
First Financial Bancorp
Investor Presentation
First Quarter 2009
Exhibit 99.1

2
Forward-Looking Statement Disclosure
Certain statements that are not statements of historical fact constitute forward-looking statements within the meaning of the Private
Securities Litigation Reform Act (the Act). In addition, certain statements in future filings by First Financial with the Securities and
Exchange Commission, in press releases, investor presentations, and in oral and written statements made by or with the approval of
First Financial which are not statements of historical fact constitute forward-looking statements within the meaning of the Act.
Examples of forward-looking statements include, but are not limited to, projections of revenues, income or loss, earnings or loss per
share, the payment or non-payment of dividends, capital structure and other financial items, statements of plans and objectives of
First Financial or its management or board of directors, and statements of future economic performances and statements of
assumptions underlying such statements. Words such as “believes,” “anticipates,” “intends,” and other similar expressions are
intended to identify forward-looking statements but are not the exclusive means of identifying such statements.
Forward-looking statements involve risks and uncertainties that may cause actual results to differ materially from those in such
statements. Factors that could cause actual results to differ from those discussed in the forward-looking statements include, but are
not limited to, management’s ability to effectively execute its business plan; the risk that the strength of the United States economy in
general and the strength of the local economies in which First Financial conducts operations may be different than expected resulting
in, among other things, a deterioration in credit quality or a reduced demand for credit, including the resultant effect on First
Financial’s loan portfolio and allowance for loan and lease losses; the ability of financial institutions to access sources of liquidity at a
reasonable cost; the effects of and changes in policies and laws of regulatory agencies; inflation, interest rates, market and monetary
fluctuations; technological changes; mergers and acquisitions; the ability to increase market share and control expenses; the effect
of changes in accounting policies and practices, as may be adopted by the regulatory agencies as well as the Financial Accounting
Standards Board and the Securities and Exchange Commission; the costs and effects of litigation and of unexpected or adverse
outcomes in such litigation; and the success of First Financial at managing the risks involved in the foregoing.
Such forward-looking statements speak only as of the date on which such statements are made, and First Financial undertakes no
obligation to update any forward-looking statement to reflect events or circumstances after the date on which such statement is made
to reflect the occurrence of unanticipated events.

3
Investment Highlights
Profitably managing the company throughout the economic downturn
First Quarter 2009
Strong loan and deposit growth
Stable net interest margin
Continued strong capital and liquidity levels
Maintaining a strong emphasis on credit and risk management while
cautiously pursuing select growth opportunities
Corporate Overview (March 31, 2009)
Total Assets: $3.8 billion
Total Loans: $2.7 billion
Total Deposits: $2.9 billion
82 retail branch locations serving 9 regional
markets in 53 communities in 3 states
1,063 FTEs
Trading Statistics (March 31, 2009)
Nasdaq: FFBC
Shares Outstanding: 37.5 million
Market Capitalization: $357 million
YTD-2009 Average Daily Trading Volume :
154,000 shares
Credit quality, although stressed, remains strong
relative to industry and peers
Investing in and growing the business
Expanding presence in key metropolitan markets
Branch acquisition
Prudent acquisition of 17 branches in key Cincinnati MSA – expected to close in third quarter 2009
Well-positioned to endure the economic challenges
Adequate capital cushion in the event of an even more severe economic downturn
Managing the company with a long-term view
First Financial stands ready to benefit as economic conditions improve

4
First Financial Bank was founded in 1863
16 bank/thrift acquisitions from 1989 through 1999 resulted in multiple bank
charters and brand identities
Established Strategic (Rebuilding & Reorganization) Plan in March 2005
History
Consolidated and streamlined company to establish one charter and one brand
identity
Restructured credit process
Restructured balance sheet
Exited non-strategic, high risk and unprofitable businesses and product lines
Renewed focus on expenses and efficiency
Upgraded infrastructure (physical, processes, technology)
Expanded market presence and recruited sales teams in regional metropolitan areas
Renewed focus on clients and sales growth

5
Reorganization Plan - Timeline
January
2005
March
2009

6
Business Units
Retail Banking
Commercial Banking
Wealth Management

7
Corporate Goals
Top-quartile performance for all stakeholders
Sustained and consistent excellence
Commitment to growth
Effective management of all risks

8
Growth Plan
Primary focus and value creation is through organic growth in key regional markets
2008 expansion included the addition of a commercial lending team in Indianapolis
(IN), a new business office and banking center in Kettering (OH), and a new
banking center in Crown Point (IN)
2009 plans include opening additional banking centers, including further expansion
within the Cincinnati metropolitan market, Northern Kentucky, Northern Ohio,
Southern Indiana
Acquisitions can advance market position and accelerate the timing of market
share compared with an organic growth only strategy
Pricing must be disciplined and favorable compared with the longer-term organic
growth only strategy
Ohio, Indiana and Kentucky where there is a strategic and geographic fit
Size and growth potential to help achieve corporate financial targets
9
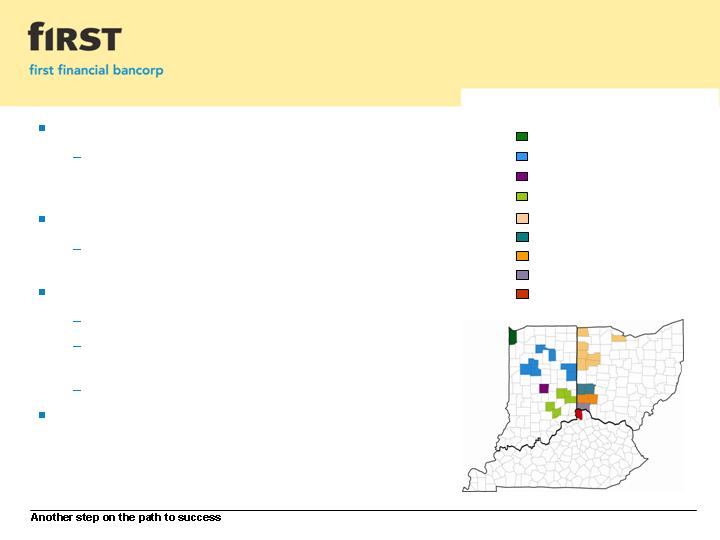
Business Strategy
Client “Intimate” Strategy
Strategic Focus: build long-term relationships with
clients by identifying and meeting their financial
needs
Target clients
Individuals and small / mid-size private businesses
located within the regional markets we serve
Ohio, Indiana, Kentucky
Serving 9 regional markets / 53 communities
Each market is managed by experienced, local
bankers
Markets are supported by centralized experts
Organic growth focus supplemented by strategic
acquisitions
Northwest Indiana
North Central Indiana
South Central Indiana
Indianapolis - Indiana
Butler / Warren County - Ohio
Northern Ohio
Dayton / Middletown - Ohio
Cincinnati - Ohio
Northern Kentucky
Markets
10
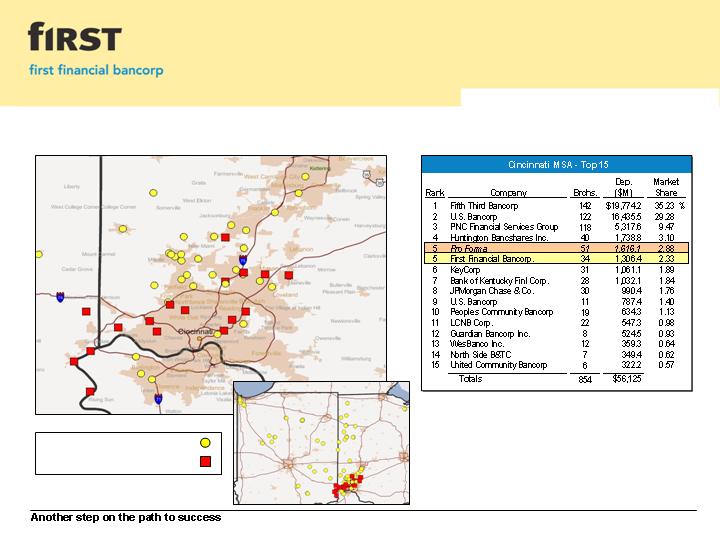
Growth-Market Expansion
Source: SNL Financial
Considerably enhances First Financial’s presence in the attractive Cincinnati MSA
First Financial Banking Centers
Banking Centers to be Acquired

Addition of 17 banking centers in Cincinnati MSA announced May 18, 2009
Consistent with First Financial's stated and conservative strategy
First Financial will have the 4th largest branch network in the Cincinnati MSA
Pro forma 2.88% Cincinnati MSA deposit market share compared with 2.33% currently –
still room to grow
Further solidifying First Financial's position in this very attractive market
Accelerates growth-market expansion strategy by several years
Acquisition is compelling relative to cost and time to build 17 profitable de novo banking
centers
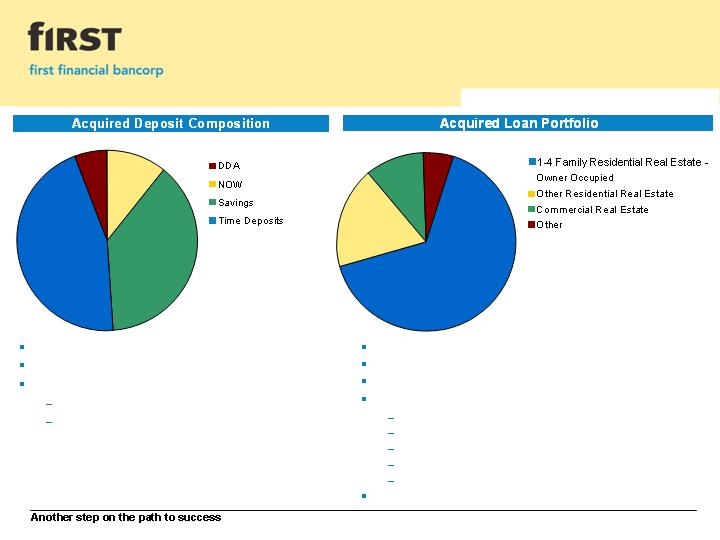
Portfolio of approximately $261 million loans acquired
Comprised of approximately 68% owner-occupied 1-4 family residential real estate
First Financial is not acquiring any construction loans, land loans, unsecured commercial
loans, nor subprime loans nor past due nor non-performing loans
5.0% deposit premium
Based on $310.0 million of deposits, premium of $15.5 million
Anticipated cash EPS accretion in 2010
11
Branch Acquisition Highlights
1
1 Source: SNL Financial
1
12
Attractive Deposit Composition &
Low-Risk Loan Portfolio
Strong core deposit funding
Weighted average interest rate 2.52%
First Financial is not assuming any
Brokered CDs
Out-of-market deposits
Balances and rates as of March 31, 2009
No loans 30+ days past due
Weighted average interest rate 5.98%
Entirely in-market portfolio
First Financial is not acquiring any
Builder lots or land loans
Unsecured commercial loans
Construction loans
Unsecured consumer loans
Subprime loans
The average retail borrower FICO score is 721
1 “Other” includes church, farm, commercial and
personal vehicle loans, and loans secured by
deposit accounts
1
$12.8M,
4.1%
$34.4M,
11.1%
$119.4M,
38.6%
$43.1M,
46.2%
$5.8M,
2.2%
$28.9M,
11.0%
$177.3M,
67.8%
$49.4M,
18.9%

13
Investment Highlights
Very attractive transaction
First Financial expands its banking center network in the Cincinnati MSA by 50%1
Transaction adds stable funding and banking centers in key areas that will leverage the First Financial
brand to increase market share
Minimal deposit runoff is expected
In-market transaction with low integration risk
Extensive due diligence performed
Highly negotiated transaction with lower risk 1-4 family owner occupied loans and deposits being
acquired
Attractive demographic profile1 2
5-year population growth rate of 6.4%
Median household income of $66,900
5-year household income growth rate of 27%
Based on current assumptions, the acquisition is projected to be accretive to 2010 EPS, and will
leave First Financial with a strong pro forma capital position
1 Source: SNL Financial
2 Weighted average demographics for each banking center based on its ZIP code, weighted by deposits as of June 30, 2008
Summary: This transaction leverages current market conditions and First Financial’s capital and
competitive strength to accelerate the company’s key-market growth strategy
14
* First Financial entered the Indianapolis market in August 2008
Source: SNL Financial
Demographic Profile
Demographic Profile (First Financial Bancorp)
Deposit, Market Share and Popluation Data as of June 30, 2008
State
Market
Number
of FFBC
Banking
Centers
Total Deposits
in Market
($000)
FFBC Deposits
in Market
($000)
FFBC Deposit
Market Share
(%)
Projected
Population
Change
2008 - 2013
(%)
OH
Butler Warren
19
4,180,986
$
828,641
$
19.8%
10.3%
OH
Cincinnati
4
42,824,615
55,672
0.1%
-2.4%
OH
Dayton / Middletown
10
9,134,296
351,086
3.8%
1.0%
KY
Northern Kentucky
3
1,887,691
106,277
5.6%
19.9%
IN
North Central Indiana
14
3,997,721
294,351
7.4%
2.6%
OH
Northern Ohio
16
5,219,065
517,777
9.9%
0.0%
IN
Northwest Indiana
8
7,329,142
486,655
6.6%
2.6%
IN
South Central Indiana
8
3,691,281
144,975
3.9%
2.2%
IN
Indianapolis*
0
24,769,456
-
-
8.6%
Totals
82
103,034,252
$
2,785,434
$
2.7%
15
Retail Banking
Strategic Focus
Retail consumer clients
Deposits
Select consumer lending activities
82 retail banking center locations
Serving 9 regional markets in 53
communities in 3 states
Managed locally by experienced
local bankers
Supported centrally

16
Commercial Banking
Strategic Focus
Small / mid-size private businesses located within our regional
markets
Commercial & Industrial
Commercial Real Estate
Deposits / Cash Management
Sales Force
9 Market Presidents
48 Commercial Lenders
10 Treasury Management Representatives

17
Wealth Management
First Financial Wealth Resource Group
Trust
Brokerage
Investment Advisor
Strategic Focus
Maintain existing client base
Increase share of wallet of existing client base
Integration with retail and commercial banking clients

Credit Management System
Market-Based
18
First Financial
Bancorp
/
Bank
CEO
Executive Vice
President Markets
Chief Credit
Officer
Market
Presidents
Commercial
Lenders
Credit
Analysts
Administrative
Assistants
Regional Credit
Officers
Central
Documentation
/
Filing
Commercial Real
Estate Specialist
Special Assets
Collections
Sr
.
Portfolio
Credit Analyst
Government
Lending Specialist
Small Business
Banking
Loan Participation
&
Credit Analysis
Centralized
Market Level

19
Credit Quality
March 31, 2009
Credit quality trends remained relatively stable and within expected range throughout most of 2008
Reflects discipline of originating loans within existing footprint, strong underwriting policies, and proactive management of
resolution strategies for problem credits
Ongoing economic stress impacting credit quality metrics late in fourth quarter 2008 and into first quarter 2009
Significantly increased loan loss reserve in fourth quarter 2008 in response to a higher level of net charge-offs and continued
deterioration in economic conditions
Net charge-offs declined $1.3 million / Nonperforming loans increased $6.7 million
Provision expense represented 115% of total net charge-offs at March 31, 2009
Allowance for loan and lease losses as a percent of period-end loans remained stable at 1.33% at March 31, 2009
Expecting credit quality to remain challenging throughout 2009 for the entire industry
1
1 First quarter 2009 compared with fourth quarter 2008
2 Net of loan sale
2
1Q-09
4Q-08
3Q-08
2Q-08
1Q-08
2008
2007
2006
2005
2004
2003
Net Charge-Off Ratio
0.55%
0.73%
0.36%
0.40%
0.40%
0.47%
0.24%
0.48%
0.30%
0.26%
0.69%
Nonperforming Loans /
Loans
0.91%
0.68%
0.53%
0.57%
0.58%
0.68%
0.56%
0.44%
1.08%
0.70%
0.96%
Reserve Ratio
1.33%
1.34%
1.14%
1.11%
1.14%
1.34%
1.12%
1.10%
1.62%
1.61%
1.71%
Reserves / Nonperforming
Loans
146.4%
197.3%
216.2%
192.5%
194.8%
197.3%
197.9%
252.8%
149.8%
230.2%
177.9%
Year
Quarter
Credit Quality Trends
20
Peer Group I is comprised of approximately 95 bank holding companies located throughout the United States with total asset size ranging from $3 - $10 billion
Peer Group II is comprised of 30 bank holding companies conducting business primarily in Ohio, Kentucky and Indiana
Source: Peer Group median data obtained from SNL Financial
Credit Quality
Net Charge-offs to Average Loans & Leases
0.89%
0.74%
0.38%
0.36%
0.46%
0.60%
0.85%
0.15%
0.47%
0.33%
0.28%
0.28%
0.19%
0.10%
0.37%
0.24%
0.22%
0.65%
0.55%
0.73%
0.36%
0.40%
0.40%
0.26%
0.23%
0.23%
0.22%
1Q-07
2Q-07
3Q-07
4Q-07
1Q-08
2Q-08
3Q-08
4Q-08
1Q-09
Peer Group I (size)
Peer Group II (geography)
FFBC
21
Credit Quality
Allowance for Loan & Lease Losses to Nonperforming Loans
Peer Group I is comprised of approximately 95 bank holding companies located throughout the United States with total asset size ranging from $3 - - $10 billion
Peer Group II is comprised of 30 bank holding companies conducting business primarily in Ohio, Kentucky and Indiana; 1Q-09 data is comprised of 26 bank holding companies
Source: Peer Group median data obtained from SNL Financial
260%
222%
209%
162%
152%
101%
90%
90%
72%
141%
151%
155%
136%
100%
80%
79%
76%
77%
187%
212%
198%
195%
193%
216%
197%
146%
241%
1Q-07
2Q-07
3Q-07
4Q-07
1Q-08
2Q-08
3Q-08
4Q-08
1Q-09
Peer Group I (size)
Peer Group II (geography)
FFBC
22
Credit Quality
Nonperforming Loans to Total Loans
Peer Group I is comprised of approximately 95 bank holding companies located throughout the United States with total asset size ranging from $3 - - $10 billion
Peer Group II is comprised of 30 bank holding companies conducting business primarily in Ohio, Kentucky and Indiana; 1Q-09 data is comprised of 26 bank holding companies
Source: Peer Group median data obtained from SNL Financial
0.83%
0.76%
0.70%
0.91%
1.19%
1.46%
2.04%
2.31%
2.81%
2.21%
0.55%
0.49%
0.43%
0.65%
0.81%
1.12%
1.46%
1.62%
0.59%
0.53%
0.56%
0.58%
0.57%
0.53%
0.68%
0.91%
0.45%
1Q-07
2Q-07
3Q-07
4Q-07
1Q-08
2Q-08
3Q-08
4Q-08
1Q-09
Peer Group I (size)
Peer Group II (geography)
FFBC

23
Capital
Excess consolidated capital of
$159.1 million over regulatory
minimum required level
Based on “well-capitalized”
requirements, can support
bank-level asset growth up to
$606 million
Announced dividend reduction to common shareholders in January 2009
Will further boost already strong capital levels and position the company to weather the economic
challenges while still taking advantage of select growth opportunities
Preserved approximately $2.6 million in common equity in first quarter 2009
Consistent with other capital management strategies
Committed to maintaining a strong capital base
Will continue to take steps to ensure capital position remains sound throughout this period of economic
uncertainty
Participating in U.S. Treasury’s Troubled Asset Relief (TARP) Capital Purchase Program (CPP)
Treasury made an investment in $80 million First Financial perpetual preferred securities in December
2008
Ratio
1Q-09
Target
Regulatory
"well-capitalized"
minimum
EOP Tangible Equity /
EOP Tangible Assets
8.60%
6.75% - 7.25%
n/a
EOP Tangible Common Equity /
EOP Tangible Common Assets
6.54%
n/a
n/a
Leverage Ratio
9.51%
8.00% - 8.50%
5.00%
Total Risk-Based Capital Ratio
13.39%
11.50% - 12.00%
10.00%

Capital Raise
24
Common Share Offering
Completed a public offering of 13.8 million shares at $7.50 per share
Net proceeds of approximately $98.0 million after deducting underwriting
discounts, commissions and estimated offering expenses
Proceeds will be used for general corporate purposes, which may include
Providing capital to support the bank’s asset and deposit growth
Acquisitions, or other business combinations
Planned purchase of 17 banking centers and the approximate $310 million in
balance sheet growth
Organic growth in key markets
Other strategic opportunities if appropriate for our franchise

Strong Capital Ratios
25
* Adjusted to reflect the $98 million in new capital from the offering
Ratio
Actual
(March 31, 2009)
Adjusted *
Regulatory
"well-capitalized"
minimum
Tier 1 Leverage
9.51%
11.77%
5.00%
Tier 1 Risk-Based Capital
12.16%
14.96%
6.00%
Total Risk-Based Capital
13.39%
16.19%
10.00%
Tangible Equity to Tangible Assets (period-end)
8.60%
10.62%
n/a
Tangible Common Equity to Tangible Assets (period-end)
6.54%
8.60%
n/a

Participation in the U.S. Treasury
Capital Purchase Program
26
Issued and sold to Treasury 80,000 shares of Series A Senior Preferred Stock* for an
aggregate purchase price of $80 million
Liquidation preference of $1,000 per share
Warrant to purchase up to 930,233 common shares, without par value at an initial exercise price
of $12.90 per share, subject to certain anti-dilution and other adjustments
Asked to participate by banking regulators
Additional capital further strengthened already strong capital levels
Due to political implications, the real benefits of participating in the program may have
been altered
Changes that have been enacted to-date have not significantly impaired either our business
model or our ability to execute our core business strategy
Board of Directors will continue to evaluate capital plan and structure, including the merits of
continued participation in the program
Quarterly dividend payments
$1.0 million in May 2009
$0.6 million (pro-rated) in February 2009
* December 23, 2008

27
CPP Investment Portfolio
March 31, 2009
Established CPP Investment Portfolio with proceeds received from Treasury
Totaled approximately $225.4 million compared with $122.5 million at December 31, 2008
Short and long-term plans for the utilization of CPP proceeds
Selectively added to the CPP Investment Portfolio during the first quarter of 2009
Funded with short-term borrowings to maximize return on net interest income
Ratio of investments to capital, or leverage, was 2.8 times the proceeds received, compared with
1.5 times at December 31, 2008, with internal maximum not to exceed 5 times
Earnings from the CPP Investment Portfolio have had, and are expected to continue to have a
positive effect on net interest income and should also exceed quarterly dividends payable to U.S.
Treasury on its investment in the preferred shares
Increased lending activities during first quarter 2009 consistent with the intent of the
Program
Commercial lending balances increased $73.1 million from December 31, 2008
Originated $47.9 residential mortgage loans compared with $21.8 million in fourth quarter 2008
Cash flows from the CPP Investment portfolio are expected to provide sufficient liquidity
and capital for redeployment into additional lending opportunities

Financial Information
29
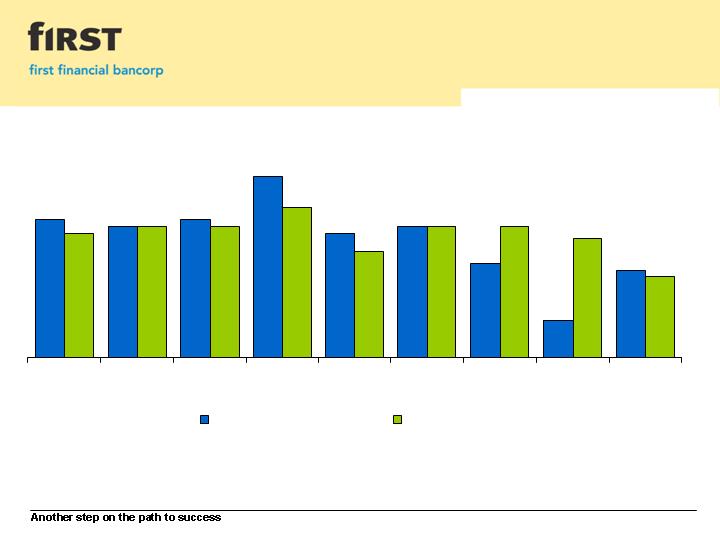
Earnings Per Share
* Reflects the impact of certain non-recurring items. A reconciliation presenting a summary of items impacting earnings per share is on page 43
$0.22
$0.21
$0.22
$0.29
$0.20
$0.21
$0.15
$0.06
$0.14
$0.20
$0.21
$0.21
$0.24
$0.17
$0.21
$0.21
$0.19
$0.13
1Q-07
2Q-07
3Q-07
4Q-07
1Q-08
2Q-08
3Q-08
4Q-08
1Q-09
GAAP Earnings Per Share
Earnings Per Share*

30
Pre-Tax Pre-Provision Income
Demonstrates a more representative comparison of operational performance without the
volatility of credit quality that is typically present in times of economic stress
Excludes provision expense and applicable securities gains and losses
1Q-09
4Q-08
3Q-08
2Q-08
1Q-08
Pre-Tax Income
8,768
$
2,455
$
8,329
$
11,700
$
10,881
$
Excluding Provision Expense
4,259
10,475
3,219
2,493
3,223
Pre-Tax, Pre-Provision Income
13,027
$
12,930
$
11,548
$
14,193
$
14,104
$
Securities Gains (Losses)
11
1
(137)
1
(3,400)
1
(221)
1
1,605
2
Pre-Tax, Pre-Provision Income, excluding
Securities Gains (Losses)
13,016
$
13,067
$
14,948
$
14,414
$
12,499
$
1
2
Gains (losses) related to the company's investment in 200,000 Federal Home Loan Mortgage Corporation (FHLMC) perpetual preferred series V shares.
Includes a $1,585 gain associated with the partial redemption of Visa, Inc. common shares.
($ in thousands)
Quarter
31
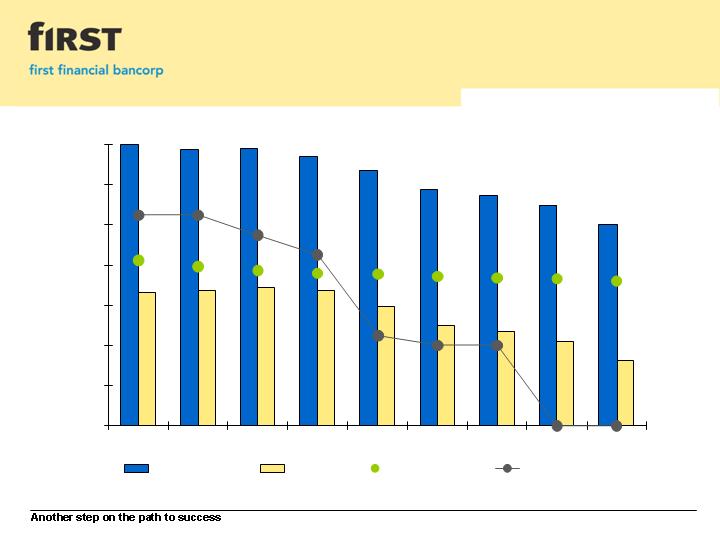
Net Interest Margin
* Represents the Fed Funds Target Rate at the end of the quarter
4.12%
3.97%
3.88%
3.79%
3.78%
3.72%
3.68%
3.67%
3.61%
0.00%
1.00%
2.00%
3.00%
4.00%
5.00%
6.00%
7.00%
1Q-07
2Q-07
3Q-07
4Q-07
1Q-08
2Q-08
3Q-08
4Q-08
1Q-09
Earning Asset Yield
Liability Cost
Net Interest Margin
Fed Funds Target Rate*
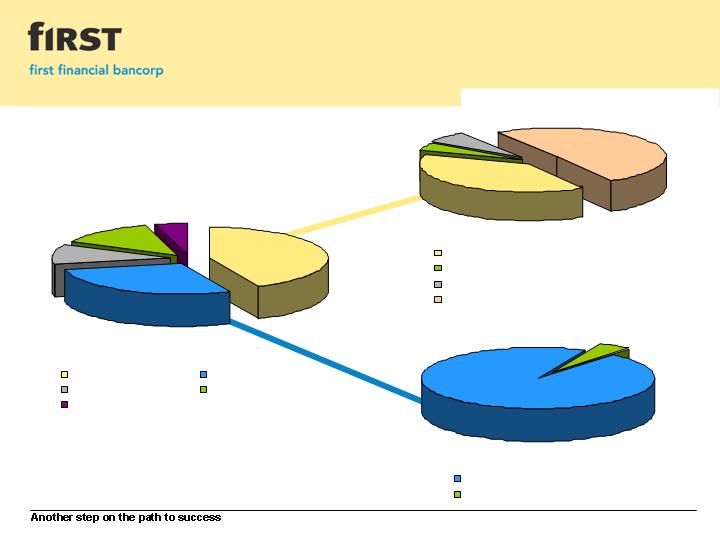
Non-Owner Occupied - $601.8 million
Acquisition & Land Development - $72.9 million
Single Issuer Loan Participation - $50.5 million
Owner Occupied - $458.1 million
39%
4%
6%
51%
44%
28%
11%
13%
4%
Commercial Real Estate
Commercial & Industrial
HELOC
Residential Real Estate
Installment & Other
Loan Composition
March 31, 2009
32
4%
96%
All Other - $742.4 million
Shared National Credits - $34.8 million
33
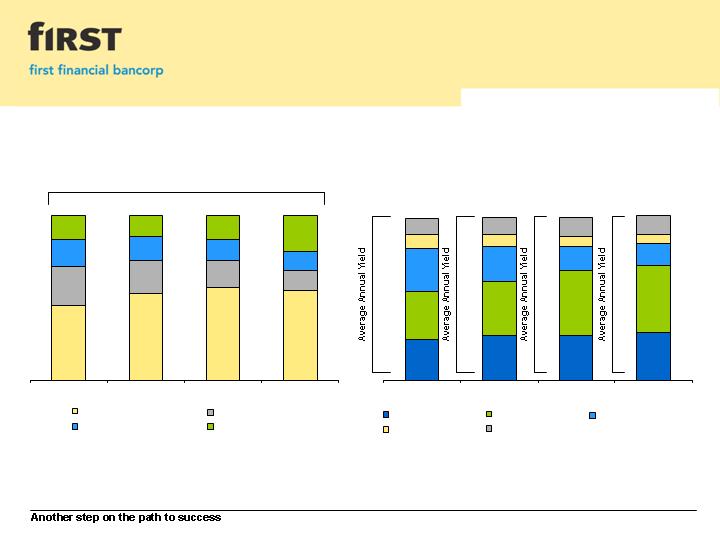
Yield presented is not tax-equivalent
8.0%
End of Period
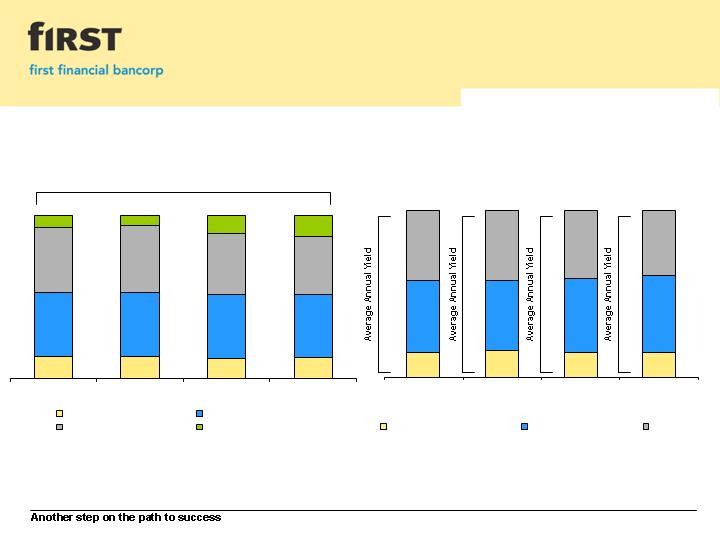
Loan Portfolio Composition
Earning Assets &
Loan Composition
6.7%
5.5%
6.5%
8.0%
7.9%
7.1%
5.6%
7.9%
8.2%
5.7%
6.1%
5.6%
7.8%
5.7%
4.0%
7.6%
5.6%
4.3%
5.1%
9%
31%
27%
30%
30%
41%
29%
33%
40%
13%
14%
21%
26%
6%
5%
4%
9%
10%
11%
11%
2006
2007
2008
1Q-2009
Commercial
Commercial RE
Residential Mortgages
Installment
Home Equity
5.0%
6.6%
5.9%
Average
Earning Assets
Yield
6.9%
12%
11%
55%
45%
53%
57%
16%
20%
24%
13%
15%
17%
22%
14%
14%
12%
Average FY-2006
Average FY-2007
Average FY-2008
Average 1Q-2009
Commercial Loans & Leases
Residential Mortgages
Consumer Loans
Investments

34
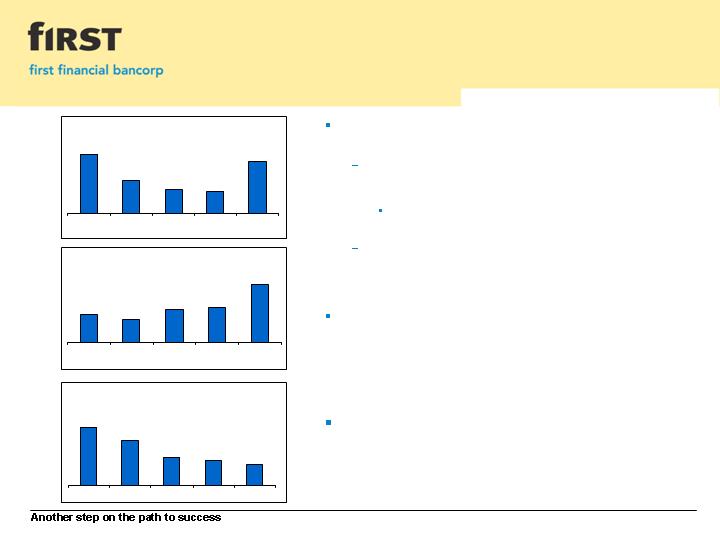
Loan Strategy
Linked-quarter percentage growth is annualized
First quarter 2009 average total loans increased
$23.0 million or 3.4% from fourth quarter 2008
Driven primarily by 14.1% growth in commercial
lending portfolios
Overall declines in the average consumer lending
portfolios are a result of the company’s strategy
to de-emphasize certain consumer-based lending
activities
Originated $47.9 million in residential mortgage
loans in first quarter 2009 compared with $21.8
million in fourth quarter 2008
Residential mortgage loan balances are not
reflected on the balance sheet due to the
company’s originate-and-sell strategy
Renewed emphasis to expand
residential mortgage lending, including maintaining
the originate-and-sell strategy
1Q-09
4Q-08
3Q-08
2Q-08
1Q-08
$1,927
$1,861
$1,809
$1,731
$1,652
($ in millions)
Average Commercial Loans
Average Total Loans
($ in millions)
$2,593
$2,645
$2,708
$2,689
$2,712
1Q-08
2Q-08
3Q-08
4Q-08
1Q-09
Average Consumer Loans
($ in millions)
$941
$914
$898
$828
$785
1Q-08
2Q-08
3Q-08
4Q-08
1Q-09

35
49%
(53%)
(88%)
* December 31, 2005 through March 31, 2009
Gross loan CAGR* = 0.65% due to planned runoff in indirect loans and residential mortgages.
Loan Portfolio Strategy
(450,000)
(350,000)
(250,000)
(150,000)
(50,000)
50,000
150,000
250,000
350,000
450,000
550,000
650,000
Commercial Lending
Residential Mortgages
Indirect Installments
($000s)
Growth Since 2005*

36
Investment Portfolio
March 31, 2009
On-going review of various strategies to increase the size of the investment portfolio and its absolute
level of earnings, while balancing capital and liquidity targets
Since the end of the first quarter of 2008, the portfolio has grown approximately $380.7 million on a net
basis
Approximately $112.9 million of securities were added during the first quarter of 2009
Portfolio selection criteria avoids securities backed by sub-prime assets and those with geographic
considerations
($ in thousands, excluding book price and market value)
Base
% of
Book
Book
Book
03/31/2009
Gain/
Total
Value
Yield
Price
Market Value
(Loss)
Agencys
5.4%
$ 41,534
5.31%
$ 99.78
103.66
$
$ 1,554
CMO's (Agency)
22.3%
170,397
4.62%
100.87
103.00
3,526
CMO's (Private)
0.0%
85
2.04%
100.00
98.04
(2)
MBS's (Agency)
63.8%
488,448
4.87%
101.01
103.50
11,790
Agency Preferred
0.0%
72
-
0.36
0.36
-
Subtotal
91.5%
$ 700,536
4.83%
100.89
$
103.38
$
$ 16,868
Municipal
4.4%
$ 33,699
7.15%
$ 99.17
100.28
$ 376
Other *
4.1%
31,382
4.41%
100.91
99.45
(461)
Subtotal
8.5%
$ 65,081
5.83%
100.01
$
99.88
$
(85)
$
Total Investment Portfolio
100.0%
765,617
$
4.92%
100.82
$
102.40
$
16,783
$
Net Unrealized Gain/(Loss)
16,783
$
Aggregate Gains
17,836
$
Aggregate Losses
(1,053)
$
Net Unrealized Gain/(Loss) % of Book Value
2.19%
* Other includes $28.0 million of regulatory stock

37
Investment Portfolio
March 31, 2009
* Other includes regulatory stock
Credit Quality
Investment Grade = A-rated securities
Other Investment Grade = B-rated securities
Non-Investment
Grade
0.2%
Investment Grade
96.7%
Other Investment
Grade
1.0%
Not Rated
2.1%
Sector Allocation
MBSs (Agency)
63.8%
Agency
Preferred
0.0%
Municipal
4.4%
Other *
4.1%
Agencys
5.4%
CMOs (Private)
0.0%
CMOs (Agency)
22.3%
38
0.0%
* Not included in yield calculation
End of Period
Deposit Portfolio Composition
Liability Mix &
Deposit Composition
1.8%
2.0%
0.8%
3.9%
4.5%
4.0%
0.0%
0.0%
0.0%
0.2%
3.2%
15%
15%
15%
16%
46%
43%
42%
44%
39%
41%
42%
42%
2006
2007
2008
1Q-2009
Noninterest-Bearing Deposits*
Interest-Bearing Deposits
Time Deposits
2.5%
Average
Liability Mix
Yield
1.6%
3.4%
3.0%
13%
7%
6%
10%
13%
13%
13%
13%
39%
39%
40%
40%
35%
38%
41%
40%
Average FY-2006
Average FY-2007
Average FY-2008
Average 1Q-2009
Noninterest-Bearing Deposits*
Interest-Bearing Deposits
Time Deposits
Borrowed Funds
39
Deposit Strategy
Linked-quarter percentage growth is annualized
First quarter 2009 average total deposits increased
$42.1 million or 6.1% from fourth quarter 2008
Driven primarily by 13% growth in transaction and
savings deposits, including solid increases in
commercial transaction account balances
Includes the seasonal effect of a large public
fund deposit
Linked-quarter growth assisted by deposit-pricing
strategies and other initiatives designed to grow
and retain more transaction-based retail and
commercial deposits
Year-over-year declines in average total and
average time deposits is attributable to the runoff of
time deposits resulting from disciplined pricing and
the company’s strategy to generate lower-cost
transaction-based retail and commercial deposit
accounts
Disciplined pricing strategies are employed for all
deposit types
1Q-09
4Q-08
3Q-08
2Q-08
1Q-08
$1,680
$1,628
$1,624
$1,602
$1,613
($ in millions)
Average Transaction & Savings Deposits
Average Total Deposits
($ in millions)
$2,832
$2,795
$2,783
$2,780
$2,822
1Q-08
2Q-08
3Q-08
4Q-08
1Q-09
Average Time Deposits
($ in millions)
$1,219
$1,193
$1,158
$1,152
$1,142
1Q-08
2Q-08
3Q-08
4Q-08
1Q-09
40
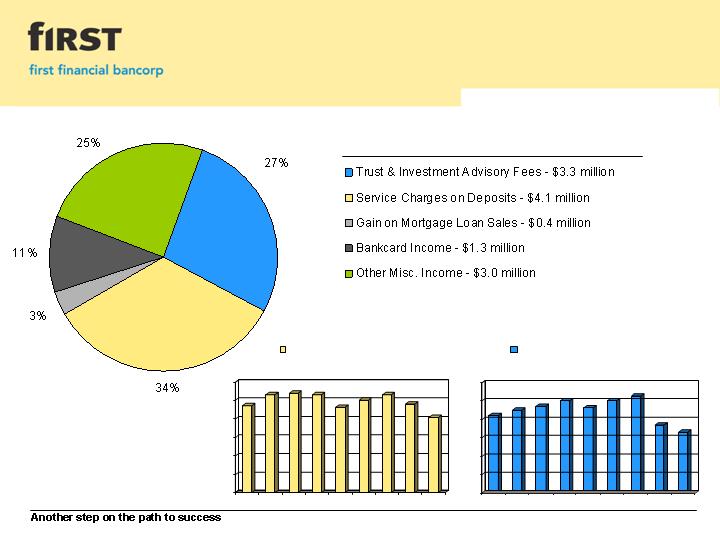
Noninterest Income
Trust & Investment Advisory Fees
1Q-09
4Q-08
3Q-08
2Q-08
1Q-08
4Q-07
3Q-07
2Q-07
1Q-07
$6.0
$5.0
$4.0
$3.0
$2.0
$1.0
$0.0
($ in millions)
($ in millions)
First Quarter 2009
Total Noninterest Income = $12.0 million
$0.0
$1.0
$2.0
$3.0
$4.0
$5.0
$6.0
1Q-07
2Q-07
3Q-07
4Q-07
1Q-08
2Q-08
3Q-08
4Q-08
1Q-09
Service Charges on Deposits
41
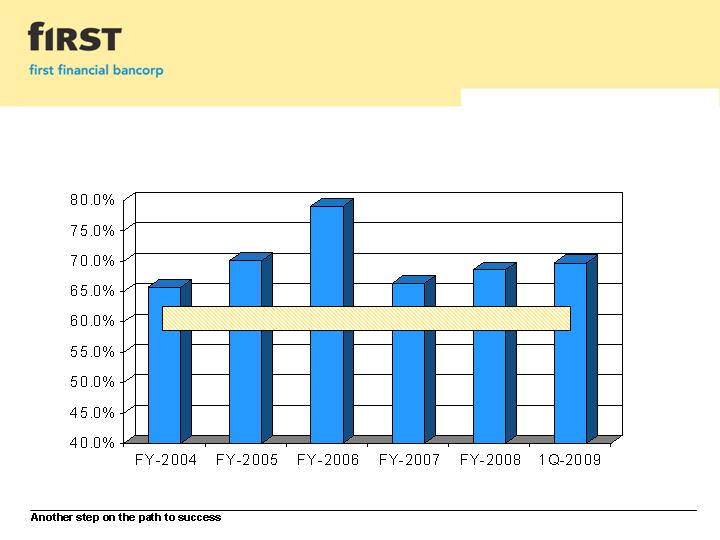
Efficiency
Long-Term Target = 55% to 60%
Efficiency Ratio
42
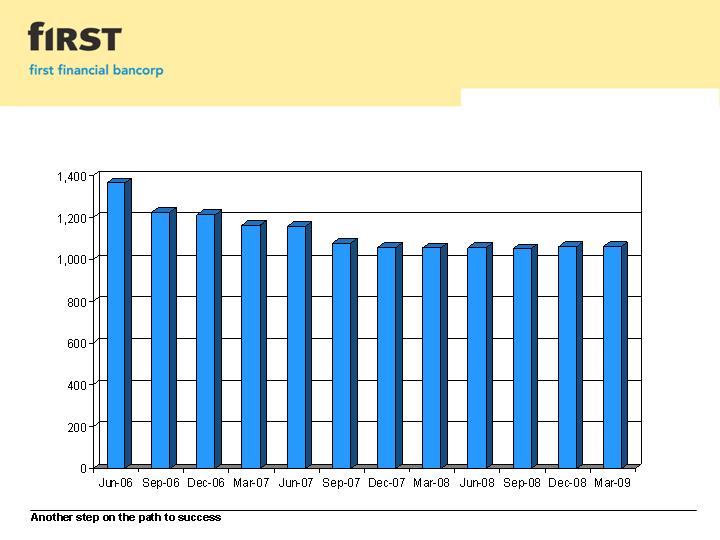
Staffing Level
Full-Time Equivalent Personnel

43
Summary of Items Impacting
Earnings Per Share
2009
1Q
Full-Year
4Q
3Q
2Q
1Q
Full-Year
4Q
3Q
2Q
1Q
Gain (Loss) on FHLMC shares*
11
$
(3,738)
$
(137)
$
(3,400)
$
(221)
$
20
$
-
$
-
$
-
$
-
$
-
$
Increase in Loan Loss Reserve & Higher
Charge-offs
-
(7,539)
(7,539)
-
-
-
-
-
-
-
-
Gain on Sale of Propery & Casualty Portion of
Insurance Business
574
-
-
-
-
-
Gain on Sale of Merchant Payment Processing
Portfolio
-
-
-
-
-
-
5,501
5,501
-
-
-
Severance Costs Related to Sale of Property &
Casualty Insurance Business
(232)
Pension Settlement Charges
-
-
-
-
-
-
(2,222)
(2,222)
-
-
-
Gains on Sales of Investment Securities
(VISA 2008; MasterCard 2007)
-
1,585
-
-
-
1,585
367
-
367
-
-
Gain on Sale of Mortgage Servicing Rights
-
-
-
-
-
-
1,061
-
-
-
1,061
Visa Member Litigation Charges
-
-
-
-
-
-
(461)
(461)
-
-
-
Impact to Pre-Tax Net Income
353
$
(9,692)
$
(7,676)
$
(3,400)
$
(221)
$
1,605
$
4,246
$
2,818
$
367
$
-
$
1,061
$
After-Tax Impact to Earnings Per Diluted
Share
0.01
$
(0.17)
$
(0.13)
$
(0.06)
$
(0.00)
$
0.03
$
0.07
$
0.05
$
0.01
$
-
$
0.02
$
*
($ in thousands, excluding per share data)
2007
2008
Gain (Loss) related to the company's investment in 200,000 Federal Home Loan Mortgage Corporation (FHLMC) perpetual preferred series V shares.

Leadership

45
Leadership
Claude E. Davis
President & Chief Executive Officer
Claude E. Davis joined First Financial in 2004 as President, Chief Executive Officer, and a member of the Board of Directors. Mr. Davis
also serves as Chairman of the Board of Directors of First Financial Bank. Prior to joining the company, he served as Senior Vice
President at Irwin Financial Corporation, and Chairman of Irwin Union Bank and Trust, the company’s lead bank, positions he held since
2003. Earlier in his career, he served as President of Irwin Union Bank and Trust for seven years. Mr. Davis began his career as a
Certified Public Accountant with the public accounting firm Coopers & Lybrand.
C. Douglas Lefferson
Executive Vice President & Chief Operating Officer
C. Douglas Lefferson has spent his entire career in various positions within First Financial Bancorp and First Financial Bank, and was
appointed to his current position in 2005. Prior to his current appointment, Mr. Lefferson served as Chief Financial Officer from 2002
through 2005.
J. Franklin Hall
Executive Vice President & Chief Financial Officer
J. Franklin Hall joined First Financial in 1999 as First Vice President, Controller, and Director of Finance, and was appointed to his
current position in 2005. Prior to joining the company, he was with Firstar Bank (currently US Bancorp). He is a Certified Public
Accountant (inactive), and began his career with the public accounting firm Ernst & Young, LLP. Mr. Hall also serves as President of the
First Financial Bancorp subsidiary First Financial Capital Advisors, LLC, and is President of the company’s proprietary mutual fund
family, First Funds.
Samuel J. Munafo
Executive Vice President, Banking Markets
Samuel J. Munafo has spent his entire career in various positions within First Financial Bancorp and First Financial Bank and currently
serves as Executive Vice President overseeing all of the company’s banking markets. Prior to his current appointment, Mr. Munafo
served as President of First Financial Bank (2005 – 2006), and President and Chief Executive Officer for several First Financial affiliates,
including Community First Bank & Trust (2001 - 2005), Indiana Lawrence Bank (1998 – 2001), and Clyde Savings Bank (1994 – 1998).
He began his career with the company as a management trainee and served the company in a number of areas, including operations,
retail, commercial lending, credit cards and security.

46
Leadership
Richard Barbercheck
Senior Vice President & Chief Credit Officer
Richard Barbercheck joined First Financial in 2005 as Senior Vice President and Chief Risk Officer, and was appointed to his current
position in 2006. Mr. Barbercheck is responsible for the administration of the bank’s lending portfolios as well as oversight of the
company’s credit policies and loan underwriting processes. Prior to joining the company, he oversaw the Credit Risk Evaluation Group
at Irwin Financial Corporation (Columbus, Indiana). Earlier in his career he served at several banks in executive-level positions
located in Southeastern Indiana, including Veedersburg State Bank (1989 – 1993), National City Bank (1993 - 1996), and Irwin Union
Bank (1999 - 2000). Mr. Barbercheck has a total of 27 years of banking experience, with a predominance of experience in the
commercial lending and credit administration areas.
Michael Cassani
Senior Vice President, Wealth Resource Group
Michael Cassani joined First Financial in 2007 as Senior Vice President and Chief Administrative Officer to oversee the company’s
Wealth Resource Group. Prior to joining the company, Mr. Cassani served as President of Fund Project Services, Inc., a financial
project management and consulting firm he co-founded in 1998. Earlier in his career, he served as Mutual Funds Product Manager at
Fifth Third Bank, and as Institutional Investment Officer at Roulston and Company. Prior to those appointments, Mr. Cassani served
as an Investment Representative for two separate companies located within the Chicago area.
Gregory A. Gehlmann
Senior Vice President, General Counsel
Gregory A. Gehlmann joined First Financial in 2005 as Senior Vice President and General Counsel. Mr. Gehlmann also served as
Chief Risk Officer for the company (2006 – 2008). Prior to joining the company, he practiced law for 16 years in Washington, D.C. Mr.
Gehlmann served as partner/counsel at Manatt, Phelps & Phillips, LLP (Washington, D.C.), where he was counsel to public and
private companies, as well as investors, underwriters, directors, officers, and principals regarding corporate securities, banking, and
general business and transactional matters.

47
Leadership
John Sabath
Senior Vice President & Chief Risk Officer
John Sabath joined First Financial in 2005 as Regulatory Risk Manager. Mr. Sabbath was then promoted to Senior Risk Officer and
First Vice President, and assumed his current position in 2008. He is responsible for management of the company’s risk management
function which includes commercial and retail credit, compliance, operational, market, strategic and reputation risk. Prior to joining the
company, he was in the Enterprise Risk Group at Fifth Third Bank. Earlier in his career, Mr. Sabbath held positions at the Federal
Reserve Bank of Cleveland, National City Bank and Star Bank (currently US Bancorp).
Jill A. Stanton
Senior Vice President, Retail & Small Business Lending Manager
Jill Stanton joined First Financial in 2008. Ms. Stanton has responsibility for product line management for first mortgage loans,
consumer lending and small business lending. Prior to joining the company, she served as Senior Vice President for Irwin Union Bank
where she was responsible for mortgage, consumer lending, business banking, commercial credit analysis, credit administration and
loan operations in their commercial banking business. Ms. Stanton has over 20 years of experience within the banking industry.
Jill L. Wyman
Senior Vice President, Retail Banking Sales & Deposit Manager
Jill Wyman joined First Financial in 2003 as Vice President and Sales Director. In her current position, Ms. Wyman has responsibility
for leading the retail sales process, growing retail deposits, and enhancing the sales culture throughout the company’s three-state
banking center network. She is also responsible for market services and corporate marketing. Prior to joining the company, she spent
19 years in retail where she served as general manager at Lazarus, a division of Federated Department Stores (currently Macy’s). Ms.
Wyman began her career as a management trainee at Federated/Macy’s and progressed to sales manager, group sales manager,
assistant general manager and regional merchandise manager.

March 31, 2009
About First Financial Bancorp
First Financial Bancorp is a Cincinnati, Ohio based bank holding company with
$3.8 billion in assets. Its banking subsidiary, First Financial Bank, N.A., founded
in 1863, provides retail and commercial banking products and services, and
investment and insurance products through its 82 retail banking locations in
Ohio, Kentucky and Indiana. The bank’s wealth management division, First
Financial Wealth Resource Group, provides investment management, traditional
trust, brokerage, private banking, and insurance services, and has approximately
$1.6 billion in assets under management. Additional information about the
company, including its products, services, and banking locations, is available at
www.bankatfirst.com.

Another step on the path to success