
First Financial Bancorp
Investor Presentation
Second Quarter 2009
Exhibit 99.1

2
Forward-Looking Statement Disclosure
This presentation should be read in conjunction with the consolidated financial statements, notes and tables in First Financial Bancorp’s most recent Annual Report on Form 10-K for
the year ended December 31, 2008.
Management’s analysis contains forward-looking statements that are provided to assist in the understanding of anticipated future financial performance. However, such performance
involves risk and uncertainties that may cause actual results to differ materially. Factors that could cause actual results to differ from those discussed in the forward-looking statements
include, but are not limited to, management’s ability to effectively execute its business plan; the risk that the strength of the United States economy in general and the strength of the
local economies in which First Financial conducts operations continue to deteriorate, resulting in, among other things, a deterioration in credit quality or a reduced demand for credit,
including the resultant effect on First Financial’s loan portfolio, allowance for loan and lease losses and overall financial purpose; the ability of financial institutions to access sources of
liquidity at a reasonable cost; the impact of recent upheaval in the financial markets and the effectiveness of domestic and international governmental actions taken in response, such
as the U.S. Treasury’s TARP and the FDIC’s Temporary Liquidity Guarantee Program, and the effect of such governmental actions on First Financial, its competitors and
counterparties, financial markets generally and availability of credit specifically, and the U.S. and international economies, including potentially higher FDIC premiums arising from
participation in the Temporary Liquidity Guarantee Program or from increased payments from FDIC insurance funds as a result of depository institution failures; the effects of and
changes in policies and laws of regulatory agencies, inflation, and interest rates; technology changes; mergers and acquisitions; including our ability to successfully integrate the
Peoples Community Bank banking centers, and the banking centers which are expected to be acquired from Irwin Union Bank and Trust Company; the effect of changes in
accounting policies and practices; adverse changes in the securities and debt markets; First Financial’s success in recruiting and retaining the necessary personnel to support
business growth and expansion and maintain sufficient expertise to support increasingly complex products and services; the cost and effects of litigation and of unexpected or adverse
outcomes in such litigation; uncertainties arising from First Financial’s participation in the TARP, including impacts on employee recruitment and retention and other business
practices, and uncertainties concerning the potential redemption of the U.S. Treasury’s preferred stock investment under the program, including the timing of, regulatory approvals for,
and conditions placed upon, any such redemption; and First Financial’s success at managing the risks involved in the foregoing.
For further discussion these and other factors that may cause such forward-looking statements to differ materially from actual results, refer to the 2008 Form 10-K and other public
documents filed with the Securities and Exchange Commission (SEC), as well as the most recent Form 10-Q filing for the quarter ended June 30, 2009. These documents are
available within the investor relations section of First Financial’s website at www.bankatfirst.com/investor and on the SEC's website at www.sec.gov.

3
Investment Highlights
Strong operating fundamentals have produced positive results
throughout the recessionary period
Capital and liquidity significantly exceed amounts necessary to be
classified as well-capitalized
Solid loan and deposit growth
Overall credit quality remained relatively strong throughout most of
the economic downturn
Prolonged conditions, including higher unemployment, now
affecting clients who recently were not impacted by the adverse
conditions
Credit metrics, although higher than historical levels, remain
relatively strong compared with industry and peer levels
Corporate Overview 1
Total Assets: $3.8 billion
Total Loans: $2.9 billion
Total Deposits: $2.8 billion
1,048 FTEs
101 banking centers serving 9 regional
markets in 60 communities in 3 states 2
Trading Statistics 1
Nasdaq: FFBC
Shares Outstanding: 51.4 million
Market Capitalization: $387.3 million
YTD-2009 Average Daily Trading Volume:
205,000 shares
Recent strategic initiatives
Common stock offering of 13.8 million shares resulted in net proceeds of $98 million
Expanding presence in key metropolitan markets through select growth opportunities
Purchased 19 banking centers in key Cincinnati MSA from Peoples Community Bank in FDIC-assisted
transaction
Purchased $145 million in loans/strategic client relationships from Irwin Union Bank and Trust Company
Pending purchase of 3 banking centers in Indiana from Irwin
Well positioned to endure the economic challenges
Adequate capital cushion in the event of a more severe and/or prolonged downturn
Managing the company with a long-term view
1 June 30, 2009 data
2 August 3, 2009 data

4
First Financial Bank was founded in 1863
16 bank/thrift acquisitions from 1989 through 1999 resulted in multiple bank
charters and brand identities
Established Strategic (Rebuilding & Reorganization) Plan in March 2005
History
Consolidated and streamlined company to establish one charter and one brand
identity
Restructured credit process
Restructured balance sheet
Exited non-strategic, high risk and unprofitable businesses and product lines
Renewed focus on expense control and efficiency
Upgraded infrastructure (physical, processes, technology)
Expanded market presence and recruited sales teams in regional metropolitan areas
Renewed focus on client and sales growth

January
2005
August
2009
Reorganization Plan - Timeline
5
February
2006
Balance Sheet
Restructuring
June
2006
-
September
2006
Branding
March
2005
Strategic Plan
Announced
September
2005
Indirect
Loan Sale
December
2007
Moved to new
Cincinnati
Headquarters
November
2005
Mortgage Sale
May
2006
Branch Plan
Announced
June
2009
Capital Raise
Issued
13
.
8
million shares
of FFBC common stock
September
2005
Fidelity Sale
December
2008
Received
$
80
million
CPP Investment
October
2006
Data Processing
Conversion
August
2006
Branch Sale
/
Closures
February
2009
Cincinnati Market
Expansion
New Banking Center
In Madeira
November
2005
Dayton Market
December
2005
Dutch Auction
November
2007
Increased Dividend
August
2008
Established Indianapolis
Commercial Team
August
2005
Charter Consolidation
October
2005
Capital Plan
May
2007
Mortgage Servicing
to PHH Mortgage
December
2008
New Banking Centers
Crown Point IN
Kettering OH
August
2006
Problem Loan
Sale
April
2006
Performance Improvement
Plan Announced
December
2006
Problem Loan
Sale
July
2005
Cincinnati Market
Expansion
July
2009
Announced Market Expansion
Proposed Purchase of
3
Banking Centers
in Indiana from
Irwin Union Bank
&
Trust
October
2007
Merchant
Portfolio Sale
December
2007
Completed
Rebuilding
&
Reorganization
portion of Strategic Plan
July
2009
Purchased
19
Banking Centers from
Peoples Community Bank
in FDIC
-
Assisted
Transaction

6
Business Units
Retail Banking
Commercial Banking
Wealth Management

7
Corporate Goals
Top-quartile performance for all stakeholders
Sustained and consistent excellence
Commitment to growth
Effective management of all risks

8
Growth Plan
Primary focus and value creation is through organic growth in key regional markets
2008 expansion included the addition of a commercial lending team in Indianapolis
(IN), a new business office and banking center in Kettering (OH), and a new
banking center in Crown Point (IN)
2009 plans include opening additional banking centers, including further expansion
within the Cincinnati metropolitan market, Northern Kentucky, Northern Ohio, South
Central Indiana
Acquisitions can advance market position and accelerate the timing of market
share compared with an organic growth only strategy
Pricing must be disciplined and favorable compared with the longer-term organic
growth only strategy
Ohio, Indiana and Kentucky where there is a strategic and geographic fit
Size and growth potential to help achieve corporate financial targets
Purchases of banking centers from Peoples and Irwin expands presence in key
metropolitan markets and leverages brand to increase market share

9
Business Strategy
Client “Intimate” Strategy
Strategic Focus: build long-term relationships with
clients by identifying and meeting their financial
needs
Target clients
Individuals and small / mid-size private businesses
located within the regional markets we serve
Ohio, Indiana, Kentucky
Serving 9 regional markets / 60 communities
Each market is managed by experienced, local
bankers
Markets are supported by centralized experts
Focus on organic growth supplemented by strategic
acquisitions
Northwest Indiana
North Central Indiana
South Central Indiana
Indianapolis - Indiana
Butler / Warren County - Ohio
Northern Ohio
Dayton / Middletown - Ohio
Cincinnati - Ohio
Northern Kentucky
Our Markets
10
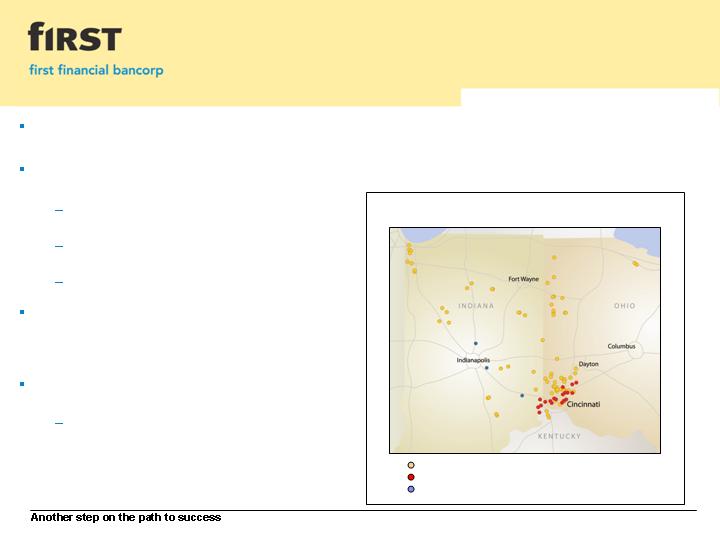
Market Expansion Opportunities
Track record of profitability combined with a strong balance sheet has allowed the company to make
strategic decisions and take advantage of market expansion opportunities
Purchased 19 banking centers, approximately $538 million in deposits and approximately $436 million in
loans from Peoples in FDIC-assisted transaction
Purchased approximately $145 million in select
performing commercial and consumer loans and
strategic client relationships on 06/30/09 from
Irwin
Pending purchase of 3 banking centers in
Indiana from Irwin
Includes approximately $143 million in
deposits and approximately $50 million in
select performing commercial and consumer
loans
Accelerates market expansion strategy by
several years
4th largest banking center network in
Cincinnati MSA
Solidifies position in market
First Financial Bank
Banking Center Network
First Financial Bank banking centers
Banking centers acquired from Peoples
Banking centers to be acquired from Irwin

19 banking centers from Peoples in Cincinnati MSA
Low-risk transaction
Loans purchased under loss sharing agreement with the FDIC for total loss protection of 88.5%
Loss sharing arrangement provides significant protection on the acquired loan and foreclosed
real estate portfolio
In-market transaction improves operating leverage
Pro forma 3.46% Cincinnati MSA deposit market share compared with 2.33% 1
Acquisition is compelling relative to cost and time to build 19 profitable de novo banking centers
3 banking centers in Indiana from Irwin (announced 07/01/09 – expected to close in 3Q-09)
Moves the company into affluent and fast-growing markets in and surrounding Indianapolis
metropolitan market
Received conditional approval from the OCC (Office of the Comptroller of the Currency)
Manageable transaction sizes reduce integration risk
Adds stable funding and banking centers in key areas that will leverage the First Financial
brand to increase market share
Consistent with growth strategy of expanding presence in strategic locations in both existing
and adjacent markets
11
Highlights of
Banking Center Acquisitions
1 Based on First Financial’s March 31, 2009 deposit base
Source: SNL Financial

Time Deposits
Savings
NOW
DDA
Balances and rates as of June 30, 2009
Total deposits of $538 million
Weighted average interest rate: 3.06%
(based on seller’s book value)
Ability to modify rates on CD portfolio at
time of assumption
Deposit & Loan Composition
Peoples Community Bank
12
$22.7
5.2%
$216.8
49.7%
$66.8
15.3%
$44.9
10.3%
$85.3
19.5%
Total loans of $436 million
Weighted average interest rate: 5.73%
Yield on portfolio may change based on fair value
assessment
Primarily in-market portfolio
Loans purchased under loss sharing agreement
with the FDIC
“Other” includes church, farm, stock,
commercial and personal vehicle loans,
unsecured commercial and loans secured
by deposit accounts
1 – 4 Family Residential Real
Estate – Owner Occupied
Other Residential Real Estate
Commercial Real Estate
Lot Loans & Land Acquisition /
Development
Other
Loan Portfolio
($ in millions)
Deposit Composition
($ in millions)
$12.8
2.4%
$343.5
63.8%
$148.3
27.5%
$33.7
6.3%
DDA
NOW
Savings
Time Deposits

13
Total loans of $145 million
No loans 30+ days past due
Weighted average interest rate: 6.40%
Entirely in-market portfolio
First Financial is not acquiring
Builder lots or land loans
Unsecured commercial loans
Construction loans
Unsecured consumer loans
Subprime loans
Deposit Composition 1
($ in millions)
Loan Portfolio 2
($ in millions)
Deposit & Loan Composition
Irwin Union Bank and Trust Company
Balances and rates as of June 30, 2009
$117.0
80.6%
$1.0
0.7%
$25.0
17.3%
$0.5
0.3%
$0.5
0.3%
$1.1
0.8%
Commercial & Industrial
Real Estate - Construction
Real Estate - Commercial
Real Estate - Residential
Installment
Home Equity
1 Deposits to be acquired when banking center transaction closes
2 Loan portfolio acquired on 06/30/09
Total deposits of $143 million
Strong core deposit funding
Weighted average interest rate: 1.05%
First Financial is not assuming any
Brokered CDs
Out-of-market deposits
Time Deposits
Transaction Deposits
$55.7
38.8%
$87.7
61.2%
Time Deposits
Transaction Deposits

14
Source: SNL Financial & FDIC
Note: FDIC deposit data updated once per year in June; data available in September
1 Number of banking centers currently in operation
2 Number of banking centers expected in operation after the 3 banking centers being purchased from Irwin closes in 3Q-09
3 Does not include deposits assumed from the 19 Peoples banking centers, or the deposits expected from the 3 Irwin banking centers
4 First Financial entered the Indianapolis market with the opening of a commercial lending office in August 2008
Demographic Profile
Demographic Profile (First Financial Bancorp)
Deposit, Market Share and Population Data as of June 30, 2008
State
Market
Number
of FFBC
Banking
Centers
1
Number
of FFBC
Banking
Centers
2
Total Deposits
in Market
($000)
FFBC Deposits
in Market
($000)
3
FFBC Deposit
Market Share
(%)
Projected
Population
Change
2008 - 2013
(%)
OH
Butler / Warren
24
24
4,180,986
$
828,641
$
19.8%
10.3%
OH
Cincinnati
12
12
42,824,615
55,672
0.1%
-2.4%
OH
Dayton / Middletown
12
12
9,134,296
351,086
3.8%
1.0%
KY
Northern Kentucky
7
7
1,887,691
106,277
5.6%
19.9%
IN
North Central Indiana
14
14
3,997,721
294,351
7.4%
2.6%
OH
Northern Ohio
16
16
5,219,065
517,777
9.9%
0.0%
IN
Northwest Indiana
8
8
7,329,142
486,655
6.6%
2.6%
IN
South Central Indiana
8
10
3,691,281
144,975
3.9%
2.2%
IN
Indianapolis
4
0
1
24,769,456
-
-
8.6%
Totals
101
104
103,034,252
$
2,785,434
$
2.7%

15
Retail Banking
Strategic Focus
Deposits
Select consumer lending
activities
101 banking centers
Serving 9 regional markets
in 60 communities in 3 states
Managed locally by
experienced local bankers
Supported centrally

16
Commercial Banking
Strategic Focus
Small / mid-size private businesses located within our regional
markets
Commercial & Industrial
Commercial Real Estate
Deposits / Cash Management
Sales Force
9 Market Presidents
50 Commercial Lenders
11 Treasury Management Representatives

17
Wealth Management
First Financial Wealth Resource Group
Trust
Brokerage
Investment Advisor
Life Insurance
Strategic Focus
Maintain existing client base
Increase share of wallet of existing client base
Integration with retail and commercial banking clients
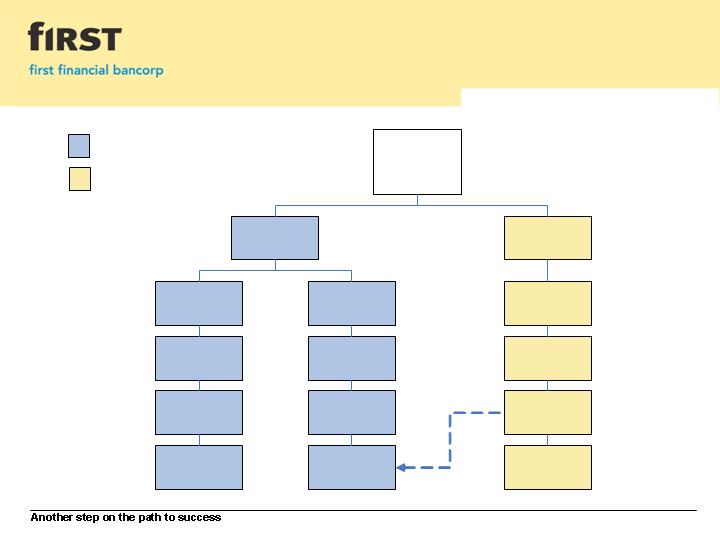
Credit Management System
Market-Based
18
First Financial
Bancorp
/
Bank
CEO
Executive Vice
President Markets
Chief Credit
Officer
Market
Presidents
Commercial
Lenders
Credit
Analysts
Administrative
Assistants
Regional Credit
Officers
Central
Documentation
/
Filing
Commercial Real
Estate Specialist
Special Assets
Collections
Sr
.
Portfolio
Credit Analyst
Government
Lending Specialist
Small Business
Banking
Loan Participation
&
Credit Analysis
Centralized
Market Level

19
Credit Quality
June 30, 2009
Credit quality trends remained relatively stable and within expected range throughout most of economic downturn
Reflecting discipline of originating loans within existing footprint, strong underwriting policies, and proactive management of
resolution strategies for problem credits
Credit quality experiencing some stress but remains relatively strong
Provision expense exceeded net charge-offs by 27% and increased $6.1 million over first quarter 2009
Significantly increased provision expense in fourth quarter 2008 and again in second quarter 2009 in response to a higher level of
net charge-offs and continued deterioration in economic conditions
Recorded 3 significant charge-offs totaling $5.1 million or 75 basis points of average loans and leases
Net charge-offs increased $4.5 million / Nonperforming loans increased $12.9 million 1
Seeing some stability in the level of loans 30 to 89 days past due
Expecting credit quality to remain challenging throughout 2009 for the entire industry
Credit costs may remain volatile over the next several quarters and may continue to impact results
1 Second quarter 2009 compared with first quarter 2009
2 Net of loan sale
2Q-09
1Q-09
4Q-08
3Q-08
2Q-08
2008
2007
2006
2
Net Charge-Off Ratio
1.19%
0.55%
0.73%
0.36%
0.40%
0.47%
0.24%
0.48%
Nonperforming Loans /
Loans
1.31%
0.91%
0.68%
0.53%
0.57%
0.68%
0.56%
0.44%
Reserve Ratio
1.34%
1.33%
1.34%
1.14%
1.11%
1.34%
1.12%
1.10%
Reserves / Nonperforming
Loans
102.3%
146.4%
197.3%
216.2%
192.5%
197.3%
197.9%
252.8%
Quarter
Year
Credit Quality Trends
0.89%
0.74%
0.38%
0.36%
0.46%
0.60%
0.85%
1.18%
1.19%
0.10%
0.19%
0.28%
0.28%
0.33%
0.47%
0.15%
0.65%
0.22%
0.24%
0.37%
0.22%
0.23%
0.23%
0.26%
0.40%
0.40%
0.36%
0.73%
0.55%
1Q-07
2Q-07
3Q-07
4Q-07
1Q-08
2Q-08
3Q-08
4Q-08
1Q-09
2Q-09
Peer Group I (size)
Peer Group II (geography)
FFBC
20
Credit Quality
Peer Group I is comprised of approximately 95 bank holding companies located throughout the United States with total asset size ranging from $3 - $10 billion; 2Q-09 data not yet available
Peer Group II is comprised of 30 bank holding companies conducting business primarily in Ohio, Kentucky and Indiana; 2Q-09 includes data from 27 companies
Source: Peer Group median data obtained from SNL Financial
Net Charge-offs to Average Loans & Leases
1 Includes higher charge-offs related to two separate and unrelated floor plan relationships (55 basis points) and one
commercial real estate construction relationship (20 basis points)
0.44%
0.20%
0.55%
1
21
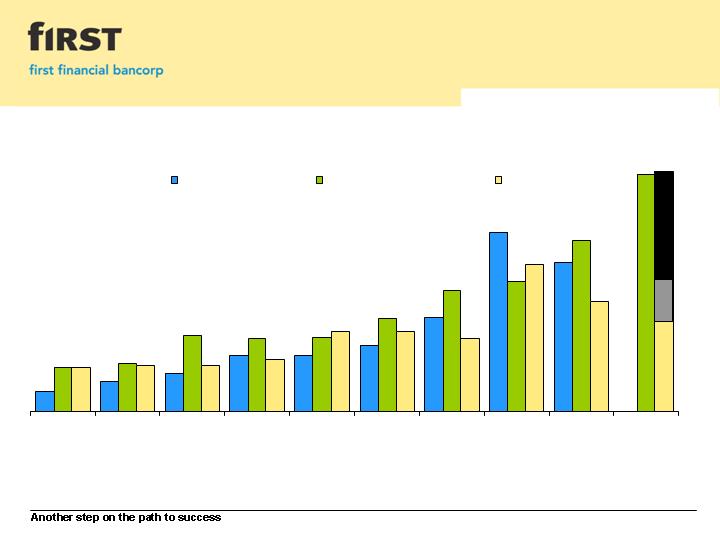
Allowance for Loans & Leases to Nonperforming Loans
Credit Quality
Peer Group I is comprised of approximately 95 bank holding companies located throughout the United States with total asset size ranging from $3 - $10 billion; 2Q-09 data not yet available
Peer Group II is comprised of 30 bank holding companies conducting business primarily in Ohio, Kentucky and Indiana; 2Q-09 data includes data from 24 companies
Source: Peer Group median data obtained from SNL Financial
260%
222%
209%
162%
152%
101%
90%
90%
72%
141%
151%
155%
136%
100%
80%
79%
76%
70%
67%
187%
212%
198%
195%
193%
216%
197%
146%
102%
241%
1Q-07
2Q-07
3Q-07
4Q-07
1Q-08
2Q-08
3Q-08
4Q-08
1Q-09
2Q-09
Peer Group I (size)
Peer Group II (geography)
FFBC
22
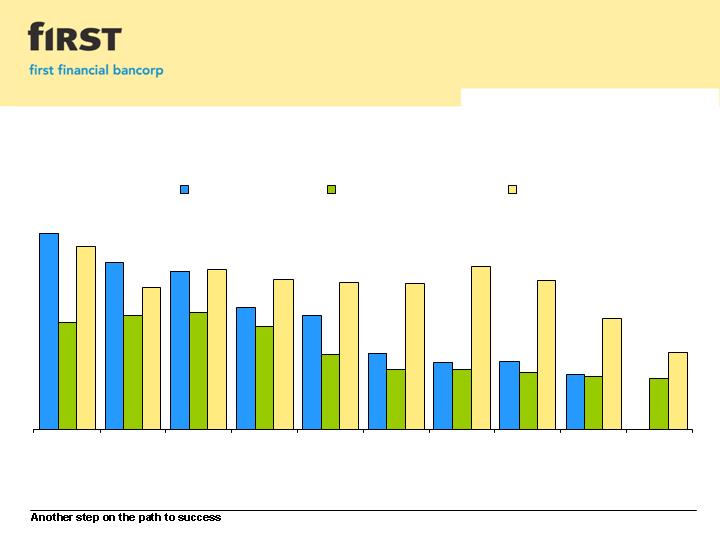
Nonperforming Loans to Total Loans
Credit Quality
Peer Group I is comprised of approximately 95 bank holding companies located throughout the United States with total asset size ranging from $3 - $10 billion; 2Q-09 data not yet available
Peer Group II is comprised of 30 bank holding companies conducting business primarily in Ohio, Kentucky and Indiana; 2Q-09 data includes data from 24 companies
Source: Peer Group median data obtained from SNL Financial
0.83%
0.76%
0.70%
0.91%
1.19%
1.46%
2.04%
2.31%
2.65%
3.34%
2.21%
0.55%
0.49%
0.43%
0.65%
0.81%
1.12%
1.46%
1.62%
1.31%
0.59%
0.53%
0.56%
0.58%
0.57%
0.53%
0.68%
0.91%
0.45%
1Q-07
2Q-07
3Q-07
4Q-07
1Q-08
2Q-08
3Q-08
4Q-08
1Q-09
2Q-09
Peer Group I (size)
Peer Group II (geography)
FFBC

23
Capital
Excess consolidated capital of $246.6
million over regulatory minimum required
level
Based on “well-capitalized” requirements,
can support bank-level asset growth up to
$448 million
Announced dividend reduction to common
shareholders in January 2009
Further improved already strong capital levels
Preserved approximately $5.3 million in common equity year-to-date 2009
Positions the company to weather the economic challenges while still taking advantage of select growth
opportunities
Long-term targeted dividend payout range is between 40% and 60% of earnings available to common
shareholders
Committed to maintaining a strong capital base
Will continue to take steps to ensure capital position remains sound throughout this period of economic
uncertainty
Capital levels will remain well in excess of regulatory minimums after the completion of both banking
center transactions
Ratio
2Q-09
Target
Regulatory
"well-capitalized"
minimum
EOP Tangible Equity /
EOP Tangible Assets
11.14%
6.75% - 7.25%
N/A
EOP Tangible Common Equity /
EOP Tangible Common Assets
9.06%
N/A
N/A
Leverage Ratio
12.02%
8.00% - 8.50%
5%
Total Risk-Based Capital Ratio
16.02%
11.50% - 12.00%
10%

Capital Raise
24
Common Share Offering
Completed a public offering of 13.8 million shares at $7.50 per share
Net proceeds of approximately $98 million after deducting underwriting
discounts, commissions and estimated offering expenses
Additional shares issued during the second quarter of 2009 had a minimal
impact on earnings per diluted common share
Positively impacted already strong capital levels
Net proceeds from the offering will support
Organic growth in key markets
Acquisitions and other business combinations and strategic opportunities,
including the recent Peoples banking center purchase and the pending
Irwin banking center purchase

Participation in the U.S. Treasury
Capital Purchase Program
25
Issued and sold to Treasury 80,000 shares of Series A Senior Preferred Stock for an
aggregate purchase price of $80 million 1
Liquidation preference of $1,000 per share
Warrant to purchase up to 930,233 common shares, without par value at an initial exercise price
of $12.90 per share, subject to certain anti-dilution and other adjustments
Asked to participate by banking regulators
Additional capital further strengthened already strong capital levels
Quarterly dividend payments
Paid $2.6 million year-to-date (February, May, August)
Due to the shifting political landscape, the real benefits of participating in the program may
have been altered
Changes that have been enacted to-date have not significantly impaired either our business
model or our ability to execute our core business strategy
Board of directors continues to evaluate capital plan and structure
Including the merits of continued participation in the program after having successfully raised
$98 million in common equity
Will consider any redemption, including partial redemption, when prudent
1 December 23, 2008

26
CPP Investment Portfolio
June 30, 2009
Established CPP Investment Portfolio with proceeds received from Treasury
Totaled approximately $60 million at June 30, 2009, compared with $225 million at
March 31, 2009, and $122 million at December 31, 2008
Earnings from the CPP Investment Portfolio in the first and second quarters of 2009 had
a positive effect on net interest income and exceeded quarterly dividends paid to
Treasury on its investment in the preferred shares
Executed a strategy to restructure the CPP Investment Portfolio to fund the $145
million loan purchase from Irwin
Sold approximately $149 million in securities from the CPP Investment Portfolio
resulting in an aggregate pre-tax gain of $3.3 million
Irwin loan purchase provided opportunity to accelerate redeployment strategy of shifting
from investment securities into loans

Financial Information

28
Second Quarter 2009
Results
Reported net income of $0.5 million or $0.01 per diluted common share
Second quarter 2009 results were impacted by:
$6.1 million increase in provision expense and a higher level of net charge-offs
Elevated FDIC deposit insurance expense of $3.4 million, including a $1.7 million special assessment
$3.3 million gain on the sale of investment securities from CPP Investment Portfolio
$0.4 million of acquisition-related expenses
Net interest income increased $2.8 million from 2Q-08 and $0.3 million from 1Q-09
Net interest margin remained stable on a linked quarter basis
Most fee income components of noninterest income continue to be impacted by declining economic
conditions and their impact on consumer spending
Service charges on deposit accounts realized some improvement from 1Q-09, and declines in total trust
and wealth management fees were not as severe as in recent quarters
Noninterest expenses were relatively flat, excluding higher FDIC premiums and special assessment
Solid loan and deposit growth
Continued strong capital and liquidity levels

29
Summary of Items Impacting
Earnings Per Diluted Common Share
1 The company believes that excluding these items presents a more representative comparison of operational performance for each period without the volatility
of credit quality that is typically present in times of economic stress, as well as other significant items not related to the company’s core business
The following table presents earnings excluding significant items impacting performance 1
Year-to-
Date
2Q
1Q
Full-Year
4Q
3Q
2Q
1Q
Full-Year
4Q
3Q
2Q
1Q
Gain (Loss) on FHLMC shares
1
123
$
112
$
11
$
(3,738)
$
(137)
$
(3,400)
$
(221)
$
20
$
-
$
-
$
-
$
-
$
-
$
Increase in Loan Loss Reserve & Higher
Charge-offs
-
-
-
(7,539)
(7,539)
-
-
-
-
-
-
-
-
Higher Charge-offs Related to Floor Plan
Relationships
(3,752)
(3,752)
-
-
-
-
-
-
-
-
-
-
-
Gain on Sale of Property & Casualty Portion
of Insurance Business
574
-
574
-
-
-
-
-
-
-
-
-
-
Gains on Sales of Investment Securities
(CPP 2009; VISA 2008; MasterCard 2007)
3,349
3,349
-
1,585
-
-
-
1,585
367
-
367
-
-
Gain on Sale of Merchant Payment
Processing Portfolio
-
-
-
-
-
-
-
-
5,501
5,501
-
-
-
Gain on Sale of Mortgage Servicing Rights
-
-
-
-
-
-
-
-
1,061
-
-
-
1,061
FDIC Special Assessment
(1,737)
(1,737)
-
-
-
-
-
-
-
-
-
-
-
FDIC Expense - Other
(1,969)
(1,687)
(282)
(521)
(158)
(115)
(121)
(127)
(330)
(81)
(81)
(82)
(86)
Acquisition-related Expenses
(426)
(426)
-
-
-
-
-
-
-
-
-
-
-
Severance Costs Related to Sale of
Property & Casualty Insurance Business
(232)
-
(232)
-
-
-
-
-
-
-
-
-
-
Pension Settlement Charges
-
-
-
-
-
-
-
-
(2,222)
(2,222)
-
-
-
Liability for Retiree Medical Benefits
-
-
-
1,285
-
-
1,285
-
-
-
-
-
-
Visa Member Litigation Charges
-
-
-
-
-
-
-
-
(461)
(461)
-
-
-
Impact to Pre-Tax Net Income
(4,070)
$
(4,141)
$
71
$
(8,928)
$
(7,834)
$
(3,515)
$
943
$
1,478
$
3,916
$
2,737
$
286
$
(82)
$
975
$
After-Tax Impact to Earnings Per Diluted
Share
(0.06)
$
(0.07)
$
0.00
$
(0.15)
$
(0.14)
$
(0.06)
$
0.02
$
0.03
$
0.07
$
0.05
$
0.00
$
(0.00)
$
0.02
$
($ in thousands, excluding per share data)
2009
2008
2007
1
Gain (Loss) related to the company's investment in 200,000 Federal Home Loan Mortgage Corporation (FHLMC) perpetual preferred series V shares
30
Earnings Per Diluted Common Share
1 Reflects the impact of certain non-recurring items. A reconciliation presenting a summary of items impacting earnings per share is on page 29
1
$0.22
$0.21
$0.22
$0.29
$0.20
$0.21
$0.15
$0.06
$0.14
$0.01
$0.20
$0.21
$0.21
$0.24
$0.17
$0.23
$0.21
$0.19
$0.14
$0.08
1Q-07
2Q-07
3Q-07
4Q-07
1Q-08
2Q-08
3Q-08
4Q-08
1Q-09
2Q-09
GAAP Earnings Per Share
Earnings Per Share

31
Pre-Tax, Pre-Provision Income
Excluding Significant Items
1 The company believes that excluding these items presents a more representative comparison of operational performance for each period without the volatility
of credit quality that is typically present in times of economic stress, as well as other significant items not related to the company’s core business
The following table presents pre-tax, pre-provision income excluding significant items 1
2Q-09
1Q-09
2Q-08
June 30,
2009
June 30,
2008
Pre-Tax Income
2,152
$
8,768
$
11,700
$
10,920
$
22,581
$
Excluding Provision Expense
10,358
4,259
2,493
14,617
5,716
Pre-Tax, Pre-Provision Income
12,510
$
13,027
$
14,193
$
25,537
$
28,297
$
Significant Items
2
1,298
353
1,064
1,651
2,669
Pre-Tax, Pre-Provision Income,
excluding Significant Items
11,212
$
12,674
$
13,129
$
23,886
$
25,628
$
2
($ in thousands)
Quarter
Year-to-Date
Includes significant items summarized on page 29, with the exception of FDIC Expense - Other and provision-related items

32
Net Interest Margin
1
1 Represents the Fed Funds Target Rate at the end of the quarter
4.12%
3.97%
3.88%
3.79%
3.78%
3.72%
3.68%
3.67%
3.61%
3.60%
0.00%
1.00%
2.00%
3.00%
4.00%
5.00%
6.00%
7.00%
1Q-07
2Q-07
3Q-07
4Q-07
1Q-08
2Q-08
3Q-08
4Q-08
1Q-09
2Q-09
Earning Asset Yield
Liability Cost
Net Interest Margin
Fed Funds Target Rate

Non-Owner Occupied - $624.4 million
Acquisition & Land Development - $66.5 million
Single Issuer Loan Participations - $49.8 million
Owner Occupied - $51 4.7 million
41%
4%
5%
50%
43%
30%
11%
12%
4%
Commercial Real Estate
Commercial & Industrial
HELOC
Residential Real Estate
Installment & Other
Includes $145 million in loans purchased on 06/30/09 from Irwin
Loan Composition
June 30, 2009
33
4%
96%
All Other - $842.1 million
Shared National Credits - $34.6 million
1
YTD-2009 = January 1, 2009 – June 30, 2009
Yield presented is not tax-equivalent
4.9%
6.6%
8.0%
6.7%
5.5%
6.5%
5.9%
Average
Earning Assets
8.0%
7.9%
7.1%
5.6%
7.9%
8.2%
5.7%
6.1%
5.6%
7.8%
5.7%
Yield
3.9%
7.6%
5.5%
4.4%
End of Period
Loan Portfolio Composition
Earning Assets &
Loan Composition
6.9%
5.1%
1 Includes $145 million in loans purchased on 06/30/09 from Irwin
34
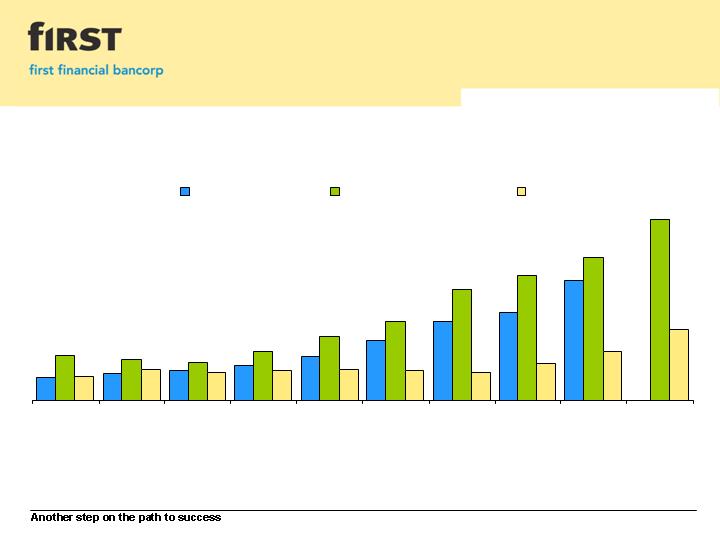
10%
12%
56%
45%
53%
57%
16%
20%
24%
13%
15%
17%
22%
14%
14%
12%
FY-2006
FY-2007
FY-2008
YTD-2009
Commercial Loans & Leases
Residential Mortgages
Consumer Loans
Investments
35
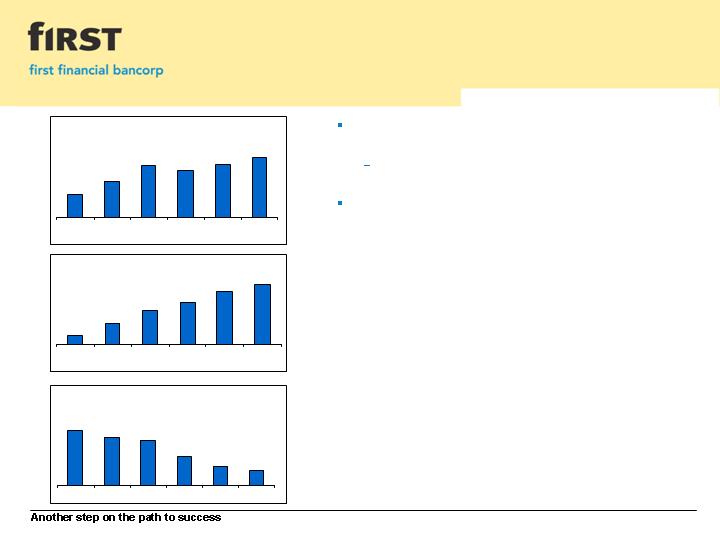
Loan Strategy
Linked-quarter percentage growth is annualized
Second quarter 2009 average total loans increased
$26.1 million or 3.9% from first quarter 2009
Driven primarily by 9.2% growth in commercial lending
portfolios
Overall declines in the average consumer lending
portfolios are a result of the company’s strategy to
de-emphasize certain consumer-based lending
activities
2Q-09
1Q-09
4Q-08
3Q-08
2Q-08
1Q-08
$2,738
$2,712
$2,689
$2,708
$2,645
$2,593
($ in millions)
Average Total Loans
2Q-09
1Q-09
4Q-08
3Q-08
2Q-08
1Q-08
$1,971
$1,927
$1,861
$1,809
$1,731
$1,652
($ in millions)
Average Commercial Loans
Average Consumer Loans
($ in millions)
$941
$914
$898
$828
$785
$767
1Q-08
2Q-08
3Q-08
4Q-08
1Q-09
2Q-09
36
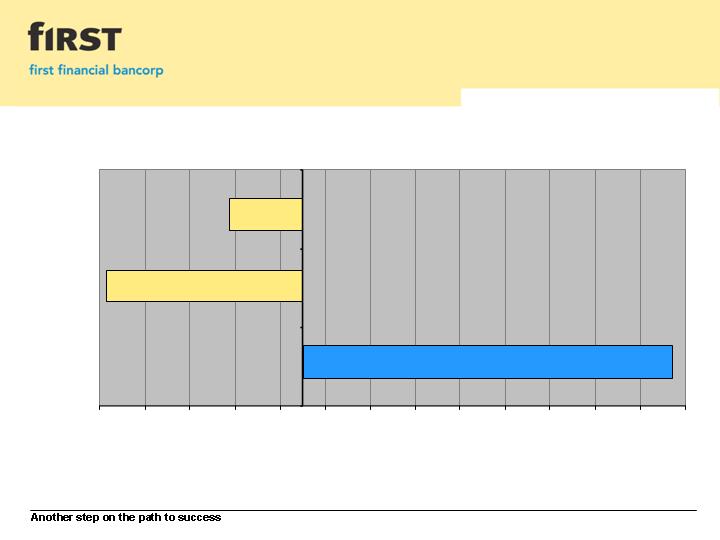
Gross loan CAGR = 2.3% due to planned runoff in indirect loans and residential mortgages
1 December 31, 2005 through June 30, 2009
Growth Since 2005 1
Loan Portfolio Strategy
(450,000)
(350,000)
(250,000)
(150,000)
(50,000)
50,000
150,000
250,000
350,000
450,000
550,000
650,000
750,000
850,000
Commercial Lending
Residential Mortgages
Indirect Installments
($000s)
62%
(56%)
(91%)
37
Investment Portfolio Summary
Investment Portfolio
June 30, 2009
On-going review of various strategies to increase the size of the investment portfolio and its absolute
level of earnings, while balancing capital and liquidity targets
Represents approximately 14.8% of total assets
Portfolio selection criteria avoids securities backed by sub-prime assets and those with geographic
considerations
($ in thousands, excluding book price and market value)
Base
% of
Book
Book
Book
June 30, 2009
Gain/
Total
Value
Yield
Price
Market Value
(Loss)
Agencies
7.3%
41,145
$
5.31
99.79
102.69
1,162
$
CMOs (Agency)
11.8%
65,879
4.71
100.44
103.50
1,950
CMOs (Private)
0.0%
77
1.60
100.00
97.94
(2)
MBSs (Agency)
69.8%
391,667
4.72
100.94
103.24
8,709
Agency Preferred
0.0%
184
-
0.92
0.92
-
Subtotal
88.9%
498,952
$
4.76
100.74
102.18
11,819
$
Municipal
5.4%
30,085
$
7.16
99.12
100.36
376
$
Other
1
5.7%
31,839
4.47
101.17
100.90
(87)
Subtotal
11.1%
61,924
$
5.78
100.18
100.64
289
$
Total Investment Portfolio
100.0%
560,876
$
4.87
100.68
102.03
12,108
$
Net Unrealized Gain/(Loss)
12,108
$
Aggregate Gains
13,072
$
Aggregate Losses
(964)
$
Net Unrealized Gain/(Loss) % of Book Value
2.16%
1
Other includes $28.0 million of regulatory stock

38
Investment Portfolio
June 30, 2009
* Other includes regulatory stock
Sector Allocation
Credit Quality
Investment Grade = A-rated securities
Other Investment Grade = B-rated securities
Non-Investment
Grade
0%
Investment Grade
96%
Other Investment
Grade
1%
Not Rated
3%
MBSs (Agency)
70%
Agency
Preferred
0.0%
Municipal
5%
Other *
6%
Agencies
7%
CMOs (Private)
0%
CMOs (Agency)
12%

39
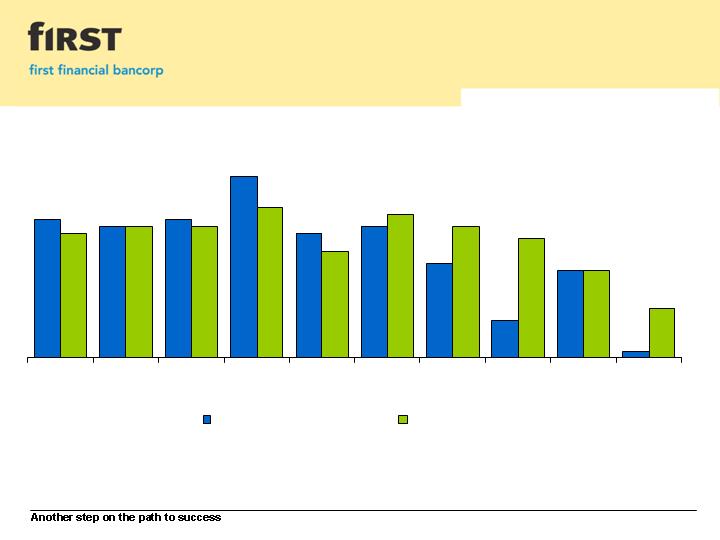
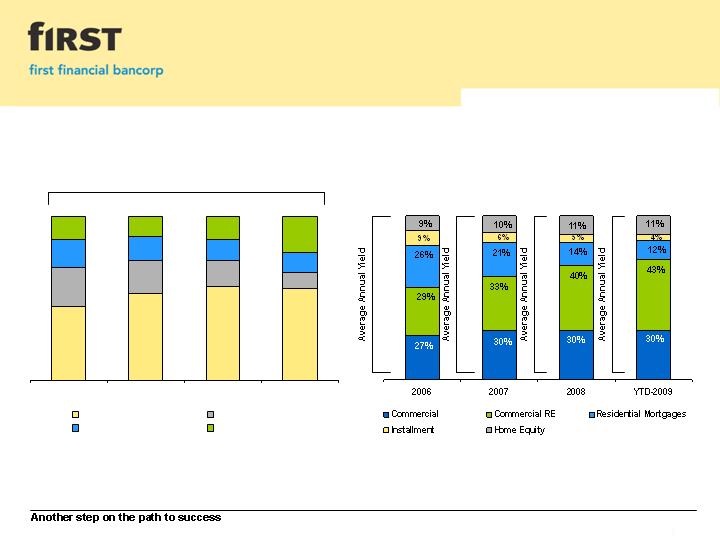
YTD-2009 = January 1, 2009 – June 30, 2009
1.6%
Borrowed Funds
Time Deposits
Interest-Bearing Deposits
Noninterest-Bearing Deposits*
YTD-2009
FY-2008
FY-2007
FY-2006
40%
41%
38%
35%
40%
40%
39%
40%
13%
13%
13%
12%
10%
6%
7%
13%
3.0%
3.4%
2.5%
* Not included in yield calculation
Average
Liability Mix
End of Period
Deposit Portfolio Composition
1.8%
2.0%
0.8%
3.9%
4.5%
4.0%
Yield
Liability Mix &
Deposit Composition
0.0%
0.0%
0.0%
0.2%
3.0%
0.0%
15%
15%
15%
16%
45%
43%
42%
44%
40%
41%
42%
42%
2006
2007
2008
YTD-2009
Noninterest-Bearing Deposits*
Interest-Bearing Deposits
Time Deposits

40
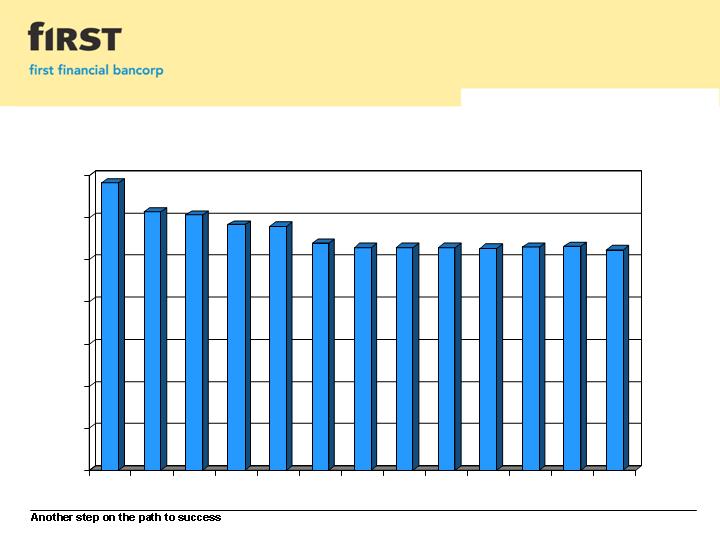
Deposit Strategy
Linked-quarter percentage growth is annualized
Second quarter 2009 average total deposits increased
$11.5 million or 1.6% from first quarter 2009
Driven primarily by 5.2% growth in transaction and
savings deposits
Growth assisted by deposit-pricing strategies and other
initiatives implemented over the past several quarters
in an effort to grow and retain more low-cost,
transaction-based retail and commercial deposits
Year-over-year declines in average time deposits are
attributable to the runoff of time deposits resulting from
disciplined pricing and the company’s strategy to
generate lower-cost transaction-based retail and
commercial deposit accounts
Disciplined pricing strategies are employed for all
deposit types
Retail sales process measures results of client
contacts, calling efforts, product sales and service
metrics
2Q-09
1Q-09
4Q-08
3Q-08
2Q-08
1Q-08
$1,701
$1,680
$1,628
$1,624
$1,602
$1,613
($ in millions)
Average Transaction & Savings Deposits
Average Total Deposits
($ in millions)
$2,832
$2,795
$2,783
$2,780
$2,822
$2,833
1Q-08
2Q-08
3Q-08
4Q-08
1Q-09
2Q-09
Average Time Deposits
($ in millions)
$1,219
$1,193
$1,158
$1,152
$1,142
$1,132
1Q-08
2Q-08
3Q-08
4Q-08
1Q-09
2Q-09
41
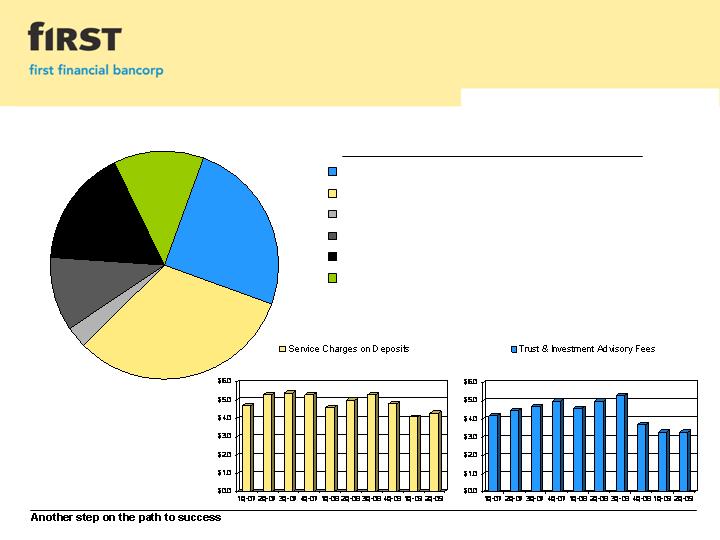
Noninterest Income
YTD-2009 = January 1, 2009 – June 30, 2009
Year-to-Date 2009
Total Noninterest Income = $26.1 million
($ in millions)
($ in millions)
13%
17%
32%
25%
3%
10%
Trust & Investment Advisory Fees - $6.5 million
Service Charges on Deposits - $8.4 million
Gain on Mortgage Loan Sales - $0.8 million
Bankcard Income - $2.7 million
Other Misc. Income - $4.4 million
Gains on Sales of Investment Securities - $3.3 million

42
Efficiency
Efficiency Ratio
YTD-2009 = January 1, 2009 – June 30, 2009
40.0%
45.0%
50.0%
55.0%
60.0%
65.0%
70.0%
75.0%
80.0%
FY-2004
FY-2005
FY-2006
FY-2007
FY-2008
YTD-2009
Long-Term Target = 55% to 60%
43
Staffing Level
Full-Time Equivalent Personnel
0
200
400
600
800
1,000
1,200
1,400
Jun-06
Sep-06
Dec-06
Mar-07
Jun-07
Sep-07
Dec-07
Mar-08
Jun-08
Sep-08
Dec-08
Mar-09
Jun-09

Leadership

45
Leadership
Claude E. Davis
President & Chief Executive Officer
Claude E. Davis joined First Financial in 2004 as President, Chief Executive Officer, and a member of the Board of Directors. Mr. Davis
also serves as Chairman of the Board of Directors of First Financial Bank. Prior to joining the company, he served as Senior Vice
President at Irwin Financial Corporation, and Chairman of Irwin Union Bank and Trust, the company’s lead bank, positions he held since
2003. Earlier in his career, he served as President of Irwin Union Bank and Trust for seven years. Mr. Davis began his career as a
Certified Public Accountant with the public accounting firm Coopers & Lybrand.
C. Douglas Lefferson
Executive Vice President & Chief Operating Officer
C. Douglas Lefferson has spent his entire career in various positions within First Financial Bancorp and First Financial Bank, and was
appointed to his current position in 2005. Prior to his current appointment, Mr. Lefferson served as Chief Financial Officer from 2002
through 2005.
J. Franklin Hall
Executive Vice President & Chief Financial Officer
J. Franklin Hall joined First Financial in 1999 and was appointed to his current position in 2005. Prior to joining the company, he was
with Firstar Bank (currently US Bancorp). He is a Certified Public Accountant (inactive), and began his career with the public accounting
firm Ernst & Young, LLP. Mr. Hall also serves as President of the First Financial Bancorp subsidiary First Financial Capital Advisors,
LLC, and is President of the company’s proprietary mutual fund family, First Funds.
Samuel J. Munafo
Executive Vice President, Banking Markets
Samuel J. Munafo has spent his entire career in various positions within First Financial Bancorp and First Financial Bank and currently
serves as Executive Vice President overseeing all of the company’s banking markets. Prior to his current appointment, Mr. Munafo
served as President of First Financial Bank (2005 – 2006), and President and Chief Executive Officer for several First Financial affiliates,
including Community First Bank & Trust (2001 - 2005), Indiana Lawrence Bank (1998 – 2001), and Clyde Savings Bank (1994 – 1998).
He began his career with the company as a management trainee and served the company in a number of areas, including operations,
retail, commercial lending, credit cards and security.

46
Leadership
Richard Barbercheck
Senior Vice President & Chief Credit Officer
Richard Barbercheck joined First Financial in 2005 as Senior Vice President and Chief Risk Officer, and was appointed to his current
position in 2006. Mr. Barbercheck is responsible for the administration of the bank’s lending portfolios as well as oversight of the
company’s credit policies and loan underwriting processes. Prior to joining the company, he oversaw the Credit Risk Evaluation
Group at Irwin Financial Corporation (Columbus, Indiana). Earlier in his career he served at several banks in executive-level positions
located in Southeastern Indiana, including Veedersburg State Bank (1989 – 1993), National City Bank (1993 - 1998), and Irwin Union
Bank (19998- 2005). Mr. Barbercheck has a total of 27 years of banking experience, with a predominance of experience in the
commercial lending and credit administration areas.
Michael Cassani
Senior Vice President, Wealth Resource Group
Michael Cassani joined First Financial in 2007 as Senior Vice President and Chief Administrative Officer to oversee the company’s
Wealth Resource Group. Prior to joining the company, Mr. Cassani served as President of Fund Project Services, Inc., a financial
project management and consulting firm he co-founded in 1998. Earlier in his career, he served as Mutual Funds Product Manager at
Fifth Third Bank, and as Institutional Investment Officer at Roulston and Company. Prior to those appointments, Mr. Cassani served
as an Investment Representative for two separate companies located within the Chicago area.
Gregory A. Gehlmann
Senior Vice President, General Counsel
Gregory A. Gehlmann joined First Financial in 2005 as Senior Vice President and General Counsel. Mr. Gehlmann also served as
Chief Risk Officer for the company (2006 – 2008). Prior to joining the company, he practiced law for 16 years in Washington, D.C. Mr.
Gehlmann served as partner/counsel at Manatt, Phelps & Phillips, LLP (Washington, D.C.), where he was counsel to public and
private companies, as well as investors, underwriters, directors, officers, and principals regarding corporate securities, banking, and
general business and transactional matters.

47
Leadership
John Sabath
Senior Vice President & Chief Risk Officer
John Sabath joined First Financial in 2005 as Regulatory Risk Manager. Mr. Sabbath was then promoted to Senior Risk Officer and
First Vice President, and assumed his current position in 2008. He is responsible for management of the company’s risk management
function which includes commercial and retail credit, compliance, operational, market, strategic and reputation risk. Prior to joining the
company, he was in the Enterprise Risk Group at Fifth Third Bank. Earlier in his career, Mr. Sabbath held positions at the Federal
Reserve Bank of Cleveland, National City Bank and Star Bank (currently US Bancorp).
Jill A. Stanton
Senior Vice President, Retail & Small Business Lending Manager
Jill Stanton joined First Financial in 2008. Ms. Stanton has responsibility for product line management for first mortgage loans,
consumer lending and small business lending. Prior to joining the company, she served as Senior Vice President for Irwin Union Bank
where she was responsible for mortgage, consumer lending, business banking, commercial credit analysis, credit administration and
loan operations in their commercial banking business. Ms. Stanton has over 20 years of experience within the banking industry.
Jill L. Wyman
Senior Vice President, Retail Banking Sales & Deposit Manager
Jill Wyman joined First Financial in 2003 as Vice President and Sales Director. In her current position, Ms. Wyman has responsibility
for leading the retail sales process, growing retail deposits, and enhancing the sales culture throughout the company’s three-state
banking center network. She is also responsible for market services and corporate marketing. Prior to joining the company, she spent
19 years in retail where she served as general manager at Lazarus, a division of Federated Department Stores (currently Macy’s). Ms.
Wyman began her career as a management trainee at Federated/Macy’s and progressed to sales manager, group sales manager,
assistant general manager and regional merchandise manager.

Financial data at June 30, 2009
Banking Centers at August 3, 2009
About First Financial Bancorp
First Financial Bancorp is a Cincinnati, Ohio based bank holding company with
$3.8 billion in assets. Its banking subsidiary, First Financial Bank, N.A., founded
in 1863, provides retail and commercial banking products and services, and
investment and insurance products through its 101 retail banking locations in
Ohio, Kentucky and Indiana. The bank’s wealth management division, First
Financial Wealth Resource Group, provides investment management, traditional
trust, brokerage, private banking, and insurance services, and has approximately
$1.7 billion in assets under management. Additional information about the
company, including its products, services, and banking locations, is available at
www.bankatfirst.com.

Another step on the path to success