Success
doesn’t come overnight. It is the culmination of good planning, many small steps and the occasional giant leap. It requires a solid foundation and constant attention. And when a big success is achieved, there is the realization that many challenging steps lie ahead. 2009 was a successful year for First Financial in many ways. Building upon that foundation will take us to new levels of success. | |
2009 was a year of challenge and
The biggest story in 2009 for First Financial was nearly doubling the size of the company by acquiring the banking operations of Peoples Community Bank, Irwin Union Bank and Trust Company, and Irwin Union Bank, F.S.B.
Having built a strong foundation based on a clear strategic plan, First Financial was ready with the capital and management resources necessary to bid on and acquire the banking operations of these three entities from the Federal Deposit Insurance Corporation (FDIC). Our selection by the FDIC to acquire these companies recognized our solid operating fundamentals, including our strong capital, liquidity and reserve levels.
Since the acquisitions, teams of associates have worked relentlessly on the integration of the new banking centers. Systems have been converted; we have consolidated duplicate locations; and new associates have quickly adapted to their new environment.
Remained profitable in 2009. Throughout the year, First Financial continued to hold its strong financial position by maintaining healthy capital and liquidity levels, controlling expenses, and focusing on core deposit growth.
These metrics highlight this success at our legacy banking centers:
· 14% growth in transaction and savings deposits
· 9% growth in commercial loans
· 8% growth in wealth resource assets under management
· 10% growth in commercial deposit balances
Our sales teams and Compass, our aggressive new retail sales process that was introduced in 2009 and will expand in 2010, contributed to our growth.
January 2009 Entered the year with a strong | February 2009 Expanded our Cincinnati |
| loan loss reserve to prepare for continuing | market with the opening of a new prototype |
| economic stress that was expected in 2009. This | banking center in the suburb of Madeira. Visual |
| prudent action helped manage credit risk and | merchandising as well as engaging retail graphics |
| protect the company. | “take the client on a journey” that reminds them of |
| | defining moments of success in their lives. |
| | |
2 First Financial Bancorp 2009 Annual Report | |
opportunity for First Financial.
Grew our assets. Our acquisitions brought us good facilities, established clients, and knowledgeable associates.
First Financial now has the fourth largest banking center network in the greater Cincinnati market and is the first or second largest in many of the Indiana communities where we have a presence.†
| December 31, 2008 | | | | |
Banking Centers‡ | | | 81 | |
| Associates | | | 1,061 | |
| Total Loans | | $2.7 billion | |
| Total Deposits | | $2.8 billion | |
| Total Assets | | $3.7 billion | |
| December 31, 2009 | | | | |
Banking Centers# | | | 118 | |
| Associates | | | 1,390 | |
| Total Loans | | $4.8 billion | |
| Total Deposits | | $5.4 billion | |
| Total Assets | | $6.7 billion | |
† Based on deposits in the market at June 30, 2009; source FDIC and SNL Financial
‡ Banking centers in operation in Ohio, Indiana and Kentucky
# Banking centers in operation in Ohio, Indiana, Kentucky and Michigan
March 2009 Completed the first quarter of | April 2009 First Financial Bancorp was honored with |
| 2009 profitably and with strong loan and deposit | Ernst & Young’s Entrepreneur of the Year award in the |
| growth. | financial services category. The annual awards recognize |
| | the best innovators and visionary thinkers in South |
| | Central Ohio and Kentucky. An independent panel |
| | judges candidates on financial performance, creativity, |
| | community involvement, and capacity for overcoming |
| | obstacles. |
| | |
| | First Financial Bancorp 2009 Annual Report 3 |
Invested in our franchise and our future. We are adding banking centers that will leverage the First Financial brand to increase market share in key areas, complement existing locations, and provide entry into new markets. In 2009, we built prototype banking centers in Cincinnati and St. Marys, Ohio, and in Edgewood, Kentucky. In addition, eight banking centers were remodeled or refreshed as a continuation of the company’s multi-year plan for improving facilities.
During 2009, our new prototype design for banking centers won two awards for retail design – one national and one international.
Moved our corporate headquarters. To support expansion needs and to further boost visibility and proximity to other companies’ corporate headquarters in the Cincinnati market, we moved our corporate headquarters with a staff of 75 associates to downtown Cincinnati in January of 2010.
May 2009 Began a public offering of 13.8 million | June 2009 Purchased $145 million in performing |
| common shares at $7.50 per share resulting in net | commercial loans with strategic client relationships |
| proceeds of $98 million. This additional capital | from Irwin Union Bank and Trust Company. We |
| positioned us to continue to take advantage of | also announced the purchase of three banking |
| market opportunities. | centers from Irwin – a move that significantly |
| | expanded First Financial’s presence in strategic |
| | locations in central and southeastern Indiana. |
| | |
4 First Financial Bancorp 2009 Annual Report | |
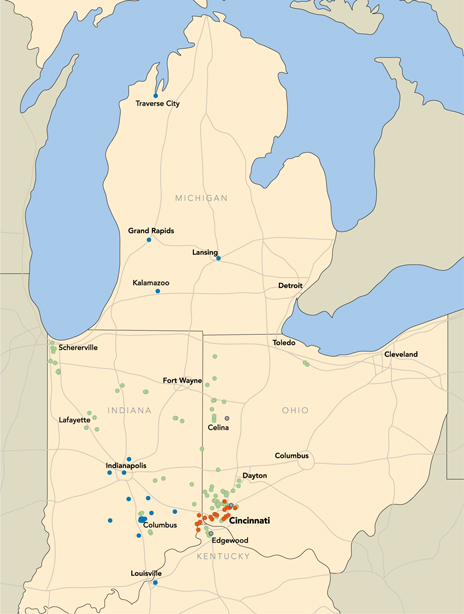
Grew our footprint.
This map shows First Financial’s base at the beginning of 2009 and the expansion of our banking center network within our strategic operating markets of Ohio, Indiana, Kentucky, and Michigan as a result of the acquisitions of the Peoples and Irwin banking centers.
• First Financial’s legacy locations
• Banking centers acquired from Peoples
• Banking centers acquired from Irwin
• New prototype banking centers opened in 2009
Strengthened our brand. After three years of developing and strengthening our brand, we commissioned a quantitative study of the brand’s impact on clients and the public in 2009. Overall awareness of our brand has increased by over 20% compared to baseline research conducted in late 2005.
Client satisfaction also showed improvement in 2009 and was a key element in our success. We continue to bring the First Financial brand of banking to new areas of our footprint.
Working swiftly to further culturalize First Financial’s brand and be sure that we are unified and consistent across all markets, we gain momentum for the challenges ahead.
July 2009 Purchased 19 banking centers, $521 | August 2009 Completed the conversion of |
| million in deposits and $335 million in loans and | client accounts from the three Indiana banking |
| other assets from Peoples Community Bank in | centers acquired from Irwin Union Bank and Trust |
| an FDIC-assisted transaction. This significantly | Company, which included total deposits of $85 |
| strengthened First Financial’s base in Greater | million and total loans of $41 million. This was |
| Cincinnati. | accomplished in record time with the extreme |
| | dedication and hard work of associates across |
| | the company. |
| | |
| | First Financial Bancorp 2009 Annual Report 5 |
Maintained our strong capital position. A strong capital level continued to support the company throughout 2009. At year-end, the total risk-based capital ratio was 18% — far exceeding the regulatory “well-capitalized” minimum requirement of 10%. In addition, our total regulatory capital exceeded the “minimum” requirement amount by $391 million. First Financial is in an excellent position to continue to take advantage of additional market opportunities.
Completed common equity offerings. We successfully completed two common equity offerings — issuing 13.8 million shares of First Financial’s common stock in June of 2009 and 6.4 million shares in February of 2010. Net proceeds from both offerings totaled approximately $190 million. The proceeds from the offering in February of 2010 allowed us to repay in full the $80 million investment made by the U.S. Treasury under the Troubled Asset Relief Program/Capital Purchase Program in December of 2008.
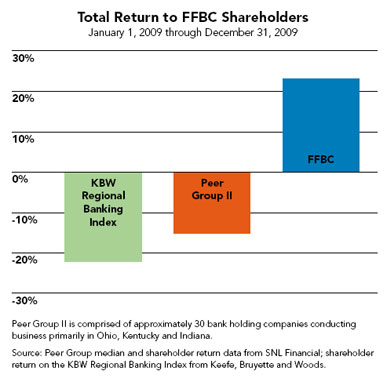
Peer Group II, comprised of approximately 30 bank holding companies conducting business primarily in Ohio, Kentucky and Indiana.
Source: Peer Group median and shareholder return data from SNL Financial; shareholder return on the KBW Regional Banking Index from Keefe, Bruyette and Woods.
Continued shareholder focus. Total return to First Financial shareholders in 2009 was 23.17%. By comparison, total return for Peer Group II was -15.70%, and total return for the KBW Regional Banking Index was -22.13%. First Financial was added to this index in November of 2009.
Managed risks successfully. Following industry trends, credit quality in our commercial and commercial real estate construction loan portfolios continued to weaken throughout 2009. However, our historically conservative underwriting practices, market discipline and proactive management of resolution strategies for problem credits produced asset quality ratios that continue to be better than industry peers.
September 2009 Purchased 27 banking centers, | October 2009 Reported record earnings for the |
| $2.5 billion in deposits and $1.8 billion in loans | third quarter. Net income was $225.6 million and |
| from Irwin Union Bank and Trust Company and | earnings per diluted common share were $4.36. |
| Irwin Union Bank, F.S.B. in an FDIC-assisted | |
| transaction. The purchase expanded First | |
| Financial’s banking center network to 49 locations | |
| in Indiana. | |
| | |
6 First Financial Bancorp 2009 Annual Report | |
2010 Outlook. First and foremost, we will continue to execute our strategic plan. This will fully prepare us to meet new opportunities where we can apply the experiences and processes our teams developed in 2009.
• As a result of the current stress commercial and commercial real estate and construction borrowers are experiencing, we expect to focus more on opportunities for growth in retail and commercial deposits and small business banking in 2010.
• As we move forward, we intend to improve the client experience at every touch point. By striving to be more positive, client-focused, and brand consistent, we will improve our service quality and deliver on our brand promises.
• We will expand our focus on risk management in 2010. We plan to learn from our weaknesses and from experts in the industry to improve our risk management systems and embed them in every aspect of our business.
• We also have plans to improve our position as an “employer of choice.” In 2009, our valued associates worked at a faster pace than ever before and stretched …sometimes more than we thought possible… to accommodate the new clients who came to us from Peoples and Irwin. We appreciate their sacrifice.
In 2010, we expect to move forward, rise to extraordinary results, and take bold new steps on our path to success.
Claude E. Davis, President and CEO
November 2009 Expanded our Northern | December 2009 In order to focus on our |
| Kentucky Market with the opening of a prototype | strategic markets, we began a series of closings |
| banking center in Edgewood, Kentucky. | of the Western states locations obtained in the |
| | acquisition of Irwin Union Bank, F.S.B. These |
| | locations do not fit the company’s strategy of |
| | Midwestern community banking. |
| | |
| | First Financial Bancorp 2009 Annual Report 7 |
| Board of Directors | | Senior Management |
| | | |
| Murph Knapke | | Claude E. Davis |
| Chairman of the Board, | | President and |
| First Financial Bancorp; | | Chief Executive Officer |
| Owner, | | |
| Knapke Law Office, | | C. Douglas Lefferson |
| Attorney-at-Law | | Executive Vice President and |
| | | Chief Operating Officer |
| J. Wickliffe Ach | | |
| President and | | J. Franklin Hall |
| Chief Executive Officer, | | Executive Vice President and |
| Hixson, Inc. | | Chief Financial Officer |
| | | |
| Donald M. Cisle, Sr. | | Samuel J. Munafo |
| President, | | Executive Vice President and |
| Seward-Murphy, Inc. | | Chief Commercial Banking Officer |
| | | |
| Mark A. Collar | | Richard Barbercheck |
| Partner, | | Senior Vice President and |
| Triathlon Medical Ventures; | | Chief Credit Officer |
| Retired President, | | |
| Global Pharmaceuticals & | | Michael J. Cassani |
| Personal Health, | | Senior Vice President and |
| Procter & Gamble Company | | Wealth Resource Group Chief |
| | | Administrative Officer |
| Claude E. Davis | | |
| President and | | Gregory A. Gehlmann |
| Chief Executive Officer, | | Senior Vice President, |
| First Financial Bancorp; | | General Counsel |
| Chairman of the Board, President, | | |
| and Chief Executive Officer, | | Kevin T. Langford |
| First Financial Bank, N.A. | | Senior Vice President and |
| | | Chief Information Officer |
| Corinne R. Finnerty | | |
| Partner, | | Alisa E. Poe |
| McConnell Finnerty Waggoner PC | | Senior Vice President and |
| | | Chief Human Resources Officer |
| Susan L. Knust | | |
| Managing Partner, | | Al Roszczyk |
| K.P. Properties and | | Senior Vice President for the |
| Omega Warehouse Services | | Commercial Banking Regions |
| | | |
| William J. Kramer | | John J. Sabath |
| Vice President of Operations, | | Senior Vice President and |
| Valco Companies, Inc. | | Chief Risk Officer |
| | | |
| Richard E. Olszewski | | Jill A. Stanton |
| Owner, | | Senior Vice President and |
| 7 Eleven Food Stores | | Co-Chief Retail Banking Officer |
| | | |
| | | Anthony M. Stollings |
| | | Senior Vice President, Controller, and |
| Internal Audit | | Chief Accounting Officer |
| James W. Manning | | |
| Senior Vice President and | | Jill L. Wyman |
| Chief Internal Auditor | | Senior Vice President and |
| | | Co-Chief Retail Banking Officer |
8 First Financial Bancorp 2009 Annual Report
Financial Highlights
| (Dollars in thousands, except per share data) | | 2009 | | | 2008 | | | % Change | |
| Earnings | | | | | | | | | |
| Net interest income | | $ | 175,983 | | | $ | 116,202 | | | | 51.45 | % |
| Net income | | | 246,546 | | | | 22,962 | | | | 973.71 | % |
| Income available to common shareholders | | | 242,968 | | | | 22,962 | | | | 958.13 | % |
| | | | | | | | | | | | | |
| Per Share | | | | | | | | | | | | |
| Net income per common share–basic | | $ | 5.40 | | | $ | 0.62 | | | | 770.97 | % |
| Net income per common share–diluted | | | 5.33 | | | | 0.61 | | | | 773.77 | % |
| Cash dividends declared per common share | | | 0.40 | | | | 0.68 | | | | (41.18 | )% |
| Book value per common share (end of year) | | | 11.59 | | | | 7.21 | | | | 60.75 | % |
| Market price (end of year) | | | 14.56 | | | | 12.39 | | | | 17.51 | % |
| | | | | | | | | | | | | |
| Average | | | | | | | | | | | | |
| Total assets | | $ | 4,741,514 | | | $ | 3,426,275 | | | | 38.39 | % |
| Deposits | | | 3,710,832 | | | | 2,797,403 | | | | 32.65 | % |
| Loans, including covered loans | | | 3,432,463 | | | | 2,661,546 | | | | 28.97 | % |
| Investment securities | | | 667,843 | | | | 452,921 | | | | 47.45 | % |
| Shareholders’ equity | | | 473,793 | | | | 279,709 | | | | 69.39 | % |
| | | | | | | | | | | | | |
| Ratios | | | | | | | | | | | | |
| Return on average assets | | | 5.20 | % | | | 0.67 | % | | | 676.12 | % |
| Return on average shareholders’ equity | | | 52.04 | % | | | 8.21 | % | | | 533.86 | % |
| Average shareholders’ equity to average assets | | | 9.99 | % | | | 8.16 | % | | | 22.43 | % |
| Net interest margin | | | 4.05 | % | | | 3.71 | % | | | 9.16 | % |
| Net interest margin (fully tax equivalent) | | | 4.08 | % | | | 3.77 | % | | | 8.22 | % |
First Financial Bancorp 2009 Annual Report 9
Management’s Discussion And Analysis Of Financial Condition And Results Of Operations
This annual report contains forward-looking statements. See Page 26 for further information on the risks and uncertainties associated with forward-looking statements.
The following discussion and analysis is presented to facilitate the understanding of the financial position and results of operations of First Financial Bancorp (First Financial or the Company). It identifies trends and material changes that occurred during the reporting periods and should be read in conjunction with the statistical data, Consolidated Financial Statements, and accompanying Notes on Pages 27 through 56.
EXECUTIVE SUMMARY
First Financial is a $6.7 billion bank holding company headquartered in Cincinnati, Ohio. As of December 31, 2009, First Financial, through its subsidiaries, operated mainly in Ohio, Indiana, Kentucky, and Michigan. These subsidiaries include a commercial bank, First Financial Bank, N.A. (Bank), with 127 banking centers and 149 ATMs, and a registered investment advisory company, First Financial Capital Advisors LLC (Capital Advisors). Within these two subsidiaries, First Financial conducts two primary activities: banking and wealth management. The Bank operates in 10 distinct markets under the First Financial Bank name and provides lending products, deposit accounts, cash management, and other services to commercial and retail clients. The wealth management activities include a full range of services including trust services, brokerage, investment, and other related services. Additionally, the Bank acquired a specialty, franchise lending subsidiary as part of a business combination in 2009 described below. The franchise finance business provides equipment and leasehold improvement financing for franchisees, in the quick service and casual dining restaurant sector, throughout the United States. Loans to franchisees often include the financing of real estate as well as equipment.
In the first quarter of 2010, First Financial’s corporate headquarters was relocated to downtown Cincinnati, Ohio. The Bank subsidiary remains headquartered in Hamilton, Ohio.
First Financial’s return on average shareholders’ equity for 2009 was 52.0%, which compares to 8.21% and 12.73% for 2008 and 2007, respectively. First Financial’s return on average assets for 2009 was 5.20%. This compares to return on average assets of 0.67% and 1.08% for 2008 and 2007, respectively.
The major components of First Financial’s operating results for the past five years are summarized in Table 1 — Financial Summary and discussed in greater detail on subsequent pages.
First Financial serves a combination of metropolitan and non-metropolitan markets in Ohio, Indiana, Kentucky, and Michigan through its full-service banking centers. Market selection is based upon a number of factors, but markets are primarily chosen for their potential for growth, and long-term profitability. First Financial’s goal is to develop a competitive advantage utilizing a local market focus; building long-term relationships with clients and helping them reach greater levels of success in their financial life. During the third quarter of 2009, First Financial assumed the banking operations of Peoples Community Bank (Peoples), Irwin Union Bank and Trust Company (Irwin Union Bank) and Irwin Union Bank, F.S.B. (Irwin FSB) (collectively, Irwin) through Federal Deposit Insurance Corporation (FDIC) assisted transactions. Also during the third quarter of 2009, in a separate and unrelated transaction, First Financial purchased three banking centers including related deposits and loans, from Irwin. First Financial intends to continue to concentrate future growth plans and capital investments in its metropolitan markets. However, the acquired franchise finance subsidiary is a national business. Smaller markets have historically provided stable, low-cost funding sources to First Financial and they remain an important part of its funding base. First Financial believes its historical strength in these markets should enable it to retain or improve its market share.
BUSINESS COMBINATIONS
All references to acquired balances reflect the fair value unless stated otherwise.
During the third quarter of 2009, through FDIC-assisted transactions, First Financial acquired the banking operations of Peoples and Irwin. The company also acquired 3 Indiana banking centers, including related deposits and loans, from Irwin in a separate and unrelated transaction. The acquisitions of the Peoples and Irwin franchises significantly expands the First Financial footprint, opens new markets and strengthens the company through the generation of additional capital. Through these three transactions, the company added a total of 49 banking centers, including 39 banking centers within the company’s primary markets.
In connection with the Peoples and Irwin FDIC-assisted transactions, First Financial entered into loss sharing agreements with the FDIC. Under the terms of these agreements the FDIC will reimburse First Financial for a percentage of losses with respect to certain loans (covered loans) and other real estate owned (OREO) (collectively, covered assets) beginning with the first dollar of loss. These agreements provide for loss protection on single-family, residential loans for a period of ten years and First Financial is required to share any recoveries of previously charged-off amounts for the same time period, on the same pro-rata basis with the FDIC. All other loans are provided loss protection for a period of five years and recoveries of previously charged-off loans must be shared with the FDIC for a period of eight years, again on the same pro-rata basis. Covered loans now represent nearly half of First Financial’s loans.
First Financial must follow specific servicing and resolution procedures, as outlined in the loss share agreements, in order to receive reimbursement from the FDIC for losses on covered assets. The company has established separate and dedicated teams of legal, finance, credit and technology staff to execute and monitor all activity related to each agreement, including the required periodic reporting to the FDIC. First Financial intends to service all covered assets with the same resolution practices and diligence as it does for the assets that are not subject to a loss share agreement.
During the fourth quarter of 2009, initial estimates of loan carrying values and other related balance sheet items were revised and resulted in adjustments to the estimated carrying values of the acquired assets and liabilities previously recorded in the third quarter of 2009. In accordance with FASB ASC Topic 805, previously reported third quarter 2009 results were adjusted to reflect the impact of this additional information. These adjustments resulted in an increase in goodwill and other intangibles of $6.0 million, a net decrease in total assets of $2.2 million, a net decrease in total shareholders’ equity of $0.6 million and a net decrease in after-tax net income of $0.6 million.
An overview of the transactions and their respective loss share agreements are discussed below.
Peoples Community Bank
Including cash received from the FDIC, First Financial acquired $566.0 million in assets, including $336.1 million in loans and other real estate, and assumed $584.7 million in liabilities, including $520.8 million in deposits. All assets and liabilities were recorded at their estimated fair market value resulting in recorded goodwill of $18.1 million as the estimated fair value of liabilities assumed exceeded the estimated fair value of assets acquired.
Covered assets totaling $324.4 million in fair value are subject to a stated loss threshold of $190.0 million whereby the FDIC will reimburse First Financial for 80% of covered asset losses up to $190.0 million, and 95% of losses beyond $190.0 million. The FDIC’s obligation to reimburse First Financial for losses with respect to covered assets begins with the first dollar of loss incurred.
First Financial holds a purchase option from the FDIC for each of Peoples bank properties and their associated contents. First Financial completed a review of the former Peoples locations and notified the FDIC of the company’s intent to purchase certain properties for a combined purchase price of $7.9 million. The acquisition date for these properties has not been determined at this time.
Early in the fourth quarter of 2009, First Financial successfully completed the technology conversion and operational integration of Peoples. In conjunction with these efforts, two former Peoples banking centers were consolidated into First Financial locations and one First Financial banking center was consolidated into a former Peoples location. In addition, of the approximately 115 associates who were employed at Peoples on the acquisition date, 102 have accepted full-time positions at First Financial. The positions are primarily located within the banking center network.
Irwin
Including cash received from the FDIC, First Financial acquired $3.3 billion in assets, including $1.8 billion in loans, and assumed $2.9 billion in liabilities, including $2.5 billion in deposits, with all assets and liabilities recorded at their estimated fair market value.
The loans were acquired under a modified transaction structure with the FDIC whereby certain non-performing loans, foreclosed real estate, acquisition, development and construction loans, and residential and commercial land loans were excluded from the acquired portfolio. The estimated fair value for loans acquired was based upon the FDIC’s estimated data for acquired loans. The company and the FDIC continue to evaluate the total loan portfolio of Irwin to determine if, based on the exclusion criteria, there are additional loans that should be excluded from the portfolio acquired by First Financial. We anticipate the final determination of the excluded loans will be completed by the end of the first quarter of 2010.
Covered assets acquired from Irwin Union Bank totaling $1.5 billion in fair value are subject to a stated loss threshold of $526.0 million whereby the FDIC will reimburse First Financial for 80% of covered asset losses up to $526.0 million, and 95% of losses beyond $526.0 million. The FDIC’s obligation to reimburse First Financial for losses with respect to covered assets begins with the first dollar of loss incurred.
Covered assets acquired from Irwin FSB totaling $259.4 million in fair value are subject to a stated loss threshold of $110.0 million whereby the FDIC will reimburse First Financial for 80% of covered asset losses up to $110.0 million, and 95% of losses beyond $110.0 million. The FDIC’s obligation to reimburse First Financial for losses with respect to covered assets begins with the first dollar of loss incurred.
As the estimated fair value of assets acquired exceeded the estimated fair value of liabilities assumed, First Financial recorded a pre-tax bargain purchase gain of $379.1 million, as required by Financial Accounting Standards Board (FASB) Accounting Standards Codification (ASC) Topic 805, Business Combinations.
Conversion of Irwin’s technology and operational systems was completed in the first quarter of 2010.
10 First Financial Bancorp 2009 Annual Report
Table 1 · Financial Summary
| | | December 31, | |
| (Dollars in thousands, except per share data) | | 2009 | | | 2008 | | | 2007 | | | 2006 | | | 2005 | |
| Summary of operations | | | | | | | | | | | | | | | |
| Interest income | | $ | 233,228 | | | $ | 183,305 | | | $ | 206,442 | | | $ | 205,525 | | | $ | 200,697 | |
Tax equivalent adjustment (1) | | | 1,265 | | | | 1,808 | | | | 2,281 | | | | 2,655 | | | | 2,983 | |
Interest income tax – equivalent (1) | | | 234,493 | | | | 185,113 | | | | 208,723 | | | | 208,180 | | | | 203,680 | |
| Interest expense | | | 57,245 | | | | 67,103 | | | | 87,942 | | | | 80,452 | | | | 67,730 | |
Net interest income tax – equivalent (1) | | $ | 177,248 | | | $ | 118,010 | | | $ | 120,781 | | | $ | 127,728 | | | $ | 135,950 | |
| Interest income | | $ | 233,228 | | | $ | 183,305 | | | $ | 206,442 | | | $ | 205,525 | | | $ | 200,697 | |
| Interest expense | | | 57,245 | | | | 67,103 | | | | 87,942 | | | | 80,452 | | | | 67,730 | |
| Net interest income | | | 175,983 | | | | 116,202 | | | | 118,500 | | | | 125,073 | | | | 132,967 | |
| Provision for loan and lease losses | | | 56,084 | | | | 19,410 | | | | 7,652 | | | | 9,822 | | | | 5,571 | |
| Noninterest income | | | 441,307 | | | | 51,749 | | | | 63,588 | | | | 67,984 | | | | 46,191 | |
| Noninterest expenses | | | 170,638 | | | | 115,176 | | | | 120,747 | | | | 152,515 | | | | 130,165 | |
| Income from continuing operations before income taxes | | | 390,568 | | | | 33,365 | | | | 53,689 | | | | 30,720 | | | | 43,422 | |
| Income tax expense | | | 144,022 | | | | 10,403 | | | | 18,008 | | | | 9,449 | | | | 12,614 | |
| Income from continuing operations | | | 246,546 | | | | 22,962 | | | | 35,681 | | | | 21,271 | | | | 30,808 | |
| Discontinued operations | | | | | | | | | | | | | | | | | | | | |
| Other operating income (loss) | | | 0 | | | | 0 | | | | 0 | | | | 0 | | | | 583 | |
| Gain on sale of discontinued operations | | | 0 | | | | 0 | | | | 0 | | | | 0 | | | | 10,366 | |
| Income (loss) from discontinued operations before income taxes | | | 0 | | | | 0 | | | | 0 | | | | 0 | | | | 10,949 | |
| Income tax expense (benefit) | | | 0 | | | | 0 | | | | 0 | | | | 0 | | | | 3,824 | |
| Income from discontinued operations | | | 0 | | | | 0 | | | | 0 | | | | 0 | | | | 7,125 | |
| Net income | | | 246,546 | | | | 22,962 | | | | 35,681 | | | | 21,271 | | | | 37,933 | |
| Dividends on preferred stock | | | 3,578 | | | | 0 | | | | 0 | | | | 0 | | | | 0 | |
| Income available to common shareholders | | $ | 242,968 | | | $ | 22,962 | | | $ | 35,681 | | | $ | 21,271 | | | $ | 37,933 | |
| | | | | | | | | | | | | | | | | | | | | |
| Per share data | | | | | | | | | | | | | | | | | | | | |
| Earnings per common share from continuing operations: | | | | | | | | | | | | | | | | | | | | |
| Basic | | $ | 5.40 | | | $ | 0.62 | | | $ | 0.93 | | | $ | 0.54 | | | $ | 0.72 | |
| Diluted | | $ | 5.33 | | | $ | 0.61 | | | $ | 0.93 | | | $ | 0.54 | | | $ | 0.71 | |
| Earnings per common share from discontinued operations: | | | | | | | | | | | | | | | | | | | | |
| Basic | | $ | 0.00 | | | $ | 0.00 | | | $ | 0.00 | | | $ | 0.00 | | | $ | 0.17 | |
| Diluted | | $ | 0.00 | | | $ | 0.00 | | | $ | 0.00 | | | $ | 0.00 | | | $ | 0.17 | |
| Earnings per common share | | | | | | | | | | | | | | | | | | | | |
| Basic | | $ | 5.40 | | | $ | 0.62 | | | $ | 0.93 | | | $ | 0.54 | | | $ | 0.89 | |
| Diluted | | $ | 5.33 | | | $ | 0.61 | | | $ | 0.93 | | | $ | 0.54 | | | $ | 0.88 | |
| Cash dividends declared per common share | | $ | 0.40 | | | $ | 0.68 | | | $ | 0.65 | | | $ | 0.64 | | | $ | 0.64 | |
| Average common shares outstanding–basic (in thousands) | | | 45,029 | | | | 37,112 | | | | 38,455 | | | | 39,539 | | | | 43,084 | |
| Average common shares outstanding–diluted (in thousands) | | | 45,557 | | | | 37,484 | | | | 38,459 | | | | 39,562 | | | | 43,173 | |
| | | | | | | | | | | | | | | | | | | | | |
| Selected year-end balances | | | | | | | | | | | | | | | | | | | | |
| Total assets | | $ | 6,681,123 | | | $ | 3,699,142 | | | $ | 3,369,316 | | | $ | 3,301,599 | | | $ | 3,690,808 | |
| Earning assets | | | 5,988,295 | | | | 3,379,873 | | | | 3,054,128 | | | | 2,956,881 | | | | 3,333,406 | |
Investment securities (2) | | | 579,147 | | | | 692,759 | | | | 346,536 | | | | 366,223 | | | | 607,983 | |
| Loans, excluding covered loans | | | 2,893,490 | | | | 2,683,260 | | | | 2,599,087 | | | | 2,479,834 | | | | 2,627,423 | |
| Covered loans | | | 1,929,549 | | | | 0 | | | | 0 | | | | 0 | | | | 0 | |
| FDIC indemnification asset | | | 316,040 | | | | 0 | | | | 0 | | | | 0 | | | | 0 | |
| Interest-bearing demand deposits | | | 1,356,249 | | | | 636,945 | | | | 603,870 | | | | 667,305 | | | | 733,880 | |
| Savings deposits | | | 1,010,469 | | | | 583,081 | | | | 596,636 | | | | 526,663 | | | | 503,297 | |
| Time deposits | | | 2,229,400 | | | | 1,150,208 | | | | 1,227,954 | | | | 1,179,852 | | | | 1,247,274 | |
| Noninterest-bearing demand deposits | | | 754,522 | | | | 413,283 | | | | 465,731 | | | | 424,138 | | | | 440,988 | |
| Total deposits | | | 5,350,640 | | | | 2,783,517 | | | | 2,894,191 | | | | 2,797,958 | | | | 2,925,439 | |
| Short-term borrowings | | | 37,430 | | | | 354,533 | | | | 98,289 | | | | 96,701 | | | | 111,634 | |
| Long-term debt | | | 404,716 | | | | 148,164 | | | | 45,896 | | | | 63,762 | | | | 286,655 | |
| Other long-term debt | | | 20,620 | | | | 20,620 | | | | 20,620 | | | | 30,930 | | | | 30,930 | |
Shareholders’ equity (3) | | | 675,167 | | | | 348,327 | | | | 276,583 | | | | 285,479 | | | | 299,881 | |
| | | | | | | | | | | | | | | | | | | | | |
| Ratios based on average balances | | | | | | | | | | | | | | | | | | | | |
Loans to deposits (4) | | | 92.50 | % | | | 95.14 | % | | | 90.03 | % | | | 89.39 | % | | | 94.81 | % |
| Net charge-offs to loans, excluding covered loans | | | 1.16 | % | | | 0.47 | % | | | 0.24 | % | | | 0.97 | % | | | 0.30 | % |
| Total shareholders’ equity to total assets | | | 9.99 | % | | | 8.16 | % | | | 8.47 | % | | | 8.69 | % | | | 9.57 | % |
| Common shareholders’ equity to total assets | | | 8.34 | % | | | 8.11 | % | | | 8.47 | % | | | 8.69 | % | | | 9.57 | % |
| Return on assets | | | 5.20 | % | | | 0.67 | % | | | 1.08 | % | | | 0.62 | % | | | 1.00 | % |
| Return on common equity | | | 61.43 | % | | | 8.27 | % | | | 12.73 | % | | | 7.13 | % | | | 10.40 | % |
| Return on equity | | | 52.04 | % | | | 8.21 | % | | | 12.73 | % | | | 7.13 | % | | | 10.40 | % |
| Net interest margin | | | 4.05 | % | | | 3.71 | % | | | 3.94 | % | | | 4.01 | % | | | 3.87 | % |
Net interest margin (tax equivalent basis) (1) | | | 4.08 | % | | | 3.77 | % | | | 4.01 | % | | | 4.09 | % | | | 3.96 | % |
| Dividend payout | | | 7.41 | % | | | 109.68 | % | | | 69.89 | % | | | 118.52 | % | | | 71.91 | % |
| (1) | Tax equivalent basis was calculated using a 35.00% tax rate in all years presented. |
| (2) | Includes investment securities held-to-maturity, investment securities available-for-sale, investment securities trading, and other investments. |
| (3) | 2008 Shareholders’ equity was reduced by $2,499 due to the impact of a pension-related accounting pronouncement effective January 1, 2008. |
| | For further information, refer to Note 17 in the Notes to Consolidated Financial Statements. |
| (4) | Includes covered loans |
First Financial Bancorp 2009 Annual Report 11
Management’s Discussion And Analysis Of Financial Condition And Results Of Operations
Irwin Banking Centers
Separate and unrelated to the previously mentioned FDIC-assisted transactions, the company purchased 3 banking centers located in Indiana from Irwin Union Bank, including $84.6 million in deposits and $41.1 million in performing loans. Assets acquired in this transaction are not subject to a loss share agreement. Loans were acquired at par value and there was no premium paid on assumed deposits. The technology conversion and operational integration of all assets acquired and liabilities assumed was complete at the acquisition date. The purchased assets and assumed liabilities were recorded at their estimated fair value resulting in recorded goodwill of $5.4 million as the estimated fair value of liabilities assumed exceeded the estimated fair value of assets acquired. Fair values are preliminary and subject to refinement for up to one year after the closing date of the acquisition, as additional information relative to closing date fair values becomes available.
Strategic Decisions
Management has concluded that the markets previously operated by Irwin in the western United States do not align with the long-term strategic plans for the company. Each of these markets pursued an exit strategy whereby the market presidents worked with an institution of their choosing to refer existing client relationships. If a suitable financial institution was not identified, an exit date was selected for each market and the office closed in compliance with the applicable regulatory requirements. Exit strategies coincided with the conversion and operational integration process. In the fourth quarter of 2009, the company elected to close the St. Louis, Missouri location and sold $43.0 million in western market loans, at their unpaid principal balances.
At December 31, 2009, the nine remaining western offices combined had $684.3 million in unpaid principal balances in loans and $347.0 million in deposits. First Financial will continue to service the loans and deposits in these markets in compliance with the terms of the purchase agreements with the FDIC and FDIC as receiver and related loss share agreements. Additionally, in the first quarter of 2010, First Financial closed 7 of the remaining 9 western market offices and sold an additional $22.6 million in western market loans at their unpaid principal balances.
First Financial also acquired, as part of the Irwin transaction, a franchise finance business. This national business is a specialty lender in the quick service and casual dining segments of the restaurant industry. It is led by a seasoned management team with strong underwriting, credit management and loss mitigation experience. There were outstanding principal balances of approximately $621.6 million in franchise finance loans at December 31, 2009, all of which are covered under a loss share agreement with the FDIC except for $16.9 million of loans originated subsequent to the acquisition.
This business offers First Financial the ability to diversify its earning assets and will be supported as part of the company’s ongoing strategy. The overall portfolio size will be managed to a risk-appropriate level so as not to create an industry concentration.
OVERVIEW OF OPERATIONS
The primary source of First Financial’s revenue is net interest income, the excess of interest received from earning assets over interest paid on interest-bearing liabilities, and the fees for financial services provided to clients. First Financial’s business results tend to be influenced by overall economic factors and conditions, including market interest rates, price competition within the marketplace, business spending, and consumer confidence.
Net interest income in 2009 increased 51.4% from 2008, compared to a 1.9% decline from 2007 to 2008. The increase in 2009, primarily during the second half of the year, was attributable to the Peoples and Irwin acquisitions which occurred in the third quarter. This resulted in an increase in the earning asset base, as well as the repricing of the assumed deposit portfolios. Average earning assets increased $1.2 billion, or 38.8%, during 2009. The net interest margin was 4.05% for 2009, compared with 3.71% in 2008, and 3.94% in 2007.
Loan growth during 2009 was primarily driven by the Peoples and Irwin acquisitions. First Financial continues to expand its commercial lending sales force and deepen its market presence, primarily in metropolitan markets. Total loans increased from $2.7 billion in the fourth quarter of 2008 to $4.8 billion in the fourth quarter of 2009, a $2.1 billion increase. The mix shift from certain lower yielding consumer loans to higher yielding commercial loans continues. Excluding covered loans, period-end commercial, commercial real estate, and construction loans increased from $1.9 billion in the fourth quarter of 2008 to $2.1 billion in the fourth quarter of 2009, an increase of $244.1 million or 12.9%.
The competitive landscape remained intense during 2009 and continues to be impacted by increased liquidity pressure being exhibited by a number of banks in our markets. First Financial experienced significant deposit growth as a result of the acquisitions described above while Compass, the company’s aggressive new retail sales process that was introduced in 2009, also contributed to deposit growth during the year. Average total deposits increased $913.4 million or 32.7% from 2008 to 2009, while, average transaction and savings deposits increased $414.3 million, or 34.0%, during this time.
Noninterest income was positively impacted by a number of factors, primarily driven by the $379.1 million bargain purchase gain recognized in the third quarter due to the Irwin acquisition as well as income earned on covered loans that prepay or that pay according to their contractual obligation. Noninterest expense increased by $55.5 million through 2009 due to higher FDIC assessment costs and higher expenses related to incentive compensation, general growth and market expansion. Acquisition related costs, which were primarily legal, professional, technology, and other integration costs also contributed to the increase in noninterest expense. Staffing, occupancy, and marketing expenses also increased due to the additional banking centers in operation during the second half of 2009.
Credit quality began to deteriorate in the second half of 2008 and this deterioration continued throughout 2009 due to sustained weakness in the economy. First Financial continued to experience significant stress in its commercial and commercial real estate portfolios as borrowers with previously sufficient capital levels struggled to withstand the protracted economic strain. The elevated levels of net charge-offs and nonperforming assets and higher provision expense recorded in 2009 reflected the weak economic conditions, including persistent high unemployment rates, lower consumer spending, higher vacancy rates, lower rents and depressed property values. Management expects credit quality trends to remain volatile until economic conditions exhibit considerable improvement.
The allowance for loan and lease losses (allowance) as a percent of nonperforming loans was 76.3% at December 31, 2009, compared with 197.3% at December 31, 2008. Coverage ratios decreased in 2009 due to growth in nonperforming loans outpacing growth in the allowance. As nonperforming loans increase, more loans are reviewed for specific valuations and these valuations are often less than 100% of loan value resulting in lower coverage ratios. While credit costs trended higher throughout 2009, management believes First Financial’s coverage ratios represent an appropriate level of reserves for the remaining risk in the portfolio. First Financial believes that its credit costs in 2009, although higher than previous levels, remain favorable relative to industry and peer levels and are a reflection of its strong credit management policies and practices.
Actions taken by the FDIC had a negative impact on First Financial’s operating results in 2009, as compared to 2008. In December 2008, the FDIC approved a final rule on deposit assessment rates for the first quarter of 2009. The rule raised assessment rates uniformly by 7 basis points, annually, beginning in the first quarter of 2009. The increase in assessment rates effective January 1, 2009 increased First Financial’s regular assessment to $4.3 million for 2009 from $0.4 million for 2008.
In addition to the change in general assessment rates discussed above, the FDIC board announced an emergency special assessment on all banks that was paid in the second quarter of 2009. The purpose of the special assessment was to restore the Deposit Insurance Fund to an acceptable level. The emergency special assessment resulted in an additional $1.7 million expense for First Financial. FDIC expense for 2009 increased $6.5 million to $6.8 million in 2009, compared to $0.4 million in 2008. We also prepaid an estimated 3 year insurance assessment of $17.1 million on December 30, 2009.
For a more detailed discussion of the above topics, please refer to the sections that follow.
NET INCOME
2009 vs. 2008. First Financial’s net income increased $223.6 million or 973.7% to $246.5 million in 2009, compared to net income of $23.0 million in 2008. Net income in 2009 included a $238.4 million bargain purchase gain, net of taxes, related to the Irwin acquisition in the third quarter. First Financial’s 2008 net income included a $3.7 million loss related to the decline in market value of 200,000 FHLMC perpetual preferred series V shares and a $1.6 million gain associated with the partial redemption of Visa Inc. common shares in the second quarter of 2008. Net interest income increased $59.8 million or 51.4% in 2009 from 2008 primarily due to the Peoples and Irwin acquisitions in the third quarter. Net interest income in 2009 was positively impacted by the increased earning asset base resulting from acquisitions as well as by the repricing of the assumed deposit portfolios. Average earning assets increased $1.2 billion, or 38.8%, during 2009. For more detail, refer to Table 2 — Volume/Rate Analysis and the Net Interest Income section.
2008 vs. 2007. First Financial’s net income decreased $12.7 million or 35.6% to $23.0 million in 2008, compared to net income of $35.7 million in 2007. The 2008 pre-tax income included a $3.7 million loss related to the decline in market value of 200,000 FHLMC perpetual preferred series V shares and a $1.6 million gain associated with the partial redemption of Visa Inc. common shares in the second quarter of 2008. First Financial’s 2007 net income included $5.5 million from the gain on the sale of its merchant payment processing portfolio, $1.1 million from the gain on the sale of residential mortgage servicing rights, and $0.4 million from the gain on the redemption of Mastercard Incorporated common shares, offset by $2.2 million in pension settlement charges and $1.6 million in severance costs. Net interest income decreased $2.3 million or 1.9% in 2008 from 2007 primarily due to the decline in market interest rates partially offset by the continued shift in the mix of deposits from higher-cost certificates of deposit to lower-cost transaction-based accounts and a $124.2 million, or 4.1%, increase in average earning assets during 2008. For more detail, refer to Table 2 — Volume/Rate Analysis and the Net Interest Income section.
12 First Financial Bancorp 2009 Annual ReportNET INTEREST INCOME
First Financial’s net interest income for the years 2005 through 2009 is shown in Table 1 — Financial Summary. Net interest income, First Financial’s principal source of income, is the excess of interest received from earning assets over interest paid on interest-bearing liabilities. The amount of net interest income is determined by the volume and mix of earning assets, the rates earned on such earning assets, and the volume, mix, and rates paid for the deposits and borrowed money that support the earning assets. Table 2 — Volume/Rate Analysis describes the extent to which changes in interest rates and changes in volume of earning assets and interest-bearing liabilities have affected First Financial’s net interest income on a tax equivalent basis during the years indicated. Table 2 — Volume/Rate Analysis should be read in conjunction with the Statistical Information shown on Page 27.
Interest income on a tax equivalent basis is presented in Table 1 — Financial Summary. The tax equivalent adjustment recognizes the income tax savings when comparing taxable and tax-exempt assets and assumes a 35.0% tax rate for all years presented. The tax equivalent net interest margin was 4.08%, 3.77%, and 4.01% for the years 2009, 2008, and 2007, respectively.
Nonaccruing loans and loans held for sale, excluding covered loans, were included in the daily average loan balances used in determining the yields in Table 2 — Volume/Rate Analysis.
Interest foregone on nonaccruing loans is disclosed in Note 10 of the Notes to Consolidated Financial Statements and is not considered to have a material effect on these presentations. The amount of loan fees included in the interest income computation for 2009, 2008, and 2007 was $1.4 million, $1.7 million, and $1.8 million, respectively. The decline in loan fees in 2009 and 2008 is primarily due to First Financial’s decision to sell residential real estate loan originations, resulting in loan fees associated with those loans being owned by the acquirer.
2009 vs. 2008. Interest income was $233.2 million in 2009, a $49.9 million or 27.2% increase from 2008. The yield on earning assets decreased 49 basis points from 5.85% in 2008 to 5.36% in 2009, as market interest rates declined throughout the year. Interest expense was $57.2 million in 2009, a decrease of $9.9 million or 14.7% from 2008. The total cost of funds increased 2 basis points to 2.49% in 2009, from 2.47% in 2008, primarily due to the impact of intense pricing competition for deposit products.
Net interest income increased $59.8 million or 51.4% primarily due to the increased level of earnings assets, including covered loans and their accretable yield. The increase was also positively impacted by the repricing of the assumed deposit portfolio. Average earning assets increased $1.2 billion, or 38.8%, during 2009.
2008 vs. 2007. Interest income was $183.3 million in 2008, a $23.1 million or 11.2% decline from 2007. The yield on earning assets decreased 109 basis points from 6.94% in 2007 to 5.85% in 2008, as market interest rates declined throughout the year. Interest expense was $67.1 million in 2008, a decrease of $20.8 million or 23.7% from 2007. The total cost of funds decreased 90 basis points to 2.47% in 2008, from 3.37% in 2007, primarily due to the decline in market interest rates which were partially offset by the impact of intense pricing competition for deposit products.
Net interest income decreased $2.3 million or 1.9% primarily due to a decline in market interest rates partially offset by the continued shift in the mix of deposits from higher-cost certificates of deposit to lower-cost transaction-based accounts and a $124.2 million, or 4.1%, increase in average earning assets during 2008.
NONINTEREST INCOME AND NONINTEREST EXPENSES
Noninterest income and noninterest expenses for 2009, 2008, and 2007 are shown in Table 3 — Noninterest Income and Noninterest Expenses.
NONINTEREST INCOME
2009 vs. 2008. Noninterest income increased $389.6 million or 752.8% from 2008. Noninterest income in 2009 included a $379.1 million bargain purchase gain on the Irwin acquisition. Noninterest income in 2008 included a $3.7 million loss related to the decline in market value of 200,000 FHLMC perpetual preferred series V shares offset by a $1.6 million gain associated with the partial redemption of Visa Inc. common shares in the second quarter of 2008. Net of the 2009 and 2008 transactions described above, noninterest income increased $6.7 million or 12.1% in 2009 as compared with 2008, primarily due to noninterest income earned on covered loans, higher service charges on deposits, and trust and wealth management fees. The increase in service charges on deposits is a result of the increase in transaction-based deposits from acquisitions.
2008 vs. 2007. Noninterest income decreased $11.8 million or 18.6% from 2007. Net of the 2008 and 2007 transactions described below, overall noninterest income in 2008 declined $2.8 million or 4.3% as compared with 2007, primarily due to lower service charges on deposits, trust and wealth management fees and earnings on bank-owned life insurance. First Financial believes that the economic downturn negatively impacted the spending habits of U.S. consumers and U.S. retail sales in the second half of 2008, also negatively affected First Financial’s client transaction volumes and led to lower deposit service charges compared to 2007. The decline related to trust and wealth management fees are attributable to decreases in investment advisory and trust fees that are a result of lower asset valuations given overall market declines in late 2007 and throughout 2008. Noninterest income in 2008 included a $3.7 million loss related to the decline in market value of 200,000 FHLMC perpetual preferred series V shares and a $1.6 million gain associated with the partial redemption of Visa Inc. common shares in the second quarter of 2008. In 2007, noninterest income included a $5.5 million gain on the sale of the merchant payment processing portfolio in the fourth quarter of 2007, the gain on the sales of investment securities of $0.4 million in the third quarter of 2007, and the gain on the sale of mortgage servicing rights of $1.1 million in the first quarter of 2007.
Table 2 · Volume/Rate Analysis – Tax Equivalent Basis (1)
| | | 2009 change from 2008 due to | | | 2008 change from 2007 due to | |
| (Dollars in thousands) | | VOLUME | | | RATE | | | TOTAL | | | VOLUME | | | RATE | | | TOTAL | |
| Interest income | | | | | | | | | | | | | | | | | | |
Loans (2) | | $ | 8,121 | | | $ | (24,089 | ) | | $ | (15,968 | ) | | $ | 6,906 | | | $ | (29,629 | ) | | $ | (22,723 | ) |
| Covered loans and indemnification asset | | | 58,271 | | | | 0 | | | | 58,271 | | | | N/M | | | | N/M | | | | N/M | |
Investment securities (3) | | | | | | | | | | | | | | | | | | | | | | | | |
| Taxable | | | 10,934 | | | | (1,512 | ) | | | 9,422 | | | | 5,739 | | | | (746 | ) | | | 4,993 | |
| Tax-exempt | | | (1,787 | ) | | | (133 | ) | | | (1,920 | ) | | | (1,634 | ) | | | 390 | | | | (1,244 | ) |
Total investment securities interest (3) | | | 9,147 | | | | (1,645 | ) | | | 7,502 | | | | 4,105 | | | | (356 | ) | | | 3,749 | |
| Interest-bearing deposits with other banks | | | 208 | | | | 0 | | | | 208 | | | | N/M | | | | N/M | | | | N/M | |
| Federal funds sold | | | (633 | ) | | | 0 | | | | (633 | ) | | | (2,911 | ) | | | (1,725 | ) | | | (4,636 | ) |
| Total | | | 75,114 | | | | (25,734 | ) | | | 49,380 | | | | 8,100 | | | | (31,710 | ) | | | (23,610 | ) |
| | | | | | | | | | | | | | | | | | | | | | | | | |
| Interest expense | | | | | | | | | | | | | | | | | | | | | | | | |
| Interest-bearing demand deposits | | | 912 | | | | (2,890 | ) | | | (1,978 | ) | | | (120 | ) | | | (7,318 | ) | | | (7,438 | ) |
| Savings deposits | | | 720 | | | | (2,888 | ) | | | (2,168 | ) | | | 298 | | | | (5,685 | ) | | | (5,387 | ) |
| Time deposits | | | 9,525 | | | | (15,796 | ) | | | (6,271 | ) | | | (1,953 | ) | | | (6,409 | ) | | | (8,362 | ) |
| Short-term borrowings | | | 118 | | | | (3,628 | ) | | | (3,510 | ) | | | 2,813 | | | | (2,217 | ) | | | 596 | |
| Long-term debt | | | 4,638 | | | | (385 | ) | | | 4,253 | | | | 783 | | | | 10 | | | | 793 | |
| Other long-term debt | | | 0 | | | | (184 | ) | | | (184 | ) | | | (509 | ) | | | (532 | ) | | | (1,041 | ) |
| Total | | | 15,913 | | | | (25,771 | ) | | | (9,858 | ) | | | 1,312 | | | | (22,151 | ) | | | (20,839 | ) |
| Net interest income | | $ | 59,201 | | | $ | 37 | | | $ | 59,238 | | | $ | 6,788 | | | $ | (9,559 | ) | | $ | (2,771 | ) |
(1) Tax equivalent basis was calculated using a 35.00% tax rate.
(2) Includes loans held-for-sale.
(3) Includes investment securities held-to-maturity, investment securities available-for-sale, and other investments.
N/M=Not meaningful
First Financial Bancorp 2009 Annual Report 13
Management’s Discussion And Analysis Of Financial Condition And Results Of Operations
Table 3 · Noninterest Income And Noninterest Expenses
| | | 2009 | | | 2008 | | | 2007 | |
| | | | | | % CHANGE | | | | | | % CHANGE | | | | | | % CHANGE | |
| | | | | | INCREASE | | | | | | INCREASE | | | | | | INCREASE | |
| (Dollars in thousands) | | TOTAL | | | (DECREASE) | | | TOTAL | | | (DECREASE) | | | TOTAL | | | (DECREASE) | |
| Noninterest income | | | | | | | | | | | | | | | | | | |
| Service charges on deposit accounts | | $ | 19,662 | | | | 0.02 | % | | $ | 19,658 | | | | (5.34 | )% | | $ | 20,766 | | | | (5.43 | )% |
| Trust and wealth management fees | | | 13,465 | | | | (22.66 | )% | | | 17,411 | | | | (5.35 | )% | | | 18,396 | | | | 13.11 | % |
| Bankcard income | | | 5,961 | | | | 5.45 | % | | | 5,653 | | | | 7.66 | % | | | 5,251 | | | | 18.35 | % |
| Net gains from sales of loans | | | 1,196 | | | | 8.33 | % | | | 1,104 | | | | 30.81 | % | | | 844 | | | | (73.67 | )% |
| Gain on sale of merchant payment processing portfolio | | | 0 | | | | N/M | | | | 0 | | | | (100.00 | )% | | | 5,501 | | | | N/M | |
| Gain on sale of mortgage servicing rights | | | 0 | | | | N/M | | | | 0 | | | | (100.00 | )% | | | 1,061 | | | | N/M | |
| Gain on acquisition | | | 379,086 | | | | N/M | | | | 0 | | | | N/M | | | | 0 | | | | N/M | |
| Income (loss) on preferred securities | | | 139 | | | | (103.72 | )% | | | (3,738 | ) | | | N/M | | | | 0 | | | | N/M | |
| Other | | | 18,449 | | | | 83.10 | % | | | 10,076 | | | | (11.63 | )% | | | 11,402 | | | | 13.45 | % |
| Subtotal | | | 437,958 | | | | 773.05 | % | | | 50,164 | | | | (20.65 | )% | | | 63,221 | | | | (7.65 | )% |
| Gains on sales of investment securities | | | 3,349 | | | | 111.29 | % | | | 1,585 | | | | 331.88 | % | | | 367 | | | | (177.10 | )% |
| Total | | $ | 441,307 | | | | 752.78 | % | | $ | 51,749 | | | | (18.62 | )% | | $ | 63,588 | | | | (6.47 | )% |
| | | | | | | | | | | | | | | | | | | | | | | | | |
| Noninterest expenses | | | | | | | | | | | | | | | | | | | | | | | | |
| Salaries and employee benefits | | $ | 86,068 | | | | 28.72 | % | | $ | 66,862 | | | | (4.33 | )% | | $ | 69,891 | | | | (14.31 | )% |
| Pension settlement charges | | | 0 | | | | N/M | | | | 0 | | | | (100.00 | )% | | | 2,222 | | | | (25.16 | )% |
| Net occupancy | | | 16,202 | | | | 52.35 | % | | | 10,635 | | | | (2.08 | )% | | | 10,861 | | | | (1.60 | )% |
| Furniture and equipment | | | 8,054 | | | | 20.07 | % | | | 6,708 | | | | (0.78 | )% | | | 6,761 | | | | 20.58 | % |
| Data processing | | | 3,475 | | | | 7.32 | % | | | 3,238 | | | | (7.43 | )% | | | 3,498 | | | | (64.91 | )% |
| Marketing | | | 3,494 | | | | 37.13 | % | | | 2,548 | | | | 4.38 | % | | | 2,441 | | | | (30.06 | )% |
| Communication | | | 3,246 | | | | 13.54 | % | | | 2,859 | | | | (11.49 | )% | | | 3,230 | | | | (3.12 | )% |
| Professional services | | | 6,032 | | | | 74.18 | % | | | 3,463 | | | | (16.39 | )% | | | 4,142 | | | | (47.13 | )% |
| State intangible tax | | | 2,508 | | | | 0.08 | % | | | 2,506 | | | | 21.06 | % | | | 2,070 | | | | (11.88 | )% |
| FDIC expense | | | 6,847 | | | | 1786.23 | % | | | 363 | | | | 10.00 | % | | | 330 | | | | (9.59 | )% |
| Other | | | 34,712 | | | | 117.03 | % | | | 15,994 | | | | 4.53 | % | | | 15,301 | | | | (36.24 | )% |
| Total | | $ | 170,638 | | | | 48.15 | % | | $ | 115,176 | | | | (4.61 | )% | | $ | 120,747 | | | | (20.83 | )% |
N/M = Not meaningful
NONINTEREST EXPENSES
2009 vs. 2008. Noninterest expenses increased $55.5 million or 48.2% for 2009 compared to 2008 due to higher FDIC costs, general growth and expansion, including acquisition related costs. Salaries and employee benefits increased $19.2 million or 28.7% from 2008 primarily due to higher expenses related to incentive compensation and acquisition related costs, as well as the additional banking centers in operation during the second half of 2009. Professional service fees increased $2.6 million or 74.2% due to acquisition-related services. A $6.5 million increase in FDIC expense due to elevated assessment rates, special assessments and increased deposits, a $0.2 million or 7.3% increase in data processing expense, and a $5.6 million or 52.3% increase in net occupancy expense related to additional banking centers contributed to the increase in noninterest expense in 2009. The increase in other noninterest expense during 2009 was primarily due to other acquisition and integration related costs of $13.4 million.
2008 vs. 2007. Noninterest expenses decreased $5.6 million or 4.6% for 2008 compared to 2007. Salaries and employee benefits decreased $3.0 million or 4.3% from 2007 primarily due to the $1.4 million reduction in salaries and other performance and incentive-based compensation resulting from an overall reduction in staffing levels and the $1.6 million reduction in retirement-related and other benefits expense. Professional fees decreased $0.7 million or 16.4% due to lower employment placement fees and both internal and external audit related expenses during 2008. There were no pension settlement charges in 2008. The $2.2 million of pension settlement charges in 2007 were due to staff reductions and an acceleration of costs that were previously deferred under pension accounting rules that would have been recognized in future periods. A $0.4 million or 11.5% decline in communication expense, a $0.3 million or 7.4% decline in data processing expense, and a $0.2 million or 2.1% decline in net occupancy expense were offset by a $1.1 million or 6.6% increase in other noninterest expense in 2008. The increase in other noninterest expense during 2008 was primarily due to a $0.4 million or 21.1% increase in state intangible tax expense and a $0.3 million or 173.5% increase in other real estate owned expense.
INCOME TAXES
First Financial’s tax expense in 2009 totaled $144.0 million compared to $10.4 million in 2008 and $18.0 million in 2007, resulting in effective tax rates of 36.9%, 31.2%, and 33.5%, in 2009, 2008, and 2007, respectively. The increase in 2009’s effective tax rate as compared to 2008 is primarily due to the tax impact from the bargain purchase gain and other changes resulting from the FDIC-assisted transactions. The lower effective tax rate in 2008 was due to the marginal impact of the year’s lower pre-tax earnings.
Further analysis of income taxes is presented in Note 14 of the Notes to Consolidated Financial Statements.
LOANS
First Financial, primarily through its banking subsidiary, is dedicated to meeting the financial needs of individuals and businesses through its high touch, high service business model. The loan portfolio is comprised of a broad range of borrowers primarily in the Ohio, Kentucky, Michigan, and Indiana markets; however, the acquired franchise finance business markets its services to a national client base. First Financial’s loan portfolio is composed of commercial, commercial real estate, real estate construction, residential real estate, and other consumer financing loans. All loans acquired in the Peoples and Irwin acquisitions were acquired under loss share agreements whereby the FDIC reimburses First Financial for losses incurred in accordance with the loss sharing agreements.
Subject to First Financial’s credit policy and guidelines, credit underwriting and approval occur within the market originating the loan. First Financial has delegated to each market president a lending limit sufficient to handle the majority of client requests in a timely manner. Loan requests for amounts greater than the market limit require the approval of the regional credit officer. The required additional approvals for greater loan amounts include the approval(s) of the chief credit officer, the chief executive officer, and the board of directors as necessary. This allows First Financial to manage the initial credit risk exposure through a standardized, disciplined, and strategically focused loan approval process, but with an increasingly higher level of authority. Plans to purchase or sell a participation in a loan or a group of loans require the approval of certain senior lending and administrative officers, and in some cases could include the board of directors.
Enhanced processes have improved management’s understanding of the loan portfolios and the value of the continuing businesses and relationships. Active use of a Special Assets Division allows First Financial to ensure appropriate oversight, improved communication, and timely resolution of issues throughout the loan portfolio. Additionally, Commercial Credit Risk provides objective oversight and assessment of commercial credit quality and credit processes using an independent, market-based credit risk review approach. Retail/Small Business Credit Risk performs product-level reviews of portfolio performance, assessment of credit quality, and compliance with underwriting and loan administration guidelines. First Financial’s analytical and reporting capability provides timely and valuable portfolio information to aid in credit management.
14 First Financial Bancorp 2009 Annual Report
LOANS (EXCLUDING COVERED LOANS)
2009 vs. 2008. Excluding covered loans, total loans increased $210.2 million or 7.8% during 2009, with average balances increasing $157.0 million or 5.9%. Period-end commercial, commercial real estate and real estate construction loans increased from $1.9 billion at December 31, 2008, to $2.1 billion at December 31, 2009, an increase of $244.1 million or 12.9%. The overall period-end increase in the loan portfolio as compared to 2008 was primarily due to growth in the commercial portfolio, partially offset by declines in consumer-related loan categories. First Financial purchased $145.1 million and $41.1 million in select, performing commercial and consumer loans from Irwin Union Bank on June 30 and August 28, 2009, respectively. None of the loans purchased were residential development, land acquisition or development loans and at the time of purchase, none were 30 days or more delinquent or considered substandard or criticized. The loans were purchased at par and were not purchased under a loss share agreement. Home equity loans increased $42.8 million or 15.0%, from $286.1 million at December 31, 2008 to $328.9 million at December 31, 2009 while residential real estate loans declined by $62.6 million or 16.3%, from $383.6 million at December 31, 2008 to $321.0 million at December 31, 2009.
At December 31, 2009, commercial, commercial real estate, and real estate construction loans comprised 73.7% of First Financial’s total loan portfolio, excluding covered loans. Residential real estate loans at 11.1%, home equity loans at 11.4%, with installment and credit card lending at 3.8%, comprised the remainder of the portfolio.
At December 31, 2009, residential development loans composed 2.9% of First Financial’s total loan portfolio.
In the third and fourth quarters of 2008, First Financial took steps to further manage the risk profile of its balance sheet by securitizing a total of $89.0 million in residential mortgage loans into agency guaranteed, mortgage-backed securities collateralized by those loans. The fourth quarter securitization consisted of $30.5 million in loans and the third quarter securitization consisted of $58.5 million in loans. These securitizations resulted in a reduction in credit risk on the balance sheet and a lower regulatory risk weighting for those assets. The assets remain on the balance sheet, but are now accounted for as investment securities available-for-sale rather than residential real estate loans.
Table 5 — Loan Maturity/Rate Sensitivity indicates the contractual maturity of commercial loans and real estate construction loans outstanding at December 31, 2009. Loans due after one year are classified according to their sensitivity to changes in interest rates.
COVERED LOANS
First Financial purchased $324.5 million and $1.8 billion of loans in conjunction with the FDIC-assisted acquisitions of Peoples and Irwin, respectively. All loans acquired in the Peoples and Irwin acquisitions were acquired under loss share agreements and are referred to as “covered loans,” whereby the FDIC reimburses First Financial for the majority of any losses incurred.
First Financial evaluated loans purchased in conjunction with the acquisitions of Peoples and Irwin for impairment in accordance with the provisions of FASB ASC Topic 310-30, Loans and Debt Securities Acquired with Deteriorated Credit Quality. Purchased loans are considered impaired if there is evidence of credit deterioration since origination and if it is probable that not all contractually required payments will be collected. First Financial elected to account for all covered loans under FASB ASC Topic 310-30, regardless of the impairment determination with the exception of $98.5 million of loans with revolving privileges, which were determined to be outside the scope of FASB ASC Topic 310-30, and other consumer loans which the Company elected to treat under the cost recovery method as expected cash flows could not be reasonably estimated.
Covered loans were recorded at fair value as of the respective acquisition dates. Generally the determination of the fair value of the loans resulted in a significant write-down in the value of the loans, which was assigned to an accretable or nonaccretable balance, with the accretable balance being recognized as interest income over the remaining term of the loan. The nonaccretable portion of the write-down in the value of the loans represents expected credit impairment on the loans and is only recognized in income if the payments on the loan exceed the recorded fair value of the loan.
Table 4 · Loan Portfolio
| | | December 31, | |
| (Dollars in thousands) | | 2009 | | | 2008 | | | 2007 | | | 2006 | | | 2005 | |
| Commercial | | $ | 798,622 | | | $ | 807,720 | | | $ | 785,143 | | | $ | 673,445 | | | $ | 582,594 | |
| Real estate – construction | | | 253,223 | | | | 232,989 | | | | 151,432 | | | | 101,688 | | | | 86,022 | |
| Real estate – commercial | | | 1,079,628 | | | | 846,673 | | | | 706,409 | | | | 623,603 | | | | 646,079 | |
| Real estate – residential | | | 321,047 | | | | 383,599 | | | | 539,332 | | | | 628,579 | | | | 772,334 | |
| Installment | | | 411,929 | | | | 384,691 | | | | 389,783 | | | | 427,009 | | | | 515,200 | |
| Credit card | | | 29,027 | | | | 27,538 | | | | 26,610 | | | | 24,587 | | | | 22,936 | |
| Lease financing | | | 14 | | | | 50 | | | | 378 | | | | 923 | | | | 2,258 | |
| Total loans, excluding covered loans | | | 2,893,490 | | | | 2,683,260 | | | | 2,599,087 | | | | 2,479,834 | | | | 2,627,423 | |
| Covered loans | | | 1,929,549 | | | | 0 | | | | 0 | | | | 0 | | | | 0 | |
| Total | | $ | 4,823,039 | | | $ | 2,683,260 | | | $ | 2,599,087 | | | $ | 2,479,834 | | | $ | 2,627,423 | |
Table 5 · Loan Maturity/Rate Sensitivity (Excluding Covered Loans)
| | | December 31, 2009 | | |
| | | Maturity | | |
| �� | | | | | After one | | | | | | | | |
| | | Within | | | but within | | | After | | | | | |
| (Dollars in thousands) | | one year | | | five years | | | five years | | | Total | | |
| Commercial | | $ | 442,361 | | | $ | 296,759 | | | $ | 59,502 | | | $ | 798,622 | | |
| Real estate – construction | | | 180,754 | | | | 60,380 | | | | 12,089 | | | | 253,223 | | |
| Total | | $ | 623,115 | | | $ | 357,139 | | | $ | 71,591 | | | $ | 1,051,845 | | |
| | | | Sensitivity to changes in interest rates | | | |
| | | | Predetermined | | | Variable | | | |
| (Dollars in thousands) | | | rate | | | rate | | | |
| Due after one year but within five years | | | $ | 138,927 | | | $ | 218,212 | | | |
| Due after five years | | | | 13,926 | | | | 57,665 | | | |
| Total | | | $ | 152,853 | | | $ | 275,877 | | | |
First Financial Bancorp 2009 Annual Report 15
Management’s Discussion And Analysis Of Financial Condition And Results Of Operations
Table 6 · Covered Loan Portfolio
| | | December 31, | |
| (Dollars in thousands) | | 2009 | |
| Commercial | | $ | 509,727 | |
Real estate – construction | | | 86,810 | |
Real estate – commercial | | | 1,012,173 | |
Real estate – residential | | | 291,210 | |
| Installment | | | 9,979 | |
| Other covered loans | | | 19,650 | |
| Total covered loans | | $ | 1,929,549 | |
Table 7 · Covered Loan Maturity
| | | December 31, 2009 | |
| | | Maturity | |
| | | | | | After one | | | | | | | |
| | | Within | | | but within | | | After | | | | |
| (Dollars in thousands) | | one year | | | five years | | | five years | | | Total | |
| Commercial | | $ | 110,964 | | | $ | 155,840 | | | $ | 242,923 | | | $ | 509,727 | |
| Real Estate – construction | | | 65,836 | | | | 15,621 | | | | 5,353 | | | | 86,810 | |
| Total | | $ | 176,800 | | | $ | 171,461 | | | $ | 248,276 | | | $ | 596,537 | |
In addition to the accretion income described above, covered loans impact noninterest income as described in the following two scenarios:
For covered loans that prepay, this income is a result of the net effect of:
| | · | The recovery of the remaining yield-based fair value adjustment, or accretable yield |
| | · | The recovery of the value adjustment associated with assumed credit impairment offset by the corresponding valuation adjustment on the FDIC indemnification asset |
This scenario can occur either through a strategic loan sale or ordinary prepayments that are typical in a loan portfolio.
For covered loans that pay according to their contractual obligation, this income is a result of the net effect of:
| | · | The value adjustment associated with assumed credit impairment offset by the corresponding valuation adjustment on the FDIC indemnification asset |
As First Financial’s experience with the acquired portfolios increases, greater predictability will emerge on the timing of the recognition of the economic value of the transaction. First Financial will consider income associated with strategic loan sales as non-core and will highlight sales when they occur. All other income associated with prepayments or contractual performance will be considered core as it arises from the expected behavior of the purchased portfolios.
First Financial and the FDIC are engaged in on-going discussions that may impact which assets and liabilities are ultimately acquired or assumed by First Financial and/or the purchase prices. The estimated fair values for the purchased impaired and nonimpaired loans were based upon the FDIC’s estimated data for excluded loans. First Financial anticipates the final determination of the excluded loans will be completed in the first quarter of 2010 and expects to finalize its analysis of these loans when this occurs.
Expected reimbursements from the FDIC under the loss sharing agreements were recorded as indemnification assets at their estimated fair value of $316.7 million on the acquisition date. These loss sharing assets are measured separately from the related covered assets as they are not contractually embedded in the assets and are not transferable with the assets should the Bank choose to dispose of them. Fair value was estimated using projected cash flows related to the loss sharing agreements based on the expected reimbursements for losses and the applicable loss sharing percentages. These expected reimbursements do not include reimbursable amounts related to future covered expenditures. These cash flows were discounted to reflect the uncertainty of the timing and receipt of the loss sharing reimbursement from the FDIC.
Reimbursement requests are submitted to the FDIC on a monthly basis for single family residential covered loans and on a quarterly basis for all other covered loans. As of December 31, 2009, none of the reimbursement claims submitted by First Financial had been denied by the FDIC.
CREDIT RISK (EXCLUDING COVERED LOANS)
First Financial records a provision for loan and lease losses (provision) in the Consolidated Statements of Income to provide for expected credit losses. Actual losses on loans and leases are charged against the allowance, which is a reserve accumulated on the Consolidated Balance Sheets through the provision. The recorded values of the loans and leases actually removed from the Consolidated Balance Sheets due to credit deterioration are referred to as charge-offs. Any subsequent recovery of a previously charged off loan is credited back to the allowance. First Financial’s policy is to charge-off loans when, in management’s opinion, full collectibility of principal and interest based upon the contractual terms of the loan is unlikely. All loans charged-off are subject to continuous review and concerted efforts are made to maximize any recovery. In most cases, the borrower’s debt obligation is not cancelled even though the balance may have been charged off.
Management maintains the allowance at a level that is considered sufficient to absorb inherent risks in the loan portfolio. Management’s evaluation in establishing the adequacy of the allowance includes evaluation of the loan and lease portfolios, past loan and lease loss experience, known and inherent risks in the portfolio, adverse situations that may affect the borrower’s ability to repay (including the timing of future payments), the estimated value of any underlying collateral, composition of the loan portfolio, economic conditions, and other pertinent factors, such as periodic internal and external evaluations of delinquent, nonaccrual, and classified loans. The evaluation is inherently subjective as it requires utilizing material estimates, including the amounts and timing of future cash flows expected to be received on impaired loans. The evaluation of these factors is the responsibility of the Allowance for Loan and Lease Losses Committee, which is comprised of senior officers from the risk management, credit administration, finance, and lending areas.
The allowance for commercial loans, including time and demand notes, tax-exempt loans, and commercial real estate loans begins with a process of estimating the probable losses inherent in the portfolio. The loss estimates for these commercial loans are established by category and based on First Financial’s internal system of credit risk ratings and historical loss data.
The estimate of losses inherent in the commercial portfolio may be adjusted for management’s estimate of probable losses on specific exposures dependent upon the values of the underlying collateral and/or the present value of expected future cash flows, as well as trends in delinquent and nonaccrual loans, prevailing economic conditions, changes in lending strategies, and other influencing factors as discussed earlier in this section.
In the commercial portfolio, certain loans, typically larger-balance non-homogeneous exposures, may have a specific allowance established based on the borrower’s overall financial condition, resources and payment record, support from guarantors, and the realizable value of any collateral.
The allowance for consumer loans which includes residential real estate, installment, home equity, credit card loans, and overdrafts, is established for each of the categories by estimating losses inherent in that particular category of consumer loans. The estimate of losses is primarily based on historical loss rates for the category, as well as trends in delinquent and nonaccrual loans, prevailing economic conditions, and other influencing factors as discussed in the Asset Quality section. Consumer loans are evaluated as an asset type within a category (i.e., residential real estate, installment, etc.), as these loans are smaller with more homogeneous characteristics.
16 First Financial Bancorp 2009 Annual Report
Elevated net charge-offs and increasing levels of nonperforming assets throughout 2009 reflect the continued adverse impact of the prolonged economic downturn and its effect on First Financial’s loan portfolio. The level of criticized loans, an indicator of possible losses, continued to increase through the fourth quarter. Based on these asset quality trends, in conjunction with a fragile economy, the allowance was increased in 2009. Much of this increase was related to the commercial real estate loan portfolio where higher vacancy rates, lower rents, and falling property values remain a significant concern. Loss in the event of default on many classes of commercial real estate properties has increased substantially throughout 2009 and this is expected to continue into 2010. Additionally, commercial customers have been suffering from the weak economy for several consecutive years and some of these customers no longer have the capital base to withstand protracted stress and, therefore, may not be able to comply with the original terms of their credit agreements.
As part of the regular reviews of the allowance in 2009, management became increasingly concerned about the potential impact the prolonged economic downturn was having on the commercial real estate portfolio. While not necessarily credit specific for First Financial, generally the outlook for this sector has continued to deteriorate and is not likely to recover over the next 12 months, according to most industry analysis. As a result, management added an additional component to the allowance review utilizing the “More Adverse” scenario of the U.S. Treasury bank stress test to assess expected remaining losses in the current credit cycle compared with the allowance. This analysis contributed to the 65.3% increase in the allowance during 2009, with a significant portion of this increase related to the company’s estimate of sector risk in the commercial real estate portfolio.
First Financial expects to maintain a higher allowance until it believes that the current economic cycle, including credit losses, for both the industry and the company, have peaked. The economy remains fragile and the company expects that certain of its credit metrics may remain volatile and at these historically higher levels over the next several quarters, or until there are more definite signs of economic recovery, including lower unemployment rates, increased consumer spending, and stabilized property values. Although there were some signs of economic stabilization and emerging optimism in the second half of 2009, unemployment rates remain at near-record levels, consumer spending is stagnant, and operating conditions continue to be challenging for many commercial borrowers.
Table 8 · Nonperforming Assets (Excluding Covered Assets)
| | | December 31, | |
| (Dollars in thousands) | | 2009 | | | 2008 | | | 2007 | | | 2006 | | | 2005 | |
| Nonaccrual loans | | $ | 71,657 | | | $ | 17,981 | | | $ | 14,113 | | | $ | 10,236 | | | $ | 24,961 | |
| Restructured loans | | | 6,125 | | | | 204 | | | | 567 | | | | 596 | | | | 3,408 | |
| Other real estate owned (OREO) | | | 4,145 | | | | 4,028 | | | | 2,636 | | | | 2,334 | | | | 3,162 | |
| Total nonperforming assets | | $ | 81,927 | | | $ | 22,213 | | | $ | 17,316 | | | $ | 13,166 | | | $ | 31,531 | |
| | | | | | | | | | | | | | | | | | | | | |
| Nonperforming assets as a percent of total loans plus OREO | | | 2.83 | % | | | 0.83 | % | | | 0.67 | % | | | 0.53 | % | | | 1.20 | % |
| | | | | | | | | | | | | | | | | | | | | |
| Accruing loans past due 90 days or more | | $ | 417 | | | $ | 138 | | | $ | 313 | | | $ | 185 | | | $ | 1,359 | |
Table 9 · Summary Of Allowance For Loan And Lease Losses And Selected Statistics (Excluding Covered Loans)
| (Dollars in thousands) | | 2009 | | | 2008 | | | 2007 | | | 2006 | | | 2005 | |
| Transactions in the allowance for loan and lease losses: | | | | | | | | | | | | | | | |
| Balance at January 1 | | $ | 35,873 | | | $ | 29,057 | | | $ | 27,386 | | | $ | 42,485 | | | $ | 45,076 | |
| Loans charged-off: | | | | | | | | | | | | | | | | | | | | |
| Commercial | | | 11,295 | | | | 5,227 | | | | 4,107 | | | | 11,950 | | | | 4,677 | |
| Real estate – commercial | | | 17,194 | | | | 3,526 | | | | 863 | | | | 7,312 | | | | 749 | |
| Real estate – residential | | | 1,315 | | | | 648 | | | | 255 | | | | 4,952 | | | | 897 | |
| Installment and other consumer financing | | | 5,145 | | | | 5,236 | | | | 4,094 | | | | 4,063 | | | | 5,191 | |
| Lease financing | | | 0 | | | | 0 | | | | 103 | | | | 72 | | | | 76 | |
| Total recoveries | | | 34,949 | | | | 14,637 | | | | 9,422 | | | | 28,349 | | | | 11,590 | |
| | | | | | | | | | | | | | | | | | | | | |
| Recoveries of loans previously charged-off: | | | | | | | | | | | | | | | | | | | | |
| Commercial | | | 632 | | | | 654 | | | | 1,002 | | | | 1,328 | | | | 1,148 | |
| Real estate – commercial | | | 557 | | | | 99 | | | | 862 | | | | 256 | | | | 21 | |
| Real estate – residential | | | 27 | | | | 25 | | | | 56 | | | | 222 | | | | 237 | |
| Installment and other consumer financing | | | 1,086 | | | | 1,253 | | | | 1,471 | | | | 1,596 | | | | 1,997 | |
| Lease financing | | | 1 | | | | 12 | | | | 50 | | | | 26 | | | | 25 | |
| Total recoveries | | | 2,303 | | | | 2,043 | | | | 3,441 | | | | 3,428 | | | | 3,428 | |
| Net charge-offs | | | 32,646 | | | | 12,594 | | | | 5,981 | | | | 24,921 | | | | 8,162 | |
| | | | | | | | | | | | | | | | | | | | | |
| Provision for loan and lease losses | | | 56,084 | | | | 19,410 | | | | 7,652 | | | | 9,822 | | | | 5,571 | |
| Balance at December 31 | | $ | 59,311 | | | $ | 35,873 | | | $ | 29,057 | | | $ | 27,386 | | | $ | 42,485 | |
| | | | | | | | | | | | | | | | | | | | | |
| Credit quality ratios: | | | | | | | | | | | | | | | | | | | | |
| As a percent of year-end loans, net of unearned income: | | | | | | | | | | | | | | | | | | | | |
| Allowance for loan and lease losses | | | 2.05 | % | | | 1.34 | % | | | 1.12 | % | | | 1.10 | % | | | 1.62 | % |
Nonperforming loans (1) | | | 2.69 | % | | | 0.68 | % | | | 0.56 | % | | | 0.44 | % | | | 1.08 | % |
| | | | | | | | | | | | | | | | | | | | | |
| As a percent of average loans, net of unearned income: | | | | | | | | | | | | | | | | | | | | |
| Net charge-offs | | | 1.16 | % | | | 0.47 | % | | | 0.24 | % | | | 0.97 | % | | | 0.30 | % |
| | | | | | | | | | | | | | | | | | | | | |
| Allowance for loan and lease losses to nonperforming loans | | | 76.25 | % | | | 197.27 | % | | | 197.94 | % | | | 252.82 | % | | | 149.76 | % |
(1) Includes nonaccrual and restructured loans.
First Financial Bancorp 2009 Annual Report 17
Management’s Discussion And Analysis Of Financial Condition And Results Of Operations
Table 10 · Allocation Of The Allowance For Loan And Lease Losses (Excluding Covered Loans)
| | | December 31, | |
| | | 2009 | | | 2008 | | | 2007 | | | 2006 | | | 2005 | |
| | | | | | Percent of | | | | | | Percent of | | | | | | Percent of | | | | | | Percent of | | | | | | Percent of | |
| | | | | | Loans to | | | | | | Loans to | | | | | | Loans to | | | | | | Loans to | | | | | | Loans to | |
| (Dollars in thousands) | | Allowance | | | Total Loans | | | Allowance | | | Total Loans | | | Allowance | | | Total Loans | | | Allowance | | | Total Loans | | | Allowance | | | Total Loans | |
| Balance at End of Period | | | | | | | | | | | | | | | | | | | | | | | | | | | | | | |
| Applicable to: | | | | | | | | | | | | | | | | | | | | | | | | | | | | | | |
| Commercial | | $ | 18,590 | | | | 27.60 | % | | $ | 12,107 | | | | 30.10 | % | | $ | 10,166 | | | | 30.21 | % | | $ | 10,415 | | | | 27.16 | % | | $ | 17,667 | | | | 22.17 | % |
| Real estate – construction | | | 8,143 | | | | 8.75 | % | | | 2,086 | | | | 8.68 | % | | | 955 | | | | 5.83 | % | | | 1,142 | | | | 4.10 | % | | | 411 | | | | 3.27 | % |
| Real estate – commercial | | | 15,190 | | | | 37.31 | % | | | 8,454 | | | | 31.56 | % | | | 7,799 | | | | 27.18 | % | | | 5,257 | | | | 25.14 | % | | | 14,874 | | | | 24.59 | % |
| Real estate – residential | | | 5,308 | | | | 11.10 | % | | | 3,715 | | | | 14.30 | % | | | 4,382 | | | | 20.75 | % | | | 4,660 | | | | 25.35 | % | | | 4,313 | | | | 29.40 | % |
| Installment, home equity | | | | | | | | | | | | | | | | | | | | | | | | | | | | | | | | | | | | | | | | |
| & credit card | | | 12,079 | | | | 15.24 | % | | | 9,508 | | | | 15.36 | % | | | 5,747 | | | | 16.02 | % | | | 5,830 | | | | 18.21 | % | | | 4,788 | | | | 20.48 | % |
| Lease financing | | | 1 | | | | 0.00 | % | | | 3 | | | | 0.00 | % | | | 8 | | | | 0.01 | % | | | 82 | | | | 0.04 | % | | | 432 | | | | 0.09 | % |
| Total | | $ | 59,311 | | | | 100.00 | % | | $ | 35,873 | | | | 100.00 | % | | $ | 29,057 | | | | 100.00 | % | | $ | 27,386 | | | | 100.00 | % | | $ | 42,485 | | | | 100.00 | % |
The allowance at December 31, 2009, was $59.3 million or 2.05% of loans, an increase of 71 basis points from 1.34% of loans at December 31, 2008. Provision for loan and lease loss expense of $56.1 million was $36.7 million higher in 2009 than in 2008, primarily due to the company’s expectations of the risk inherent in the commercial real estate loan portfolio. A large percentage of underperforming assets are secured by real estate, and this collateral has been appropriately considered in establishing the allowance. It is management’s belief that the allowance for loan and lease losses is adequate to absorb estimated credit losses in the loan and lease portfolio at December 31, 2009.
CREDIT RISK – COVERED LOANS
There was no allowance for loan and lease losses related to covered loans at December 31, 2009 as these loans were recorded at acquisition at their estimated fair value. With the exception of covered loans accounted for outside the scope of FASB ASC Topic 310-30, improvements in the estimated fair value of covered loans are reflected through higher yields on these loans while declines in the estimated fair value of covered loans are recorded as impairment charges in the company’s operating results in the period in which the decline occurs.
All loans acquired in the Peoples and Irwin acquisitions are covered by loss sharing agreements with the FDIC, whereby the FDIC reimburses First Financial for the majority of the losses incurred. Generally the determination of the fair value of the loans resulted in a significant write-down in the value of the loans, which was assigned to an accretable or nonaccretable balance, with the accretable balance being recognized as interest income over the remaining term of the loan. In accordance with accounting for business combinations, there was no allowance brought forward on any of the acquired loans, as the credit losses evident in the loans were included in the determination of the fair value of the loans at the acquisition date and are represented by the nonaccretable balance. The majority of the nonaccretable balance is expected to be received from the FDIC through the loss sharing agreements and is recorded as a separate asset from the covered loans and reflected on the Consolidated Balance Sheets. As a result, the majority of loans acquired in the Peoples and Irwin acquisitions are considered to be accruing loans. In accordance with regulatory reporting standards, covered loans that are contractually past due will continue to be reported as past due and still accruing based on the number of days past due.
Due to the significant change in the accounting for the covered loans and the loss sharing agreements with the FDIC, management believes that asset quality measures excluding the covered loans are generally more meaningful. Therefore, management has included asset quality measures that exclude covered loans in tables 8 through 10. First Financial had $16.4 million of covered nonaccrual loans, $172.0 million of covered loans 90 days past due and still accruing, and $12.9 million of covered OREO at December 31, 2009.
ASSET QUALITY (EXCLUDING COVERED LOANS)
Nonperforming assets consist of nonaccrual loans, restructured loans, and other real estate owned (OREO). The level of nonaccrual and restructured loans is an important element in assessing asset quality. Loans are classified as nonaccrual when, in the opinion of management, collection of principal or interest is doubtful. The accrual of interest income is discontinued when the collection of a loan or interest, in whole or in part, is doubtful. Loans are classified as restructured when management, to protect its investment, grants concessions to the debtor that it would not otherwise consider. See Table 8 — Nonperforming Assets for a summary of First Financial’s nonaccrual loans, restructured loans, and OREO properties.
2009 vs. 2008. Total nonperforming assets, as shown in Table 8 — Nonperforming Assets, increased $59.7 million to $81.9 million at December 31, 2009, from $22.2 million at December 31, 2008. Nonaccrual loans increased $53.7 million from 2008 and OREO increased $0.1 million, while restructured loans increased $5.9 million. The increase in nonaccrual loans was primarily due to increases in commercial, commercial real estate, and construction loans, partially offset by decreased residential real estate. OREO increased $0.1 million from $4.0 million at December 31, 2008 to $4.1 million at December 31, 2009.
Nonperforming loans, as a percent of total loans, were 2.69% at December 31, 2009, compared to 0.68% at December 31, 2008. The allowance to nonperforming loans ratio was 76.25% at December 31, 2009, compared to 197.27% at December 31, 2008. Accruing loans past due 90 days or more increased to $0.4 million at December 31, 2009, from $0.1 million at December 31, 2008.
Net charge-offs in 2009 were $32.6 million, an increase of $20.1 million from 2008, with the ratio of net charge-offs as a percent of average loans outstanding increasing from 0.47% to 1.16% as shown in Table 9 — Summary of Allowance for Loan and Lease Losses and Selected Statistics.
Consistent with the banking industry, First Financial’s overall credit quality trends deteriorated throughout most of 2009, with most pressure occurring in its commercial lending portfolios. During the fourth quarter, the company charged-off two large credits from its commercial real estate construction portfolios totaling $5.1 million. These two credits represented 17 basis points of the full-year 2009 net charge-offs to average loans and leases ratio. During the third quarter, the company sold the entire $34.5 million portfolio of shared national credits resulting in a $2.2 million charge-off, representing 8 basis points of average loans and leases. Additionally, net charge-offs in 2009 were also negatively impacted by $3.8 million of net charge-offs, or 14 basis points, related to two vehicle floor plan relationships in the second quarter.
In 2009, First Financial experienced growth of 42.8% in the home equity loan portfolio. First Financial believes its current underwriting criteria coupled with the monitoring of a number of portfolio metrics including credit scores, loan-to-value ratios, line size, and usage, provides adequate oversight. The origination methods for our home equity lending also keep both the credit decision and the documentation under the control of First Financial associates. At December 31, 2009, approximately 95.5% and 85.4% of the outstanding home equity loans had credit line sizes of less than $100,000 and $50,000 respectively, and had an average outstanding balance of approximately $30,000. First Financial maintains a strong pricing discipline for its home equity loan product and does not sacrifice loan quality for growth. Approximately 92% of First Financial’s home equity loan customers had credit scores of 700 or better at December 31, 2009.
From an industry perspective it is likely home equity lending will continue to experience stress as borrowers remain under pressure and property values remain volatile in the current economic environment. While the ratio of net charge-offs to average loans in the home equity loan portfolio had been below 50 basis points in the preceding five quarters, this ratio increased significantly to 131 basis points in the fourth quarter of 2009. First Financial continues to actively monitor its home equity portfolio and expects continued volatility in this portfolio over the next year.
In 2005, First Financial made the strategic decisions to discontinue the origination of residential real estate loans for retention on its balance sheet and to exit its indirect installment lending. The residential real estate and indirect installment portfolio have declined $338.0 million and $239.0 million excluding the impact of loan sales, since that time. In 2007, First Financial sold the servicing of its remaining residential real estate portfolio and established an agreement to sell substantially all its future originations to a strategic partner. Prior to this decision, First Financial was not a sub-prime lender, and the company does not originate sub-prime residential real estate loans in the current originate-and-sell model. In the first quarter of 2010, First Financial terminated the agreement with its strategic partner and reestablished an internal residential real estate loan origination platform. While First Financial is originating residential real estate loans again, the company has maintained the originate and sell business strategy. Newly originated residential real estate loans are now sold to multiple investors on a servicing released basis.
18 First Financial Bancorp 2009 Annual Report
Table 11 ● Investment Securities As Of December 31, 2009
| | | | | | | | | Maturing | | | | | | | |
| | | Within one year | | | After one but within five years | | | After five but within ten years | | | After ten years | |
| (Dollars in thousands) | | Amount | | | | | | Amount | | | | | | Amount | | | | | | Amount | | | | |
| Held-to-Maturity | | | | | | | | | | | | | | | | | | | | | | | | |
| U.S. Treasuries | | $ | 6,984 | | | | 2.85 | % | | $ | 6,873 | | | | 2.32 | % | | $ | 0 | | | | 0.00 | % | | $ | 0 | | | | 0.00 | % |
| Mortgage-backed securities | | | 11 | | | | 13.14 | % | | | 138 | | | | 4.73 | % | | | 0 | | | | 0.00 | % | | | 0 | | | | 0.00 | % |
Obligations of state and other political subdivisions | | | 286 | | | | 6.06 | % | | | 2,390 | | | | 7.00 | % | | | 456 | | | | 7.20 | % | | | 977 | | | | 7.82 | % |
| Total | | $ | 7,281 | | | | 2.99 | % | | $ | 9,401 | | | | 3.54 | % | | $ | 456 | | | | 7.20 | % | | $ | 977 | | | | 7.82 | % |
| | | | | | | | | | | | | | | | | | | | | | | | | | | | | | | | | |
| Available-for-Sale | | | | | | | | | | | | | | | | | | | | | | | | | | | | | | | | |
Securities of other U.S. government agencies and corporations | | $ | 0 | | | | 0.00 | % | | $ | 50 | | | | 6.41 | % | | $ | 20,571 | | | | 5.50 | % | | $ | 0 | | | | 0.00 | % |
| Mortgage-backed securities | | | 8,508 | | | | 4.34 | % | | | 310,892 | | | | 4.67 | % | | | 69,318 | | | | 4.45 | % | | | 33,541 | | | | 5.18 | % |
| Obligations of state and other | | | | | | | | | | | | | | | | | | | | | | | | | | | | | | | | |
| political subdivisions | | | 1,331 | | | | 7.40 | % | | | 10,985 | | | | 7.66 | % | | | 5,551 | | | | 6.86 | % | | | 255 | | | | 7.80 | % |
| Other securities | | | 241 | | | | 6.20 | % | | | 121 | | | | 6.13 | % | | | 0 | | | | 0.00 | % | | | 9,638 | | | | 4.33 | % |
| Total | | $ | 10,080 | | | | 4.79 | % | | $ | 322,048 | | | | 4.78 | % | | $ | 95,440 | | | | 4.82 | % | | $ | 43,434 | | | | 5.01 | % |
(1) Tax equivalent basis was calculated using a 35.00% tax rate and yields were based on amortized cost.
INVESTMENT SECURITIES
First Financial’s investment securities at December 31, 2009, totaled $579.1 million, a $113.6 million or 16.4% decrease from the $692.8 million balance at December 31, 2008. The decrease in the portfolio was primarily attributable to the sale of $149.4 million of securities in that quarter of 2009 used to fund the $145.1 million purchase of loans from Irwin in the second quarter of 2009, partially offset by investment securities acquired in the Peoples and Irwin acquisitions discussed above. Additionally, First Financial did not reinvest cash flow paydowns and maturities from the investment securities portfolio during 2009. First Financial has not purchased investment securities since the first quarter of 2009 primarily due to the higher pricing on bonds throughout 2009.
In anticipation of the receipt of the $80.0 million in capital through the U.S. Treasury’s Capital Purchase Program (CPP) in 2008, First Financial had both a long term and short term plan for the proceeds and purchased agency-guaranteed, mortgage backed securities (MBSs) late in the fourth quarter of 2008 through first quarter of 2009 and designated an investment portfolio specifically supported by the CPP capital, referred to as the CPP Investment Portfolio. This investment portfolio totaled $52.6 million at December 31, 2009, compared with $121.9 million at December 31, 2008. First Financial restructured the CPP Investment Portfolio to fund the loan purchase from Irwin noted above. The remaining CPP Investment Portfolio is now included and managed as part of First Financial’s total Investment Portfolio as of December 31, 2009.
The sale of the CPP Investment Portfolio securities resulted in an aggregate pre-tax gain of $3.3 million. First Financial’s investment portfolio, as a percentage of total assets, is the second largest component of total assets after loans but remains low relative to its peers. The company continues to review various portfolio strategies that may increase the size of its investment portfolio and its absolute level of earnings while balancing capital and liquidity targets. Among other factors, the portfolio selection criteria avoids securities backed by sub-prime assets, those containing assets that would give rise to material geographic concentrations, and securities that give rise to significant prepayment risk, which occurs when underlying borrowers prepay their obligations due to market fluctuations and mortgage interest rates. First Financial’s investment strategy focuses on shorter duration securities with more predictable cash flows in a variety of interest rate scenarios consistent with its overall asset/liability management position.
The majority of the investment portfolio is comprised of low-risk investment securities, primarily treasury, government agency and agency residential mortgage-backed securities. The December 31, 2009 investment securities portfolio included a net unrealized pre-tax gain of $16.5 million representing the difference between fair value and amortized cost. This compares with net unrealized pre-tax gains of $11.1 million at December 31, 2008. The net unrealized pre-tax gain increased in 2009 over 2008 due to improved liquidity and pricing in agency securities markets, primarily related to residential mortgage-backed securities. The total investment portfolio represented 8.7% and 18.7% of total assets at December 31, 2009 and December 31, 2008, respectively.
Table 12 ● Investment Securities
| | | 2009 | | | 2008 | |
| | | | | | Percent of | | | | | | Percent of | |
| (Dollars in thousands) | | Amount | | | Portfolio | | | Amount | | | Portfolio | |
| U.S. Treasuries | | $ | 13,857 | | | | 2.83 | % | | $ | 0 | | | | 0.00 | % |
| Securities of U.S. Government agencies and corporations | | | 20,621 | | | | 4.21 | % | | | 46,682 | | | | 7.02 | % |
| Mortgage-backed securities | | | 422,408 | | | | 86.34 | % | | | 572,706 | | | | 86.15 | % |
| Obligations of state and other political subdivisions | | | 22,231 | | | | 4.54 | % | | | 40,928 | | | | 6.16 | % |
| Other securities | | | 10,200 | | | | 2.08 | % | | | 4,467 | | | | 0.67 | % |
| Total | | $ | 489,317 | | | | 100.00 | % | | $ | 664,783 | | | | 100.00 | % |
Securities issued by U.S. government agencies and corporations, primarily the Federal Home Loan Bank (FHLB), FHLMC, Federal National Mortgage Association (FNMA), and Federal Farm Credit Bank represented 7.0% of the investment portfolio at both December 31, 2009, and 2008. All U.S. government agencies and corporations’ securities were classified as available-for-sale at December 31, 2009, and 2008. Due to the government guarantees, either expressed or implied, U.S. government agency and corporation obligations are considered to have a low credit risk and high liquidity profile.
Investments in MBSs, including collateralized mortgage obligations (CMOs), represented 86.3% and 86.1% of the investment portfolio at December 31, 2009, and 2008, respectively. MBSs represent participations in pools of residential real estate loans, the principal and interest payments of which are passed through to the security investors. MBSs are subject to prepayment risk, especially during periods of falling interest rates, and duration typically extends in periods of rising interest rates. Prepayments of the underlying residential real estate loans may shorten the lives of the securities, thereby affecting yields to maturity and market values. First Financial invests primarily in MBSs issued by U.S. government agencies and corporations, such as Government National Mortgage Association (GNMA), FHLMC, and FNMA. Such securities, because of government agency guarantees, are considered to have a low credit risk and high liquidity profile.
CMOs totaled $58.2 million at December 31, 2009, and $134.5 million at December 31, 2008, all of which were classified as available-for-sale. All CMOs held by First Financial are AAA rated by Standard & Poor’s Corporation or similar rating agencies, and First Financial does not own any interest-only securities, principal-only securities, or other high risk securities.
Securities of state and other political subdivisions comprised 4.5% and 6.2% of the investment portfolio at December 31, 2009, and 2008, respectively. The securities are diversified as to states and issuing authorities within states, thereby decreasing portfolio risk.
First Financial Bancorp 2009 Annual Report 19
Management’s Discussion And Analysis Of Financial Condition And Results Of Operations
Other securities, 2.0% and 0.7% of First Financial’s investment portfolio at December 31, 2009, and 2008, respectively, were primarily composed of taxable obligations of state and other political subdivisions, Community Reinvestment Act qualified mutual funds, and a small private equity fund.
The estimated maturities and weighted-average yields of the held-to-maturity and available-for-sale investment securities as of December 31, 2009, are shown in Table 12 — Investment Securities as of December 31, 2009. Tax-equivalent adjustments, using a 35.0% rate, have been made in calculating yields on tax-exempt obligations of state and other political subdivisions.
At December 31, 2009 and 2008, 96.9% and 99.2%, respectively, of investment securities were classified as available-for-sale. At December 31, 2009, the market value of First Financial’s held-to-maturity investment securities portfolio exceeded the carrying value by $0.3 million. The available-for-sale investment securities are reported at their market value of $471.0 million. At December 31, 2008, the market value of First Financial’s held-to-maturity investment securities portfolio exceeded the carrying value by $0.2 million. The available-for-sale investment securities are reported at their market value of $659.8 million. See Note 9 of the Notes to Consolidated Financial Statements for additional information.
First Financial adopted FASB ASC Topic 825-10 effective January 1, 2008. This statement permits the initial and subsequent measurement of many financial instruments and certain other assets and liabilities at fair value on an instrument-by-instrument, irrevocable basis. First Financial applied the fair value option to its equity securities of government sponsored entities (GSE), specifically 200,000 FHLMC perpetual preferred series V shares. Throughout 2008 and 2009, these securities were classified as trading investment securities in First Financial’s Consolidated Balance Sheets. For the full-year of 2008, the company recorded a $3.7 million pre-tax loss related to its investment in these securities, with $3.4 million recorded in the third quarter of 2008. This loss was a result of the decline in market value of the shares following the September 7, 2008 announcement by the U.S. Treasury, the Federal Reserve, and the Federal Housing Finance Agency (FHFA), that the FHFA was placing FHLMC under conservatorship and would eliminate the dividends on its common and preferred stock. The fair value accounting treatment discussed above requires First Financial to recognize in its income statement both the market value increases and decreases in future periods. The value of the FHLMC securities fluctuated moderately throughout 2009, resulting in a $0.1 million net realized gain for the twelve months ended December 31, 2009. First Financial sold all 200,000 FHLMC securities in the first quarter of 2010 for $0.2 million, resulting in a realized loss of less than $0.1 million.
The other investments category in the Consolidated Balance Sheets reflects First Financial’s investment in the stock of the Federal Reserve Bank and the FHLB.
First Financial held excess cash on deposit with the Federal Reserve of $262.0 million at December 31, 2009. First Financial began holding excess cash on deposit with the Federal Reserve rather than investing excess cash overnight in federal funds sold when the Federal Reserve began paying interest on bank deposits during the year. First Financial had no excess cash on deposit with the Federal Reserve or invested in federal funds sold at December 31, 2008. The increase in excess cash is primarily a result of the $967.4 million of cash received from the FDIC in the Irwin and Peoples acquisitions in the third quarter 2009. The primary reason for the decline in these funds received was due to planned runoff in the acquired deposit portfolios. First Financial monitors this position as part of its asset/liability and liquidity management process.
See Note 21 of the Notes to Consolidated Financial Statements for additional information on how First Financial determines the fair value of investment securities.
DERIVATIVES
The use of derivative instruments allows First Financial to meet the needs of its clients while managing the interest-rate risk associated with certain transactions. First Financial’s board of directors has authorized the use of certain derivative products, including interest rate caps, floors, and swaps. First Financial does not use derivatives for speculative purposes and currently does not have any derivatives that are not designated as hedges.
The accounting for changes in the fair value of derivatives depends on the intended use of the derivative and the resulting designation. Derivatives used to hedge the exposure to changes in the fair value of an asset, liability, or firm commitment attributable to a particular risk, such as interest rate risk, are considered fair value hedges. Derivatives used to hedge the exposure to variability in expected future cash flows, or other types of forecasted transactions, are considered cash flow hedges.
Fair Value Hedges. First Financial utilizes interest rate swaps designated as fair value hedges as a means to offer commercial customers products that meet their needs, primarily creating for them synthetic fixed rate borrowing, but are also designed to achieve First Financial’s desired interest rate risk profile at the time. The fair value swap agreements generally involve the net receipt by First Financial of floating-rate amounts in exchange for net payments by First Financial, through its loan clients, of fixed-rate amounts over the life of the agreements without an exchange of the underlying principal or notional amount. This results in First Financial’s loan customers receiving fixed rate funding, while providing First Financial with a floating rate asset. The net interest receivable or payable on the interest rate swaps is accrued and recognized as an adjustment to the interest income or interest expense of the hedged item. The fair value of the interest rate swaps is included within accrued interest and other assets on the Consolidated Balance Sheets. The corresponding fair-value adjustment is also included on the Consolidated Balance Sheets in the carrying value of the hedged item. Derivative gains and losses not considered effective in hedging the change in fair value of the hedged item are recognized immediately in income.
Cash Flow Hedges. First Financial utilizes interest rate swaps designated as cash flow hedges to manage the variability of cash flows, primarily net interest income, attributable to changes in interest rates. The net interest receivable or payable on an interest rate swap designated as a cash flow hedge is accrued and recognized as an adjustment to interest income or interest expense. The fair value of the interest rate swaps are included within accrued interest and other assets on the Consolidated Balance Sheets. Changes in the fair value of the interest rate swap are included in accumulated comprehensive income (loss). Derivative gains and losses not considered effective in hedging the cash flows related to the underlying hedged item, if any, would be recognized immediately in income. All of First Financial’s cash flow hedges are considered to be effective.
During the third quarter of 2008, First Financial executed a prime interest rate swap to hedge against interest rate volatility on $50.0 million of prime-based, floating rate loans. The prime interest rate swap involved the receipt of fixed-rate interest amounts in exchange for variable-rate interest payments over the life of the agreement without exchange of the underlying notional amount. First Financial terminated the $50.0 million prime interest rate swap during the fourth quarter of 2008 to mitigate counterparty risk and locked in the favorable value of the swap at the time. Terminating the prime interest rate swap resulted in a $1.3 million pre-tax gain that is included in accumulated other comprehensive income (loss) on the Consolidated Balance Sheets. The $1.3 million pre-tax gain is amortized into income over the remaining term of the original prime interest rate swap. First Financial amortized $0.8 million of the pre-tax gain into income in 2009, while the remaining $0.5 million pre-tax gain will be amortized into income in 2010.
During the first quarter of 2009, First Financial executed a cash flow hedge utilizing an interest rate swap to hedge against interest rate volatility on $20,000 of LIBOR-based, floating rate trust preferred securities. The interest rate swap involves the receipt by First Financial of variable-rate interest amounts in exchange for fixed-rate interest payments by First Financial for a period of 10 years at an annual rate of 6.20%. The net interest receivable or payable on the trust preferred interest rate swap will be accrued and recognized as an adjustment to interest expense. The fair value of the trust preferred interest rate swap will be included in accrued interest and other assets or liabilities on the Consolidated Balance Sheets. Changes in the fair value of the trust preferred interest rate swap will be included in accumulated other comprehensive income (loss) on the Consolidated Balance Sheets. Derivative gains and losses not considered effective in hedging the cash flows related to these securities, if any, will be recognized immediately in income.
The notional amount of a swap only establishes the basis on which interest payments are exchanged with counterparties. As only interest rate payments are exchanged, cash requirements and credit risk are significantly less than the notional amounts. First Financial’s credit risk exposure is limited to the market value of the instrument. First Financial manages the credit risk through counterparty credit policies and at December 31, 2009, had bilateral collateral agreements in place with its counterparties. The counterparty credit policies require First Financial to maintain a total derivative notional position of less than 35.0% of assets, total credit exposure of less than 3.0% of capital, and no single counterparty credit risk exposure greater than $20.0 million. First Financial is currently well below all single counterparty and portfolio limits.
As of December 31, 2009, there were no delinquent amounts due and First Financial had never experienced a credit loss related to these agreements. First Financial had $11.2 million and $12.1 million deposited as cash collateral with its counterparties as of December 31, 2009, and 2008, respectively. This cash collateral is held at commercial banks and earns a rate of interest generally equal to the overnight Federal Funds interest rate.
As of December 31, 2009, First Financial had interest rate swaps with a notional value of $239.3 million, compared to a notional value of $154.1 million at December 31, 2008.
20 First Financial Bancorp 2009 Annual Report
Table 13 ● Maturities Of Time Deposits
Greater Than Or Equal To $100,000
| | | December 31, 2009 | |
| | | Certificates of | | | | | | | | | | |
| (Dollars in thousands) | | Deposit | | | IRAs | | | Brokered CDs | | | Total | |
| Maturing in | | | | | | | | | | | | |
| 3 months or less | | $ | 118,411 | | | $ | 4,972 | | | $ | 43,412 | | | $ | 166,795 | |
| 3 months to 6 months | | | 91,508 | | | | 5,928 | | | | 78,726 | | | | 176,162 | |
| 6 months to 12 months | | | 161,746 | | | | 14,906 | | | | 115,394 | | | | 292,046 | |
| over 12 months | | | 197,234 | | | | 49,395 | | | | 120,043 | | | | 366,672 | |
| Total | | $ | 568,899 | | | $ | 75,201 | | | $ | 357,575 | | | $ | 1,001,675 | |
DEPOSITS
First Financial solicits deposits by offering a wide variety of savings and transaction accounts, including checking, regular savings, money-market deposit, and time deposits of various maturities and rates.
2009 vs. 2008. Total average deposits for 2009 increased $913.4 million or 32.7% from 2008, due primarily to the Peoples and Irwin acquisitions. Average time deposits increased $357.0 million or 30.2%, while average transaction and savings deposits increased $414.3 million or 34.0%. As permitted by the FDIC, First Financial had the option to reprice the acquired deposit portfolios of Peoples and Irwin to current market rates within seven days of the acquisition dates. If First Financial elected to reprice the rates on deposit accounts the clients then had the option to withdraw funds from those accounts without penalty. The company chose to reprice approximately $1.0 billion in deposits comprised of all assumed brokered deposits, all time deposits from Peoples, as well as time deposits of Irwin Union Bank, F.S.B. First Financial received approximately $967.4 million from the FDIC associated with the transactions and believes that this provides sufficient liquidity to fund the potential at-risk deposit outflows. Through the end of December 2009, approximately 47% of the repriced Irwin deposit accounts were redeemed without penalty.
As a result of First Financial’s plans to exit the nine remaining western market locations it acquired from Irwin, the company anticipates that those deposits will roll off at a more rapid pace over the next few months. Deposits in these nine markets totaled $347.0 million at December 31, 2009.
During 2008, the company initiated a deposit pricing strategy aimed at maximizing the net interest margin in a very competitive deposit gathering landscape. Late in the third quarter of 2008, and continuing through 2009, First Financial instituted pricing initiatives designed to grow and retain retail deposits as well as to manage its overall asset/liability position. The company also extended the terms of CD offerings with maturities of one year and beyond to secure long-term funding at attractive rates, and continues to evaluate its key customer and market demographics to develop a combination of strategies to help increase core deposits. The strategy has been successful as outflows of time deposits have been replaced with less expensive wholesale funding that was used to help fund asset generation.
Total deposits at December 31, 2009, were $5.5 billion as compared to December 31, 2008 at $2.8 billion, a $2.7 billion or 99.7% increase due to an increase in interest-bearing checking deposits of $813.1 million, an increase in time deposits of $1.2 billion, savings deposits of $374.5 million, and noninterest-bearing deposits of $355.9 million.
Table 13 — Maturities of Time Deposits Greater Than or Equal to $0.1 million shows the contractual maturity of time deposits of $0.1 million and over that were outstanding at December 31, 2009. These deposits represented 12.0% of total deposits.
BORROWINGS
2009 vs. 2008. Short-term borrowings decreased to $37.4 million at December 31, 2009, from $354.5 million at December 31, 2008, as a result of maturities of short term advances. Long-term debt increased $256.6 million to $425.3 million at December 31, 2009, from $168.8 million at December 31, 2008 due to the Federal Home Loan Bank long term debt acquired in the Peoples and Irwin transactions in 2009.
As a result of increasing the size of the investment portfolio, continued strong loan demand, and net deposit outflows during the third quarter of 2008, First Financial executed $115 million of term debt instruments. Utilizing a combination of its funding sources from the pledging of investment securities and the FHLB, this funding has multiple maturities between two and three years, and a weighted average cost of 3.63%. This strategy was primarily executed to reduce overnight liquidity risk and to mitigate interest rate sensitivity on the balance sheet.
First Financial utilizes advances from the FHLB as a funding source. Total short-term borrowings from the FHLB were $0 and $150.0 million at December 31, 2009 and 2008, respectively. Total long-term borrowings from the FHLB were $339.7 million and $83.2 million at December 31, 2009 and 2008, respectively. The total available borrowing capacity from the FHLB at December 31, 2009, was $232.0 million.
As of December 31, 2009, First Financial has pledged certain real estate loans, as well as government and agency securities, with a book value of $1.4 billion, as collateral for borrowings to the FHLB. For ease of borrowing execution, First Financial utilizes a blanket collateral agreement with the FHLB.
First Financial maintains a short-term revolving credit facility with an unaffiliated bank. This facility provides First Financial additional liquidity for various corporate activities, including the repurchase of First Financial shares and the payment of dividends to shareholders. As of December 31, 2009, the outstanding balance was $0 compared to an outstanding balance of $57.0 million as of December 31, 2008. The outstanding balance of this line varies throughout the year depending on First Financial’s cash needs. The average outstanding balance was $29.7 million for 2009 and $56.7 million for 2008. First Financial entered into the credit facility for $75.0 million during the first quarter of 2007 for a period of one year, and in the third quarter of 2007 increased the line to $85.0 million until February 1, 2008, at which time it was reduced back to $75.0 million. First Financial renewed the credit facility during the first quarter of 2009 for a period of one year with an amended, maximum outstanding balance of $40.0 million. The credit facility was subsequently amended to reduce the maximum outstanding balance to $25.0 million. The credit agreement required First Financial to maintain certain covenants including return on average assets and those related to capital levels. As of December 31, 2009, and 2008, First Financial was in compliance with all required covenants.
Other long-term debt which appears on the Consolidated Balance Sheets consists of junior subordinated debentures owed to unconsolidated subsidiary trusts. Capital securities were issued in the third quarters of 2003 and 2002 by statutory business trusts –First Financial (OH) Statutory Trust II and First Financial (OH) Statutory Trust I, respectively. The debentures issued in 2002, with a final maturity of 2032, were first eligible for early redemption by First Financial in September of 2007. At the date of early redemption, First Financial redeemed all the underlying capital securities relating to Trust I. The total outstanding capital securities redeemed were $10.0 million. The debentures issued in 2003 were eligible for early redemption by First Financial in September of 2008. First Financial did not elect to redeem early, but under the terms of the agreement may redeem the securities on any interest payment date after September of 2008, with a final maturity in 2033.
First Financial owns 100% of the common equity of the remaining trust, Trust II. The trust was formed with the sole purpose of issuing the capital securities and investing the proceeds from the sale of such capital securities in the debentures. The debentures held by the trust are the sole asset of the trust. Distributions on the capital securities are payable quarterly at a variable rate of interest, which is equal to the interest rate being earned by the trust on the debentures, and are recorded as interest expense of First Financial. The capital securities are subject to mandatory redemption, in whole or in part, upon repayment of the debentures. First Financial has entered into agreements which, taken collectively, fully or unconditionally guarantee the capital securities subject to the terms of the guarantees. The amount outstanding, net of offering costs, as of December 31, 2009, is $20.0 million. These funds were used for general corporate purposes, to repurchase First Financial stock and as a means to diversify funding sources at the parent company level. As was previously described, these instruments were effectively converted to a fixed interest rate, accounted for as a cash flow hedge, in the first quarter of 2009 through the execution of an interest rate swap. The interest rate swap effectively converts floating interest rate securities to a fixed interest rate of 6.20% per annum for a term of 10 years.
The debenture qualifies as Tier I capital under Federal Reserve Board guidelines, but is limited to 25% of total qualifying tier 1 capital. The company has the capacity to issue approximately $65.8 million in additional qualifying debentures under these guidelines.
First Financial Bancorp 2009 Annual Report 21
Management’s Discussion And Analysis Of Financial Condition And Results Of Operations
See Note 13 of the Notes to Consolidated Financial Statements for additional information on borrowings and Note 16 for additional information on capital.
LIQUIDITY
Liquidity management is the process by which First Financial manages the continuing flow of funds necessary to meet its financial commitments on a timely basis and at a reasonable cost. These funding commitments include withdrawals by depositors, credit commitments to borrowers, common and preferred dividends, expenses of its operations, and capital expenditures. Liquidity is monitored and closely managed by First Financial’s Asset and Liability Committee (ALCO), a group of senior officers from the lending, deposit gathering, finance, risk management, and treasury areas. It is ALCO’s responsibility to ensure First Financial has the necessary level of funds available for normal operations as well as maintain a contingency funding policy to ensure that liquidity stress events are quickly identified, and management plans are in place to respond. This is accomplished through the use of policies which establish limits and require measurements to monitor liquidity trends, including management reporting that identifies the amounts and costs of all available funding sources. During 2009, First Financial was able to expand its various funding sources, including overnight borrowing lines, and has a diversified base of liquidity sources. These sources are periodically tested for funding availability and there have been no restrictions in availability.
Liquidity is derived primarily from deposit growth, principal and interest payments on loans and investment securities, maturing loans and investment securities, access to wholesale funding sources, and collateralized borrowings. First Financial’s most stable source of liability-funded liquidity for both the long and short-term needs is deposit growth and retention of the core deposit base. The deposit base is diversified among individuals, partnerships, corporations, public entities, and geographic markets. This diversification helps First Financial minimize dependence on large concentrations of wholesale funding sources.
Capital expenditures, such as banking center expansions and technology investments, were $13.2 million for 2009, $11.9 million for 2008, and $7.6 million for 2007. In addition, remodeling is a planned and ongoing process given First Financial’s 127 banking centers. Material commitments for capital expenditures as of December 31, 2009, were $19.5 million. Management believes that First Financial has sufficient liquidity to fund its future capital expenditure commitments.
The principal source of asset-funded liquidity is marketable investment securities, particularly those with shorter maturities. The market value of investment securities classified as available-for-sale totaled $471.0 million at December 31, 2009. Securities classified as held-to-maturity that are maturing within a short period of time are also a source of liquidity. Securities classified as held-to-maturity that are maturing in one year or less totaled $7.3 million at December 31, 2009. In addition, other types of assets such as cash and due from banks, federal funds sold and securities purchased under agreements to resell, as well as loans maturing within one year, are sources of liquidity.
At December 31, 2009, in addition to liquidity on hand of $606.2 million, First Financial had unused and available overnight wholesale funding of approximately $2.3 billion to fund any significant deposit runoff that may occur as a result of the repriced deposits and from the markets that the company is exiting as well as general corporate requirements.
Certain restrictions exist regarding the ability of First Financial’s subsidiaries to transfer funds to First Financial in the form of cash dividends, loans, or advances. The approval of the subsidiaries’ respective primary federal regulators is required for First Financial’s subsidiaries to pay dividends in excess of regulatory limitations. Dividends paid to First Financial from its subsidiaries totaled $40.7 million, $24.9 million, and $31.7 million for the years 2009, 2008, and 2007, respectively. As of December 31, 2009, First Financial’s subsidiaries had retained earnings of $346.6 million of which $223.7 million was available for distribution to First Financial without prior regulatory approval. Management is not aware of any other events or regulatory requirements that, if implemented, are likely to have a material effect on First Financial’s liquidity.
First Financial makes quarterly interest payments on its junior subordinated debentures owed to unconsolidated subsidiary trusts. Interest expense related to this other long-term debt totaled $1.2 million, $1.4 million, and $2.4 million, in the years 2009, 2008, and 2007, respectively.
During 2009, First Financial made quarterly dividend payments to the U.S. Treasury on the 80,000 perpetual preferred securities, which carry a 5.0% dividend rate for the first five years and a 9.0% rate thereafter. On February 24, 2010, First Financial Bancorp redeemed all of the $80.0 million of senior preferred shares issued to the U.S. Treasury in December 2008 under its CPP. First Financial will include in its computation of earnings per diluted common share the impact of a non-cash, deemed dividend of $0.8 million, representing the unaccreted preferred stock discount remaining on the transaction date. This one-time deemed dividend is in addition to the first quarter 2010 preferred cash dividends paid through the redemption date, totaling $1.1 million.
PENSION PLAN
First Financial sponsors a non-contributory defined-benefit pension plan covering substantially all employees. Plan assets are administered by First Financial’s Wealth Resource Group and primarily consist of equity and debt mutual funds, as well as money market funds. The pension plan does not own any shares of First Financial common stock, directly or through an equity fund.
Effective in the third quarter of 2007, First Financial amended the defined benefit pension plan formula to change the determination of participant benefits from a final average earnings plan to a cash balance plan. Pension plan participants prior to July 1, 2007, transitioned to the amended plan on January 1, 2008. After July 1, 2007, newly eligible participants entered the amended plan upon their eligibility date.
The significant assumptions used in the pension plan include the discount rate, expected return on plan assets, and the rate of compensation increase. The discount rate assumption was determined using published December 31, 2009, Corporate Bond Indices, projected cash flows of the pension plan, and comparisons to external industry surveys for reasonableness. The basis used to determine the overall expected long-term return on plan assets was based on the composition of plan assets and a consensus of estimates from similarly managed portfolios of expected future returns. The expected return on plan assets was 8.5% in both 2009 and 2008. First Financial will continue to monitor the return on plan assets and the investment vehicle used to fund the plan. The rate of compensation increase is compared to historical increases for plan participants.
Presented below is the estimated impact on First Financial’s projected benefit obligation and pension expense as of December 31, 2009, assuming shifts in the significant assumptions:
| | | | | | | | | | | | Rate of | |
| | | | | | | | | Expected Return on | | | Compensation | |
| | | Discount Rate | | | Plan Assets | | | Increase | |
| | | -100 basis | | | +100 basis | | | -100 basis | | | +100 basis | | | -100 basis | | | +100 basis | |
| (Dollars in thousands) | | points | | | points | | | points | | | points | | | points | | | points | |
| Change in Projected Benefit Obligation | | $ | 7,363 | | | $ | (6,014 | ) | | | N/A | | | | N/A | | | $ | (672 | ) | | $ | 733 | |
| Change in Pension Expense | | $ | 685 | | | $ | (630 | ) | | $ | 620 | | | $ | (620 | ) | | $ | (109 | ) | | $ | 123 | |
In accordance with FASB ASC Topic 715, Compensation – Retirement Benefits, First Financial recorded a pension settlement charge of $2.2 million in 2007. No such charge was required in 2008 or 2009. The charge in 2007 was a result of First Financial’s staff reductions that year, and was an acceleration of costs previously deferred under pension accounting rules and would have been recognized in future periods. First Financial recorded pension expense in the Consolidated Statements of Income of $0.9 million, $1.4 million, and $4.5 million for 2009, 2008, and 2007, respectively, inclusive of the pension settlement and curtailment charges discussed above. First Financial made cash contributions totaling $30.8 million to fund the pension plan, with $30.0 million in the second quarter of 2009. No cash contributions to fund the pension plan were necessary in 2008 and 2007. First Financial does not expect to make a cash contribution to its pension plan in 2010. Contributions, if necessary, are required to meet ERISA’s minimum funding standards and the estimated quarterly contribution requirements during this period.
INTEREST RATE SENSITIVITY
Market risk is the risk of loss arising from adverse changes in the fair value of financial instruments due to changes in interest rates, foreign exchange rates, and equity prices. The primary source of market risk for First Financial is interest-rate risk. Interest-rate risk is the risk to earnings and value arising from changes in market interest rates and arises in the normal course of business to the extent that there is a divergence between the amount of First Financial’s interest-earning assets and the amount of interest-bearing liabilities that are prepaid/withdrawn, re-price, or mature in specified periods. First Financial seeks to achieve consistent growth in net interest income and capital while managing volatility arising from shifts in market interest rates. First Financial’s board of directors establishes policy limits with respect to interest rate risk. ALCO oversees market risk management, monitoring risk measures, limits, and policy guidelines for managing the amount of interest-rate risk and its effect on net interest income and capital.
Interest rate risk management is an active process that encompasses monitoring loan and deposit flows complemented by investment and funding activities. Effective interest rate risk management begins with understanding the dynamic characteristics of assets and liabilities and determining the appropriate interest rate risk position given business activities, management objectives, market expectations and ALCO policy limits and guidelines.
22 First Financial Bancorp 2009 Annual Report
Table 14 ● Market Risk Disclosure
| | | Principal Amount Maturing In: | | | FAIR VALUE | |
| | | | | | | | | | | | | | | | | | | | | | | | December 31, | |
| (Dollars in thousands) | | 2010 | | | 2011 | | | 2012 | | | 2013 | | | 2014 | | | THEREAFTER | | | TOTAL | | | 2009 | |
| Rate sensitive assets | | | | | | | | | | | | | | | | | | | | | | | | |
Fixed interest rate loans(1) | | | 205,805 | | | | 178,061 | | | | 151,522 | | | | 180,650 | | | | 111,283 | | | | 112,807 | | | | 940,128 | | | | 938,419 | |
| Average interest rate | | | 5.47 | % | | | 5.68 | % | | | 6.90 | % | | | 6.12 | % | | | 6.07 | % | | | 6.68 | % | | | 6.08 | % | | | | |
Variable interest rate loans(1) | | | 740,053 | | | | 192,088 | | | | 506,518 | | | | 108,165 | | | | 97,552 | | | | 317,038 | | | | 1,961,414 | | | | 1,975,642 | |
| Average interest rate | | | 4.46 | % | | | 4.41 | % | | | 4.00 | % | | | 4.76 | % | | | 4.30 | % | | | 4.79 | % | | | 4.40 | % | | | | |
| Covered loans | | | 701,104 | | | | 308,168 | | | | 255,026 | | | | 179,378 | | | | 106,545 | | | | 379,328 | | | | 1,929,549 | | | | 1,929,549 | |
| Average interest rate | | | 8.83 | % | | | 8.63 | % | | | 8.53 | % | | | 8.40 | % | | | 8.23 | % | | | 7.58 | % | | | 8.44 | % | | | | |
| Fixed interest rate securities | | | 16,922 | | | | 57,818 | | | | 88,308 | | | | 83,861 | | | | 34,410 | | | | 86,447 | | | | 367,766 | | | | 368,241 | |
| Average interest rate | | | 4.11 | % | | | 4.99 | % | | | 4.65 | % | | | 4.83 | % | | | 5.21 | % | | | 5.22 | % | | | 4.91 | % | | | | |
| Variable interest rate securities | | | 438 | | | | 56 | | | | 10,666 | | | | 39,306 | | | | 17,025 | | | | 143,890 | | | | 211,381 | | | | 211,381 | |
| Average interest rate | | | 1.25 | % | | | 4.14 | % | | | 4.75 | % | | | 4.15 | % | | | 4.37 | % | | | 3.60 | % | | | 3.81 | % | | | | |
| Other earning assets | | | 262,017 | | | | 0 | | | | 0 | | | | 0 | | | | 0 | | | | 0 | | | | 262,017 | | | | 262,017 | |
| Average interest rate | | | 0.25 | % | | | 0.00 | % | | | 0.00 | % | | | 0.00 | % | | | 0.00 | % | | | 0.00 | % | | | 0.25 | % | | | | |
| FDIC indemnification asset | | | 175,043 | | | | 88,792 | | | | 20,034 | | | | 12,015 | | | | 3,544 | | | | 16,612 | | | | 316,040 | | | | 316,040 | |
| Average interest rate | | | 6.50 | % | | | 6.50 | % | | | 6.50 | % | | | 6.50 | % | | | 6.50 | % | | | 6.50 | % | | | 6.50 | % | | | | |
| | | | | | | | | | | | | | | | | | | | | | | | | | | | | | | | | |
| Rate sensitive liabilities | | | | | | | | | | | | | | | | | | | | | | | | | | | | | | | | |
| Noninterest-bearing checking | | | 754,522 | | | | 0 | | | | 0 | | | | 0 | | | | 0 | | | | 0 | | | | 754,522 | | | | 754,522 | |
| Savings and interest-bearing checking | | | 236,672 | | | | 2,130,046 | | | | 0 | | | | 0 | | | | 0 | | | | 0 | | | | 2,366,718 | | | | 2,366,718 | |
| Average interest rate | | | 0.54 | % | | | 0.54 | % | | | 0.00 | % | | | 0.00 | % | | | 0.00 | % | | | 0.00 | % | | | 0.54 | % | | | | |
| Time deposits | | | 1,362,667 | | | | 306,505 | | | | 297,605 | | | | 221,542 | | | | 31,604 | | | | 9,477 | | | | 2,229,400 | | | | 2,230,173 | |
| Average interest rate | | | 1.95 | % | | | 2.53 | % | | | 3.43 | % | | | 3.09 | % | | | 2.82 | % | | | 1.94 | % | | | 2.36 | % | | | | |
| Fixed interest rate borrowings | | | 20,570 | | | | 50,017 | | | | 52,000 | | | | 500 | | | | 0 | | | | 241,629 | | | | 364,716 | | | | 386,468 | |
| Average interest rate | | | 0.23 | % | | | 3.90 | % | | | 4.16 | % | | | 4.31 | % | | | 0.00 | % | | | 4.66 | % | | | 4.24 | % | | | | |
| Variable interest rate borrowings | | | 37,430 | | | | 0 | | | | 0 | | | | 12,500 | | | | 27,500 | | | | 20,620 | | | | 98,050 | | | | 99,940 | |
| Average interest rate | | | 0.19 | % | | | 0.00 | % | | | 0.00 | % | | | 3.55 | % | | | 3.45 | % | | | 3.35 | % | | | 2.20 | % | | | | |
| | | | | | | | | | | | | | | | | | | | | | | | | | | | | | | | | |
| Interest rate derivatives | | | | | | | | | | | | | | | | | | | | | | | | | | | | | | | | |
| Interest rate swaps | | | | | | | | | | | | | | | | | | | | | | | | | | | | | | | | |
| Fixed to variable | | | 1,801 | | | | 3,714 | | | | 2,329 | | | | 2,551 | | | | 1,398 | | | | 10,767 | | | | 22,560 | | | | (1,365 | ) |
| Average pay rate (fixed) | | | 6.80 | % | | | 7.06 | % | | | 6.73 | % | | | 6.56 | % | | | 6.73 | % | | | 6.84 | % | | | 6.82 | % | | | | |
| Average receive rate (variable) | | | 2.64 | % | | | 2.20 | % | | | 2.45 | % | | | 2.43 | % | | | 2.22 | % | | | 2.18 | % | | | 2.28 | % | | | | |
(1) Includes loans held for sale, but excludes covered loans.
Interest-rate risk for First Financial’s Consolidated Balance Sheets consists of repricing, option, and basis risks. Repricing risk results from differences in the maturity, or repricing, of interest-bearing assets and liabilities. Option risk in financial instruments arises from embedded options such as loan prepayments, early withdrawal of Certificates of Deposits, and calls on investments and debt instruments that are primarily driven by third party or client behavior. Basis risk refers to the potential for changes in the underlying relationship between market rates or indices, which subsequently result in a narrowing of the net interest margin. Basis risk is also present in managed rate liabilities, such as interest-bearing checking accounts and savings accounts, where historical pricing relationships to market rates may change due to the level or directional change in market interest rates, or competitive pressures.
Table 14 — Market Risk Disclosure projects the principal maturities and yields of First Financial’s interest-bearing financial instruments at December 31, 2009, for the next five years and thereafter. Also included with each category is the fair value of the instruments. For loans, securities, and liabilities with contractual maturities, the table presents principal cash flows and related weighted-average interest rates by contractual maturities. For investment securities, including mortgage-backed securities and collateralized mortgage obligations, principal cash flows are based on estimated average lives. For loan instruments without contractual maturities, such as credit card loans, principal payments are allocated based on historical trends of payment activity. Maturities for interest-bearing liability accounts with no set maturity are estimated according to historical experience of cash flows and current expectations of client behaviors. For interest rate swaps, the table includes notional amounts and weighted-average interest rates by contractual maturity dates. The variable receiving rates are indexed to the one-month London Inter-Bank Offered Rate (LIBOR) plus a spread.
The interest-rate risk position is measured and monitored using income simulation models and economic value of equity sensitivity analysis that capture both short-term and long-term interest-rate risk exposure. Income simulation involves forecasting net interest income under a variety of interest rate scenarios including instantaneous shocks.
Presented below is the estimated impact on First Financial’s net interest income as of December 31, 2009, assuming immediate, parallel shifts in interest rates:
| | | -200 basis | | | -100 basis | | | +100 basis | | | +200 basis | |
| | | points | | | points | | | points | | | points | |
| December 31, 2009 | | | (5.28 | )% | | | (1.69 | )% | | | 4.76 | % | | | 7.53 | % |
Modeling the sensitivity of net interest income and the economic value of equity to changes in market interest rates is highly dependent on numerous assumptions incorporated into the modeling process. The models used for these measurements take into account prepayment speeds on mortgage loans, mortgage-backed securities, and consumer installment loans, as well as embedded options and cash flows of other assets and liabilities. Balance sheet growth assumptions are also included in the simulation modeling process. The model includes the effects of derivatives such as interest rate swaps. Due to the current low interest rate environment, we assumed that market interest rates would not fall below 0% over the next 12-month period for the scenarios that used the down 100 and down 200 basis point parallel shift in market interest rates. The analysis provides a framework as to what our overall sensitivity position is as of our most recent reported position.
“Asset sensitive position” refers to an increase in interest rates, primarily short-term rates, that is expected to generate higher net interest income as rates earned on our interest-earning assets would reprice upward more quickly or in greater quantities than rates paid on our interest-bearing liabilities would reprice. Conversely, “liability sensitive position” refers to an increase in short-term interest rates that is expected to generate lower net interest income as rates paid on our interest-bearing liabilities would reprice upward more quickly or in greater quantities than rates earned on our interest-earning assets.
Management strategies may impact future reporting periods, as our actual results may differ from simulated results due to the timing, magnitude, and frequency of interest rate changes, the difference between actual experience, and the characteristics assumed, as well as changes in market conditions. Market based prepayment speeds are factored into the analysis for loan and securities portfolios. Rate sensitivity for transactional deposit accounts is modeled based on both historical experience and external industry studies.
First Financial Bancorp 2009 Annual Report 23
Management’s Discussion And Analysis Of Financial Condition And Results Of Operations
Table ● 15 Contractual Obligations
| | | | | | Payments due by period | | | | |
| | | | | | Less than | | | One to three | | | Three to five | | �� | More than | |
| (Dollars in thousands) | | Total | | | one year | | | Years | | | years | | | five years | |
| Contractual Obligations | | | | | | | | | | | | | | | |
| Long-term debt obligations (including interest) | | | | | | | | | | | | | | | |
| Federal Home Loan Bank borrowings | | $ | 429,665 | | | $ | 8,424 | | | $ | 136,287 | | | $ | 17,548 | | | $ | 267,406 | |
| National Market Repurchase Agreement | | | 76,244 | | | | 2,119 | | | | 4,814 | | | | 43,701 | | | | 25,610 | |
| Junior subordinated debentures owed to unconsolidated subsidiary trusts | | | 36,318 | | | | 679 | | | | 1,361 | | | | 1,359 | | | | 32,919 | |
| Operating lease obligations | | | 34,059 | | | | 11,512 | | | | 15,591 | | | | 4,436 | | | | 2,520 | |
| Total | | $ | 576,286 | | | $ | 22,734 | | | $ | 158,053 | | | $ | 67,044 | | | $ | 328,455 | |
First Financial uses economic value of equity sensitivity analysis to understand the impact of interest rate changes on long-term cash flows, income, and capital. Economic value of equity is based on discounting the cash flows for all balance sheet instruments under different interest rate scenarios. Deposit premiums are based on external industry studies and utilizing historical experience.
Presented below is the change in First Financial’s economic value of equity position as of December 31, 2009, assuming immediate, parallel shifts in interest rates:
| | | | | | -100 basis | | | +100 basis | | | +200 basis | |
| | | Points | | | Points | | | points | | | points | |
| December 31, 2009 | | | (17.91 | )% | | | (8.13 | )% | | | 4.83 | % | | | 7.97 | % |
First Financial, utilizing interest rates primarily based upon external industry studies, models additional scenarios covering the next twelve months. Based on these scenarios, First Financial has a slightly asset sensitive interest rate risk position of a positive 1.9% when compared to a base-case scenario with interest rates held constant. Given its outlook for future interest rates, First Financial is managing its balance sheet with a bias toward asset sensitivity. First Financial’s year-end asset sensitive interest rate risk position is influenced by the acquired assets from Peoples and Irwin, the repositioning of our investment securities through the investment of portfolio paydowns into floating rate loans, and the modeling assumptions regarding deposit pricing.
OPERATIONAL RISK
As with all companies, First Financial is subject to operational risk. Operational risk is the risk of loss due to human error, inadequate or failed internal systems and controls, violations of, or noncompliance with, laws, rules, regulations, prescribed practices, or ethical standards, and external influences such as market conditions, fraudulent activities, disasters, and security risks. First Financial continuously strives to strengthen the company’s system of internal controls to ensure compliance with laws, rules, and regulations, and to improve the oversight of our operational risk.
RISK MANAGEMENT
The risk management function manages risks for the company through processes that assess the overall level of risk on a regular basis and identifies specific risks and the steps being taken to mitigate them. Managing risk at First Financial continues to evolve and has enhanced risk awareness as part of the culture of the company over time. First Financial is currently moving to a more structured Enterprise Risk Management (ERM) approach as part of this progression. ERM allows First Financial to align a variety of risk management activities within the company into a cohesive, enterprise-wide approach, focus on process-level risk management activities and strategic objectives within the risk management culture, deliberately consider risk responses and effectiveness of mitigation compared to established standards for risk appetite and tolerance, recognize and respond to the significant organizational changes that have increased the size and complexity of the organization, and consolidate information obtained through a common process into concise business performance and risk information for management and the board of directors.
First Financial uses a robust regulatory risk framework as one of the foundational components of its ERM framework. This not only allows for a common categorization across the company, but allows for a consistent and complete risk framework that can be summarized and assessed enterprise-wide. In addition, the framework is consistent with that used by the company’s regulators, allowing for additional feedback on First Financial’s ability to assess and measure risk across the organization and for management and the board of directors to identify and understand differences in assessed risk profile using this same foundation.
The goal of this framework is to implement effective risk management techniques and strategies, minimize losses, and strengthen the company’s overall performance.
CAPITAL
First Financial and its subsidiary, First Financial Bank, are subject to regulatory capital requirements administered by federal banking agencies. Capital adequacy guidelines and, additionally for banks, prompt corrective action regulations involve quantitative measures of assets, liabilities, and certain off-balance sheet items calculated under regulatory accounting practices. Capital amounts and classifications are also subject to qualitative judgments by regulators. Failure to meet minimum capital requirements can initiate regulatory action.
| | | December 31, | |
| (Dollars in thousands) | | 2009 | | | 2008 | |
| Consolidated capital calculations: | | | | | | |
| Common stock | | $ | 490,532 | | | $ | 394,169 | |
| Retained earnings | | | 301,328 | | | | 76,339 | |
| Accumulated other comprehensive loss | | | (10,487 | ) | | | (11,905 | ) |
| Treasury stock, at cost | | | (185,401 | ) | | | (188,295 | ) |
| Total common shareholder’s equity | | | 595,972 | | | | 270,308 | |
| Preferred stock | | | 79,195 | | | | 78,019 | |
| Total shareholder’s equity | | | 675,167 | | | | 348,327 | |
| Goodwill | | | (51,908 | ) | | | (28,261 | ) |
| Other intangibles | | | (7,461 | ) | | | (1,002 | ) |
| Total tangible equity | | | 615,798 | | | | 319,064 | |
| Preferred stock | | | (79,195 | ) | | | (78,019 | ) |
| Total tangible common equity | | $ | 536,603 | | | $ | 241,045 | |
| Total assets | | $ | 6,681,123 | | | $ | 3,699,142 | |
| Goodwill | | | (51,908 | ) | | | (28,261 | ) |
| Other intangibles | | | (7,461 | ) | | | (1,002 | ) |
| Total tangible assets | | $ | 6,621,754 | | | $ | 3,669,879 | |
| Tier 1 capital | | $ | 654,104 | | | $ | 356,307 | |
| Total capital | | $ | 703,202 | | | $ | 392,180 | |
| Total risk-weighted assets | | $ | 3,908,105 | | | $ | 2,878,548 | |
Average assets1 | | $ | 6,833,203 | | | $ | 3,566,051 | |
| | | | | | | | | |
| Regulatory capital: | | | | | | | | |
| Tier 1 ratio | | | 16.74 | % | | | 12.38 | % |
| Total capital ratio | | | 17.99 | % | | | 13.62 | % |
| Leverage ratio | | | 9.57 | % | | | 10.00 | % |
| | | | | | | | | |
| Other capital ratios: | | | | | | | | |
Total shareholders’ equity to ending assets | | | 10.11 | % | | | 9.42 | % |
Total common shareholders’ equity to ending assets | | | 8.92 | % | | | 7.31 | % |
Total tangible shareholders’ equity to ending tangible assets | | | 9.30 | % | | | 8.70 | % |
Total tangible common shareholders’ equity to ending tangible assets | | | 8.10 | % | | | 6.57 | % |
(1) For purposes of calculating the Leverage Ratio, certain intangible assets are excluded from average assets.
24 First Financial Bancorp 2009 Annual Report
Quantitative measures established by regulation to ensure capital adequacy require First Financial to maintain minimum amounts and ratios as defined by the regulations for Total and Tier 1 capital to risk-weighted assets and to average assets, respectively. Management believes, as of December 31, 2009, that First Financial met all capital adequacy requirements to which it was subject. At December 31, 2009, and December 31, 2008, regulatory notifications categorized First Financial as well-capitalized under the regulatory framework for prompt corrective action. To be categorized as well-capitalized, First Financial must maintain minimum Total risk-based, Tier 1 risk-based, and Tier 1 leverage ratios as set forth by regulation. There have been no conditions or events since those notifications that management believes has changed the institution’s category. For further information, see Note 16 of the Notes to Consolidated Financial Statements.
First Financial’s Tier I capital is comprised of total shareholders’ equity plus junior subordinated debentures, less unrealized gains and losses and any amounts resulting from the application of FASB ASC Topic 715, Compensation – Retirement Benefits, that is recorded within accumulated other comprehensive income (loss), intangible assets, and any valuation related to mortgage servicing rights. Total risk-based capital consists of Tier I capital plus qualifying allowance for loan and lease losses and gross unrealized gains on equity securities.
For purposes of calculating the leverage ratio, average assets represents quarterly average assets less assets not qualifying for Total risk-based capital including intangibles and non-qualifying mortgage servicing rights and allowance for loan and lease losses.
The Peoples and Irwin FDIC-assisted transactions, which were each accounted for as a business combination, resulted in the recognition of an FDIC Indemnification Asset, which represents the fair value of estimated future payments by the FDIC to First Financial for losses on covered assets. The FDIC indemnification asset, as well as covered assets, are risk-weighted at 20% for regulatory capital requirement purposes.
On October 1, 2008, First Financial filed a shelf registration on Form S-3 with the Securities and Exchange Commission (SEC). Subsequently on May 1, 2009, the company amended the shelf registration on Form S-3. This amended shelf registration statement allowed the company to raise capital from time to time, up to an aggregate of $200.0 million, through the sale of various types of securities. On June 8, 2009, the company completed a public offering of 13,800,000 shares of its common stock at a price of $7.50 per share resulting in net proceeds of $98.0 million of additional common equity after offering related costs. Subsequently on February 2, 2010, the company completed a public offering of 6,372,117 shares of it common stock at a price of $15.14 per share resulting in net proceeds of $91.2 million of additional equity after offering related costs. The offering on February 2, 2010 utilized the remaining capacity under the amended shelf registration statement.
The U.S. Department of the Treasury (Treasury), working with the Federal Reserve Board, established late in 2008 the Troubled Asset Relief Program (TARP) Capital Purchase Program (CPP), which was intended to stabilize the financial services industry. One of the components of the CPP included a $250 billion voluntary capital purchase program for certain qualified and healthy banking institutions. Pursuant to the CPP, Treasury purchased from First Financial 80,000 shares of $1,000 par value senior perpetual preferred securities at a price of $80.0 million equal to approximately 3.0% of the company’s then risk-weighted assets. Treasury also received a warrant for the purchase of common stock in the amount of 930,233 shares at a strike price of $12.90 per share. As a result of the common equity raised during the second quarter of 2009, the number of common shares eligible for purchase under the warrant agreement was reduced by 50% to 465,117 shares. Such preferred shares pay a dividend of 5% for the first five years and increase to 9% thereafter. In addition, subject to certain limited exceptions, financial institutions participating in the CPP are prohibited from (a) increasing their dividend to common shareholders and (b) conducting share repurchases without the prior approval of the Treasury. Participating financial institutions are also subject to certain limitations on executive compensation as well as other conditions. On January 21, 2009, First Financial filed a registration statement on Form S-3 with the SEC to register these securities as required by the security purchase agreement with the Treasury. On February 19, 2009, the registration statement was deemed effective by the SEC.
During 2009, the company paid dividends of $3.6 million to the Treasury on its senior perpetual preferred securities.
On February 24, 2010, First Financial Bancorp redeemed all of the $80.0 million of senior preferred shares issued to the Treasury in December 2008 under its CPP. First Financial will include in its computation of earnings per diluted common share the impact of a non-cash, deemed dividend of $0.8 million, representing the unaccreted preferred stock discount remaining on the transaction date. This one-time deemed dividend is in addition to the first quarter 2010 preferred cash dividends paid through the redemption date, totaling $1.1 million. A warrant issued in connection with the preferred shares will continue to be held by the U.S. Treasury enabling it to purchase up to 465,117 shares of First Financial common stock at an exercise price of $12.90 per share until its expiration on December 23, 2018. First Financial does not intend to repurchase the warrant at this time.
First Financial also opted to participate in the FDIC’s temporary liquidity guarantee program. The components of this program include the guarantee, until December 31, 2012, of certain newly issued senior unsecured debt issued by banks and bank holding companies through October 31, 2009 and full deposit insurance coverage for noninterest-bearing transaction accounts, regardless of size, until June 30, 2010. Participation in these programs will result in an increase in deposit insurance premiums and any debt will be subject to an insurance premium.
Total shareholders’ equity at December 31, 2009, was $675.2 million compared to total shareholders’ equity at December 31, 2008, of $348.3 million. This $326.8 million or 93.8% increase was primarily due to the Irwin-FDIC assisted transaction, which was accounted for as a business combination with an after-tax bargain purchase gain of $238.4 million.
For further detail, see the Consolidated Statements of Changes in Shareholders’ Equity.
On January 25, 2000, the board of directors authorized First Financial to repurchase the number of common shares necessary to satisfy any restricted stock awards or stock options that were granted from time to time under the 1999 Stock Incentive Option Plan for Officers and Employees and the 1999 Stock Option Plan for Non-Employee Directors. In 2007, the plan was amended to allow for the purchase of shares for general corporate purposes. Under this plan, First Financial repurchased 1,612,285 shares in 2007, 276,000 shares in 2001, and 650,110 shares in 2000. The total number of shares that can be repurchased over the remaining life of the ten-year plan may not exceed 7,507,500 shares. At December 31, 2009, 4,969,105 shares remained available for purchase under this program.
On February 26, 2002, the board of directors authorized a stock repurchase program for up to 5% of First Financial’s common shares outstanding. This program was intended to provide shares for general corporate purposes including the payment of future stock dividends. Repurchase activity under this plan was 1,053,699 shares in 2003 and 1,272,205 shares in 2002. The shares repurchased in 2003 completed this program.
On February 25, 2003, First Financial’s board of directors authorized an additional stock repurchase program to repurchase up to 5% of its shares outstanding upon the completion of the February 26, 2002, program. Under this plan, First Financial repurchased 387,715 shares in 2007, 404,000 shares in 2006, 916,000 shares in 2005, 358,999 shares in 2004, and 177,001 shares in 2003. The shares repurchased in 2007 completed this program.
On December 9, 2005, the final results for the “Modified Dutch Auction” tender offer were announced. First Financial repurchased 3,250,000 shares at a price of $19.00 per share. The “Modified Dutch Auction” tender procedure allowed shareholders to select the price within the specified range at which each shareholder was willing to sell all or a portion of his or her shares to First Financial. Based on the number of shares tendered and the prices specified by the tendering shareholders, First Financial determined the single per share price within the range that would allow it to repurchase the 3,250,000 shares.
At this time, First Financial does not plan on repurchasing any of its shares in 2010.
The dividend payout ratio was 7.4%, 109.7%, and 69.9% for the years 2009, 2008, and 2007, respectively. The dividend payout ratio is continually reviewed by management and the board of directors for consistency with First Financial’s overall capital plan and compliance with applicable regulatory limitations.
In January of 2009, First Financial announced the board of directors’ decision to reduce its quarterly cash dividend to common shareholders in a continued effort to further strengthen First Financial’s capital level. The quarterly cash dividend was reduced to $0.10 per share from the previous $0.17 per share and is consistent with the board of directors’ long-term target dividend payout range of between 40% and 60% of normalized earnings available to common shareholders.
First Financial has consistently maintained regulatory capital ratios at or above the level that results in its classification as “well-capitalized.” For further detail on capital ratios, see Note 16 of the Notes to Consolidated Financial Statements.
CRITICAL ACCOUNTING POLICIES
First Financial’s Consolidated Financial Statements are prepared based on the application of accounting policies, the most significant of which are described in Note 1 of the Notes to Consolidated Financial Statements. These policies require the reliance on estimates and assumptions. Changes in underlying factors, assumptions, or estimates in any of these areas could have a material impact on First Financial’s future financial condition and results of operations. In management’s opinion, some of these areas have a more significant impact than others on First Financial’s financial reporting. For First Financial, these areas currently include accounting for the allowance for loan and lease losses, income taxes, covered loans, FDIC indemnification asset, pension, and goodwill and other intangible assets. This annual report provides management’s analysis of the allowance for loan and lease losses on pages 16 through 18, income taxes on page 14, covered loans on pages 15 and 16, and pension plan on page 22.
First Financial Bancorp 2009 Annual Report 25
Management’s Discussion And Analysis Of Financial Condition And Results Of Operations
Allowance for Loan and Lease Losses. First Financial maintains the allowance for loan and lease losses at a level sufficient to absorb potential losses inherent in the loan portfolio given the conditions at the time. Management determines the adequacy of the allowance based on periodic evaluations of the loan portfolio and other factors. These evaluations are inherently subjective as they require material estimates, all of which may be susceptible to significant change, including, among others:
| | · | Exposure at date of default, |
| | · | Amounts and timing of expected future cash flows on impaired loans, |
| | · | Historical loss exposure, and |
| | · | The effects of changes in economic conditions that may not be reflected in historical results. |
To the extent actual outcomes differ from management’s estimates, additional provision for credit losses may be required that would impact First Financial’s operating results. Pages 16 through 18 of this annual report provide management’s analysis of the allowance for loan and lease losses.
Covered loans. Loans acquired in FDIC-assisted transactions are covered under loss sharing agreements. Covered loans were recorded at fair value at acquisition. Fair values for covered loans were based on a discounted cash flow methodology that considered various factors including the type of loan and related collateral, classification status, fixed or variable interest rate, term of loan and whether or not the loan was amortizing, and a discount rate reflecting the Company’s assessment of risk inherent in the cash flow estimates. Covered loans were grouped together according to similar characteristics and were treated in the aggregate when applying various valuation techniques.
FDIC indemnification asset. FDIC indemnification assets result from the loss share agreements in the assisted transactions and are measured separately from the related covered assets as they are not contractually embedded in the assets and are not transferable with the assets should First Financial choose to dispose of them. Fair value is estimated using projected cash flows related to the loss sharing agreements based on the expected reimbursements for losses and the applicable loss sharing percentages. These expected reimbursements do not include reimbursable amounts related to future covered expenditures. These cash flows are discounted to reflect the uncertainty of the timing and receipt of the loss sharing reimbursement from the FDIC.
Goodwill. Goodwill arising from business acquisitions represents the value attributable to unidentifiable intangible elements in the business acquired. FASB ASC Topic 350, Intangibles – Goodwill and Other, requires goodwill to be tested for impairment on an annual basis and more frequently in certain circumstances. At least annually, First Financial reviews goodwill for impairment using both income and asset based approaches. The income-based approach utilizes a multiple of earnings method in which First Financial’s annualized earnings are compared to equity to provide an implied book-value-to-earnings multiple. First Financial then compares the implied multiple to current marketplace earnings multiples for which banks are being traded. An implied multiple less than current marketplace earnings multiples is an indication of possible goodwill impairment. The asset-based approach uses the discounted flows of First Financial’s assets and liabilities, inclusive of goodwill, to determine an implied fair value. This input is used to calculate the fair value of the company, including goodwill, and is compared to the company’s book value. An implied fair value that exceeds the company’s book value is an indication that goodwill is not impaired. If First Financial’s book value exceeds the implied fair value, an impairment loss equal to the excess amount would be recognized. Based on First Financial’s analysis at year-end 2009, there have been no impairment charges required.
Pension. First Financial sponsors a non-contributory defined-benefit pension plan covering substantially all employees. Accounting for the pension plan involves material estimates regarding future plan obligations and investment returns on plan assets. Significant assumptions used in the pension plan include the discount rate, expected return on plan assets, and the rate of compensation increase. First Financial determines the discount rate assumption using published Corporate Bond Indices, projected cash flows of the pension plan, and comparisons to external industry surveys for reasonableness. The expected long-term return on plan assets is based on the composition of plan assets and a consensus of estimates of expected future returns from similarly managed portfolios while the rate of compensation increase is compared to historical increases for plan participants. Changes in these assumptions can have a material impact on the amount of First Financial’s future pension obligations, on the funded status of the plan and can impact First Financial’s operating results. Page 22 of this annual report provides management’s analysis of First Financial’s pension plan.
Income Taxes. First Financial evaluates and assesses the relative risks and appropriate tax treatment of transactions after considering statutes, regulations, judicial precedent and other information and maintains tax accruals consistent with its evaluation of these relative risks. Changes to the estimate of accrued taxes occur periodically due to changes in tax rates, interpretations of tax laws, the status of examinations being conducted by taxing authorities and changes to statutory, judicial, and regulatory guidance that impact the relative risks of tax positions. These changes, when they occur, can affect deferred taxes and accrued taxes as well as the current period’s income tax expense and can be material to First Financial’s operating results. Page 14 of this annual report provides management’s analysis of First Financial’s income taxes.
FORWARD-LOOKING STATEMENTS
Certain statements contained in this report that are not statements of historical fact constitute forward-looking statements within the meaning of the Private Securities Litigation Reform Act (the Act). In addition, certain statements in future filings by First Financial with the Securities and Exchange Commission, in press releases, and in oral and written statements made by or with the approval of First Financial which are not statements of historical fact constitute forward-looking statements within the meaning of the Act.
Examples of forward-looking statements include, but are not limited to, projections of revenues, income or loss, earnings or loss per share, the payment or non-payment of dividends, capital structure and other financial items, statements of plans and objectives of First Financial or its management or board of directors, and statements of future economic performances and statements of assumptions underlying such statements. Words such as “believes,” “anticipates,” “intends,” and other similar expressions are intended to identify forward-looking statements but are not the exclusive means of identifying such statements.
Management’s analysis contains forward-looking statements that are provided to assist in the understanding of anticipated future financial performance. However, such performance involves risk and uncertainties that may cause actual results to differ materially. Factors that could cause actual results to differ from those discussed in the forward-looking statements include, but are not limited to: management’s ability to effectively execute its business plan; the risk that the strength of the United States economy in general and the strength of the local economies in which we conduct operations may continue to deteriorate resulting in, among other things, a further deterioration in credit quality or a reduced demand for credit, including the resultant effect on our loan portfolio, allowance for loan and lease losses and overall financial performance; the ability of financial institutions to access sources of liquidity at a reasonable cost; the impact of recent upheaval in the financial markets and the effectiveness of domestic and international governmental actions taken in response, such as the U.S. Treasury’s TARP and the FDIC’s Temporary Liquidity Guarantee Program, and the effect of such governmental actions on us, our competitors and counterparties, financial markets generally and availability of credit specifically, and the U.S. and international economies, including potentially higher FDIC premiums arising from participation in the Temporary Liquidity Guarantee Program or from increased payments from FDIC insurance funds as a result of depository institution failures; the effects of and changes in policies and laws of regulatory agencies, inflation and interest rates; technology changes; mergers and acquisitions, including costs or difficulties related to the integration of acquired companies, including our ability to successfully integrate the branches of Peoples and Irwin which were acquired out of FDIC receivership; the risk that exploring merger and acquisition opportunities may detract from management’s time and ability to successfully manage our company; expected cost savings in connection with the consolidation of recent acquisitions may not be fully realized or realized within the expected time frames, and deposit attrition, customer loss and revenue loss following completed acquisitions may be greater than expected; our ability to increase market share and control expenses; the effect of changes in accounting policies and practices, as may be adopted by the regulatory agencies as well as the Financial Accounting Standards Board and the SEC; adverse changes in the securities and debt markets; our success in recruiting and retaining the necessary personnel to support business growth and expansion and maintain sufficient expertise to support increasingly complex products and services; monetary and fiscal policies of the Board of Governors of the Federal Reserve System (Federal Reserve) and the U.S. government and other governmental initiatives affecting the financial services industry; our ability to manage loan delinquency and charge-off rates and changes in estimation of the adequacy of the allowance for loan losses; the costs and effects of litigation and of unexpected or adverse outcomes in such litigation; the uncertainties arising from our participation in the TARP, including impacts on employee recruitment and retention and other business practices; and our success at managing the risks involved in the foregoing.
Such forward-looking statements speak only as of the date on which such statements are made, and First Financial undertakes no obligation to update any forward-looking statement to reflect events or circumstances after the date on which such statement is made to reflect the occurrence of unanticipated events.
26 First Financial Bancorp 2009 Annual Report
Statistical Information (Unaudited)
| | | 2009 | | | 2008 | | | 2007 | |
| | | Balance | | | Interest | | | Yield | | | Balance | | | Interest | | | Yield | | | Balance | | | Interest | | | Yield | |
| Earning assets | | Daily average balances and interest rates (Tax equivalent basis; dollars in thousands): | |
Loans (1), (4) | | | | | | | | | | | | | | | | | | | | | | | | | | | |
Commercial(2) | | $ | 841,088 | | | $ | 39,181 | | | | 4.66 | % | | $ | 803,945 | | | $ | 46,589 | | | | 5.80 | % | | $ | 739,884 | | | $ | 59,236 | | | | 8.01 | % |
| Real estate – construction | | | 254,746 | | | | 9,673 | | | | 3.80 | % | | | 188,763 | | | | 10,096 | | | | 5.35 | % | | | 128,208 | | | | 10,033 | | | | 7.83 | % |
| Real estate – commercial | | | 945,456 | | | | 53,388 | | | | 5.65 | % | | | 771,014 | | | | 49,373 | | | | 6.40 | % | | | 669,370 | | | | 46,441 | | | | 6.94 | % |
| Real estate – residential | | | 351,376 | | | | 18,608 | | | | 5.30 | % | | | 489,093 | | | | 27,618 | | | | 5.65 | % | | | 581,764 | | | | 33,053 | | | | 5.68 | % |
| Installment and other consumer | | | 427,505 | | | | 23,501 | | | | 5.50 | % | | | 408,561 | | | | 26,626 | | | | 6.52 | % | | | 427,051 | | | | 34,215 | | | | 8.01 | % |
Lease financing(2) | | | 31 | | | | 2 | | | | 6.45 | % | | | 170 | | | | 19 | | | | 11.18 | % | | | 621 | | | | 66 | | | | 10.63 | % |
| Total loans, excluding covered loans | | | 2,820,202 | | | | 144,353 | | | | 5.12 | % | | | 2,661,546 | | | | 160,321 | | | | 6.02 | % | | | 2,546,898 | | | | 183,044 | | | | 7.19 | % |
| Covered loans and indemnification asset | | | 710,230 | | | | 58,271 | | | | 8.20 | % | | | 0 | | | | 0 | | | | N/M | | | | 0 | | | | 0 | | | | N/M | |
Investment securities(3) | | | | | | | | | | | | | | | | | | | | | | | | | | | | | | | | | | | | |
| Taxable | | | 638,685 | | | | 29,376 | | | | 4.60 | % | | | 400,957 | | | | 19,954 | | | | 4.98 | % | | | 285,645 | | | | 14,961 | | | | 5.24 | % |
Tax-exempt (2) | | | 29,158 | | | | 2,285 | | | | 7.84 | % | | | 51,964 | | | | 4,205 | | | | 8.09 | % | | | 72,158 | | | | 5,449 | | | | 7.55 | % |
Total investment securities (3) | | | 667,843 | | | | 31,661 | | | | 4.74 | % | | | 452,921 | | | | 24,159 | | | | 5.33 | % | | | 357,803 | | | | 20,410 | | | | 5.70 | % |
| Interest-bearing deposits with other banks | | | 151,198 | | | | 208 | | | | 0.14 | % | | | 0 | | | | 0 | | | | N/M | | | | 0 | | | | 0 | | | | N/M | |
| Federal funds sold | | | 0 | | | | 0 | | | | N/M | | | | 18,603 | | | | 633 | | | | 3.40 | % | | | 104,165 | | | | 5,269 | | | | 5.06 | % |
| Total earning assets | | | 4,349,473 | | | | 234,493 | | | | 5.39 | % | | | 3,133,070 | | | | 185,113 | | | | 5.91 | % | | | 3,008,866 | | | | 208,723 | | | | 6.94 | % |
| | | | | | | | | | | | | | | | | | | | | | | | | | | | | | | | | | | | | |
| Nonearning assets | | | | | | | | | | | | | | | | | | | | | | | | | | | | | | | | | | | | |
| Allowance for loan and lease losses | | | (42,553 | ) | | | | | | | | | | | (29,391 | ) | | | | | | | | | | | (28,263 | ) | | | | | | | | |
| Cash and due from banks | | | 133,611 | | | | | | | | | | | | 86,265 | | | | | | | | | | | | 89,780 | | | | | | | | | |
| Accrued interest and other assets | | | 300,983 | | | | | | | | | | | | 236,331 | | | | | | | | | | | | 239,657 | | | | | | | | | |
| Total assets | | $ | 4,741,514 | | | | | | | | | | | $ | 3,426,275 | | | | | | | | | | | $ | 3,310,040 | | | | | | | | | |
| | | | | | | | | | | | | | | | | | | | | | | | | | | | | | | | | | | | | |
| Interest-bearing liabilities | | | | | | | | | | | | | | | | | | | | | | | | | | | | | | | | | | | | |
| Deposits | | | | | | | | | | | | | | | | | | | | | | | | | | | | | | | | | | | | |
| Interest-bearing demand | | $ | 862,730 | | | | 3,097 | | | | 0.36 | % | | $ | 608,708 | | | | 5,075 | | | | 0.83 | % | | $ | 623,110 | | | | 12,513 | | | | 2.01 | % |
| Savings | | | 771,202 | | | | 3,461 | | | | 0.45 | % | | | 610,875 | | | | 5,629 | | | | 0.92 | % | | | 578,579 | | | | 11,016 | | | | 1.90 | % |
| Time | | | 1,537,564 | | | | 41,022 | | | | 2.67 | % | | | 1,180,553 | | | | 47,293 | | | | 4.01 | % | | | 1,229,297 | | | | 55,655 | | | | 4.53 | % |
| Total interest-bearing deposits | | | 3,171,496 | | | | 47,580 | | | | 1.50 | % | | | 2,400,136 | | | | 57,997 | | | | 2.42 | % | | | 2,430,986 | | | | 79,184 | | | | 3.26 | % |
| Borrowed funds | | | | | | | | | | | | | | | | | | | | | | | | | | | | | | | | | | | | |
| Short-term borrowings | | | 244,014 | | | | 1,318 | | | | 0.54 | % | | | 222,143 | | | | 4,828 | | | | 2.17 | % | | | 92,709 | | | | 4,232 | | | | 4.56 | % |
| Long-term debt | | | 224,475 | | | | 7,145 | | | | 3.18 | % | | | 78,776 | | | | 2,892 | | | | 3.67 | % | | | 57,458 | | | | 2,099 | | | | 3.65 | % |
| Other long-term debt | | | 20,620 | | | | 1,202 | | | | 5.83 | % | | | 20,620 | | | | 1,386 | | | | 6.72 | % | | | 28,190 | | | | 2,427 | | | | 8.61 | % |
| Total borrowed funds | | | 489,109 | | | | 9,665 | | | | 1.98 | % | | | 321,539 | | | | 9,106 | | | | 2.83 | % | | | 178,357 | | | | 8,758 | | | | 4.91 | % |
| Total interest-bearing liabilities | | | 3,660,605 | | | | 57,245 | | | | 1.56 | % | | | 2,721,675 | | | | 67,103 | | | | 2.47 | % | | | 2,609,343 | | | | 87,942 | | | | 3.37 | % |
| | | | | | | | | | | | | | | | | | | | | | | | | | | | | | | | | | | | | |
| Noninterest-bearing liabilities | | | | | | | | | | | | | | | | | | | | | | | | | | | | | | | | | | | | |
| Noninterest-bearing demand deposits | | | 539,336 | | | | | | | | | | | | 397,267 | | | | | | | | | | | | 397,918 | | | | | | | | | |
| Other liabilities | | | 67,780 | | | | | | | | | | | | 27,624 | | | | | | | | | | | | 22,504 | | | | | | | | | |
| Shareholders’ equity | | | 473,793 | | | | | | | | | | | | 279,709 | | | | | | | | | | | | 280,275 | | | | | | | | | |
Total liabilities and shareholders’ equity | | $ | 4,741,514 | | | | | | | | | | | $ | 3,426,275 | | | | | | | | | | | $ | 3,310,040 | | | | | | | | | |
Net interest income and interest rate spread (fully tax equivalent) | | | | | | $ | 177,248 | | | | 3.83 | % | | | | | | $ | 118,010 | | | | 3.44 | % | | | | | | $ | 120,781 | | | | 3.57 | % |
Net interest margin (fully tax equivalent) | | | | | | | | | | | 4.08 | % | | | | | | | | | | | 3.77 | % | | | | | | | | | | | 4.01 | % |
| Interest income and yield | | | | | | $ | 238,228 | | | | 5.36 | % | | | | | | $ | 183,305 | | | | 5.85 | % | | | | | | $ | 206,442 | | | | 6.86 | % |
| Interest expense and rate | | | | | | | 57,245 | | | | 1.56 | % | | | | | | | 67,103 | | | | 2.47 | % | | | | | | | 87,942 | | | | 3.37 | % |
| Net interest income and spread | | | | | | $ | 175,983 | | | | 3.80 | % | | | | | | $ | 116,202 | | | | 3.38 | % | | | | | | $ | 118,500 | | | | 3.49 | % |
| Net interest margin | | | | | | | | | | | 4.05 | % | | | | | | | | | | | 3.71 | % | | | | | | | | | | | 3.94 | % |
| (1) | Nonaccrual loans are included in average loan balance and loan fees are included in interest income. |
| (2) | Interest income on tax-exempt investments and on certain tax-exempt loans and leases has been adjusted to a tax equivalent basis using a 35.00% tax rate. |
| (3) | Includes investment securities held-to-maturity, investment securities available-for-sale, investment securities trading, and other investments. |
| (4) | Includes loans held-for-sale. |
N/M=Not meaningful
First Financial Bancorp 2009 Annual Report 27
Management’s Report On Internal Control Over Financial Reporting
First Financial’s management is responsible for establishing and maintaining adequate internal control over financial reporting. First Financial’s internal control over financial reporting is a process designed under the supervision of First Financial’s chief executive officer and chief financial officer to provide reasonable assurance regarding the reliability of financial reporting and the preparation of financial statements for external purposes in accordance with generally accepted accounting principles. Any system of internal control, no matter how well designed, has inherent limitations, including the possibility that a control can be circumvented or overridden and misstatements due to error or fraud may occur and not be detected. Also, because of changes in conditions, internal control effectiveness may vary over time. Accordingly, even an effective system of internal control will provide only reasonable assurance with respect to financial statement preparation. As of December 31, 2009, First Financial’s management, including the chief executive officer and the chief financial officer, evaluated the effectiveness of First Financial’s internal controls over financial reporting, using as its framework for that evaluation the Internal Control – Integrated Framework published by the Committee of Sponsoring Organizations (COSO) of the Treadway Commission. Based upon that evaluation, management believes that First Financial’s internal control over financial reporting is effective based on those criteria.
Ernst & Young LLP, the independent registered public accounting firm that audited the consolidated financial statements included in this Form 10-K, has issued an attestation report on First Financial’s internal control over financial reporting as of December 31, 2009. The report, which expresses an unqualified opinion on First Financial’s internal control over financial reporting as of December 31, 2009, is included in the information that follows under the heading “Report on Internal Control Over Financial Reporting.”
| |
| Claude E. Davis | J. Franklin Hall |
| President & CEO | Executive Vice President & CFO |
| March 16, 2010 | March 16, 2010 |
28 First Financial Bancorp 2009 Annual Report
Report Of Independent Registered Public Accounting Firm
Report On Internal Control Over Financial Reporting
The Board of Directors and Shareholders of First Financial Bancorp
We have audited First Financial Bancorp’s Internal Control Over Financial Reporting as of December 31, 2009, based on criteria established in Internal Control – Integrated Framework issued by the Committee of Sponsoring Organizations of the Treadway Commission (the COSO criteria). First Financial Bancorp’s management is responsible for maintaining effective internal control over financial reporting, and for its assessment about the effectiveness of internal control over financial reporting included in the accompanying Management’s Report On Internal Control Over Financial Reporting. Our responsibility is to express an opinion on the company’s internal control over financial reporting based on our audit.
We conducted our audit in accordance with the standards of the Public Company Accounting Oversight Board (United States). Those standards require that we plan and perform the audit to obtain reasonable assurance about whether effective internal control over financial reporting was maintained in all material respects. Our audit included obtaining an understanding of internal control over financial reporting, assessing the risk that a material weakness exists, testing and evaluating the design and operating effectiveness of internal control based on the assessed risk, and performing such other procedures as we considered necessary in the circumstances. We believe that our audit provides a reasonable basis for our opinion.
A company’s internal control over financial reporting is a process designed to provide reasonable assurance regarding the reliability of financial reporting and the preparation of financial statements for external purposes in accordance with generally accepted accounting principles. A company’s internal control over financial reporting includes those policies and procedures that (1) pertain to the maintenance of records that, in reasonable detail, accurately and fairly reflect the transactions and dispositions of the assets of the company; (2) provide reasonable assurance that transactions are recorded as necessary to permit preparation of financial statements in accordance with generally accepted accounting principles, and that receipts and expenditures of the company are being made only in accordance with authorizations of management and directors of the company; and (3) provide reasonable assurance regarding prevention or timely detection of unauthorized acquisition, use, or disposition of the company’s assets that could have a material effect on the financial statements.
Because of its inherent limitations, internal control over financial reporting may not prevent or detect misstatements. Also, projections of any evaluation of effectiveness to future periods are subject to the risk that controls may become inadequate because of changes in conditions, or that the degree of compliance with the policies or procedures may deteriorate.
In our opinion, First Financial Bancorp maintained, in all material respects, effective internal control over financial reporting as of December 31, 2009, based on the COSO criteria.
We also have audited, in accordance with the standards of the Public Company Accounting Oversight Board (United States), the consolidated balance sheets of First Financial Bancorp as of December 31, 2009, and 2008, and the related consolidated statements of income, changes in shareholders’ equity, and cash flows for each of the three years in the period ended December 31, 2009, of First Financial Bancorp and our report dated March 16, 2010 expressed an unqualified opinion thereon.
Cincinnati, Ohio March 16, 2010 | |
Report Of Independent Registered Public Accounting Firm
Report On Consolidated Financial Statements
The Board of Directors and Shareholders of First Financial Bancorp
We have audited the accompanying consolidated balance sheets of First Financial Bancorp and subsidiaries (the Company) as of December 31, 2009 and 2008, and the related consolidated statements of income, changes in shareholders’ equity, and cash flows for each of the three years in the period ended December 31, 2009. These financial statements are the responsibility of First Financial Bancorp’s management. Our responsibility is to express an opinion on these financial statements based on our audits.
We conducted our audits in accordance with the standards of the Public Company Accounting Oversight Board (United States). Those standards require that we plan and perform the audit to obtain reasonable assurance about whether the financial statements are free of material misstatement. An audit includes examining, on a test basis, evidence supporting the amounts and disclosures in the financial statements. An audit also includes assessing the accounting principles used and significant estimates made by management, as well as evaluating the overall financial statement presentation. We believe that our audits provide a reasonable basis for our opinion.
In our opinion, the financial statements referred to above present fairly, in all material respects, the consolidated financial position of First Financial Bancorp and subsidiaries at December 31, 2009, and 2008, and the consolidated results of their operations and their cash flows for each of the three years in the period ended December 31, 2009, in conformity with U.S. generally accepted accounting principles.
We also have audited, in accordance with the standards of the Public Company Accounting Oversight Board (United States), First Financial Bancorp’s internal control over financial reporting as of December 31, 2009, based on criteria established in Internal Control – Integrated Framework issued by the Committee of Sponsoring Organizations of the Treadway Commission and our report dated March 16, 2010 expressed an unqualified opinion thereon.
Cincinnati, Ohio March 16, 2010 | |
First Financial Bancorp 2009 Annual Report
29
Consolidated Balance Sheets
| | | December 31, | |
| (Dollars in thousands) | | 2009 | | | 2008 | |
| Assets | | | | | | |
| Cash and due from banks | | $ | 344,150 | | | $ | 100,935 | |
| Interest-bearing deposits with other banks | | | 262,017 | | | | 0 | |
| Investment securities held-to-maturity | | | | | | | | |
| (market value of $18,590 at December 31, 2009; $5,135 at December 31, 2008) | | | 18,115 | | | | 4,966 | |
| Investment securities available-for-sale, at market value | | | | | | | | |
| (cost of $454,953 at December 31, 2009; $648,845 at December 31, 2008) | | | 471,002 | | | | 659,756 | |
| Investment securities trading | | | 200 | | | | 61 | |
| Other investments | | | 89,830 | | | | 27,976 | |
| Loans held for sale | | | 8,052 | | | | 3,854 | |
| Loans | | | | | | | | |
| Commercial | | | 798,622 | | | | 807,720 | |
| Real estate – construction | | | 253,223 | | | | 232,989 | |
| Real estate – commercial | | | 1,079,628 | | | | 846,673 | |
| Real estate – residential | | | 321,047 | | | | 383,599 | |
| Installment | | | 82,989 | | | | 98,581 | |
| Home equity | | | 328,940 | | | | 286,110 | |
| Credit card | | | 29,027 | | | | 27,538 | |
| Lease financing | | | 14 | | | | 50 | |
| Total loans, excluding covered loans | | | 2,893,490 | | | | 2,683,260 | |
| Covered loans | | | 1,929,549 | | | | 0 | |
| Total loans | | | 4,823,039 | | | | 2,683,260 | |
| Less | | | | | | | | |
| Allowance for loan and lease losses | | | 59,311 | | | | 35,873 | |
| Net loans | | | 4,763,728 | | | | 2,647,387 | |
| Premises and equipment | | | 107,351 | | | | 84,105 | |
| Goodwill | | | 51,908 | | | | 28,261 | |
| Other intangibles | | | 7,461 | | | | 1,002 | |
| FDIC indemnification asset | | | 316,040 | | | | 0 | |
| Accrued interest and other assets | | | 241,269 | | | | 140,839 | |
| Total assets | | $ | 6,681,123 | | | $ | 3,699,142 | |
| | | | | | | | | |
| Liabilities | | | | | | | | |
| Deposits | | | | | | | | |
| Interest-bearing | | $ | 1,356,249 | | | $ | 636,945 | |
| Savings | | | 1,010,469 | | | | 583,081 | |
| Time | | | 2,229,400 | | | | 1,150,208 | |
| Total interest-bearing deposits | | | 4,596,118 | | | | 2,370,234 | |
| Noninterest-bearing | | | 754,522 | | | | 413,283 | |
| Total deposits | | | 5,350,640 | | | | 2,783,517 | |
| Short-term borrowings | | | | | | | | |
| Federal funds purchased and securities sold under agreements to repurchase | | | 37,430 | | | | 147,533 | |
| Federal Home Loan Bank | | | 0 | | | | 150,000 | |
| Other | | | 0 | | | | 57,000 | |
| Total short-term borrowings | | | 37,430 | | | | 354,533 | |
| Long-term debt | | | 404,716 | | | | 148,164 | |
| Other long-term debt | | | 20,620 | | | | 20,620 | |
| Accrued interest and other liabilities | | | 192,550 | | | | 43,981 | |
| Total liabilities | | | 6,005,956 | | | | 3,350,815 | |
| | | | | | | | | |
| Shareholders’ equity | | | | | | | | |
| Preferred stock – $1,000 par value | | | | | | | | |
| Authorized – 80,000 shares | | | | | | | | |
| Outstanding – 80,000 shares in 2009 and 2008 | | | 79,195 | | | | 78,019 | |
| Common stock – no par value | | | | | | | | |
| Authorized – 160,000,000 shares | | | | | | | | |
| Issued – 62,358,614 in 2009 and 48,558,614 shares in 2008 | | | 490,532 | | | | 394,169 | |
| Retained earnings | | | 301,328 | | | | 76,339 | |
| Accumulated other comprehensive loss | | | (10,487 | ) | | | (11,905 | ) |
| Treasury stock, at cost, 10,924,793 shares in 2009 and 11,077,413 shares in 2008 | | | (185,401 | ) | | | (188,295 | ) |
| Total shareholders’ equity | | | 675,167 | | | | 348,327 | |
| Total liabilities and shareholders’ equity | | $ | 6,681,123 | | | $ | 3,699,142 | |
See Notes to Consolidated Financial Statements.
30 First Financial Bancorp 2009 Annual Report
Consolidated Statements Of Income
| | | Year ended December 31, | |
| (Dollars in thousands except per share data) | | 2009 | | | 2008 | | | 2007 | |
| Interest income | | | | | | | | | |
| Loans, including fees | | $ | 195,917 | | | $ | 159,985 | | | $ | 182,670 | |
| Investment securities | | | | | | | | | | | | |
| Taxable | | | 29,376 | | | | 19,954 | | | | 14,961 | |
| Tax-exempt | | | 1,492 | | | | 2,733 | | | | 3,542 | |
| Total investment securities interest | | | 30,868 | | | | 22,687 | | | | 18,503 | |
| Other earning assets | | | 6,443 | | | | 633 | | | | 5,269 | |
| Total interest income | | | 233,228 | | | | 183,305 | | | | 206,442 | |
| Interest expense | | | | | | | | | | | | |
| Deposits | | | 47,580 | | | | 57,997 | | | | 79,184 | |
| Short-term borrowings | | | 1,318 | | | | 4,828 | | | | 4,232 | |
| Long-term borrowings | | | 7,145 | | | | 2,892 | | | | 2,099 | |
| Subordinated debentures and capital securities | | | 1,202 | | | | 1,386 | | | | 2,427 | |
| Total interest expense | | | 57,245 | | | | 67,103 | | | | 87,942 | |
| Net interest income | | | 175,983 | | | | 116,202 | | | | 118,500 | |
| Provision for loan and lease losses | | | 56,084 | | | | 19,410 | | | | 7,652 | |
| Net interest income after provision for loan and lease losses | | | 119,899 | | | | 96,792 | | | | 110,848 | |
| | | | | | | | | | | | | |
| Noninterest income | | | | | | | | | | | | |
| Service charges on deposit accounts | | | 19,662 | | | | 19,658 | | | | 20,766 | |
| Trust and wealth management fees | | | 13,465 | | | | 17,411 | | | | 18,396 | |
| Bankcard income | | | 5,961 | | | | 5,653 | | | | 5,251 | |
| Net gains from sales of loans | | | 1,196 | | | | 1,104 | | | | 844 | |
| Gain on sale of merchant payment processing portfolio | | | 0 | | | | 0 | | | | 5,501 | |
| Gain on sale of mortgage servicing rights | | | 0 | | | | 0 | | | | 1,061 | |
| Gains on sales of investment securities | | | 3,349 | | | | 1,585 | | | | 367 | |
| Gains on acquisition | | | 379,086 | | | | 0 | | | | 0 | |
| Income (loss) on preferred securities | | | 139 | | | | (3,738 | ) | | | 0 | |
| Other | | | 18,449 | | | | 10,076 | | | | 11,402 | |
| Total noninterest income | | | 441,307 | | | | 51,749 | | | | 63,588 | |
| | | | | | | | | | | | | |
| Noninterest expenses | | | | | | | | | | | | |
| Salaries and employee benefits | | | 86,068 | | | | 66,862 | | | | 69,891 | |
| Pension settlement charges | | | 0 | | | | 0 | | | | 2,222 | |
| Net occupancy | | | 16,202 | | | | 10,635 | | | | 10,861 | |
| Furniture and equipment | | | 8,054 | | | | 6,708 | | | | 6,761 | |
| Data processing | | | 3,475 | | | | 3,238 | | | | 3,498 | |
| Marketing | | | 3,494 | | | | 2,548 | | | | 2,441 | |
| Communication | | | 3,246 | | | | 2,859 | | | | 3,230 | |
| Professional services | | | 6,032 | | | | 3,463 | | | | 4,142 | |
| State intangible tax | | | 2,508 | | | | 2,506 | | | | 2,070 | |
| FDIC expense | | | 6,847 | | | | 363 | | | | 330 | |
| Other | | | 34,712 | | | | 15,994 | | | | 15,301 | |
| Total noninterest expenses | | | 170,638 | | | | 115,176 | | | | 120,747 | |
| | | | | | | | | | | | | |
| Income before income tax expense | | | 390,568 | | | | 33,365 | | | | 53,689 | |
| Income tax expense | | | 144,022 | | | | 10,403 | | | | 18,008 | |
| Net income | | | 246,546 | | | | 22,962 | | | | 35,681 | |
| | | | | | | | | | | | | |
| Dividends on preferred stock | | | 3,578 | | | | 0 | | | | 0 | |
| Income available to common shareholders | | $ | 242,968 | | | $ | 22,962 | | | $ | 35,681 | |
| | | | | | | | | | | | | |
| Earnings per common share: | | | | | | | | | | | | |
| Basic | | $ | 5.40 | | | $ | 0.62 | | | $ | 0.93 | |
| Diluted | | $ | 5.33 | | | $ | 0.61 | | | $ | 0.93 | |
| Average common shares outstanding – basic | | | 45,028,640 | | | | 37,112,065 | | | | 38,455,084 | |
| Average common shares outstanding – diluted | | | 45,556,868 | | | | 37,484,198 | | | | 38,459,138 | |
See Notes to Consolidated Financial Statements.
First Financial Bancorp 2009 Annual Report 31
Consolidated Statements Of Cash Flows
| | | Year ended December 31, | |
| (Dollars in thousands) | | 2009 | | | 2008 | | | 2007 | |
| Operating activities | | | | | | | | | |
| Net income | | $ | 246,546 | | | $ | 22,962 | | | $ | 35,681 | |
| Adjustments to reconcile net income to net cash provided by operating activities | | | | | | | | | | | | |
| Provision for loan and lease losses | | | 56,084 | | | | 19,410 | | | | 7,652 | |
| Provision for depreciation and amortization | | | 8,626 | | | | 6,677 | | | | 7,949 | |
| Stock-based compensation expense | | | 2,799 | | | | 2,444 | | | | 1,384 | |
| Pension expense | | | 914 | | | | 1,390 | | | | 4,541 | |
| Net amortization of premiums and accretion of discounts on investment securities | | | 1,148 | | | | 179 | | | | 131 | |
| Deferred income taxes | | | 127,995 | | | | (4,210 | ) | | | (3,338 | ) |
| Gains on sales of investment securities | | | (3,349 | ) | | | (1,585 | ) | | | (367 | ) |
| (Income) losses on trading securities | | | (139 | ) | | | 3,738 | | | | 0 | |
| Gain on acquisition | | | (379,086 | ) | | | 0 | | | | 0 | |
| Originations of loans held for sale | | | (141,697 | ) | | | (84,199 | ) | | | (68,027 | ) |
| Net gains from sales of loans held for sale | | | (1,197 | ) | | | (1,104 | ) | | | (844 | ) |
| Proceeds from sale of loans held for sale | | | 138,633 | | | | 82,553 | | | | 76,564 | |
| Increase in cash surrender value of life insurance | | | (3,586 | ) | | | (3,598 | ) | | | (4,105 | ) |
| (Increase) decrease in interest receivable | | | (7,424 | ) | | | 4,297 | | | | (869 | ) |
| (Increase) decrease in prepaid expenses | | | (17,721 | ) | | | 240 | | | | (435 | ) |
| Increase (decrease) in accrued expenses | | | 25,974 | | | | (3,134 | ) | | | 706 | |
| (Decrease) increase in interest payable | | | (1,274 | ) | | | (2,642 | ) | | | 1,920 | |
| Contribution to pension plan | | | (30,800 | ) | | | 0 | | | | 0 | |
| Other | | | 17,007 | | | | (1,764 | ) | | | 15,023 | |
| Net cash provided by operating activities | | | 39,453 | | | | 41,654 | | | | 73,566 | |
| Investing activities | | | | | | | | | | | | |
| Proceeds from sales of investment securities available-for-sale | | | 152,751 | | | | 1,124 | | | | 392 | |
| Proceeds from calls, paydowns, and maturities of investment securities available-for-sale | | | 185,308 | | | | 109,557 | | | | 59,657 | |
| Purchases of investment securities available-for-sale | | | (113,151 | ) | | | (368,147 | ) | | | (41,303 | ) |
| Proceeds from calls, paydowns, and maturities of investment securities held-to-maturity | | | 708 | | | | 673 | | | | 3,290 | |
| Purchases of investment securities held-to-maturity | | | (248 | ) | | | 0 | | | | (934 | ) |
| Net increase in interest-bearing deposits with other banks | | | (262,017 | ) | | | 0 | | | | 0 | |
| Net decrease (increase) in federal funds sold | | | 0 | | | | 106,990 | | | | (4,990 | ) |
| Net increase in loans and leases, excluding covered loans | | | (214,531 | ) | | | (189,420 | ) | | | (127,922 | ) |
| Net decrease in covered loans | | | 150,185 | | | | 0 | | | | 0 | |
| Proceeds from surrender of life insurance | | | 0 | | | | 0 | | | | 12,941 | |
| Proceeds from disposal of other real estate owned | | | 5,665 | | | | 1,785 | | | | 1,734 | |
| Purchases of premises and equipment | | | (13,180 | ) | | | (11,886 | ) | | | (7,578 | ) |
| Net cash acquired from acquisitions | | | 285,562 | | | | 0 | | | | 0 | |
| Net cash proceeds received in FDIC-assisted acquisition | | | 967,391 | | | | 0 | | | | 0 | |
| Net cash provided by (used in) investing activities | | | 1,144,443 | | | | (349,324 | ) | | | (104,713 | ) |
| Financing activities | | | | | | | | | | | | |
| Net (decrease) increase in total deposits | | | (536,669 | ) | | | (110,674 | ) | | | 96,233 | |
| Net (decrease) increase in short-term borrowings | | | (372,103 | ) | | | 256,244 | | | | 1,588 | |
| Payments on long-term borrowings | | | (107,103 | ) | | | (12,732 | ) | | | (17,866 | ) |
| Proceeds on long-term borrowings | | | 0 | | | | 115,000 | | | | 0 | |
| Redemption of other long-term debt | | | 0 | | | | 0 | | | | (10,000 | ) |
| Cash dividends paid on common stock | | | (19,024 | ) | | | (25,443 | ) | | | (24,845 | ) |
| Cash dividends paid on preferred stock | | | (3,578 | ) | | | 0 | | | | 0 | |
| Proceeds from issuance of preferred stock and warrants | | | 0 | | | | 80,000 | | | | 0 | |
| Issuance of common stock | | | 97,985 | | | | 0 | | | | 0 | |
| Treasury stock purchase | | | 0 | | | | 0 | | | | (27,297 | ) |
| Proceeds from exercise of stock options | | | 0 | | | | 0 | | | | 82 | |
| Excess tax (liability) benefit on share-based compensation | | | (189 | ) | | | (14 | ) | | | 69 | |
| Net cash (used in) provided by financing activities | | | (940,681 | ) | | | 302,381 | | | | 17,964 | |
| Cash and cash equivalents: | | | | | | | | | | | | |
| Net increase (decrease) in cash and cash equivalents | | | 243,215 | | | | (5,289 | ) | | | (13,183 | ) |
| Cash and cash equivalents at beginning of year | | | 100,935 | | | | 106,224 | | | | 119,407 | |
| Cash and cash equivalents at end of year | | $ | 344,150 | | | $ | 100,935 | | | $ | 106,224 | |
| Supplemental disclosures | | | | | | | | | | | | |
| Interest paid | | $ | 58,519 | | | $ | 69,746 | | | $ | 86,022 | |
| Income taxes paid | | $ | 16,485 | | | $ | 15,050 | | | $ | 14,445 | |
| Acquisition of other real estate owned through foreclosure | | $ | 6,136 | | | $ | 3,650 | | | $ | 2,198 | |
| Issuance of restricted stock awards | | $ | 2,418 | | | $ | 1,638 | | | $ | 2,254 | |
| Mortgage loans exchanged for mortgage-backed securities | | $ | 0 | | | $ | 89,003 | | | $ | 0 | |
| Supplemental schedule for investing activities | | | | | | | | | | | | |
Acquisitions | | | | | | | | | | | | |
| Assets acquired – branch acquisition | | $ | 79,101 | | | $ | 0 | | | $ | 0 | |
| Liabilities assumed – branch acquisition | | | 84,641 | | | | 0 | | | | 0 | |
| Goodwill | | $ | 5,540 | | | $ | 0 | | | $ | 0 | |
| Assets acquired – Peoples | | $ | 566,555 | | | $ | 0 | | | $ | 0 | |
| Liabilities assumed – Peoples | | | 584,661 | | | | 0 | | | | 0 | |
| Goodwill | | $ | 18,106 | | | $ | 0 | | | $ | 0 | |
| Assets acquired – Irwin | | $ | 3,265,289 | | | $ | 0 | | | $ | 0 | |
| Liabilities assumed – Irwin | | | 2,886,203 | | | | 0 | | | | 0 | |
| Bargain purchase gain | | $ | 379,086 | | | $ | 0 | | | $ | 0 | |
See Notes to Consolidated Financial Statements.
32 First Financial Bancorp 2009 Annual Report
Consolidated Statements Of Changes In Shareholders’ Equity
| | | | | | | | | | | | | | | | | | Accumulated | | | Treasury stock | | | | |
| | | Preferred | | | Preferred | | | Common | | | Common | | | | | | other | | | | | | | | | | |
| (Dollars in thousands, | | stock | | | stock | | | stock | | | stock | | | Retained | | | comprehensive | | | | | | | | | | |
except share amounts) | | shares | | | amount | | | shares | | | amount | | | earnings | | | income (loss) | | | Shares | | | Amount | | | Total | |
| Balances at January 1, 2007 | | | 0 | | | $ | 0 | | | | 48,558,614 | | | $ | 392,736 | | | $ | 71,320 | | | $ | (13,375 | ) | | | (9,313,207 | ) | | $ | (165,202 | ) | | $ | 285,479 | |
| Net income | | | | | | | | | | | | | | | | | | | 35,681 | | | | | | | | | | | | | | | | 35,681 | |
| Unrealized holding gains on securities available for sale arising during the period | | | | | | | | | | | | | | | | | | | | | | | 748 | | | | | | | | | | | | 748 | |
| Change in retirement obligation | | | | | | | | | | | | | | | | | | | | | | | 5,500 | | | | | | | | | | | | 5,500 | |
| Total comprehensive income | | | | | | | | | | | | | | | | | | | | | | | | | | | | | | | | | | | 41,929 | |
| Cash dividends declared ($0.65 per share) | | | | | | | | | | | | | | | | | | | (24,908 | ) | | | | | | | | | | | | | | | (24,908 | ) |
| Purchase of common stock | | | | | | | | | | | | | | | | | | | | | | | | | | | (2,000,000 | ) | | | (27,297 | ) | | | (27,297 | ) |
| Tax benefit on stock option exercise | | | | | | | | | | | | | | | 69 | | | | | | | | | | | | | | | | | | | | 69 | |
| Exercise of stock options, net of shares purchased | | | | | | | | | | | | | | | (57 | ) | | | | | | | | | | | 8,474 | | | | 139 | | | | 82 | |
| Restricted stock awards, net | | | | | | | | | | | | | | | (2,170 | ) | | | | | | | | | | | 113,927 | | | | 2,015 | | | | (155 | ) |
| Share-based compensation expense | | | | | | | | | | | | | | | 1,384 | | | | | | | | | | | | | | | | | | | | 1,384 | |
| Balances at December 31, 2007 | | | 0 | | | | 0 | | | | 48,558,614 | | | | 391,962 | | | | 82,093 | | | | (7,127 | ) | | | (11,190,806 | ) | | | (190,345 | ) | | | 276,583 | |
| | | | | | | | | | | | | | | | | | | | | | | | | | | | | | | | | | | | | |
| Cumulative adjustment for accounting changes: | | | | | | | | | | | | | | | | | | | | | | | | | | | | | | | | | | | | |
| Fair value option | | | | | | | | | | | | | | | | | | | (750 | ) | | | 750 | | | | | | | | | | | | 0 | |
| Split dollar life insurance | | | | | | | | | | | | | | | | | | | (2,499 | ) | | | | | | | | | | | | | | | (2,499 | ) |
| Net income | | | | | | | | | | | | | | | | | | | 22,962 | | | | | | | | | | | | | | | | 22,962 | |
| Unrealized holding gains on securities available for sale arising during the period | | | | | | | | | | | | | | | | | | | | | | | 5,861 | | | | | | | | | | | | 5,861 | |
| Change in retirement obligation | | | | | | | | | | | | | | | | | | | | | | | (12,158 | ) | | | | | | | | | | | (12,158 | ) |
| Unrealized gain on derivatives | | | | | | | | | | | | | | | | | | | | | | | 769 | | | | | | | | | | | | 769 | |
| Total comprehensive income | | | | | | | | | | | | | | | | | | | | | | | | | | | | | | | | | | | 17,434 | |
| Issuance of preferred stock and warrant | | | 80,000 | | | | 78,019 | | | | | | | | 1,981 | | | | | | | | | | | | | | | | | | | | 80,000 | |
| Cash dividends declared: | | | | | | | | | | | | | | | | | | | | | | | | | | | | | | | | | | | | |
| Common stock at $0.68 per share | | | | | | | | | | | | | | | | | | | (25,467 | ) | | | | | | | | | | | | | | | (25,467 | ) |
| Tax liability on stock option exercise | | | | | | | | | | | | | | | (14 | ) | | | | | | | | | | | | | | | | | | | (14 | ) |
| Restricted stock awards, net | | | | | | | | | | | | | | | (2,204 | ) | | | | | | | | | | | 113,393 | | | | 2,050 | | | | (154 | ) |
| Share-based compensation expense | | | | | | | | | | | | | | | 2,444 | | �� | | | | | | | | | | | | | | | | | | 2,444 | |
| Balances at December 31, 2008 | | | 80,000 | | | | 78,019 | | | | 48,558,614 | | | | 394,169 | | | | 76,339 | | | | (11,905 | ) | | | (11,077,413 | ) | | | (188,295 | ) | | | 348,327 | |
| | | | | | | | | | | | | | | | | | | | | | | | | | | | | | | | | | | | | |
| Net income | | | | | | | | | | | | | | | | | | | 246,546 | | | | | | | | | | | | | | | | 246,546 | |
Unrealized holding gains on securities available for sale arising during the period | | | | | | | | | | | | | | | | | | | | | | | 3,285 | | | | | | | | | | | | 3,285 | |
| Change in retirement obligation | | | | | | | | | | | | | | | | | | | | | | | (2,148 | ) | | | | | | | | | | | (2,148 | ) |
| Unrealized loss on derivatives – Prime Swap | | | | | | | | | | | | | | | | | | | | | | | (474 | ) | | | | | | | | | | | (474 | ) |
| Unrealized gain on derivatives – Trust Preferred Swap | | | | | | | | | | | | | | | | | | | | | | | 636 | | | | | | | | | | | | 636 | |
| Foreign currency exchange | | | | | | | | | | | | | | | | | | | | | | | 119 | | | | | | | | | | | | 119 | |
| Total comprehensive income | | | | | | | | | | | | | | | | | | | | | | | | | | | | | | | | | | | 247,964 | |
| Issuance of common stock | | | | | | | | | | | 13,800,000 | | | | 97,985 | | | | | | | | | | | | | | | | | | | | 97,985 | |
| Cash dividends declared: | | | | | | | | | | | | | | | | | | | | | | | | | | | | | | | | | | | | |
| Common stock at $0.40 per share | | | | | | | | | | | | | | | | | | | (17,794 | ) | | | | | | | | | | | | | | | (17,794 | ) |
| Preferred stock | | | | | | | | | | | | | | | | | | | (3,578 | ) | | | | | | | | | | | | | | | (3,578 | ) |
| Warrant reduction | | | | | | | 826 | | | | | | | | (991 | ) | | | 165 | | | | | | | | | | | | | | | | 0 | |
| Discount on preferred stock | | | | | | | 350 | | | | | | | | | | | | (350 | ) | | | | | | | | | | | | | | | 0 | |
| Excess tax liability on share-based compensation | | | | | | | | | | | | | | | (189 | ) | | | | | | | | | | | | | | | | | | | (189 | ) |
| Restricted stock awards, net | | | | | | | | | | | | | | | (3,241 | ) | | | | | | | | | | | 152,620 | | | | 2,894 | | | | (347 | ) |
| Share-based compensation expense | | | | | | | | | | | | | | | 2,799 | | | | | | | | | | | | | | | | | | | | 2,799 | |
| Balances at December 31, 2009 | | | 80,000 | | | $ | 79,195 | | | | 62,358,614 | | | $ | 490,532 | | | $ | 301,328 | | | $ | (10,487 | ) | | | (10,924,743 | ) | | $ | (185,401 | ) | | $ | 675,167 | |
See Notes to Consolidated Financial Statements.
First Financial Bancorp 2009 Annual Report 33
Notes To Consolidated Financial Statements
1. Summary Of Significant Accounting Policies
Basis of presentation: The Consolidated Financial Statements of First Financial Bancorp. (First Financial), a bank holding company, principally serving Ohio, Indiana, Kentucky and Michigan, include the accounts and operations of First Financial and its wholly owned subsidiaries - First Financial Bank, N.A. and First Financial Capital Advisors LLC, a registered investment advisor. All significant intercompany transactions and accounts have been eliminated in consolidation. Certain reclassifications of prior years’ amounts have been made to conform to current year presentation. Such reclassifications had no effect on net earnings.
The preparation of Consolidated Financial Statements in conformity with U.S. Generally Accepted Accounting Principles (GAAP) requires management to make estimates, assumptions, and judgments that affect the amounts reported in the Consolidated Financial Statements and accompanying Notes. Actual realized amounts could differ materially from those estimates.
Interest income and interest expense on all interest-earning assets and interest-bearing liabilities is recognized on the accrual basis.
All dollar amounts, except per share data, are expressed in thousands of dollars.
The Financial Accounting Standards Board’s (FASB) Accounting Standards Codification (ASC) became effective July 1, 2009. At that date, the ASC became the FASB’s officially recognized source of authoritative GAAP applicable to all public and non-public nongovernmental entities, superseding existing FASB, American Institute of Certified Public Accountants, Emerging Issues Tax Force, and related literature. Rules and interpretive releases of the Securities and Exchange Commission (SEC) under the authority of federal securities laws are also sources of authoritative GAAP for SEC registrants. All other accounting literature is considered non-authoritative. The change to ASC affects the way companies refer to GAAP in financial statements and accounting policies. Citing particular content in the ASC involves specifying the unique numeric path to the content through the Topic, Subtopic, Section, and Paragraph structure.
Investment securities: First Financial can classify debt and equity securities in three categories: trading, held-to-maturity, and available-for-sale.
Management determines the appropriate classification of debt securities at the time of purchase and reevaluates such designation as of each balance sheet date. Debt securities are classified as held-to-maturity when First Financial has the positive intent and ability to hold the securities to maturity. Held-to-maturity securities are stated at amortized cost. Debt securities not classified as held-to-maturity are classified as available-for-sale. Available-for-sale securities are stated at aggregate fair value, with the unrealized gains and losses, net of tax, reported as a separate component of accumulated other comprehensive income (loss) in shareholders’ equity.
Securities classified as trading are held principally for resale in the near term and are recorded at fair value. Gains or losses, either unrealized or realized, are reported in noninterest income. Quoted market prices are used to determine the fair value of trading securities.
The amortized cost of debt securities classified as either held-to-maturity or available-for-sale is adjusted for amortization of premiums and accretion of discounts to maturity, or in the case of mortgage-backed securities, over the estimated life of the security. Such amortization is included in interest income from investments. Interest and dividends are included in interest income from investments. Realized gains and losses are based on amortized cost of the security sold using the specific identification method. Available-for-sale and held-to-maturity securities are reviewed quarterly for impairment in fair value. In performing this review, management considers the length of time and extent to which the fair value has been less than cost, the financial condition and near-term prospects of the issuer, and the ability and intent to hold the security for a period sufficient to allow for any anticipated recovery in fair value. If the fair value of a security is less than the amortized cost and the impairment is determined to be other-than-temporary, the security is written down, establishing a reduced cost basis. The related charge is recorded in the Consolidated Statements of Income as an impairment on investment securities.
Other investments include Federal Reserve Bank (FRB) stock and Federal Home Loan Bank (FHLB) stock. FRB and FHLB stock is carried at cost.
Loans and leases: Loan origination and commitment fees and certain direct loan origination costs are deferred, and the net amount amortized as an adjustment to the related loan’s yield. The accrual of interest income is discontinued when the collection of a loan or interest, in whole or in part, is doubtful. This applies generally to all loans, including impaired loans. When interest accruals are suspended, interest income accrued in the current year is reversed and interest accrued from the prior year is charged to the allowance for loan and lease losses. Loans are returned to accrual status when all the principal and interest amounts contractually due are brought current and future payments are reasonably assured.
Loans held for sale may come from two sources: residential real estate loans newly originated for sale and in certain circumstances, previously originated loans that have been specifically identified by management for sale based on predetermined criteria. Loans originated for sale are placed immediately into that category upon origination and are considered to be at fair market value due to the commitment to sell in a short timeframe. Loans transferred to held for sale status are done at the lower of cost or fair value with any difference charged to the allowance for loan and lease losses. Any subsequent change in carrying value, not to exceed original cost, is recorded in the Consolidated Statements of Income.
Allowance for loan and lease losses: The level of the allowance for loan and lease losses (allowance) is based upon management’s evaluation of the loan and lease portfolios, past loan loss experience, known and inherent risks in the portfolio, adverse situations that may affect the borrower’s ability to repay (including the timing of future payments), the estimated value of any underlying collateral, composition of the loan portfolio, economic conditions, and other pertinent factors. This evaluation is inherently subjective as it requires material estimates including the amounts and timing of future cash flows expected to be received on impaired loans that may be susceptible to significant change. Loans are charged off when management believes that the ultimate collectibility of the loan is unlikely. Allocation of the allowance may be made for specific loans, but the entire allowance is available for any loan that, in management’s judgment, is deemed to be uncollectible.
Management’s determination of the adequacy of the allowance is based on an assessment of the inherent loss potential in the loan portfolio given the conditions at the time. The allowance is increased by provisions charged to expense and decreased by charge-offs, net of recoveries of amounts previously charged-off. The allowance for commercial loans, including time and demand notes, tax-exempt loans, commercial real estate, and commercial capital leases begins with a process of estimating the probable losses inherent in the portfolio. The estimates for these commercial loans are established by category and based on First Financial’s internal system of credit risk ratings and historical loss data.
The estimate of losses inherent in the commercial portfolio may then be adjusted for management’s estimate of probable losses on specific exposures as well as trends in delinquent and nonaccrual loans and other factors such as prevailing economic conditions, lending strategies, and other influencing factors. In the commercial portfolio, certain loans, typically larger-balance non-homogeneous exposures, may have a specific allowance established based on the borrower’s overall financial condition, resources and payment record, support from guarantors, and the realizable value of any collateral.
The allowance for consumer loans which includes residential real estate, installment, home equity, credit card, and overdrafts is established for each of the categories by estimating losses inherent in that particular category of consumer loans. The estimate of losses is primarily based on historical loss rates. Consumer loans are evaluated as an asset type within a category (i.e., residential real estate, installment, etc.), as these loans are smaller and more homogeneous.
Larger balance commercial and commercial real estate loans are considered impaired when, based on current information and events, it is probable that First Financial will be unable to collect all principal and interest amounts due according to the contractual terms of the loan agreement.
An impairment loss is recognized if the present value of expected future cash flows from the loan is less than the recorded investment in the loan (recorded investment in the loan is the principal balance plus any accrued interest, net deferred loan fees or costs, and unamortized premium or discount, and does not reflect any direct write-down of the investment), as defined by FASB ASC Topic 310-10-35-4, Loan Impairment. The impairment loss is recognized through the allowance for loan and lease losses. Loans that are impaired are recorded at the present value of expected future cash flows discounted at the loan’s effective interest rate or if the loan is collateral dependent, impairment measurement is based on the fair value of the collateral. Income recognition on impaired loans is recorded on the cash basis method.
Covered loans: Loans acquired in Federal Deposit Insurance Corporation (FDIC)-assisted transactions are covered under loss sharing agreements and are referred to as covered loans. Pursuant to the terms of the loss sharing agreements, covered loans are subject to a stated loss thresholds whereby the FDIC will reimburse First Financial for 80% of losses of up to the stated loss thresholds, and 95% of losses in excess of these amounts. First Financial will reimburse the FDIC for its share of recoveries with respect to losses for which the FDIC paid First Financial a reimbursement under the loss sharing agreement. The FDIC’s obligation to reimburse First Financial for losses with respect to covered loan begins with the first dollar of loss incurred.
Covered loans were recorded at fair value at the time of acquisition. Fair values for covered loans are based on a discounted cash flow methodology that considered various factors including the type of loan and related collateral, classification status, fixed or variable interest rate, term of loan and whether or not the loan was amortizing, and a discount rate reflecting the Company’s assessment of risk inherent in the cash flow estimates. Covered loans were grouped together according to similar characteristics and were treated in the aggregate when applying various valuation techniques. Losses on covered loans are not charged to the allowance for loan and lease losses.
34 First Financial Bancorp 2009 Annual Report
FDIC indemnification asset: FDIC indemnification assets result from the loss share agreements in the FDIC-assisted transactions and are measured separately from the related covered assets as they are not contractually embedded in the assets and are not transferable with the assets should First Financial choose to dispose of them. The FDIC indemnification assets represent the estimated fair value of expected reimbursements from the FDIC for losses on covered loans. Pursuant to the terms of the loss sharing agreements, covered loans are subject to a stated loss threshold whereby the FDIC will reimburse First Financial for 80% of losses up to the stated loss thresholds, and 95% of losses in excess of these amounts. Fair value is estimated using projected cash flows related to the loss sharing agreements based on the expected reimbursements for losses and the applicable loss sharing percentages. These expected reimbursements do not include reimbursable amounts related to future covered expenditures. These cash flows are discounted to reflect the uncertainty of the timing and receipt of the loss sharing reimbursement from the FDIC.
Premises and equipment: Premises and equipment are stated at cost, less accumulated depreciation and amortization. Depreciation and amortization are computed principally on the straight-line method over the estimated useful lives of the assets. Useful lives generally range from ten to 40 years for building and building improvement; three to ten years for furniture, fixtures, and equipment; and three to five years for software, hardware, and data handling equipment. Land improvements are depreciated over 20 years and leasehold improvements are depreciated over the lesser of the base term of the respective lease or the asset useful life. Maintenance and repairs are charged to operations as incurred.
Goodwill and other intangible assets: Under accounting for business combinations, the net assets of entities acquired by First Financial are recorded at their estimated fair value at the date of acquisition. The excess cost of the acquisition over the fair value of net assets acquired is recorded as goodwill. The excess fair value of net assets acquired over the cost of the acquisition is considered a bargain purchase gain and is recorded as noninterest income. Goodwill and intangible assets deemed to have indefinite lives, if any, are not amortized, but are subject to annual impairment tests.
Core deposit intangibles (CDIs): CDIs represent the value of acquired relationships with deposit customers. The fair value of CDIs are estimated based on a discounted cash flow methodology that gives appropriate consideration to expected customer attrition rates, cost of the deposit base, reserve requirements and the net maintenance cost attributable to customer deposits. CDIs are amortized on an accelerated basis over their useful lives.
Mortgage servicing assets (MSRs): MSRs are recognized as separate assets when loans are sold into the secondary market or securitized, servicing retained. Upon sale, the mortgage servicing right is established, which represents the then current market value of future net cash flows expected to be realized for performing the servicing activities. The market value of the mortgage servicing rights are estimated by calculating the present value of estimated future net servicing cash flows, taking into consideration actual and expected mortgage loan prepayment rates, discount rates, servicing costs, and other economic factors, which are determined based on current market conditions. The expected and actual rates of mortgage loan prepayments are the most significant factors driving the value of mortgage servicing rights. Increases in mortgage loan prepayments reduce estimated future net servicing cash flows because the life of the underlying loan is reduced. In determining the market value of the mortgage servicing rights, mortgage interest rates are used to determine prepayment and discount rates, and are held constant over the estimated life of the portfolio.
Other real estate owned: Other real estate owned represents properties primarily acquired by First Financial’s bank subsidiary through loan defaults by clients. The property is recorded at the lower of cost or fair value minus estimated costs to sell at the date acquired. Subsequently, the property is valued at the lower of the amount recorded when the property was placed into other real estate owned or fair value minus estimated costs to sell based on periodic valuations performed by management. Any gains or losses realized at the time of disposal are reflected in income.
Other real estate owned covered by loss share: Other real estate owned covered by loss share represents properties primarily acquired by First Financial’s bank subsidiary through loan defaults by clients on covered loans. Pursuant to the terms of the loss sharing agreements, covered assets are subject to a stated loss threshold whereby the FDIC will reimburse First Financial for 80% of losses of up to the stated loss threshold, and 95% of losses in excess of these amounts. The property is recorded at the lower of cost or fair value minus estimated costs to sell at the date acquired. Subsequently, the property is valued at the lower of the amount recorded when the property was placed into other real estate owned or fair value minus estimated costs to sell based on periodic valuations performed by management. Any gains or losses realized at the time of disposal are partially offset by the FDIC reflected in income.
Deferred income taxes: Deferred tax assets and liabilities are measured using enacted tax rates expected to apply to taxable income in the years in which those temporary differences are expected to be recovered or settled. The effect on deferred tax assets and liabilities of a change in tax rates is recognized in income in the period that includes the enactment date.
First Financial and its subsidiaries file a consolidated federal income tax return. Each subsidiary provides for income taxes on a separate return basis, and remits to First Financial amounts determined to be currently payable.
Capital: On June 8, 2009, First Financial completed a public offering of 13,800,000 shares of its common stock adding approximately $97,985 of additional common equity, after offering related costs. Subsequently, on February 2, 2010, First Financial completed an additional public offering of 6,372,117 shares of its common stock adding approximately $91,192 of additional common equity, after offering related costs.
In December 2008, First Financial completed the sale of $80,000 in perpetual preferred securities to the U.S. Treasury (Treasury) under its Capital Purchase Program (CPP), as a component of its Troubled Asset Relief Program (TARP). This represented approximately 3.00% of its risk-weighted assets as of September 30, 2008. The preferred shares pay a cumulative dividend of 5.00% per year for the first five years and reset to a rate of 9.00% per year thereafter. The dividends are payable quarterly in arrears. The preferred shares are non-voting, other than class voting rights on certain matters that could adversely affect the Senior Preferred Shares. They are also callable by First Financial at the par value of $1,000 per share, subject to consultation with First Financial’s primary regulator, the Office of the Comptroller of the Currency and with the approval of the Treasury. The Treasury may also transfer the Senior Preferred Shares to a third party at any time.
In conjunction with the purchase of the preferred shares, the Treasury received a warrant to purchase 930,233 common shares at an exercise price of $12.90 per share. The warrant has a term of 10 years. The Treasury agreed not to exercise voting power with respect to the common shares that it acquires upon exercise of the warrants. As a result of the common equity raised during the second quarter of 2009, the number of common shares eligible for purchase under the warrant agreement was reduced by 50% to 465,117 shares. On February 24, 2010, First Financial Bancorp redeemed all of the $80,000 of senior preferred shares issued to the Treasury in December 2008 under the CPP. First Financial does not intend to repurchase the warrant at this time.
Comprehensive income (loss): Comprehensive income (loss) is defined as the change in equity of a business enterprise during the period from transactions and other events and circumstances from nonowner sources. Accumulated other comprehensive income (loss) includes the unrealized holding gains and losses from available-for-sale securities arising during the period. First Financial recorded net unrealized holding gains of $10,224 at December 31, 2009 and $6,939 at December 31, 2008. While there was no income tax expense or benefit, there was a deferred tax liability associated with available-for-sale securities of $5,825 at December 31, 2009 and $3,972 at December 31, 2008.
Accumulated other comprehensive income (loss) also includes the unrealized gain on derivatives (cash flow hedges). First Financial recorded a net unrealized gain of $931 and $769 as of December 31, 2009 and 2008, respectively. No income tax expense is recorded. Deferred tax liabilities of $529 and $440 associated with this type of derivative instrument were recorded as of December 31, 2009 and 2008, respectively. Prior to 2008, First Financial did not participate in any cash flow hedges required to be reported under FASB ASC Topic 815, Derivatives and Hedging.
Accumulated other comprehensive income (loss) also includes a net unfunded pension obligation of $21,761 and $19,613 as of December 31, 2009 and 2008, respectively. There was a net deferred tax asset recorded to reflect the funded status of the postretirement benefit plans of $12,388 and $11,226 as of December 31, 2009 and 2008, respectively.
Pension: First Financial sponsors a non-contributory defined benefit pension plan covering substantially all employees. The measurement of the accrued benefit liability and the annual pension expense involves actuarial and economic assumptions. The assumptions used in pension accounting relate to the discount rates, the expected return on plan assets, and the rate of compensation increase. First Financial adopted the recognition and disclosure provisions of FASB ASC Topic 715, Compensation – Retirement Benefits.
Derivative instruments: First Financial accounts for its derivative financial instruments in accordance with FASB ASC Topic 815, Derivatives and Hedging. FASB ASC Topic 815 requires all derivative instruments to be carried at fair value on the balance sheet. First Financial designates derivative instruments used to manage interest-rate risk as hedge relationships with certain assets or liabilities being hedged.
First Financial has entered into derivative transactions, primarily interest rate swaps, to mitigate exposure to changes in the fair value of an asset, liability, or firm commitment attributable to a particular risk, such as interest rate risk, and under the provisions of FASB ASC Topic 815, are considered to be fair value hedges. Because the critical terms of the hedged financial instruments and the derivative instruments coincide, the changes in the fair value of the hedged financial instruments and the derivative instruments offset and the hedges are considered to be highly effective. For a fair value hedge, the fair value of the interest rate swap is recognized on the Consolidated Balance Sheets as either a freestanding asset or liability with a corresponding adjustment to the hedged financial instrument. Subsequent adjustments due to changes in the fair value of a derivative that qualifies as a fair value hedge are offset in current period earnings. Under the fair value method, any derivative gains or losses not effective in hedging the change in fair value of the hedged item would be recognized in the Consolidated Statements of Income.
First Financial Bancorp 2009 Annual Report 35
Notes To Consolidated Financial Statements
First Financial utilizes interest rate swaps designated as cash flow hedges to manage the variability of cash flows, primarily net interest income, attributable to changes in interest rates. The net interest receivable or payable on an interest rate swap designated as a cash flow hedge is accrued and recognized as an adjustment to interest income or interest expense. The fair value of the interest rate swaps is included within accrued interest and other assets on the Consolidated Balance Sheets. Changes in the fair value of the interest rate swap are included in accumulated comprehensive income (loss). Derivative gains and losses not considered effective in hedging the cash flows related to the underlying loans, if any, would be recognized immediately in income. All of First Financial’s cash flow hedges are considered effective.
Stock-based compensation: First Financial grants stock-based awards, including restricted stock and options to purchase common stock. Stock option grants are for a fixed number of shares to employees and directors with an exercise price equal to the fair value of the shares at the date of grant. Stock-based compensation for awards is recognized in the Consolidated Statements of Income on a straight-line basis over the vesting period. The amortization of stock-based compensation reflects estimated forfeitures adjusted for actual forfeiture experience. As compensation expense is recognized, a deferred tax asset is recorded that represents an estimate of the future tax deduction from exercise. At the time stock-based awards are exercised, cancelled, or expire, First Financial may be required to recognize an adjustment to tax expense.
Earnings per share: Basic net income per common share is computed by dividing net income applicable to common stock by the weighted average number of shares of common stock outstanding during the period. Diluted net income per common share is computed by dividing net income applicable to common stock by the weighted average number of shares, nonvested stock, and dilutive common stock equivalents outstanding during the period. Common stock equivalents consist of common stock issuable under the assumed exercise of stock options granted under First Financial’s stock plans and the assumed conversion of common stock warrants, using the treasury stock method.
Cash flow information: For purposes of the Consolidated Statements of Cash Flows, First Financial considers cash and due from banks as cash and cash equivalents.
Segments and related information: In 2009, management continued to review operating performance and make decisions as one banking segment in contiguous geographic markets.
2. Recently Adopted and Issued Accounting Standards
Effective January 1, 2009, First Financial adopted FASB ASC Topic 805, Business Combinations. This topic significantly changes how business acquisitions are accounted for, continuing the transition to fair value measurement, and will impact financial statements both on the acquisition date and in subsequent periods. This topic requires the acquirer to recognize assets acquired, liabilities assumed, and any noncontrolling interest in the acquiree at their respective fair values as of the acquisition date. The Business Combinations topic changes the treatment of acquisition-related costs, restructuring costs related to an acquisition that the acquirer expects but is not obligated to incur, contingent consideration associated with the purchase price, and preacquisition contingencies associated with acquired assets and liabilities. In addition, this topic requires enhanced disclosures to enable users of the financial statements to evaluate the nature and financial effects of the business combination.
Effective June 30, 2009, First Financial adopted the amended guidance on the initial recognition and measurement, subsequent measurements and accounting, and disclosure of assets and liabilities arising from contingencies in a business combination in FASB ASC Topic 805. This guidance is effective for all acquisitions of assets and liabilities arising from contingencies in a business combination with closing dates after January 1, 2009. The guidance in FASB ASC Topic 805 was considered in the accounting for First Financial’s business combinations during the third quarter of 2009. For further detail, see Note 3 – Business Combinations.
Effective January 1, 2009, First Financial adopted the requirements of FASB ASC Topic 810 on Noncontrolling Interests in Consolidated Financial Statements. This guidance changes the accounting and reporting for minority interests, which are recharacterized as noncontrolling interests and classified as a component of shareholders’ equity. The Noncontrolling Interests topic requires retroactive adoption of the presentation and disclosure requirements for existing consolidated minority interests. All other requirements of this topic are required to be applied prospectively. First Financial has no existing consolidated minority interests and management does not anticipate this will occur in the future; therefore, this guidance did not have a material impact on First Financial’s Consolidated Financial Statements.
In June of 2009, the FASB amended the consolidation guidance on variable interest entities in FASB ASC Topic 810. This guidance affects all entities and enterprises currently within its scope, as well as qualifying special purpose entities that were previously outside of its scope, and is effective for fiscal years beginning after November 15, 2009, with early adoption prohibited. First Financial is evaluating the revised guidance and does not anticipate a material impact on the Consolidated Financial Statements.
Effective January 1, 2009, First Financial adopted the requirements of FASB ASC Topic 815, Derivatives and Hedging. This guidance is intended to help investors better understand how derivative instruments and hedging activities impact an entity’s financial condition, financial performance, and cash flows through enhanced disclosure requirements. For further detail on First Financial’s derivative instruments and hedging activities, see Note 8 – Derivatives.
Effective January 1, 2009, First Financial adopted the requirements of the FASB ASC Topic 860, Transfers and Servicing. This topic applies to repurchase financing, which is a repurchase agreement that relates to a previously transferred financial asset between the same counterparties that is entered into contemporaneously with the initial transfer. This topic presumes that an initial transfer of a financial asset and a repurchase financing are considered part of the same arrangement, known as a linked transaction. However, if certain criteria are met, the initial transfer and repurchase financing may not be evaluated as a linked transaction and must be evaluated separately. The adoption of this guidance did not have a material impact on First Financial’s Consolidated Financial Statements.
Effective June 30, 2009, First Financial adopted the requirements of FASB ASC Topic 320, Investments – Debt and Equity Securities. This topic revised the guidance for determining whether an impairment is other than temporary for debt securities, requires bifurcation of any other than temporary impairment between the amount representing credit loss and the amount related to all other factors and requires additional disclosures on other than temporary impairment of debt and equity securities. The adoption of this guidance did not have a material impact on First Financial’s Consolidated Financial Statements.
Effective June 30, 2009, First Financial adopted the requirements of FASB ASC Topic 820, Fair Value Measurements and Disclosures. This topic provides additional guidance on estimating fair value when the volume and level of activity for an asset or liability have significantly decreased in relation to normal market activity for the asset or liability, provides guidance on circumstances that may indicate that a transaction is not orderly and requires additional disclosures about fair value measurements in annual and interim reporting periods. The adoption of this guidance did not have a material impact on First Financial’s Consolidated Financial Statements.
Effective June 30, 2009, First Financial adopted the requirements of FASB ASC Topic 825, Financial Instruments. This topic extends the original disclosure requirements about the fair value of financial instruments to interim financial statements of publicly traded companies. For further detail on First Financial’s fair value disclosures, see Note 21 – Fair Value Disclosures.
Effective June 30, 2009, First Financial adopted the requirements of FASB ASC Topic 855, Subsequent Events. This topic represents the inclusion of guidance on subsequent events in accounting literature and provides guidance on management’s assessment of subsequent events. Historically, management had relied on U.S. auditing literature for guidance on assessing and disclosing subsequent events. The Subsequent Events topic clarifies that management must evaluate, as of each reporting period, events or transactions that occur after the balance sheet date “through the date that the financial statements are issued or are available to be issued.” Management must perform its assessment for both interim and annual financial reporting periods. For further detail on First Financial’s assessment of subsequent events, see Note 23 – Subsequent Events.
In June of 2009, the FASB amended the derecognition guidance on transfers of financial assets in FASB ASC Topic 860, Transfers and Servicing. This guidance removes the concept of a qualifying special-purpose entity and removes the exception from applying FASB ASC Topic 810, Consolidations, to qualifying special-purpose entities. This guidance applies prospectively to transfers of financial assets occurring on or after the effective date and is effective for fiscal years beginning after November 15, 2009, with early adoption prohibited. First Financial is evaluating the revised guidance included in this topic and does not anticipate a material impact on the Consolidated Financial Statements.
Effective September 30, 2009, First Financial adopted additional guidance clarifying the appropriate techniques for measuring the fair value of liabilities in FASB ASC Topic 820. This guidance was effective for the first reporting period, including interim periods, after issuance. The adoption of this guidance did not have a material impact on First Financial’s Consolidated Financial Statements.
Effective December 31, 2009, First Financial adopted additional guidance from the FASB on ASC Topic 715, Compensation -Retirement Benefits - Defined Benefits. This guidance requires additional disclosures about plan assets in an employer’s defined benefit pension and other postretirement plans including disclosure of the fair value of each major asset category, consideration of whether additional categories or further disaggregation should be disclosed, disclosure of the level within the fair value hierarchy in which each major category of plan assets falls, and reconciliation of beginning and ending balances of plan assets with fair values measured using significant unobservable inputs. This guidance is effective for fiscal years ending after December 15, 2009 with early adoption permitted. For further detail on First Financial’s postretirement benefit plans, see Note 17 – Employee Benefit Plans.
36 First Financial Bancorp 2009 Annual Report
On July 31, 2009, First Financial Bank, N.A. (First Financial Bank), a wholly owned subsidiary of First Financial Bancorp, entered into a purchase and assumption agreement (Peoples Agreement) with the Federal Deposit Insurance Corporation (FDIC), as receiver, pursuant to which First Financial acquired certain assets and assumed substantially all of the deposits and certain liabilities of Peoples Community Bank (Peoples).
Prior to the acquisition, Peoples operated 19 banking centers in the Cincinnati, Ohio metropolitan area. Excluding the effects of purchase accounting adjustments, First Financial acquired $579,628 in assets and assumed approximately $520,779 of the deposits of Peoples.
In connection with the Peoples acquisition, First Financial Bank entered into a loss sharing agreement with the FDIC that covers $449,674 of assets, based upon seller’s records, including single family residential mortgage loans, commercial real estate and commercial and industrial loans, and OREO (collectively, covered assets). First Financial acquired other Peoples assets that are not covered by the loss sharing agreement with the FDIC including investment securities purchased at fair market value and other tangible assets. Pursuant to the terms of the loss sharing agreement, the covered assets are subject to a stated loss threshold of $190,000 whereby the FDIC will reimburse First Financial for 80% of losses of up to $190,000, and 95% of losses in excess of this amount. First Financial will reimburse the FDIC for its share of recoveries with respect to losses for which the FDIC paid First Financial a reimbursement under the loss sharing agreement. The FDIC’s obligation to reimburse First Financial for losses with respect to covered assets begins with the first dollar of loss incurred.
On September 18, 2009, First Financial Bank, N.A, entered into separate purchase and assumption agreements (Irwin Agreements) with the FDIC, as receiver, pursuant to which First Financial acquired certain assets and assumed substantially all of the deposits and certain liabilities of Irwin Union Bank and Trust Company (Irwin Union Bank) and Irwin Union Bank, F.S.B. (Irwin FSB). Irwin Union Bank and Irwin FSB are collectively referred to herein as Irwin.
Prior to the acquisition, Irwin operated 27 banking centers primarily located in Indiana, with banking centers also located in Michigan, Nevada, Arizona, California, Kentucky, Missouri, New Mexico and Utah. Excluding the effects of purchase accounting adjustments, First Financial acquired $2,573,513 in assets and assumed approximately $2,498,447 of the deposits of Irwin.
In connection with the Irwin acquisitions, First Financial Bank entered into loss sharing agreements with the FDIC that collectively cover approximately $2,237,954 of assets, based upon seller’s records, which include single family residential mortgage loans, commercial real estate and commercial and industrial loans (covered assets). First Financial acquired other Irwin assets that are not covered by loss sharing agreements with the FDIC including investment securities purchased at fair market value and other tangible assets. Pursuant to the terms of the loss sharing agreements, the covered assets of Irwin Union Bank are subject to a stated loss threshold of $526,000 whereby the FDIC will reimburse First Financial for 80% of losses of up to $526,000, and 95% of losses in excess of this amount. Also pursuant to the terms of the loss sharing agreements, the covered assets of Irwin FSB are subject to a stated loss threshold of $110,000 whereby the FDIC will reimburse First Financial for 80% of losses of up to $110,000, and 95% of losses in excess of this amount. First Financial will reimburse the FDIC for its share of recoveries with respect to losses for which the FDIC paid First Financial a reimbursement under the loss sharing agreements. The FDIC’s obligation to reimburse First Financial for losses with respect to covered assets begins with the first dollar of loss incurred.
The amounts covered by the loss sharing agreements are the pre-acquisition book values of the underlying covered assets, the contractual balance of unfunded commitments that were acquired, and certain future net direct costs. The loss sharing agreements applicable to single family residential mortgage loans provide for FDIC loss sharing and First Financial reimbursement to the FDIC, in each case as described above, for ten years. The loss sharing agreements applicable to all other covered assets provide for FDIC loss sharing for five years and First Financial reimbursement of recoveries to the FDIC for eight years, in each case as described above.
The loss sharing agreements are subject to certain servicing procedures as specified in agreements with the FDIC. The expected reimbursements under the loss sharing agreements were recorded as indemnification assets at their estimated fair values of $69,657 and $247,016 for the Peoples Agreement and the Irwin Agreements, respectively, on the acquisition dates. The indemnification assets reflect the present value of the expected net cash reimbursement related to the loss sharing agreements described above.
First Financial has determined that the acquisitions of the net assets of Peoples and Irwin constitute business combinations as defined by the FASB ASC Topic 805, Business Combinations. Accordingly, the assets acquired and liabilities assumed are presented at their fair values as required. Fair values were determined based on the requirements of FASB ASC Topic 820, Fair Value Measurements. In many cases the determination of these fair values required management to make estimates about discount rates, future expected cash flows, market conditions and other future events that are highly subjective in nature and subject to change. These fair value estimates are considered preliminary, and are subject to change for up to one year after the closing dates of the acquisitions as additional information relative to closing date fair values becomes available. First Financial and the FDIC are engaged in on-going discussions that may impact which assets and liabilities are ultimately acquired or assumed by First Financial and/or the purchase prices. In addition, the tax treatment of FDIC assisted acquisitions is complex and subject to interpretations that may result in future adjustments of deferred taxes as of the acquisition dates.
The table below presents a summary of the assets and liabilities purchased in the Peoples and Irwin acquisitions recorded at estimated fair value.
| | | Peoples | | | Irwin | |
| | | As Recorded | | | Fair Value | | | As Recorded | | | As Recorded | | | Fair Value | | | As Recorded | |
| (Dollars in thousands) | | by FDIC | | | Adjustments | | | by FFB | | | by FDIC | | | Adjustments | | | by FFB | |
| Assets | | | | | | | | | | | | | | | | | | |
| Cash and interest-bearing deposits | | $ | 87,158 | | | $ | 0 | | | $ | 87,158 | | | $ | 158,786 | | | $ | 0 | | | $ | 158,786 | |
| Investment securities | | | 37,681 | | | | 0 | | | | 37,681 | | | | 70,700 | | | | 0 | | | | 70,700 | |
| Covered Loans | | | 431,217 | | | | (106,751 | ) | | | 324,466 | | | | 2,237,158 | | | | (481,891 | ) | | | 1,755,267 | |
| Total loans | | | 431,217 | | | | (106,751 | ) | | | 324,466 | | | | 2,237,158 | | | | (481,891 | ) | | | 1,755,267 | |
| Goodwill (Bargain Purchase) | | | 0 | | | | 18,106 | | | | 18,106 | | | | 0 | | | | (379,086 | ) | | | (379,086 | ) |
| Core deposits intangible | | | 0 | | | | 1,820 | | | | 1,820 | | | | 0 | | | | 3,326 | | | | 3,326 | |
| Covered other real estate owned | | | 18,457 | | | | (7,728 | ) | | | 10,729 | | | | 796 | | | | 0 | | | | 796 | |
| FDIC indemnification asset | | | 0 | | | | 69,657 | | | | 69,657 | | | | 0 | | | | 247,016 | | | | 247,016 | |
| Other assets | | | 5,115 | | | | (4,695 | ) | | | 420 | | | | 106,073 | | | | (9,488 | ) | | | 96,585 | |
| Total assest acquired | | $ | 579,628 | | | $ | (29,591 | ) | | $ | 550,037 | | | $ | 2,573,513 | | | $ | (620,123 | ) | | $ | 1,953,390 | |
| | | | | | | | | | | | | | | | | | | | | | | | | |
| Liabilities | | | | | | | | | | | | | | | | | | | | | | | | |
| Deposits | | | | | | | | | | | | | | | | | | | | | | | | |
| Noninterest-bearing deposit accounts | | $ | 49,424 | | | $ | 0 | | | $ | 49,424 | | | $ | 300,859 | | | $ | 0 | | | $ | 300,859 | |
| Interest-bearing deposit accounts | | | 0 | | | | 0 | | | | 0 | | | | 741,525 | | | | 0 | | | | 741,525 | |
| Savings deposits | | | 168,220 | | | | 0 | | | | 168,220 | | | | 79,987 | | | | 0 | | | | 79,987 | |
| Time deposits | | | 303,135 | | | | 0 | | | | 303,135 | | | | 1,376,076 | | | | 0 | | | | 1,376,076 | |
| Total deposits | | | 520,779 | | | | 0 | | | | 520,779 | | | | 2,498,447 | | | | 0 | | | | 2,498,447 | |
| Advances from Federal Home Loan Banks | | | 58,940 | | | | 4,598 | | | | 63,538 | | | | 337,433 | | | | 17,685 | | | | 355,118 | |
| Accrued expenses and other liabilities | | | 344 | | | | 0 | | | | 344 | | | | 32,638 | | | | 0 | | | | 32,638 | |
| Total liabilities assumed | | $ | 580,063 | | | $ | 4,598 | | | $ | 584,661 | | | $ | 2,868,518 | | | $ | 17,685 | | | $ | 2,886,203 | |
| Due from FDIC for net liabilities assumed | | $ | 435 | | | $ | 34,189 | | | $ | 34,624 | | | $ | 295,005 | | | $ | 637,808 | | | $ | 932,813 | |
First Financial Bancorp 2009 Annual Report 37
Notes To Consolidated Financial Statements
Generally the determination of the estimated fair value of the loans resulted in a significant write-down in the value of the loans, which was assigned to an accretable or nonaccretable balance, with the accretable balance being recognized as interest income over the remaining term of the loan. Therefore, interest income, through accretion of the difference between the carrying amount of the loans and the expected cash flows, is being recognized on all covered loans. First Financial recognized $51,753 of loan discount accretion in interest income in 2009. The nonaccretable portion of the write-down in the value of the loans represents expected credit impairment on the loans and is only recognized in income if the payments on the loan exceed the recorded fair value of the loan.
The estimated fair value of liabilities assumed exceeded the estimated fair value of assets acquired in the Peoples acquisition, resulting in the recognition of goodwill in the amount of approximately $18,106. In the Irwin acquisition, the estimated fair value of assets acquired exceeded the estimated fair value of liabilities assumed, resulting in a bargain purchase gain of $379,086 and the recognition of a $238,369 after-tax gain.
The operating results of First Financial for the period ended December 31, 2009 include the operating results produced by the acquired assets and assumed liabilities for the period of July 31, 2009 to December 31, 2009 and September 18, 2009 to December 31, 2009, for Peoples and Irwin, respectively. Due primarily to First Financial acquiring only certain assets and liabilities in the Peoples and Irwin acquisitions, the significant amount of fair value adjustments, the loss sharing agreements with the FDIC, and on-going discussions with the FDIC that may impact which assets and liabilities are ultimately acquired or assumed by First Financial, historical results from Peoples and Irwin are not meaningful to First Financial’s results, and thus no 2008 and 2009 pro forma information is presented. For these same reasons, the impact of the Peoples and Irwin acquisitions on First Financial’s results of operations for 2009 is not meaningful and is not presented.
First Financial did not acquire the real estate, banking facilities, furniture and equipment of Peoples as part of the purchase and assumption agreement but has the option to purchase these assets at fair market value from the FDIC. This purchase option expires 90 days after acquisition date, but was extended by the FDIC. First Financial completed a review of the former Peoples locations and notified the FDIC during the first quarter of 2010 of the company’s intent to purchase certain properties for a combined purchase price of $7,939. The acquisition date for these properties has not been determined at this time.
The following is a description of the methods used to determine the fair values of significant assets and liabilities presented above.
Cash and due from banks and interest-bearing deposits in banks and the Federal Reserve – The carrying amount of these assets is a reasonable estimate of fair value based on the short-term nature of these assets.
Investment Securities – Investment securities were acquired from the FDIC at fair market value.
Loans – Fair values for loans were based on a discounted cash flow methodology that considered various factors including the type of loan and related collateral, classification status, fixed or variable interest rate, term of loan and whether or not the loan was amortizing, and current discount rates. The discount rates used for loans are based on current market rates for new originations of comparable loans and include adjustments for liquidity concerns. The discount rate does not include a factor for credit losses as that has been included in the estimated cash flows.
Core deposit intangible – This intangible asset represents the value of the relationships that Peoples and Irwin had with its deposit customers. The fair value of this intangible asset was estimated based on a discounted cash flow methodology that gave appropriate consideration to expected customer attrition rates, cost of the deposit base, and the net maintenance cost attributable to customer deposits.
Other real estate owned – OREO is presented at the estimated present value that management expects to receive when the property is sold, net of related costs of disposal. Pursuant to the terms of the loss sharing agreements, covered assets are subject to a stated loss threshold whereby the FDIC will reimburse First Financial for 80% of losses of up to the stated loss threshold, and 95% of losses in excess of these amounts.
FDIC indemnification asset – This loss sharing asset is measured separately from the related covered assets as it is not contractually embedded in the covered assets and is not transferable with the covered assets should First Financial choose to dispose of them. Fair value was estimated using projected cash flows related to the loss sharing agreements based on the expected reimbursements for losses and the applicable loss sharing percentages. These cash flows were discounted to reflect the uncertainty of the timing and receipt of the loss sharing reimbursement from the FDIC.
Deposits – The fair values used for the demand and savings deposits that comprise the transaction accounts acquired, by definition equal the amount payable on demand at the acquisition date. No fair value adjustment was applied for time deposits as First Financial was provided with the option, upon acquisition, to reset deposit rates to market rates currently offered.
Advances from Federal Home Loan Banks – The fair values of Federal Home Loan Bank (FHLB) advances were based on contractual pre-payment penalties that are determined by the FHLB.
Other Acquisitions
In a separate and unrelated transaction, First Financial completed the purchase of 3 Indiana banking centers from Irwin Union Bank on August 28, 2009. First Financial purchased $41,146 of performing loans and assumed $84,566 of deposits. Loans were acquired at par value and there was no premium paid on assumed liabilities. Assets acquired in this transaction are not subject to a loss share agreement. The acquisition was accounted for under the purchase method of accounting in accordance with FASB ASC Topic 805. The purchased assets and assumed liabilities were recorded at their estimated fair values. Fair values are preliminary and subject to refinement for up to one year after the closing date of the acquisition, as information relative to closing date fair values becomes available.
Loans purchased in conjunction with the 3 banking centers were evaluated for impairment in accordance with FASB ASC Topic 310-30, Loans and Debt Securities Acquired with Deteriorated Credit Quality. These loans were determined not to be impaired and will be accounted for under FASB ASC Topic 310, Receivables.
4. Goodwill and Other Intangible Assets
Goodwill
Changes in the net carrying amount of goodwill for the year ended December 31, 2009 are shown below. No changes to goodwill were recorded during 2008.
| (Dollars in thousands) | | | |
| Balance at December 31, 2008 | | $ | 28,261 | |
| Goodwill acquired: | | | | |
| Peoples Community Bank | | | 18,107 | |
| Branch acquisition | | | 5,540 | |
| Balance at December 31, 2009 | | $ | 51,908 | |
Assets and liabilities of acquired entities are recorded at their estimated fair values as of the acquisition date and are subject to refinement for up to one year as information relative to the fair values of that data becomes available. The change in the goodwill for 2009 was a result of the purchase accounting adjustments related to the FDIC-assisted transaction in July of 2009 for Peoples Community Bank and the August of 2009 purchase of three branches, and related loans and deposits, from Irwin Union Bank and Trust Company. First Financial expects all the goodwill resulting from the acquisitions described above to be deductible for tax purposes.
Goodwill is not amortized, but is measured for impairment on an annual basis as of October 1 of each year or whenever events or changes in circumstances indicate that the fair value of a reporting unit may be below its carrying value. First Financial performed its annual impairment test as of October 1, 2009, and determined that no impairment was indicated.
Other intangible assets
Other intangible assets consist of mortgage servicing rights, core deposit intangibles, insurance covenants, and insurance expirations. Intangible assets, excluding servicing rights, are primarily amortized on an accelerated basis over their estimated useful lives and have an estimated weighted average life of 9.3 years.
38 First Financial Bancorp 2009 Annual Report
At December 31, 2009 and 2008, other intangible assets consisted of the following:
| | | December 31, 2009 | |
| | | | | | | | | Net | |
| | | Gross Carrying | | | Accumulated | | | Carrying | |
| (Dollars in thousands) | | Amount | | | Amortization | | | Amount | |
| Core deposit intangibles | | $ | 5,691 | | | $ | (332 | ) | | $ | 5,359 | |
| Mortgage servicing rights | | | 2,072 | | | | (96 | ) | | | 1,976 | |
| Other | | | 178 | | | | (52 | ) | | | 126 | |
Total other intangible assets | | $ | 7,941 | | | $ | (480 | ) | | $ | 7,461 | |
| | | December 31, 2008 | |
| | | | | | | | | Net | |
| | | Gross Carrying | | | Accumulated | | | Carrying | |
| (Dollars in thousands) | | Amount | | | Amortization | | | Amount | |
| Mortgage servicing rights | | $ | 412 | | | $ | (14 | ) | | $ | 398 | |
| Other | | | 993 | | | | (389 | ) | | | 604 | |
Total other intangible assets | | $ | 1,405 | | | $ | (403 | ) | | $ | 1,002 | |
Amortization expense recognized on intangible assets for 2009, 2008, and 2007 was $349, $93, and $696, respectively. The estimated amortization expense of other intangible assets for the next five years is as follows:
| | | Amortization | |
| (Dollars in thousands) | | Expense | |
| 2010 | | $ | 1,265 | |
| 2011 | | | 919 | |
| 2012 | | | 652 | |
| 2013 | | | 462 | |
| 2014 | | | 462 | |
Mortgage Service Rights
Changes in capitalized servicing rights are summarized as follows:
| (Dollars in thousands) | | 2009 | | | 2008 | | | 2007 | |
| Balance at beginning of year | | $ | 398 | | | $ | 0 | | | $ | 4,448 | |
| Rights acquired | | | 1,930 | | | | 0 | | | | 0 | |
| Rights capitalized | | | 0 | | | | 412 | | | | 121 | |
| Amortization | | | (352 | ) | | | (14 | ) | | | (308 | ) |
| Rights sold | | | 0 | | | | 0 | | | | (4,261 | ) |
| Balance at end of year | | $ | 1,976 | | | $ | 398 | | | $ | 0 | |
Due to the acquisition of Irwin Union Bank in 2009, First Financial acquired $1,930 in servicing rights. No new servicing rights were capitalized.
During 2008, First Financial securitized $89,003 of existing residential mortgage loans, transferring the credit risk associated with the loans to the Federal Home Loan Mortgage Company (FHLMC). This resulted in total MSRs of $412 being recorded.
The estimated fair value of capitalized mortgage servicing rights was $1,976, $398, and $0 at December 31, 2009, 2008, and 2007, respectively.
In the first quarter of 2007, First Financial entered into an agreement to sell the right to service its conforming, conventional mortgage servicing portfolio of $591,895. First Financial recorded a gain of $1,061 associated with the sale.
Mortgage loans serviced for others are not included in the accompanying Consolidated Balance Sheets. The unpaid principal balances of these loans totaled $66,204, $87,312, and $0 at December 31, 2009, 2008, and 2007, respectively.
5. Restrictions On Cash And Due From Bank Accounts
First Financial’s bank subsidiary is required to maintain average reserve balances either in the form of vault cash or reserves held on deposit with the Federal Reserve Bank, Federal Home Loan Bank, or in pass-through reserve accounts with correspondent banks. The average amounts of these required reserve balances, based upon the average level of First Financial’s transaction accounts, for 2009 and 2008 were approximately $18,879 and $9,639, respectively. Beginning in October of 2008, the Federal Reserve Bank began paying a short-term market interest rate on depository institutions required and excess reserve balances.
6. Restrictions on subsidiary dividends, loans, or advances
Dividends paid by First Financial to its shareholders are principally funded through dividends paid to First Financial by its subsidiaries. However, certain restrictions exist regarding the ability of bank subsidiaries to transfer funds to First Financial in the form of cash dividends, loans, or advances. The approval of the subsidiaries’ respective primary federal regulators is required for First Financial’s subsidiaries to pay dividends in excess of regulatory limitations, which is equal to the net income of the current year through the dividend date, combined with its retained net income of the preceding two years. As of December 31, 2009 First Financial’s subsidiaries had retained earnings of $346,594 of which $223,712 was available for distribution to First Financial without prior regulatory approval.
7. Commitments And Contingencies
In the normal course of business, First Financial offers a variety of financial instruments with off-balance-sheet risk to its clients to aid them in meeting their requirements for liquidity and credit enhancement. These financial instruments include standby letters of credit and outstanding commitments to extend credit. U.S. generally accepted accounting principles do not require these financial instruments to be recorded in the Consolidated Balance Sheets, Consolidated Statements of Income, Consolidated Statements of Changes in Shareholders’ Equity, and Consolidated Statements of Cash Flows. Following is a discussion of these transactions.
First Financial’s exposure to credit loss, in the event of nonperformance by the other party to the financial instrument for standby letters of credit, and outstanding commitments to extend credit, is represented by the contractual amounts of those instruments. First Financial uses the same credit policies in making commitments and conditional obligations as it does for on-balance-sheet instruments.
Standby letters of credit – These transactions are conditional commitments issued by First Financial to guarantee the performance of a client to a third party. First Financial’s portfolio of standby letters of credit consists primarily of performance assurances made on behalf of clients who have a contractual commitment to produce or deliver goods or services. The risk to First Financial arises from its obligation to make payment in the event of the clients’ contractual default to produce the contracted good or service to a third party. First Financial has issued standby letters of credit aggregating $22,857 and $22,523 at December 31, 2009, and December 31, 2008, respectively.
Loan commitments – Commitments to extend credit are agreements to lend to a client as long as there is no violation of any condition established in the commitment. Commitments generally have fixed expiration dates or other termination clauses and may require payment of a fee. Since many of the commitments are expected to expire without being drawn upon, the total commitment amounts do not necessarily represent future cash requirements. First Financial evaluates each client’s creditworthiness on an individual basis. The amount of collateral obtained, if deemed necessary by First Financial upon extension of credit, is based on management’s credit evaluation of the counterparty. The collateral held varies, but may include securities, real estate, inventory, plant, or equipment. First Financial had commitments outstanding to extend credit totaling $1,068,694 and $767,280 at December 31, 2009, and December 31, 2008, respectively.
First Financial Bancorp 2009 Annual Report 39
Notes To Consolidated Financial Statements
Contingencies/litigation – We and our subsidiaries are from time to time engaged in various matters of litigation, other assertions of improper or fraudulent loan practices or lending violations, and other matters, and we have a number of unresolved claims pending. In addition, as part of the ordinary course of business, we and our subsidiaries are parties to litigation involving claims to the ownership of funds in particular accounts, the collection of delinquent accounts, challenges to security interests in collateral, and foreclosure interests, that is incidental to our regular business activities. While the ultimate liability with respect to these other litigation matters and claims cannot be determined at this time, we believe that damages, if any, and other amounts relating to pending matters are not likely to be material to our consolidated financial position or results of operations. Reserves are established for these various matters of litigation, when appropriate under FASB ASC Topic 450, Contingencies, based in part upon the advice of legal counsel.
The use of derivative instruments allows First Financial to meet the needs of its clients while managing the interest-rate risk associated with certain transactions. First Financial’s board of directors has authorized the use of certain derivative products, including interest rate caps, floors, and swaps. First Financial does not use derivatives for speculative purposes and currently does not have any derivatives that are not designated as hedges.
The following table summarizes the derivative financial instruments utilized by First Financial by the nature of the underlying asset or liability:
| | | December 31, 2009 | | | December 31, 2008 | |
| | | Fair Value | | | Cash Flow | | | | | | Fair Value | | | Cash Flow | | | | |
| (Dollars in thousands) | | Hedges | | | Hedges | | | Total | | | Hedges | | | Hedges | | | Total | |
| Instruments associated with: | | | | | | | | | | | | | | | | | | |
| Loans | | $ | 456,077 | | | $ | 0 | | | $ | 456,077 | | | $ | 283,419 | | | $ | 0 | | | $ | 283,419 | |
| Other long-term debt | | | 0 | | | | 20,000 | | | | 20,000 | | | | 0 | | | | 0 | | | | 0 | |
| Total notional value | | $ | 456,077 | | | $ | 20,000 | | | $ | 476,077 | | | $ | 283,419 | | | $ | 0 | | | $ | 283,419 | |
While authorized to use a variety of derivative products, First Financial primarily utilizes interest rate swaps as a means to offer borrowers products that meet their needs and may from time to time utilize interest rate swaps to manage the macro interest rate risk profile of the company. These agreements establish the basis on which interest rate payments are exchanged with counterparties and are referred to as the notional amount. As only interest rate payments are exchanged, cash requirements and credit risk are significantly less than the notional amount and the company’s credit risk exposure is limited to the market value of the instrument.
First Financial manages this market value credit risk through counterparty credit policies. These policies require the company to maintain a total derivative notional position of less than 10% of assets, total credit exposure of less than 3% of capital, and no single counterparty credit risk exposure greater than $20,000. The company is currently well below all single counterparty and portfolio limits. At December 31, 2009, the company had a total counterparty notional amount outstanding of approximately $259,318, spread among six counterparties, with an outstanding liability from these contracts of $3,380. At December 31, 2008, First Financial had a total counterparty notional amount outstanding of $154,061, spread among six counterparties, with a gross credit risk exposure of $9,568.
In connection with its use of derivative instruments, First Financial from time to time is required to post cash collateral with its counterparties to offset its market position. Derivative collateral balances were $11,196 and $12,060 at December 31, 2009, and December 31, 2008, respectively. First Financial classifies the derivative cash collateral outstanding with its counterparties as an adjustment to the fair value of the derivative contracts within accrued interest and other liabilities in the Consolidated Balance Sheets.
The following table summarizes the derivative financial instruments utilized by First Financial and their balances:
| | | | | December 31, 2009 | | | December 31, 2008 | |
| | | | | Notional | | | Estimated Fair Value | | | Notional | | | Estimated Fair Value | |
| (Dollars in thousands) | | Balance Sheet Location | | Amount | | | Gain | | | (Loss) | | | Amount | | | Gain | | | (Loss) | |
| Fair value hedges | | | | | | | | | | | | | | | | | | | | |
| Pay fixed interest rate swaps with counterparty | | Accrued interest and other liabilities | | $ | 22,559 | | | $ | 0 | | | $ | (1,928 | ) | | $ | 24,703 | | | $ | 2 | | | $ | (3,339 | ) |
| Matched interest rate swaps with borrower | | Accrued interest and other assets | | | 216,759 | | | | 10,266 | | | | (32 | ) | | | 129,358 | | | | 15,074 | | | | 0 | |
| Matched interest rate swaps with counterparty | | Accrued interest and other liabilities | | | 216,759 | | | | 32 | | | | (10,661 | ) | | | 129,358 | | | | 0 | | | | (15,020 | ) |
| | | | | | | | | | | | | | | | | | | | | | | | | | | |
| Cash flow hedges | | | | | | | | | | | | | | | | | | | | | | | | | | |
| Trust preferred swap | | Accumulated other comprehensive loss | | | 20,000 | | | | 998 | | | | 0 | | | | 0 | | | | 0 | | | | 0 | |
| Total | | | | $ | 476,077 | | | $ | 11,256 | | | $ | (12,621 | ) | | $ | 283,419 | | | $ | 15,076 | | | $ | (18,359 | ) |
The following table details the derivative financial instruments, the average remaining maturities and the weighted-average interest rates being paid and received by First Financial at December 31, 2009:
| | | | | | Average | | | | | | | |
| | | Notional | | | Maturity | | | Fair | | | Weighted-Average Rate | |
| (Dollars in thousands) | | Value | | | (Years) | | | Value | | | Receive | | | Pay | |
| Asset conversion swaps | | | | | | | | | | | | | | | |
| Pay fixed interest rate swaps with counterparty | | $ | 22,559 | | | | 5.7 | | | $ | (1,928 | ) | | | 2.28 | % | | | 6.82 | % |
| Receive fixed, matched interest rate swaps with borrower | | | 216,759 | | | | 5.1 | | | | 10,194 | | | | 6.35 | % | | | 2.79 | % |
| Pay fixed, matched interest rate swaps with counterparty | | | 216,759 | | | | 5.1 | | | | (10,629 | ) | | | 2.79 | % | | | 6.35 | % |
| Total asset conversion swaps | | $ | 456,077 | | | | 5.1 | | | $ | (2,363 | ) | | | 4.48 | % | | | 4.72 | % |
| | | | | | | | | | | | | | | | | | | | | |
| Liability conversion swaps | | | | | | | | | | | | | | | | | | | | |
| Trust preferred swaps | | $ | 20,000 | | | | 9.2 | | | $ | 998 | | | | 3.35 | % | | | 6.20 | % |
| Total liability conversion swaps | | $ | 20,000 | | | | 9.2 | | | $ | 998 | | | | 3.35 | % | | | 6.20 | % |
| Total swap portfolio | | $ | 476,077 | | | | 5.3 | | | $ | (1,365 | ) | | | 4.43 | % | | | 4.79 | % |
40 First Financial Bancorp 2009 Annual Report
The accounting for changes in the fair value of derivatives depends on the intended use of the derivative and the resulting designation. Derivatives used to hedge the exposure to changes in the fair value of an asset, liability, or firm commitment attributable to a particular risk, such as interest rate risk, are considered fair value hedges. Derivatives used to hedge the exposure to variability in expected future cash flows, or other types of forecasted transactions, are considered cash flow hedges.
Fair Value Hedges - First Financial utilizes interest rate swaps as a means to offer commercial borrowers products that meet their needs, but are also designed to achieve First Financial’s desired interest rate risk profile at the time. The fair value swap agreements generally involve the net receipt by First Financial of floating-rate amounts in exchange for net payments by First Financial, through its loan clients, of fixed-rate amounts over the life of the agreements without an exchange of the underlying principal or notional amount. This results in First Financial’s loan customers receiving fixed rate funding, while providing First Financial with a floating rate asset. The net interest receivable or payable on the interest rate swaps is accrued and recognized as an adjustment to the interest income or interest expense of the hedged item. The fair value of the interest rate swaps is included within accrued interest and other assets on the Consolidated Balance Sheets. The corresponding fair-value adjustment is also included on the Consolidated Balance Sheets in the carrying value of the hedged item. Derivative gains and losses not considered effective in hedging the change in fair value of the hedged item are recognized immediately in income.
The following table details the location and amounts recognized for fair value hedges:
| | | | | Decrease to Interest Income | |
| (Dollars in thousands) | | | | Twelve Months Ended | |
| Derivatives in fair value hedging relationships | | Location of change in fair value recognized in earning on derivative | | December 31, 2009 | | | December 31, 2008 | |
| Interest rate contracts | | | | | | | | |
| Loans | | Interest Income – Loans | | $ | (1,008 | ) | | $ | (466 | ) |
| Total | | | | $ | (1,008 | ) | | $ | (466 | ) |
Cash Flow Hedges – First Financial utilizes interest rate swaps designated as cash flow hedges to manage the variability of cash flows, primarily net interest income, attributable to changes in interest rates. The net interest receivable or payable on an interest rate swap designated as a cash flow hedge is accrued and recognized as an adjustment to interest income or interest expense. The fair value of the interest rate swaps is included within accrued interest and other assets on the Consolidated Balance Sheets. Changes in the fair value of the interest rate swap are included in accumulated comprehensive income (loss). Derivative gains and losses not considered effective in hedging the cash flows related to the hedged item, if any, would be recognized immediately in income. All of First Financial’s cash flow hedges are considered effective.
Effective March 30, 2009, First Financial executed a cash flow hedge utilizing an interest rate swap to hedge against interest rate volatility on $20,000 of floating rate trust preferred securities indexed to the London Inter-Bank Offered Rate (LIBOR). The interest rate swap involves the receipt by First Financial of variable-rate interest amounts in exchange for fixed-rate interest payments by First Financial for a period of 10 years. The net interest receivable or payable on the trust preferred interest rate swap is accrued and recognized as an adjustment to interest expense. The fair value of the trust preferred interest rate swap is included in accrued interest and other assets or liabilities on the Consolidated Balance Sheets. Changes in the fair value of the trust preferred interest rate swap are included in accumulated other comprehensive income (loss) on the Consolidated Balance Sheets.
The following table details the location and amounts recognized for cash flow hedges:
| | | | | | | | | | Amount of Gain or (Loss) Reclassified | |
| | | Amount of Gain Recognized in | | | | from Accumulated OCI into Earnings | |
| | | OCI on Derivatives (Effective Portion) | | | | (Effective Portion) | |
| (Dollars in thousands) | | Twelve Months Ended | | | | Twelve Months Ended | |
| Derivatives in cash flow hedging relationships | | December 31, 2009 | | | December 31, 2008 | | Location of change in fair value recognized in earnings on derivative | | December 31, 2009 | | | December 31, 2008 | |
| Interest rate contracts | | | | | | | | | | | | | |
| | | | | | | | Interest Income – | | | | | | |
| Other long-term debt | | $ | 636 | | | $ | 0 | | other long-term debt | | $ | (369 | ) | | $ | 273 | |
| Total | | $ | 636 | | | $ | 0 | | | | $ | (369 | ) | | $ | 273 | |
First Financial expects approximately $362 of the unrecognized losses on cash flow hedges, net of taxes, at December 31, 2009 to be reclassified into earnings within the next 12 months.
First Financial Bancorp 2009 Annual Report 41
Notes To Consolidated Financial Statements
The following is a summary of investment securities as of December 31, 2009:
| | | Held-to-Maturity | | | Available-for-Sale | |
| | | Amortized | | | Unrealized | | | Unrealized | | | Market | | | Amortized | | | Unrealized | | | Unrealized | | | Market | |
| (Dollars in thousands) | | Cost | | | Gains | | | Losses | | | Value | | | Cost | | | Gains | | | Losses | | | Value | |
| U.S. Treasuries | | $ | 13,857 | | | $ | 204 | | | $ | (31 | ) | | $ | 14,030 | | | | | | | | | | | | | |
| Securities of U.S. government | | | | | | | | | | | | | | | | | | | | | | | | | | | | |
| agencies and corporations | | | | | | | | | | | | | | | | | | $ | 20,036 | | | $ | 585 | | | $ | 0 | | | $ | 20,621 | |
| Mortgage-backed securities | | | 149 | | | | 1 | | | | 0 | | | | 150 | | | | 407,221 | | | | 15,407 | | | | (369 | ) | | | 422,259 | |
| Obligations of state and | | | | | | | | | | | | | | | | | | | | | | | | | | | | | | | | |
| other political subdivisions | | | 4,109 | | | | 301 | | | | 0 | | | | 4,410 | | | | 17,949 | | | | 303 | | | | (130 | ) | | | 18,122 | |
| Other securities | | | 0 | | | | 0 | | | | 0 | | | | 0 | | | | 9,747 | | | | 266 | | | | (13 | ) | | | 10,000 | |
| Total | | $ | 18,115 | | | $ | 506 | | | $ | (31 | ) | | $ | 18,590 | | | $ | 454,953 | | | $ | 16,561 | | | $ | (512 | ) | | $ | 471,002 | |
The following is a summary of investment securities as of December 31, 2008:
| | | Held-to-Maturity | | | Available-for-Sale | |
| | | Amortized | | | Unrealized | | | Unrealized | | | Market | | | Amortized | | | Unrealized | | | Unrealized | | | Market | |
| (Dollars in thousands) | | Cost | | | Gains | | | Losses | | | Value | | | Cost | | | Gains | | | Losses | | | Value | |
| Securities of U.S. government | | | | | | | | | | | | | | | | | | | | | | | | |
| agencies and corporations | | | | | | | | | | | | | | $ | 44,951 | | | $ | 1,731 | | | $ | 0 | | | $ | 46,682 | |
| Mortgage-backed securities | | $ | 190 | | | $ | 0 | | | $ | (1 | ) | | $ | 189 | | | | 563,341 | | | | 9,640 | | | | (465 | ) | | | 572,516 | |
| Obligations of state and | | | | | | | | | | | | | | | | | | | | | | | | | | | | | | | | |
| other political subdivisions | | | 4,776 | | | | 170 | | | | 0 | | | | 4,946 | | | | 35,992 | | | | 461 | | | | (301 | ) | | | 36,152 | |
| Other securities | | | 0 | | | | 0 | | | | 0 | | | | 0 | | | | 4,561 | | | | 73 | | | | (228 | ) | | | 4,406 | |
| Total | | $ | 4,966 | | | $ | 170 | | | $ | (1 | ) | | $ | 5,135 | | | $ | 648,845 | | | $ | 11,905 | | | $ | (994 | ) | | $ | 659,756 | |
During the year ended December 31, 2009, First Financial sold available-for-sale securities with a fair value of $152,751 at the date of sale and recorded a $3,349 gross gain. There was a net investment gain after taxes of $2,111 for the year ended December 31, 2009. The applicable income tax effect was an expense of $1,238 for 2009.
During the year ended December 31, 2008, no available-for-sale securities were sold. However, a $1,585 gain was recorded on the redemption of Visa Inc. common shares upon its initial public offering. There was a net investment gain after taxes of $996 for the year ended December 31, 2008. The applicable income tax effect was an expense of $589 for 2008.
During the year ended December 31, 2007, no available-for-sale securities were sold. However, a $367 gain was recorded on the redemption of MasterCard Incorporated common shares upon its initial public offering. There was a net investment gain after taxes of $233 for the year ended December 31, 2007. The applicable income tax effect was an expense of $134 for 2007.
The carrying value of investment securities pledged as collateral to secure public deposits, repurchase agreements, and for other purposes as required by law totaled $437,013 at December 31, 2009, and $466,096 at December 31, 2008.
The amortized cost and market value of investment securities, including mortgage-backed securities at December 31, 2009, by estimated lives, are shown in the table that follows.
Estimated lives on mortgage-backed securities may differ from contractual maturities as issuers may have the right to call or prepay obligations with or without call or prepayment penalties.
The following is a summary of investment securities by estimated maturity as of December 31, 2009:
| | | Held-to-Maturity | | | Available-for-Sale | |
| | | Amortized | | | Market | | | Amortized | | | Market | |
| (Dollars in thousands) | | Cost | | | Value | | | Cost | | | Value | |
| Due in one year or less | | $ | 7,281 | | | $ | 7,353 | | | $ | 9,921 | | | $ | 10,080 | |
| Due after one year through five years | | | 9,401 | | | | 9,680 | | | | 309,631 | | | | 322,048 | |
| Due after five years through ten years | | | 456 | | | | 497 | | | | 93,063 | | | | 95,440 | |
| Due after ten years | | | 977 | | | | 1,060 | | | | 42,338 | | | | 43,434 | |
| Total | | $ | 18,115 | | | $ | 18,590 | | | $ | 454,953 | | | $ | 471,002 | |
42 First Financial Bancorp 2009 Annual Report
The following tables present the age of gross unrealized losses and associated fair value by investment category for both available-for-sale and held-to-maturity securities.
| | | December 31, 2009 | |
| | | Less than 12 Months | | | 12 Months or More | | | Total | |
| | | | | | Unrealized | | | | | | Unrealized | | | | | | Unrealized | |
| (Dollars in thousands) | | Fair Value | | | Loss | | | Fair Value | | | Loss | | | Fair Value | | | Loss | |
| U.S. Treasuries | | $ | 2,277 | | | $ | 31 | | | $ | 0 | | | $ | 0 | | | $ | 2,277 | | | $ | 31 | |
| Mortgage-backed securities | | | 23,800 | | | | 266 | | | | 1,608 | | | | 103 | | | | 25,408 | | | | 369 | |
| Obligations of state and other political subdivisions | | | 621 | | | | 10 | | | | 1,540 | | | | 120 | | | | 2,161 | | | | 130 | |
| Other securities | | | 312 | | | | 13 | | | | 0 | | | | 0 | | | | 312 | | | | 13 | |
| Total | | $ | 27,010 | | | $ | 320 | | | $ | 3,148 | | | $ | 223 | | | $ | 30,158 | | | $ | 543 | |
| | | December 31, 2008 | |
| | | Less than 12 Months | | | 12 Months or More | | | Total | |
| | | | | | Unrealized | | | | | | Unrealized | | | | | | Unrealized | |
| (Dollars in thousands) | | Fair Value | | | Loss | | | Fair Value | | | Loss | | | Fair Value | | | Loss | |
| Securities of U.S. government agencies and corporations | | $ | 11 | | | $ | 0 | | | $ | 0 | | | $ | 0 | | | $ | 11 | | | $ | 0 | |
| Mortgage-backed securities | | | 32,362 | | | | 311 | | | | 15,925 | | | | 154 | | | | 48,287 | | | | 465 | |
| Obligations of state and other political subdivisions | | | 1,904 | | | | 284 | | | | 659 | | | | 17 | | | | 2,563 | | | | 301 | |
| Other securities | | | 44 | | | | 0 | | | | 1,787 | | | | 228 | | | | 1,831 | | | | 228 | |
| Total | | $ | 34,321 | | | $ | 595 | | | $ | 18,371 | | | $ | 399 | | | $ | 52,692 | | | $ | 994 | |
Unrealized losses on debt securities are generally due to higher current market yields relative to the yields of the debt securities at their amortized cost. Unrealized losses due to credit risk associated with the underlying collateral of the debt security, if any, are not material. All securities with unrealized losses are reviewed quarterly to determine if any impairment is other than temporary, requiring a write-down to fair market value. First Financial considers the percentage loss on a security, duration of loss, average life or duration of the security, credit rating of the security, as well as payment performance and the company’s intent and ability to hold the security to maturity when determining whether any impairment is other than temporary. First Financial has the intent and ability to hold all debt security issues temporarily impaired until maturity or recovery of book value. First Financial had no other than temporary impairment charges for the years ended December 31, 2009, 2008, or 2007.
First Financial had trading securities with a fair value of $200 and $61 at December 31, 2009 and 2008, respectively. For further detail on the fair value of investment securities, see Note 21 - Fair Value Disclosures.
10. Loans (Excluding Covered Loans)
Information as to nonaccrual, restructured, and impaired loans at December 31 was as follows:
| (Dollars in thousands) | | 2009 | | | 2008 | | | 2007 | |
| Principal balance | | | | | | | | | |
| Nonaccrual loans | | | | | | | | | |
| Commercial | | $ | 13,756 | | | $ | 5,930 | | | $ | 2,677 | |
| Real estate – construction | | | 35,604 | | | | 240 | | | | 0 | |
| Real estate – commercial | | | 15,320 | | | | 4,779 | | | | 5,965 | |
| Real estate – residential | | | 3,993 | | | | 5,363 | | | | 3,063 | |
| Installment | | | 660 | | | | 459 | | | | 734 | |
| Home equity | | | 2,324 | | | | 1,204 | | | | 1,662 | |
| All other | | | 0 | | | | 6 | | | | 12 | |
| Total nonaccrual loans | | | 71,657 | | | | 17,981 | | | | 14,113 | |
| Restructured loans | | | 6,125 | | | | 204 | | | | 567 | |
| Total | | $ | 77,782 | | | $ | 18,185 | | | $ | 14,680 | |
| | | | | | | | | | | | | |
| Impaired loans requiring a valuation allowance of $11,662 in 2009, $864 in 2008, and $2,638 in 2007 | | $ | 27,666 | | | $ | 1,472 | | | $ | 4,764 | |
| Impaired loans not requiring a valuation allowance | | | 49,437 | | | | 16,509 | | | | 9,348 | |
| Total impaired loans | | $ | 77,103 | | | $ | 17,981 | | | $ | 14,113 | |
| Average impaired loans for the year | | $ | 44,212 | | | $ | 15,085 | | | $ | 12,530 | |
| | | | | | | | | | | | | |
| Interest income effect | | | | | | | | | | | | |
| Gross amount of interest that would have been recorded under original terms | | $ | 4,576 | | | $ | 1,221 | | | $ | 1,334 | |
| Interest included in income | | | | | | | | | | | | |
| Nonaccrual loans | | | 2,384 | | | | 569 | | | | 538 | |
| Restructured loans | | | 35 | | | | 16 | | | | 43 | |
| Total interest included in income | | | 2,419 | | | | 585 | | | | 581 | |
| Net impact on interest income | | $ | 2,157 | | | $ | 636 | | | $ | 753 | |
| | | | | | | | | | | | | |
| Commitments outstanding to borrowers with nonaccrual loans | | $ | 4 | | | $ | 712 | | | $ | 0 | |
First Financial Bancorp 2009 Annual Report 43
Notes To Consolidated Financial Statements
The allowances for loan and lease losses related to loans that are identified as impaired, as defined by FASB ASC 310-10-35-4, are based on discounted cash flows using the loan’s initial effective interest rate or the fair value of the collateral for certain collateral dependent loans. Interest income for impaired loans is recorded on a cash basis during the period the loan is considered impaired after recovery of principal is reasonable assured.
Changes in the allowance for loan and lease losses for the three years ended December 31 were as follows:
| (Dollars in thousands) | | 2009 | | | 2008 | | | 2007 | |
| Balance at beginning of year | | $ | 35,873 | | | $ | 29,057 | | | $ | 27,386 | |
| Provision for loan and lease losses | | | 56,084 | | | | 19,410 | | | | 7,652 | |
| Loans charged-off | | | (34,949 | ) | | | (14,637 | ) | | | (9,422 | ) |
| Recoveries | | | 2,303 | | | | 2,043 | | | | 3,441 | |
| Balance at end of year | | $ | 59,311 | | | $ | 35,873 | | | $ | 29,057 | |
The balances of other real estate acquired through loan foreclosures, repossessions, or other workout situations are carried at net realizable value. Changes in other real estate owned for the three years ended December 31 were as follows:
| (Dollars in thousands) | | 2009 | | | 2008 | | | 2007 | |
| Balance at beginning of year | | $ | 4,028 | | | $ | 2,636 | | | $ | 2,334 | |
| Additions | | | | | | | | | | | | |
| Commercial | | | 3,074 | | | | 1,454 | | | | 1,596 | |
| Residential | | | 3,062 | | | | 2,196 | | | | 602 | |
| Total additions | | | 6,136 | | | | 3,650 | | | | 2,198 | |
| Disposals | | | | | | | | | | | | |
| Commercial | | | 3,237 | | | | 1,154 | | | | 1,054 | |
| Residential | | | 2,428 | | | | 631 | | | | 680 | |
| Total disposals | | | 5,665 | | | | 1,785 | | | | 1,734 | |
| Write-downs | | | | | | | | | | | | |
| Commercial | | | 55 | | | | 454 | | | | 108 | |
| Residential | | | 299 | | | | 19 | | | | 54 | |
| Total write-downs | | | 354 | | | | 473 | | | | 162 | |
| Balance at end of year | | $ | 4,145 | | | $ | 4,028 | | | $ | 2,636 | |
First Financial evaluated loans purchased in conjunction with the acquisitions of Peoples and Irwin described in Note 3, Business Combinations, for impairment in accordance with the provisions of FASB ASC Topic 310-30, Loans and Debt Securities Acquired with Deteriorated Credit Quality. Purchased loans are considered impaired if there is evidence of credit deterioration since origination and if it is probable that not all contractually required payments will be collected. The following table reflects the carrying value of all purchased impaired and nonimpaired loans as of December 31, 2009 for both the Peoples and Irwin FDIC-assisted transactions:
| | | | | | Loans Excluded | | | | |
| | | FASB ASC | | | from FASB ASC | | | Total Purchased | |
| (Dollars in thousands) | | Topic 310-30 | | | Topic 310-30(1) | | | Loans | |
| Commercial | | $ | 422,257 | | | $ | 87,470 | | | $ | 509,727 | |
| Real estate – construction | | | 86,810 | | | | 0 | | | | 86,810 | |
| Real estate – commercial | | | 1,000,378 | | | | 11,795 | | | | 1,012,173 | |
| Real estate – residential | | | 213,674 | | | | 77,536 | | | | 291,210 | |
| Installment | | | 9,979 | | | | 0 | | | | 9,979 | |
| Other covered loans | | | 0 | | | | 19,650 | | | | 19,650 | |
| Total covered loans | | $ | 1,733,098 | | | $ | 196,451 | | | $ | 1,929,549 | |
(1) Includes loans with revolving privileges which are scoped out of FASB ASC Topic 310-30 and certain loans which First Financial has elected to treat under the cost recovery method of accounting.
44 First Financial Bancorp 2009 Annual Report
As of the respective acquisition dates, the preliminary estimates of contractually required payments receivable, including interest, for all impaired loans acquired in the Peoples and Irwin transactions were $1.1 billion. The cash flows expected to be collected as of the acquisition dates for these loans were $738.1 million, including interest. These amounts were determined based upon the estimated remaining life of the underlying loans, which includes the effects of estimated prepayments. These loans were not classified as nonperforming assets at December 31, 2009 as the loans are accounted for on a pooled basis and the pools are considered to be performing. Therefore, interest income, through accretion of the difference between the carrying amount of the loans and the expected cash flows, is being recognized on all purchased impaired loans.
Changes in the carrying amount of accretable yield for purchased impaired and nonimpaired loans were as follows at December 31, 2009 for both Peoples and Irwin:
| | | Accretable | | | Carrying Amount | |
| (Dollars in thousands) | | Yield | | | of Loan | |
| Balance at beginning of period | | $ | 0 | | | $ | 0 | |
Additions(1) | | | 553,831 | | | | 1,862,642 | |
| Accretion | | | (51,753 | ) | | | 51,753 | |
| Payments received, net | | | 0 | | | | (181,289 | ) |
| Balance at end of period | | $ | 502,078 | | | $ | 1,733,106 | |
(1) Represents the fair value of the loans at the date of acquisition. Excludes covered loans with revolving privileges which are scoped out of FASB ASC Topic 310-30 and certain loans which First Financial has elected to value under the cost recovery method of accounting.
As of the respective acquisition dates, the preliminary estimates of the contractually required payments receivable, including interest, for all nonimpaired loans acquired in the Peoples and Irwin transactions were $2.2 billion. The cash flows expected to be collected as of the acquisition dates for these loans were $1.8 billion, including interest. The difference between the carrying value of the purchased nonimpaired loans and the expected cash flows is being accreted to interest income over the remaining life of the loans.
There were no allowances for loan and lease losses related to the purchased impaired and nonimpaired loans at December 31, 2009.
First Financial and the FDIC are engaged in on-going discussions that may impact which assets and liabilities are ultimately acquired or assumed by First Financial and/or the purchase prices. The estimated fair values for the purchased impaired and nonimpaired loans were based upon the FDIC’s estimated data for acquired loans. First Financial anticipates the final determination of the acquired loans will be completed in the first quarter of 2010 and expects to finalize its analysis of these loans when this occurs.
12. Premises and Equipment
Premises and equipment at December 31 were summarized as follows:
| (Dollars in thousands) | | 2009 | | | 2008 | |
| Land and land improvements | | $ | 31,141 | | | $ | 26,690 | |
| Buildings | | | 90,681 | | | | 71,809 | |
| Furniture and fixtures | | | 48,965 | | | | 40,506 | |
| Leasehold improvements | | | 9,268 | | | | 8,821 | |
| Construction in progress | | | 4,333 | | | | 4,760 | |
| | | | 184,388 | | | | 152,586 | |
| | | | | | | | | |
| Less accumulated depreciation | | | | | | | | |
| and amortization | | | 77,037 | | | | 68,481 | |
| Total | | $ | 107,351 | | | $ | 84,105 | |
Rental expense recorded under operating leases in 2009, 2008, and 2007, was $7,659, $2,072, and $2,289, respectively.
Future minimum lease payments for operating leases are as follows:
| | | December 31, | |
| (Dollars in thousands) | | 2009 | |
| 2010 | | $ | 11,512 | |
| 2011 | | | 10,731 | |
| 2012 | | | 4,860 | |
| 2013 | | | 2,715 | |
| 2014 | | | 1,721 | |
| Thereafter | | | 2,520 | |
| Total | | $ | 34,059 | |
First Financial Bancorp 2009 Annual Report 45
Notes To Consolidated Financial Statements
The following is a summary of short-term borrowings for the last three years:
| | | 2009 | | | 2008 | | | 2007 | |
| (Dollars in thousands) | | Amount | | | Rate | | | Amount | | | Rate | | | Amount | | | Rate | |
| At year end | | | | | | | | | | | | | | | | | | |
| Federal funds purchased and securities | | | | | | | | | | | | | | | | | | |
| sold under agreements to repurchase | | $ | 37,430 | | | | 0.19 | % | | $ | 147,533 | | | | 0.29 | % | | $ | 26,289 | | | | 2.56 | % |
| Federal Home Loan Bank borrowings | | | 0 | | | | N/A | | | | 150,000 | | | | 0.67 | % | | | 0 | | | | N/A | |
| Other short-term borrowings | | | 0 | | | | N/A | | | | 57,000 | | | | 1.14 | % | | | 72,000 | | | | 5.32 | % |
| Total | | $ | 37,430 | | | | 0.19 | % | | $ | 354,533 | | | | 0.59 | % | | $ | 98,289 | | | | 4.58 | % |
| | | | | | | | | | | | | | | | | | | | | | | | | |
| Average for the year | | | | | | | | | | | | | | | | | | | | | | | | |
| Federal funds purchased and securities | | | | | | | | | | | | | | | | | | | | | | | | |
| sold under agreements to repurchase | | $ | 99,865 | | | | 0.25 | % | | $ | 46,913 | | | | 1.15 | % | | $ | 34,691 | | | | 2.60 | % |
| Federal Home Loan Bank borrowings | | | 114,636 | | | | 0.37 | % | | | 118,550 | | | | 2.05 | % | | | 0 | | | | N/A | |
| Other short-term borrowings | | | 29,512 | | | | 2.20 | % | | | 56,680 | | | | 3.28 | % | | | 58,018 | | | | 5.74 | % |
| Total | | $ | 244,013 | | | | 0.54 | % | | $ | 222,143 | | | | 2.17 | % | | $ | 92,709 | | | | 4.56 | % |
| | | | | | | | | | | | | | | | | | | | | | | | | |
| Maximum month-end balances | | | | | | | | | | | | | | | | | | | | | | | | |
| Federal funds purchased and securities | | | | | | | | | | | | | | | | | | | | | | | | |
| sold under agreements to repurchase | | $ | 240,557 | | | | | | | $ | 147,533 | | | | | | | $ | 49,928 | | | | | |
| Federal Home Loan Bank borrowings | | | 250,000 | | | | | | | | 248,000 | | | | | | | | 0 | | | | | |
| Other short-term borrowings | | | 58,000 | | | | | | | | 73,000 | | | | | | | | 78,500 | | | | | |
Repurchase Agreements are utilized for corporate sweep accounts, on which Cash Management Account Agreements are in place. All are subject to the terms and conditions of Repurchase/Security Agreements between First Financial Bank and client. To secure the bank’s liability to the client, First Financial Bank is authorized to sell or repurchase U.S. Treasury, government agencies, and mortgage-backed securities.
First Financial maintains a short-term revolving credit facility with an unaffiliated bank. This facility provides First Financial additional liquidity for various corporate activities, including the repurchase of First Financial shares and the payment of dividends to shareholders. As of December 31, 2009, there was no outstanding balance. The outstanding balance of this account varies throughout the year depending on First Financial’s cash needs. First Financial renewed the credit facility during the first quarter of 2009 for a period of one year with an an amended, maximum outstanding balance of $40,000. The credit facility was subsequently amended to reduce the maximum outstanding balance to $25,000. The variable interest rate on this line is the overnight London Inter-Bank Offered Rate (LIBOR) plus a spread. The credit agreement requires First Financial to maintain certain covenants including return on average assets and those related to capital levels. As of December 31, 2009, and 2008, First Financial was in compliance with all required covenants.
Long-term debt on the Consolidated Balance Sheets consists of FHLB long-term advances and repurchase agreements utilizing investment securities pledged as collateral. These instruments are primarily utilized to reduce overnight liquidity risk and to mitigate interest rate sensitivity on the balance sheet. During the third quarter of 2008, First Financial executed $115,000 of these term debt instruments utilizing a combination of its funding sources such as pledging investment securities to collateralize $65,000 in repurchase agreements and borrowing $50,000 from the FHLB. The $115,000 of borrowings have remaining maturities between one and three years and a weighted average rate of 3.63%. Securities pledged as collateral in conjunction with the repurchase agreements are included within Investment securities available-for-sale on the Consolidated Balance Sheets. First Financial assumed additional FHLB long-term advances in the Peoples and Irwin acquisitions of $63,500 and $216,300, respectively. As of December 31, 2009, the FHLB long-term advances assumed in the two transactions totaled $253,892 and had remaining maturities between one and 15 years and a weighted average rate of 4.72%.
FHLB advances, both short-term and long-term, were secured by certain commercial and residential real estate loans, as well as certain government and agency securities, with a book value of $2,602,674 at December 31, 2009. For ease of borrowing execution, First Financial utilizes a blanket collateral agreement with the FHLB.
The following is a summary of long-term debt:
| (Dollars in thousands) | | December 31, 2009 | |
| | | Amount | | | Average Rate | |
| Federal Home Loan Bank | | $ | 339,716 | | | | 2.53 | % |
| National Market Repurchase Agreement | | | 65,000 | | | | 3.50 | % |
| Total long-term debt | | $ | 404,716 | | | | 2.69 | % |
As of December 31, 2009, the long-term debt matures as follows:
| | | | | | Repurchase | |
| (Dollars in thousands) | | FHLB | | | Agreement | |
| 2010 | | $ | 895 | | | $ | 0 | |
| 2011 | | | 50,001 | | | | 0 | |
| 2012 | | | 55,372 | | | | 0 | |
| 2013 | | | 537 | | | | 12,500 | |
| 2014 | | | 0 | | | | 27,500 | |
| Thereafter | | | 232,911 | | | | 25,000 | |
| Total | | $ | 339,716 | | | $ | 65,000 | |
Other long-term debt appearing on the Consolidated Balance Sheets consists of junior subordinated debentures owed to unconsolidated subsidiary trusts. Capital securities were issued in the third quarter of 2003 by a statutory business trust, First Financial (OH) Statutory Trust II (Trust II), and in the third quarter of 2002 by First Financial (OH) Statutory Trust I (Trust I).
The debentures issued in 2002 were eligible for early redemption by First Financial in September 2007, with a final maturity in 2032. In September 2007, First Financial redeemed all the underlying capital securities relating to Trust I. The total outstanding capital securities redeemed were $10,000. The debentures issued in 2003 were eligible for early redemption by First Financial in September 2008. First Financial did not elect to redeem early, but under the terms of the agreement may redeem the securities on any interest payment date after September 2008, with a final maturity in 2033.
46 First Financial Bancorp 2009 Annual Report
First Financial owns 100% of the common equity of the remaining trust, Trust II. The trust was formed with the sole purpose of issuing the capital securities and investing the proceeds from the sale of such capital securities in the debentures. The debentures held by the trust are the sole asset of the trust. Distributions on the capital securities are payable quarterly at a variable rate of interest, which is equal to the interest rate being earned by the trust on the debentures and are recorded as interest expense of First Financial. The interest rate is subject to change every three months, indexed to the three-month LIBOR. During the the first quarter of 2009, First Financial executed a cash flow hedge utilizing an interest rate swap to hedge against interest rate volatility on the $20,000 of floating rate trust preferred securities. The interest rate swap involves the receipt by First Financial of variable-rate interest amounts in exchange for fixed-rate interest payments by First Financial for a period of 10 years.
First Financial has the option to defer interest for up to five years on the debentures. However, the covenants prevent the payment of dividends on First Financial’s common stock if the interest is deferred. The capital securities are subject to mandatory redemption, in whole or in part, upon repayment of the debentures. First Financial has entered into agreements which, taken collectively, fully or unconditionally guarantee the capital securities subject to the terms of the guarantees. The debenture currently qualifies as Tier I capital under Federal Reserve Board guidelines, but is limited to 25% of qualifying Tier I capital. The company has the capacity to issue approximately $65,752 in additional qualifying debentures under these guidelines.
The following is a summary of other long-term debt:
| | | December 31, 2009 | |
| (Dollars in thousands) | | Amount | | | Contractual Rate | | Maturity Date | |
| First Financial (OH) Statutory | | | | | | | | |
| Trust II | | $ | 20,000 | | | | 3.35 | % | 9/30/2033 | |
Effective March 30, 2009, First Financial executed a cash flow hedge utilizing an interest rate swap to hedge against interest rate volatility on $20,000 of floating rate trust preferred securities indexed to the London Inter-Bank Offered Rate (LIBOR). The interest rate swap involves the receipt by First Financial of variable-rate interest amounts in exchange for fixed-rate interest payments by First Financial for a period of 10 years. This interest rate swap effectively fixed the rate of interest on the floating rate trust preferred securities at 6.20% for the 10 year life of the swap. The net interest receivable or payable on the trust preferred interest rate swap is accrued and recognized as an adjustment to interest expense. The fair value of the trust preferred interest rate swap is included in accrued interest and other assets or liabilities on the Consolidated Balance Sheets. Changes in the fair value of the trust preferred interest rate swap are included in accumulated other comprehensive income (loss) on the Consolidated Balance Sheets
Income tax expense consisted of the following components:
| (Dollars in thousands) | | 2009 | | | 2008 | | | 2007 | |
| Current expense | | | | | | | | | |
| Federal | | $ | 14,859 | | | $ | 14,011 | | | $ | 19,820 | |
| State | | | 1,168 | | | | 602 | | | | 1,526 | |
| Total | | | 16,027 | | | | 14,613 | | | | 21,346 | |
| Deferred expense (benefit) | | | | | | | | | | | | |
| Federal | | | 116,674 | | | | (4,053 | ) | | | (3,207 | ) |
| State | | | 11,321 | | | | (157 | ) | | | (131 | ) |
| Total | | | 127,995 | | | | (4,210 | ) | | | (3,338 | ) |
| Income tax expense | | $ | 144,022 | | | $ | 10,403 | | | $ | 18,008 | |
The difference between the federal income tax rates, applied to income before income taxes, and the effective rates were due to the following:
| (Dollars in thousands) | | 2009 | | | 2008 | | | 2007 | |
| Income taxes computed at federal | | | | | | | | | |
| statutory rate (35%) on income | | | | | | | | | |
| before income taxes | | $ | 136,699 | | | $ | 11,678 | | | $ | 18,791 | |
| Tax-exempt income | | | (754 | ) | | | (982 | ) | | | (1,238 | ) |
| Bank-owned life insurance | | | (255 | ) | | | (798 | ) | | | (763 | ) |
| Tax credits | | | (380 | ) | | | 0 | | | | 0 | |
| State income taxes, net of federal | | | | | | | | | | | | |
| tax benefit | | | 8,118 | | | | 289 | | | | 907 | |
| Other | | | 594 | | | | 216 | | | | 311 | |
| Income tax expense | | $ | 144,022 | | | $ | 10,403 | | | $ | 18,008 | |
The major components of the temporary differences that give rise to deferred tax assets and liabilities at December 31, 2009, and 2008, were as follows:
| (Dollars in thousands) | | 2009 | | | 2008 | |
| Deferred tax assets | | | | | | |
| Allowance for loan and lease losses | | $ | 22,019 | | | $ | 13,059 | |
| Deferred compensation | | | 328 | | | | 272 | |
Mark to market adjustment on loans and derivatives | | | 433 | | | | 295 | |
Postretirement benefits other than pension liability | | | 184 | | | | 210 | |
| Accrued stock-based compensation | | | 817 | | | | 822 | |
| Other reserves | | | 4,891 | | | | 0 | |
| Accrued expenses | | | 1,180 | | | | 0 | |
| Loss on preferred securities | | | 1,775 | | | | 1,791 | |
| Other | | | 1,329 | | | | 440 | |
| Total deferred tax assets | | | 32,956 | | | | 16,889 | |
| Deferred tax liabilities | | | | | | | | |
Tax depreciation greater than book depreciation | | | (4,441 | ) | | | (2,739 | ) |
| FHLB and FRB stock | | | (22,484 | ) | | | (3,368 | ) |
| Mortgage-servicing rights | | | (734 | ) | | | (145 | ) |
| Leasing activities | | | (2,862 | ) | | | (16 | ) |
| Deferred section 597 gain | | | (97,850 | ) | | | 0 | |
| Prepaid pension | | | (17,270 | ) | | | (6,054 | ) |
| Intangible assets | | | (5,740 | ) | | | (4,195 | ) |
| Deferred loan fees and costs | | | (3,363 | ) | | | (91 | ) |
| Prepaid expenses | | | (1,075 | ) | | | (538 | ) |
| Fair value adjustments on acquisitions | | | (5,831 | ) | | | (582 | ) |
| Other | | | (810 | ) | | | (670 | ) |
| Total deferred tax liabilities | | | (162,460 | ) | | | (18,398 | ) |
| Net deferred tax liability recognized through | | | | | | | | |
| the Consolidated Statements of Income | | | (129,504 | ) | | | (1,509 | ) |
| Net deferred tax asset related to accumulated | | | | | | | | |
| other comprehensive income (loss) items, | | | | | | | | |
| recognized in equity section of the Consolidated | | | | | | | | |
| Balance Sheets: | | | | | | | | |
| Unfunded pension obligation | | | 12,388 | | | | 11,226 | |
| Unrealized gain on AFS securities | | | (5,825 | ) | | | (3,972 | ) |
| Unrealized gain on derivatives | | | (530 | ) | | | (440 | ) |
| Net deferred tax asset related to AOCI | | | 6,033 | | | | 6,814 | |
| Total net deferred tax (liability) asset | | $ | (123,471 | ) | | $ | 5,305 | |
First Financial Bancorp 2009 Annual Report 47
Notes To Consolidated Financial Statements
At December 31, 2009, and 2008, First Financial had no FASB ASC Topic 740-10 unrecognized tax benefits recorded. First Financial does not expect the total amount of unrecognized tax benefits to significantly increase within the next twelve months.
First Financial recognizes interest and penalties on income tax assessments or income tax refunds in the Consolidated Financial Statements as a component of noninterest expense.
First Financial and its subsidiaries are subject to U.S. federal income tax as well as state and local income tax in several jurisdictions. Tax years prior to 2008 have been closed and are no longer subject to U.S. federal income tax examinations.
First Financial is no longer subject to state and local income tax examinations for years prior to 2006. First Financial’s 2006 and 2007 tax years are currently under examination by the state of Indiana. Management anticipates no material impact to the Corporation’s financial position as a result of this examination. Tax years 2006 through 2008 remain open to state and local examination by various jurisdictions.
15. Accumulated Other Comprehensive Income (Loss)
Shareholders’ equity is affected by transactions and valuations of asset and liability positions that require adjustments to accumulated other comprehensive income (loss). Disclosure of the related tax effects allocated to other comprehensive income and accumulated other comprehensive income (loss) were as follows:
Accumulated other comprehensive income (loss)
| | | December 31, 2009 | |
| | | Transactions | | | Balances | |
| (Dollars in thousands) | | Pre-tax | | | Tax-effect | | | Net of tax | | | Net of tax | |
| Unrealized gain on securities available-for-sale | | $ | 5,138 | | | $ | (1,853 | ) | | $ | 3,285 | | | $ | 10,224 | |
| Unrealized loss on derivatives | | | 251 | | | | (89 | ) | | | 162 | | | | 931 | |
| Unfunded pension obligation | | | (3,310 | ) | | | 1,162 | | | | (2,148 | ) | | | (21,761 | ) |
| Foreign currency translation | | | 119 | | | | 0 | | | | 119 | | | | 119 | |
| Total | | $ | 2,198 | | | $ | (780 | ) | | $ | 1,418 | | | $ | (10,487 | ) |
| | | December 31, 2008 | |
| | | Transactions | | | Balances | |
| (Dollars in thousands) | | Pre-tax | | | Tax-effect | | | Net of tax | | | Net of tax | |
| Cumulative adjustment for accounting change-fair value option | | $ | 1,181 | | | $ | (431 | ) | | $ | 750 | | | $ | 0 | |
| Unrealized gain on securities available-for-sale | | | 9,214 | | | | (3,353 | ) | | | 5,861 | | | | 6,939 | |
| Unrealized gain on derivatives | | | 1,209 | | | | (440 | ) | | | 769 | | | | 769 | |
| Unfunded pension obligation | | | (19,102 | ) | | | 6,944 | | | | (12,158 | ) | | | (19,613 | ) |
| Total | | $ | (7,498 | ) | | $ | 2,720 | | | $ | (4,778 | ) | | $ | (11,905 | ) |
| | | December 31, 2007 | |
| | | Transactions | | | Balances | |
| (Dollars in thousands) | | Pre-tax | | | Tax-effect | | | Net of tax | | | Net of tax | |
| Unrealized gain on securities available-for-sale | | $ | 1,179 | | | $ | (431 | ) | | $ | 748 | | | $ | 328 | |
| Unfunded pension obligation | | | 8,697 | | | | (3,197 | ) | | | 5,500 | | | | (7,455 | ) |
| Total | | $ | 9,876 | | | $ | (3,628 | ) | | $ | 6,248 | | | $ | (7,127 | ) |
First Financial and its subsidiary, First Financial Bank, are subject to regulatory capital requirements administered by federal banking agencies. Capital adequacy guidelines and, additionally for banks, prompt corrective action regulations involve quantitative measures of assets, liabilities, and certain off-balance sheet items calculated under regulatory accounting practices. Capital amounts and classifications are also subject to qualitative judgments by regulators. Failure to meet minimum capital requirements can initiate regulatory action.
On June 8, 2009, First Financial completed a public offering of 13.8 million shares of its common stock adding $97,985 of additional common equity, after offering related costs. As a result of the capital raise, during the second quarter, the company’s capital ratios further improved and continued to significantly exceed the amounts necessary to be classified as well capitalized.
On February 2, 2010, First Financial completed a public offering of 6.4 million shares of its common stock adding $91,192 of additional common equity after offering related costs. This public offering completes the issuance of common shares available to be offered pursuant to a prospectus supplement and base prospectus filed as part of an existing shelf registration statement, filed with the Securities and Exchange Commission (SEC) on Form S-3.
Quantitative measures established by regulation to ensure capital adequacy require First Financial to maintain minimum amounts and ratios (as defined in the regulations and set forth in the table below) of Total and Tier 1 capital to risk-weighted assets and to average assets, respectively. Management believes, as of December 31, 2009, that First Financial meets all capital adequacy requirements to which it is subject. At December 31, 2009, and 2008, regulatory notifications categorized First Financial as well-capitalized under the regulatory framework for prompt corrective action. To be categorized as well-capitalized, First Financial must maintain minimum Total risk-based, Tier 1 risk-based, and Tier 1 leverage ratios as set forth in the table. There have been no conditions or events since those notifications that management believes has changed the institution’s category.
First Financial’s Tier 1 capital is comprised of total shareholders’ equity plus junior subordinated debentures, less unrealized gains and losses and any amounts resulting from the application of FASB ASC Topic 715, Compensation-Retirement Benefits, that is recorded within accumulated other comprehensive income (loss), intangible assets, and any valuation related to mortgage servicing rights. Total risk-based capital consists of Tier 1 capital plus the qualifying allowance for loan and lease losses and gross unrealized gains on equity securities.
The Peoples and Irwin FDIC-assisted transactions, which were each accounted for as a business combination, resulted in the recognition of an FDIC Indemnification Asset, which represents the fair value of estimated future payments by the FDIC for losses on covered assets. The FDIC Indemmification Asset, as well as covered assets, are risk-weighted at 20% for regulatory capital requirement purposes.
For purposes of calculating the leverage ratio, average assets represents quarterly average assets less assets not qualifying for total risk-based capital including intangibles and non-qualifying mortgage servicing assets and allowance for loan and lease losses.
48 First Financial Bancorp 2009 Annual Report
Actual and required capital amounts and ratios are presented below at year-end.
| | | | | | For Capital | | | To Be Well Capitalized Under | |
| | | Actual | | | Adequacy Purposes | | | Prompt Corrective Action Provisions | |
(Dollars in thousands) | | Amount | | | Ratio | | | Amount | | | Ratio | | | Amount | | | Ratio | |
| December 31, 2009 | | | | | | | | | | | | | | | | | | |
| Total capital to risk-weighted assets | | | | | | | | | | | | | | | | | | |
| Consolidated | | $ | 703,202 | | | | 17.99 | % | | $ | 312,648 | | | | 8.00 | % | | | N/A | | | | N/A | |
| First Financial Bank | | | 622,076 | | | | 15.95 | % | | | 311,929 | | | | 8.00 | % | | $ | 389,911 | | | | 10.00 | % |
| | | | | | | | | | | | | | | | | | | | | | | | | |
| Tier 1 capital to risk-weighted assets | | | | | | | | | | | | | | | | | | | | | | | | |
| Consolidated | | | 654,104 | | | | 16.74 | % | | | 156,324 | | | | 4.00 | % | | | N/A | | | | N/A | |
| First Financial Bank | | | 565,666 | | | | 14.51 | % | | | 155,965 | | | | 4.00 | % | | | 233,947 | | | | 6.00 | % |
| | | | | | | | | | | | | | | | | | | | | | | | | |
| Tier 1 capital to average assets | | | | | | | | | | | | | | | | | | | | | | | | |
| Consolidated | | | 654,104 | | | | 9.57 | % | | | 242,495 | | | | 4.00 | % | | | N/A | | | | N/A | |
| First Financial Bank | | | 565,666 | | | | 8.24 | % | | | 273,698 | | | | 4.00 | % | | | 342,123 | | | | 5.00 | % |
| | | | | | For Capital | | | To Be Well Capitalized Under | |
| | | Actual | | | Adequacy Purposes | | | Prompt Corrective Action Provisions | |
(Dollars in thousands) | | Amount | | | Ratio | | | Amount | | | Ratio | | | Amount | | | Ratio | |
| December 31, 2008 | | | | | | | | | | | | | | | | | | |
| Total capital to risk-weighted assets | | | | | | | | | | | | | | | | | | |
| Consolidated | | $ | 392,180 | | | | 13.62 | % | | $ | 230,284 | | | | 8.00 | % | | | N/A | | | | N/A | |
| First Financial Bank | | | 354,333 | | | | 12.37 | % | | | 229,086 | | | | 8.00 | % | | $ | 286,358 | | | | 10.00 | % |
| | | | | | | | | | | | | | | | | | | | | | | | | |
| Tier 1 capital to risk-weighted assets | | | | | | | | | | | | | | | | | | | | | | | | |
| Consolidated | | | 356,307 | | | | 12.38 | % | | | 115,142 | | | | 4.00 | % | | | N/A | | | | N/A | |
| First Financial Bank | | | 311,037 | | | | 10.86 | % | | | 114,543 | | | | 4.00 | % | | | 171,815 | | | | 6.00 | % |
| | | | | | | | | | | | | | | | | | | | | | | | | |
| Tier 1 capital to average assets | | | | | | | | | | | | | | | | | | | | | | | | |
| Consolidated | | | 356,307 | | | | 10.00 | % | | | 141,689 | | | | 4.00 | % | | | N/A | | | | N/A | |
| First Financial Bank | | | 311,037 | | | | 8.77 | % | | | 141,188 | | | | 4.00 | % | | | 176,485 | | | | 5.00 | % |
17. Employee Benefit Plans
First Financial sponsors a non-contributory defined benefit pension plan covering substantially all employees. First Financial uses a December 31 measurement date for its defined benefit pension plan. Effective in the third quarter of 2007, First Financial amended the defined benefit pension plan formula to change the determination of participant benefits from a final average earnings plan to a cash balance plan. Pension plan participants prior to July 1, 2007, transitioned to the amended plan on January 1, 2008. After July 1, 2007, newly eligible participants entered the amended plan upon their eligibility date.
The following tables set forth information concerning amounts recognized in First Financial’s Consolidated Balance Sheets and Consolidated Statements of Income:
| | | December 31, | |
| (Dollars in thousands) | | 2009 | | | 2008 | |
| Change in benefit obligation | | | | | | |
| Benefit obligation at beginning of year | | $ | 44,639 | | | $ | 43,521 | |
| Service cost | | | 2,301 | | | | 2,242 | |
| Interest cost | | | 2,704 | | | | 2,558 | |
| Actuarial loss (gain) | | | 3,384 | | | | (49 | ) |
| Benefits paid, excluding settlement | | | (5,032 | ) | | | (3,633 | ) |
| Benefit obligation at end of year | | | 47,996 | | | | 44,639 | |
| | | | | | | | | |
| Change in plan assets | | | | | | | | |
| Fair value of plan assets at beginning of year | | | 30,485 | | | | 49,866 | |
| Actual return on plan assets | | | 4,165 | | | | (15,748 | ) |
| Employer contribution | | | 30,800 | | | | 0 | |
| Benefits paid, excluding settlement | | | (5,032 | ) | | | (3,633 | ) |
| Fair value of plan assets at end of year | | | 60,418 | | | | 30,485 | |
| | | | | | | | | |
| Amounts recognized in the Consolidated Balance Sheets | | | | | | | | |
| Assets | | | 12,422 | | | | 0 | |
| Liabilities | | | 0 | | | | (14,154 | ) |
| Net amount recognized | | $ | 12,422 | | | $ | (14,154 | ) |
| | | | | | | | | |
| Amounts recognized in accumulated other comprehensive income (loss) | | | | | | | | |
| Net actuarial loss | | $ | 39,538 | | | $ | 36,650 | |
| Net prior service cost | | | (5,389 | ) | | | (5,811 | ) |
| Deferred tax assets | | | (12,388 | ) | | | (11,226 | ) |
| Net amount recognized | | $ | 21,761 | | | $ | 19,613 | |
| | | | | | | | | |
| Change in accumulated other comprehensive income (loss) | | $ | 2,148 | | | $ | 12,163 | |
| | | | | | | | | |
| Accumulated benefit obligation | | $ | 45,022 | | | $ | 41,957 | |
| | | | | | | | | |
| Information for pension plans with an accumulated benefit obligation in excess of plan assets | | | | | | | | |
| Projected benefit obligation | | $ | 0 | | | $ | 44,639 | |
| Accumulated benefit obligation | | | 0 | | | | 41,957 | |
| Fair value of plan assets | | | 0 | | | | 30,485 | |
First Financial Bancorp 2009 Annual Report 49
Notes To Consolidated Financial Statements
| Components of net periodic benefit cost | | | |
| | | December 31, | |
| (Dollars in thousands) | | 2009 | | | 2008 | | | 2007 | |
| Service cost | | $ | 2,301 | | | $ | 2,242 | | | $ | 3,254 | |
| Interest cost | | | 2,704 | | | | 2,558 | | | | 2,744 | |
| Expected return on assets | | | (5,273 | ) | | | (4,049 | ) | | | (4,341 | ) |
| Amortization of initial net asset | | | 0 | | | | (35 | ) | | | (47 | ) |
| Amortization of prior service cost | | | (423 | ) | | | (423 | ) | | | (187 | ) |
| Recognized net actuarial loss | | | 1,605 | | | | 1,097 | | | | 896 | |
| Settlement loss | | | 0 | | | | 0 | | | | 2,222 | |
| Net periodic benefit cost | | | 914 | | | | 1,390 | | | | 4,541 | |
| | | | | | | | | | | | | |
| Other changes recognized in accumulated other comprehensive income (loss) | | | | | | | | | | | | |
| Net actuarial loss | | | 4,492 | | | | 19,748 | | | | 534 | |
| Prior service credit | | | 0 | | | | 0 | | | | (6,484 | ) |
| Amortization of prior service cost | | | 423 | | | | 423 | | | | 187 | |
| Amortization of gain | | | (1,605 | ) | | | (1,097 | ) | | | (896 | ) |
| Amortization of transition asset | | | 0 | | | | 35 | | | | 47 | |
| Settlements | | | 0 | | | | 0 | | | | (2,222 | ) |
| Total recognized in accumulated other comprehensive income (loss) | | | 3,310 | | | | 19,109 | | | | (8,834 | ) |
| Total recognized in net periodic benefit cost and accumulated other comprehensive income (loss) | | $ | 4,224 | | | $ | 20,499 | | | $ | (4,293 | ) |
| | | | | | | | | | | | | |
| Amount expected to be recognized in net periodic pension expense in the coming year | | | | | | | | | | | | |
| Amortization of loss | | $ | 2,055 | | | $ | 1,549 | | | $ | 958 | |
| Amortization of prior service credit | | | (423 | ) | | | (423 | ) | | | (423 | ) |
| Amortization of transition asset | | | 0 | | | | 0 | | | | (35 | ) |
| | | | | | | | | | | | | |
| Weighted-average assumptions to determine: | | | | | | | | | | | | |
| | | December 31, | | | | | |
| | | 2009 | | | 2008 | | | | | |
| Benefit obligations | | | | | | | | | | | | |
| Discount rate | | | 5.88 | % | | | 6.26 | % | | | | |
| Rate of compensation increase | | | 3.50 | % | | | 3.50 | % | | | | |
| | | | | | | | | | | | | |
| Net periodic benefit cost | | | | | | | | | | | | |
| Discount rate | | | 6.26 | % | | | 6.12 | % | | | | |
| Expected return on plan assets | | | 8.50 | % | | | 8.50 | % | | | | |
| Rate of compensation increase | | | 3.50 | % | | | 3.50 | % | | | | |
The basis used to determine the overall expected long-term return on plan assets was based on the composition of plan assets and a consensus of estimates from similarly managed portfolios of expected future returns.
Plan assets are administered by the Wealth Resource Group of First Financial Bank, N.A. and managed by First Financial Capital Advisors, LLC, a subsidiary of First Financial. Plan assets are invested in a broad range of equity, fixed income, and cash securities, consisting entirely of publicly traded individual stocks and bonds and publicly traded mutual funds and exchange traded funds.
The pension plan does not directly own any shares of First Financial common stock or any other First Financial security or product.
The investment objective of the Plan is to structure the assets to, as much as feasible, mimic the liabilities of the Plan. The current target asset allocation set by the Bank for the Plan is 50% equities and 50% fixed income, with the aim to use the fixed income component to match the identified near term and long term Plan distributions and the equity component to generate growth of capital to meet other future Plan liabilities.
The fair value of the plan assets as of December 31, 2009 by asset category is shown below.
| | | Fair Value Measurements | |
| | | | | | Quoted Prices in | | | Significant | | | Significant | |
| | | | | | Active Markets for | | | Observable | | | Unobservable | |
| | | | | | Identical Assets | | | Inputs | | | Inputs | |
| Asset Category | | Total | | | (Level 1) | | | (Level 2) | | | (Level 3) | |
| Money market fund | | $ | 10,982 | | | $ | 10,982 | | | $ | 0 | | | $ | 0 | |
| U.S. Treasury securities | | | 460 | | | | 0 | | | | 460 | | | | 0 | |
| Corporate bonds | | | 16,463 | | | | 0 | | | | 16,463 | | | | 0 | |
| Equity securities: | | | | | | | | | | | | | | | | |
| Stock mutual funds | | | 24,529 | | | | 24,529 | | | | 0 | | | | 0 | |
| Exchange traded funds | | | 7,878 | | | | 7,878 | | | | 0 | | | | 0 | |
| Total | | $ | 60,312 | | | $ | 43,389 | | | $ | 16,923 | | | $ | 0 | |
50 First Financial Bancorp 2009 Annual Report
During December 2009, the First Funds Calibur Equity fund sold all 4,200,246 of its shares at which time it was liquidated and closed. The plan received dividends of $105 from the First Funds. The plan also held a total of 1,542,664 shares in other funds at December 31, 2009, with a fair value of $32,407. Dividends received from these funds were $230.
The plan had held assets of the First Funds Sterling Income fund which was also liquidated and closed in December 2009. During 2009, this fund purchased debt securities with a cost basis of $3,136 and sold debt securities with a cost basis of $6,269. The plan received interest income from this fund of $440. The plan also holds assets in other bond funds at a cost basis of $16,984 and received income of $196.
Due to the funded status of the pension plan, First Financial does not expect to make any contributions to its pension plan in 2010.
The following benefit payments, which reflect expected future service, as appropriate, are expected to be paid:
| (Dollars in thousands) | | Retirement Benefits | |
| 2010 | | $ | 3,097 | |
| 2011 | | | 3,358 | |
| 2012 | | | 5,407 | |
| 2013 | | | 5,809 | |
| 2014 | | | 4,864 | |
| Thereafter | | | 25,584 | |
First Financial also sponsors a defined contribution 401(k) thrift plan which covers substantially all employees. Employees may contribute up to 50% of their earnings into the plan, not to exceed applicable limitations prescribed by the Internal Revenue Service. During 2007, First Financial contributed $0.50 for each $1.00 an employee contributed, up to a maximum First Financial contribution of 3.00% of the employee’s earnings. Beginning in 2008, First Financial contributed $1.00 for every $1.00 an employee contributed up to 3.00% of the employee’s earnings and then contributed $0.50 for every $1.00 of the next 2.00% of the employee’s earnings, up to a maximum First Financial total contribution of 5.00% of the employee’s earnings. All First Financial matching contributions vest immediately. First Financial contributions to the 401(k) plan are at the discretion of the board of directors. Total First Financial contributions to the 401(k) plan were $1,671 during 2009, $1,895 during 2008, and $1,142 during 2007.
First Financial has purchased bank-owned life insurance on certain of its employees. The cash surrender value of these policies is carried as an asset on the Consolidated Balance Sheets in accrued interest and other assets. The carrying value was $81,318 and $77,732 at December 31, 2009, and 2008, respectively.
First Financial adopted the requirements of FASB ASC Topic 715, Compensation-Retirement Benefits-Defined Benefits, effective January 1, 2008. First Financial recorded the $2,499 transition impact of this guidance as a reduction of opening retained earnings as part of a cumulative-effect adjustment and an increase in accrued interest and other liabilities in the Consolidated Balance Sheets, reflective of the ongoing cost of insurance for the pool of retirees.
First Financial maintained a health care plan for certain retired employees. The plan was unfunded and paid medically necessary expenses incurred by retirees, after subtracting payments by Medicare or other providers and after deductibles had been met. First Financial had reserved the right to change or eliminate this benefit plan. In the second quarter of 2008, First Financial communicated to the pool of covered retirees that it was changing its postretirement health care plan. Effective August 1, 2008, First Financial began offering retiree health care coverage to the existing pool of covered retirees under a fully insured plan. Covered retirees pay a monthly premium equal to 50% of the total premium for their health care coverage, and First Financial pays a per participant monthly gross premium equal to 50% of the total premium. A third party administers the plan, directly paying all covered retiree medical expenses after co-payments and deductibles are met.
The change in the postretirement health care plan is considered a plan settlement per FASB ASC Topic 715-60, Compensation-Retirement Benefits-Defined Benefits-Other Postretirement and as such the fully insured plan eliminated the need for the postretirement benefit liability that was recorded on the balance sheet. As there was no transition asset or prior service cost for the plan recorded within accumulated other comprehensive income, in the second quarter of 2008 First Financial reversed $1,285 of the postretirement benefit liability as a reduction of salaries and benefits expense. First Financial’s portion of the future monthly payment of third party premiums are expensed as paid.
18. Earnings Per Common Share
The following table sets forth the computation of basic and diluted earnings per share:
| (Dollars in thousands, except per share data) | | 2009 | | | 2008 | | | 2007 | |
| Numerator for basic and diluted earnings per share – income available to common shareholders: | | | | | | | | | |
| Net income | | $ | 246,546 | | | $ | 22,962 | | | $ | 35,681 | |
| Dividends on preferred stock | | | 3,578 | | | | 0 | | | | 0 | |
| Income available to common shareholders | | $ | 242,968 | | | $ | 22,962 | | | $ | 35,681 | |
| | | | | | | | | | | | | |
| Denominator for basic earnings per share – weighted average shares | | | 45,028,640 | | | | 37,112,065 | | | | 38,455,084 | |
| Effect of dilutive securities – | | | | | | | | | | | | |
| Employee stock options | | | 508,507 | | | | 372,133 | | | | 4,054 | |
| Warrants | | | 19,721 | | | | 0 | | | | 0 | |
| | | | | | | | | | | | | |
| Denominator for diluted earnings per share – | | | | | | | | | | | | |
| adjusted weighted average shares | | | 45,556,868 | | | | 37,484,198 | | | | 38,459,138 | |
| | | | | | | | | | | | | |
| Earnings per share available to common shareholders | | | | | | | | | | | | |
| Basic | | $ | 5.40 | | | $ | 0.62 | | | $ | 0.93 | |
| Diluted | | $ | 5.33 | | | $ | 0.61 | | | $ | 0.93 | |
Stock options and warrants, where the exercise price was greater than the average market price of the common shares, were not included in the computation of net income per diluted share as they would have been antidilutive. These out-of-the-money options were 1,833,037, 1,939,981, and 2,127,782 at December 31, 2009, 2008, and 2007, respectively. The warrant to purchase 465,117 shares of common stock was also outstanding at December 31, 2009. At December 31, 2008, the warrant to purchase 960,233 shares of common stock was also outstanding, but was out-of-the-money. The reduction in the warrant share position was a result of the common stock offering that occurred in June of 2009, in accordance with rules established by the U.S. Treasury.
19. Stock Options And Awards
First Financial adopted the provisions of FASB ASC Topic 718, Compensation-Stock Compensation effective January 1, 2006, using the modified-prospective transition method, which requires measurement of compensation cost for all stock-based awards at fair value on the date of grant and recognition of compensation expense over the service period for all awards expected to vest. Share-based compensation expense for stock options and restricted stock awards included in salaries and employee benefits expense for the year ended December 31, 2009, and 2008, was $2,799 and $2,444, respectively. Total unrecognized compensation cost related to nonvested share-based compensation was $4,613 at December 31, 2009 and is expected to be recognized over a weighted average period of 2.5 years.
As of December 31, 2009, First Financial had four stock-based compensation plans. The 1999 Stock Incentive Plan provides incentive stock options and stock awards to certain key employees and non-qualified stock options to non-employee directors of First Financial for up to 7,507,500 common shares of First Financial. The options become exercisable at a rate of 25% per year on the anniversary date of the grant and remain outstanding for 10 years after the initial grant date. All options expire at the end of the exercise period. No additional options are available for grant under the 1999 plans. On June 15, 2009, the shareholders approved the 2009 Employee Stock Plan and the 2009 Non-Employee Director Plan that provides for the issuance of 1,500,000 shares and 75,000 shares, respectively.
First Financial Bancorp 2009 Annual Report 51
Notes To Consolidated Financial Statements
First Financial utilizes the Black-Scholes valuation model to determine the fair value of its stock options. As well as the stock option strike price, the Black-Scholes valuation model requires the use of the following assumptions: the expected dividend yield based on historical dividend payouts; the expected stock price volatility based on the historical volatility of company stock for a period approximating the expected life of the options; the risk-free rate based on the U.S. Treasury yield curve in effect at the time of grant for periods corresponding with the expected life of the option; and the expected option life represented by the period of time the options are expected to be outstanding and is based on historical trends. The estimated fair value of the options granted, as well as the weighted average assumptions used in the computations are as follows:
| | | 2009 | | | 2008 | | | 2007 | |
| Fair value of options granted | | $ | 1.76 | | | $ | 1.00 | | | $ | 2.17 | |
| Expected dividend yield | | | 4.20 | % | | | 5.84 | % | | | 4.30 | % |
| Expected volatility | | | 0.283 | | | | 0.190 | | | | 0.188 | |
| Risk-free interest rate | | | 2.50 | % | | | 3.42 | % | | | 4.56 | % |
| Expected life | | 7.23 years | | | 6.99 years | | | 6.93 years | |
Activity in the stock option plan for the year ended December 31, 2009, is summarized as follows:
| | | | | | | | Weighted | | | |
| | | Number | | | Weighted Average | | Average Remaining | | Aggregate | |
| (Dollars in thousands, except per share data) | | of shares | | | Exercise Price | | Contractual Life | | Intrinsic Value | |
| Outstanding at beginning of year | | | 3,386,581 | | | $ | 14.34 | | | | | |
| Granted | | | 2,000 | | | | 9.53 | | | | | |
| Exercised | | | 0 | | | | 0.00 | | | | | |
| Forfeited or expired | | | (120,319 | ) | | | 17.37 | | | | | |
| Outstanding at end of year | | | 3,268,262 | | | $ | 14.23 | | 6.43 years | | $ | 4,192 | |
| Exercisable at end of year | | | 1,819,136 | | | $ | 15.55 | | 5.30 years | | $ | 1,050 | |
Intrinsic value for stock options is defined as the difference between the current market value and the grant price. First Financial uses treasury shares purchased under the company’s share repurchase program to satisfy share-based exercises.
| | | 2009 | | | 2008 | | | 2007 | |
| Total intrinsic value of options exercised | | $ | 0 | | | $ | 0 | | | $ | 56 | |
| Cash received from exercises | | $ | 0 | | | $ | 0 | | | $ | 82 | |
| Tax benefit from exercises | | $ | 0 | | | $ | 0 | | | $ | 341 | |
Restricted stock awards have historically been recorded as deferred compensation, a component of shareholders’ equity at the fair value of these awards at the grant date and amortized on a straight-line basis to salaries and benefits expense over the specified vesting periods, which is currently four years for employees and three years for non-employee directors. For awards granted to non-employee directors through 2009, the vesting of the awards only required a service period to be met. For restricted stock awards granted to employees in 2005 through 2008, First Financial must have met a minimum performance threshold in order for the awards to vest. The minimum level of performance was the achievement of an annual return on average equity greater than or equal to the return on average equity of the twenty-fifth percentile of a national peer group for each respective vesting year. In subsequent years, an award that did not previously vest may vest if the average annual return on average equity for the grant period is greater than or equal to the average return on average equity of the twenty-fifth percentile of the national peer group for the grant period. The national peer group is the group of publicly traded bank holding companies between $3 billion and $10 billion in total assets for the reporting period. For stock awards granted in 2009, there is no longer a performance threshold that must be met.
Activity in restricted stock for the previous three years ended December 31 is summarized as follows:
| | | 2009 | | | 2008 | | | 2007 | |
| | | | | | Weighted Average | | | | | | Weighted Average | | | | | | Weighted Average | |
| | | Number | | | Grant Date | | | Number | | | Grant Date | | | Number | | | Grant Date | |
| | | of shares | | | Fair Value | | | of shares | | | Fair Value | | | of shares | | | Fair Value | |
| Nonvested at beginning of year | | | 346,972 | | | $ | 14.23 | | | | 308,107 | | | $ | 15.86 | | | | 225,709 | | | $ | 16.76 | |
| Granted | | | 219,695 | | | | 11.01 | | | | 139,055 | | | | 11.78 | | | | 151,440 | | | | 14.88 | |
| Vested | | | (131,508 | ) | | | 14.84 | | | | (86,540 | ) | | | 15.87 | | | | (41,104 | ) | | | 16.81 | |
| Forfeited | | | (33,225 | ) | | | 16.91 | | | | (13,650 | ) | | | 15.20 | | | | (27,938 | ) | | | 16.37 | |
| Nonvested at end of year | | | 401,934 | | | $ | 12.05 | | | | 346,972 | | | $ | 14.23 | | | | 308,107 | | | $ | 15.86 | |
The fair value of restricted stock is determined based on the number of shares granted and the quoted price of First Financial’s common stock. The total fair value of restricted stock vested during 2009 was $1,952.
20. Loans to Related Parties
Activity of loans to directors, executive officers, principal holders of First Financial’s common stock, and certain related persons was as follows:
| (Dollars in thousands) | | 2009 | | | 2008 | | | 2007 | |
| Beginning balance | | $ | 9,491 | | | $ | 21,436 | | | $ | 16,388 | |
| Additions | | | 7,042 | | | | 911 | | | | 6,960 | |
| Deductions | | | 486 | | | | 12,856 | | | | 1,912 | |
| Ending balance | | $ | 16,047 | | | $ | 9,491 | | | $ | 21,436 | |
| Loans 90 days past due | | $ | 0 | | | $ | 0 | | | $ | 0 | |
Related parties of First Financial, as defined above, were clients of and had transactions with subsidiaries of First Financial in the ordinary course of business during the periods noted above. Additional transactions may be expected in the ordinary course of business in the future. All outstanding loans, commitments, financing leases, transactions in money market instruments and deposit relationships included in such transactions were made on substantially the same terms, including interest rates and collateral, as those prevailing at the time for comparable transactions with others, and did not involve more than a normal risk of collectbility or present other unfavorable features.
52 First Financial Bancorp 2009 Annual Report
21. Fair Value Disclosures
Fair Value Option
The following table summarizes the impact on First Financial’s Consolidated Balance Sheets of adopting the fair value option (FVO) for equity securities of government sponsored entities, specifically 200,000 Federal Home Loan Mortgage Corporation perpetual preferred series V shares with an original cost basis of $5,000. Amounts shown represent the carrying value of the affected investment security categories before and after the change in accounting resulting from the adoption of FASB Topic 820-10, Fair Value Measurements and Disclosures.
| | | Jan. 1, 2008 | | | | | | Jan. 1, 2008 | |
| | | Balance Sheet | | | | | | Balance Sheet | |
| (Dollars in thousands) | | Prior to Adoption | | | Adoption Impact | | | After Adoption | |
| Trading investment securities | | $ | 0 | | | $ | 3,799 | | | $ | 3,799 | |
| Available-for-sale investment securities | | | 306,928 | | | | (3,799 | ) | | | 303,129 | |
| Accumulated comprehensive income (loss) | | | (7,127 | ) | | | 750 | | | | (6,377 | ) |
Cumulative effect of adoption of the FVO-charge to retained earnings(1) | | | | | | $ | 750 | | | | | |
| | | | | | | | | | | | | |
| Retained earnings | | $ | 82,093 | | | $ | (750 | ) | | $ | 81,343 | |
(1) The adoption of FASB Topic 820-10 had no overall tax impact due to the transfer of the unrealized loss from accumulated other comprehensive income (loss) to retained earnings, within shareholders’ equity.
Prior to the election of the FVO effective January 1, 2008, First Financial’s equity securities of government sponsored entities totaled $3,799 and were classified as investment securities available-for-sale. An unrealized loss of $750, net of taxes of $431, as of December 31, 2007, was included as a component of accumulated other comprehensive income (loss). In connection with First Financial’s adoption of FASB Topic 820-10, Financial Instruments, effective January 1, 2008, the $750 unrealized loss was reclassified from accumulated other comprehensive income (loss) to beginning retained earnings as part of a cumulative-effect adjustment. There was no impact on total shareholders’ equity upon adoption. The equity securities of government sponsored entities are included as trading investment securities on First Financial’s Consolidated Balance Sheets effective January 1, 2008.
At December 31, 2009, the fair value of the equity securities of government sponsored entities for which the FVO was elected was $200, a decrease of approximately $3,599 from the fair value of the equity securities at January 1, 2008. Since January 1, 2008, changes in market value for the equity securities of government sponsored entities for which the FVO was elected have been recorded in other noninterest income.
There were no purchases or sales of these or similar investment securities during 2009, however, in January of 2010, the remaining equity securities of government-sponsored entities were sold at a loss of $30.
Fair Value Measurement
The fair value framework as disclosed in the Fair Value Measurements and Disclosure Topic of the FASB Accounting Standards Codification (Fair Value Topic) includes a hierarchy which focuses on prioritizing the inputs used in valuation techniques. The fair value hierarchy gives the highest priority to quoted prices in active markets for identical assets or liabilities (Level 1), a lower priority to observable inputs other than quoted prices in active markets for identical assets and liabilities (Level 2), and the lowest priority to unobservable inputs (Level 3). When determining the fair value measurements for assets and liabilities, First Financial looks to active markets to price identical assets or liabilities whenever possible and classifies such items in Level 1. When identical assets and liabilities are not traded in active markets, First Financial looks to market observable data for similar assets and liabilities and classifies such items as Level 2. Certain assets and liabilities are not actively traded in observable markets and First Financial must use alternative techniques, based on unobservable inputs, to determine the fair value and classifies such items as Level 3. The level within the fair value hierarchy is based on the lowest level of input that is significant in the fair value measurement.
The following methods, assumptions, and valuation techniques were used by First Financial to measure different financial assets and liabilities at fair value and in estimating its fair value disclosures for financial instruments.
Cash and short-term investments – The carrying amounts reported in the Consolidated Balance Sheets for cash and short-term investments, such as federal funds sold and interest-bearing deposits with other banks, approximated the fair value of those instruments.
Investment securities – Investment securities classified as trading and available-for-sale are recorded at fair value on a recurring basis. Fair value measurement is based upon quoted market prices, when available (Level 1). If quoted market prices are not available, fair values are measured utilizing independent valuation techniques of identical or similar investment securities. Third party vendors compile prices from various sources and may apply such techniques as matrix pricing to determine the value of identical or similar investment securities (Level 2). Matrix pricing is a mathematical technique widely used in the banking industry to value investment securities without relying exclusively on quoted prices for the specific investment securities but rather relying on the investment securities’ relationship to other benchmark quoted investment securities. Any investment securities not valued based upon the methods above are considered Level 3.
First Financial utilizes information provided by a third party investment securities portfolio manager in analyzing the investment securities portfolio in accordance with the fair value hierarchy of the Fair Value Topic. The portfolio manager’s evaluation of investment security portfolio pricing is performed using a combination of prices and data from third party vendors, along with internally developed matrix pricing models and assistance from the provider’s internal fixed income analysts and trading desk. The portfolio manager’s month-end pricing process includes a series of quality assurance activities where prices are compared to recent market conditions, previous evaluation prices, and between the various pricing services. These processes produce a series of quality assurance reports on which price exceptions are identified, reviewed, and where appropriate, securities are repriced. In the event of a materially different price, the portfolio manager will report the variance to the third party vendor as a “price challenge”, and review the pricing methodology in detail. The results of the quality assurance process are incorporated into the selection of pricing providers by the portfolio manager.
Loans held for sale – Loans held for sale are carried at the lower of cost or market value. These loans currently consist of one-to-four family residential real estate loans originated for sale to third party investors on a servicing released basis. Fair value is based on the contractual price to be received, which is not materially different than cost due to the short duration between origination and sale (Level 2). As such, First Financial records any fair value adjustments on a nonrecurring basis. Gains and losses on the sale of loans are recorded as net gains from sales of loans within noninterest income in the Consolidated Statements of Income.
Loans – The fair value of commercial, commercial real estate, residential real estate, and consumer loans were estimated by discounting the future cash flows using the current rates at which similar loans would be made to borrowers with similar credit ratings and for the same remaining maturities or repricing frequency. The carrying amount of accrued interest approximates its fair value.
Covered loans – Fair values for loans were based on a discounted cash flow methodology that considered various factors including the type of loan and related collateral, classification status, fixed or variable interest rate, term of loan and whether or not the loan was amortizing, and current discount rates. Loans were grouped together according to similar characteristics and were treated in the aggregate when applying various valuation techniques. The discount rates used for loans are based on current market rates for new originations of comparable loans and include adjustments for liquidity concerns. The discount rate does not include a factor for credit losses as that has been included in the estimated cash flows.
Allowance for loan and lease losses – Loans are designated as impaired when, in the judgment of management based on current information and events, it is probable that all amounts due according to the contractual terms of the loan agreement will not be collected. Impaired loans are valued at the lower of cost or market for purposes of determining the appropriate amount of impairment to be allocated to the allowance for loan and lease losses. Market value is measured based on the value of the collateral securing the loans. Collateral may be in the form of real estate or business assets including equipment, inventory, and accounts receivable. The vast majority of the collateral is real estate. The value of real estate collateral is determined utilizing an income or market valuation approach based on an appraisal conducted by an independent, licensed appraiser outside of the company (Level 2). The value of business equipment is based upon an outside appraisal if deemed significant, or the net book value on the applicable borrower financial statements if not considered significant. Likewise, values for inventory and accounts receivable collateral are based on borrower financial statement balances or aging reports (Level 3). Impaired loans allocated to the allowance for loan and lease losses are measured at fair value on a nonrecurring basis. Any fair value adjustments are recorded in the period incurred as provision for loan and lease losses on the Consolidated Statements of Income.
First Financial Bancorp 2009 Annual Report 53
Notes To Consolidated Financial Statements
Mortgage-servicing rights – The fair value of mortgage-servicing rights was determined through modeling the expected future cash flows. The modeling included stratification by maturity and coupon rates on the underlying mortgage loans. Certain assumptions were used in the valuation regarding prepayment speeds, discount rates, servicing costs, delinquency, cash balances, and foreclosure costs which were arrived at from third-party sources and internal records.
FDIC indemnification asset – These loss sharing assets are measured separately from the related covered assets as they are not contractually embedded in the assets and are not transferable with the assets should the Bank choose to dispose of them. Fair value was estimated using projected cash flows related to the loss sharing agreements based on the expected reimbursements for losses and the applicable loss sharing percentages. These expected reimbursements do not include reimbursable amounts related to future covered expenditures. These cash flows were discounted to reflect the uncertainty of the timing and receipt of the loss sharing reimbursement from the FDIC.
Deposit liabilities – The fair value of demand deposits, savings accounts, and certain money-market deposits was the amount payable on demand at the reporting date. The carrying amounts for variable-rate certificates of deposit approximated their fair values at the reporting date. The fair value of fixed-rate certificates of deposit was estimated using a discounted cash flow calculation which applies the interest rates currently offered for deposits of similar remaining maturities. The carrying amount of accrued interest approximated its fair value.
Borrowings – The carry amounts of federal funds purchased and securities sold under agreements to repurchase and other short-term borrowings approximated their fair values. The fair value of long-term debt was estimated using a discounted cash flow calculation which utilizes the interest rates currently offered for borrowings of similar remaining maturities. Third-party valuations were used for long-term debt with embedded options, such as call features.
Commitments to extend credit and standby letters of credit – Pricing of these financial instruments is based on the credit quality and relationship, fees, interest rates, probability of funding and compensating balance and other covenants or requirements. Loan commitments generally have fixed expiration dates, are variable rate and contain termination and other clauses which provide for relief from funding in the event that there is a significant deterioration in the credit quality of the client. Many loan commitments are expected to expire without being drawn upon. The rates and terms of the commitments to extend credit and the standby letters of credit are competitive with those in First Financial’s market area. The carrying amounts are reasonable estimates of the fair value of these financial instruments. Carrying amounts, which are comprised of the unamortized fee income and, where necessary, reserves for any expected credit losses from these financial instruments, are immaterial.
Derivatives – First Financial utilizes interest rate swaps as a means to offer commercial borrowers products that meet their needs and also to achieve First Financial’s desired interest rate risk profile at the time. The net interest receivable or payable is accrued and recognized as an adjustment to the interest income or interest expense of the hedged item. First Financial utilizes third-party vendors for derivative valuation purposes. These vendors determine the appropriate fair value based on a net present value calculation of the cash flows related to the interest rate swaps using primarily observable market inputs such as interest rate yield curves. The discounted net present value calculated represents the cost to terminate the swap if First Financial should choose to do so on the applicable measurement date (Level 2). Additionally, First Financial utilizes a vendor developed, proprietary model to value the credit risk component of both the derivative assets and liabilities. The credit valuation adjustment is recorded as an adjustment to the fair value of the derivative asset or liability on the applicable measurement date (Level 3).
The estimated fair values of First Financial’s financial instruments at December 31 were as follows:
| | | 2009 | | | 2008 | |
| | | Carrying | | | Fair | | | Carrying | | | Fair | |
| (Dollars in thousands) | | value | | | value | | | value | | | value | |
| Financial assets | | | | | | | | | | | | |
| Cash and short-term investments | | $ | 606,167 | | | $ | 606,167 | | | $ | 100,935 | | | $ | 100,935 | |
| Investment securities trading | | | 200 | | | | 200 | | | | 61 | | | | 61 | |
| Investment securities held-to-maturity | | | 18,115 | | | | 18,590 | | | | 4,966 | | | | 5,135 | |
| Investment securities available-for-sale | | | 471,002 | | | | 471,002 | | | | 659,756 | | | | 659,756 | |
| Other investments | | | 89,830 | | | | 89,830 | | | | 27,976 | | | | 27,976 | |
| Loans held for sale | | | 8,052 | | | | 8,052 | | | | 3,854 | | | | 3,854 | |
| Loans, excluding covered loans | | | 2,834,179 | | | | 2,906,009 | | | | 2,647,387 | | | | 2,665,024 | |
| Covered loans | | | 1,929,549 | | | | 1,929,549 | | | | 0 | | | | 0 | |
| Mortgage-servicing rights | | | 1,976 | | | | 1,976 | | | | 398 | | | | 398 | |
| FDIC indemnification asset | | | 316,040 | | | | 316,040 | | | | 0 | | | | 0 | |
| Accrued interest receivable | | | 22,647 | | | | 22,647 | | | | 15,223 | | | | 15,223 | |
| Derivative financial instruments | | | 998 | | | | 998 | | | | 56 | | | | 56 | |
| | | | | | | | | | | | | | | | | |
| Financial liabilities | | | | | | | | | | | | | | | | |
| Deposits | | | | | | | | | | | | | | | | |
| Noninterest-bearing | | $ | 754,522 | | | $ | 754,522 | | | $ | 413,283 | | | $ | 413,283 | |
| Interest-bearing demand | | | 1,356,249 | | | | 1,356,249 | | | | 636,945 | | | | 636,945 | |
| Savings | | | 1,010,469 | | | | 1,010,469 | | | | 583,081 | | | | 583,081 | |
| Time | | | 2,229,400 | | | | 2,230,173 | | | | 1,150,208 | | | | 1,168,228 | |
| Total deposits | | | 5,350,640 | | | | 5,351,413 | | | | 2,783,517 | | | | 2,801,537 | |
| Short-term borrowings | | | 37,430 | | | | 37,430 | | | | 354,533 | | | | 354,533 | |
| Long-term debt | | | 404,716 | | | | 428,358 | | | | 148,164 | | | | 155,702 | |
| Other long-term debt | | | 20,620 | | | | 20,620 | | | | 20,620 | | | | 20,620 | |
| Accrued interest payable | | | 4,759 | | | | 4,759 | | | | 6,033 | | | | 6,033 | |
| Derivative financial instruments | | | 2,363 | | | | 2,363 | | | | 3,339 | | | | 3,339 | |
The following table summarizes the financial assets and liabilities measured at fair value on a recurring basis at December 31, 2009:
| (Dollars in thousands) | | Fair Value Measurements Using | | | Netting | | | Assets/Liabilities | |
| | | Level 1 | | | Level 2 | | | Level 3 | | | Adjustments(1) | | | at Fair Value | |
| Assets | | | | | | | | | | | | | | | |
Trading investment securities (2) | | $ | 200 | | | $ | 0 | | | $ | 0 | | | $ | 0 | | | $ | 200 | |
| Derivatives | | | 0 | | | | 11,391 | | | | (135 | ) | | | (10,258 | ) | | | 998 | |
| Available-for-sale investment securities | | | 114 | | | | 470,888 | | | | 0 | | | | 0 | | | | 471,002 | |
| Total | | $ | 314 | | | $ | 482,279 | | | $ | (135 | ) | | $ | (10,258 | ) | | $ | 472,200 | |
| | | | | | | | | | | | | | | | | | | | | |
| Liabilities | | | | | | | | | | | | | | | | | | | | |
| Derivatives | | $ | 0 | | | $ | 12,185 | | | $ | 436 | | | $ | (10,258 | ) | | $ | 2,363 | |
| (1) | Amounts represent the impact of legally enforceable master netting arrangements that allow First Financial to settle positive and negative positions and also cash collateral held with the same counterparties. |
| (2) | Amount represents an item for which First Financial elected the fair value option under the Financial Instruments Topic of the FASB ASC. |
54 First Financial Bancorp 2009 Annual Report
Certain financial assets and liabilities are measured at fair value on a nonrecurring basis. Adjustments to the fair market value of these assets usually result from the application of lower-of-cost-or-market accounting or write-downs of individual assets.
The following table summarizes financial assets and liabilities measured at fair value on a nonrecurring basis at December 30, 2009:
| (Dollars in thousands) | | Fair Value Measurements Using | | | Year-to-date | |
| | | Level 1 | | | Level 2 | | | Level 3 | | | Gains/Losses | |
| Assets | | | | | | | | | | | | |
| Loans held for sale | | $ | 0 | | | $ | 8,052 | | | $ | 0 | | | $ | 0 | |
Impaired Loans(1) | | | 0 | | | | 15,656 | | | | 348 | | | | 0 | |
(1) Amounts represent the fair value of collateral for impaired loans allocated to the allowance for loan and lease losses.
22. First Financial Bancorp. (Parent Company Only) Financial Information
Balance Sheets
| | | December 31, | |
| (Dollars in thousands) | | 2009 | | | 2008 | |
| Assets | | | | | | |
| Cash | | $ | 75,517 | | | $ | 87,274 | |
| Investment securities, available for sale | | | 2,344 | | | | 1,908 | |
| Subordinated notes from subsidiaries | | | 7,500 | | | | 7,500 | |
| Investment in subsidiaries | | | | | | | | |
| Commercial banks | | | 580,198 | | | | 298,419 | |
| Nonbanks | | | 18,646 | | | | 18,879 | |
| Total investment in subsidiaries | | | 598,844 | | | | 317,298 | |
| | | | | | | | | |
| Loans | | | | | | | | |
| Real estate – commercial | | | 1,808 | | | | 3,921 | |
| Total loans | | | 1,808 | | | | 3,921 | |
| Allowance for loan and lease losses | | | 168 | | | | 22 | |
| Net loans | | | 1,640 | | | | 3,899 | |
| Premises and equipment | | | 795 | | | | 861 | |
| Other assets | | | 15,491 | | | | 15,733 | |
| Total assets | | $ | 702,131 | | | $ | 434,473 | |
| | | | | | | | | |
| Liabilities | | | | | | | | |
| Short-term borrowings | | $ | 0 | | | $ | 57,000 | |
| Subordinated debentures | | | 20,620 | | | | 20,620 | |
| Dividends payable | | | 5,144 | | | | 6,372 | |
| Other liabilities | | | 1,199 | | | | 2,154 | |
| Total liabilities | | | 26,963 | | | | 86,146 | |
| Shareholders’ equity | | | 675,168 | | | | 348,327 | |
| Total liabilities and shareholders’ equity | | $ | 702,131 | | | $ | 434,473 | |
| Statements of Income | | Year ended December 31, | |
| (Dollars in thousands) | | 2009 | | | 2008 | | | 2007 | |
| Income | | | | | | | | | |
| Interest income | | $ | 296 | | | $ | 367 | | | $ | 320 | |
| Noninterest income | | | 0 | | | | 52 | | | | 260 | |
| Dividends from subsidiaries | | | 40,700 | | | | 24,900 | | | | 31,700 | |
| Total income | | | 40,996 | | | | 25,319 | | | | 32,280 | |
| | | | | | | | | | | | | |
| Expenses | | | | | | | | | | | | |
| Interest expense | | | 1,851 | | | | 3,244 | | | | 5,758 | |
| Provision for (recovery of) loan and lease losses | | | 146 | | | | (227 | ) | | | 43 | |
| Salaries and employee benefits | | | 2,949 | | | | 2,604 | | | | 1,997 | |
| Miscellaneous professional services | | | 384 | | | | 366 | | | | 464 | |
| Other | | | 2,443 | | | | 2,113 | | | | 1,732 | |
| Total expenses | | | 7,773 | | | | 8,100 | | | | 9,994 | |
| Income before income taxes and (excess dividends from) equity in undistributed net earnings of subsidiaries | | | 33,223 | | | | 17,219 | | | | 22,286 | |
| Income tax benefit | | | (2,597 | ) | | | (2,579 | ) | | | (3,229 | ) |
| Equity in undistributed net income of (excess dividends from) subsidiaries | | | 210,726 | | | | 3,164 | | | | 10,166 | |
| Net income | | $ | 246,546 | | | $ | 22,962 | | | $ | 35,681 | |
First Financial Bancorp 2009 Annual Report 55
Notes To Consolidated Financial Statements
| | | Year ended December 31, | |
| (Dollars in thousands) | | 2009 | | | 2008 | | | 2007 | |
| Operating activities | | | | | | | | | |
| Net income | | $ | 246,546 | | | $ | 22,962 | | | $ | 35,681 | |
| Adjustments to reconcile net income to net cash provided by operating activities | | | | | | | | | | | | |
| Equity in undistributed earnings of subsidiaries | | | (210,726 | ) | | | (3,164 | ) | | | (10,166 | ) |
| Provision for loan and lease losses | | | 146 | | | | (227 | ) | | | 43 | |
| Depreciation and amortization | | | 67 | | | | 75 | | | | 79 | |
| Stock-based compensation expense | | | 2,799 | | | | 2,444 | | | | 1,384 | |
| Pension expense | | | 34 | | | | 85 | | | | 270 | |
| Deferred income taxes | | | (416 | ) | | | 115 | | | | 122 | |
| (Decrease) increase in dividends payable | | | (1,228 | ) | | | 20 | | | | 62 | |
| Increase (decrease) in accrued expenses | | | 1,094 | | | | (720 | ) | | | (508 | ) |
| Decrease in other assets | | | 573 | | | | 18,929 | | | | 5,319 | |
| Net cash provided by operating activities | | | 38,889 | | | | 40,519 | | | | 32,286 | |
| | | | | | | | | | | | | |
| Investing activities | | | | | | | | | | | | |
| Capital contributions to subsidiaries | | | (71,500 | ) | | | 0 | | | | 0 | |
| Purchases of investment securities, available-for-sale | | | (127 | ) | | | (159 | ) | | | (77 | ) |
| Net decrease in loans | | | 2,113 | | | | 176 | | | | 108 | |
| Purchases of premises and equipment | | | 0 | | | | 0 | | | | (15 | ) |
| Other | | | 674 | | | | 11 | | | | (84 | ) |
| Net cash (used in) provided by investing activities | | | (68,840 | ) | | | 28 | | | | (68 | ) |
| | | | | | | | | | | | | |
| Financing activities | | | | | | | | | | | | |
| (Decrease) increase in short-term borrowings | | | (57,000 | ) | | | (15,000 | ) | | | 32,500 | |
| Redemption of junior subordinated debt | | | 0 | | | | 0 | | | | (10,000 | ) |
| Cash dividends paid on common stock | | | (19,024 | ) | | | (25,443 | ) | | | (24,845 | ) |
| Cash dividends paid on preferred stock | | | (3,578 | ) | | | 0 | | | | 0 | |
| Proceeds from issuance of preferred stock and warrant | | | 0 | | | | 80,000 | | | | 0 | |
| Issuance of common stock | | | 97,985 | | | | 0 | | | | 0 | |
| Treasury stock purchases | | | 0 | | | | 0 | | | | (27,297 | ) |
| Proceeds from exercise of stock options, net of shares purchased | | | 0 | | | | 0 | | | | 82 | |
| Excess tax (liability) benefit on share-based compensation | | | (189 | ) | | | (14 | ) | | | 69 | |
| Net cash provided by (used in) financing activities | | | 18,194 | | | | 39,543 | | | | (29,491 | ) |
| Decrease (increase) in cash | | | (11,757 | ) | | | 80,090 | | | | 2,727 | |
| Cash at beginning of year | | | 87,274 | | | | 7,184 | | | | 4,457 | |
| Cash at end of year | | $ | 75,517 | | | $ | 87,274 | | | $ | 7,184 | |
56 First Financial Bancorp 2009 Annual Report
Quarterly Financial And Common Stock Data (Unaudited)
| | | Three months ended | |
| (Dollars in thousands, except per share data) | | March 31 | | | June 30 | | | September 30 | | | December 31 | |
| 2009 | | | | | | | | | | | | |
| Interest income | | $ | 42,781 | | | $ | 42,387 | | | $ | 54,715 | | | $ | 93,345 | |
| Interest expense | | | 11,853 | | | | 11,178 | | | | 14,051 | | | | 20,163 | |
| Net interest income | | | 30,928 | | | | 31,209 | | | | 40,664 | | | | 73,182 | |
| Provision for loan and lease losses | | | 4,259 | | | | 10,358 | | | | 26,655 | | | | 14,812 | |
| Noninterest income | | | | | | | | | | | | | | | | |
| Gains on sales of investment securities | | | 0 | | | | 3,349 | | | | 0 | | | | 0 | |
| Income (loss) on preferred securities | | | 11 | | | | 112 | | | | 154 | | | | (138 | ) |
| Gain on acquisition | | | 0 | | | | 0 | | | | 379,086 | | | | 0 | |
| All other | | | 12,022 | | | | 10,636 | | | | 11,788 | | | | 24,287 | |
| Noninterest expenses | | | 29,934 | | | | 32,796 | | | | 46,301 | | | | 61,607 | |
| Income before income taxes | | | 8,768 | | | | 2,152 | | | | 358,736 | | | | 20,912 | |
| Income tax expense | | | 3,033 | | | | 702 | | | | 133,170 | | | | 7,117 | |
| Net income | | | 5,735 | | | | 1,450 | | | | 225,566 | | | | 13,795 | |
| Dividends on preferred stock | | | 578 | | | | 1,000 | | | | 1,000 | | | | 1,000 | |
| Income available to common shareholders | | $ | 5,157 | | | $ | 450 | | | $ | 224,566 | | | $ | 12,795 | |
| | | | | | | | | | | | | | | | | |
| Earnings per common share: | | | | | | | | | | | | | | | | |
| Basic | | $ | 0.14 | | | $ | 0.01 | | | $ | 4.40 | | | $ | 0.25 | |
| Diluted | | $ | 0.14 | | | $ | 0.01 | | | $ | 4.36 | | | $ | 0.25 | |
| Cash dividends paid per common share | | $ | 0.17 | | | $ | 0.10 | | | $ | 0.10 | | | $ | 0.10 | |
| Market price | | | | | | | | | | | | | | | | |
| High | | $ | 12.10 | | | $ | 11.92 | | | $ | 12.07 | | | $ | 15.48 | |
| Low | | $ | 5.58 | | | $ | 7.35 | | | $ | 7.52 | | | $ | 11.83 | |
| | | | | | | | | | | | | | | | | |
| 2008 | | | | | | | | | | | | | | | | |
| Interest income | | $ | 47,598 | | | $ | 44,865 | | | $ | 45,756 | | | $ | 45,086 | |
| Interest expense | | | 19,349 | | | | 16,451 | | | | 16,346 | | | | 14,957 | |
| Net interest income | | | 28,249 | | | | 28,414 | | | | 29,410 | | | | 30,129 | |
| Provision for loan and lease losses | | | 3,223 | | | | 2,493 | | | | 3,219 | | | | 10,475 | |
| Noninterest income | | | | | | | | | | | | | | | | |
| Gains on sales of investment securities | | | 1,585 | | | | 0 | | | | 0 | | | | 0 | |
| Income (loss) on preferred securities | | | 20 | | | | (221 | ) | | | (3,400 | ) | | | (137 | ) |
| All other | | | 13,270 | | | | 13,969 | | | | 13,878 | | | | 12,785 | |
| Noninterest expenses | | | 29,020 | | | | 27,969 | | | | 28,340 | | | | 29,847 | |
| Income before income taxes | | | 10,881 | | | | 11,700 | | | | 8,329 | | | | 2,455 | |
| Income tax expense | | | 3,543 | | | | 3,892 | | | | 2,597 | | | | 371 | |
| Net income | | $ | 7,338 | | | $ | 7,808 | | | $ | 5,732 | | | $ | 2,084 | |
| Earnings per common share: | | | | | | | | | | | | | | | | |
| Basic | | $ | 0.20 | | | $ | 0.21 | | | $ | 0.15 | | | $ | 0.06 | |
| Diluted | | $ | 0.20 | | | $ | 0.21 | | | $ | 0.15 | | | $ | 0.06 | |
| Cash dividends paid per common share | | $ | 0.17 | | | $ | 0.17 | | | $ | 0.17 | | | $ | 0.17 | |
| Market price | | | | | | | | | | | | | | | | |
| High | | $ | 13.81 | | | $ | 13.88 | | | $ | 14.80 | | | $ | 14.30 | |
| Low | | $ | 10.19 | | | $ | 9.20 | | | $ | 8.10 | | | $ | 10.81 | |
First Financial Bancorp common stock trades on The Nasdaq Stock Market under the symbol FFBC.
First Financial Bancorp 2009 Annual Report 57
Financial Performance (Unaudited)
The following graph compares the five-year cumulative total return of First Financial Bancorp with that of companies that comprise the Nasdaq Market Index and a peer group comprised of actively traded bank holding companies in Ohio and Indiana, one actively traded bank holding company in Illinois, and one actively traded bank holding company in Idaho (the “Peer Group”).
The following table assumes $100 invested on December 31, 2004 in First Financial Bancorp, the Nasdaq Market Index and equally in the Peer Group, and assumes that dividends are reinvested. The returns of the issuers comprised of the Peer Group have been weighted according to their respective stock market capitalization.
| | | 2004 | | | 2005 | | | 2006 | | | 2007 | | | 2008 | | | 2009 | |
| First Financial Bancorp | | | 100.00 | | | | 103.64 | | | | 102.22 | | | | 73.64 | | | | 84.80 | | | | 104.45 | |
| Nasdaq Market Index | | | 100.00 | | | | 101.41 | | | | 114.05 | | | | 123.94 | | | | 73.43 | | | | 105.89 | |
| Peer Group Index | | | 100.00 | | | | 90.59 | | | | 101.81 | | | | 68.51 | | | | 36.31 | | | | 30.27 | |
The Peer Group is comprised of 1st Source Corporation, Amcore Financial, Inc., Community Bank Shares of Indiana, Inc., First Citizens Banc Corp., Fifth Third Bancorp, First Financial Bancorp, First Financial Corporation, FirstMerit Corporation, First Merchants Corporation, German American Bancorp, Inc., Huntington Bancshares Incorporated, Horizon Bancorp, Home Federal Bancorp, Inc., Integra Bank Corporation, KeyCorp, Lakeland Financial Corporation, LNB Bancorp, Inc., Monroe Bancorp, Mainsource Financial Group, Inc., NB&T Financial Group, Ohio Legacy Corporation, Old National Bancorp, Ohio Valley Banc Corp., Peoples Bancorp Inc., Park National Corporation, Rurban Financial Corp, Tower Financial Corporation, United Bancorp, Inc., and United Bancshares, Inc. The following entity was removed from the Peer Group due to its bankruptcy in 2009: Irwin Financial Corporation.
58 First Financial Bancorp 2009 Annual Report
2009 Annual Shareholder Meeting
The annual meeting of shareholders will be held on Tuesday, May 25, 2010, at 10:00 a.m. (EDT) at:
The Taft Center at Fountain Square
425 Walnut Street
Cincinnati, OH 45202
Common Stock Listing
| First Financial Bancorp’s common stock trades on the Nasdaq Stock Market under the symbol FFBC. At December 31, 2009, there were approximately 12,300 registered and beneficial shareholders. | | |
Registrar & Transfer Agent
Registrar and Transfer Company serves as the registrar and transfer agent for First Financial Bancorp common stock for registered shareholders. Shareholder account inquiries, including changes of address or ownership, transferring stock, and replacing lost certificates or dividend checks should be directed to Registrar and Transfer Company at:
Registrar and Transfer Company
10 Commerce Drive
Cranford, NJ 07016
1-800-368-5948
Shareholders of record can also access their shareholder account records and request information related to their shareholder account via the internet. To register for online account access, go to: www.rtco.com.
Dividend Reinvestment & Stock Purchase Plan
Shareholders of record holding 25 shares or more are eligible to participate in our Dividend Reinvestment Plan. Shareholders of record may elect to have cash dividends automatically reinvested in additional common shares and can also purchase additional common shares by making optional cash payments. To obtain a prospectus and authorization card to enroll in the plan, please visit the Investor Relations section of our website at www.bankatfirst.com/investor to print the documents or contact Investor Relations.
Investor Relations
Corporate and investor information, including news releases, webcasts, investor presentations, annual reports, proxy statements and SEC filings as well as information on the company’s corporate governance practices is available within the Investor Relations section of our website at www.bankatfirst.com/investor.
Shareholders, analysts and other investment professionals who would like corporate and financial information on First Financial Bancorp should contact:
Investor Relations
First Financial Bancorp
201 East Fourth Street, Suite 1900
Cincinnati, OH 45202-4248
Phone: 513-979-5782
Securities & Exchange Commission Filings
All reports filed electronically by First Financial Bancorp with the United States Securities and Exchange Commission (SEC), including the Annual Report on Form 10-K, quarterly reports on Form 10-Q, and current event reports on Form 8-K, as well as any amendments to those reports, are accessible at no cost within the Investor Relations section of our website at www.bankatfirst.com/investor, or by contacting Investor Relations. These filings are also accessible on the SEC’s website at www.sec.gov.
Media Requests
Members of the media should contact:
Cheryl Lipp
First Vice President, Marketing Director
First Financial Bancorp
201 East Fourth Street, Suite 1900
Cincinnati, OH 45202-4248
Phone: 513-979-5797
E-Mail: cheryl.lipp@bankatfirst.com
First Financial Bancorp
201 East Fourth Street
Cincinnati, OH 45202-4248
bankatfirst.com