UNITED STATES
SECURITIES AND EXCHANGE COMMISSION
Washington, D.C. 20549
FORM N-CSRS
CERTIFIED SHAREHOLDER REPORT OF REGISTERED MANAGEMENT
INVESTMENT COMPANIES |
Investment Company Act file number 811-03595
Name of Fund: BlackRock Healthcare Fund, Inc.
Fund Address: 100 Bellevue Parkway, Wilmington, DE 19809
Name and address of agent for service: Donald C. Burke, Chief Executive Officer, BlackRock
Healthcare Fund, Inc., 800 Scudders Mill Road, Plainsboro, NJ, 08536. Mailing address:
P.O. Box 9011, Princeton, NJ, 08543-9011
Registrant’s telephone number, including area code: (800) 441-7762
Date of fiscal year end: 04/30/2009
Date of reporting period: 05/01/2008 – 10/31/2008
Item 1 – Report to Stockholders |
EQUITIES FIXED INCOME REAL ESTATE LIQUIDITY ALTERNATIVES BLACKROCK SOLUTIONS
BlackRock
Healthcare Fund, Inc.
SEMI-ANNUAL REPORT
OCTOBER 31, 2008 | (UNAUDITED)

NOT FDIC INSURED MAY LOSE VALUE NO BANK GUARANTEE
| Table of Contents | | |
| | | Page |
| |
| A Letter to Shareholders | | 3 |
| Semi-Annual Report: | | |
| Fund Summary | | 4 |
| About Fund Performance | | 6 |
| Disclosure of Expenses | | 6 |
| Financial Statements: | | |
| Schedule of Investments | | 7 |
| Statement of Assets and Liabilities | | 9 |
| Statement of Operations | | 10 |
| Statements of Changes in Net Assets | | 11 |
| Financial Highlights | | 12 |
| Notes to Financial Statements | | 17 |
| Officers and Directors | | 21 |
| Disclosure of Investment Advisory Agreement and Subadvisory Agreement | | 22 |
| Additional Information | | 25 |
| Mutual Fund Family | | 27 |
2 BLACKROCK HEALTHCARE FUND, INC.
A Letter to Shareholders
Dear Shareholder
It has been a tumultuous period for investors, marked by almost daily headlines of deepening turmoil in financial markets and a darkening economic
outlook. The news took an extraordinarily heavy tone late in the period as the credit crisis boiled over and triggered unprecedented failures and consoli-
dation in the financial sector, stoking fears of a market and economic collapse and prompting a series of new government programs designed to
contain and combat the fallout.
The Federal Reserve Board (the “Fed”) has taken decisive measures to restore liquidity and stabilize the financial system. Key moves included
slashing the target federal funds rate 250 basis points (2.50%) between November 2007 and April 2008 and providing massive cash injections and
lending programs. In October, as credit conditions further deteriorated, the central bank cut the key interest rate by 50 basis points on two separate
occasions — on October 8 in coordination with five other global central banks, and again during its regularly scheduled meeting on October 29. This
left the key short-term rate at just 1.0%, its lowest level since 2004. While the U.S. economy appeared fairly resilient through the second quarter
of 2008, the third quarter saw a contraction of 0.5%, and a more significant decline is expected for the fourth quarter. Moreover, on December 1,
the National Bureau of Economic Research confirmed that the U.S. had entered a recession in December 2007.
Against this backdrop, U.S. equity markets experienced intense volatility, with periods of downward pressure punctuated by sharp rebounds. Losses
were significant and broad-based, though small-cap stocks fared moderately better than their larger counterparts. Non-U.S. markets decelerated at a
considerably faster pace than domestic equities — a stark reversal of recent years’ trends, when international stocks generally outpaced U.S. stocks.
Treasury issues also traded in a volatile fashion, but rallied overall (yields fell and prices correspondingly rose) and outperformed other fixed income
assets as investors continued their flight to higher quality and more liquid securities. Tax-exempt issues generally underperformed, as problems among
municipal bond insurers and the collapse in the market for auction rate securities afflicted the group throughout the course of the past year. At the
same time, the above mentioned economic headwinds and malfunctioning credit markets plagued the high yield sector, with the third quarter of 2008
marking one of the worst periods in history for the asset class.
Facing unprecedented volatility and macro pressures, the major benchmark indexes generally recorded losses for the six- and 12-month reporting periods:
| Total Returns as of October 31, 2008 | | 6-month | | 12-month |
| U.S. equities (S&P 500 Index) | | (29.28)% | | (36.10)% |
| Small cap U.S. equities (Russell 2000 Index) | | (24.39) | | (34.16) |
| International equities (MSCI Europe, Australasia, Far East Index) | | (41.21) | | (46.62) |
| Fixed income (Barclays Capital U.S. Aggregate Index*) | | (3.63) | | 0.30 |
| Tax-exempt fixed income (Barclays Capital Municipal Bond Index*) | | (4.70) | | (3.30) |
| High yield bonds | | | | |
| (Barclays Capital U.S. Corporate High Yield 2% Issuer Capped Index*) | | (24.86) | | (25.41) |
| |
| |
|
| *Formerly a Lehman Brothers Index. | | | | |
| Past performance is no guarantee of future results. Index performance shown is for illustrative purposes only. You cannot invest directly in an index. | | |
Through periods of market turbulence, as ever, BlackRock’s full resources are dedicated to the management of our clients’ assets. For our most
current views on the economy and financial markets, we invite you to visit www.blackrock.com/funds. As always, we thank you for entrusting
BlackRock with your investments, and we look forward to continuing to serve you in the months and years ahead.

President, BlackRock Advisors, LLC
| THIS PAGE NOT PART OF YOUR FUND REPORT |
Fund Summary
Portfolio Management Commentary
How did the Fund perform?
•For the six-month period, Fund results outpaced that of the broad-
market S&P 500 Index, but trailed the Russell 3000 Healthcare Index.
What factors influenced performance?
•During the period, we continued to emphasize the biotechnology
subsector, based on its potential for new drug discovery and develop-
ment. The Fund’s overweight in the group was the primary driver of
positive performance relative to the Russell 3000 Health Care Index,
as biotechnology outperformed the broad healthcare universe. An
underweight in the weak healthcare providers & services sub-group
also contributed to relative results. On an individual-stock basis,
Fund holdings Genoptix, Inc. and HMS Holdings Corp. were the
strongest contributors, each gaining more than 20 percent during
the period.
•The Fund’s performance was negatively impacted by positions in
Genmab A/S and Hologic, Inc., both of which fell more than 50%
over the six months. Positions in Aetna, Inc. and Cigna Corp. declined
by more than 40%, reflecting weakening business prospects in the
managed care arena. The stock selection effect was further weakened,
as we were underweight in Johnson & Johnson, which outperformed,
and overweight in Bayer AG and Glenmark Pharmaceuticals Ltd., which
were market laggards.
Describe recent portfolio activity.
•During the six months, we increased the Fund’s allocations to biotech-
nology, which remained its largest sub-industry overweight, as well as
to healthcare services. We also added to existing pharmaceuticals hold-
ings, including Bristol-Myers Squibb Co., Johnson & Johnson and Abbott
Laboratories. We believe that pharmaceuticals priced at present modest
valuations, coupled with attractive dividend yields, provide a degree of
downside support. On an individual-stock basis, the Fund’s top holdings
in biotechnology included Genentech, Inc., Celgene Corp. and Genzyme
Corp. Positions within each of these companies were increased over the
time period.
•By contrast, positions were sold in anticipation of economic impact on
the life sciences tools & services sub-sector. The most notable sales in
the portfolio included Waters Corp. and a significant reduction in Thermo
Fisher Scientific, Inc.
Describe Fund positioning at period-end.
•At period-end, the Fund’s most significant overweight relative to the
Russell 3000 Health Care Index was in the biotechnology subsector,
while pharmaceuticals remained its single largest sub-industry under-
weight. Although we are sensitive to the present economic challenge,
we remain optimistic on the long-term outlook for healthcare. The world’s
aging population, the rise of the middle class within emerging markets,
and the potential for major scientific advances in genomics and molec-
ular biology underlie our optimism over the prospects for the sector.
The views expressed reflect the opinions of BlackRock as of the date of this report and are subject to change based on changes in market, economic or other conditions.
These views are not intended to be a forecast of future events and are no guarantee of future results.
| Portfolio Information | | | | | | |
| | | Percent of | | | | Percent of |
| Ten Largest Holdings | | Net Assets | | Five Largest Industries | | Net Assets |
| Genentech, Inc. | | 9% | | Pharmaceuticals | | 36% |
| Bristol-Myers Squibb Co. | | 6 | | Biotechnology | | 30 |
| Johnson & Johnson | | 5 | | Health Care Equipment & Supplies | | 14 |
| Abbott Laboratories | | 5 | | Health Care Providers & Services | | 11 |
| Celgene Corp. | | 5 | | Health Care Technology | | 4 |
| Genzyme Corp. | | 5 | | | | Percent of |
| Genoptix, Inc. | | 4 | | | | Long-Term |
| Bayer AG | | 4 | | Sector Representation | | Investments |
| Teva Pharmaceutical Industries Ltd. | | 4 | | Health Care | | 98% |
| Novartis AG Registered Shares | | 4 | | Consumer Staples | | 1 |
| | | | | Information Technology | | 1 |
For Fund compliance purposes, the Fund's industry and sector classifications refer to
any one or more of the industry and sector sub-classifications used by one or more
widely recognized market indexes or ratings group indexes, and/or as defined by Fund
management. This definition may not apply for purposes of this report, which may
combine such industry and sector sub-classifications for reporting ease.
| 4 BLACKROCK HEALTHCARE FUND, INC. OCTOBER 31, 2008 |
Total Return Based on a $10,000 Investment
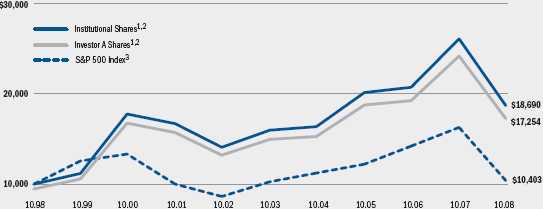
| 1 | Assuming maximum sales charge, if any, transaction costs and other operating expenses, including advisory fees. |
| |
| 2 | The Fund invests worldwide primarily in equity securities of companies that, in the opinion of management, derive or are expected to derive a substantial portion of their sales from products or services in health care. |
| |
| 3 | This unmanaged Index covers 500 industrial, utility, transportation and financial companies of the U.S. markets (mostly NYSE issues) representing about 75% of NYSE market capitalization and 30% of NYSE issues. |
| |
| Performance Summary for the Period Ended October 31, 2008 | | | | | | | | | | | | |
| | | | | | | | | Average Annual Total Returns4 | | | | |
| | | | |
| |
| |
| |
| |
|
| | | | | 1 Year | | | | 5 Years | | | | 10 Years |
| | | | |
| |
| |
| |
| |
|
| | | 6-Month | | w/o sales | | w/sales | | w/o sales | | w/sales | | w/o sales | | w/sales |
| | | Total Returns | | charge | | charge | | charge | | charge | | charge | | charge |
| Institutional | | (16.64)% | | (28.31)% | | — | | 3.19% | | — | | 6.45% | | — |
| Investor A | | (16.95) | | (28.60) | | (32.35)% | | 2.90 | | 1.80% | | 6.18 | | 5.61% |
| Investor B | | (17.39) | | (29.26) | | (32.16) | | 2.08 | | 1.85 | | 5.53 | | 5.53 |
| Investor C | | (16.96) | | (29.06) | | (29.70) | | 2.15 | | 2.15 | | 5.35 | | 5.35 |
| Class R | | (17.00) | | (28.95) | | — | | 2.58 | | — | | 5.94 | | — |
| S&P 500 Index | | (29.28) | | (36.10) | | — | | 0.26 | | — | | 0.40 | | — |
| Russell 3000 Health Care Index5 | | (13.94) | | (23.79) | | — | | 0.58 | | — | | 0.82 | | — |
| 4 | Assuming maximum sales charges. See “About Fund Performance” on page 6 for a detailed description of share classes, including any related sales charges and fees. |
| |
| 5 | The Russell 3000 Health Care Index is an unmanaged index containing companies involved in medical services or healthcare in the Russell 3000 Index. Past performance is not indicative of future results. |
| |
| Expense Example | | | | | | | | | | | | |
| | | | | Actual | | | | | | Hypothetical2 | | |
| | |
| |
| |
| |
| |
| |
|
| | | Beginning | | Ending | | | | Beginning | | Ending | | |
| | | Account Value | | Account Value | | Expenses Paid | | Account Value | | Account Value | | Expenses Paid |
| | | May 1, 2008 | | October 31, 2008 | | During the Period1 | | May 1, 2008 | | October 31, 2008 | | During the Period1 |
| Institutional | | $1,000 | | $833.60 | | $ 6.10 | | $1,000 | | $1,018.55 | | $ 6.72 |
| Investor A | | $1,000 | | $830.50 | | $ 7.20 | | $1,000 | | $1,017.34 | | $ 7.93 |
| Investor B | | $1,000 | | $826.10 | | $11.23 | | $1,000 | | $1,012.90 | | $12.38 |
| Investor C | | $1,000 | | $830.40 | | $11.03 | | $1,000 | | $1,013.15 | | $12.13 |
| Class R | | $1,000 | | $830.00 | | $10.06 | | $1,000 | | $1,014.21 | | $11.07 |
| 1 | For each class of the Fund, expenses are equal to the annualized expense ratio for the class (1.32% for Institutional, 1.56% for Investor A, 2.44% for Investor B, 2.39% for Investor C and 2.18% for Class R), multiplied by the average account value over the period, multiplied by 184/365 (to reflect the one-half year period shown). |
| |
| 2 | Hypothetical 5% annual return before expenses is calculated by pro-rating the number of days in the most recent fiscal half year divided by 365. See “Disclosure of Expenses” on page 6 for further information on how expenses were calculated. |
| |
| BLACKROCK HEALTHCARE FUND, INC. |
About Fund Performance
•Institutional Sharesare not subject to any sales charge. Institutional
Shares bear no ongoing distribution or service fees and are available
only to eligible investors.
•Investor A Sharesincur a maximum initial sales charge (front-end load)
of 5.25% and a service fee of 0.25% per year (but no distribution fee).
•Investor B Sharesare subject to a maximum contingent deferred sales
charge of 4.50% declining to 0% after six years. In addition, Investor B
Shares are subject to a distribution fee of 0.75% per year and a service
fee of 0.25% per year. These shares automatically convert to Investor A
Shares after approximately eight years. (There is no initial sales charge
for automatic share conversions.) All returns for periods greater than
eight years reflect this conversion.
•Investor C Sharesare subject to a distribution fee of 0.75% & nbsp; per year and a service fee of 0.25% per year. In addition, Investor C Shares are
subject to a 1% contingent deferred sales charge if redeemed within
one year of purchase.
•Class R Sharesdo not incur a maximum initial sales charge (front-end
load) or deferred sales charge. These shares are subject to a distribution
fee of 0.25% per year and a service fee of 0.25% per year. Class R
Shares are available only to certain retirement plans. Prior to inception,
Class R Share performance results are those of the Institutional Shares
(which have no distribution or service fees) restated to reflect Class R
Share fees.
Performance information reflects past performance and does not guar-
antee future results. Current performance may be lower or higher than
the performance data quoted. Refer to www.blackrock.com/funds
to obtain performance data current to the most recent month-end.
Performance results do not reflect the deduction of taxes that a share-
holder would pay on fund distributions or the redemption of fund shares.
Figures shown in the performance table on page 5 assume reinvestment
of all dividends and capital gain distributions, if any, at net asset value
on the ex-dividend date. Investment return and principal value of shares
will fluctuate so that shares, when redeemed, may be worth more or less
than their original cost. Dividends paid to each class of shares will vary
because of the different levels of service, distribution and transfer
agency fees applicable to each class, which are deducted from the
income available to be paid to shareholders.
Disclosure of Expenses
Shareholders of this Fund may incur the following charges: (a) expenses
related to transactions, including sales charges, redemption fees and
exchange fees; and (b) operating expenses including advisory fees,
distribution fees including 12b-1 fees, and other Fund expenses. The
expense example on page 4 (which is based on a hypothetical invest-
ment of $1,000 invested on May 1, 2008 and held through October 31,
2008) is intended to assist shareholders both in calculating expenses
based on an investment in the Fund and in comparing these expenses
with similar costs of investing in other mutual funds.
The table provides information about actual account values and actual
expenses. In order to estimate the expenses a shareholder paid during
the period covered by this report, shareholders can divide their account
value by $1,000 and then multiply the result by the number correspon-
ding to their share class under the heading entitled “Expenses Paid
During the Period.”
The table also provides information about hypothetical account values
and hypothetical expenses based on the Fund’s actual expense ratio
and an assumed rate of return of 5% per year before expenses. In
order to assist shareholders in comparing the ongoing expenses of
investing in this Fund and other funds, compare the 5% hypothetical
example with the 5% hypothetical examples that appear in other funds’
shareholder reports.
The expenses shown in the table are intended to highlight shareholders’
ongoing costs only and do not reflect any transactional expenses, such
as sales charges, redemption fees or exchange fees. Therefore, the hypo-
thetical example is useful in comparing ongoing expenses only, and will
not help shareholders determine the relative total expenses of owning
different funds. If these transactional expenses were included, shareholder
expenses would have been higher.
6 BLACKROCK HEALTHCARE FUND, INC. OCTOBER 31, 2008
Schedule of Investments October 31, 2008 (Unaudited) (Percentages shown are based on Net Assets)
| Common Stocks | | Shares | | Value | | Common Stocks | | Shares | | Value |
| |
| Biotechnology — 30.0% | | | | | | Health Care Technology — 4.3% | | | | |
| Amgen, Inc. (a) | | 94,000 | | $ 5,629,660 | | Cerner Corp. (a)(b) | | 77,000 | | $ 2,866,710 |
| Celgene Corp. (a) | | 274,000 | | 17,607,240 | | HLTH Corp. (a) | | 1,383,200 | | 11,466,728 |
| Cephalon, Inc. (a) | | 45,733 | | 3,279,971 | | | | | | 14,333,438 |
| Cleveland BioLabs, Inc. (a)(b) | | 148,942 | | 454,273 | | | | | | |
| Cougar Biotechnology, Inc. (a) | | 50,000 | | 1,270,000 | | Internet Software & Services — 1.2% | | | | |
| Cytori Therapeutics, Inc. (a) | | 77,800 | | 311,200 | | WebMD Health Corp. Class A (a)(b) | | 177,000 | | 3,955,950 |
| GenVec, Inc. (a)(b) | | 2,000,000 | | 1,980,000 | | Life Sciences Tools & Services — 0.2% | | | | |
| Genentech, Inc. (a) | | 380,000 | | 31,517,200 | | Thermo Fisher Scientific, Inc. (a) | | 20,000 | | 812,000 |
| Genmab A/S (a) | | 30,000 | | 1,354,899 | | Pharmaceuticals — 36.3% | | | | |
| Genzyme Corp. (a) | | 213,532 | | 15,562,212 | | Abbott Laboratories | | 320,000 | | 17,648,000 |
| Gilead Sciences, Inc. (a) | | 203,000 | | 9,307,550 | | Bayer AG | | 250,000 | | 13,685,291 |
| Intercell AG (a) | | 50,000 | | 1,401,165 | | Bristol-Myers Squibb Co. | | 1,020,000 | | 20,961,000 |
| Lexicon Genetics, Inc. (a) | | 1,100,000 | | 1,727,000 | | Eli Lilly & Co. | | 20,000 | | 676,400 |
| Medigene AG (a) | | 400,000 | | 2,491,715 | | Forest Laboratories, Inc. (a) | | 28,000 | | 650,440 |
| Onyx Pharmaceuticals, Inc. (a) | | 60,000 | | 1,618,800 | | Glenmark Pharmaceuticals Ltd. | | 106,187 | | 628,683 |
| Seattle Genetics, Inc. (a) | | 200,000 | | 2,056,000 | | Johnson & Johnson | | 300,000 | | 18,402,000 |
| Synta Pharmaceuticals Corp. (a)(b) | | 180,000 | | 1,274,400 | | Merck & Co., Inc. | | 100,000 | | 3,095,000 |
| Vertex Pharmaceuticals, Inc. (a) | | 79,000 | | 2,070,590 | | Novartis AG Registered Shares | | 240,000 | | 12,181,924 |
| Vical, Inc. (a) | | 107,300 | | 175,972 | | Pfizer, Inc. | | 500,000 | | 8,855,000 |
| | | | | 101,089,847 | | Roche Holding AG | | 60,000 | | 9,175,611 |
| Food & Staples Retailing — 0.9% | | | | | | Shire Pharmaceuticals Plc (c) | | 60,000 | | 2,367,000 |
| CVS Caremark Corp. | | 100,000 | | 3,065,000 | | Teva Pharmaceutical Industries Ltd. (c) | | 299,000 | | 12,821,120 |
| | | | | | | United Laboratories Ltd. (a) | | 4,000,000 | | 949,521 |
| Health Care Equipment & Supplies — 13.9% | | | | | | | | | | |
| Baxter International, Inc. | | 120,000 | | 7,258,800 | | | | | | 122,096,990 |
| China Medical Technologies, Inc. (b)(c) | | 120,000 | | 2,924,400 | | Total Long-Term Investments | | | | |
| Gen-Probe, Inc. (a) | | 119,000 | | 5,600,140 | | (Cost — $327,549,282) — 98.1% | | | | 330,380,376 |
| Hologic, Inc. (a) | | 245,000 | | 2,998,800 | | | | | | |
| Masimo Corp. (a) | | 271,100 | | 8,672,489 | | | | | | |
| Mindray Medical International Ltd. (c) | | 99,400 | | 2,143,064 | | | | | | |
| SonoSite, Inc. (a)(b) | | 416,000 | | 8,765,120 | | | | Beneficial | | |
| VNUS Medical Technologies, Inc. (a) | | 550,000 | | 8,486,500 | | | | Interest | | |
| | | | | 46,849,313 | | Short-Term Securities | | (000) | | |
| Health Care Providers & Services — 11.3% | | | | | | BlackRock Liquidity Series, LLC | | | | |
| Aetna, Inc. | | 300,000 | | 7,461,000 | | Cash Sweep Series, 4.6% (d)(e) | | $ 10,860 | | 10,860,189 |
| Express Scripts, Inc. (a) | | 114,000 | | 6,909,540 | | BlackRock Liquidity Series, LLC | | | | |
| Genoptix, Inc. (a)(b) | | 434,203 | | 14,519,748 | | Money Market Series, 1.57% (d)(e)(f) | | 13,729 | | 13,728,750 |
| Medco Health Solutions, Inc. (a) | | 225,000 | | 8,538,750 | | Total Short-Term Securities | | | | |
| Quest Diagnostics, Inc. | | 16,000 | | 748,800 | | (Cost — $24,588,939) — 7.3% | | | | 24,588,939 |
| | | | | 38,177,838 | | Total Investments (Cost — $352,138,221*) — 105.4% | | 354,969,315 |
| | | | | | | Liabilities in Excess of Other Assets — (5.4)% | | | | (18,250,257) |
| | | | | | | Net Assets — 100.0% | | | | $336,719,058 |
See Notes to Financial Statements.
BLACKROCK HEALTHCARE FUND, INC. OCTOBER 31, 2008 7 |
Schedule of Investments (concluded)
* The cost and unrealized appreciation (depreciation) of investments as of October
31, 2008, as computed for federal income tax purposes, were as follows:
| Aggregate cost | | $ 358,414,969 |
| Gross unrealized appreciation | | $ 25,751,436 |
| Gross unrealized depreciation | | (29,197,090) |
| Net unrealized depreciation | | $ (3,445,654) |
(a) Non-income producing security.
(b) Security, or a portion of security, is on loan.
(c) Depositary receipts.
(d) Investments in companies considered to be an affiliate of the Fund, for purposes
of Section 2(a)(3) of the Investment Company Act of 1940, were as follows:
| | | Net | | |
| | | Activity | | |
| Affiliate | | (000) | | Income |
| |
| BlackRock Liquidity Series, LLC | | | | |
| Cash Sweep Series | | $ 10,860 | | $189,944 |
| BlackRock Liquidity Series, LLC | | | | |
| Money Market Series | | $ 13,729 | | $336,448 |
| Merrill Lynch Premier Institutional Fund | | $(87,398) | | — |
(e) Represents the current yield as of report date.
(f) Security was purchased with the cash proceeds from securities loans.
•For Fund compliance purposes,the Fund’s industry classifications refer to any
one or more of the industry sub-classifications used by one or more widely rec-
ognized market indexes or ratings group indexes, and/or as defined by Fund
management. This definition may not apply for purposes of this report, which
may combine such industry sub-classifications for reporting ease.
•Effective May 1,2008,the Fund adopted Financial Accounting Standards Board
Statement of Financial Accounting Standards No. 157, “Fair Value Measurements”
(“FAS 157”). FAS 157 clarifies the definition of fair value, establishes a frame-
work for measuring fair values and requires additional disclosures about the use
of fair value measurements. Various inputs are used in determining the fair value
of investments, which are as follows:
•Level 1 — price quotations in active markets/exchanges for identical securities
•Level 2 — other observable inputs (including,but not limited to: quoted prices
for similar assets or liabilities in markets that are not active, inputs other than
quoted prices that are observable for the assets or liabilities (such as interest
rates, yield curves, volatilities, prepayment speeds, loss severities, credit risks,
and default rates)
•Level 3 — unobservable inputs based on the best information available in the
circumstance, to the extent observable inputs are not available (including the
Fund’s own assumption used in determining the fair value of investments)
The inputs or methodology used for valuing securities are not necessarily an
indication of the risk associated with investing in those securities. For information
about the Fund’s policy regarding valuation of investments and other significant
accounting policies, please refer to Note 1 of the Notes to Financial Statements.
The following table summarizes the inputs used as of October 31, 2008 in deter-
mining the fair valuation of the Fund’s investments: |
| Valuation | | Investments in |
| Inputs | | Securities |
| Level 1 | | $288,511,568 |
| Level 2 | | 66,457,747 |
| Level 3 | | — |
| Total | | $354,969,315 |
See Notes to Financial Statements.
8 BLACKROCK HEALTHCARE FUND, INC.
| Statement of Assets and Liabilities | | |
| |
| October 31, 2008 (Unaudited) | | |
| |
| Assets | | |
| |
| Investments at value — unaffiliated (including securities loaned of $12,981,341) (cost — $327,549,282) | | $ 330,380,376 |
| Investments at value — affiliated (cost — $24,588,939) | | 24,588,939 |
| Foreign currency at value (cost — $745,542) | | 745,680 |
| Cash. | | 497,053 |
| Investments sold receivable — unaffiliated | | 5,417,969 |
| Investments sold receivable — affiliated | | 1,643,133 |
| Capital shares sold receivable | | 873,499 |
| Dividends receivable | | 599,661 |
| Securities lending income receivable — affiliated | | 80,631 |
| Prepaid expenses | | 25,799 |
| Total assets | | 364,852,740 |
| |
| Liabilities | | |
| |
| Collateral at value — securities loaned | | 13,728,750 |
| Investments purchased payable — unaffiliated | | 7,228,186 |
| Investments purchased payable — affiliated | | 4,808,867 |
| Capital shares redeemed payable | | 1,720,801 |
| Investment advisory fees payable | | 295,390 |
| Other affiliates payable | | 138,330 |
| Distribution fees payable | | 108,375 |
| Other accrued expenses payable | | 95,985 |
| Officer’s and Directors’ fees payable | | 8,898 |
| Other liabilities | | 100 |
| Total liabilities | | 28,133,682 |
| Net Assets | | $ 336,719,058 |
| |
| Net Assets Consist of | | |
| |
| Institutional Shares, $0.10 par value, 200,000,000 shares authorized. | | $ 2,133,653 |
| Investor A Shares, $0.10 par value, 100,000,000 shares authorized. | | 3,084,707 |
| Investor B Shares, $0.10 par value, 250,000,000 shares authorized. | | 1,028,056 |
| Investor C Shares, $0.10 par value, 100,000,000 shares authorized. | | 2,022,585 |
| Class R Shares, $0.10 par value, 250,000,000 shares authorized. | | 275,805 |
| Paid-in capital in excess of par. | | 354,867,333 |
| Accumulated net investment loss | | (2,301,961) |
| Accumulated net realized loss | | (27,211,008) |
| Net unrealized appreciation/depreciation | | 2,819,888 |
| Net Assets | | $ 336,719,058 |
| |
| Net Asset Value | | |
| |
| Institutional — Based on net assets of $105,764,294 and 21,336,525 shares outstanding | | $ 4.96 |
| Investor A — Based on net assets of $136,183,453 and 30,847,066 shares outstanding | | $ 4.41 |
| Investor B — Based on net assets of $29,341,928 and 10,280,562 shares outstanding. | | $ 2.85 |
| Investor C — Based on net assets of $57,356,558 and 20,225,850 shares outstanding. | | $ 2.84 |
| Class R — Based on net assets of $8,072,825 and 2,758,053 shares outstanding | | $ 2.93 |
| See Notes to Financial Statements. |
| BLACKROCK HEALTHCARE FUND, INC. |
| Statement of Operations | | |
| |
| Six Months Ended October 31, 2008 (Unaudited) | | |
| |
| Investment Income | | |
| |
|
| Dividends (net of $12,912 foreign withholding tax) | | $ 868,975 |
| Income — affiliated | | 195,861 |
| Securities lending — affiliated | | 336,448 |
| Total income. | | 1,401,284 |
| |
| Expenses | | |
| |
| Investment advisory | | 2,105,509 |
| Service - Investor A | | 216,788 |
| Service and distribution — Investor B | | 198,602 |
| Service and distribution — Investor C | | 345,045 |
| Service and distribution — Class R | | 23,765 |
| Transfer agent — Institutional | | 125,689 |
| Transfer agent — Investor A | | 153,893 |
| Transfer agent — Investor B | | 59,326 |
| Transfer agent — Investor C | | 89,229 |
| Transfer agent — Class R | | 26,366 |
| Accounting services | | 84,983 |
| Custodian | | 52,546 |
| Printing | | 40,714 |
| Professional | | 39,128 |
| Registration | | 34,983 |
| Officer and Directors | | 9,697 |
| Miscellaneous | | 14,112 |
| Total expenses | | 3,620,375 |
| Net investment loss | | (2,219,091) |
| |
| Realized and Unrealized Loss | | |
| Net realized loss from: | | |
| Investments | | (14,064,422) |
| Foreign currency | | (250,307) |
| | | (14,314,729) |
| Net change in unrealized appreciation/depreciation on: | | |
| Investments (including $127,380 foreign capital gain credit) | | (54,897,484) |
| Foreign currency | | (65,827) |
| | | (54,963,311) |
| Total realized and unrealized loss | | (69,278,040) |
| Net Decrease in Net Assets Resulting from Operations | | $ (71,497,131) |
| See Notes to Financial Statements. |
10 BLACKROCK HEALTHCARE FUND, INC.
| Statements of Changes in Net Assets | | | | |
| |
| | | Six Months | | |
| | | Ended | | Year Ended |
| | | October 31, 2008 | | April 30, |
| Increase (Decrease) in Net Assets: | | (Unaudited) | | 2008 |
| |
| Operations | | | | |
| |
| Net investment loss | | $ (2,219,091) | | $ (3,725,015) |
| Net realized gain (loss) | | (14,314,729) | | 23,945,308 |
| Net change in unrealized appreciation/depreciation | | (54,963,311) | | (39,638,687) |
| Net decrease in net assets resulting from operations | | (71,497,131) | | (19,418,394) |
| |
| Distributions to Shareholders From | | | | |
| |
| Net realized gain: | | | | |
| Institutional | | — | | (19,190,519) |
| Investor A | | — | | (23,511,776) |
| Investor B | | — | | (11,380,057) |
| Investor C | | — | | (13,862,386) |
| Class R | | — | | (1,455,949) |
| Tax return of capital: | | | | |
| Institutional | | — | | (821,866) |
| Investor A | | — | | (1,066,468) |
| Investor B | | — | | (519,689) |
| Investor C | | — | | (681,171) |
| Class R | | — | | (74,088) |
| Decrease in net assets resulting from distributions to shareholders | | — | | (72,563,969) |
| |
| Capital Share Transactions | | | | |
| |
| Net increase (decrease) in net assets derived from capital share transactions | | (23,994,991) | | 72,072,219 |
| |
| Net Assets | | | | |
| |
| Total decrease in net assets | | (95,492,122) | | (19,910,144) |
| Beginning of period | | 432,211,180 | | 452,121,324 |
| End of period | | $ 336,719,058 | | $ 432,211,180 |
| End of period accumulated net investment loss | | $ (2,301,961) | | $ (82,870) |
| See Notes to Financial Statements. |
| BLACKROCK HEALTHCARE FUND, INC. |
| Financial Highlights | | | | | | | | | | | | | |
| | | | | | | | Institutional | | | | |
| Six Months |
| Ended |
| | | October 31, 2008 | | | | Year Ended April 30, | | | | |
| | | (Unaudited) | | | 2008 | | 2007 | | 2006 | | 2005 | | 2004 |
| Per Share Operating Performance | | | | | | | | | | | | | |
| |
| Net asset value, beginning of period | | $ 5.95 | $ 7.08 | $ 7.29 | | $ 6.55 | $ 6.87 | | $ 5.59 |
| Net investment loss1 | | (0.02) | | | (0.03) | | (0.04) | | (0.05) | | (0.06) | | (0.05) |
| Net realized and unrealized gain (loss) | | (0.97) | | | (0.14) | | 0.67 | | 1.27 | | 0.11 | | 1.33 |
| Net increase (decrease) from investment operations | | (0.99) | | | (0.17) | | 0.63 | | 1.22 | | 0.05 | | 1.28 |
| Distributions from: | | | | | | | | | | | | | |
| Net realized gain | | — | | | (0.92) | | (0.84) | | (0.48) | | (0.37) | | — |
| Tax return of capital | | — | | | (0.04) | | — | | — | | — | | — |
| Total distributions | | — | | | (0.96) | | (0.84) | | (0.48) | | (0.37) | | — |
| Net asset value, end of period | | $ 4.96 | $ 5.95 | $ 7.08 | | $ 7.29 | $ 6.55 | | $ 6.87 |
| |
| Total Investment Return2 | | | | | | | | | | | | | |
| |
| Based on net asset value | | (16.64)%3 | | (3.54)% | 10.62% | | 18.70%4 | | 0.99% | | 22.90% |
| |
| Ratios to Average Net Assets | | | | | | | | | | | | | |
| Total expenses | | 1.32%5 | | | 1.29% | | 1.33% | | 1.30% | | 1.33% | | 1.29% |
| Net investment loss | | (0.66)%5 | | | (0.42)% | | (0.64)% | | (0.75)% | | (0.88)% | | (0.75)% |
| |
| Supplemental Data | | | | | | | | | | | | | |
| |
| Net assets, end of period (000) | | $ 105,764 | $ 132,784 | $ 147,755 | | $ 159,116 | $ 146,922 | | $ 275,570 |
| Portfolio turnover | | 89% | | | 163% | | 152% | | 120% | | 127% | | 141% |
| 1 | Based on average shares outstanding. |
| |
| 2 | Total investment returns exclude the effects of any sales charges. |
| |
| 3 | Aggregate total investment return. |
| |
| 4 | A portion of total investment return consisted of a payment by the previous investment advisor, which had no impact to the return. |
| |
| 5 | Annualized. |
| |
| See Notes to Financial Statements. |
12 BLACKROCK HEALTHCARE FUND, INC.
| Financial Highlights (continued) | | | | | | | | | | | | | | | | |
| | | | | | | | | Investor A | | | | | | |
| Six Months |
| Ended |
| | | October 31, 2008 | | | | Year Ended April 30, | | | | |
| | | (Unaudited) | | | | 2008 | | 2007 | | 2006 | | | | 2005 | | 2004 |
| |
| |
| |
| |
| |
| |
| |
| |
|
| Per Share Operating Performance | | | | | | | | | | | | | | | | |
| |
| Net asset value, beginning of period | | $ 5.31 | | $ 6.41 | | $ 6.69 | | $ 6.04 | | $ 6.38 | | $ 5.21 |
| Net investment loss1 | | (0.02) | | | | (0.04) | | (0.05) | | (0.07) | | | | (0.07) | | (0.06) |
| Net realized and unrealized gain (loss) | | (0.88) | | | | (0.12) | | 0.61 | | 1.19 | | | | 0.10 | | 1.23 |
| Net increase (decrease) from investment operations | | (0.90) | | | | (0.16) | | 0.56 | | 1.12 | | | | 0.03 | | 1.17 |
| Distributions from: | | | | | | | | | | | | | | | | |
| Net realized gain | | — | | | | (0.90) | | (0.84) | | (0.47) | | | | (0.37) | | — |
| Tax return of capital | | — | | | | (0.04) | | — | | — | | | | — | | — |
| Total distributions | | — | | | | (0.94) | | (0.84) | | (0.47) | | | | (0.37) | | — |
| Net asset value, end of period | | $ 4.41 | | $ 5.31 | | $ 6.41 | | $ 6.69 | | $ 6.04 | | $ 6.38 |
| |
| Total Investment Return2 | | | | | | | | | | | | | | | | |
| |
| Based on net asset value | | (16.95)%3 | | | | (3.80)% | | 10.43% | | 18.61%4 | | | | 0.74% | | 22.46% |
| |
| Ratios to Average Net Assets | | | | | | | | | | | | | | | | |
| |
| Total expenses | | 1.56%5 | | | | 1.52% | | 1.57% | | 1.55% | | | | 1.58% | | 1.55% |
| Net investment loss | | (0.89)%5 | | | | (0.64)% | | (0.89)% | | (0.99)% | | | | (1.13)% | | (1.00)% |
| |
| Supplemental Data | | | | | | | | | | | | | | | | |
| |
| Net assets, end of period (000) | | $ 136,183 | | $ 175,094 | | $ 160,652 | | $ 172,585 | | $ 142,774 | | $ 160,443 |
| Portfolio turnover | | 89% | | | | 163% | | 152% | | 120% | | | | 127% | | 141% |
| 1 | Based on average shares outstanding. |
| |
| 2 | Total investment returns exclude the effects of sales charges. |
| |
| 3 | Aggregate total investment return. |
| |
| 4 | A portion of total investment return consisted of a payment by the previous investment advisor, which had no impact to the return. |
| |
| 5 | Annualized. |
| |
| See Notes to Financial Statements. |
| BLACKROCK HEALTHCARE FUND, INC. |
| Financial Highlights (continued) | | | | | | | | | | | | | | | | | | |
| |
| | | | | | | | | Investor B | | | | | | | | |
| Six Months |
| Ended |
| | | October 31, 2008 | �� | | | Year Ended April 30, | | | | | | |
| | | (Unaudited) | | | | 2008 | | 2007 | | 2006 | | | | 2005 | | | | 2004 |
| Per Share Operating Performance | | | | | | | | | | | | | | | | | | |
| |
| Net asset value, beginning of period | | $ 3.45 | | $ 4.44 | | $ 4.93 | | $ 4.57 | | $ 4.96 | | $ 4.08 |
| Net investment loss1 | | (0.03) | | | | (0.06) | | (0.07) | | (0.09) | | | | (0.09) | | | | (0.08) |
| Net realized and unrealized gain (loss) | | (0.57) | | | | (0.06) | | 0.41 | | 0.89 | | | | 0.07 | | | | 0.96 |
| Net increase (decrease) from investment operations | | (0.60) | | | | (0.12) | | 0.34 | | 0.80 | | | | (0.02) | | | | 0.88 |
| Distributions from: | | | | | | | | | | | | | | | | | | |
| Net realized gain | | — | | | | (0.83) | | (0.83) | | (0.44) | | | | (0.37) | | | | — |
| Tax return of capital | | — | | | | (0.04) | | — | | — | | | | — | | | | — |
| Total distributions | | — | | | | (0.87) | | (0.83) | | (0.44) | | | | (0.37) | | | | — |
| Net asset value, end of period | | $ 2.85 | | $ 3.45 | | $ 4.44 | | $ 4.93 | | $ 4.57 | | $ 4.96 |
| |
| Total Investment Return2 | | | | | | | | | | | | | | | | | | |
| |
| Based on net asset value | | (17.39)%3 | | | | (4.49)% | | 9.41% | | 17.64%4 | | | | (0.09)% | | 21.57% |
| |
| Ratios to Average Net Assets | | | | | | | | | | | | | | | | | | |
| |
| Total expenses | | 2.44%5 | | | | 2.37% | | 2.36% | | 2.33% | | | | 2.36% | | | | 2.32% |
| Net investment loss | | (1.78)%5 | | | | (1.52)% | | (1.67)% | | (1.79)% | | | | (1.91)% | | | | (1.78)% |
| |
| Supplemental Data | | | | | | | | | | | | | | | | | | |
| |
| Net assets, end of period (000) | | $ 29,342 | | $ 44,711 | | $ 68,034 | | $ 105,503 | | $ 117,482 | | $ 177,952 |
| Portfolio turnover | | 89% | | | | 163% | | 152% | | 120% | | | | 127% | | | | 141% |
| 1 | Based on average shares outstanding. |
| |
| 2 | Total investment returns exclude the effects of sales charges. |
| |
| 3 | Aggregate total investment return. |
| |
| 4 | A portion of total investment return consisted of a payment by the previous investment advisor, which increased the return by 0.23%. |
| |
| 5 | Annualized. |
| |
| See Notes to Financial Statements. |
14 BLACKROCK HEALTHCARE FUND, INC.
| Financial Highlights (continued) | | | | | | | | | | | | | | | | | | |
| |
| | | | | | | | | Investor C | | | | | | | | |
| Six Months |
| Ended |
| | | October 31, 2008 | | | | Year Ended April 30, | | | | | | |
| | | (Unaudited) | | | | 2008 | | 2007 | | 2006 | | | | 2005 | | | | 2004 |
| Per Share Operating Performance | | | | | | | | | | | | | | | | | | |
| |
| Net asset value, beginning of period | | $ 3.42 | | $ 4.43 | | $ 4.92 | | $ 4.57 | | $ 4.96 | | $ 4.07 |
| Net investment loss1 | | (0.03) | | | | (0.06) | | (0.07) | | (0.09) | | | | (0.09) | | | | (0.08) |
| Net realized and unrealized gain (loss) | | (0.55) | | | | (0.06) | | 0.41 | | 0.88 | | | | 0.07 | | | | 0.97 |
| Net increase (decrease) from investment operations | | (0.58) | | | | (0.12) | | 0.34 | | 0.79 | | | | (0.02) | | | | 0.89 |
| Distributions from: | | | | | | | | | | | | | | | | | | |
| Net realized gain | | — | | | | (0.85) | | (0.83) | | (0.44) | | | | (0.37) | | | | — |
| Tax return of capital | | — | | | | (0.04) | | — | | — | | | | — | | | | — |
| Total distributions | | — | | | | (0.89) | | (0.83) | | (0.44) | | | | (0.37) | | | | — |
| Net asset value, end of period | | $ 2.84 | | $ 3.42 | | $ 4.43 | | $ 4.92 | | $ 4.57 | | $ 4.96 |
| |
| Total Investment Return2 | | | | | | | | | | | | | | | | | | |
| |
| Based on net asset value | | (16.96)%3 | | | | (4.62)% | | 9.47% | | 17.50%4 | | | | (0.09)% | | 21.87% |
| |
| Ratios to Average Net Assets | | | | | | | | | | | | | | | | | | |
| |
| Total expenses | | 2.39%5 | | | | 2.35% | | 2.36% | | 2.33% | | | | 2.37% | | | | 2.33% |
| Net investment loss | | (1.72)%5 | | | | (1.47)% | | (1.67)% | | (1.77)% | | | | (1.92)% | | | | (1.79)% |
| |
| Supplemental Data | | | | | | | | | | | | | | | | | | |
| |
| Net assets, end of period (000) | | $ 57,357 | | $ 70,452 | | $ 69,535 | | $ 85,553 | | $ 68,743 | | $ 85,753 |
| Portfolio turnover | | 89% | | | | 163% | | 152% | | 120% | | | | 127% | | | | 141% |
| 1 | Based on average shares outstanding. |
| |
| 2 | Total investment returns exclude the effects of sales charges. |
| |
| 3 | Aggregate total investment return. |
| |
| 4 | A portion of total investment return consisted of a payment by the previous investment advisor, which had no impact to the return. |
| |
| 5 | Annualized. |
| |
| See Notes to Financial Statements. |
| BLACKROCK HEALTHCARE FUND, INC. |
| Financial Highlights (concluded) |
| | | | | | | | | Class R | | | | | | | | |
| Six Months |
| Ended |
| | | October 31, 2008 | | | | Year Ended April 30, | | | | |
| | | (Unaudited) | | | | 2008 | | 2007 | | | | 2006 | | | | 2005 | | 2004 |
| Per Share Operating Performance | | | | | | | | | | | | | | | | | | |
| |
| Net asset value, beginning of period | | $ 3.53 | | $ 4.57 | | $ 5.04 | | $ 4.66 | | $ 5.02 | | $ 4.09 |
| Net investment loss1 | | (0.03) | | | | (0.05) | | (0.05) | | | | (0.06) | | | | (0.06) | | (0.02) |
| Net realized and unrealized gain (loss) | | (0.57) | | | | (0.06) | | 0.42 | | | | 0.90 | | | | 0.07 | | 0.95 |
| Net increase (decrease) from investment operations | | (0.60) | | | | (0.11) | | 0.37 | | | | 0.84 | | | | 0.01 | | 0.93 |
| Distributions from: | | | | | | | | | | | | | | | | | | |
| Net realized gain | | — | | | | (0.89) | | (0.84) | | | | (0.46) | | | | (0.37) | | — |
| Tax return of capital | | — | | | | (0.04) | | — | | | | — | | | | — | | — |
| Total distributions | | — | | | | (0.93) | | (0.84) | | | | (0.46) | | | | (0.37) | | — |
| Net asset value, end of period | | $ 2.93 | | $ 3.53 | | $ 4.57 | | $ 5.04 | | $ 4.66 | | $ 5.02 |
| |
| Total Investment Return | | | | | | | | | | | | | | | | | | |
| Based on net asset value | | (17.00)%2 | | | | (4.29)% | | 9.98% | | | | 18.25%3 | | | | 0.54% | | 22.74% |
| |
| Ratios to Average Net Assets | | | | | | | | | | | | | | | | | | |
| |
| Total expenses | | 2.18%4 | | | | 2.06% | | 1.88% | | | | 1.80% | | | | 1.83% | | 1.73% |
| Net investment loss | | (1.51)%4 | | | | (1.16)% | | (1.20)% | | | | (1.20)% | | | | (1.37)% | | (1.15)% |
| |
| Supplemental Data | | | | | | | | | | | | | | | | | | |
| |
| Net assets, end of period (000) | | $ 8,073 | | $ 9,170 | | $ 6,145 | | $ 4,885 | | $ 1,853 | | $ 473 |
| Portfolio turnover | | 89% | | | | 163% | | 152% | | | | 120% | | | | 127% | | 141% |
| 1 | Based on average shares outstanding. |
| |
| 2 | Aggregate total investment return. |
| |
| 3 | A portion of total investment return consisted of a payment by the previous investment advisor, which had no impact to the return. |
| |
| 4 | Annualized. |
| |
See Notes to Financial Statements.
16 BLACKROCK HEALTHCARE FUND, INC.
Notes to Financial Statements (Unaudited)
1. Organization and Significant Accounting Policies:
BlackRock Healthcare Fund, Inc. (the “Fund”) is registered under the
Investment Company Act of 1940, as amended (the “1940 Act”), as a
non-diversified, open-end management investment company. The Fund
is organized as a Maryland corporation. The Fund’s financial state-
ments are prepared in conformity with accounting principles generally
accepted in the United States of America, which may require the use of
management accruals and estimates. Actual results may differ from
these estimates. The Fund offers multiple classes of shares. Institutional
Shares are sold only to certain eligible investors. Investor A Shares are
generally sold with a front-end sales charge. Investor B and Investor C
Shares may be subject to a contingent deferred sales charge. Class R
Shares are sold only to certain retirement plans. All classes of shares
have identical voting, dividend, liquidation and other rights and the
same terms and conditions, except that Investor A, Investor B, Investor C
and Class R Shares bear certain expenses related to the shareholder
servicing of such shares, and Investor B, Investor C and Class R Shares
also bear certain expenses related to the distribution of such shares.
Each class has exclusive voting rights with respect to matters relating
to its shareholder servicing and distribution expenditures (except that
Investor B shareholders may vote on material changes to the Investor A
distribution plan).
The following is a summary of significant accounting policies followed by
the Fund:
Valuation of Investments: Equity investments traded on a recognized
securities exchange or the NASDAQ Global Market System are valued at
the last reported sale price that day or the NASDAQ official closing price,
if applicable. For equity investments traded on more than one exchange,
the last reported sale price on the exchange where the stock is primarily
traded is used. Equity investments traded on a recognized exchange for
which there were no sales on that day are valued at the last available
bid price. If no bid price is available, the prior day’s price will be used,
unless it is determined that such prior day’s price no longer reflects the
fair value of the security. The Fund values its investments in Cash Sweep
Series and Money Market Series each of the BlackRock Liquidity Series,
LLC at fair value, which is ordinarily based upon their pro-rata ownership
in the net assets of the underlying fund.
In the event that application of these methods of valuation results in a
price for an investment which is deemed not to be representative of the
market value of such investment, the investment will be valued by a
method approved by the Board of Directors (the “Board”) as reflecting
fair value (“Fair Value Assets”). When determining the price for Fair Value
Assets, the investment advisor and/or sub-advisor seeks to determine
the price that the Fund might reasonably expect to receive from the cur-
rent sale of that asset in an arm’s-length transaction. Fair value determi-
nations shall be based upon all available factors that the investment advisor and/or sub-advisor deems relevant. The pricing of all Fair Value
Assets is subsequently reported to the Board or a committee thereof.
Generally, trading in foreign securities is substantially completed each
day at various times prior to the close of business on the New York Stock
Exchange (“NYSE”). The values of such securities used in computing the
net assets of the Fund are determined as of such times. Foreign cur-
rency exchange rates will be determined as of the close of business on
the NYSE. Occasionally, events affecting the values of such securities
and such exchange rates may occur between the times at which they
are determined and the close of business on the NYSE that may not
be reflected in the computation of the Fund’s net assets. If events
(for example, a company announcement, market volatility or a natural
disaster) occur during such periods that are expected to materially
affect the value of such securities, those securities may be valued at
their fair value as determined in good faith by the Board or by the
investment advisor using a pricing service and/or procedures approved
by the Board.
Foreign Currency Transactions: Foreign currency amounts are translated
into United States dollars on the following basis: (i) market value of
investment securities, assets and liabilities at the current rate of
exchange; and (ii) purchases and sales of investment securities, income
and expenses at the rates of exchange prevailing on the respective dates
of such transactions.
The Fund reports foreign currency related transactions as components
of realized gains for financial reporting purposes, whereas such compo-
nents are treated as ordinary income for federal income tax purposes.
Investment Transactions and Investment Income: Investment transac-
tions are recorded on the dates the transactions are entered into (the
trade dates). Realized gains and losses on security transactions are
determined on the identified cost basis. Dividend income is recorded
on the ex-dividend dates. Dividends from foreign securities where the
ex-dividend date may have passed are subsequently recorded when the
Fund has determined the ex-dividend date. Interest income is recognized
on the accrual basis. Income and realized and unrealized gains and
losses are allocated daily to each class based on its relative net assets.
Dividends and Distributions: Dividends and distributions paid by the
Fund are recorded on the ex-dividend dates.
Securities Lending: The Fund may lend securities to financial institutions
that provide cash or securities issued or guaranteed by the U.S. govern-
ment as collateral, which will be maintained at all times in an amount
equal to at least 100% of the current market value of the loaned securi-
ties. The market value of the loaned securities is determined at the close
of business of the Fund and any additional required collateral is deliv-
ered to the Fund on the next business day. The Fund typically receives
| BLACKROCK HEALTHCARE FUND, INC. |
Notes to Financial Statements (continued)
the income on the loaned securities but does not receive the income on
the collateral. Where the Fund receives cash collateral, it may invest such
collateral and retain the amount earned on such investment, net of any
amount rebated to the borrower. The Fund may receive a flat fee for its
loans. Loans of securities are terminable at any time and the borrower,
after notice, is required to return borrowed securities within the standard
time period for settlement of securities transactions. The Fund may pay
reasonable lending agent, administrative and custodial fees in connec-
tion with its loans. In the event that the borrower defaults on its obliga-
tion to return borrowed securities because of insolvency or for any other
reason, the Fund could experience delays and costs in gaining access to
the collateral. The Fund also could suffer a loss where the value of the
invested collateral falls below the market value of the borrowed secu-
rities, either in the event of borrower default or in the event of losses
on investments made with cash collateral.
Income Taxes: It is the Fund’s policy to comply with the requirements of
the Internal Revenue Code applicable to regulated investment compa-
nies and to distribute substantially all of its taxable income to its share-
holders. Therefore, no federal income tax provision is required. Under the
applicable foreign tax laws, a withholding tax may be imposed on inter-
est, dividends and capital gains at various rates.
The Fund files U.S. federal and various state and local tax returns. No
income tax returns are currently under examination. The statute of limita-
tions on the Fund’s tax returns remains open for the years ended April
30, 2005 through April 20, 2007. The statutes of limitations on the
Fund’s state and local tax returns may remain open for an additional
year depending upon the jurisdiction.
Recent Accounting Pronouncement: In March 2008, Statement of
Financial Accounting Standards No. 161, “Disclosures about Derivative
Instruments and Hedging Activities-an amendment of FASB Statement
No. 133” (“FAS 161”), was issued. FAS 161 is intended to improve
financial reporting for derivative instruments by requiring enhanced
disclosure that enables investors to understand how and why an entity
uses derivatives, how derivatives are accounted for, and how derivative
instruments affect an entity’s results of operations and financial posi-
tion. In September 2008, FASB Staff Position No. 133-1 and FASB
Interpretation No. 45-4 (the “FSP”), “Disclosures about Credit Derivatives
and Certain Guarantees: An Amendment of FASB Statement No. 133
and FASB Interpretation No. 45; and Clarification of the Effective Date
of FASB Statement No. 161” was issued and is effective for fiscal years
and interim periods ending after November 15, 2008. The FSP amends
FASB Statement No. 133, “Accounting for Derivative Instruments and
Hedging Activities,” to require disclosures by sellers of credit derivatives,
including credit derivatives embedded in hybrid instruments. The FSP also clarifies the effective date of FAS 161, whereby disclosures required
by FAS 161 are effective for financial statements issued for fiscal
years and interim periods beginning after November 15, 2008. The
impact on the Funds’ financial statement disclosures, if any, is currently
being assessed.
Other: Expenses directly related to the Fund or its classes are charged
to that Fund or class. Other operating expenses shared by several funds
are pro-rated among those funds on the basis of relative net assets or
other appropriate methods. Other expenses of the Fund are allocated
daily to each class based on its relative net assets.
2. Investment Advisory Agreement and Other Transactions
with Affiliates:
The Fund entered into an Investment Advisory Agreement with BlackRock
Advisors, LLC (the “Advisor”), an indirect, wholly owned subsidiary of
BlackRock, Inc., to provide investment advisory and administration ser-
vices. Merrill Lynch & Co., Inc. (“Merrill Lynch”) and The PNC Financial
Services Group, Inc. (“PNC”) are principal owners of BlackRock, Inc.
The Advisor is responsible for the management of the Fund’s portfolio
and provides the necessary personnel, facilities, equipment and certain
other services necessary to the operation of the Fund. For such services,
the Fund pays the Advisor a monthly fee at an annual rate of 1.00% of
the average daily value of the Fund’s net assets.
The Advisor has entered into a separate sub-advisory agreement
with BlackRock Investment Management, LLC (“BIM”), an affiliate of the
Advisor, under which the Advisor pays BIM for services it provides, a
monthly fee that is an annual percentage of the investment advisory
fee paid by the Fund to the Advisor.
For the six months ended October 31, 2008, the Fund reimbursed the
Advisor $3,618, for certain accounting services, which is included in
accounting services in the Statement of Operations.
Effective October 1, 2008, the Fund entered into separate Distribution
Agreements and Distribution Plans with BlackRock Investments, Inc.
(“BII”), which replaced FAM Distributors, Inc. (“FAMD”) and BlackRock
Distributors, Inc. and its affiliates (“BDI”) (collectively, the “Distributor”)
as the sole distributor of the Fund. FAMD is a wholly owned subsidiary
of Merrill Lynch Group, Inc., and BII and BDI are affiliates of BlackRock,
Inc. The service and distribution fees did not change as a result of
this transaction.
Pursuant to the Distribution Plans adopted by the Fund in accordance
with Rule 12b-1 under the 1940 Act, the Fund pays the Distributor
ongoing service and distribution fees. The fees are accrued daily and
18 BLACKROCK HEALTHCARE FUND, INC.
Notes to Financial Statements (continued)
paid monthly at annual rates based upon the average daily net assets of
the shares as follows:
| | | Service | | Distribution |
| | | Fee | | Fee |
| Investor A | | 0.25% | | — |
| Investor B | | 0.25% | | 0.75% |
| Investor C | | 0.25% | | 0.75% |
| Class R | | 0.25% | | 0.25% |
Pursuant to sub-agreements with the Distributor, broker-dealers, including
Merrill Lynch, Pierce, Fenner & Smith Incorporated (“MLPF&S”), a wholly
owned subsidiary of Merrill Lynch, and the Distributor provide shareholder
servicing and distribution services to the Fund. The ongoing service fee
and/or distribution fee compensates the Distributor and each broker-
dealer for providing shareholder servicing and/or distribution-related
services to Investor A, Investor B, Investor C and Class R shareholders.
For the six months ended October 31, 2008, affiliates earned under-
writing discounts, direct commissions and dealer concessions on sales
of the Fund’s Investor A Shares, which totaled $25,087 and affiliates
received contingent deferred sales charges of $23,098 and $8,796
relating to transactions in Investor B and Investor C Shares, respectively.
Furthermore, affiliates received contingent deferred sales charges of
$48 relating to transactions subject to front-end sales charge waivers
on Investor A Shares.
The Fund has received an exemptive order from the Securities and
Exchange Commission permitting it to lend portfolio securities to
MLPF&S or its affiliates. As of October 31, 2008, the Fund loaned secu-
rities with a value of $2,093,270 to MLPF&S or its affiliates. Pursuant to
that order, the Fund has retained BIM as the securities lending agent for
a fee based on a share of the returns on investment of cash collateral.
BIM may, on behalf of the Fund, invest cash collateral received by the
Fund for such loans, among other things, in a private investment comp-
any managed by the Advisor or in registered money market funds
advised by the Advisor or its affiliates. For the six months ended October
31, 2008, BIM received $78,950 in securities lending agent fees.
In addition, MLPF&S and Piper Jaffray & Co. (considered an affiliate of
the Advisor for a portion of the period) received $282,514 and $1,620,
respectively, in commissions on the execution of portfolio security trans-
actions for the Fund for the six months ended October 31, 2008.
Pursuant to written agreements, certain affiliates provide the Fund with
sub-accounting, recordkeeping, sub-transfer agency and other adminis-
trative services with respect to sub-accounts they service. For these
services, these affiliates receive an annual fee per shareholder account
which will vary depending on share class. For the six months ended |
October 31, 2008, the Fund paid $309,424 in return for these services,
which are a component of the transfer agent fees in the accompanying
Statement of Operations.
The Fund may earn income on positive cash balances in demand
deposit accounts that are maintained by the transfer agent on behalf
of the Fund. For the six months ended October 31, 2008, the Fund
earned $5,917, which is included in income from affiliates in the
Statement of Operations.
PNC Global Investment Servicing (U.S.) Inc., formerly PFPC Inc., an
indirect, wholly owned subsidiary of PNC and an affiliate of the Advisor,
serves as transfer agent. Each class of the Fund bears the costs of trans-
fer agent fees associated with such respective classes. Transfer agency
fees borne by each class of the Fund are comprised of those fees
charged for all shareholder communications including mailing of share-
holder reports, dividend and distribution notices, and proxy materials
for shareholders meetings, as well as per account and per transaction
fees related to servicing and maintenance of shareholder accounts,
including the issuing, redeeming and transferring of shares of each
class of the Fund, 12b-1 fee calculation, check writing, anti-money
laundering services, and customer identification services.
The Advisor maintains a call center, which is responsible for providing
certain shareholder services to the Fund, such as responding to share-
holder inquiries and processing transactions based upon instructions
from shareholders with respect to the subscription and redemption of
Fund shares. For the six months ended October 31, 2008, the Fund
reimbursed the Advisor the following amounts for costs incurred running
the call center, which are a component of the transfer agent fees in the
accompanying Statement of Operations. |
| | | Call Center |
| | | Fees |
| Institutional | | $3,575 |
| Investor A | | $4,224 |
| Investor B | | $ 948 |
| Investor C | | $1,441 |
| Class R | | $ 168 |
Certain officers and/or directors of the Fund are officers and/or directors
of BlackRock, Inc. or its affiliates. The Fund reimburses the Advisor for
compensation paid to the Fund’s Chief Compliance Officer.
3. Investments:
Purchases and sales of investments, excluding short-term securities,
for the six months ended October 31, 2008, were $357,413,694, and
$367,769,359, respectively.
| BLACKROCK HEALTHCARE FUND, INC. |
| Notes to Financial Statements (continued) | | | | |
| |
| 4. Capital Share Transactions: | | | | | | |
| Transactions in shares for each class were as follows: | | | | | | |
| |
| | | Six Months Ended | | Year Ended |
| | | October 31, 2008 | | April 30, 2008 |
| | | Shares | Amount | | Shares | Amount |
| Institutional | | | | | | |
| Shares sold | | 1,454,278 | $ 8,400,961 | | 3,636,933 | $ 24,157,299 |
| Shares issued to shareholders in reinvestment | | | | | | |
| of distributions | | — | — | | 1,666,185 | 11,110,554 |
| Total issued | | 1,454,278 | 8,400,961 | | 5,303,118 | 35,267,853 |
| Shares redeemed | | (2,419,241) | (14,185,460) | | (3,859,722) | (25,369,674) |
| Net increase (decrease) | | (964,963) | $ (5,784,499) | | 1,443,396 | $ 9,898,179 |
| |
| Investor A | | | | | | |
| Shares sold and automatic conversion of shares | | 5,134,399 | $ 27,050,389 | | 13,900,855 | $ 81,903,347 |
| Shares issued to shareholders in reinvestment | | | | | | |
| of distributions | | — | — | | 2,230,527 | 13,359,839 |
| Total issued | | 5,134,399 | 27,050,389 | | 16,131,382 | 95,263,186 |
| Shares redeemed | | (7,267,604) | (35,838,476) | | (8,232,045) | (48,139,484) |
| Net increase (decrease) | | (2,133,205) | $ (8,788,087) | | 7,899,337 | $ 47,123,702 |
| |
| Investor B | | | | | | |
| Shares sold | | 681,949 | $ 2,326,412 | | 2,536,472 | $ 10,043,911 |
| Shares issued to shareholders in reinvestment | | | | | | |
| of distributions | | — | — | | 1,603,409 | 6,436,538 |
| Total issued | | 681,949 | 2,326,412 | | 4,139,881 | 16,480,449 |
| Shares redeemed and automatic conversion of shares | | (3,371,897) | (11,287,601) | | (6,493,212) | (25,984,096) |
| Net decrease | | (2,689,948) | $ (8,961,189) | | (2,353,331) | $ (9,503,647) |
| |
| Investor C | | | | | | |
| Shares sold | | 2,759,374 | $ 9,330,109 | | 7,623,364 | $ 29,864,565 |
| Shares issued to shareholders in reinvestment | | | | | | |
| of distributions | | — | — | | 1,872,373 | 7,474,447 |
| Total issued | | 2,759,374 | 9,330,109 | | 9,495,737 | 37,339,012 |
| Shares redeemed | | (3,106,590) | (10,361,677) | | (4,610,643) | (17,870,414) |
| Net increase (decrease) | | (347,216) | $ (1,031,568) | | 4,885,094 | $ 19,468,598 |
| |
| Class R | | | | | | |
| Shares sold | | 894,050 | $ 3,072,729 | | 2,286,947 | $ 9,216,749 |
| Shares issued to shareholders in reinvestment | | | | | | |
| of distributions | | — | — | | 186,789 | 767,099 |
| Total issued | | 894,050 | 3,072,729 | | 2,473,736 | 9,983,848 |
| Shares redeemed | | (732,927) | (2,502,377) | | (1,221,218) | (4,898,461) |
| Net increase | | 161,123 | $ 570,352 | | 1,252,518 | $ 5,085,387 |
20 BLACKROCK HEALTHCARE FUND, INC.
Notes to Financial Statements (concluded)
5. Short-Term Borrowings:
The Fund, along with certain other funds managed by the Advisor and
its affiliates, is a party to a $500,000,000 credit agreement with a
group of lenders, which expired in November 2008 and was subsequently
renewed until November 2009. The Fund may borrow under the credit
agreement to fund shareholder redemptions and for other lawful purpos-
es other than for leverage. The Fund may borrow up to the maximum
amount allowable under the Fund’s current Prospectus and Statement
of Additional Information, subject to various other legal, regulatory or
contractual limits. The Fund pays a commitment fee of 0.06% per annum
based on the Fund’s pro rata share of the unused portion of the credit
agreement, which is included in miscellaneous in the Statement of
Operations. Amounts borrowed under the credit agreement bear interest
at a rate equal to, at the fund’s election, the federal funds rate plus
0.35% or a base rate as defined in the credit agreement. The Fund
did not borrow under the credit agreement during the six months
ended October 31, 2008.
6. Commitments:
At October 31, 2008, the Fund had entered into foreign exchange
contracts under which it had agreed to purchase and sell various
foreign currencies with approximate values of $3,415,000 and
$31,000, respectively.
7. Subsequent Event:
On September 15, 2008, Bank of America Corporation announced that
it has agreed to acquire Merrill Lynch, one of the principal owners of
BlackRock, Inc. The purchase has been approved by the shareholders
and directors of both companies and certain regulators. Subject to other
regulatory approvals, the transaction is expected to close on or about
December 31, 2008. |
Officers and Directors
Ronald W. Forbes, Co-Chairman of the Board and Director
Rodney D. Johnson, Co-Chairman of the Board and Director
David O. Beim, Director
Richard S. Davis, Director
Henry Gabbay, Director
Dr. Matina Horner, Director
Herbert I. London, Director
Cynthia A. Montgomery, Director
Joseph . Platt, Jr., Director
Robert C. Robb, Jr., Director
Toby Rosenblatt, Director
Kenneth L. Urish, Chairman of the Audit Committee and Director
Frederick W. Winter, Director
Donald C. Burke, Fund President and Chief Executive Officer
Anne F. Ackerley, Vice President
Neal J. Andrews, Chief Financial Officer
Jay M. Fife, Treasurer
Brian . Kindelan, Chief Compliance Officer of the Fund
Howard B. Surloff, Secretary
Custodian
JPMorgan Chase Bank, N.A.
Brooklyn, NY 11245
Transfer Agent
PNC Global Investment Servicing (U.S.) Inc.
Wilmington, DE 19809
Accounting Agent
State Street Bank and
Trust Company
Princeton, NJ 08540
Independent Registered Public
Accounting Firm
Deloitte & Touche LLP
Princeton, NJ 08540
Legal Counsel
Sidley Austin LLP
New York, NY 10019
| BLACKROCK HEALTHCARE FUND, INC. |
Disclosure of Investment Advisory Agreement and Subadvisory Agreement
The Board of Directors (the “Board,” the members of which are referred
to as “Directors”) of BlackRock Healthcare Fund, Inc. (the “Fund”) met in
person in April and June 2008 to consider the approval of the invest-
ment advisory agreement (the “Advisory Agreement”) between the Fund
and BlackRock Advisors, LLC (the “Advisor”). The Board also considered
the approval of the subadvisory agreement between the Advisor and
BlackRock Investment Management, LLC (the “Subadvisor”) (the
“Subadvisory Agreement”). The Advisor and the Subadvisor are referred
to herein as “BlackRock.” The Advisory Agreement and the Subadvisory
Agreement are referred to herein as the “Agreements.”
Activities and Composition of the Board
The Board consists of thirteen individuals, eleven of whom are not “inter-
ested persons” as defined in the Investment Company Act of 1940, as
amended (the “1940 Act”) (the “Independent Directors”). The Directors
are responsible for the oversight of the operations of the Fund and per-
form the various duties imposed on the directors of investment compa-
nies by the 1940 Act. The Independent Directors have retained inde-
pendent legal counsel to assist them in connection with their duties. The
Co-Chairs of the Board are both Independent Directors. The Board estab-
lished four standing committees: an Audit Committee, a Governance and
Nominating Committee, a Compliance Committee and a Performance
Oversight Committee, each of which is composed of, and chaired by,
Independent Directors.
The Agreements
Upon the consummation of the combination of BlackRock’s investment
management business with Merrill Lynch & Co., Inc.’s investment man-
agement business, including Merrill Lynch Investment Managers, L. . and
certain affiliates (the “Transaction”), the Fund entered into the Advisory
Agreement with the Advisor with an initial two-year term and the Advisor
entered into the Subadvisory Agreement with the Subadvisor with an ini-
tial two-year term. Consistent with the 1940 Act, prior to the expiration of
each Agreement’s initial two-year term, the Board is required to consider
the continuation of the Agreements on an annual basis. In connection
with this process, the Board assessed, among other things, the nature,
scope and quality of the services provided to the Fund by the personnel
of BlackRock and its affiliates, including investment management, admi-
nistrative services, shareholder services, oversight of fund accounting
and custody, marketing services and assistance in meeting legal and
regulatory requirements. The Board also received and assessed informa-
tion regarding the services provided to the Fund by certain unaffiliated
service providers.
Throughout the year, the Board, acting directly and through its commit-
tees, considers at each of its meetings factors that are relevant to its
annual consideration of the renewal of the Agreements, including the
services and support provided to the Fund and its shareholders. Among
the matters the Board considered were: (a) investment performance for
one, three and five years, as applicable, against peer funds, as well as
senior management’s and portfolio managers’ analysis of the reasons for
underperformance, if applicable; (b) fees, including advisory, administra-
tion, if applicable, and other fees paid to BlackRock and its affiliates by
the Fund, such as transfer agency fees and fees for marketing and distri-
bution; (c) the Fund’s operating expenses; (d) the resources devoted to
and compliance reports relating to the Fund’s investment objective, poli-
cies and restrictions; (e) the Fund’s compliance with its Code of Ethics
and compliance policies and procedures; (f) the nature, cost and char-
acter of non-investment management services provided by BlackRock
and its affiliates; (g) BlackRock’s and other service providers’ internal
controls; (h) BlackRock’s implementation of the proxy voting guidelines
approved by the Board; (i) the use of brokerage commissions and
spread and execution quality; (j) valuation and liquidity procedures; and
(k) periodic overview of BlackRock’s business, including BlackRock’s
response to the increasing scale of its business.
Board Considerations in Approving the Agreements
The Approval Process: Prior to the April 16, 2008 meeting at which
approval of the Agreements was to be considered, the Board requested
and received materials specifically relating to the Agreements. The Board
is engaged in an ongoing process with BlackRock to continuously review
the nature and scope of the information provided to better assist its
deliberations. These materials included (a) information independently
compiled and prepared by Lipper, Inc. (“Lipper”) on the Fund’s fees and
expenses and the investment performance of the Fund as compared with
a peer group of funds as determined by Lipper (“Peers”); (b) information
on the profitability of the Agreements to BlackRock and certain affiliates,
including their other relationships with the Fund, and a discussion of fall-
out benefits; (c) a general analysis provided by BlackRock concerning
investment advisory fees charged to other clients, such as institutional
and closed-end funds under similar investment mandates, as well as the
performance of such other clients; (d) a report on economies of scale;
(e) sales and redemption data regarding the Fund’s shares; and (f) an
internal comparison of management fees classified by Lipper, if applica-
ble. At the April 16, 2008 meeting, the Board requested and subse-
quently received from BlackRock (i) comprehensive analysis of total
expenses on a fund-by-fund basis; (ii) further analysis of investment per-
formance; (iii) further data regarding Fund profitability, Fund size and
Fund fee levels; and (iv) additional information on sales and redemp-
tions.
The Board also considered other matters it deemed important to the
approval process, such as payments made to BlackRock or its affiliates
relating to the distribution of Fund shares, services related to the valua-
tion and pricing of portfolio holdings of the Fund, allocation of Portfolio
brokerage fees (including the benefits of “soft dollars”), and direct and
indirect benefits to BlackRock and its affiliates from their relationship
with the Fund. The Board did not identify any particular information as
controlling, and each Director may have attributed different weights to
the various items considered.
22 BLACKROCK HEALTHCARE FUND, INC.
Disclosure of Investment Advisory Agreement and Subadvisory Agreement (continued)
At an in-person meeting held on April 16, 2008, the Board discussed
and considered the proposed renewal of the Agreements. As a result of
the discussions, the Board requested and BlackRock provided additional
information, as detailed above, in advance of the June 3-4, 2008 Board
meeting. At the in-person meeting held on June 3-4, 2008, the Board,
including the Independent Directors, unanimously approved the continua-
tion of (a) the Advisory Agreement between the Advisor and the Fund
for a one-year term ending June 30, 2009 and (b) the Subadvisory
Agreement between the Advisor and the Subadvisor with respect to the
Fund for a one-year term ending June 30, 2009. The Board considered
all factors it believed relevant with respect to the Fund, including, among
other factors: (i) the nature, extent and quality of the services provided
by BlackRock; (ii) the investment performance of the Fund and
BlackRock portfolio management; (iii) the advisory fee and the cost
of the services and profits to be realized by BlackRock and certain affili-
ates from the relationship with the Fund; and (iv) economies of scale.
A. Nature, Extent and Quality of the Services: The Board, including the
Independent Directors, reviewed the nature, extent and quality of services
provided by BlackRock, including the investment advisory services and
the resulting performance of the Fund. The Board compared the Fund’s
performance to the performance of a comparable group of mutual funds
as classified by Lipper and the performance of at least one relevant
index or combination of indices. The Board met with BlackRock’s senior
management personnel responsible for investment operations, including
the senior investment officers. The Board also reviewed the materials
provided by the Fund’s portfolio management team discussing Fund per-
formance and the Fund’s investment objective, strategies and outlook.
The Board considered, among other factors, the number, education and
experience of BlackRock’s investment personnel generally, and of the
Fund’s portfolio management team; BlackRock’s portfolio trading capa-
bilities; BlackRock’s use of technology; BlackRock’s commitment to com-
pliance; and BlackRock’s approach to training and retaining portfolio
managers and other research, advisory and management personnel. The
Board also reviewed BlackRock’s compensation structure with respect to
the portfolio management teams of the Fund and BlackRock’s ability to
attract and retain high-quality talent.
In addition to advisory services, the Board considered the quality of the
administrative and non-investment advisory services provided to the
Fund. BlackRock and its affiliates provide the Fund with certain adminis-
trative, transfer agency, shareholder and other services (in addition to
any such services provided to the Fund by third parties) and officers and
other personnel as are necessary for the operations of the Fund. In addi-
tion to investment advisory services, BlackRock and its affiliates provide
the Fund with other services, including (a) preparing disclosure docu-
ments, such as the prospectus, the statement of additional information
and shareholder reports; (b) assisting with daily accounting and pricing;
(c) overseeing and coordinating the activities of other service providers;
(d) organizing Board meetings and preparing the materials for such
Board meetings; (e) providing legal and compliance support; and (f)
performing other administrative functions necessary for the operation of
the Fund, such as tax reporting and fulfilling regulatory filing require-
ments. The Board reviewed the structure and duties of BlackRock’s fund
administration, accounting, legal and compliance departments.
B. The Investment Performance of the Fund and BlackRock: The Board,
including the Independent Directors, also reviewed and considered the
performance history of the Fund. In preparation for the April 16, 2008
meeting, the Board was provided with reports, independently prepared
by Lipper, which included a comprehensive analysis of the Fund’s per-
formance. The Board also reviewed a narrative and statistical analysis of
the Lipper data that was prepared by BlackRock, which analyzed various
factors that affect Lipper rankings. In connection with its review, the
Board received and reviewed information regarding the investment per-
formance of the Fund as compared to a representative group of similar
funds as determined by Lipper and to all funds in the Fund’s applicable
Lipper category. The Board was provided with a description of the metho-
dology used by Lipper to select the peer funds. The Board regularly
reviews the performance of the Fund throughout the year. The Board
attaches more importance to performance over relatively long periods
of time, typically three to five years.
The Board noted that the Fund’s performance was at or above the
median of its Peers during each of the one-, three- and five-year
periods reported.
C. Consideration of the Advisory Fees and the Cost of the Services
and Profits to be Realized by BlackRock and its Affiliates from the
Relationship with the Fund: The Board, including the Independent
Directors, reviewed the Fund’s contractual advisory fee rates compared
with the other funds in its Lipper category. It also compared the Fund’s
total expenses to those of other comparable funds. The Board consid-
ered the services provided and the fees charged by BlackRock to other
types of clients with similar investment mandates, including separately
managed institutional accounts.
The Board received and reviewed statements relating to BlackRock’s
financial condition and profitability with respect to the services it provid-
ed to the Fund. The Board was also provided with a profitability analysis
that detailed the revenues earned and the expenses incurred by
BlackRock and certain affiliates that provide services to the Fund. The
Board reviewed BlackRock’s profitability with respect to the Fund and
each fund the Board currently oversees for the year ended December
31, 2007 compared to aggregated profitability data provided for the
year ended December 31, 2005.
| BLACKROCK HEALTHCARE FUND, INC. |
Disclosure of Investment Advisory Agreement and Subadvisory Agreement (concluded)
In addition, the Board considered the cost of the services provided to
the Fund by BlackRock, and BlackRock’s and its affiliates’ profits relating
to the management and distribution of the Fund and the other funds
advised by BlackRock and its affiliates. As part of its analysis, the Board
reviewed BlackRock’s methodology in allocating its costs to the manage-
ment of the Fund and concluded that there was a reasonable basis for
the allocation. The Board also considered whether BlackRock has the
financial resources necessary to attract and retain high quality invest-
ment management personnel to perform its obligations under the
Agreements and to continue to provide the high quality of services
that are expected by the Board.
The Board noted that although the Fund paid contractual advisory fees,
prior to any expense reimbursement or fee waivers, higher than the
median of its Peers, the Fund’s actual total expenses were below the
median of its Peers.
D. Economies of Scale: The Board, including the Independent Directors,
considered the extent to which economies of scale might be realized as
the assets of the Fund increase and whether there should be changes in
the advisory fee rate or structure in order to enable the Fund to partici-
pate in these economies of scale. The Board, including the Independent
Directors, considered whether the shareholders would benefit from
economies of scale and whether there was potential for future realization
of economies with respect to the Fund. The Board considered that the
funds in the BlackRock fund complex share common resources and, as
a result, an increase in the overall size of the complex could permit each
fund to incur lower expenses than it would otherwise as a stand-alone
entity. The Board also considered the anticipated efficiencies in the
processes of BlackRock’s overall operations as it continues to add per-
sonnel and commit capital to expand the scale of operations. The Board
found, based on its review of comparable funds, that the Fund’s man-
agement fee is appropriate in light of the scale of the Fund.
E. Other Factors: The Board also took into account other ancillary or
“fall-out” benefits that BlackRock may derive from its relationship with
the Fund, both tangible and intangible, such as BlackRock’s ability to
leverage its investment professionals who manage other portfolios, an
increase in BlackRock’s profile in the investment advisory community,
and the engagement of BlackRock’s affiliates as service providers to the
Fund, including for administrative, transfer agency and distribution serv-
ices. The Board also noted that BlackRock may use third party research,
obtained by soft dollars generated by transactions in the Fund, to assist
itself in managing all or a number of its other client accounts.
In connection with its consideration of the Agreements, the Board also
received information regarding BlackRock’s brokerage and soft dollar
practices. The Boards received reports from BlackRock which included
information on brokerage commissions and trade execution practices
throughout the year.
Conclusion
The Board approved the continuation of (a) the Advisory Agreement
between the Advisor and the Fund for a one-year term ending June 30,
2009 and (b) the Subadvisory Agreements between the Advisor and
Subadvisor with respect to the Fund for a one-year term ending June 30,
2009. Based upon its evaluation of all these factors in their totality, the
Board, including the Independent Directors, was satisfied that the terms
of the Agreements were fair and reasonable and in the best interest
of the Fund and the Fund’s shareholders. In arriving at a decision to
approve the Agreements, the Board did not identify any single factor or
group of factors as all-important or controlling, but considered all factors
together. The Independent Directors were also assisted by the advice of
independent legal counsel in making this determination. The contractual
fee arrangements for the Fund reflect the results of several years of
review by the Directors and predecessor Directors, and discussions
between the Directors (and predecessor Directors) and BlackRock (and
predecessor advisors). Certain aspects of the arrangements may be the
subject of more attention in some years than in others, and the Directors’
conclusions may be based in part on their consideration of these
arrangements in prior years.
24 BLACKROCK HEALTHCARE FUND, INC.
Additional Information
BlackRock Privacy Principles
BlackRock is committed to maintaining the privacy of its current and
former fund investors and individual clients (collectively, “Clients”) and
to safeguarding their non-public personal information. The following infor-
mation is provided to help you understand what personal information
BlackRock collects, how we protect that information and why in certain
cases we share such information with select parties.
If you are located in a jurisdiction where specific laws, rules or regulations
require BlackRock to provide you with additional or different privacy-related
rights beyond what is set forth below, then BlackRock will comply with
those specific laws, rules or regulations.
BlackRock obtains or verifies personal non-public information from and
about you from different sources, including the following: (i) information
we receive from you or, if applicable, your financial intermediary, on appli-
cations, forms or other documents; (ii) information about your trans-
actions with us, our affiliates, or others; (iii) information we receive from
a consumer reporting agency; and (iv) from visits to our websites.
BlackRock does not sell or disclose to non-affiliated third parties any non-
public personal information about its Clients, except as permitted by law
or as is necessary to respond to regulatory requests or to service Client
accounts. These non-affiliated third parties are required to protect the
confidentiality and security of this information and to use it only for its
intended purpose.
We may share information with our affiliates to service your account or to
provide you with information about other BlackRock products or services
that may be of interest to you. In addition, BlackRock restricts access
to non-public personal information about its Clients to those BlackRock
employees with a legitimate business need for the information. BlackRock
maintains physical, electronic and procedural safeguards that are designed
to protect the non-public personal information of its Clients, including pro-
cedures relating to the proper storage and disposal of such information.
Availability of Additional Information
Electronic copies of most financial reports and prospectuses are available
on the Fund’s website or shareholders can sign up for e-mail notifications
of quarterly statements, annual and semi-annual reports and prospectuses
by enrolling in the Fund’s electronic delivery program.
To enroll:
Shareholders Who Hold Accounts with Investment Advisors, Banks or
Brokerages:
Please contact your financial advisor. Please note that not all investment
advisors, banks or brokerages may offer this service.
Shareholders Who Hold Accounts Directly with BlackRock:
1) Access the BlackRock website at
http://www.blackrock.com/edelivery
2) Click on the applicable link and follow the steps to sign up
3) Log into your account
Householding
The Fund will mail only one copy of shareholder documents, including
prospectuses, annual and semi-annual reports and proxy statements, to
shareholders with multiple accounts at the same address. This practice is
commonly called “householding” and it is intended to reduce expenses
and eliminate duplicate mailings of shareholder documents. Mailings of
your shareholder documents may be householded indefinitely unless you
instruct us otherwise. If you do not want the mailing of these documents
to be combined with those for other members of your household, please
contact the Fund at (800) 441-7762.
Availability of Proxy Voting Policies and Procedures
A description of the policies and procedures that the Fund uses to
determine how to vote proxies relating to portfolio securities is available
(1) without charge, upon request, by calling toll-free (800) 441-7762;
(2) at www.blackrock.com; and (3) on the Securities and Exchange
Commission’s (the “SEC”) website at http://www.sec.gov.
| BLACKROCK HEALTHCARE FUND, INC. |
Additional Information (concluded)
Availability of Additional Information (concluded)
Availability of Proxy Voting Record
Information about how the Fund votes proxies relating to securities held
in the Fund’s portfolio during the most recent 12-month period ended
June 30 is available upon request and without charge (1) at www.black-
rock.com or by calling (800) 441-7762 and (2) on the SEC’s website at
http://www.sec.gov.
Availability of Quarterly Portfolio Schedule
The Fund files its complete schedule of portfolio holdings with the SEC
for the first and third quarters of each fiscal year on Form N-Q. The Fund’s
Forms N-Q are available on the SEC’s website at http://www.sec.gov
and may also be reviewed and copied at the SEC’s Public Reference
Room in Washington, D.C. Information on the operation of the Public
Reference Room may be obtained by calling (800) SEC-0330. The
Fund’s Forms N-Q may also be obtained upon request and without
charge by calling (800) 441-7762.
Shareholder Privileges
Account Information
Call us at (800) 441-7762 from 8:00 AM to 6:00 PM EST to get infor-
mation about your account balances, recent transactions and share
prices. You can also reach us on the Web at www.blackrock.com/funds.
Automatic Investment Plans
Investor Class shareholders who want to invest regularly can arrange to
have $50 or more automatically deducted from their checking or savings
account and invested in any of the BlackRock funds.
Systematic Withdrawal Plans
Investor Class shareholders can establish a systematic withdrawal plan
and receive periodic payments of $50 or more from their BlackRock
funds, as long as their account is at least $10,000.
Retirement Plans
Shareholders may make investments in conjunction with Traditional,
Rollover, Roth, Coverdell, Simple IRAs, SEP IRAs and 403(b) Plans.
26 BLACKROCK HEALTHCARE FUND, INC.
A World-Class Mutual Fund Family
BlackRock offers a diverse lineup of open-end mutual funds crossing all investment styles and managed by experts in equity, fixed income and
tax-exempt investing. |
| Equity Funds | | | | |
| |
| |
|
| |
| BlackRock All-Cap Global Resources Portfolio | | BlackRock Global Resources Portfolio | | BlackRock Mid-Cap Value Equity Portfolio |
| BlackRock Asset Allocation Portfolio† | | BlackRock Global SmallCap Fund | | BlackRock Mid Cap Value Opportunities Fund |
| BlackRock Aurora Portfolio | | BlackRock Health Sciences Opportunities Portfolio* | | BlackRock Natural Resources Trust |
| BlackRock Balanced Capital Fund† | | BlackRock Healthcare Fund | | BlackRock Pacific Fund |
| BlackRock Basic Value Fund | | BlackRock Index Equity Portfolio* | | BlackRock Science & Technology |
| BlackRock Capital Appreciation Portfolio | | BlackRock International Fund | | Opportunities Portfolio |
| BlackRock Equity Dividend Fund | | BlackRock International Diversification Fund | | BlackRock Small Cap Core Equity Portfolio |
| BlackRock EuroFund | | BlackRock International Index Fund | | BlackRock Small Cap Growth Equity Portfolio |
| BlackRock Focus Growth Fund | | BlackRock International Opportunities Portfolio | | BlackRock Small Cap Growth Fund II |
| BlackRock Focus Value Fund | | BlackRock International Value Fund | | BlackRock Small Cap Index Fund |
| BlackRock Fundamental Growth Fund | | BlackRock Large Cap Core Fund | | BlackRock Small Cap Value Equity Portfolio* |
| BlackRock Global Allocation Fund† | | BlackRock Large Cap Core Plus Fund | | BlackRock Small/Mid-Cap Growth Portfolio |
| BlackRock Global Dynamic Equity Fund | | BlackRock Large Cap Growth Fund | | BlackRock S&P 500 Index Fund |
| BlackRock Global Emerging Markets Fund | | BlackRock Large Cap Value Fund | | BlackRock U.S. Opportunities Portfolio |
| BlackRock Global Financial Services Fund | | BlackRock Latin America Fund | | BlackRock Utilities and Telecommunications Fund |
| BlackRock Global Growth Fund | | BlackRock Mid-Cap Growth Equity Portfolio | | BlackRock Value Opportunities Fund |
| BlackRock Global Opportunities Portfolio | | | | |
| |
| |
|
| |
| Fixed Income Funds | | | | |
| |
| |
|
| |
| BlackRock Emerging Market Debt Portfolio | | BlackRock Inflation Protected Bond Portfolio | | BlackRock Short-Term Bond Fund |
| BlackRock Enhanced Income Portfolio | | BlackRock Intermediate Bond Portfolio II | | BlackRock Strategic Income Portfolio |
| BlackRock GNMA Portfolio | | BlackRock Intermediate Government | | BlackRock Total Return Fund |
| BlackRock Government Income Portfolio | | Bond Portfolio | | BlackRock Total Return Portfolio II |
| BlackRock High Income Fund | | BlackRock International Bond Portfolio | | BlackRock World Income Fund |
| BlackRock High Yield Bond Portfolio | | BlackRock Long Duration Bond Portfolio | | |
| BlackRock Income Portfolio† | | BlackRock Low Duration Bond Portfolio | | |
| BlackRock Income Builder Portfolio† | | BlackRock Managed Income Portfolio | | |
| |
| |
|
| |
| Municipal Bond Funds | | | | |
| |
| |
|
| BlackRock AMT-Free Municipal Bond Portfolio | | BlackRock Intermediate Municipal Fund | | BlackRock New York Municipal Bond Fund |
| BlackRock California Insured Municipal Bond Fund | | BlackRock Kentucky Municipal Bond Portfolio | | BlackRock Ohio Municipal Bond Portfolio |
| BlackRock Delaware Municipal Bond Portfolio | | BlackRock Municipal Insured Fund | | BlackRock Pennsylvania Municipal Bond Fund |
| BlackRock Florida Municipal Bond Fund | | BlackRock National Municipal Fund | | BlackRock Short-Term Municipal Fund |
| BlackRock High Yield Municipal Fund | | BlackRock New Jersey Municipal Bond Fund | | |
| |
| |
|
| |
| Target Risk & Target Date Funds | | | | |
| |
| |
|
| |
| BlackRock Prepared Portfolios | | BlackRock Lifecycle Prepared Portfolios | | |
| Conservative Prepared Portfolio | | Prepared Portfolio 2010 | | Prepared Portfolio 2030 |
| Moderate Prepared Portfolio | | Prepared Portfolio 2015 | | Prepared Portfolio 2035 |
| Growth Prepared Portfolio | | Prepared Portfolio 2020 | | Prepared Portfolio 2040 |
| Aggressive Growth Prepared Portfolio | | Prepared Portfolio 2025 | | Prepared Portfolio 2045 |
| | | | | Prepared Portfolio 2050 |
| * See the prospectus for information on specific limitations on investments in the fund. | | |
| † Mixed asset fund. | | | | |
BlackRock mutual funds are currently distributed by BlackRock Investments, Inc. You should consider the investment objectives, risks, charges and
expenses of the funds under consideration carefully before investing. Each fund’s prospectus contains this and other information and is available at
www.blackrock.com or by calling (800) 882-0052 or from your financial advisor. The prospectus should be read carefully before investing. |
| BLACKROCK HEALTHCARE FUND, INC. |

This report is not authorized for use as an offer of sale or a solici-
tation of an offer to buy shares of the Fund unless accompanied
or preceded by the Fund’s current prospectus. Past performance
results shown in this report should not be considered a representa-
tion of future performance. Investment return and principal value
of shares will fluctuate so that shares, when redeemed, may be
worth more or less than their original cost. Statements and other
information herein are as dated and are subject to change.
BlackRock Healthcare Fund, Inc.
100 Bellevue Parkway
Wilmington, DE 19809

#10254-10/08
Item 2 – Code of Ethics – Not Applicable to this semi-annual report
Item 3 – Audit Committee Financial Expert – Not Applicable to this semi-annual report
Item 4 – Principal Accountant Fees and Services – Not Applicable to this semi-annual report
Item 5 – Audit Committee of Listed Registrants – Not Applicable
Item 6 – Investments
(a) The registrant’s Schedule of Investments is included as part of the Report to Stockholders filed under
Item 1 of this form.
(b) Not Applicable due to no such divestments during the semi-annual period covered since the previous
Form N-CSR filing.
Item 7 – Disclosure of Proxy Voting Policies and Procedures for Closed-End Management Investment Companies –
Not Applicable
Item 8 – Portfolio Managers of Closed-End Management Investment Companies – Not Applicable
Item 9 – Purchases of Equity Securities by Closed-End Management Investment Company and Affiliated
Purchasers – Not Applicable
Item 10 – Submission of Matters to a Vote of Security Holders – The registrant’s Nominating and Governance
Committee will consider nominees to the board of directors recommended by shareholders when a vacancy
becomes available. Shareholders who wish to recommend a nominee should send nominations that include
biographical information and set forth the qualifications of the proposed nominee to the registrant’s
Secretary. There have been no material changes to these procedures.
Item 11 – Controls and Procedures
11(a) – The registrant’s principal executive and principal financial officers or persons performing similar functions
have concluded that the registrant’s disclosure controls and procedures (as defined in Rule 30a-3(c) under
the Investment Company Act of 1940, as amended (the “1940 Act”)) are effective as of a date within 90
days of the filing of this report based on the evaluation of these controls and procedures required by Rule
30a-3(b) under the 1940 Act and Rule 15d-15(b) under the Securities Exchange Act of 1934, as amended.
11(b) – There were no changes in the registrant’s internal control over financial reporting (as defined in Rule 30a-
3(d) under the 1940 Act) that occurred during the second fiscal quarter of the period covered by this report
that have materially affected, or are reasonably likely to materially affect, the registrant’s internal control
over financial reporting.
Item 12 – Exhibits attached hereto
12(a)(1) – Code of Ethics – Not Applicable to this semi-annual report
12(a)(2) – Certifications – Attached hereto
12(a)(3) – Not Applicable
12(b) – Certifications – Attached hereto
Pursuant to the requirements of the Securities Exchange Act of 1934 and the Investment Company Act of
1940, the registrant has duly caused this report to be signed on its behalf by the undersigned, thereunto duly
authorized. |
BlackRock Healthcare Fund, Inc.
By: /s/ Donald C. Burke
Donald C. Burke
Chief Executive Officer of
BlackRock Healthcare Fund, Inc.
Date: December 19, 2008
Pursuant to the requirements of the Securities Exchange Act of 1934 and the Investment Company Act of
1940, this report has been signed below by the following persons on behalf of the registrant and in the
capacities and on the dates indicated.
By: /s/ Donald C. Burke
Donald C. Burke
Chief Executive Officer (principal executive officer) of
BlackRock Healthcare Fund, Inc.
Date: December 19, 2008
By: /s/ Neal J. Andrews
Neal J. Andrews
Chief Financial Officer (principal financial officer) of
BlackRock Healthcare Fund, Inc.
Date: December 19, 2008 |