 Farmers National Banc Corp. Canfield, OH (NASDAQ: FMNB) Investor Presentation September 30, 2011 Exhibit 99.1 |
 2 Disclosure Statement Forward-Looking Statements This presentation contains forward-looking statements within the meaning of the Private Securities Litigation Reform Act of 1995. Forward-looking statements express management’s current expectations, forecasts of future events or long-term-goals and, by their nature, are subject to assumptions, risks and uncertainties. Actual results could differ materially from those indicated. Farmers National Banc Corp. (“Farmers”) refers you to its periodic reports and registration statements filed with the Securities and Exchange Commission, including its Annual Report on Form 10-K for the year ended December 31, 2010 and Quarterly Report on Form 10-Q for the period ended September 30, 2011 which have been filed with the Securities and Exchange Commission and are available on Farmers’ website (www.farmersbankgroup.com) and on the Securities and Exchange Commission’s website (www.sec.gov), for additional discussion of these assumptions, risks and uncertainties. Forward-looking statements are not guarantees of future performance and should not be relied upon as representing management’s views as of any subsequent date. Farmers undertakes no obligation to update forward-looking statements, whether as a result of new information, future events or otherwise, except as may be required by law. Use of Non-GAAP Financial Measures This presentation contains certain financial information determined by methods other than in accordance with accounting principles generally accepted in the United States (“GAAP”). These non-GAAP financial measures include “Core Deposits” and “Pre-tax, Pre- provision Earnings”. Farmers believes that these non-GAAP financial measures provide both management and investors a more complete understanding of the Company’s deposit profile and profitability. These non-GAAP financial measures are supplemental and are not a substitute for any analysis based on GAAP financial measures. Because not all companies use the same calculation of “Core Deposits” and “Pre-tax, Pre-provision Earnings”, this presentation may not be comparable to other similarly titled measures as calculated by other companies. |
 3 Sound franchise with many opportunities for growth Profitable throughout cycle and growing tangible book value per share Diversified and growing revenue streams Stable asset quality and strong core deposit franchise Strong capital position and did not take TARP CPP Operational excellence and brand development Seasoned management team with knowledge of the Northeast Ohio marketplace Commence trading on NASDAQ effective September 15, 2011 (“FMNB”) Compelling valuation: 0.78x of tangible book value 4.7x LTM pre-tax pre-provision earnings Farmers offers a unique and strong platform for growth Investment Highlights 7.7x LTM EPS 2.68% dividend yield |
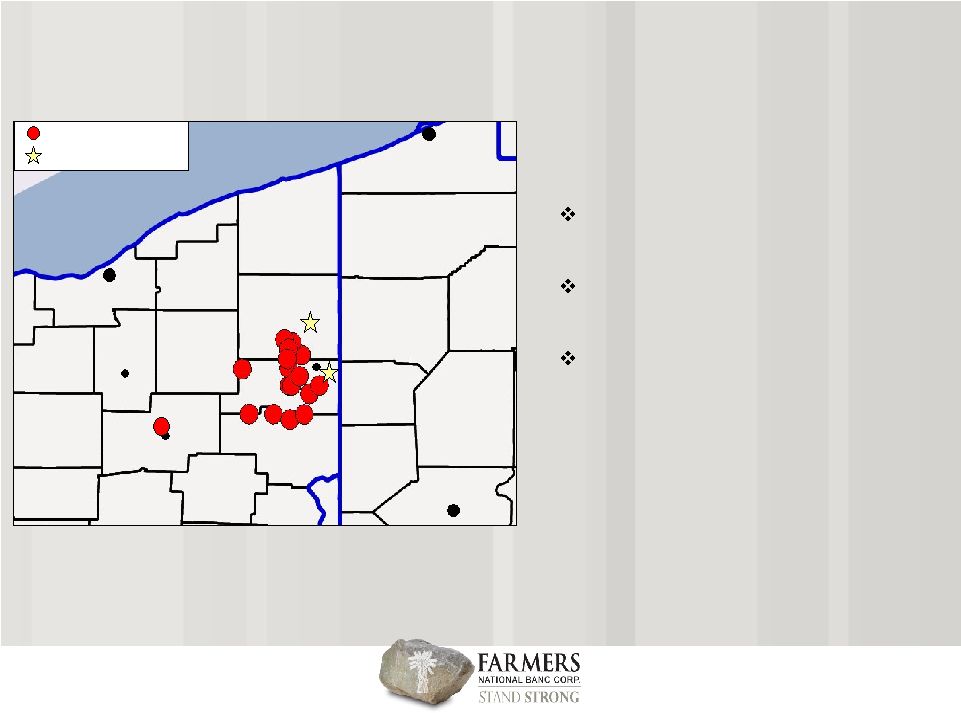 4 Founded over 120 years ago 18 branches and 17 ATMs Approximately 75 - 100 miles from Cleveland, Pittsburgh & Erie Branch Map in Mahoning Valley Erie Pittsburgh Youngstown Akron Cleveland Trumbull County Mahoning County Columbiana County Branch Locations Trust Locations Canton |
 5 Note: Deposit data as of June 30, 2011 Source: FDIC Opportunity for growth with approximately 9.5% deposit market share in the Mahoning Valley Large regional competitors lack focus Community competitors inwardly focused Attractive Deposit Franchise – Deposit Market Share by MSA & County 2011 Rank Company Branches Dep. ($M) Market Share 1 Home Savings & Loan Co. 7 309.6 $ 23.66% 2 Huntington National Bank 12 305.5 $ 23.35% 3 PNC Bank National Assn 6 134.9 $ 10.31% 4 Farmers National Bank of Canfield 4 123.6 $ 9.44% 5 JPMorgan Chase Bank NA 3 90.3 $ 6.90% 6 Consumers National Bank 3 85.6 $ 6.54% 7 1st National Community Bank 4 85.2 $ 6.51% 8 CFBank 2 78.9 $ 6.03% 9 Keybank National Assn 1 48.8 $ 3.73% 10 RBS Citizens National Assn 1 44.4 $ 3.39% Total For Institutions In Market 45 1,308.3 $ Columbiana - Top 10 2011 Rank Company Branches Dep. ($M) Market Share 1 Huntington National Bank 42 1,978.9 $ 24.16% 2 Homes Savings & Loan 21 1,241.3 $ 15.16% 3 First Place Bank 19 1,188.0 $ 14.51% 4 PNC Bank National Assn 23 909.2 $ 11.10% 5 Farmers National Bank of Canfield 17 776.4 $ 9.48% 6 JPMorgan Chase Bank NA 20 752.1 $ 9.18% 7 Cortland Savings & Banking Co. 10 346.5 $ 4.23% 8 First NB of Pennsylvania 8 246.2 $ 3.01% 9 Keybank National Assn 6 172.2 $ 2.10% 10 RBS Citizens National Assn 6 165.4 $ 2.02% Total For Institutions In Market 196 8,189.7 $ Tri-County - Top 10 2011 Rank Company Branches Dep. ($M) Market Share 1 Huntington National Bank 17 $1,135.5 27.00% 2 Home Savings & Loan Co. 10 $776.1 18.45% 3 First Place Bank 12 $578.9 13.76% 4 PNC Bank Naitonal Assn 10 $527.1 12.53% 5 Farmers National Bank of Canfield 7 $478.8 11.38% 6 JPMorgan Chase Bank NA 7 $316.5 7.52% 7 First NB of Pennsylvania 5 $168.3 4.00% 8 Keybank National Assn 4 $87.9 2.09% 9 RBS Citizens National Assn 3 $87.1 2.07% 10 Cortland Savings & Banking Co. 2 $26.3 0.63% Total For Institutions In Market 81 $4,205.8 Mahoning - Top 10 2011 Rank Company Branches Dep. ($M) Market Share 1 First Place Bank 7 609.2 $ 22.77% 2 Huntington National Bank 13 538.0 $ 20.11% 3 JPMorgan Chase Bank NA 10 345.4 $ 12.91% 4 Cortland Savings & Banking Co. 8 320.2 $ 11.97% 5 PNC Bank National Assn 7 247.2 $ 9.24% 6 Farmers National Bank of Canfield 6 174.0 $ 6.50% 7 Home Savings & Loan Co. 4 155.6 $ 5.81% 8 First NB of Pennsylvania 3 77.8 $ 2.91% 9 Home FS&LA of Niles 1 61.5 $ 2.30% 10 Middlefield Banking Co. 1 43.7 $ 1.63% Total For Institutions In Market 70 2,675.7 $ Trumbull - Top 10 |
 6 Source: Regional Chamber, Youngstown-Warren, Ohio Metropolitan Profile Valley Leads in Industrial Job Growth in NE Ohio, The Vindicator Ohio’s Economic Impact Study – September, 2011 Resources and infrastructure within 100 miles of the Mahoning Valley Recently the Mahoning Valley has seen several important investments in new business including: Steelmaker V&M Star’s $650 million expansion • 350,000 tons of steel tubing per year for the drilling of shale gas in the U.S. • About 350 jobs will be created once production begins The acquisition of WCI Steel by OAO Severstal – $327 million investment General Motors Lordstown plant building the Chevrolet Cruze next generation small car – $230 million investment Ohio’s Natural Gas and Crude Oil Exploration and Production Industry and the Emerging Utica Gas Formation Impact regarding to: • Jobs (204,000 created or supported by 2015) • Income (Economic Output will increase by over $22 billion by 2015) Economic Overview of Market Area 6.8 million people 18 Fortune 500 company world headquarters 95 colleges and universities campus locations 2 international airports; 3 regional airports Lake Erie shipping Ohio River ports Northeast Ohio’s manufacturing productivity is on track to outpace the rest of the nation by 10 percent as early as 2015, according to a report released by Team Northeast Ohio. Youngstown-Warren metro area had the third-highest job growth in the U.S. in the last 12 months. Land acquisition, construction and labor costs are significantly below national averages |
 7 • Performance-driven culture • Advancing automation and use of technology • Metrics-oriented accountability • Scaling organization to support growth • Diligent risk management • Expand fee-based business • Integrate sales efforts • Continue to drive name awareness • Unification of brand • Top graded talent to drive performance growth • De novo expansion and strategic acquisitions • Customer intimacy/decisions close to customer • Identify target markets and customer segments • Lead with commercial business/expand wallet share Acquire Share of Market/Share of Customer Operational Excellence Risk Management Evolve Trust, Insurance & Financial Services Brand Development Talent Farmers’ Strategy for Growth |
 8 Established and experienced management team with over 173 years of combined experience, 97 of which has been with Farmers Experienced Management Team FMNB Industry Previous Experience John S. Gulas (53) President & CEO 3+ 27+ Past executive roles with Key Bank, Sky Bank and Wachovia. Prior to Farmers, Mr. Gulas served as President and CEO of Sky Trust Company and was responsible for a $6.0BN trust company, a $1.2BN brokerage company and a $1.1BN private bank. James H. Sisek (65) President & CEO of Farmers Trust 15+ 36+ President and CEO of the Farmers Trust Company. Carl D. Culp (48) EVP & CFO 22+ 26+ 25 years of experience in finance and accounting in the banking industry, and is a Certified Public Accountant. Mark L. Graham (56) SVP & Chief Credit Officer 34+ 34+ Has been with Farmers for 33 years and has held a variety of positions within the bank, all in the credit area. Kevin J. Helmick (39) SVP of Retail Services 16+ 16+ Responsible for the management of Farmers National Investments, Farmers Insurance and all branch sales and operational functions. Mr. Helmick holds an MBA and CFP designation. Amber B. Wallace (45) SVP & Director of Marketing 3+ 3+ Prior to joining the Farmers team, Ms. Wallace served as the Assistant Vice President of Marketing and Physician Relations at Trumbull Memorial Hospital, where she managed a $14MM endowment, a $1.5MM marketing budget and all physician contracts. Mark A. Nicastro (40) VP & Director of Human Resources 2+ 13+ Brings an MBA and more than 12 years experience in HR Management from both large multi-national banks and regional community banks, including U.S. Bank and Sky Bank. Brian Jackson (42) VP & Chief Information Officer 2+ 18+ More than 17 years experience in the IT field. Yrs. Of Experience |
 9 March 2009 – opportunistic acquisition of Butler Wick Trust Company, the largest trust department in the Mahoning Valley Assets under management have grown approximately 48% since acquisition to $901 million currently From December 31, 2008 through December 31, 2010: Revenue¹ has grown $16.6 million or 52.9% Total assets have increased $102.4 million or 11.6% • Loans have grown $38.4 million or 7.0% Total deposits have increased $113.0 million or 17.4% • Core deposits² have grown $113.3 million or 20.6% Tangible book value per share has grown $0.12 or 2.1% Fiserv Premier – core operating system Flexible system that offers unlimited accounts Keeps current with compliance and regulatory changes Offers multiple products and services that integrate into core system (i.e. internet banking, ATMs, and GL) One of the top core system providers in the nation SAN & Virtualization – data management system Data Storage: reduces disk space expenditures; allow for better utilization of disk space Data Backup: consistent backups of all data and replicated at DR Site Disaster Recovery: able to recover from disaster in minutes Overall reduced IT costs Scalable to various network configurations ¹ Revenue defined as net interest income plus non-interest income; excludes securities gains / losses; ² Core deposits defined as Total Deposits – Jumbo Deposits Recent Growth |
 10 Butler Wick Trust Company Acquisition Acquired from United Community Financial Corporation for cash on March 31, 2009 Only locally owned trust company in the Mahoning Valley Rebranded to Farmers Trust Company Assets increased approximately 48% since acquisition Contributed $4.9 million to non-interest income in 2010 Farmers Trust Company |
 11 Meaningfully profitable every quarter during this cycle Always paid quarterly cash dividend High net interest margin which has expanded every year since 2006 4.10% December 31, 2010 Strong record of profitability Average ROAA and ROAE from 2006 through 2010 of 0.75% and 8.60%, respectively Continue to invest in operations to support ongoing growth, yet maintain a strong balance sheet Historical Operating Results |
 12 Pre-tax income excluding security gains and losses increased 12% from the third quarter of 2010. Investment commissions and trust fees for the third quarter of 2011 increased 63% and 8%, respectively, from the third quarter of 2010. Provision for loan losses for the third quarter of 2011 decreased $800 thousand from the third quarter of 2010. Annualized net charge-offs to average net loans outstanding improved to 0.43% at September 30, 2011, compared to 1.31% at September 30, 2010. Loans 30-89 days delinquent decreased to $3.4 million at September 30, 2011, compared to $5.9 million at September 30, 2010. Continued Strong Results – Overview of Q3 2011 |
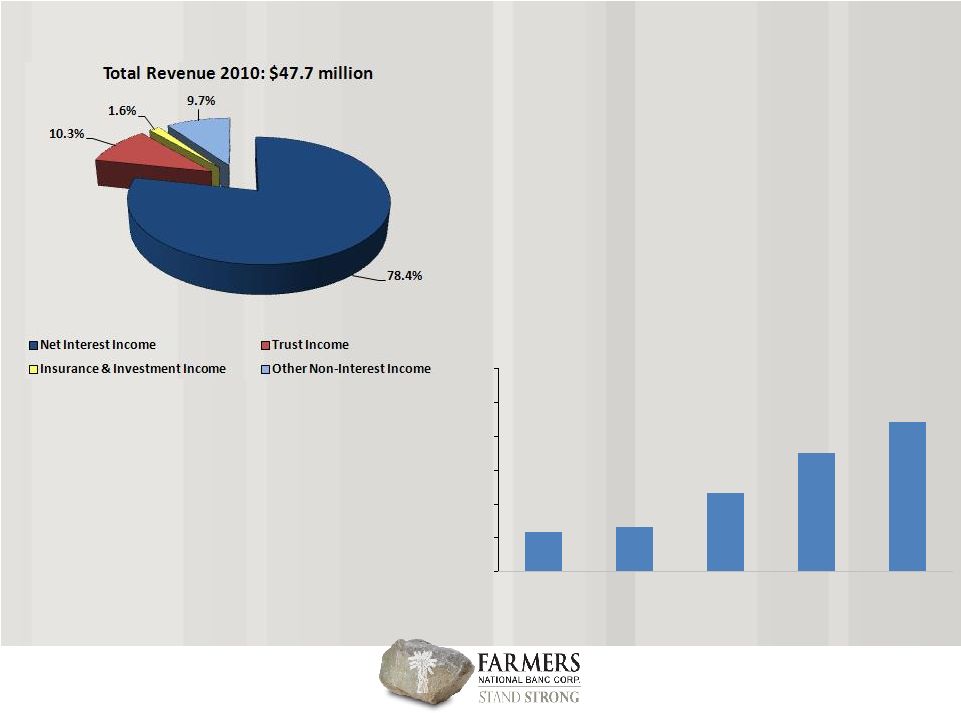 13 • 2010 net interest income increased 13% over prior year period due to increase in loan balances and lower cost of funds • Acquisition of Trust Company increased non-interest income by 13.8% since first quarter 2009¹ Growing and Diverse Revenue Stream Note: Revenue defined as net interest income plus non-interest income; Excludes $225K gain on settlement of trust business and $2.7MM net gain on securities ¹ Calculated as Q4 2010 trust revenue / Q1 2009 total revenue Net Interest Margin 3.29% 3.33% 3.58% 3.88% 4.10% 3.00% 3.25% 3.50% 3.75% 4.00% 4.25% 4.50% 2006 2007 2008 2009 2010 |
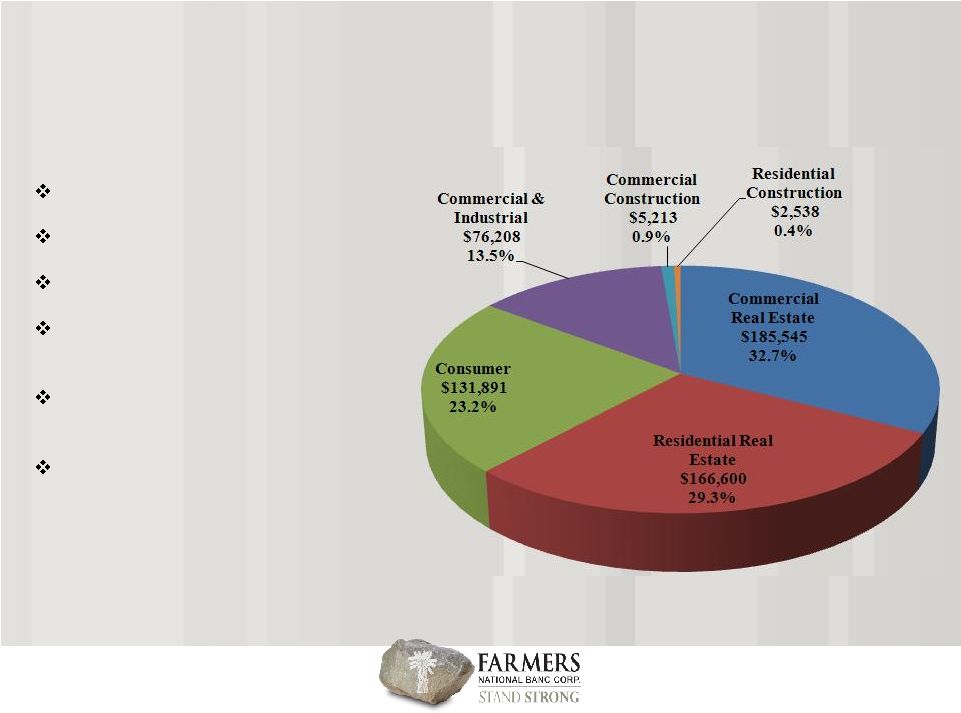 14 Diverse loan mix No national lending No sub-prime lending Farmers’ practice is to lend primarily within its market area Less than 1% of loan portfolio is participations purchased Less than 2% of loan portfolio is construction loans Loan Portfolio Mix (September 30, 2011) Overview of Loan Portfolio Note: Dollars in thousands |
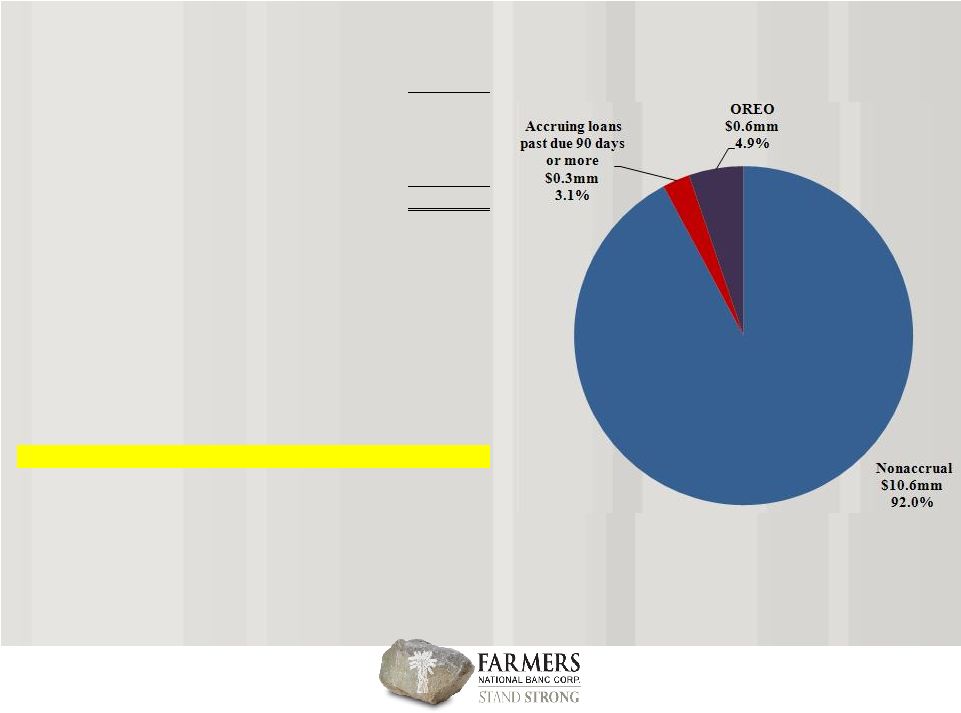 15 Excellent Asset Quality Note: Dollars in millions; Asset quality ratios exclude troubled debt restructuring 9/30/2011 Nonaccrual loans $10.6 Accruing loans past due 90 days or more 0.3 OREO 0.6 Total nonperforming assets (NPAs) $11.5 Troubled Debt Restructuring (TDR) $4.0 Loans 30-89 days delinquent 3.4 Gross portfolio loans 568.0 Loans held for sale (HFS) 0.0 Allowance for loan losses (ALL) 11.0 Total Assets $1,086.4 NPLs & 90 days past due/Gross loans (excl. HFS) 1.92% NPLs & 90 days past due/Gross loans (incl. HFS) 1.92% NPAs/Total Assets 1.05% TDR/Gross loans (excl. HFS) 0.70% 30-89 days delinquent/Gross loans (excl. HFS) 0.60% ALL/NPLs & 90 days past due 100.92% ALL/Gross loans (excl. HFS) 1.93% |
  Financial Data for the Period Ended September 30, 2011 Condition and Performance Metrics Valuation Metrics LTM Core Price/ Core Price/ Price/ TCE/ LTM LTM PTPP ³/ Loans/ Dep/ NPAs/ NPL/ Res./ Res./ Tan. Dep. LTM LTM Div. TA ROAA NIM ROAA Dep. Tot Dep Assets Loans Loans NPLs Book Prem. PTPP ³/ EPS Yield (%) (%) (%) (%) (%) (%) (%) (%) (%) (%) (x) (%) (x) (x) (%) Peers Midwest Banks ¹ 7.12 0.49 3.57 1.40 81.7 86.3 2.62 3.06 2.05 72.8 0.82 (1.8) 3.9 11.4 1.16 National Banks ² 8.91 1.00 3.91 1.68 74.3 86.6 1.25 1.45 1.60 92.6 1.14 1.8 6.4 10.9 3.18 FMNB.OB 9.94 0.92 4.14 1.69 70.5 88.3 1.06 1.92 1.93 100.7 0.79 (3.2) 4.9 7.8 2.67 16 Relative to Comparable Midwest and National banks, Farmers is attractively valued Farmers has an Attractive Valuation Note: Peer data is the median value for the peer group; market data is as of November 16, 2011; asset quality ratios exclude troubled debt restructurings ¹ Selected Midwest Banks with Assets $800 Million - $2.0 Billion ² Selected Capital & Credit Quality Banks with Assets $800 Million - $2.0 Billion; No TARP; TCE / TA >= 7.0%; NPAs / Assets < 2.5% and Positive LTM Net Income ³ Last 12 months pre-tax, pre-provision earnings Source: SNL Financial |