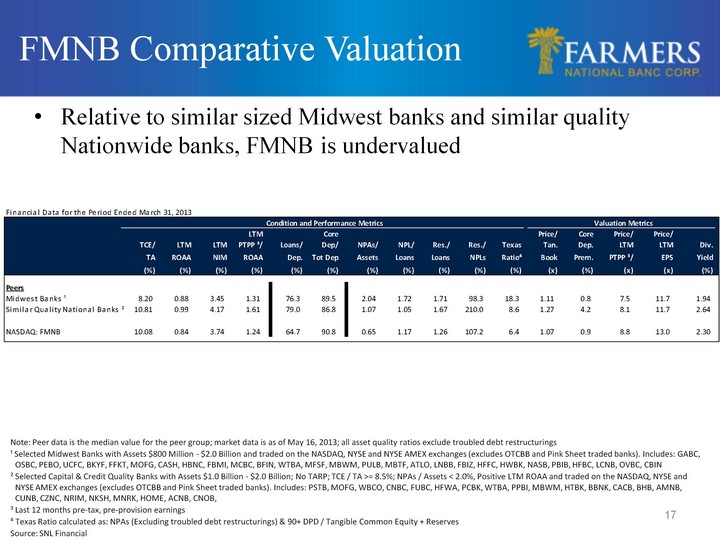
| 17 FMNB Comparative Valuation Relative to similar sized Midwest banks and similar quality Nationwide banks, FMNB is undervalued Note: Peer data is the median value for the peer group; market data is as of May 16, 2013; all asset quality ratios exclude troubled debt restructurings 1 Selected Midwest Banks with Assets $800 Million - $2.0 Billion and traded on the NASDAQ, NYSE and NYSE AMEX exchanges (excludes OTCBB and Pink Sheet traded banks). Includes: GABC, OSBC, PEBO, UCFC, BKYF, FFKT, MOFG, CASH, HBNC, FBMI, MCBC, BFIN, WTBA, MFSF, MBWM, PULB, MBTF, ATLO, LNBB, FBIZ, HFFC, HWBK, NASB, PBIB, HFBC, LCNB, OVBC, CBIN 2 Selected Capital & Credit Quality Banks with Assets $1.0 Billion - $2.0 Billion; No TARP; TCE / TA >= 8.5%; NPAs / Assets < 2.0%, Positive LTM ROAA and traded on the NASDAQ, NYSE and NYSE AMEX exchanges (excludes OTCBB and Pink Sheet traded banks). Includes: PSTB, MOFG, WBCO, CNBC, FUBC, HFWA, PCBK, WTBA, PPBI, MBWM, HTBK, BBNK, CACB, BHB, AMNB, CUNB, CZNC, NRIM, NKSH, MNRK, HOME, ACNB, CNOB, 3 Last 12 months pre-tax, pre-provision earnings ^ Texas Ratio calculated as: NPAs (Excluding troubled debt restructurings) & 90+ DPD / Tangible Common Equity + Reserves Source: SNL Financial |