Investor Presentation 1Q, 2020 Exhibit 99.1
Disclosure Statements Forward-Looking Statements This presentation contains forward-looking statements within the meaning of the Private Securities Litigation Reform Act of 1995, including statements about the financial condition, results of operations, asset quality trends and profitability of Farmers National Banc Corp. (“Farmers”). Forward-looking statements are not historical facts but instead express only management’s current expectations and forecasts of future events or long-term-goals, many of which, by their nature, are inherently uncertain and outside of Farmers’ control. Forward-looking statements are preceded by terms such as “expects,” “believes,” “anticipates,” “intends” and similar expressions, as well as any statements related to future expectations of performance or conditional verbs, such as “will,” “would,” “should,” “could” or “may.” Farmers’ actual results and financial condition may differ, possibly materially, from those indicated in these forward-looking statements. Factors that could cause Farmers’ actual results to differ materially from those described in the forward-looking statements include impacts from the COVID-19 pandemic on local, national and global economic conditions; higher default rates on loans made to our customers related to the COVID-19 pandemic and its impact on our customers’ operations and financial condition; unexpected changes in interest rates or disruptions in the mortgage markets related to COVID-19 or other responses to the health crisis; and the other factors contained in Farmers’ periodic reports and registration statements filed with the Securities and Exchange Commission, including its Annual Report on Form 10-K for the year ended December 31, 2019, and Quarterly Report on Form 10-Q for the period ended March 31, 2020, which have been filed with the Securities and Exchange Commission and are available on Farmers’ website (www.farmersbankgroup.com) and on the Securities and Exchange Commission’s website (www.sec.gov). Forward-looking statements are not guarantees of future performance and should not be relied upon as representing management’s views as of any subsequent date. Farmers undertakes no obligation to update forward-looking statements, whether as a result of new information, future events or otherwise. Use of Non-GAAP Financial Measures This presentation contains certain financial information determined by methods other than in accordance with accounting principles generally accepted in the United States (“GAAP”). These non-GAAP financial measures include “Core Deposits” and “Tangible Common Equity ratio.” Farmers believes that these non-GAAP financial measures provide both management and investors a more complete understanding of Farmers’ deposit profile and capital. These non-GAAP financial measures are supplemental and are not a substitute for any analysis based on GAAP financial measures. Because not all companies use the same calculation of “Core Deposits” and “Tangible Common Equity ratio,” this presentation may not be comparable to other similarly titled measures as calculated by other companies.
COVID-19 Update Customers Developed payment relief initiatives and programs Waiving certain account fees Supporting small business customers through PPP assistance Focusing on relationship banking Frequent customer communications Levering digital, mobile, and online infrastructure Communities Adjusted operations to safely provide essential financial support to our communities Creating re-opening plan Supporting local community food pantries and mobile meals Provided nearly $190,000 in Community Giving at March 31, 2020 Giving through random acts of kindness for healthcare workers Associates Daily CEO communications Created COVID-19 Task-Force Initiated special bonuses for certain eligible Associates Installed Plexiglas and other safety measures Enhanced Associate training and in-branch cleaning process We are focused on protecting the health and safety of our Associates and customers, while providing essential financial resources to our communities.
About Farmers National Banc Corp. Operating in nine counties in Ohio Founded in 1887 Acquired Geauga Savings Bank (Maple Leaf) in January, 2020 Added a loan production office in Beachwood, OH in December, 2017 Entered Holmes County, OH with the Monitor Bank merger in August, 2017 Added a loan production office in Beaver, PA in July, 2016 Acquired Bowers Insurance Agency, Inc. in June, 2016 Sound franchise well-positioned for growth Credit quality remains strong Diversified and growing revenue streams Compelling growth Diversified financial institution Geography Service Rated #1 Performing Bank in Ohio, and 30th in the nation in the $1-$5 billion asset size category* Named one of the Best Employers in Ohio in 2019 and 2020** *Source: Bank Director Magazine 2018 Bank Performance Scorecard **Source: Best Companies Group
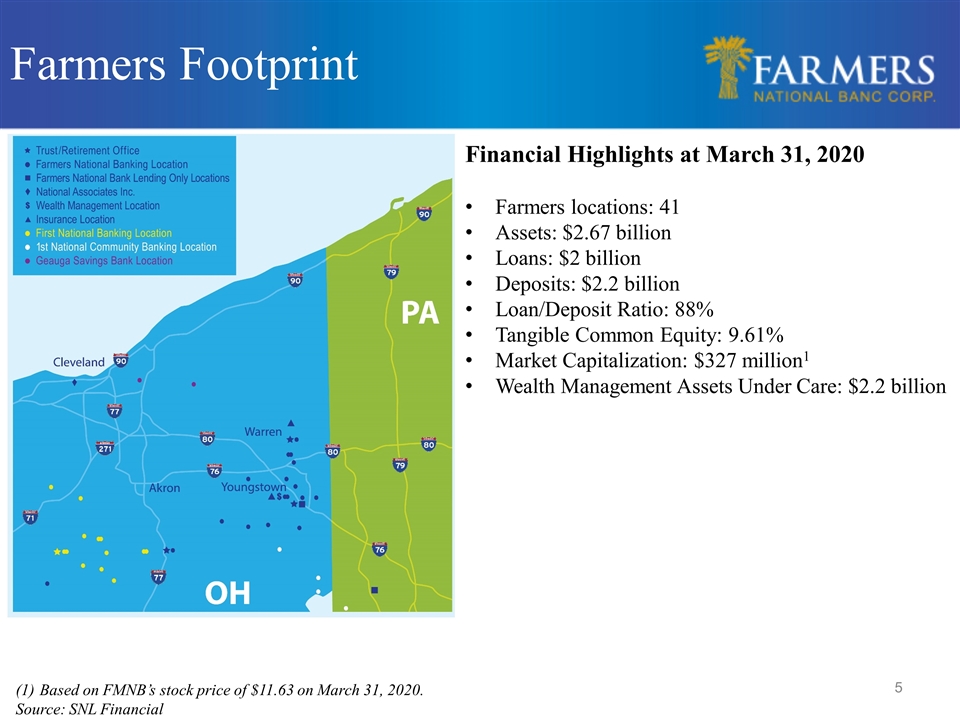
Farmers Footprint Financial Highlights at March 31, 2020 Farmers locations: 41 Assets: $2.67 billion Loans: $2 billion Deposits: $2.2 billion Loan/Deposit Ratio: 88% Tangible Common Equity: 9.61% Market Capitalization: $327 million1 Wealth Management Assets Under Care: $2.2 billion Based on FMNB’s stock price of $11.63 on March 31, 2020. Source: SNL Financial
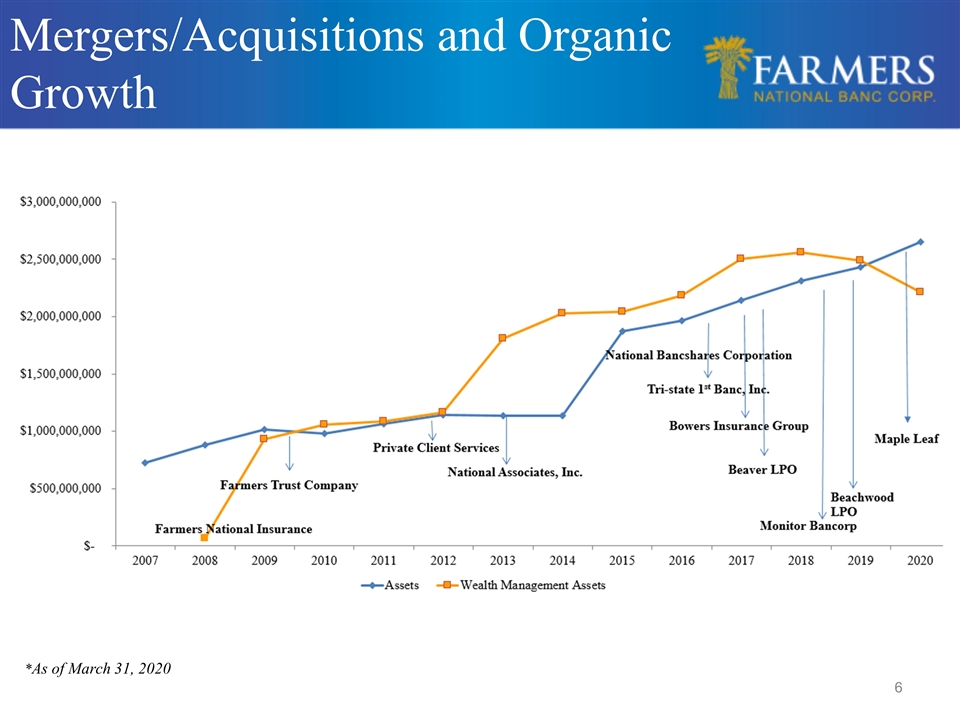
Mergers/Acquisitions and Organic Growth *As of March 31, 2020
Operating in Strong Economic Region According to a January 2020 study from the State of Ohio, in 2018 Ohio was the 7th largest source of GDP among the 50 states and Washington D.C. - If Ohio was a separate country, it would be the 36th largest national economy in the world. - Cleveland+ Region Diverse Economy Large, Stable Employers Diverse $238 billion economy One of the largest economic regions in the U.S. Ohio was ranked the 9th best state for business in 2019 according to Chief Executive Globally recognized for its skilled workforce, low cost of doing business, corporate-friendly tax structure, logistics infrastructure and exceptional quality of life The economic region is home to 4 million residents and 2 million workers Youngstown Business Incubator leverages its entrepreneurial expertise and resource network to meaningfully impact technology-based economic development Key Industries include: BioMedical and Health Care Aluminum Manufacturing Automotive Manufacturing Customer Contact Centers Distribution, Warehousing & Logistics Food-Related Products Manufacturing Petrochemicals & Energy Development Primary Metals Fabricated Products Manufacturing Additive Manufacturing Industrial Internet of Things 8 Northeast Ohio companies on 2019 Fortune 500 A number of companies with locations through out the country are headquartered in the Youngstown-Warren area Large regional employers include: Alorica, Inc. B J Alan Co, Inc. Covelli Enterprises Diocese of Youngstown Mercy Health Sharon Regional Health Youngstown Air Reserve Youngstown State University
First Quarter Financial Overview, 3/31/20 Stock Data – NASDAQ: FMNB Stock Price: $11.63 Operating Results Revenue: $35.4 million excluding gains Cash Dividends: $3.1 million Net Income-Diluted Share: $0.30 ROAE: 11.53% ROAA: 1.32% Tangible Book Value: $8.94 Net Income: $8.6 million Dividend (yield): $0.11 (3.78%)
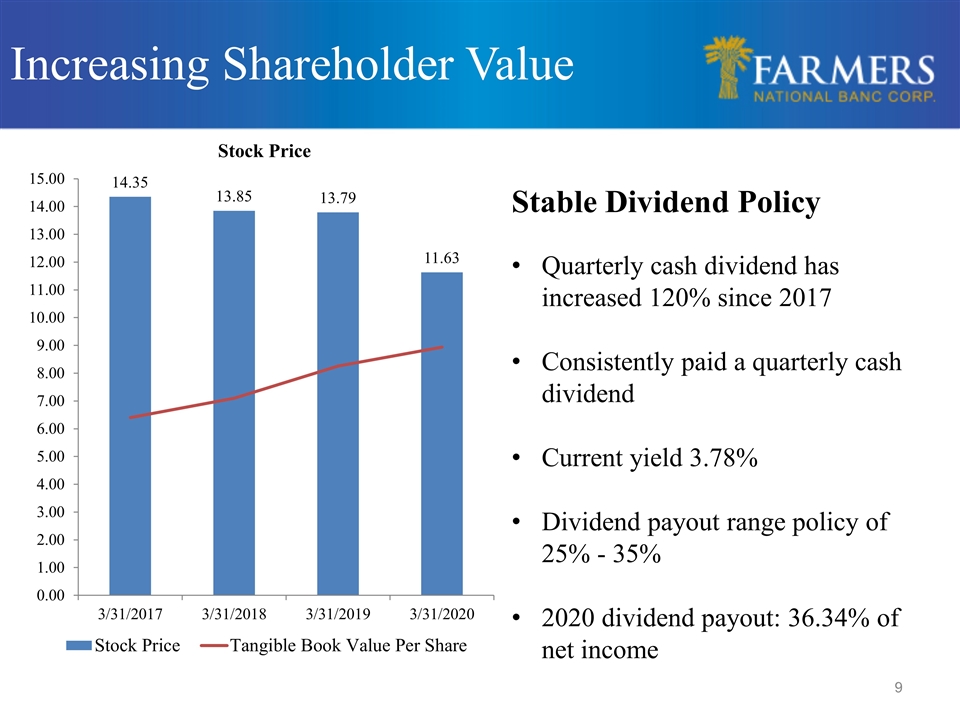
Stable Dividend Policy Quarterly cash dividend has increased 120% since 2017 Consistently paid a quarterly cash dividend Current yield 3.78% Dividend payout range policy of 25% - 35% 2020 dividend payout: 36.34% of net income Increasing Shareholder Value
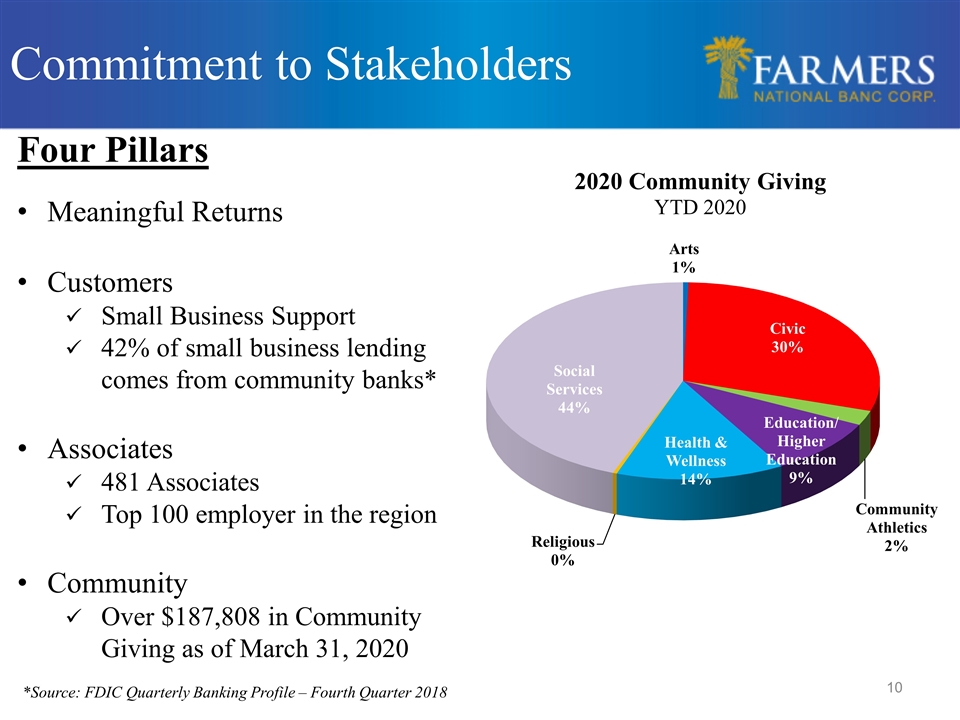
Commitment to Stakeholders *Source: FDIC Quarterly Banking Profile – Fourth Quarter 2018 Four Pillars Meaningful Returns Customers Small Business Support 42% of small business lending comes from community banks* Associates 481 Associates Top 100 employer in the region Community Over $187,808 in Community Giving as of March 31, 2020
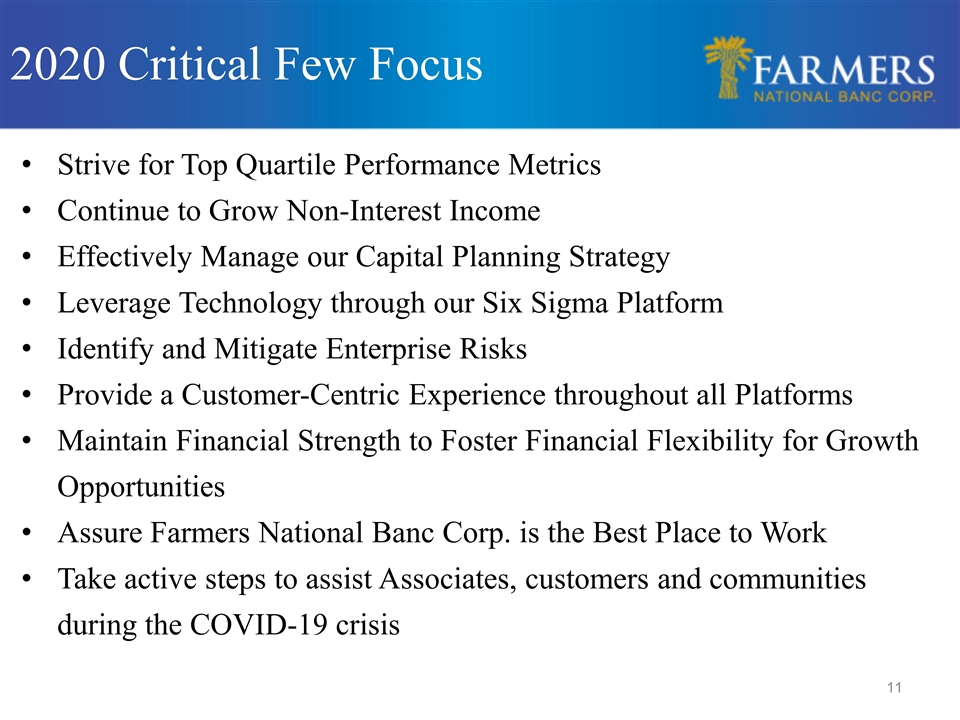
2020 Critical Few Focus Strive for Top Quartile Performance Metrics Continue to Grow Non-Interest Income Effectively Manage our Capital Planning Strategy Leverage Technology through our Six Sigma Platform Identify and Mitigate Enterprise Risks Provide a Customer-Centric Experience throughout all Platforms Maintain Financial Strength to Foster Financial Flexibility for Growth Opportunities Assure Farmers National Banc Corp. is the Best Place to Work Take active steps to assist Associates, customers and communities during the COVID-19 crisis
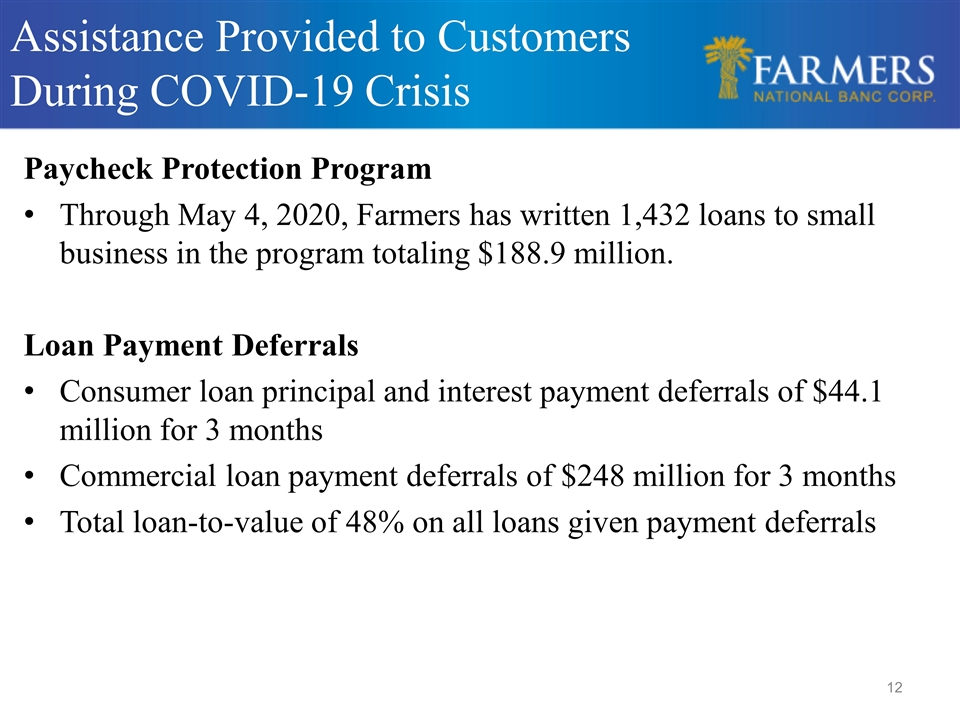
Assistance Provided to Customers During COVID-19 Crisis Paycheck Protection Program Through May 4, 2020, Farmers has written 1,432 loans to small business in the program totaling $188.9 million. Loan Payment Deferrals Consumer loan principal and interest payment deferrals of $44.1 million for 3 months Commercial loan payment deferrals of $248 million for 3 months Total loan-to-value of 48% on all loans given payment deferrals
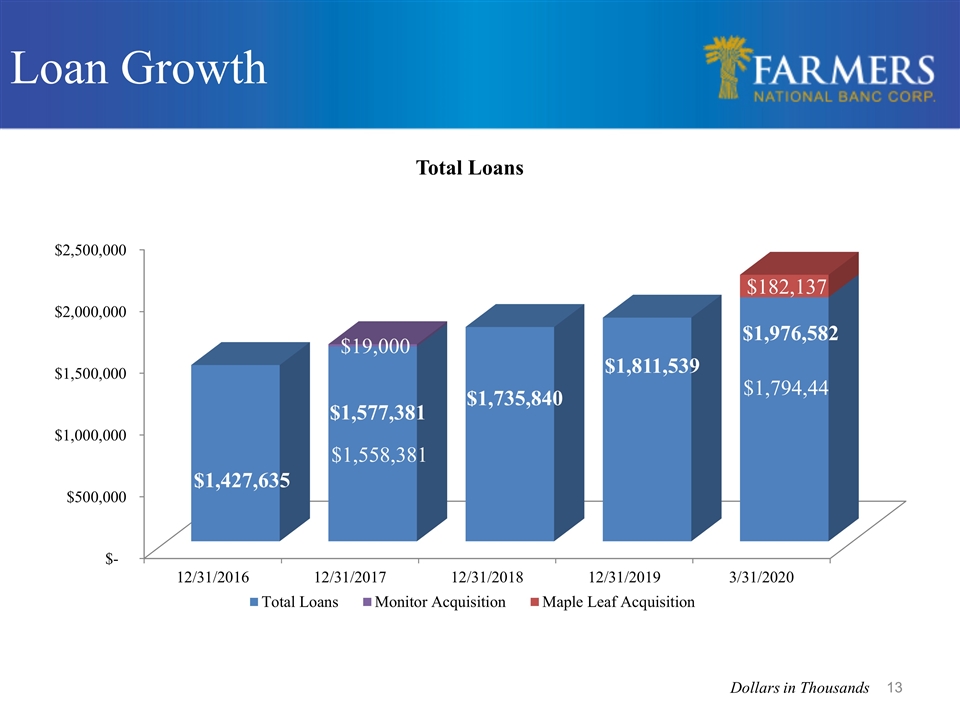
Loan Growth $1,296,865 $1,577,381 Dollars in Thousands
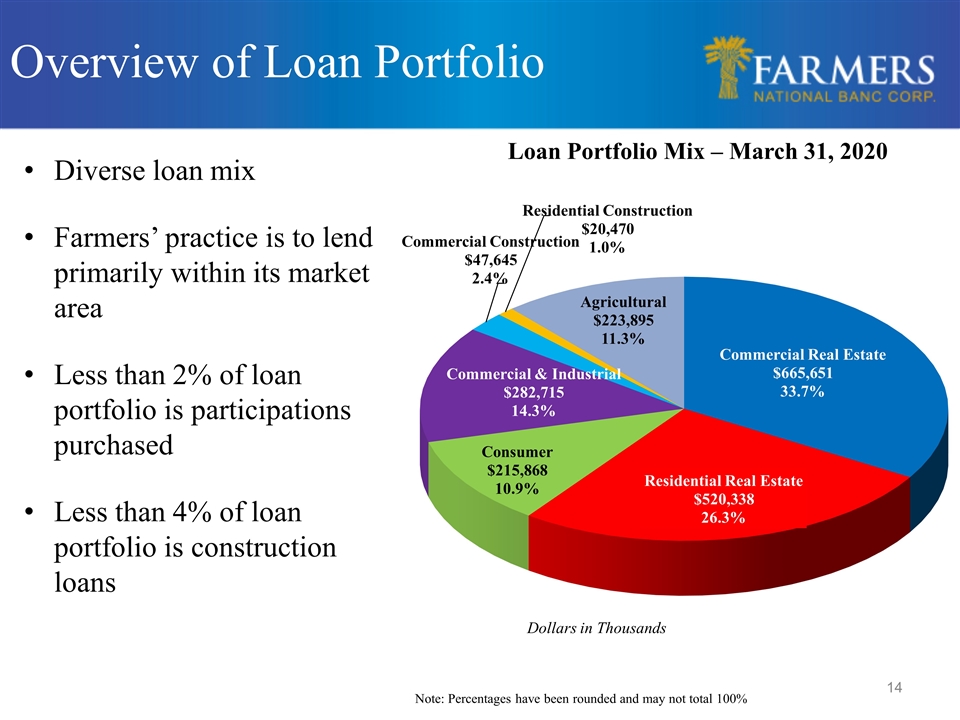
Loan Portfolio Mix – March 31, 2020 Overview of Loan Portfolio Dollars in Thousands Diverse loan mix Farmers’ practice is to lend primarily within its market area Less than 2% of loan portfolio is participations purchased Less than 4% of loan portfolio is construction loans
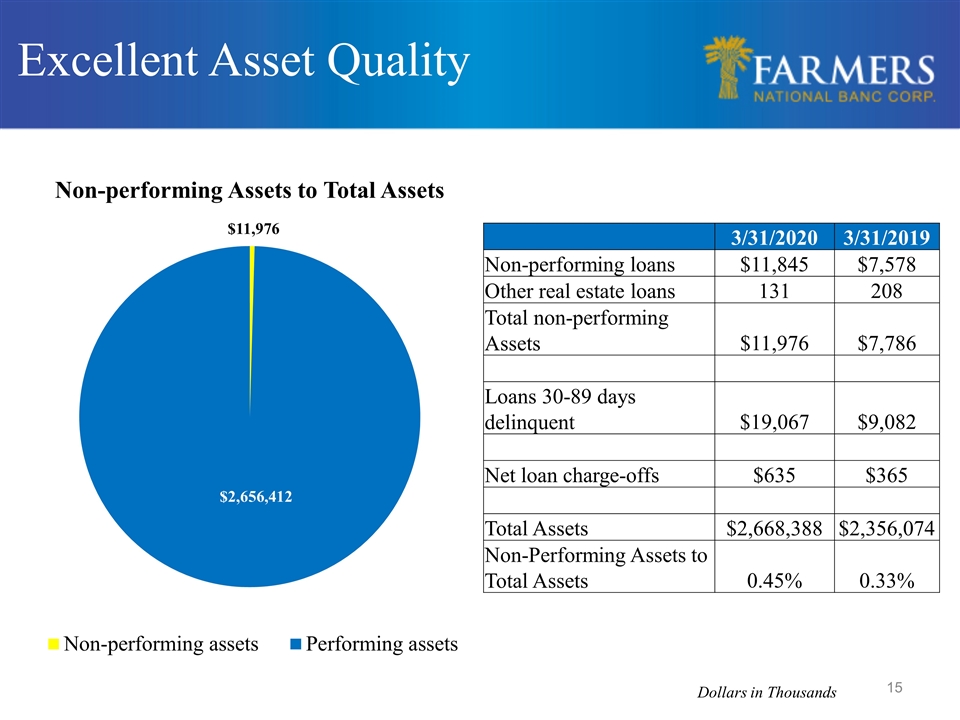
Excellent Asset Quality Dollars in Thousands 3/31/2020 3/31/2019 Non-performing loans $11,845 $7,578 Other real estate loans 131 208 Total non-performing Assets $11,976 $7,786 Loans 30-89 days delinquent $19,067 $9,082 Net loan charge-offs $635 $365 Total Assets $2,668,388 $2,356,074 Non-Performing Assets to Total Assets 0.45% 0.33%
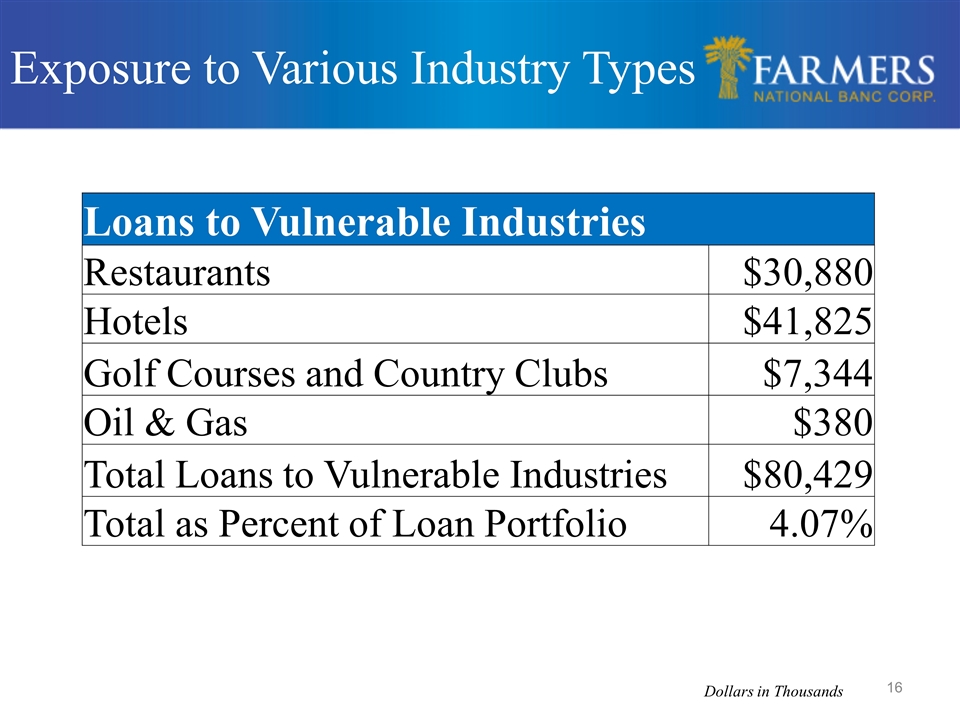
Exposure to Various Industry Types Loans to Vulnerable Industries Restaurants $30,880 Hotels $41,825 Golf Courses and Country Clubs $7,344 Oil & Gas $380 Total Loans to Vulnerable Industries $80,429 Total as Percent of Loan Portfolio 4.07% Dollars in Thousands
Wealth Management Creates Fee-based Income Fee Income 2009: 14.5% of total gross income Noninterest income excluding security gains Fee Income 2020*: 21.8% of total gross income Noninterest income excluding security and asset gains Wealth Management Growth Timeline 2000 Farmers National Investments 2009 Farmers Trust Company 2010 Farmers National Insurance, LLC 2012 Private Client Services 2013 National Associates, Inc. 2016 Bowers Insurance Agency, Inc. *For the three months ended March 31, 2020 Noninterest Income
Noninterest Income Continued Focus on Growing Noninterest Income Noninterest Revenue: 21.8% of Total Revenue, excluding gains *For the quarter ending March 31, 2020 excluding gains
Established and experienced management team with over 361 years of combined experience, 193 of which have been with Farmers. Farmers Academy Attracting quality banking talent Robust succession planning process Talent Acquisition and Retention Years of Experience FMNB Industry President & Chief Executive Officer Kevin J. Helmick (47) 25 25 Senior EVP, Chief Banking Officer Mark Witmer (55) 10 31 Senior EVP, Chief Financial Officer Carl D. Culp (56) 31 36
Cash Dividend Payout Policy Maintain 25% - 35% range Organic Growth Continued organic growth in current markets Growth opportunities in new markets with Private Banking, Trust and Investments Acquisition Opportunities Targeted acquisitions include fee-based business and banks Accretive to earnings near term (excluding one-time charges) Manageable initial tangible book value dilution Must enhance shareholder value Must sustain our culture Not materially change our investment merits Sustain our TCE and regulatory ratios Share Repurchase Plan-Suspended in March Capital Management
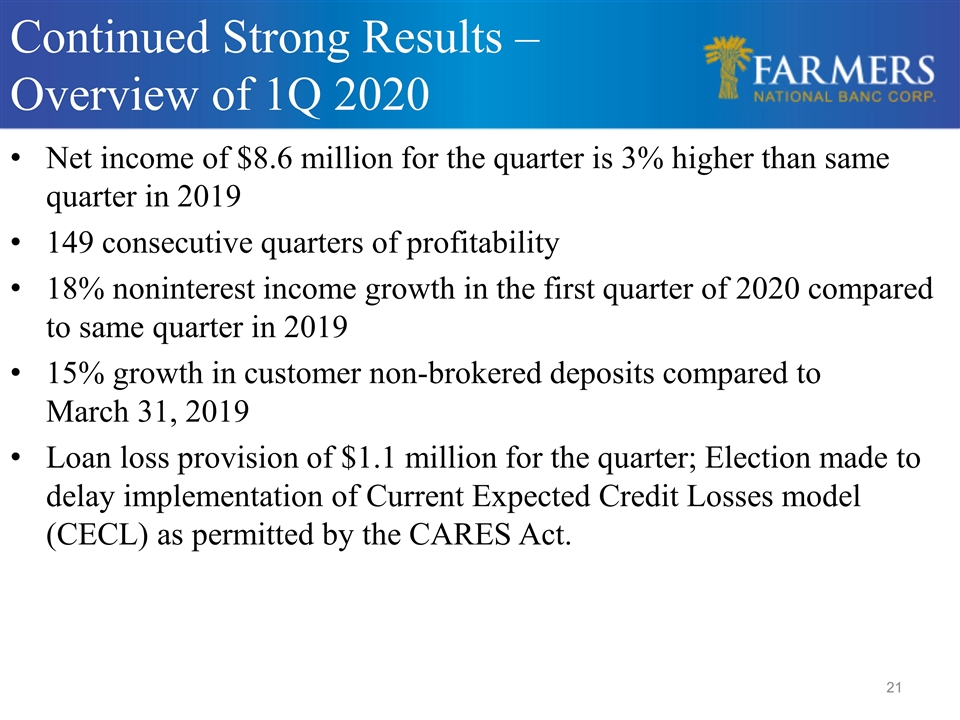
Net income of $8.6 million for the quarter is 3% higher than same quarter in 2019 149 consecutive quarters of profitability 18% noninterest income growth in the first quarter of 2020 compared to same quarter in 2019 15% growth in customer non-brokered deposits compared to March 31, 2019 Loan loss provision of $1.1 million for the quarter; Election made to delay implementation of Current Expected Credit Losses model (CECL) as permitted by the CARES Act. Continued Strong Results – Overview of 1Q 2020
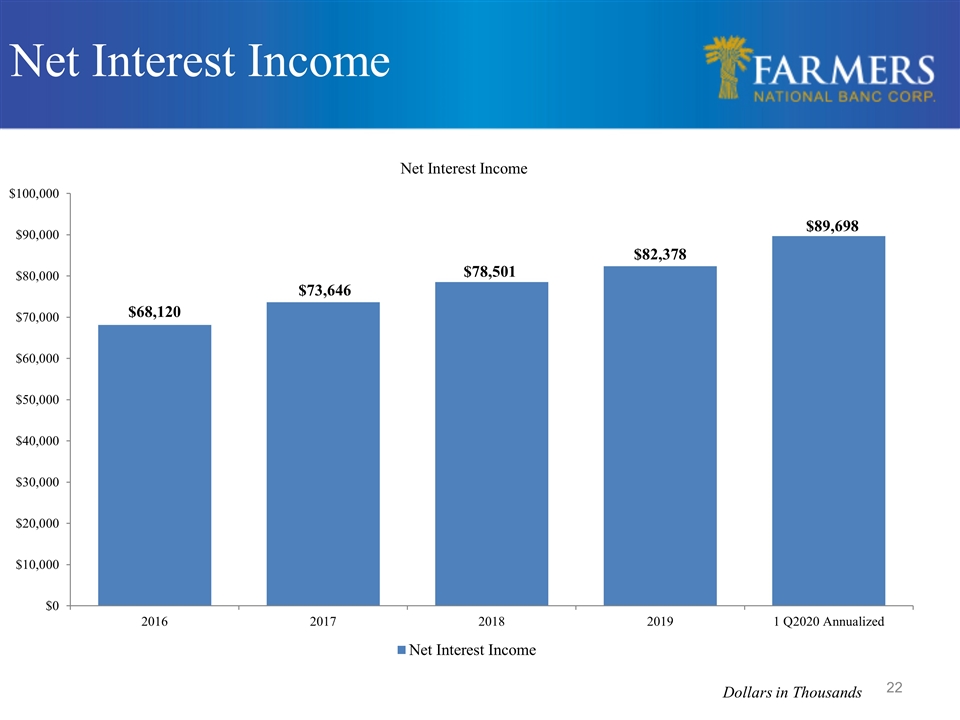
Net Interest Income Dollars in Thousands
Supplemental Information
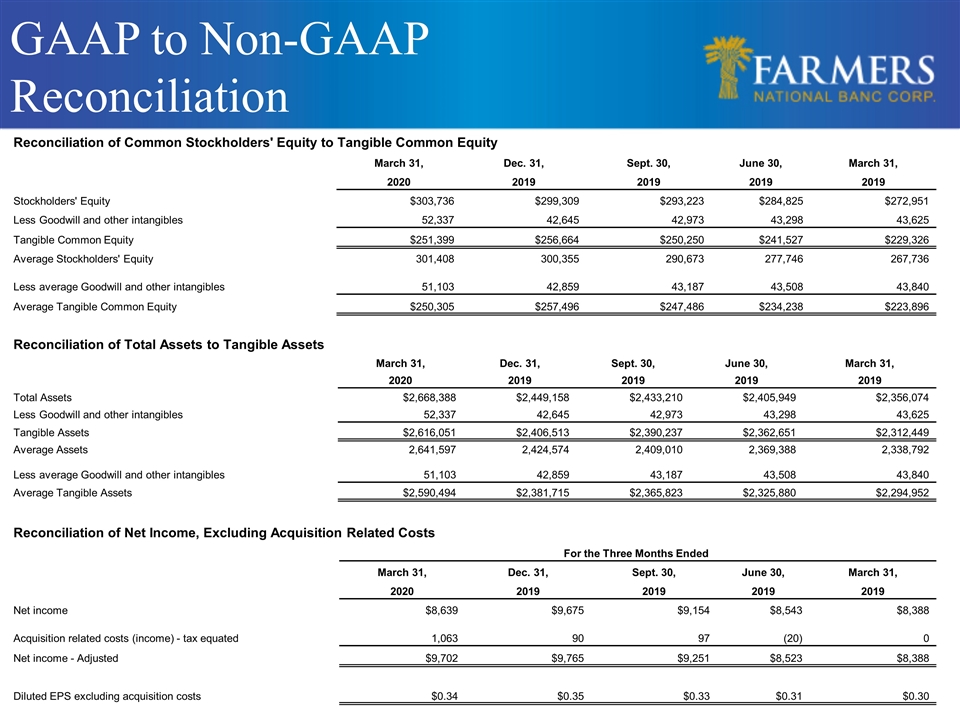
GAAP to Non-GAAP Reconciliation Reconciliation of Common Stockholders' Equity to Tangible Common Equity March 31, Dec. 31, Sept. 30, June 30, March 31, 2020 2019 2019 2019 2019 Stockholders' Equity $303,736 $299,309 $293,223 $284,825 $272,951 Less Goodwill and other intangibles 52,337 42,645 42,973 43,298 43,625 Tangible Common Equity $251,399 $256,664 $250,250 $241,527 $229,326 Average Stockholders' Equity 301,408 300,355 290,673 277,746 267,736 Less average Goodwill and other intangibles 51,103 42,859 43,187 43,508 43,840 Average Tangible Common Equity $250,305 $257,496 $247,486 $234,238 $223,896 Reconciliation of Total Assets to Tangible Assets March 31, Dec. 31, Sept. 30, June 30, March 31, 2020 2019 2019 2019 2019 Total Assets $2,668,388 $2,449,158 $2,433,210 $2,405,949 $2,356,074 Less Goodwill and other intangibles 52,337 42,645 42,973 43,298 43,625 Tangible Assets $2,616,051 $2,406,513 $2,390,237 $2,362,651 $2,312,449 Average Assets 2,641,597 2,424,574 2,409,010 2,369,388 2,338,792 Less average Goodwill and other intangibles 51,103 42,859 43,187 43,508 43,840 Average Tangible Assets $2,590,494 $2,381,715 $2,365,823 $2,325,880 $2,294,952 Reconciliation of Net Income, Excluding Acquisition Related Costs For the Three Months Ended March 31, Dec. 31, Sept. 30, June 30, March 31, 2020 2019 2019 2019 2019 Net income $8,639 $9,675 $9,154 $8,543 $8,388 Acquisition related costs (income) - tax equated 1,063 90 97 (20) 0 Net income - Adjusted $9,702 $9,765 $9,251 $8,523 $8,388 Diluted EPS excluding acquisition costs $0.34 $0.35 $0.33 $0.31 $0.30
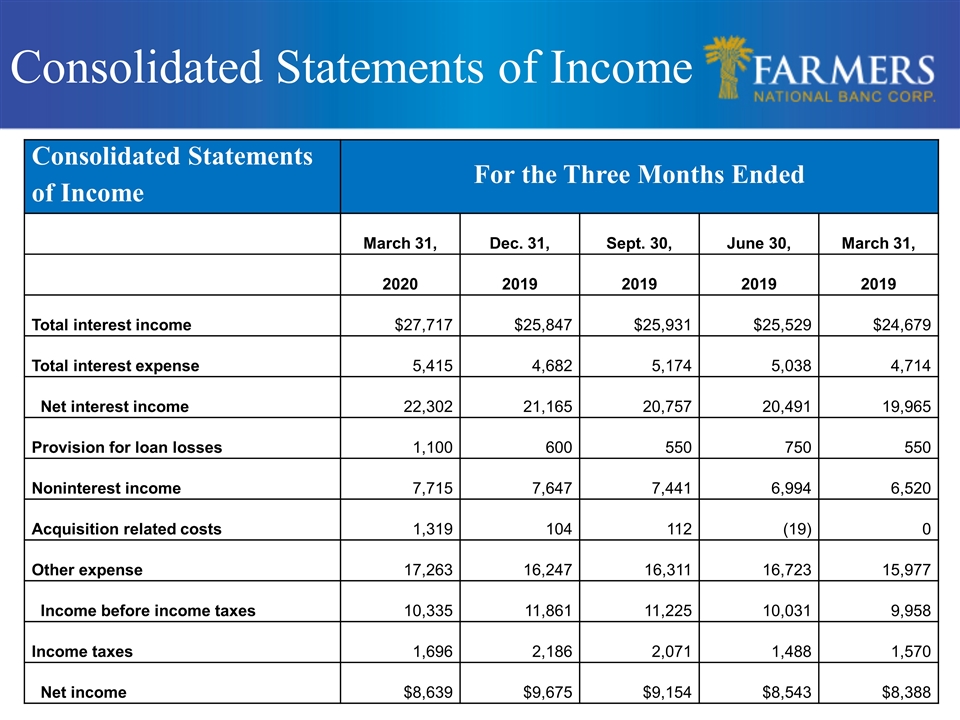
Consolidated Statements of Income Consolidated Statements of Income For the Three Months Ended March 31, Dec. 31, Sept. 30, June 30, March 31, 2020 2019 2019 2019 2019 Total interest income $27,717 $25,847 $25,931 $25,529 $24,679 Total interest expense 5,415 4,682 5,174 5,038 4,714 Net interest income 22,302 21,165 20,757 20,491 19,965 Provision for loan losses 1,100 600 550 750 550 Noninterest income 7,715 7,647 7,441 6,994 6,520 Acquisition related costs 1,319 104 112 (19) 0 Other expense 17,263 16,247 16,311 16,723 15,977 Income before income taxes 10,335 11,861 11,225 10,031 9,958 Income taxes 1,696 2,186 2,071 1,488 1,570 Net income $8,639 $9,675 $9,154 $8,543 $8,388
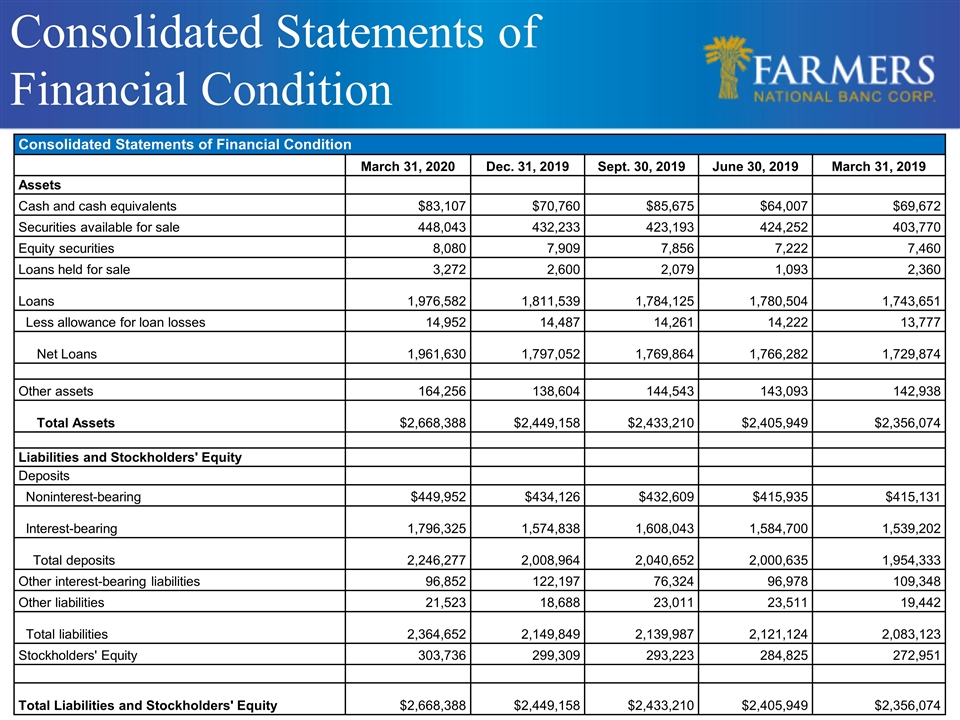
Consolidated Statements of Financial Condition Consolidated Statements of Financial Condition March 31, 2020 Dec. 31, 2019 Sept. 30, 2019 June 30, 2019 March 31, 2019 Assets Cash and cash equivalents $83,107 $70,760 $85,675 $64,007 $69,672 Securities available for sale 448,043 432,233 423,193 424,252 403,770 Equity securities 8,080 7,909 7,856 7,222 7,460 Loans held for sale 3,272 2,600 2,079 1,093 2,360 Loans 1,976,582 1,811,539 1,784,125 1,780,504 1,743,651 Less allowance for loan losses 14,952 14,487 14,261 14,222 13,777 Net Loans 1,961,630 1,797,052 1,769,864 1,766,282 1,729,874 Other assets 164,256 138,604 144,543 143,093 142,938 Total Assets $2,668,388 $2,449,158 $2,433,210 $2,405,949 $2,356,074 Liabilities and Stockholders' Equity Deposits Noninterest-bearing $449,952 $434,126 $432,609 $415,935 $415,131 Interest-bearing 1,796,325 1,574,838 1,608,043 1,584,700 1,539,202 Total deposits 2,246,277 2,008,964 2,040,652 2,000,635 1,954,333 Other interest-bearing liabilities 96,852 122,197 76,324 96,978 109,348 Other liabilities 21,523 18,688 23,011 23,511 19,442 Total liabilities 2,364,652 2,149,849 2,139,987 2,121,124 2,083,123 Stockholders' Equity 303,736 299,309 293,223 284,825 272,951 Total Liabilities and Stockholders' Equity $2,668,388 $2,449,158 $2,433,210 $2,405,949 $2,356,074
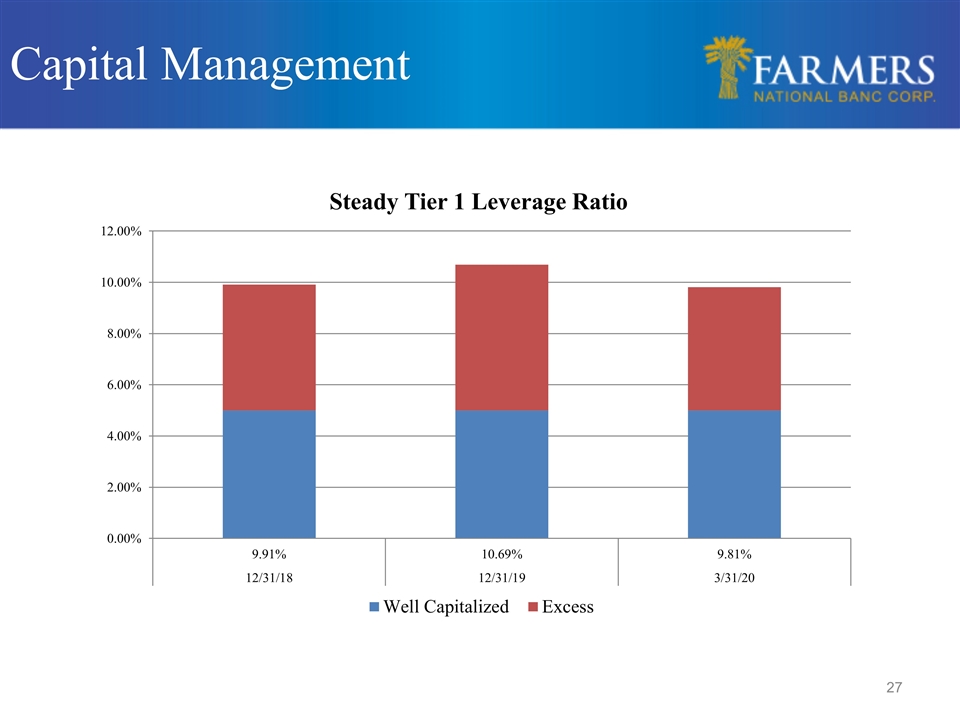
Capital Management
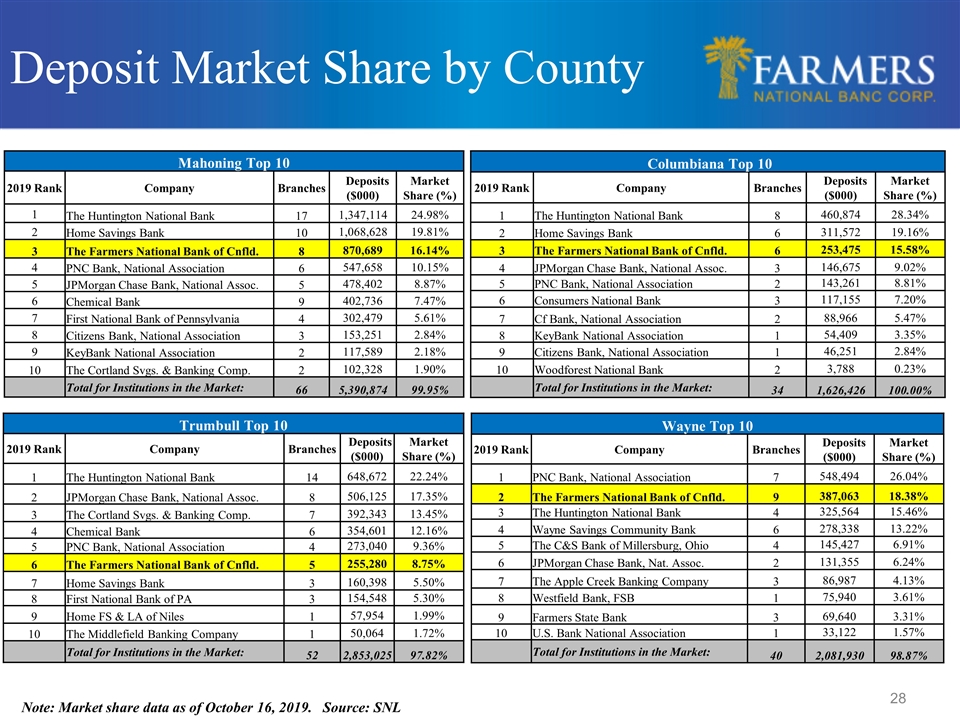
Deposit Market Share by County Note: Market share data as of October 16, 2019. Source: SNL Mahoning Top 10 2019 Rank Company Branches Deposits ($000) Market Share (%) 1 The Huntington National Bank 17 1,347,114 24.98% 2 Home Savings Bank 10 1,068,628 19.81% 3 The Farmers National Bank of Cnfld. 8 870,689 16.14% 4 PNC Bank, National Association 6 547,658 10.15% 5 JPMorgan Chase Bank, National Assoc. 5 478,402 8.87% 6 Chemical Bank 9 402,736 7.47% 7 First National Bank of Pennsylvania 4 302,479 5.61% 8 Citizens Bank, National Association 3 153,251 2.84% 9 KeyBank National Association 2 117,589 2.18% 10 The Cortland Svgs. & Banking Comp. 2 102,328 1.90% Total for Institutions in the Market: 66 5,390,874 99.95% Columbiana Top 10 2019 Rank Company Branches Deposits ($000) Market Share (%) 1 The Huntington National Bank 8 460,874 28.34% 2 Home Savings Bank 6 311,572 19.16% 3 The Farmers National Bank of Cnfld. 6 253,475 15.58% 4 JPMorgan Chase Bank, National Assoc. 3 146,675 9.02% 5 PNC Bank, National Association 2 143,261 8.81% 6 Consumers National Bank 3 117,155 7.20% 7 Cf Bank, National Association 2 88,966 5.47% 8 KeyBank National Association 1 54,409 3.35% 9 Citizens Bank, National Association 1 46,251 2.84% 10 Woodforest National Bank 2 3,788 0.23% Total for Institutions in the Market: 34 1,626,426 100.00% Trumbull Top 10 2019 Rank Company Branches Deposits ($000) Market Share (%) 1 The Huntington National Bank 14 648,672 22.24% 2 JPMorgan Chase Bank, National Assoc. 8 506,125 17.35% 3 The Cortland Svgs. & Banking Comp. 7 392,343 13.45% 4 Chemical Bank 6 354,601 12.16% 5 PNC Bank, National Association 4 273,040 9.36% 6 The Farmers National Bank of Cnfld. 5 255,280 8.75% 7 Home Savings Bank 3 160,398 5.50% 8 First National Bank of PA 3 154,548 5.30% 9 Home FS & LA of Niles 1 57,954 1.99% 10 The Middlefield Banking Company 1 50,064 1.72% Total for Institutions in the Market: 52 2,853,025 97.82% Wayne Top 10 2019 Rank Company Branches Deposits ($000) Market Share (%) 1 PNC Bank, National Association 7 548,494 26.04% 2 The Farmers National Bank of Cnfld. 9 387,063 18.38% 3 The Huntington National Bank 4 325,564 15.46% 4 Wayne Savings Community Bank 6 278,338 13.22% 5 The C&S Bank of Millersburg, Ohio 4 145,427 6.91% 6 JPMorgan Chase Bank, Nat. Assoc. 2 131,355 6.24% 7 The Apple Creek Banking Company 3 86,987 4.13% 8 Westfield Bank, FSB 1 75,940 3.61% 9 Farmers State Bank 3 69,640 3.31% 10 U.S. Bank National Association 1 33,122 1.57% Total for Institutions in the Market: 40 2,081,930 98.87%


