
Exhibit 99.2 Q2 2024 Investor Presentation NASDAQ: FMNB

Disclosure Statement Forward-LookingStatements This presentation contains forward-looking statements within the meaning of the Private Securities Litigation Reform Act of 1995, including statements about the financial condition, results of operations, asset quality trends and profitability of Farmers National Banc Corp. (“Farmers”). Forward-looking statements are not historical facts but instead express only management’s current expectations and forecasts of future events or long-term-goals, many of which, by their nature, are inherently uncertain and outside of Farmers’ control. Forward-looking statements are preceded by terms such as “expects,” “believes,” “anticipates,” “intends” and similar expressions, as well as any statements related to future expectations of performance or conditional verbs, such as “will,” “would,” “should,” “could” or “may.” Farmers’ actual results and financial condition may differ, possibly materially, from those indicated in these forward-looking statements. Factors that could cause Farmers’ actual results to differ materially from those described in the forward-looking statements include significant changes in near-term local, regional, and U.S. economic conditions including those resulting from continued high rates of inflation, tightening monetary policy of the Board of Governors of the Federal Reserve, and possibility of a recession; and the other factors contained in Farmers’ periodic reports and registration statements filed with the Securities and Exchange Commission, including its Annual Report on Form 10-K for the year ended December 31, 2023, and Quarterly Report on Form 10-Q, which have been filed with the Securities and Exchange Commission and are available on Farmers’ website (www.farmersbankgroup.com) and on the Securities and Exchange Commission’s website (www.sec.gov). Forward- looking statements are not guarantees of future performance and should not be relied upon as representing management’s views as of any subsequent date. Farmers undertakes no obligation to update forward-looking statements, whether as a result of new information, future events or otherwise. Use of Non-GAAP Financial Measures This presentation contains certain financial information determined by methods other than in accordance with accounting principles generally accepted in the United States (“GAAP”). These non-GAAP financial measures include “Core Deposits” and “Tangible Common Equity ratio.” Farmers believes that these non-GAAP financial measures provide both management and investors a more complete understanding of Farmers’ deposit profile and capital. These non-GAAP financial measures are supplemental and are not a substitute for any analysis based on GAAP financial measures. Because not all companies use the same calculation of “Core Deposits” and “Tangible Common Equity ratio,” this presentation may not be comparable to other similarly titled measures as calculated by other companies. 2
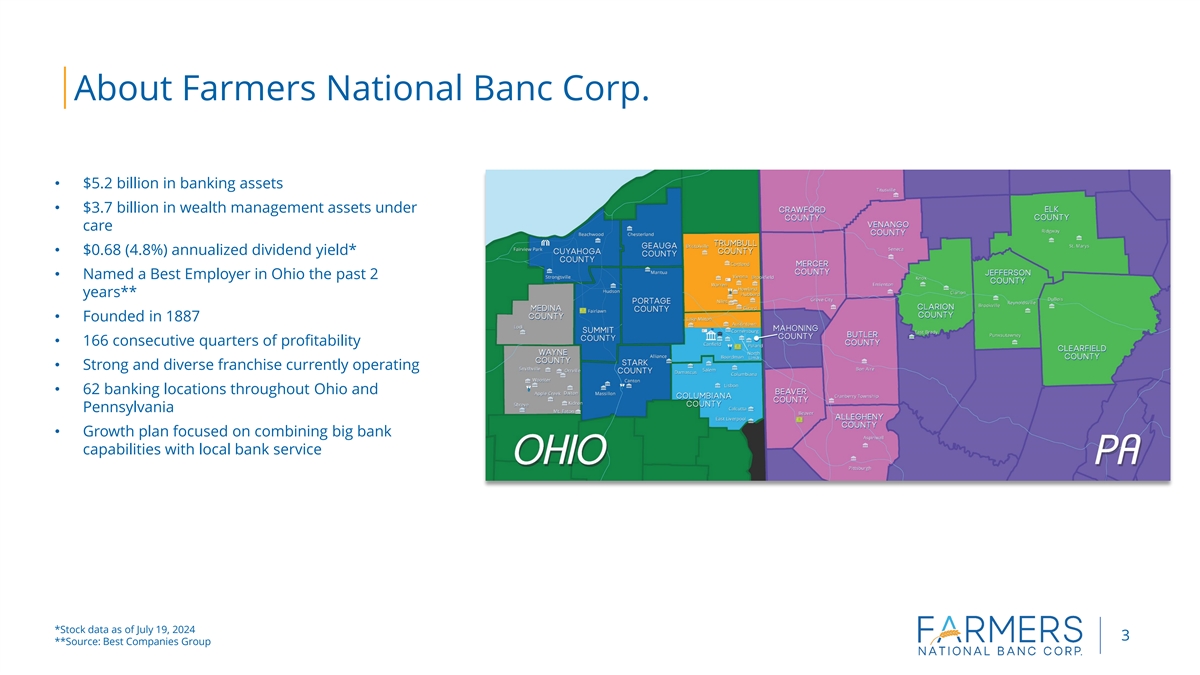
About Farmers National Banc Corp. • $5.2 billion in banking assets • $3.7 billion in wealth management assets under care • $0.68 (4.8%) annualized dividend yield* • Named a Best Employer in Ohio the past 2 years** • Founded in 1887 • 166 consecutive quarters of profitability • Strong and diverse franchise currently operating • 62 banking locations throughout Ohio and Pennsylvania • Growth plan focused on combining big bank capabilities with local bank service *Stock data as of July 19, 2024 3 **Source: Best Companies Group

Local, Established & Experienced Leadership Team Kevin Helmick (52) Troy Adair (58) Amber Wallace (58) Michael Matuszak (56) Timothy Shaffer (62) President & Senior Executive Vice President, Senior Executive Vice President, Senior Executive Vice President, Senior Executive Vice President, Chief Executive Officer Chief Financial Officer Chief Retail/Marketing Officer Chief Operating Officer Chief Credit Officer Mark Wenick (64) Brian Jackson (55) Michael Oberhaus (49) Mark Nicastro (53) William Shivers (63) Senior Executive Vice President, Executive Vice President, Executive Vice President, Executive Vice President, Senior Vice President, Chief Chief Wealth Management Officer Chief Information Officer Chief Risk Officer Chief Human Resources Officer Commercial Lending Officer Training Talent Acquisition Robust Succession Planning Alignment with Shareholders • Farmers Academy • Comprehensive recruitment • Annual review • Structure of STI and LTI programs program encourages sound business • In-house leadership/management • Multi-layered approach practices and appropriate levels of training program • High percentage of referrals come focused on core competencies of risk management from our employees position • Ohio Bankers League Bank • Recognition as Best Employer in − Linked to annual performance Management School • Retention of key executives Ohio in 2019, 2020, 2022 as voted appraisal and development plan by our employees* − Current executive team has been • Executive succession planning with the bank for over nine years • Key metrics of success reflected in reviewed at holding company consistent results board level 4 * Source: Best Companies Group

Farmers Strategic Vision Leveraging our History with Modern Banking Technologies to Support our Future Invest in our Franchise Drive Financial Excellence • Leverage technology • Strive for performance metrics in top quartile ranking vs. peer group • Drive efficiencies through Six Sigma operating framework • Focus on growing noninterest income • Strive to be customer centric and provide exceptional experiences • Proactive capital management • Assure Farmers is the best place to work • Maintain financial strength • Continued pursuit of organic and M&A opportunities • Prudent risk management and focus on asset quality 5

Proven Acquisition History and Strategy Long-term strategy of value-enhancing acquisitions $6,000 Emclaire Seven acquisitions in the Financial (2023) past eight years $5,000 Cortland Bancorp (2021) Target franchises with similar culture, compelling reputation, and strong $4,000 Maple Leaf customer base (2020) Bowers Insurance (2016) $3,000 Focus on businesses that support cross Farmers National sell opportunities and diversify footprint Trust Bancshares into compelling banking markets Company (2015) Private Client (2009) Services $2,000 (2012) Farmers Monitor National Bancorp Insurance (2017) Manageable initial tangible book value (2008) dilution st $1,000 Tri-state 1 Banc National (2015) Associates (2013) $- Reasonable price with a currency mix of 07 08 09 10 11 12 13 14 15 16 17 18 19 20 21 22 23 24 cash and stock Assets Wealth Management Assets • Graph in millions 6 • As of June 30, 2024

Financial Performance NASDAQ: FMNB
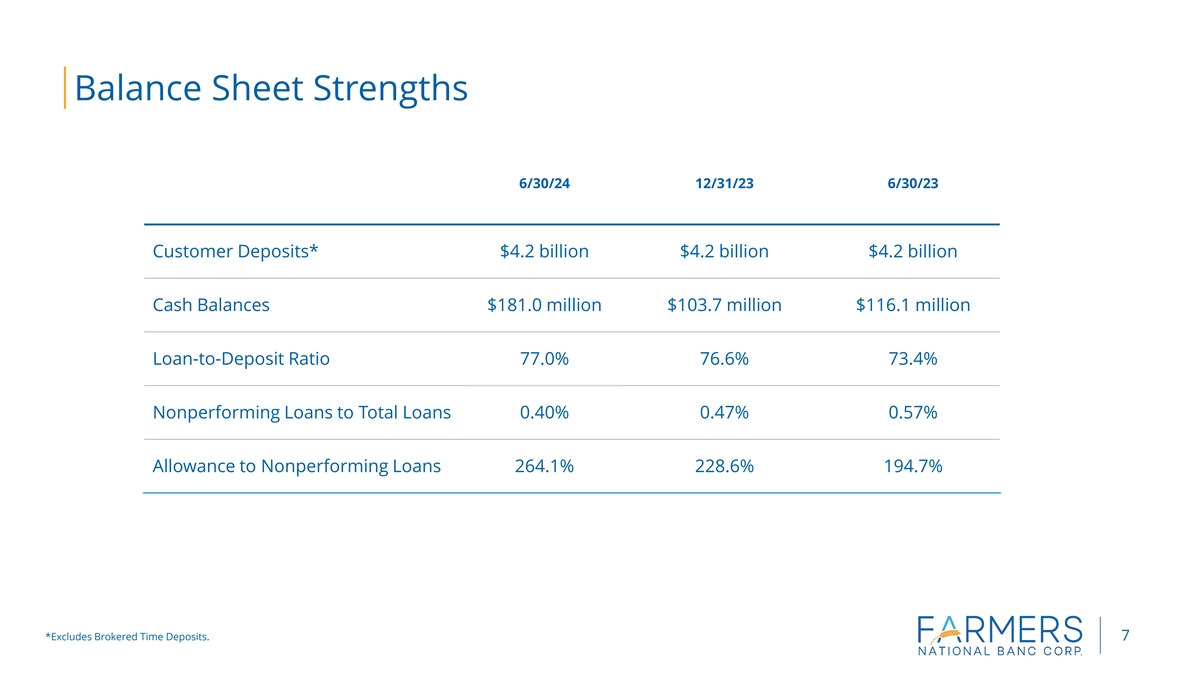
Balance Sheet Strengths (1) 6/30/24 12/31/23 6/30/23 Customer Deposits* $4.2 billion $4.2 billion $4.2 billion Cash Balances $181.0 million $103.7 million $116.1 million (1) Loan-to-Deposit Ratio 77.0% 76.6% 73.4% Nonperforming Loans to Total Loans 0.40% 0.47% 0.57% Allowance to Nonperforming Loans 264.1% 228.6% 194.7% *Excludes Brokered Time Deposits. 7

Core Results Overview Core Net Income $62,316 $63,994 $61,798 $65,000 • Core EPS remains strong through challenging environments $55,000 • Robust fee businesses provide stability $44,461 $45,000 $35,000 $25,105 $25,000 $15,000 $5,000 2020 2021 2022 2023 YTD 6/30/2024 Core EPS Core Return on Assets 1.83% $2.50 $2.13 1.55% 1.54% $1.89 $2.00 $1.65 1.23% $1.57 $1.50 1.00% $1.00 $0.67 $0.50 $0.00 2020 2021 2022 2023 YTD 6/30/2024 2020 2021 2022 2023 YTD 6/30/2024 8 Core items exclude the impact of acquisition related provision and other items. See Non-GAAP reconciliation in appendix.

Loan Portfolio Overview Overview Rate Type Segments • Total loans $3.2 billion Variable, 15% • Diverse loan mix • Farmers’ practice is to lend primarily within its market area Fixed, 52% Adjustable, 33% Total Loans (in millions) Net Loans to Assets $3,500.00 66.9% $3,000.00 62.3% 62.1% 58.3% $2,500.00 55.6% $2,000.00 $1,500.00 $1,000.00 $500.00 $0.00 2020 2021 2022 2023 6/30/2024 2020 2021 2022 2023 6/30/2024 CRE C&I Agricultural Residential Mortgage Consumer 9

CRE Overview CRE Breakdown Construction, • Well diversified portfolio 7% Owner Multifamily, • Strong credit culture Occupied, 29% 12% • Independent loan review Non-owner Occupied, 52% CRE Categories Loans by Industry Type 8% Category Balance % of CRE % of Port Retail $ 342,090 25% 11% 11% Warehouse/Industrial $ 186,884 14% 6% Commercial Real Estate Office $ 181,994 14% 6% 42% Residential Real Estate Multifamily $ 160,967 12% 5% Consumer 13% Medical $ 147,153 11% 5% Commercial & Industrial Special Purpose $ 92, 952 7% 3% Agricultural Restaurant $ 53,885 4% 2% Multifamily - Construction $ 49, 942 4% 2% 26% Hotel $ 43,314 3% 1% Remainder $ 88, 446 7% 3% Total $ 1, 347,627 10

Asset Quality Trends Overview Annualized Net Charge-Offs to Avg. Net Loans • Early-stage delinquencies were $18.5 million, or 0.57% of total 0.11% 0.10% loans at June 30, 2024, compared to $16.7 million, or 0.52% of total loans at December 31, 2023 0.07% 0.07% • Conservative underwriting practices • Sound reserve levels under CECL 0.04% 2020 2021 2022 2023 YTD 6/30/2024 NPLs/Total Loans & Leases ($ in thousands) ACL to Total Loans 1.26% $20,000 0.90% 0.80% 0.70% $15,000 0.60% 1.12% 0.50% 1.08% $10,000 1.07% 0.40% 1.05% 0.30% $5,000 0.20% 0.10% $- 0.00% 2020 2021 2022 2023 6/30/2024 2020 2021 2022 2023 6/30/2024 NPLs NPLs / Total Loans 11

Securities Portfolio Overview CMOs, 7.8% Mortgage Corporates, 1.7% • All of the Investment securities portfolio is categorized as Backed available for sale U.S. Government, 9.5% Securities • All MBS and CMOs are U.S. government agency issued 40.1% • All municipal securities are investment grade, majority with credit enhancements • The duration of the available for sale securities portfolio is 7.0 years at June 30, 2024 • Assuming no changes to interest rates, the AOCI is expected to have accretion of approximately $27.3 million, or 11.3% over the next four quarters • Over the next three years, the AOCI is expected to have accretion of approximately $76.9 million, or 31.7%, assuming no changes to interest rates Municipals, 40.9% 12
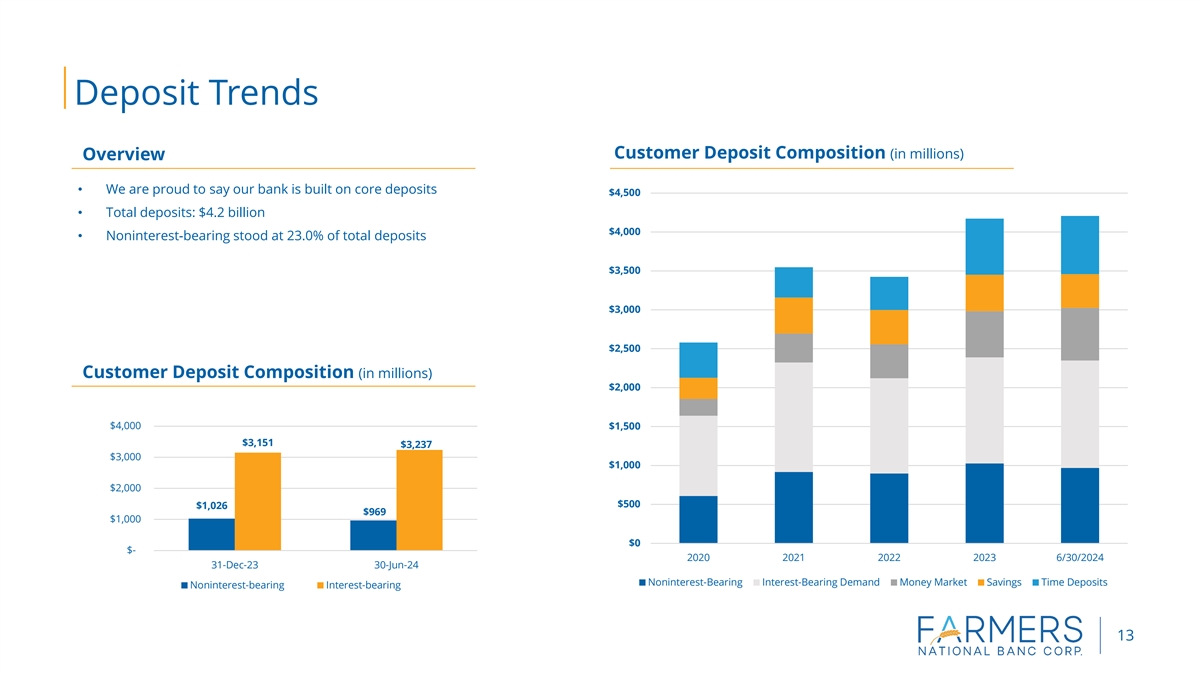
Deposit Trends Customer Deposit Composition (in millions) Overview • We are proud to say our bank is built on core deposits $4,500 • Total deposits: $4.2 billion $4,000 • Noninterest-bearing stood at 23.0% of total deposits $3,500 $3,000 $2,500 Customer Deposit Composition (in millions) $2,000 $4,000 $1,500 $3,151 $3,237 $3,000 $1,000 $2,000 $500 $1,026 $969 $1,000 $0 $- 2020 2021 2022 2023 6/30/2024 31-Dec-23 30-Jun-24 Noninterest-Bearing Interest-Bearing Demand Money Market Savings Time Deposits Noninterest-bearing Interest-bearing 13

Liquidity Farmers National Banc Corp. has the following sources of liquidity at the holding company as of June 30, 2024: • $51.4 million of cash and equivalents • $5.0 million in unsecured lines of credit with a zero balance Farmers National Bank has the following sources of liquidity as of June 30, 2024: • $178.0 million of cash and equivalents • $679.7 million of additional borrowing capacity at the FHLB • $25.0 million of unsecured lines of credit with a zero balance • $238.1 million of available for sale securities that are not pledged • Brokered CDs • Securities roll-off of approximately $73.9 million in next 12 months 14

Net Interest Income and NIM Trends Overview Net Interest Income (in thousands) $160,000 • Focused on growing loans to manage net interest margin $140,000 • Managing cost of funds and deposit betas through rising rate $120,000 environment $100,000 $80,000 $60,000 $40,000 $20,000 2020 2021 2022 2023 YTD 6/30/2024 Net Interest Margin (annualized) Loans to Deposits 3.70% 90.00% 3.45% 3.18% 80.00% 2.91% 2.70% 70.00% 60.00% 50.00% 40.00% 30.00% 20.00% 10.00% 0.00% 2020 2021 2022 2023 YTD 6/30/2024 2020 2021 2022 2023 6/30/2024 15

Noninterest Income Trends Overview Total Noninterest Income* (in thousands) $50,000 • Robust Trust, Wealth Management and Insurance businesses $40,000 • Diverse revenue sources • Working to increase noninterest income to total revenue $30,000 $20,000 $10,000 $- 2020 2021 2022 2023 YTD 6/30/2024 Noninterest Income to Total Revenue* Components of Noninterest Income* (in thousands) $40,000 27.3% 26.1% 24.4% $35,000 22.9% 22.4% $30,000 $25,000 $20,000 $15,000 $10,000 $5,000 $- 2020 2021 2022 2023 YTD 6/30/2024 2020 2021 2022 2023 YTD 6/30/2024 Wealth Mortgage Banking Svc Chgs/Debit Fees Other 16 *Noninterest income in 2022 excludes $8.4 million in income related to the proceeds of a one-time legal settlement. In 2023, it excludes $915,000 related to the gain recognized on the sale of commercial loans and in 2024, it excludes $2.6 million loss on sale of securities and other assets. See Non-GAAP reconciliation in appendix.

Noninterest Expense Trends 1) (1) Overview Noninterest Expense to Average Assets • Overall focus on driving efficiencies 2.43% • The Company has a number of process improvement projects 2.12% 2.05% 2.07% 1.98% underway. • Track record of prudent expense management 2020 2021 2022 2023 YTD 6/30/2024 (2) (1) Noninterest Expense (in thousands) Efficiency Ratio $120,000 60.9% $100,000 55.4% 49.4% 49.0% 46.3% $80,000 $60,000 $40,000 $20,000 $- 2020 2021 2022 2023 YTD 6/30/24 2020 2021 2022 2023 YTD 6/30/2024 (1) Ratios adjusted for certain items. See Non-GAAP reconciliation in appendix. 17 (2) All periods adjusted for certain items. See Non-GAAP reconciliation in appendix.
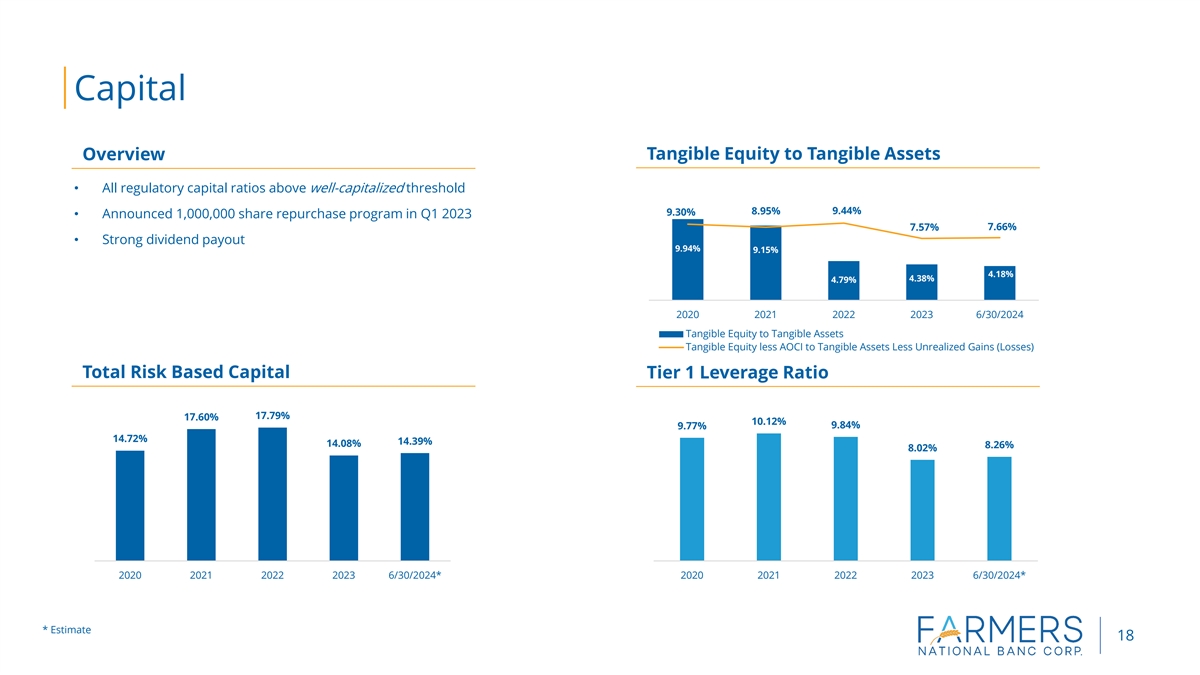
Capital Overview Tangible Equity to Tangible Assets • All regulatory capital ratios above well-capitalized threshold 8.95% 9.44% 9.30% • Announced 1,000,000 share repurchase program in Q1 2023 7.66% 7.57% • Strong dividend payout 9.94% 9.15% 4.18% 4.38% 4.79% 2020 2021 2022 2023 6/30/2024 Tangible Equity to Tangible Assets Tangible Equity less AOCI to Tangible Assets Less Unrealized Gains (Losses) Total Risk Based Capital Tier 1 Leverage Ratio 17.79% 17.60% 10.12% 9.84% 9.77% 14.72% 14.39% 14.08% 8.26% 8.02% 2020 2021 2022 2023 6/30/2024* 2020 2021 2022 2023 6/30/2024* * Estimate 18

Appendix – Non GAAP Reconciliations Net income $ 41,876 $ 51,844 $ 60,597 $ 49,932 $ 23, 023 Acquisition related costs - after tax 2,585 5,731 3,290 4,395 - Acquisition related provision - after tax - 3,846 - 6,077 - Employee severance - - - 798 - Law suit settlement income - after tax - - ( 6,616) - - Law suit settlement contingent legal expense - after tax - - 1,639 620 - Charitable donation - after tax - - 4,740 - - FHLB prepayment penalties - after tax 666 1,682 - - - Net loss (gain) on asset/security sales - after tax 404 (598) 344 ( 723) 2, 082 Gain on sale of non-mortgage loans - after tax - (189) - 698 - Core net income $ 45,531 $ 62,316 $ 63,994 $ 61,797 $ 25, 105 Reported diluted EPS $ 1.47 $ 1.77 $ 1.79 $ 1.33 $ 0. 61 Core diluted EPS $ 1.60 $ 2.13 $ 1.89 $ 1.65 $ 0. 67 Reported return on average assets (annualized) 1.46% 1.52% 1.46% 0.99% 0.91% Core return on average assets (annualized) 1.59% 1.83% 1.54% 1.23% 1.00% Net interest income, reported $ 96,191 $ 107,990 $ 124,166 $ 137,786 $ 63, 753 Net interest income, tax equated $ 98,582 $ 110,835 $ 127,530 $ 140,588 $ 65, 001 Noninterest income 36,161 38,193 44,202 41,861 17, 963 Legal settlement income - - ( 8,375) - - Net loss (gain) on asset/security sales 511 (757) 435 883 2, 635 Net (gain) on commercial loan sale - - - - - Gain on sale of non-mortgage loans - (239) - ( 915) - Adjusted noninterest income 36,672 37,197 36,262 41,829 20, 598 Net interest income and noninterest income adjusted 135,254 148,032 163,792 182,417 85, 599 Noninterest expense less intangible amortization 70,001 77,817 92,438 108,361 52, 124 Charitable donation - - 6,000 - - Contingent legal settlement expense - - 2,075 785 - Employee severance - - - 1,010 - Acquisition related costs 3,223 7,109 4,070 5,475 - FHLB prepayment penalties - 2,129 - - - Adjusted noninterest expense 66,778 68,579 80,293 101,091 52, 124 Reported efficiency ratio (tax equivalent basis) 52.55% 51.13% 53.68% 59.24% 61.17% Efficiency ratio excluding certain items 49.37% 46.33% 49.02% 55.42% 60.89% 19

Appendix – Non GAAP Reconciliations 2020 2021 2022 2023 6/30/2024 Total assets $ 3,071,148 $ 4,142,749 $ 4,082,200 $ 5,078,350 $ 5, 156,853 Less goodw ill and other intangibles 49,617 102,606 101,666 190,287 188, 970 Tangible Assets $ 3,021,531 $ 4,040,143 $ 3,980,534 $ 4,888,063 $ 4, 967,883 Gross unrealized losses $ 27,889 $ 11,718 $ ( 266,487) $ ( 217,140) $ (242,341) Tangible assets less gross unrealized gains (losses) $ 2,993,642 $ 4,028,425 $ 4,247,021 $ 5,105,203 $ 5, 210,224 Stockholders' Equity $ 350,097 $ 472,432 $ 292,295 $ 404,415 $ 396, 694 Less goodw ill and other intangibles 49,617 102,606 101,666 190,287 188, 970 Tangible common equity 300,480 369,826 190,629 214,128 207, 724 Accumulated othe comprehensive income (loss) (AOCI) 22,032 9,295 ( 210,490) ( 172,554) (191,233) Tangible common equity less AOCI $ 278,448 $ 360,531 $ 401,119 $ 386,682 $ 398, 957 Equity to assets 11.40% 11.40% 7.16% 7.96% 7.69% Tangible equity to tangible assets 9.94% 9.15% 4.79% 4.38% 4.18% Tangible equity less AOCI to tangible assets less gross unrealized gains (losses) 9.30% 8.95% 9.44% 7.57% 7.66% 20