| UNITED STATES |
| SECURITIES AND EXCHANGE COMMISSION |
| Washington, D.C. 20549 |
| FORM N-CSR |
| CERTIFIED SHAREHOLDER REPORT |
| OF |
| REGISTERED MANAGEMENT INVESTMENT COMPANIES |
| Investment Company Act file number: 811-03599 |
| Name of Registrant: The Royce Fund |
| Address of Registrant: 745 Fifth Avenue |
| New York, NY 10151 |
| Name and address of agent for service: | John E. Denneen, Esquire | |||
| 745 Fifth Avenue | ||||
| New York, NY 10151 |
| Registrant’s telephone number, including area code: (212) 508-4500 |
| Date of fiscal year end: December 31 |
| Date of reporting period: January 1, 2012 – December 31, 2012 |
Item 1. Reports to Shareholders.
|

ANNUAL
REVIEW AND REPORT
TO SHAREHOLDERS
SMALL-CAP DIVERSIFIED Royce Pennsylvania Mutual Fund Royce Low-Priced Stock Fund Royce Heritage Fund Royce Value Plus Fund FOCUSED Royce Premier Fund Royce Special Equity Fund Royce Value Fund Royce 100 Fund TOTAL RETURN Royce Total Return Fund Royce Dividend Value Fund MICRO-CAP Royce Micro-Cap Fund Royce Opportunity Fund GLOBAL/INTERNATIONAL Royce Global Value Fund Royce International Smaller-Companies Fund | ||
www.roycefunds.com |  | |
| Online Update |
| Visit www.roycefunds.com for Fund performance information, special messages and commentary from Co-CIOs Chuck Royce, Whitney George and other portfolio managers, news, literature and tools to help you better understand and compare our Funds. |

eDelivery Saves! Sign Up Now. eDelivery saves paper, time and fund expenses.1 Sign up now to view statements, prospectuses, financial reports and tax forms online. > www.roycefunds.com/edelivery 1 Any direct Royce Funds IRA investor who chooses eDelivery of prospectuses, financial reports, and RWord will be exempt from the $15 annual IRA maintenance fee. (We will continue to also waive the fee for investors with more than $20,000 invested in Royce IRAs at the time the fee is charged, and for new transfer and rollover accounts in their first year.) Stay Informed Follow us on Twitter, watch us on YouTube, subscribe to our RSS feed and sign up for our monthly eWord newsletter to stay up to date on the latest from The Royce Funds.  www.twitter.com/roycefunds www.twitter.com/roycefunds www.youtube.com/roycefunds www.youtube.com/roycefunds www.roycefunds.com/eword www.roycefunds.com/ewordFinancial Professionals Login to our Financial Professional website to access up-to-date research, insights and whitepapers including: What’s in a Name? How Small-Caps Have Evolved While the adoption of small-cap is now wide-spread, there remain differences in how the category is defined in the U.S. and abroad. Consider Micro-Caps: Why Now Might be a Good Time Low expectations, a history of strong, above-average returns, and solid near-term results may mean the start of something good for the underfollowed and underappreciated micro-cap asset class. > www.roycefunds.com/research Quarterly Advisor Materials Log into our Financial Professional site and manage your preferences to receive alerts about our: • Quarterly Review Book • Fund Impact and Attribution Reports • Longitudinal Studies • Fact Sheets > www.roycefunds.com/advisors |
| This page is not part of the 2012 Annual Report to Shareholders |
| Table of Contents | |
| Annual Review | |
| Royce Featured Fund Guide | 2 |
| Performance and Expenses | 4 |
| Portfolio Characteristics | 5 |
| Market Cycle and Risk Adjusted Performance | 6 |
| Letter to Our Shareholders | 7 |
| Fund Focus | 14 |
| 2012: In Quotes | 130 |
| Making Headlines | 131 |
| Postscript: The Lessons of 40 Years | 132 |
| Annual Report to Shareholders | 15 |
 | |
| This page is not part of the 2012 Annual Report to Shareholders | 1 |
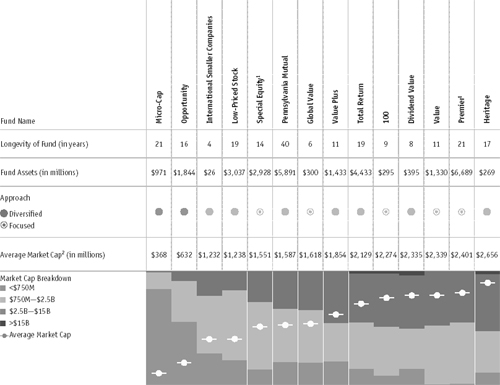
| Royce Featured Fund Guide |
| Value-Oriented Small-Cap Offerings Tailored to Specific Investor Needs |
| INVESTMENT UNIVERSE BREAKDOWN1 |
|

The size and diversity of the small-company universe make it a unique and fertile area for investment. For 40 years, it has been our primary area of focus. Over that time, this universe has evolved into an established asset class, used by a wide range of investors, including institutions, consultants, advisors, and individuals. Today, there are numerous small-cap and micro-cap indexes and ETFs. Importantly, the continuous regeneration of the asset class, through the entrance of new companies, spin-offs and IPOs, makes it an evergreen source of investment opportunities. This is why we have elected to focus on the smaller-company universe and believe it is ideally suited for a variety of distinct offerings. Our Featured Funds offer broad exposure to this large and diverse universe. Market Cap The smaller company universe consists of more than 4,1001 publicly traded companies in the U.S. (and more than 28,0001 outside the U.S.). We break it down into two distinct market segments: micro-cap—companies with market caps up to $750 million—and small-cap—companies with market caps between $750 million and $2.5 billion. Sorting the universe into two markets is critical because, in our experience, each requires a portfolio approach based primarily on diversification needs. Our portfolio managers share a common investment approach, one that emphasizes paying attention to risk and buying what each thinks are strong businesses at discounted prices, but our portfolios also possess important differences that make each one unique. Each portfolio falls within the small-cap universe, in terms of both constituent names and average market cap. Portfolio Approach Our portfolio managers possess broad latitude within our investment universe, though in general they seek a combination of quality—measured by the balance sheet and returns on invested capital—and valuation. Portfolios that invest more heavily in micro-caps are, in general, more broadly diversified due to liquidity considerations; those that invest primarily in the upper end of the small-cap universe tend to be more focused. In addition, we seek to take advantage of pockets of opportunity, such as dividend-paying companies, low-priced companies, turnarounds, special situations, etc., within each universe. Diversified Portfolios  A diversified portfolio at Royce is one that generally holds more than 100 securities and whose top positions generally do not exceed 2% of net assets. Focused Portfolios  A focused portfolio at Royce is one that either (i) generally invests in no more than 100 companies, and whose top positions generally exceed 2% of net assets, or (ii) invests primarily in a single sector. |
1 Reuters as of 12/31/12 |
| The Royce Funds invest primarily in micro-cap, small-cap and/or mid-cap stocks, which may involve considerably more risk than investing in larger-cap stocks (Please see “Primary Risks for Fund Investors” in the prospectus). Each Fund may invest a portion of its net assets in foreign securities, which may involve political, economic, currency, and other risks not encountered in U.S. investments (Please see “Investing in Foreign Securities” in the prospectus). Distributor: Royce Fund Services, Inc. |
| 2 | This page is not part of the 2012 Annual Report to Shareholders |
This guide is designed to help investors better understand both the different approaches and the common ground among our portfolios. Looking closely at our Featured Funds allows investors to see other important differences—in levels of volatility, sector orientation, and investment themes—within the context of our two key differentiators, namely, market cap and portfolio approach. We think that understanding these differences can inform asset allocation decisions, especially when investors incorporate more than one Royce offering within their portfolios. Listed below are our funds arranged by average market cap. For a complete listing of our Funds and their attributes please visit our website at www.roycefunds.com. |
| Fund Tools Go online for more tools to help you better understand our Funds. Compare Funds > www.roycefunds.com/compare Prices & Performance > www.roycefunds.com/prices |
 |
1 Only available to existing investors and relationships. |
2 Geometric Average. This weighted calculation uses each portfolio holding’s market cap in a way designed to not skew the effect of very large or small holdings; instead, it aims to better identify the portfolio’s center, which Royce believes offers a more accurate measure of average market cap than a simple mean or median. |
| This page is not part of the 2012 Annual Report to Shareholders | 3 |
| Performance and Expenses | Through December 31, 2012 |
| Average Annual Total Returns | ||||||||||||||||||||||||||||||
| Gross Annual | Net Annual | |||||||||||||||||||||||||||||
| 40-Year/Since | Inception | Operating | Operating | |||||||||||||||||||||||||||
| Fund | 1-Year | 5-Year | 10-Year | 20-Year | Inception | Date | Expenses | Expenses | ||||||||||||||||||||||
| SMALL-CAP | ||||||||||||||||||||||||||||||
| DIVERSIFIED | ||||||||||||||||||||||||||||||
| Royce Pennsylvania Mutual Fund | 14.58 | % | 3.86 | % | 10.46 | % | 10.23 | % | 11.79 | % | n.a. | 0.91 | % | 0.91 | % | |||||||||||||||
| Royce Low-Priced Stock Fund | 4.48 | 2.90 | 9.69 | n.a. | 11.58 | 12/15/93 | 1.58 | 1.51 | ||||||||||||||||||||||
| Royce Heritage Fund | 14.30 | 5.05 | 11.12 | n.a. | 13.34 | 12/27/95 | 1.50 | 1.50 | ||||||||||||||||||||||
| Royce Value Plus Fund | 15.25 | 0.69 | 12.78 | n.a. | 11.31 | 6/14/01 | 1.45 | 1.45 | ||||||||||||||||||||||
| FOCUSED | ||||||||||||||||||||||||||||||
| Royce Premier Fund | 11.45 | 5.95 | 12.57 | 11.81 | 12.00 | 12/31/91 | 1.09 | 1.09 | ||||||||||||||||||||||
| Royce Special Equity Fund | 15.36 | 7.34 | 9.37 | n.a. | 9.16 | 5/1/98 | 1.15 | 1.15 | ||||||||||||||||||||||
| Royce Value Fund | 9.56 | 3.83 | 13.23 | n.a. | 10.47 | 6/14/01 | 1.45 | 1.45 | ||||||||||||||||||||||
| Royce 100 Fund | 11.52 | 4.93 | n.a. | n.a. | 10.17 | 6/30/03 | 1.47 | 1.47 | ||||||||||||||||||||||
| TOTAL RETURN | ||||||||||||||||||||||||||||||
| Royce Total Return Fund | 14.42 | 3.83 | 8.87 | n.a. | 10.72 | 12/15/93 | 1.15 | 1.15 | ||||||||||||||||||||||
| Royce Dividend Value Fund | 16.95 | 6.51 | n.a. | n.a. | 8.28 | 5/3/04 | 1.50 | 1.50 | ||||||||||||||||||||||
| MICRO-CAP | ||||||||||||||||||||||||||||||
| Royce Micro-Cap Fund | 8.01 | 2.57 | 11.35 | 11.49 | 12.28 | 12/31/91 | 1.50 | 1.50 | ||||||||||||||||||||||
| Royce Opportunity Fund | 22.59 | 4.67 | 12.02 | n.a. | 12.22 | 11/19/96 | 1.17 | 1.17 | ||||||||||||||||||||||
| GLOBAL/ INTERNATIONAL | ||||||||||||||||||||||||||||||
| Royce Global Value Fund | 11.03 | 3.57 | n.a. | n.a. | 5.28 | 12/29/06 | 1.77 | 1.69 | ||||||||||||||||||||||
| Royce International | ||||||||||||||||||||||||||||||
| Smaller-Companies Fund | 19.39 | n.a. | n.a. | n.a. | 5.79 | 6/30/08 | 2.15 | 1.69 | ||||||||||||||||||||||
| INDEX | ||||||||||||||||||||||||||||||
| Russell 2000 Index | 16.35 | 3.56 | 9.72 | 8.43 | n.a. | n.a. | n.a. | n.a. | ||||||||||||||||||||||
| Russell Microcap Index | 19.75 | 1.46 | 8.42 | n.a. | n.a. | n.a. | n.a. | n.a. | ||||||||||||||||||||||
| Russell Global Small Cap Index | 17.75 | 0.19 | 11.54 | n.a. | n.a. | n.a. | n.a. | n.a. | ||||||||||||||||||||||
| Russell Global ex-U.S. Small Cap Index | 18.84 | -1.19 | 13.16 | n.a. | n.a. | n.a. | n.a. | n.a. | ||||||||||||||||||||||
| 1 Not annualized | ||||||||||||||||||||||||||||||
Important Performance, Expense, and Risk Information
All performance information in this Review and Report reflects past performance, is presented on a total return basis, reflects the reinvestment of distributions, and does not reflect the deduction of taxes a shareholder would pay on fund distributions or the redemption of fund shares. Past performance is no guarantee of future results. Investment return and principal value of an investment will fluctuate, so that shares may be worth more or less than their original cost when redeemed. Shares redeemed within 180 days of purchase may be subject to a 1% redemption fee payable to the Fund. Redemption fees are not reflected in the performance shown above; if they were, performance would be lower. Current performance may be higher or lower than performance quoted. Current month-end performance may be obtained at www.roycefunds.com. All performance and expense information reflects results of the Fund’s oldest share Class (Investment Class or Service Class, as the case may be). Price and total return information is based on net asset values calculated for shareholder transactions. Gross annual operating expenses, reflect the Fund’s gross total annual operating expenses and include management fees, any 12b-1 distribution and service fees, other expenses, and any applicable acquired fund fees and expenses. Net annual operating expenses reflect contractual fee waivers and/or reimbursements. All expense information is reported as of the Fund’s most current prospectus. Royce & Associates has contractually agreed to waive fees and/or reimburse operating expenses, other than acquired fund fees and expenses, if any, to the extent necessary to maintain net operating expenses at or below: 1.49% for Royce Low-Priced Stock Fund; 1.69% for Royce Global Value and International Smaller-Companies Funds through April 30, 2013; and at or below 1.99% for Royce Global Value and International Smaller-Companies Funds through April 30, 2022. Acquired fund fees and expenses reflect the estimated amount of fees and expenses incurred indirectly by the Fund through its investments in mutual funds, hedge funds, private equity funds, and other investment companies. Shares of the Funds’ Service, Consultant, R, and K Classes bear an annual distribution expense that is not borne by the Funds’ Investment Class. Investments in securities of micro-cap, small-cap and/or mid-cap companies may involve considerably more risk than investments in securities of larger-cap companies. (Please see “Primary Risks for Fund Investors” in the prospectus.) Royce Global Value and International Smaller-Companies Funds invest a significant portion of their respective assets in foreign companies which may be subject to different risks than investments in securities of U.S. companies, including adverse political, social, economic, or other developments that are unique to a particular country or region. (Please see “Investing in foreign securities” in the prospectus.) Therefore, the prices of securities of foreign companies, in particular countries or regions may, at times, move in a different direction than those of securities of U.S. companies. (Please see “Primary Risk of Fund Investors” in the prospectus.) Please read the prospectus carefully before investing or sending money. Russell Investment Group is the source and owner of the trademarks, service marks and copyrights related to the Russell Indexes. Russell® is a trademark of Russell Investment Group. The Russell 2000 Index is an unmanaged, capitalization-weighted index of domestic small-cap stocks. It measures the performance of the 2,000 smallest publicly traded U.S. companies in the Russell 3000 Index. The Russell Microcap Index includes 1,000 of the smallest securities in the Russell 2000 Index, along with the next smallest eligible securities as determined by Russell. The Russell Global Small Cap Index is an index of global small-cap stocks. The Russell Global ex-U.S. Small Cap Index is an index of global small-cap stocks, excluding the United States. Distributor: Royce Fund Services, Inc. |
| 4 | This page is not part of the 2012 Annual Report to Shareholders |
| Portfolio Characteristics | As of December 31, 2012 |
| Longevity | Average of | % of | ||||||||||||||||||||
| of Fund | Portfolio | Fund Assets | Market Cap | Annualized | Non-U.S. | Portfolio | ||||||||||||||||
| Fund | (in years) | Approach | (in millions) | Breakdown | Five-Year Returns1 | Securities | Volatility2 | |||||||||||||||
| SMALL-CAP | ||||||||||||||||||||||
| DIVERSIFIED | ||||||||||||||||||||||
| Royce Pennsylvania Mutual Fund | 40 | | $5,891 |  | 9.5 | % | 8.0 | % | Moderate | |||||||||||||
| Royce Low-Priced Stock Fund | 19 | | 3,037 |  | 10.3 | 34.1 | Higher | |||||||||||||||
| Royce Heritage Fund | 17 | | 269 |  | 9.9 | 24.7 | Higher | |||||||||||||||
| Royce Value Plus Fund | 11 | | 1,433 |  | 9.2 | 13.4 | Higher | |||||||||||||||
| FOCUSED | ||||||||||||||||||||||
| Royce Premier Fund | 21 | | 6,689 |  | 11.3 | 13.6 | Lower | |||||||||||||||
| Royce Special Equity Fund | 14 | | 2,928 |  | 10.3 | 0.0 | Lower | |||||||||||||||
| Royce Value Fund | 11 | | 1,330 |  | 10.4 | 17.7 | Higher | |||||||||||||||
| Royce 100 Fund | 9 | | 295 |  | 6.2 | 10.5 | Higher | |||||||||||||||
| TOTAL RETURN | ||||||||||||||||||||||
| Royce Total Return Fund | 19 | | 4,433 |  | 8.3 | 10.2 | Lower | |||||||||||||||
| Royce Dividend Value Fund | 8 | | 395 |  | 5.0 | 21.1 | Lower | |||||||||||||||
| MICRO-CAP | ||||||||||||||||||||||
| Royce Micro-Cap Fund | 21 | | 971 |  | 10.9 | 33.7 | Moderate | |||||||||||||||
| Royce Opportunity Fund | 16 | | 1,844 |  | 10.2 | 2.8 | Higher | |||||||||||||||
| GLOBAL/ INTERNATIONAL | ||||||||||||||||||||||
| Royce Global Value Fund | 6 | | 300 |  | 3.3 | 77.9 | Higher | |||||||||||||||
| Royce International Smaller-Companies Fund | 4 | | 26 |  | n.a. | 97.1 | Lower | |||||||||||||||
| 1 | The Fund’s average of annualized five-year returns is an average of monthly rolling five-year periods and is calculated over the trailing 120 (10 years) five-year periods for all Funds with 10 years of history. For those Funds that do not have 10 years of history, all monthly rolling five-year return periods are included since the Fund’s inception. |
| 2 | Each Fund’s volatility is measured using Morningstar’s Risk Ratio, which measures variations in a fund’s monthly returns, with an emphasis on downside performance. Each Royce Fund’s overall Risk Ratio is a weighted combination of its three-, five- and 10-year scores, if applicable. Except as noted below, each Fund’s results reflect its score compared with all small-cap objective funds tracked by Morningstar with at least three years of history (374 funds as of 12/31/12). For Royce Global Value Fund, included are all world stock funds with weighted average market-caps of less than $5 billion tracked by Morningstar with at least three years of history (24 funds as of 12/31/12). For Royce International Smaller-Companies Fund, included are all foreign small/mid growth and value stock funds tracked by Morningstar with at least three years of history (65 funds as of 12/31/12). We consider funds whose results rank in the top third of the category to have relatively lower volatility; those in the middle third to have moderate volatility; and those in the bottom third to have higher volatility. |
| Market Cap Breakdown key: n <$750M n $750M–$2.5B n $2.5B–$15B n >$15B Diversified Focused |
| This page is not part of the 2012 Annual Report to Shareholders | 5 |
| Market Cycle and Risk Adjusted Performance |
We believe strongly in the idea that a long-term investment perspective is crucial for determining the success of a particular investment approach. While flourishing in an up market is wonderful, surviving a bear market by losing less (or not at all) is at least as good. However, the true test of a portfolio’s mettle is performance over full market cycle periods, which include both an up and down market period. |
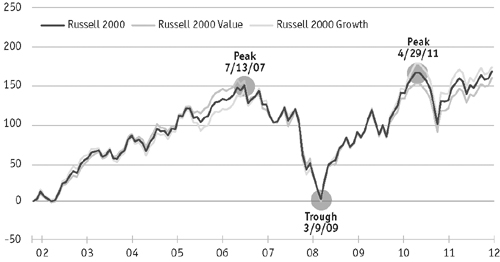
| Since the inception of the Russell 2000’s index on 12/31/78, there have been 10 full market cycles, with the most recent peaking on 4/29/11. Market cycles are defined as those that have retreated at least 15% from a previous market peak and have rebounded to establish a new peak above the previous one. Each market cycle contains a peak-to-trough and a trough-to-peak period. Interestingly, over the small-cap index’s 30+ year history, each style index—the Russell 2000 Value Index and the Russell 2000 Growth Index—outperformed in five of the 10 full market cycles. In fact, leadership has alternated between growth and value over the last six cycles. If history were to adhere to this pattern, value would lead in the current cycle that began on 4/29/11. |
RISK / RETURN PROFILE 10-YEAR PERIOD ENDED DECEMBER 31, 2012 |
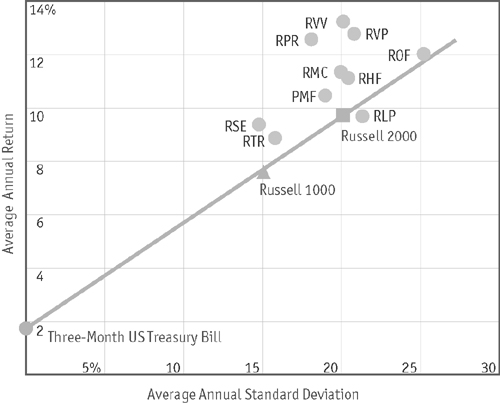 |
| n | For the 10-year period ended 12/31/12, seven out of 10 Royce Funds with 10 years of history outperformed the Russell 2000, while nine of the 10 did so with better risk-adjusted returns and Sharpe ratios. | |
| n | In addition, for the 10-year period ended 12/31/12, three of the 10 Royce Funds outperformed the Russell 2000 with lower volatility. |
SMALL-CAP MARKET CYCLE: RUSSELL 2000 INDEXES TOTAL RETURNS |
 |
| ROYCE U.S. EQUITY FUNDS VS. RUSSELL 2000 INDEX: | ||||||||||||
| MARKET CYCLE RESULTS | ||||||||||||
| Peak-to- | Peak-to- | Peak-to- | ||||||||||
| Peak | Peak | Current | ||||||||||
| 3/9/00– | 7/13/07– | 4/29/11 | ||||||||||
| Fund | 7/13/07 | 4/29/11 | 12/31/12 | |||||||||
| SMALL-CAP | ||||||||||||
| DIVERSIFIED | ||||||||||||
| Royce Pennsylvania Mutual Fund | 207.1 | % | 11.6 | % | -1.6 | % | ||||||
| Royce Low-Priced Stock Fund | 198.9 | 27.2 | -18.2 | |||||||||
| Royce Heritage Fund | 150.4 | 25.3 | -6.2 | |||||||||
| Royce Value Plus Fund | n.a. | -3.0 | -5.4 | |||||||||
| FOCUSED | ||||||||||||
| Royce Premier Fund | 198.1 | 29.9 | -2.0 | |||||||||
| Royce Special Equity Fund | 227.4 | 20.8 | 7.6 | |||||||||
| Royce Value Fund | n.a. | 17.4 | -9.3 | |||||||||
| Royce 100 Fund | n.a. | 27.6 | -5.5 | |||||||||
| TOTAL RETURN | ||||||||||||
| Royce Total Return Fund | 193.9 | 6.8 | 3.6 | |||||||||
| Royce Dividend Value Fund | n.a. | 21.6 | 3.1 | |||||||||
| MICRO-CAP | ||||||||||||
| Royce Micro-Cap Fund | 197.4 | 24.9 | -13.6 | |||||||||
| Royce Opportunity Fund | 191.8 | 6.9 | -1.1 | |||||||||
| INDEX | ||||||||||||
| Russell 2000 | 54.8 | 6.6 | 0.6 | |||||||||
| Russell 2000 Value | 189.4 | -1.4 | 3.0 | |||||||||
| Russell 2000 Growth | -14.8 | 14.3 | -1.7 | |||||||||
| All performance information above reflects past performance, is presented on a total return basis, reflects the reinvestment of distributions, and does not reflect the deduction of taxes that a shareholder would pay on fund distributions or the redemption of fund shares. Past performance is no guarantee of future results. Investment return and principal value of an investment will fluctuate, so that shares may be worth more or less than their original cost when redeemed. Current performance may be higher or lower than performance quoted. |
| 6 | This page is not part of the 2012 Annual Report to Shareholders |
| Letter to Our Shareholders |
 |
Men can do nothing without the make-believe of a beginning. |
See a Little Light | ||
When seeing out one year and ushering in another, it is important to remember that the calendar, useful though it may be, provides only one way of tracking time. Some people, for example, choose to look to spring for a new beginning, while others, more habituated to the rhythms of the school year, prefer the arrival of fall. The stock market, in all its caprice and unpredictability, most often eschews 12-month spans in favor of its own irregularly paced seasons. So we find ourselves, as we look back on 2012 and peer ahead to 2013, at one of those curious, familiar junctures when the calendar compels a shift that the market seems to have anticipated months before. From our perspective as active small-cap managers, the recent market cycle change was something of a watershed. In fact, it seems very likely to us that the 2012 small-cap low on June 4 signaled the end of the closely correlated, range-bound cycle of the last few years, a cycle that created ample disappointments for those of us committed to high quality, risk management, and long-term absolute returns. It is not yet clear that this June low will prove as auspicious as it looks to us at this writing. Suffice it to say that major market inflection points seldom do any of us the favor of announcing their arrival. | From our perspective as active small- cap managers, the recent market cycle change was something of a watershed. In fact, it seems very likely to us that the 2012 small-cap low on June 4 signaled the end of the closely correlated, range- bound cycle of the last few years, a cycle that created ample disappointments for those of us committed to high quality, risk management, and long-term absolute returns. |
| This page is not part of the 2012 Annual Report to Shareholders | 7 |
 Charles M. Royce, President One of the most interesting recent developments in the equity markets, particularly in the small-cap space, has been the persistent disparity in performance between high- and low-quality companies. Over longer periods of time, higher-quality companies have differentiated themselves from a performance standpoint, especially compared to the lower quality segments of the market. While the aftermath of the financial crisis altered this script, there are signs that the dynamic is changing. Historically, lower-quality companies have tended to demonstrate their most robust outperformance when markets are in the initial recovery phase following a recession or bear market low. However, once economies and markets move from recovery to expansion, the rate of change in these inputs begins to slow while leadership tends to rotate back to higher- quality companies, whose business fundamentals are more compelling. Continued on page 10... | Letter to Our Shareholders It is equally important to emphasize that our new-found sanguine attitude is contingent on seeing in 2013 more of what we saw in the second half of 2012, particularly in last year’s closing months. During this period, investors were looking more closely at companies that possess sustainable quality in the form of strong balance sheets, high returns on invested capital, steady earnings, and reasonable dividends while paying a bit less attention to high-yield instruments, copiously leveraged stocks, and explosive growth surprises. We want to stress the extremely cautious nature of our optimism. The resurgence of quality off the June low was not decisive and has been thus far short lived. However, in our view, it did mark a subtle and significant shift that grew more pronounced in the fourth quarter, most notably in October and November when share prices went wobbly from the impact of Hurricane Sandy and the aftermath of the elections, which included periods of recurrent anxiety over the then-looming fiscal cliff. Quality shone through in this more uncertain period. Throughout most of our first 35 years of managing portfolios, this resilience would have been unexceptional, and hardly worth mentioning, because quality companies have historically defended well. However, since the spring of 2010—and even more dramatically since the April 2011 small-cap high—little of what worked historically has enjoyed success. This has made the last five years—the last three particularly—among the most frustrating periods of our 40 years in business. With retrospective clarity, perhaps we should have suspected that something was amiss, or at least historically aberrant, when stocks rebounded so quickly and dynamically from the March 2009 bottom. Considering that the recession which began in 2007 was made far worse by the global financial crisis in the fall of 2008, the market’s surge may have been too much too soon, welcome though it was. In any event, investors soon became more than a little wary, shuffling in and out of stocks with little regard for business fundamentals and too much for macro headlines, nearly all of them negative. Unable to establish any clear direction, the market sputtered as it rose and wheezed as it stumbled. It often seemed as though many of the investors who were frantically shoving money in and pulling it out again weeks, days, or hours later were the same people decrying the mercurial nature of asset prices and questioning whether equities were any longer a viable investment option. Along the way, results for passive investment approaches began to outpace those of an ever-larger number of active managers. So it is with a large measure of relief that we bid a tentative and hopeful good-bye to all that as we look ahead to better, more stable days. The Wall of Worry An old adage has it that “the market climbs a wall of worry” during those times when stocks behave bullishly in the face of negative news or perceptions. It seems clear to us that in 2012, the market scaled just such a wall. Consider the following: For the most part, the bearish second quarter eroded, but did not undo, the gains achieved in the first. | ||
| 8 | This page is not part of the 2012 Annual Report to Shareholders |
The year’s final six months found many investors still behaving coolly toward equities and a host of large-scale economic and fiscal issues yet to be fully worked through. As the year closed, a fiscal cliff deal had yet to be reached, various European nations continued to flirt with financial peril, and China was still growing at a slower pace than in previous boom years. In addition, there was a typically contentious presidential election preceded by a disastrous hurricane that swept through the world’s financial capital. Yet the market ultimately shrugged off most of these concerns. | ||||
| Share prices did not skyrocket following the June 4 small-cap low. July, in fact, saw a downturn for most stocks. But August and September were highly rewarding months that enabled equities to rally decisively enough to post impressive third-quarter results. For the quarter, the small-cap Russell 2000 Index gained 5.3% while the large-cap S&P 500 and Russell 1000 Indexes were up 6.4% and 6.3%, respectively, and the more tech-oriented Nasdaq Composite climbed 6.2%. Following the strong third quarter, equities took a bit of a breather in October, before rallying again in November and December, which repeated to some degree the third quarter’s pattern, though with far more modest or slightly negative results. For the fourth quarter, the Russell 2000 was up 1.9%, the Russell 1000 rose 0.1%, the S&P 500 was off 0.4%, and the Nasdaq Composite fell 3.1%. | ||||
The end result was a strong calendar year, especially compared to 2011, with each major equity index posting double-digit returns. In 2012, the Russell 2000 gained 16.3%, the S&P 500 rose 16.0%, the Russell 1000 was up 16.4%, and the Nasdaq Composite increased 15.9%. Three-year returns for the major indexes were also strong, with each again posting double-digit average annual total returns. For the three-year period ended December 31, 2012, the Russell 2000 led with a gain of 12.2%. The Russell 2000, Russell 1000, and S&P 500 each finished the year within 2.5% of their respective highs established during 2012’s third quarter, while the Nasdaq Composite remained 40.2% below its peak from March 10, 2000. Non-U.S. equities also enjoyed a strong second half after starting the year with generally lower gains when stacked against their domestic cousins. The Russell Global ex-U.S. Small Cap Index climbed 8.3% in the third quarter, while the Russell Global ex-U.S. Large Cap Index rose 7.7%. In contrast to the domestic indexes, these strong third-quarter performances were followed by consistently positive results in the fourth quarter. The Russell Global ex-U.S. Small Cap Index was up 4.8% versus a gain of 5.8% for the Russell Global ex-U.S. Large Cap Index. For the full year small-caps were the leaders, with the Russell Global ex-U.S. Small Cap Index gaining 18.8% while the Russell Global ex-U.S. Large Cap Index was up 17.0%. So while the perception persists that non-U.S. markets are a mess—a perception based on the uncertain debt and currency situations in Europe and slower-than-desired growth in developing countries—the reality is that stocks across the globe finished the year with highly attractive results. | An old adage has it that “the market climbs a wall of worry” during those times when stocks behave bullishly in the face of negative news or perceptions. It seems clear to us that in 2012 the market scaled just such a wall. | |||
| This page is not part of the 2012 Annual Report to Shareholders | 9 |
However, the four rounds of QE have created an extended tailwind for low-quality companies. Highly levered businesses—a low-quality attribute from our standpoint—have benefited from the sharp drop in the cost of capital that has accompanied the Fed’s bond buying programs. Access to capital has simultaneously improved, allowing weaker companies to stave off potential financing challenges. This is particularly relevant in the smaller company space where financing is often tenuous. Interestingly, companies with large net cash positions have also lagged as that cash has been viewed as an unproductive asset that generates little or no return, even though it provides a healthy margin of safety and is often the result of profitability. Even allowing for strong second-half results, high-quality small-caps look highly attractive to us relative to both their lower-quality counterparts and their high-quality peers in the large-cap space. The drop in market volatility back to pre-crisis levels, as measured by the VIX, has contributed to the relative strength of low-quality companies. Investors’ appetite for riskier assets tends to correlate with sharp moves—both up and down—in volatility. As the more violent swings in the market dissipated, investors were increasingly willing to embrace the added risk associated with lower quality enterprises. Continued on page 12... | |||
| Letter to Our Shareholders | ||
| Shifting back stateside finds that micro-cap stocks enjoyed a very strong year. After finishing the first half with an enviable 13.0% return, the Russell Microcap Index climbed 5.9% in the third quarter and was essentially flat in the fourth, up 0.04%, which gave the index a 19.7% increase in 2012. Mid-cap stocks also experienced robust results for the calendar year—the Russell Midcap Index was up 17.3% in 2012. | ||
Good-Bye to All That (We Hope) With three notable exceptions, calendar-year results for The Royce Funds in this Annual Review and Report fell short of our expectations on a relative basis (well short in some cases), even as almost all of the portfolios finished the year with both solid second-half performances and more-than-respectable absolute returns. This was most notably the case for our more focused portfolios, which drew the greatest benefit from the market’s suddenly renewed affection for quality characteristics. Results as a whole therefore left us frustrated yet hopeful, for the reasons outlined above. We have previously discussed the reasons for recent performance disappointments, but they are worth recapping for what we would like to think will be the last time, at least for a while. Beginning with 2007’s recession and moving through the global financial crisis into the early days of June 2012, the markets were highly volatile, closely correlated, and frequently disappointing. This pattern could first be seen emerging in the spring of 2010 and was cast in harder material by the small-cap high on April 29, 2011. So while the one- and three-year numbers for the major domestic indexes were strong through the end of 2012, investors continue to be leery of the market, most probably owing to its lack of a sustainable course, bullish or bearish, especially in the roughly 13-month period between the April 2011 high and the 2012 low in early June. More importantly, this cycle of high correlation proved very difficult for certain Royce-managed portfolios. Throughout this time, we remained patient and disciplined, resolutely searching for companies that met our standards for quality and attractive valuation while investors grew more interested in other matters. On the one hand, they sought safety in fixed income instruments, utilities, or high-yielding vehicles such as REITs and MLPs; on the other hand they looked for fast, dramatic growth, which most often came from highly leveraged companies in which we take no interest. For our part, we continued to see many companies across several sector and industry groups that answered to our preferred combination of quality and value. However, many of the largest company, industry, and/or sector weightings in some portfolios have fared poorest, including those in the Energy, Materials, and Information Technology sectors. While all of this has been frustrating, none of it has changed the way in which we invest or construct portfolios. As we said in our Semiannual Review and Report, patience and discipline are not virtues to which we pay lip service. Our investment horizon will remain squarely focused on the long term, as it has for 40 years. | ||
| 10 | This page is not part of the 2012 Annual Report to Shareholders |
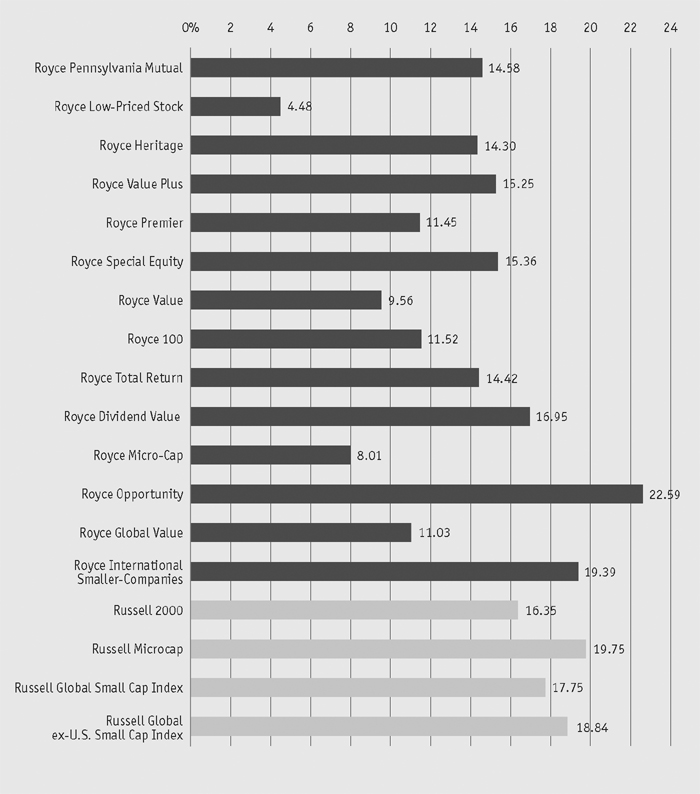
| 2012 TOTAL RETURNS FOR THE ROYCE FUNDS VS. BENCHMARK INDEXES As of 12/31/12 | ||
 | ||
New Cycle, New Balance The recent era of low rates and ample liquidity has not changed our view of the importance of strong balance sheets, high returns on invested capital, cash flow, or dividends. Many small-cap companies that possess any number of these characteristics underperformed the Russell 2000 in 2010, 2011, and the first half of 2012, which definitely hampered the effectiveness of our disciplined approach. This can be seen in many of the Funds’ one-, three-, and even five-year results in some cases, through the end of 2012. We did not enjoy watching so many portfolio favorites languish. But not once did we consider changing our core principles. We knew that we were in a highly anomalous market, one that we may not see again for more than a generation. So we stayed patient and consistent while we waited for the cycle to shift. Our contention is that quality stocks underperformed through much of the recent cycle of correlation owing to both the zero-interest-rate policies that the Fed has implemented over the last few years and the related rounds of quantitative easing. | We did not enjoy watching so many portfolio favorites languish. But not once did we consider changing our core principles. We knew that we were in a highly anomalous market, one that we may not see again for more than a generation. So we stayed patient and consistent while we waited for the cycle to shift. |
| This page is not part of the 2012 Annual Report to Shareholders | 11 |
The current preference for passive strategies and ETFs at the expense of active management has also played a role. Within small-cap, active managers, especially those with a long-term orientation, tend to have a quality bias in their portfolios, while passive index vehicles, especially those meant to replicate the Russell 2000, have no bias other than market cap and therefore have a higher weighting in lower-quality companies. Persistent redemptions of actively managed funds combined with modest inflows to ETFs have further distorted the low quality/high performance differential. The key question, then, is when will this change? It is our view that it may already have begun. Interest rates, while at historic lows, cannot fall much lower. In fact, each successive round of quantitative easing is exerting less and less pressure on rates while at the same time raising the specter of increased inflation down the road. While liquidity should remain abundant, the rate of change in the cost of capital has clearly peaked. By the same token, the rate of decline in market volatility has significantly slowed with the VIX now back to its long-run averages. And while the global economy continues to grow, GDP statistics are anything but robust. Low-quality companies have had an extended moment in the sun, but it is our strong belief that we are entering a new era for quality. | Letter to Our Shareholders  With interest rates so low, companies were finding it very easy to restructure debt or take on more of it. The price companies were paying to do so was miniscule, so investors acted accordingly by rewarding a number of fast-growing, highly leveraged businesses while often ignoring those with strong balance sheets. In an environment where the cost of debt has been virtually nil, low-debt companies lost their traditional advantage. (Our Sidebar piece provides some more details.) However, we also suspect that we have reached a stage where this advantage is diminishing because rates have been historically low for a few years now and monetary stimulus no longer has the same dramatic impact it had with the first two or three rounds of quantitative easing. In addition to their stalwart second-half returns, we think this is a good sign for high-quality small-cap stocks. A Quality Cycle? As correlation continues to abate, we expect to see more opportunities for quality stocks to flourish. This is ultimately why we were not surprised by the market’s strength in the second half, even with ample ongoing uncertainty. We feel confident that the market has entered a cycle in which stock picking matters. Our optimism, cautious as it is, is bolstered by the fact that in the years ahead earnings growth can accelerate for small caps and should be robust as the economy continues to improve. While many companies are hesitant about capital expenditures, those issues have more to do with timing. That is, businesses were not willing to start spending until the President and Congress struck a deal. Yet our meetings with management teams have convinced us that there is no question about their willingness to invest. | ||||||
| 12 | This page is not part of the 2012 Annual Report to Shareholders |
In this context, it is worth mentioning that the tax and stimulus deal that was struck early in January still left important matters such as infrastructure spending, entitlements, and the next debt ceiling increase unresolved. So there will be opportunities for political intransigence to potentially affect the markets in 2013, and it will be interesting to see how investors respond to additional rounds of fiscal gridlock. Our thought is that greater levels of attention to business fundamentals will remain high. We believe that equities will continue their positive performance into 2013, that quality-oriented companies and active management approaches, especially within the small-cap universe, will continue their resurgence, and that non-U.S. small-caps will continue to surprise on the upside. We are very happy to say that it looks like a new, more historically typical cycle has begun. Sincerely, | We feel confident that the market has entered a cycle in which stock picking matters. Our optimism, cautious as it is, is bolstered by the fact that in the years ahead earnings growth can accelerate for small caps and should be robust as the economy continues to improve. | |||||
 |  |  | ||||
| Charles M. Royce | W. Whitney George | Jack E. Fockler, Jr. | ||||
| President | Vice President | Vice President | ||||
| January 31, 2013 | ||||||
| This page is not part of the 2012 Annual Report to Shareholders | 13 |
| Fund Focus |
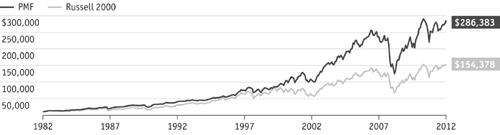
In a world often captivated by short-term results, the long term for many may be measured in months, not years, and certainly not 40 years. And while other mutual funds have been in existence since 1972—the year Chuck Royce began to manage Royce Pennsylvania Mutual Fund (PMF)—very few are still helmed by the same manager or continue to employ the same investment philosophy. We take what we hope is an understandable amount of pride in a mutual fund that has a long-term record that few others can match.
Not long after Chuck first took up the reins as PMF’s portfolio manager in November 1972, his singular approach began to take shape. His eventual focus on small-caps was based on two factors: the asset class offered plentiful opportunities and most institutions were unwilling to devote substantial resources to the more labor-intensive research process small-cap investing required. At the same time the bear market of 1973-4 convinced Chuck that preserving capital was as crucial as building it. He began to forge an approach based on balance sheet strength and compelling valuations while seeking out companies for PMF’s portfolio that were often unrecognized by most (if not all) of Wall Street or were poorly understood by other investors.
As we refined our approach over the years, we saw the Fund’s long-term results reflecting what we believe are two critical competitive advantages—our organizational depth and our investment approach. In most asset management organizations, smaller-company investing occupies a small place on a much larger menu of offerings. However, at Royce smaller-company investing has been our focus for 40 years. This wealth of experience has seen us through almost every conceivable kind of market, proving especially valuable in trying times.
Many smaller-company managers focus on the return side of the risk/return equation, yet we devote equal if not greater attention to risk. We focus on risk at multiple levels—e.g., corporate, market, industry, price—in an attempt to provide more consistent, long-term results. Managing risk is crucial because failing to do so can erode, or even destroy, returns. In our opinion, preserving capital during downturns is of equal importance to success in upswings.
Another important element in the approach is our long-term investment time horizon. In a world fixated on quarterly, monthly, and even daily performance, being able to look beyond short-term difficulties and invest for the coming three to five years remains critical to our efforts.
We stick to our discipline, regardless of market movements and trends. Indeed, we are always surprised by how many asset management organizations do not employ a consistent investment approach and are dismayed by those who do, only to discard it for something else when the market goes against them. By contrast, we consistently look for what we believe are high-quality smaller companies trading at attractive discounts to our estimate of their worth as a business. These core principles have successfully guided our firm through many markets, both bearish and bullish.
As we look back, we remain proud of Royce Pennsylvania Mutual Fund’s long-term performance history—and not simply because of its strong absolute and relative results. The relatively lower volatility of PMF’s returns over long-term periods, which includes three- to 40-year time spans, is another element in which we take great pride (see the table below). Finally, an important hallmark of the Fund’s long-term historical performance has been its ability to better weather down market periods, something that goes directly toward meeting our goal of capital preservation and achieving strong long-term, risk-adjusted returns (see page 6 for the Fund’s market cycle results.)
| Royce Pennsylvania Mutual Fund vs the Russell 2000: Performance and Expense Information | Through December 31, 2012 | |||||||||||||||||||||||||||||||||||||||||||||
| Average Annual Total Returns | Net | |||||||||||||||||||||||||||||||||||||||||||||
| Operating | ||||||||||||||||||||||||||||||||||||||||||||||
| One-Year | Three-Year | Five-Year | 10-Year | 15-Year | 20-Year | 25-Year | 30-Year | 35-Year | 40-Year | Expenses | ||||||||||||||||||||||||||||||||||||
| Royce Pennsylvania Mutual Fund | 14.58 | % | 10.79 | % | 3.86 | % | 10.46 | % | 9.30 | % | 10.23 | % | 11.08 | % | 11.83 | % | 13.18 | % | 11.79 | % | 0.91 | % | ||||||||||||||||||||||||
| Russell 2000 | 16.35 | 12.25 | 3.56 | 9.72 | 5.89 | 8.43 | 9.74 | 9.55 | n.a. | n.a. | n.a. | |||||||||||||||||||||||||||||||||||
Important Performance, Expense, and Risk Information
All performance information is for the Fund’s Investment Class, reflects past performance, is presented on a total return basis, reflects the reinvestment of distributions, and does not reflect the deduction of taxes that a shareholder would pay on fund distributions or the redemption of fund shares. Past performance is no guarantee of future results. Investment return and principal value of an investment will fluctuate, so that shares may be worth more or less than their original cost when redeemed. Shares redeemed within 180 days of purchase may be subject to a 1% redemption fee, payable to the Fund, which is not reflected in the performance shown above; if it were, performance would be lower. Current performance may be higher or lower than performance quoted. Current month-end performance information may be obtained at www.roycefunds.com. Operating expenses reflect the Fund’s total annual operating expenses for the Investment Class as of the Fund’s most current prospectus and include management fees, other expenses, and acquired fund fees and expenses. Acquired fund fees and expenses reflect the estimated amount of the fees and expenses incurred indirectly by the Fund through its investments in mutual funds, hedge funds, private equity funds and other investment companies. Shares of PMF’s Service, Consultant, R, and K Classes bear an annual distribution expense that is not borne by the Investment Class.
The Fund invests primarily in small-cap and micro-cap stocks, which may involve considerably more risk than investing in larger-cap stocks. (Please see “Primary Risks for Fund Investors” in the prospectus.) Russell Investment Group is the source and owner of the trademarks, service marks and copyrights related to the Russell Indexes. Russell® is a trademark of Russell Investment Group. The Russell 2000 Index is an unmanaged, capitalization-weighted index of domestic small-cap stocks. It measures the performance of the 2,000 smallest publicly traded U.S. companies in the Russell 3000 Index. Distributor: Royce Fund Services, Inc.
| 14 | This page is not part of the 2012 Annual Report to Shareholders |
| Table of Contents | ||
| Annual Report to Shareholders | ||
| Managers’ Discussions of Fund Performance | ||
| SMALL-CAP | ||
| DIVERSIFIED | ||
| Royce Pennsylvania Mutual Fund | 16 | |
| Royce Low-Priced Stock Fund | 18 | |
| Royce Heritage Fund | 20 | |
| Royce Value Plus Fund | 22 | |
| FOCUSED | ||
| Royce Premier Fund | 24 | |
| Royce Special Equity Fund | 26 | |
| Royce Value Fund | 28 | |
| Royce 100 Fund | 30 | |
| TOTAL RETURN | ||
| Royce Total Return Fund | 32 | |
| Royce Dividend Value Fund | 34 | |
| . | ||
| MICRO-CAP | ||
| Royce Micro-Cap Fund | 36 | |
| Royce Opportunity Fund | 38 | |
| GLOBAL/INTERNATIONAL | ||
| Royce Global Value Fund | 40 | |
| Royce International Smaller-Companies Fund | 42 | |
| Schedules of Investments and Financial Statements | 44 | |
| Notes to Financial Statements | 110 | |
| Report of Independent Registered Public Accounting Firm | 124 | |
| Understanding Your Fund’s Expenses | 125 | |
| Trustees and Officers | 128 | |
| Notes to Performance and Other Important Information | 129 | |
| The Royce Funds 2012 Annual Report to Shareholders | 15 |
| Royce Pennsylvania Mutual Fund |
AVERAGE ANNUAL TOTAL RETURNS Through 12/31/12 | |||||||||||
| July-December 20121 | 10.17 | % | |||||||||
| One-Year | 14.58 | ||||||||||
| Three-Year | 10.79 | ||||||||||
| Five-Year | 3.86 | ||||||||||
| 10-Year | 10.46 | ||||||||||
| 15-Year | 9.30 | ||||||||||
| 20-Year | 10.23 | ||||||||||
| 25-Year | 11.08 | ||||||||||
| 30-Year | 11.83 | ||||||||||
| 35-Year | 13.18 | ||||||||||
| 40-Year | 11.79 | ||||||||||
| ANNUAL EXPENSE RATIO | |||||||||||
| Operating Expenses | 0.91 | % | |||||||||
| 1 Not annualized | |||||||||||
| CALENDAR YEAR TOTAL RETURNS | |||||||||||
| Year | PMF | Year | PMF | ||||||||
| 2012 | 14.6 | % | 2004 | 20.2 | % | ||||||
| 2011 | -4.2 | 2003 | 40.3 | ||||||||
| 2010 | 23.9 | 2002 | -9.2 | ||||||||
| 2009 | 36.3 | 2001 | 18.4 | ||||||||
| 2008 | -34.8 | 2000 | 18.3 | ||||||||
| 2007 | 2.8 | 1999 | 6.0 | ||||||||
| 2006 | 14.8 | 1998 | 4.2 | ||||||||
| 2005 | 12.5 | 1997 | 25.0 | ||||||||
| TOP 10 POSITIONS % of Net Assets | |||||||||||
| Kennametal | 1.2 | % | |||||||||
| Oil States International | 1.2 | ||||||||||
| Advisory Board (The) | 1.0 | ||||||||||
| Helmerich & Payne | 0.9 | ||||||||||
| Lincoln Electric Holdings | 0.9 | ||||||||||
| HEICO Corporation | 0.8 | ||||||||||
| IPG Photonics | 0.8 | ||||||||||
| Unit Corporation | 0.8 | ||||||||||
| Reliance Steel & Aluminum | 0.8 | ||||||||||
| SEI Investments | 0.7 | ||||||||||
| PORTFOLIO SECTOR BREAKDOWN % of Net Assets | |||||||||||
| Industrials | 27.1 | % | |||||||||
| Information Technology | 20.6 | ||||||||||
| Consumer Discretionary | 14.7 | ||||||||||
| Financials | 9.6 | ||||||||||
| Materials | 9.1 | ||||||||||
| Health Care | 7.7 | ||||||||||
| Energy | 7.4 | ||||||||||
| Consumer Staples | 1.5 | ||||||||||
| Telecommunication Services | 0.1 | ||||||||||
| Miscellaneous | 1.2 | ||||||||||
| Cash and Cash Equivalents | 1.0 | ||||||||||
 | |||||||||
Manager’s Discussion While we were satisfied with the absolute performance of our flagship Royce Pennsylvania Mutual Fund (PMF) in 2012, its relative results left us just slightly disappointed. The Fund was up 14.6% in 2012, behind its small-cap benchmark, the Russell 2000 Index, which gained 16.3% for the same period. After trailing its benchmark in the first half—the Fund gained 4.0% compared to 8.5% for the small-cap benchmark—PMF posted stronger relative results between July and the end of December. A welcome summer rally lifted share prices of all asset classes, and the Fund was even with the Russell 2000 for the third quarter—both gained 5.3%—and tied its benchmark from the 2012 low on June 4 through December 31, 2012, a period in which PMF and the Russell 2000 climbed 16.3%. Much of the Fund’s performance advantage from the June low came from better results during the more volatile fourth quarter, a period that saw equities reacting to a series of major events, including Hurricane Sandy, the elections, and a fourth round of quantitative easing in mid-December. For the year’s final quarter, PMF gained 4.7% versus a gain of 1.9% for the Russell 2000. We do not want to make too much of this short-term outperformance period for the Fund, though we are hopeful that it signals the beginning of a more historically normal period of equity returns. This would be a welcome development, one potentially capable of helping the Fund to once more produce stronger short- and intermediate-term results on both an absolute and relative basis. As it is, the Fund continued to outpace the Russell 2000 over long-term time spans. (Market cycle results can be found on page 6.) For the periods ended December 31, 2012, the Fund beat the small-cap index for the five-, 10-, 15-, 20-, 25-, and 30-year periods. PMF’s average annual total return for the 40-year period ended December 31, 2012 was 11.8%, a long-term record in which we take great pride. We are also very pleased to have celebrated the 40th anniversary of Chuck’s management of our flagship portfolio in November. All of the Fund’s equity sectors finished 2012 in the black. Four of the Fund’s largest sectors were also its best performers, which is always a welcome development. Industrials led all sectors, boosted by particularly strong results for holdings in the machinery group. The Consumer Discretionary sector was also a source of strength. The specialty retail and, to a lesser degree, | |||||||||
| 16 | The Royce Funds 2012 Annual Report to Shareholders |
Performance and Portfolio Review textiles, apparel & luxury goods industries posted notable net contributions. Information Technology and Financials were also strong net contributors. The core businesses of top 10 holding IPG Photonics have shown enviable growth through the challenging economic environment. The company manufactures fiber lasers and provides components for marking, cutting, and welding applications. While it has a cost and technology advantage that we believe can allow it to continue to grow market share, its skyrocketing stock price led us to take some gains in the second half. In July we began to reduce our stake in Cirrus Logic, a semiconductor maker that is the sole provider of audio codecs for Apple’s iPhones and iPads, among other products and customers. Its core business continues to show strength, its business with Apple has been expanding, and it has been developing promising new products. However, its rapidly rising stock price in the second half hit levels that were well beyond our initial sell targets, which prompted the reduction. Nordson Corporation manufactures customized systems that apply adhesives, sealants, and coatings to consumer and industrial products during the manufacturing process. A steady increase in earnings—and an increased dividend for the 49th consecutive year—seemed to draw more investors to the stock. We took some gains between late August and early September. A rising share price also led us to reduce our stake in Dorman Products throughout the second half. The company makes aftermarket auto parts and is usually first to market non-OEM parts. We liked its balance sheet, leadership in a growing business, and ability to be successful in a tough economy, but when its share price began to move higher we chose to take gains. Disappointing performances were most often minor in 2012. CARBO Ceramics is an old favorite that we have owned continuously in the portfolio since 2006 after first purchasing shares in 1996. The company manufactures resin-coated ceramic and sand proppants used in the hydraulic fracturing of natural gas and oil wells. Slumping natural gas prices have crimped production, which led to a high proppant inventory. More recently, the firm has faced tougher-than-expected competition from reduced-cost, lower-quality Chinese companies. Although we reduced our position somewhat in December, we think its industry leadership and the ample supply of natural gas reserves here in the U.S. make it more than capable of a rebound. We felt even better about the long-term prospects for ADTRAN, which manufactures high-speed digital transmission products for telecomm companies. Revenues and earnings have fallen as its business slowed, but by the end of 2012 its stock looked even more attractively cheap to us than it had at various other times of the year when we were building a position. |
 |
| Includes reinvestment of distributions. | |||
| PORTFOLIO DIAGNOSTICS | |||
| Fund Net Assets | $5,891 million | ||
| Number of Holdings | 460 | ||
| Turnover Rate | 22% | ||
| Average Market Capitalization1 | $1,587 million | ||
| Weighted Average P/E Ratio2,3 | 16.4x | ||
| Weighted Average P/B Ratio2 | 1.9x | ||
| U.S. Investments (% of Net Assets) | 91.0% | ||
| Non-U.S. Investments (% of Net Assets) | 8.0% | ||
| Symbol | |||
| Investment Class | PENNX | ||
| Service Class | RYPFX | ||
| Consultant Class | RYPCX | ||
| Institutional Class | RPMIX | ||
| R Class | RPMRX | ||
| K Class | RPMKX | ||
1 Geometric Average. This weighted calculation uses each portfolio holding’s market cap in a way designed to not skew the effect of very large or small holdings; instead, it aims to better identify the portfolio’s center, which Royce believes offers a more accurate measure of average market cap than a simple mean or median. | |||
2 Harmonic Average. This weighted calculation evaluates a portfolio as if it were a single stock and measures it overall. It compares the total market value of the portfolio to the portfolio’s share in the earnings or book value, as the case may be, of its underlying stocks. | |||
| MORNINGSTAR STATISTICAL MEASURES1 | |||
| Sharpe Ratio | Standard Deviation | ||
| PMF | 0.26 | 23.78 | |
| Russell 2000 | 0.25 | 24.55 | |
| Category Median | 0.24 | 24.07 | |
| Best Quartile Breakpoint | 0.30 | 22.94 | |
1 Five years ended 12/31/12. Category Median and Best Quartile Breakpoint based on 353 small-cap objective funds (oldest class only) with at least five years of history. | |||
The Fund beat the Russell 2000 and performed within the top 50% of small-cap objective funds on a risk-adjusted basis, as shown by its Sharpe ratio. In addition, the Fund’s volatility ranked within the top 50% of small-cap objective funds, while the Fund also produced lower volatility than the Russell 2000. | |||
DOWN MARKET PERFORMANCE COMPARISON | |||
 | |||
| The Royce Funds 2012 Annual Report to Shareholders | 17 |
| Royce Low-Priced Stock Fund |
AVERAGE ANNUAL TOTAL RETURNS Through 12/31/12 | ||||||||||
| July–December 20121 | 5.58 | % | ||||||||
| One-Year | 4.48 | |||||||||
| Three-Year | 5.47 | |||||||||
| Five-Year | 2.90 | |||||||||
| 10-Year | 9.69 | |||||||||
| 15-Year | 10.29 | |||||||||
| Since Inception (12/15/93) | 11.58 | |||||||||
| ANNUAL EXPENSE RATIOS | ||||||||||
| Gross Operating Expenses | 1.58 | % | ||||||||
| Net Operating Expenses | 1.51 | |||||||||
| 1 Not annualized | ||||||||||
| CALENDAR YEAR TOTAL RETURNS | ||||||||||
| Year | RLP | Year | RLP | |||||||
| 2012 | 4.5 | % | 2004 | 13.6 | % | |||||
| 2011 | -14.6 | 2003 | 44.0 | |||||||
| 2010 | 31.5 | 2002 | -16.3 | |||||||
| 2009 | 53.6 | 2001 | 25.1 | |||||||
| 2008 | -36.0 | 2000 | 24.0 | |||||||
| 2007 | 2.3 | 1999 | 29.8 | |||||||
| 2006 | 19.0 | 1998 | 2.4 | |||||||
| 2005 | 9.7 | 1997 | 19.5 | |||||||
| TOP 10 POSITIONS % of Net Assets | ||||||||||
| Teradyne | 2.0 | % | ||||||||
| Fairchild Semiconductor International | 2.0 | |||||||||
| Pretium Resources | 1.9 | |||||||||
| Alamos Gold | 1.8 | |||||||||
| Globe Specialty Metals | 1.8 | |||||||||
| Trican Well Service | 1.8 | |||||||||
| Myriad Genetics | 1.8 | |||||||||
| International Rectifier | 1.7 | |||||||||
| TrueBlue | 1.7 | |||||||||
| Value Partners Group | 1.7 | |||||||||
| PORTFOLIO SECTOR BREAKDOWN % of Net Assets | ||||||||||
| Materials | 22.1 | % | ||||||||
| Information Technology | 21.8 | |||||||||
| Industrials | 12.9 | |||||||||
| Energy | 12.5 | |||||||||
| Financials | 10.6 | |||||||||
| Consumer Discretionary | 8.0 | |||||||||
| Health Care | 6.2 | |||||||||
| Consumer Staples | 3.7 | |||||||||
| Utilities | 0.1 | |||||||||
| Telecommunication Services | 0.1 | |||||||||
| Miscellaneous | 0.4 | |||||||||
| Cash and Cash Equivalents | 1.6 | |||||||||
 |
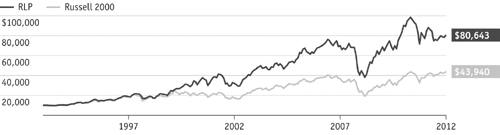
Manager’s Discussion While stocks as a whole enjoyed good times in 2012, it was a very disappointing year on both an absolute and relative basis for the diversified portfolio of Royce Low-Priced Stock Fund (RLP). The Fund was up 4.5% in 2012, substantially lagging its small-cap benchmark, the Russell 2000 Index, which gained 16.3% for the same period. Calendar-year results perpetuated a frustrating pattern for the Fund in which too many portfolio holdings performed poorly even as the markets otherwise continued to show a high degree of both correlation and above-average returns. RLP got off to a rough start in 2012, with lackluster results in both the bullish first quarter and bearish second quarter, a double dose of relative underperformance that was at odds with much of the Fund’s longer-term track record. During the first quarter RLP was up 11.5%, trailing its benchmark’s gain of 12.4%. For the third straight year a promising early start was derailed by a bearish spring, with the added problem that more economically sensitive areas of the stock market—including large Fund sectors Energy, Materials, and Industrials—were among the hardest hit. This resulted in a significant downturn in the second quarter in which the Fund fell 11.3% versus a decline of 3.5% for its benchmark. The warmer weather brought a solid rally in which small-caps rebounded off their 2012 low on June 4. RLP trailed in the third-quarter rebound, up 4.6% versus a gain of 5.3% for the Russell 2000. Share prices grew a bit more volatile in the fourth quarter. Investors did their best to sort out the consequences of Hurricane Sandy, the elections, the fiscal cliff, and another round of quantitative easing. Day to day, it seemed as though the market was not quite sure what to make of any of it. RLP gained 0.9% for the fourth quarter while the small-cap index again stayed ahead, rising 1.9%. A second consecutive year of underperformance versus the Russell 2000 meant that RLP lagged over intermediate- and some longer-term periods. The Fund was also behind in recent market cycle periods. (More market cycle results can be found on page 6.) RLP outperformed the small-cap index for the 15-year and since inception (12/15/93) periods ended December 31, 2012. The Fund’s average annual total return since inception was 11.6%. |
| 18 | The Royce Funds 2012 Annual Report to Shareholders |
Performance and Portfolio Review |
| With two notable exceptions at the individual company level there were really no large-scale hits to performance in 2012, which made underperformance as much a function of where the portfolio was not invested as where it was. For example, the Fund’s two equity sectors that detracted from performance—Energy and Telecommunication Services—posted modest losses as a whole, especially the latter group. (Utilities were flat in 2012.) Yet combined net gains from Consumer Discretionary, Health Care (in which RLP was considerably underweight versus the Russell 2000), Information Technology, Industrials, and Materials were simply not large enough to provide better performance for the Fund. This was particularly the case for holdings throughout the portfolio coming off the early June low—many did well, just not well enough. In retrospect, it seems clear that we underestimated the effect that a zero percent interest rate environment would have on the equity markets. Many highly leveraged companies received a new lease on life thanks to record-low rates, while more conservatively capitalized firms were sitting on cash that was earning virtually nothing. The appeal of strong balance sheets or companies investing in hard assets, even in the more vulnerable world of low-priced stocks, was mostly lost. As for those holdings that did not perform well in 2012, we reduced our stake in Lamprell, a UAE-based company that has years of experience in the oil rig refurbishing business. It suffered first from problems with suppliers when it entered the rig construction business. These supply chain issues were the impetus behind the company issuing a whopping five profit warnings in 2012. A new CEO came aboard late in the year with a commitment to concentrate on what we think the firm does best—refurbishing rigs. Knight Capital Group suffered a well-publicized $440 million trading loss caused by software problems in July. Seeing a potential long-term opportunity, we initially increased our stake in the aftermath of the loss only to see takeover bids for far less than we thought its trading business was worth. Somewhat grudgingly, we took our losses and moved on in November and December. GrafTech International manufactures synthetic and natural graphite and carbon based products that are used to produce steel. The company experienced slowing steel demand and capacity utilization, but we remain confident that a resumption of industrial activity, particularly in the developing world, can engineer a recovery. We bought more shares between late April and early October. We also increased our position in Major Drilling Group International with small buys in September. The company provides contract drilling services for metals miners. It continued to produce revenue and positive earnings. While these were lower than what many analysts were expecting, we thought that its resilience in a very tough market for mining companies was a strong sign. |
 |
| Includes reinvestment of distributions. |
| PORTFOLIO DIAGNOSTICS | |||||
| Fund Net Assets | $3,037 million | ||||
| Number of Holdings | 154 | ||||
| Turnover Rate | 8% | ||||
| Average Market Capitalization1 | $1,238 million | ||||
| Weighted Average P/E Ratio2,3 | 13.5x | ||||
| Weighted Average P/B Ratio2 | 1.5x | ||||
| U.S. Investments (% of Net Assets) | 64.1% | ||||
| Non-U.S. Investments (% of Net Assets) | 34.3% | ||||
| Symbol | |||||
| Investment Class | RLPHX | ||||
| Service Class | RYLPX | ||||
| Institutional Class | RLPIX | ||||
| R Class | RLPRX | ||||
| K Class | RLPKX | ||||
1 Geometric Average. This weighted calculation uses each portfolio holding’s market cap in a way designed to not skew the effect of very large or small holdings; instead, it aims to better identify the portfolio’s center, which Royce believes offers a more accurate measure of average market cap than a simple mean or median. | |||||
2 Harmonic Average. This weighted calculation evaluates a portfolio as if it were a single stock and measures it overall. It compares the total market value of the portfolio to the portfolio’s share in the earnings or book value, as the case may be, of its underlying stocks. | |||||
3 The Fund’s P/E ratio calculation excludes companies with zero or negative earnings (16% of portfolio holdings as of 12/31/12). | |||||
| MORNINGSTAR STATISTICAL MEASURES1 | |||||
| Sharpe Ratio | Standard Deviation | ||||
| RLP | 0.23 | 26.48 | |||
| Russell 2000 | 0.25 | 24.55 | |||
| Category Median | 0.24 | 24.07 | |||
| Best Quartile Breakpoint | 0.30 | 22.94 | |||
1 Five years ended 12/31/12. Category Median and Best Quartile Breakpoint based on 353 small-cap objective funds (oldest class only) with at least five years of history. | |||||
DOWN MARKET PERFORMANCE COMPARISON All Down Periods of 7.5% or Greater Over the Last 7 Years, in Percentages(%) 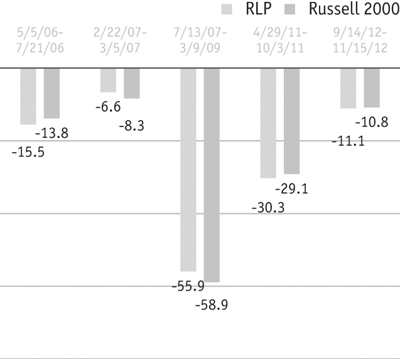 | |||||
| The Royce Funds 2012 Annual Report to Shareholders | 19 |
| Royce Heritage Fund |
AVERAGE ANNUAL TOTAL RETURNS Through 12/31/12 | |||||||||||
| July–December 20121 | 11.64 | % | |||||||||
| One-Year | 14.30 | ||||||||||
| Three-Year | 9.74 | ||||||||||
| Five-Year | 5.05 | ||||||||||
| 10-Year | 11.12 | ||||||||||
| 15-Year | 11.77 | ||||||||||
| Since Inception (12/27/95) | 13.34 | ||||||||||
| ANNUAL EXPENSE RATIO | |||||||||||
| Operating Expenses | 1.50 | % | |||||||||
| 1 Not annualized | |||||||||||
| CALENDAR YEAR TOTAL RETURNS | |||||||||||
| Year | RHF | Year | RHF | ||||||||
| 2012 | 14.3 | % | 2004 | 20.4 | % | ||||||
| 2011 | -9.3 | 2003 | 38.1 | ||||||||
| 2010 | 27.5 | 2002 | -18.9 | ||||||||
| 2009 | 51.8 | 2001 | 20.5 | ||||||||
| 2008 | -36.2 | 2000 | 11.7 | ||||||||
| 2007 | 1.2 | 1999 | 41.7 | ||||||||
| 2006 | 22.6 | 1998 | 19.5 | ||||||||
| 2005 | 8.7 | 1997 | 26.0 | ||||||||
| TOP 10 POSITIONS % of Net Assets | |||||||||||
| Kennametal | 1.4 | % | |||||||||
| Lazard Cl. A | 1.3 | ||||||||||
| ManpowerGroup | 1.2 | ||||||||||
| SEI Investments | 1.2 | ||||||||||
| Helmerich & Payne | 1.2 | ||||||||||
| Forward Air | 1.2 | ||||||||||
| KBR | 1.2 | ||||||||||
| Greif Cl. A | 1.2 | ||||||||||
| Towers Watson & Company Cl. A | 1.2 | ||||||||||
| KKR & Co. L.P. | 1.1 | ||||||||||
| PORTFOLIO SECTOR BREAKDOWN % of Net Assets | |||||||||||
| Industrials | 23.9 | % | |||||||||
| Financials | 18.3 | ||||||||||
| Information Technology | 16.2 | ||||||||||
| Materials | 11.6 | ||||||||||
| Consumer Discretionary | 11.1 | ||||||||||
| Energy | 5.2 | ||||||||||
| Health Care | 4.4 | ||||||||||
| Consumer Staples | 1.2 | ||||||||||
| Utilities | 0.1 | ||||||||||
| Miscellaneous | 4.6 | ||||||||||
| Cash and Cash Equivalents | 3.4 | ||||||||||
 | |||||||||
Managers’ Discussion Although we were pleased that Royce Heritage Fund (RHF) outperformed its small-cap benchmark, the Russell 2000 Index, during the latter half of 2012, we were slightly disappointed by the Fund’s relative results for the calendar year. The Fund gained 14.3% in 2012, trailing its benchmark, the Russell 2000, which climbed 16.3% for the same period. Following 2011’s small-cap low on October 3, stocks got off to a fast start in 2012. RHF gained 12.9% in the first quarter of 2012 compared to the 12.4% rise for its benchmark. However, the bull cycle did not last long. On March 26, 2012—just days before the end of the first quarter—the market entered a down period. For the second quarter RHF fell 9.3%, wrapping up a relatively disappointing first half, while the Russell 2000 declined 3.5%. We were more satisfied with the Fund’s third-quarter rebound. Seeming to ignore the macro noise of ongoing European debt issues, concerns about the state of the U.S. economy, and China’s slower growth, stocks rallied through the quarter, with RHF gaining 5.0% and the small-cap index rising 5.3%. The fourth quarter saw more volatility and mostly lower returns as investors reacted to the significant impacts of Hurricane Sandy, the presidential election, the looming fiscal cliff, and another round of quantitative easing. For the fourth quarter, RHF gained 6.4% compared to 1.9% for the Russell 2000. We took this strong result in the year’s final quarter as a welcome sign that the demand for quality stocks was growing. Over longer-term periods, RHF provided noteworthy absolute and relative returns, outpacing its benchmark for the five-, 10-, 15-year, and since inception (12/27/95) periods ended December 31, 2012. In large part this advantage was the product of strong market cycle results. For example, from the previous small-cap peak on July 13, 2007 through the most recent peak on April 29, 2011 the Fund gained 25.3% versus 6.6% for the small-cap index. We were also pleased that RHF beat the Russell 2000 from the small-cap low on June 4, 2012 through December 31, 2012, up 17.7% versus 16.3%. (More market cycle results can be found on page 6.) The Fund’s average annual total return since inception was 13.3%. | |||||||||
| 20 | The Royce Funds 2012 Annual Report to Shareholders |
Performance and Portfolio Review There were no significant disappointments at the sector, industry, or company level. The Energy sector detracted with a modest loss, while Diversified Investment Companies were flat. In June we parted ways with Lamprell, which repairs and refurbishes drilling rigs. This company from the Energy sector faced problems with suppliers in its recent efforts to enter the rig construction business, but met with more serious issues in May when the first of a whopping five profit warnings was issued. It was no surprise when these events caused its share price to plummet. We chose to hold our shares in Major Drilling Group International, the world’s second-largest mine drilling company. While it remains profitable, its revenues from metals explorers fell by 41% in fiscal 2012 owing to the problems smaller miners had raising capital. We like its prospects in the event of a pick-up in mining activity. At the sector level contributions came in the form of notable net gains from Industrials, Financials, Information Technology, and Consumer Discretionary, with the first two particularly strong. Capital markets, led by SEI Investments, was the leading industry group, followed by machinery, where Valmont Industries was the leader, and the electronic equipment, instruments & components group, which saw strength from the Fund’s top contributor, IPG Photonics. The company specializes in the development and manufacture of high-power, fiber-optic lasers and provides components for marking, cutting, and welding applications. Its share price made its first-half high in February, leading us to take gains before adding to our stake in May, June, and July at more attractive prices. Although its stock price did not follow the smoothest course, it spent most of the second half on the rise, prompting us to another round of selling between August and the end of December. We held shares at the end of the year because we think the expanding market for its fiber laser technology, a global growth business for the firm, combined with its first-mover advantage in numerous laser applications, positions the company for ongoing success. The recovery in the housing industry spurred the rapidly rising stock price of Mohawk Industries in 2012, which in turn led us to begin taking gains in September. This conservatively capitalized company produces floor coverings for the residential and commercial markets. In addition to its robust earnings growth, investors seemed to like its aggressive attempts to capture market share by acquiring smaller competitors. Homebuilder NVR also enjoyed success as a result of the housing rebound. We sold some shares in November and December. Valmont Industries produces fabricated metal products, pole and tower structures, and mechanized irrigation systems. The global reach of its core businesses was a benefit as demand grew for utility infrastructure. Also helping earnings growth were growing sales for its irrigation systems, which were needed in the aftermath of the Midwest’s devastating summer drought. |
 |
| Includes reinvestment of distributions. | |||
| PORTFOLIO DIAGNOSTICS | |||
| Fund Net Assets | $269 million | ||
| Number of Holdings | 236 | ||
| Turnover Rate | 39% | ||
| Average Market Capitalization1 | $2,656 million | ||
| Weighted Average P/E Ratio2,3 | 16.3x | ||
| Weighted Average P/B Ratio2 | 2.3x | ||
| U.S. Investments (% of Net Assets) | 71.8% | ||
| Non-U.S. Investments (% of Net Assets) | 24.8% | ||
| Symbol | |||
| Investment Class | RHFHX | ||
| Service Class | RGFAX | ||
| Consultant Class | RYGCX | ||
| R Class | RHFRX | ||
| K Class | RHFKX | ||
1 Geometric Average. This weighted calculation uses each portfolio holding’s market cap in a way designed to not skew the effect of very large or small holdings; instead, it aims to better identify the portfolio’s center, which Royce believes offers a more accurate measure of average market cap than a simple mean or median. | |||
2 Harmonic Average. This weighted calculation evaluates a portfolio as if it were a single stock and measures it overall. It compares the total market value of the portfolio to the portfolio’s share in the earnings or book value, as the case may be, of its underlying stocks. | |||
| MORNINGSTAR STATISTICAL MEASURES1 | |||
| Sharpe Ratio | Standard Deviation | ||
| RHF | 0.31 | 25.98 | |
| Russell 2000 | 0.25 | 24.55 | |
| Category Median | 0.24 | 24.07 | |
| Best Quartile Breakpoint | 0.30 | 22.94 | |
1 Five years ended 12/31/12. Category Median and Best Quartile Breakpoint based on 353 small-cap objective funds (oldest class only) with at least five years of history. | |||
The Fund beat the Russell 2000 and performed within the Best Quartile of small-cap objective funds on a risk-adjusted basis, as shown by its Sharpe ratio. | |||
DOWN MARKET PERFORMANCE COMPARISON | |||
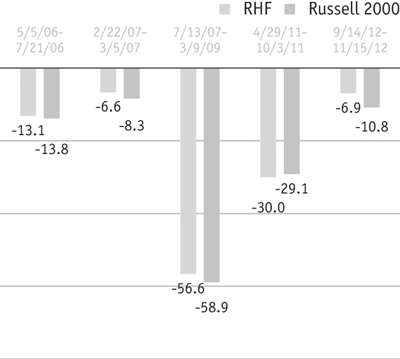 | |||
| The Royce Funds 2012 Annual Report to Shareholders | 21 |
| Royce Value Plus Fund |
AVERAGE ANNUAL TOTAL RETURNS Through 12/31/12 | ||||||||||
| July-December 20121 | 8.81 | % | ||||||||
| One-Year | 15.25 | |||||||||
| Three-Year | 7.49 | |||||||||
| Five-Year | 0.69 | |||||||||
| 10-Year | 12.78 | |||||||||
| Since Inception (6/14/01) | 11.31 | |||||||||
| ANNUAL EXPENSE RATIO | ||||||||||
| Operating Expenses | 1.45 | % | ||||||||
| 1 Not annualized | ||||||||||
| CALENDAR YEAR TOTAL RETURNS | ||||||||||
| Year | RVP | Year | RVP | |||||||
| 2012 | 15.2 | % | 2006 | 19.3 | % | |||||
| 2011 | -10.0 | 2005 | 13.2 | |||||||
| 2010 | 19.7 | 2004 | 28.2 | |||||||
| 2009 | 41.4 | 2003 | 79.9 | |||||||
| 2008 | -41.1 | 2002 | -14.7 | |||||||
| 2007 | 3.2 | |||||||||
| TOP 10 POSITIONS % of Net Assets | ||||||||||
| IPG Photonics | 2.0 | % | ||||||||
| Worthington Industries | 2.0 | |||||||||
| Myriad Genetics | 1.8 | |||||||||
| Quanex Building Products | 1.6 | |||||||||
| Eagle Materials | 1.6 | |||||||||
| Affiliated Managers Group | 1.5 | |||||||||
| Raymond James Financial | 1.5 | |||||||||
| Bankrate | 1.5 | |||||||||
| Carter’s | 1.4 | |||||||||
| Berkshire Hills Bancorp | 1.4 | |||||||||
| PORTFOLIO SECTOR BREAKDOWN % of Net Assets | ||||||||||
| Information Technology | 21.9 | % | ||||||||
| Industrials | 20.2 | |||||||||
| Financials | 16.4 | |||||||||
| Materials | 13.0 | |||||||||
| Health Care | 9.8 | |||||||||
| Consumer Discretionary | 8.5 | |||||||||
| Energy | 3.5 | |||||||||
| Consumer Staples | 1.1 | |||||||||
| Miscellaneous | 4.8 | |||||||||
| Cash and Cash Equivalents | 0.8 | |||||||||
 |
Manager’s Discussion While Royce Value Plus Fund (RVP) fell short of beating its benchmark in 2012, we were encouraged by both its strong absolute return and its terrific second-half showing. The Fund gained 15.2% in 2012, trailing its small-cap benchmark, the Russell 2000 Index, which was up 16.3% for the same period. RVP got off to a fine start in 2012, gaining 15.1% in the bullish first quarter compared to 12.4% for the small-cap index. The Fund then struggled in the second-quarter downturn, losing 8.0% while the benchmark declined 3.5%. Still, we were pleased that RVP posted a solid absolute result in the first half of the year. Our improved mood stayed with us as the Fund did well on both an absolute and relative basis when the market began to slowly move upward after the June 4, 2012 small-cap low. The third quarter saw other investors in a more mercurial mood as they put aside concerns about macro matters in favor of improving equity performance. The Fund benefited, gaining 7.9% in the third quarter and outperforming the Russell 2000, which was up 5.3%. The fourth quarter, like the second, proved more challenging. RVP rose 0.9% between the beginning of October and the end of December compared to a gain of 1.9% for the small-cap index. The Fund’s stronger third quarter, however, gave it a performance edge for the year’s second half, up 8.8% versus 7.2% for the benchmark. (From the early June small-cap low through the end of December the Fund was up 15.2% versus a gain of 16.3% for the small-cap index.) RVP outperformed the Russell 2000 for the 10-year and since inception (6/14/01) periods ended December 31, 2012. The Fund’s average annual total return since inception was 11.3%. When the Fund was underperforming its benchmark in the second half of 2010 and during 2011, we were beginning to subtly re-tool the portfolio and focused our efforts on strengthening our existing stock-selection discipline. Specifically, we sold several holdings that were in the turnaround or special situations category where the thesis had not played out as we had initially anticipated. This effort also entailed a shift back to more of a GARP (growth at a reasonable price) focus in which we targeted companies with greater current growth prospects that also possessed attractive valuations. |
| 22 | The Royce Funds 2012 Annual Report to Shareholders |
Performance and Portfolio Review Considering the slow pace of the economic recovery, it seemed prudent to invest in themes or industries with multi-year growth dynamics that would therefore provide more tailwinds than headwinds. An important example was our interest in companies participating in domestic infrastructure spending, especially those focused on the electrical grid and energy pipeline development. The U.S. and Canada have been investing significantly in their electric utility transmission grids both to add capacity and to upgrade antiquated transmission lines. Similar activities are taking place in the pipeline industry, which has been driven more by the need to transport oil and gas from new shale discovery basins in the U.S. and Canada. All of the Fund’s equity sectors posted net gains in 2012, with the largest contributions coming from Industrials and Materials, though Financials, Information Technology, and Consumer Discretionary also had notable results. Top holding IPG Photonics enjoyed success in 2012’s slow-growth economy. The company manufactures fiber lasers and provides components for marking, cutting, and welding applications on a global basis. It boasts both a cost and technology advantage that we think can allow it to keep taking market share. We continued to enjoy success with the portfolio’s ‘underwear theme’ in the year’s second half, as two top-25 holdings in the apparel business posted impressive gains. The stock prices of Gildan Activewear and Carter’s had suffered when cotton prices were on the rise but began to turn around in the first quarter when the cost of cotton declined and margins began to expand. Gildan makes t-shirts, fleece, and activewear for wholesale distributors while Carter’s markets branded children’s wear. A rising stock price led us to take gains in Worthington Industries, mostly during the second half of 2012. One of the few bright spots in the portfolio’s metals & mining group, the company processes steel and other metals. Better-than-expected results in its cylinder business, effective acquisitions, and improved margins were the primary drivers of growth. Mercury Systems provides open sensor and Big Data processing systems, software, and services for commercial, defense, and intelligence applications. Its share price suffered through most of 2012, though the most severe declines came in the second half after it announced mixed fiscal fourth quarter results and a cautious outlook for fiscal 2013 in July. Impatient with the company’s progress, we first began to reduce our position in November 2011 and were selling through October of 2012. We also first began to reduce our stake in Lattice Semiconductor in 2011 and continued to do so into October 2012. The company makes PLDs (programmable logic devices) for handheld and other portable equipment. Ongoing revisions to earnings guidance and declining revenues informed our decision to start selling. |
GOOD IDEAS AT THE TIME | |
| Mercury Computer Systems | -0.45% |
| Lattice Semiconductor | -0.36 |
| SanDisk Corporation | -0.34 |
| Bankrate | -0.34 |
| Rex Energy | -0.25 |
| 1 Net of dividends | |
| ROYCE VALUE PLUS FUND VS. RUSSELL 2000 Value of $10,000 Invested on 6/14/01 | |
 |
| Includes reinvestment of distributions. | |||
| PORTFOLIO DIAGNOSTICS | |||
| Fund Net Assets | $1,433 million | ||
| Number of Holdings | 116 | ||
| Turnover Rate | 32% | ||
| Average Market Capitalization1 | $1,854 million | ||
| Weighted Average P/E Ratio2,3 | 19.9x | ||
| Weighted Average P/B Ratio2 | 2.2x | ||
| U.S. Investments (% of Net Assets) | 85.7% | ||
| Non-U.S. Investments (% of Net Assets) | 13.5% | ||
| Symbol | |||
| Investment Class | RVPHX | ||
| Service Class | RYVPX | ||
| Consultant Class | RVPCX | ||
| Institutional Class | RVPIX | ||
| R Class | RVPRX | ||
| K Class | RVPKX | ||
1 Geometric Average. This weighted calculation uses each portfolio holding’s market cap in a way designed to not skew the effect of very large or small holdings; instead, it aims to better identify the portfolio’s center, which Royce believes offers a more accurate measure of average market cap than a simple mean or median. | |||
2 Harmonic Average. This weighted calculation evaluates a portfolio as if it were a single stock and measures it overall. It compares the total market value of the portfolio to the portfolio’s share in the earnings or book value, as the case may be, of its underlying stocks. | |||
| MORNINGSTAR STATISTICAL MEASURES1 | |||
| Sharpe Ratio | Standard Deviation | ||
| RVP | 0.14 | 24.44 | |
| Russell 2000 | 0.25 | 24.55 | |
| Category Median | 0.24 | 24.07 | |
| Best Quartile Breakpoint | 0.30 | 22.94 | |
1 Five years ended 12/31/12. Category Median and Best Quartile Breakpoint based on 353 small-cap objective funds (oldest class only) with at least five years of history. | |||
The Fund produced lower volatility than the Russell 2000. | |||
DOWN MARKET PERFORMANCE COMPARISON | |||
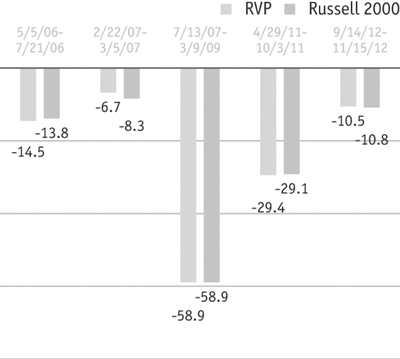 | |||
| The Royce Funds 2012 Annual Report to Shareholders | 23 |
| Royce Premier Fund |
AVERAGE ANNUAL TOTAL RETURNS Through 12/31/12 | |||||||||||
| July-December 20121 | 8.57 | % | |||||||||
| One-Year | 11.45 | ||||||||||
| Three-Year | 11.80 | ||||||||||
| Five-Year | 5.95 | ||||||||||
| 10-Year | 12.57 | ||||||||||
| 15-Year | 10.72 | ||||||||||
| 20-Year | 11.81 | ||||||||||
| Since Inception (12/31/91) | 12.00 | ||||||||||
| ANNUAL EXPENSE RATIO | |||||||||||
| Operating Expenses | 1.09 | % | |||||||||
| 1 Not annualized | |||||||||||
| CALENDAR YEAR TOTAL RETURNS | |||||||||||
| Year | RPR | Year | RPR | ||||||||
| 2012 | 11.4 | % | 2004 | 22.8 | % | ||||||
| 2011 | -0.9 | 2003 | 38.7 | ||||||||
| 2010 | 26.5 | 2002 | -7.8 | ||||||||
| 2009 | 33.3 | 2001 | 9.6 | ||||||||
| 2008 | -28.3 | 2000 | 17.1 | ||||||||
| 2007 | 12.7 | 1999 | 11.5 | ||||||||
| 2006 | 8.8 | 1998 | 6.7 | ||||||||
| 2005 | 17.1 | 1997 | 18.4 | ||||||||
| TOP 10 POSITIONS % of Net Assets | |||||||||||
| Lincoln Electric Holdings | 3.7 | % | |||||||||
| Westlake Chemical | 2.9 | ||||||||||
| Alleghany Corporation | 2.6 | ||||||||||
| Gartner | 2.4 | ||||||||||
| Reliance Steel & Aluminum | 2.3 | ||||||||||
| Thor Industries | 2.3 | ||||||||||
| Woodward | 2.2 | ||||||||||
| IDEXX Laboratories | 2.1 | ||||||||||
| Nu Skin Enterprises Cl. A | 2.1 | ||||||||||
| Myriad Genetics | 2.1 | ||||||||||
| PORTFOLIO SECTOR BREAKDOWN % of Net Assets | |||||||||||
| Industrials | 26.3 | % | |||||||||
| Information Technology | 18.0 | ||||||||||
| Materials | 13.5 | ||||||||||
| Financials | 10.9 | ||||||||||
| Consumer Discretionary | 10.4 | ||||||||||
| Energy | 6.8 | ||||||||||
| Health Care | 5.2 | ||||||||||
| Consumer Staples | 4.5 | ||||||||||
| Miscellaneous | 0.3 | ||||||||||
| Cash and Cash Equivalents | 4.1 | ||||||||||
 | |||||||||
Managers’ Discussion It was a peculiar year for Royce Premier Fund (RPR), one that left us with mixed emotions. On the one hand we were disappointed that the Fund underperformed its small-cap benchmark, the Russell 2000 Index, in 2012, but this was mitigated to some degree by the Fund’s respectable absolute result for the calendar year, which included a strong second-half performance. RPR rose 11.4% in 2012 compared to a gain of 16.3% for the Russell 2000. The Fund’s opening half was difficult, as the Fund lagged the small-cap benchmark in both the bullish first quarter (+11.7% versus +12.4%) and the bearish second quarter (-8.1% compared to -3.5%). Small-caps hit a 2012 low on June 4 and from that point through the end of the year the Fund’s relative results improved markedly, though it continued to lag, up 13.5% versus 16.3% for the Russell 2000. Coming nearer to closing the relative performance gap was partly the result of solid results in the year’s more bullish first and third quarters. During the latter period, RPR gained 3.2% compared to 5.3% for its benchmark. However, during the more volatile fourth quarter the Fund better distinguished itself by climbing 5.3%—well ahead of its benchmark, which rose 1.9%. In this period investors moved from being almost exclusively concerned with the macroeconomic issues that preoccupied them earlier in the year—European debt and the pace of growth in the U.S. and China—to trying to make sense of these and newer developments such as Hurricane Sandy, the elections, and the fourth round of quantitative easing. It was no surprise, then, that equity performance was a little rockier in the fourth quarter than it was in the third. Longer-term results for the Fund remained solid, though RPR continued to lag its benchmark for the three-year period ended December 31, 2012. Market cycle results, which can be found on page 6, were more mixed while long-term results were decidedly strong on a relative basis (and in many cases strong on an absolute basis as well). The Fund outpaced the Russell 2000 for the five-, 10-, 15-, 20-year, and since inception (12/31/91) periods ended December 31, 2012. RPR’s average annual total return since inception was 12.0%. Six of the Fund’s eight equity sectors finished the year in the black, while Consumer Staples and Energy posted relatively small net losses. In addition, those sectors that made net contributions—Information Technology, Industrials, Consumer Discretionary, Materials, Financials, and Health Care—all posted noteworthy net gains. At the industry level, chemicals, | |||||||||
| GOOD IDEAS THAT WORKED Top Contributors to 2012 Performance1 | |||||||||||
| Westlake Chemical | 1.97% | ||||||||||
| Thor Industries | 0.81 | ||||||||||
| Gartner | 0.80 | ||||||||||
| Lincoln Electric Holdings | 0.73 | ||||||||||
| FEI Company | 0.59 | ||||||||||
| 1 Includes dividends | |||||||||||
Important Performance and Expense Information All performance information in this Report reflects past performance, is presented on a total return basis, reflects the reinvestment of distributions, and does not reflect the deduction of taxes that a shareholder would pay on fund distributions or the redemption of fund shares. Past performance is no guarantee of future results. Investment return and principal value of an investment will fluctuate, so that shares may be worth more or less than their original cost when redeemed. Shares redeemed within 180 days of purchase may be subject to a 1% redemption fee payable to the Fund, which is not reflected in the performance shown above; if it were, performance would be lower. Current month-end performance may be higher or lower than performance quoted and may be obtained at www.roycefunds.com. All performance and risk information reflects results of the Investment Class (its oldest class). Operating expenses reflect the Fund’s total annual operating expenses for the Investment Class as of the Fund’s most current prospectus and include management fees and other expenses. Shares of RPR’s Service, Consultant, R, and K Classes bear an annual distribution expense that is not borne by the Investment Class. Regarding the two “Good Ideas” tables shown above, the sum of all contributors to, and all detractors from, performance for all securities in the portfolio would approximate the Fund’s performance for 2012. | |||||||||||
| 24 | The Royce Funds 2012 Annual Report to Shareholders |
Performance and Portfolio Review machinery, and textile, apparel & luxury goods each made a solid contribution. Although we would have liked to see stronger results for the year as a whole, we were pleased to see holdings in two key sectors—Industrials and Materials—come back in the second half, boosted by Lincoln Electric Holdings and Westlake Chemicals, respectively. The Fund’s top four contributors were also top-10 positions at the end of December, something that we always like to see happen. Westlake Chemical produces basic chemicals, vinyls, polymers, and fabricated building products, as well as plastics and high-end plastic films used to wrap food. With natural gas prices sinking, which hurt holdings such as Trican Well Service in the Energy sector, the company enjoyed an enviable cost advantage since gas is a primary feedstock in manufacturing plastic. With the housing industry rebounding, we see additional growth potential for this founder-controlled business with conservative and intelligent management. Yet with its stock price soaring we took gains in 2012. Between September and December we trimmed our stake in RV and small- and mid-size bus maker Thor Industries, a stock that we first bought in the portfolio during 2004. The company recently emerged in what we think is excellent condition following a five-year period of slow sales and consolidation in its industry. With demand for RVs growing, we also see potential going forward. The stock price of Gartner also climbed to impressive heights, especially in the second half of the year. A long-time Royce favorite that we have owned in RPR’s portfolio since 2000, Gartner provides research and analysis on IT (information technology), computer hardware, software, communications, and other technologies. The uncertain global economy has been highly beneficial to top-flight consultants. This, along with the firm’s generous margins, drew more and more investors to its stock. A significant and widely publicized software problem created a multi-million dollar loss for Knight Capital Group in July. While our admiration for the firm’s trading business dates back several years, the ensuing collapse of its share price prompted us to exit the position in August. We felt differently about Strayer Education, the holding company for Strayer University, a for-profit undergraduate and graduate institution. Its shares struggled throughout the year, but took a dramatic plunge in July. Recent earnings have fallen well shy of expectations, the firm has been dealing with higher costs and lower enrollments, and the industry has seen negative headlines touting high dropout rates and poorly prepared students. However, we believe that for-profit education is here to stay and that Strayer is a company that can eventually benefit because of its history of previous success and what we think is an attractive business model. |
GOOD IDEAS AT THE TIME | |
| Knight Capital Group Cl. A | -0.71% |
| Strayer Education | -0.60 |
| Nu Skin Enterprises Cl. A | -0.51 |
| ADTRAN | -0.43 |
| Trican Well Service | -0.40 |
| 1 Net of dividends | |
| ROYCE PREMIER FUND VS. RUSSELL 2000 Value of $10,000 Invested on 12/31/91 | |
 |
| Includes reinvestment of distributions. | |||
| PORTFOLIO DIAGNOSTICS | |||
| Fund Net Assets | $6,689 million | ||
| Number of Holdings | 77 | ||
| Turnover Rate | 7% | ||
| Average Market Capitalization1 | $2,401 million | ||
| Weighted Average P/E Ratio2,3 | 16.4x | ||
| Weighted Average P/B Ratio2 | 2.1x | ||
| U.S. Investments (% of Net Assets) | 82.3% | ||
| Non-U.S. Investments (% of Net Assets) | 13.6% | ||
| Symbol | |||
| Investment Class | RYPRX | ||
| Service Class | RPFFX | ||
| Consultant Class | RPRCX | ||
| Institutional Class | RPFIX | ||
| W Class | RPRWX | ||
| R Class | RPRRX | ||
| K Class | RPRKX | ||
1 Geometric Average. This weighted calculation uses each portfolio holding’s market cap in a way designed to not skew the effect of very large or small holdings; instead, it aims to better identify the portfolio’s center, which Royce believes offers a more accurate measure of average market cap than a simple mean or median. | |||
2 Harmonic Average. This weighted calculation evaluates a portfolio as if it were a single stock and measures it overall. It compares the total market value of the portfolio to the portfolio’s share in the earnings or book value, as the case may be, of its underlying stocks. | |||
| MORNINGSTAR STATISTICAL MEASURES1 | |||
| Sharpe Ratio | Standard Deviation | ||
| RPR | 0.35 | 22.54 | |
| Russell 2000 | 0.25 | 24.55 | |
| Category Median | 0.24 | 24.07 | |
| Best Quartile Breakpoint | 0.30 | 22.94 | |
1 Five years ended 12/31/12. Category Median and Best Quartile Breakpoint based on 353 small-cap objective funds (lowest expense class only) with at least five years of history. | |||
The Fund beat the Russell 2000 and performed within the Best Quartile of small-cap objective funds on a risk-adjusted basis, as shown by its Sharpe ratio. In addition, the Fund’s volatility ranked within the Best Quartile of small-cap objective funds, while the Fund also produced lower volatility than the Russell 2000. | |||
DOWN MARKET PERFORMANCE COMPARISON | |||
 | |||
| The Royce Funds 2012 Annual Report to Shareholders | 25 |
| Royce Special Equity Fund |
AVERAGE ANNUAL TOTAL RETURNS Through 12/31/12 | ||||||||||
| July-December 20121 | 8.84 | % | ||||||||
| One-Year | 15.36 | |||||||||
| Three-Year | 11.36 | |||||||||
| Five-Year | 7.34 | |||||||||
| 10-Year | 9.37 | |||||||||
| Since Inception (5/1/98) | 9.16 | |||||||||
| ANNUAL EXPENSE RATIO | ||||||||||
| Operating Expenses | 1.15 | % | ||||||||
| 1 Not annualized | ||||||||||
| CALENDAR YEAR TOTAL RETURNS | ||||||||||
| Year | RSE | Year | RSE | |||||||
| 2012 | 15.4 | % | 2005 | -1.0 | % | |||||
| 2011 | 0.1 | 2004 | 13.9 | |||||||
| 2010 | 19.6 | 2003 | 27.6 | |||||||
| 2009 | 28.4 | 2002 | 15.3 | |||||||
| 2008 | -19.6 | 2001 | 30.7 | |||||||
| 2007 | 4.7 | 2000 | 16.3 | |||||||
| 2006 | 14.0 | 1999 | -9.6 | |||||||
| TOP 10 POSITIONS % of Net Assets | ||||||||||
| Minerals Technologies | 3.9 | % | ||||||||
| Bio-Rad Laboratories Cl. A | 3.8 | |||||||||
| UniFirst Corporation | 3.7 | |||||||||
| Teradyne | 3.6 | |||||||||
| Molex Cl. A | 3.6 | |||||||||
| Applied Industrial Technologies | 3.5 | |||||||||
| American Eagle Outfitters | 3.5 | |||||||||
| Hubbell Cl. B | 3.2 | |||||||||
| Bed Bath & Beyond | 3.0 | |||||||||
| EnerSys | 2.9 | |||||||||
| PORTFOLIO SECTOR BREAKDOWN % of Net Assets | ||||||||||
| Industrials | 23.1 | % | ||||||||
| Consumer Discretionary | 22.9 | |||||||||
| Information Technology | 18.4 | |||||||||
| Materials | 12.6 | |||||||||
| Health Care | 6.3 | |||||||||
| Consumer Staples | 6.1 | |||||||||
| Cash and Cash Equivalents | 10.6 | |||||||||
 |
Manager’s Discussion Macro events loomed large over the market in 2012, with investors contending with such matters as eurozone debt, Hurricane Sandy, elections in the U.S. and elsewhere, and the fiscal cliff. The market also responded generally favorably to the various stimulus actions taken by the Federal Reserve. In this context, we were very pleased with the absolute result for Royce Special Equity Fund (RSE) even as it lagged its small-cap benchmark. The Fund was up 15.4% in 2012 versus a gain of 16.3% for its benchmark, the Russell 2000 Index, for the same period. During the more extreme first half of the year, RSE underperformed the small-cap index, though its results were largely in line with our expectations. The Fund gained 10.9% in the first quarter compared to 12.4% for the Russell 2000. This bullish phase, which began after an October 2011 small-cap low, lasted until almost the end of March. The market then switched modes, with April and May seeing mostly declining share prices. Although stocks began to rebound in June, it was not enough to lift second-quarter results into positive territory. RSE was down 4.4% in the second quarter while its benchmark lost 3.5%. This seeming down-market disadvantage was actually the result of underperformance in June, when the Fund gained 2.3% and trailed the benchmark’s 5.0% gain. The second half was a far less extreme period in which the Fund fared better on both an absolute and relative basis. Small-cap stocks reached a low in 2012 on June 4, and while the Russell 2000 reached a peak for the year on September 14, the prices of many smaller companies continued to rise through the end of the year following some stumbles in a bearish October. RSE climbed 5.7% in the third quarter versus a 5.3% increase for the small-cap index. The fourth quarter was less bullish, but still a solid period for many equities. During December, and for the fourth quarter as a whole, the highest beta shares outperformed, which partially explains the 10.7% advance in the Russell 2000 from November 15 through December 31. The Fund rose 8.0% for the same period, but outperformed for the quarter as a whole, up 3.0% while its benchmark was up 1.9%. Given the headlines in 2012, the market wound up doing better than it felt. It has gotten difficult to assess popular expectations as that gauge is clouded by dislike for governmental processes and outcomes. Through the closely correlated cycle that began with the small-cap peak on April 29, 2011, the Fund continued its tradition of defending well during declines while generally rising more modestly during the cycle’s upturns. This has been a hallmark of RSE since its inception. |
| GOOD IDEAS THAT WORKED Top Contributors to 2012 Performance1 | |||||||||||
| Dorman Products | 1.94% | ||||||||||
| American Eagle Outfitters | 1.48 | ||||||||||
| Minerals Technologies | 0.99 | ||||||||||
| Hubbell Cl. B | 0.95 | ||||||||||
| Thomas & Betts | 0.92 | ||||||||||
| 1 Includes dividends | |||||||||||
Important Performance and Expense Information All performance information in this Report reflects past performance, is presented on a total return basis, reflects the reinvestment of distributions, and does not reflect the deduction of taxes that a shareholder would pay on fund distributions or the redemption of fund shares. Past performance is no guarantee of future results. Investment return and principal value of an investment will fluctuate, so that shares may be worth more or less than their original cost when redeemed. Shares redeemed within 180 days of purchase may be subject to a 1% redemption fee payable to the Fund, which is not reflected in the performance shown above; if it were, performance would be lower. Current month-end performance may be higher or lower than performance quoted and may be obtained at www.roycefunds.com. All performance and risk information reflects results of the Investment Class (its oldest class). Operating expenses reflect the Fund’s total annual operating expenses for the Investment Class as of the Fund’s most current prospectus and include management fees and other expenses. Shares of RSE’s Service and Consultant Classes bear an annual distribution expense that is not borne by the Investment Class. Regarding the two “Good Ideas” tables shown above, the sum of all contributors to, and all detractors from, performance for all securities in the portfolio would approximate the Fund’s performance for 2012. | |||||||||||
| 26 | The Royce Funds 2012 Annual Report to Shareholders |
Performance and Portfolio Review |
We continue to strive for absolute performance through as much risk aversion as we can build into the portfolio. From the April 29, 2011 small-cap peak through December 31, 2012, the Fund was up 7.6% versus a 0.6% gain for the Russell 2000. (More market cycle results are on page 6.) RSE also outperformed the small-cap index for the five-year, and since inception (5/1/98) periods ended December 31, 2012. The Fund’s average annual total return since inception was 9.2%. Our portfolio construction method remains firmly rooted in bottom-up stock selection. The process requires that a company possess very specific qualities to merit inclusion in the portfolio. We have not changed our discipline. In fact, the only recent tweak we have introduced has been to often reduce our usual trailing 12-month EBIT (earnings before interest and taxes) used in our valuation metric to a lower figure in an effort to account for the high levels of global uncertainty, a move that we regard as stress-testing the attractiveness of a holding. Statistically the market looks fairly priced as of this writing. However, in other parts of the world we have seen the self-inflicted market penalty caused by political division, lingering budget issues, and the resulting debt. Yes, there is opportunity amid this, and as always, we intend to be opportunistically poised to find bargains, even assuming poor macro outcomes. Following the market’s strong second half advance, its final month-and-a-half in particular, few opportunities have been apparent. That rise, the government’s poor performance in the fiscal cliff negotiations, and perhaps even poorer prospects for the U.S. to get its fiscal act together—both figuratively and literally—any time soon have caused us to do more selling than buying of late. Over the last few years, we have viewed several portfolio holdings as events waiting to happen. While we saw a fair number of takeovers in 2012, we see the likelihood of even more once there is greater economic certainty and corporations look to acquire earnings growth. One encouraging sign in 2012 was that several companies made special dividend declarations, some of them very large. We continue to believe the portfolio can benefit from transactional activities. All of the Fund’s six equity sectors posted net gains in 2012. Industrials led by a wide margin, though Consumer Discretionary, Information Technology, and Materials also made strong contributions. The leading industry groups were electrical equipment, chemicals, and auto components. The top performers were aftermarket auto parts maker Dorman Products and clothing retailer American Eagle Outfitters. The two top detractors from performance were electric components maker AVX Corporation and value-priced clothier Children’s Place Retail Stores. |
GOOD IDEAS AT THE TIME | |
| AVX Corporation | -0.54% |
| Children’s Place Retail Stores | -0.45 |
| National Presto Industries | -0.26 |
| Atrion Corporation | -0.17 |
| Towers Watson & Company Cl. A | -0.17 |
| 1 Net of dividends | |
| ROYCE SPECIAL EQUITY FUND VS. RUSSELL 2000 Value of $10,000 Invested on 5/1/98 | |
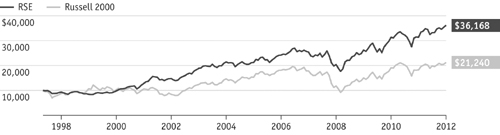 |
| Includes reinvestment of distributions. |
| PORTFOLIO DIAGNOSTICS | |||||
| Fund Net Assets | $2,928 million | ||||
| Number of Holdings | 48 | ||||
| Turnover Rate | 31% | ||||
| Average Market Capitalization1 | $1,551 million | ||||
| Weighted Average P/E Ratio2,3 | 15.0x | ||||
| Weighted Average P/B Ratio2 | 1.9x | ||||
| U.S. Investments (% of Net Assets) | 89.4% | ||||
| Non-U.S. Investments (% of Net Assets) | 0.0% | ||||
| Symbol | |||||
| Investment Class | RYSEX | ||||
| Service Class | RSEFX | ||||
| Consultant Class | RSQCX | ||||
| Institutional Class | RSEIX | ||||
1 Geometric Average. This weighted calculation uses each portfolio holding’s market cap in a way designed to not skew the effect of very large or small holdings; instead, it aims to better identify the portfolio’s center, which Royce believes offers a more accurate measure of average market cap than a simple mean or median. | |||||
2 Harmonic Average. This weighted calculation evaluates a portfolio as if it were a single stock and measures it overall. It compares the total market value of the portfolio to the portfolio’s share in the earnings or book value, as the case may be, of its underlying stocks. | |||||
3 The Fund’s P/E ratio calculation excludes companies with zero or negative earnings (4% of portfolio holdings as of 12/31/12). | |||||
| MORNINGSTAR STATISTICAL MEASURES1 | |||||
| Sharpe Ratio | Standard Deviation | ||||
| RSE | 0.46 | 18.09 | |||
| Russell 2000 | 0.25 | 24.55 | |||
| Category Median | 0.24 | 24.07 | |||
| Best Decile Breakpoint | 0.35 | 21.49 | |||
1 Five years ended 12/31/12 Category Median and Best Decile Breakpoint based on 353 small-cap objective funds (oldest class only) with at least five years of history. | |||||
| |||||
DOWN MARKET PERFORMANCE COMPARISON All Down Periods of 7.5% or Greater Over the Last 7 Years, in Percentages(%)  | |||||
| The Royce Funds 2012 Annual Report to Shareholders | 27 |
| Royce Value Fund |
AVERAGE ANNUAL TOTAL RETURNS Through 12/31/12 | |||||||||||
| July-December 20121 | 11.39 | % | |||||||||
| One-Year | 9.56 | ||||||||||
| Three-Year | 8.23 | ||||||||||
| Five-Year | 3.83 | ||||||||||
| 10-Year | 13.23 | ||||||||||
| Since Inception (6/14/01) | 10.47 | ||||||||||
| ANNUAL EXPENSE RATIO | |||||||||||
| Operating Expenses | 1.45 | % | |||||||||
| 1 Not annualized | |||||||||||
| CALENDAR YEAR TOTAL RETURNS | |||||||||||
| Year | RVV | Year | RVV | ||||||||
| 2012 | 9.6 | % | 2006 | 16.8 | % | ||||||
| 2011 | -7.4 | 2005 | 17.2 | ||||||||
| 2010 | 25.0 | 2004 | 30.9 | ||||||||
| 2009 | 44.7 | 2003 | 54.3 | ||||||||
| 2008 | -34.2 | 2002 | -23.5 | ||||||||
| 2007 | 3.8 | ||||||||||
| TOP 10 POSITIONS % of Net Assets | |||||||||||
| GameStop Corporation Cl. A | 4.4 | % | |||||||||
| Unit Corporation | 4.3 | ||||||||||
| Teradyne | 3.5 | ||||||||||
| Reliance Steel & Aluminum | 3.3 | ||||||||||
| Reinsurance Group of America | 3.1 | ||||||||||
| Oil States International | 2.9 | ||||||||||
| Helmerich & Payne | 2.8 | ||||||||||
| Ascena Retail Group | 2.8 | ||||||||||
| Chemed Corporation | 2.7 | ||||||||||
| Buckle (The) | 2.6 | ||||||||||
| PORTFOLIO SECTOR BREAKDOWN % of Net Assets | |||||||||||
| Consumer Discretionary | 19.8 | % | |||||||||
| Materials | 17.9 | ||||||||||
| Information Technology | 16.6 | ||||||||||
| Financials | 14.0 | ||||||||||
| Energy | 12.2 | ||||||||||
| Industrials | 10.1 | ||||||||||
| Health Care | 5.0 | ||||||||||
| Consumer Staples | 1.4 | ||||||||||
| Miscellaneous | 1.8 | ||||||||||
| Cash and Cash Equivalents | 1.2 | ||||||||||
 | |||||||||
Managers’ Discussion Strong second-half results for Royce Value Fund (RVV) were not quite enough for the Fund to overcome an earlier performance disadvantage against its small-cap benchmark in 2012. RVV gained 9.6% in 2012, lagging its small-cap benchmark the Russell 2000 Index, which climbed 16.3% for the same period. The Fund fared better during 2012’s bullish phases than in its down phases, though it also shone when prices were volatile later in the year. Like its benchmark, the Fund enjoyed a strong first quarter, up 10.7% versus a 12.4% gain for the Russell 2000. The second-quarter downturn, however, saw RVV struggle as it fell 11.1% versus a far more modest decline of 3.5% for the benchmark. Small-caps reached their 2012 low on June 4, with share prices mostly rising into mid-September and making the third quarter a bullish one for stocks across all asset classes. Investors seemed to take a break from the series of worries that helped to depress share prices in the spring, such as European sovereign debt and the slow pace of growth in the U.S. and China. During this period, RVV rose 8.0% versus an increase of 5.3% for the Russell 2000. The Fund’s relative advantage persisted through the end of the year, with RVV also beating the Russell 2000 in the more volatile fourth quarter, up 3.2% compared to 1.9% for the small-cap index. RVV was also competitive with its benchmark from the June low through the end of December, rising 16.1% versus 16.3%. Investors faced a number of challenges in the year’s final months. They were confronted not only with the concerns that dampened markets in the spring, but also had to contend with Hurricane Sandy, the elections, anxiety over the looming fiscal cliff, and another round of stimulative monetary policy courtesy of the Fed. We took it as a positive sign that during this trying period investors focused more on quality than momentum or macro factors. The Fund’s recent market cycle performances (found on page 6) remained mixed while long-term results were strong. RVV outperformed the Russell 2000 for the five-, 10-year, and since inception (6/14/01) periods ended December 31, 2012. The Fund’s average annual total return since inception was 10.5%. All but one of the Fund’s equity sectors made a net contribution to returns, and Consumer Staples, the lone detracting sector, suffered a minor net loss. Consumer Discretionary and Information Technology led all sectors, though Financials and Materials also posted solid net gains | |||||||||
| GOOD IDEAS THAT WORKED Top Contributors to 2012 Performance1 | |||||||||||
| Westlake Chemical | 2.03% | ||||||||||
| Federated Investors Cl. B | 0.75 | ||||||||||
| Reliance Steel & Aluminum | 0.75 | ||||||||||
| Teradyne | 0.72 | ||||||||||
| Chemed Corporation | 0.68 | ||||||||||
| 1 Includes dividends | |||||||||||
Important Performance and Expense Information All performance information in this Report reflects past performance, is presented on a total return basis, reflects the reinvestment of distributions, and does not reflect the deduction of taxes that a shareholder would pay on fund distributions or the redemption of fund shares. Past performance is no guarantee of future results. Investment return and principal value of an investment will fluctuate, so that shares may be worth more or less than their original cost when redeemed. Shares redeemed within 180 days of purchase may be subject to a 1% redemption fee payable to the Fund, which is not reflected in the performance shown above; if it were, performance would be lower. Current month-end performance may be higher or lower than performance quoted and may be obtained at www.roycefunds.com. All performance and risk information reflects results of the Service Class (its oldest class). Operating expenses reflect the Fund’s total annual operating expenses for the Service Class as of the Fund’s most current prospectus and include management fees, 12b-1 distribution and service fees, and other expenses. Shares of RVV’s Consultant and R Classes bear an annual distribution expense that is higher than that of the Service Class. Regarding the two “Good Ideas” tables shown above, the sum of all contributors to, and all detractors from, performance for all securities in the portfolio would approximate the Fund’s performance for 2012. | |||||||||||
| 28 | The Royce Funds 2012 Annual Report to Shareholders |
Performance and Portfolio Review as a group. Several industry groups distinguished themselves with terrific performances, including chemicals companies, in which top-performing Westlake Chemical took the lion’s share of net gains. Net contributions were more spread out in the insurance group, where Allied World Assurance Company Holdings, Partner Re, and Aspen Insurance Holdings all did well. Teradyne and Veeco Instruments did the most to help the semiconductors & semiconductor equipment group to shine while Chemed Corporation and, to a lesser degree, Mednax were the top performers in the health care providers & services group. Westlake Chemical, which had a wonderfully outsized impact on returns, manufactures basic chemicals, vinyls, polymers, and fabricated building products. It also makes plastics and high-end plastic films used to wrap food. Using natural gas as a feedstock for much of what it produces gave it a huge cost advantage thanks to slumping gas prices (a development that hurt portfolio holdings in the Energy sector). A founder-controlled business with conservative and intelligent management, we think its ongoing prospects remain very strong, especially in light of the fact that it has yet to see much benefit from the reviving housing industry. We did, however, reduce our position in 2012 as its stock price was climbing. We also remained optimistic about the long-term prospects for asset manager, money market specialist, and top-15 holding Federated Investors, which we repurchased in the portfolio during the fall of 2008. Money market funds have been facing the prospect of new regulations for more than a year, and most observers believe that the longer this process takes, the less onerous the rules are likely to be. Equally important is our contention that interest rates are likely to rise at some point, which should help its business. Long-time favorite and fourth-largest holding Reliance Steel & Aluminum distributes and processes metals. We see it as a well-run company that has managed to thrive during a difficult time for industrial metals businesses. Aside from the Fund’s two top detracting stocks, losses on the whole were quite modest at the sector, industry, and company levels. A major software error led to a multi-million dollar loss for Knight Capital Group in July. Although we had a long-running affection for the firm’s trading business, this was a more dramatic decline than we could stomach, so we sold our shares between July and August. We slightly increased our position in Major Drilling Group International with a purchase in September. The company provides contract drilling services for metals miners. Its share price suffered in 2012 in spite of its ongoing growth and profitability. Considering the dismal climate for mining companies, this was likely a case of guilt by association. Our take was that its resilience in a challenging market for mining companies was a major positive. |
GOOD IDEAS AT THE TIME | |
| Knight Capital Group Cl. A | -1.45% |
| Major Drilling Group International | -0.93 |
| Schnitzer Steel Industries Cl. A | -0.51 |
| Trican Well Service | -0.40 |
| GrafTech International | -0.36 |
| 1 Net of dividends | |
| ROYCE VALUE FUND VS. RUSSELL 2000 Value of $10,000 Invested on 6/14/01 | |
 |
| Includes reinvestment of distributions. | |||
| PORTFOLIO DIAGNOSTICS | |||
| Fund Net Assets | $1,330 million | ||
| Number of Holdings | 65 | ||
| Turnover Rate | 25% | ||
| Average Market Capitalization1 | $2,339 million | ||
| Weighted Average P/E Ratio2,3 | 12.6x | ||
| Weighted Average P/B Ratio2 | 1.6x | ||
| U.S. Investments (% of Net Assets) | 81.1% | ||
| Non-U.S. Investments (% of Net Assets) | 17.7% | ||
| Symbol | |||
| Investment Class | RVVHX | ||
| Service Class | RYVFX | ||
| Consultant Class | RVFCX | ||
| Institutional Class | RVFIX | ||
| R Class | RVVRX | ||
| K Class | RVFKX | ||
1 Geometric Average. This weighted calculation uses each portfolio holding’s market cap in a way designed to not skew the effect of very large or small holdings; instead, it aims to better identify the portfolio’s center, which Royce believes offers a more accurate measure of average market cap than a simple mean or median. | |||
2 Harmonic Average. This weighted calculation evaluates a portfolio as if it were a single stock and measures it overall. It compares the total market value of the portfolio to the portfolio’s share in the earnings or book value, as the case may be, of its underlying stocks. | |||
| MORNINGSTAR STATISTICAL MEASURES1 | |||
| Sharpe Ratio | Standard Deviation | ||
| RVV | 0.26 | 24.89 | |
| Russell 2000 | 0.25 | 24.55 | |
| Category Median | 0.24 | 24.07 | |
| Best Quartile Breakpoint | 0.30 | 22.94 | |
1 Five years ended 12/31/12. Category Median and Best Quartile Breakpoint based on 353 small-cap objective funds (oldest class only) with at least five years of history. | |||
The Fund beat the Russell 2000 and performed within the top 50% of small-cap objective funds on a risk-adjusted basis, as shown by its Sharpe ratio. | |||
DOWN MARKET PERFORMANCE COMPARISON | |||
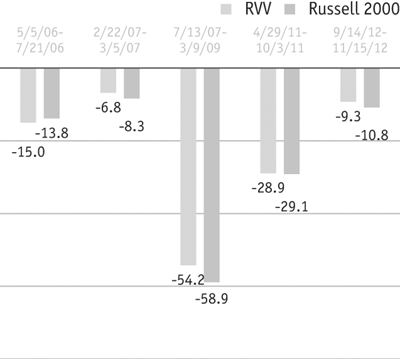 | |||
| The Royce Funds 2012 Annual Report to Shareholders | 29 |
| Royce 100 Fund |
AVERAGE ANNUAL TOTAL RETURNS Through 12/31/12 | |||||||||||
| July-December 20121 | 9.62 | % | |||||||||
| One-Year | 11.52 | ||||||||||
| Three-Year | 9.16 | ||||||||||
| Five-Year | 4.93 | ||||||||||
| Since Inception (6/30/03) | 10.17 | ||||||||||
| ANNUAL EXPENSE RATIOS | |||||||||||
| Operating Expenses | 1.47 | % | |||||||||
| 1 Not annualized | |||||||||||
| CALENDAR YEAR TOTAL RETURNS | |||||||||||
| Year | ROH | Year | ROH | ||||||||
| 2012 | 11.5 | % | 2007 | 7.3 | % | ||||||
| 2011 | -6.5 | 2006 | 13.7 | ||||||||
| 2010 | 24.8 | 2005 | 14.9 | ||||||||
| 2009 | 38.0 | 2004 | 27.2 | ||||||||
| 2008 | -29.2 | ||||||||||
| TOP 10 POSITIONS % of Net Assets | |||||||||||
| Reliance Steel & Aluminum | 2.1 | % | |||||||||
| Kennametal | 2.1 | ||||||||||
| PerkinElmer | 2.0 | ||||||||||
| Helmerich & Payne | 2.0 | ||||||||||
| Affiliated Managers Group | 1.9 | ||||||||||
| KBR | 1.8 | ||||||||||
| National Instruments | 1.7 | ||||||||||
| Valmont Industries | 1.6 | ||||||||||
| Lazard Cl. A | 1.6 | ||||||||||
| Mohawk Industries | 1.6 | ||||||||||
| PORTFOLIO SECTOR BREAKDOWN % of Net Assets | |||||||||||
| Industrials | 26.8 | % | |||||||||
| Information Technology | 18.9 | ||||||||||
| Consumer Discretionary | 11.2 | ||||||||||
| Energy | 10.9 | ||||||||||
| Financials | 10.0 | ||||||||||
| Materials | 10.0 | ||||||||||
| Health Care | 3.6 | ||||||||||
| Consumer Staples | 2.2 | ||||||||||
| Miscellaneous | 4.2 | ||||||||||
| Cash and Cash Equivalents | 2.2 | ||||||||||
 | |||||||||
Managers’ Discussion On a relative basis, we were disappointed with the calendar-year return for Royce 100 Fund (ROH), though its absolute return was solid. The Fund was up 11.5% in 2012, trailing its small-cap benchmark, the Russell 2000 Index, which rose 16.3% for the same period. The year began on a high note for stocks as a whole, and ROH more than fully participated in the first-quarter rally, up 13.1% compared to its benchmark’s 12.4% gain. In fact, the Fund lost most of its ground versus the index in 2012 during the more volatile and bearish months of April and May, the latter being especially tough on both an absolute and relative basis. These months were marked by lingering concerns about European debt and the strength of the U.S. and Chinese economies. For the second quarter, ROH slipped 10.1% while the Russell 2000 lost a more modest 3.5%. Small-caps reached their low in 2012 on June 4 before spending much of the summer months rising. The Russell 2000 reached its high for the year on September 14, though many small-caps, including the high-quality type that we seek for the Fund’s portfolio, continued to rise through the end of the year, particularly during the more volatile fourth quarter, which was key to the Fund outpacing its benchmark in the second half. For the third quarter, ROH was up 4.2% versus a gain of 5.3% for the small-cap index. During the fourth quarter, the Fund rose 5.2% while the Russell 2000 was up 1.9%. The Fund’s increase for the final six months of 2012 was 9.6% versus 7.2% for the small-cap index. Performance over the last full market cycle was strong on a relative basis and solid from an absolute standpoint. From the previous small-cap market peak on July 13, 2007 through the small-cap peak on April 29, 2011, the Fund was up 27.6% versus 6.6% for the small-cap index. (Please see page 6 for more market cycle results.) For the periods ended December 31, 2012, ROH outpaced the Russell 2000 for the five-year and since inception (6/30/03) periods. The Fund’s average annual total return since inception was 10.2%. As was the case in the first half of the year, each of the Fund’s eight equity sectors made a net contribution to returns. Unlike the first half, the full 12-month period saw net gains that were impressive. Two of the Fund’s largest sectors—Consumer Discretionary and Industrials—led all portfolio sectors by a comfortable margin, while Financials and Health Care also posted notable | |||||||||
| 30 | The Royce Funds 2012 Annual Report to Shareholders |
Performance and Portfolio Review net gains. The latter group’s contribution was especially impressive considering its low weight in the portfolio. (It was also considerably underweight relative to the Russell 2000.) At the industry level net gains came from a variety of groups, with capital markets, textiles, apparel & luxury goods, household durables, machinery, and life sciences tools & services leading. Although M&A activity was somewhat muted in 2012, the portfolio benefited from the announcement on Halloween that apparel maker The Warnaco Group would be acquired for a more than 30% premium by a larger competitor in its business, PVH Corporation. The ensuing increase in Warnaco’s share price prompted us to sell our position. IPG Photonics develops and manufactures high-power, fiber-optic lasers and other laser products. Results improved through the year as its business in Asia reaccelerated while overall sentiment about fiber laser opportunity improved. We began to reduce our position in August. We also took gains in AZZ, which manufactures electrical and industrial products and provides galvanizing services. The company consistently beat quarterly earnings expectations in 2012—while margins also improved—based on strong global demand for utility infrastructure components used for power plant build-outs and a pick-up in steel galvanizing demand. Top-10 holding Valmont Industries makes fabricated metal products, pole and tower structures, and mechanized irrigation systems. Like AZZ, Valmont benefited from strong global utility infrastructure demand. This capacity expansion bolstered the firm’s outlook for sustained growth, while its irrigation system sales grew strong in the wake of summer droughts in the Midwest. PerkinElmer develops diagnostics for disease prevention and also offers technologies that focus on food safety and environmental quality. Its business benefited from several positive developments: a shift in focus to its higher margin, recurring revenue, neonatal diagnostic products; margin expansion from the rationalization of operations after aggressive M&A in prior years; accelerating organic growth from its expansion into emerging markets; and the secular tailwind of genomic analysis. It was a top-10 position at the end of December. We parted ways with securities trading and technology business Knight Capital Group in August after a software glitch caused trading errors that resulted in the need for a dilutive equity infusion. The slower pace of consumer electronics shipments, particularly DVD players, has been creating what we anticipate will be a near-term royalty revenue headwind for DTS, which provides multi-channel audio technology, products, and services for various entertainment markets. We held our shares in 2012. |
 |
| Includes reinvestment of distributions. | |||
| PORTFOLIO DIAGNOSTICS | |||
| Fund Net Assets | $295 million | ||
| Number of Holdings | 90 | ||
| Turnover Rate | 13% | ||
| Average Market Capitalization1 | $2,274 million | ||
| Weighted Average P/E Ratio2,3 | 17.5x | ||
| Weighted Average P/B Ratio2 | 1.9x | ||
| U.S. Investments (% of Net Assets) | 87.3% | ||
| Non-U.S. Investments (% of Net Assets) | 10.5% | ||
| Symbol | |||
| Investment Class | ROHHX | ||
| Service Class | RYOHX | ||
| R Class | ROHRX | ||
| K Class | ROHKX | ||
1 Geometric Average. This weighted calculation uses each portfolio holding’s market cap in a way designed to not skew the effect of very large or small holdings; instead, it aims to better identify the portfolio’s center, which Royce believes offers a more accurate measure of average market cap than a simple mean or median. | |||
2 Harmonic Average. This weighted calculation evaluates a portfolio as if it were a single stock and measures it overall. It compares the total market value of the portfolio to the portfolio’s share in the earnings or book value, as the case may be, of its underlying stocks. | |||
| MORNINGSTAR STATISTICAL MEASURES1 | |||
| Sharpe Ratio | Standard Deviation | ||
| ROH | 0.30 | 23.68 | |
| Russell 2000 | 0.25 | 24.55 | |
| Category Median | 0.24 | 24.07 | |
| Best Quartile Breakpoint | 0.30 | 22.94 | |
1 Five years ended 12/31/12. Category Median and Best Quartile Breakpoint based on 353 small-cap objective funds (oldest class only) with at least five years of history. | |||
The Fund beat the Russell 2000 and performed within the top 50% of small-cap objective funds on a risk-adjusted basis, as shown by its Sharpe ratio. In addition, the Fund’s volatility ranked within the top 50% of small-cap objective funds, while the Fund also produced lower volatility than the Russell 2000. | |||
DOWN MARKET PERFORMANCE COMPARISON | |||
 | |||
| The Royce Funds 2012 Annual Report to Shareholders | 31 |
| Royce Total Return Fund |
AVERAGE ANNUAL TOTAL RETURNS Through 12/31/12 | ||||||||||
| July-December 20121 | 9.83 | % | ||||||||
| One-Year | 14.42 | |||||||||
| Three-Year | 11.58 | |||||||||
| Five-Year | 3.83 | |||||||||
| 10-Year | 8.87 | |||||||||
| 15-Year | 8.41 | |||||||||
| Since Inception (12/15/93) | 10.72 | |||||||||
| ANNUAL EXPENSE RATIO | ||||||||||
| Operating Expenses | 1.15 | % | ||||||||
| 1 Not annualized | ||||||||||
| CALENDAR YEAR TOTAL RETURNS | ||||||||||
| Year | RTR | Year | RTR | |||||||
| 2012 | 14.4 | % | 2004 | 17.5 | % | |||||
| 2011 | -1.7 | 2003 | 30.0 | |||||||
| 2010 | 23.5 | 2002 | -1.6 | |||||||
| 2009 | 26.2 | 2001 | 14.8 | |||||||
| 2008 | -31.2 | 2000 | 19.4 | |||||||
| 2007 | 2.4 | 1999 | 1.5 | |||||||
| 2006 | 14.5 | 1998 | 4.8 | |||||||
| 2005 | 8.2 | 1997 | 23.7 | |||||||
| TOP 10 POSITIONS % of Net Assets | ||||||||||
| Nordson Corporation | 1.0 | % | ||||||||
| Erie Indemnity Cl. A | 1.0 | |||||||||
| Rayonier | 0.9 | |||||||||
| E-L Financial | 0.9 | |||||||||
| Cato Corporation (The) Cl. A | 0.9 | |||||||||
| Chemed Corporation | 0.9 | |||||||||
| Federated Investors Cl. B | 0.9 | |||||||||
| Magellan Midstream Partners L.P. | 0.8 | |||||||||
| SEI Investments | 0.8 | |||||||||
| Balchem Corporation | 0.8 | |||||||||
| PORTFOLIO SECTOR BREAKDOWN % of Net Assets | ||||||||||
| Financials | 27.8 | % | ||||||||
| Industrials | 20.4 | |||||||||
| Consumer Discretionary | 11.3 | |||||||||
| Energy | 8.2 | |||||||||
| Materials | 7.6 | |||||||||
| Information Technology | 6.7 | |||||||||
| Health Care | 5.7 | |||||||||
| Consumer Staples | 4.0 | |||||||||
| Utilities | 2.9 | |||||||||
| Telecommunication Services | 0.7 | |||||||||
| Diversified Investment Companies | 0.4 | |||||||||
| Miscellaneous | 1.9 | |||||||||
| Bond | 0.1 | |||||||||
| Cash and Cash Equivalents | 2.3 | |||||||||
 |
Managers’ Discussion A strong second half was a great help to the calendar-year performance of Royce Total Return Fund (RTR). The Fund gained 14.4% in 2012 versus 16.3% for its small-cap benchmark, the Russell 2000, for the same period. The year began, however, on a less satisfying note. Stocks rallied through much of the first quarter and, as we would typically expect, RTR lagged the small-cap index, gaining 8.9% versus 12.4% for its benchmark. Improving economic data gave way to the by-now-familiar menu of anxieties, including European sovereign debt, another recession in the U.S., and slower growth in China, all of which conspired to depress stock prices following a small-cap high on March 26. The markets mostly floundered until early June, which made the second quarter markedly bearish. Unfortunately, the Fund’s historical resilience in down markets seemed to temporarily desert it, and RTR fell 4.3% in the second quarter compared to a loss of 3.5% for the Russell 2000. Summer brought a welcome wave of rising share prices. For the small-cap index the rally peaked in mid-September, while many of the Fund’s holdings posted positive performance, however modest, into December. RTR climbed 6.0% in the third quarter compared to 5.3% for its benchmark. The Russell 2000 staggered through October, losing 2.2% for the month while the Fund eked out a 0.4% gain. For the fourth quarter as a whole, RTR rose 3.6% versus a 1.9% result for the small-cap index. The Fund was also competitive with the Russell 2000 from the 2012 small-cap low on June 4 through the end of December, up 16.1% versus 16.3%. While very short-term in nature, these results were encouraging, giving us hope that the market is finally leaving the tightly correlated cycle of the last few years and is entering a more historically typical cycle. The Fund’s recent market cycle performance, which can be found on page 6, remained somewhat mixed through the end of the year. RTR outperformed the Russell 2000 for the five-, 15-year, and since inception (12/15/93) periods ended December 31, 2012. The Fund’s average annual total return since inception was 10.7%. Financials led all of the Fund’s sectors by a wide margin. Within the sector, capital markets made the most significant positive impact on performance. This group was led by asset manager and money market specialist Federated Investors. First buying shares in RTR during 1999, we |
| 32 | The Royce Funds 2012 Annual Report to Shareholders |
Performance and Portfolio Review |
built our position during some of the worst days of the financial crisis. New regulations are coming for money market funds, though the wait has stretched beyond a year. The consensus has been that the longer it takes for the new rules to materialize, the less burdensome they are likely to be. Many investors viewed this as good news for Federated’s stock in 2012. We built our position based on that view and also on the idea that interest rates will rise at some point, helping the firm’s core business. Another holding in the capital markets group was A.F.P. Provida, the largest pension fund manager in Chile. Its stock price soared on news that its parent company received a bid to buy Provida. Rising pension assets also seemed to help keep its shares in high demand. Other financial companies that did well included two old favorites—asset management, financial services, and software company SEI Investments and asset manager Alliance Bernstein. The Financial sector also saw strong net gains from the insurance group and the Fund’s small but profitable number of holdings in REITs. Companies in Industrials made a notable contribution. Nordson Corporation, part of the machinery group, was the sector’s—and the Fund’s—top performer in 2012. The company has what we think is a highly attractive niche business making customized systems that apply adhesives, sealants, and coatings to consumer and industrial products during the manufacturing process. The company announced a 20% increase in its fiscal fourth quarter dividend in July, which not only excited investors, but also marked the 49th consecutive year in which it increased its dividend. We trimmed our position during June and July. Net losses were modest at every level of the portfolio and included a long-time Royce favorite. Our first purchase of CARBO Ceramics in RTR was back in 1998, and we have held a position continuously ever since in this manufacturer of resin-coated ceramic and sand proppants used in the hydraulic fracturing of natural gas and oil wells. Falling natural gas prices slowed production, which led to higher proppant inventories. The company also met with tough competition from Chinese firms selling similar, lower quality wares at discounted prices. Taking the long view, we added a bit to our position in October because we still like its prospects, especially with ample natural gas reserves still untapped here in the U.S. We began to sell much of our position in Meadowbrook Insurance Group during July. The company’s growth was largely the result of writing underpriced policies, which left it with inadequate reserves when the time came to pay out. |
 |
| Includes reinvestment of distributions. |
| PORTFOLIO DIAGNOSTICS | |||||
| Fund Net Assets | $4,433 million | ||||
| Number of Holdings | 456 | ||||
| Turnover Rate | 17% | ||||
| Average Market Capitalization1 | $2,129 million | ||||
| Weighted Average P/E Ratio2,3 | 14.5x | ||||
| Weighted Average P/B Ratio2 | 1.7x | ||||
| U.S. Investments (% of Net Assets) | 87.5% | ||||
| Non-U.S. Investments (% of Net Assets) | 10.2% | ||||
| Symbol | |||||
| Investment Class | RYTRX | ||||
| Service Class | RYTFX | ||||
| Consultant Class | RYTCX | ||||
| Institutional Class | RTRIX | ||||
| W Class | RTRWX | ||||
| R Class | RTRRX | ||||
| K Class | RTRKX | ||||
1 Geometric Average. This weighted calculation uses each portfolio holding’s market cap in a way designed to not skew the effect of very large or small holdings; instead, it aims to better identify the portfolio’s center, which Royce believes offers a more accurate measure of average market cap than a simple mean or median. | |||||
2 Harmonic Average. This weighted calculation evaluates a portfolio as if it were a single stock and measures it overall. It compares the total market value of the portfolio to the portfolio’s share in the earnings or book value, as the case may be, of its underlying stocks. | |||||
3 The Fund’s P/E ratio calculation excludes companies with zero or negative earnings (6% of portfolio holdings as of 12/31/12). | |||||
| Morningstar Statistical Measures1 | |||||
| Sharpe Ratio | Standard Deviation | ||||
| RTR | 0.27 | 20.05 | |||
| Russell 2000 | 0.25 | 24.55 | |||
| Category Median | 0.24 | 24.07 | |||
| Best Decile Breakpoint | 0.35 | 21.49 | |||
1 Five years ended 12/31/12. Category Median and Best Decile Breakpoint based on 353 small-cap objective funds (oldest class only) with at least five years of history. | |||||
The Fund beat the Russell 2000 and performed within the top 50% of small-cap objective funds on a risk-adjusted basis, as shown by its Sharpe ratio. In addition, the Fund’s volatility ranked within the Best Decile of small-cap objective funds, while the Fund also produced lower volatility than the Russell 2000. Down Market Performance Comparison All Down Periods of 7.5% or Greater Over the Last 7 Years, in Percentages(%) 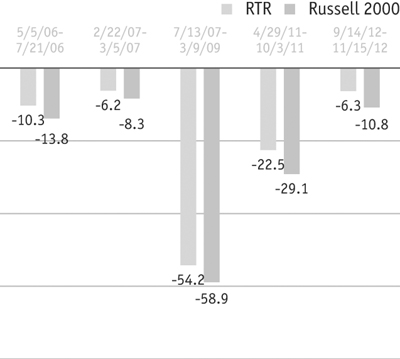 | |||||
| The Royce Funds 2012 Annual Report to Shareholders | 33 |
| Royce Dividend Value Fund |
AVERAGE ANNUAL TOTAL RETURNS Through 12/31/12 | |||||||||||
| July-December 20121 | 11.53 | % | |||||||||
| One-Year | 16.95 | ||||||||||
| Three-Year | 13.25 | ||||||||||
| Five-Year | 6.51 | ||||||||||
| Since Inception (5/3/04) | 8.28 | ||||||||||
| ANNUAL EXPENSE RATIOS | |||||||||||
| Operating Expenses | 1.50 | % | |||||||||
| 1 Not annualized | |||||||||||
| CALENDAR YEAR TOTAL RETURNS | |||||||||||
| Year | RDV | Year | RDV | ||||||||
| 2012 | 16.9 | % | 2008 | -31.5 | % | ||||||
| 2011 | -4.5 | 2007 | 0.0 | ||||||||
| 2010 | 30.1 | 2006 | 19.9 | ||||||||
| 2009 | 37.7 | 2005 | 7.3 | ||||||||
| TOP 10 POSITIONS % of Net Assets | |||||||||||
| Kennametal | 1.6 | % | |||||||||
| Pandora | 1.3 | ||||||||||
| Helmerich & Payne | 1.3 | ||||||||||
| SEI Investments | 1.1 | ||||||||||
| KKR & Co. L.P. | 1.1 | ||||||||||
| Hubbell Cl. B | 1.1 | ||||||||||
| Molex | 1.1 | ||||||||||
| AllianceBernstein Holding L.P. | 1.1 | ||||||||||
| Reinsurance Group of America | 1.1 | ||||||||||
| Oil States International | 1.1 | ||||||||||
| PORTFOLIO SECTOR BREAKDOWN % of Net Assets | |||||||||||
| Financials | 28.2 | % | |||||||||
| Industrials | 21.8 | ||||||||||
| Consumer Discretionary | 11.7 | ||||||||||
| Materials | 11.3 | ||||||||||
| Information Technology | 7.8 | ||||||||||
| Energy | 4.9 | ||||||||||
| Health Care | 4.3 | ||||||||||
| Consumer Staples | 2.9 | ||||||||||
| Telecommunication Services | 0.0 | ||||||||||
| Miscellaneous | 4.5 | ||||||||||
| Cash and Cash Equivalents | 2.6 | ||||||||||
| |||||||||
Managers’ Discussion One encouraging sign that quality small-cap stocks have been mounting a comeback was the strong performance of dividend-paying smaller companies during the last six-plus months of 2012, which could be seen in both the absolute and relative results for Royce Dividend Value Fund (RDV). For the calendar year the Fund gained 16.9%, ahead of its small-cap benchmark, the Russell 2000 Index, which was up 16.3% for the same period. RDV’s performance edge was entirely the result of a stronger rise from the 2012 small-cap low on June 4. The first half of 2012 was otherwise disappointing. The Fund underperformed its benchmark in both the bullish first quarter (+11.9% versus +12.4%) and the bearish second quarter (-6.3% versus -3.5%). These results were born of the closely correlated market phase that began in the spring of 2010, a period in which the Fund mostly struggled compared to the small-cap index. This began to change following the early June low, though one would have been hard pressed to see the significance of this date at the time. The third quarter brought mostly rising prices, and we were very pleased with RDV’s results. The Fund outpaced the Russell 2000 for the period, climbing 6.0% compared to a 5.3% gain for the benchmark. The fourth quarter was a more volatile time, as Hurricane Sandy, the elections, and distress about the fiscal cliff created concerns for investors. RDV beat the benchmark by a wider margin between the beginning of October and the end of December, rising 5.2% for the fourth quarter versus 1.9% for the small-cap index. We were especially happy that the Fund outpaced the Russell 2000 in October when share prices throughout the market were declining. RDV defied the odds, up 0.4% while its benchmark fell 2.2%. From the low on June 4 through December 31, 2012, the Fund gained 17.9% compared to 16.3% for the Russell 2000. The Fund’s strong year helped to solidify longer-term relative advantages for both market cycle and calendar year periods. RDV was ahead of its benchmark from the March 9, 2009 bottom through the end of 2012, rising 167.6% versus 160.9% for the Russell 2000. (More market cycle results can be found on page 6.) The Fund also beat the small-cap index for the three-, five-year, and since inception (5/3/04) periods ended December 31, 2012. RDV’s average annual total return since inception was 8.3%. | |||||||||
| 34 | The Royce Funds 2012 Annual Report to Shareholders |
Performance and Portfolio Review While none of the Fund’s sectors finished the year in the red, Financials and Industrials stood out with particularly strong contributions. Asset manager and money market specialist Federated Investors reaped a benefit from the view that the longer it takes for new money market regulations to take effect, the less troublesome they are likely to be. We held our shares based on that view and on the contention that interest rates will rise at some point, which should help the firm’s business. Two companies from the Industrials sector posted notable net gains. AZZ makes electrical and industrial products and provides galvanizing services for steel fabrication. Revenues rose, which helped to push earnings beyond what Wall Street was expecting. AZZ benefited from high global demand for both utility infrastructure components used for power plant build-outs and steel galvanizing services. After building our position, we took gains in November and December. Valmont Industries was helped by the same growing need for global utility infrastructure builds. The increased capacity improved the firm’s growth outlook while summer droughts in the Midwest also helped its irrigation system sales. It did not take long for the stock of top-10 position Pandora A/S to make its mark in RDV’s portfolio. We initiated a position in July 2012 shortly before its stock took off. The company is a Danish designer, maker, and distributor of hand-finished jewelry. Its shares plummeted 65% in August of 2011 after an unexpected profit warning. It then labored to come back, falling dramatically again in February 2012. All of this made its valuation very attractive to us when we first purchased stock. Its shares then rose in August after the company released better-than-expected results. This trend continued when strong third-quarter results were released early in November, again pushing its stock upward. Artio Global Investors is a New York City-based asset manager that first attracted us with its impressive long-term track record with non-U.S. equities. The stock suffered from declining assets and revenues. Eventually deciding that we liked its dividend, its attractively low share price, and the company’s expertise in a market that we view as poised for growth, we reinitiated a position in August that we added to in September. Strayer Education, the holding company for Strayer University, is a for-profit undergraduate and graduate institution. Its shares struggled throughout the year, but took a dramatic plunge in July. Recent earnings were well below expectations, the firm has been dealing with increased costs and falling enrollments, and negative headlines have highlighted high dropout rates and poorly prepared students in its industry. Although we suspect that for-profit education is here to stay and that Strayer can eventually benefit, we chose to take our losses and move on by selling our shares in July. |
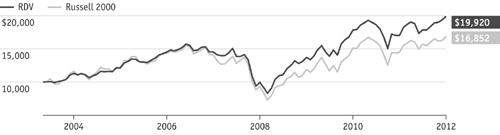 |
| Includes reinvestment of distributions. | |||
| PORTFOLIO DIAGNOSTICS | |||
| Fund Net Assets | $395 million | ||
| Number of Holdings | 238 | ||
| Turnover Rate | 28% | ||
| Average Market Capitalization1 | $2,335 million | ||
| Weighted Average P/E Ratio2,3 | 14.7x | ||
| Weighted Average P/B Ratio2 | 2.0x | ||
| U.S. Investments (% of Net Assets) | 76.3% | ||
| Non-U.S. Investments (% of Net Assets) | 21.1% | ||
| Symbol | |||
| Investment Class | RDVIX | ||
| Service Class | RYDVX | ||
| Institutional Class | RDIIX | ||
1 Geometric Average. This weighted calculation uses each portfolio holding’s market cap in a way designed to not skew the effect of very large or small holdings; instead, it aims to better identify the portfolio’s center, which Royce believes offers a more accurate measure of average market cap than a simple mean or median. | |||
2 Harmonic Average. This weighted calculation evaluates a portfolio as if it were a single stock and measures it overall. It compares the total market value of the portfolio to the portfolio’s share in the earnings or book value, as the case may be, of its underlying stocks. | |||
| MORNINGSTAR STATISTICAL MEASURES1 | |||
| Sharpe Ratio | Standard Deviation | ||
| RDV | 0.38 | 21.54 | |
| Russell 2000 | 0.25 | 24.55 | |
| Category Median | 0.24 | 24.07 | |
| Best Quartile Breakpoint | 0.30 | 22.94 | |
1 Five years ended 12/31/12. Category Median and Best Quartile Breakpoint based on 353 small-cap objective funds (oldest class only) with at least five years of history. | |||
The Fund beat the Russell 2000 and performed within the Best Quartile of small-cap objective funds on a risk-adjusted basis, as shown by its Sharpe ratio. In addition, the Fund’s volatility ranked within the Best Quartile of small-cap objective funds, while the Fund also produced lower volatility than the Russell 2000. | |||
DOWN MARKET PERFORMANCE COMPARISON | |||
 | |||
| The Royce Funds 2012 Annual Report to Shareholders | 35 |
| Royce Micro-Cap Fund |
AVERAGE ANNUAL TOTAL RETURNS Through 12/31/12 | ||||||||||
| July-December 20121 | 5.26 | % | ||||||||
| One-Year | 8.01 | |||||||||
| Three-Year | 7.28 | |||||||||
| Five-Year | 2.57 | |||||||||
| 10-Year | 11.35 | |||||||||
| 15-Year | 9.69 | |||||||||
| 20-Year | 11.49 | |||||||||
| Since Inception (12/31/91) | 12.28 | |||||||||
| ANNUAL EXPENSE RATIO | ||||||||||
| Operating Expenses | 1.50 | % | ||||||||
| 1 Not annualized | ||||||||||
| CALENDAR YEAR TOTAL RETURNS | ||||||||||
| Year | RMC | Year | RMC | |||||||
| 2012 | 8.0 | % | 2004 | 15.8 | % | |||||
| 2011 | -12.1 | 2003 | 52.6 | |||||||
| 2010 | 30.1 | 2002 | -13.4 | |||||||
| 2009 | 55.7 | 2001 | 23.1 | |||||||
| 2008 | -40.9 | 2000 | 16.7 | |||||||
| 2007 | 7.1 | 1999 | 13.7 | |||||||
| 2006 | 22.3 | 1998 | -3.3 | |||||||
| 2005 | 11.5 | 1997 | 24.7 | |||||||
| TOP 10 POSITIONS % of Net Assets | ||||||||||
| Marten Transport | 1.3 | % | ||||||||
| Graham Corporation | 1.2 | |||||||||
| Perry Ellis International | 1.2 | |||||||||
| Anaren | 1.2 | |||||||||
| Universal Stainless & Alloy Products | 1.1 | |||||||||
| Olympic Steel | 1.1 | |||||||||
| Patriot Transportation Holding | 1.1 | |||||||||
| GP Strategies | 1.1 | |||||||||
| Quaker Chemical | 1.1 | |||||||||
| Total Energy Services | 1.0 | |||||||||
| PORTFOLIO SECTOR BREAKDOWN % of Net Assets | ||||||||||
| Industrials | 21.3 | % | ||||||||
| Materials | 15.4 | |||||||||
| Information Technology | 14.8 | |||||||||
| Consumer Discretionary | 14.6 | |||||||||
| Health Care | 10.1 | |||||||||
| Energy | 8.3 | |||||||||
| Financials | 5.8 | |||||||||
| Consumer Staples | 1.9 | |||||||||
| Telecommunication Services | 0.8 | |||||||||
| Utilities | 0.2 | |||||||||
| Miscellaneous | 5.0 | |||||||||
| Cash and Cash Equivalents | 1.8 | |||||||||
 |
Manager’s Discussion Two thousand twelve was a difficult year for Royce Micro-Cap Fund (RMC), which made for a poor relative performance for the calendar year. The Fund was up 8.0% in 2012, trailing its benchmark, the Russell Microcap Index, and the small-cap Russell 2000 Index, which posted respective calendar-year gains of 19.7% and 16.3%. RMC struggled to keep pace with both indexes following a micro-cap high on March 26, 2012 (this high lasted into September). During the first half of the year, the Fund was up 2.6% versus gains of 13.0% for its benchmark and 8.5% for the small-cap Russell 2000 Index for the same period. The second half was only slightly better. While the rally that enlivened the summer months was welcome for stocks as a whole, it bore too close a resemblance to 2012’s first quarter, a period in which the Fund acquitted itself well on an absolute basis but trailed both the micro-cap and small-cap indexes. For the third quarter, RMC gained 4.7% versus 5.9% for its benchmark and 5.3% for the Russell 2000. The Fund thus remained behind as we entered the fourth quarter, a more unsettled period in which we would typically expect the portfolio to have fared better, particularly on a relative basis. Attempting to make sense of Hurricane Sandy, the elections, the looming fiscal cliff, and the initiation of a fourth round of monetary stimulus in mid-December, the markets weaved first this way then that, finishing the quarter for the most part flat to slightly negative. RMC was up 0.5% in the year’s final quarter compared to gains of 0.0% for the Russell Microcap and 1.9% for the Russell 2000. The Fund’s heavier weightings in more economically sensitive areas of the micro-cap space—including Materials and Energy—hindered results for the calendar year. This left us in a dilemma that is typically far more temporary—our disciplined approach and preference for bargain-priced companies with strong balance sheets and above-average returns on invested capital have led us to companies that have had far more muted participation in recent rallies while they have been just as fully sold off during downturns. Needless to say, this frustrating pattern has persisted for far longer than any of us would like. RMC outperformed the Russell Microcap from the previous small-cap peak on July 13, 2007 through December 31, 2012 up 7.9% versus -6.9%. (Market results can be found on page 6.) The Fund also outpaced its benchmark for the five- and 10-year periods ended December 31, 2012, while it beat the Russell 2000 for the 10-, 15-, 20-year, and since inception (12/31/91) periods. (Data for the micro-cap index goes back only as far as 2000.) The Fund’s average annual total return since inception was 12.3%. |
| 36 | The Royce Funds 2012 Annual Report to Shareholders |
Performance and Portfolio Review |
There was significant bifurcation in the micro-cap market in 2012, where strong performance came from two extremes in the asset class while many companies left in the middle languished. This barbell-shaped market consisted of high-yielding, fixed-income-looking issues at one end—primarily REITs (real estate investment trusts) and MLPs (master limited partnerships), which many investors saw as more stable. The other end was made up of companies that were growing very quickly, but were mostly more speculative types of companies that lacked the strong business qualities that we seek for the portfolio. These were primarily higher-growth and higher-risk investments in sectors and industries such as biotech, fast-growing consumer oriented companies, and high-growth tech stocks. Very few investors were interested in the kinds of micro-cap companies that were attracting our attention—businesses with good balance sheets and solid returns on invested capital. The bulk of these stocks apparently looked too risky to one segment of investors and not fast-growing enough to another. Top-10 holding GP Strategies provides customized training services for a growing number of industries in the U.S. and U.K. We have long admired both its business and its successful execution in challenging markets for its industry. Several acquisitions over the last few years also helped its business to improve, something increasing numbers of investors began to notice. Geospace Technologies makes seismic data instruments. Innovations with wireless technology and strong margins kept its stock price climbing through much of the year. We began to take gains in February. We began to sell our shares of Super Group more aggressively in October. This Singapore-based business makes breakfast cereal, instant beverages, and other food products. Double-digit sales and profit growth in its fiscal third quarter gave its stock price a lift. Canadian gold mining business Richmont Mines detracted most from performance in 2012. The company’s CEO resigned in February before the firm announced revised reserve and resource guidance on several mines. These struggles were compounded when a mine closed in November. We began to sell our shares in December. Lamprell faced its own share of trouble in 2012. While the firm remains a leader in the repair and refurbishment of drilling rigs, it had problems with suppliers in its efforts to enter the rig construction business. Its share price then fell more dramatically in May when the company issued the first of five profit warnings on the heels of insider selling. Our thought was that this historically well-run business could learn from these missteps, benefit from its new management, and eventually recover. |
 |
| Includes reinvestment of distributions. |
| PORTFOLIO DIAGNOSTICS | |||||
| Fund Net Assets | $971 million | ||||
| Number of Holdings | 204 | ||||
| Turnover Rate | 15% | ||||
| Average Market Capitalization1 | $368 million | ||||
| Weighted Average P/E Ratio2,3 | 14.9x | ||||
| Weighted Average P/B Ratio2 | 1.5x | ||||
| U.S. Investments (% of Net Assets) | 64.5% | ||||
| Non-U.S. Investments (% of Net Assets) | 33.7% | ||||
| Symbol | |||||
| Investment Class | RYOTX | ||||
| Service Class | RMCFX | ||||
| Consultant Class | RYMCX | ||||
1 Geometric Average. This weighted calculation uses each portfolio holding’s market cap in a way designed to not skew the effect of very large or small holdings; instead, it aims to better identify the portfolio’s center, which Royce believes offers a more accurate measure of average market cap than a simple mean or median. | |||||
2 Harmonic Average. This weighted calculation evaluates a portfolio as if it were a single stock and measures it overall. It compares the total market value of the portfolio to the portfolio’s share in the earnings or book value, as the case may be, of its underlying stocks. | |||||
3 The Fund’s P/E ratio calculation excludes companies with zero or negative earnings (22% of portfolio holdings as of 12/31/12). | |||||
| MORNINGSTAR STATISTICAL MEASURES1 | |||||
| Sharpe Ratio | Standard Deviation | ||||
| RMC | 0.21 | 24.14 | |||
| Russell Microcap | 0.17 | 25.61 | |||
| Category Median | 0.23 | 24.99 | |||
| Best Quartile Breakpoint | 0.29 | 24.31 | |||
1 Five years ended 12/31/12. Category Median and Best Quartile Breakpoint based on 27 micro-cap objective funds (oldest class only) with at least five years of history. | |||||
| |||||
| DOWN MARKET PERFORMANCE COMPARISON All Down Periods of 7.5% or Greater Over the Last 7 Years, in Percentages(%) | |||||
 | |||||
| The Royce Funds 2012 Annual Report to Shareholders | 37 |
| Royce Opportunity Fund |
AVERAGE ANNUAL TOTAL RETURNS Through 12/31/12 | |||||||||||
| July-December 20121 | 10.20 | % | |||||||||
| One-Year | 22.59 | ||||||||||
| Three-Year | 12.60 | ||||||||||
| Five-Year | 4.67 | ||||||||||
| 10-Year | 12.02 | ||||||||||
| 15-Year | 11.39 | ||||||||||
| Since Inception (11/19/96) | 12.22 | ||||||||||
| ANNUAL EXPENSE RATIO | |||||||||||
| Operating Expenses | 1.17 | % | |||||||||
| 1 Not annualized | |||||||||||
| CALENDAR YEAR TOTAL RETURNS | |||||||||||
| Year | ROF | Year | ROF | ||||||||
| 2012 | 22.6 | % | 2004 | 17.5 | % | ||||||
| 2011 | -13.0 | 2003 | 72.9 | ||||||||
| 2010 | 33.8 | 2002 | -17.0 | ||||||||
| 2009 | 62.1 | 2001 | 17.3 | ||||||||
| 2008 | -45.7 | 2000 | 19.8 | ||||||||
| 2007 | -2.0 | 1999 | 32.3 | ||||||||
| 2006 | 18.8 | 1998 | 4.9 | ||||||||
| 2005 | 4.8 | 1997 | 20.8 | ||||||||
| TOP 10 POSITIONS % of Net Assets | |||||||||||
| Apogee Enterprises | 0.8 | % | |||||||||
| Kaiser Aluminum | 0.8 | ||||||||||
| NCI Building Systems | 0.8 | ||||||||||
| Piper Jaffray | 0.7 | ||||||||||
| Texas Industries | 0.7 | ||||||||||
| Quanex Building Products | 0.7 | ||||||||||
| Unifi | 0.7 | ||||||||||
| Jones Group (The) | 0.7 | ||||||||||
| RTI International Metals | 0.7 | ||||||||||
| OM Group | 0.7 | ||||||||||
| PORTFOLIO SECTOR BREAKDOWN % of Net Assets | |||||||||||
| Information Technology | 23.1 | % | |||||||||
| Industrials | 20.6 | ||||||||||
| Consumer Discretionary | 16.2 | ||||||||||
| Financials | 11.4 | ||||||||||
| Materials | 9.5 | ||||||||||
| Energy | 4.5 | ||||||||||
| Health Care | 2.5 | ||||||||||
| Consumer Staples | 0.7 | ||||||||||
| Telecommunication Services | 0.4 | ||||||||||
| Miscellaneous | 4.0 | ||||||||||
| Preferred Stock | 0.4 | ||||||||||
| Cash and Cash Equivalents | 6.7 | ||||||||||
 | |||||||||
Manager’s Discussion The calendar year return for Royce Opportunity Fund (ROF) was strong on both an absolute and relative basis. The Fund gained an impressive 22.6% in 2012, outperforming its small-cap benchmark, the Russell 2000 Index, which was up 16.3% for the same period. We have been pleased with the Fund’s recent performance, especially when considering that it was achieved in a market climate that has not been hospitable of late to active management styles in general and small-cap value approaches in particular. The Fund started the year with full participation in the bull run that lasted through almost the entire first quarter, when ROF rose 17.4% compared to 12.4% for the Russell 2000. The Fund then fell 5.3% in the bearish second quarter while the small-cap index was down 3.5%, which gave ROF a solid advantage in the year’s first half. The market rallied again following the 2012 small-cap low on June 4, a rally that for some stocks lasted through the end of the year. The Fund was up 4.2% in the third quarter versus a gain of 5.3% for its benchmark. The fourth quarter was more unsettled. Investors reacted, though less dramatically than in the second quarter, to several developments, including Hurricane Sandy, the elections, and anxiety about the fiscal cliff. The Fund enjoyed a terrific fourth quarter, and a particularly solid October, when it lost 1.0% compared to a decline of 2.2% for the small-cap index. For the quarter as a whole, ROF was up 5.8% versus 1.9% for the Russell 2000. The Fund has been historically strong in bull phases. For the periods ended December 31, 2012, ROF beat the small-cap index from the March 9, 2009 small-cap bottom (+243.8% versus +160.9%), from the October 3, 2011 small-cap low (+54.0% versus +42.0%), and from the June 4, 2012 small-cap low (+19.8% versus +16.3%). (More market cycle results can be found on page 6.) The Fund outperformed the Russell 2000 for the three-, five-, 10-, 15-year, and since inception (11/19/96) periods ended December 31, 2012. ROF’s average annual total return since inception was 12.2%. While there continues to be great uncertainty and the pace of growth remains fairly muted, it is important to remember that the economy is nonetheless expanding. Moreover, certain resurgent areas were particularly strong in 2012, such as housing, automobiles, and many consumer areas. The market rewarded these industries over the last 12 months as many | |||||||||
| 38 | The Royce Funds 2012 Annual Report to Shareholders |
Performance and Portfolio Review investors, flush with liquidity thanks to record low interest rates, were hungry for growth. The portfolio was well positioned to benefit from these developments, enjoying particular success with holdings related to housing. Contributions came from companies ranging from builders to mortgage businesses. Louisiana-Pacific Corporation manufactures building products for new home construction, repair, and remodeling. With its stock price rising through most of the year, we began to slowly reduce our position in March. Apogee Enterprises makes a variety of glass products such as architectural glass and thermo-glass. An anticipated increase in commercial building seemed to drive its share price upward, prompting us to begin taking gains in May. We did something similar with M.D.C. Holdings, a Colorado-based homebuilder and mortgage services business with an experienced management team that guided the company effectively through the housing crisis by getting leaner and generating cash. We started to slowly sell shares in April. Beginning in November, we also thinned out our position in the preferred shares of homebuilder Hovnanian Enterprises. Small-caps are routinely subject to the ‘urge to merge,’ and 2012 was no exception, at least for ROF’s portfolio. In the first half alone nearly a dozen holdings were acquired, including the Fund’s top contributor in 2012, Cost Plus, which was bought by Bed Bath & Beyond in a deal that closed late in June. Cost Plus retails specialty food items, kitchen utensils, and other home goods. New management emphasized this merchandise while de-emphasizing furniture, helping the firm to operate more effectively. We finished selling our stake shortly after the announcement was made in early May. Disappointments were few and included supermarket and pharmacy operator SUPERVALU, which is a turnaround candidate that had not yet reversed direction by the end of December. (In early January its price began to rise when a private equity firm announced that it would buy several of its supermarket and pharmacy lines.) We were drawn to its solid business and attractive cash-flow characteristics, reasoning that these could help its business to recover. Events in early July then forced us to reconsider our analysis. We still see the potential for a turnaround, but a tough pricing environment and dismal sales mean that more patience will be needed. Actively trading the stock in 2012, we began to trim our stake in October and November. We felt a similar need for patience with shipping and transport company Arkansas Best, which continued to struggle through a difficult period for its industry. We first built a position into early April and then reduced it between late April and early September. Dramatic share price declines led us to start buying again in October. Its valuation remained compelling, and we like the firm’s expertise in its industry. |
 |
| Includes reinvestment of distributions. | |||
| PORTFOLIO DIAGNOSTICS | |||
| Fund Net Assets | $1,844 million | ||
| Number of Holdings | 304 | ||
| Turnover Rate | 34% | ||
| Average Market Capitalization1 | $632 million | ||
| Weighted Average P/E Ratio2,3 | 13.7x | ||
| Weighted Average P/B Ratio3 | 1.2x | ||
| U.S. Investments (% of Net Assets) | 90.6% | ||
| Non-U.S. Investments (% of Net Assets) | 2.7% | ||
| Symbol | |||
| Investment Class | RYPNX | ||
| Service Class | RYOFX | ||
| Consultant Class | ROFCX | ||
| Institutional Class | ROFIX | ||
| R Class | ROFRX | ||
| K Class | ROFKX | ||
1 Geometric Average. This weighted calculation uses each portfolio holding’s market cap in a way designed to not skew the effect of very large or small holdings; instead, it aims to better identify the portfolio’s center, which Royce believes offers a more accurate measure of average market cap than a simple mean or median. | |||
2 Harmonic Average. This weighted calculation evaluates a portfolio as if it were a single stock and measures it overall. It compares the total market value of the portfolio to the portfolio’s share in the earnings or book value, as the case may be, of its underlying stocks. | |||
| MORNINGSTAR STATISTICAL MEASURES1 | |||
| Sharpe Ratio | Standard Deviation | ||
| ROF | 0.29 | 31.61 | |
| Russell 2000 | 0.25 | 24.55 | |
| Category Median | 0.24 | 24.07 | |
| Best Quartile Breakpoint | 0.30 | 22.94 | |
1 Five years ended 12/31/12 Category Median and Best Quartile Breakpoint based on 353 small-cap objective funds (oldest class only) with at least five years of history. | |||
The Fund beat the Russell 2000 and performed within the top 50% of small-cap objective funds on a risk-adjusted basis, as shown by its Sharpe ratio. | |||
DOWN MARKET PERFORMANCE COMPARISON | |||
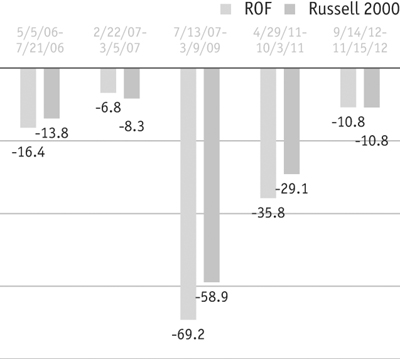 | |||
| The Royce Funds 2012 Annual Report to Shareholders | 39 |
| Royce Global Value Fund |
AVERAGE ANNUAL TOTAL RETURNS Through 12/31/12 | ||||||||||
| July-December 20121 | 11.51 | % | ||||||||
| One-Year | 11.03 | |||||||||
| Three-Year | 7.00 | |||||||||
| Five-Year | 3.57 | |||||||||
| Since Inception (12/29/06) | 5.28 | |||||||||
| ANNUAL EXPENSE RATIOS | ||||||||||
| Gross Operating Expenses | 1.77 | % | ||||||||
| Net Operating Expenses | 1.69 | |||||||||
| 1 Not annualized | ||||||||||
| CALENDAR YEAR TOTAL RETURNS | ||||||||||
| Year | RGV | Year | RGV | |||||||
| 2012 | 11.0 | % | 2009 | 61.9 | % | |||||
| 2011 | -18.7 | 2008 | -39.9 | |||||||
| 2010 | 35.7 | 2007 | 14.3 | |||||||
| TOP 10 POSITIONS % of Net Assets | ||||||||||
| Semperit AG Holding | 3.0 | % | ||||||||
| Mayr-Melnhof Karton | 3.0 | |||||||||
| Helmerich & Payne | 2.7 | |||||||||
| Ashmore Group | 2.6 | |||||||||
| Trican Well Service | 2.5 | |||||||||
| FamilyMart | 2.3 | |||||||||
| Pason Systems | 2.3 | |||||||||
| Recordati | 2.2 | |||||||||
| Jupiter Fund Management | 2.2 | |||||||||
| Value Partners Group | 2.1 | |||||||||
| PORTFOLIO SECTOR BREAKDOWN % of Net Assets | ||||||||||
| Materials | 19.8 | % | ||||||||
| Industrials | 16.9 | |||||||||
| Financials | 13.8 | |||||||||
| Consumer Discretionary | 10.6 | |||||||||
| Information Technology | 10.1 | |||||||||
| Health Care | 9.7 | |||||||||
| Energy | 8.9 | |||||||||
| Consumer Staples | 5.9 | |||||||||
| Cash and Cash Equivalents | 4.3 | |||||||||
| PORTFOLIO COUNTRY BREAKDOWN1,2 % of Net Assets | ||||||||||
| United States | 17.7 | % | ||||||||
| United Kingdom | 11.1 | |||||||||
| Japan | 10.6 | |||||||||
| Canada | 9.3 | |||||||||
| Austria | 6.0 | |||||||||
| Hong Kong | 4.3 | |||||||||
| South Africa | 4.2 | |||||||||
| Germany | 3.7 | |||||||||
| Switzerland | 3.0 | |||||||||
| 1 Represents countries that are 3% or more of net assets. | ||||||||||
| 2 Securities are categorized by their country of headquarters. | ||||||||||
 |
Managers’ Discussion Royce Global Value Fund (RGV) gained 11.0% in 2012, lagging its benchmark, the Russell Global Small Cap Index, which was up 17.7% for the same period. During the decidedly bullish first quarter the Fund gained 13.1%, staying close to its benchmark, which rose 13.7%. Anxieties about European sovereign debt, the fragility of the U.S. economy, and the slowing pace of growth in China drove share prices down across the globe between late March and early June, which made for a grim second quarter. RGV fell 11.9% during this quarter compared to a decline of 6.7% for its global small-cap benchmark. Underperformance was driven in large part by the share-price collapse of a previously profitable holding—Lamprell—and the Fund’s significant overweight in the Materials sector. The second half of the year was far better. When news came out of Europe in late June that more definitive action would be taken to shore up the finances of troubled Spain and Italy, the markets rallied. The good times lasted in some cases through the end of the year and made for a bullish third quarter in which the Fund gained 8.8% versus its benchmark’s 7.1% increase. The pace of the rally slackened in the fourth quarter, though small-cap share prices in general continued to climb. RGV was up 2.5% in the fourth quarter versus a gain of 3.6% for the Russell Global Small Cap. The Fund rose a bit more slowly than its benchmark during the rally that began following the global small-cap index’s 2012 low on June 4, but its second half was strong on an absolute basis. From the June low through the end of December, RGV was up 15.2% compared to 18.8% for the benchmark; for the second half, the Fund gained 11.5% versus 11.0% for the Russell Global Small Cap. RGV also beat its benchmark for the five-year and since inception (12/29/06) periods ended December 31, 2012. In addition to holdings located in the U.S., Japan, and Hong Kong, the Fund enjoyed success with several European holdings. This merits mentioning because so many observers seem to have written Europe off. Considering the eurozone’s ongoing debt and currency concerns, this pessimism is not baseless. However, the situation is far more nuanced than is typically reported. One can almost color in a map of corporate Europe by the strength |
| 40 | The Royce Funds 2012 Annual Report to Shareholders |
Performance and Portfolio Review |
of balance sheets with the U.K. and the area north of the Alps (in particular Switzerland, Germany, France, Scandinavia, and northern Italy), while most of the bad news has been coming from peripheral markets such as Greece, Spain, and Ireland. The bulk of our European investments have been in those economies and stock markets that have been more stable or successful. In Germany, to take one instance, unemployment hit a 20-year low in 2012. Employment levels were at a 40-year high driven by robust export-centered industries. So while many look at Europe and conclude that the lights have gone out, we see many areas that continue to function (or flourish), where small-cap companies took market share and went on creating value in 2012. Seven of the Fund’s eight equity sectors finished the year with net gains while net losses in the Energy sector were modest. Industrials led all sectors by a wide margin, though notable net gains also came from Materials (which recovered nicely in the second half), Financials, Information Technology, and Health Care. The top performer in 2012, in the Industrials sector and in the portfolio as a whole, was Moshi Moshi Hotline, a Japanese business that offers call centers, back office services, consulting, and other services. Its stock fell sharply in the aftermath of the March 2011 earthquake and had not yet recovered by early 2012. We were attracted to its core businesses, dividend yield, and attractive valuation, so we first built our position in the first half of 2011. Its stock soared in early August when the company significantly raised its consolidated mid-year revenue outlook based primarily on increased sales and improved business efficiency. After buying in the spring, we reduced our position on the heels of this development between late August and October. Lamprell, which had an outsized and unfortunate effect on calendar-year results, was the Fund’s number-one detractor in 2012. The company repairs and refurbishes drilling rigs and encountered supply-chain problems in its first foray into the rig construction business. Its share price then fell dramatically in May when the company issued the first of an eventual five profit warnings on the heels of insider selling. Concluding that the new-build business line was structurally unattractive and a hindrance to managing the company as well as it had been before, we sold our investment in June. A slumping stock price led us to add to our stake in top-10 holding Trican Well Service in March. A long-time Royce favorite, we were initially attracted to its well-run business and low-debt balance sheet and continue to hold a high opinion of this specialized equipment and service provider for drilling, completion, and reworking oil and gas wells. A poor market for many energy stocks was the major reason why its stock struggled through most of 2012. |
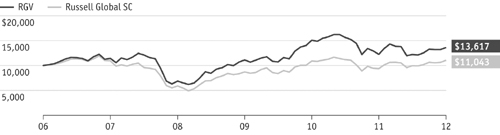 |
| Includes reinvestment of distributions. |
| PORTFOLIO DIAGNOSTICS | |||||
| Fund Net Assets | $300 million | ||||
| Number of Holdings | 63 | ||||
| Turnover Rate | 36% | ||||
| Average Market Capitalization1 | $1,618 million | ||||
| Weighted Average P/E Ratio2,3 | 12.9x | ||||
| Weighted Average P/B Ratio2 | 1.9x | ||||
| Ticker Symbol | |||||
| Investment Class | RGVIX | ||||
| Service Class | RIVFX | ||||
| Consultant Class | RGVHX | ||||
| R Class | RGVRX | ||||
| K Class | RGVKR | ||||
1 Geometric Average. This weighted calculation uses each portfolio holding’s market cap in a way designed to not skew the effect of very large or small holdings; instead, it aims to better identify the portfolio’s center, which Royce believes offers a more accurate measure of average market cap than a simple mean or median. | |||||
2 Harmonic Average. This weighted calculation evaluates a portfolio as if it were a single stock and measures it overall. It compares the total market value of the portfolio to the portfolio’s share in the earnings or book value, as the case may be, of its underlying stocks. | |||||
3 The Fund’s P/E ratio calculation excludes companies with zero or negative earnings (2% of portfolio holdings as of 12/31/12). | |||||
| MORNINGSTAR STATISTICAL MEASURES1 | |||||
| Sharpe Ratio | Standard Deviation | ||||
| RGV | 0.25 | 26.72 | |||
| Russell Global Small Cap | 0.12 | 24.57 | |||
| Category Median | 0.12 | 24.51 | |||
| Best Quartile Breakpoint | 0.25 | 22.93 | |||
1 Five years ended 12/31/12. Category Median and Best Quartile Breakpoint based on 21 world stock small-cap objective funds (oldest class only) with at least five years of history. | |||||
The Fund beat the Russell Global Small Cap and performed within the top 50% of world stock small-cap objective funds on a risk-adjusted basis, as shown by its Sharpe ratio. DOWN MARKET PERFORMANCE COMPARISON All Down Periods of 7.5% or Greater in Percentages(%) 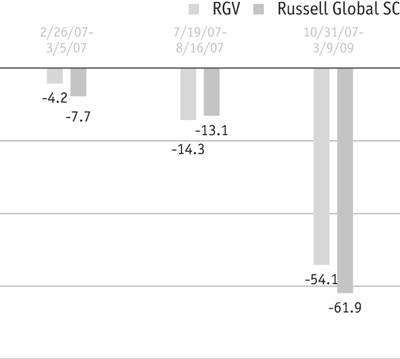 | |||||
| The Royce Funds 2012 Annual Report to Shareholders | 41 |
| Royce International Smaller-Companies Fund |
AVERAGE ANNUAL TOTAL RETURNS Through 12/31/12 | |||||||||||
| July-December 20121 | 14.27 | % | |||||||||
| One-Year | 19.39 | ||||||||||
| Three-Year | 7.05 | ||||||||||
| Since Inception (6/30/08) | 5.79 | ||||||||||
| ANNUAL EXPENSE RATIOS | |||||||||||
| Gross Operating Expenses | 2.15 | % | |||||||||
| Net Operating Expenses | 1.69 | ||||||||||
| 1 Not annualized | |||||||||||
| CALENDAR YEAR TOTAL RETURNS | |||||||||||
| Year | RIS | Year | RIS | ||||||||
| 2012 | 19.4 | % | 2010 | 26.5 | % | ||||||
| 2011 | -18.7 | 2009 | 50.3 | ||||||||
| TOP 10 POSITIONS % of Net Assets | |||||||||||
| Recordati | 1.7 | % | |||||||||
| Semperit AG Holding | 1.3 | ||||||||||
| Takkt | 1.3 | ||||||||||
| DiaSorin | 1.3 | ||||||||||
| Santen Pharmaceutical | 1.2 | ||||||||||
| Mayr-Melnhof Karton | 1.2 | ||||||||||
| Ashmore Group | 1.2 | ||||||||||
| Sulzer | 1.2 | ||||||||||
| SimCorp | 1.2 | ||||||||||
| Partners Group Holding | 1.2 | ||||||||||
| PORTFOLIO SECTOR BREAKDOWN % of Net Assets | |||||||||||
| Consumer Discretionary | 22.2 | % | |||||||||
| Health Care | 18.0 | ||||||||||
| Industrials | 14.5 | ||||||||||
| Financials | 12.6 | ||||||||||
| Materials | 11.5 | ||||||||||
| Information Technology | 7.7 | ||||||||||
| Consumer Staples | 6.6 | ||||||||||
| Energy | 4.0 | ||||||||||
| Cash and Cash Equivalents | 2.9 | ||||||||||
| PORTFOLIO COUNTRY BREAKDOWN1,2 % of Net Assets | |||||||||||
| Japan | 12.3 | % | |||||||||
| United Kingdom | 9.9 | ||||||||||
| France | 9.6 | ||||||||||
| Switzerland | 8.5 | ||||||||||
| Hong Kong | 8.4 | ||||||||||
| Germany | 6.3 | ||||||||||
| Italy | 3.7 | ||||||||||
| South Africa | 3.2 | ||||||||||
| India | 3.2 | ||||||||||
| China | 3.1 | ||||||||||
| 1 Represents countries that are 3% or more of net assets. | |||||||||||
| 2 Securities are categorized by the country of their headquarters. | |||||||||||
 | |||||||||
Managers’ Discussion While perception held otherwise, many non-U.S. markets finished 2012 in soundly bullish shape. This could be seen in the calendar-year performance for Royce International Smaller-Companies Fund (RIS). The Fund was up 19.4% in 2012, ahead of its benchmark, the Russell Global ex-U.S. Small Cap Index, which gained 18.8% for the same period. Perhaps those who believed that foreign stock markets were worth avoiding can be forgiven considering that the first half of the year featured the shifting extremes of the alternately bullish and bearish moods that investors have been in over the last few years. The first quarter built on the up-market momentum established late in 2011 when the ECB (European Central Bank) announced a plan to help Italy and Spain escape potential insolvency. For the quarter, RIS was up 13.8%, just behind the non-U.S. small-cap index, which gained 14.4%. Yet worries about European debt resurfaced before the end of March, joined by anxiety over the pace of growth in both the U.S. and Chinese economies. Fatalism was once again substituted for confidence, which drove share prices down in the second quarter when the Fund fell 8.2% compared to a decline of 8.5% for its benchmark. After finishing the first half slightly behind the non-U.S. small-cap index, the Fund fared better in the more mildly bullish third quarter. RIS rose 9.3% versus 8.3% for the Russell Global ex-U.S. Small Cap. Renewed optimism over an ECB announcement that more would be done to keep certain eurozone nations from defaulting on debt was the chief catalyst. The year’s final quarter saw share prices continue to rise, though again at a slower rate than was the case earlier in the year. For the fourth quarter, RIS climbed 4.6%, close to its benchmark’s gain of 4.8% for the same period. These results gave the Fund a second-half advantage, up 14.3% versus 13.5% for the Russell Global ex-U.S. Small Cap. RIS also outperformed its benchmark for the three-year and since inception (6/30/08) periods ended December 31, 2012. One dilemma facing investors in non-U.S. companies is that the ECB has often sounded more resolute about dealing with eurozone members’ ongoing struggles with debt than it has been with actually taking action to confront these problems. In spite of this, many investors realize that there will be action at some point and that many European businesses were carrying on successfully even in the absence of policy solutions. We are not entirely confident that the ECB | |||||||||
| 42 | The Royce Funds 2012 Annual Report to Shareholders |
Performance and Portfolio Review can create a policy that will solve either sovereign debt or currency issues because the structural challenges are likely to prove intractable. However, within the admittedly bleak macro picture we continue to see ample opportunities in Europe, especially in fiscally prudent and/or export-heavy economies such as Germany, France, and Norway, or in non-euro-using nations such as the UK and Switzerland. Equally important are the opportunities in non-European locales such as Hong Kong, Japan, Brazil, and Mexico. It is worth mentioning that holdings from all of these countries made net contributions to results in 2012. With the exception of a very modest net loss from Energy, each of the Fund’s equity sectors posted net gains for the calendar year. Consumer Discretionary and Industrials led by a sizable margin, though notable net gains also came from Health Care, Materials, Financials, and Consumer Staples. The leading industry groups for 2012 included textiles, apparel & luxury goods, machinery, food products, capital markets, and pharmaceuticals. Net losses at the industry level were also small in the 12-month period. Lamprell is a leading UAE-based construction and engineering firm that repairs and refurbishes oil and natural gas rigs. Supply chain problems caused the company to stumble badly in the second quarter when it entered the rig construction business. We found what followed even more distressing: Its share price fell dramatically in May when the company issued the first of an eventual five profit warnings in 2012. The combination of its significantly altered business model, insider selling before the first profit warning, the compromised ability of management to forecast performance and control the business, and a weakened balance sheet convinced us to sell our shares in June. MegaStudy, a South Korean educational firm that specializes in online tutoring and test preparation, was another poor performer in 2012. Confident in the company’s long-term prospects in a rapidly growing field, we built our position in March, April, and September as its stock price fell dramatically on ongoing earnings disappointments. Grendene is a Brazilian company that manufactures footwear and sells it under several brand names including Melissa, Grendha, Ipanema, Rider, and Grendene Kids. Its shares soared, in the second half especially, as rising net income and an acquisition aimed at improving the company’s retail footprint seemed to make its shares increasingly attractive. We took some gains in September. Fuchs Petrolub is a German business that refines and produces industrial and automotive lubricants. The company benefited from growing demand, especially in emerging markets, and a decline in base oil prices, its primary raw material cost input. We reduced our stake in September and October. |
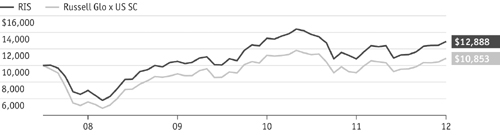 |
| Includes reinvestment of distributions. | |||
| PORTFOLIO DIAGNOSTICS | |||
| Fund Net Assets | $26 million | ||
| Number of Holdings | 136 | ||
| Turnover Rate | 44% | ||
| Average Market Capitalization1 | $1,232 million | ||
| Weighted Average P/E Ratio2,3 | 13.4x | ||
| Weighted Average P/B Ratio2 | 2.0x | ||
| Ticker Symbol | |||
| Service Class | RYGSX | ||
1 Geometric Average. This weighted calculation uses each portfolio holding’s market cap in a way designed to not skew the effect of very large or small holdings; instead, it aims to better identify the portfolio’s center, which Royce believes offers a more accurate measure of average market cap than a simple mean or median. | |||
2 Harmonic Average. This weighted calculation evaluates a portfolio as if it were a single stock and measures it overall. It compares the total market value of the portfolio to the portfolio’s share in the earnings or book value, as the case may be, of its underlying stocks. | |||
| MORNINGSTAR STATISTICAL MEASURES1 | |||
| Sharpe Ratio | Standard Deviation | ||
| RIS | 0.45 | 19.13 | |
| Russell Global ex-U.S. Small Cap | 0.42 | 19.26 | |
| Category Median | 0.48 | 19.81 | |
| Best Quartile Breakpoint | 0.59 | 18.11 | |
1 Three years ended 12/31/12. Category Median and Best Quartile Breakpoint based on 65 foreign small/mid objective funds (oldest class only) with at least three years of history. | |||
The Fund beat the Russell Global ex-U.S. Small Cap on a risk-adjusted basis, as shown by its Sharpe ratio. In addition, the Fund’s volatility ranked within the top 50% of foreign small/mid objective funds, while the Fund also produced lower volatility than the Russell Global ex-U.S. Small Cap. | |||
| The Royce Funds 2012 Annual Report to Shareholders | 43 |
Schedules of Investments
| Royce Pennsylvania Mutual Fund |
| SHARES | VALUE | ||||
| COMMON STOCKS – 99.0% | |||||
| Consumer Discretionary – 14.7% | |||||
| Auto Components - 1.2% | |||||
| 244,900 | $ | 940,416 | |||
Dorman Products | 716,691 | 25,327,860 | |||
Drew Industries | 822,088 | 26,512,338 | |||
Gentex Corporation | 156,200 | 2,939,684 | |||
Spartan Motors | 109,000 | 537,370 | |||
Strattec Security | 150,000 | 3,871,500 | |||
Superior Industries International | 488,000 | 9,955,200 | |||
| 70,084,368 | |||||
| Automobiles - 0.8% | |||||
Thor Industries | 656,950 | 24,589,638 | |||
| 1,504,450 | 25,771,229 | ||||
| 50,360,867 | |||||
| Distributors - 0.4% | |||||
Pool Corporation | 261,400 | 11,062,448 | |||
Weyco Group 3 | 590,500 | 13,794,080 | |||
| 24,856,528 | |||||
| Diversified Consumer Services - 0.9% | |||||
Corinthian Colleges 2 | 100,000 | 244,000 | |||
Lincoln Educational Services | 54,800 | 306,332 | |||
Sotheby’s | 1,273,108 | 42,801,891 | |||
Universal Technical Institute | 753,700 | 7,567,148 | |||
| 50,919,371 | |||||
| Hotels, Restaurants & Leisure - 0.1% | |||||
CEC Entertainment | 140,600 | 4,666,514 | |||
| Household Durables - 2.7% | |||||
| 292,400 | 3,649,152 | ||||
Ethan Allen Interiors 3 | 1,573,910 | 40,465,226 | |||
| 1,029,400 | 1,091,164 | ||||
Harman International Industries | 401,900 | 17,940,816 | |||
La-Z-Boy | 907,300 | 12,838,295 | |||
Mohawk Industries 2 | 371,900 | 33,645,793 | |||
Natuzzi ADR 2 | 2,096,300 | 4,024,896 | |||
NVR 2 | 42,651 | 39,238,920 | |||
| 68,600 | 534,394 | ||||
| 183,400 | 744,604 | ||||
| 912,235 | 4,105,058 | ||||
| 158,278,318 | |||||
| Internet & Catalog Retail - 0.0% | |||||
| 120,000 | 692,400 | ||||
Leisure Equipment & Products - 0.1% | |||||
Arctic Cat 2 | 27,300 | 911,547 | |||
Callaway Golf | 250,000 | 1,625,000 | |||
Leapfrog Enterprises Cl. A 2 | 73,400 | 633,442 | |||
Sturm, Ruger & Co. | 7,800 | 354,120 | |||
| 3,524,109 | |||||
| Media - 1.2% | |||||
† Acquity Group ADR 2 | 36,000 | 277,560 | |||
| 746,800 | 12,374,476 | ||||
Morningstar | 546,800 | 34,355,444 | |||
Rentrak Corporation 2 | 283,265 | 5,520,835 | |||
Scholastic Corporation | 443,000 | 13,095,080 | |||
World Wrestling Entertainment Cl. A | 357,831 | 2,823,286 | |||
| 68,446,681 | |||||
| Multiline Retail - 0.0% | |||||
Tuesday Morning 2 | 370,000 | 2,312,500 | |||
| Specialty Retail - 5.1% | |||||
American Eagle Outfitters | 982,991 | 20,161,145 | |||
| 556,600 | 22,553,432 | ||||
Ascena Retail Group 2 | 2,264,132 | 41,863,801 | |||
Buckle (The) | 638,004 | 28,480,498 | |||
Cato Corporation (The) Cl. A | 1,362,502 | 37,373,430 | |||
GameStop Corporation Cl. A | 1,032,300 | 25,900,407 | |||
Guess? | 908,814 | 22,302,296 | |||
Jos. A. Bank Clothiers 2 | 668,079 | 28,446,804 | |||
| 685,000 | 2,520,458 | ||||
Men’s Wearhouse (The) | 67,533 | 2,104,328 | |||
Penske Automotive Group | 389,200 | 11,711,028 | |||
Pier 1 Imports | 1,210,400 | 24,208,000 | |||
Shoe Carnival 3 | 1,227,698 | 25,155,532 | |||
Stein Mart | 815,929 | 6,152,105 | |||
Wet Seal (The) Cl. A 2 | 204,300 | 563,868 | |||
| 299,497,132 | |||||
| Textiles, Apparel & Luxury Goods - 2.2% | |||||
Barry (R.G.) | 204,344 | 2,895,555 | |||
Columbia Sportswear | 331,061 | 17,665,415 | |||
Crocs 2 | 791,020 | 11,382,778 | |||
| 430,884 | 17,351,699 | ||||
G-III Apparel Group 2 | 608,157 | 20,817,214 | |||
Gildan Activewear | 239,000 | 8,742,620 | |||
| 654,450 | 2,198,952 | ||||
Maidenform Brands 2 | 988,207 | 19,260,154 | |||
Movado Group | 50,000 | 1,534,000 | |||
Steven Madden 2 | 365,966 | 15,469,383 | |||
True Religion Apparel | 407,200 | 10,351,024 | |||
| 140,962 | 3,538,146 | ||||
| 131,206,940 | |||||
| Total (Cost $685,334,812) | 864,845,728 | ||||
| Consumer Staples – 1.5% | |||||
| Food & Staples Retailing - 0.1% | |||||
Village Super Market Cl. A | 80,811 | 2,655,449 | |||
Food Products - 0.5% | |||||
Calavo Growers | 58,200 | 1,467,222 | |||
Cal-Maine Foods | 157,221 | 6,323,429 | |||
Darling International 2 | 20,000 | 320,800 | |||
Industrias Bachoco ADR | 103,886 | 2,900,497 | |||
Sanderson Farms | 366,900 | 17,446,095 | |||
| 28,458,043 | |||||
| Household Products - 0.1% | |||||
Harbinger Group 2 | 1,009,600 | 7,763,824 | |||
| Personal Products - 0.8% | |||||
Inter Parfums | 1,199,410 | 23,340,519 | |||
Nu Skin Enterprises Cl. A 1 | 512,609 | 18,992,163 | |||
| 44 | The Royce Funds 2012 Annual Report to Shareholders | THE ACCOMPANYING NOTES ARE AN INTEGRAL PART OF THESE FINANCIAL STATEMENTS. |
December 31, 2012 |
| SHARES | VALUE | ||||
| Consumer Staples (continued) | |||||
| Personal Products (continued) | |||||
Nutraceutical International | 312,500 | $ | 5,168,750 | ||
| 47,501,432 | |||||
| Total (Cost $66,296,316) | 86,378,748 | ||||
| Energy – 7.4% | |||||
| Energy Equipment & Services - 6.6% | |||||
† C&J Energy Services 2 | 301,177 | 6,457,235 | |||
CARBO Ceramics | 211,700 | 16,584,578 | |||
Ensign Energy Services | 1,710,100 | 26,424,286 | |||
Exterran Holdings 2 | 951,700 | 20,861,264 | |||
Helmerich & Payne | 990,469 | 55,476,169 | |||
ION Geophysical 2 | 816,700 | 5,316,717 | |||
Lufkin Industries | 167,600 | 9,742,588 | |||
Matrix Service 2 | 1,265,043 | 14,547,994 | |||
Oil States International 2 | 949,502 | 67,927,373 | |||
Pason Systems | 2,236,700 | 38,563,792 | |||
Patterson-UTI Energy | 419,800 | 7,820,874 | |||
Rowan Companies 2 | 14,000 | 437,780 | |||
RPC | 1,280,475 | 15,673,014 | |||
SEACOR Holdings | 267,200 | 22,391,360 | |||
ShawCor Cl. A | 264,300 | 10,359,965 | |||
Tidewater | 51,000 | 2,278,680 | |||
Trican Well Service | 1,416,100 | 18,678,227 | |||
Unit Corporation 2 | 1,035,037 | 46,628,417 | |||
Willbros Group 2 | 230,800 | 1,237,088 | |||
| 387,407,401 | |||||
| Oil, Gas & Consumable Fuels - 0.8% | |||||
Cimarex Energy | 345,700 | 19,957,261 | |||
SM Energy | 229,100 | 11,961,311 | |||
Sprott Resource | 2,957,400 | 12,933,237 | |||
VAALCO Energy 2 | 196,000 | 1,695,400 | |||
| 46,547,209 | |||||
| Total (Cost $278,440,062) | 433,954,610 | ||||
| Financials – 9.6% | |||||
| Capital Markets - 5.2% | |||||
Affiliated Managers Group 2 | 238,265 | 31,010,190 | |||
AGF Management Cl. B | 846,600 | 8,443,020 | |||
AllianceBernstein Holding L.P. | 1,911,560 | 33,318,491 | |||
Artio Global Investors Cl. A | 1,397,300 | 2,654,870 | |||
Cohen & Steers | 857,170 | 26,117,970 | |||
Cowen Group 2 | 2,152,377 | 5,273,323 | |||
Diamond Hill Investment Group | 104,900 | 7,118,514 | |||
Federated Investors Cl. B | 2,018,055 | 40,825,253 | |||
| 97,000 | 2,691,750 | ||||
GAMCO Investors Cl. A | 112,200 | 5,954,454 | |||
GFI Group | 580,000 | 1,879,200 | |||
INTL FCStone 2 | 61,217 | 1,065,788 | |||
Janus Capital Group | 650,000 | 5,538,000 | |||
Lazard Cl. A | 1,039,000 | 31,003,760 | |||
Manning & Napier | 677,292 | 8,533,879 | |||
MVC Capital | 223,600 | 2,716,740 | |||
Oppenheimer Holdings Cl. A | 25,000 | 431,750 | |||
SEI Investments | 1,890,900 | 44,133,606 | |||
Sprott | 433,900 | 1,727,399 | |||
Waddell & Reed Financial Cl. A | 862,027 | 30,015,780 | |||
Westwood Holdings Group | 359,735 | 14,713,161 | |||
| 305,166,898 | |||||
| Commercial Banks - 0.1% | |||||
City Holding Company | 228,101 | 7,949,320 | |||
| Diversified Financial Services - 0.5% | |||||
Interactive Brokers Group | 788,600 | 10,788,048 | |||
MSCI Cl. A 2 | 229,500 | 7,112,205 | |||
PICO Holdings 2 | 487,400 | 9,879,598 | |||
| 27,779,851 | |||||
| Insurance - 3.0% | |||||
Alleghany Corporation 2 | 14,200 | 4,762,964 | |||
Allied World Assurance Company | |||||
Holdings | 156,753 | 12,352,136 | |||
Aspen Insurance Holdings | 309,839 | 9,939,635 | |||
Baldwin & Lyons Cl. B | 306,000 | 7,301,160 | |||
Brown & Brown | 755,700 | 19,240,122 | |||
E-L Financial | 40,980 | 17,921,283 | |||
Enstar Group 2 | 142,189 | 15,922,324 | |||
Erie Indemnity Cl. A | 309,000 | 21,388,980 | |||
Gallagher (Arthur J.) & Co. | 611,100 | 21,174,615 | |||
Greenlight Capital Re Cl. A 2 | 470,901 | 10,868,395 | |||
ProAssurance Corporation | 40,400 | 1,704,476 | |||
Reinsurance Group of America | 511,621 | 27,381,956 | |||
RLI Corp. | 65,231 | 4,217,837 | |||
Stewart Information Services | 116,600 | 3,031,600 | |||
| 177,207,483 | |||||
| Real Estate Management & Development - 0.5% | |||||
E-House China Holdings ADR | 343,700 | 1,409,170 | |||
Forestar Group 2 | 50,000 | 866,500 | |||
Jones Lang LaSalle | 301,900 | 25,341,486 | |||
Tejon Ranch 2 | 111,624 | 3,134,402 | |||
| 30,751,558 | |||||
| Thrifts & Mortgage Finance - 0.3% | |||||
BofI Holding 2 | 82,800 | 2,307,636 | |||
Doral Financial 2 | 214,600 | 155,392 | |||
Genworth MI Canada | 715,100 | 16,240,182 | |||
| 18,703,210 | |||||
| Total (Cost $572,479,812) | 567,558,320 | ||||
| Health Care – 7.7% | |||||
| Biotechnology - 0.4% | |||||
Lexicon Pharmaceuticals 2 | 1,522,400 | 3,379,728 | |||
Myriad Genetics 2 | 641,000 | 17,467,250 | |||
| 20,846,978 | |||||
| Health Care Equipment & Supplies - 2.0% | |||||
Analogic Corporation | 278,500 | 20,692,550 | |||
CryoLife | 124,427 | 775,180 | |||
Exactech 2 | 57,000 | 966,150 | |||
| 387,899 | 35,997,027 | ||||
Invacare Corporation | 95,100 | 1,550,130 | |||
| 304,262 | 818,465 | ||||
Merit Medical Systems 2 | 534,586 | 7,430,746 | |||
| THE ACCOMPANYING NOTES ARE AN INTEGRAL PART OF THESE FINANCIAL STATEMENTS. | The Royce Funds 2012 Annual Report to Shareholders | 45 |
Schedules of Investments
| Royce Pennsylvania Mutual Fund (continued) |
| SHARES | VALUE | ||||
| Health Care (continued) | |||||
| Health Care Equipment & Supplies (continued) | |||||
STERIS Corporation | 577,600 | $ | 20,060,048 | ||
SurModics 2 | 346,900 | 7,756,684 | |||
Teleflex | 60,000 | 4,278,600 | |||
Thoratec Corporation 2 | 348,300 | 13,068,216 | |||
Young Innovations | 190,293 | 7,499,447 | |||
| 120,893,243 | |||||
| Health Care Providers & Services - 2.3% | |||||
Almost Family | 34,147 | 691,819 | |||
Chemed Corporation | 382,208 | 26,215,647 | |||
Cross Country Healthcare 2 | 240,700 | 1,155,360 | |||
HealthSouth Corporation 2 | 915,000 | 19,315,650 | |||
| 2,392,970 | 950,009 | ||||
Landauer | 370,334 | 22,668,144 | |||
Magellan Health Services 2 | 264,822 | 12,976,278 | |||
MEDNAX 2 | 157,002 | 12,484,799 | |||
Owens & Minor | 654,000 | 18,645,540 | |||
U.S. Physical Therapy 3 | 656,893 | 18,090,833 | |||
VCA Antech 2 | 111,083 | 2,338,297 | |||
| 135,532,376 | |||||
| Life Sciences Tools & Services - 2.3% | |||||
Bio-Rad Laboratories Cl. A 2 | 83,012 | 8,720,411 | |||
Covance 2 | 340,000 | 19,641,800 | |||
Furiex Pharmaceuticals 2 | 43,625 | 840,217 | |||
ICON ADR 2 | 574,623 | 15,951,534 | |||
Mettler-Toledo International 2 | 196,200 | 37,925,460 | |||
PAREXEL International 2 | 270,000 | 7,989,300 | |||
PerkinElmer | 1,018,020 | 32,311,955 | |||
Techne Corporation | 174,300 | 11,911,662 | |||
| 135,292,339 | |||||
| Pharmaceuticals - 0.7% | |||||
| 246,000 | 6,462,420 | ||||
Hi-Tech Pharmacal 3 | 997,731 | 34,900,630 | |||
| 41,363,050 | |||||
| Total (Cost $345,472,045) | 453,927,986 | ||||
| Industrials – 27.1% | |||||
| Aerospace & Defense - 1.7% | |||||
AeroVironment 2 | 54,900 | 1,193,526 | |||
Astronics Corporation 2 | 96,120 | 2,199,225 | |||
CPI Aerostructures 2 | 79,065 | 791,441 | |||
Cubic Corporation | 266,363 | 12,777,433 | |||
Curtiss-Wright | 255,620 | 8,392,005 | |||
HEICO Corporation | 975,428 | 43,660,157 | |||
HEICO Corporation Cl. A | 151,952 | 4,859,425 | |||
| 95,578 | 480,757 | ||||
Sparton Corporation 2 | 87,208 | 1,209,575 | |||
Teledyne Technologies 2 | 365,766 | 23,800,394 | |||
| 99,363,938 | |||||
| Air Freight & Logistics - 1.0% | |||||
Forward Air | 869,900 | 30,455,199 | |||
Hub Group Cl. A 2 | 247,500 | 8,316,000 | |||
Pacer International 2 | 817,040 | 3,186,456 | |||
UTi Worldwide | 1,364,900 | 18,289,660 | |||
| 60,247,315 | |||||
| Building Products - 2.4% | |||||
AAON | 1,150,650 | 24,014,065 | |||
Ameresco Cl. A 2 | 173,700 | 1,703,997 | |||
American Woodmark 2 | 645,774 | 17,965,433 | |||
Apogee Enterprises | 125,069 | 2,997,904 | |||
Armstrong World Industries | 346,600 | 17,583,018 | |||
Gibraltar Industries 2 | 615,120 | 9,792,710 | |||
Insteel Industries | 233,708 | 2,916,676 | |||
Owens Corning 2 | 808,000 | 29,887,920 | |||
Simpson Manufacturing | 1,084,000 | 35,544,360 | |||
WaterFurnace Renewable Energy | 125,000 | 1,814,618 | |||
| 144,220,701 | |||||
| Commercial Services & Supplies - 2.9% | |||||
Brink’s Company (The) | 1,125,000 | 32,096,250 | |||
Copart 2 | 1,060,012 | 31,270,354 | |||
Healthcare Services Group | 677,275 | 15,733,098 | |||
Mine Safety Appliances | 332,100 | 14,183,991 | |||
Ritchie Bros. Auctioneers | 1,726,900 | 36,074,941 | |||
Steelcase Cl. A | 100,000 | 1,274,000 | |||
Sykes Enterprises 2 | 104,777 | 1,594,706 | |||
Team 2 | 487,388 | 18,540,239 | |||
Tetra Tech 2 | 402,860 | 10,655,647 | |||
TMS International Cl. A 2 | 204,500 | 2,560,340 | |||
Viad Corporation | 203,666 | 5,531,569 | |||
| 169,515,135 | |||||
| Construction & Engineering - 1.5% | |||||
Baker (Michael) | 163,100 | 4,066,083 | |||
Chicago Bridge & Iron | 23,000 | 1,066,050 | |||
Comfort Systems USA | 579,884 | 7,051,390 | |||
EMCOR Group | 1,131,840 | 39,172,982 | |||
KBR | 1,030,300 | 30,826,576 | |||
Layne Christensen 2 | 117,100 | 2,842,017 | |||
Pike Electric | 121,858 | 1,163,744 | |||
Sterling Construction 2 | 244,671 | 2,432,030 | |||
| 88,620,872 | |||||
| Electrical Equipment - 2.7% | |||||
AZZ | 647,858 | 24,897,183 | |||
Brady Corporation Cl. A | 481,900 | 16,095,460 | |||
Encore Wire | 353,079 | 10,701,825 | |||
EnerSys 2 | 58,000 | 2,182,540 | |||
Franklin Electric | 604,700 | 37,594,199 | |||
Global Power Equipment Group | 659,405 | 11,308,796 | |||
GrafTech International 2 | 2,177,806 | 20,449,598 | |||
Powell Industries 2 | 365,000 | 15,158,450 | |||
Preformed Line Products 3 | 311,088 | 18,484,849 | |||
| 156,872,900 | |||||
| Industrial Conglomerates - 0.4% | |||||
Raven Industries | 814,270 | 21,464,157 | |||
Standex International | 24,600 | 1,261,734 | |||
| 22,725,891 | |||||
| 46 | The Royce Funds 2012 Annual Report to Shareholders | THE ACCOMPANYING NOTES ARE AN INTEGRAL PART OF THESE FINANCIAL STATEMENTS. |
December 31, 2012 |
| SHARES | VALUE | ||||
| Industrials (continued) | |||||
| Machinery - 8.1% | |||||
Astec Industries | 70,624 | $ | 2,353,898 | ||
Briggs & Stratton | 252,600 | 5,324,808 | |||
Cascade Corporation | 10,000 | 643,000 | |||
| 19,500 | 1,300,065 | ||||
CLARCOR | 600,400 | 28,687,112 | |||
Columbus McKinnon 2 | 187,150 | 3,091,718 | |||
Donaldson Company | 867,000 | 28,472,280 | |||
Flow International 2 | 192,466 | 673,631 | |||
Foster (L.B.) Company | 126,598 | 5,499,417 | |||
Gardner Denver | 159,400 | 10,918,900 | |||
Gorman-Rupp Company | 49,733 | 1,483,535 | |||
Graco | 605,449 | 31,174,569 | |||
Graham Corporation | 106,248 | 2,071,836 | |||
Hurco Companies 2 | 30,552 | 702,696 | |||
IDEX Corporation | 343,500 | 15,983,055 | |||
Kaydon Corporation | 158,400 | 3,790,512 | |||
Kennametal | 1,809,545 | 72,381,800 | |||
Lincoln Electric Holdings | 1,052,027 | 51,212,674 | |||
Lindsay Corporation | 10,300 | 825,236 | |||
Miller Industries | 48,310 | 736,728 | |||
Nordson Corporation | 576,568 | 36,392,972 | |||
| 75,000 | 2,956,500 | ||||
RBC Bearings 2 | 459,400 | 23,002,158 | |||
Sun Hydraulics | 660,200 | 17,218,016 | |||
Tennant Company | 764,500 | 33,599,775 | |||
Valmont Industries | 300,200 | 40,992,310 | |||
WABCO Holdings 2 | 494,200 | 32,216,898 | |||
Wabtec Corporation | 291,870 | 25,550,300 | |||
| 479,256,399 | |||||
| Marine - 0.2% | |||||
Kirby Corporation 2 | 213,700 | 13,225,893 | |||
| Professional Services - 3.5% | |||||
Advisory Board (The) 2 | 1,232,000 | 57,645,280 | |||
Barrett Business Services | 160,800 | 6,124,872 | |||
Corporate Executive Board | 619,700 | 29,410,962 | |||
| 592,143 | 11,706,667 | ||||
Exponent 2 | 373,893 | 20,874,446 | |||
FTI Consulting 2 | 186,600 | 6,157,800 | |||
GP Strategies 2 | 91,015 | 1,879,460 | |||
Korn/Ferry International 2 | 50,000 | 793,000 | |||
ManpowerGroup | 429,330 | 18,220,765 | |||
On Assignment 2 | 85,000 | 1,723,800 | |||
Robert Half International | 701,100 | 22,309,002 | |||
Towers Watson & Company Cl. A | 367,700 | 20,668,417 | |||
TrueBlue 2 | 438,600 | 6,907,950 | |||
| 204,422,421 | |||||
| Road & Rail - 0.9% | |||||
Arkansas Best | 486,600 | 4,647,030 | |||
Landstar System | 593,500 | 31,135,010 | |||
Patriot Transportation Holding 2 | 254,400 | 7,232,592 | |||
Universal Truckload Services | 661,600 | 12,074,200 | |||
| 55,088,832 | |||||
| Trading Companies & Distributors - 1.5% | |||||
| 568,800 | 12,229,200 | ||||
Applied Industrial Technologies | 936,890 | 39,358,749 | |||
Houston Wire & Cable | 22,700 | 278,529 | |||
MFC Industrial | 42,600 | 364,230 | |||
MSC Industrial Direct Cl. A | 451,200 | 34,011,456 | |||
| 86,242,164 | |||||
| Transportation Infrastructure - 0.3% | |||||
| 1,243,787 | 16,430,426 | ||||
| Total (Cost $1,080,739,108) | 1,596,232,887 | ||||
| Information Technology – 20.6% | |||||
| Communications Equipment - 1.8% | |||||
ADTRAN | 1,243,415 | 24,296,329 | |||
Black Box | 192,502 | 4,685,499 | |||
| 127,841 | 277,415 | ||||
Digi International 2 | 388,644 | 3,680,459 | |||
Finisar Corporation 2 | 64,000 | 1,043,200 | |||
Globecomm Systems 2 | 120,800 | 1,365,040 | |||
Harmonic 2 | 150,000 | 760,500 | |||
NETGEAR 2 | 1,098,942 | 43,320,294 | |||
Oplink Communications 2 | 94,167 | 1,467,122 | |||
Plantronics | 587,942 | 21,677,421 | |||
Polycom 2 | 130,000 | 1,359,800 | |||
| 103,933,079 | |||||
| Computers & Peripherals - 1.1% | |||||
Diebold | 701,000 | 21,457,610 | |||
Lexmark International Cl. A | 349,000 | 8,093,310 | |||
Logitech International 1 | 1,287,100 | 9,704,734 | |||
Rimage Corporation | 153,000 | 1,022,040 | |||
| 289,335 | 23,190,200 | ||||
Super Micro Computer 2 | 417,914 | 4,262,723 | |||
| 67,730,617 | |||||
| Electronic Equipment, Instruments & Components - 8.3% | |||||
Anixter International | 370,564 | 23,708,685 | |||
AVX Corporation | 1,545,821 | 16,663,950 | |||
Benchmark Electronics 2 | 1,009,000 | 16,769,580 | |||
Checkpoint Systems 2 | 134,700 | 1,446,678 | |||
Cognex Corporation | 888,835 | 32,726,905 | |||
Coherent | 781,000 | 39,534,220 | |||
Dolby Laboratories Cl. A 1 | 1,022,450 | 29,988,458 | |||
| 1,167,789 | 19,502,076 | ||||
Electro Rent | 77,074 | 1,185,398 | |||
Fabrinet 2 | 1,326,911 | 17,435,611 | |||
FARO Technologies 2 | 582,175 | 20,772,004 | |||
FEI Company | 17,950 | 995,507 | |||
FLIR Systems | 831,400 | 18,548,534 | |||
Frequency Electronics | 95,400 | 783,234 | |||
Hollysys Automation Technologies 2 | 238,355 | 2,829,274 | |||
IPG Photonics 1 | 700,630 | 46,696,989 | |||
Littelfuse | 183,717 | 11,337,176 | |||
| 214,944 | 236,438 | ||||
Mercury Systems 2 | 180,344 | 1,659,165 | |||
Molex Cl. A | 790,929 | 17,653,535 | |||
MTS Systems | 413,374 | 21,053,138 | |||
Multi-Fineline Electronix 2 | 32,051 | 647,751 | |||
| THE ACCOMPANYING NOTES ARE AN INTEGRAL PART OF THESE FINANCIAL STATEMENTS. | The Royce Funds 2012 Annual Report to Shareholders | 47 |
Schedules of Investments
| Royce Pennsylvania Mutual Fund (continued) |
| SHARES | VALUE | ||||
| Information Technology (continued) | |||||
| Electronic Equipment, Instruments & Components (continued) | |||||
National Instruments | 1,388,700 | $ | 35,842,347 | ||
Newport Corporation 2 | 1,336,722 | 17,978,911 | |||
Park Electrochemical | 70,200 | 1,806,246 | |||
Plexus Corporation 2 | 788,200 | 20,335,560 | |||
| 2,231,739 | 692,955 | ||||
Rofin-Sinar Technologies 2 | 1,269,172 | 27,515,649 | |||
Rogers Corporation 2 | 20,000 | 993,200 | |||
Tech Data 2 | 449,700 | 20,474,841 | |||
TTM Technologies 2 | 300,000 | 2,760,000 | |||
Vishay Intertechnology 2 | 1,679,809 | 17,856,370 | |||
| 488,430,385 | |||||
| Internet Software & Services - 0.2% | |||||
| 1,802,700 | 8,851,257 | ||||
| 600,000 | 282,000 | ||||
Stamps.com 2 | 55,400 | 1,396,080 | |||
ValueClick 2 | 81,645 | 1,584,730 | |||
| 12,114,067 | |||||
| IT Services - 2.5% | |||||
Convergys Corporation | 748,045 | 12,275,418 | |||
CoreLogic 2 | 319,000 | 8,587,480 | |||
Forrester Research | 298,200 | 7,991,760 | |||
ManTech International Cl. A | 967,670 | 25,101,360 | |||
MAXIMUS | 366,600 | 23,176,452 | |||
MoneyGram International 2 | 1,257,239 | 16,708,706 | |||
Sapient Corporation 2 | 1,980,000 | 20,908,800 | |||
| 715,761 | 4,187,202 | ||||
Syntel | 343,200 | 18,392,088 | |||
Total System Services | 389,400 | 8,340,948 | |||
| 145,670,214 | |||||
| Office Electronics - 0.4% | |||||
Zebra Technologies Cl. A 2 | 633,673 | 24,890,675 | |||
| Semiconductors & Semiconductor Equipment - 3.8% | |||||
Advanced Energy Industries 2 | 718,314 | 9,919,916 | |||
Aixtron ADR | 345,300 | 4,126,335 | |||
Alpha & Omega Semiconductor 2 | 163,200 | 1,370,880 | |||
Amtech Systems 2 | 264,100 | 850,402 | |||
ATMI 2 | 140,485 | 2,933,327 | |||
AXT 2 | 148,800 | 418,128 | |||
Cabot Microelectronics | 453,800 | 16,114,438 | |||
Cirrus Logic 2 | 375,500 | 10,878,235 | |||
Diodes 2 | 1,333,700 | 23,139,695 | |||
Exar Corporation 2 | 824,441 | 7,337,525 | |||
Fairchild Semiconductor International 2 | 1,205,300 | 17,356,320 | |||
GSI Technology 2 | 375,280 | 2,353,005 | |||
Integrated Device Technology 2 | 300,000 | 2,190,000 | |||
Integrated Silicon Solution 2 | 696,709 | 6,270,381 | |||
International Rectifier 2 | 873,600 | 15,488,928 | |||
IXYS Corporation | 1,364,764 | 12,473,943 | |||
Kulicke & Soffa Industries 2 | 153,400 | 1,839,266 | |||
LTX-Credence Corporation 2 | 182,800 | 1,199,168 | |||
Micrel | 1,080,800 | 10,267,600 | |||
MKS Instruments | 710,669 | 18,321,047 | |||
Nanometrics 2 | 290,471 | 4,188,592 | |||
OmniVision Technologies 2 | 301,700 | 4,247,936 | |||
Photronics 2 | 496,060 | 2,956,518 | |||
RDA Microelectronics ADR | 200,733 | 2,157,880 | |||
| 89,422 | 1,202,726 | ||||
† Silicon Motion Technology ADR 2 | 142,300 | 2,023,506 | |||
Supertex | 334,000 | 5,861,700 | |||
Teradyne 2 | 1,645,096 | 27,785,671 | |||
Ultra Clean Holdings 2 | 590,540 | 2,899,551 | |||
| 142,800 | 4,215,456 | ||||
| 222,388,075 | |||||
| Software - 2.5% | |||||
ACI Worldwide 2 | 427,600 | 18,681,844 | |||
Actuate Corporation 2 | 304,872 | 1,707,283 | |||
American Software Cl. A | 199,684 | 1,549,548 | |||
ANSYS 2 | 573,200 | 38,599,288 | |||
Blackbaud | 689,291 | 15,736,514 | |||
FactSet Research Systems | 110,900 | 9,765,854 | |||
Fair Isaac | 506,900 | 21,305,007 | |||
Manhattan Associates 2 | 455,000 | 27,454,700 | |||
| 1,461,500 | 13,021,965 | ||||
| 147,822,003 | |||||
| Total (Cost $1,093,111,263) | 1,212,979,115 | ||||
| Materials – 9.1% | |||||
| Chemicals - 3.0% | |||||
Balchem Corporation | 305,000 | 11,102,000 | |||
Cabot Corporation | 478,300 | 19,031,557 | |||
Hawkins | 29,617 | 1,144,401 | |||
Innospec | 714,592 | 24,646,278 | |||
Intrepid Potash | 799,406 | 17,019,354 | |||
KMG Chemicals | 50,389 | 885,335 | |||
| 204,900 | 7,257,558 | ||||
Minerals Technologies | 250,032 | 9,981,277 | |||
Olin Corporation | 34,800 | 751,332 | |||
OM Group 2 | 45,100 | 1,001,220 | |||
Quaker Chemical | 441,180 | 23,761,955 | |||
Schulman (A.) | 269,690 | 7,802,132 | |||
Stepan Company | 349,914 | 19,434,223 | |||
Westlake Chemical | 373,300 | 29,602,690 | |||
| 173,421,312 | |||||
| Construction Materials - 0.1% | |||||
Ash Grove Cement 4 | 50,018 | 7,552,718 | |||
| Containers & Packaging - 0.6% | |||||
AptarGroup | 221,700 | 10,579,524 | |||
Greif Cl. A | 536,468 | 23,872,826 | |||
UFP Technologies 2 | 127,144 | 2,278,421 | |||
| 36,730,771 | |||||
| Metals & Mining - 5.0% | |||||
Agnico-Eagle Mines | 307,700 | 16,141,942 | |||
Allegheny Technologies | 284,700 | 8,643,492 | |||
Allied Nevada Gold 2 | 36,600 | 1,102,758 | |||
Carpenter Technology | 117,500 | 6,066,525 | |||
Commercial Metals | 238,700 | 3,547,082 | |||
Compass Minerals International | 210,126 | 15,698,513 | |||
Eldorado Gold | 1,435,900 | 18,494,392 | |||
| 48 | The Royce Funds 2012 Annual Report to Shareholders | THE ACCOMPANYING NOTES ARE AN INTEGRAL PART OF THESE FINANCIAL STATEMENTS. |
December 31, 2012 |
| SHARES | VALUE | ||||
| Materials (continued) | |||||
| Metals & Mining (continued) | |||||
Franco-Nevada Corporation | 300,000 | $ | 17,151,000 | ||
Geodrill 2 | 497,300 | 539,946 | |||
Globe Specialty Metals | 1,271,803 | 17,487,291 | |||
Haynes International | 388,293 | 20,140,758 | |||
Hecla Mining | 2,044,100 | 11,917,103 | |||
Hochschild Mining | 217,300 | 1,688,432 | |||
Horsehead Holding Corporation 2 | 633,100 | 6,463,951 | |||
Kingsrose Mining | 100,000 | 88,351 | |||
Major Drilling Group International | 858,700 | 8,460,099 | |||
Olympic Steel | 129,000 | 2,856,060 | |||
Pan American Silver | 930,700 | 17,432,011 | |||
Reliance Steel & Aluminum | 732,000 | 45,457,200 | |||
Schnitzer Steel Industries Cl. A | 372,410 | 11,295,195 | |||
Scorpio Mining 2 | 364,000 | 376,918 | |||
Seabridge Gold 2 | 446,200 | 8,018,214 | |||
Silver Standard Resources 2 | 689,000 | 10,259,210 | |||
Sims Metal Management ADR | 2,387,247 | 23,538,255 | |||
Steel Dynamics | 383,521 | 5,265,743 | |||
Universal Stainless & Alloy Products 2 | 70,000 | 2,573,900 | |||
Worthington Industries | 523,733 | 13,611,821 | |||
| 294,316,162 | |||||
| Paper & Forest Products - 0.4% | |||||
Stella-Jones | 297,600 | 22,926,599 | |||
| Total (Cost $417,359,325) | 534,947,562 | ||||
| Telecommunication Services – 0.1% | |||||
| Diversified Telecommunication Services - 0.1% | |||||
Premiere Global Services 2 | 516,500 | 5,051,370 | |||
| Total (Cost $4,038,835) | 5,051,370 | ||||
| Miscellaneous 5 – 1.2% | |||||
| Total (Cost $67,976,959) | 73,283,724 | ||||
| TOTAL COMMON STOCKS | |||||
(Cost $4,611,248,537) | 5,829,160,050 | ||||
| REPURCHASE AGREEMENT – 1.3% | |||||
Fixed Income Clearing Corporation, | 75,946,000 | ||||
| PRINCIPAL | |||||
| AMOUNT | |||||
COLLATERAL RECEIVED FOR SECURITIES | |||||
U.S. Treasury Notes | $15,760,555 | 15,836,869 | |||
Money Market Funds | 86,884,540 | ||||
TOTAL COLLATERAL RECEIVED FOR | |||||
(Cost $102,721,409) | 102,721,409 | ||||
| TOTAL INVESTMENTS – 102.0% | |||||
(Cost $4,789,915,946) | 6,007,827,459 | ||||
| LIABILITIES LESS CASH | |||||
AND OTHER ASSETS – (2.0)% | (116,695,026 ) | ||||
| NET ASSETS – 100.0% | $ | 5,891,132,433 | |||
| THE ACCOMPANYING NOTES ARE AN INTEGRAL PART OF THESE FINANCIAL STATEMENTS. | The Royce Funds 2012 Annual Report to Shareholders | 49 |
Schedules of Investments
| Royce Micro-Cap Fund |
| SHARES | VALUE | ||||
| COMMON STOCKS – 98.2% | |||||
| Consumer Discretionary – 14.6% | |||||
| Auto Components - 1.1% | |||||
Drew Industries | 263,069 | $ | 8,483,975 | ||
Fuel Systems Solutions 2 | 166,471 | 2,447,124 | |||
| 10,931,099 | |||||
| Diversified Consumer Services - 1.1% | |||||
| 51,430 | 1,857,137 | ||||
Lincoln Educational Services 3 | 1,520,827 | 8,501,423 | |||
| 10,358,560 | |||||
| Household Durables - 1.2% | |||||
Cavco Industries 2 | 178,783 | 8,935,574 | |||
| 409,000 | 3,186,110 | ||||
| 12,121,684 | |||||
| Internet & Catalog Retail - 1.2% | |||||
GS Home Shopping | 33,000 | 4,700,279 | |||
Manutan International | 89,597 | 3,974,849 | |||
Vitacost.com 2 | 379,400 | 2,572,332 | |||
| 11,247,460 | |||||
| Leisure Equipment & Products - 0.4% | |||||
Callaway Golf | 678,654 | 4,411,251 | |||
| Media - 0.3% | |||||
Saraiva S/A Livreiros Editores | 219,500 | 2,799,693 | |||
| Specialty Retail - 6.4% | |||||
Buckle (The) | 161,275 | 7,199,316 | |||
Cato Corporation (The) Cl. A | 243,250 | 6,672,347 | |||
Citi Trends 2 | 338,583 | 4,658,902 | |||
| 729,976 | 5,124,432 | ||||
Jos. A. Bank Clothiers 2 | 104,180 | 4,435,984 | |||
Kirkland’s 2 | 735,557 | 7,789,549 | |||
Padini Holdings | 8,703,800 | 5,287,610 | |||
Shoe Carnival | 449,114 | 9,202,346 | |||
Stein Mart | 1,061,752 | 8,005,610 | |||
| 187,600 | 3,641,316 | ||||
| 62,017,412 | |||||
| Textiles, Apparel & Luxury Goods - 2.9% | |||||
Calida Holding | 105,000 | 2,931,867 | |||
† Geox 1 | 1,025,000 | 2,963,869 | |||
Maidenform Brands 2 | 246,600 | 4,806,234 | |||
Perry Ellis International | 578,448 | 11,511,115 | |||
True Religion Apparel | 137,300 | 3,490,166 | |||
Van de Velde | 52,548 | 2,376,366 | |||
| 28,079,617 | |||||
| Total (Cost $128,710,331) | 141,966,776 | ||||
| Consumer Staples – 1.9% | |||||
| Food Products - 1.6% | |||||
Asian Citrus Holdings | 8,000,000 | 3,806,004 | |||
Legumex Walker 2 | 667,500 | 4,328,315 | |||
Sipef | 61,448 | 4,813,633 | |||
Super Group | 762,900 | 2,030,757 | |||
| 2,760,860 | 403,638 | ||||
| 15,382,347 | |||||
| Personal Products - 0.3% | |||||
Nutraceutical International | 183,447 | 3,034,214 | |||
| Total (Cost $15,216,327) | 18,416,561 | ||||
| Energy – 8.3% | |||||
| Energy Equipment & Services - 6.1% | |||||
Canadian Energy Services & Technology | 856,100 | 9,123,012 | |||
Dawson Geophysical 2 | 204,333 | 5,390,305 | |||
Geospace Technologies 2 | 34,296 | 3,047,886 | |||
Gulf Island Fabrication | 290,244 | 6,974,563 | |||
Lamprell | 2,506,756 | 3,824,145 | |||
Natural Gas Services Group 2 | 404,091 | 6,635,174 | |||
Tesco Corporation 2 | 542,600 | 6,180,214 | |||
TGC Industries | 922,893 | 7,558,494 | |||
Total Energy Services | 675,900 | 10,185,725 | |||
| 58,919,518 | |||||
| Oil, Gas & Consumable Fuels - 2.2% | |||||
Gran Tierra Energy 2 | 916,700 | 5,051,017 | |||
† Renewable Energy Group 2 | 356,600 | 2,089,676 | |||
Sprott Resource | 2,139,900 | 9,358,164 | |||
Triangle Petroleum 2 | 733,963 | 4,396,438 | |||
Uranium Resources 2 | 1,146,479 | 366,873 | |||
| 21,262,168 | |||||
| Total (Cost $55,949,834) | 80,181,686 | ||||
| Financials – 5.8% | |||||
| Capital Markets - 2.6% | |||||
FBR & Co. 2 | 1,081,746 | 4,186,357 | |||
Gluskin Sheff + Associates | 379,200 | 5,706,870 | |||
GMP Capital | 550,600 | 3,238,172 | |||
INTL FCStone 2 | 378,455 | 6,588,902 | |||
U.S. Global Investors Cl. A | 381,749 | 1,530,813 | |||
Westwood Holdings Group | 86,572 | 3,540,795 | |||
| 24,791,909 | |||||
| Commercial Banks - 0.8% | |||||
Bancorp (The) 2 | 284,267 | 3,118,409 | |||
BCB Holdings 2 | 2,760,860 | 975,461 | |||
Pacific Continental | 356,897 | 3,472,608 | |||
| 7,566,478 | |||||
| Insurance - 0.8% | |||||
American Safety Insurance Holdings 2 | 252,100 | 4,769,732 | |||
Navigators Group 2 | 54,164 | 2,766,156 | |||
| 7,535,888 | |||||
| Real Estate Management & Development - 1.6% | |||||
Kennedy-Wilson Holdings | 691,081 | 9,661,312 | |||
Midland Holdings | 9,766,500 | 4,742,675 | |||
Syswin ADR 2 | 850,350 | 1,649,679 | |||
| 16,053,666 | |||||
| Total (Cost $53,982,159) | 55,947,941 | ||||
| Health Care – 10.1% | |||||
| Biotechnology - 1.0% | |||||
Burcon NutraScience 2 | 279,600 | 1,174,320 | |||
| 50 | The Royce Funds 2012 Annual Report to Shareholders | THE ACCOMPANYING NOTES ARE AN INTEGRAL PART OF THESE FINANCIAL STATEMENTS. |
December 31, 2012 |
| SHARES | VALUE | ||||
| Health Care (continued) | |||||
| Biotechnology (continued) | |||||
Dyax Corporation 2 | 1,177,084 | $ | 4,096,252 | ||
Lexicon Pharmaceuticals 2 | 1,838,871 | 4,082,294 | |||
| 9,352,866 | |||||
| Health Care Equipment & Supplies - 3.9% | |||||
| 1,071,554 | 3,386,111 | ||||
CryoLife | 587,711 | 3,661,440 | |||
Exactech 2 | 361,879 | 6,133,849 | |||
Merit Medical Systems 2 | 290,765 | 4,041,633 | |||
SurModics 2 | 358,122 | 8,007,608 | |||
Syneron Medical 2 | 814,674 | 7,063,224 | |||
Young Innovations | 72,389 | 2,852,850 | |||
| 592,986 | 2,745,525 | ||||
| 37,892,240 | |||||
| Health Care Providers & Services - 2.4% | |||||
CorVel Corporation 2 | 134,557 | 6,032,190 | |||
IPC The Hospitalist 2 | 63,509 | 2,521,942 | |||
| 982,694 | 7,468,475 | ||||
U.S. Physical Therapy | 264,040 | 7,271,662 | |||
| 23,294,269 | |||||
| Health Care Technology - 0.1% | |||||
Epocrates 2 | 158,400 | 1,397,088 | |||
| Life Sciences Tools & Services - 1.1% | |||||
BioClinica 2 | 461,806 | 2,641,530 | |||
EPS Corporation | 3,000 | 7,686,528 | |||
| 10,328,058 | |||||
| Pharmaceuticals - 1.6% | |||||
Clinigen Group 2 | 790,000 | 2,740,198 | |||
Unichem Laboratories | 849,000 | 2,852,546 | |||
Vetoquinol | 254,365 | 8,918,584 | |||
| 928,500 | 1,234,905 | ||||
| 15,746,233 | |||||
| Total (Cost $80,877,879) | 98,010,754 | ||||
| Industrials – 21.3% | |||||
| Aerospace & Defense - 0.3% | |||||
American Science & Engineering | 42,718 | 2,785,641 | |||
| Building Products - 1.8% | |||||
AAON | 340,927 | 7,115,147 | |||
Quanex Building Products | 326,500 | 6,663,865 | |||
WaterFurnace Renewable Energy | 259,100 | 3,761,339 | |||
| 17,540,351 | |||||
| Commercial Services & Supplies - 1.0% | |||||
Courier Corporation | 236,782 | 2,604,602 | |||
Ennis | 456,251 | 7,058,203 | |||
| 9,662,805 | |||||
| Construction & Engineering - 2.3% | |||||
Layne Christensen 2 | 329,360 | 7,993,567 | |||
Raubex Group | 2,974,200 | 5,948,811 | |||
Severfield-Rowen | 2,066,200 | 3,241,537 | |||
Sterling Construction 2 | 558,175 | 5,548,260 | |||
| 22,732,175 | |||||
| Electrical Equipment - 2.9% | |||||
Elektrobudowa | 70,000 | 2,375,426 | |||
Global Power Equipment Group | 576,212 | 9,882,036 | |||
Graphite India | 4,227,400 | 6,429,830 | |||
LSI Industries | 960,136 | 6,730,553 | |||
Voltamp Transformers | 400,000 | 3,152,129 | |||
| 28,569,974 | |||||
| Machinery - 7.8% | |||||
AIA Engineering | 309,087 | 1,856,339 | |||
Burckhardt Compression Holding | 19,500 | 6,395,665 | |||
CB Industrial Product Holding | 3,615,800 | 3,237,099 | |||
Foster (L.B.) Company | 194,856 | 8,464,544 | |||
FreightCar America | 364,309 | 8,167,808 | |||
Gorman-Rupp Company | 90,971 | 2,713,665 | |||
Graham Corporation 3 | 601,249 | 11,724,355 | |||
Kadant 2 | 275,716 | 7,309,231 | |||
| 421,814 | 4,403,738 | ||||
Pfeiffer Vacuum Technology | 47,000 | 5,691,221 | |||
RBC Bearings 2 | 126,043 | 6,310,973 | |||
Semperit AG Holding | 232,809 | 9,595,428 | |||
| 75,870,066 | |||||
| Professional Services - 2.4% | |||||
CRA International 2 | 340,783 | 6,737,280 | |||
Exponent 2 | 110,435 | 6,165,586 | |||
GP Strategies 2 | 512,182 | 10,576,558 | |||
| 23,479,424 | |||||
| Road & Rail - 2.4% | |||||
Marten Transport | 676,719 | 12,444,862 | |||
Patriot Transportation Holding 2 | 378,269 | 10,754,188 | |||
| 23,199,050 | |||||
| Trading Companies & Distributors - 0.4% | |||||
Houston Wire & Cable | 277,200 | 3,401,244 | |||
| Total (Cost $178,144,533) | 207,240,730 | ||||
| Information Technology – 14.8% | |||||
| Communications Equipment - 3.2% | |||||
Anaren 2 | 588,707 | 11,450,351 | |||
Digi International 2 | 593,408 | 5,619,574 | |||
KVH Industries 2 | 488,400 | 6,827,832 | |||
Parrot 2 | 179,770 | 6,696,664 | |||
| 30,594,421 | |||||
| Computers & Peripherals - 0.9% | |||||
Avid Technology 2 | 159,343 | 1,207,820 | |||
| 2,142,033 | 2,870,325 | ||||
Super Micro Computer 2 | 502,931 | 5,129,896 | |||
| 9,208,041 | |||||
| Electronic Equipment, Instruments & Components - 2.2% | |||||
Diploma | 585,000 | 5,260,499 | |||
Domino Printing Sciences | 317,600 | 3,016,065 | |||
Electro Rent | 247,000 | 3,798,860 | |||
Fabrinet 2 | 356,745 | 4,687,629 | |||
Inficon Holding | 10,000 | 2,398,214 | |||
Nice | 384,500 | 1,333,198 | |||
Vaisala Cl. A | 48,000 | 1,008,233 | |||
| 21,502,698 | |||||
| THE ACCOMPANYING NOTES ARE AN INTEGRAL PART OF THESE FINANCIAL STATEMENTS. | The Royce Funds 2012 Annual Report to Shareholders | 51 |
Schedules of Investments
| Royce Micro-Cap Fund (continued) |
| SHARES | VALUE | ||||
| Information Technology (continued) | |||||
| Internet Software & Services - 0.5% | |||||
Envestnet 2 | 130,042 | $ | 1,814,086 | ||
| 733,900 | 3,192,465 | ||||
| 5,006,551 | |||||
| IT Services - 1.1% | |||||
CSE Global | 3,066,500 | 1,975,046 | |||
| 255,517 | 4,624,858 | ||||
Neurones | 335,000 | 3,678,880 | |||
| 10,278,784 | |||||
| Semiconductors & Semiconductor Equipment - 5.3% | |||||
Advanced Energy Industries 2 | 535,736 | 7,398,514 | |||
ATMI 2 | 448,300 | 9,360,504 | |||
| 1,808,161 | 5,080,932 | ||||
GSI Technology 2 | 902,937 | 5,661,415 | |||
Integrated Silicon Solution 2 | 747,800 | 6,730,200 | |||
Mindspeed Technologies 2 | 716,700 | 3,354,156 | |||
Rudolph Technologies 2 | 362,765 | 4,879,189 | |||
Sigma Designs 2 | 1,184,223 | 6,098,749 | |||
Ultra Clean Holdings 2 | 588,004 | 2,887,100 | |||
| 51,450,759 | |||||
| Software - 1.6% | |||||
Monotype Imaging Holdings | 507,370 | 8,107,772 | |||
VASCO Data Security International 2 | 969,010 | 7,907,122 | |||
| 16,014,894 | |||||
| Total (Cost $137,477,032) | 144,056,148 | ||||
| Materials – 15.4% | |||||
| Chemicals - 2.6% | |||||
C. Uyemura & Co. | 119,700 | 3,787,961 | |||
Huchems Fine Chemical | 235,700 | 5,698,884 | |||
Quaker Chemical | 195,150 | 10,510,779 | |||
Societe Internationale de Plantations d’Heveas | 56,786 | 4,651,960 | |||
| 24,649,584 | |||||
| Construction Materials - 0.2% | |||||
Mardin Cimento Sanayii | 737,500 | 2,207,755 | |||
| Metals & Mining - 12.6% | |||||
Alamos Gold | 410,900 | 7,208,410 | |||
Allied Nevada Gold 2 | 159,400 | 4,802,722 | |||
Argonaut Gold 2 | 246,100 | 2,342,985 | |||
Aureus Mining 2 | 1,364,000 | 822,761 | |||
Bear Creek Mining 2 | 1,024,500 | 3,409,163 | |||
| 205,959 | 3,042,014 | ||||
Endeavour Mining 2 | 1,971,000 | 4,101,709 | |||
| 890,500 | 7,026,045 | ||||
Geodrill 2 | 1,912,300 | 2,076,288 | |||
Goldgroup Mining 2 | 1,576,500 | 594,338 | |||
† Haynes International | 115,330 | 5,982,167 | |||
Horsehead Holding Corporation 2 | 941,771 | 9,615,482 | |||
Imdex | 1,521,265 | 2,718,910 | |||
International Tower Hill Mines 2 | 678,000 | 1,471,260 | |||
Lumina Copper 2 | 707,300 | 6,705,377 | |||
| 1,498,804 | 5,740,419 | ||||
| 735,499 | 88,730 | ||||
Olympic Steel | 488,672 | 10,819,198 | |||
Pilot Gold 2 | 2,914,500 | 6,240,962 | |||
Quaterra Resources 2 | 1,885,000 | 644,314 | |||
| 172,000 | 485,040 | ||||
| 606,000 | 1,824,060 | ||||
Scorpio Mining 2 | 2,205,400 | 2,283,665 | |||
Silvercorp Metals | 830,200 | 4,250,624 | |||
Soltoro 2 | 1,680,000 | 878,255 | |||
Synalloy Corporation | 180,942 | 2,373,959 | |||
Timmins Gold 2 | 1,681,200 | 5,043,600 | |||
Torex Gold Resources 2 | 1,858,700 | 4,110,928 | |||
Universal Stainless & Alloy Products 2 | 298,352 | 10,970,403 | |||
Village Main Reef | 7,500,000 | 1,112,929 | |||
Western Copper and Gold 2 | 1,471,000 | 2,088,820 | |||
Wildcat Silver 2 | 2,226,600 | 1,790,772 | |||
| 122,666,309 | |||||
| Total (Cost $132,871,178) | 149,523,648 | ||||
| Telecommunication Services – 0.8% | |||||
| Diversified Telecommunication Services - 0.8% | |||||
Atlantic Tele-Network | 206,912 | 7,595,740 | |||
| Total (Cost $2,339,745) | 7,595,740 | ||||
| Utilities – 0.2% | |||||
| Independent Power Producers & Energy Traders - 0.2% | |||||
Alterra Power 2 | 3,498,400 | 1,512,327 | |||
| Total (Cost $4,304,472) | 1,512,327 | ||||
| Miscellaneous 5 – 5.0% | |||||
| Total (Cost $47,616,132) | 48,335,302 | ||||
| TOTAL COMMON STOCKS | |||||
(Cost $837,489,622) | 952,787,613 | ||||
| REPURCHASE AGREEMENT – 1.4% | |||||
Fixed Income Clearing Corporation, | 13,427,000 | ||||
| 52 | The Royce Funds 2012 Annual Report to Shareholders | THE ACCOMPANYING NOTES ARE AN INTEGRAL PART OF THESE FINANCIAL STATEMENTS. |
December 31, 2012 |
| VALUE | ||||||
| COLLATERAL RECEIVED FOR SECURITIES | ||||||
LOANED – 2.3% | ||||||
| Money Market Funds | ||||||
Federated Government Obligations Fund | ||||||
(7 day yield-0.0107%) | ||||||
(Cost $22,690,458) | $ | 22,690,458 | ||||
| TOTAL INVESTMENTS – 101.9% | ||||||
(Cost $873,607,080) | 988,905,071 | |||||
| LIABILITIES LESS CASH | ||||||
AND OTHER ASSETS – (1.9)% | (18,213,291 | ) | ||||
| NET ASSETS – 100.0% | $ | 970,691,780 | ||||
Royce Premier Fund
| SHARES | VALUE | ||||
| COMMON STOCKS – 95.9% | |||||
| Consumer Discretionary – 10.4% | |||||
| Automobiles - 2.3% | |||||
Thor Industries 3 | 4,166,757 | $ | 155,961,714 | ||
| Distributors - 1.1% | |||||
Pool Corporation | 1,811,400 | 76,658,448 | |||
| Diversified Consumer Services - 2.3% | |||||
Sotheby’s | 2,828,594 | 95,097,330 | |||
| 1,068,485 | 60,016,803 | ||||
| 155,114,133 | |||||
| Media - 1.3% | |||||
Morningstar | 1,333,206 | 83,765,333 | |||
| Specialty Retail - 1.2% | |||||
Buckle (The) | 1,730,836 | 77,264,519 | |||
| Textiles, Apparel & Luxury Goods - 2.2% | |||||
| 1,144,800 | 63,708,120 | ||||
Columbia Sportswear | 1,341,600 | 71,587,776 | |||
Warnaco Group (The) 2 | 210,200 | 15,044,014 | |||
| 150,339,910 | |||||
| Total (Cost $565,141,807) | 699,104,057 | ||||
| Consumer Staples – 4.5% | |||||
| Food Products - 2.4% | |||||
Cal-Maine Foods 3 | 1,721,686 | 69,246,211 | |||
Sanderson Farms 3 | 1,880,191 | 89,403,082 | |||
| 158,649,293 | |||||
| Personal Products - 2.1% | |||||
| 3,816,994 | 141,419,628 | ||||
| Total (Cost $183,452,607) | 300,068,921 | ||||
| Energy – 6.8% | |||||
| Energy Equipment & Services - 6.8% | |||||
Ensign Energy Services | 7,128,000 | 110,141,107 | |||
Pason Systems | 3,916,300 | 67,522,413 | |||
SEACOR Holdings | 479,540 | 40,185,452 | |||
Trican Well Service 3 | 8,027,100 | 105,876,702 | |||
| 2,896,073 | 130,468,089 | ||||
| Total (Cost $304,676,443) | 454,193,763 | ||||
| Financials – 10.9% | |||||
| Capital Markets - 4.4% | |||||
Affiliated Managers Group 2 | 500,000 | 65,075,000 | |||
Federated Investors Cl. B | 3,939,300 | 79,692,039 | |||
Partners Group Holding | 296,613 | 68,509,149 | |||
Stifel Financial 2 | 2,590,777 | 82,827,141 | |||
| 296,103,329 | |||||
| Insurance - 3.7% | |||||
Alleghany Corporation 2 | 514,525 | 172,581,975 | |||
ProAssurance Corporation | 1,688,298 | 71,229,293 | |||
| 243,811,268 | |||||
| Real Estate Management & Development - 2.8% | |||||
Jones Lang LaSalle | 1,319,700 | 110,775,618 | |||
| THE ACCOMPANYING NOTES ARE AN INTEGRAL PART OF THESE FINANCIAL STATEMENTS. | The Royce Funds 2012 Annual Report to Shareholders | 53 |
Schedules of Investments
| Royce Premier Fund (continued) |
| SHARES | VALUE | ||||
| Financials (continued) | |||||
| Real Estate Management & Development (continued) | |||||
| 3,288,074 | $ | 75,888,748 | |||
| 186,664,366 | |||||
| Total (Cost $529,873,781) | 726,578,963 | ||||
| Health Care – 5.2% | |||||
| Biotechnology - 2.1% | |||||
| 5,114,765 | 139,377,346 | ||||
| Health Care Equipment & Supplies - 2.1% | |||||
| 1,536,500 | 142,587,200 | ||||
| Life Sciences Tools & Services - 1.0% | |||||
PerkinElmer | 2,083,200 | 66,120,768 | |||
| Total (Cost $195,722,278) | 348,085,314 | ||||
| Industrials – 26.3% | |||||
| Air Freight & Logistics - 0.9% | |||||
Forward Air | 890,128 | 31,163,381 | |||
UTi Worldwide | 2,459,700 | 32,959,980 | |||
| 64,123,361 | |||||
| Building Products - 2.4% | |||||
Armstrong World Industries | 970,170 | 49,216,724 | |||
Simpson Manufacturing 3 | 3,387,886 | 111,088,782 | |||
| 160,305,506 | |||||
| Commercial Services & Supplies - 2.5% | |||||
| 2,534,800 | 74,776,600 | ||||
Ritchie Bros. Auctioneers | 4,441,250 | 92,777,713 | |||
| 167,554,313 | |||||
| Construction & Engineering - 1.3% | |||||
EMCOR Group | 2,508,145 | 86,806,899 | |||
| Electrical Equipment - 1.6% | |||||
Brady Corporation Cl. A | 1,516,927 | 50,665,362 | |||
GrafTech International 2 | 6,034,076 | 56,659,974 | |||
| 107,325,336 | |||||
| Machinery - 13.0% | |||||
Gardner Denver | 1,078,918 | 73,905,883 | |||
Kennametal | 1,563,500 | 62,540,000 | |||
Lincoln Electric Holdings 3 | 5,074,994 | 247,050,708 | |||
Rational | 229,966 | 66,229,855 | |||
Semperit AG Holding 3 | 1,894,996 | 78,103,926 | |||
Valmont Industries | 813,440 | 111,075,232 | |||
Wabtec Corporation | 913,137 | 79,936,013 | |||
Woodward 3 | 3,906,024 | 148,936,695 | |||
| 867,778,312 | |||||
| Marine - 1.1% | |||||
| 1,147,335 | 71,008,563 | ||||
| Professional Services - 0.9% | |||||
Towers Watson & Company Cl. A | 1,111,811 | 62,494,896 | |||
| Road & Rail - 1.2% | |||||
Landstar System | 1,500,300 | 78,705,738 | |||
| Trading Companies & Distributors - 1.4% | |||||
† Air Lease Cl. A 2 | 1,030,757 | 22,161,275 | |||
MSC Industrial Direct Cl. A | 952,284 | 71,783,168 | |||
| 93,944,443 | |||||
| Total (Cost $1,005,673,257) | 1,760,047,367 | ||||
| Information Technology – 18.0% | |||||
| Communications Equipment - 1.0% | |||||
ADTRAN 3 | 3,245,434 | 63,415,780 | |||
| Electronic Equipment, Instruments & Components - 6.1% | |||||
Anixter International | 980,700 | 62,745,186 | |||
| 2,843,900 | 47,265,618 | ||||
Cognex Corporation 3 | 3,052,717 | 112,401,040 | |||
FEI Company | 1,473,350 | 81,711,991 | |||
National Instruments | 4,147,101 | �� | 107,036,677 | ||
| 411,160,512 | |||||
| IT Services - 3.4% | |||||
Gartner 2 | 3,443,100 | 158,451,462 | |||
Jack Henry & Associates | 1,836,640 | 72,106,487 | |||
| 230,557,949 | |||||
| Office Electronics - 1.4% | |||||
| Zebra Technologies Cl. A 2 | 2,423,325 | 95,188,206 | |||
| Semiconductors & Semiconductor Equipment - 4.9% | |||||
Cabot Microelectronics 3 | 2,086,191 | 74,080,642 | |||
| 6,508,112 | 93,716,813 | ||||
MKS Instruments 3 | 2,971,910 | 76,615,840 | |||
| 2,708,912 | 79,967,082 | ||||
| 324,380,377 | |||||
| Software - 1.2% | |||||
Fair Isaac 3 | 1,832,600 | 77,024,178 | |||
| Total (Cost $953,515,027) | 1,201,727,002 | ||||
| Materials – 13.5% | |||||
| Chemicals - 3.7% | |||||
Cabot Corporation | 1,355,000 | 53,915,450 | |||
Westlake Chemical | 2,412,985 | 191,349,710 | |||
| 245,265,160 | |||||
| Metals & Mining - 9.5% | |||||
Allied Nevada Gold 2 | 2,255,500 | 67,958,215 | |||
Globe Specialty Metals | 3,632,763 | 49,950,491 | |||
Pan American Silver | 5,188,544 | 97,181,429 | |||
† Pretium Resources 2 | 4,672,100 | 61,718,441 | |||
Reliance Steel & Aluminum | 2,519,800 | 156,479,580 | |||
Schnitzer Steel Industries Cl. A 3 | 2,108,038 | 63,936,793 | |||
| 3,342,400 | 60,062,928 | ||||
| 4,115,069 | 61,273,377 | ||||
Sims Metal Management ADR | 2,161,404 | 21,311,444 | |||
| 639,872,698 | |||||
| Paper & Forest Products - 0.3% | |||||
† Stella-Jones | 243,953 | 18,793,725 | |||
| Total (Cost $747,206,850) | 903,931,583 | ||||
| Miscellaneous 5 – 0.3% | |||||
| Total (Cost $16,180,968) | 22,385,209 | ||||
| 54 | The Royce Funds 2012 Annual Report to Shareholders | THE ACCOMPANYING NOTES ARE AN INTEGRAL PART OF THESE FINANCIAL STATEMENTS. |
December 31, 2012 |
| VALUE | ||||||
| TOTAL COMMON STOCKS | ||||||
(Cost $4,501,443,018) | $ | 6,416,122,179 | ||||
| REPURCHASE AGREEMENT – 4.1% | ||||||
Fixed Income Clearing Corporation, | 272,862,000 | |||||
| COLLATERAL RECEIVED FOR SECURITIES | ||||||
LOANED – 3.0% | ||||||
| Money Market Funds | ||||||
Federated Government Obligations Fund | ||||||
(7 day yield-0.0107%) | ||||||
(Cost $198,869,651) | 198,869,651 | |||||
| TOTAL INVESTMENTS – 103.0% | ||||||
(Cost $4,973,174,669) | 6,887,853,830 | |||||
| LIABILITIES LESS CASH | ||||||
AND OTHER ASSETS – (3.0)% | (199,081,662 | ) | ||||
| NET ASSETS – 100.0% | $ | 6,688,772,168 | ||||
Royce Low-Priced Stock Fund
| SHARES | VALUE | ||||
| COMMON STOCKS – 98.4% | |||||
| Consumer Discretionary – 8.0% | |||||
| Auto Components - 0.2% | |||||
Gentex Corporation | 350,000 | $ | 6,587,000 | ||
| Automobiles - 0.9% | |||||
Thor Industries | 728,653 | 27,273,482 | |||
| Diversified Consumer Services - 0.9% | |||||
| 4,041,854 | 9,862,124 | ||||
Universal Technical Institute 3 | 1,655,679 | 16,623,017 | |||
| 26,485,141 | |||||
| Household Durables - 0.4% | |||||
Ekornes | 77,025 | 1,284,471 | |||
Helen of Troy 2 | 300,406 | 10,030,557 | |||
| 11,315,028 | |||||
| Internet & Catalog Retail - 0.3% | |||||
NutriSystem | 1,125,690 | 9,219,401 | |||
| Media - 0.3% | |||||
Pico Far East Holdings | 30,000,000 | 8,964,793 | |||
| Multiline Retail - 0.2% | |||||
| 957,230 | 5,982,687 | ||||
| Specialty Retail - 4.5% | |||||
Buckle (The) | 679,575 | 30,336,228 | |||
Cato Corporation (The) Cl. A 1 | 597,350 | 16,385,311 | |||
Chico’s FAS | 781,000 | 14,417,260 | |||
GameStop Corporation Cl. A | 850,000 | 21,326,500 | |||
Lewis Group | 1,543,747 | 12,592,295 | |||
Luk Fook Holdings (International) 1 | 4,577,800 | 14,690,522 | |||
Men’s Wearhouse (The) | 406,700 | 12,672,772 | |||
Williams-Sonoma | 290,405 | 12,711,027 | |||
| 135,131,915 | |||||
| Textiles, Apparel & Luxury Goods - 0.3% | |||||
Gildan Activewear | 161,448 | 5,905,768 | |||
Grendene | 560,900 | 4,545,278 | |||
| 10,451,046 | |||||
| Total (Cost $189,259,554) | 241,410,493 | ||||
| Consumer Staples – 3.7% | |||||
| Food Products - 2.2% | |||||
Asian Citrus Holdings | 30,918,000 | 14,709,255 | |||
Darling International 2 | 1,253,770 | 20,110,471 | |||
Industrias Bachoco ADR | 1,103,673 | 30,814,550 | |||
| 65,634,276 | |||||
| Personal Products - 1.5% | |||||
Nu Skin Enterprises Cl. A 1 | 1,257,833 | 46,602,713 | |||
| Total (Cost $67,413,668) | 112,236,989 | ||||
| Energy – 12.5% | |||||
| Energy Equipment & Services - 12.1% | |||||
| 2,289,193 | 49,080,298 | ||||
Calfrac Well Services | 1,706,100 | 42,965,522 | |||
Ensign Energy Services | 1,604,100 | 24,786,385 | |||
Lamprell | 4,878,455 | 7,442,256 | |||
Oil States International 2 | 352,343 | 25,206,618 | |||
Pason Systems | 2,250,700 | 38,805,172 | |||
| THE ACCOMPANYING NOTES ARE AN INTEGRAL PART OF THESE FINANCIAL STATEMENTS. | The Royce Funds 2012 Annual Report to Shareholders | 55 |
Schedules of Investments
| Royce Low-Priced Stock Fund (continued) |
| SHARES | VALUE | ||||
| Energy (continued) | |||||
| Energy Equipment & Services (continued) | |||||
RPC | 1,133,769 | $ | 13,877,332 | ||
| 2,682,105 | 30,549,176 | ||||
TGS-NOPEC Geophysical | 435,000 | 14,255,076 | |||
Total Energy Services 3 | 1,866,700 | 28,130,926 | |||
Trican Well Service | 4,119,800 | 54,339,779 | |||
Unit Corporation 2 | 853,400 | 38,445,670 | |||
| 367,884,210 | |||||
| Oil, Gas & Consumable Fuels - 0.4% | |||||
Sprott Resource | 2,980,100 | 13,032,508 | |||
| Total (Cost $242,190,000) | 380,916,718 | ||||
| Financials – 10.6% | |||||
| Capital Markets - 7.2% | |||||
Artio Global Investors Cl. A | 2,081,437 | 3,954,730 | |||
Ashmore Group | 4,080,363 | 23,593,960 | |||
Deutsche Beteiligungs | 259,995 | 6,676,382 | |||
Duff & Phelps Cl. A | 1,031,400 | 16,110,468 | |||
Federated Investors Cl. B | 1,271,900 | 25,730,537 | |||
† INTL FCStone 2 | 604,900 | 10,531,309 | |||
Jupiter Fund Management | 6,471,349 | 30,035,958 | |||
Sprott | 8,302,400 | 33,052,685 | |||
Stifel Financial 2 | 470,663 | 15,047,096 | |||
U.S. Global Investors Cl. A | 661,751 | 2,653,621 | |||
Value Partners Group | 76,030,500 | 51,038,553 | |||
| 218,425,299 | |||||
| Diversified Financial Services - 1.2% | |||||
KKR Financial Holdings LLC | 1,763,430 | 18,621,821 | |||
PICO Holdings 2 | 963,799 | 19,536,206 | |||
| 38,158,027 | |||||
| Insurance - 0.9% | |||||
Argo Group International Holdings | 371,897 | 12,492,020 | |||
Aspen Insurance Holdings | 453,000 | 14,532,240 | |||
| 27,024,260 | |||||
| Real Estate Management & Development - 1.3% | |||||
E-House China Holdings ADR | 2,086,204 | 8,553,437 | |||
Kennedy-Wilson Holdings | 2,150,830 | 30,068,603 | |||
| 38,622,040 | |||||
| Total (Cost $367,383,385) | 322,229,626 | ||||
| Health Care – 6.2% | |||||
| Biotechnology - 2.0% | |||||
Maxygen | 640,200 | 1,574,892 | |||
| 1,980,237 | 53,961,458 | ||||
| 1,749,629 | 5,493,835 | ||||
| 61,030,185 | |||||
| Health Care Equipment & Supplies - 1.6% | |||||
| Carl Zeiss Meditec | 1,041,017 | 29,909,048 | |||
| Nihon Kohden | 342,000 | 10,369,677 | |||
| Thoratec Corporation 2 | 200,000 | 7,504,000 | |||
| 47,782,725 | |||||
| Health Care Providers & Services - 0.1% | |||||
Cross Country Healthcare 2 | 1,044,768 | 5,014,886 | |||
| Pharmaceuticals - 2.5% | |||||
Adcock Ingram Holdings | 2,311,000 | 14,721,835 | |||
Medicines Company (The) 2 | 1,400,140 | 33,561,356 | |||
Recordati | 1,588,800 | 14,556,634 | |||
Sino Biopharmaceutical | 15,450,000 | 7,406,380 | |||
| 350,000 | 4,697,000 | ||||
| 74,943,205 | |||||
| Total (Cost $155,629,767) | 188,771,001 | ||||
| Industrials – 12.9% | |||||
| Aerospace & Defense - 1.4% | |||||
HEICO Corporation Cl. A | 994,627 | 31,808,171 | |||
† Orbital Sciences 2 | 852,523 | 11,739,242 | |||
| 43,547,413 | |||||
| Building Products - 0.5% | |||||
WaterFurnace Renewable Energy 3 | 970,500 | 14,088,690 | |||
| Commercial Services & Supplies - 1.3% | |||||
Ennis | 1,004,600 | 15,541,162 | |||
Moshi Moshi Hotline | 1,800,000 | 22,942,302 | |||
| 38,483,464 | |||||
| Construction & Engineering - 0.3% | |||||
Raubex Group | 5,279,971 | 10,560,671 | |||
| Electrical Equipment - 2.0% | |||||
| 5,357,800 | 50,309,742 | ||||
Powell Industries 2 | 239,848 | 9,960,888 | |||
| 60,270,630 | |||||
| Machinery - 2.4% | |||||
Kennametal | 1,124,500 | 44,980,000 | |||
Lincoln Electric Holdings | 569,770 | 27,736,404 | |||
| 72,716,404 | |||||
| Professional Services - 3.4% | |||||
| 597,600 | 3,531,816 | ||||
Exponent 2 | 130,400 | 7,280,232 | |||
Kforce | 698,774 | 10,013,432 | |||
Korn/Ferry International 2 | 1,879,340 | 29,806,332 | |||
| 3,262,691 | 51,387,383 | ||||
| 102,019,195 | |||||
| Road & Rail - 1.0% | |||||
Heartland Express | 688,366 | 8,996,944 | |||
Universal Truckload Services | 387,561 | 7,072,988 | |||
Werner Enterprises | 605,093 | 13,112,365 | |||
| 29,182,297 | |||||
| Trading Companies & Distributors - 0.6% | |||||
Houston Wire & Cable 3 | 1,591,200 | 19,524,024 | |||
| Total (Cost $313,954,105) | 390,392,788 | ||||
| Information Technology – 21.8% | |||||
| Communications Equipment - 3.5% | |||||
ADTRAN | 1,494,642 | 29,205,305 | |||
Arris Group 2 | 1,041,971 | 15,567,047 | |||
Harmonic 2 | 1,372,500 | 6,958,575 | |||
| 777,804 | 10,873,700 | ||||
NETGEAR 2 | 749,300 | 29,537,406 | |||
PC-Tel 3 | 995,592 | 7,168,262 | |||
| 56 | The Royce Funds 2012 Annual Report to Shareholders | THE ACCOMPANYING NOTES ARE AN INTEGRAL PART OF THESE FINANCIAL STATEMENTS. |
December 31, 2012 |
| SHARES | VALUE | ||||
| Information Technology (continued) | |||||
| Communications Equipment (continued) | |||||
Tellabs | 2,932,600 | $ | 6,686,328 | ||
| 105,996,623 | |||||
| Computers & Peripherals - 0.7% | |||||
QLogic Corporation 2 | 500,000 | 4,865,000 | |||
| 1,562,400 | 7,702,632 | ||||
Xyratex | 1,177,566 | 9,903,330 | |||
| 22,470,962 | |||||
| Electronic Equipment, Instruments & Components - 2.7% | |||||
AVX Corporation | 1,068,900 | 11,522,742 | |||
GSI Group 2 | 1,275,000 | 11,041,500 | |||
Littelfuse | 258,400 | 15,945,864 | |||
Methode Electronics | 311,320 | 3,122,540 | |||
| 2,606,735 | 23,981,962 | ||||
| 1,656,550 | 17,609,126 | ||||
| 83,223,734 | |||||
| Internet Software & Services - 0.5% | |||||
ValueClick 2 | 752,600 | 14,607,966 | |||
| IT Services - 2.4% | |||||
† Convergys Corporation | 1,855,730 | 30,452,529 | |||
Forrester Research | 426,690 | 11,435,292 | |||
| 1,670,473 | 29,734,420 | ||||
| 71,622,241 | |||||
| Semiconductors & Semiconductor Equipment - 12.0% | |||||
Advanced Energy Industries 2 | 901,400 | 12,448,334 | |||
Aixtron ADR 1 | 1,271,316 | 15,192,226 | |||
| 1,125,000 | 23,490,000 | ||||
Brooks Automation | 3,172,582 | 25,539,285 | |||
Exar Corporation 2 | 261,700 | 2,329,130 | |||
Fairchild Semiconductor | |||||
International 2 | 4,167,039 | 60,005,362 | |||
International Rectifier 2 | 2,987,122 | 52,961,673 | |||
Lam Research 2 | 743,800 | 26,873,494 | |||
Micrel | 635,744 | 6,039,568 | |||
MKS Instruments | 1,351,455 | 34,840,510 | |||
| 2,020,191 | 28,444,289 | ||||
| 1,720,358 | 8,859,844 | ||||
Supertex | 336,900 | 5,912,595 | |||
Teradyne 2 | 3,585,596 | 60,560,716 | |||
| 363,497,026 | |||||
| Software - 0.0% | |||||
| 808,576 | 1,220,950 | ||||
| Total (Cost $635,490,621) | 662,639,502 | ||||
| Materials – 22.1% | |||||
| Chemicals - 1.9% | |||||
Intrepid Potash | 1,359,900 | 28,952,271 | |||
Westlake Chemical | 363,900 | 28,857,270 | |||
| 57,809,541 | |||||
| Construction Materials - 0.2% | |||||
Mardin Cimento Sanayii | 2,160,000 | 6,466,104 | |||
| Metals & Mining - 19.2% | |||||
Alamos Gold | 3,168,400 | 55,583,171 | |||
Allied Nevada Gold 2 | 1,663,878 | 50,132,644 | |||
AuRico Gold 2 | 1,147,500 | 9,386,550 | |||
| 953,867 | 14,088,616 | ||||
Centamin 2 | 16,355,900 | 10,359,120 | |||
CGA Mining 2 | 2,990,000 | 7,905,600 | |||
Endeavour Mining 2 | 3,625,000 | 7,543,732 | |||
Globe Specialty Metals 3 | 4,026,606 | 55,365,832 | |||
Hecla Mining | 2,027,715 | 11,821,578 | |||
Hochschild Mining | 5,858,563 | 45,521,343 | |||
| 1,563,535 | 15,963,692 | ||||
Kirkland Lake Gold 2 | 1,641,100 | 9,651,588 | |||
Major Drilling Group International | 2,836,800 | 27,948,769 | |||
| 6,708,918 | 25,695,156 | ||||
Medusa Mining | 786,300 | 4,535,320 | |||
Olympic Steel | 460,800 | 10,202,112 | |||
Orbit Garant Drilling 2 | 1,512,500 | 3,345,230 | |||
Pan American Silver | 2,413,053 | 45,196,483 | |||
| 4,335,000 | 57,265,350 | ||||
Reliance Steel & Aluminum | 180,000 | 11,178,000 | |||
Schnitzer Steel Industries Cl. A | 177,100 | 5,371,443 | |||
Seabridge Gold 2 | 1,111,783 | 19,978,741 | |||
| 1,978,611 | 29,461,518 | ||||
Silvercorp Metals | 3,860,400 | 19,765,248 | |||
Sims Metal Management ADR | 1,558,952 | 15,371,267 | |||
Tahoe Resources 2 | 719,400 | 13,162,843 | |||
| 581,800,946 | |||||
| Paper & Forest Products - 0.8% | |||||
Buckeye Technologies | 831,300 | 23,866,623 | |||
| Total (Cost $538,916,480) | 669,943,214 | ||||
| Telecommunication Services – 0.1% | |||||
| Diversified Telecommunication Services - 0.1% | |||||
Neutral Tandem | 668,210 | 1,717,300 | |||
| Total (Cost $8,566,957) | 1,717,300 | ||||
| Utilities – 0.1% | |||||
| Independent Power Producers & Energy Traders - 0.1% | |||||
Alterra Power 2 | 9,732,900 | 4,207,446 | |||
| Total (Cost $12,581,546) | 4,207,446 | ||||
| Miscellaneous 5 – 0.4% | |||||
| Total (Cost $13,829,416) | 12,924,895 | ||||
| TOTAL COMMON STOCKS | |||||
(Cost $2,545,215,499) | 2,987,389,972 | ||||
| REPURCHASE AGREEMENT – 1.8% | |||||
Fixed Income Clearing Corporation, | 55,591,000 | ||||
| THE ACCOMPANYING NOTES ARE AN INTEGRAL PART OF THESE FINANCIAL STATEMENTS. | The Royce Funds 2012 Annual Report to Shareholders | 57 |
Schedules of Investments
| Royce Low-Priced Stock Fund (continued) |
| VALUE | ||||||
| COLLATERAL RECEIVED FOR SECURITIES | ||||||
LOANED – 3.6% | ||||||
Money Market Funds | $ | 108,541,564 | ||||
| TOTAL INVESTMENTS – 103.8% | ||||||
(Cost $2,709,348,063) | 3,151,522,536 | |||||
| LIABILITIES LESS CASH | ||||||
AND OTHER ASSETS – (3.8)% | (114,358,357 | ) | ||||
| NET ASSETS – 100.0% | $ | 3,037,164,179 | ||||
| Royce Total Return Fund |
| SHARES | VALUE | ||||
| COMMON STOCKS – 97.6% | |||||
| Consumer Discretionary – 11.3% | |||||
| Auto Components - 0.4% | |||||
Autoliv | 29,300 | $ | 1,974,527 | ||
Gentex Corporation | 595,000 | 11,197,900 | |||
Spartan Motors | 47,557 | 234,456 | |||
Standard Motor Products | 90,706 | 2,015,487 | |||
Superior Industries International | 95,121 | 1,940,469 | |||
| 17,362,839 | |||||
| Automobiles - 0.3% | |||||
Thor Industries | 401,349 | 15,022,493 | |||
| Distributors - 0.1% | |||||
Weyco Group | 282,000 | 6,587,520 | |||
| Diversified Consumer Services - 0.3% | |||||
DeVry | 84,100 | 1,995,693 | |||
Hillenbrand | 243,625 | 5,508,361 | |||
Regis Corporation | 231,100 | 3,910,212 | |||
Sotheby’s | 2,200 | 73,964 | |||
Strayer Education 1 | 21,000 | 1,179,570 | |||
| 12,667,800 | |||||
| Hotels, Restaurants & Leisure - 0.5% | |||||
Abu Dhabi National Hotels | 1,200,000 | 588,075 | |||
Ambassadors Group | 29,970 | 127,672 | |||
Bob Evans Farms | 441,873 | 17,763,295 | |||
DineEquity 2 | 61,030 | 4,089,010 | |||
| 22,568,052 | |||||
| Household Durables - 0.8% | |||||
American Greetings Cl. A | 112,800 | 1,905,192 | |||
Blyth | 7,638 | 118,771 | |||
Ethan Allen Interiors | 1,170,250 | 30,087,127 | |||
Harman International Industries | 47,500 | 2,120,400 | |||
Leggett & Platt | 39,003 | 1,061,662 | |||
| 35,293,152 | |||||
| Internet & Catalog Retail - 0.0% | |||||
NutriSystem | 44,160 | 361,671 | |||
| Leisure Equipment & Products - 0.2% | |||||
| 92,881 | 3,101,297 | ||||
Callaway Golf | 962,900 | 6,258,850 | |||
Hasbro | 12,438 | 446,524 | |||
JAKKS Pacific | 58,268 | 729,515 | |||
Sturm, Ruger & Co. | 12,862 | 583,935 | |||
| 11,120,121 | |||||
| Media - 0.4% | |||||
Arbitron | 43,600 | 2,035,248 | |||
Harte-Hanks | 144,627 | 853,299 | |||
Meredith Corporation | 99,620 | 3,431,909 | |||
Scholastic Corporation | 65,599 | 1,939,106 | |||
Washington Post Cl. B | 2,800 | 1,022,588 | |||
World Wrestling Entertainment Cl. A | 1,008,467 | 7,956,805 | |||
| 17,238,955 | |||||
| Multiline Retail - 0.1% | |||||
Dillard’s Cl. A | 29,786 | 2,495,173 | |||
| Specialty Retail - 6.4% | |||||
Aaron’s | 14,100 | 398,748 | |||
| 58 | The Royce Funds 2012 Annual Report to Shareholders | THE ACCOMPANYING NOTES ARE AN INTEGRAL PART OF THESE FINANCIAL STATEMENTS. |
December 31, 2012 |
| SHARES | VALUE | ||||
| Consumer Discretionary (continued) | |||||
| Specialty Retail (continued) | |||||
American Eagle Outfitters | 1,515,562 | $ | 31,084,176 | ||
Ascena Retail Group 2 | 1,771,418 | 32,753,519 | |||
Buckle (The) | 765,936 | 34,191,383 | |||
Cato Corporation (The) Cl. A | 1,424,615 | 39,077,189 | |||
Chico’s FAS | 96,200 | 1,775,852 | |||
DSW Cl. A | 800 | 52,552 | |||
Finish Line (The) Cl. A | 78,148 | 1,479,342 | |||
Foot Locker | 90,392 | 2,903,391 | |||
GameStop Corporation Cl. A | 1,331,757 | 33,413,783 | |||
Guess? | 1,282,119 | 31,463,200 | |||
Jos. A. Bank Clothiers 2 | 759,736 | 32,349,559 | |||
Men’s Wearhouse (The) | 303,139 | 9,445,811 | |||
Pier 1 Imports | 6,000 | 120,000 | |||
RadioShack Corporation 1 | 159,981 | 339,160 | |||
Rent-A-Center | 24,400 | 838,384 | |||
Ross Stores | 59,800 | 3,238,170 | |||
Stage Stores | 59,478 | 1,473,865 | |||
Systemax | 295,961 | 2,856,024 | |||
Tiffany & Co. | 407,500 | 23,366,050 | |||
Williams-Sonoma | 3,000 | 131,310 | |||
| 282,751,468 | |||||
| Textiles, Apparel & Luxury Goods - 1.8% | |||||
Barry (R.G.) 3 | 1,048,496 | 14,857,188 | |||
Columbia Sportswear | 54,129 | 2,888,323 | |||
G-III Apparel Group 2 | 704,359 | 24,110,209 | |||
Jones Group (The) | 535,179 | 5,919,080 | |||
| 90,575 | 304,332 | ||||
Movado Group | 3,900 | 119,652 | |||
Steven Madden 2 | 527,247 | 22,286,731 | |||
| 175,700 | 4,410,070 | ||||
Wolverine World Wide | 68,117 | 2,791,435 | |||
| 77,687,020 | |||||
| Total (Cost $402,921,146) | 501,156,264 | ||||
| Consumer Staples – 4.0% | |||||
| Food & Staples Retailing - 0.6% | |||||
Village Super Market Cl. A 3 | 726,483 | 23,872,231 | |||
Weis Markets | 7,067 | 276,815 | |||
| 24,149,046 | |||||
| Food Products - 2.2% | |||||
Cal-Maine Foods | 60,898 | 2,449,318 | |||
| 542,300 | 7,825,389 | ||||
Flowers Foods | 600,150 | 13,965,490 | |||
Fresh Del Monte Produce | 900 | 23,715 | |||
Hershey Creamery 4 | 882 | 1,764,000 | |||
Hormel Foods | 404,766 | 12,632,747 | |||
J.M. Smucker Company (The) | 324,000 | 27,941,760 | |||
Lancaster Colony | 3,100 | 214,489 | |||
Sanderson Farms | 5,000 | 237,750 | |||
Tootsie Roll Industries | 1,130,396 | 29,299,864 | |||
| 96,354,522 | |||||
| Household Products - 0.0% | |||||
WD-40 Company | 5,296 | 249,495 | |||
| Personal Products - 1.2% | |||||
Inter Parfums | 1,115,245 | 21,702,668 | |||
Nu Skin Enterprises Cl. A 1 | 873,710 | 32,370,955 | |||
| 54,073,623 | |||||
| Tobacco - 0.0% | |||||
Universal Corporation | 7,064 | 352,564 | |||
| Total (Cost $144,993,407) | 175,179,250 | ||||
| Diversified Investment Companies – 0.4% | |||||
| Closed-End Funds - 0.4% | |||||
British Empire Securities and General | |||||
Trust | 440,000 | 3,393,278 | |||
Central Fund of Canada Cl. A | 750,500 | 15,783,015 | |||
| Total (Cost $13,086,573) | 19,176,293 | ||||
| Energy – 8.2% | |||||
| Energy Equipment & Services - 3.3% | |||||
CARBO Ceramics | 280,700 | 21,990,038 | |||
Core Laboratories | 100 | 10,931 | |||
Exterran Partners L.P. | 629,700 | 12,764,019 | |||
Helmerich & Payne | 636,268 | 35,637,371 | |||
Lufkin Industries | 53,136 | 3,088,796 | |||
Oceaneering International | 11,801 | 634,776 | |||
† Oil States International 2 | 502,000 | 35,913,080 | |||
Patterson-UTI Energy | 58,877 | 1,096,878 | |||
Precision Drilling | 611,050 | 5,059,494 | |||
RPC | 165,300 | 2,023,272 | |||
SEACOR Holdings | 361,477 | 30,291,772 | |||
| 148,510,427 | |||||
| Oil, Gas & Consumable Fuels - 4.9% | |||||
Alliance Holdings GP L.P. | 578,500 | 27,525,030 | |||
Alliance Resource Partners L.P. | 278,000 | 16,143,460 | |||
† Apco Oil and Gas International 1 | 2,700 | 33,237 | |||
Arch Coal | 111,518 | 816,312 | |||
Cimarex Energy | 346,590 | 20,008,641 | |||
Delek US Holdings | 15,203 | 384,940 | |||
Energen Corporation | 165,132 | 7,445,802 | |||
Energy Transfer Equity L.P. | 424,500 | 19,306,260 | |||
Hugoton Royalty Trust | 558,500 | 4,082,635 | |||
Magellan Midstream Partners L.P. | 867,402 | 37,463,092 | |||
Natural Resource Partners L.P. | 537,700 | 9,968,958 | |||
NuStar GP Holdings LLC | 369,200 | 10,223,148 | |||
Pengrowth Energy | 85,357 | 424,224 | |||
Penn Virginia | 633,760 | 2,794,882 | |||
Pioneer Southwest Energy Partners L.P. | 86,685 | 1,967,749 | |||
Plains All American Pipeline L.P. | 180,000 | 8,143,200 | |||
PVR Partners, L.P. | 514,500 | 13,366,710 | |||
Sabine Royalty Trust | 1,800 | 71,622 | |||
San Juan Basin Royalty Trust | 1,820 | 24,406 | |||
SM Energy | 18,342 | 957,636 | |||
Sunoco Logistics Partners L.P. | 693,000 | 34,462,890 | |||
W&T Offshore | 77,700 | 1,245,531 | |||
| 216,860,365 | |||||
| Total (Cost $247,341,300) | 365,370,792 | ||||
| THE ACCOMPANYING NOTES ARE AN INTEGRAL PART OF THESE FINANCIAL STATEMENTS. | The Royce Funds 2012 Annual Report to Shareholders | 59 |
Schedules of Investments
| Royce Total Return Fund (continued) |
| SHARES | VALUE | ||||
| Financials – 27.8% | |||||
| Capital Markets - 8.2% | |||||
A.F.P. Provida ADR | 311,700 | $ | 32,416,800 | ||
AGF Management Cl. B | 815,600 | 8,133,861 | |||
AllianceBernstein Holding L.P. | 1,941,900 | 33,847,317 | |||
AP Alternative Assets L.P. 2 | 76,000 | 1,127,203 | |||
Apollo Global Management LLC Cl. A | 659,500 | 11,448,920 | |||
Apollo Investment | 1,161,400 | 9,709,304 | |||
Artio Global Investors Cl. A | 28,587 | 54,315 | |||
ASA Gold and Precious Metals | 255,000 | 5,490,150 | |||
| 27,601 | 803,585 | ||||
Banque Privee Edmond de Rothschild | 205 | 4,094,034 | |||
CI Financial | 933,500 | 23,396,155 | |||
Cohen & Steers | 385,630 | 11,750,146 | |||
Egyptian Financial Group-Hermes Holding | |||||
Company 2 | 860,027 | 1,490,173 | |||
Egyptian Financial Group-Hermes Holding | |||||
Company GDR 2 | 75,000 | 285,000 | |||
Federated Investors Cl. B | 1,889,963 | 38,233,952 | |||
GAMCO Investors Cl. A | 278,300 | 14,769,381 | |||
Janus Capital Group | 1,038,509 | 8,848,097 | |||
KKR & Co. L.P. | 1,315,600 | 20,036,588 | |||
Lazard Cl. A | 575,000 | 17,158,000 | |||
MVC Capital | 495,000 | 6,014,250 | |||
Och-Ziff Capital Management Group LLC | |||||
Cl. A | 190,400 | 1,808,800 | |||
Oppenheimer Holdings Cl. A | 4,867 | 84,053 | |||
Paris Orleans | 249,213 | 5,690,190 | |||
Raymond James Financial | 597,925 | 23,038,050 | |||
Schroders | 131,100 | 3,683,212 | |||
SEI Investments | 1,585,292 | 37,000,715 | |||
T. Rowe Price Group | 411,100 | 26,774,943 | |||
Teton Advisors Cl. A 4 | 1,297 | 21,271 | |||
Vontobel Holding | 75,400 | 2,328,100 | |||
Waddell & Reed Financial Cl. A | 280,500 | 9,767,010 | |||
Westwood Holdings Group | 45,895 | 1,877,106 | |||
| 361,180,681 | |||||
| Commercial Banks - 3.4% | |||||
Ames National | 320,421 | 7,017,220 | |||
Banco Latinoamericano de Comercio | |||||
Exterior Cl. E | 110,775 | 2,388,309 | |||
Bank of Hawaii | 782,001 | 34,447,144 | |||
BLOM Bank GDR | 684,500 | 5,407,550 | |||
BOK Financial | 521,582 | 28,405,356 | |||
Canadian Western Bank | 783,200 | 22,392,890 | |||
CapitalSource | 95,200 | 721,616 | |||
City Holding Company | 640,358 | 22,316,476 | |||
Farmers & Merchants Bank of Long | |||||
Beach | 479 | 2,064,490 | |||
First Citizens BancShares Cl. A | 61,526 | 10,059,501 | |||
First National Bank Alaska | 3,110 | 5,209,250 | |||
National Bankshares | 133,884 | 4,336,503 | |||
Peapack-Gladstone Financial 3 | 475,350 | 6,692,928 | |||
| 284,428 | 1,006,875 | ||||
| 152,466,108 | |||||
| Consumer Finance - 0.0% | |||||
Cash America International | 19,500 | 773,565 | |||
| Diversified Financial Services - 0.6% | |||||
Leucadia National | 433,800 | 10,320,102 | |||
Sofina | 195,572 | 17,714,808 | |||
| 28,034,910 | |||||
| Insurance - 10.4% | |||||
Alleghany Corporation 2 | 102,139 | 34,259,463 | |||
Allied World Assurance Company | |||||
Holdings | 388,902 | 30,645,478 | |||
American Financial Group | 136,400 | 5,390,528 | |||
American National Insurance | 145,093 | 9,908,401 | |||
AmTrust Financial Services | 38,280 | 1,098,253 | |||
Argo Group International Holdings | 52,281 | 1,756,119 | |||
Aspen Insurance Holdings | 700,208 | 22,462,673 | |||
Assurant | 57,759 | 2,004,237 | |||
Assured Guaranty | 242,192 | 3,446,392 | |||
Baldwin & Lyons Cl. B | 109,041 | 2,601,718 | |||
Brown & Brown | 110,000 | 2,800,600 | |||
Cincinnati Financial | 280,000 | 10,964,800 | |||
Crawford & Company Cl. B | 65,377 | 521,709 | |||
E-L Financial | 92,288 | 40,359,184 | |||
EMC Insurance Group | 101,164 | 2,415,796 | |||
Employers Holdings | 10,400 | 214,032 | |||
Erie Indemnity Cl. A | 635,400 | 43,982,388 | |||
Everest Re Group | 8,700 | 956,565 | |||
FBL Financial Group Cl. A | 7,100 | 242,891 | |||
Fidelity National Financial | 1,151,652 | 27,121,405 | |||
First American Financial | 436,661 | 10,519,164 | |||
Gallagher (Arthur J.) & Co. | 978,200 | 33,894,630 | |||
HCC Insurance Holdings | 350,626 | 13,046,793 | |||
Infinity Property & Casualty | 76,462 | 4,453,147 | |||
Kansas City Life Insurance | 2,247 | 85,746 | |||
Markel Corporation 2 | 67,900 | 29,429,218 | |||
Meadowbrook Insurance Group | 136,771 | 790,536 | |||
Mercury General | 203,900 | 8,092,791 | |||
Montpelier Re Holdings | 421,406 | 9,633,341 | |||
Old Republic International | 987,000 | 10,511,550 | |||
PartnerRe | 213,030 | 17,146,785 | |||
Platinum Underwriters Holdings | 287,006 | 13,202,276 | |||
Protective Life | 67,830 | 1,938,581 | |||
Reinsurance Group of America | 675,586 | 36,157,363 | |||
RenaissanceRe Holdings | 9,809 | 797,079 | |||
RLI Corp. | 79,435 | 5,136,267 | |||
StanCorp Financial Group | 8,800 | 322,696 | |||
State Auto Financial | 362,000 | 5,408,280 | |||
Stewart Information Services | 12,600 | 327,600 | |||
Symetra Financial | 712,400 | 9,246,952 | |||
Tower Group | 41,555 | 738,432 | |||
United Fire Group | 123,574 | 2,698,856 | |||
Validus Holdings | 1 | 35 | |||
White Mountains Insurance Group | 3,760 | 1,936,400 | |||
| 458,667,150 | |||||
| Real Estate Investment Trusts (REITs) - 4.2% | |||||
Annaly Capital Management | 450,500 | 6,325,020 | |||
| 60 | The Royce Funds 2012 Annual Report to Shareholders | THE ACCOMPANYING NOTES ARE AN INTEGRAL PART OF THESE FINANCIAL STATEMENTS. |
December 31, 2012 |
| SHARES | VALUE | ||||
| Financials (continued) | |||||
| Real Estate Investment Trusts (REITs) (continued) | |||||
Colony Financial | 1,744,149 | $ | 34,010,905 | ||
Cousins Properties | 818,085 | 6,831,010 | |||
DCT Industrial Trust | 1,121,600 | 7,279,184 | |||
Essex Property Trust | 83,000 | 12,171,950 | |||
Lexington Realty Trust | 1,711,246 | 17,882,521 | |||
MFA Financial | 692,000 | 5,612,120 | |||
National Health Investors | 159,570 | 9,020,492 | |||
National Retail Properties | 650,000 | 20,280,000 | |||
PS Business Parks | 168,500 | 10,949,130 | |||
Rayonier | 794,100 | 41,158,203 | |||
W.P. Carey | 281,231 | 14,666,197 | |||
| 186,186,732 | |||||
| Thrifts & Mortgage Finance - 1.0% | |||||
Genworth MI Canada | 1,151,700 | 26,155,527 | |||
HopFed Bancorp | 59,009 | 519,869 | |||
Kearny Financial 1 | 312,100 | 3,042,975 | |||
TrustCo Bank Corp NY | 2,706,049 | 14,287,939 | |||
| 44,006,310 | |||||
| Total (Cost $968,853,315) | 1,231,315,456 | ||||
| Health Care – 5.7% | |||||
| Health Care Equipment & Supplies - 2.5% | |||||
Analogic Corporation | 160,900 | 11,954,870 | |||
Cantel Medical | 54,709 | 1,626,498 | |||
Hill-Rom Holdings | 512,170 | 14,596,845 | |||
| 379,600 | 35,226,880 | ||||
Invacare Corporation | 126,189 | 2,056,881 | |||
STERIS Corporation | 693,500 | 24,085,255 | |||
Teleflex | 309,700 | 22,084,707 | |||
Young Innovations | 15,705 | 618,934 | |||
| 112,250,870 | |||||
| Health Care Providers & Services - 2.6% | |||||
† Assisted Living Concepts Cl. A 1 | 5,000 | 48,750 | |||
Chemed Corporation | 566,359 | 38,846,564 | |||
Coventry Health Care | 26,300 | 1,179,029 | |||
Ensign Group | 33,555 | 912,360 | |||
Landauer | 403,771 | 24,714,823 | |||
| 272,888 | 21,700,054 | ||||
Omnicare | 71,699 | 2,588,334 | |||
Owens & Minor | 911,950 | 25,999,694 | |||
| 115,989,608 | |||||
| Life Sciences Tools & Services - 0.5% | |||||
PerkinElmer | 712,600 | 22,617,924 | |||
| Pharmaceuticals - 0.1% | |||||
Valeant Pharmaceuticals International 2 | 55,768 | 3,333,254 | |||
| Total (Cost $144,242,061) | 254,191,656 | ||||
| Industrials – 20.4% | |||||
| Aerospace & Defense - 1.5% | |||||
American Science & Engineering | 68,834 | 4,488,665 | |||
Cubic Corporation | 590,720 | 28,336,838 | |||
HEICO Corporation | 371,875 | 16,645,125 | |||
HEICO Corporation Cl. A | 390,933 | 12,502,037 | |||
National Presto Industries | 60,726 | 4,196,167 | |||
Triumph Group | 24,376 | 1,591,753 | |||
| 67,760,585 | |||||
| Air Freight & Logistics - 0.9% | |||||
Aramex | 1,600,000 | 869,575 | |||
C. H. Robinson Worldwide | 256,000 | 16,184,320 | |||
Expeditors International of Washington | 458,400 | 18,129,720 | |||
UTi Worldwide | 492,600 | 6,600,840 | |||
| 41,784,455 | |||||
| Building Products - 0.7% | |||||
Smith (A.O.) Corporation | 497,894 | 31,402,175 | |||
| Commercial Services & Supplies - 2.7% | |||||
ABM Industries | 716,100 | 14,286,195 | |||
Ennis | 387,401 | 5,993,094 | |||
G&K Services Cl. A | 1,955 | 66,763 | |||
Healthcare Services Group | 142,464 | 3,309,439 | |||
HNI Corporation | 474,573 | 14,265,664 | |||
Kimball International Cl. B | 724,600 | 8,412,606 | |||
McGrath RentCorp | 291,300 | 8,453,526 | |||
Mine Safety Appliances | 196,000 | 8,371,160 | |||
Progressive Waste Solutions | 11,600 | 250,560 | |||
Ritchie Bros. Auctioneers | 1,656,320 | 34,600,525 | |||
Rollins | 833,625 | 18,373,095 | |||
UniFirst Corporation | 28,416 | 2,083,461 | |||
US Ecology | 36,705 | 864,036 | |||
Viad Corporation | 1,740 | 47,258 | |||
| 119,377,382 | |||||
| Construction & Engineering - 0.3% | |||||
Comfort Systems USA | 283,050 | 3,441,888 | |||
EMCOR Group | 71,139 | 2,462,121 | |||
Granite Construction | 196,075 | 6,592,041 | |||
Great Lakes Dredge & Dock | 4,432 | 39,578 | |||
KBR | 91,213 | 2,729,093 | |||
| 15,264,721 | |||||
| Electrical Equipment - 2.6% | |||||
Acuity Brands | 12,368 | 837,685 | |||
AZZ | 518,965 | 19,943,825 | |||
Belden | 18,703 | 841,448 | |||
Brady Corporation Cl. A | 469,773 | 15,690,418 | |||
Encore Wire | 10,200 | 309,162 | |||
Franklin Electric | 366,900 | 22,810,173 | |||
Hubbell Cl. B | 316,021 | 26,744,857 | |||
LSI Industries | 1,104,161 | 7,740,168 | |||
Preformed Line Products | 202,671 | 12,042,711 | |||
Regal-Beloit | 10,702 | 754,170 | |||
Roper Industries | 76,000 | 8,472,480 | |||
| 116,187,097 | |||||
| Industrial Conglomerates - 0.9% | |||||
Raven Industries | 312,402 | 8,234,917 | |||
Seaboard Corporation | 10,476 | 26,503,023 | |||
Standex International | 54,043 | 2,771,865 | |||
| 37,509,805 | |||||
| Machinery - 7.9% | |||||
Alamo Group | 397,332 | 12,968,916 | |||
American Railcar Industries | 119,609 | 3,795,194 | |||
| THE ACCOMPANYING NOTES ARE AN INTEGRAL PART OF THESE FINANCIAL STATEMENTS. | The Royce Funds 2012 Annual Report to Shareholders | 61 |
Schedules of Investments
| Royce Total Return Fund (continued) |
| SHARES | VALUE | ||||
| Industrials (continued) | |||||
| Machinery (continued) | |||||
Ampco-Pittsburgh | 189,320 | $ | 3,782,614 | ||
Briggs & Stratton | 435,230 | 9,174,648 | |||
Cascade Corporation | 87,203 | 5,607,153 | |||
Crane Company | 290,000 | 13,421,200 | |||
FreightCar America | 10,539 | 236,284 | |||
Gardner Denver | 14,500 | 993,250 | |||
Gorman-Rupp Company | 576,633 | 17,200,962 | |||
Kaydon Corporation | 15,100 | 361,343 | |||
Kennametal | 867,659 | 34,706,360 | |||
Lincoln Electric Holdings | 513,872 | 25,015,289 | |||
Lindsay Corporation | 222,482 | 17,825,258 | |||
| 116,700 | 2,520,720 | ||||
Mueller Industries | 430,862 | 21,556,026 | |||
Nordson Corporation | 734,300 | 46,349,016 | |||
Robbins & Myers | 5,200 | 309,140 | |||
Starrett (L.S.) Company (The) Cl. A 3 | 529,400 | 5,135,180 | |||
Sun Hydraulics | 1,025,346 | 26,741,024 | |||
Tennant Company | 632,198 | 27,785,102 | |||
Timken Company (The) | 36,132 | 1,728,194 | |||
Toro Company (The) | 656,550 | 28,218,519 | |||
Trinity Industries | 645,587 | 23,124,926 | |||
Wabtec Corporation | 1,400 | 122,556 | |||
Watts Water Technologies Cl. A | 1,500 | 64,485 | |||
Woodward | 609,200 | 23,228,796 | |||
| 351,972,155 | |||||
| Marine - 0.3% | |||||
Euroseas | 125,346 | 114,065 | |||
Matson | 494,700 | 12,228,984 | |||
| 12,343,049 | |||||
| Professional Services - 1.6% | |||||
CDI Corporation | 2,863 | 49,043 | |||
Corporate Executive Board | 236,000 | 11,200,560 | |||
Heidrick & Struggles International | 131,532 | 2,007,178 | |||
Kelly Services Cl. A | 595,000 | 9,365,300 | |||
ManpowerGroup | 462,152 | 19,613,731 | |||
Resources Connection | 58,700 | 700,878 | |||
Robert Half International | 26,300 | 836,866 | |||
Towers Watson & Company Cl. A | 475,900 | 26,750,339 | |||
| 70,523,895 | |||||
| Road & Rail - 0.1% | |||||
Arkansas Best | 246,081 | 2,350,074 | |||
| Trading Companies & Distributors - 0.8% | |||||
Applied Industrial Technologies | 772,970 | 32,472,470 | |||
Houston Wire & Cable | 59,164 | 725,942 | |||
MFC Industrial | 153,159 | 1,309,509 | |||
Watsco | 6,402 | 479,510 | |||
| 34,987,431 | |||||
| Transportation Infrastructure - 0.1% | |||||
Grupo Aeroportuario del Pacifico ADR | 40,000 | 2,286,800 | |||
| Total (Cost $495,239,783) | 903,749,624 | ||||
| Information Technology – 6.7% | |||||
| Communications Equipment - 2.1% | |||||
ADTRAN | 429,000 | 8,382,660 | |||
Bel Fuse Cl. A | 22,350 | 384,644 | |||
Bel Fuse Cl. B | 74,000 | 1,446,700 | |||
Black Box | 319,653 | 7,780,354 | |||
Comtech Telecommunications | 98,500 | 2,499,930 | |||
NETGEAR 2 | 895,809 | 35,312,791 | |||
Plantronics | 986,997 | 36,390,579 | |||
Tellabs | 741,355 | 1,690,289 | |||
| 93,887,947 | |||||
| Computers & Peripherals - 0.0% | |||||
Diebold | 13,700 | 419,357 | |||
Xyratex | 50,003 | 420,525 | |||
| 839,882 | |||||
| Electronic Equipment, Instruments & Components - 2.8% | |||||
AVX Corporation | 1,218,031 | 13,130,374 | |||
Cognex Corporation | 418,300 | 15,401,806 | |||
Electro Rent | 4,700 | 72,286 | |||
Littelfuse | 451,111 | 27,838,060 | |||
Methode Electronics | 1,122,573 | 11,259,407 | |||
Molex | 55,411 | 1,514,383 | |||
Molex Cl. A | 1,210,855 | 27,026,284 | |||
MTS Systems | 122,641 | 6,246,106 | |||
Nam Tai Electronics | 1,405,500 | 19,424,010 | |||
Park Electrochemical | 120,751 | 3,106,923 | |||
| 125,019,639 | |||||
| Internet Software & Services - 0.2% | |||||
EarthLink | 434,698 | 2,808,149 | |||
j2 Global | 65,700 | 2,009,106 | |||
United Online | 618,215 | 3,455,822 | |||
| 8,273,077 | |||||
| IT Services - 0.8% | |||||
Broadridge Financial Solutions | 6,500 | 148,720 | |||
Computer Sciences | 2,400 | 96,120 | |||
Global Payments | 15,846 | 717,824 | |||
Jack Henry & Associates | 2,500 | 98,150 | |||
ManTech International Cl. A | 930,068 | 24,125,964 | |||
MAXIMUS | 74,560 | 4,713,683 | |||
Syntel 1 | 11,800 | 632,362 | |||
Total System Services | 217,495 | 4,658,743 | |||
| 35,191,566 | |||||
| Semiconductors & Semiconductor Equipment - 0.6% | |||||
Brooks Automation | 54,390 | 437,839 | |||
Micrel | 90,460 | 859,370 | |||
MKS Instruments | 5,000 | 128,900 | |||
Teradyne 2 | 1,402,200 | 23,683,158 | |||
| 25,109,267 | |||||
| Software - 0.2% | |||||
† Ebix 1 | 101,900 | 1,637,533 | |||
FactSet Research Systems | 2,300 | 202,538 | |||
Fair Isaac | 173,457 | 7,290,398 | |||
| 9,130,469 | |||||
| Total (Cost $289,117,535) | 297,451,847 | ||||
| 62 | The Royce Funds 2012 Annual Report to Shareholders | THE ACCOMPANYING NOTES ARE AN INTEGRAL PART OF THESE FINANCIAL STATEMENTS. |
December 31, 2012 |
| SHARES | VALUE | ||||
| Materials – 7.6% | |||||
| Chemicals - 4.2% | |||||
Agrium | 5,200 | $ | 519,532 | ||
Albemarle Corporation | 447,900 | 27,823,548 | |||
Balchem Corporation | 1,006,200 | 36,625,680 | |||
Cabot Corporation | 781,000 | 31,075,990 | |||
Chase Corporation 3 | 773,974 | 14,395,916 | |||
FutureFuel Corporation | 136,547 | 1,616,717 | |||
H.B. Fuller Company | 9,022 | 314,146 | |||
Innophos Holdings | 317,952 | 14,784,768 | |||
International Flavors & Fragrances | 255,300 | 16,987,662 | |||
Kronos Worldwide | 55,300 | 1,078,350 | |||
Methanex Corporation | 310,710 | 9,902,328 | |||
Minerals Technologies | 69,734 | 2,783,781 | |||
NewMarket Corporation | 6,526 | 1,711,117 | |||
Quaker Chemical | 421,029 | 22,676,622 | |||
Stepan Company | 14,128 | 784,669 | |||
Tredegar Corporation | 11,700 | 238,914 | |||
Westlake Chemical | 39,300 | 3,116,490 | |||
| 186,436,230 | |||||
| Construction Materials - 0.1% | |||||
Ash Grove Cement 4 | 39,610 | 5,981,110 | |||
| Containers & Packaging - 1.2% | |||||
AptarGroup | 41,300 | 1,970,836 | |||
Bemis Company | 464,800 | 15,552,208 | |||
Greif Cl. A | 586,801 | 26,112,644 | |||
Myers Industries | 14,700 | 222,705 | |||
Sealed Air | 1,513 | 26,493 | |||
Sonoco Products | 359,778 | 10,696,200 | |||
| 54,581,086 | |||||
| Metals & Mining - 1.7% | |||||
Agnico-Eagle Mines | 117,000 | 6,137,820 | |||
Carpenter Technology | 284,375 | 14,682,281 | |||
Gold Fields ADR | 391,200 | 4,886,088 | |||
IAMGOLD Corporation | 206,620 | 2,369,932 | |||
Olympic Steel | 39,297 | 870,036 | |||
Reliance Steel & Aluminum | 568,113 | 35,279,817 | |||
Sims Metal Management ADR | 1,000,000 | 9,860,000 | |||
| 74,085,974 | |||||
| Paper & Forest Products - 0.4% | |||||
Buckeye Technologies | 8,200 | 235,422 | |||
Deltic Timber | 172,000 | 12,146,640 | |||
Domtar Corporation | 17,300 | 1,444,896 | |||
Glatfelter | 16,002 | 279,715 | |||
Schweitzer-Mauduit International | 70,800 | 2,763,324 | |||
| 16,869,997 | |||||
| Total (Cost $212,474,090) | 337,954,397 | ||||
| Telecommunication Services – 0.7% | |||||
| Diversified Telecommunication Services - 0.2% | |||||
Atlantic Tele-Network | 284,303 | 10,436,763 | |||
| Wireless Telecommunication Services - 0.5% | |||||
Telephone and Data Systems | 822,190 | 18,203,287 | |||
USA Mobility | 143,566 | 1,676,851 | |||
| 19,880,138 | |||||
| Total (Cost $28,847,837) | 30,316,901 | ||||
| Utilities – 2.9% | |||||
| Electric Utilities - 0.9% | |||||
ALLETE | 199,147 | 8,161,044 | |||
ITC Holdings | 250,000 | 19,227,500 | |||
PNM Resources | 638,900 | 13,103,839 | |||
| 40,492,383 | |||||
| Gas Utilities - 1.3% | |||||
AGL Resources | 312,558 | 12,492,943 | |||
National Fuel Gas | 61,676 | 3,126,357 | |||
Piedmont Natural Gas | 539,500 | 16,891,745 | |||
UGI Corporation | 660,076 | 21,591,086 | |||
| 54,102,131 | |||||
| Water Utilities - 0.7% | |||||
Aqua America | 819,766 | 20,838,451 | |||
Consolidated Water | 25,827 | 191,120 | |||
SJW | 400,400 | 10,650,640 | |||
| 31,680,211 | |||||
| Total (Cost $93,414,655) | 126,274,725 | ||||
| Miscellaneous 5 – 1.9% | |||||
| Total (Cost $70,903,096) | 82,928,069 | ||||
| TOTAL COMMON STOCKS | |||||
(Cost $3,111,434,798) | 4,325,065,274 | ||||
| PRINCIPAL | |||||
| AMOUNT | |||||
| CORPORATE BOND – 0.1% | |||||
Leucadia National 3.75% | |||||
Conv. Senior Note due 4/15/14 | |||||
(Cost $3,000,000) | $3,000,000 | 3,496,875 | |||
| REPURCHASE AGREEMENT – 2.4% | |||||
| Fixed Income Clearing Corporation, | |||||
0.10% dated 12/31/12, due 1/2/13, | |||||
maturity value $108,998,606 (collateralized | |||||
by obligations of various U.S. Government | |||||
Agencies, 0.125%-0.30% due 12/4/13-12/20/13, | |||||
valued at $111,178,509) | |||||
(Cost $108,998,000) | 108,998,000 | ||||
COLLATERAL RECEIVED FOR SECURITIES | |||||
| U.S. Treasury Notes | |||||
1.00%-4.00% | |||||
due 1/31/14-9/30/17 | 7,255,438 | 7,291,871 | |||
| THE ACCOMPANYING NOTES ARE AN INTEGRAL PART OF THESE FINANCIAL STATEMENTS. | The Royce Funds 2012 Annual Report to Shareholders | 63 |
Schedules of Investments
| Royce Total Return Fund (continued) |
| VALUE | |||||||
COLLATERAL RECEIVED FOR SECURITIES | |||||||
| Money Market Funds | |||||||
Federated Government Obligations Fund | |||||||
(7 day yield-0.0107%) | $ | 36,088,082 | |||||
| TOTAL COLLATERAL RECEIVED FOR | |||||||
SECURITIES LOANED | |||||||
(Cost $43,379,953) | 43,379,953 | ||||||
| TOTAL INVESTMENTS – 101.1% | |||||||
(Cost $3,266,812,751) | 4,480,940,102 | ||||||
| LIABILITIES LESS CASH | |||||||
AND OTHER ASSETS – (1.1)% | (48,269,025 | ) | |||||
| NET ASSETS – 100.0% | $ | 4,432,671,077 | |||||
| Royce Heritage Fund |
| SHARES | VALUE | ||||
| COMMON STOCKS – 96.6% | |||||
| Consumer Discretionary – 11.1% | |||||
| Auto Components - 1.5% | |||||
Autoliv | 3,830 | $ | 258,104 | ||
Drew Industries | 48,200 | 1,554,450 | |||
Gentex Corporation | 40,000 | 752,800 | |||
Minth Group | 262,300 | 303,374 | |||
Nokian Renkaat | 28,000 | 1,126,683 | |||
| 3,995,411 | |||||
| Automobiles - 0.6% | |||||
Thor Industries | 46,540 | 1,741,992 | |||
| Distributors - 0.7% | |||||
LKQ Corporation 2 | 95,800 | 2,021,380 | |||
| Diversified Consumer Services - 0.8% | |||||
Sotheby’s | 61,800 | 2,077,716 | |||
| Household Durables - 3.6% | |||||
Ethan Allen Interiors | 55,900 | 1,437,189 | |||
Garmin | 35,000 | 1,428,700 | |||
Harman International Industries | 46,200 | 2,062,368 | |||
Mohawk Industries 2 | 28,100 | 2,542,207 | |||
NVR 2 | 2,580 | 2,373,600 | |||
| 9,844,064 | |||||
| Media - 0.1% | |||||
| 11,600 | 260,768 | ||||
| Specialty Retail - 3.0% | |||||
Advance Auto Parts | 4,461 | 322,753 | |||
American Eagle Outfitters | 8,200 | 168,182 | |||
Ascena Retail Group 2 | 19,400 | 358,706 | |||
Fielmann | 4,700 | 452,870 | |||
GameStop Corporation Cl. A | 4,000 | 100,360 | |||
Guess? | 4,700 | 115,338 | |||
Lewis Group | 59,500 | 485,339 | |||
Luk Fook Holdings (International) | 85,000 | 272,772 | |||
Monro Muffler Brake | 6,500 | 227,305 | |||
Signet Jewelers | 42,620 | 2,275,908 | |||
Tiffany & Co. | 43,100 | 2,471,354 | |||
USS | 7,000 | 725,582 | |||
| 7,976,469 | |||||
| Textiles, Apparel & Luxury Goods - 0.8% | |||||
Daphne International Holdings | 235,300 | 325,949 | |||
Gildan Activewear | 6,820 | 249,476 | |||
Stella International Holdings | 568,200 | 1,540,281 | |||
| 2,115,706 | |||||
| Total (Cost $23,201,970) | 30,033,506 | ||||
| Consumer Staples – 1.2% | |||||
| Beverages - 0.3% | |||||
National Beverage | 56,300 | 821,417 | |||
| Food Products - 0.9% | |||||
Darling International 2 | 102,500 | 1,644,100 | |||
First Resources | 116,100 | 193,407 | |||
Sanderson Farms | 2,200 | 104,610 | |||
| 64 | The Royce Funds 2012 Annual Report to Shareholders | THE ACCOMPANYING NOTES ARE AN INTEGRAL PART OF THESE FINANCIAL STATEMENTS. |
December 31, 2012 |
| SHARES | VALUE | ||||
| Consumer Staples (continued) | |||||
| Food Products (continued) | |||||
Super Group | 136,000 | $ | 362,018 | ||
| 2,304,135 | |||||
| Total (Cost $2,385,049) | 3,125,552 | ||||
| Energy – 5.2% | |||||
| Energy Equipment & Services - 5.2% | |||||
C&J Energy Services 2 | 10,500 | 225,120 | |||
CARBO Ceramics | 750 | 58,755 | |||
Ensco Cl. A | 1,800 | 106,704 | |||
Ensign Energy Services | 24,800 | 383,207 | |||
Helmerich & Payne | 56,870 | 3,185,289 | |||
Oil States International 2 | 43,000 | 3,076,220 | |||
Pason Systems | 93,300 | 1,608,621 | |||
RPC | 30,100 | 368,424 | |||
TGS-NOPEC Geophysical | 58,400 | 1,913,785 | |||
Total Energy Services | 75,100 | 1,131,747 | |||
Trican Well Service | 139,000 | 1,833,397 | |||
| 13,891,269 | |||||
| Oil, Gas & Consumable Fuels - 0.0% | |||||
Energen Corporation | 1,500 | 67,635 | |||
| Total (Cost $9,300,058) | 13,958,904 | ||||
| Financials – 18.3% | |||||
| Capital Markets - 14.4% | |||||
Affiliated Managers Group 2 | 18,160 | 2,363,524 | |||
AllianceBernstein Holding L.P. | 95,441 | 1,663,537 | |||
ARA Asset Management | 620,000 | 827,298 | |||
Ashmore Group | 367,500 | 2,125,002 | |||
Banque Privee Edmond de Rothschild | 18 | 359,476 | |||
Blackstone Group L.P. | 75,000 | 1,169,250 | |||
Egyptian Financial Group-Hermes Holding | |||||
Company 2 | 248,750 | 431,010 | |||
Federated Investors Cl. B | 49,600 | 1,003,408 | |||
Invesco | 84,300 | 2,199,387 | |||
Jupiter Fund Management | 475,900 | 2,208,831 | |||
KKR & Co. L.P. | 203,000 | 3,091,690 | |||
Lazard Cl. A | 118,200 | 3,527,088 | |||
SEI Investments | 137,200 | 3,202,248 | |||
Sprott | 438,400 | 1,745,314 | |||
State Street | 31,000 | 1,457,310 | |||
T. Rowe Price Group | 26,800 | 1,745,484 | |||
TD AMERITRADE Holding Corporation | 130,000 | 2,185,300 | |||
Value Partners Group | 3,583,300 | 2,405,435 | |||
VZ Holding | 5,500 | 693,713 | |||
Waddell & Reed Financial Cl. A | 43,600 | 1,518,152 | |||
† WisdomTree Investments 2 | 450,700 | 2,758,284 | |||
| 38,680,741 | |||||
| Diversified Financial Services - 3.3% | |||||
Bolsa Mexicana de Valores | 801,800 | 2,022,132 | |||
Hellenic Exchanges | 77,500 | 446,565 | |||
Leucadia National | 33,900 | 806,481 | |||
Moody’s Corporation | 56,760 | 2,856,163 | |||
Singapore Exchange | 260,000 | 1,507,322 | |||
Warsaw Stock Exchange | 100,000 | 1,257,439 | |||
| 8,896,102 | |||||
| Insurance - 0.4% | |||||
Alleghany Corporation 2 | 2,890 | 969,364 | |||
Berkley (W.R.) | 3,800 | 143,412 | |||
| 1,112,776 | |||||
| Real Estate Management & Development - 0.2% | |||||
E-House China Holdings ADR | 66,100 | 271,010 | |||
Kennedy-Wilson Holdings | 10,987 | 153,598 | |||
Midland Holdings | 480,600 | 233,382 | |||
| 657,990 | |||||
| Total (Cost $40,799,361) | 49,347,609 | ||||
| Health Care – 4.4% | |||||
| Biotechnology - 0.6% | |||||
Myriad Genetics 2 | 60,900 | 1,659,525 | |||
| Health Care Equipment & Supplies - 1.7% | |||||
Analogic Corporation | 20,974 | 1,558,368 | |||
Atrion Corporation | 4,900 | 960,400 | |||
Carl Zeiss Meditec | 57,000 | 1,637,644 | |||
Kossan Rubber Industries | 433,997 | 476,754 | |||
| 4,633,166 | |||||
| Health Care Providers & Services - 0.2% | |||||
Schein (Henry) 2 | 7,900 | 635,634 | |||
| Life Sciences Tools & Services - 1.1% | |||||
PerkinElmer | 29,750 | 944,265 | |||
Techne Corporation | 12,100 | 826,914 | |||
Waters Corporation 2 | 13,250 | 1,154,340 | |||
| 2,925,519 | |||||
| Pharmaceuticals - 0.8% | |||||
Adcock Ingram Holdings | 157,500 | 1,003,327 | |||
Hi-Tech Pharmacal | 8,300 | 290,334 | |||
Perrigo Company | 1,900 | 197,657 | |||
Santen Pharmaceutical | 16,300 | 624,072 | |||
| 2,115,390 | |||||
| Total (Cost $10,390,156) | 11,969,234 | ||||
| Industrials – 23.9% | |||||
| Aerospace & Defense - 0.5% | |||||
AeroVironment 2 | 10,500 | 228,270 | |||
HEICO Corporation | 27,343 | 1,223,873 | |||
| 1,452,143 | |||||
| Air Freight & Logistics - 2.4% | |||||
Expeditors International of Washington | 49,700 | 1,965,635 | |||
Forward Air | 89,800 | 3,143,898 | |||
UTi Worldwide | 103,000 | 1,380,200 | |||
| 6,489,733 | |||||
| Building Products - 1.2% | |||||
AAON | 57,350 | 1,196,894 | |||
Simpson Manufacturing | 63,000 | 2,065,770 | |||
| 3,262,664 | |||||
| Commercial Services & Supplies - 1.2% | |||||
Brink’s Company (The) | 33,400 | 952,902 | |||
| THE ACCOMPANYING NOTES ARE AN INTEGRAL PART OF THESE FINANCIAL STATEMENTS. | The Royce Funds 2012 Annual Report to Shareholders | 65 |
Schedules of Investments
| Royce Heritage Fund (continued) |
| SHARES | VALUE | ||||
| Industrials (continued) | |||||
| Commercial Services & Supplies (continued) | |||||
Cintas Corporation | 8,800 | $ | 359,920 | ||
Ritchie Bros. Auctioneers | 69,100 | 1,443,499 | |||
Team 2 | 10,176 | 387,095 | |||
| 3,143,416 | |||||
| Construction & Engineering - 3.6% | |||||
Chicago Bridge & Iron | 2,300 | 106,605 | |||
EMCOR Group | 43,400 | 1,502,074 | |||
Fluor Corporation | 27,700 | 1,627,098 | |||
Jacobs Engineering Group 2 | 55,000 | 2,341,350 | |||
KBR | 104,500 | 3,126,640 | |||
Pike Electric | 42 | 401 | |||
Quanta Services 2 | 5,200 | 141,908 | |||
Raubex Group | 367,500 | 735,051 | |||
| 9,581,127 | |||||
| Electrical Equipment - 0.7% | |||||
AZZ | 4,000 | 153,720 | |||
EnerSys 2 | 4,000 | 150,520 | |||
Franklin Electric | 1,800 | 111,906 | |||
GrafTech International 2 | 139,100 | 1,306,149 | |||
| 1,722,295 | |||||
| Industrial Conglomerates - 0.5% | |||||
Raven Industries | 50,400 | 1,328,544 | |||
| Machinery - 6.1% | |||||
Astec Industries | 2,800 | 93,324 | |||
Burckhardt Compression Holding | 3,200 | 1,049,545 | |||
Chart Industries 2 | 1,600 | 106,672 | |||
Foster (L.B.) Company | 40,600 | 1,763,664 | |||
† Graco | 30,400 | 1,565,296 | |||
Graham Corporation | 9,900 | 193,050 | |||
Kaydon Corporation | 2,600 | 62,218 | |||
Kennametal | 93,030 | 3,721,200 | |||
Lincoln Electric Holdings | 30,500 | 1,484,740 | |||
Pfeiffer Vacuum Technology | 12,000 | 1,453,078 | |||
Spirax-Sarco Engineering | 44,000 | 1,654,269 | |||
Timken Company (The) | 2,500 | 119,575 | |||
Valmont Industries | 19,070 | 2,604,008 | |||
Wabtec Corporation | 7,300 | 639,042 | |||
| 16,509,681 | |||||
| Marine - 0.4% | |||||
Kirby Corporation 2 | 18,250 | 1,129,493 | |||
| Professional Services - 5.3% | |||||
Advisory Board (The) 2 | 64,900 | 3,036,671 | |||
Equifax | 37,570 | 2,033,288 | |||
ManpowerGroup | 77,325 | 3,281,673 | |||
Towers Watson & Company Cl. A | 55,150 | 3,099,982 | |||
Verisk Analytics Cl. A 2 | 57,200 | 2,917,200 | |||
| 14,368,814 | |||||
| Road & Rail - 2.0% | |||||
Landstar System | 58,300 | 3,058,418 | |||
Patriot Transportation Holding 2 | 79,512 | 2,260,526 | |||
| 5,318,944 | |||||
| Total (Cost $47,883,896) | 64,306,854 | ||||
| Information Technology – 16.2% | |||||
| Communications Equipment - 0.5% | |||||
ADTRAN | 31,950 | 624,303 | |||
Finisar Corporation 2 | 4,000 | 65,200 | |||
Oplink Communications 2 | 16,900 | 263,302 | |||
Plantronics | 8,000 | 294,960 | |||
| 1,247,765 | |||||
| Computers & Peripherals - 0.7% | |||||
Super Micro Computer 2 | 42,300 | 431,460 | |||
Western Digital | 37,000 | 1,572,130 | |||
| 2,003,590 | |||||
| Electronic Equipment, Instruments & Components - 7.6% | |||||
Amphenol Corporation Cl. A | 16,900 | 1,093,430 | |||
Anixter International | 35,900 | 2,296,882 | |||
AVX Corporation | 42,663 | 459,907 | |||
Cognex Corporation | 47,400 | 1,745,268 | |||
Coherent | 58,100 | 2,941,022 | |||
FEI Company | 31,100 | 1,724,806 | |||
FLIR Systems | 110,700 | 2,469,717 | |||
IPG Photonics 1 | 29,914 | 1,993,768 | |||
Molex | 25,000 | 683,250 | |||
National Instruments | 87,050 | 2,246,761 | |||
Rofin-Sinar Technologies 2 | 55,500 | 1,203,240 | |||
† Trimble Navigation 2 | 24,430 | 1,460,425 | |||
Vishay Intertechnology 2 | 14,300 | 152,009 | |||
| 20,470,485 | |||||
| Internet Software & Services - 0.2% | |||||
Stamps.com 2 | 10,500 | 264,600 | |||
ValueClick 2 | 14,885 | 288,918 | |||
| 553,518 | |||||
| IT Services - 2.3% | |||||
CSE Global | 587,100 | 378,135 | |||
Fiserv 2 | 29,840 | 2,358,255 | |||
MAXIMUS | 26,100 | 1,650,042 | |||
Sapient Corporation 2 | 119,800 | 1,265,088 | |||
Total System Services | 18,700 | 400,554 | |||
| 6,052,074 | |||||
| Office Electronics - 0.5% | |||||
Zebra Technologies Cl. A 2 | 32,870 | 1,291,134 | |||
| Semiconductors & Semiconductor Equipment - 3.1% | |||||
Aixtron ADR | 4,500 | 53,775 | |||
Analog Devices | 46,500 | 1,955,790 | |||
Diodes 2 | 98,300 | 1,705,505 | |||
Fairchild Semiconductor International 2 | 6,800 | 97,920 | |||
Integrated Silicon Solution 2 | 22,800 | 205,200 | |||
International Rectifier 2 | 5,000 | 88,650 | |||
Lam Research 2 | 2,000 | 72,260 | |||
MKS Instruments | 7,300 | 188,194 | |||
Photronics 2 | 94,000 | 560,240 | |||
RDA Microelectronics ADR | 36,210 | 389,257 | |||
Teradyne 2 | 175,700 | 2,967,573 | |||
Veeco Instruments 2 | 2,500 | 73,800 | |||
| 8,358,164 | |||||
| Software - 1.3% | |||||
Actuate Corporation 2 | 58,600 | 328,160 | |||
| 66 | The Royce Funds 2012 Annual Report to Shareholders | THE ACCOMPANYING NOTES ARE AN INTEGRAL PART OF THESE FINANCIAL STATEMENTS. |
December 31, 2012 |
| SHARES | VALUE | |||||
| Information Technology (continued) | ||||||
| Software (continued) | ||||||
American Software Cl. A | 37,740 | $ | 292,862 | |||
ANSYS 2 | 43,300 | 2,915,822 | ||||
| 3,536,844 | ||||||
| Total (Cost $34,438,885) | 43,513,574 | |||||
| Materials – 11.6% | ||||||
| Chemicals - 2.2% | ||||||
Airgas | 8,000 | 730,320 | ||||
Albemarle Corporation | 2,800 | 173,936 | ||||
Cabot Corporation | 34,400 | 1,368,776 | ||||
Intrepid Potash | 33,100 | 704,699 | ||||
Minerals Technologies | 7,400 | 295,408 | ||||
OM Group 2 | 2,900 | 64,380 | ||||
Sigma-Aldrich Corporation | 9,040 | 665,163 | ||||
† Tronox Cl. A 1 | 39,800 | 726,350 | ||||
Victrex | 40,000 | 1,079,521 | ||||
Westlake Chemical | 2,000 | 158,600 | ||||
| 5,967,153 | ||||||
| Containers & Packaging - 1.1% | ||||||
Greif Cl. A | 69,800 | 3,106,100 | ||||
| Metals & Mining - 7.5% | ||||||
Allegheny Technologies | 1,600 | 48,576 | ||||
Allied Nevada Gold 2 | 50,000 | 1,506,500 | ||||
Compass Minerals International | 18,500 | 1,382,135 | ||||
Endeavour Mining 2 | 80,400 | 167,315 | ||||
Fresnillo | 48,000 | 1,489,383 | ||||
Globe Specialty Metals | 91,500 | 1,258,125 | ||||
Gold Fields ADR | 136,900 | 1,709,881 | ||||
Haynes International | 6,107 | 316,770 | ||||
Hochschild Mining | 240,900 | 1,871,806 | ||||
Horsehead Holding Corporation 2 | 38,500 | 393,085 | ||||
Major Drilling Group International | 182,000 | 1,793,103 | ||||
Pan American Silver | 85,600 | 1,603,288 | ||||
Randgold Resources ADR | 26,700 | 2,649,975 | ||||
Reliance Steel & Aluminum | 36,080 | 2,240,568 | ||||
Seabridge Gold 2 | 19,400 | 348,618 | ||||
Sims Metal Management ADR | 137,800 | 1,358,708 | ||||
| 20,137,836 | ||||||
| Paper & Forest Products - 0.8% | ||||||
Stella-Jones | 27,560 | 2,123,176 | ||||
| Total (Cost $28,245,606) | 31,334,265 | |||||
| Utilities – 0.1% | ||||||
| Gas Utilities - 0.1% | ||||||
UGI Corporation | 9,300 | 304,203 | ||||
| Total (Cost $279,486) | 304,203 | |||||
| Miscellaneous 5 – 4.6% | ||||||
| Total (Cost $11,106,712) | 12,321,292 | |||||
| TOTAL COMMON STOCKS | ||||||
(Cost $208,031,179) | 260,214,993 | |||||
| REPURCHASE AGREEMENT – 3.5% | ||||||
| Fixed Income Clearing Corporation, | ||||||
0.10% dated 12/31/12, due 1/2/13, | ||||||
maturity value $9,538,053 (collateralized | ||||||
by obligations of various U.S. Government | ||||||
Agencies, 0.30% due 12/4/13, valued at $9,733,171) | ||||||
(Cost $9,538,000) | $ | 9,538,000 | ||||
COLLATERAL RECEIVED FOR SECURITIES | ||||||
| Money Market Funds | ||||||
Federated Government Obligations Fund | ||||||
(7 day yield-0.0107%) | ||||||
(Cost $1,522,584) | 1,522,584 | |||||
| TOTAL INVESTMENTS – 100.7% | ||||||
(Cost $219,091,763) | 271,275,577 | |||||
| LIABILITIES LESS CASH | ||||||
AND OTHER ASSETS – (0.7)% | (1,971,158 | ) | ||||
| NET ASSETS – 100.0% | $ | 269,304,419 | ||||
| THE ACCOMPANYING NOTES ARE AN INTEGRAL PART OF THESE FINANCIAL STATEMENTS. | The Royce Funds 2012 Annual Report to Shareholders | 67 |
Schedules of Investments
| Royce Opportunity Fund |
| SHARES | VALUE | ||||
| COMMON STOCKS – 92.9% | |||||
| Consumer Discretionary – 16.2% | |||||
| Auto Components - 2.0% | |||||
Cooper Tire & Rubber | 298,793 | $ | 7,577,390 | ||
Dana Holding Corporation | 474,436 | 7,405,946 | |||
| 354,900 | 5,217,030 | ||||
Spartan Motors | 298,515 | 1,471,679 | |||
Tower International 2 | 811,979 | 6,536,431 | |||
Visteon Corporation 2 | 170,200 | 9,160,164 | |||
| 37,368,640 | |||||
| Automobiles - 0.3% | |||||
Winnebago Industries 2 | 355,036 | 6,081,767 | |||
| Distributors - 0.3% | |||||
VOXX International Cl. A 2 | 792,694 | 5,334,831 | |||
| Hotels, Restaurants & Leisure - 1.7% | |||||
Carrols Restaurant Group 2 | 657,898 | 3,934,230 | |||
Einstein Noah Restaurant Group | 82,352 | 1,005,518 | |||
Isle of Capri Casinos 2 | 1,108,536 | 6,207,802 | |||
Jamba 2 | 2,051,753 | 4,595,927 | |||
Krispy Kreme Doughnuts 2 | 694,623 | 6,515,564 | |||
Orient-Express Hotels Cl. A 2 | 801,911 | 9,374,339 | |||
| 31,633,380 | |||||
| Household Durables - 2.5% | |||||
| 1,285,590 | 1,491,285 | ||||
| 829,519 | 2,745,708 | ||||
Ethan Allen Interiors | 254,300 | 6,538,053 | |||
| 2,024,873 | 2,146,365 | ||||
Harman International Industries | 118,400 | 5,285,376 | |||
| 953,809 | 1,478,404 | ||||
La-Z-Boy | 740,541 | 10,478,655 | |||
M.D.C. Holdings | 135,150 | 4,968,114 | |||
| 776,000 | 5,703,600 | ||||
Toll Brothers 2 | 159,600 | 5,159,868 | |||
| 45,995,428 | |||||
| Internet & Catalog Retail - 0.8% | |||||
| 1,602,615 | 1,875,059 | ||||
Gaiam Cl. A 2 | 716,304 | 2,263,521 | |||
1-800-FLOWERS.COM Cl. A 2 | 757,127 | 2,778,656 | |||
| 1,096,622 | 7,435,097 | ||||
| 14,352,333 | |||||
| Leisure Equipment & Products - 0.8% | |||||
Callaway Golf | 1,072,126 | 6,968,819 | |||
Steinway Musical Instruments 2 | 366,003 | 7,740,963 | |||
| 14,709,782 | |||||
| Media - 1.6% | |||||
Ballantyne Strong 2 | 387,197 | 1,277,750 | |||
Belo Corporation Ser. A | 453,444 | 3,477,916 | |||
| 2,213,535 | 2,656,242 | ||||
Journal Communications Cl. A 2 | 208,679 | 1,128,953 | |||
Martha Stewart Living Omnimedia Cl. A 2 | 1,380,857 | 3,383,100 | |||
McClatchy Company (The) Cl. A 2 | 1,739,100 | 5,686,857 | |||
| 874,743 | 3,761,395 | ||||
| 938,700 | 8,007,111 | ||||
| 29,379,324 | |||||
| Multiline Retail - 0.2% | |||||
Dillard’s Cl. A | 37,700 | 3,158,129 | |||
| Specialty Retail - 3.4% | |||||
bebe stores | 535,121 | 2,135,133 | |||
Brown Shoe | 353,959 | 6,502,227 | |||
| 479,058 | 2,304,269 | ||||
Haverty Furniture | 382,526 | 6,238,999 | |||
Hot Topic | 384,300 | 3,708,495 | |||
Lithia Motors Cl. A | 264,000 | 9,878,880 | |||
| 1,357,850 | 12,139,179 | ||||
| 635,500 | 1,010,445 | ||||
Penske Automotive Group | 270,500 | 8,139,345 | |||
† Sears Hometown and Outlet Stores 2 | 60,960 | 1,984,857 | |||
West Marine 2 | 844,935 | 9,083,051 | |||
| 63,124,880 | |||||
| Textiles, Apparel & Luxury Goods - 2.6% | |||||
† Delta Apparel 2 | 147,726 | 2,065,210 | |||
Fifth & Pacific 2 | 247,619 | 3,082,857 | |||
Jones Group (The) | 1,145,771 | 12,672,227 | |||
| 1,633,445 | 6,942,141 | ||||
Skechers U.S.A. Cl. A 2 | 507,958 | 9,397,223 | |||
| 980,734 | 12,759,349 | ||||
| 46,919,007 | |||||
| Total (Cost $282,373,360) | 298,057,501 | ||||
| Consumer Staples – 0.7% | |||||
| Food & Staples Retailing - 0.3% | |||||
Pantry (The) 2 | 325,750 | 3,951,347 | |||
SUPERVALU | 938,900 | 2,319,083 | |||
| 6,270,430 | |||||
| Food Products - 0.1% | |||||
Inventure Foods 2 | 244,232 | 1,585,066 | |||
| Household Products - 0.3% | |||||
Central Garden & Pet 2 | 540,400 | 5,414,808 | |||
| Total (Cost $18,200,143) | 13,270,304 | ||||
| Energy – 4.5% | |||||
| Energy Equipment & Services - 2.2% | |||||
| 506,995 | 5,784,813 | ||||
| 1,148,531 | 1,986,959 | ||||
Hercules Offshore 2 | 824,700 | 5,096,646 | |||
Key Energy Services 2 | 761,300 | 5,291,035 | |||
| 731,887 | 8,416,701 | ||||
Newpark Resources 2 | 810,577 | 6,363,029 | |||
Patterson-UTI Energy | 215,100 | 4,007,313 | |||
Willbros Group 2 | 559,200 | 2,997,312 | |||
| 39,943,808 | |||||
| Oil, Gas & Consumable Fuels - 2.3% | |||||
| 605,000 | 5,638,600 | ||||
PDC Energy 2 | 285,400 | 9,478,134 | |||
Penn Virginia | 462,850 | 2,041,168 | |||
REX American Resources 2 | 180,500 | 3,481,845 | |||
Scorpio Tankers 2 | 508,826 | 3,617,753 | |||
StealthGas 2 | 938,245 | 7,440,283 | |||
| 68 | The Royce Funds 2012 Annual Report to Shareholders | THE ACCOMPANYING NOTES ARE AN INTEGRAL PART OF THESE FINANCIAL STATEMENTS. |
December 31, 2012 |
| SHARES | VALUE | ||||
| Energy (continued) | |||||
| Oil, Gas & Consumable Fuels (continued) | |||||
Stone Energy 2 | 311,235 | $ | 6,386,542 | ||
Swift Energy 2 | 354,300 | 5,452,677 | |||
| 43,537,002 | |||||
| Total (Cost $87,402,006) | 83,480,810 | ||||
| Financials – 11.4% | |||||
| Capital Markets - 2.0% | |||||
Evercore Partners Cl. A | 231,100 | 6,976,909 | |||
Harris & Harris Group 2 | 811,702 | 2,678,617 | |||
Janus Capital Group | 441,700 | 3,763,284 | |||
| 419,300 | 13,472,109 | ||||
Stifel Financial 2 | 333,800 | 10,671,586 | |||
| 37,562,505 | |||||
| Commercial Banks - 2.4% | |||||
BancorpSouth | 404,400 | 5,879,976 | |||
Boston Private Financial Holdings | 960,546 | 8,654,519 | |||
Columbia Banking System | 304,500 | 5,462,730 | |||
First Bancorp | 157,908 | 2,024,381 | |||
Guaranty Bancorp 2 | 848,484 | 1,654,544 | |||
Old National Bancorp | 342,700 | 4,067,849 | |||
State Bank Financial | 154,559 | 2,454,397 | |||
SVB Financial Group 2 | 40,300 | 2,255,591 | |||
Umpqua Holdings | 545,800 | 6,434,982 | |||
Valley National Bancorp | 434,468 | 4,040,552 | |||
Virginia Commerce Bancorp 2 | 185,667 | 1,661,720 | |||
| 44,591,241 | |||||
| Insurance - 3.5% | |||||
Argo Group International Holdings | 228,500 | 7,675,315 | |||
† Aspen Insurance Holdings | 285,100 | 9,146,008 | |||
Fidelity National Financial | 342,400 | 8,063,520 | |||
| 460,624 | 6,236,849 | ||||
Kemper Corporation | 318,000 | 9,381,000 | |||
| 189,019 | 9,653,200 | ||||
Old Republic International | 802,100 | 8,542,365 | |||
Tower Group | 350,669 | 6,231,388 | |||
| 64,929,645 | |||||
| Real Estate Investment Trusts (REITs) - 1.9% | |||||
LaSalle Hotel Properties | 470,600 | 11,948,534 | |||
Mack-Cali Realty | 341,750 | 8,923,093 | |||
PennyMac Mortgage Investment Trust | 418,300 | 10,578,807 | |||
RAIT Financial Trust | 451,600 | 2,551,540 | |||
| 34,001,974 | |||||
| Real Estate Management & Development - 0.1% | |||||
Maui Land & Pineapple 2 | 204,161 | 847,268 | |||
| Thrifts & Mortgage Finance - 1.5% | |||||
Berkshire Hills Bancorp | 152,200 | 3,631,492 | |||
Brookline Bancorp | 293,700 | 2,496,450 | |||
First Financial Holdings | 170,300 | 2,227,524 | |||
| 1,207,885 | 3,212,974 | ||||
Radian Group | 1,564,900 | 9,561,539 | |||
Washington Federal | 420,400 | 7,092,148 | |||
| 28,222,127 | |||||
| Total (Cost $204,245,386) | 210,154,760 | ||||
| Health Care – 2.5% | |||||
| Health Care Equipment & Supplies - 0.8% | |||||
AngioDynamics 2 | 540,603 | 5,941,227 | |||
DGT Holdings 2 | 84,741 | 1,108,412 | |||
Exactech 2 | 314,282 | 5,327,080 | |||
Greatbatch 2 | 101,800 | 2,365,832 | |||
| 14,742,551 | |||||
| Health Care Providers & Services - 0.7% | |||||
Kindred Healthcare 2 | 527,400 | 5,706,468 | |||
Select Medical Holdings | 523,400 | 4,935,662 | |||
Skilled Healthcare Group Cl. A 2 | 324,590 | 2,067,638 | |||
| 12,709,768 | |||||
| Life Sciences Tools & Services - 1.0% | |||||
| 1,195,284 | 6,311,099 | ||||
Cambrex Corporation 2 | 1,053,454 | 11,988,307 | |||
| 18,299,406 | |||||
| Total (Cost $40,683,307) | 45,751,725 | ||||
| Industrials – 20.6% | |||||
| Aerospace & Defense - 1.6% | |||||
| 617,761 | 5,652,513 | ||||
Hexcel Corporation 2 | 369,347 | 9,957,595 | |||
| 758,770 | 3,816,613 | ||||
Moog Cl. A 2 | 254,691 | 10,449,972 | |||
| 29,876,693 | |||||
| Air Freight & Logistics - 0.2% | |||||
| 223,400 | 3,882,692 | ||||
| Airlines - 0.2% | |||||
| 668,447 | 3,796,779 | ||||
| Building Products - 4.2% | |||||
Ameresco Cl. A 2 | 379,499 | 3,722,885 | |||
American Woodmark 2 | 297,260 | 8,269,773 | |||
Apogee Enterprises | 604,841 | 14,498,039 | |||
† Builders FirstSource 2 | 1,102,800 | 6,153,624 | |||
Insteel Industries | 385,200 | 4,807,296 | |||
NCI Building Systems 2 | 1,015,269 | 14,112,239 | |||
PGT 2 | 797,808 | 3,590,136 | |||
Quanex Building Products | 626,700 | 12,790,947 | |||
Trex Company 2 | 267,215 | 9,948,415 | |||
| 77,893,354 | |||||
| Commercial Services & Supplies - 1.0% | |||||
Interface | 540,800 | 8,696,064 | |||
| 1,683,765 | 9,799,512 | ||||
| 18,495,576 | |||||
| Construction & Engineering - 3.1% | |||||
Aegion Corporation 2 | 538,053 | 11,939,396 | |||
Furmanite Corporation 2 | 1,088,330 | 5,844,332 | |||
iShares Dow Jones US Home Construction | |||||
Index Fund | 219,600 | 4,646,736 | |||
| THE ACCOMPANYING NOTES ARE AN INTEGRAL PART OF THESE FINANCIAL STATEMENTS. | The Royce Funds 2012 Annual Report to Shareholders | 69 |
Schedules of Investments
| Royce Opportunity Fund (continued) |
| SHARES | VALUE | ||||
| Industrials (continued) | |||||
| Construction & Engineering (continued) | |||||
| 349,520 | $ | 8,482,851 | |||
MasTec 2 | 411,695 | 10,263,556 | |||
Northwest Pipe 2 | 440,235 | 10,504,007 | |||
Pike Electric | 491,721 | 4,695,936 | |||
| 56,376,814 | |||||
| Electrical Equipment - 0.1% | |||||
GrafTech International 2 | 91,509 | 859,270 | |||
Magnetek 2 | 155,445 | 1,601,083 | |||
| 2,460,353 | |||||
| Machinery - 6.8% | |||||
Albany International Cl. A | 352,900 | 8,003,772 | |||
Astec Industries | 283,670 | 9,454,721 | |||
Barnes Group | 402,649 | 9,043,497 | |||
CIRCOR International | 261,080 | 10,336,157 | |||
† Commercial Vehicle Group 2 | 700,451 | 5,750,703 | |||
Dynamic Materials | 269,099 | 3,740,476 | |||
Federal Signal 2 | 1,372,079 | 10,441,521 | |||
Flow International 2 | 1,802,072 | 6,307,252 | |||
Hardinge | 569,291 | 5,658,753 | |||
Hurco Companies 2 | 198,595 | 4,567,685 | |||
Lydall 2 | 532,000 | 7,628,880 | |||
| 1,289,421 | 6,098,961 | ||||
Mueller Industries | 209,700 | 10,491,291 | |||
Mueller Water Products Cl. A | 1,768,575 | 9,921,706 | |||
NN 2 | 410,789 | 3,762,827 | |||
Timken Company (The) | 122,900 | 5,878,307 | |||
Trinity Industries | 234,150 | 8,387,253 | |||
| 125,473,762 | |||||
| Marine - 0.4% | |||||
Diana Containerships | 283,534 | 1,712,545 | |||
Diana Shipping 2 | 684,000 | 4,993,200 | |||
| 6,705,745 | |||||
| Professional Services - 0.3% | |||||
| 338,890 | 1,558,894 | ||||
Hill International 2 | 674,207 | 2,467,598 | |||
Hudson Global 2 | 441,480 | 1,977,830 | |||
| 6,004,322 | |||||
| Road & Rail - 0.7% | |||||
Arkansas Best | 453,539 | 4,331,297 | |||
Swift Transportation 2 | 826,734 | 7,539,814 | |||
| 11,871,111 | |||||
| Trading Companies & Distributors - 1.8% | |||||
Aceto Corporation | 910,460 | 9,141,018 | |||
Beacon Roofing Supply 2 | 105,500 | 3,511,040 | |||
Kaman Corporation | 199,531 | 7,342,741 | |||
SeaCube Container Leasing | 170,450 | 3,212,983 | |||
United Rentals 2 | 202,100 | 9,199,592 | |||
| 32,407,374 | |||||
| Transportation Infrastructure - 0.2% | |||||
Wesco Aircraft Holdings 2 | 276,800 | 3,656,528 | |||
| Total (Cost $289,547,298) | 378,901,103 | ||||
| Information Technology – 23.1% | |||||
| Communications Equipment - 3.0% | |||||
Aviat Networks 2 | 1,838,592 | 6,048,968 | |||
† Ciena Corporation 2 | 611,400 | 9,598,980 | |||
| 556,620 | 2,248,745 | ||||
| 442,100 | 3,227,330 | ||||
| 556,755 | 9,075,106 | ||||
Harmonic 2 | 959,653 | 4,865,441 | |||
| 1,486,326 | 2,333,532 | ||||
Oplink Communications 2 | 424,229 | 6,609,488 | |||
| 1,133,204 | 6,538,587 | ||||
| 2,446,702 | 2,544,570 | ||||
Westell Technologies Cl. A 2 | 970,831 | 1,796,037 | |||
| 54,886,784 | |||||
| Computers & Peripherals - 1.0% | |||||
| 553,933 | 4,198,812 | ||||
Cray 2 | 628,859 | 10,030,301 | |||
| 1,588,871 | 1,489,567 | ||||
| 298,743 | 773,744 | ||||
Intevac 2 | 428,094 | 1,956,390 | |||
| 257,086 | 269,940 | ||||
| 18,718,754 | |||||
| Electronic Equipment, Instruments & Components - 5.9% | |||||
Benchmark Electronics 2 | 640,900 | 10,651,758 | |||
CTS Corporation | 221,303 | 2,352,451 | |||
Echelon Corporation 2 | 583,786 | 1,430,276 | |||
FEI Company | 157,975 | 8,761,293 | |||
Frequency Electronics | 223,565 | 1,835,469 | |||
| 650,675 | 976,012 | ||||
Ingram Micro Cl. A 2 | 540,000 | 9,136,800 | |||
KEMET Corporation 2 | 1,330,154 | 6,690,675 | |||
Maxwell Technologies 2 | 420,561 | 3,486,451 | |||
Mercury Systems 2 | 549,297 | 5,053,532 | |||
Newport Corporation 2 | 701,084 | 9,429,580 | |||
Park Electrochemical | 366,034 | 9,418,055 | |||
| 1,554,792 | 2,223,352 | ||||
| 928,143 | 2,765,866 | ||||
Sanmina Corporation 2 | 1,119,331 | 12,390,994 | |||
| 344,172 | 1,400,780 | ||||
TTM Technologies 2 | 641,800 | 5,904,560 | |||
| 302,008 | 3,684,498 | ||||
Vishay Intertechnology 2 | 744,523 | 7,914,279 | |||
Zygo Corporation 2 | 241,934 | 3,798,364 | |||
| 109,305,045 | |||||
| Internet Software & Services - 2.0% | |||||
| 332,989 | 1,325,296 | ||||
Blucora 2 | 359,530 | 5,648,216 | |||
EarthLink | 1,407,500 | 9,092,450 | |||
| 983,200 | 5,525,584 | ||||
| 530,750 | 3,566,640 | ||||
Support.com 2 | 1,028,985 | 4,301,157 | |||
ValueClick 2 | 363,491 | 7,055,361 | |||
WebMediaBrands 2 | 212,937 | 425,874 | |||
| 36,940,578 | |||||
| IT Services - 1.2% | |||||
| 1,320,373 | 4,410,046 | ||||
| 70 | The Royce Funds 2012 Annual Report to Shareholders | THE ACCOMPANYING NOTES ARE AN INTEGRAL PART OF THESE FINANCIAL STATEMENTS. |
December 31, 2012 |
| SHARES | VALUE | ||||||||
| Information Technology (continued) | |||||||||
| IT Services (continued) | |||||||||
† Lender Processing Services | 373,300 | $ | 9,190,646 | ||||||
| 484,400 | 8,380,120 | ||||||||
| 21,980,812 | |||||||||
| Semiconductors & Semiconductor Equipment - 8.8% | |||||||||
Advanced Energy Industries 2 | 573,288 | 7,917,107 | |||||||
Alpha & Omega Semiconductor 2 | 917,481 | 7,706,840 | |||||||
ANADIGICS 2 | 1,969,614 | 4,963,427 | |||||||
ATMI 2 | 524,107 | 10,943,354 | |||||||
Axcelis Technologies 2 | 992,694 | 1,379,845 | |||||||
AXT 2 | 629,230 | 1,768,136 | |||||||
Brooks Automation | 1,048,200 | 8,438,010 | |||||||
| 686,756 | 1,366,644 | ||||||||
Cohu | 297,509 | 3,224,998 | |||||||
| 216,600 | 7,360,068 | ||||||||
Exar Corporation 2 | 618,683 | 5,506,279 | |||||||
Fairchild Semiconductor International 2 | 807,920 | 11,634,048 | |||||||
FormFactor 2 | 726,761 | 3,314,030 | |||||||
Integrated Silicon Solution 2 | 290,775 | 2,616,975 | |||||||
International Rectifier 2 | 645,802 | 11,450,070 | |||||||
| 707,500 | 8,482,925 | ||||||||
LTX-Credence Corporation 2 | 1,063,906 | 6,979,223 | |||||||
MEMC Electronic Materials 2 | 1,884,734 | 6,049,996 | |||||||
Mindspeed Technologies 2 | 960,600 | 4,495,608 | |||||||
Nanometrics 2 | 704,971 | 10,165,682 | |||||||
| 1,240,848 | 9,964,009 | ||||||||
| 691,280 | 4,223,721 | ||||||||
Rudolph Technologies 2 | 430,111 | 5,784,993 | |||||||
| 622,611 | 510,541 | ||||||||
| 448,074 | 224,485 | ||||||||
| 1,113,453 | 6,257,606 | ||||||||
TriQuint Semiconductor 2 | 1,079,114 | 5,222,912 | |||||||
Ultra Clean Holdings 2 | 281,406 | 1,381,704 | |||||||
| 902,978 | 2,013,641 | ||||||||
| 161,346,877 | |||||||||
| Software - 1.2% | |||||||||
Actuate Corporation 2 | 719,783 | 4,030,785 | |||||||
Aspen Technology 2 | 58,935 | 1,628,964 | |||||||
Bottomline Technologies 2 | 119,300 | 3,148,327 | |||||||
Cinedigm Digital Cinema Cl. A 2 | 1,597,736 | 2,236,830 | |||||||
† Ebix 1 | 141,200 | 2,269,084 | |||||||
Mentor Graphics 2 | 472,900 | 8,048,758 | |||||||
Smith Micro Software 2 | 1,114,892 | 1,683,487 | |||||||
| 23,046,235 | |||||||||
| Total (Cost $461,161,677) | 426,225,085 | ||||||||
| Materials – 9.5% | |||||||||
| Chemicals - 4.1% | |||||||||
Chemtura Corporation 2 | 314,850 | 6,693,711 | |||||||
Cytec Industries | 125,500 | 8,638,165 | |||||||
Ferro Corporation 2 | 1,783,211 | 7,453,822 | |||||||
H.B. Fuller Company | 184,000 | 6,406,880 | |||||||
Material Sciences 2 | 488,727 | 4,413,205 | |||||||
| 564,200 | 12,525,240 | ||||||||
PolyOne Corporation | 538,300 | 10,992,086 | |||||||
Quaker Chemical | 144,100 | 7,761,226 | |||||||
Spartech Corporation 2 | 279,369 | 2,533,877 | |||||||
Zoltek Companies 2 | 998,550 | 7,738,762 | |||||||
| 75,156,974 | |||||||||
| Construction Materials - 0.7% | |||||||||
| 263,177 | 13,424,659 | ||||||||
| Containers & Packaging - 0.3% | |||||||||
Boise | 638,300 | 5,074,485 | |||||||
| Metals & Mining - 3.9% | |||||||||
Carpenter Technology | 85,636 | 4,421,387 | |||||||
| 1,080,500 | 9,465,180 | ||||||||
Commercial Metals | 803,661 | 11,942,402 | |||||||
Haynes International | 172,644 | 8,955,044 | |||||||
Kaiser Aluminum | 229,900 | 14,182,531 | |||||||
RTI International Metals 2 | 456,400 | 12,578,384 | |||||||
† US Silica Holdings 1 | 248,400 | 4,155,732 | |||||||
Walter Energy | 176,300 | 6,325,644 | |||||||
| 72,026,304 | |||||||||
| Paper & Forest Products - 0.5% | |||||||||
Louisiana-Pacific Corporation 2 | 496,200 | 9,586,584 | |||||||
| Total (Cost $120,560,960) | 175,269,006 | ||||||||
| Telecommunication Services – 0.4% | |||||||||
| Diversified Telecommunication Services - 0.4% | |||||||||
General Communication Cl. A 2 | 182,206 | 1,747,356 | |||||||
| 922,546 | 6,217,960 | ||||||||
| Total (Cost $8,154,083) | 7,965,316 | ||||||||
| Miscellaneous 5 – 4.0% | |||||||||
| Total (Cost $65,299,417) | 74,153,103 | ||||||||
| TOTAL COMMON STOCKS | |||||||||
(Cost $1,577,627,637) | 1,713,228,713 | ||||||||
| PREFERRED STOCK – 0.4% | |||||||||
Hovnanian Enterprises 7.25% Conv. | |||||||||
(Cost $4,500,639) | 223,600 | 7,696,312 | |||||||
| REPURCHASE AGREEMENT – 6.8% | |||||||||
| Fixed Income Clearing Corporation, | |||||||||
0.10% dated 12/31/12, due 1/2/13, | |||||||||
maturity value $124,329,691 (collateralized | |||||||||
by obligations of various U.S. Government | |||||||||
Agencies, 0.875%-1.00% due 12/27/13-1/15/14, | |||||||||
valued at $126,817,910) | |||||||||
(Cost $124,329,000) | 124,329,000 | ||||||||
| THE ACCOMPANYING NOTES ARE AN INTEGRAL PART OF THESE FINANCIAL STATEMENTS. | The Royce Funds 2012 Annual Report to Shareholders | 71 |
Schedules of Investments
| Royce Opportunity Fund (continued) |
| VALUE | ||||||
COLLATERAL RECEIVED FOR SECURITIES | ||||||
| Money Market Funds | ||||||
Federated Government Obligations Fund | ||||||
(7 day yield-0.0107%) | ||||||
(Cost $77,870,030) | $ | 77,870,030 | ||||
| TOTAL INVESTMENTS – 104.3% | ||||||
(Cost $1,784,327,306) | 1,923,124,055 | |||||
| LIABILITIES LESS CASH | ||||||
AND OTHER ASSETS – (4.3)% | (79,257,861 | ) | ||||
| NET ASSETS – 100.0% | $ | 1,843,866,194 | ||||
| Royce Special Equity Fund |
| SHARES | VALUE | ||||
| COMMON STOCKS – 89.4% | |||||
| Consumer Discretionary – 22.9% | |||||
| Auto Components - 2.8% | |||||
Dorman Products 3 | 2,306,679 | $ | 81,518,036 | ||
| Hotels, Restaurants & Leisure - 0.5% | |||||
Bowl America Cl. A 3 | 342,575 | 4,282,187 | |||
Frisch’s Restaurants 3 | 505,100 | 9,344,350 | |||
| 13,626,537 | |||||
| Household Durables - 0.7% | |||||
CSS Industries 3 | 974,100 | 21,323,049 | |||
| Media - 5.6% | |||||
† Belo Corporation Ser. A | 2,451,470 | 18,802,775 | |||
Meredith Corporation | 2,194,450 | 75,598,802 | |||
† Scholastic Corporation 3 | 2,400,207 | 70,950,119 | |||
| 165,351,696 | |||||
| Specialty Retail - 13.3% | |||||
American Eagle Outfitters | 4,944,200 | 101,405,542 | |||
Bed Bath & Beyond 2 | 1,589,900 | 88,891,309 | |||
Buckle (The) | 1,258,174 | 56,164,888 | |||
| 1,318,056 | 58,376,700 | ||||
Finish Line (The) Cl. A 3 | 4,462,000 | 84,465,660 | |||
| 389,304,099 | |||||
| Total (Cost $548,160,635) | 671,123,417 | ||||
| Consumer Staples – 6.1% | |||||
| Beverages - 0.1% | |||||
National Beverage | 274,600 | 4,006,414 | |||
| Food & Staples Retailing - 2.0% | |||||
Arden Group Cl. A 3 | 232,001 | 20,873,130 | |||
Weis Markets | 994,008 | 38,935,293 | |||
| 59,808,423 | |||||
| Food Products - 4.0% | |||||
J&J Snack Foods | 669,021 | 42,777,203 | |||
Lancaster Colony | 1,054,919 | 72,989,846 | |||
| 115,767,049 | |||||
| Total (Cost $134,664,796) | 179,581,886 | ||||
| Health Care – 6.3% | |||||
| Health Care Equipment & Supplies - 2.5% | �� | ||||
Atrion Corporation 3 | 165,000 | 32,340,000 | |||
† Hill-Rom Holdings | 1,448,400 | 41,279,400 | |||
| 73,619,400 | |||||
| Life Sciences Tools & Services - 3.8% | |||||
| 1,062,000 | 111,563,100 | ||||
| Total (Cost $154,592,171) | 185,182,500 | ||||
| Industrials – 23.1% | |||||
| Aerospace & Defense - 1.6% | |||||
National Presto Industries 3 | 656,500 | 45,364,150 | |||
| Commercial Services & Supplies - 3.7% | |||||
UniFirst Corporation 3 | 1,469,012 | 107,707,960 | |||
| Electrical Equipment - 9.2% | |||||
† Brady Corporation Cl. A | 1,158,339 | 38,688,523 | |||
| 72 | The Royce Funds 2012 Annual Report to Shareholders | THE ACCOMPANYING NOTES ARE AN INTEGRAL PART OF THESE FINANCIAL STATEMENTS. |
December 31, 2012 |
| SHARES | VALUE | ||||
| Industrials (continued) | |||||
| Electrical Equipment (continued) | |||||
† EnerSys 2 | 2,284,700 | $ | 85,973,261 | ||
Hubbell Cl. B | 1,090,781 | 92,312,796 | |||
Regal-Beloit | 763,203 | 53,782,915 | |||
| 270,757,495 | |||||
| Industrial Conglomerates - 1.5% | |||||
Standex International 3 | 831,990 | 42,672,767 | |||
| Machinery - 3.6% | |||||
Ampco-Pittsburgh 3 | 987,000 | 19,720,260 | |||
Foster (L.B.) Company 3 | 928,875 | 40,350,330 | |||
| 435,179 | 10,009,117 | ||||
Kaydon Corporation | 1,190,000 | 28,476,700 | |||
† Sauer-Danfoss | 154,100 | 8,224,317 | |||
| 106,780,724 | |||||
| Trading Companies & Distributors - 3.5% | |||||
Applied Industrial Technologies 3 | 2,430,400 | 102,101,104 | |||
| Total (Cost $511,917,786) | 675,384,200 | ||||
| Information Technology – 18.4% | |||||
| Communications Equipment - 2.6% | |||||
Plantronics | 2,077,278 | 76,589,240 | |||
| Electronic Equipment, Instruments & Components - 10.5% | |||||
AVX Corporation | 5,931,800 | 63,944,804 | |||
Littelfuse 3 | 1,375,583 | 84,887,227 | |||
Molex Cl. A | 4,695,015 | 104,792,735 | |||
Park Electrochemical 3 | 2,011,012 | 51,743,338 | |||
| 305,368,104 | |||||
| IT Services - 0.6% | |||||
Computer Services 4 | 640,842 | 18,199,913 | |||
| Semiconductors & Semiconductor Equipment - 4.7% | |||||
† Entegris 2 | 3,448,997 | 31,661,792 | |||
Teradyne 2 | 6,281,800 | 106,099,602 | |||
| 137,761,394 | |||||
| Total (Cost $484,007,661) | 537,918,651 | ||||
| Materials – 12.6% | |||||
| Chemicals - 8.9% | |||||
Hawkins 3 | 911,020 | 35,201,813 | |||
Minerals Technologies 3 | 2,851,200 | 113,819,904 | |||
Schulman (A.) 3 | 1,472,577 | 42,601,652 | |||
Stepan Company 3 | 1,252,900 | 69,586,066 | |||
| 261,209,435 | |||||
| Containers & Packaging - 1.0% | |||||
Sonoco Products | 924,500 | 27,485,385 | |||
| Metals & Mining - 0.1% | |||||
Central Steel & Wire 4 | 4,246 | 2,824,652 | |||
| Paper & Forest Products - 2.6% | |||||
| 1,956,000 | 76,596,960 | ||||
| Total (Cost $277,905,026) | 368,116,432 | ||||
| TOTAL COMMON STOCKS | |||||
(Cost $2,111,248,075) | 2,617,307,086 | ||||
| REPURCHASE AGREEMENT – 10.6% | ||||||
Fixed Income Clearing Corporation, | $ | 310,976,000 | ||||
| COLLATERAL RECEIVED FOR SECURITIES | ||||||
LOANED – 0.0% | ||||||
Money Market Funds | 18,600 | |||||
| TOTAL INVESTMENTS – 100.0% | ||||||
(Cost $2,422,242,675) | 2,928,301,686 | |||||
| LIABILITIES LESS CASH | ||||||
AND OTHER ASSETS – (0.0)% | (153,040 | ) | ||||
| NET ASSETS – 100.0% | $ | 2,928,148,646 | ||||
| THE ACCOMPANYING NOTES ARE AN INTEGRAL PART OF THESE FINANCIAL STATEMENTS. | The Royce Funds 2012 Annual Report to Shareholders | 73 |
Schedules of Investments
| Royce Value Fund |
| SHARES | VALUE | ||||
| COMMON STOCKS – 98.8% | |||||
| Consumer Discretionary – 19.8% | |||||
| Automobiles - 1.7% | |||||
Thor Industries | 606,540 | $ | 22,702,792 | ||
| Specialty Retail - 15.7% | |||||
American Eagle Outfitters | 873,765 | 17,920,920 | |||
Ascena Retail Group 2 | 1,984,734 | 36,697,732 | |||
Buckle (The) | 784,620 | 35,025,437 | |||
GameStop Corporation Cl. A | 2,338,026 | 58,661,072 | |||
Guess? | 1,064,932 | 26,133,431 | |||
Jos. A. Bank Clothiers 2 | 803,861 | 34,228,402 | |||
| 208,666,994 | |||||
| Textiles, Apparel & Luxury Goods - 2.4% | |||||
| 314,857 | 12,679,291 | ||||
Steven Madden 2 | 399,199 | 16,874,142 | |||
| 105,200 | 2,640,520 | ||||
| 32,193,953 | |||||
| Total (Cost $220,990,909) | 263,563,739 | ||||
| Consumer Staples – 1.4% | |||||
| Food Products - 0.4% | |||||
Hormel Foods | 152,088 | 4,746,666 | |||
| Personal Products - 1.0% | |||||
Nu Skin Enterprises Cl. A | 379,300 | 14,053,065 | |||
| Total (Cost $18,789,162) | 18,799,731 | ||||
| Energy – 12.2% | |||||
| Energy Equipment & Services - 11.9% | |||||
Helmerich & Payne | 672,956 | 37,692,266 | |||
Oil States International 2 | 538,623 | 38,533,089 | |||
Trican Well Service | 1,925,500 | 25,397,166 | |||
Unit Corporation 2 | 1,273,859 | 57,387,348 | |||
| 159,009,869 | |||||
| Oil, Gas & Consumable Fuels - 0.3% | |||||
Cimarex Energy | 59,392 | 3,428,700 | |||
| Total (Cost $160,158,040) | 162,438,569 | ||||
| Financials – 14.0% | |||||
| Capital Markets - 7.5% | |||||
Affiliated Managers Group 2 | 79,418 | 10,336,253 | |||
Ashmore Group | 5,411,900 | 31,293,331 | |||
Federated Investors Cl. B | 1,596,826 | 32,303,790 | |||
Partners Group Holding | 55,000 | 12,703,432 | |||
Value Partners Group | 20,000,000 | 13,425,810 | |||
| 100,062,616 | |||||
| Insurance - 5.5% | |||||
Allied World Assurance Company | |||||
Holdings | 188,671 | 14,867,275 | |||
Aspen Insurance Holdings | 325,597 | 10,445,152 | |||
PartnerRe | 86,989 | 7,001,745 | |||
Reinsurance Group of America | 762,145 | 40,790,000 | |||
| 73,104,172 | |||||
| Thrifts & Mortgage Finance - 1.0% | |||||
† Genworth MI Canada | 544,600 | 12,368,065 | |||
| Total (Cost $163,603,268) | 185,534,853 | ||||
| Health Care – 5.0% | |||||
| Health Care Providers & Services - 5.0% | |||||
Chemed Corporation | 519,683 | 35,645,057 | |||
Magellan Health Services 2 | 222,435 | 10,899,315 | |||
MEDNAX 2 | 245,464 | 19,519,297 | |||
| Total (Cost $50,700,558) | 66,063,669 | ||||
| Industrials – 10.1% | |||||
| Aerospace & Defense - 0.6% | |||||
† Cubic Corporation | 160,474 | 7,697,938 | |||
| Building Products - 0.8% | |||||
Simpson Manufacturing | 327,200 | 10,728,888 | |||
| Construction & Engineering - 1.3% | |||||
Jacobs Engineering Group 2 | 407,500 | 17,347,275 | |||
| Electrical Equipment - 1.0% | |||||
GrafTech International 2 | 1,420,125 | 13,334,974 | |||
| Machinery - 4.9% | |||||
Gardner Denver | 146,375 | 10,026,687 | |||
Kennametal | 796,714 | 31,868,560 | |||
Lincoln Electric Holdings | 491,066 | 23,905,093 | |||
| 65,800,340 | |||||
| Trading Companies & Distributors - 1.5% | |||||
Applied Industrial Technologies | 475,990 | 19,996,340 | |||
| Total (Cost $113,356,032) | 134,905,755 | ||||
| Information Technology – 16.6% | |||||
| Communications Equipment - 3.4% | |||||
NETGEAR 2 | 631,438 | 24,891,286 | |||
Plantronics | 561,733 | 20,711,096 | |||
| 45,602,382 | |||||
| Electronic Equipment, Instruments & Components - 3.2% | |||||
Littelfuse | 195,158 | 12,043,200 | |||
Molex Cl. A | 703,568 | 15,703,638 | |||
† Vishay Intertechnology 2 | 1,385,960 | 14,732,755 | |||
| 42,479,593 | |||||
| IT Services - 2.1% | |||||
ManTech International Cl. A | 1,078,224 | 27,969,130 | |||
| Office Electronics - 0.3% | |||||
Zebra Technologies Cl. A 2 | 94,560 | 3,714,317 | |||
| Semiconductors & Semiconductor Equipment - 6.6% | |||||
Cabot Microelectronics | 138,550 | 4,919,911 | |||
Lam Research 2 | 153,200 | 5,535,116 | |||
MKS Instruments | 894,404 | 23,057,735 | |||
Teradyne 2 | 2,776,227 | 46,890,474 | |||
| 266,500 | 7,867,080 | ||||
| 88,270,316 | |||||
| 74 | The Royce Funds 2012 Annual Report to Shareholders | THE ACCOMPANYING NOTES ARE AN INTEGRAL PART OF THESE FINANCIAL STATEMENTS. |
December 31, 2012 |
| SHARES | VALUE | |||||
| Information Technology (continued) | ||||||
| Software - 1.0% | ||||||
† SimCorp | 56,500 | $ | 12,647,643 | |||
| Total (Cost $224,041,246) | 220,683,381 | |||||
| Materials – 17.9% | ||||||
| Chemicals - 4.1% | ||||||
LSB Industries 2 | 558,713 | 19,789,614 | ||||
Westlake Chemical | 430,370 | 34,128,341 | ||||
| 53,917,955 | ||||||
| Metals & Mining - 13.8% | ||||||
Allied Nevada Gold 2 | 863,000 | 26,002,190 | ||||
Hochschild Mining | 1,680,000 | 13,053,688 | ||||
Major Drilling Group International | 2,420,300 | 23,845,321 | ||||
Pan American Silver | 1,275,430 | 23,888,804 | ||||
Reliance Steel & Aluminum | 713,600 | 44,314,560 | ||||
Schnitzer Steel Industries Cl. A | 676,100 | 20,506,113 | ||||
Seabridge Gold 2 | 956,000 | 17,179,320 | ||||
Silver Standard Resources 2 | 1,031,101 | 15,353,094 | ||||
| 184,143,090 | ||||||
| Total (Cost $234,010,078) | 238,061,045 | |||||
| Miscellaneous 5 – 1.8% | ||||||
| Total (Cost $24,389,726) | 24,569,095 | |||||
| TOTAL COMMON STOCKS | ||||||
(Cost $1,210,039,019) | 1,314,619,837 | |||||
| REPURCHASE AGREEMENT – 1.4% | ||||||
Fixed Income Clearing Corporation, | 18,001,000 | |||||
| COLLATERAL RECEIVED FOR SECURITIES | ||||||
LOANED – 1.6% | ||||||
Money Market Funds | 21,218,911 | |||||
| TOTAL INVESTMENTS – 101.8% | ||||||
(Cost $1,249,258,930) | 1,353,839,748 | |||||
| LIABILITIES LESS CASH | ||||||
AND OTHER ASSETS – (1.8)% | (23,839,827 | ) | ||||
| NET ASSETS – 100.0% | $ | 1,329,999,921 | ||||
| Royce Value Plus Fund |
| SHARES | VALUE | ||||
| COMMON STOCKS – 99.2% | |||||
| Consumer Discretionary – 8.5% | |||||
| Hotels, Restaurants & Leisure - 1.2% | |||||
Buffalo Wild Wings 2 | 162,900 | $ | 11,862,378 | ||
| 6,833,770 | 5,316,673 | ||||
| 17,179,051 | |||||
| Household Durables - 0.4% | |||||
† iRobot Corporation 2 | 324,000 | 6,071,760 | |||
| Internet & Catalog Retail - 0.7% | |||||
| 440,500 | 9,691,000 | ||||
| Multiline Retail - 0.8% | |||||
Dollar Tree 2 | 297,000 | 12,046,320 | |||
| Specialty Retail - 2.7% | |||||
| 177,000 | 9,350,910 | ||||
Monro Muffler Brake | 200,000 | 6,994,000 | |||
Tractor Supply | 160,000 | 14,137,600 | |||
| 442,000 | 8,579,220 | ||||
| 39,061,730 | |||||
| Textiles, Apparel & Luxury Goods - 2.7% | |||||
Carter’s 2 | 370,200 | 20,601,630 | |||
Gildan Activewear | 489,342 | 17,900,130 | |||
| 38,501,760 | |||||
| Total (Cost $107,687,636) | 122,551,621 | ||||
| Consumer Staples – 1.1% | |||||
| Food & Staples Retailing - 0.5% | |||||
United Natural Foods 2 | 140,517 | 7,530,306 | |||
| Food Products - 0.6% | |||||
Snyder’s-Lance | 330,000 | 7,956,300 | |||
| Total (Cost $13,603,557) | 15,486,606 | ||||
| Energy – 3.5% | |||||
| Energy Equipment & Services - 2.0% | |||||
Helmerich & Payne | 88,000 | 4,928,880 | |||
Pason Systems | 668,000 | 11,517,241 | |||
Trican Well Service | 476,800 | 6,288,948 | |||
Unit Corporation 2 | 127,400 | 5,739,370 | |||
| 28,474,439 | |||||
| Oil, Gas & Consumable Fuels - 1.5% | |||||
EPL Oil & Gas 2 | 695,160 | 15,675,858 | |||
Sprott Resource | 1,515,000 | 6,625,364 | |||
| 22,301,222 | |||||
| Total (Cost $39,333,369) | 50,775,661 | ||||
| Financials – 16.4% | |||||
| Capital Markets - 8.3% | |||||
Affiliated Managers Group 2 | 168,000 | 21,865,200 | |||
Ashmore Group | 2,180,000 | 12,605,455 | |||
Northern Trust | 383,000 | 19,211,280 | |||
Partners Group Holding | 65,000 | 15,013,147 | |||
Raymond James Financial | 553,000 | 21,307,090 | |||
Sprott | 1,851,000 | 7,369,016 | |||
Value Partners Group | 18,128,500 | 12,169,490 | |||
| THE ACCOMPANYING NOTES ARE AN INTEGRAL PART OF THESE FINANCIAL STATEMENTS. | The Royce Funds 2012 Annual Report to Shareholders | 75 |
Schedules of Investments
| Royce Value Plus Fund (continued) |
| SHARES | VALUE | ||||
| Financials (continued) | |||||
| Capital Markets (continued) | |||||
Waddell & Reed Financial Cl. A | 272,000 | $ | 9,471,040 | ||
| 119,011,718 | |||||
| Commercial Banks - 4.3% | |||||
Associated Banc-Corp | 1,045,000 | 13,710,400 | |||
Columbia Banking System | 354,500 | 6,359,730 | |||
Enterprise Financial Services | 765,800 | 10,009,006 | |||
Fifth Third Bancorp | 1,176,800 | 17,875,592 | |||
Umpqua Holdings | 1,162,300 | 13,703,517 | |||
| 61,658,245 | |||||
| Consumer Finance - 1.3% | |||||
| 1,603,600 | 18,954,552 | ||||
| Diversified Financial Services - 1.1% | |||||
PICO Holdings 2 | 737,222 | 14,943,490 | |||
| Thrifts & Mortgage Finance - 1.4% | |||||
Berkshire Hills Bancorp | 856,700 | 20,440,862 | |||
| Total (Cost $215,463,362) | 235,008,867 | ||||
| Health Care – 9.8% | |||||
| Biotechnology - 2.9% | |||||
| 300,000 | 2,013,000 | ||||
Cubist Pharmaceuticals 2 | 186,000 | 7,823,160 | |||
Myriad Genetics 2 | 970,000 | 26,432,500 | |||
Rigel Pharmaceuticals 2 | 795,900 | 5,173,350 | |||
| 41,442,010 | |||||
| Health Care Equipment & Supplies - 2.3% | |||||
| 2,884,500 | 9,115,020 | ||||
| 756,677 | 7,937,541 | ||||
Thoratec Corporation 2 | 421,600 | 15,818,432 | |||
| 32,870,993 | |||||
| Health Care Providers & Services - 0.8% | |||||
Healthways 2 | 1,079,000 | 11,545,300 | |||
| Life Sciences Tools & Services - 1.5% | |||||
PerkinElmer | 573,000 | 18,187,020 | |||
| 831,000 | 3,922,320 | ||||
| 22,109,340 | |||||
| Pharmaceuticals - 2.3% | |||||
† Medicines Company (The) 2 | 598,000 | 14,334,060 | |||
UCB | 313,000 | 18,006,601 | |||
| 32,340,661 | |||||
| Total (Cost $126,832,966) | 140,308,304 | ||||
| Industrials – 20.2% | |||||
| Aerospace & Defense - 0.1% | |||||
AeroVironment 2 | 72,000 | 1,565,280 | |||
| Building Products - 2.9% | |||||
† Apogee Enterprises | 764,766 | 18,331,441 | |||
Quanex Building Products | 1,134,533 | 23,155,819 | |||
| 41,487,260 | |||||
| Commercial Services & Supplies - 2.6% | |||||
| 749,528 | 11,250,415 | ||||
Ritchie Bros. Auctioneers | 377,600 | 7,888,064 | |||
| Commercial Services & Supplies (continued) | |||||
UniFirst Corporation | 249,400 | 18,286,008 | |||
| 37,424,487 | |||||
| Construction & Engineering - 2.1% | |||||
MYR Group 2 | 501,608 | 11,160,778 | |||
Quanta Services 2 | 693,000 | 18,911,970 | |||
| 30,072,748 | |||||
| Electrical Equipment - 1.2% | |||||
Acuity Brands | 258,095 | 17,480,774 | |||
| Industrial Conglomerates - 1.4% | |||||
Carlisle Companies | 336,900 | 19,796,244 | |||
| Machinery - 3.6% | |||||
Chart Industries 2 | 112,000 | 7,467,040 | |||
Tennant Company | 179,437 | 7,886,256 | |||
Valmont Industries | 141,400 | 19,308,170 | |||
† Wabtec Corporation | 194,232 | 17,003,070 | |||
| 51,664,536 | |||||
| Professional Services - 1.9% | |||||
Robert Half International | 559,800 | 17,812,836 | |||
† WageWorks 2 | 488,665 | 8,698,237 | |||
| 26,511,073 | |||||
| Road & Rail - 2.1% | |||||
Celadon Group | 989,800 | 17,885,686 | |||
Knight Transportation | 461,100 | 6,745,893 | |||
Werner Enterprises | 264,000 | 5,720,880 | |||
| 30,352,459 | |||||
| Trading Companies & Distributors - 2.3% | |||||
Grainger (W.W.) | 74,600 | 15,096,802 | |||
Watsco | 235,100 | 17,608,990 | |||
| 32,705,792 | |||||
| Total (Cost $216,627,439) | 289,060,653 | ||||
| Information Technology – 21.9% | |||||
| Communications Equipment - 2.3% | |||||
EXFO 2 | 1,967,500 | 10,329,375 | |||
| 1,568,833 | 9,114,920 | ||||
NETGEAR 2 | 360,820 | 14,223,524 | |||
| 33,667,819 | |||||
| Computers & Peripherals - 0.8% | |||||
| 1,578,109 | 10,841,609 | ||||
| Electronic Equipment, Instruments & Components - 6.2% | |||||
FARO Technologies 2 | 509,323 | 18,172,645 | |||
FLIR Systems | 276,000 | 6,157,560 | |||
IPG Photonics 1 | 433,732 | 28,908,238 | |||
Littelfuse | 172,744 | 10,660,032 | |||
Mercury Systems 2 | 1,033,749 | 9,510,491 | |||
Rogers Corporation 2 | 304,543 | 15,123,605 | |||
| 88,532,571 | |||||
| Internet Software & Services - 1.4% | |||||
| 1,668,727 | 20,775,651 | ||||
| IT Services - 2.2% | |||||
† CoreLogic 2 | 395,929 | 10,658,409 | |||
| 76 | The Royce Funds 2012 Annual Report to Shareholders | THE ACCOMPANYING NOTES ARE AN INTEGRAL PART OF THESE FINANCIAL STATEMENTS. |
December 31, 2012 |
| SHARES | VALUE | |||||
| Information Technology (continued) | ||||||
| IT Services (continued) | ||||||
† Genpact | 1,302,000 | $ | 20,181,000 | |||
| 30,839,409 | ||||||
| Semiconductors & Semiconductor Equipment - 7.5% | ||||||
Analog Devices | 307,000 | 12,912,420 | ||||
| 312,000 | 10,601,760 | |||||
International Rectifier 2 | 750,048 | 13,298,351 | ||||
Lattice Semiconductor 2 | 2,430,700 | 9,698,493 | ||||
| 2,742,000 | 19,413,360 | |||||
Micrel | 1,265,901 | 12,026,060 | ||||
Teradyne 2 | 982,000 | 16,585,980 | ||||
Ultratech 2 | 357,041 | 13,317,629 | ||||
| 107,854,053 | ||||||
| Software - 1.5% | ||||||
† Parametric Technology 2 | 595,000 | 13,393,450 | ||||
| 277,304 | 8,047,362 | |||||
| 21,440,812 | ||||||
| Total (Cost $269,362,947) | 313,951,924 | |||||
| Materials – 13.0% | ||||||
| Chemicals - 1.2% | ||||||
Westlake Chemical | 223,091 | 17,691,116 | ||||
| Construction Materials - 1.6% | ||||||
† Eagle Materials | 385,000 | 22,522,500 | ||||
| Metals & Mining - 10.2% | ||||||
Alamos Gold | 880,600 | 15,448,347 | ||||
Allied Nevada Gold 2 | 220,400 | 6,640,652 | ||||
Detour Gold 2 | 418,000 | 10,459,455 | ||||
Globe Specialty Metals | 554,300 | 7,621,625 | ||||
Hochschild Mining | 1,213,000 | 9,425,074 | ||||
Horsehead Holding Corporation 2 | 1,441,353 | 14,716,214 | ||||
Major Drilling Group International | 888,000 | 8,748,769 | ||||
| 1,875,000 | 7,181,250 | |||||
Pretium Resources 2 | 675,600 | 8,922,415 | ||||
Reliance Steel & Aluminum | 311,100 | 19,319,310 | ||||
Tahoe Resources 2 | 459,000 | 8,398,311 | ||||
Worthington Industries | 1,108,966 | 28,822,026 | ||||
| 145,703,448 | ||||||
| Total (Cost $154,569,440) | 185,917,064 | |||||
| Miscellaneous 5 – 4.8% | ||||||
| Total (Cost $69,326,364) | 68,272,577 | |||||
| TOTAL COMMON STOCKS | ||||||
(Cost $1,212,807,080) | 1,421,333,277 | |||||
| REPURCHASE AGREEMENT – 0.5% | ||||||
Fixed Income Clearing Corporation, | 6,710,000 | |||||
| COLLATERAL RECEIVED FOR SECURITIES | ||||||
LOANED – 7.9% | ||||||
Money Market Funds | $ | 113,429,210 | ||||
| TOTAL INVESTMENTS – 107.6% | ||||||
(Cost $1,332,946,290) | 1,541,472,487 | |||||
| LIABILITIES LESS CASH | ||||||
AND OTHER ASSETS – (7.6)% | (108,824,776 | ) | ||||
| NET ASSETS – 100.0% | $ | 1,432,647,711 | ||||
| THE ACCOMPANYING NOTES ARE AN INTEGRAL PART OF THESE FINANCIAL STATEMENTS. | The Royce Funds 2012 Annual Report to Shareholders | 77 |
| Schedules of Investments |
| Royce 100 Fund |
| SHARES | VALUE | |||||
| COMMON STOCKS – 97.8% | ||||||
| Consumer Discretionary – 11.2% | ||||||
| Auto Components - 1.6% | ||||||
Drew Industries | 96,956 | $ | 3,126,831 | |||
Gentex Corporation | 80,200 | 1,509,364 | ||||
| 4,636,195 | ||||||
| Distributors - 1.0% | ||||||
LKQ Corporation 2 | 136,000 | 2,869,600 | ||||
| Diversified Consumer Services - 0.8% | ||||||
Sotheby’s | 70,800 | 2,380,296 | ||||
| Household Durables - 5.3% | ||||||
Ethan Allen Interiors | 108,100 | 2,779,251 | ||||
Harman International Industries | 99,600 | 4,446,144 | ||||
Mohawk Industries 2 | 53,215 | 4,814,361 | ||||
NVR 2 | 3,800 | 3,496,000 | ||||
| 15,535,756 | ||||||
| Media - 0.6% | ||||||
Morningstar | 30,772 | 1,933,405 | ||||
| Specialty Retail - 1.3% | ||||||
Ascena Retail Group 2 | 202,000 | 3,734,980 | ||||
| Textiles, Apparel & Luxury Goods - 0.6% | ||||||
Columbia Sportswear | 34,100 | 1,819,576 | ||||
| Total (Cost $21,226,974) | 32,909,808 | |||||
| Consumer Staples – 2.2% | ||||||
Food Products - 2.2% | ||||||
Darling International 2 | 212,800 | 3,413,312 | ||||
Sanderson Farms | 62,700 | 2,981,385 | ||||
| Total (Cost $4,973,309) | 6,394,697 | |||||
| Energy – 10.9% | ||||||
| Energy Equipment & Services - 10.9% | ||||||
Ensign Energy Services | 201,500 | 3,113,557 | ||||
Helmerich & Payne | 103,125 | 5,776,031 | ||||
Oil States International 2 | 57,500 | 4,113,550 | ||||
Pason Systems | 270,300 | 4,660,345 | ||||
SEACOR Holdings | 41,500 | 3,477,700 | ||||
ShawCor Cl. A | 109,900 | 4,307,833 | ||||
Trican Well Service | 265,200 | 3,497,963 | ||||
Unit Corporation 2 | 73,200 | 3,297,660 | ||||
| Total (Cost $21,302,062) | 32,244,639 | |||||
| Financials – 10.0% | ||||||
| Capital Markets - 10.0% | ||||||
Affiliated Managers Group 2 | 43,497 | 5,661,134 | ||||
AllianceBernstein Holding L.P. | 235,569 | 4,105,968 | ||||
Federated Investors Cl. B | 231,700 | 4,687,291 | ||||
KKR & Co. L.P. | 145,000 | 2,208,350 | ||||
Lazard Cl. A | 162,300 | 4,843,032 | ||||
SEI Investments | 193,700 | 4,520,958 | ||||
Waddell & Reed Financial Cl. A | 102,400 | 3,565,568 | ||||
| Total (Cost $27,167,108) | 29,592,301 | |||||
| Health Care – 3.6% | ||||||
| Biotechnology - 0.6% | ||||||
Myriad Genetics 2 | 62,500 | 1,703,125 | ||||
| Life Sciences Tools & Services - 3.0% | ||||||
Bio-Rad Laboratories Cl. A 2 | 29,500 | 3,098,975 | ||||
PerkinElmer | 187,900 | 5,963,946 | ||||
| 9,062,921 | ||||||
| Total (Cost $8,289,155) | 10,766,046 | |||||
| Industrials – 26.8% | ||||||
Aerospace & Defense - 1.0% | ||||||
HEICO Corporation Cl. A | 95,740 | 3,061,765 | ||||
| Air Freight & Logistics - 2.6% | ||||||
Forward Air | 129,800 | 4,544,298 | ||||
UTi Worldwide | 238,900 | 3,201,260 | ||||
| 7,745,558 | ||||||
| Building Products - 1.0% | ||||||
Simpson Manufacturing | 87,500 | 2,869,125 | ||||
| Construction & Engineering - 4.0% | ||||||
EMCOR Group | 56,500 | 1,955,465 | ||||
Jacobs Engineering Group 2 | 105,000 | 4,469,850 | ||||
KBR | 175,400 | 5,247,968 | ||||
| 11,673,283 | ||||||
| Electrical Equipment - 2.9% | ||||||
AZZ | 82,500 | 3,170,475 | ||||
GrafTech International 2 | 392,000 | 3,680,880 | ||||
Regal-Beloit | 25,500 | 1,796,985 | ||||
| 8,648,340 | ||||||
| Industrial Conglomerates - 0.2% | ||||||
Raven Industries | 19,200 | 506,112 | ||||
| Machinery - 6.3% | ||||||
Kaydon Corporation | 134,500 | 3,218,585 | ||||
Kennametal | 154,100 | 6,164,000 | ||||
Lincoln Electric Holdings | 60,000 | 2,920,800 | ||||
Valmont Industries | 35,500 | 4,847,525 | ||||
Wabtec Corporation | 16,700 | 1,461,918 | ||||
| 18,612,828 | ||||||
| Professional Services - 5.8% | ||||||
Advisory Board (The) 2 | 51,582 | 2,413,522 | ||||
CRA International 2 | 152,313 | 3,011,228 | ||||
ManpowerGroup | 90,266 | 3,830,889 | ||||
Robert Half International | 95,000 | 3,022,900 | ||||
Towers Watson & Company Cl. A | 43,500 | 2,445,135 | ||||
Verisk Analytics Cl. A 2 | 47,500 | 2,422,500 | ||||
| 17,146,174 | ||||||
| Trading Companies & Distributors - 3.0% | ||||||
† Air Lease Cl. A 2 | 106,100 | 2,281,150 | ||||
Applied Industrial Technologies | 99,300 | 4,171,593 | ||||
MSC Industrial Direct Cl. A | 33,300 | 2,510,154 | ||||
| 8,962,897 | ||||||
| Total (Cost $61,359,205) | 79,226,082 | |||||
| 78 | The Royce Funds 2012 Annual Report to Shareholders | THE ACCOMPANYING NOTES ARE AN INTEGRAL PART OF THESE FINANCIAL STATEMENTS. |
| December 31, 2012 |
| SHARES | VALUE | |||||
| Information Technology – 18.9% | ||||||
| Communications Equipment - 1.0% | ||||||
ADTRAN | 155,800 | $ | 3,044,332 | |||
| Computers & Peripherals - 0.7% | ||||||
Diebold | 66,900 | 2,047,809 | ||||
| Electronic Equipment, Instruments & Components - 10.7% | ||||||
Coherent | 74,700 | 3,781,314 | ||||
Dolby Laboratories Cl. A 1 | 70,000 | 2,053,100 | ||||
DTS 2 | 150,600 | 2,515,020 | ||||
FARO Technologies 2 | 93,887 | 3,349,888 | ||||
FLIR Systems | 143,900 | 3,210,409 | ||||
IPG Photonics 1 | 45,086 | 3,004,982 | ||||
Littelfuse | 45,000 | 2,776,950 | ||||
National Instruments | 193,200 | 4,986,492 | ||||
Plexus Corporation 2 | 113,400 | 2,925,720 | ||||
Rofin-Sinar Technologies 2 | 137,500 | 2,981,000 | ||||
| 31,584,875 | ||||||
| IT Services - 1.2% | ||||||
Sapient Corporation 2 | 329,400 | 3,478,464 | ||||
| Office Electronics - 1.0% | ||||||
Zebra Technologies Cl. A 2 | 72,100 | 2,832,088 | ||||
| Semiconductors & Semiconductor Equipment - 2.2% | ||||||
Cabot Microelectronics | 71,800 | 2,549,618 | ||||
Diodes 2 | 125,000 | 2,168,750 | ||||
International Rectifier 2 | 107,000 | 1,897,110 | ||||
| 6,615,478 | ||||||
| Software - 2.1% | ||||||
ANSYS 2 | 63,500 | 4,276,090 | ||||
Blackbaud | 78,900 | 1,801,287 | ||||
| 6,077,377 | ||||||
| Total (Cost $51,320,418) | 55,680,423 | |||||
| Materials – 10.0% | ||||||
| Chemicals - 1.2% | ||||||
Intrepid Potash | 167,000 | 3,555,430 | ||||
| Containers & Packaging - 1.4% | ||||||
Greif Cl. A | 95,300 | 4,240,850 | ||||
| Metals & Mining - 7.4% | ||||||
Fresnillo | 136,500 | 4,235,433 | ||||
Major Drilling Group International | 340,500 | 3,354,680 | ||||
Randgold Resources ADR | 12,500 | 1,240,625 | ||||
Reliance Steel & Aluminum | 100,000 | 6,210,000 | ||||
Schnitzer Steel Industries Cl. A | 57,600 | 1,747,008 | ||||
Sims Metal Management ADR | 235,617 | 2,323,183 | ||||
Steel Dynamics | 185,500 | 2,546,915 | ||||
| 21,657,844 | ||||||
| Total (Cost $26,267,916) | 29,454,124 | |||||
| Miscellaneous 5 – 4.2% | ||||||
| Total (Cost $11,479,720) | 12,447,121 | |||||
| TOTAL COMMON STOCKS | ||||||
(Cost $233,385,867) | 288,715,241 | |||||
| REPURCHASE AGREEMENT – 2.8% | ||||||
| Fixed Income Clearing Corporation, | ||||||
0.10% dated 12/31/12, due 1/2/13, | ||||||
maturity value $8,356,046 (collateralized | ||||||
by obligations of various U.S. Government | ||||||
Agencies, 0.75% due 8/15/13, valued at $8,525,589) | ||||||
(Cost $8,356,000) | 8,356,000 | |||||
| COLLATERAL RECEIVED FOR SECURITIES | ||||||
LOANED – 1.2% | ||||||
| Money Market Funds | ||||||
Federated Government Obligations Fund | ||||||
(7 day yield-0.0107%) | ||||||
(Cost $3,483,733) | 3,483,733 | |||||
| TOTAL INVESTMENTS – 101.8% | ||||||
(Cost $245,225,600) | 300,554,974 | |||||
| LIABILITIES LESS CASH | ||||||
AND OTHER ASSETS – (1.8)% | (5,377,568 | ) | ||||
| NET ASSETS – 100.0% | $ | 295,177,406 | ||||
| THE ACCOMPANYING NOTES ARE AN INTEGRAL PART OF THESE FINANCIAL STATEMENTS. | The Royce Funds 2012 Annual Report to Shareholders | 79 |
| Schedules of Investments |
| Royce Dividend Value Fund |
| SHARES | VALUE | |||||
| COMMON STOCKS – 97.4% | ||||||
| Consumer Discretionary – 11.7% | ||||||
| Auto Components - 0.6% | ||||||
Autoliv | 33,300 | $ | 2,244,087 | |||
Tianneng Power International | 324,000 | 210,697 | ||||
Xinyi Glass Holdings | 130,000 | 81,837 | ||||
| 2,536,621 | ||||||
| Distributors - 0.1% | ||||||
Weyco Group | 11,600 | 270,976 | ||||
| Diversified Consumer Services - 0.6% | ||||||
Benesse Holdings | 4,000 | 165,793 | ||||
Regis Corporation | 127,800 | 2,162,376 | ||||
| 2,328,169 | ||||||
| Hotels, Restaurants & Leisure - 0.1% | ||||||
Abu Dhabi National Hotels | 642,000 | 314,620 | ||||
| Household Durables - 1.2% | ||||||
Ethan Allen Interiors | 49,000 | 1,259,790 | ||||
Harman International Industries | 54,400 | 2,428,416 | ||||
Hunter Douglas | 27,600 | 1,072,394 | ||||
| 4,760,600 | ||||||
| Internet & Catalog Retail - 0.2% | ||||||
PetMed Express | 56,000 | 621,600 | ||||
| Media - 0.4% | ||||||
Value Line | 169,000 | 1,515,930 | ||||
World Wrestling Entertainment Cl. A | 24,231 | 191,183 | ||||
| 1,707,113 | ||||||
| Specialty Retail - 6.7% | ||||||
American Eagle Outfitters | 136,900 | 2,807,819 | ||||
Ascena Retail Group 2 | 216,184 | 3,997,242 | ||||
Buckle (The) | 85,601 | 3,821,229 | ||||
Cato Corporation (The) Cl. A | 40,310 | 1,105,703 | ||||
Fielmann | 3,200 | 308,337 | ||||
GameStop Corporation Cl. A | 129,300 | 3,244,137 | ||||
Guess? | 116,900 | 2,868,726 | ||||
| 84,549 | 3,600,096 | |||||
Lewis Group | 41,000 | 334,436 | ||||
Tiffany & Co. | 60,500 | 3,469,070 | ||||
USS | 7,000 | 725,582 | ||||
Williams-Sonoma | 5,100 | 223,227 | ||||
| 26,505,604 | ||||||
| Textiles, Apparel & Luxury Goods - 1.8% | ||||||
Barry (R.G.) | 12,775 | 181,022 | ||||
Marimekko | 22,500 | 425,045 | ||||
† Pandora 1 | 240,000 | 5,288,358 | ||||
Stella International Holdings | 314,000 | 851,194 | ||||
| 11,500 | 288,650 | |||||
| 7,034,269 | ||||||
| Total (Cost $42,334,350) | 46,079,572 | |||||
| Consumer Staples – 2.9% | ||||||
| Food & Staples Retailing - 0.7% | ||||||
FamilyMart | 15,850 | 652,452 | ||||
Village Super Market Cl. A | 59,269 | 1,947,579 | ||||
| 2,600,031 | ||||||
| Food Products - 1.5% | ||||||
Hormel Foods | 120,476 | 3,760,056 | ||||
Industrias Bachoco ADR | 6,100 | 170,312 | ||||
J&J Snack Foods | 10,300 | 658,582 | ||||
Lancaster Colony | 5,600 | 387,464 | ||||
Lindt & Spruengli | 4 | 150,951 | ||||
Sanderson Farms | 1,300 | 61,815 | ||||
Super Group | 346,000 | 921,015 | ||||
| 6,110,195 | ||||||
| Personal Products - 0.7% | ||||||
Inter Parfums | 29,319 | 570,548 | ||||
Nu Skin Enterprises Cl. A | 62,645 | 2,320,997 | ||||
| 2,891,545 | ||||||
| Total (Cost $10,476,561) | 11,601,771 | |||||
| Energy – 4.9% | ||||||
| Energy Equipment & Services - 4.4% | ||||||
Ensco Cl. A | 58,100 | 3,444,168 | ||||
Ensign Energy Services | 25,300 | 390,933 | ||||
Helmerich & Payne | 92,154 | 5,161,546 | ||||
Lufkin Industries | 7,400 | 430,162 | ||||
Oil States International 2 | 58,300 | 4,170,782 | ||||
TGS-NOPEC Geophysical | 18,500 | 606,250 | ||||
Tidewater | 70,500 | 3,149,940 | ||||
| 17,353,781 | ||||||
| Oil, Gas & Consumable Fuels - 0.5% | ||||||
Cimarex Energy | 5,700 | 329,061 | ||||
Energen Corporation | 9,150 | 412,574 | ||||
Golar LNG | 10,700 | 393,546 | ||||
Natural Resource Partners L.P. | 37,500 | 695,250 | ||||
Pioneer Southwest Energy Partners L.P. | 1,713 | 38,885 | ||||
| 1,869,316 | ||||||
| Total (Cost $17,164,500) | 19,223,097 | |||||
| Financials – 28.2% | ||||||
| Capital Markets - 15.9% | ||||||
AllianceBernstein Holding L.P. | 242,600 | 4,228,518 | ||||
Apollo Global Management LLC Cl. A | 163,800 | 2,843,568 | ||||
Artio Global Investors Cl. A | 216,200 | 410,780 | ||||
Ashmore Group | 464,250 | 2,684,441 | ||||
Close Brothers Group | 18,000 | 252,756 | ||||
† Coronation Fund Managers | 760,000 | 3,560,723 | ||||
Egyptian Financial Group-Hermes Holding | ||||||
Company 2 | 132,500 | 229,583 | ||||
Federated Investors Cl. B | 205,700 | 4,161,311 | ||||
Fortress Investment Group LLC Cl. A | 50,000 | 219,500 | ||||
Gluskin Sheff + Associates | 32,200 | 484,602 | ||||
Invesco | 148,200 | 3,866,538 | ||||
Investec | 80,000 | 544,882 | ||||
Jupiter Fund Management | 550,000 | 2,552,756 | ||||
KKR & Co. L.P. | 293,200 | 4,465,436 | ||||
Lazard Cl. A | 134,600 | 4,016,464 | ||||
Manning & Napier | 307,500 | 3,874,500 | ||||
| 80 | The Royce Funds 2012 Annual Report to Shareholders | THE ACCOMPANYING NOTES ARE AN INTEGRAL PART OF THESE FINANCIAL STATEMENTS. |
| December 31, 2012 |
| SHARES | VALUE | |||||
| Financials (continued) | ||||||
| Capital Markets (continued) | ||||||
Och-Ziff Capital Management Group LLC Cl. A | 108,100 | $ | 1,026,950 | |||
Oppenheimer Holdings Cl. A | 121,512 | 2,098,512 | ||||
Partners Group Holding | 500 | 115,486 | ||||
Raymond James Financial | 7,800 | 300,534 | ||||
SEI Investments | 193,300 | 4,511,622 | ||||
Sprott | 420,000 | 1,672,062 | ||||
† State Street | 71,100 | 3,342,411 | ||||
T. Rowe Price Group | 42,000 | 2,735,460 | ||||
U.S. Global Investors Cl. A | 588,380 | 2,359,404 | ||||
Value Partners Group | 1,225,000 | 822,331 | ||||
VZ Holding | 8,300 | 1,046,876 | ||||
Waddell & Reed Financial Cl. A | 67,510 | 2,350,698 | ||||
Westwood Holdings Group | 49,173 | 2,011,176 | ||||
| 62,789,880 | ||||||
| Commercial Banks - 2.2% | ||||||
Ames National | 22,064 | 483,202 | ||||
Bank of Hawaii | 63,400 | 2,792,770 | ||||
BLOM Bank GDR | 63,000 | 497,700 | ||||
BOK Financial | 30,400 | 1,655,584 | ||||
City Holding Company | 52,865 | 1,842,345 | ||||
First Republic Bank | 43,100 | 1,412,818 | ||||
| 8,684,419 | ||||||
| Diversified Financial Services - 2.7% | ||||||
Bolsa Mexicana de Valores | 674,900 | 1,702,091 | ||||
Hellenic Exchanges | 158,000 | 910,416 | ||||
KKR Financial Holdings LLC | 228,350 | 2,411,376 | ||||
† Moody’s Corporation | 64,900 | 3,265,768 | ||||
Singapore Exchange | 140,000 | 811,635 | ||||
Warsaw Stock Exchange | 135,400 | 1,702,573 | ||||
| 10,803,859 | ||||||
| Insurance - 5.3% | ||||||
Allied World Assurance Company Holdings | 30,598 | 2,411,122 | ||||
Aspen Insurance Holdings | 25,324 | 812,394 | ||||
Brown & Brown | 13,400 | 341,164 | ||||
Cincinnati Financial | 46,700 | 1,828,772 | ||||
Erie Indemnity Cl. A | 24,200 | 1,675,124 | ||||
HCC Insurance Holdings | 16,500 | 613,965 | ||||
Marsh & McLennan | 85,900 | 2,960,973 | ||||
Montpelier Re Holdings | 16,195 | 370,218 | ||||
PartnerRe | 21,206 | 1,706,871 | ||||
Reinsurance Group of America | 78,842 | 4,219,624 | ||||
United Fire Group | 11,900 | 259,896 | ||||
Willis Group Holdings | 110,700 | 3,711,771 | ||||
| 20,911,894 | ||||||
| Real Estate Investment Trusts (REITs) - 1.0% | ||||||
CommonWealth REIT | 6,250 | 99,000 | ||||
Cousins Properties | 40,010 | 334,083 | ||||
DCT Industrial Trust | 98,400 | 638,616 | ||||
Essex Property Trust | 8,000 | 1,173,200 | ||||
Lexington Realty Trust | 58,706 | 613,478 | ||||
National Health Investors | 19,300 | 1,091,029 | ||||
| 3,949,406 | ||||||
| Real Estate Management & Development - 0.4% | ||||||
Kennedy-Wilson Holdings | 98,600 | 1,378,428 | ||||
| Thrifts & Mortgage Finance - 0.7% | ||||||
Capitol Federal Financial | 27,000 | 315,630 | ||||
Genworth MI Canada | 63,318 | 1,437,975 | ||||
TrustCo Bank Corp NY | 164,710 | 869,669 | ||||
| 2,623,274 | ||||||
| Total (Cost $102,016,872) | 111,141,160 | |||||
| Health Care – 4.3% | ||||||
| Health Care Equipment & Supplies - 0.7% | ||||||
Atrion Corporation | 13,200 | 2,587,200 | ||||
Carl Zeiss Meditec | 9,500 | 272,941 | ||||
| 2,860,141 | ||||||
| Health Care Providers & Services - 3.2% | ||||||
Chemed Corporation | 58,158 | 3,989,057 | ||||
Landauer | 53,000 | 3,244,130 | ||||
MEDNAX 2 | 21,800 | 1,733,536 | ||||
OdontoPrev | 38,400 | 202,883 | ||||
Owens & Minor | 114,600 | 3,267,246 | ||||
| 12,436,852 | ||||||
| Pharmaceuticals - 0.4% | ||||||
Adcock Ingram Holdings | 48,900 | 311,509 | ||||
Hikma Pharmaceuticals | 11,000 | 137,667 | ||||
Recordati | 57,500 | 526,817 | ||||
Santen Pharmaceutical | 18,100 | 692,987 | ||||
| 1,668,980 | ||||||
| Total (Cost $15,895,486) | 16,965,973 | |||||
| Industrials – 21.8% | ||||||
| Aerospace & Defense - 1.6% | ||||||
American Science & Engineering | 49,545 | 3,230,829 | ||||
Cubic Corporation | 45,416 | 2,178,606 | ||||
HEICO Corporation Cl. A | 28,906 | 924,414 | ||||
| 6,333,849 | ||||||
| Air Freight & Logistics - 0.8% | ||||||
Forward Air | 88,000 | 3,080,880 | ||||
UTi Worldwide | 16,700 | 223,780 | ||||
| 3,304,660 | ||||||
| Building Products - 1.3% | ||||||
AAON | 78,350 | 1,635,164 | ||||
Geberit | 1,000 | 221,378 | ||||
Insteel Industries | 72,000 | 898,560 | ||||
Simpson Manufacturing | 57,600 | 1,888,704 | ||||
TOTO | 74,000 | 555,859 | ||||
WaterFurnace Renewable Energy | 6,000 | 87,102 | ||||
| 5,286,767 | ||||||
| Commercial Services & Supplies - 1.8% | ||||||
Brink’s Company (The) | 108,500 | 3,095,505 | ||||
CompX International Cl. A | 25,800 | 359,394 | ||||
Interface | 8,000 | 128,640 | ||||
Mine Safety Appliances | 35,000 | 1,494,850 | ||||
Ritchie Bros. Auctioneers | 48,900 | 1,021,521 | ||||
Societe BIC | 6,600 | 787,878 | ||||
| THE ACCOMPANYING NOTES ARE AN INTEGRAL PART OF THESE FINANCIAL STATEMENTS. | The Royce Funds 2012 Annual Report to Shareholders | 81 |
| Schedules of Investments |
| Royce Dividend Value Fund (continued) |
| SHARES | VALUE | |||||
| Industrials (continued) | ||||||
| Commercial Services & Supplies (continued) | ||||||
US Ecology | 7,700 | $ | 181,258 | |||
| 7,069,046 | ||||||
| Construction & Engineering - 0.6% | ||||||
† KBR | 75,000 | 2,244,000 | ||||
Raubex Group | 135,000 | 270,019 | ||||
| 2,514,019 | ||||||
| Electrical Equipment - 3.0% | ||||||
AZZ | 92,800 | 3,566,304 | ||||
Brady Corporation Cl. A | 54,300 | 1,813,620 | ||||
Franklin Electric | 6,000 | 373,020 | ||||
Hubbell Cl. B | 51,400 | 4,349,982 | ||||
Preformed Line Products | 13,100 | 778,402 | ||||
Regal-Beloit | 11,400 | 803,358 | ||||
| 11,684,686 | ||||||
| Machinery - 8.7% | ||||||
Burckhardt Compression Holding | 3,600 | 1,180,738 | ||||
CLARCOR | 53,200 | 2,541,896 | ||||
Donaldson Company | 101,000 | 3,316,840 | ||||
Flowserve Corporation | 7,900 | 1,159,720 | ||||
Foster (L.B.) Company | 55,300 | 2,402,232 | ||||
Graco | 64,000 | 3,295,360 | ||||
Kennametal | 158,808 | 6,352,320 | ||||
Lincoln Electric Holdings | 56,400 | 2,745,552 | ||||
Lindsay Corporation | 32,800 | 2,627,936 | ||||
Nordson Corporation | 15,400 | 972,048 | ||||
Pfeiffer Vacuum Technology | 13,500 | 1,634,713 | ||||
Rational | 1,000 | 287,999 | ||||
Semperit AG Holding | 5,000 | 206,079 | ||||
Spirax-Sarco Engineering | 36,500 | 1,372,291 | ||||
Tennant Company | 18,400 | 808,680 | ||||
Valmont Industries | 23,700 | 3,236,235 | ||||
| 34,140,639 | ||||||
| Professional Services - 1.7% | ||||||
Corporate Executive Board | 3,900 | 185,094 | ||||
Kelly Services Cl. A | 39,200 | 617,008 | ||||
ManpowerGroup | 72,800 | 3,089,632 | ||||
Michael Page International | 36,000 | 232,512 | ||||
Towers Watson & Company Cl. A | 46,100 | 2,591,281 | ||||
| 6,715,527 | ||||||
| Road & Rail - 1.0% | ||||||
Arkansas Best | 49,600 | 473,680 | ||||
Landstar System | 66,300 | 3,478,098 | ||||
| 3,951,778 | ||||||
| Trading Companies & Distributors - 1.3% | ||||||
Applied Industrial Technologies | 95,506 | 4,012,207 | ||||
Houston Wire & Cable | 79,700 | 977,919 | ||||
| 4,990,126 | ||||||
| Transportation Infrastructure - 0.0% | ||||||
Grupo Aeroportuario del Centro Norte ADR | 7,342 | 159,688 | ||||
| Total (Cost $69,944,361) | 86,150,785 | |||||
| Information Technology – 7.8% | ||||||
| Communications Equipment - 0.6% | ||||||
ADTRAN | 3,300 | 64,482 | ||||
Plantronics | 67,908 | 2,503,768 | ||||
| 2,568,250 | ||||||
| Computers & Peripherals - 0.1% | ||||||
Diebold | 13,800 | 422,418 | ||||
| Electronic Equipment, Instruments & Components - 5.9% | ||||||
Amphenol Corporation Cl. A | 47,100 | 3,047,370 | ||||
AVX Corporation | 142,300 | 1,533,994 | ||||
Cognex Corporation | 10,000 | 368,200 | ||||
Domino Printing Sciences | 36,000 | 341,871 | ||||
Electro Rent | 15,900 | 244,542 | ||||
FLIR Systems | 142,900 | 3,188,099 | ||||
Littelfuse | 48,402 | 2,986,887 | ||||
Molex | 91,000 | 2,487,030 | ||||
Molex Cl. A | 78,518 | 1,752,522 | ||||
MTS Systems | 50,293 | 2,561,423 | ||||
National Instruments | 145,400 | 3,752,774 | ||||
Vaisala Cl. A | 41,000 | 861,199 | ||||
| 23,125,911 | ||||||
| IT Services - 0.7% | ||||||
CoreLogic 2 | 9,300 | 250,356 | ||||
Jack Henry & Associates | 32,300 | 1,268,098 | ||||
ManTech International Cl. A | 45,736 | 1,186,392 | ||||
| 2,704,846 | ||||||
| Semiconductors & Semiconductor Equipment - 0.5% | ||||||
Aixtron ADR | 15,000 | 179,250 | ||||
Teradyne 2 | 112,000 | 1,891,680 | ||||
| 2,070,930 | ||||||
| Total (Cost $29,168,738) | 30,892,355 | |||||
| Materials – 11.3% | ||||||
| Chemicals - 2.8% | ||||||
Balchem Corporation | 50,150 | 1,825,460 | ||||
Cabot Corporation | 6,500 | 258,635 | ||||
International Flavors & Fragrances | 27,100 | 1,803,234 | ||||
Quaker Chemical | 57,600 | 3,102,336 | ||||
Stepan Company | 60,600 | 3,365,724 | ||||
Victrex | 7,500 | 202,410 | ||||
Westlake Chemical | 4,300 | 340,990 | ||||
| 10,898,789 | ||||||
| Containers & Packaging - 1.8% | ||||||
AptarGroup | 68,300 | 3,259,276 | ||||
Greif Cl. A | 84,800 | 3,773,600 | ||||
| 7,032,876 | ||||||
| Metals & Mining - 6.7% | ||||||
Allegheny Technologies | 13,000 | 394,680 | ||||
Commercial Metals | 18,700 | 277,882 | ||||
Compass Minerals International | 37,600 | 2,809,096 | ||||
Fresnillo | 81,800 | 2,538,157 | ||||
† Gold Fields ADR | 269,400 | 3,364,806 | ||||
Kingsgate Consolidated | 33,000 | 154,709 | ||||
Major Drilling Group International | 88,000 | 866,995 | ||||
† Pan American Silver | 157,100 | 2,942,483 | ||||
| 82 | The Royce Funds 2012 Annual Report to Shareholders | THE ACCOMPANYING NOTES ARE AN INTEGRAL PART OF THESE FINANCIAL STATEMENTS. |
| December 31, 2012 |
| SHARES | VALUE | |||||
| Materials (continued) | ||||||
| Metals & Mining (continued) | ||||||
Randgold Resources ADR | 36,300 | $ | 3,602,775 | |||
Reliance Steel & Aluminum | 62,347 | 3,871,749 | ||||
Schnitzer Steel Industries Cl. A | 12,400 | 376,092 | ||||
Sims Metal Management ADR | 240,000 | 2,366,400 | ||||
Steel Dynamics | 21,000 | 288,330 | ||||
Worthington Industries | 103,800 | 2,697,762 | ||||
| 26,551,916 | ||||||
| Total (Cost $41,400,295) | 44,483,581 | |||||
| Telecommunication Services – 0.0% | ||||||
| Diversified Telecommunication Services - 0.0% | ||||||
Citic Telecom International Holdings | 551,000 | 150,826 | ||||
| Total (Cost $163,939) | 150,826 | |||||
| Miscellaneous 5 – 4.5% | ||||||
| Total (Cost $16,215,367) | 17,952,039 | |||||
| TOTAL COMMON STOCKS | ||||||
(Cost $344,780,469) | 384,641,159 | |||||
| REPURCHASE AGREEMENT – 3.6% | ||||||
| Fixed Income Clearing Corporation, | ||||||
0.10% dated 12/31/12, due 1/2/13, | ||||||
maturity value $14,092,078 (collateralized | ||||||
by obligations of various U.S. Government | ||||||
Agencies, 0.75% due 8/15/13, valued at | ||||||
$14,378,752) | ||||||
(Cost $14,092,000) | 14,092,000 | |||||
| COLLATERAL RECEIVED FOR SECURITIES | ||||||
LOANED – 0.5% | ||||||
| Money Market Funds | ||||||
Federated Government Obligations Fund | ||||||
(7 day yield-0.0107%) | ||||||
(Cost $2,015,454) | 2,015,454 | |||||
| TOTAL INVESTMENTS – 101.5% | ||||||
(Cost $360,887,923) | 400,748,613 | |||||
| LIABILITIES LESS CASH | ||||||
AND OTHER ASSETS – (1.5)% | (6,025,743 | ) | ||||
| NET ASSETS – 100.0% | $ | 394,722,870 | ||||
| Royce Global Value Fund | ||||||
| SHARES | VALUE | |||||
| COMMON STOCKS – 95.7% | ||||||
| Australia – 2.3% | ||||||
CGA Mining 2 | 1,296,500 | $ | 3,427,963 | |||
Medusa Mining | 600,000 | 3,460,756 | ||||
| Total (Cost $8,094,230) | 6,888,719 | |||||
| Austria – 6.0% | ||||||
Mayr-Melnhof Karton | 83,000 | 8,903,512 | ||||
Semperit AG Holding | 221,844 | 9,143,496 | ||||
| Total (Cost $21,950,625) | 18,047,008 | |||||
| Belgium – 2.2% | ||||||
GIMV | 47,950 | 2,411,109 | ||||
Sipef | 54,259 | 4,250,471 | ||||
| Total (Cost $7,914,898) | 6,661,580 | |||||
| Brazil – 1.4% | ||||||
† Brasil Brokers Participacoes | 750,000 | 2,514,254 | ||||
† Eternit | 400,000 | 1,595,322 | ||||
| Total (Cost $4,158,483) | 4,109,576 | |||||
| Canada – 9.3% | ||||||
Major Drilling Group International | 464,500 | 4,576,355 | ||||
Pan American Silver | 274,000 | 5,132,020 | ||||
Pason Systems | 400,000 | 6,896,552 | ||||
Sprott | 954,000 | 3,797,969 | ||||
Trican Well Service | 565,400 | 7,457,573 | ||||
| Total (Cost $39,384,269) | 27,860,469 | |||||
| China – 1.9% | ||||||
† Daphne International Holdings | 1,700,000 | 2,354,924 | ||||
E-House China Holdings ADR | 829,886 | 3,402,533 | ||||
| Total (Cost $10,964,813) | 5,757,457 | |||||
| Denmark – 1.5% | ||||||
† SimCorp | 20,000 | 4,477,042 | ||||
| Total (Cost $3,540,758) | 4,477,042 | |||||
| France – 2.0% | ||||||
Boiron | 69,422 | 2,394,834 | ||||
Societe Internationale de Plantations d’Heveas | 44,900 | 3,678,248 | ||||
| Total (Cost $7,603,742) | 6,073,082 | |||||
| Germany – 3.7% | ||||||
Carl Zeiss Meditec | 159,300 | 4,576,785 | ||||
Fuchs Petrolub | 39,900 | 2,793,768 | ||||
Pfeiffer Vacuum Technology | 30,800 | 3,729,566 | ||||
| Total (Cost $8,951,076) | 11,100,119 | |||||
| Hong Kong – 4.3% | ||||||
Asian Citrus Holdings | 4,000,000 | 1,903,002 | ||||
Luk Fook Holdings (International) 1 | 1,400,000 | 4,492,711 | ||||
| THE ACCOMPANYING NOTES ARE AN INTEGRAL PART OF THESE FINANCIAL STATEMENTS. | The Royce Funds 2012 Annual Report to Shareholders | 83 |
| Schedules of Investments |
| Royce Global Value Fund (continued) |
| SHARES | VALUE | |||||
| Hong Kong (continued) | ||||||
Value Partners Group | 9,450,000 | $ | 6,343,695 | |||
| Total (Cost $15,236,144) | 12,739,408 | |||||
| India – 2.5% | ||||||
Graphite India | 2,500,000 | 3,802,473 | ||||
Maharashtra Seamless | 750,000 | 3,697,999 | ||||
| Total (Cost $10,773,270) | 7,500,472 | |||||
| Italy – 2.3% | ||||||
Recordati | 732,400 | 6,710,271 | ||||
| Total (Cost $6,380,539) | 6,710,271 | |||||
| Japan – 10.6% | ||||||
† EPS Corporation | 1,600 | 4,099,482 | ||||
FamilyMart | 170,000 | 6,997,910 | ||||
† MISUMI Group | 135,000 | 3,663,655 | ||||
Moshi Moshi Hotline | 270,000 | 3,441,345 | ||||
† Nihon M&A Center | 120,000 | 3,995,549 | ||||
Santen Pharmaceutical | 104,500 | 4,000,949 | ||||
USS | 54,000 | 5,597,345 | ||||
| Total (Cost $27,664,492) | 31,796,235 | |||||
| Mexico – 2.4% | ||||||
Grupo SIMEC Ser. B 2 | 598,500 | 2,833,618 | ||||
Industrias Bachoco ADR | 157,929 | 4,409,378 | ||||
| Total (Cost $5,517,179) | 7,242,996 | |||||
| Norway – 2.8% | ||||||
Ekornes | 255,000 | 4,252,388 | ||||
TGS-NOPEC Geophysical | 129,600 | 4,247,029 | ||||
| Total (Cost $6,824,428) | 8,499,417 | |||||
| South Africa – 4.2% | ||||||
Adcock Ingram Holdings | 570,000 | 3,631,089 | ||||
Lewis Group | 600,000 | 4,894,181 | ||||
Raubex Group | 2,023,000 | 4,046,279 | ||||
| Total (Cost $16,444,149) | 12,571,549 | |||||
| South Korea – 1.8% | ||||||
MegaStudy | 72,500 | 5,343,754 | ||||
| Total (Cost $9,491,354) | 5,343,754 | |||||
| Sweden – 1.6% | ||||||
Autoliv | 71,400 | 4,811,646 | ||||
| Total (Cost $5,095,967) | 4,811,646 | |||||
| Switzerland – 3.0% | ||||||
Burckhardt Compression Holding | 10,000 | 3,279,828 | ||||
Partners Group Holding | 24,800 | 5,728,093 | ||||
| Total (Cost $7,505,986) | 9,007,921 | |||||
| Turkey – 1.1% | ||||||
Mardin Cimento Sanayii | 1,121,145 | 3,356,222 | ||||
| Total (Cost $5,052,828) | 3,356,222 | |||||
| United Kingdom – 11.1% | ||||||
Ashmore Group | 1,345,000 | 7,777,219 | ||||
† Domino Printing Sciences | 450,000 | 4,273,391 | ||||
Hochschild Mining | 800,000 | 6,216,042 | ||||
Jupiter Fund Management | 1,400,000 | 6,497,925 | ||||
Spirax-Sarco Engineering | 124,600 | 4,684,589 | ||||
Victrex | 144,000 | 3,886,277 | ||||
| Total (Cost $32,513,919) | 33,335,443 | |||||
| United States – 17.7% | ||||||
† ADTRAN | 127,150 | 2,484,511 | ||||
Allied Nevada Gold 2 | 189,500 | 5,709,635 | ||||
† Dolby Laboratories Cl. A 1 | 140,000 | 4,106,200 | ||||
Helmerich & Payne | 147,100 | 8,239,071 | ||||
Kennametal | 136,600 | 5,464,000 | ||||
† Kennedy-Wilson Holdings | 220,000 | 3,075,600 | ||||
Lincoln Electric Holdings | 110,800 | 5,393,744 | ||||
† Myriad Genetics 2 | 140,000 | 3,815,000 | ||||
Teradyne 2 | 310,000 | 5,235,900 | ||||
Veeco Instruments 2 | 134,500 | 3,970,440 | ||||
Western Digital | 134,500 | 5,714,905 | ||||
| Total (Cost $54,011,351) | 53,209,006 | |||||
| TOTAL COMMON STOCKS | ||||||
(Cost $315,074,500) | 287,099,392 | |||||
| REPURCHASE AGREEMENT – 4.2% | ||||||
| Fixed Income Clearing Corporation, | ||||||
0.10% dated 12/31/12, due 1/2/13, | ||||||
maturity value $12,739,071 (collateralized | ||||||
by obligations of various U.S. Government | ||||||
Agencies, 0.30% due 12/4/13, valued at | ||||||
$12,997,588) | ||||||
(Cost $12,739,000) | 12,739,000 | |||||
| COLLATERAL RECEIVED FOR SECURITIES | ||||||
LOANED – 1.3% | ||||||
| Money Market Funds | ||||||
Federated Government Obligations Fund | ||||||
(7 day yield-0.0107%) | ||||||
(Cost $3,993,332) | 3,993,332 | |||||
| TOTAL INVESTMENTS – 101.2% | ||||||
(Cost $331,806,832) | 303,831,724 | |||||
| LIABILITIES LESS CASH | ||||||
AND OTHER ASSETS – (1.2)% | (3,734,579 | ) | ||||
| NET ASSETS – 100.0% | $ | 300,097,145 | ||||
| 84 | The Royce Funds 2012 Annual Report to Shareholders | THE ACCOMPANYING NOTES ARE AN INTEGRAL PART OF THESE FINANCIAL STATEMENTS. |
| December 31, 2012 |
| Royce International Smaller-Companies Fund |
| SHARES | VALUE | |||||
| COMMON STOCKS – 97.1% | ||||||
| Australia – 2.0% | ||||||
CGA Mining 2 | 67,500 | $ | 178,471 | |||
Medusa Mining | 22,500 | 129,778 | ||||
Regis Resources 2 | 40,000 | 215,923 | ||||
| Total (Cost $433,336) | 524,172 | |||||
| Austria – 2.5% | ||||||
Mayr-Melnhof Karton | 3,000 | 321,814 | ||||
Semperit AG Holding | 8,500 | 350,335 | ||||
| Total (Cost $662,532) | 672,149 | |||||
| Belgium – 1.7% | ||||||
GIMV | 3,950 | 198,621 | ||||
Sipef | 1,500 | 117,505 | ||||
† Van de Velde | 2,700 | 122,102 | ||||
| Total (Cost $422,716) | 438,228 | |||||
| Brazil – 2.8% | ||||||
† Brasil Brokers Participacoes | 60,000 | 201,140 | ||||
Eternit | 40,000 | 159,532 | ||||
† Fleury | 12,000 | 135,278 | ||||
Grendene | 30,000 | 243,107 | ||||
| Total (Cost $709,001) | 739,057 | |||||
| Canada – 2.8% | ||||||
Ensign Energy Services | 8,000 | 123,615 | ||||
Gluskin Sheff + Associates | 7,000 | 105,348 | ||||
Major Drilling Group International | 20,000 | 197,044 | ||||
ShawCor Cl. A | 2,300 | 90,155 | ||||
Trican Well Service | 17,500 | 230,824 | ||||
| Total (Cost $686,984) | 746,986 | |||||
| Cayman Islands – 0.9% | ||||||
Greenlight Capital Re Cl. A 2 | 10,000 | 230,800 | ||||
| Total (Cost $194,676) | 230,800 | |||||
| China – 3.1% | ||||||
Anta Sports Products | 200,000 | 178,796 | ||||
Daphne International Holdings | 175,000 | 242,419 | ||||
E-House China Holdings ADR | 27,500 | 112,750 | ||||
† Haitian International Holdings | 100,000 | 119,410 | ||||
† Pacific Online | 500,000 | 177,288 | ||||
| Total (Cost $903,271) | 830,663 | |||||
| Cyprus – 0.7% | ||||||
Globaltrans Investment GDR | 11,000 | 183,838 | ||||
| Total (Cost $154,885) | 183,838 | |||||
| Denmark – 1.9% | ||||||
H. Lundbeck | 12,500 | 182,993 | ||||
SimCorp | 1,400 | 313,393 | ||||
| Total (Cost $454,917) | 496,386 | |||||
| France – 9.6% | ||||||
Altamir Amboise | 17,500 | 171,100 | ||||
Alten | 6,500 | 224,246 | ||||
Audika Groupe | 15,000 | 163,923 | ||||
Beneteau | 17,500 | 190,052 | ||||
bioMerieux | 2,000 | 193,321 | ||||
Boiron | 5,000 | 172,484 | ||||
Ipsen | 4,000 | 121,151 | ||||
Manutan International | 5,000 | 221,818 | ||||
Paris Orleans | 5,000 | 114,163 | ||||
Parrot 2 | 6,000 | 223,508 | ||||
Piscines Desjoyaux | 12,500 | 94,301 | ||||
Societe Internationale de Plantations d’Heveas | 2,500 | 204,802 | ||||
Vetoquinol | 7,000 | 245,435 | ||||
Virbac | 950 | 187,847 | ||||
| Total (Cost $2,551,185) | 2,528,151 | |||||
| Germany – 6.3% | ||||||
Carl Zeiss Meditec | 9,000 | 258,575 | ||||
Fuchs Petrolub | 2,500 | 175,048 | ||||
KWS Saat | 800 | 257,159 | ||||
Nemetschek | 3,000 | 132,107 | ||||
Pfeiffer Vacuum Technology | 2,500 | 302,725 | ||||
PUMA | 615 | 182,540 | ||||
Takkt | 25,000 | 348,055 | ||||
| Total (Cost $1,234,345) | 1,656,209 | |||||
| Greece – 0.6% | ||||||
JUMBO | 20,000 | 158,190 | ||||
| Total (Cost $102,151) | 158,190 | |||||
| Hong Kong – 8.4% | ||||||
Bosideng International Holdings | 350,000 | 104,377 | ||||
Luk Fook Holdings (International) | 50,000 | 160,454 | ||||
† Media Chinese International | 350,000 | 127,793 | ||||
Midland Holdings | 350,000 | 169,962 | ||||
New World Department Store China | 375,000 | 244,109 | ||||
Pacific Textiles Holdings | 300,000 | 271,433 | ||||
Pico Far East Holdings | 500,000 | 149,413 | ||||
Stella International Holdings | 60,000 | 162,649 | ||||
† Television Broadcasts | 30,000 | 225,187 | ||||
Texwinca Holdings | 200,000 | 191,016 | ||||
Value Partners Group | 350,000 | 234,952 | ||||
Xtep International Holdings | 400,000 | 173,097 | ||||
| Total (Cost $2,075,501) | 2,214,442 | |||||
| India – 3.2% | ||||||
AIA Engineering | 30,000 | 180,176 | ||||
Educomp Solutions | 60,000 | 154,500 | ||||
| THE ACCOMPANYING NOTES ARE AN INTEGRAL PART OF THESE FINANCIAL STATEMENTS. | The Royce Funds 2012 Annual Report to Shareholders | 85 |
| Schedules of Investments |
| Royce International Smaller-Companies Fund (continued) |
| SHARES | VALUE | |||||
| India (continued) | ||||||
Graphite India | 125,000 | $ | 190,124 | |||
Maharashtra Seamless | 35,000 | 172,573 | ||||
Unichem Laboratories | 40,000 | 134,396 | ||||
| Total (Cost $1,075,440) | 831,769 | |||||
| Italy – 3.7% | ||||||
DiaSorin | 8,500 | 340,950 | ||||
Geox | 70,000 | 202,411 | ||||
Recordati | 47,500 | 435,196 | ||||
| Total (Cost $855,597) | 978,557 | |||||
| Japan – 12.3% | ||||||
Benesse Holdings | 4,100 | 169,938 | ||||
BML | 7,500 | 183,060 | ||||
C. Uyemura & Co. | 5,500 | 174,050 | ||||
† Dr.Ci:Labo | 50 | 156,022 | ||||
EPS Corporation | 80 | 204,974 | ||||
FamilyMart | 7,000 | 288,149 | ||||
Hisamitsu Pharmaceutical | 2,800 | 138,832 | ||||
Hogy Medical | 3,000 | 142,882 | ||||
Kakaku.com | 4,000 | 131,716 | ||||
† Mandom Corporation | 5,000 | 137,640 | ||||
† Milbon | 4,000 | 126,218 | ||||
† Miraial | 10,500 | 197,792 | ||||
MISUMI Group | 7,500 | 203,536 | ||||
Moshi Moshi Hotline | 14,000 | 178,440 | ||||
Nomura Research Institute | 8,000 | 165,602 | ||||
Santen Pharmaceutical | 8,500 | 325,436 | ||||
USS | 3,000 | 310,964 | ||||
| Total (Cost $2,998,060) | 3,235,251 | |||||
| Luxembourg – 0.3% | ||||||
Reinet Investments 2 | 5,000 | 91,183 | ||||
| Total (Cost $82,407) | 91,183 | |||||
| Malaysia – 0.5% | ||||||
Padini Holdings | 200,000 | 121,501 | ||||
| Total (Cost $78,930) | 121,501 | |||||
| Mexico – 2.7% | ||||||
Grupo Herdez | 100,000 | 307,435 | ||||
† Grupo SIMEC Ser. B 2 | 40,000 | 189,382 | ||||
Industrias Bachoco ADR | 7,500 | 209,400 | ||||
| Total (Cost $435,779) | 706,217 | |||||
| Norway – 1.3% | ||||||
Ekornes | 10,000 | 166,760 | ||||
TGS-NOPEC Geophysical | 5,000 | 163,852 | ||||
| Total (Cost $212,372) | 330,612 | |||||
| Poland – 0.7% | ||||||
Warsaw Stock Exchange | 15,000 | 188,616 | ||||
| Total (Cost $193,820) | 188,616 | |||||
| Singapore – 1.8% | ||||||
ARA Asset Management | 79,900 | 106,615 | ||||
Biosensors International Group 2 | 125,000 | 124,279 | ||||
† ComfortDelGro Corporation | 100,000 | 146,564 | ||||
† Yoma Strategic Holdings | 180,000 | 105,418 | ||||
| Total (Cost $369,194) | 482,876 | |||||
| South Africa – 3.2% | ||||||
Adcock Ingram Holdings | 32,500 | 207,036 | ||||
ADvTECH | 150,000 | 109,935 | ||||
† AVI | 19,000 | 134,039 | ||||
Lewis Group | 30,000 | 244,709 | ||||
Raubex Group | 80,000 | 160,011 | ||||
| Total (Cost $968,672) | 855,730 | |||||
| South Korea – 2.7% | ||||||
Green Cross | 1,000 | 129,556 | ||||
GS Home Shopping | 1,400 | 199,406 | ||||
† Handsome Co. | 5,000 | 138,012 | ||||
MegaStudy | 3,500 | 257,974 | ||||
| Total (Cost $750,357) | 724,948 | |||||
| Spain – 0.8% | ||||||
Almirall | 20,200 | 198,453 | ||||
| Total (Cost $190,408) | 198,453 | |||||
| Sweden – 1.0% | ||||||
Lundin Petroleum 2 | 12,000 | 276,888 | ||||
| Total (Cost $166,038) | 276,888 | |||||
| Switzerland – 8.5% | ||||||
Bank Sarasin & Co. Cl. B 2 | 3,000 | 87,343 | ||||
Banque Privee Edmond de Rothschild | 3 | 59,913 | ||||
Belimo Holding | 50 | 96,710 | ||||
Burckhardt Compression Holding | 750 | 245,987 | ||||
† Kaba Holding | 450 | 190,764 | ||||
Logitech International | 20,000 | 152,487 | ||||
Partners Group Holding | 1,350 | 311,811 | ||||
Sika | 60 | 139,057 | ||||
Sulzer | 2,000 | 316,957 | ||||
† Tecan Group | 1,400 | 117,321 | ||||
Vontobel Holding | 4,000 | 123,507 | ||||
VZ Holding | 2,000 | 252,259 | ||||
† Zehnder Group | 2,800 | 135,895 | ||||
| Total (Cost $1,858,232) | 2,230,011 | |||||
| Turkey – 1.2% | ||||||
† Koza Altin Isletmeleri | 5,300 | 127,992 | ||||
| 86 | The Royce Funds 2012 Annual Report to Shareholders | THE ACCOMPANYING NOTES ARE AN INTEGRAL PART OF THESE FINANCIAL STATEMENTS. |
| December 31, 2012 |
| SHARES | VALUE | |||||
| Turkey (continued) | ||||||
Mardin Cimento Sanayii | 60,000 | $ | 179,614 | |||
| Total (Cost $384,552) | 307,606 | |||||
| United Kingdom – 9.9% | ||||||
Ashmore Group | 55,000 | 318,027 | ||||
Clinigen Group 2 | 80,000 | 277,488 | ||||
Domino Printing Sciences | 12,000 | 113,957 | ||||
EnQuest 2 | 80,000 | 159,634 | ||||
Hikma Pharmaceuticals | 10,000 | 125,152 | ||||
Hochschild Mining | 32,500 | 252,527 | ||||
† Homeserve | 50,000 | 188,766 | ||||
Jupiter Fund Management | 50,000 | 232,069 | ||||
† Oxford Instruments | 9,000 | 210,446 | ||||
Rotork | 3,500 | 145,149 | ||||
Severfield-Rowen | 100,000 | 156,884 | ||||
Spirax-Sarco Engineering | 6,000 | 225,582 | ||||
Victrex | 8,000 | 215,904 | ||||
| Total (Cost $2,139,442) | 2,621,585 | |||||
| TOTAL COMMON STOCKS | ||||||
(Cost $23,344,800) | 25,601,074 | |||||
| REPURCHASE AGREEMENT – 3.9% | ||||||
| Fixed Income Clearing Corporation, | ||||||
0.10% dated 12/31/12, due 1/2/13, | ||||||
maturity value $1,037,006 (collateralized | ||||||
by obligations of various U.S. Government | ||||||
Agencies, 0.75% due 8/15/13, valued at $1,061,924) | ||||||
(Cost $1,037,000) | 1,037,000 | |||||
| TOTAL INVESTMENTS – 101.0% | ||||||
(Cost $24,381,800) | 26,638,074 | |||||
| LIABILITIES LESS CASH | ||||||
AND OTHER ASSETS – (1.0)% | (267,188 | ) | ||||
| NET ASSETS – 100.0% | $ | 26,370,886 | ||||
| THE ACCOMPANYING NOTES ARE AN INTEGRAL PART OF THESE FINANCIAL STATEMENTS. | The Royce Funds 2012 Annual Report to Shareholders | 87 |
Statements of Assets and Liabilities
| Royce | Royce | Royce | Royce | |||||||||||||
| Pennsylvania | Micro-Cap | Premier | Low-Priced | |||||||||||||
| Mutual Fund | Fund | Fund | Stock Fund | |||||||||||||
| ASSETS: | ||||||||||||||||
| Investments at value (including collateral on loaned securities) | ||||||||||||||||
Non-Affiliated Companies | $ | 5,684,329,882 | $ | 932,236,358 | $ | 4,328,282,053 | $ | 2,853,360,682 | ||||||||
Affiliated Companies | 247,551,577 | 43,241,713 | 2,286,709,777 | 242,570,854 | ||||||||||||
| Repurchase agreements (at cost and value) | 75,946,000 | 13,427,000 | 272,862,000 | 55,591,000 | ||||||||||||
| Cash and foreign currency | 2,476,748 | 261,332 | 375 | 6,164,946 | ||||||||||||
| Receivable for investments sold | 10,400,143 | 9,456,984 | 8,918,567 | 14,632,263 | ||||||||||||
| Receivable for capital shares sold | 10,986,615 | 1,869,230 | 10,906,822 | 2,339,524 | ||||||||||||
| Receivable for dividends and interest | 1,837,626 | 594,355 | 4,159,422 | 1,632,284 | ||||||||||||
| Prepaid expenses and other assets | 1,886,661 | 3,367 | 20,415 | 10,804 | ||||||||||||
Total Assets | 6,035,415,252 | 1,001,090,339 | 6,911,859,431 | 3,176,302,357 | ||||||||||||
| LIABILITIES: | ||||||||||||||||
| Payable for collateral on loaned securities | 102,721,409 | 22,690,458 | 198,869,651 | 108,541,564 | ||||||||||||
| Payable for investments purchased | 15,444,167 | 47,493 | 3,119,594 | 598,280 | ||||||||||||
| Payable for capital shares redeemed | 19,574,674 | 5,868,062 | 12,726,015 | 24,967,825 | ||||||||||||
| Payable for investment advisory fees | 3,709,873 | 1,083,578 | 5,317,652 | 2,945,980 | ||||||||||||
| Accrued expenses | 2,832,696 | 708,968 | 3,054,351 | 2,084,529 | ||||||||||||
Total Liabilities | 144,282,819 | 30,398,559 | 223,087,263 | 139,138,178 | ||||||||||||
Net Assets | $ | 5,891,132,433 | $ | 970,691,780 | $ | 6,688,772,168 | $ | 3,037,164,179 | ||||||||
| ANALYSIS OF NET ASSETS: | ||||||||||||||||
| Paid-in capital | $ | 4,662,010,778 | $ | 868,365,176 | $ | 4,761,716,817 | $ | 2,707,468,034 | ||||||||
| Undistributed net investment income (loss) | (3,692,596 | ) | (4,217,174 | ) | 8,060,497 | (38,478,936 | ) | |||||||||
Accumulated net realized gain (loss) on investments and foreign currency | 14,909,201 | (8,753,853 | ) | 4,338,213 | (74,008,621 | ) | ||||||||||
Net unrealized appreciation (depreciation) on investments and foreign currency | 1,217,905,050 | 115,297,631 | 1,914,656,641 | 442,183,702 | ||||||||||||
Net Assets | $ | 5,891,132,433 | $ | 970,691,780 | $ | 6,688,772,168 | $ | 3,037,164,179 | ||||||||
Investment Class | $ | 4,232,988,403 | $ | 740,364,176 | $ | 4,629,271,679 | $ | 255,335,356 | ||||||||
Service Class | 473,624,238 | 109,456,840 | 560,552,660 | 1,800,088,588 | ||||||||||||
Consultant Class | 654,642,363 | 120,870,764 | 60,568,592 | |||||||||||||
Institutional Class | 488,051,510 | 866,276,672 | 969,664,396 | |||||||||||||
W Class | 533,762,875 | |||||||||||||||
R Class | 32,977,258 | 28,632,608 | 5,822,587 | |||||||||||||
K Class | 8,848,661 | 9,707,082 | 6,253,252 | |||||||||||||
| SHARES OUTSTANDING (unlimited number of $.001 par value): | ||||||||||||||||
Investment Class | 368,096,371 | 50,101,827 | 241,582,436 | 18,466,124 | ||||||||||||
Service Class | 41,159,295 | 7,491,622 | 29,666,884 | 130,053,971 | ||||||||||||
Consultant Class | 63,610,249 | 9,243,422 | 3,490,034 | |||||||||||||
Institutional Class | 42,377,696 | 44,892,976 | 70,060,355 | |||||||||||||
W Class | 27,804,797 | |||||||||||||||
R Class | 2,938,346 | 1,538,727 | 428,781 | |||||||||||||
K Class | 859,851 | 1,185,299 | 791,715 | |||||||||||||
| NET ASSET VALUES (Net Assets ÷ Shares Outstanding): | ||||||||||||||||
Investment Class 1 | $ | 11.50 | $ | 14.78 | $ | 19.16 | $ | 13.83 | ||||||||
Service Class 1 | 11.51 | 14.61 | 18.89 | 13.84 | ||||||||||||
Consultant Class 2 | 10.29 | 13.08 | 17.35 | |||||||||||||
Institutional Class 3 | 11.52 | 19.30 | 13.84 | |||||||||||||
W Class 3 | 19.20 | |||||||||||||||
R Class 3 | 11.22 | 18.61 | 13.58 | |||||||||||||
K Class 3 | 10.29 | 8.19 | 7.90 | |||||||||||||
Investments at identified cost | $ | 4,713,969,946 | $ | 860,180,080 | $ | 4,700,312,669 | $ | 2,653,757,063 | ||||||||
Market value of loaned securities | 102,376,530 | 21,984,876 | 199,828,946 | 108,184,579 | ||||||||||||
| 1 | Offering and redemption price per share; shares held less than 180 days may be subject to a 1% redemption fee, payable to the Fund. | |
| 2 | Offering and redemption price per share; shares held less than 365 days may be subject to a 1% contingent deferred sales charge, payable to Royce Fund Services, Inc. | |
| 3 | Offering and redemption price per share. |
| 88 | The Royce Funds 2012 Annual Report to Shareholders | THE ACCOMPANYING NOTES ARE AN INTEGRAL PART OF THESE FINANCIAL STATEMENTS. |
December 31, 2012 |
| Royce | Royce | Royce | Royce | |||||||||||||
| Total Return | Heritage | Opportunity | Special Equity | |||||||||||||
| Fund | Fund | Fund | Fund | |||||||||||||
| ASSETS: | ||||||||||||||||
| Investments at value (including collateral on loaned securities) | ||||||||||||||||
Non-Affiliated Companies | $ | 4,304,467,939 | $ | 261,737,577 | $ | 1,753,316,297 | $ | 1,391,489,807 | ||||||||
Affiliated Companies | 67,474,163 | – | 45,478,758 | 1,225,835,879 | ||||||||||||
| Repurchase agreements (at cost and value) | 108,998,000 | 9,538,000 | 124,329,000 | 310,976,000 | ||||||||||||
| Cash and foreign currency | 1,732,231 | 78,415 | 857 | 751 | ||||||||||||
| Receivable for investments sold | 3,071,570 | 1,816,633 | 3,361,116 | 5,068,196 | ||||||||||||
| Receivable for capital shares sold | 7,835,531 | 186,797 | 5,428,866 | 8,858,553 | ||||||||||||
| Receivable for dividends and interest | 4,269,734 | 99,905 | 310,235 | 267,116 | ||||||||||||
| Prepaid expenses and other assets | 13,445 | 802 | 5,174 | 1,315 | ||||||||||||
Total Assets | 4,497,862,613 | 273,458,129 | 1,932,230,303 | 2,942,497,617 | ||||||||||||
| LIABILITIES: | ||||||||||||||||
| Payable for collateral on loaned securities | 43,379,953 | 1,522,584 | 77,870,030 | 18,600 | ||||||||||||
| Payable for investments purchased | 4,373,224 | 1,621,757 | 2,132,371 | 3,434,712 | ||||||||||||
| Payable for capital shares redeemed | 11,671,635 | 568,344 | 6,246,046 | 7,322,314 | ||||||||||||
| Payable for investment advisory fees | 3,624,161 | 224,134 | 1,507,537 | 2,405,103 | ||||||||||||
| Accrued expenses | 2,142,563 | 216,891 | 608,125 | 1,168,242 | ||||||||||||
Total Liabilities | 65,191,536 | 4,153,710 | 88,364,109 | 14,348,971 | ||||||||||||
Net Assets | $ | 4,432,671,077 | $ | 269,304,419 | $ | 1,843,866,194 | $ | 2,928,148,646 | ||||||||
| ANALYSIS OF NET ASSETS: | ||||||||||||||||
| Paid-in capital | $ | 3,146,358,767 | $ | 214,703,991 | $ | 1,707,621,253 | $ | 2,406,711,049 | ||||||||
| Undistributed net investment income (loss) | (6,473,757 | ) | (105,508 | ) | (718,346 | ) | 104,734 | |||||||||
Accumulated net realized gain (loss) on investments and foreign currency | 78,661,527 | 2,521,459 | (1,833,270 | ) | 15,273,851 | |||||||||||
Net unrealized appreciation (depreciation) on investments and foreign currency | 1,214,124,540 | 52,184,477 | 138,796,557 | 506,059,012 | ||||||||||||
Net Assets | $ | 4,432,671,077 | $ | 269,304,419 | $ | 1,843,866,194 | $ | 2,928,148,646 | ||||||||
Investment Class | $ | 3,044,664,238 | $ | 40,374,598 | $ | 921,473,330 | $ | 2,048,090,381 | ||||||||
Service Class | 264,528,295 | 203,111,982 | 205,083,948 | 250,915,307 | ||||||||||||
Consultant Class | 331,116,543 | 13,908,728 | 11,930,305 | 57,755,241 | ||||||||||||
Institutional Class | 408,550,567 | 689,938,919 | 571,387,717 | |||||||||||||
W Class | 171,603,164 | |||||||||||||||
R Class | 48,796,614 | 4,832,448 | 6,612,003 | |||||||||||||
K Class | 163,411,656 | 7,076,663 | 8,827,689 | |||||||||||||
| SHARES OUTSTANDING (unlimited number of $.001 par value): | ||||||||||||||||
Investment Class | 223,381,106 | 2,787,864 | 77,099,197 | 96,918,791 | ||||||||||||
Service Class | 19,276,248 | 14,057,885 | 17,750,420 | 11,879,632 | ||||||||||||
Consultant Class | 23,972,264 | 1,190,935 | 1,083,254 | 2,859,572 | ||||||||||||
Institutional Class | 30,143,814 | 57,214,742 | 27,182,279 | |||||||||||||
W Class | 12,602,290 | |||||||||||||||
R Class | 3,530,853 | 444,829 | 577,106 | |||||||||||||
K Class | 15,525,637 | 649,510 | 825,360 | |||||||||||||
| NET ASSET VALUES (Net Assets ÷ Shares Outstanding): | ||||||||||||||||
Investment Class 1 | $ | 13.63 | $ | 14.48 | $ | 11.95 | $ | 21.13 | ||||||||
Service Class 1 | 13.72 | 14.45 | 11.55 | 21.12 | ||||||||||||
Consultant Class 2 | 13.81 | 11.68 | 11.01 | 20.20 | ||||||||||||
Institutional Class 3 | 13.55 | 12.06 | 21.02 | |||||||||||||
W Class 3 | 13.62 | |||||||||||||||
R Class 3 | 13.82 | 10.86 | 11.46 | |||||||||||||
K Class 3 | 10.53 | 10.90 | 10.70 | |||||||||||||
Investments at identified cost | $ | 3,157,814,751 | $ | 209,553,763 | $ | 1,659,998,306 | $ | 2,111,266,675 | ||||||||
Market value of loaned securities | 43,860,136 | 1,508,714 | 77,164,084 | 18,337 | ||||||||||||
| 1 | Offering and redemption price per share; shares held less than 180 days may be subject to a 1% redemption fee, payable to the Fund. | |
| 2 | Offering and redemption price per share; shares held less than 365 days may be subject to a 1% contingent deferred sales charge, payable to Royce Fund Services, Inc. | |
| 3 | Offering and redemption price per share. |
| THE ACCOMPANYING NOTES ARE AN INTEGRAL PART OF THESE FINANCIAL STATEMENTS. | The Royce Funds 2012 Annual Report to Shareholders | 89 |
Statements of Assets and Liabilities
| Royce | Royce | Royce | ||||||||||
| Value | Value Plus | 100 | ||||||||||
| Fund | Fund | Fund | ||||||||||
| ASSETS: | ||||||||||||
| Investments at value (including collateral on loaned securities) | ||||||||||||
Non-Affiliated Companies | $ | 1,335,838,748 | $ | 1,509,489,185 | $ | 292,198,974 | ||||||
Affiliated Companies | – | 25,273,302 | – | |||||||||
| Repurchase agreements (at cost and value) | 18,001,000 | 6,710,000 | 8,356,000 | |||||||||
| Cash and foreign currency | 472 | 198 | 205,407 | |||||||||
| Receivable for investments sold | 6,017,295 | 10,630,874 | – | |||||||||
| Receivable for capital shares sold | 1,338,572 | 1,236,367 | 323,981 | |||||||||
| Receivable for dividends and interest | 414,536 | 637,642 | 163,690 | |||||||||
| Prepaid expenses and other assets | 4,401 | 5,129 | 1,061 | |||||||||
Total Assets | 1,361,615,024 | 1,553,982,697 | 301,249,113 | |||||||||
| LIABILITIES: | ||||||||||||
| Payable for collateral on loaned securities | 21,218,911 | 113,429,210 | 3,483,733 | |||||||||
| Payable for investments purchased | 2,720,470 | 142,052 | 383,150 | |||||||||
| Payable for capital shares redeemed | 5,630,369 | 5,457,328 | 1,710,415 | |||||||||
| Payable for investment advisory fees | 1,127,310 | 1,238,023 | 249,751 | |||||||||
| Accrued expenses | 918,043 | 1,068,373 | 244,658 | |||||||||
Total Liabilities | 31,615,103 | 121,334,986 | 6,071,707 | |||||||||
Net Assets | $ | 1,329,999,921 | $ | 1,432,647,711 | $ | 295,177,406 | ||||||
| ANALYSIS OF NET ASSETS: | ||||||||||||
| Paid-in capital | $ | 1,229,271,612 | $ | 1,319,275,389 | $ | 236,965,980 | ||||||
| Undistributed net investment income (loss) | 1,227,883 | (4,144,731 | ) | 528,222 | ||||||||
Accumulated net realized gain (loss) on investments and foreign currency | (5,082,243 | ) | (91,007,998 | ) | 2,354,601 | |||||||
| Net unrealized appreciation (depreciation) on investments and foreign currency | 104,582,669 | 208,525,051 | 55,328,603 | |||||||||
Net Assets | $ | 1,329,999,921 | $ | 1,432,647,711 | $ | 295,177,406 | ||||||
Investment Class | $ | 206,316,113 | $ | 228,016,008 | $ | 68,395,142 | ||||||
Service Class | 831,673,413 | 966,735,154 | 220,673,838 | |||||||||
Consultant Class | 33,479,710 | 19,618,292 | ||||||||||
Institutional Class | 202,643,159 | 216,571,562 | ||||||||||
R Class | 37,678,704 | 1,221,280 | 2,554,391 | |||||||||
K Class | 18,208,822 | 485,415 | 3,554,035 | |||||||||
| SHARES OUTSTANDING (unlimited number of $.001 par value): | ||||||||||||
Investment Class | 18,143,373 | 16,405,112 | 7,724,320 | |||||||||
Service Class | 73,310,127 | 69,900,515 | 25,052,891 | |||||||||
Consultant Class | 3,098,005 | 1,481,385 | ||||||||||
Institutional Class | 17,809,323 | 15,539,198 | ||||||||||
R Class | 3,375,963 | 90,424 | 235,546 | |||||||||
K Class | 1,991,724 | 48,060 | 324,540 | |||||||||
| NET ASSET VALUES (Net Assets ÷ Shares Outstanding): | ||||||||||||
Investment Class 1 | $ | 11.37 | $ | 13.90 | $ | 8.85 | ||||||
Service Class 1 | 11.34 | 13.83 | 8.81 | |||||||||
Consultant Class 2 | 10.81 | 13.24 | ||||||||||
Institutional Class 3 | 11.38 | 13.94 | ||||||||||
R Class 3 | 11.16 | 13.51 | 10.84 | |||||||||
K Class 3 | 9.14 | 10.10 | 10.95 | |||||||||
Investments at identified cost | $ | 1,231,257,930 | $ | 1,326,236,290 | $ | 236,869,600 | ||||||
Market value of loaned securities | 21,846,762 | 112,689,610 | 3,494,152 | |||||||||
| 1 | Offering and redemption price per share; shares held less than 180 days may be subject to a 1% redemption fee, payable to the Fund. | |
| 2 | Offering and redemption price per share; shares held less than 365 days may be subject to a 1% contingent deferred sales charge, payable to Royce Fund Services, Inc. | |
| 3 | Offering and redemption price per share. |
| 90 | The Royce Funds 2012 Annual Report to Shareholders | THE ACCOMPANYING NOTES ARE AN INTEGRAL PART OF THESE FINANCIAL STATEMENTS. |
December 31, 2012 |
| Royce | Royce | Royce | ||||||||||
| Dividend | Global | International Smaller- | ||||||||||
| Value Fund | Value Fund | Companies Fund | ||||||||||
| ASSETS: | ||||||||||||
| Investments at value (including collateral on loaned securities) | ||||||||||||
Non-Affiliated Companies | $ | 386,656,613 | $ | 291,092,724 | $ | 25,601,074 | ||||||
| Repurchase agreements (at cost and value) | 14,092,000 | 12,739,000 | 1,037,000 | |||||||||
| Cash and foreign currency | 142,961 | 145,330 | 31,291 | |||||||||
| Receivable for investments sold | 2,461,219 | 514,124 | – | |||||||||
| Receivable for capital shares sold | 1,957,217 | 1,205,632 | 207,165 | |||||||||
| Receivable for dividends and interest | 231,030 | 406,223 | 54,842 | |||||||||
| Prepaid expenses and other assets | 313 | 880 | 10 | |||||||||
Total Assets | 405,541,353 | 306,103,913 | 26,931,382 | |||||||||
| LIABILITIES: | ||||||||||||
| Payable for collateral on loaned securities | 2,015,454 | 3,993,332 | – | |||||||||
| Payable for investments purchased | 7,151,962 | 145,149 | 299,240 | |||||||||
| Payable for capital shares redeemed | 1,097,468 | 1,313,133 | 195,849 | |||||||||
| Payable for investment advisory fees | 327,657 | 317,672 | 20,379 | |||||||||
| Accrued expenses | 225,942 | 237,482 | 45,028 | |||||||||
Total Liabilities | 10,818,483 | 6,006,768 | 560,496 | |||||||||
Net Assets | $ | 394,722,870 | $ | 300,097,145 | $ | 26,370,886 | ||||||
| ANALYSIS OF NET ASSETS: | ||||||||||||
| Paid-in capital | $ | 348,918,344 | $ | 375,295,547 | $ | 25,106,915 | ||||||
| Undistributed net investment income (loss) | 1,527,478 | (26,269 | ) | (42,855 | ) | |||||||
Accumulated net realized gain (loss) on investments and foreign currency | 4,416,478 | (47,187,129 | ) | (949,298 | ) | |||||||
| Net unrealized appreciation (depreciation) on investments and foreign currency | 39,860,570 | (27,985,004 | ) | 2,256,124 | ||||||||
Net Assets | $ | 394,722,870 | $ | 300,097,145 | $ | 26,370,886 | ||||||
Investment Class | $ | 118,820,274 | $ | 178,319,150 | ||||||||
Service Class | 252,442,298 | 98,273,914 | $ | 26,370,886 | ||||||||
Consultant Class | 23,382,796 | |||||||||||
Institutional Class | 23,460,298 | |||||||||||
R Class | 79,644 | |||||||||||
K Class | 41,641 | |||||||||||
| SHARES OUTSTANDING (unlimited number of $.001 par value): | ||||||||||||
Investment Class | 16,294,112 | 13,814,389 | ||||||||||
Service Class | 34,360,210 | 7,572,454 | 2,337,465 | |||||||||
Consultant Class | 1,814,824 | |||||||||||
Institutional Class | 3,220,602 | |||||||||||
R Class | 8,218 | |||||||||||
K Class | 4,296 | |||||||||||
| NET ASSET VALUES (Net Assets ÷ Shares Outstanding): | ||||||||||||
Investment Class 1 | $ | 7.29 | $ | 12.91 | ||||||||
Service Class 1 | 7.35 | 12.98 | $ | 11.28 | ||||||||
Consultant Class 2 | 12.88 | |||||||||||
Institutional Class 3 | 7.28 | |||||||||||
R Class 3 | 9.69 | |||||||||||
K Class 3 | 9.69 | |||||||||||
Investments at identified cost | $ | 346,795,923 | $ | 319,067,832 | $ | 23,344,800 | ||||||
Market value of loaned securities | 1,949,027 | 3,879,808 | ||||||||||
| 1 | Offering and redemption price per share; shares held less than 180 days may be subject to a 1% redemption fee (Royce Dividend Value Fund), or a 2% redemption fee, payable to the Fund. | |
| 2 | Offering and redemption price per share; shares held less than 365 days may be subject to a 1% contingent deferred sales charge, payable to Royce Fund Services, Inc. | |
| 3 | Offering and redemption price per share. |
| THE ACCOMPANYING NOTES ARE AN INTEGRAL PART OF THESE FINANCIAL STATEMENTS. | The Royce Funds 2012 Annual Report to Shareholders | 91 |
| Royce Pennsylvania | ||||||||||||||||||||||||||||||
| Mutual Fund | Royce Micro-Cap Fund | Royce Premier Fund | ||||||||||||||||||||||||||||
| Year ended | Year ended | Year ended | Year ended | Year ended | Year ended | |||||||||||||||||||||||||
| 12/31/12 | 12/31/11 | 12/31/12 | 12/31/11 | 12/31/12 | 12/31/11 | |||||||||||||||||||||||||
INVESTMENT OPERATIONS: | ||||||||||||||||||||||||||||||
Net investment income (loss) | $ | 63,191,199 | $ | (1,736,062 | ) | $ | 1,716,521 | $ | (8,590,607 | ) | $ | 80,158,458 | $ | (8,208,621 | ) | |||||||||||||||
Net realized gain (loss) on investments and foreign currency | 378,839,758 | 227,496,225 | 42,923,758 | 85,770,324 | 279,919,593 | 684,906,171 | ||||||||||||||||||||||||
Net change in unrealized appreciation (depreciation) on investments and foreign currency | 334,772,475 | (504,275,913 | ) | 35,269,614 | (256,605,573 | ) | 365,993,509 | (761,470,308 | ) | |||||||||||||||||||||
Net increase (decrease) in net assets from investment operations | 776,803,432 | (278,515,750 | ) | 79,909,893 | (179,425,856 | ) | 726,071,560 | (84,772,758 | ) | |||||||||||||||||||||
DISTRIBUTIONS: | ||||||||||||||||||||||||||||||
Net investment income | ||||||||||||||||||||||||||||||
Investment Class | (54,629,386 | ) | (7,553,630 | ) | (251,657 | ) | (12,205,302 | ) | (56,492,020 | ) | (12,153,429 | ) | ||||||||||||||||||
Service Class | (3,420,121 | ) | – | – | (1,545,545 | ) | (3,868,028 | ) | (752,969 | ) | ||||||||||||||||||||
Consultant Class | (921,895 | ) | – | – | (521,659 | ) | (58,930 | ) | – | |||||||||||||||||||||
Institutional Class | (7,313,426 | ) | – | (12,152,037 | ) | (3,198,893 | ) | |||||||||||||||||||||||
W Class | (7,061,577 | ) | (2,087,838 | ) | ||||||||||||||||||||||||||
R Class | (151,956 | ) | – | (116,893 | ) | (49,192 | ) | |||||||||||||||||||||||
K Class | (58,794 | ) | – | (211,170 | ) | (54,734 | ) | |||||||||||||||||||||||
Net realized gain on investments and foreign currency | ||||||||||||||||||||||||||||||
Investment Class | (228,773,446 | ) | (147,840,546 | ) | (44,059,505 | ) | (42,238,594 | ) | (277,063,842 | ) | (362,055,233 | ) | ||||||||||||||||||
Service Class | (25,136,819 | ) | (14,504,009 | ) | (7,356,916 | ) | (5,775,719 | ) | (34,158,623 | ) | (50,755,242 | ) | ||||||||||||||||||
Consultant Class | (39,332,146 | ) | (25,426,352 | ) | (7,779,887 | ) | (6,858,461 | ) | (3,996,638 | ) | (5,210,713 | ) | ||||||||||||||||||
Institutional Class | (25,463,721 | ) | (8,073,158 | ) | (51,201,959 | ) | (65,746,753 | ) | ||||||||||||||||||||||
W Class | (32,235,493 | ) | (44,761,892 | ) | ||||||||||||||||||||||||||
R Class | (1,791,694 | ) | (773,990 | ) | (1,746,454 | ) | (1,872,119 | ) | ||||||||||||||||||||||
K Class | (502,561 | ) | (218,971 | ) | (1,257,434 | ) | (1,393,122 | ) | ||||||||||||||||||||||
| Total distributions | (387,495,965 | ) | (204,390,656 | ) | (59,447,965 | ) | (69,145,280 | ) | (481,621,098 | ) | (550,092,129 | ) | ||||||||||||||||||
| CAPITAL SHARE TRANSACTIONS: | ||||||||||||||||||||||||||||||
| Net capital share transactions | ||||||||||||||||||||||||||||||
Investment Class | (335,995,316 | ) | (103,999,144 | ) | (180,722,729 | ) | 11,342,816 | (81,178,362 | ) | (9,633,723 | ) | |||||||||||||||||||
Service Class | 38,274,164 | (4,630,665 | ) | (15,930,771 | ) | 9,291,180 | (91,558,488 | ) | 105,553,789 | |||||||||||||||||||||
Consultant Class | (52,892,588 | ) | (115,290,247 | ) | (14,554,956 | ) | (18,158,871 | ) | (1,059,390 | ) | (5,810,352 | ) | ||||||||||||||||||
Institutional Class | 232,958,907 | 258,340,306 | 25,599,256 | 197,239,074 | ||||||||||||||||||||||||||
W Class | (37,012,083 | ) | 182,723,037 | |||||||||||||||||||||||||||
R Class | 8,694,966 | 6,206,100 | 4,268,797 | 16,429,482 | ||||||||||||||||||||||||||
K Class | 2,702,838 | 2,401,452 | 1,447,345 | 6,908,558 | ||||||||||||||||||||||||||
| Shareholder redemption fees | ||||||||||||||||||||||||||||||
Investment Class | 159,022 | 249,468 | 29,714 | 37,257 | 151,679 | 276,230 | ||||||||||||||||||||||||
Service Class | 45,638 | 169,200 | 9,218 | 20,092 | 32,028 | 119,591 | ||||||||||||||||||||||||
Consultant Class | – | (948 | ) | – | (734 | ) | – | (25 | ) | |||||||||||||||||||||
R Class | – | (382 | ) | – | (385 | ) | ||||||||||||||||||||||||
K Class | – | (1,263 | ) | – | – | |||||||||||||||||||||||||
Net increase (decrease) in net assets from capital share transactions | (106,052,369 | ) | 43,443,877 | (211,169,524 | ) | 2,531,740 | (179,309,218 | ) | 493,805,276 | |||||||||||||||||||||
NET INCREASE (DECREASE) IN NET ASSETS | 283,255,098 | (439,462,529 | ) | (190,707,596 | ) | (246,039,396 | ) | 65,141,244 | (141,059,611 | ) | ||||||||||||||||||||
NET ASSETS: | ||||||||||||||||||||||||||||||
Beginning of year | 5,607,877,335 | 6,047,339,864 | 1,161,399,376 | 1,407,438,772 | 6,623,630,924 | 6,764,690,535 | ||||||||||||||||||||||||
End of year | $ | 5,891,132,433 | $ | 5,607,877,335 | $ | 970,691,780 | $ | 1,161,399,376 | $ | 6,688,772,168 | $ | 6,623,630,924 | ||||||||||||||||||
UNDISTRIBUTED NET INVESTMENT INCOME (LOSS) AT END OF YEAR | $ | (3,692,596 | ) | $ | (1,035,236 | ) | $ | (4,217,174 | ) | $ | (7,653,005 | ) | $ | 8,060,497 | $ | 7,500,301 | ||||||||||||||
| 92 | The Royce Funds 2012 Annual Report to Shareholders | THE ACCOMPANYING NOTES ARE AN INTEGRAL PART OF THESE FINANCIAL STATEMENTS. |
| Royce Low-Priced Stock Fund | Royce Total Return Fund | Royce Heritage Fund | ||||||||||||||||||||||||||||
| Year ended | Year ended | Year ended | Year ended | Year ended | Year ended | |||||||||||||||||||||||||
| 12/31/12 | 12/31/11 | 12/31/12 | 12/31/11 | 12/31/12 | 12/31/11 | |||||||||||||||||||||||||
| INVESTMENT OPERATIONS: | ||||||||||||||||||||||||||||||
Net investment income (loss) | $ | 24,690,528 | $ | (13,606,980 | ) | $ | 81,188,302 | $ | 48,152,272 | $ | 1,469,368 | $ | (316,386 | ) | ||||||||||||||||
Net realized gain (loss) on investments and foreign currency | 151,259,303 | 328,960,886 | 184,938,882 | 277,439,732 | 11,021,118 | 4,744,335 | ||||||||||||||||||||||||
Net change in unrealized appreciation (depreciation) on investments and foreign currency | (19,676,712 | ) | (1,002,287,882 | ) | 334,217,094 | (403,974,188 | ) | 23,058,809 | (34,193,708 | ) | ||||||||||||||||||||
Net increase (decrease) in net assets from investment operations | 156,273,119 | (686,933,976 | ) | 600,344,278 | (78,382,184 | ) | 35,549,295 | (29,765,759 | ) | |||||||||||||||||||||
| DISTRIBUTIONS: | ||||||||||||||||||||||||||||||
| Net investment income | ||||||||||||||||||||||||||||||
Investment Class | (4,662,575 | ) | (2,622,938 | ) | (53,669,916 | ) | (30,675,794 | ) | (349,590 | ) | (82,990 | ) | ||||||||||||||||||
Service Class | (21,186,960 | ) | (15,929,733 | ) | (3,010,686 | ) | (1,488,830 | ) | (611,643 | ) | (408,937 | ) | ||||||||||||||||||
Consultant Class | (359,919 | ) | – | – | – | |||||||||||||||||||||||||
Institutional Class | (17,457,085 | ) | (9,414,641 | ) | (8,049,250 | ) | (4,368,776 | ) | ||||||||||||||||||||||
W Class | (2,959,883 | ) | (1,201,279 | ) | ||||||||||||||||||||||||||
R Class | (42,427 | ) | (61,040 | ) | (267,095 | ) | (96,644 | ) | (1,807 | ) | (12,269 | ) | ||||||||||||||||||
K Class | (134,605 | ) | (122,723 | ) | (2,164,963 | ) | (719,572 | ) | (41,464 | ) | (32,521 | ) | ||||||||||||||||||
Net realized gain on investments and foreign currency | ||||||||||||||||||||||||||||||
Investment Class | (17,157,473 | ) | (21,174,775 | ) | (133,827,796 | ) | (35,538,995 | ) | (918,362 | ) | (908,574 | ) | ||||||||||||||||||
Service Class | (116,022,410 | ) | (197,159,302 | ) | (11,891,556 | ) | (3,245,517 | ) | (5,058,972 | ) | (9,538,084 | ) | ||||||||||||||||||
Consultant Class | (14,383,518 | ) | (3,759,667 | ) | (427,725 | ) | (743,095 | ) | ||||||||||||||||||||||
Institutional Class | (59,427,238 | ) | (74,891,179 | ) | (17,842,030 | ) | (4,472,089 | ) | ||||||||||||||||||||||
W Class | (7,371,475 | ) | (1,506,553 | ) | ||||||||||||||||||||||||||
R Class | (371,144 | ) | (572,840 | ) | (2,086,921 | ) | (385,835 | ) | (155,993 | ) | (200,554 | ) | ||||||||||||||||||
K Class | (647,596 | ) | (1,048,801 | ) | (9,380,378 | ) | (2,596,783 | ) | (230,237 | ) | (436,155 | ) | ||||||||||||||||||
| Total distributions | (237,109,513 | ) | (322,997,972 | ) | (267,265,386 | ) | (90,056,334 | ) | (7,795,793 | ) | (12,363,179 | ) | ||||||||||||||||||
| CAPITAL SHARE TRANSACTIONS: | ||||||||||||||||||||||||||||||
| Net capital share transactions | ||||||||||||||||||||||||||||||
Investment Class | (10,702,232 | ) | 200,509,136 | (292,787,502 | ) | (336,209,156 | ) | 16,574,511 | 10,893,188 | |||||||||||||||||||||
Service Class | (652,700,848 | ) | (303,687,732 | ) | (40,417,979 | ) | (1,872,348 | ) | (38,109,460 | ) | 9,640,655 | |||||||||||||||||||
Consultant Class | (23,892,297 | ) | (50,011,884 | ) | (1,264,043 | ) | 3,645,699 | |||||||||||||||||||||||
Institutional Class | 11,456,233 | 183,689,075 | (9,567,656 | ) | 52,023,722 | |||||||||||||||||||||||||
W Class | 29,048,933 | 63,365,878 | ||||||||||||||||||||||||||||
R Class | (1,360,956 | ) | 5,966,770 | 11,084,404 | 15,625,875 | 288,324 | 2,807,392 | |||||||||||||||||||||||
K Class | (1,987,623 | ) | 6,633,649 | (26,785,638 | ) | 82,088,857 | (1,534,883 | ) | 3,622,168 | |||||||||||||||||||||
| Shareholder redemption fees | ||||||||||||||||||||||||||||||
Investment Class | 8,999 | 52,306 | 99,541 | 176,798 | 9,332 | 10,466 | ||||||||||||||||||||||||
Service Class | 89,425 | 313,978 | 16,129 | 71,858 | 11,091 | 26,956 | ||||||||||||||||||||||||
Consultant Class | – | (1,669 | ) | – | – | |||||||||||||||||||||||||
R Class | – | – | – | – | – | (55 | ) | |||||||||||||||||||||||
K Class | – | (61 | ) | – | – | – | – | |||||||||||||||||||||||
Net increase (decrease) in net assets from capital share transactions | (655,197,002 | ) | 93,477,121 | (353,202,065 | ) | (174,742,069 | ) | (24,025,128 | ) | 30,646,469 | ||||||||||||||||||||
NET INCREASE (DECREASE) IN NET ASSETS | (736,033,396 | ) | (916,454,827 | ) | (20,123,173 | ) | (343,180,587 | ) | 3,728,374 | (11,482,469 | ) | |||||||||||||||||||
| NET ASSETS: | ||||||||||||||||||||||||||||||
Beginning of year | 3,773,197,575 | 4,689,652,402 | 4,452,794,250 | 4,795,974,837 | 265,576,045 | 277,058,514 | ||||||||||||||||||||||||
End of year | $ | 3,037,164,179 | $ | 3,773,197,575 | $ | 4,432,671,077 | $ | 4,452,794,250 | $ | 269,304,419 | $ | 265,576,045 | ||||||||||||||||||
UNDISTRIBUTED NET INVESTMENT INCOME (LOSS) AT END OF YEAR | $ | (38,478,936 | ) | $ | (27,674,403 | ) | $ | (6,473,757 | ) | $ | (2,401,765 | ) | $ | (105,508 | ) | $ | (782,419 | ) | ||||||||||||
| THE ACCOMPANYING NOTES ARE AN INTEGRAL PART OF THESE FINANCIAL STATEMENTS. | The Royce Funds 2012 Annual Report to Shareholders | 93 |
| Royce Opportunity Fund | Royce Special Equity Fund | Royce Value Fund | ||||||||||||||||||||||||||||
| Year ended | Year ended | Year ended | Year ended | Year ended | Year ended | |||||||||||||||||||||||||
| 12/31/12 | 12/31/11 | 12/31/12 | 12/31/11 | 12/31/12 | 12/31/11 | |||||||||||||||||||||||||
| INVESTMENT OPERATIONS: | ||||||||||||||||||||||||||||||
| Net investment income (loss) | $ | 102,039 | $ | (7,692,995 | ) | $ | 60,607,144 | $ | 5,246,783 | $ | 14,771,880 | $ | (3,005,590 | ) | ||||||||||||||||
Net realized gain (loss) on investments and foreign currency | 109,724,848 | 200,833,727 | 141,201,929 | 133,073,710 | 52,407,833 | 183,939,122 | ||||||||||||||||||||||||
Net change in unrealized appreciation (depreciation) on investments and foreign currency | 244,768,732 | (466,957,664 | ) | 181,861,687 | (153,511,418 | ) | 61,602,303 | (340,931,439 | ) | |||||||||||||||||||||
Net increase (decrease) in net assets from investment operations | 354,595,619 | (273,816,932 | ) | 383,670,760 | (15,190,925 | ) | 128,782,016 | (159,997,907 | ) | |||||||||||||||||||||
| DISTRIBUTIONS: | ||||||||||||||||||||||||||||||
| Net investment income | ||||||||||||||||||||||||||||||
Investment Class | – | – | (42,635,374 | ) | (7,506,674 | ) | (2,519,414 | ) | (1,311,276 | ) | ||||||||||||||||||||
Service Class | – | – | (4,207,327 | ) | (533,230 | ) | (7,612,610 | ) | (2,106,179 | ) | ||||||||||||||||||||
Consultant Class | – | – | (638,032 | ) | – | (90,458 | ) | – | ||||||||||||||||||||||
Institutional Class | – | – | (13,115,881 | ) | (2,738,810 | ) | (2,720,021 | ) | (1,186,806 | ) | ||||||||||||||||||||
R Class | – | – | (226,100 | ) | (113,727 | ) | ||||||||||||||||||||||||
K Class | – | – | (231,059 | ) | (63,344 | ) | ||||||||||||||||||||||||
Net realized gain on investments and foreign currency | ||||||||||||||||||||||||||||||
Investment Class | (50,051,234 | ) | (16,007,095 | ) | (100,542,375 | ) | (86,786,033 | ) | (9,221,480 | ) | (14,160,961 | ) | ||||||||||||||||||
Service Class | (9,506,373 | ) | (3,015,764 | ) | (12,209,477 | ) | (11,156,408 | ) | (37,662,892 | ) | (71,209,823 | ) | ||||||||||||||||||
Consultant Class | (699,843 | ) | (226,990 | ) | (2,985,183 | ) | (2,659,079 | ) | (1,611,685 | ) | (2,423,117 | ) | ||||||||||||||||||
Institutional Class | (36,267,105 | ) | (10,373,465 | ) | (27,981,290 | ) | (24,966,735 | ) | (8,879,772 | ) | (11,887,154 | ) | ||||||||||||||||||
R Class | (374,879 | ) | (58,426 | ) | (1,683,262 | ) | (2,190,124 | ) | ||||||||||||||||||||||
K Class | (504,189 | ) | (125,508 | ) | (1,016,272 | ) | (1,042,529 | ) | ||||||||||||||||||||||
| Total distributions | (97,403,623 | ) | (29,807,248 | ) | (204,314,939 | ) | (136,346,969 | ) | (73,475,025 | ) | (107,695,040 | ) | ||||||||||||||||||
| CAPITAL SHARE TRANSACTIONS: | ||||||||||||||||||||||||||||||
| Net capital share transactions | ||||||||||||||||||||||||||||||
Investment Class | (96,250,867 | ) | (128,372,272 | ) | 245,485,021 | 294,451,345 | (20,874,943 | ) | 147,753,479 | |||||||||||||||||||||
Service Class | 18,730,839 | (119,333,649 | ) | 19,208,306 | 68,539,674 | (288,914,041 | ) | (152,759,752 | ) | |||||||||||||||||||||
Consultant Class | (1,632,584 | ) | 1,059,226 | 3,989,935 | 14,957,245 | (3,805,405 | ) | 6,999,042 | ||||||||||||||||||||||
Institutional Class | 25,874,792 | (24,517,878 | ) | 54,304,122 | 66,765,812 | 4,907,087 | 438,275 | |||||||||||||||||||||||
R Class | 2,950,304 | 2,092,297 | 2,483,316 | 13,089,183 | ||||||||||||||||||||||||||
K Class | 1,362,780 | 1,293,607 | 3,867,457 | 3,612,310 | ||||||||||||||||||||||||||
| Shareholder redemption fees | ||||||||||||||||||||||||||||||
Investment Class | 34,806 | 79,778 | 131,211 | 249,340 | 11,705 | 110,138 | ||||||||||||||||||||||||
Service Class | 1,830 | 180,844 | 29,902 | 51,327 | 63,509 | 634,242 | ||||||||||||||||||||||||
K Class | – | (9 | ) | – | – | |||||||||||||||||||||||||
| Net increase (decrease) in net assets from capital share transactions | (48,928,100 | ) | (267,518,056 | ) | 323,148,497 | 445,014,743 | (302,261,315 | ) | 19,876,917 | |||||||||||||||||||||
NET INCREASE (DECREASE) IN NET ASSETS | 208,263,896 | (571,142,236 | ) | 502,504,318 | 293,476,849 | (246,954,324 | ) | (247,816,030 | ) | |||||||||||||||||||||
| NET ASSETS: | ||||||||||||||||||||||||||||||
Beginning of year | 1,635,602,298 | 2,206,744,534 | 2,425,644,328 | 2,132,167,479 | 1,576,954,245 | 1,824,770,275 | ||||||||||||||||||||||||
End of year | $ | 1,843,866,194 | $ | 1,635,602,298 | $ | 2,928,148,646 | $ | 2,425,644,328 | $ | 1,329,999,921 | $ | 1,576,954,245 | ||||||||||||||||||
UNDISTRIBUTED NET INVESTMENT INCOME (LOSS) AT END OF YEAR | $ | (718,346 | ) | $ | (585,048 | ) | $ | 104,734 | $ | 94,204 | $ | 1,227,883 | $ | (69,519 | ) | |||||||||||||||
| 94 | The Royce Funds 2012 Annual Report to Shareholders | THE ACCOMPANYING NOTES ARE AN INTEGRAL PART OF THESE FINANCIAL STATEMENTS. |
| Royce Value Plus Fund | Royce 100 Fund | Royce Dividend Value Fund | ||||||||||||||||||||||||||||
| Year ended | Year ended | Year ended | Year ended | Year ended | Year ended | |||||||||||||||||||||||||
| 12/31/12 | 12/31/11 | 12/31/12 | 12/31/11 | 12/31/12 | 12/31/11 | |||||||||||||||||||||||||
| INVESTMENT OPERATIONS: | ||||||||||||||||||||||||||||||
| Net investment income (loss) | $ | (4,512,013 | ) | $ | (17,942,015 | ) | $ | 3,820,129 | $ | (2,203,228 | ) | $ | 6,466,075 | $ | 2,332,072 | |||||||||||||||
Net realized gain (loss) on investments and foreign currency | 73,209,917 | 282,999,938 | 22,129,056 | 21,557,245 | 4,715,713 | 4,242,268 | ||||||||||||||||||||||||
Net change in unrealized appreciation (depreciation) on investments and foreign currency | 200,771,476 | (522,171,703 | ) | 10,234,695 | (53,701,837 | ) | 43,493,780 | (24,682,355 | ) | |||||||||||||||||||||
Net increase (decrease) in net assets from investment operations | 269,469,380 | (257,113,780 | ) | 36,183,880 | (34,347,820 | ) | 54,675,568 | (18,108,015 | ) | |||||||||||||||||||||
| DISTRIBUTIONS: | ||||||||||||||||||||||||||||||
| Net investment income | ||||||||||||||||||||||||||||||
Investment Class | – | (3,973,855 | ) | (1,109,858 | ) | (46,735 | ) | (1,908,107 | ) | (714,241 | ) | |||||||||||||||||||
Service Class | – | (9,654,977 | ) | (2,171,815 | ) | – | (2,958,083 | ) | (1,059,090 | ) | ||||||||||||||||||||
Consultant Class | – | – | ||||||||||||||||||||||||||||
Institutional Class | – | (3,466,339 | ) | (249,765 | ) | |||||||||||||||||||||||||
R Class | – | (8,226 | ) | – | – | |||||||||||||||||||||||||
K Class | – | – | (13,851 | ) | – | |||||||||||||||||||||||||
Net realized gain on investments and foreign currency | ||||||||||||||||||||||||||||||
Investment Class | – | – | (5,347,166 | ) | (3,108,241 | ) | (281,579 | ) | (1,223,501 | ) | ||||||||||||||||||||
Service Class | – | – | (17,649,123 | ) | (15,452,399 | ) | (594,951 | ) | (2,867,224 | ) | ||||||||||||||||||||
Consultant Class | – | – | ||||||||||||||||||||||||||||
Institutional Class | – | – | (55,684 | ) | ||||||||||||||||||||||||||
R Class | – | – | (157,770 | ) | (130,243 | ) | ||||||||||||||||||||||||
K Class | – | – | (235,061 | ) | (181,337 | ) | ||||||||||||||||||||||||
| Total distributions | – | (17,103,397 | ) | (26,684,644 | ) | (18,918,955 | ) | (6,048,169 | ) | (5,864,056 | ) | |||||||||||||||||||
| CAPITAL SHARE TRANSACTIONS: | ||||||||||||||||||||||||||||||
| Net capital share transactions | ||||||||||||||||||||||||||||||
Investment Class | (113,741,824 | ) | 33,159,380 | 4,430,476 | 5,131,162 | 18,217,648 | 57,157,873 | |||||||||||||||||||||||
Service Class | (637,273,254 | ) | (848,101,245 | ) | (98,413,720 | ) | (11,187,742 | ) | 19,094,095 | 100,621,245 | ||||||||||||||||||||
Consultant Class | (3,330,475 | ) | (7,468,096 | ) | ||||||||||||||||||||||||||
Institutional Class | (81,721,749 | ) | (121,895,301 | ) | 21,931,199 | |||||||||||||||||||||||||
R Class | (15,162 | ) | 281,374 | (1,037,720 | ) | 2,419,632 | ||||||||||||||||||||||||
K Class | (84,938 | ) | (1,181,200 | ) | (1,079,162 | ) | 2,100,132 | |||||||||||||||||||||||
| Shareholder redemption fees | ||||||||||||||||||||||||||||||
Investment Class | 5,789 | 84,677 | 3,283 | 21,461 | 19,184 | 17,078 | ||||||||||||||||||||||||
Service Class | 43,741 | 164,613 | 22,175 | 66,531 | 11,034 | 67,799 | ||||||||||||||||||||||||
Net increase (decrease) in net assets from capital share transactions | (836,117,872 | ) | (944,955,798 | ) | (96,074,668 | ) | (1,448,824 | ) | 59,273,160 | 157,863,995 | ||||||||||||||||||||
NET INCREASE (DECREASE) IN NET ASSETS | (566,648,492 | ) | (1,219,172,975 | ) | (86,575,432 | ) | (54,715,599 | ) | 107,900,559 | 133,891,924 | ||||||||||||||||||||
| NET ASSETS: | ||||||||||||||||||||||||||||||
Beginning of year | 1,999,296,203 | 3,218,469,178 | 381,752,838 | 436,468,437 | 286,822,311 | 152,930,387 | ||||||||||||||||||||||||
End of year | $ | 1,432,647,711 | $ | 1,999,296,203 | $ | 295,177,406 | $ | 381,752,838 | $ | 394,722,870 | $ | 286,822,311 | ||||||||||||||||||
UNDISTRIBUTED NET INVESTMENT INCOME (LOSS) AT END OF YEAR | $ | (4,144,731 | ) | $ | (4,839,927 | ) | $ | 528,222 | $ | – | $ | 1,527,478 | $ | 487,373 | ||||||||||||||||
| THE ACCOMPANYING NOTES ARE AN INTEGRAL PART OF THESE FINANCIAL STATEMENTS. | The Royce Funds 2012 Annual Report to Shareholders | 95 |
| Royce International Smaller- | ||||||||||||||||||||
| Royce Global Value Fund | Companies Fund | |||||||||||||||||||
| Year ended | Year ended | Year ended | Year ended | |||||||||||||||||
| 12/31/12 | 12/31/11 | 12/31/12 | 12/31/11 | |||||||||||||||||
| INVESTMENT OPERATIONS: | ||||||||||||||||||||
Net investment income (loss) | $ | 3,023,958 | $ | 2,363,099 | $ | 312,115 | $ | 186,087 | ||||||||||||
Net realized gain (loss) on investments and foreign currency | (35,393,527 | ) | (1,113,155 | ) | (470,078 | ) | 428,419 | |||||||||||||
Net change in unrealized appreciation (depreciation) on investments and foreign currency | 61,537,989 | (115,351,653 | ) | 4,127,441 | (5,301,142 | ) | ||||||||||||||
Net increase (decrease) in net assets from investment operations | 29,168,420 | (114,101,709 | ) | 3,969,478 | (4,686,636 | ) | ||||||||||||||
| DISTRIBUTIONS: | ||||||||||||||||||||
| Net investment income | ||||||||||||||||||||
Investment Class | (2,257,000 | ) | (1,481,274 | ) | ||||||||||||||||
Service Class | (672,322 | ) | (794,372 | ) | (351,848 | ) | (158,172 | ) | ||||||||||||
Consultant Class | (28,794 | ) | (102,078 | ) | ||||||||||||||||
R Class | (950 | ) | ||||||||||||||||||
K Class | (565 | ) | ||||||||||||||||||
Net realized gain on investments and foreign currency | ||||||||||||||||||||
Investment Class | – | – | ||||||||||||||||||
Service Class | – | – | – | (1,529,125 | ) | |||||||||||||||
Consultant Class | – | – | ||||||||||||||||||
R Class | – | |||||||||||||||||||
K Class | – | |||||||||||||||||||
| Return of capital | ||||||||||||||||||||
Investment Class | – | – | ||||||||||||||||||
Service Class | – | – | – | (12,924 | ) | |||||||||||||||
Consultant Class | – | – | ||||||||||||||||||
R Class | – | |||||||||||||||||||
K Class | – | |||||||||||||||||||
| Total distributions | (2,959,631 | ) | (2,377,724 | ) | (351,848 | ) | (1,700,221 | ) | ||||||||||||
| CAPITAL SHARE TRANSACTIONS: | ||||||||||||||||||||
| Net capital share transactions | ||||||||||||||||||||
Investment Class | 23,272,708 | 207,132,510 | ||||||||||||||||||
Service Class | (34,945,055 | ) | 19,816,952 | 2,636,481 | 8,177,613 | |||||||||||||||
Consultant Class | 3,019,093 | 22,957,004 | ||||||||||||||||||
R Class | 76,841 | |||||||||||||||||||
K Class | 42,936 | |||||||||||||||||||
| Shareholder redemption fees | ||||||||||||||||||||
Investment Class | 51,565 | 95,961 | ||||||||||||||||||
Service Class | 31,111 | 198,465 | 13,906 | 14,620 | ||||||||||||||||
Net increase (decrease) in net assets from capital share transactions | (8,450,801 | ) | 250,200,892 | 2,650,387 | 8,192,233 | |||||||||||||||
NET INCREASE (DECREASE) IN NET ASSETS | 17,757,988 | 133,721,459 | 6,268,017 | 1,805,376 | ||||||||||||||||
| NET ASSETS: | ||||||||||||||||||||
Beginning of year | 282,339,157 | 148,617,698 | 20,102,869 | 18,297,493 | ||||||||||||||||
End of year | $ | 300,097,145 | $ | 282,339,157 | $ | 26,370,886 | $ | 20,102,869 | ||||||||||||
UNDISTRIBUTED NET INVESTMENT INCOME (LOSS) AT END OF YEAR | $ | (26,269 | ) | $ | (101,148 | ) | $ | (42,855 | ) | $ | (11,012 | ) | ||||||||
| 96 | The Royce Funds 2012 Annual Report to Shareholders | THE ACCOMPANYING NOTES ARE AN INTEGRAL PART OF THESE FINANCIAL STATEMENTS. |
| Statements of Operations | Year Ended December 31, 2012 |
| Royce | Royce | Royce | Royce | Royce | Royce | Royce | |||||||||||||||||||||||||||||
| Pennsylvania | Micro-Cap | Premier | Low-Priced | Total Return | Heritage | Opportunity | |||||||||||||||||||||||||||||
| Mutual Fund | Fund | Fund | Stock Fund | Fund | Fund | Fund | |||||||||||||||||||||||||||||
| INVESTMENT INCOME: | |||||||||||||||||||||||||||||||||||
| Income: | |||||||||||||||||||||||||||||||||||
Dividends | |||||||||||||||||||||||||||||||||||
Non-Affiliated Companies | $ | 117,665,409 | $ | 19,150,949 | $ | 78,927,805 | $ | 67,535,537 | $ | 127,150,548 | $ | 5,584,635 | $ | 18,782,660 | |||||||||||||||||||||
Affiliated Companies | 5,559,790 | 823,307 | 77,550,950 | 8,521,078 | 9,458,233 | – | – | ||||||||||||||||||||||||||||
Foreign withholding tax | (933,640 | ) | (815,052 | ) | (2,806,069 | ) | (2,506,493 | ) | (1,414,348 | ) | (126,833 | ) | (19,437 | ) | |||||||||||||||||||||
Interest | 224,617 | 30,105 | 258,482 | 55,759 | 816,429 | 3,958 | 67,878 | ||||||||||||||||||||||||||||
Securities lending | 1,961,857 | 879,562 | 1,023,131 | 1,558,768 | 137,373 | 27,605 | 1,513,298 | ||||||||||||||||||||||||||||
| Total income | 124,478,033 | 20,068,871 | 154,954,299 | 75,164,649 | 136,148,235 | 5,489,365 | 20,344,399 | ||||||||||||||||||||||||||||
| Expenses: | |||||||||||||||||||||||||||||||||||
Investment advisory fees | 44,654,744 | 14,763,517 | 64,565,815 | 41,094,630 | 43,907,098 | 2,713,893 | 17,728,592 | ||||||||||||||||||||||||||||
Distribution fees | 7,931,860 | 1,637,960 | 2,341,356 | 5,710,391 | 4,740,675 | 720,357 | 604,608 | ||||||||||||||||||||||||||||
Shareholder servicing | 5,585,757 | 921,584 | 4,217,219 | 3,307,453 | 3,598,739 | 299,090 | 979,538 | ||||||||||||||||||||||||||||
Shareholder reports | 1,217,324 | 432,883 | 1,567,382 | 814,395 | 980,495 | 87,795 | 265,072 | ||||||||||||||||||||||||||||
Administrative and office facilities | 725,319 | 148,183 | 851,639 | 483,989 | 559,174 | 33,827 | 218,887 | ||||||||||||||||||||||||||||
Custody | 513,603 | 317,911 | 555,818 | 568,909 | 424,289 | 75,874 | 185,739 | ||||||||||||||||||||||||||||
Trustees’ fees | 206,605 | 41,232 | 242,419 | 133,902 | 158,931 | 9,590 | 61,563 | ||||||||||||||||||||||||||||
Registration | 110,419 | 63,633 | 140,704 | 74,012 | 121,123 | 51,466 | 79,523 | ||||||||||||||||||||||||||||
Legal | 94,678 | 19,784 | 110,767 | 64,897 | 73,017 | 4,417 | 29,171 | ||||||||||||||||||||||||||||
Audit | 77,882 | 68,690 | 76,021 | 70,029 | 76,099 | 41,929 | 45,672 | ||||||||||||||||||||||||||||
Other expenses | 171,375 | 37,055 | 191,444 | 119,188 | 322,604 | 9,942 | 52,657 | ||||||||||||||||||||||||||||
Total expenses | 61,289,566 | 18,452,432 | 74,860,584 | 52,441,795 | 54,962,244 | 4,048,180 | 20,251,022 | ||||||||||||||||||||||||||||
Compensating balance credits | (2,732 | ) | (842 | ) | (2,347 | ) | (945 | ) | (2,311 | ) | (329 | ) | (676 | ) | |||||||||||||||||||||
Fees waived by distributor | – | – | (62,396 | ) | – | – | (21,653 | ) | – | ||||||||||||||||||||||||||
Expenses reimbursed by investment adviser | – | (99,240 | ) | – | (1,966,729 | ) | – | (6,201 | ) | (7,986 | ) | ||||||||||||||||||||||||
Net expenses | 61,286,834 | 18,352,350 | 74,795,841 | 50,474,121 | 54,959,933 | 4,019,997 | 20,242,360 | ||||||||||||||||||||||||||||
Net investment income (loss) | 63,191,199 | 1,716,521 | 80,158,458 | 24,690,528 | 81,188,302 | 1,469,368 | 102,039 | ||||||||||||||||||||||||||||
REALIZED AND UNREALIZED GAIN (LOSS) ON INVESTMENTS AND FOREIGN CURRENCY: | |||||||||||||||||||||||||||||||||||
| Net realized gain (loss): | |||||||||||||||||||||||||||||||||||
Investments in Non-Affiliated Companies | 372,114,192 | 35,500,529 | 294,023,483 | 229,800,069 | 181,483,690 | 11,017,640 | 105,060,942 | ||||||||||||||||||||||||||||
Investments in Affiliated Companies | 6,715,561 | 7,455,322 | (14,720,352 | ) | (78,391,450 | ) | 3,401,143 | – | 4,663,669 | ||||||||||||||||||||||||||
Foreign currency transactions | 10,005 | (32,093 | ) | 616,462 | (149,316 | ) | 54,049 | 3,478 | 237 | ||||||||||||||||||||||||||
Net change in unrealized appreciation (depreciation): | |||||||||||||||||||||||||||||||||||
Investments and foreign currency translations | 334,784,719 | 35,262,769 | 365,936,325 | (19,686,811 | ) | 334,224,267 | 23,055,013 | 244,768,925 | |||||||||||||||||||||||||||
Other assets and liabilities denominated in foreign currency | (12,244 | ) | 6,845 | 57,184 | 10,099 | (7,173 | ) | 3,796 | (193 | ) | |||||||||||||||||||||||||
Net realized and unrealized gain (loss) on investments and foreign currency | 713,612,233 | 78,193,372 | 645,913,102 | 131,582,591 | 519,155,976 | 34,079,927 | 354,493,580 | ||||||||||||||||||||||||||||
NET INCREASE (DECREASE) IN NET ASSETS FROM INVESTMENT OPERATIONS | $ | 776,803,432 | $ | 79,909,893 | $ | 726,071,560 | $ | 156,273,119 | $ | 600,344,278 | $ | 35,549,295 | $ | 354,595,619 | |||||||||||||||||||||
| THE ACCOMPANYING NOTES ARE AN INTEGRAL PART OF THESE FINANCIAL STATEMENTS. | The Royce Funds 2012 Annual Report to Shareholders | 97 |
| Statements of Operations | Year Ended December 31, 2012 |
| Royce | Royce | Royce | Royce | Royce | Royce | Royce International | |||||||||||||||||||||||||||||
| Special Equity | Value | Value Plus | 100 | Dividend | Global | Smaller- | |||||||||||||||||||||||||||||
| Fund | Fund | Fund | Fund | Value Fund | Value Fund | Companies Fund | |||||||||||||||||||||||||||||
| INVESTMENT INCOME: | |||||||||||||||||||||||||||||||||||
| Income: | |||||||||||||||||||||||||||||||||||
Dividends | |||||||||||||||||||||||||||||||||||
Non-Affiliated Companies | $ | 56,531,338 | $ | 35,606,570 | $ | 19,888,931 | $ | 8,809,944 | $ | 11,302,869 | $ | 8,636,810 | $ | 775,288 | |||||||||||||||||||||
Affiliated Companies | 36,094,508 | – | 74,704 | – | – | – | – | ||||||||||||||||||||||||||||
Foreign withholding tax | – | (370,073 | ) | (420,483 | ) | (72,093 | ) | (121,675 | ) | (742,722 | ) | (56,569 | ) | ||||||||||||||||||||||
Interest | 202,614 | 12,276 | 32,655 | 3,313 | 7,527 | 13,104 | 1,409 | ||||||||||||||||||||||||||||
Securities lending | 48,300 | 251,827 | 214,224 | 10,537 | 36,200 | 54,177 | – | ||||||||||||||||||||||||||||
| Total income | 92,876,760 | 35,500,600 | 19,790,031 | 8,751,701 | 11,224,921 | 7,961,369 | 720,128 | ||||||||||||||||||||||||||||
| Expenses: | |||||||||||||||||||||||||||||||||||
Investment advisory fees | 27,559,900 | 14,921,949 | 17,718,634 | 3,558,074 | 3,491,107 | 3,843,650 | 301,785 | ||||||||||||||||||||||||||||
Distribution fees | 1,177,963 | 3,049,271 | 3,321,998 | 729,384 | 581,321 | 509,487 | 60,357 | ||||||||||||||||||||||||||||
Shareholder servicing | 2,123,826 | 1,752,171 | 2,116,425 | 432,117 | 395,718 | 342,401 | 45,687 | ||||||||||||||||||||||||||||
Shareholder reports | 570,397 | 395,627 | 569,100 | 172,805 | 149,761 | 101,853 | 9,591 | ||||||||||||||||||||||||||||
Administrative and office facilities | 323,673 | 197,094 | 247,594 | 47,815 | 38,658 | 38,865 | 2,781 | ||||||||||||||||||||||||||||
Custody | 228,415 | 162,220 | 182,242 | 36,620 | 73,394 | 176,377 | 44,469 | ||||||||||||||||||||||||||||
Trustees’ fees | 94,495 | 54,711 | 66,375 | 13,240 | 11,472 | 10,726 | 807 | ||||||||||||||||||||||||||||
Registration | 120,979 | 75,477 | 69,289 | 36,543 | 60,042 | 59,949 | 21,440 | ||||||||||||||||||||||||||||
Legal | 41,142 | 26,280 | 34,597 | 6,386 | 6,756 | 6,829 | 357 | ||||||||||||||||||||||||||||
Audit | 60,616 | 45,434 | 45,726 | 29,346 | 32,825 | 50,916 | 25,462 | ||||||||||||||||||||||||||||
Other expenses | 67,783 | 49,665 | 69,295 | 13,944 | 8,501 | 14,065 | 1,166 | ||||||||||||||||||||||||||||
| Total expenses | 32,369,189 | 20,729,899 | 24,441,275 | 5,076,274 | 4,849,555 | 5,155,118 | 513,902 | ||||||||||||||||||||||||||||
Compensating balance credits | (1,929 | ) | (1,179 | ) | (771 | ) | (455 | ) | (705 | ) | (209 | ) | (24 | ) | |||||||||||||||||||||
Fees waived by investment adviser and distributor | – | – | (124,359 | ) | (111,894 | ) | (70,373 | ) | – | (105,865 | ) | ||||||||||||||||||||||||
Expenses reimbursed by investment adviser | (97,644 | ) | – | (14,101 | ) | (32,353 | ) | (19,631 | ) | (217,498 | ) | – | |||||||||||||||||||||||
| Net expenses | 32,269,616 | 20,728,720 | 24,302,044 | 4,931,572 | 4,758,846 | 4,937,411 | 408,013 | ||||||||||||||||||||||||||||
| Net investment income (loss) | 60,607,144 | 14,771,880 | (4,512,013 | ) | 3,820,129 | 6,466,075 | 3,023,958 | 312,115 | |||||||||||||||||||||||||||
REALIZED AND UNREALIZED GAIN (LOSS) ON INVESTMENTS AND FOREIGN CURRENCY: | |||||||||||||||||||||||||||||||||||
| Net realized gain (loss): | |||||||||||||||||||||||||||||||||||
Investments in Non-Affiliated Companies | 127,633,271 | 52,482,648 | 105,690,447 | 22,125,438 | 4,715,540 | (35,322,607 | ) | (463,061 | ) | ||||||||||||||||||||||||||
Investments in Affiliated Companies | 13,568,658 | – | (32,521,723 | ) | – | – | – | – | |||||||||||||||||||||||||||
Foreign currency transactions | – | (74,815 | ) | 41,193 | 3,618 | 173 | (70,920 | ) | (7,017 | ) | |||||||||||||||||||||||||
Net change in unrealized appreciation (depreciation): | |||||||||||||||||||||||||||||||||||
Investments and foreign currency translations | 181,861,687 | 61,587,748 | 200,766,560 | 10,236,621 | 43,493,112 | 61,529,045 | 4,126,821 | ||||||||||||||||||||||||||||
Other assets and liabilities denominated in foreign currency | – | 14,555 | 4,916 | (1,926 | ) | 668 | 8,944 | 620 | |||||||||||||||||||||||||||
Net realized and unrealized gain (loss) on investments and foreign currency | 323,063,616 | 114,010,136 | 273,981,393 | 32,363,751 | 48,209,493 | 26,144,462 | 3,657,363 | ||||||||||||||||||||||||||||
NET INCREASE (DECREASE) IN NET ASSETS FROM INVESTMENT OPERATIONS | $ | 383,670,760 | $ | 128,782,016 | $ | 269,469,380 | $ | 36,183,880 | $ | 54,675,568 | $ | 29,168,420 | $ | 3,969,478 | |||||||||||||||||||||
| 98 | The Royce Funds 2012 Annual Report to Shareholders | THE ACCOMPANYING NOTES ARE AN INTEGRAL PART OF THESE FINANCIAL STATEMENTS. |
|
Financial Highlights |
| |||||||||||||||||||||||||||||||||||||||||||||||||||||||||
|
| Net |
| Net |
| Net Realized and Unrealized |
|
| Distributions |
| Distributions from Net |
|
|
|
|
|
|
|
|
| Ratio of Expenses to Average Net Assets |
| Ratio of Net Investment |
|
| ||||||||||||||||||||||||||||||||
|
| Asset Value, |
| Investment |
| Gain (Loss) on |
| Total from Investment Operations |
| from Net Investment Income |
| Realized Gain on |
| Distributions |
| Total Distributions |
| Shareholder Redemption Fees |
| Net Asset |
| Total Return |
| Net Assets, |
| Prior to Fee |
| Prior |
| Net of |
| Income (Loss) |
| Portfolio Turnover Rate |
| ||||||||||||||||||||||
|
|
|
|
|
|
|
|
|
|
|
|
|
|
|
|
|
|
|
|
|
|
|
|
|
|
|
|
|
|
|
|
|
|
|
|
|
|
|
|
|
|
|
|
|
|
|
|
|
|
|
|
|
|
|
|
|
|
Royce Pennsylvania Mutual Fund – Investment Class | |||||||||||||||||||||||||||||||||||||||||||||||||||||||||
2012 |
| $ | 10.76 |
| $ | 0.15 |
| $ | 1.39 |
| $ | 1.54 |
| $ | (0.15 | ) | $ | (0.65 | ) | $ | – |
| $ | (0.80 | ) | $ | – |
| $ | 11.50 |
|
| 14.58 | % | $ | 4,232,988 |
|
| 0.89 | % |
|
| 0.89 | % |
|
| 0.89 | % |
|
| 1.19 | % |
|
| 22 | % |
|
2011 |
|
| 11.65 |
|
| 0.01 |
|
| (0.50 | ) |
| (0.49 | ) |
| (0.02 | ) |
| (0.38 | ) |
| – |
|
| (0.40 | ) |
| – |
|
| 10.76 |
|
| (4.17 | ) |
| 4,266,754 |
|
| 0.90 |
|
|
| 0.90 |
|
|
| 0.90 |
|
|
| 0.11 |
|
|
| 20 |
|
|
2010 |
|
| 9.45 |
|
| 0.06 |
|
| 2.19 |
|
| 2.25 |
|
| (0.05 | ) |
| – |
|
| – |
|
| (0.05 | ) |
| – |
|
| 11.65 |
|
| 23.86 |
|
| 4,735,403 |
|
| 0.90 |
|
|
| 0.90 |
|
|
| 0.90 |
|
|
| 0.63 |
|
|
| 25 |
|
|
2009 |
|
| 6.94 |
|
| 0.02 |
|
| 2.50 |
|
| 2.52 |
|
| (0.01 | ) |
| – |
|
| – |
|
| (0.01 | ) |
| – |
|
| 9.45 |
|
| 36.28 |
|
| 3,555,507 |
|
| 0.92 |
|
|
| 0.92 |
|
|
| 0.92 |
|
|
| 0.33 |
|
|
| 23 |
|
|
2008 |
|
| 10.82 |
|
| 0.05 |
|
| (3.82 | ) |
| (3.77 | ) |
| (0.01 | ) |
| (0.10 | ) |
| – |
|
| (0.11 | ) |
| – |
|
| 6.94 |
|
| (34.78 | ) |
| 2,293,526 |
|
| 0.90 |
|
|
| 0.89 |
|
|
| 0.89 |
|
|
| 0.55 |
|
|
| 36 |
|
|
Royce Pennsylvania Mutual Fund – Service Class | |||||||||||||||||||||||||||||||||||||||||||||||||||||||||
2012 |
| $ | 10.75 |
| $ | 0.10 |
| $ | 1.40 |
| $ | 1.50 |
| $ | (0.09 | ) | $ | (0.65 | ) | $ | – |
| $ | (0.74 | ) | $ | – |
| $ | 11.51 |
|
| 14.15 | % | $ | 473,624 |
|
| 1.24 | % |
|
| 1.24 | % |
|
| 1.24 | % |
|
| 0.90 | % |
|
| 22 | % |
|
2011 |
|
| 11.65 |
|
| (0.02 | ) |
| (0.50 | ) |
| (0.52 | ) |
| – |
|
| (0.38 | ) |
| – |
|
| (0.38 | ) |
| – |
|
| 10.75 |
|
| (4.42 | ) |
| 406,052 |
|
| 1.19 |
|
|
| 1.19 |
|
|
| 1.19 |
|
|
| (0.18 | ) |
|
| 20 |
|
|
2010 |
|
| 9.41 |
|
| 0.02 |
|
| 2.20 |
|
| 2.22 |
|
| – |
|
| – |
|
| – |
|
| – |
|
| 0.02 |
|
| 11.65 |
|
| 23.80 |
|
| 448,784 |
|
| 1.27 |
|
|
| 1.27 |
|
|
| 1.25 |
|
|
| 0.18 |
|
|
| 25 |
|
|
2009 |
|
| 6.90 |
|
| (0.00 | ) |
| 2.49 |
|
| 2.49 |
|
| – |
|
| – |
|
| – |
|
| – |
|
| 0.02 |
|
| 9.41 |
|
| 36.38 |
|
| 609,445 |
|
| 1.31 |
|
|
| 1.31 |
|
|
| 1.29 |
|
|
| (0.05 | ) |
|
| 23 |
|
|
2008 |
|
| 10.78 |
|
| 0.04 |
|
| (3.82 | ) |
| (3.78 | ) |
| – |
|
| (0.10 | ) |
| – |
|
| (0.10 | ) |
| – |
|
| 6.90 |
|
| (35.00 | ) |
| 115,959 |
|
| 1.11 |
|
|
| 1.11 |
|
|
| 1.11 |
|
|
| 0.41 |
|
|
| 36 |
|
|
Royce Pennsylvania Mutual Fund – Consultant Class | |||||||||||||||||||||||||||||||||||||||||||||||||||||||||
2012 |
| $ | 9.69 |
| $ | 0.01 |
| $ | 1.25 |
| $ | 1.26 |
| $ | (0.01 | ) | $ | (0.65 | ) | $ | – |
| $ | (0.66 | ) | $ | – |
| $ | 10.29 |
|
| 13.27 | % | $ | 654,642 |
|
| 1.97 | % |
|
| 1.97 | % |
|
| 1.97 | % |
|
| 0.12 | % |
|
| 22 | % |
|
2011 |
|
| 10.61 |
|
| (0.09 | ) |
| (0.45 | ) |
| (0.54 | ) |
| – |
|
| (0.38 | ) |
| – |
|
| (0.38 | ) |
| – |
|
| 9.69 |
|
| (5.05 | ) |
| 664,778 |
|
| 1.85 |
|
|
| 1.85 |
|
|
| 1.85 |
|
|
| (0.85 | ) |
|
| 20 |
|
|
2010 |
|
| 8.65 |
|
| (0.03 | ) |
| 1.99 |
|
| 1.96 |
|
| – |
|
| – |
|
| – |
|
| – |
|
| – |
|
| 10.61 |
|
| 22.66 |
|
| 841,525 |
|
| 1.87 |
|
|
| 1.87 |
|
|
| 1.87 |
|
|
| (0.36 | ) |
|
| 25 |
|
|
2009 |
|
| 6.40 |
|
| (0.05 | ) |
| 2.30 |
|
| 2.25 |
|
| – |
|
| – |
|
| – |
|
| – |
|
| – |
|
| 8.65 |
|
| 35.16 |
|
| 757,734 |
|
| 1.89 |
|
|
| 1.89 |
|
|
| 1.89 |
|
|
| (0.64 | ) |
|
| 23 |
|
|
2008 |
|
| 10.09 |
|
| (0.04 | ) |
| (3.55 | ) |
| (3.59 | ) |
| – |
|
| (0.10 | ) |
| – |
|
| (0.10 | ) |
| – |
|
| 6.40 |
|
| (35.52 | ) |
| 635,688 |
|
| 1.88 |
|
|
| 1.87 |
|
|
| 1.87 |
|
|
| (0.46 | ) |
|
| 36 |
|
|
Royce Pennsylvania Mutual Fund – Institutional Class a | |||||||||||||||||||||||||||||||||||||||||||||||||||||||||
2012 |
| $ | 10.79 |
| $ | 0.13 |
| $ | 1.43 |
| $ | 1.56 |
| $ | (0.18 | ) | $ | (0.65 | ) | $ | – |
| $ | (0.83 | ) | $ | – |
| $ | 11.52 |
|
| 14.72 | % | $ | 488,052 |
|
| 0.80 | % |
|
| 0.80 | % |
|
| 0.80 | % |
|
| 1.53 | % |
|
| 22 | % |
|
2011 |
|
| 12.19 |
|
| 0.03 |
|
| (1.05 | ) |
| (1.02 | ) |
| – |
|
| (0.38 | ) |
| – |
|
| (0.38 | ) |
| – |
|
| 10.79 |
|
| (8.33 | )1 |
| 241,951 |
|
| 0.78 | 2 |
|
| 0.78 | 2 |
|
| 0.78 | 2 |
|
| 0.46 | 2 |
|
| 20 |
|
|
Royce Pennsylvania Mutual Fund – R Class | |||||||||||||||||||||||||||||||||||||||||||||||||||||||||
2012 |
| $ | 10.50 |
| $ | 0.07 |
| $ | 1.35 |
| $ | 1.42 |
| $ | (0.05 | ) | $ | (0.65 | ) | $ | – |
| $ | (0.70 | ) | $ | – |
| $ | 11.22 |
|
| 13.79 | % | $ | 32,977 |
|
| 1.50 | % |
|
| 1.50 | % |
|
| 1.50 | % |
|
| 0.70 | % |
|
| 22 | % |
|
2011 |
|
| 11.43 |
|
| (0.05 | ) |
| (0.50 | ) |
| (0.55 | ) |
| – |
|
| (0.38 | ) |
| – |
|
| (0.38 | ) |
| – |
|
| 10.50 |
|
| (4.77 | ) |
| 22,542 |
|
| 1.51 |
|
|
| 1.51 |
|
|
| 1.51 |
|
|
| (0.47 | ) |
|
| 20 |
|
|
2010 |
|
| 9.28 |
|
| 0.01 |
|
| 2.14 |
|
| 2.15 |
|
| (0.00 | ) |
| – |
|
| – |
|
| (0.00 | ) |
| – |
|
| 11.43 |
|
| 23.21 |
|
| 17,868 |
|
| 1.51 |
|
|
| 1.51 |
|
|
| 1.51 |
|
|
| 0.06 |
|
|
| 25 |
|
|
2009 |
|
| 6.87 |
|
| (0.05 | ) |
| 2.46 |
|
| 2.41 |
|
| – |
|
| – |
|
| – |
|
| – |
|
| – |
|
| 9.28 |
|
| 35.08 |
|
| 9,808 |
|
| 1.95 |
|
|
| 1.95 |
|
|
| 1.84 |
|
|
| (0.61 | ) |
|
| 23 |
|
|
2008 |
|
| 10.78 |
|
| (0.00 | ) |
| (3.81 | ) |
| (3.81 | ) |
| – |
|
| (0.10 | ) |
| – |
|
| (0.10 | ) |
| – |
|
| 6.87 |
|
| (35.28 | ) |
| 5,270 |
|
| 1.58 |
|
|
| 1.57 |
|
|
| 1.57 |
|
|
| (0.03 | ) |
|
| 36 |
|
|
Royce Pennsylvania Mutual Fund – K Class b | |||||||||||||||||||||||||||||||||||||||||||||||||||||||||
2012 |
| $ | 9.68 |
| $ | 0.09 |
| $ | 1.24 |
| $ | 1.33 |
| $ | (0.07 | ) | $ | (0.65 | ) | $ | – |
| $ | (0.72 | ) | $ | – |
| $ | 10.29 |
|
| 14.04 | % | $ | 8,849 |
|
| 1.26 | % |
|
| 1.26 | % |
|
| 1.26 | % |
|
| 0.94 | % |
|
| 22 | % |
|
2011 |
|
| 10.57 |
|
| (0.05 | ) |
| (0.46 | ) |
| (0.51 | ) |
| – |
|
| (0.38 | ) |
| – |
|
| (0.38 | ) |
| – |
|
| 9.68 |
|
| (4.78 | ) |
| 5,800 |
|
| 1.55 |
|
|
| 1.55 |
|
|
| 1.55 |
|
|
| (0.49 | ) |
|
| 20 |
|
|
2010 |
|
| 8.59 |
|
| 0.00 |
|
| 1.98 |
|
| 1.98 |
|
| (0.00 | ) |
| – |
|
| – |
|
| (0.00 | ) |
| – |
|
| 10.57 |
|
| 23.11 |
|
| 3,760 |
|
| 1.61 |
|
|
| 1.61 |
|
|
| 1.59 |
|
|
| 0.01 |
|
|
| 25 |
|
|
2009 |
|
| 6.34 |
|
| (0.02 | ) |
| 2.27 |
|
| 2.25 |
|
| – |
|
| – |
|
| – |
|
| – |
|
| – |
|
| 8.59 |
|
| 35.49 |
|
| 1,920 |
|
| 1.79 |
|
|
| 1.79 |
|
|
| 1.59 |
|
|
| (0.34 | ) |
|
| 23 |
|
|
2008 |
|
| 10.00 |
|
| 0.01 |
|
| (3.57 | ) |
| (3.56 | ) |
| – |
|
| (0.10 | ) |
| – |
|
| (0.10 | ) |
| – |
|
| 6.34 |
|
| (35.53 | )1 |
| 694 |
|
| 12.12 | 2 |
|
| 12.12 | 2 |
|
| 1.59 | 2 |
|
| 0.13 | 2 |
|
| 36 |
|
|
Royce Micro-Cap Fund – Investment Class | |||||||||||||||||||||||||||||||||||||||||||||||||||||||||
2012 |
| $ | 14.55 |
| $ | 0.05 |
| $ | 1.07 |
| $ | 1.12 |
| $ | (0.01 | ) | $ | (0.88 | ) | $ | – |
| $ | (0.89 | ) | $ | – |
| $ | 14.78 |
|
| 7.93 | % | $ | 740,364 |
|
| 1.47 | % |
|
| 1.47 | % |
|
| 1.47 | % |
|
| 0.29 | % |
|
| 15 | % |
|
2011 |
|
| 17.57 |
|
| (0.07 | ) |
| (2.05 | ) |
| (2.12 | ) |
| (0.20 | ) |
| (0.70 | ) |
| – |
|
| (0.90 | ) |
| – |
|
| 14.55 |
|
| (12.04 | ) |
| 904,168 |
|
| 1.50 |
|
|
| 1.50 |
|
|
| 1.50 |
|
|
| (0.50 | ) |
|
| 35 |
|
|
2010 |
|
| 13.71 |
|
| (0.03 | ) |
| 4.14 |
|
| 4.11 |
|
| (0.25 | ) |
| – |
|
| – |
|
| (0.25 | ) |
| – |
|
| 17.57 |
|
| 30.06 |
|
| 1,085,782 |
|
| 1.50 |
|
|
| 1.50 |
|
|
| 1.50 |
|
|
| (0.27 | ) |
|
| 36 |
|
|
2009 |
|
| 8.93 |
|
| (0.06 | ) |
| 5.02 |
|
| 4.96 |
|
| (0.18 | ) |
| – |
|
| – |
|
| (0.18 | ) |
| – |
|
| 13.71 |
|
| 55.67 |
|
| 844,859 |
|
| 1.54 |
|
|
| 1.54 |
|
|
| 1.54 |
|
|
| (0.41 | ) |
|
| 34 |
|
|
2008 |
|
| 15.72 |
|
| 0.12 |
|
| (6.58 | ) |
| (6.46 | ) |
| – |
|
| (0.33 | ) |
| – |
|
| (0.33 | ) |
| – |
|
| 8.93 |
|
| (40.94 | ) |
| 455,077 |
|
| 1.52 |
|
|
| 1.51 |
|
|
| 1.51 |
|
|
| 0.89 |
|
|
| 43 |
|
|
|
|
|
THE ACCOMPANYING NOTES ARE AN INTEGRAL PART OF THESE FINANCIAL STATEMENTS. |
| The Royce Funds 2012 Annual Report to Shareholders | 99 |
|
Financial Highlights |
| |||||||||||||||||||||||||||||||||||||||||||||||||||||||||
|
| Net |
| Net |
| Net Realized and Unrealized |
|
| Distributions |
| Distributions from Net |
|
|
|
|
|
|
|
|
| Ratio of Expenses to Average Net Assets |
| Ratio of Net Investment |
|
| ||||||||||||||||||||||||||||||||
|
| Asset Value, |
| Investment |
| Gain (Loss) on |
| Total from Investment Operations |
| from Net Investment Income |
| Realized Gain on |
| Distributions |
| Total Distributions |
| Shareholder Redemption Fees |
| Net Asset |
| Total Return |
| Net Assets, |
| Prior to Fee |
| Prior |
| Net of |
| Income (Loss) |
| Portfolio Turnover Rate |
| ||||||||||||||||||||||
|
|
|
|
|
|
|
|
|
|
|
|
|
|
|
|
|
|
|
|
|
|
|
|
|
|
|
|
|
|
|
|
|
|
|
|
|
|
|
|
|
|
|
|
|
|
|
|
|
|
|
|
|
|
|
|
|
|
Royce Micro-Cap Fund – Service Class | |||||||||||||||||||||||||||||||||||||||||||||||||||||||||
2012 |
| $ | 14.41 |
| $ | 0.02 |
| $ | 1.06 |
| $ | 1.08 |
| $ | – |
| $ | (0.88 | ) | $ | – |
| $ | (0.88 | ) | $ | – |
| $ | 14.61 |
|
| 7.76 | % | $ | 109,457 |
|
| 1.74 | % |
|
| 1.74 | % |
|
| 1.66 | % |
|
| 0.14 | % |
|
| 15 | % |
|
2011 |
|
| 17.43 |
|
| (0.10 | ) |
| (2.04 | ) |
| (2.14 | ) |
| (0.18 | ) |
| (0.70 | ) |
| – |
|
| (0.88 | ) |
| – |
|
| 14.41 |
|
| (12.23 | ) |
| 122,479 |
|
| 1.76 |
|
|
| 1.76 |
|
|
| 1.66 |
|
|
| (0.65 | ) |
|
| 35 |
|
|
2010 |
|
| 13.61 |
|
| (0.08 | ) |
| 4.14 |
|
| 4.06 |
|
| (0.24 | ) |
| – |
|
| – |
|
| (0.24 | ) |
| – |
|
| 17.43 |
|
| 29.85 |
|
| 139,911 |
|
| 1.78 |
|
|
| 1.78 |
|
|
| 1.66 |
|
|
| (0.41 | ) |
|
| 36 |
|
|
2009 |
|
| 8.87 |
|
| (0.10 | ) |
| 5.01 |
|
| 4.91 |
|
| (0.18 | ) |
| – |
|
| – |
|
| (0.18 | ) |
| 0.01 |
|
| 13.61 |
|
| 55.49 |
|
| 84,771 |
|
| 1.77 |
|
|
| 1.77 |
|
|
| 1.66 |
|
|
| (0.53 | ) |
|
| 34 |
|
|
2008 |
|
| 15.63 |
|
| 0.07 |
|
| (6.51 | ) |
| (6.44 | ) |
| – |
|
| (0.33 | ) |
| – |
|
| (0.33 | ) |
| 0.01 |
|
| 8.87 |
|
| (40.98 | ) |
| 28,245 |
|
| 1.79 |
|
|
| 1.78 |
|
|
| 1.66 |
|
|
| 0.58 |
|
|
| 43 |
|
|
Royce Micro-Cap Fund – Consultant Class | |||||||||||||||||||||||||||||||||||||||||||||||||||||||||
2012 |
| $ | 13.11 |
| $ | (0.10 | ) | $ | 0.95 |
| $ | 0.85 |
| $ | – |
| $ | (0.88 | ) | $ | – |
| $ | (0.88 | ) | $ | – |
| $ | 13.08 |
|
| 6.77 | % | $ | 120,871 |
|
| 2.55 | % |
|
| 2.55 | % |
|
| 2.55 | % |
|
| (0.77 | )% |
|
| 15 | % |
|
2011 |
|
| 15.91 |
|
| (0.21 | ) |
| (1.84 | ) |
| (2.05 | ) |
| (0.05 | ) |
| (0.70 | ) |
| – |
|
| (0.75 | ) |
| – |
|
| 13.11 |
|
| (12.86 | ) |
| 134,752 |
|
| 2.42 |
|
|
| 2.42 |
|
|
| 2.42 |
|
|
| (1.41 | ) |
|
| 35 |
|
|
2010 |
|
| 12.45 |
|
| (0.15 | ) |
| 3.74 |
|
| 3.59 |
|
| (0.13 | ) |
| – |
|
| – |
|
| (0.13 | ) |
| – |
|
| 15.91 |
|
| 28.85 |
|
| 181,746 |
|
| 2.43 |
|
|
| 2.43 |
|
|
| 2.43 |
|
|
| (1.20 | ) |
|
| 36 |
|
|
2009 |
|
| 8.14 |
|
| (0.13 | ) |
| 4.53 |
|
| 4.40 |
|
| (0.09 | ) |
| – |
|
| – |
|
| (0.09 | ) |
| – |
|
| 12.45 |
|
| 54.14 |
|
| 149,454 |
|
| 2.46 |
|
|
| 2.46 |
|
|
| 2.46 |
|
|
| (1.30 | ) |
|
| 34 |
|
|
2008 |
|
| 14.51 |
|
| 0.00 |
|
| (6.04 | ) |
| (6.04 | ) |
| – |
|
| (0.33 | ) |
| – |
|
| (0.33 | ) |
| – |
|
| 8.14 |
|
| (41.46 | ) |
| 103,038 |
|
| 2.45 |
|
|
| 2.45 |
|
|
| 2.45 |
|
|
| 0.02 |
|
|
| 43 |
|
|
Royce Premier Fund – Investment Class | |||||||||||||||||||||||||||||||||||||||||||||||||||||||||
2012 |
| $ | 18.52 |
| $ | 0.24 |
| $ | 1.85 |
| $ | 2.09 |
| $ | (0.24 | ) | $ | (1.21 | ) | $ | – |
| $ | (1.45 | ) | $ | – |
| $ | 19.16 |
|
| 11.45 | % | $ | 4,629,272 |
|
| 1.06 | % |
|
| 1.06 | % |
|
| 1.06 | % |
|
| 1.19 | % |
|
| 7 | % |
|
2011 |
|
| 20.35 |
|
| (0.02 | ) |
| (0.17 | ) |
| (0.19 | ) |
| (0.05 | ) |
| (1.59 | ) |
| – |
|
| (1.64 | ) |
| – |
|
| 18.52 |
|
| (0.86 | ) |
| 4,539,127 |
|
| 1.09 |
|
|
| 1.09 |
|
|
| 1.09 |
|
|
| (0.11 | ) |
|
| 18 |
|
|
2010 |
|
| 16.31 |
|
| (0.01 | ) |
| 4.32 |
|
| 4.31 |
|
| – |
|
| (0.27 | ) |
| – |
|
| (0.27 | ) |
| – |
|
| 20.35 |
|
| 26.46 |
|
| 4,961,891 |
|
| 1.12 |
|
|
| 1.12 |
|
|
| 1.12 |
|
|
| (0.07 | ) |
|
| 10 |
|
|
2009 |
|
| 12.24 |
|
| (0.02 | ) |
| 4.09 |
|
| 4.07 |
|
| – |
|
| – |
|
| – |
|
| – |
|
| – |
|
| 16.31 |
|
| 33.25 |
|
| 3,911,502 |
|
| 1.15 |
|
|
| 1.15 |
|
|
| 1.15 |
|
|
| (0.14 | ) |
|
| 14 |
|
|
2008 |
|
| 17.36 |
|
| 0.02 |
|
| (4.94 | ) |
| (4.92 | ) |
| – |
|
| (0.20 | ) |
| – |
|
| (0.20 | ) |
| – |
|
| 12.24 |
|
| (28.29 | ) |
| 2,634,045 |
|
| 1.13 |
|
|
| 1.12 |
|
|
| 1.12 |
|
|
| 0.15 |
|
|
| 11 |
|
|
Royce Premier Fund – Service Class | |||||||||||||||||||||||||||||||||||||||||||||||||||||||||
2012 |
| $ | 18.23 |
| $ | 0.19 |
| $ | 1.81 |
| $ | 2.00 |
| $ | (0.13 | ) | $ | (1.21 | ) | $ | – |
| $ | (1.34 | ) | $ | – |
| $ | 18.89 |
|
| 11.14 | % | $ | 560,553 |
|
| 1.33 | % |
|
| 1.33 | % |
|
| 1.32 | % |
|
| 0.92 | % |
|
| 7 | % |
|
2011 |
|
| 20.07 |
|
| (0.07 | ) |
| (0.16 | ) |
| (0.23 | ) |
| (0.02 | ) |
| (1.59 | ) |
| – |
|
| (1.61 | ) |
| – |
|
| 18.23 |
|
| (1.07 | ) |
| 628,824 |
|
| 1.34 |
|
|
| 1.34 |
|
|
| 1.32 |
|
|
| (0.33 | ) |
|
| 18 |
|
|
2010 |
|
| 16.12 |
|
| (0.05 | ) |
| 4.27 |
|
| 4.22 |
|
| – |
|
| (0.27 | ) |
| – |
|
| (0.27 | ) |
| – |
|
| 20.07 |
|
| 26.22 |
|
| 584,817 |
|
| 1.39 |
|
|
| 1.39 |
|
|
| 1.37 |
|
|
| (0.30 | ) |
|
| 10 |
|
|
2009 |
|
| 12.14 |
|
| (0.06 | ) |
| 4.04 |
|
| 3.98 |
|
| – |
|
| – |
|
| – |
|
| – |
|
| – |
|
| 16.12 |
|
| 32.78 |
|
| 377,079 |
|
| 1.44 |
|
|
| 1.44 |
|
|
| 1.43 |
|
|
| (0.41 | ) |
|
| 14 |
|
|
2008 |
|
| 17.25 |
|
| (0.01 | ) |
| (4.91 | ) |
| (4.92 | ) |
| – |
|
| (0.20 | ) |
| – |
|
| (0.20 | ) |
| 0.01 |
|
| 12.14 |
|
| (28.41 | ) |
| 209,647 |
|
| 1.37 |
|
|
| 1.37 |
|
|
| 1.34 |
|
|
| (0.06 | ) |
|
| 11 |
|
|
Royce Premier Fund – Consultant Class | |||||||||||||||||||||||||||||||||||||||||||||||||||||||||
2012 |
| $ | 16.87 |
| $ | 0.02 |
| $ | 1.69 |
| $ | 1.71 |
| $ | (0.02 | ) | $ | (1.21 | ) | $ | – |
| $ | (1.23 | ) | $ | – |
| $ | 17.35 |
|
| 10.24 | % | $ | 60,568 |
|
| 2.12 | % |
|
| 2.12 | % |
|
| 2.12 | % |
|
| 0.13 | % |
|
| 7 | % |
|
2011 |
|
| 18.81 |
|
| (0.21 | ) |
| (0.14 | ) |
| (0.35 | ) |
| – |
|
| (1.59 | ) |
| – |
|
| (1.59 | ) |
| – |
|
| 16.87 |
|
| (1.80 | ) |
| 59,766 |
|
| 2.05 |
|
|
| 2.05 |
|
|
| 2.05 |
|
|
| (1.07 | ) |
|
| 18 |
|
|
2010 |
|
| 15.24 |
|
| (0.17 | ) |
| 4.01 |
|
| 3.84 |
|
| – |
|
| (0.27 | ) |
| – |
|
| (0.27 | ) |
| – |
|
| 18.81 |
|
| 25.24 |
|
| 71,686 |
|
| 2.08 |
|
|
| 2.08 |
|
|
| 2.08 |
|
|
| (1.04 | ) |
|
| 10 |
|
|
2009 |
|
| 11.55 |
|
| (0.15 | ) |
| 3.84 |
|
| 3.69 |
|
| – |
|
| – |
|
| – |
|
| – |
|
| – |
|
| 15.24 |
|
| 31.95 |
|
| 58,241 |
|
| 2.14 |
|
|
| 2.14 |
|
|
| 2.14 |
|
|
| (1.13 | ) |
|
| 14 |
|
|
2008 |
|
| 16.57 |
|
| (0.13 | ) |
| (4.69 | ) |
| (4.82 | ) |
| – |
|
| (0.20 | ) |
| – |
|
| (0.20 | ) |
| – |
|
| 11.55 |
|
| (29.04 | ) |
| 28,977 |
|
| 2.12 |
|
|
| 2.11 |
|
|
| 2.11 |
|
|
| (0.84 | ) |
|
| 11 |
|
|
Royce Premier Fund – Institutional Class | |||||||||||||||||||||||||||||||||||||||||||||||||||||||||
2012 |
| $ | 18.66 |
| $ | 0.26 |
| $ | 1.87 |
| $ | 2.13 |
| $ | (0.28 | ) | $ | (1.21 | ) | $ | – |
| $ | (1.49 | ) | $ | – |
| $ | 19.30 |
|
| 11.57 | % | $ | 866,277 |
|
| 0.98 | % |
|
| 0.98 | % |
|
| 0.98 | % |
|
| 1.30 | % |
|
| 7 | % |
|
2011 |
|
| 20.49 |
|
| 0.00 |
|
| (0.16 | ) |
| (0.16 | ) |
| (0.08 |
|
| (1.59 | ) |
| – |
|
| (1.67 | ) |
| – |
|
| 18.66 |
|
| (0.73 | ) |
| 813,837 |
|
| 0.97 |
|
|
| 0.97 |
|
|
| 0.97 |
|
|
| 0.02 |
|
|
| 18 |
|
|
2010 |
|
| 16.40 |
|
| 0.01 |
|
| 4.35 |
|
| 4.36 |
|
| – |
|
| (0.27 | ) |
| – |
|
| (0.27 | ) |
| – |
|
| 20.49 |
|
| 26.62 |
|
| 706,870 |
|
| 0.99 |
|
|
| 0.99 |
|
|
| 0.99 |
|
|
| 0.07 |
|
|
| 10 |
|
|
2009 |
|
| 12.30 |
|
| (0.00 | ) |
| 4.10 |
|
| 4.10 |
|
| – |
|
| – |
|
| – |
|
| – |
|
| – |
|
| 16.40 |
|
| 33.33 |
|
| 516,900 |
|
| 1.03 |
|
|
| 1.03 |
|
|
| 1.03 |
|
|
| (0.01 | ) |
|
| 14 |
|
|
2008 |
|
| 17.42 |
|
| 0.04 |
|
| (4.96 | ) |
| (4.92 | ) |
| – |
|
| (0.20 | ) |
| – |
|
| (0.20 | ) |
| – |
|
| 12.30 |
|
| (28.19 | ) |
| 352,804 |
|
| 1.01 |
|
|
| 1.01 |
|
|
| 1.01 |
|
|
| 0.27 |
|
|
| 11 |
|
|
|
|
|
100 | The Royce Funds 2012 Annual Report to Shareholders |
| THE ACCOMPANYING NOTES ARE AN INTEGRAL PART OF THESE FINANCIAL STATEMENTS. |
|
Financial Highlights |
| |||||||||||||||||||||||||||||||||||||||||||||||||||||||||
|
| Net |
| Net |
| Net Realized and Unrealized |
|
| Distributions |
| Distributions from Net |
|
|
|
|
|
|
|
|
| Ratio of Expenses to Average Net Assets |
| Ratio of Net Investment |
|
| ||||||||||||||||||||||||||||||||
|
| Asset Value, |
| Investment |
| Gain (Loss) on |
| Total from Investment Operations |
| from Net Investment Income |
| Realized Gain on |
| Distributions |
| Total Distributions |
| Shareholder Redemption Fees |
| Net Asset |
| Total Return |
| Net Assets, |
| Prior to Fee |
| Prior |
| Net of |
| Income (Loss) |
| Portfolio Turnover Rate |
| ||||||||||||||||||||||
|
|
|
|
|
|
|
|
|
|
|
|
|
|
|
|
|
|
|
|
|
|
|
|
|
|
|
|
|
|
|
|
|
|
|
|
|
|
|
|
|
|
|
|
|
|
|
|
|
|
|
|
|
|
|
|
|
|
Royce Premier Fund – W Class | |||||||||||||||||||||||||||||||||||||||||||||||||||||||||
2012 |
| $ | 18.57 |
| $ | 0.25 |
| $ | 1.85 |
| $ | 2.10 |
| $ | (0.26 | ) | $ | (1.21 | ) | $ | – |
| $ | (1.47 | ) | $ | – |
| $ | 19.20 |
|
| 11.46 | % | $ | 533,763 |
|
| 1.05 | % |
|
| 1.05 | % |
|
| 1.05 | % |
|
| 1.19 | % |
|
| 7 | % |
|
2011 |
|
| 20.40 |
|
| (0.01 | ) |
| (0.15 | ) |
| (0.16 | ) |
| (0.08 | ) |
| (1.59 | ) |
| – |
|
| (1.67 | ) |
| – |
|
| 18.57 |
|
| (0.75 | ) |
| 549,648 |
|
| 1.00 |
|
|
| 1.00 |
|
|
| 1.00 |
|
|
| (0.01 | ) |
|
| 18 |
|
|
2010 |
|
| 16.33 |
|
| 0.01 |
|
| 4.33 |
|
| 4.34 |
|
| – |
|
| (0.27 | ) |
| – |
|
| (0.27 | ) |
| – |
|
| 20.40 |
|
| 26.61 |
|
| 425,397 |
|
| 1.02 |
|
|
| 1.02 |
|
|
| 1.02 |
|
|
| 0.04 |
|
|
| 10 |
|
|
2009 |
|
| 12.25 |
|
| (0.01 | ) |
| 4.09 |
|
| 4.08 |
|
| – |
|
| – |
|
| – |
|
| – |
|
| – |
|
| 16.33 |
|
| 33.31 |
|
| 319,120 |
|
| 1.07 |
|
|
| 1.07 |
|
|
| 1.07 |
|
|
| (0.06 | ) |
|
| 14 |
|
|
2008 |
|
| 17.36 |
|
| 0.04 |
|
| (4.95 | ) |
| (4.91 | ) |
| – |
|
| (0.20 | ) |
| – |
|
| (0.20 | ) |
| – |
|
| 12.25 |
|
| (28.23 | ) |
| 234,618 |
|
| 1.04 |
|
|
| 1.04 |
|
|
| 1.04 |
|
|
| 0.23 |
|
|
| 11 |
|
|
Royce Premier Fund – R Class | |||||||||||||||||||||||||||||||||||||||||||||||||||||||||
2012 |
| $ | 17.99 |
| $ | 0.11 |
| $ | 1.80 |
| $ | 1.91 |
| $ | (0.08 | ) | $ | (1.21 | ) | $ | – |
| $ | (1.29 | ) | $ | – |
| $ | 18.61 |
|
| 10.75 | % | $ | 28,632 |
|
| 1.68 | % |
|
| 1.68 | % |
|
| 1.68 | % |
|
| 0.57 | % |
|
| 7 | % |
|
2011 |
|
| 19.91 |
|
| (0.14 | ) |
| (0.15 | ) |
| (0.29 | ) |
| (0.04 | ) |
| (1.59 | ) |
| – |
|
| (1.63 | ) |
| – |
|
| 17.99 |
|
| (1.38 | ) |
| 23,653 |
|
| 1.66 |
|
|
| 1.66 |
|
|
| 1.66 |
|
|
| (0.63 | ) |
|
| 18 |
|
|
2010 |
|
| 16.07 |
|
| (0.11 | ) |
| 4.22 |
|
| 4.11 |
|
| – |
|
| (0.27 | ) |
| – |
|
| (0.27 | ) |
| – |
|
| 19.91 |
|
| 25.61 |
|
| 10,185 |
|
| 1.78 |
|
|
| 1.78 |
|
|
| 1.78 |
|
|
| (0.64 | ) |
|
| 10 |
|
|
2009 |
|
| 12.15 |
|
| (0.12 | ) |
| 4.04 |
|
| 3.92 |
|
| – |
|
| – |
|
| – |
|
| – |
|
| – |
|
| 16.07 |
|
| 32.26 |
|
| 2,634 |
|
| 2.26 |
|
|
| 2.26 |
|
|
| 1.84 |
|
|
| (0.83 | ) |
|
| 14 |
|
|
2008 |
|
| 17.36 |
|
| (0.08 | ) |
| (4.93 | ) |
| (5.01 | ) |
| – |
|
| (0.20 | ) |
| – |
|
| (0.20 | ) |
| – |
|
| 12.15 |
|
| (28.81 | ) |
| 396 |
|
| 3.97 |
|
|
| 3.97 |
|
|
| 1.84 |
|
|
| (0.54 | ) |
|
| 11 |
|
|
Royce Premier Fund – K Class b | |||||||||||||||||||||||||||||||||||||||||||||||||||||||||
2012 |
| $ | 8.67 |
| $ | 0.08 |
| $ | 0.85 |
| $ | 0.93 |
| $ | (0.20 | ) | $ | (1.21 | ) | $ | – |
| $ | (1.41 | ) | $ | – |
| $ | 8.19 |
|
| 11.00 | % | $ | 9,707 |
|
| 1.47 | % |
|
| 1.47 | % |
|
| 1.47 | % |
|
| 0.79 | % |
|
| 7 | % |
|
2011 |
|
| 10.46 |
|
| (0.05 | ) |
| (0.09 | ) |
| (0.14 | ) |
| (0.06 | ) |
| (1.59 | ) |
| – |
|
| (1.65 | ) |
| – |
|
| 8.67 |
|
| (1.20 | ) |
| 8,776 |
|
| 1.49 |
|
|
| 1.49 |
|
|
| 1.49 |
|
|
| (0.46 | ) |
|
| 18 |
|
|
2010 |
|
| 8.53 |
|
| (0.04 | ) |
| 2.24 |
|
| 2.20 |
|
| – |
|
| (0.27 | ) |
| – |
|
| (0.27 | ) |
| – |
|
| 10.46 |
|
| 25.86 |
|
| 3,845 |
|
| 1.63 |
|
|
| 1.63 |
|
|
| 1.59 |
|
|
| (0.47 | ) |
|
| 10 |
|
|
2009 |
|
| 6.44 |
|
| (0.05 | ) |
| 2.14 |
|
| 2.09 |
|
| – |
|
| – |
|
| – |
|
| – |
|
| – |
|
| 8.53 |
|
| 32.45 |
|
| 1,551 |
|
| 2.39 |
|
|
| 2.39 |
|
|
| 1.59 |
|
|
| (0.60 | ) |
|
| 14 |
|
|
2008 |
|
| 10.00 |
|
| (0.02 | ) |
| (3.34 | ) |
| (3.36 | ) |
| – |
|
| (0.20 | ) |
| – |
|
| (0.20 | ) |
| – |
|
| 6.44 |
|
| (33.51 | )1 |
| 35 |
|
| 35.36 | 2 |
|
| 35.36 | 2 |
|
| 1.59 | 2 |
|
| (0.38 | )2 |
|
| 11 |
|
|
Royce Low-Priced Stock Fund – Investment Class | |||||||||||||||||||||||||||||||||||||||||||||||||||||||||
2012 |
| $ | 14.34 |
| $ | 0.15 |
| $ | 0.50 |
| $ | 0.65 |
| $ | (0.25 | ) | $ | (0.91 | ) | $ | – |
| $ | (1.16 | ) | $ | – |
| $ | 13.83 |
|
| 4.79 | % | $ | 255,335 |
|
| 1.26 | % |
|
| 1.26 | % |
|
| 1.24 | % |
|
| 0.86 | % |
|
| 8 | % |
|
2011 |
|
| 18.31 |
|
| (0.06 | ) |
| (2.57 | ) |
| (2.63 | ) |
| (0.14 | ) |
| (1.20 | ) |
| – |
|
| (1.34 | ) |
| – |
|
| 14.34 |
|
| (14.37 | ) |
| 276,247 |
|
| 1.26 |
|
|
| 1.26 |
|
|
| 1.24 |
|
|
| (0.15 | ) |
|
| 22 |
|
|
2010 |
|
| 14.08 |
|
| (0.03 | ) |
| 4.50 |
|
| 4.47 |
|
| (0.10 | ) |
| (0.14 | ) |
| – |
|
| (0.24 | ) |
| – |
|
| 18.31 |
|
| 31.77 |
|
| 148,144 |
|
| 1.26 |
|
|
| 1.26 |
|
|
| 1.24 |
|
|
| (0.10 | ) |
|
| 24 |
|
|
2009 |
|
| 9.17 |
|
| (0.01 | ) |
| 4.96 |
|
| 4.95 |
|
| (0.04 | ) |
| – |
|
| – |
|
| (0.04 | ) |
| – |
|
| 14.08 |
|
| 54.04 |
|
| 94,966 |
|
| 1.27 |
|
|
| 1.27 |
|
|
| 1.24 |
|
|
| (0.14 | ) |
|
| 22 |
|
|
2008 |
|
| 14.75 |
|
| 0.03 |
|
| (5.35 | ) |
| (5.32 | ) |
| – |
|
| (0.27 | ) |
| – |
|
| (0.27 | ) |
| 0.01 |
|
| 9.17 |
|
| (35.77 | ) |
| 65,004 |
|
| 1.24 |
|
|
| 1.24 |
|
|
| 1.24 |
|
|
| 0.29 |
|
|
| 39 |
|
|
Royce Low-Priced Stock Fund – Service Class | |||||||||||||||||||||||||||||||||||||||||||||||||||||||||
2012 |
| $ | 14.31 |
| $ | 0.11 |
| $ | 0.49 |
| $ | 0.60 |
| $ | (0.16 | ) | $ | (0.91 | ) | $ | – |
| $ | (1.07 | ) | $ | – |
| $ | 13.84 |
|
| 4.48 | % | $ | 1,800,089 |
|
| 1.57 | % |
|
| 1.57 | % |
|
| 1.49 | % |
|
| 0.54 | % |
|
| 8 | % |
|
2011 |
|
| 18.26 |
|
| (0.06 | ) |
| (2.60 | ) |
| (2.66 | ) |
| (0.09 | ) |
| (1.20 | ) |
| – |
|
| (1.29 | ) |
| – |
|
| 14.31 |
|
| (14.58 | ) |
| 2,489,189 |
|
| 1.56 |
|
|
| 1.56 |
|
|
| 1.49 |
|
|
| (0.39 | ) |
|
| 22 |
|
|
2010 |
|
| 14.05 |
|
| (0.05 | ) |
| 4.47 |
|
| 4.42 |
|
| (0.07 | ) |
| (0.14 | ) |
| – |
|
| (0.21 | ) |
| – |
|
| 18.26 |
|
| 31.49 |
|
| 3,456,142 |
|
| 1.60 |
|
|
| 1.60 |
|
|
| 1.49 |
|
|
| (0.37 | ) |
|
| 24 |
|
|
2009 |
|
| 9.16 |
|
| (0.04 | ) |
| 4.95 |
|
| 4.91 |
|
| (0.02 | ) |
| – |
|
| – |
|
| (0.02 | ) |
| – |
|
| 14.05 |
|
| 53.58 |
|
| 2,669,235 |
|
| 1.60 |
|
|
| 1.60 |
|
|
| 1.49 |
|
|
| (0.38 | ) |
|
| 22 |
|
|
2008 |
|
| 14.78 |
|
| (0.01 | ) |
| (5.34 | ) |
| (5.35 | ) |
| – |
|
| (0.27 | ) |
| – |
|
| (0.27 | ) |
| – |
|
| 9.16 |
|
| (35.97 | ) |
| 1,870,016 |
|
| 1.56 |
|
|
| 1.55 |
|
|
| 1.49 |
|
|
| (0.10 | ) |
|
| 39 |
|
|
Royce Low-Priced Stock Fund – Institutional Class | |||||||||||||||||||||||||||||||||||||||||||||||||||||||||
2012 |
| $ | 14.36 |
| $ | 0.16 |
| $ | 0.49 |
| $ | 0.65 |
| $ | (0.26 | ) | $ | (0.91 | ) | $ | – |
| $ | (1.17 | ) | $ | – |
| $ | 13.84 |
|
| 4.81 | % | $ | 969,664 |
|
| 1.20 | % |
|
| 1.20 | % |
|
| 1.20 | % |
|
| 0.92 | % |
|
| 8 | % |
|
2011 |
|
| 18.33 |
|
| (0.01 | ) |
| (2.61 | ) |
| (2.62 | ) |
| (0.15 | ) |
| (1.20 | ) |
| – |
|
| (1.35 | ) |
| – |
|
| 14.36 |
|
| (14.35 | ) |
| 991,706 |
|
| 1.17 |
|
|
| 1.17 |
|
|
| 1.17 |
|
|
| (0.07 | ) |
|
| 22 |
|
|
2010 |
|
| 14.09 |
|
| (0.02 | ) |
| 4.50 |
|
| 4.48 |
|
| (0.10 | ) |
| (0.14 | ) |
| – |
|
| (0.24 | ) |
| – |
|
| 18.33 |
|
| 31.82 |
|
| 1,077,659 |
|
| 1.18 |
|
|
| 1.18 |
|
|
| 1.18 |
|
|
| (0.04 | ) |
|
| 24 |
|
|
2009 |
|
| 9.18 |
|
| (0.01 | ) |
| 4.96 |
|
| 4.95 |
|
| (0.04 | ) |
| – |
|
| – |
|
| (0.04 | ) |
| – |
|
| 14.09 |
|
| 53.97 |
|
| 673,846 |
|
| 1.24 |
|
|
| 1.24 |
|
|
| 1.24 |
|
|
| (0.15 | ) |
|
| 22 |
|
|
2008 |
|
| 14.76 |
|
| 0.03 |
|
| (5.34 | ) |
| (5.31 | ) |
| – |
|
| (0.27 | ) |
| – |
|
| (0.27 | ) |
| – |
|
| 9.18 |
|
| (35.75 | ) |
| 553,070 |
|
| 1.18 |
|
|
| 1.18 |
|
|
| 1.18 |
|
|
| 0.22 |
|
|
| 39 |
|
|
| THE ACCOMPANYING NOTES ARE AN INTEGRAL PART OF THESE FINANCIAL STATEMENTS. | The Royce Funds 2012 Annual Report to Shareholders | 101 |
|
Financial Highlights |
| Net Asset | Net | Net Realized and Unrealized | Distributions | Distributions from Net | Ratio of Expenses to Average Net Assets | Ratio of Net Investment | |||||||||||||||||||||||||||||||||||||||||||||||||||||||||
| Value, Beginning of Period | Investment Income (Loss) | Gain (Loss) on Investments and Foreign Currency | Total from Investment Operations | from Net Investment Income | Realized Gain on Investments and Foreign Currency | Distributions | Total Distributions | Shareholder Redemption Fees | Net Asset Value, End of Period | Total Return | Net Assets, End of Period (in thousands) | Prior to Fee Waivers and Balance Credits | Prior to Fee Waivers | Net of Fee Waivers | Income (Loss) to Average Net Assets | Portfolio Turnover Rate | |||||||||||||||||||||||||||||||||||||||||||||||
|
|
|
|
|
|
|
|
|
|
|
|
|
|
|
|
|
|
|
|
|
|
|
|
|
|
|
|
|
|
|
|
|
|
|
|
|
|
|
|
|
|
|
|
|
|
|
|
|
|
|
|
|
|
|
|
|
|
|
|
|
|
|
|
| Royce Low-Priced Stock Fund – R Class | |||||||||||||||||||||||||||||||||||||||||||||||||||||||||||||||
| 2012 | $ | 14.05 | $ | 0.04 |
| $ | 0.50 |
| $ | 0.54 |
| $ | (0.10 | ) | $ | (0.91 | ) | $ | – | $ | (1.01 | ) | $ | – | $ | 13.58 | 4.10 | % | $ | 5,823 | 2.05 | % | 2.05 | % | 1.84 | % | 0.22 | % | 8 | % | |||||||||||||||||||||||
| 2011 | 18.05 | (0.19 | ) | (2.49 | ) | (2.68 | ) | (0.12 | ) | (1.20 | ) | – | (1.32 | ) | – | 14.05 | (14.86 | ) | 7,337 | 1.95 | 1.95 | 1.84 | (0.72 | ) | 22 | ||||||||||||||||||||||||||||||||||||||
| 2010 | 13.95 | (0.12 | ) | 4.44 | 4.32 | (0.08 | ) | (0.14 | ) | – | (0.22 | ) | – | 18.05 | 31.00 | 2,925 | 2.21 | 2.21 | 1.84 | (0.67 | ) | 24 | |||||||||||||||||||||||||||||||||||||||||
| 2009 | 9.11 | (0.09 | ) | 4.92 | 4.83 | (0.00 | ) | – | – | (0.00 | ) | 0.01 | 13.95 | 53.13 | 1,134 | 3.02 | 3.02 | 1.84 | (0.76 | ) | 22 | ||||||||||||||||||||||||||||||||||||||||||
| 2008 | 14.76 | (0.05 | ) | (5.33 | ) | (5.38 | ) | – | (0.27 | ) | – | (0.27 | ) | – | 9.11 | (36.22 | ) | 74 | 10.95 | 10.94 | 1.84 | (0.42 | ) | 39 | |||||||||||||||||||||||||||||||||||||||
| Royce Low-Priced Stock Fund – K Class b | |||||||||||||||||||||||||||||||||||||||||||||||||||||||||||||||
| 2012 | $ | 8.65 | $ | 0.07 |
| $ | 0.27 |
| $ | 0.34 |
| $ | (0.18 | ) | $ | (0.91 | ) | $ | – | $ | (1.09 | ) | $ | – | $ | 7.90 | 4.42 | % | $ | 6,253 | 1.71 | % | 1.71 | % | 1.59 | % | 0.40 | % | 8 | % | |||||||||||||||||||||||
| 2011 | 11.70 | (0.08 | ) | (1.63 | ) | (1.71 | ) | (0.14 | ) | (1.20 | ) | – | (1.34 | ) | – | 8.65 | (14.71 | ) | 8,719 | 1.68 | 1.68 | 1.59 | (0.48 | ) | 22 | ||||||||||||||||||||||||||||||||||||||
| 2010 | 9.09 | (0.08 | ) | 2.93 | 2.85 | (0.10 | ) | (0.14 | ) | – | (0.24 | ) | – | 11.70 | 31.44 | 4,782 | 1.78 | 1.78 | 1.59 | (0.40 | ) | 24 | |||||||||||||||||||||||||||||||||||||||||
| 2009 | 5.95 | (0.10 | ) | 3.28 | 3.18 | (0.04 | ) | – | – | (0.04 | ) | – | 9.09 | 53.45 | 676 | 4.75 | 4.75 | 1.59 | (0.44 | ) | 22 | ||||||||||||||||||||||||||||||||||||||||||
| 2008 | 10.00 | (0.01 | ) | (3.77 | ) | (3.78 | ) | – | (0.27 | ) | – | (0.27 | ) | – | 5.95 | (37.47 | )1 | 30 | 40.19 | 2 | 40.19 | 2 | 1.59 | 2 | (0.19 | )2 | 39 | ||||||||||||||||||||||||||||||||||||
| Royce Total Return Fund – Investment Class | |||||||||||||||||||||||||||||||||||||||||||||||||||||||||||||||
| 2012 | $ | 12.68 | $ | 0.26 | $ | 1.54 |
| $ | 1.80 |
| $ | (0.23 | ) | $ | (0.62 | ) | $ | – | $ | (0.85 | ) | $ | – | $ | 13.63 | 14.42 | % | $ | 3,044,664 | 1.10 | % | 1.10 | % | 1.10 | % | 1.89 | % | 17 | % | ||||||||||||||||||||||||
| 2011 | 13.17 | 0.15 | (0.37 | ) | (0.22 | ) | (0.12 | ) | (0.15 | ) | – | (0.27 | ) | – | 12.68 | (1.68 | ) | 3,106,208 | 1.12 | 1.12 | 1.12 | 1.10 | 21 | ||||||||||||||||||||||||||||||||||||||||
| 2010 | 10.81 | 0.19 | 2.32 | 2.51 | (0.15 | ) | – | – | (0.15 | ) | – | 13.17 | 23.47 | 3,562,002 | 1.14 | 1.14 | 1.14 | 1.64 | 15 | ||||||||||||||||||||||||||||||||||||||||||||
| 2009 | 8.70 | 0.16 | 2.09 | 2.25 | (0.14 | ) | – | – | (0.14 | ) | – | 10.81 | 26.22 | 3,077,099 | 1.17 | 1.17 | 1.17 | 1.74 | 20 | ||||||||||||||||||||||||||||||||||||||||||||
| 2008 | 12.93 | 0.20 | (4.20 | ) | (4.00 | ) | (0.23 | ) | (0.00 | ) | – | (0.23 | ) | – | 8.70 | (31.17 | ) | 2,577,031 | 1.12 | 1.12 | 1.12 | 1.69 | 25 | ||||||||||||||||||||||||||||||||||||||||
| Royce Total Return Fund – Service Class | |||||||||||||||||||||||||||||||||||||||||||||||||||||||||||||||
| 2012 | $ | 12.71 | $ | 0.22 | $ | 1.55 | $ | 1.77 | $ | (0.14 | ) | $ | (0.62 | ) | $ | – | $ | (0.76 | ) | $ | – | $ | 13.72 | 14.11 | % | $ | 264,528 | 1.39 | % | 1.39 | % | 1.39 | % | 1.58 | % | 17 | % | ||||||||||||||||||||||||||
| 2011 | 13.19 | 0.11 | (0.38 | ) | (0.27 | ) | (0.06 | ) | (0.15 | ) | – | (0.21 | ) | – | 12.71 | (2.01 | ) | 282,704 | 1.41 | 1.41 | 1.41 | 0.82 | 21 | ||||||||||||||||||||||||||||||||||||||||
| 2010 | 10.81 | 0.16 | 2.32 | 2.48 | (0.10 | ) | – | – | (0.10 | ) | – | 13.19 | 23.11 | 295,656 | 1.42 | 1.42 | 1.42 | 1.39 | 15 | ||||||||||||||||||||||||||||||||||||||||||||
| 2009 | 8.67 | 0.14 | 2.09 | 2.23 | (0.10 | ) | – | – | (0.10 | ) | 0.01 | 10.81 | 26.16 | 215,939 | 1.42 | 1.42 | 1.42 | 1.49 | 20 | ||||||||||||||||||||||||||||||||||||||||||||
| 2008 | 12.82 | 0.17 | (4.16 | ) | (3.99 | ) | (0.18 | ) | (0.00 | ) | – | (0.18 | ) | 0.02 | 8.67 | (31.17 | ) | 155,644 | 1.37 | 1.37 | 1.34 | 1.49 | 25 | ||||||||||||||||||||||||||||||||||||||||
| Royce Total Return Fund – Consultant Class | |||||||||||||||||||||||||||||||||||||||||||||||||||||||||||||||
| 2012 | $ | 12.77 | $ | 0.11 | $ | 1.56 | $ | 1.67 | $ | (0.01 | ) | $ | (0.62 | ) | $ | – | $ | (0.63 | ) | $ | – | $ | 13.81 | 13.19 | % | $ | 331,116 | 2.20 | % | 2.20 | % | 2.20 | % | 0.80 | % | 17 | % | ||||||||||||||||||||||||||
| 2011 | 13.27 | 0.02 | (0.37 | ) | (0.35 | ) | – | (0.15 | ) |
| – | (0.15 | ) | – | 12.77 | (2.64 | ) | 328,610 | 2.07 | 2.07 | 2.07 | 0.15 | 21 | ||||||||||||||||||||||||||||||||||||||||
| 2010 | 10.90 | 0.08 | 2.33 | 2.41 | (0.04 | ) | – |
| – | (0.04 | ) | – | 13.27 | 22.18 | 391,886 | 2.09 | 2.09 | 2.09 | 0.68 | 15 | |||||||||||||||||||||||||||||||||||||||||||
| 2009 | 8.76 | 0.07 | 2.12 | 2.19 | (0.05 | ) | – |
| – | (0.05 | ) | – | 10.90 | 25.12 | 366,367 | 2.12 | 2.12 | 2.12 | 0.78 | 20 | |||||||||||||||||||||||||||||||||||||||||||
| 2008 | 12.91 | 0.08 | (4.18 | ) | (4.10 | ) | (0.05 | ) | (0.00 | ) |
| – | (0.05 | ) | – | 8.76 | (31.83 | ) | 354,384 | 2.09 | 2.08 | 2.08 | 0.71 | 25 | |||||||||||||||||||||||||||||||||||||||
| Royce Total Return Fund – Institutional Class | |||||||||||||||||||||||||||||||||||||||||||||||||||||||||||||||
| 2012 | $ | 12.64 | $ | 0.27 | $ | 1.54 | $ | 1.81 | $ | (0.28 | ) | $ | (0.62 | ) | $ | – | $ | (0.90 | ) | $ | – | $ | 13.55 | 14.48 | % | $ | 408,551 | 1.02 | % | 1.02 | % | 1.02 | % | 2.02 | % | 17 | % | ||||||||||||||||||||||||||
| 2011 | 13.14 | 0.16 | (0.37 | ) | (0.21 | ) | (0.14 | ) | (0.15 | ) |
| – | (0.29 | ) | – | 12.64 | (1.55 | ) | 390,277 | 1.00 | 1.00 | 1.00 | 1.26 | 21 | |||||||||||||||||||||||||||||||||||||||
| 2010 | 10.80 | 0.21 | 2.31 | 2.52 | (0.18 | ) | – |
| – | (0.18 | ) | – | 13.14 | 23.56 | 356,038 | 1.01 | 1.01 | 1.01 | 1.79 | 15 | |||||||||||||||||||||||||||||||||||||||||||
| 2009 | 8.70 | 0.17 | 2.09 | 2.26 | (0.16 | ) | – |
| – | (0.16 | ) | – | 10.80 | 26.41 | 264,041 | 1.04 | 1.04 | 1.04 | 1.87 | 20 | |||||||||||||||||||||||||||||||||||||||||||
| 2008 | 12.95 | 0.20 | (4.19 | ) | (3.99 | ) | (0.26 | ) | (0.00 | ) |
| – | (0.26 | ) | – | 8.70 | (31.09 | ) | 191,014 | 1.00 | 0.99 | 0.99 | 1.82 | 25 | |||||||||||||||||||||||||||||||||||||||
| 102 | The Royce Funds 2012 Annual Report to Shareholders | THE ACCOMPANYING NOTES ARE AN INTEGRAL PART OF THESE FINANCIAL STATEMENTS. |
|
Financial Highlights |
| Net Asset | Net | Net Realized and Unrealized | Distributions | Distributions from Net | Ratio of Expenses to Average Net Assets | Ratio of Net Investment | |||||||||||||||||||||||||||||||||||||||||||||||||||||||||
| Value, Beginning of Period | Investment Income (Loss) | Gain (Loss) on Investments and Foreign Currency | Total from Investment Operations | from Net Investment Income | Realized Gain on Investments and Foreign Currency | Distributions | Total Distributions | Shareholder Redemption Fees | Net Asset Value, End of Period | Total Return | Net Assets, End of Period (in thousands) | Prior to Fee Waivers and Balance Credits | Prior to Fee Waivers | Net of Fee Waivers | Income (Loss) to Average Net Assets | Portfolio Turnover Rate | |||||||||||||||||||||||||||||||||||||||||||||||
|
|
|
|
|
|
|
|
|
|
|
|
|
|
|
|
|
|
|
|
|
|
|
|
|
|
|
|
|
|
|
|
|
|
|
|
|
|
|
|
|
|
|
|
|
|
|
|
|
|
|
|
|
|
|
|
|
|
|
|
|
|
|
|
| Royce Total Return Fund – W Class | |||||||||||||||||||||||||||||||||||||||||||||||||||||||||||||||
| 2012 | $ | 12.69 | $ | 0.26 | $ | 1.54 | $ | 1.80 | $ | (0.25 | ) | $ | (0.62 | ) | $ | – | $ | (0.87 | ) | $ | – | $ | 13.62 | 14.41 | % | $ | 171,603 | 1.12 | % | 1.12 | % | 1.12 | % | 1.97 | % | 17 | % | ||||||||||||||||||||||||||
| 2011 | 13.19 | 0.16 | (0.37 | ) | (0.21 | ) | (0.14 | ) | (0.15 | ) | – | (0.29 | ) | – | 12.69 | (1.58 | ) | 132,488 | 1.05 | 1.05 | 1.05 | 1.27 | 21 | ||||||||||||||||||||||||||||||||||||||||
| 2010 | 10.83 | 0.20 | 2.32 | 2.52 | (0.16 | ) | – | – | (0.16 | ) | – | 13.19 | 23.44 | 75,063 | 1.09 | 1.09 | 1.09 | 1.74 | 15 | ||||||||||||||||||||||||||||||||||||||||||||
| 2009 | 8.71 | 0.16 | 2.10 | 2.26 | (0.14 | ) | – | – | (0.14 | ) | – | 10.83 | 26.28 | 48,058 | 1.13 | 1.13 | 1.13 | 1.78 | 20 | ||||||||||||||||||||||||||||||||||||||||||||
| 2008 | 12.95 | 0.23 | (4.23 | ) | (4.00 | ) | (0.24 | ) | (0.00 | ) | – | (0.24 | ) | – | 8.71 | (31.18 | ) | 65,260 | 1.08 | 1.08 | 1.08 | 1.66 | 25 | ||||||||||||||||||||||||||||||||||||||||
| Royce Total Return Fund – R Class | |||||||||||||||||||||||||||||||||||||||||||||||||||||||||||||||
| 2012 | $ | 12.79 | $ | 0.18 | $ | 1.55 | $ | 1.73 | $ | (0.08 | ) | $ | (0.62 | ) | $ | – | $ | (0.70 | ) | $ | – | $ | 13.82 | 13.66 | % | $ | 48,797 | 1.74 | % | 1.74 | % | 1.74 | % | 1.36 | % | 17 | % | ||||||||||||||||||||||||||
| 2011 | 13.28 | 0.08 | (0.38 | ) | (0.30 | ) | (0.04 | ) | (0.15 | ) | – | (0.19 | ) | – | 12.79 | (2.23 | ) | 34,695 | 1.68 | 1.68 | 1.68 | 0.62 | 21 | ||||||||||||||||||||||||||||||||||||||||
| 2010 | 10.88 | 0.15 | 2.32 | 2.47 | (0.07 | ) | – | – | (0.07 | ) | – | 13.28 | 22.76 | 20,011 | 1.71 | 1.71 | 1.71 | 1.20 | 15 | ||||||||||||||||||||||||||||||||||||||||||||
| 2009 | 8.74 | 0.10 | 2.10 | 2.20 | (0.06 | ) | – | – | (0.06 | ) | – | 10.88 | 25.43 | 6,450 | 1.85 | 1.85 | 1.84 | 1.05 | 20 | ||||||||||||||||||||||||||||||||||||||||||||
| 2008 | 12.93 | 0.11 | (4.19 | ) | (4.08 | ) | (0.11 | ) | (0.00 | ) | – | (0.11 | ) | – | 8.74 | (31.67 | ) | 2,946 | 2.03 | 2.02 | 1.84 | 1.10 | 25 | ||||||||||||||||||||||||||||||||||||||||
| Royce Total Return Fund – K Class c | |||||||||||||||||||||||||||||||||||||||||||||||||||||||||||||||
| 2012 | $ | 9.90 | $ | 0.17 | $ | 1.21 | $ | 1.38 | $ | (0.13 | ) | $ | (0.62 | ) | $ | – | $ | (0.75 | ) | $ | – | $ | 10.53 | 14.08 | % | $ | 163,412 | 1.43 | % | 1.43 | % | 1.43 | % | 1.51 | % | 17 | % | ||||||||||||||||||||||||||
| 2011 | 10.31 | 0.09 | (0.30 | ) | (0.21 | ) | (0.05 | ) | (0.15 | ) | – | (0.20 | ) | – | 9.90 | (1.97 | ) | 177,812 | 1.44 | 1.44 | 1.44 | 0.90 | 21 | ||||||||||||||||||||||||||||||||||||||||
| 2010 | 8.47 | 0.13 | 1.81 | 1.94 | (0.10 | ) | – | – | (0.10 | ) | – | 10.31 | 23.08 | 95,319 | 1.43 | 1.43 | 1.43 | 1.46 | 15 | ||||||||||||||||||||||||||||||||||||||||||||
| 2009 | 6.81 | 0.11 | 1.63 | 1.74 | (0.08 | ) | – | – | (0.08 | ) | – | 8.47 | 25.89 | 43,281 | 1.42 | 1.42 | 1.42 | 1.44 | 20 | ||||||||||||||||||||||||||||||||||||||||||||
| 2008 | 10.00 | 0.02 | (3.07 | ) | (3.05 | ) | (0.14 | ) | (0.00 | ) | – | (0.14 | ) | – | 6.81 | (30.56 | )1 | 14,064 | 1.46 | 2 | 1.46 | 2 | 1.46 | 2 | 1.81 | 2 | 25 | ||||||||||||||||||||||||||||||||||||
| Royce Heritage Fund – Investment Class | |||||||||||||||||||||||||||||||||||||||||||||||||||||||||||||||
| 2012 | $ | 13.07 | $ | 0.10 | $ | 1.80 | $ | 1.90 | $ | (0.13 | ) | $ | (0.36 | ) | $ | – | $ | (0.49 | ) | $ | – | $ | 14.48 | 14.70 | % | $ | 40,374 | 1.20 | % | 1.20 | % | 1.20 | % | 0.94 | % | 39 | % | ||||||||||||||||||||||||||
| 2011 | 15.10 | 0.01 | (1.41 | ) | (1.40 | ) | (0.05 | ) | (0.59 | ) | – | (0.64 | ) | 0.01 | 13.07 | (9.16 | ) | 21,088 | 1.22 | 1.22 | 1.22 | 0.15 | 51 | ||||||||||||||||||||||||||||||||||||||||
| 2010 | 12.12 | 0.04 | 3.31 | 3.35 | (0.08 | ) | (0.29 | ) | – | (0.37 | ) | – | 15.10 | 27.71 | 13,313 | 1.25 | 1.25 | 1.24 | 0.35 | 66 | |||||||||||||||||||||||||||||||||||||||||||
| 2009 | 7.97 | 0.02 | 4.13 | 4.15 | – | – | – | – | – | 12.12 | 52.07 | 10,052 | 1.34 | 1.34 | 1.24 | 0.19 | 59 | ||||||||||||||||||||||||||||||||||||||||||||||
| 2008 | 12.88 | 0.04 | (4.70 | ) | (4.66 | ) | – | (0.25 | ) | – | (0.25 | ) | – | 7.97 | (36.07 | ) | 5,522 | 1.39 | 1.38 | 1.24 | 0.40 | 128 | |||||||||||||||||||||||||||||||||||||||||
| Royce Heritage Fund – Service Class | |||||||||||||||||||||||||||||||||||||||||||||||||||||||||||||||
| 2012 | $ | 13.00 | $ | 0.08 | $ | 1.78 | $ | 1.86 | $ | (0.05 | ) | $ | (0.36 | ) | $ | – | $ | (0.41 | ) | $ | – | $ | 14.45 | 14.39 | % | $ | 203,112 | 1.46 | % | 1.46 | % | 1.45 | % | 0.56 | % | 39 | % | ||||||||||||||||||||||||||
| 2011 | 15.03 | (0.01 | ) | (1.40 | ) | (1.41 | ) | (0.03 | ) | (0.59 | ) | – | (0.62 | ) | – | 13.00 | (9.39 | ) | 218,770 | 1.47 | 1.47 | 1.44 | (0.07 | ) | 51 | ||||||||||||||||||||||||||||||||||||||
| 2010 | 12.07 | 0.03 | 3.28 | 3.31 | (0.06 | ) | (0.29 | ) | – | (0.35 | ) | – | 15.03 | 27.50 | 243,822 | 1.47 | 1.47 | 1.38 | 0.21 | 66 | |||||||||||||||||||||||||||||||||||||||||||
| 2009 | 7.95 | (0.00 | ) | 4.12 | 4.12 | – | – | – | – | – | 12.07 | 51.82 | 182,690 | 1.51 | 1.51 | 1.42 | (0.02 | ) | 59 | ||||||||||||||||||||||||||||||||||||||||||||
| 2008 | 12.88 | 0.02 | (4.70 | ) | (4.68 | ) | – | (0.25 | ) | – | (0.25 | ) | – | 7.95 | (36.22 | ) | 78,526 | 1.50 | 1.49 | 1.49 | 0.14 | 128 | |||||||||||||||||||||||||||||||||||||||||
| Royce Heritage Fund – Consultant Class | |||||||||||||||||||||||||||||||||||||||||||||||||||||||||||||||
| 2012 | $ | 10.64 | $ | (0.04 | ) | $ | 1.44 | $ | 1.40 | $ | – | $ | (0.36 | ) | $ | – | $ | (0.36 | ) | $ | – | $ | 11.68 | 13.30 | % | $ | 13,909 | 2.41 | % | 2.41 | % | 2.41 | % | (0.39 | )% | 39 | % | ||||||||||||||||||||||||||
| 2011 | 12.50 | (0.11 | ) | (1.16 | ) | (1.27 | ) | – | (0.59 | ) | – | (0.59 | ) | – | 10.64 | (10.14 | ) | 13,850 | 2.28 | 2.28 | 2.28 | (0.91 | ) | 51 | |||||||||||||||||||||||||||||||||||||||
| 2010 | 10.14 | (0.08 | ) | 2.73 | 2.65 | – | (0.29 | ) | – | (0.29 | ) | – | 12.50 | 26.22 | 12,801 | 2.36 | 2.36 | 2.36 | (0.77 | ) | 66 | ||||||||||||||||||||||||||||||||||||||||||
| 2009 | 6.75 | (0.09 | ) | 3.48 | 3.39 | – | – | – | – | – | 10.14 | 50.22 | 7,485 | 2.55 | 2.55 | 2.49 | (1.05 | ) | 59 | ||||||||||||||||||||||||||||||||||||||||||||
| 2008 | 11.10 | (0.08 | ) | (4.03 | ) | (4.11 | ) | – | (0.25 | ) | – | (0.25 | ) | 0.01 | 6.75 | (36.81 | ) | 4,609 | 2.69 | 2.68 | 2.49 | (0.86 | ) | 128 | |||||||||||||||||||||||||||||||||||||||
| THE ACCOMPANYING NOTES ARE AN INTEGRAL PART OF THESE FINANCIAL STATEMENTS. | The Royce Funds 2012 Annual Report to Shareholders | 103 |
|
Financial Highlights |
| Net Asset | Net | Net Realized and Unrealized | Distributions | Distributions from Net | Ratio of Expenses to Average Net Assets | Ratio of Net Investment | |||||||||||||||||||||||||||||||||||||||||||||||||||||||||
| Value, Beginning of Period | Investment Income (Loss) | Gain (Loss) on Investments and Foreign Currency | Total from Investment Operations | from Net Investment Income | Realized Gain on Investments and Foreign Currency | Distributions | Total Distributions | Shareholder Redemption Fees | Net Asset Value, End of Period | Total Return | Net Assets, End of Period (in thousands) | Prior to Fee Waivers and Balance Credits | Prior to Fee Waivers | Net of Fee Waivers | Income (Loss) to Average Net Assets | Portfolio Turnover Rate | |||||||||||||||||||||||||||||||||||||||||||||||
|
|
|
|
|
|
|
|
|
|
|
|
|
|
|
|
|
|
|
|
|
|
|
|
|
|
|
|
|
|
|
|
|
|
|
|
|
|
|
|
|
|
|
|
|
|
|
|
|
|
|
|
|
|
|
|
|
|
|
|
|
|
|
|
| Royce Heritage Fund – R Class b | |||||||||||||||||||||||||||||||||||||||||||||||||||||||||||||||
| 2012 | $ | 9.87 | $ | 0.02 | $ | 1.34 | $ | 1.36 | $ | (0.01 | ) | $ | (0.36 | ) | $ | – | $ | (0.37 | ) | $ | – | $ | 10.86 | 13.88 | % | $ | 4,832 | 1.95 | % | 1.95 | % | 1.84 | % | 0.17 | % | 39 | % | ||||||||||||||||||||||||||
| 2011 | 11.63 | (0.06 | ) | (1.07 | ) | (1.13 | ) | (0.04 | ) | (0.59 | ) | – | (0.63 | ) | – | 9.87 | (9.73 | ) | 4,081 | 1.90 | 1.90 | 1.84 | (0.45 | ) | 51 | ||||||||||||||||||||||||||||||||||||||
| 2010 | 9.43 | (0.03 | ) | 2.55 | 2.52 | (0.03 | ) | (0.29 | ) | – | (0.32 | ) | – | 11.63 | 26.84 | 1,909 | 2.22 | 2.22 | 1.84 | (0.25 | ) | 66 | |||||||||||||||||||||||||||||||||||||||||
| 2009 | 6.23 | (0.05 | ) | 3.25 | 3.20 | – | – | – | – | – | 9.43 | 51.36 | 832 | 4.03 | 4.03 | 1.84 | (0.56 | ) | 59 | ||||||||||||||||||||||||||||||||||||||||||||
| 2008 | 10.00 | (0.01 | ) | (3.51 | ) | (3.52 | ) | – | (0.25 | ) | – | (0.25 | ) | – | 6.23 | (35.05 | )1 | 65 | 19.77 | 2 | 19.76 | 2 | 1.84 | 2 | (0.27 | )2 | 128 | ||||||||||||||||||||||||||||||||||||
| Royce Heritage Fund – K Class b | |||||||||||||||||||||||||||||||||||||||||||||||||||||||||||||||
| 2012 | $ | 9.93 | $ | 0.04 | $ | 1.36 | $ | 1.40 | $ | (0.07 | ) | $ | (0.36 | ) | $ | – | $ | (0.43 | ) | $ | – | $ | 10.90 | 14.22 | % | $ | 7,077 | 1.61 | % | 1.61 | % | 1.59 | % | 0.42 | % | 39 | % | ||||||||||||||||||||||||||
| 2011 | 11.68 | (0.04 | ) | (1.08 | ) | (1.12 | ) | (0.04 | ) | (0.59 | ) | – | (0.63 | ) | – | 9.93 | (9.53 | ) | 7,787 | 1.66 | 1.66 | 1.59 | (0.24 | ) | 51 | ||||||||||||||||||||||||||||||||||||||
| 2010 | 9.46 | (0.03 | ) | 2.60 | 2.57 | (0.06 | ) | (0.29 | ) | – | (0.35 | ) | – | 11.68 | 27.29 | 5,214 | 1.67 | 1.67 | 1.59 | (0.00 | ) | 66 | |||||||||||||||||||||||||||||||||||||||||
| 2009 | 6.24 | (0.02 | ) | 3.24 | 3.22 | – | – | – | – | – | 9.46 | 51.60 | 287 | 5.82 | 5.82 | 1.59 | (0.26 | ) | 59 | ||||||||||||||||||||||||||||||||||||||||||||
| 2008 | 10.00 | (0.00 | ) | (3.51 | ) | (3.51 | ) | – | (0.25 | ) | – | (0.25 | ) | – | 6.24 | (34.95 | )1 | 65 | 19.53 | 2 | 19.53 | 2 | 1.59 | 2 | (0.02 | )2 | 128 | ||||||||||||||||||||||||||||||||||||
| Royce Opportunity Fund – Investment Class | |||||||||||||||||||||||||||||||||||||||||||||||||||||||||||||||
| 2012 | $ | 10.32 | $ | 0.00 |
| $ | 2.30 | $ | 2.30 | $ | – | $ | (0.67 | ) | $ | – | $ | (0.67 | ) | $ | – | $ | 11.95 | 22.59 | % | $ | 921,473 | 1.13 | % | 1.13 | % | 1.13 | % | 0.02 | % | 34 | % | ||||||||||||||||||||||||||
| 2011 | 12.08 | (0.04 | ) | (1.53 | ) | (1.57 | ) | – | (0.19 | ) | – | (0.19 | ) | – | 10.32 | (12.95 | ) | 878,824 | 1.16 | 1.16 | 1.16 | (0.38 | ) | 35 | |||||||||||||||||||||||||||||||||||||||
| 2010 | 9.03 | (0.04 | ) | 3.09 | 3.05 | – | – | – | – | – | 12.08 | 33.78 | 1,170,607 | 1.17 | 1.17 | 1.17 | (0.44 | ) | 47 | ||||||||||||||||||||||||||||||||||||||||||||
| 2009 | 5.57 | (0.03 | ) | 3.49 | 3.46 | (0.00 | ) | – | – | (0.00 | ) | – | 9.03 | 62.14 | 836,268 | 1.22 | 1.22 | 1.22 | (0.43 | ) | 44 | ||||||||||||||||||||||||||||||||||||||||||
| 2008 | 11.02 | 0.06 | (5.12 | ) | (5.06 | ) | (0.05 | ) | (0.34 | ) | – | (0.39 | ) | – | 5.57 | (45.73 | ) | 581,860 | 1.17 | 1.17 | 1.17 | 0.63 | 52 | ||||||||||||||||||||||||||||||||||||||||
| Royce Opportunity Fund – Service Class | |||||||||||||||||||||||||||||||||||||||||||||||||||||||||||||||
| 2012 | $ | 10.03 | $ | (0.04 | ) | $ | 2.23 | $ | 2.19 | $ | – | $ | (0.67 | ) | $ | – | $ | (0.67 | ) | $ | – | $ | 11.55 | 22.14 | % | $ | 205,084 | 1.46 | % | 1.46 | % | 1.46 | % | (0.32 | )% | 34 | % | ||||||||||||||||||||||||||
| 2011 | 11.78 | (0.08 | ) | (1.49 | ) | (1.57 | ) | – | (0.19 | ) | – | (0.19 | ) | 0.01 | 10.03 | (13.20 | ) | 160,496 | 1.48 | 1.48 | 1.48 | (0.73 | ) | 35 | |||||||||||||||||||||||||||||||||||||||
| 2010 | 8.83 | (0.08 | ) | 3.03 | 2.95 | – | – | – | – | – | 11.78 | 33.41 | 312,728 | 1.46 | 1.46 | 1.46 | (0.78 | ) | 47 | ||||||||||||||||||||||||||||||||||||||||||||
| 2009 | 5.46 | (0.05 | ) | 3.42 | 3.37 | – | – | – | – | – | 8.83 | 61.72 | 298,410 | 1.47 | 1.47 | 1.47 | (0.69 | ) | 44 | ||||||||||||||||||||||||||||||||||||||||||||
| 2008 | 10.80 | 0.04 | (5.00 | ) | (4.96 | ) | (0.04 | ) | (0.34 | ) | – | (0.38 | ) | – | 5.46 | (45.76 | ) | 162,607 | 1.41 | 1.41 | 1.34 | 0.40 | 52 | ||||||||||||||||||||||||||||||||||||||||
| Royce Opportunity Fund – Consultant Class | |||||||||||||||||||||||||||||||||||||||||||||||||||||||||||||||
| 2012 | $ | 9.67 | $ | (0.13 | ) | $ | 2.14 | $ | 2.01 | $ | – | $ | (0.67 | ) | $ | – | $ | (0.67 | ) | $ | – | $ | 11.01 | 21.09 | % | $ | 11,930 | 2.36 | % | 2.36 | % | 2.36 | % | (1.22 | )% | 34 | % | ||||||||||||||||||||||||||
| 2011 | 11.46 | (0.15 | ) | (1.45 | ) | (1.60 | ) | – | (0.19 | ) | – | (0.19 | ) | – | 9.67 | (13.91 | ) | 11,884 | 2.24 | 2.24 | 2.24 | (1.44 | ) | 35 | |||||||||||||||||||||||||||||||||||||||
| 2010 | 8.66 | (0.15 | ) | 2.95 | 2.80 | – | – | – | – | – | 11.46 | 32.33 | 13,126 | 2.29 | 2.29 | 2.29 | (1.56 | ) | 47 | ||||||||||||||||||||||||||||||||||||||||||||
| 2009 | 5.42 | (0.11 | ) | 3.35 | 3.24 | – | – | – | – | – | 8.66 | 59.78 | 7,500 | 2.45 | 2.45 | 2.45 | (1.66 | ) | 44 | ||||||||||||||||||||||||||||||||||||||||||||
| 2008 | 10.78 | (0.07 | ) | (4.95 | ) | (5.02 | ) | – | (0.34 | ) | – | (0.34 | ) | – | 5.42 | (46.40 | ) | 4,707 | 2.48 | 2.47 | 2.47 | (0.74 | ) | 52 | |||||||||||||||||||||||||||||||||||||||
| Royce Opportunity Fund – Institutional Class | |||||||||||||||||||||||||||||||||||||||||||||||||||||||||||||||
| 2012 | $ | 10.40 | $ | 0.01 |
| $ | 2.32 | $ | 2.33 | $ | – | $ | (0.67 | ) | $ | – | $ | (0.67 | ) | $ | – | $ | 12.06 | 22.70 | % | $ | 689,939 | 1.04 | % | 1.04 | % | 1.04 | % | 0.11 | % | 34 | % | ||||||||||||||||||||||||||
| 2011 | 12.16 | (0.03 | ) | (1.54 | ) | (1.57 | ) | – | (0.19 | ) | – | (0.19 | ) | – | 10.40 | (12.86 | ) | 574,826 | 1.03 | 1.03 | 1.03 | (0.24 | ) | 35 | |||||||||||||||||||||||||||||||||||||||
| 2010 | 9.07 | (0.03 | ) | 3.12 | 3.09 | – | – | – | – | – | 12.16 | 34.07 | 702,220 | 1.04 | 1.04 | 1.04 | (0.32 | ) | 47 | ||||||||||||||||||||||||||||||||||||||||||||
| 2009 | 5.60 | (0.02 | ) | 3.50 | 3.48 | (0.01 | ) | – | – | (0.01 | ) | – | 9.07 | 62.23 | 502,300 | 1.04 | 1.04 | 1.04 | (0.26 | ) | 44 | ||||||||||||||||||||||||||||||||||||||||||
| 2008 | 11.09 | 0.05 | (5.13 | ) | (5.08 | ) | (0.07 | ) | (0.34 | ) | – | (0.41 | ) | – | 5.60 | (45.66 | ) | 310,272 | 1.04 | 1.04 | 1.04 | 0.60 | 52 | ||||||||||||||||||||||||||||||||||||||||
| 104 | The Royce Funds 2012 Annual Report to Shareholders | THE ACCOMPANYING NOTES ARE AN INTEGRAL PART OF THESE FINANCIAL STATEMENTS. |
|
Financial Highlights |
| |||||||||||||||||||||||||||||||||||||||||||||||||||||||||
|
| Net |
| Net |
| Net Realized and Unrealized |
|
| Distributions |
| Distributions from Net |
|
|
|
|
|
|
|
|
| Ratio of Expenses to Average Net Assets |
| Ratio of Net Investment |
|
| ||||||||||||||||||||||||||||||||
|
| Asset Value, |
| Investment |
| Gain (Loss) on |
| Total from Investment Operations |
| from Net Investment Income |
| Realized Gain on |
| Distributions |
| Total Distributions |
| Shareholder Redemption Fees |
| Net Asset |
| Total Return |
| Net Assets, |
| Prior to Fee |
| Prior |
| Net of |
| Income (Loss) |
| Portfolio Turnover Rate |
| ||||||||||||||||||||||
|
|
|
|
|
|
|
|
|
|
|
|
|
|
|
|
|
|
|
|
|
|
|
|
|
|
|
|
|
|
|
|
|
|
|
|
|
|
|
|
|
|
|
|
|
|
|
|
|
|
|
|
|
|
|
|
|
|
Royce Opportunity Fund – R Class | |||||||||||||||||||||||||||||||||||||||||||||||||||||||||
2012 |
| $ | 9.98 |
| $ | (0.07 | ) | $ | 2.22 |
| $ | 2.15 |
| $ | – |
| $ | (0.67 | ) | $ | – |
| $ | (0.67 | ) | $ | – |
| $ | 11.46 |
|
| 21.85 | % | $ | 6,612 |
|
| 2.01 | % |
|
| 2.01 | % |
|
| 1.84 | % |
|
| (0.62 | )% |
|
| 34 | % |
|
2011 |
|
| 11.78 |
|
| (0.10 | ) |
| (1.51 | ) |
| (1.61 | ) |
| – |
|
| (0.19 | ) |
| – |
|
| (0.19 | ) |
| – |
|
| 9.98 |
|
| (13.62 | ) |
| 3,088 |
|
| 2.03 |
|
|
| 2.03 |
|
|
| 1.84 |
|
|
| (0.98 | ) |
|
| 35 |
|
|
2010 |
|
| 8.86 |
|
| (0.11 | ) |
| 3.03 |
|
| 2.92 |
|
| – |
|
| – |
|
| – |
|
| – |
|
| – |
|
| 11.78 |
|
| 32.96 |
|
| 1,407 |
|
| 2.88 |
|
|
| 2.88 |
|
|
| 1.84 |
|
|
| (1.06 | ) |
|
| 47 |
|
|
2009 |
|
| 5.50 |
|
| (0.07 | ) |
| 3.43 |
|
| 3.36 |
|
| – |
|
| – |
|
| – |
|
| – |
|
| – |
|
| 8.86 |
|
| 61.09 |
|
| 341 |
|
| 9.91 |
|
|
| 9.91 |
|
|
| 1.84 |
|
|
| (1.05 | ) |
|
| 44 |
|
|
2008 |
|
| 11.02 |
|
| (0.06 | ) |
| (5.08 | ) |
| (5.14 | ) |
| (0.04 | ) |
| (0.34 | ) |
| – |
|
| (0.38 | ) |
| – |
|
| 5.50 |
|
| (46.50 | ) |
| 64 |
|
| 18.28 |
|
|
| 18.27 |
|
|
| 1.84 |
|
|
| (0.04 | ) |
|
| 52 |
|
|
Royce Opportunity Fund – K Class b | |||||||||||||||||||||||||||||||||||||||||||||||||||||||||
2012 |
| $ | 9.33 |
| $ | (0.04 | ) | $ | 2.08 |
| $ | 2.04 |
| $ | – |
| $ | (0.67 | ) | $ | – |
| $ | (0.67 | ) | $ | – |
| $ | 10.70 |
|
| 22.19 | % | $ | 8,828 |
|
| 1.52 | % |
|
| 1.52 | % |
|
| 1.52 | % |
|
| (0.36 | )% |
|
| 34 | % |
|
2011 |
|
| 10.98 |
|
| (0.07 | ) |
| (1.39 | ) |
| (1.46 | ) |
| – |
|
| (0.19 | ) |
| – |
|
| (0.19 | ) |
| – |
|
| 9.33 |
|
| (13.25 | ) |
| 6,484 |
|
| 1.46 |
|
|
| 1.46 |
|
|
| 1.46 |
|
|
| (0.68 | ) |
|
| 35 |
|
|
2010 |
|
| 8.24 |
|
| (0.07 | ) |
| 2.81 |
|
| 2.74 |
|
| – |
|
| – |
|
| – |
|
| – |
|
| – |
|
| 10.98 |
|
| 33.25 |
|
| 6,657 |
|
| 1.63 |
|
|
| 1.63 |
|
|
| 1.59 |
|
|
| (0.76 | ) |
|
| 47 |
|
|
2009 |
|
| 5.11 |
|
| (0.06 | ) |
| 3.19 |
|
| 3.13 |
|
| – |
|
| – |
|
| – |
|
| – |
|
| – |
|
| 8.24 |
|
| 61.25 |
|
| 286 |
|
| 6.85 |
|
|
| 6.85 |
|
|
| 1.59 |
|
|
| (0.86 | ) |
|
| 44 |
|
|
2008 |
|
| 10.00 |
|
| (0.00 | ) |
| (4.51 | ) |
| (4.51 | ) |
| (0.04 | ) |
| (0.34 | ) |
| – |
|
| (0.38 | ) |
| – |
|
| 5.11 |
|
| (44.92 | )1 |
| 24 |
|
| 44.39 | 2 |
|
| 44.39 | 2 |
|
| 1.59 | 2 |
|
| (0.06 | )2 |
|
| 52 |
|
|
Royce Special Equity Fund – Investment Class | |||||||||||||||||||||||||||||||||||||||||||||||||||||||||
2012 |
| $ | 19.70 |
| $ | 0.46 |
| $ | 2.53 |
| $ | 2.99 |
| $ | (0.46 | ) | $ | (1.10 | ) | $ | – |
| $ | (1.56 | ) | $ | – |
| $ | 21.13 |
|
| 15.36 | % | $ | 2,048,091 |
|
| 1.13 | % |
|
| 1.13 | % |
|
| 1.13 | % |
|
| 2.20 | % |
|
| 31 | % |
|
2011 |
|
| 20.87 |
|
| 0.05 |
|
| (0.05 | ) |
| 0.00 |
|
| (0.09 | ) |
| (1.08 | ) |
| – |
|
| (1.17 | ) |
| – |
|
| 19.70 |
|
| 0.08 |
|
| 1,677,393 |
|
| 1.15 |
|
|
| 1.15 |
|
|
| 1.15 |
|
|
| 0.23 |
|
|
| 23 |
|
|
2010 |
|
| 17.50 |
|
| 0.14 |
|
| 3.29 |
|
| 3.43 |
|
| (0.06 | ) |
| – |
|
| – |
|
| (0.06 | ) |
| – |
|
| 20.87 |
|
| 19.61 |
|
| 1,487,632 |
|
| 1.17 |
|
|
| 1.16 |
|
|
| 1.16 |
|
|
| 0.78 |
|
|
| 21 |
|
|
2009 |
|
| 13.69 |
|
| 0.07 |
|
| 3.80 |
|
| 3.87 |
|
| (0.07 | ) |
| – |
|
| – |
|
| (0.07 | ) |
| 0.01 |
|
| 17.50 |
|
| 28.38 |
|
| 842,678 |
|
| 1.17 |
|
|
| 1.17 |
|
|
| 1.17 |
|
|
| 0.62 |
|
|
| 10 |
|
|
2008 |
|
| 18.27 |
|
| 0.21 |
|
| (3.83 | ) |
| (3.62 | ) |
| (0.21 | ) |
| (0.75 | ) |
| – |
|
| (0.96 | ) |
| – |
|
| 13.69 |
|
| (19.62 | ) |
| 316,558 |
|
| 1.15 |
|
|
| 1.15 |
|
|
| 1.15 |
|
|
| 1.32 |
|
|
| 27 |
|
|
Royce Special Equity Fund – Service Class | |||||||||||||||||||||||||||||||||||||||||||||||||||||||||
2012 |
| $ | 19.66 |
| $ | 0.42 |
| $ | 2.52 |
| $ | 2.94 |
| $ | (0.38 | ) | $ | (1.10 | ) | $ | – |
| $ | (1.48 | ) | $ | – |
| $ | 21.12 |
|
| 15.10 | % | $ | 250,915 |
|
| 1.43 | % |
|
| 1.43 | % |
|
| 1.39 | % |
|
| 1.90 | % |
|
| 31 | % |
|
2011 |
|
| 20.83 |
|
| 0.00 |
|
| (0.05 | ) |
| (0.05 | ) |
| (0.05 | ) |
| (1.08 | ) |
| – |
|
| (1.13 | ) |
| 0.01 |
|
| 19.66 |
|
| (0.12 | ) |
| 216,143 |
|
| 1.45 |
|
|
| 1.45 |
|
|
| 1.39 |
|
|
| 0.00 |
|
|
| 23 |
|
|
2010 |
|
| 17.48 |
|
| 0.10 |
|
| 3.27 |
|
| 3.37 |
|
| (0.03 | ) |
| – |
|
| – |
|
| (0.03 | ) |
| 0.01 |
|
| 20.83 |
|
| 19.33 |
|
| 160,870 |
|
| 1.48 |
|
|
| 1.48 |
|
|
| 1.39 |
|
|
| 0.56 |
|
|
| 21 |
|
|
2009 |
|
| 13.69 |
|
| (0.00 | ) |
| 3.84 |
|
| 3.84 |
|
| (0.06 | ) |
| – |
|
| – |
|
| (0.06 | ) |
| 0.01 |
|
| 17.48 |
|
| 28.11 |
|
| 72,360 |
|
| 1.52 |
|
|
| 1.52 |
|
|
| 1.39 |
|
|
| 0.29 |
|
|
| 10 |
|
|
2008 |
|
| 18.28 |
|
| 0.11 |
|
| (3.77 | ) |
| (3.66 | ) |
| (0.19 | ) |
| (0.75 | ) |
| – |
|
| (0.94 | ) |
| 0.01 |
|
| 13.69 |
|
| (19.74 | ) |
| 9,549 |
|
| 1.83 |
|
|
| 1.82 |
|
|
| 1.35 |
|
|
| 1.27 |
|
|
| 27 |
|
|
Royce Special Equity Fund – Consultant Class | |||||||||||||||||||||||||||||||||||||||||||||||||||||||||
2012 |
| $ | 18.88 |
| $ | 0.23 |
| $ | 2.42 |
| $ | 2.65 |
| $ | (0.23 | ) | $ | (1.10 | ) | $ | – |
| $ | (1.33 | ) | $ | – |
| $ | 20.20 |
|
| 14.20 | % | $ | 57,755 |
|
| 2.18 | % |
|
| 2.18 | % |
|
| 2.18 | % |
|
| 1.13 | % |
|
| 31 | % |
|
2011 |
|
| 20.16 |
|
| (0.15 | ) |
| (0.05 | ) |
| (0.20 | ) |
| – |
|
| (1.08 | ) |
| – |
|
| (1.08 | ) |
| – |
|
| 18.88 |
|
| (0.93 | ) |
| 50,253 |
|
| 2.16 |
|
|
| 2.16 |
|
|
| 2.16 |
|
|
| (0.77 | ) |
|
| 23 |
|
|
2010 |
|
| 17.03 |
|
| (0.04 | ) |
| 3.17 |
|
| 3.13 |
|
| – |
|
| – |
|
| – |
|
| – |
|
| – |
|
| 20.16 |
|
| 18.38 |
|
| 38,497 |
|
| 2.17 |
|
|
| 2.17 |
|
|
| 2.17 |
|
|
| (0.22 | ) |
|
| 21 |
|
|
2009 |
|
| 13.42 |
|
| (0.06 | ) |
| 3.67 |
|
| 3.61 |
|
| – |
|
| – |
|
| – |
|
| – |
|
| – |
|
| 17.03 |
|
| 26.90 |
|
| 20,891 |
|
| 2.23 |
|
|
| 2.23 |
|
|
| 2.23 |
|
|
| (0.41 | ) |
|
| 10 |
|
|
2008 |
|
| 17.87 |
|
| 0.03 |
|
| (3.72 | ) |
| (3.69 | ) |
| (0.01 | ) |
| (0.75 | ) |
| – |
|
| (0.76 | ) |
| – |
|
| 13.42 |
|
| (20.46 | ) |
| 11,460 |
|
| 2.26 |
|
|
| 2.26 |
|
|
| 2.26 |
|
|
| 0.18 |
|
|
| 27 |
|
|
Royce Special Equity Fund – Institutional Class | |||||||||||||||||||||||||||||||||||||||||||||||||||||||||
2012 |
| $ | 19.63 |
| $ | 0.49 |
| $ | 2.51 |
| $ | 3.00 |
| $ | (0.51 | ) | $ | (1.10 | ) | $ | – |
| $ | (1.61 | ) | $ | – |
| $ | 21.02 |
|
| 15.46 | % | $ | 571,388 |
|
| 1.02 | % |
|
| 1.02 | % |
|
| 1.02 | % |
|
| 2.28 | % |
|
| 31 | % |
|
2011 |
|
| 20.79 |
|
| 0.07 |
|
| (0.03 | ) |
| 0.04 |
|
| (0.12 | ) |
| (1.08 | ) |
| – |
|
| (1.20 | ) |
| – |
|
| 19.63 |
|
| 0.25 |
|
| 481,855 |
|
| 1.03 |
|
|
| 1.03 |
|
|
| 1.03 |
|
|
| 0.36 |
|
|
| 23 |
|
|
2010 |
|
| 17.44 |
|
| 0.16 |
|
| 3.27 |
|
| 3.43 |
|
| (0.08 | ) |
| – |
|
| – |
|
| (0.08 | ) |
| – |
|
| 20.79 |
|
| 19.69 |
|
| 445,168 |
|
| 1.04 |
|
|
| 1.04 |
|
|
| 1.04 |
|
|
| 0.91 |
|
|
| 21 |
|
|
2009 |
|
| 13.65 |
|
| 0.11 |
|
| 3.77 |
|
| 3.88 |
|
| (0.09 | ) |
| – |
|
| – |
|
| (0.09 | ) |
| – |
|
| 17.44 |
|
| 28.42 |
|
| 280,253 |
|
| 1.05 |
|
|
| 1.05 |
|
|
| 1.05 |
|
|
| 0.81 |
|
|
| 10 |
|
|
2008 |
|
| 18.22 |
|
| 0.21 |
|
| (3.80 | ) |
| (3.59 | ) |
| (0.23 | ) |
| (0.75 | ) |
| – |
|
| (0.98 | ) |
| – |
|
| 13.65 |
|
| (19.52 | ) |
| 161,840 |
|
| 1.05 |
|
|
| 1.05 |
|
|
| 1.05 |
|
|
| 1.43 |
|
|
| 27 |
|
|
|
|
|
THE ACCOMPANYING NOTES ARE AN INTEGRAL PART OF THESE FINANCIAL STATEMENTS. |
| The Royce Funds 2012 Annual Report to Shareholders | 105 |
|
Financial Highlights |
| |||||||||||||||||||||||||||||||||||||||||||||||||||||||||
|
| Net |
| Net |
| Net Realized and Unrealized |
|
| Distributions |
| Distributions from Net |
|
|
|
|
|
|
|
|
| Ratio of Expenses to Average Net Assets |
| Ratio of Net Investment |
|
| ||||||||||||||||||||||||||||||||
|
| Asset Value, |
| Investment |
| Gain (Loss) on |
| Total from Investment Operations |
| from Net Investment Income |
| Realized Gain on |
| Distributions |
| Total Distributions |
| Shareholder Redemption Fees |
| Net Asset |
| Total Return |
| Net Assets, |
| Prior to Fee |
| Prior |
| Net of |
| Income (Loss) |
| Portfolio Turnover Rate |
| ||||||||||||||||||||||
|
|
|
|
|
|
|
|
|
|
|
|
|
|
|
|
|
|
|
|
|
|
|
|
|
|
|
|
|
|
|
|
|
|
|
|
|
|
|
|
|
|
|
|
|
|
|
|
|
|
|
|
|
|
|
|
|
|
Royce Value Fund – Investment Class | |||||||||||||||||||||||||||||||||||||||||||||||||||||||||
2012 |
| $ | 10.97 |
| $ | 0.15 |
| $ | 0.92 |
| $ | 1.07 |
| $ | (0.14 | ) | $ | (0.53 | ) | $ | – |
| $ | (0.67 | ) | $ | – |
| $ | 11.37 |
|
| 9.88 | % | $ | 206,316 |
|
| 1.19 | % |
|
| 1.19 | % |
|
| 1.19 | % |
|
| 1.22 | % |
|
| 25 | % |
|
2011 |
|
| 12.70 |
|
| 0.00 |
|
| (0.92 | ) |
| (0.92 | ) |
| (0.07 | ) |
| (0.75 | ) |
| – |
|
| (0.82 | ) |
| 0.01 |
|
| 10.97 |
|
| (7.17 | ) |
| 218,126 |
|
| 1.17 |
|
|
| 1.17 |
|
|
| 1.17 |
|
|
| 0.09 |
|
|
| 35 |
|
|
2010 |
|
| 10.16 |
|
| 0.03 |
|
| 2.55 |
|
| 2.58 |
|
| (0.04 | ) |
| – |
|
| – |
|
| (0.04 | ) |
| – |
|
| 12.70 |
|
| 25.42 |
|
| 115,007 |
|
| 1.16 |
|
|
| 1.16 |
|
|
| 1.16 |
|
|
| 0.32 |
|
|
| 35 |
|
|
2009 |
|
| 7.00 |
|
| 0.01 |
|
| 3.15 |
|
| 3.16 |
|
| – |
|
| – |
|
| – |
|
| – |
|
| – |
|
| 10.16 |
|
| 45.14 |
|
| 67,249 |
|
| 1.14 |
|
|
| 1.14 |
|
|
| 1.14 |
|
|
| 0.06 |
|
|
| 49 |
|
|
2008 |
|
| 10.62 |
|
| (0.01 | ) |
| (3.61 | ) |
| (3.62 | ) |
| – |
|
| – |
|
| – |
|
| – |
|
| – |
|
| 7.00 |
|
| (34.09 | ) |
| 18,993 |
|
| 1.16 |
|
|
| 1.16 |
|
|
| 1.16 |
|
|
| (0.06 | ) |
|
| 41 |
|
|
Royce Value Fund – Service Class | |||||||||||||||||||||||||||||||||||||||||||||||||||||||||
2012 |
| $ | 10.94 |
| $ | 0.12 |
| $ | 0.91 |
| $ | 1.03 |
| $ | (0.10 | ) | $ | (0.53 | ) | $ | – |
| $ | (0.63 | ) | $ | – |
| $ | 11.34 |
|
| 9.56 | % | $ | 831,673 |
|
| 1.45 | % |
|
| 1.45 | % |
|
| 1.45 | % |
|
| 0.90 | % |
|
| 25 | % |
|
2011 |
|
| 12.65 |
|
| (0.03 | ) |
| (0.92 | ) |
| (0.95 | ) |
| (0.02 | ) |
| (0.75 | ) |
| – |
|
| (0.77 | ) |
| 0.01 |
|
| 10.94 |
|
| (7.41 | ) |
| 1,083,903 |
|
| 1.45 |
|
|
| 1.45 |
|
|
| 1.44 |
|
|
| (0.23 | ) |
|
| 35 |
|
|
2010 |
|
| 10.13 |
|
| 0.00 |
|
| 2.53 |
|
| 2.53 |
|
| (0.01 | ) |
| – |
|
| – |
|
| (0.01 | ) |
| – |
|
| 12.65 |
|
| 24.97 |
|
| 1,415,766 |
|
| 1.46 |
|
|
| 1.46 |
|
|
| 1.44 |
|
|
| 0.04 |
|
|
| 35 |
|
|
2009 |
|
| 7.00 |
|
| (0.03 | ) |
| 3.16 |
|
| 3.13 |
|
| – |
|
| – |
|
| – |
|
| – |
|
| – |
|
| 10.13 |
|
| 44.71 |
|
| 1,178,806 |
|
| 1.47 |
|
|
| 1.47 |
|
|
| 1.45 |
|
|
| (0.31 | ) |
|
| 49 |
|
|
2008 |
|
| 10.64 |
|
| (0.03 | ) |
| (3.62 | ) |
| (3.65 | ) |
| – |
|
| – |
|
| – |
|
| – |
|
| 0.01 |
|
| 7.00 |
|
| (34.21 | ) |
| 704,406 |
|
| 1.45 |
|
|
| 1.45 |
|
|
| 1.45 |
|
|
| (0.34 | ) |
|
| 41 |
|
|
Royce Value Fund – Consultant Class | |||||||||||||||||||||||||||||||||||||||||||||||||||||||||
2012 |
| $ | 10.46 |
| $ | 0.02 |
| $ | 0.89 |
| $ | 0.91 |
| $ | (0.03 | ) | $ | (0.53 | ) | $ | – |
| $ | (0.56 | ) | $ | – |
| $ | 10.81 |
|
| 8.77 | % | $ | 33,480 |
|
| 2.26 | % |
|
| 2.26 | % |
|
| 2.26 | % |
|
| 0.15 | % |
|
| 25 | % |
|
2011 |
|
| 12.21 |
|
| (0.11 | ) |
| (0.89 | ) |
| (1.00 | ) |
| – |
|
| (0.75 | ) |
| – |
|
| (0.75 | ) |
| – |
|
| 10.46 |
|
| (8.20 | ) |
| 36,104 |
|
| 2.17 |
|
|
| 2.17 |
|
|
| 2.17 |
|
|
| (0.94 | ) |
|
| 35 |
|
|
2010 |
|
| 9.84 |
|
| (0.07 | ) |
| 2.44 |
|
| 2.37 |
|
| – |
|
| – |
|
| – |
|
| – |
|
| – |
|
| 12.21 |
|
| 24.09 |
|
| 35,167 |
|
| 2.18 |
|
|
| 2.18 |
|
|
| 2.18 |
|
|
| (0.69 | ) |
|
| 35 |
|
|
2009 |
|
| 6.85 |
|
| (0.09 | ) |
| 3.08 |
|
| 2.99 |
|
| – |
|
| – |
|
| – |
|
| – |
|
| – |
|
| 9.84 |
|
| 43.65 |
|
| 27,625 |
|
| 2.23 |
|
|
| 2.23 |
|
|
| 2.23 |
|
|
| (1.09 | ) |
|
| 49 |
|
|
2008 |
|
| 10.50 |
|
| (0.11 | ) |
| (3.54 | ) |
| (3.65 | ) |
| – |
|
| – |
|
| – |
|
| – |
|
| – |
|
| 6.85 |
|
| (34.76 | ) |
| 15,915 |
|
| 2.29 |
|
|
| 2.28 |
|
|
| 2.28 |
|
|
| (1.18 | ) |
|
| 41 |
|
|
Royce Value Fund – Institutional Class | |||||||||||||||||||||||||||||||||||||||||||||||||||||||||
2012 |
| $ | 10.98 |
| $ | 0.17 |
| $ | 0.92 |
| $ | 1.09 |
| $ | (0.16 | ) | $ | (0.53 | ) | $ | – |
| $ | (0.69 | ) | $ | – |
| $ | 11.38 |
|
| 10.04 | % | $ | 202,643 |
|
| 1.05 | % |
|
| 1.05 | % |
|
| 1.05 | % |
|
| 1.41 | % |
|
| 25 | % |
|
2011 |
|
| 12.71 |
|
| 0.03 |
|
| (0.94 | ) |
| (0.91 | ) |
| (0.07 | ) |
| (0.75 | ) |
| – |
|
| (0.82 | ) |
| – |
|
| 10.98 |
|
| (7.12 | ) |
| 190,591 |
|
| 1.04 |
|
|
| 1.04 |
|
|
| 1.04 |
|
|
| 0.19 |
|
|
| 35 |
|
|
2010 |
|
| 10.17 |
|
| 0.05 |
|
| 2.54 |
|
| 2.59 |
|
| (0.05 | ) |
| – |
|
| – |
|
| (0.05 | ) |
| – |
|
| 12.71 |
|
| 25.52 |
|
| 219,111 |
|
| 1.04 |
|
|
| 1.04 |
|
|
| 1.04 |
|
|
| 0.45 |
|
|
| 35 |
|
|
2009 |
|
| 7.00 |
|
| 0.01 |
|
| 3.16 |
|
| 3.17 |
|
| – |
|
| – |
|
| – |
|
| – |
|
| – |
|
| 10.17 |
|
| 45.29 |
|
| 167,215 |
|
| 1.04 |
|
|
| 1.04 |
|
|
| 1.04 |
|
|
| 0.10 |
|
|
| 49 |
|
|
2008 |
|
| 10.61 |
|
| 0.00 |
|
| (3.61 | ) |
| (3.61 | ) |
| – |
|
| – |
|
| – |
|
| – |
|
| – |
|
| 7.00 |
|
| (34.02 | ) |
| 114,244 |
|
| 1.04 |
|
|
| 1.04 |
|
|
| 1.04 |
|
|
| 0.03 |
|
|
| 41 |
|
|
Royce Value Fund – R Class | |||||||||||||||||||||||||||||||||||||||||||||||||||||||||
2012 |
| $ | 10.78 |
| $ | 0.07 |
| $ | 0.91 |
| $ | 0.98 |
| $ | (0.07 | ) | $ | (0.53 | ) | $ | – |
| $ | (0.60 | ) | $ | – |
| $ | 11.16 |
|
| 9.18 | % | $ | 37,679 |
|
| 1.85 | % |
|
| 1.85 | % |
|
| 1.85 | % |
|
| 0.59 | % |
|
| 25 | % |
|
2011 |
|
| 12.54 |
|
| (0.06 | ) |
| (0.91 | ) |
| (0.97 | ) |
| (0.04 | ) |
| (0.75 | ) |
| – |
|
| (0.79 | ) |
| – |
|
| 10.78 |
|
| (7.75 | ) |
| 34,151 |
|
| 1.68 |
|
|
| 1.68 |
|
|
| 1.68 |
|
|
| (0.44 | ) |
|
| 35 |
|
|
2010 |
|
| 10.05 |
|
| (0.02 | ) |
| 2.51 |
|
| 2.49 |
|
| (0.00 | ) |
| – |
|
| – |
|
| (0.00 | ) |
| – |
|
| 12.54 |
|
| 24.81 |
|
| 26,524 |
|
| 1.68 |
|
|
| 1.67 |
|
|
| 1.67 |
|
|
| (0.16 | ) |
|
| 35 |
|
|
2009 |
|
| 6.97 |
|
| (0.06 | ) |
| 3.14 |
|
| 3.08 |
|
| – |
|
| – |
|
| – |
|
| – |
|
| – |
|
| 10.05 |
|
| 44.19 |
|
| 6,114 |
|
| 2.08 |
|
|
| 2.08 |
|
|
| 1.84 |
|
|
| (0.68 | ) |
|
| 49 |
|
|
2008 |
|
| 10.63 |
|
| (0.06 | ) |
| (3.62 | ) |
| (3.68 | ) |
| – |
|
| – |
|
| – |
|
| – |
|
| 0.02 |
|
| 6.97 |
|
| (34.43 | ) |
| 326 |
|
| 6.72 |
|
|
| 6.71 |
|
|
| 1.84 |
|
|
| (0.68 | ) |
|
| 41 |
|
|
Royce Value Fund – K Class b | |||||||||||||||||||||||||||||||||||||||||||||||||||||||||
2012 |
| $ | 8.95 |
| $ | 0.09 |
| $ | 0.75 |
| $ | 0.84 |
| $ | (0.12 | ) | $ | (0.53 | ) | $ | – |
| $ | (0.65 | ) | $ | – |
| $ | 9.14 |
|
| 9.49 | % | $ | 18,209 |
|
| 1.53 | % |
|
| 1.53 | % |
|
| 1.53 | % |
|
| 0.98 | % |
|
| 25 | % |
|
2011 |
|
| 10.54 |
|
| (0.03 | ) |
| (0.77 | ) |
| (0.80 | ) |
| (0.04 | ) |
| (0.75 | ) |
| – |
|
| (0.79 | ) |
| – |
|
| 8.95 |
|
| (7.54 | ) |
| 14,079 |
|
| 1.54 |
|
|
| 1.54 |
|
|
| 1.54 |
|
|
| (0.33 | ) |
|
| 35 |
|
|
2010 |
|
| 8.46 |
|
| (0.00 | ) |
| 2.10 |
|
| 2.10 |
|
| (0.02 | ) |
| – |
|
| – |
|
| (0.02 | ) |
| – |
|
| 10.54 |
|
| 24.82 |
|
| 13,195 |
|
| 1.50 |
|
|
| 1.50 |
|
|
| 1.50 |
|
|
| 0.01 |
|
|
| 35 |
|
|
2009 |
|
| 5.91 |
|
| (0.03 | ) |
| 2.58 |
|
| 2.55 |
|
| – |
|
| – |
|
| – |
|
| – |
|
| – |
|
| 8.46 |
|
| 43.15 |
|
| 4,721 |
|
| 1.73 |
|
|
| 1.73 |
|
|
| 1.59 |
|
|
| (0.43 | ) |
|
| 49 |
|
|
2008 |
|
| 10.00 |
|
| (0.01 | ) |
| (4.08 | ) |
| (4.09 | ) |
| – |
|
| – |
|
| – |
|
| – |
|
| – |
|
| 5.91 |
|
| (40.90 | )1 |
| 1,550 |
|
| 9.63 | 2 |
|
| 9.63 | 2 |
|
| 1.59 | 2 |
|
| (0.35 | )2 |
|
| 41 |
|
|
|
|
|
106 | The Royce Funds 2012 Annual Report to Shareholders | THE ACCOMPANYING NOTES ARE AN INTEGRAL PART OF THESE FINANCIAL STATEMENTS. | |
|
Financial Highlights |
| |||||||||||||||||||||||||||||||||||||||||||||||||||||||||
|
| Net |
| Net |
| Net Realized and Unrealized |
|
| Distributions |
| Distributions from Net |
|
|
|
|
|
|
|
|
| Ratio of Expenses to Average Net Assets |
| Ratio of Net Investment |
|
| ||||||||||||||||||||||||||||||||
|
| Asset Value, |
| Investment |
| Gain (Loss) on |
| Total from Investment Operations |
| from Net Investment Income |
| Realized Gain on |
| Distributions |
| Total Distributions |
| Shareholder Redemption Fees |
| Net Asset |
| Total Return |
| Net Assets, |
| Prior to Fee |
| Prior |
| Net of |
| Income (Loss) |
| Portfolio Turnover Rate |
| ||||||||||||||||||||||
|
|
|
|
|
|
|
|
|
|
|
|
|
|
|
|
|
|
|
|
|
|
|
|
|
|
|
|
|
|
|
|
|
|
|
|
|
|
|
|
|
|
|
|
|
|
|
|
|
|
|
|
|
|
|
|
|
|
Royce Value Plus Fund – Investment Class | |||||||||||||||||||||||||||||||||||||||||||||||||||||||||
2012 |
| $ | 12.04 |
| $ | (0.02 | ) | $ | 1.88 |
| $ | 1.86 |
| $ | – |
| $ | – |
| $ | – |
| $ | – |
| $ | – |
| $ | 13.90 |
|
| 15.45 | % | $ | 228,016 |
|
| 1.27 | % |
|
| 1.27 | % |
|
| 1.27 | % |
|
| (0.14 | )% |
|
| 32 | % |
|
2011 |
|
| 13.52 |
|
| (0.06 | ) |
| (1.27 | ) |
| (1.33 | ) |
| (0.15 | ) |
| – |
|
| – |
|
| (0.15 | ) |
| – |
|
| 12.04 |
|
| (9.79 | ) |
| 298,073 |
|
| 1.13 |
|
|
| 1.13 |
|
|
| 1.13 |
|
|
| (0.42 | ) |
|
| 49 |
|
|
2010 |
|
| 11.31 |
|
| (0.02 | ) |
| 2.31 |
|
| 2.29 |
|
| (0.08 | ) |
| – |
|
| – |
|
| (0.08 | ) |
| – |
|
| 13.52 |
|
| 20.25 |
|
| 305,161 |
|
| 1.08 |
|
|
| 1.08 |
|
|
| 1.08 |
|
|
| (0.14 | ) |
|
| 48 |
|
|
2009 |
|
| 7.97 |
|
| 0.01 |
|
| 3.33 |
|
| 3.34 |
|
| – |
|
| – |
|
| – |
|
| – |
|
| – |
|
| 11.31 |
|
| 41.91 |
|
| 261,906 |
|
| 1.06 |
|
|
| 1.06 |
|
|
| 1.06 |
|
|
| 0.13 |
|
|
| 39 |
|
|
2008 |
|
| 13.80 |
|
| (0.02 | ) |
| (5.63 | ) |
| (5.65 | ) |
| – |
|
| (0.18 | ) |
| – |
|
| (0.18 | ) |
| – |
|
| 7.97 |
|
| (40.88 | ) |
| 122,043 |
|
| 1.07 |
|
|
| 1.07 |
|
|
| 1.07 |
|
|
| (0.15 | ) |
|
| 42 |
|
|
Royce Value Plus Fund – Service Class | |||||||||||||||||||||||||||||||||||||||||||||||||||||||||
2012 |
| $ | 12.00 |
| $ | (0.04 | ) | $ | 1.87 |
| $ | 1.83 |
| $ | – |
| $ | – |
| $ | – |
| $ | – |
| $ | – |
| $ | 13.83 |
|
| 15.25 | % | $ | 966,735 |
|
| 1.45 | % |
|
| 1.45 | % |
|
| 1.44 | % |
|
| (0.33 | )% |
|
| 32 | % |
|
2011 |
|
| 13.42 |
|
| (0.08 | ) |
| (1.26 | ) |
| (1.34 | ) |
| (0.08 | ) |
| – |
|
| – |
|
| (0.08 | ) |
| – |
|
| 12.00 |
|
| (9.98 | ) |
| 1,417,973 |
|
| 1.44 |
|
|
| 1.44 |
|
|
| 1.42 |
|
|
| (0.74 | ) |
|
| 49 |
|
|
2010 |
|
| 11.24 |
|
| (0.06 | ) |
| 2.27 |
|
| 2.21 |
|
| (0.03 | ) |
| – |
|
| – |
|
| (0.03 | ) |
| – |
|
| 13.42 |
|
| 19.70 |
|
| 2,454,325 |
|
| 1.44 |
|
|
| 1.44 |
|
|
| 1.42 |
|
|
| (0.53 | ) |
|
| 48 |
|
|
2009 |
|
| 7.95 |
|
| (0.02 | ) |
| 3.31 |
|
| 3.29 |
|
| – |
|
| – |
|
| – |
|
| – |
|
| – |
|
| 11.24 |
|
| 41.38 |
|
| 2,505,017 |
|
| 1.47 |
|
|
| 1.47 |
|
|
| 1.45 |
|
|
| (0.25 | ) |
|
| 39 |
|
|
2008 |
|
| 13.81 |
|
| (0.06 | ) |
| (5.62 | ) |
| (5.68 | ) |
| – |
|
| (0.18 | ) |
| – |
|
| (0.18 | ) |
| – |
|
| 7.95 |
|
| (41.07 | ) |
| 1,709,764 |
|
| 1.44 |
|
|
| 1.43 |
|
|
| 1.43 |
|
|
| (0.53 | ) |
|
| 42 |
|
|
Royce Value Plus Fund – Consultant Class | |||||||||||||||||||||||||||||||||||||||||||||||||||||||||
2012 |
| $ | 11.60 |
| $ | (0.15 | ) | $ | 1.79 |
| $ | 1.64 |
| $ | – |
| $ | – |
| $ | – |
| $ | – |
| $ | – |
| $ | 13.24 |
|
| 14.14 | % | $ | 19,618 |
|
| 2.37 | % |
|
| 2.37 | % |
|
| 2.37 | % |
|
| (1.21 | )% |
|
| 32 | % |
|
2011 |
|
| 12.99 |
|
| (0.19 | ) |
| (1.20 | ) |
| (1.39 | ) |
| – |
|
| – |
|
| – |
|
| – |
|
| – |
|
| 11.60 |
|
| (10.70 | ) |
| 20,245 |
|
| 2.19 |
|
|
| 2.19 |
|
|
| 2.19 |
|
|
| (1.50 | ) |
|
| 49 |
|
|
2010 |
|
| 10.93 |
|
| (0.14 | ) |
| 2.20 |
|
| 2.06 |
|
| – |
|
| – |
|
| – |
|
| – |
|
| – |
|
| 12.99 |
|
| 18.85 |
|
| 30,279 |
|
| 2.16 |
|
|
| 2.16 |
|
|
| 2.16 |
|
|
| (1.26 | ) |
|
| 48 |
|
|
2009 |
|
| 7.79 |
|
| (0.09 | ) |
| 3.23 |
|
| 3.14 |
|
| – |
|
| – |
|
| – |
|
| – |
|
| – |
|
| 10.93 |
|
| 40.31 |
|
| 31,154 |
|
| 2.20 |
|
|
| 2.20 |
|
|
| 2.20 |
|
|
| (0.98 | ) |
|
| 39 |
|
|
2008 |
|
| 13.65 |
|
| (0.15 | ) |
| (5.53 | ) |
| (5.68 | ) |
| – |
|
| (0.18 | ) |
| – |
|
| (0.18 | ) |
| – |
|
| 7.79 |
|
| (41.55 | ) |
| 26,024 |
|
| 2.21 |
|
|
| 2.21 |
|
|
| 2.21 |
|
|
| (1.30 | ) |
|
| 42 |
|
|
Royce Value Plus Fund – Institutional Class | |||||||||||||||||||||||||||||||||||||||||||||||||||||||||
2012 |
| $ | 12.05 |
| $ | 0.01 |
| $ | 1.88 |
| $ | 1.89 |
| $ | – |
| $ | – |
| $ | – |
| $ | – |
| $ | – |
| $ | 13.94 |
|
| 15.68 | % | $ | 216,572 |
|
| 1.06 | % |
|
| 1.06 | % |
|
| 1.06 | % |
|
| 0.08 | % |
|
| 32 | % |
|
2011 |
|
| 13.52 |
|
| (0.01 | ) |
| (1.30 | ) |
| (1.31 | ) |
| (0.16 | ) |
| – |
|
| – |
|
| (0.16 | ) |
| – |
|
| 12.05 |
|
| (9.70 | ) |
| 261,425 |
|
| 1.05 |
|
|
| 1.05 |
|
|
| 1.05 |
|
|
| (0.36 | ) |
|
| 49 |
|
|
2010 |
|
| 11.31 |
|
| (0.01 | ) |
| 2.30 |
|
| 2.29 |
|
| (0.08 | ) |
| – |
|
| – |
|
| (0.08 | ) |
| – |
|
| 13.52 |
|
| 20.25 |
|
| 425,911 |
|
| 1.04 |
|
|
| 1.04 |
|
|
| 1.04 |
|
|
| (0.12 | ) |
|
| 48 |
|
|
2009 |
|
| 7.97 |
|
| 0.01 |
|
| 3.33 |
|
| 3.34 |
|
| – |
|
| – |
|
| – |
|
| – |
|
| – |
|
| 11.31 |
|
| 41.91 |
|
| 357,734 |
|
| 1.06 |
|
|
| 1.06 |
|
|
| 1.06 |
|
|
| 0.08 |
|
|
| 39 |
|
|
2008 |
|
| 13.80 |
|
| (0.01 | ) |
| (5.64 | ) |
| (5.65 | ) |
| – |
|
| (0.18 | ) |
| – |
|
| (0.18 | ) |
| – |
|
| 7.97 |
|
| (40.88 | ) |
| 143,315 |
|
| 1.04 |
|
|
| 1.04 |
|
|
| 1.04 |
|
|
| (0.13 | ) |
|
| 42 |
|
|
Royce Value Plus Fund – R Class | |||||||||||||||||||||||||||||||||||||||||||||||||||||||||
2012 |
| $ | 11.77 |
| $ | (0.09 | ) | $ | 1.83 |
| $ | 1.74 |
| $ | – |
| $ | – |
| $ | – |
| $ | – |
| $ | – |
| $ | 13.51 |
|
| 14.78 | % | $ | 1,221 |
|
| 2.35 | % |
|
| 2.35 | % |
|
| 1.84 | % |
|
| (0.66 | )% |
|
| 32 | % |
|
2011 |
|
| 13.24 |
|
| (0.15 | ) |
| (1.23 | ) |
| (1.38 | ) |
| (0.09 | ) |
| – |
|
| – |
|
| (0.09 | ) |
| – |
|
| 11.77 |
|
| (10.40 | ) |
| 1,079 |
|
| 2.45 |
|
|
| 2.45 |
|
|
| 1.84 |
|
|
| (1.12 | ) |
|
| 49 |
|
|
2010 |
|
| 11.13 |
|
| (0.11 | ) |
| 2.26 |
|
| 2.15 |
|
| (0.04 | ) |
| – |
|
| – |
|
| (0.04 | ) |
| – |
|
| 13.24 |
|
| 19.34 |
|
| 942 |
|
| 2.75 |
|
|
| 2.75 |
|
|
| 1.84 |
|
|
| (0.90 | ) |
|
| 48 |
|
|
2009 |
|
| 7.91 |
|
| (0.06 | ) |
| 3.28 |
|
| 3.22 |
|
| – |
|
| – |
|
| – |
|
| – |
|
| – |
|
| 11.13 |
|
| 40.71 |
|
| 642 |
|
| 3.76 |
|
|
| 3.76 |
|
|
| 1.84 |
|
|
| (0.70 | ) |
|
| 39 |
|
|
2008 |
|
| 13.80 |
|
| (0.09 | ) |
| (5.62 | ) |
| (5.71 | ) |
| – |
|
| (0.18 | ) |
| – |
|
| (0.18 | ) |
| – |
|
| 7.91 |
|
| (41.31 | ) |
| 331 |
|
| 6.62 |
|
|
| 6.62 |
|
|
| 1.84 |
|
|
| (0.92 | ) |
|
| 42 |
|
|
Royce Value Plus Fund – K Class b | |||||||||||||||||||||||||||||||||||||||||||||||||||||||||
2012 |
| $ | 8.78 |
| $ | (0.04 | ) | $ | 1.36 |
| $ | 1.32 |
| $ | – |
| $ | – |
| $ | – |
| $ | – |
| $ | – |
| $ | 10.10 |
|
| 15.03 | % | $ | 486 |
|
| 2.96 | % |
|
| 2.96 | % |
|
| 1.59 | % |
|
| (0.45 | )% |
|
| 32 | % |
|
2011 |
|
| 9.77 |
|
| (0.08 | ) |
| (0.91 | ) |
| (0.99 | ) |
| – |
|
| – |
|
| – |
|
| – |
|
| – |
|
| 8.78 |
|
| (10.13 | ) |
| 501 |
|
| 1.86 |
|
|
| 1.86 |
|
|
| 1.59 |
|
|
| (0.86 | ) |
|
| 49 |
|
|
2010 |
|
| 8.22 |
|
| (0.06 | ) |
| 1.67 |
|
| 1.61 |
|
| (0.06 | ) |
| – |
|
| – |
|
| (0.06 | ) |
| – |
|
| 9.77 |
|
| 19.55 |
|
| 1,851 |
|
| 1.88 |
|
|
| 1.88 |
|
|
| 1.59 |
|
|
| (0.67 | ) |
|
| 48 |
|
|
2009 |
|
| 5.82 |
|
| (0.03 | ) |
| 2.43 |
|
| 2.40 |
|
| – |
|
| – |
|
| – |
|
| – |
|
| – |
|
| 8.22 |
|
| 41.24 |
|
| 1,363 |
|
| 2.46 |
|
|
| 2.45 |
|
|
| 1.59 |
|
|
| (0.38 | ) |
|
| 39 |
|
|
2008 |
|
| 10.00 |
|
| (0.04 | ) |
| (3.96 | ) |
| (4.00 | ) |
| – |
|
| (0.18 | ) |
| – |
|
| (0.18 | ) |
| – |
|
| 5.82 |
|
| (39.91 | )1 |
| 31 |
|
| 39.36 | 2 |
|
| 39.36 | 2 |
|
| 1.59 | 2 |
|
| (0.75 | )2 |
|
| 42 |
|
|
|
|
|
THE ACCOMPANYING NOTES ARE AN INTEGRAL PART OF THESE FINANCIAL STATEMENTS. |
| The Royce Funds 2012 Annual Report to Shareholders | 107 |
|
Financial Highlights |
| ||||||||||||||||||||||||||||||||||||||||||||||||||||||||||||
|
| Net |
| Net |
| Net Realized and Unrealized |
|
| Distributions |
| Distributions from Net |
|
|
|
|
|
|
|
|
| Ratio of Expenses to Average Net Assets |
| Ratio of Net Investment |
|
| |||||||||||||||||||||||||||||||||||
|
| Asset Value, |
| Investment |
| Gain (Loss) on |
| Total from Investment Operations |
| from Net Investment Income |
| Realized Gain on |
| Distributions |
| Total Distributions |
| Shareholder Redemption Fees |
| Net Asset |
| Total Return |
| Net Assets, |
| Prior to Fee |
| Prior |
| Net of |
| Income (Loss) |
| Portfolio Turnover Rate |
| |||||||||||||||||||||||||
|
|
|
|
|
|
|
|
|
|
|
|
|
|
|
|
|
|
|
|
|
|
|
|
|
|
|
|
|
|
|
|
|
|
|
|
|
|
|
|
|
|
|
|
|
|
|
|
|
|
|
|
|
|
|
|
|
| |||
Royce 100 Fund – Investment Class | ||||||||||||||||||||||||||||||||||||||||||||||||||||||||||||
2012 |
| $ | 8.74 |
| $ | 0.12 |
| $ | 0.88 |
| $ | 1.00 |
| $ | (0.15 | ) | $ | (0.74 | ) | $ | – |
| $ | (0.89 | ) | $ | – |
| $ | 8.85 |
|
| 11.78 | % | $ | 68,395 |
|
| 1.19 | % |
|
| 1.19 | % |
|
| 1.19 | % |
|
| 1.31 | % |
|
| 13 | % |
| |||
2011 |
|
| 9.82 |
|
| (0.03 | ) |
| (0.60 | ) |
| (0.63 | ) |
| (0.00 | ) |
| (0.45 | ) |
| – |
|
| (0.45 | ) |
| – |
|
| 8.74 |
|
| (6.31 | ) |
| 63,012 |
|
| 1.17 |
|
|
| 1.17 |
|
|
| 1.17 |
|
|
| (0.27 | ) |
|
| 27 |
|
| |||
2010 |
|
| 7.94 |
|
| 0.03 |
|
| 1.96 |
|
| 1.99 |
|
| – |
|
| (0.11 | ) |
| – |
|
| (0.11 | ) |
| – |
|
| 9.82 |
|
| 25.06 |
|
| 66,011 |
|
| 1.17 |
|
|
| 1.17 |
|
|
| 1.17 |
|
|
| 0.33 |
|
|
| 27 |
|
| |||
2009 |
|
| 5.74 |
|
| 0.00 |
|
| 2.20 |
|
| 2.20 |
|
| – |
|
| – |
|
| – |
|
| – |
|
| – |
|
| 7.94 |
|
| 38.33 |
|
| 35,165 |
|
| 1.22 |
|
|
| 1.22 |
|
|
| 1.22 |
|
|
| 0.03 |
|
|
| 42 |
|
| |||
2008 |
|
| 8.23 |
|
| 0.01 |
|
| (2.41 | ) |
| (2.40 | ) |
| – |
|
| (0.09 | ) |
| – |
|
| (0.09 | ) |
| – |
|
| 5.74 |
|
| (29.13 | ) |
| 15,748 |
|
| 1.39 |
|
|
| 1.39 |
|
|
| 1.24 |
|
|
| 0.21 |
|
|
| 72 |
|
| |||
Royce 100 Fund – Service Class | ||||||||||||||||||||||||||||||||||||||||||||||||||||||||||||
2012 |
| $ | 8.67 |
| $ | 0.11 |
| $ | 0.86 |
| $ | 0.97 |
| $ | (0.09 | ) | $ | (0.74 | ) | $ | – |
| $ | (0.83 | ) | $ | – |
| $ | 8.81 |
|
| 11.52 | % | $ | 220,674 |
|
| 1.46 | % |
|
| 1.46 | % |
|
| 1.42 | % |
|
| 1.03 | % |
|
| 13 | % |
| |||
2011 |
|
| 9.76 |
|
| (0.05 | ) |
| (0.59 | ) |
| (0.64 | ) |
| – |
|
| (0.45 | ) |
| – |
|
| (0.45 | ) |
| – |
|
| 8.67 |
|
| (6.52 | ) |
| 310,825 |
|
| 1.47 |
|
|
| 1.47 |
|
|
| 1.42 |
|
|
| (0.53 | ) |
|
| 27 |
|
| |||
2010 |
|
| 7.91 |
|
| 0.00 |
|
| 1.96 |
|
| 1.96 |
|
| – |
|
| (0.11 | ) |
| – |
|
| (0.11 | ) |
| – |
|
| 9.76 |
|
| 24.77 |
|
| 366,184 |
|
| 1.50 |
|
|
| 1.50 |
|
|
| 1.46 |
|
|
| 0.03 |
|
|
| 27 |
|
| |||
2009 |
|
| 5.73 |
|
| (0.01 | ) |
| 2.19 |
|
| 2.18 |
|
| – |
|
| – |
|
| – |
|
| – |
|
| – |
|
| 7.91 |
|
| 38.05 |
|
| 197,607 |
|
| 1.54 |
|
|
| 1.54 |
|
|
| 1.49 |
|
|
| (0.19 | ) |
|
| 42 |
|
| |||
2008 |
|
| 8.22 |
|
| (0.01 | ) |
| (2.40 | ) |
| (2.41 | ) |
| – |
|
| (0.09 | ) |
| – |
|
| (0.09 | ) |
| 0.01 |
|
| 5.73 |
|
| (29.17 | ) |
| 43,882 |
|
| 1.57 |
|
|
| 1.56 |
|
|
| 1.49 |
|
|
| (0.10 | ) |
|
| 72 |
|
| |||
Royce 100 Fund – R Class b | ||||||||||||||||||||||||||||||||||||||||||||||||||||||||||||
2012 |
| $ | 10.46 |
| $ | 0.05 |
| $ | 1.07 |
| $ | 1.12 |
| $ | – |
| $ | (0.74 | ) | $ | – |
| $ | (0.74 | ) | $ | – |
| $ | 10.84 |
|
| 10.95 | % | $ | 2,554 |
|
| 2.57 | % |
|
| 2.57 | % |
|
| 1.84 | % |
|
| 0.46 | % |
|
| 13 | % |
| |||
2011 |
|
| 11.72 |
|
| (0.10 | ) |
| (0.71 | ) |
| (0.81 | ) |
| – |
|
| (0.45 | ) |
| – |
|
| (0.45 | ) |
| – |
|
| 10.46 |
|
| (6.88 | ) |
| 3,469 |
|
| 2.70 |
|
|
| 2.69 |
|
|
| 1.84 |
|
|
| (0.88 | ) |
|
| 27 |
| ||||
2010 |
|
| 9.52 |
|
| (0.03 | ) |
| 2.34 |
|
| 2.31 |
|
| – |
|
| (0.11 | ) |
| – |
|
| (0.11 | ) |
| – |
|
| 11.72 |
|
| 24.26 |
|
| 1,358 |
|
| 2.22 |
|
|
| 2.21 |
|
|
| 1.84 |
|
|
| (0.29 | ) |
|
| 27 |
|
| |||
2009 |
|
| 6.93 |
|
| (0.05 | ) |
| 2.64 |
|
| 2.59 |
|
| – |
|
| – |
|
| – |
|
| – |
|
| – |
|
| 9.52 |
|
| 37.37 |
|
| 296 |
|
| 6.58 |
|
|
| 6.57 |
|
|
| 1.84 |
|
|
| (0.56 | ) |
|
| 42 |
|
| |||
2008 |
|
| 10.00 |
|
| (0.02 | ) |
| (2.96 | ) |
| (2.98 | ) |
| – |
|
| (0.09 | ) |
| – |
|
| (0.09 | ) |
| – |
|
| 6.93 |
|
| (29.78 | )1 |
| 70 |
|
| 18.97 | 2 |
|
| 18.97 | 2 |
|
| 1.84 | 2 |
|
| (0.44 | )2 |
|
| 72 |
|
| |||
Royce 100 Fund – K Class b | ||||||||||||||||||||||||||||||||||||||||||||||||||||||||||||
2012 |
| $ | 10.56 |
| $ | 0.11 |
| $ | 1.06 |
| $ | 1.17 |
| $ | (0.04 | ) | $ | (0.74 | ) | $ | – |
| $ | (0.78 | ) | $ | – |
| $ | 10.95 |
|
| 11.37 | % | $ | 3,554 |
|
| 1.68 | % |
|
| 1.68 | % |
|
| 1.59 | % |
|
| 0.88 | % |
|
| 13 | % |
| |||
2011 |
|
| 11.81 |
|
| (0.08 | ) |
| (0.72 | ) |
| (0.80 | ) |
| – |
|
| (0.45 | ) |
| – |
|
| (0.45 | ) |
| – |
|
| 10.56 |
|
| (6.75 | ) |
| 4,447 |
|
| 1.66 |
|
|
| 1.66 |
|
|
| 1.59 |
|
|
| (0.68 | ) |
|
| 27 |
|
| |||
2010 |
|
| 9.57 |
|
| 0.02 |
|
| 2.33 |
|
| 2.35 |
|
| – |
|
| (0.11 | ) |
| – |
|
| (0.11 | ) |
| – |
|
| 11.81 |
|
| 24.55 |
|
| 2,915 |
|
| 1.89 |
|
|
| 1.89 |
|
|
| 1.59 |
|
|
| 0.20 |
|
|
| 27 |
|
| |||
2009 |
|
| 6.94 |
|
| (0.03 | ) |
| 2.66 |
|
| 2.63 |
|
| – |
|
| – |
|
| – |
|
| – |
|
| – |
|
| 9.57 |
|
| 37.90 |
|
| 186 |
|
| 5.78 |
|
|
| 5.78 |
|
|
| 1.59 |
|
|
| (0.41 | ) |
|
| 42 |
|
| |||
2008 |
|
| 10.00 |
|
| (0.01 | ) |
| (2.96 | ) |
| (2.97 | ) |
| – |
|
| (0.09 | ) |
| – |
|
| (0.09 | ) |
| – |
|
| 6.94 |
|
| (29.68 | )1 |
| 95 |
|
| 17.55 | 2 |
|
| 17.55 | 2 |
|
| 1.59 | 2 |
|
| (0.13 | )2 |
|
| 72 |
|
| |||
| Royce Dividend Value Fund – Investment Class | ||||||||||||||||||||||||||||||||||||||||||||||||||||||||||||
2012 |
| $ | 6.34 |
| $ | 0.14 |
| $ | 0.95 |
| $ | 1.09 |
| $ | (0.12 | ) | $ | (0.02 | ) | $ | – |
| $ | (0.14 | ) | $ | – |
| $ | 7.29 |
|
| 17.26 | % | $ | 118,820 |
|
| 1.19 | % |
|
| 1.19 | % |
|
| 1.19 | % |
|
| 1.99 | % |
|
| 28 | % |
| |||
| 2011 | 6.80 | 0.07 | (0.37 | ) | (0.30 | ) | (0.07 | ) | (0.09 | ) |
| – |
| (0.16 | ) | – | 6.34 | (4.46 | ) | 85,188 | 1.20 |
| 1.20 |
| 1.20 |
| 1.14 |
| 14 |
| ||||||||||||||||||||||||||||||
| 2010 | 5.31 | 0.09 | 1.51 | 1.60 | (0.08 | ) | (0.03 | ) |
| – |
| (0.11 | ) | – | 6.80 | 30.46 | 35,626 | 1.38 |
| 1.38 |
| 1.24 |
| 1.56 |
| 21 |
| |||||||||||||||||||||||||||||||||
| 2009 | 3.90 | 0.07 | 1.40 | 1.47 | (0.06 | ) | – |
| – |
| (0.06 | ) | – | 5.31 | 38.22 | 13,208 | 1.69 |
| 1.69 |
| 1.24 |
| 1.70 |
| 43 |
| ||||||||||||||||||||||||||||||||||
| 2008 | 5.82 | 0.11 | (1.91 | ) | (1.80 | ) | (0.12 | ) | (0.00 | ) |
| – |
| (0.12 | ) | – | 3.90 | (31.38 | ) | 1,881 | 2.84 |
| 2.83 |
| 1.24 |
| 2.13 |
| 61 |
| ||||||||||||||||||||||||||||||
| Royce Dividend Value Fund – Service Class | ||||||||||||||||||||||||||||||||||||||||||||||||||||||||||||
2012 |
| $ | 6.38 |
| $ | 0.12 |
| $ | 0.95 |
| $ | 1.07 |
| $ | (0.08 | ) | $ | (0.02 | ) | $ | – |
| $ | (0.10 | ) | $ | – |
| $ | 7.35 |
|
| 16.95 | % | $ | 252,443 |
|
| 1.48 | % |
|
| 1.48 | % |
|
| 1.46 | % |
|
| 1.74 | % |
|
| 28 | % |
| |||
| 2011 | 6.82 | 0.05 | (0.36 | ) | (0.31 | ) | (0.04 | ) | (0.09 | ) |
| – |
| (0.13 | ) | – | 6.38 | (4.55 | ) | 201,634 | 1.48 |
| 1.48 |
| 1.46 |
| 0.84 |
| 14 |
| ||||||||||||||||||||||||||||||
| 2010 | 5.33 | 0.08 | 1.51 | 1.59 | (0.07 | ) | (0.03 | ) |
| – |
| (0.10 | ) | – | 6.82 | 30.11 | 117,304 | 1.56 |
| 1.56 |
| 1.49 |
| 1.32 |
| 21 |
| |||||||||||||||||||||||||||||||||
| 2009 | 3.92 | 0.07 | 1.39 | 1.46 | (0.05 | ) | – |
| – |
| (0.05 | ) | – | 5.33 | 37.73 | 16,107 | 2.04 |
| 2.04 |
| 1.49 |
| 1.45 |
| 43 |
| ||||||||||||||||||||||||||||||||||
| 2008 | 5.83 | 0.09 | (1.90 | ) | (1.81 | ) | (0.10 | ) | (0.00 | ) |
| – |
| (0.10 | ) | – | 3.92 | (31.47 | ) | 4,872 | 2.54 |
| 2.54 |
| 1.49 |
| 1.89 |
| 61 |
| ||||||||||||||||||||||||||||||
| Royce Dividend Value Fund – Institutional Class d | ||||||||||||||||||||||||||||||||||||||||||||||||||||||||||||
2012 |
| $ | 6.80 |
| $ | 0.08 |
| $ | 0.50 |
| $ | 0.58 |
| $ | (0.08 | ) | $ | (0.02 | ) | $ | – |
| $ | (0.10 | ) | $ | – |
| $ | 7.28 |
|
| 8.51 | %1 | $ | 23,460 |
|
| 1.33 | %2 |
|
| 1.33 | %2 |
|
| 1.04 | %2 |
|
| 3.48 | %2 |
|
| 28 | % |
| |||
|
|
|
108 | The Royce Funds 2012 Annual Report to Shareholders |
| THE ACCOMPANYING NOTES ARE AN INTEGRAL PART OF THESE FINANCIAL STATEMENTS. |
|
Financial Highlights |
| ||||||||||||||||||||||||||||||||||||||||||||||||||||||||||||
|
| Net |
| Net |
| Net Realized and Unrealized |
|
| Distributions |
| Distributions from Net |
|
|
|
|
|
|
|
|
| Ratio of Expenses to Average Net Assets |
| Ratio of Net Investment |
|
| |||||||||||||||||||||||||||||||||||
|
| Asset Value, |
| Investment |
| Gain (Loss) on |
| Total from Investment Operations |
| from Net Investment Income |
| Realized Gain on |
| Distributions |
| Total Distributions |
| Shareholder Redemption Fees |
| Net Asset |
| Total Return |
| Net Assets, |
| Prior to Fee |
| Prior |
| Net of |
| Income (Loss) |
| Portfolio Turnover Rate |
| |||||||||||||||||||||||||
|
|
|
|
|
|
|
|
|
|
|
|
|
|
|
|
|
|
|
|
|
|
|
|
|
|
|
|
|
|
|
|
|
|
|
|
|
|
|
|
|
|
|
|
|
|
|
|
|
|
|
|
|
|
|
|
|
| |||
Royce Global Value Fund – Investment Class e | ||||||||||||||||||||||||||||||||||||||||||||||||||||||||||||
2012 |
| $ | 11.74 |
| $ | 0.14 |
| $ | 1.19 |
| $ | 1.33 |
| $ | (0.16 | ) | $ | – |
| $ | – |
| $ | (0.16 | ) | $ | – |
| $ | 12.91 |
|
| 11.37 | % | $ | 178,319 |
|
| 1.47 | % |
|
| 1.47 | % |
|
| 1.44 | % |
|
| 1.16 | % |
|
| 36 | % |
| |||
2011 |
|
| 14.54 |
|
| 0.13 |
|
| (2.82 | ) |
| (2.69 | ) |
| (0.12 | ) |
| – |
|
| – |
|
| (0.12 | ) |
| 0.01 |
|
| 11.74 |
|
| (18.48 | ) |
| 141,180 |
|
| 1.42 |
|
|
| 1.42 |
|
|
| 1.42 |
|
|
| 0.80 |
|
|
| 77 |
|
| |||
2010 |
|
| 11.02 |
|
| (0.06 | ) |
| 3.68 |
|
| 3.62 |
|
| (0.10 | ) |
| – |
|
| – |
|
| (0.10 | ) |
| – |
|
| 14.54 |
|
| 32.88 | 1 |
| 6,626 |
|
| 2.07 | 2 |
|
| 2.07 | 2 |
|
| 1.44 | 2 |
|
| (0.58 | )2 |
|
| 42 |
|
| |||
Royce Global Value Fund – Service Class | ||||||||||||||||||||||||||||||||||||||||||||||||||||||||||||
2012 |
| $ | 11.77 |
| $ | 0.12 |
| $ | 1.18 |
| $ | 1.30 |
| $ | (0.09 | ) | $ | – |
| $ | – |
| $ | (0.09 | ) | $ | – |
| $ | 12.98 |
|
| 11.03 | % | $ | 98,274 |
|
| 1.80 | % |
|
| 1.80 | % |
|
| 1.69 | % |
|
| 0.88 | % |
|
| 36 | % |
| |||
2011 |
|
| 14.56 |
|
| 0.07 |
|
| (2.80 | ) |
| (2.73 | ) |
| (0.07 | ) |
| – |
|
| – |
|
| (0.07 | ) |
| 0.01 |
|
| 11.77 |
|
| (18.69 | ) |
| 122,574 |
|
| 1.77 |
|
|
| 1.77 |
|
|
| 1.69 |
|
|
| 0.41 |
|
|
| 77 |
|
| |||
2010 |
|
| 10.79 |
|
| (0.03 | ) |
| 3.87 |
|
| 3.84 |
|
| (0.08 | ) |
| – |
|
| – |
|
| (0.08 | ) |
| 0.01 |
|
| 14.56 |
|
| 35.69 |
|
| 141,992 |
|
| 1.84 |
|
|
| 1.84 |
|
|
| 1.69 |
|
|
| 0.01 |
|
|
| 42 |
|
| |||
2009 |
|
| 6.70 |
|
| 0.01 |
|
| 4.13 |
|
| 4.14 |
|
| (0.06 | ) |
| – |
|
| – |
|
| (0.06 | ) |
| 0.01 |
|
| 10.79 |
|
| 61.89 |
|
| 50,946 |
|
| 1.88 |
|
|
| 1.88 |
|
|
| 1.69 |
|
|
| 0.11 |
|
|
| 71 |
|
| |||
2008 |
|
| 11.20 |
|
| 0.14 |
|
| (4.65 | ) |
| (4.51 | ) |
| (0.03 | ) |
| (0.00 | ) |
| – |
|
| (0.03 | ) |
| 0.04 |
|
| 6.70 |
|
| (39.92 | ) |
| 31,040 |
|
| 1.91 |
|
|
| 1.90 |
|
|
| 1.69 |
|
|
| 1.64 |
|
|
| 45 |
|
| |||
Royce Global Value Fund – Consultant Class f | ||||||||||||||||||||||||||||||||||||||||||||||||||||||||||||
2012 |
| $ | 11.71 |
| $ | 0.02 |
| $ | 1.17 |
| $ | 1.19 |
| $ | (0.02 | ) | $ | – |
| $ | – |
| $ | (0.02 | ) | $ | – |
| $ | 12.88 |
|
| 10.13 | % | $ | 23,383 |
|
| 2.55 | % |
|
| 2.55 | % |
|
| 2.44 | % |
|
| 0.16 | % |
|
| 36 | % |
| |||
2011 |
|
| 15.66 |
|
| (0.09 | ) |
| (3.80 | ) |
| (3.89 | ) |
| (0.06 | ) |
| – |
|
| – |
|
| (0.06 | ) |
| – |
|
| 11.71 |
|
| (24.82 | )1 |
| 18,585 |
|
| 2.64 | 2 |
|
| 2.64 | 2 |
|
| 2.44 | 2 |
|
| (0.77 | )2 |
|
| 77 |
| ||||
Royce Global Value Fund – R Class g | ||||||||||||||||||||||||||||||||||||||||||||||||||||||||||||
2012 |
| $ | 10.00 |
| $ | 0.02 |
| $ | (0.21 | ) | $ | (0.19 | ) | $ | (0.12 | ) | $ | – |
| $ | – |
| $ | (0.12 | ) | $ | – |
| $ | 9.69 |
|
| (1.90 | )%1 | $ | 80 |
|
| 19.19 | %2 |
|
| 19.19 | %2 |
|
| 1.99 | %2 |
|
| 0.70 | %2 |
|
| 36 | % |
| |||
| Royce Global Value Fund – K Class g | ||||||||||||||||||||||||||||||||||||||||||||||||||||||||||||
2012 |
| $ | 10.00 |
| $ | 0.09 |
| $ | (0.27 | ) | $ | (0.18 | ) | $ | (0.13 | ) | $ | – |
| $ | – |
| $ | (0.13 | ) | $ | – |
| $ | 9.69 |
|
| (1.74 | )%1 | $ | 41 |
|
| 29.99 | %2 |
|
| 29.98 | %2 |
|
| 1.74 | %2 |
|
| 1.20 | %2 |
|
| 36 | % |
| |||
| Royce International Smaller-Companies Fund – Service Class h | ||||||||||||||||||||||||||||||||||||||||||||||||||||||||||||
2012 |
| $ | 9.58 |
| $ | 0.14 |
| $ | 1.70 |
| $ | 1.84 |
| $ | (0.15 | ) | $ | – |
| $ | – |
| $ | (0.15 | ) | $ | 0.01 |
| $ | 11.28 |
|
| 19.39 | % | $ | 26,371 |
|
| 2.13 | % |
|
| 2.13 | % |
|
| 1.69 | % |
|
| 1.29 | % |
|
| 44 | % |
| |||
| 2011 | 12.85 | 0.10 | (2.51 | ) | (2.41 | ) | (0.08 | ) | (0.78 | ) |
| (0.01 | ) | (0.87 | ) | 0.01 |
| 9.58 | (18.75 | ) | 20,103 | 2.15 |
| 2.15 |
| 1.69 |
| 0.88 |
| 38 |
| |||||||||||||||||||||||||||||
| 2010 | 10.49 | 0.03 | 2.72 | 2.75 | (0.10 | ) | (0.30 | ) |
| – |
| (0.40 | ) | 0.01 |
| 12.85 | 26.45 | 18,297 | 2.35 |
| 2.35 |
| 1.69 |
| 0.45 |
| 55 |
| ||||||||||||||||||||||||||||||||
| 2009 | 6.99 | (0.02 | ) | 3.53 | 3.51 | (0.02 | ) | – |
| – |
| (0.02 | ) | 0.01 |
| 10.49 | 50.31 | 7,871 | 3.01 |
| 3.01 |
| 1.69 |
| (0.18 | ) |
| 38 |
| |||||||||||||||||||||||||||||||
| 2008 | 10.00 | (0.02 | ) | (2.99 | ) | (3.01 | ) | – |
| – |
|
| – |
| – |
| – | 6.99 | (30.10 | )1 | 1,960 | 6.24 | 2 |
| 5.98 | 2 |
| 1.69 | 2 |
| (0.43 | )2 |
| 1 |
| |||||||||||||||||||||||||
| 1 | Not annualized |
| 2 | Annualized |
| a | The Class commenced operations on June 6, 2011. |
| b | The Class commenced operations on May 15, 2008. |
| c | The Class commenced operations on May 1, 2008. |
| d | The Class commenced operations on September 4, 2012. |
| e | The Class commenced operations on September 1, 2010. |
| f | The Class commenced operations on May 2, 2011. |
| g | The Class commenced operations on March 21, 2012. |
| h | The Fund commenced operations on July 1, 2008. |
|
|
|
THE ACCOMPANYING NOTES ARE AN INTEGRAL PART OF THESE FINANCIAL STATEMENTS. |
| The Royce Funds 2012 Annual Report to Shareholders | 109 |
Royce Pennsylvania Mutual Fund, Royce Micro-Cap Fund, Royce Premier Fund, Royce Low-Priced Stock Fund, Royce Total Return Fund, Royce Heritage Fund, Royce Opportunity Fund, Royce Special Equity Fund, Royce Value Fund, Royce Value Plus Fund, Royce 100 Fund, Royce Dividend Value Fund, Royce Global Value Fund and Royce International Smaller-Companies Fund (the “Fund” or “Funds”), are fourteen series of The Royce Fund (the “Trust”), a diversified open-end management investment company organized as a Delaware statutory trust.
At December 31, 2012, officers, employees of Royce & Associates, LLC (“Royce”), Fund trustees, the Royce retirement plans and other affiliates owned more than 10% of the following Fund:
Royce International Smaller-Companies Fund 12%
| Level 1 | Level 2 | Level 3 | Total | |||||||||||||||||
| Royce Pennsylvania Mutual Fund | ||||||||||||||||||||
| Common Stocks | $ | 5,648,398,649 | $ | 180,761,401 | $ | – | $ | 5,829,160,050 | ||||||||||||
| Cash Equivalents | 102,721,409 | 75,946,000 | – | 178,667,409 | ||||||||||||||||
| Royce Micro-Cap Fund | ||||||||||||||||||||
| Common Stocks | 708,370,833 | 244,013,142 | 403,638 | 952,787,613 | ||||||||||||||||
| Cash Equivalents | 22,690,458 | 13,427,000 | – | 36,117,458 | ||||||||||||||||
| 110 | The Royce Funds 2012 Annual Report to Shareholders |
| Valuation of Investments (continued): | ||||||||||||||||||||
| Level 1 | Level 2 | Level 3 | Total | |||||||||||||||||
| Royce Premier Fund | ||||||||||||||||||||
| Common Stocks | $ | 5,816,841,651 | $ | 599,280,528 | $ | – | $ | 6,416,122,179 | ||||||||||||
| Cash Equivalents | 198,869,651 | 272,862,000 | – | 471,731,651 | ||||||||||||||||
| Royce Low-Priced Stock Fund | ||||||||||||||||||||
| Common Stocks | 2,220,025,243 | 767,364,729 | – | 2,987,389,972 | ||||||||||||||||
| Cash Equivalents | 108,541,564 | 55,591,000 | – | 164,132,564 | ||||||||||||||||
| Royce Total Return Fund | ||||||||||||||||||||
| Common Stocks | 4,213,922,313 | 111,142,961 | – | 4,325,065,274 | ||||||||||||||||
| Corporate Bonds | – | 3,496,875 | – | 3,496,875 | ||||||||||||||||
| Cash Equivalents | 43,379,953 | 108,998,000 | – | 152,377,953 | ||||||||||||||||
| Royce Heritage Fund | ||||||||||||||||||||
| Common Stocks | 212,580,065 | 47,634,928 | – | 260,214,993 | ||||||||||||||||
| Cash Equivalents | 1,522,584 | 9,538,000 | – | 11,060,584 | ||||||||||||||||
| Royce Opportunity Fund | ||||||||||||||||||||
| Common Stocks | 1,713,228,713 | – | – | 1,713,228,713 | ||||||||||||||||
| Preferred Stocks | 7,696,312 | – | – | 7,696,312 | ||||||||||||||||
| Cash Equivalents | 77,870,030 | 124,329,000 | – | 202,199,030 | ||||||||||||||||
| Royce Special Equity Fund | ||||||||||||||||||||
| Common Stocks | 2,596,282,522 | 21,024,564 | – | 2,617,307,086 | ||||||||||||||||
| Cash Equivalents | 18,600 | 310,976,000 | – | 310,994,600 | ||||||||||||||||
| Royce Value Fund | ||||||||||||||||||||
| Common Stocks | 1,179,466,675 | 135,153,162 | – | 1,314,619,837 | ||||||||||||||||
| Cash Equivalents | 21,218,911 | 18,001,000 | – | 39,219,911 | ||||||||||||||||
| Royce Value Plus Fund | ||||||||||||||||||||
| Common Stocks | 1,271,721,004 | 149,612,273 | – | 1,421,333,277 | ||||||||||||||||
| Cash Equivalents | 113,429,210 | 6,710,000 | – | 120,139,210 | ||||||||||||||||
| Royce 100 Fund | ||||||||||||||||||||
| Common Stocks | 265,545,431 | 23,169,810 | – | 288,715,241 | ||||||||||||||||
| Cash Equivalents | 3,483,733 | 8,356,000 | – | 11,839,733 | ||||||||||||||||
| Royce Dividend Value Fund | ||||||||||||||||||||
| Common Stocks | 338,877,643 | 45,763,516 | – | 384,641,159 | ||||||||||||||||
| Cash Equivalents | 2,015,454 | 14,092,000 | – | 16,107,454 | ||||||||||||||||
| Royce Global Value Fund | ||||||||||||||||||||
| Common Stocks | 77,226,164 | 209,873,228 | – | 287,099,392 | ||||||||||||||||
| Cash Equivalents | 3,993,332 | 12,739,000 | – | 16,732,332 | ||||||||||||||||
| Royce International Smaller-Companies Fund | ||||||||||||||||||||
| Common Stocks | 1,333,586 | 24,267,488 | – | 25,601,074 | ||||||||||||||||
| Cash Equivalents | – | 1,037,000 | – | 1,037,000 | ||||||||||||||||
For the year ended December 31, 2012, certain securities have transferred in and out of Level 1 and Level 2 measurements as a result of the fair value pricing procedures for international equities. The Funds recognize transfers between levels as of the end of the reporting period. At December 31, 2012, the following Funds had securities transfer from Level 2 to Level 1 within the fair value hierarchy:
| Transfers from Level 2 | Transfers from Level 2 | |||||||||||
| to Level 1 | to Level 1 | |||||||||||
| Royce Pennsylvania Mutual Fund | $33,931,128 | Royce Value Plus Fund | $8,398,311 | |||||||||
| Royce Micro-Cap Fund | 25,861,707 | Royce Dividend Value Fund | 3,454,686 | |||||||||
| Royce Low-Priced Stock Fund | 48,386,367 | Royce Global Value Fund | 3,427,963 | |||||||||
| Royce Total Return Fund | 72,532,647 | Royce International Smaller-Companies Fund | 485,906 | |||||||||
| Royce Heritage Fund | 2,022,132 | |||||||||||
| Level 3 Reconciliation: | ||||||||||||||||||||
| Balance as of | Realized and Unrealized | Balance as of | ||||||||||||||||||
| 12/31/11 | Sales | Gain (Loss)1 | 12/31/12 | |||||||||||||||||
| Royce Micro-Cap Fund | ||||||||||||||||||||
| Common Stocks | $ | 385,968 | $ | – | $ | 17,670 | $ | 403,638 | ||||||||||||
| Royce Low-Priced Stock Fund | ||||||||||||||||||||
| Common Stocks | 4,425,038 | – | (4,425,038 | ) | – | |||||||||||||||
| Royce Heritage Fund | ||||||||||||||||||||
| Common Stocks | 641,800 | 323,405 | (318,395 | ) | – | |||||||||||||||
| Royce Dividend Value Fund | ||||||||||||||||||||
| Common Stocks | 174,722 | – | (174,722 | ) | – | |||||||||||||||
| Royce Global Value Fund | ||||||||||||||||||||
| Common Stocks | 626,722 | – | (626,722 | ) | – | |||||||||||||||
| The Royce Funds 2012 Annual Report to Shareholders | 111 |
| Level 3 Reconciliation (continued): | ||||||||||||||||||||
| Balance as of | Realized and Unrealized | Balance as of | ||||||||||||||||||
| 12/31/11 | Sales | Gain (Loss)1 | 12/31/12 | |||||||||||||||||
| Royce International Smaller-Companies Fund | ||||||||||||||||||||
| Common Stocks | $38,173 | $ – | $(38,173) | $ – | ||||||||||||||||
Royce Total Return Fund and Royce Dividend Value Fund pay any dividends from net investment income quarterly and make any distributions from net realized gains annually in December. The other Funds pay any dividends and capital gain distributions annually in December. Dividends from net investment income are determined at a class level and distributions from capital gains are determined at a Fund level. Because federal income tax regulations differ from generally accepted accounting principles, income and capital gain distributions determined in accordance with tax regulations may differ from net investment income and realized gains recognized for financial reporting purposes. Accordingly, the character of distributions and composition of net assets for tax purposes differ from those reflected in the accompanying financial statements.
| 112 | The Royce Funds 2012 Annual Report to Shareholders |
Capital Share Transactions (in dollars):
| Shares issued for | Net increase (decrease) from | |||||||||||||||||||||||||||||||||||||||
| Shares sold | reinvestment of distributions | Shares redeemed | capital share transactions | |||||||||||||||||||||||||||||||||||||
| Period ended | Period ended | Period ended | Period ended | Period ended | Period ended | Period ended | Period ended | |||||||||||||||||||||||||||||||||
| 12/31/12 | 12/31/11 | 12/31/12 | 12/31/11 | 12/31/12 | 12/31/11 | 12/31/12 | 12/31/11 | |||||||||||||||||||||||||||||||||
| Royce Pennsylvania Mutual Fund | ||||||||||||||||||||||||||||||||||||||||
Investment Class | $ | 662,607,895 | $ | 1,102,213,825 | $ | 257,795,544 | $ | 139,754,604 | $ | (1,256,398,755 | ) | $ | (1,345,967,573 | ) | $ | (335,995,316 | ) | $ | (103,999,144 | ) | ||||||||||||||||||||
Service Class | 165,003,710 | 169,728,944 | 28,468,833 | 14,465,251 | (155,198,379 | ) | (188,824,860 | ) | 38,274,164 | (4,630,665 | ) | |||||||||||||||||||||||||||||
Consultant Class | 34,093,194 | 60,497,490 | 39,215,706 | 24,684,398 | (126,201,488 | ) | (200,472,135 | ) | (52,892,588 | ) | (115,290,247 | ) | ||||||||||||||||||||||||||||
Institutional Class | 261,272,296 | 270,513,053 | 32,724,191 | 8,073,158 | (61,037,580 | ) | (20,245,905 | ) | 232,958,907 | 258,340,306 | ||||||||||||||||||||||||||||||
R Class | 15,853,054 | 13,140,277 | 1,943,538 | 773,925 | (9,101,626 | ) | (7,708,102 | ) | 8,694,966 | 6,206,100 | ||||||||||||||||||||||||||||||
K Class | 4,442,442 | 4,738,021 | 491,916 | 182,665 | (2,231,520 | ) | (2,519,234 | ) | 2,702,838 | 2,401,452 | ||||||||||||||||||||||||||||||
| Royce Micro-Cap Fund | ||||||||||||||||||||||||||||||||||||||||
Investment Class | 110,135,135 | 249,149,983 | 40,891,444 | 49,969,999 | (331,749,308 | ) | (287,777,166 | ) | (180,722,729 | ) | 11,342,816 | |||||||||||||||||||||||||||||
Service Class | 77,650,222 | 50,283,758 | 7,331,533 | 7,305,787 | (100,912,526 | ) | (48,298,365 | ) | (15,930,771 | ) | 9,291,180 | |||||||||||||||||||||||||||||
Consultant Class | 5,379,491 | 13,417,277 | 7,635,941 | 7,216,221 | (27,570,388 | ) | (38,792,369 | ) | (14,554,956 | ) | (18,158,871 | ) | ||||||||||||||||||||||||||||
| Royce Premier Fund | ||||||||||||||||||||||||||||||||||||||||
Investment Class | 747,646,770 | 1,177,957,241 | 313,244,907 | 350,452,967 | (1,142,070,039 | ) | (1,538,043,931 | ) | (81,178,362 | ) | (9,633,723 | ) | ||||||||||||||||||||||||||||
Service Class | 137,054,293 | 219,593,689 | 37,837,318 | 51,342,238 | (266,450,099 | ) | (165,382,138 | ) | (91,558,488 | ) | 105,553,789 | |||||||||||||||||||||||||||||
Consultant Class | 4,914,067 | 6,859,040 | 3,975,657 | 5,081,665 | (9,949,114 | ) | (17,751,057 | ) | (1,059,390 | ) | (5,810,352 | ) | ||||||||||||||||||||||||||||
Institutional Class | 163,632,309 | 405,946,501 | 58,694,049 | 67,306,892 | (196,727,102 | ) | (276,014,319 | ) | 25,599,256 | 197,239,074 | ||||||||||||||||||||||||||||||
W Class | 113,845,651 | 303,893,656 | 29,318,980 | 32,794,914 | (180,176,714 | ) | (153,965,533 | ) | (37,012,083 | ) | 182,723,037 | |||||||||||||||||||||||||||||
R Class | 11,096,351 | 20,687,253 | 1,863,347 | 1,921,311 | (8,690,901 | ) | (6,179,082 | ) | 4,268,797 | 16,429,482 | ||||||||||||||||||||||||||||||
K Class | 2,923,140 | 10,047,005 | 1,464,327 | 1,442,829 | (2,940,122 | ) | (4,581,276 | ) | 1,447,345 | 6,908,558 | ||||||||||||||||||||||||||||||
| Royce Low-Priced Stock Fund | ||||||||||||||||||||||||||||||||||||||||
Investment Class | 121,523,266 | 267,858,377 | 19,845,684 | 21,315,767 | (152,071,182 | ) | (88,665,008 | ) | (10,702,232 | ) | 200,509,136 | |||||||||||||||||||||||||||||
Service Class | 239,998,652 | 649,126,714 | 135,141,136 | 209,213,994 | (1,027,840,636 | ) | (1,162,028,440 | ) | (652,700,848 | ) | (303,687,732 | ) | ||||||||||||||||||||||||||||
Institutional Class | 216,954,398 | 363,441,878 | 76,401,516 | 83,945,467 | (281,899,681 | ) | (263,698,270 | ) | 11,456,233 | 183,689,075 | ||||||||||||||||||||||||||||||
R Class | 1,545,216 | 7,291,736 | 413,318 | 633,549 | (3,319,490 | ) | (1,958,515 | ) | (1,360,956 | ) | 5,966,770 | |||||||||||||||||||||||||||||
K Class | 1,898,473 | 7,773,938 | 781,650 | 1,169,483 | (4,667,746 | ) | (2,309,772 | ) | (1,987,623 | ) | 6,633,649 | |||||||||||||||||||||||||||||
| Royce Total Return Fund | ||||||||||||||||||||||||||||||||||||||||
Investment Class | 419,303,349 | 570,309,226 | 173,830,152 | 61,427,071 | (885,921,003 | ) | (967,945,453 | ) | (292,787,502 | ) | (336,209,156 | ) | ||||||||||||||||||||||||||||
Service Class | 69,272,271 | 97,812,608 | 14,854,646 | 4,720,762 | (124,544,896 | ) | (104,405,718 | ) | (40,417,979 | ) | (1,872,348 | ) | ||||||||||||||||||||||||||||
Consultant Class | 20,173,454 | 31,585,192 | 14,273,391 | 3,609,466 | (58,339,142 | ) | (85,206,542 | ) | (23,892,297 | ) | (50,011,884 | ) | ||||||||||||||||||||||||||||
Institutional Class | 92,895,625 | 142,262,470 | 23,588,680 | 7,938,613 | (126,051,961 | ) | (98,177,361 | ) | (9,567,656 | ) | 52,023,722 | |||||||||||||||||||||||||||||
W Class | 56,620,882 | 84,832,543 | 10,281,660 | 2,638,508 | (37,853,609 | ) | (24,105,173 | ) | 29,048,933 | 63,365,878 | ||||||||||||||||||||||||||||||
R Class | 19,963,699 | 22,947,769 | 2,354,016 | 482,478 | (11,233,311 | ) | (7,804,372 | ) | 11,084,404 | 15,625,875 | ||||||||||||||||||||||||||||||
K Class | 96,984,981 | 166,693,686 | 11,545,341 | 3,316,355 | (135,315,960 | ) | (87,921,184 | ) | (26,785,638 | ) | 82,088,857 | |||||||||||||||||||||||||||||
| Royce Heritage Fund | ||||||||||||||||||||||||||||||||||||||||
Investment Class | 25,279,973 | 13,834,446 | 1,251,617 | 960,195 | (9,957,079 | ) | (3,901,453 | ) | 16,574,511 | 10,893,188 | ||||||||||||||||||||||||||||||
Service Class | 23,331,563 | 52,657,922 | 5,597,731 | 9,824,989 | (67,038,754 | ) | (52,842,256 | ) | (38,109,460 | ) | 9,640,655 | |||||||||||||||||||||||||||||
Consultant Class | 1,725,731 | 5,827,667 | 423,298 | 735,831 | (3,413,072 | ) | (2,917,799 | ) | (1,264,043 | ) | 3,645,699 | |||||||||||||||||||||||||||||
R Class | 1,916,645 | 4,544,349 | 157,800 | 212,823 | (1,786,121 | ) | (1,949,780 | ) | 288,324 | 2,807,392 | ||||||||||||||||||||||||||||||
K Class | 4,681,526 | 6,751,172 | 271,701 | 468,676 | (6,488,110 | ) | (3,597,680 | ) | (1,534,883 | ) | 3,622,168 | |||||||||||||||||||||||||||||
| Royce Opportunity Fund | ||||||||||||||||||||||||||||||||||||||||
Investment Class | 128,158,726 | 187,675,587 | 47,244,802 | 15,192,502 | (271,654,395 | ) | (331,240,361 | ) | (96,250,867 | ) | (128,372,272 | ) | ||||||||||||||||||||||||||||
Service Class | 70,636,968 | 72,921,825 | 9,474,766 | 3,011,889 | (61,380,895 | ) | (195,267,363 | ) | 18,730,839 | (119,333,649 | ) | |||||||||||||||||||||||||||||
Consultant Class | 1,688,984 | 4,180,186 | 671,947 | 220,159 | (3,993,515 | ) | (3,341,119 | ) | (1,632,584 | ) | 1,059,226 | |||||||||||||||||||||||||||||
Institutional Class | 158,959,803 | 145,203,393 | 34,022,248 | 9,624,122 | (167,107,259 | ) | (179,345,393 | ) | 25,874,792 | (24,517,878 | ) | |||||||||||||||||||||||||||||
R Class | 4,090,762 | 2,725,250 | 374,879 | 58,426 | (1,515,337 | ) | (691,379 | ) | 2,950,304 | 2,092,297 | ||||||||||||||||||||||||||||||
K Class | 2,701,921 | 12,548,071 | 504,189 | 125,508 | (1,843,330 | ) | (11,379,972 | ) | 1,362,780 | 1,293,607 | ||||||||||||||||||||||||||||||
| Royce Special Equity Fund | ||||||||||||||||||||||||||||||||||||||||
Investment Class | 577,591,163 | 696,228,274 | 130,040,727 | 86,530,365 | (462,146,869 | ) | (488,307,294 | ) | 245,485,021 | 294,451,345 | ||||||||||||||||||||||||||||||
Service Class | 95,889,522 | 118,969,742 | 15,496,840 | 11,164,951 | (92,178,056 | ) | (61,595,019 | ) | 19,208,306 | 68,539,674 | ||||||||||||||||||||||||||||||
Consultant Class | 8,002,331 | 20,800,103 | 3,566,493 | 2,609,373 | (7,578,889 | ) | (8,452,231 | ) | 3,989,935 | 14,957,245 | ||||||||||||||||||||||||||||||
Institutional Class | 142,834,981 | 156,918,524 | 38,652,965 | 26,944,460 | (127,183,824 | ) | (117,097,172 | ) | 54,304,122 | 66,765,812 | ||||||||||||||||||||||||||||||
| The Royce Funds 2012 Annual Report to Shareholders | 113 |
| Shares issued for | Net increase (decrease) from | |||||||||||||||||||||||||||||||||||||||
| Shares sold | reinvestment of distributions | Shares redeemed | capital share transactions | |||||||||||||||||||||||||||||||||||||
| Period ended | Period ended | Period ended | Period ended | Period ended | Period ended | Period ended | Period ended | |||||||||||||||||||||||||||||||||
| 12/31/12 | 12/31/11 | 12/31/12 | 12/31/11 | 12/31/12 | 12/31/11 | 12/31/12 | 12/31/11 | |||||||||||||||||||||||||||||||||
| Royce Value Fund | ||||||||||||||||||||||||||||||||||||||||
Investment Class | $ | 70,246,479 | $ | 236,538,146 | $ | 10,320,986 | $ | 12,574,342 | $ | (101,442,408 | ) | $ | (101,359,009 | ) | $ | (20,874,943 | ) | $ | 147,753,479 | |||||||||||||||||||||
Service Class | 109,344,849 | 339,194,986 | 44,267,749 | 71,891,837 | (442,526,639 | ) | (563,846,575 | ) | (288,914,041 | ) | (152,759,752 | ) | ||||||||||||||||||||||||||||
Consultant Class | 3,482,363 | 11,153,721 | 1,631,878 | 2,303,504 | (8,919,646 | ) | (6,458,183 | ) | (3,805,405 | ) | 6,999,042 | |||||||||||||||||||||||||||||
Institutional Class | 45,645,269 | 64,381,177 | 11,504,828 | 12,914,796 | (52,243,010 | ) | (76,857,698 | ) | 4,907,087 | 438,275 | ||||||||||||||||||||||||||||||
R Class | 12,801,375 | 20,039,567 | 1,909,362 | 2,303,851 | (12,227,421 | ) | (9,254,235 | ) | 2,483,316 | 13,089,183 | ||||||||||||||||||||||||||||||
K Class | 9,830,058 | 17,684,351 | 1,247,136 | 1,103,064 | (7,209,737 | ) | (15,175,105 | ) | 3,867,457 | 3,612,310 | ||||||||||||||||||||||||||||||
| Royce Value Plus Fund | ||||||||||||||||||||||||||||||||||||||||
Investment Class | 69,004,335 | 185,667,134 | – | 3,286,855 | (182,746,159 | ) | (155,794,609 | ) | (113,741,824 | ) | 33,159,380 | |||||||||||||||||||||||||||||
Service Class | 123,835,229 | 272,171,440 | – | 9,452,816 | (761,108,483 | ) | (1,129,725,501 | ) | (637,273,254 | ) | (848,101,245 | ) | ||||||||||||||||||||||||||||
Consultant Class | 1,261,129 | 1,284,171 | – | – | (4,591,604 | ) | (8,752,267 | ) | (3,330,475 | ) | (7,468,096 | ) | ||||||||||||||||||||||||||||
Institutional Class | 50,704,394 | 111,467,750 | – | 3,221,338 | (132,426,143 | ) | (236,584,389 | ) | (81,721,749 | ) | (121,895,301 | ) | ||||||||||||||||||||||||||||
R Class | 737,783 | 451,652 | – | 8,226 | (752,945 | ) | (178,504 | ) | (15,162 | ) | 281,374 | |||||||||||||||||||||||||||||
K Class | 159,051 | 3,058,200 | – | – | (243,989 | ) | (4,239,400 | ) | (84,938 | ) | (1,181,200 | ) | ||||||||||||||||||||||||||||
| Royce 100 Fund | ||||||||||||||||||||||||||||||||||||||||
Investment Class | 28,275,102 | 32,341,098 | 5,900,826 | 2,656,739 | (29,745,452 | ) | (29,866,675 | ) | 4,430,476 | 5,131,162 | ||||||||||||||||||||||||||||||
Service Class | 31,574,384 | 118,580,030 | 19,484,774 | 15,193,911 | (149,472,878 | ) | (144,961,683 | ) | (98,413,720 | ) | (11,187,742 | ) | ||||||||||||||||||||||||||||
R Class | 2,369,785 | 3,262,072 | 157,770 | 130,243 | (3,565,275 | ) | (972,683 | ) | (1,037,720 | ) | 2,419,632 | |||||||||||||||||||||||||||||
K Class | 1,218,557 | 4,756,044 | 248,406 | 181,048 | (2,546,125 | ) | (2,836,960 | ) | (1,079,162 | ) | 2,100,132 | |||||||||||||||||||||||||||||
| Royce Dividend Value Fund | ||||||||||||||||||||||||||||||||||||||||
Investment Class | 73,458,760 | 79,351,633 | 2,119,445 | 1,764,026 | (57,360,557 | ) | (23,957,786 | ) | 18,217,648 | 57,157,873 | ||||||||||||||||||||||||||||||
Service Class | 84,975,117 | 167,064,708 | 3,193,010 | 3,620,595 | (69,074,032 | ) | (70,064,058 | ) | 19,094,095 | 100,621,245 | ||||||||||||||||||||||||||||||
Institutional Class | 22,056,597 | 305,449 | (430,847 | ) | 21,931,199 | |||||||||||||||||||||||||||||||||||
| Royce Global Value Fund | ||||||||||||||||||||||||||||||||||||||||
Investment Class | 91,568,654 | 458,023,470 | 2,219,916 | 1,438,187 | (70,515,862 | ) | (252,329,147 | ) | 23,272,708 | 207,132,510 | ||||||||||||||||||||||||||||||
Service Class | 34,284,203 | 179,708,594 | 652,820 | 771,935 | (69,882,078 | ) | (160,663,577 | ) | (34,945,055 | ) | 19,816,952 | |||||||||||||||||||||||||||||
Consultant Class | 7,109,366 | 24,267,972 | 28,010 | 99,255 | (4,118,283 | ) | (1,410,223 | ) | 3,019,093 | 22,957,004 | ||||||||||||||||||||||||||||||
R Class | 75,891 | 950 | – | 76,841 | ||||||||||||||||||||||||||||||||||||
K Class | 42,371 | 565 | – | 42,936 | ||||||||||||||||||||||||||||||||||||
| Royce International Smaller-Companies Fund | ||||||||||||||||||||||||||||||||||||||||
Service Class | 10,558,425 | 17,672,503 | 336,519 | 1,683,837 | (8,258,463 | ) | (11,178,727 | ) | 2,636,481 | 8,177,613 | ||||||||||||||||||||||||||||||
| Shares issued for | Net increase (decrease) in | |||||||||||||||||||||||||||||||||||||||
| Shares sold | reinvestment of distributions | Shares redeemed | shares outstanding | |||||||||||||||||||||||||||||||||||||
| Period ended | Period ended | Period ended | Period ended | Period ended | Period ended | Period ended | Period ended | |||||||||||||||||||||||||||||||||
| 12/31/12 | 12/31/11 | 12/31/12 | 12/31/11 | 12/31/12 | 12/31/11 | 12/31/12 | 12/31/11 | |||||||||||||||||||||||||||||||||
| Royce Pennsylvania Mutual Fund | ||||||||||||||||||||||||||||||||||||||||
Investment Class | 57,315,522 | 93,955,432 | 23,088,722 | 13,159,567 | (108,721,143 | ) | (117,108,017 | ) | (28,316,899 | ) | (9,993,018 | ) | ||||||||||||||||||||||||||||
Service Class | 14,331,989 | 14,475,377 | 2,555,226 | 1,363,360 | (13,503,390 | ) | (16,595,769 | ) | 3,383,825 | (757,032 | ) | |||||||||||||||||||||||||||||
Consultant Class | 3,295,095 | 5,643,268 | 3,937,320 | 2,579,352 | (12,234,852 | ) | (18,914,549 | ) | (5,002,437 | ) | (10,691,929 | ) | ||||||||||||||||||||||||||||
Institutional Class | 22,317,425 | 23,477,535 | 2,922,651 | 758,043 | (5,277,914 | ) | (1,820,044 | ) | 19,962,162 | 22,415,534 | ||||||||||||||||||||||||||||||
R Class | 1,421,548 | 1,175,009 | 179,128 | 74,703 | (809,427 | ) | (666,563 | ) | 791,249 | 583,149 | ||||||||||||||||||||||||||||||
K Class | 428,087 | 456,460 | 49,436 | 19,127 | (217,025 | ) | (231,873 | ) | 260,498 | 243,714 | ||||||||||||||||||||||||||||||
| Royce Micro-Cap Fund | ||||||||||||||||||||||||||||||||||||||||
Investment Class | 7,184,519 | 14,410,692 | 2,883,568 | 3,453,352 | (22,127,390 | ) | (17,485,122 | ) | (12,059,303 | ) | 378,922 | |||||||||||||||||||||||||||||
Service Class | 5,290,434 | 2,868,077 | 522,645 | 509,469 | (6,819,080 | ) | (2,905,990 | ) | (1,006,001 | ) | 471,556 | |||||||||||||||||||||||||||||
Consultant Class | 390,707 | 861,120 | 607,577 | 552,967 | (2,035,352 | ) | (2,554,011 | ) | (1,037,068 | ) | (1,139,924 | ) | ||||||||||||||||||||||||||||
| Royce Premier Fund | ||||||||||||||||||||||||||||||||||||||||
Investment Class | 38,100,247 | 56,921,269 | 16,634,759 | 19,056,714 | (58,228,633 | ) | (74,774,521 | ) | (3,493,627 | ) | 1,203,462 | |||||||||||||||||||||||||||||
Service Class | 7,053,893 | 10,661,741 | 2,043,052 | 2,836,588 | (13,922,293 | ) | (8,148,599 | ) | (4,825,348 | ) | 5,349,730 | |||||||||||||||||||||||||||||
Consultant Class | 274,128 | 358,012 | 233,450 | 303,202 | (560,084 | ) | (930,069 | ) | (52,506 | ) | (268,855 | ) | ||||||||||||||||||||||||||||
Institutional Class | 8,171,315 | 19,132,729 | 3,090,868 | 3,634,281 | (9,977,508 | ) | (13,659,607 | ) | 1,284,675 | 9,107,403 | ||||||||||||||||||||||||||||||
W Class | 5,771,151 | 14,454,090 | 1,552,912 | 1,779,431 | (9,121,752 | ) | (7,486,167 | ) | (1,797,689 | ) | 8,747,354 | |||||||||||||||||||||||||||||
R Class | 580,289 | 1,006,378 | 102,157 | 107,576 | (458,782 | ) | (310,552 | ) | 223,664 | 803,402 | ||||||||||||||||||||||||||||||
K Class | 318,350 | 910,788 | 181,684 | 167,576 | (326,918 | ) | (433,639 | ) | 173,116 | 644,725 | ||||||||||||||||||||||||||||||
| 114 | The Royce Funds 2012 Annual Report to Shareholders |
| Shares issued for | Net increase (decrease) in | |||||||||||||||||||||||||||||||||||||||
| Shares sold | reinvestment of distributions | Shares redeemed | shares outstanding | |||||||||||||||||||||||||||||||||||||
| Period ended | Period ended | Period ended | Period ended | Period ended | Period ended | Period ended | Period ended | |||||||||||||||||||||||||||||||||
| 12/31/12 | 12/31/11 | 12/31/12 | 12/31/11 | 12/31/12 | 12/31/11 | 12/31/12 | 12/31/11 | |||||||||||||||||||||||||||||||||
| Royce Low-Priced Stock Fund | ||||||||||||||||||||||||||||||||||||||||
Investment Class | 8,187,882 | 14,766,141 | 1,478,272 | 1,480,262 | (10,464,863 | ) | (5,072,436 | ) | (798,709 | ) | 11,173,967 | |||||||||||||||||||||||||||||
Service Class | 16,082,356 | 36,270,301 | 10,083,981 | 14,559,081 | (70,093,267 | ) | (66,117,217 | ) | (43,926,930 | ) | (15,287,835 | ) | ||||||||||||||||||||||||||||
Institutional Class | 14,658,805 | 19,794,095 | 5,682,348 | 5,821,461 | (19,337,316 | ) | (15,354,755 | ) | 1,003,837 | 10,260,801 | ||||||||||||||||||||||||||||||
R Class | 104,095 | 433,871 | 31,455 | 44,901 | (229,127 | ) | (118,436 | ) | (93,577 | ) | 360,336 | |||||||||||||||||||||||||||||
K Class | 207,241 | 674,843 | 102,021 | 134,578 | (525,629 | ) | (210,142 | ) | (216,367 | ) | 599,279 | |||||||||||||||||||||||||||||
| Royce Total Return Fund | ||||||||||||||||||||||||||||||||||||||||
Investment Class | 31,093,660 | 43,347,125 | 12,992,846 | 4,874,317 | (65,700,802 | ) | (73,682,294 | ) | (21,614,296 | ) | (25,460,852 | ) | ||||||||||||||||||||||||||||
Service Class | 5,140,212 | 7,382,050 | 1,104,895 | 374,791 | (9,205,687 | ) | (7,941,788 | ) | (2,960,580 | ) | (184,947 | ) | ||||||||||||||||||||||||||||
Consultant Class | 1,485,792 | 2,356,914 | 1,051,103 | 288,296 | (4,288,883 | ) | (6,445,536 | ) | (1,751,988 | ) | (3,800,326 | ) | ||||||||||||||||||||||||||||
Institutional Class | 6,887,862 | 10,769,148 | 1,770,103 | 632,149 | (9,394,490 | ) | (7,607,871 | ) | (736,525 | ) | 3,793,426 | |||||||||||||||||||||||||||||
W Class | 4,191,083 | 6,414,204 | 768,514 | 210,690 | (2,800,377 | ) | (1,871,026 | ) | 2,159,220 | 4,753,868 | ||||||||||||||||||||||||||||||
R Class | 1,471,260 | 1,760,255 | 173,782 | 38,216 | (827,928 | ) | (591,978 | ) | 817,114 | 1,206,493 | ||||||||||||||||||||||||||||||
K Class | 9,249,102 | 16,865,834 | 1,117,868 | 339,825 | (12,806,385 | ) | (8,485,413 | ) | (2,439,415 | ) | 8,720,246 | |||||||||||||||||||||||||||||
| Royce Heritage Fund | ||||||||||||||||||||||||||||||||||||||||
Investment Class | 1,804,807 | 920,375 | �� | 88,973 | 73,804 | (718,974 | ) | (262,754 | ) | 1,174,806 | 731,425 | |||||||||||||||||||||||||||||
Service Class | 1,676,233 | 3,478,683 | 400,670 | 759,273 | (4,845,156 | ) | (3,632,933 | ) | (2,768,253 | ) | 605,023 | |||||||||||||||||||||||||||||
Consultant Class | 151,913 | 458,167 | 37,493 | 69,418 | (299,964 | ) | (249,851 | ) | (110,558 | ) | 277,734 | |||||||||||||||||||||||||||||
R Class | 189,339 | 404,387 | 15,043 | 21,650 | (173,028 | ) | (176,673 | ) | 31,354 | 249,364 | ||||||||||||||||||||||||||||||
K Class | 440,847 | 594,107 | 25,725 | 47,389 | (601,164 | ) | (303,773 | ) | (134,592 | ) | 337,723 | |||||||||||||||||||||||||||||
| Royce Opportunity Fund | ||||||||||||||||||||||||||||||||||||||||
Investment Class | 11,028,382 | 16,080,330 | 4,137,014 | 1,525,352 | (23,238,518 | ) | (29,329,940 | ) | (8,073,122 | ) | (11,724,258 | ) | ||||||||||||||||||||||||||||
Service Class | 6,304,466 | 6,253,247 | 857,445 | 311,146 | (5,418,150 | ) | (17,108,991 | ) | 1,743,761 | (10,544,598 | ) | |||||||||||||||||||||||||||||
Consultant Class | 156,945 | 371,087 | 63,752 | 23,572 | (366,220 | ) | (311,141 | ) | (145,523 | ) | 83,518 | |||||||||||||||||||||||||||||
Institutional Class | 13,339,942 | 12,519,115 | 2,950,759 | 959,534 | (14,367,297 | ) | (15,954,285 | ) | 1,923,404 | (2,475,636 | ) | |||||||||||||||||||||||||||||
R Class | 368,584 | 247,611 | 34,204 | 6,061 | (134,921 | ) | (63,912 | ) | 267,867 | 189,760 | ||||||||||||||||||||||||||||||
K Class | 255,383 | 1,128,142 | 49,285 | 13,930 | (174,304 | ) | (1,053,344 | ) | 130,364 | 88,728 | ||||||||||||||||||||||||||||||
| Royce Special Equity Fund | ||||||||||||||||||||||||||||||||||||||||
Investment Class | 27,211,249 | 33,469,863 | 6,281,951 | 4,453,441 | (21,715,568 | ) | (24,072,476 | ) | 11,777,632 | 13,850,828 | ||||||||||||||||||||||||||||||
Service Class | 4,525,611 | 5,712,641 | 749,726 | 575,810 | (4,387,157 | ) | (3,018,331 | ) | 888,180 | 3,270,120 | ||||||||||||||||||||||||||||||
Consultant Class | 393,687 | 1,037,328 | 180,399 | 140,063 | (375,603 | ) | (425,823 | ) | 198,483 | 751,568 | ||||||||||||||||||||||||||||||
Institutional Class | 6,717,922 | 7,481,863 | 1,874,538 | 1,392,479 | (5,963,143 | ) | (5,729,562 | ) | 2,629,317 | 3,144,780 | ||||||||||||||||||||||||||||||
| Royce Value Fund | ||||||||||||||||||||||||||||||||||||||||
Investment Class | 6,106,020 | 18,150,120 | 928,146 | 1,150,443 | (8,777,389 | ) | (8,468,180 | ) | (1,743,223 | ) | 10,832,383 | |||||||||||||||||||||||||||||
Service Class | 9,480,588 | 25,928,581 | 3,991,686 | 6,595,581 | (39,259,385 | ) | (45,319,524 | ) | (25,787,111 | ) | (12,795,362 | ) | ||||||||||||||||||||||||||||
Consultant Class | 315,057 | 892,206 | 154,388 | 220,854 | (822,780 | ) | (542,320 | ) | (353,335 | ) | 570,740 | |||||||||||||||||||||||||||||
Institutional Class | 3,985,141 | 5,163,976 | 1,034,607 | 1,180,512 | (4,574,089 | ) | (6,225,995 | ) | 445,659 | 118,493 | ||||||||||||||||||||||||||||||
R Class | 1,126,145 | 1,581,685 | 175,010 | 214,312 | (1,092,910 | ) | (743,888 | ) | 208,245 | 1,052,109 | ||||||||||||||||||||||||||||||
K Class | 1,047,488 | 1,654,858 | 139,501 | 123,662 | (768,482 | ) | (1,456,778 | ) | 418,507 | 321,742 | ||||||||||||||||||||||||||||||
| Royce Value Plus Fund | ||||||||||||||||||||||||||||||||||||||||
Investment Class | 5,344,485 | 13,953,159 | – | 275,512 | (13,687,043 | ) | (12,058,932 | ) | (8,342,558 | ) | 2,169,739 | |||||||||||||||||||||||||||||
Service Class | 9,451,131 | 20,796,051 | – | 795,022 | (57,686,001 | ) | (86,273,369 | ) | (48,234,870 | ) | (64,682,296 | ) | ||||||||||||||||||||||||||||
Consultant Class | 97,660 | 99,173 | – | – | (361,007 | ) | (684,718 | ) | (263,347 | ) | (585,545 | ) | ||||||||||||||||||||||||||||
Institutional Class | 3,813,004 | 8,212,310 | – | 269,794 | (9,966,075 | ) | (18,297,908 | ) | (6,153,071 | ) | (9,815,804 | ) | ||||||||||||||||||||||||||||
R Class | 56,661 | 33,407 | – | 705 | (57,916 | ) | (13,559 | ) | (1,255 | ) | 20,553 | |||||||||||||||||||||||||||||
K Class | 16,250 | 333,094 | – | – | (25,241 | ) | (465,542 | ) | (8,991 | ) | (132,448 | ) | ||||||||||||||||||||||||||||
| Royce 100 Fund | ||||||||||||||||||||||||||||||||||||||||
Investment Class | 3,117,457 | 3,285,201 | 686,458 | 309,283 | (3,286,242 | ) | (3,107,511 | ) | 517,673 | 486,973 | ||||||||||||||||||||||||||||||
Service Class | 3,400,812 | 12,069,200 | 2,288,621 | 1,783,323 | (16,496,087 | ) | (15,506,812 | ) | (10,806,654 | ) | (1,654,289 | ) | ||||||||||||||||||||||||||||
R Class | 212,108 | 287,703 | 15,083 | 12,682 | (323,459 | ) | (84,431 | ) | (96,268 | ) | 215,954 | |||||||||||||||||||||||||||||
K Class | 108,470 | 398,695 | 23,523 | 17,442 | (228,464 | ) | (241,925 | ) | (96,471 | ) | 174,212 | |||||||||||||||||||||||||||||
| The Royce Funds 2012 Annual Report to Shareholders | 115 |
| Shares issued for | Net increase (decrease) in | |||||||||||||||||||||||||||||||||||||||
| Shares sold | reinvestment of distributions | Shares redeemed | shares outstanding | |||||||||||||||||||||||||||||||||||||
| Period ended | Period ended | Period ended | Period ended | Period ended | Period ended | Period ended | Period ended | |||||||||||||||||||||||||||||||||
| 12/31/12 | 12/31/11 | 12/31/12 | 12/31/11 | 12/31/12 | 12/31/11 | 12/31/12 | 12/31/11 | |||||||||||||||||||||||||||||||||
| Royce Dividend Value Fund | ||||||||||||||||||||||||||||||||||||||||
Investment Class | 10,955,363 | 11,679,392 | 306,194 | 279,799 | (8,396,697 | ) | (3,772,024 | ) | 2,864,860 | 8,187,167 | ||||||||||||||||||||||||||||||
Service Class | 12,321,600 | 24,465,109 | 458,132 | 569,317 | (10,025,848 | ) | (10,620,820 | ) | 2,753,884 | 14,413,606 | ||||||||||||||||||||||||||||||
Institutional Class | 3,238,890 | 43,093 | (61,381 | ) | 3,220,602 | |||||||||||||||||||||||||||||||||||
| Royce Global Value Fund | ||||||||||||||||||||||||||||||||||||||||
Investment Class | 7,291,263 | 31,068,356 | 175,061 | 119,550 | (5,672,627 | ) | (19,622,886 | ) | 1,793,697 | 11,565,020 | ||||||||||||||||||||||||||||||
Service Class | 2,693,567 | 12,306,022 | 51,403 | 64,008 | (5,587,200 | ) | (11,710,844 | ) | (2,842,230 | ) | 659,186 | |||||||||||||||||||||||||||||
Consultant Class | 564,189 | 1,694,955 | 2,221 | 8,264 | (338,661 | ) | (116,145 | ) | 227,749 | 1,587,074 | ||||||||||||||||||||||||||||||
R Class | 8,118 | 100 | – | 8,218 | ||||||||||||||||||||||||||||||||||||
K Class | 4,237 | 59 | – | 4,296 | ||||||||||||||||||||||||||||||||||||
| Royce International Smaller-Companies Fund | ||||||||||||||||||||||||||||||||||||||||
Service Class | 1,000,016 | 1,481,538 | 30,648 | 173,413 | (791,871 | ) | (980,107 | ) | 238,793 | 674,844 | ||||||||||||||||||||||||||||||
Investment Adviser: Under the Trust’s investment advisory agreements with Royce, Royce is entitled to receive Investment Advisory fees that are computed daily and payable monthly. Royce’s commitment to waive its fees and reimburse class-specific expenses to the extent necessary to maintain certain Funds’ net annual operating expense ratios at specified levels through April 30, 2013, is shown below to the extent that it impacted net expenses for the period ended December 31, 2012. See the Prospectus for contractual waiver expiration dates.
| Annual contractual | Committed net annual | Period ended | ||||||||||||||||||||||||||||||||||||||||||||||||
| advisory fee as a | operating expense ratio cap | December 31, 2012 | ||||||||||||||||||||||||||||||||||||||||||||||||
| percentage of | Investment | Service | Consultant | Institutional | Net advisory | Advisory | ||||||||||||||||||||||||||||||||||||||||||||
| average net assets1 | Class3 | Class3 | Class3 | Class3 | W Class3 | R Class3 | K Class3 | fees | fees waived | |||||||||||||||||||||||||||||||||||||||||
Royce Pennsylvania Mutual Fund | 0.75 | %2 | N/A | N/A | N/A | N/A | N/A | N/A | N/A | $ | 44,654,744 | $ | – | |||||||||||||||||||||||||||||||||||||
Royce Micro-Cap Fund | 1.30 | % | N/A | 1.66 | % | N/A | N/A | N/A | N/A | N/A | 14,763,517 | – | ||||||||||||||||||||||||||||||||||||||
Royce Premier Fund | 0.94 | % | N/A | N/A | N/A | N/A | N/A | N/A | N/A | 64,565,815 | – | |||||||||||||||||||||||||||||||||||||||
Royce Low-Priced Stock Fund | 1.13 | % | 1.24 | % | 1.49 | % | N/A | N/A | N/A | 1.84 | % | 1.59 | % | 41,094,630 | – | |||||||||||||||||||||||||||||||||||
Royce Total Return Fund | 0.97 | % | N/A | N/A | N/A | N/A | N/A | N/A | N/A | 43,907,098 | – | |||||||||||||||||||||||||||||||||||||||
Royce Heritage Fund | 1.00 | % | N/A | N/A | N/A | N/A | N/A | 1.84 | % | 1.59 | % | 2,713,893 | – | |||||||||||||||||||||||||||||||||||||
Royce Opportunity Fund | 1.00 | % | N/A | N/A | N/A | N/A | N/A | 1.84 | % | N/A | 17,728,592 | – | ||||||||||||||||||||||||||||||||||||||
Royce Special Equity Fund | 0.99 | % | N/A | 1.39 | % | N/A | N/A | N/A | N/A | N/A | 27,559,900 | – | ||||||||||||||||||||||||||||||||||||||
Royce Value Fund | 1.00 | % | N/A | N/A | N/A | N/A | N/A | N/A | N/A | 14,921,949 | – | |||||||||||||||||||||||||||||||||||||||
Royce Value Plus Fund | 1.00 | % | N/A | N/A | N/A | N/A | N/A | 1.84 | % | 1.59 | % | 17,718,634 | – | |||||||||||||||||||||||||||||||||||||
Royce 100 Fund | 1.00 | % | N/A | N/A | N/A | N/A | N/A | 1.84 | % | 1.59 | % | 3,558,074 | – | |||||||||||||||||||||||||||||||||||||
Royce Dividend Value Fund | 1.00 | % | N/A | N/A | N/A | 1.04 | % | N/A | N/A | N/A | 3,467,240 | 23,867 | ||||||||||||||||||||||||||||||||||||||
Royce Global Value Fund | 1.25 | % | 1.44 | % | 1.69 | % | 2.44 | % | N/A | N/A | 1.99 | % | 1.74 | % | 3,843,650 | – | ||||||||||||||||||||||||||||||||||
Royce International Smaller-Companies Fund | 1.25 | % | N/A | 1.69 | % | N/A | N/A | N/A | N/A | N/A | 195,920 | 105,865 | ||||||||||||||||||||||||||||||||||||||
| 116 | The Royce Funds 2012 Annual Report to Shareholders |
| Period ended December 31, 2012 | |||||||||||||||
| Annual contractual distribution fee as | Net distribution | Distribution fees | |||||||||||||
| a percentage of average net assets | fees | waived | |||||||||||||
Royce Pennsylvania Mutual Fund – Service Class | 0.25 | % | $ | 1,094,517 | $ | – | |||||||||
Royce Pennsylvania Mutual Fund – Consultant Class | 1.00 | % | 6,673,158 | – | |||||||||||
Royce Pennsylvania Mutual Fund – R Class | 0.50 | % | 144,883 | – | |||||||||||
Royce Pennsylvania Mutual Fund – K Class | 0.25 | % | 19,302 | – | |||||||||||
Royce Micro-Cap Fund – Service Class | 0.25 | % | 324,182 | – | |||||||||||
Royce Micro-Cap Fund – Consultant Class | 1.00 | % | 1,313,778 | – | |||||||||||
Royce Premier Fund – Service Class | 0.25 | % | 1,497,498 | 62,396 | |||||||||||
Royce Premier Fund – Consultant Class | 1.00 | % | 614,809 | – | |||||||||||
Royce Premier Fund – R Class | 0.50 | % | 141,573 | – | |||||||||||
Royce Premier Fund – K Class | 0.25 | % | 25,080 | – | |||||||||||
Royce Low-Priced Stock Fund – Service Class | 0.25 | % | 5,656,380 | – | |||||||||||
Royce Low-Priced Stock Fund – R Class | 0.50 | % | 33,816 | – | |||||||||||
Royce Low-Priced Stock Fund – K Class | 0.25 | % | 20,195 | – | |||||||||||
Royce Total Return Fund – Service Class | 0.25 | % | 724,394 | – | |||||||||||
Royce Total Return Fund – Consultant Class | 1.00 | % | 3,322,764 | – | |||||||||||
Royce Total Return Fund – R Class | 0.50 | % | 217,107 | – | |||||||||||
Royce Total Return Fund – K Class | 0.25 | % | 476,410 | – | |||||||||||
Royce Heritage Fund – Service Class | 0.25 | % | 519,675 | 21,653 | |||||||||||
Royce Heritage Fund – Consultant Class | 1.00 | % | 138,840 | – | |||||||||||
Royce Heritage Fund – R Class | 0.50 | % | 24,022 | – | |||||||||||
Royce Heritage Fund – K Class | 0.25 | % | 16,167 | – | |||||||||||
Royce Opportunity Fund – Service Class | 0.25 | % | 438,762 | – | |||||||||||
Royce Opportunity Fund – Consultant Class | 1.00 | % | 123,410 | – | |||||||||||
Royce Opportunity Fund – R Class | 0.50 | % | 23,251 | – | |||||||||||
Royce Opportunity Fund – K Class | 0.25 | % | 19,185 | – | |||||||||||
Royce Special Equity Fund – Service Class | 0.25 | % | 615,956 | – | |||||||||||
Royce Special Equity Fund – Consultant Class | 1.00 | % | 562,007 | – | |||||||||||
Royce Value Fund – Service Class | 0.25 | % | 2,454,125 | – | |||||||||||
Royce Value Fund – Consultant Class | 1.00 | % | 362,987 | – | |||||||||||
Royce Value Fund – R Class | 0.50 | % | 188,974 | – | |||||||||||
Royce Value Fund – K Class | 0.25 | % | 43,185 | – | |||||||||||
Royce Value Plus Fund – Service Class | 0.25 | % | 2,984,615 | 124,359 | |||||||||||
Royce Value Plus Fund – Consultant Class | 1.00 | % | 205,081 | – | |||||||||||
Royce Value Plus Fund – R Class | 0.50 | % | 6,599 | – | |||||||||||
Royce Value Plus Fund – K Class | 0.25 | % | 1,344 | – | |||||||||||
Royce 100 Fund – Service Class | 0.25 | % | 587,442 | 111,894 | |||||||||||
Royce 100 Fund – R Class | 0.50 | % | 19,362 | – | |||||||||||
Royce 100 Fund – K Class | 0.25 | % | 10,686 | – | |||||||||||
Royce Dividend Value Fund – Service Class | 0.25 | % | 534,815 | 46,506 | |||||||||||
Royce Global Value Fund – Service Class | 0.25 | % | 291,040 | – | |||||||||||
Royce Global Value Fund – Consultant Class | 1.00 | % | 218,132 | – | |||||||||||
Royce Global Value Fund – R Class | 0.50 | % | 238 | – | |||||||||||
Royce Global Value Fund – K Class | 0.25 | % | 77 | – | |||||||||||
Royce International Smaller-Companies Fund – Service Class | 0.25 | % | 60,357 | – | |||||||||||
| Purchases | Sales | Purchases | Sales | |||||||||||||||||||
Royce Pennsylvania Mutual Fund | $ | 1,296,763,325 | $ | 1,641,808,072 | Royce Special Equity Fund | $ | 847,133,460 | $ | 763,938,619 | |||||||||||||
Royce Micro-Cap Fund | 168,517,587 | 422,228,479 | Royce Value Fund | 371,470,142 | 727,807,721 | |||||||||||||||||
Royce Premier Fund | 452,473,487 | 777,261,261 | Royce Value Plus Fund | 555,055,431 | 1,352,994,338 | |||||||||||||||||
Royce Low-Priced Stock Fund | 281,778,471 | 1,139,414,488 | Royce 100 Fund | 44,307,476 | 164,540,293 | |||||||||||||||||
Royce Total Return Fund | 725,637,181 | 1,132,554,421 | Royce Dividend Value Fund | 150,835,615 | 94,870,783 | |||||||||||||||||
Royce Heritage Fund | 103,679,503 | 131,837,897 | Royce Global Value Fund | 103,027,012 | 115,585,604 | |||||||||||||||||
Royce Opportunity Fund | 560,139,395 | 759,967,171 | Royce International Smaller-Companies Fund | 12,615,039 | 9,691,983 | |||||||||||||||||
| The Royce Funds 2012 Annual Report to Shareholders | 117 |
| Class Level | |||||||||||||||||||||||||||||||||||
| Transfer | Expenses | ||||||||||||||||||||||||||||||||||
| Net | Agent | Reimbursed by | |||||||||||||||||||||||||||||||||
| Distribution | Shareholder | Shareholder | Balance | Investment | |||||||||||||||||||||||||||||||
| Fees | Servicing | Reports | Registration | Credits | Total | Adviser | |||||||||||||||||||||||||||||
Royce Pennsylvania Mutual Fund – Investment Class | $ | – | $ | 3,717,100 | $ | 853,819 | $ | 64,151 | $ | (1,993 | ) | $ | 4,633,077 | $ | – | ||||||||||||||||||||
Royce Pennsylvania Mutual Fund – Service Class | 1,094,517 | 771,054 | 138,037 | 13,590 | (47 | ) | 2,017,151 | – | |||||||||||||||||||||||||||
Royce Pennsylvania Mutual Fund – Consultant Class | 6,673,158 | 1,018,431 | 203,895 | 16,021 | (637 | ) | 7,910,868 | – | |||||||||||||||||||||||||||
Royce Pennsylvania Mutual Fund – Institutional Class | – | 6,663 | 15,911 | 14,256 | (2 | ) | 36,828 | – | |||||||||||||||||||||||||||
Royce Pennsylvania Mutual Fund – R Class | 144,883 | 57,106 | 4,473 | 1,201 | (26 | ) | 207,637 | – | |||||||||||||||||||||||||||
Royce Pennsylvania Mutual Fund – K Class | 19,302 | 15,403 | 1,189 | 1,200 | (3 | ) | 37,091 | – | |||||||||||||||||||||||||||
| 7,931,860 | 5,585,757 | 1,217,324 | 110,419 | (2,708 | ) | ||||||||||||||||||||||||||||||
Royce Micro-Cap Fund – Investment Class | – | 594,526 | 361,746 | 37,916 | (527 | ) | 993,661 | – | |||||||||||||||||||||||||||
Royce Micro-Cap Fund – Service Class | 324,182 | 119,733 | 36,520 | 12,972 | (34 | ) | 493,373 | 99,240 | |||||||||||||||||||||||||||
Royce Micro-Cap Fund – Consultant Class | 1,313,778 | 207,325 | 34,617 | 12,745 | (126 | ) | 1,568,339 | – | |||||||||||||||||||||||||||
| 1,637,960 | 921,584 | 432,883 | 63,633 | (687 | ) | 99,240 | |||||||||||||||||||||||||||||
Royce Premier Fund – Investment Class | – | 3,156,312 | 1,228,135 | 73,109 | (1,512 | ) | 4,456,044 | – | |||||||||||||||||||||||||||
Royce Premier Fund – Service Class | 1,497,498 | 623,057 | 86,572 | 13,811 | (109 | ) | 2,220,829 | – | |||||||||||||||||||||||||||
Royce Premier Fund – Consultant Class | 614,809 | 67,326 | 16,247 | 11,931 | (55 | ) | 710,258 | – | |||||||||||||||||||||||||||
Royce Premier Fund – Institutional Class | – | 8,601 | 77,168 | 16,173 | (8 | ) | 101,934 | – | |||||||||||||||||||||||||||
Royce Premier Fund – W Class | – | 283,822 | 154,840 | 23,280 | (313 | ) | 461,629 | – | |||||||||||||||||||||||||||
Royce Premier Fund – R Class | 141,573 | 54,755 | 3,724 | 1,200 | (12 | ) | 201,240 | – | |||||||||||||||||||||||||||
Royce Premier Fund – K Class | 25,080 | 23,346 | 696 | 1,200 | (3 | ) | 50,319 | – | |||||||||||||||||||||||||||
| 2,278,960 | 4,217,219 | 1,567,382 | 140,704 | (2,012 | ) | ||||||||||||||||||||||||||||||
Royce Low-Priced Stock Fund – Investment Class | – | 206,192 | 42,743 | 27,470 | (25 | ) | 276,380 | 48,166 | |||||||||||||||||||||||||||
Royce Low-Priced Stock Fund – Service Class | 5,656,380 | 3,047,842 | 493,261 | 25,979 | (900 | ) | 9,222,562 | 1,894,624 | |||||||||||||||||||||||||||
Royce Low-Priced Stock Fund – Institutional Class | – | 9,016 | 275,402 | 18,163 | (7 | ) | 302,574 | – | |||||||||||||||||||||||||||
Royce Low-Priced Stock Fund – R Class | 33,816 | 23,110 | 1,602 | 1,200 | (10 | ) | 59,718 | 14,147 | |||||||||||||||||||||||||||
Royce Low-Priced Stock Fund – K Class | 20,195 | 21,293 | 1,387 | 1,200 | (3 | ) | 44,072 | 9,792 | |||||||||||||||||||||||||||
| 5,710,391 | 3,307,453 | 814,395 | 74,012 | (945 | ) | 1,966,729 | |||||||||||||||||||||||||||||
Royce Total Return Fund – Investment Class | – | 2,202,013 | 730,586 | 47,185 | (1,641 | ) | 2,978,143 | – | |||||||||||||||||||||||||||
Royce Total Return Fund – Service Class | 724,394 | 320,623 | 54,858 | 13,827 | (43 | ) | 1,113,659 | – | |||||||||||||||||||||||||||
Royce Total Return Fund – Consultant Class | 3,322,764 | 536,070 | 102,274 | 19,081 | (318 | ) | 3,979,871 | – | |||||||||||||||||||||||||||
Royce Total Return Fund – Institutional Class | – | 10,128 | 24,484 | 19,863 | (14 | ) | 54,461 | – | |||||||||||||||||||||||||||
Royce Total Return Fund – W Class | – | 99,545 | 60,813 | 18,763 | (6 | ) | 179,115 | – | |||||||||||||||||||||||||||
Royce Total Return Fund – R Class | 217,107 | 95,460 | 5,161 | 1,201 | (25 | ) | 318,904 | – | |||||||||||||||||||||||||||
Royce Total Return Fund – K Class | 476,410 | 334,900 | 2,319 | 1,203 | (7 | ) | 814,825 | – | |||||||||||||||||||||||||||
| 4,740,675 | 3,598,739 | 980,495 | 121,123 | (2,054 | ) | ||||||||||||||||||||||||||||||
Royce Heritage Fund – Investment Class | – | 21,504 | 4,225 | 12,914 | (7 | ) | 38,636 | – | |||||||||||||||||||||||||||
Royce Heritage Fund – Service Class | 519,675 | 218,882 | 73,033 | 22,829 | (276 | ) | 834,143 | – | |||||||||||||||||||||||||||
Royce Heritage Fund – Consultant Class | 138,840 | 26,215 | 8,212 | 13,679 | (28 | ) | 186,918 | – | |||||||||||||||||||||||||||
Royce Heritage Fund – R Class | 24,022 | 16,128 | 1,332 | 1,018 | (7 | ) | 42,493 | 5,213 | |||||||||||||||||||||||||||
Royce Heritage Fund – K Class | 16,167 | 16,361 | 993 | 1,026 | (4 | ) | 34,543 | 988 | |||||||||||||||||||||||||||
| 698,704 | 299,090 | 87,795 | 51,466 | (322 | ) | 6,201 | |||||||||||||||||||||||||||||
Royce Opportunity Fund – Investment Class | – | 661,574 | 180,154 | 35,551 | (612 | ) | 876,667 | – | |||||||||||||||||||||||||||
Royce Opportunity Fund – Service Class | 438,762 | 249,292 | 58,114 | 12,820 | (19 | ) | 758,969 | – | |||||||||||||||||||||||||||
Royce Opportunity Fund – Consultant Class | 123,410 | 25,335 | 4,843 | 10,558 | (17 | ) | 164,129 | – | |||||||||||||||||||||||||||
Royce Opportunity Fund – Institutional Class | – | 7,265 | 19,557 | 18,562 | (6 | ) | 45,378 | – | |||||||||||||||||||||||||||
Royce Opportunity Fund – R Class | 23,251 | 19,413 | 1,700 | 1,008 | (11 | ) | 45,361 | 7,986 | |||||||||||||||||||||||||||
Royce Opportunity Fund – K Class | 19,185 | 16,659 | 704 | 1,024 | (3 | ) | 37,569 | – | |||||||||||||||||||||||||||
| 604,608 | 979,538 | 265,072 | 79,523 | (668 | ) | 7,986 | |||||||||||||||||||||||||||||
Royce Special Equity Fund – Investment Class | – | 1,755,598 | 457,880 | 74,345 | (1,206 | ) | 2,286,617 | – | |||||||||||||||||||||||||||
Royce Special Equity Fund – Service Class | 615,956 | 299,134 | 89,816 | 18,104 | (354 | ) | 1,022,656 | 97,644 | |||||||||||||||||||||||||||
Royce Special Equity Fund – Consultant Class | 562,007 | 61,672 | 16,696 | 12,504 | (58 | ) | 652,821 | – | |||||||||||||||||||||||||||
Royce Special Equity Fund – Institutional Class | – | 7,422 | 6,005 | 16,026 | (6 | ) | 29,447 | – | |||||||||||||||||||||||||||
| 1,177,963 | 2,123,826 | 570,397 | 120,979 | (1,624 | ) | 97,644 | |||||||||||||||||||||||||||||
| 118 | The Royce Funds 2012 Annual Report to Shareholders |
| Class Level | |||||||||||||||||||||||||||||||||||
| Transfer | Expenses | ||||||||||||||||||||||||||||||||||
| Net | Agent | Reimbursed by | |||||||||||||||||||||||||||||||||
| Distribution | Shareholder | Shareholder | Balance | Investment | |||||||||||||||||||||||||||||||
| Fees | Servicing | Reports | Registration | Credits | Total | Adviser | |||||||||||||||||||||||||||||
Royce Value Fund – Investment Class | $ | – | $ | 224,116 | $ | 95,109 | $ | 16,800 | $ | (395 | ) | $ | 335,630 | $ | – | ||||||||||||||||||||
Royce Value Fund – Service Class | 2,454,125 | 1,312,091 | 277,746 | 29,356 | (704 | ) | 4,072,614 | – | |||||||||||||||||||||||||||
Royce Value Fund – Consultant Class | 362,987 | 55,340 | 14,216 | 11,512 | (51 | ) | 444,004 | – | |||||||||||||||||||||||||||
Royce Value Fund – Institutional Class | – | 7,294 | 1,737 | 15,406 | (5 | ) | 24,432 | – | |||||||||||||||||||||||||||
Royce Value Fund – R Class | 188,974 | 114,874 | 3,669 | 1,202 | (20 | ) | 308,699 | – | |||||||||||||||||||||||||||
Royce Value Fund – K Class | 43,185 | 38,456 | 3,150 | 1,201 | (4 | ) | 85,988 | – | |||||||||||||||||||||||||||
| 3,049,271 | 1,752,171 | 395,627 | 75,477 | (1,179 | ) | ||||||||||||||||||||||||||||||
Royce Value Plus Fund – Investment Class | – | 458,520 | 138,002 | 15,525 | (86 | ) | 611,961 | – | |||||||||||||||||||||||||||
Royce Value Plus Fund – Service Class | 2,984,615 | 1,596,973 | 376,529 | 21,802 | (534 | ) | 4,979,385 | – | |||||||||||||||||||||||||||
Royce Value Plus Fund – Consultant Class | 205,081 | 48,692 | 9,860 | 10,614 | (31 | ) | 274,216 | – | |||||||||||||||||||||||||||
Royce Value Plus Fund – Institutional Class | – | (4,261 | ) | 43,844 | 18,948 | (6 | ) | 58,525 | – | ||||||||||||||||||||||||||
Royce Value Plus Fund – R Class | 6,599 | 8,903 | 665 | 1,200 | (4 | ) | 17,363 | 6,742 | |||||||||||||||||||||||||||
Royce Value Plus Fund – K Class | 1,344 | 7,598 | 200 | 1,200 | (2 | ) | 10,340 | 7,359 | |||||||||||||||||||||||||||
| 3,197,639 | 2,116,425 | 569,100 | 69,289 | (663 | ) | 14,101 | |||||||||||||||||||||||||||||
Royce 100 Fund – Investment Class | – | 58,480 | 27,153 | 12,494 | (101 | ) | 98,026 | – | |||||||||||||||||||||||||||
Royce 100 Fund – Service Class | 587,442 | 331,719 | 131,914 | 22,842 | (252 | ) | 1,073,665 | – | |||||||||||||||||||||||||||
Royce 100 Fund – R Class | 19,362 | 27,063 | 12,789 | 201 | (99 | ) | 59,316 | 28,310 | |||||||||||||||||||||||||||
Royce 100 Fund – K Class | 10,686 | 14,855 | 949 | 1,006 | (3 | ) | 27,493 | 4,043 | |||||||||||||||||||||||||||
| 617,490 | 432,117 | 172,805 | 36,543 | (455 | ) | 32,353 | |||||||||||||||||||||||||||||
Royce Dividend Value Fund – Investment Class | – | 102,328 | 37,461 | 17,883 | (25 | ) | 157,647 | – | |||||||||||||||||||||||||||
Royce Dividend Value Fund – Service Class | 534,815 | 289,403 | 112,268 | 26,547 | (635 | ) | 962,398 | – | |||||||||||||||||||||||||||
Royce Dividend Value Fund – Institutional Class | – | 3,987 | 32 | 15,612 | – | 19,631 | 19,631 | ||||||||||||||||||||||||||||
| 534,815 | 395,718 | 149,761 | 60,042 | (660 | ) | 19,631 | |||||||||||||||||||||||||||||
Royce Global Value Fund – Investment Class | – | 137,063 | 46,890 | 22,770 | (23 | ) | 206,700 | 48,254 | |||||||||||||||||||||||||||
Royce Global Value Fund – Service Class | 291,040 | 169,866 | 46,299 | 20,622 | (162 | ) | 527,665 | 129,051 | |||||||||||||||||||||||||||
Royce Global Value Fund – Consultant Class | 218,132 | 23,068 | 8,606 | 12,032 | (24 | ) | 261,814 | 23,333 | |||||||||||||||||||||||||||
Royce Global Value Fund – R Class | 238 | 5,967 | 30 | 2,262 | – | 8,497 | 8,182 | ||||||||||||||||||||||||||||
Royce Global Value Fund – K Class | 77 | 6,437 | 28 | 2,263 | – | 8,805 | 8,678 | ||||||||||||||||||||||||||||
| 509,487 | 342,401 | 101,853 | 59,949 | (209 | ) | 217,498 | |||||||||||||||||||||||||||||
| Net Unrealized | ||||||||||||||||||||
| Appreciation | Gross Unrealized | |||||||||||||||||||
| Tax Basis Cost | (Depreciation) | Appreciation | Depreciation | |||||||||||||||||
Royce Pennsylvania Mutual Fund | $4,801,372,697 | $1,206,454,762 | $1,676,737,604 | $470,282,842 | ||||||||||||||||
Royce Micro-Cap Fund | 887,591,126 | 101,313,945 | 225,357,555 | 124,043,610 | ||||||||||||||||
Royce Premier Fund | 4,988,382,225 | 1,899,471,605 | 2,207,582,279 | 308,110,674 | ||||||||||||||||
Royce Low-Priced Stock Fund | 2,818,270,300 | 333,252,236 | 697,782,183 | 364,529,947 | ||||||||||||||||
Royce Total Return Fund | 3,204,950,359 | 1,275,989,743 | 1,522,964,862 | 246,975,119 | ||||||||||||||||
Royce Heritage Fund | 220,032,325 | 51,243,252 | 56,847,578 | 5,604,326 | ||||||||||||||||
Royce Opportunity Fund | 1,797,682,392 | 125,441,663 | 371,440,228 | 245,998,565 | ||||||||||||||||
Royce Special Equity Fund | 2,422,268,581 | 506,033,105 | 553,085,605 | 47,052,500 | ||||||||||||||||
Royce Value Fund | 1,255,699,434 | 98,140,314 | 210,289,608 | 112,149,294 | ||||||||||||||||
Royce Value Plus Fund | 1,337,646,409 | 203,826,078 | 313,483,701 | 109,657,623 | ||||||||||||||||
Royce 100 Fund | 245,215,584 | 55,339,390 | 73,569,270 | 18,229,880 | ||||||||||||||||
Royce Dividend Value Fund | 361,292,498 | 39,456,115 | 54,446,904 | 14,990,789 | ||||||||||||||||
Royce Global Value Fund | 332,092,155 | (28,260,431 | ) | 21,782,778 | 50,043,209 | |||||||||||||||
Royce International Smaller-Companies Fund | 24,435,964 | 2,202,110 | 3,825,151 | 1,623,041 | ||||||||||||||||
| The Royce Funds 2012 Annual Report to Shareholders | 119 |
| Ordinary Income | Long-Term Capital Gains | Return of Capital | ||||||||||||||||||||||||||||
| 2012 | 2011 | 2012 | 2011 | 2012 | 2011 | |||||||||||||||||||||||||
Royce Pennsylvania Mutual Fund | $ | 83,523,200 | $ | 7,542,786 | $ | 303,972,765 | $ | 196,847,870 | $ | – | $ | – | ||||||||||||||||||
Royce Micro-Cap Fund | 3,824,113 | 14,271,892 | 55,623,852 | 54,873,388 | – | – | ||||||||||||||||||||||||
Royce Premier Fund | 89,857,357 | 18,295,499 | 391,763,741 | 531,796,630 | – | – | ||||||||||||||||||||||||
Royce Low-Priced Stock Fund | 43,483,652 | 30,296,582 | 193,625,861 | 292,701,390 | – | – | ||||||||||||||||||||||||
Royce Total Return Fund | 79,171,771 | 38,550,895 | 188,093,615 | 51,505,439 | – | – | ||||||||||||||||||||||||
Royce Heritage Fund | 1,004,504 | 1,852,743 | 6,791,289 | 10,510,436 | – | – | ||||||||||||||||||||||||
Royce Opportunity Fund | 19,148,442 | – | 78,255,181 | 29,807,248 | – | – | ||||||||||||||||||||||||
Royce Special Equity Fund | 60,596,614 | 10,778,714 | 143,718,325 | 125,568,255 | – | – | ||||||||||||||||||||||||
Royce Value Fund | 14,199,753 | 4,774,888 | 59,275,272 | 102,920,152 | – | – | ||||||||||||||||||||||||
Royce Value Plus Fund | – | 17,103,397 | – | – | – | – | ||||||||||||||||||||||||
Royce 100 Fund | 3,453,944 | 1,521,477 | 23,230,700 | 17,397,478 | – | – | ||||||||||||||||||||||||
Royce Dividend Value Fund | 5,115,955 | 4,203,847 | 932,214 | 1,660,209 | – | – | ||||||||||||||||||||||||
Royce Global Value Fund | 2,959,631 | 2,377,724 | – | – | – | – | ||||||||||||||||||||||||
Royce International Smaller-Companies Fund | 351,848 | 402,788 | – | 1,284,509 | – | 12,924 | ||||||||||||||||||||||||
| Qualified | |||||||||||||||||||||||||||||||||||
| Late Year | |||||||||||||||||||||||||||||||||||
| Undistributed | Ordinary | ||||||||||||||||||||||||||||||||||
| Long-Term | and | ||||||||||||||||||||||||||||||||||
| Undistributed | Capital Gains or | Capital Loss | Net Unrealized | Post-October | Total | Capital Loss | |||||||||||||||||||||||||||||
| Ordinary | (Capital Loss | Carryforward | Appreciation | Loss | Distributable | Carryforward | |||||||||||||||||||||||||||||
| Income | Carryforward) | to 12/31/171 | (Depreciation)2 | Deferrals3 | Earnings | Utilized | |||||||||||||||||||||||||||||
Royce Pennsylvania Mutual Fund | $ | 10,114,915 | $ | 16,134,240 | $ | – | $ | 1,202,872,500 | $ | – | $ | 1,229,121,655 | $ | – | |||||||||||||||||||||
Royce Micro-Cap Fund | 698,929 | 4,886,056 | – | 101,313,585 | (4,571,966 | ) | 102,326,604 | – | |||||||||||||||||||||||||||
Royce Premier Fund | – | 27,695,292 | – | 1,899,449,084 | (89,025 | ) | 1,927,055,351 | – | |||||||||||||||||||||||||||
Royce Low-Priced Stock Fund | 1,783,500 | 4,694,607 | – | 333,261,466 | (10,043,428 | ) | 329,696,145 | – | |||||||||||||||||||||||||||
Royce Total Return Fund | 16,789,546 | 12,509,140 | – | 1,257,013,624 | – | 1,286,312,310 | – | ||||||||||||||||||||||||||||
Royce Heritage Fund | 946,214 | 2,410,300 | – | 51,243,914 | – | 54,600,428 | – | ||||||||||||||||||||||||||||
Royce Opportunity Fund | 3,113,197 | 9,194,987 | – | 125,441,471 | (1,504,714 | ) | 136,244,941 | – | |||||||||||||||||||||||||||
Royce Special Equity Fund | 104,734 | 15,299,759 | – | 506,033,104 | – | 521,437,597 | – | ||||||||||||||||||||||||||||
Royce Value Fund | 1,834,786 | 754,904 | – | 98,142,165 | (3,546 | ) | 100,728,309 | – | |||||||||||||||||||||||||||
Royce Value Plus Fund | 369,437 | – | (90,329,111 | ) | 203,824,932 | (492,936 | ) | 113,372,322 | 29,871,967 | ||||||||||||||||||||||||||
Royce 100 Fund | 603,948 | 2,269,377 | – | 55,338,619 | (518 | ) | 58,211,426 | – | |||||||||||||||||||||||||||
Royce Dividend Value Fund | 1,667,939 | 4,714,826 | – | 39,421,761 | – | 45,804,526 | – | ||||||||||||||||||||||||||||
Royce Global Value Fund | – | (30,670,715 | ) | (7,981,106 | ) | (28,270,331 | ) | (8,276,250 | ) | (75,198,402 | ) | – | |||||||||||||||||||||||
Royce International Smaller-Companies Fund | – | (645,622 | ) | – | 2,201,962 | (292,369 | ) | 1,263,971 | – | ||||||||||||||||||||||||||
| 120 | The Royce Funds 2012 Annual Report to Shareholders |
| Undistributed | Accumulated | ||||||||||||||
| Net Investment | Net Realized | Paid–in | |||||||||||||
| Income (Loss) | Gain (Loss) | Capital | |||||||||||||
Royce Pennsylvania Mutual Fund | $ | 647,017 | $ | (15,222,430 | ) | $ | 14,575,413 | ||||||||
Royce Micro-Cap Fund | 1,970,967 | (1,970,967 | ) | – | |||||||||||
Royce Premier Fund | 362,395 | (14,706,461 | ) | 14,344,066 | |||||||||||
Royce Low-Priced Stock Fund | 7,988,592 | (7,988,592 | ) | – | |||||||||||
Royce Total Return Fund | (14,778,582 | ) | 3,553,652 | 11,224,930 | |||||||||||
Royce Heritage Fund | 212,048 | 123,824 | (335,872 | ) | |||||||||||
Royce Opportunity Fund | (235,336 | ) | (3,591,254 | ) | 3,826,590 | ||||||||||
Royce Special Equity Fund | – | (11,836,198 | ) | 11,836,198 | |||||||||||
Royce Value Fund | (74,815 | ) | (3,585,175 | ) | 3,659,990 | ||||||||||
Royce Value Plus Fund | 5,207,208 | (5,207,208 | ) | – | |||||||||||
Royce 100 Fund | 3,618 | (2,278,961 | ) | 2,275,343 | |||||||||||
Royce Dividend Value Fund | (310,015 | ) | 311,018 | (1,003 | ) | ||||||||||
Royce Global Value Fund | 10,552 | 64,564 | (75,116 | ) | |||||||||||
Royce International Smaller-Companies Fund | 7,890 | (2,237 | ) | (5,653 | ) | ||||||||||
| Market | Realized | Market | ||||||||||||||||||||||||||||||||||||||
| Shares | Value | Cost of | Cost of | Gain | Dividend | Shares | Value | |||||||||||||||||||||||||||||||||
| Affiliated Company | 12/31/11 | 12/31/11 | Purchases | Sales | (Loss) | Income | 12/31/12 | 12/31/12 | ||||||||||||||||||||||||||||||||
| Royce Pennsylvania Mutual Fund | ||||||||||||||||||||||||||||||||||||||||
America’s Car-Mart | 451,600 | $ | 17,693,688 | $ | 4,373,867 | $ | – | $ | – | $ | – | 556,600 | $ | 22,553,432 | ||||||||||||||||||||||||||
CRA International | 592,143 | 11,748,117 | – | – | – | – | 592,143 | 11,706,667 | ||||||||||||||||||||||||||||||||
DTS | 65,000 | 1,770,600 | 26,907,518 | – | – | – | 1,167,789 | 19,502,076 | ||||||||||||||||||||||||||||||||
Ethan Allen Interiors | 1,623,910 | 38,502,906 | – | 1,790,305 | (528,239 | ) | 1,331,606 | 1,573,910 | 40,465,226 | |||||||||||||||||||||||||||||||
Hi-Tech Pharmacal | 530,400 | 20,627,256 | 15,436,926 | – | – | 1,457,906 | 997,731 | 34,900,630 | ||||||||||||||||||||||||||||||||
Obagi Medical Products1 | 1,053,977 | 10,708,407 | 180,814 | 9,701,091 | 6,123,802 | – | ||||||||||||||||||||||||||||||||||
Pervasive Software | 1,461,500 | 8,505,930 | – | – | – | – | 1,461,500 | 13,021,965 | ||||||||||||||||||||||||||||||||
Preformed Line Products | 291,088 | 17,366,310 | 1,147,791 | – | – | 303,088 | 311,088 | 18,484,849 | ||||||||||||||||||||||||||||||||
Pulse Electronics1 | 2,231,739 | 6,248,869 | – | – | – | – | ||||||||||||||||||||||||||||||||||
Rofin-Sinar Technologies1 | 1,642,767 | 37,537,226 | 4,822,113 | 15,603,401 | (1,471,002 | ) | – | |||||||||||||||||||||||||||||||||
Shoe Carnival | 639,729 | 16,441,035 | 6,122,731 | 1,803,663 | 149,878 | 1,419,023 | 1,227,698 | 25,155,532 | ||||||||||||||||||||||||||||||||
Stanley Furniture | 912,235 | 2,736,705 | – | – | – | – | 912,235 | 4,105,058 | ||||||||||||||||||||||||||||||||
U.S. Physical Therapy | 883,675 | 17,390,724 | 1,402,626 | 4,770,333 | 2,441,122 | 552,147 | 656,893 | 18,090,833 | ||||||||||||||||||||||||||||||||
Weyco Group | 590,500 | 14,496,775 | – | – | – | 496,020 | 590,500 | 13,794,080 | ||||||||||||||||||||||||||||||||
Winnebago Industries | 1,504,450 | 11,102,841 | – | – | – | – | 1,504,450 | 25,771,229 | ||||||||||||||||||||||||||||||||
| 232,877,389 | 6,715,561 | 5,559,790 | 247,551,577 | |||||||||||||||||||||||||||||||||||||
Royce Micro-Cap Fund | ||||||||||||||||||||||||||||||||||||||||
Anaren1 | 743,436 | 12,355,906 | 122,988 | 3,411,270 | (327,442 | ) | – | |||||||||||||||||||||||||||||||||
AXT | 1,879,961 | 7,839,438 | 146,710 | 789,419 | (422,024 | ) | – | 1,808,161 | 5,080,932 | |||||||||||||||||||||||||||||||
GP Strategies1 | 1,029,900 | 13,883,052 | – | 4,028,803 | 5,409,885 | – | ||||||||||||||||||||||||||||||||||
Graham Corporation | 621,249 | 13,940,828 | – | 384,400 | (21,200 | ) | 49,300 | 601,249 | 11,724,355 | |||||||||||||||||||||||||||||||
Key Technology | 446,814 | 5,781,773 | – | 503,042 | (254,122 | ) | – | 421,814 | 4,403,738 | |||||||||||||||||||||||||||||||
LaCrosse Footwear1 | 532,669 | 6,722,283 | – | 7,482,367 | 3,040,315 | 130,667 | ||||||||||||||||||||||||||||||||||
Legumex Walker1 | 702,500 | 3,557,532 | – | – | – | – | ||||||||||||||||||||||||||||||||||
Lincoln Educational Services | 1,382,527 | 10,921,963 | 1,438,566 | 334,218 | (147,288 | ) | 422,626 | 1,520,827 | 8,501,423 | |||||||||||||||||||||||||||||||
Novatel Wireless | 413,900 | 1,295,507 | 4,739,482 | 868,464 | (362,454 | ) | – | 2,142,033 | 2,870,325 | |||||||||||||||||||||||||||||||
PDI | 1,015,694 | 6,551,226 | – | 323,730 | (96,360 | ) | – | 982,694 | 7,468,475 | |||||||||||||||||||||||||||||||
Pilot Gold1 | 3,114,500 | 3,943,761 | – | 715,720 | (340,580 | ) | – | |||||||||||||||||||||||||||||||||
| The Royce Funds 2012 Annual Report to Shareholders | 121 |
| Market | Realized | Market | ||||||||||||||||||||||||||||||||||||||
| Shares | Value | Cost of | Cost of | Gain | Dividend | Shares | Value | |||||||||||||||||||||||||||||||||
| Affiliated Company | 12/31/11 | 12/31/11 | Purchases | Sales | (Loss) | Income | 12/31/12 | 12/31/12 | ||||||||||||||||||||||||||||||||
Royce Micro-Cap Fund (continued) | ||||||||||||||||||||||||||||||||||||||||
TGC Industries1 | 1,105,667 | $ | 7,894,463 | $ | 102,053 | $ | 1,486,187 | $ | 1,201,032 | $ | 138,434 | |||||||||||||||||||||||||||||
Universal Stainless & Alloy Products1 | 326,512 | 12,198,488 | 1,547,641 | 2,395,846 | 632,652 | – | ||||||||||||||||||||||||||||||||||
Voltamp Transformers1 | 524,000 | 4,499,463 | – | 2,167,163 | (724,274 | ) | 82,280 | |||||||||||||||||||||||||||||||||
World Energy Solutions | 747,900 | 2,258,658 | – | 189,796 | (132,818 | ) | – | 733,900 | $ | 3,192,465 | ||||||||||||||||||||||||||||||
| 113,644,341 | 7,455,322 | 823,307 | 43,241,713 | |||||||||||||||||||||||||||||||||||||
Royce Premier Fund | ||||||||||||||||||||||||||||||||||||||||
ADTRAN | 2,535,434 | 76,468,690 | 15,670,954 | – | – | 1,014,906 | 3,245,434 | 63,415,780 | ||||||||||||||||||||||||||||||||
Alleghany Corporation1 | 514,525 | 146,788,837 | – | – | – | – | ||||||||||||||||||||||||||||||||||
Benchmark Electronics | 2,710,000 | 36,503,700 | 1,817,591 | – | – | – | 2,843,900 | 47,265,618 | ||||||||||||||||||||||||||||||||
Cabot Microelectronics | 2,086,191 | 98,572,525 | – | – | – | 31,292,865 | 2,086,191 | 74,080,642 | ||||||||||||||||||||||||||||||||
Cal-Maine Foods | 1,771,686 | 64,790,557 | – | 1,643,839 | 594,584 | 2,374,059 | 1,721,686 | 69,246,211 | ||||||||||||||||||||||||||||||||
Cognex Corporation | 3,052,717 | 109,256,741 | – | – | – | 4,701,184 | 3,052,717 | 112,401,040 | ||||||||||||||||||||||||||||||||
Fair Isaac | 1,832,600 | 65,680,384 | – | – | – | 146,608 | 1,832,600 | 77,024,178 | ||||||||||||||||||||||||||||||||
Fairchild Semiconductor International | 6,458,112 | 77,755,668 | 714,525 | – | – | – | 6,508,112 | 93,716,813 | ||||||||||||||||||||||||||||||||
FEI Company1 | 2,693,120 | 109,825,434 | – | 47,945,195 | 16,846,368 | 363,468 | ||||||||||||||||||||||||||||||||||
Knight Capital Group Cl. A1 | 4,667,200 | 55,166,304 | – | 72,603,294 | (59,062,852 | ) | – | |||||||||||||||||||||||||||||||||
Lincoln Electric Holdings | 5,074,994 | 198,533,765 | – | – | – | 3,603,246 | 5,074,994 | 247,050,708 | ||||||||||||||||||||||||||||||||
MKS Instruments | 2,971,910 | 82,678,536 | – | – | – | 1,842,584 | 2,971,910 | 76,615,840 | ||||||||||||||||||||||||||||||||
Myriad Genetics | 4,329,367 | 90,656,945 | 19,677,063 | 1,284,805 | 223,048 | – | 5,114,765 | 139,377,346 | ||||||||||||||||||||||||||||||||
Nu Skin Enterprises Cl. A | 4,181,500 | 203,095,455 | – | 11,086,627 | 8,796,891 | 3,196,496 | 3,816,994 | 141,419,628 | ||||||||||||||||||||||||||||||||
ProAssurance Corporation1 | 1,683,449 | 134,372,899 | – | 44,943,506 | 29,530,780 | 5,668,956 | ||||||||||||||||||||||||||||||||||
Sanderson Farms | 2,130,191 | 106,786,475 | – | 12,520,759 | (310,076 | ) | 1,448,530 | 1,880,191 | 89,403,082 | |||||||||||||||||||||||||||||||
Schnitzer Steel Industries Cl. A | 2,108,038 | 89,127,846 | – | – | – | 1,221,608 | 2,108,038 | 63,936,793 | ||||||||||||||||||||||||||||||||
Seabridge Gold | 2,883,900 | 46,459,629 | 9,008,341 | 612,250 | (293,960 | ) | – | 3,342,400 | 60,062,928 | |||||||||||||||||||||||||||||||
Semperit AG Holding | 1,689,463 | 65,050,999 | 8,528,212 | – | – | 1,392,137 | 1,894,996 | 78,103,926 | ||||||||||||||||||||||||||||||||
Silver Standard Resources | 4,621,999 | 63,876,026 | 4,788,635 | 22,452,101 | (11,576,543 | ) | – | 4,115,069 | 61,273,377 | |||||||||||||||||||||||||||||||
Simpson Manufacturing | 3,387,886 | 114,036,243 | – | – | – | 2,540,915 | 3,387,886 | 111,088,782 | ||||||||||||||||||||||||||||||||
Strayer Education | 1,068,485 | 103,846,057 | – | – | – | 4,273,940 | 1,068,485 | 60,016,803 | ||||||||||||||||||||||||||||||||
Thor Industries | 4,407,057 | 120,885,574 | – | 8,459,744 | 531,408 | 9,199,539 | 4,166,757 | 155,961,714 | ||||||||||||||||||||||||||||||||
Trican Well Service | 7,241,100 | 124,742,386 | 12,091,170 | – | – | 2,019,981 | 8,027,100 | 105,876,702 | ||||||||||||||||||||||||||||||||
Unit Corporation | 2,896,073 | 134,377,787 | – | – | – | – | 2,896,073 | 130,468,089 | ||||||||||||||||||||||||||||||||
Veeco Instruments | 2,658,912 | 55,305,370 | 1,401,520 | – | – | – | 2,708,912 | 79,967,082 | ||||||||||||||||||||||||||||||||
Woodward | 3,906,024 | 159,873,562 | – | – | – | 1,249,928 | 3,906,024 | 148,936,695 | ||||||||||||||||||||||||||||||||
| 2,734,514,394 | (14,720,352 | ) | 77,550,950 | 2,286,709,777 | ||||||||||||||||||||||||||||||||||||
Royce Low-Priced Stock Fund | ||||||||||||||||||||||||||||||||||||||||
C&J Energy Services1 | 450,000 | 9,418,500 | 41,882,532 | 7,011,634 | (304,139 | ) | – | |||||||||||||||||||||||||||||||||
Castle (A.M.) & Co.1 | 1,799,667 | 17,024,850 | – | 18,923,609 | (8,376,526 | ) | – | |||||||||||||||||||||||||||||||||
Corinthian Colleges1 | 5,239,000 | 11,368,630 | – | 18,535,237 | (14,865,291 | ) | – | |||||||||||||||||||||||||||||||||
Cross Country Healthcare1 | 2,692,607 | 14,943,969 | – | 25,637,102 | (18,390,182 | ) | – | |||||||||||||||||||||||||||||||||
Globe Specialty Metals | 4,160,280 | 55,706,149 | – | 3,129,151 | (1,114,268 | ) | 1,036,945 | 4,026,606 | 55,365,832 | |||||||||||||||||||||||||||||||
Houston Wire & Cable | 1,591,200 | 21,990,384 | – | – | – | 572,832 | 1,591,200 | 19,524,024 | ||||||||||||||||||||||||||||||||
Kennedy-Wilson Holdings1 | 2,891,499 | 30,592,059 | 351,000 | 8,029,583 | 2,385,216 | 511,024 | ||||||||||||||||||||||||||||||||||
Korn/Ferry International1 | 2,836,963 | 48,398,589 | 820,315 | 21,146,997 | (6,560,797 | ) | – | |||||||||||||||||||||||||||||||||
KVH Industries | 1,100,200 | 8,559,556 | – | 4,423,568 | (214,921 | ) | – | 777,804 | 10,873,700 | |||||||||||||||||||||||||||||||
McEwen Mining1 | 7,858,918 | 26,405,964 | 813,865 | 10,751,720 | (4,250,191 | ) | – | |||||||||||||||||||||||||||||||||
Neutral Tandem1 | 1,681,614 | 17,976,454 | – | 15,330,889 | (7,341,729 | ) | 3,504,630 | |||||||||||||||||||||||||||||||||
Novatel Wireless1 | 3,205,176 | 10,032,201 | – | 18,431,709 | (11,252,115 | ) | – | |||||||||||||||||||||||||||||||||
NutriSystem1 | 1,625,690 | 21,020,172 | – | 11,245,391 | (5,619,909 | ) | 962,983 | |||||||||||||||||||||||||||||||||
PC-Tel | 1,095,592 | 7,493,849 | – | 764,664 | (99,972 | ) | 131,471 | 995,592 | 7,168,262 | |||||||||||||||||||||||||||||||
Pretium Resources1 | 5,037,000 | 61,853,124 | – | 6,458,472 | 5,233,084 | – | ||||||||||||||||||||||||||||||||||
Sigma Designs | 2,007,658 | 12,045,948 | – | 5,393,449 | (3,788,835 | ) | – | 1,720,358 | 8,859,844 | |||||||||||||||||||||||||||||||
Smith Micro Software1 | 2,208,776 | 2,495,917 | – | 2,072,296 | 1,201,172 | – | ||||||||||||||||||||||||||||||||||
Tesco Corporation | 3,475,005 | 43,924,063 | – | 15,492,054 | (3,928,753 | ) | – | 2,682,105 | 30,549,176 | |||||||||||||||||||||||||||||||
Total Energy Services | 1,866,700 | 31,809,485 | – | – | – | 316,993 | 1,866,700 | 28,130,926 | ||||||||||||||||||||||||||||||||
TrueBlue | 3,212,691 | 44,592,151 | 3,154,110 | 2,765,281 | (347,454 | ) | – | 3,262,691 | 51,387,383 | |||||||||||||||||||||||||||||||
Universal Technical Institute | 1,730,679 | 22,118,078 | – | 1,496,074 | (755,840 | ) | 692,272 | 1,655,679 | 16,623,017 | |||||||||||||||||||||||||||||||
WaterFurnace Renewable Energy | 970,500 | 14,823,048 | – | – | – | 791,928 | 970,500 | 14,088,690 | ||||||||||||||||||||||||||||||||
| 534,593,140 | (78,391,450 | ) | 8,521,078 | 242,570,854 | ||||||||||||||||||||||||||||||||||||
Royce Total Return Fund | ||||||||||||||||||||||||||||||||||||||||
Barry (R.G.) | 1,048,496 | 12,665,832 | – | – | – | 429,883 | 1,048,496 | 14,857,188 | ||||||||||||||||||||||||||||||||
Cato Corporation (The) Cl. A1 | 1,477,815 | 35,763,123 | – | 1,296,635 | 285,541 | 4,275,939 | ||||||||||||||||||||||||||||||||||
| 122 | The Royce Funds 2012 Annual Report to Shareholders |
| Market | Realized | Market | ||||||||||||||||||||||||||||||||||||||
| Shares | Value | Cost of | Cost of | Gain | Dividend | Shares | Value | |||||||||||||||||||||||||||||||||
| Affiliated Company | 12/31/11 | 12/31/11 | Purchases | Sales | (Loss) | Income | 12/31/12 | 12/31/12 | ||||||||||||||||||||||||||||||||
| Royce Total Return Fund (continued) | ||||||||||||||||||||||||||||||||||||||||
Chase Corporation | 773,974 | $ | 10,758,239 | $ | – | $ | – | $ | – | $ | 309,590 | 773,974 | $ | 14,395,916 | ||||||||||||||||||||||||||
Colony Financial1 | 2,082,230 | 32,711,833 | 5,093,274 | 11,415,298 | (1,107,930 | ) | 2,383,911 | |||||||||||||||||||||||||||||||||
DDi Corporation1 | 1,093,312 | 10,200,601 | – | 9,903,624 | 4,218,584 | 131,197 | ||||||||||||||||||||||||||||||||||
Mueller (Paul) Company | 116,700 | 2,042,250 | – | – | – | – | 116,700 | 2,520,720 | ||||||||||||||||||||||||||||||||
Peapack-Gladstone Financial | 473,145 | 5,081,577 | 33,604 | – | – | 94,850 | 475,350 | 6,692,928 | ||||||||||||||||||||||||||||||||
Starrett (L.S.) Company (The) Cl. A | 529,400 | 6,802,790 | – | – | – | 211,760 | 529,400 | 5,135,180 | ||||||||||||||||||||||||||||||||
Village Super Market Cl. A | 714,675 | 20,332,504 | 600,799 | 190,950 | 4,948 | 1,621,103 | 726,483 | 23,872,231 | ||||||||||||||||||||||||||||||||
| 136,358,749 | 3,401,143 | 9,458,233 | 67,474,163 | |||||||||||||||||||||||||||||||||||||
Royce Opportunity Fund | ||||||||||||||||||||||||||||||||||||||||
BTU International | 690,763 | 1,795,984 | – | 40,172 | (30,839 | ) | – | 686,756 | 1,366,644 | |||||||||||||||||||||||||||||||
ClearOne | 556,620 | 2,404,599 | – | – | – | – | 556,620 | 2,248,745 | ||||||||||||||||||||||||||||||||
Comstock Holding Companies Cl. A | 1,290,590 | 1,342,213 | – | 9,849 | (4,188 | ) | – | 1,285,590 | 1,491,285 | |||||||||||||||||||||||||||||||
Cost Plus1 | 1,393,623 | 13,587,824 | – | 7,118,946 | 18,863,319 | – | ||||||||||||||||||||||||||||||||||
dELiA*s | 1,721,584 | 1,756,016 | 104,418 | 1,392,120 | (1,112,386 | ) | – | 1,602,615 | 1,875,059 | |||||||||||||||||||||||||||||||
Dixie Group | 819,019 | 2,416,106 | 41,625 | – | – | – | 829,519 | 2,745,708 | ||||||||||||||||||||||||||||||||
Evans & Sutherland Computer1 | 654,730 | 134,220 | – | 3,006,750 | (2,962,350 | ) | – | |||||||||||||||||||||||||||||||||
MarineMax | 1,415,750 | 9,230,690 | 447,866 | 1,965,009 | (840,017 | ) | – | 1,357,850 | 12,139,179 | |||||||||||||||||||||||||||||||
Material Sciences1 | 560,160 | 4,570,906 | – | 915,145 | (315,339 | ) | – | |||||||||||||||||||||||||||||||||
NCI Building Systems1 | 1,005,369 | 10,928,361 | 1,163,048 | 1,755,844 | (440,054 | ) | – | |||||||||||||||||||||||||||||||||
Network Equipment Technologies1 | 1,972,468 | 2,288,063 | 81,459 | 8,187,146 | (5,635,146 | ) | – | |||||||||||||||||||||||||||||||||
Pericom Semiconductor | 1,112,329 | 8,464,824 | 996,332 | – | – | – | 1,240,848 | 9,964,009 | ||||||||||||||||||||||||||||||||
Planar Systems | 1,554,792 | 3,016,296 | – | – | – | – | 1,554,792 | 2,223,352 | ||||||||||||||||||||||||||||||||
SigmaTron International | 345,972 | 1,141,708 | – | 11,867 | (5,052 | ) | – | 344,172 | 1,400,780 | |||||||||||||||||||||||||||||||
Spartech Corporation1 | 1,597,940 | 7,558,256 | 847,361 | 14,256,786 | (1,787,358 | ) | – | |||||||||||||||||||||||||||||||||
Spire Corporation | 505,783 | 313,585 | 4,921 | 207,850 | (173,145 | ) | – | 448,074 | 224,485 | |||||||||||||||||||||||||||||||
TRC Companies | 1,644,680 | 9,884,527 | 557,282 | 1,046,751 | (635,753 | ) | – | 1,683,765 | 9,799,512 | |||||||||||||||||||||||||||||||
Unifi1 | 945,600 | 7,186,560 | 1,221,720 | 1,379,384 | (258,023 | ) | – | |||||||||||||||||||||||||||||||||
| 88,020,738 | 4,663,669 | – | 45,478,758 | |||||||||||||||||||||||||||||||||||||
Royce Special Equity Fund | ||||||||||||||||||||||||||||||||||||||||
Ampco-Pittsburgh | 979,650 | 18,946,431 | 145,053 | – | – | 707,877 | 987,000 | 19,720,260 | ||||||||||||||||||||||||||||||||
Applied Industrial Technologies | 1,627,973 | 57,255,810 | 31,860,683 | – | – | 1,772,571 | 2,430,400 | 102,101,104 | ||||||||||||||||||||||||||||||||
Arden Group Cl. A | 182,543 | 16,430,695 | 4,770,089 | 475,948 | (10,100 | ) | 4,956,812 | 232,001 | 20,873,130 | |||||||||||||||||||||||||||||||
Atrion Corporation | 158,000 | 37,956,340 | 2,435,630 | 811,477 | 310,904 | 2,010,911 | 165,000 | 32,340,000 | ||||||||||||||||||||||||||||||||
Bowl America Cl. A | 342,575 | 4,282,188 | – | – | – | 448,773 | 342,575 | 4,282,187 | ||||||||||||||||||||||||||||||||
Children’s Place Retail Stores | 1,173,000 | 62,309,760 | 7,113,000 | 213,172 | 16,719 | – | 1,318,056 | 58,376,700 | ||||||||||||||||||||||||||||||||
Clearwater Paper | 1,901,200 | 67,701,732 | 4,132,336 | 2,762,034 | (118,245 | ) | – | 1,956,000 | 76,596,960 | |||||||||||||||||||||||||||||||
Computer Services1 | 929,517 | 26,258,855 | 118,196 | 6,951,915 | 2,672,427 | 1,020,954 | ||||||||||||||||||||||||||||||||||
CSS Industries | 974,100 | 19,404,072 | – | – | – | 584,460 | 974,100 | 21,323,049 | ||||||||||||||||||||||||||||||||
Dorman Products | 1,396,165 | 51,560,373 | 657,904 | 7,796,524 | 9,531,259 | 3,903,990 | 2,306,679 | 81,518,036 | ||||||||||||||||||||||||||||||||
Finish Line (The) Cl. A | 2,390,550 | 46,101,757 | 44,384,448 | – | – | 810,610 | 4,462,000 | 84,465,660 | ||||||||||||||||||||||||||||||||
Foster (L.B.) Company | 926,600 | 26,213,514 | 65,200 | – | – | 92,831 | 928,875 | 40,350,330 | ||||||||||||||||||||||||||||||||
Frisch’s Restaurants | 505,100 | 9,859,552 | – | – | – | 5,121,714 | 505,100 | 9,344,350 | ||||||||||||||||||||||||||||||||
Hawkins | 877,400 | 32,340,964 | 1,439,299 | 442,091 | (17,352 | ) | 589,017 | 911,020 | 35,201,813 | |||||||||||||||||||||||||||||||
Hurco Companies | 170,000 | 3,570,000 | 6,449,861 | – | – | – | 435,179 | 10,009,117 | ||||||||||||||||||||||||||||||||
Littelfuse | 1,032,650 | 44,383,297 | 18,809,377 | – | – | 908,388 | 1,375,583 | 84,887,227 | ||||||||||||||||||||||||||||||||
Mesa Laboratories1 | 315,000 | 13,053,600 | – | 6,752,933 | 8,035,618 | 87,591 | ||||||||||||||||||||||||||||||||||
Minerals Technologies | 507,500 | 28,688,975 | 59,881,919 | – | – | 304,645 | 2,851,200 | 113,819,904 | ||||||||||||||||||||||||||||||||
National Presto Industries | 612,000 | 57,283,200 | 3,458,143 | – | – | 7,960,250 | 656,500 | 45,364,150 | ||||||||||||||||||||||||||||||||
Park Electrochemical | 1,879,800 | 48,160,476 | 3,777,042 | – | – | 788,202 | 2,011,012 | 51,743,338 | ||||||||||||||||||||||||||||||||
Rimage Corporation1 | 807,000 | 9,078,750 | 1,910,829 | 13,271,060 | (7,087,425 | ) | 448,405 | |||||||||||||||||||||||||||||||||
Scholastic Corporation | 75,777,807 | 708,318 | 2,400,207 | 70,950,119 | ||||||||||||||||||||||||||||||||||||
Schulman (A.) | 1,423,500 | 30,149,730 | 5,968,956 | 4,954,713 | 679,042 | 1,470,928 | 1,472,577 | 42,601,652 | ||||||||||||||||||||||||||||||||
Standex International | 792,200 | 27,069,474 | 1,815,889 | 288,206 | 65,666 | 238,581 | 831,990 | 42,672,767 | ||||||||||||||||||||||||||||||||
Stepan Company | 692,200 | 55,486,752 | – | 5,089,639 | 1,542,699 | 795,112 | 1,252,900 | 69,586,066 | ||||||||||||||||||||||||||||||||
UniFirst Corporation | 886,600 | 50,305,684 | 35,726,835 | – | – | 197,765 | 1,469,012 | 107,707,960 | ||||||||||||||||||||||||||||||||
Universal Electronics1 | 755,000 | 12,736,850 | – | 14,675,309 | (4,466,779 | ) | – | |||||||||||||||||||||||||||||||||
Utah Medical Products1 | 321,331 | 8,675,937 | – | 8,429,813 | 2,414,225 | 165,803 | ||||||||||||||||||||||||||||||||||
| 865,264,768 | 13,568,658 | 36,094,508 | 1,225,835,879 | |||||||||||||||||||||||||||||||||||||
Royce Value Plus Fund | ||||||||||||||||||||||||||||||||||||||||
Casual Male Retail Group1 | 3,578,734 | 12,239,270 | – | 33,643,616 | (22,473,582 | ) | – | |||||||||||||||||||||||||||||||||
Celadon Group1 | 1,663,600 | 19,647,116 | – | 10,036,287 | 522,576 | 74,704 | ||||||||||||||||||||||||||||||||||
| The Royce Funds 2012 Annual Report to Shareholders | 123 |
| Market | Realized | Market | ||||||||||||||||||||||||||||||||||||||
| Shares | Value | Cost of | Cost of | Gain | Dividend | Shares | Value | |||||||||||||||||||||||||||||||||
| Affiliated Company | 12/31/11 | 12/31/11 | Purchases | Sales | (Loss) | Income | 12/31/12 | 12/31/12 | ||||||||||||||||||||||||||||||||
| Royce Value Plus Fund (continued) | ||||||||||||||||||||||||||||||||||||||||
Cerus Corporation | 2,884,500 | $ | 8,076,600 | $ | – | $ | – | $ | – | $ | – | 2,884,500 | $ | 9,115,020 | ||||||||||||||||||||||||||
Cosi | 4,975,812 | 3,507,948 | 1,207,675 | – | – | – | 6,833,770 | 5,316,673 | ||||||||||||||||||||||||||||||||
Digi International1 | 1,504,600 | 16,791,336 | – | 17,018,378 | (2,278,081 | ) | – | |||||||||||||||||||||||||||||||||
Immersion Corporation | 9,091,807 | – | – | – | 1,578,109 | 10,841,609 | ||||||||||||||||||||||||||||||||||
Mercury Systems1 | 2,218,749 | 29,487,174 | – | 12,195,361 | 484,053 | – | ||||||||||||||||||||||||||||||||||
Oplink Communications1 | 1,395,012 | 22,975,848 | – | 28,664,423 | (8,776,689 | ) | – | |||||||||||||||||||||||||||||||||
| 112,725,292 | (32,521,723 | ) | 74,704 | 25,273,302 | ||||||||||||||||||||||||||||||||||||
| 1 Not an Affiliated Company at December 31, 2012. |
Baltimore, Maryland
February 20, 2013
| 124 | The Royce Funds 2012 Annual Report to Shareholders |
| Actual | Hypothetical (5% per year return before expenses) | ||||||||||||||||||||||||||||||||||
| Beginning | Ending | Expenses Paid | Beginning | Ending | Expenses Paid | Annualized | |||||||||||||||||||||||||||||
| Account Value | Account Value | During the | Account Value | Account Value | During the | Expense | |||||||||||||||||||||||||||||
| 7/1/12 | 12/31/12 | Period1 | 7/1/12 | 12/31/12 | Period1 | Ratio2 | |||||||||||||||||||||||||||||
Investment Class | |||||||||||||||||||||||||||||||||||
Royce Pennsylvania Mutual Fund | $ | 1,000.00 | $ | 1,101.74 | $ | 4.60 | $ | 1,000.00 | $ | 1,020.76 | $ | 4.42 | 0.87 | % | |||||||||||||||||||||
Royce Micro-Cap Fund | 1,000.00 | 1,052.57 | 7.27 | 1,000.00 | 1,018.05 | 7.15 | 1.41 | ||||||||||||||||||||||||||||
Royce Premier Fund | 1,000.00 | 1,085.74 | 5.45 | 1,000.00 | 1,019.91 | 5.28 | 1.04 | ||||||||||||||||||||||||||||
Royce Low-Priced Stock Fund | 1,000.00 | 1,057.44 | 6.41 | 1,000.00 | 1,018.90 | 6.29 | 1.24 | ||||||||||||||||||||||||||||
Royce Total Return Fund | 1,000.00 | 1,098.30 | 5.59 | 1,000.00 | 1,019.81 | 5.38 | 1.06 | ||||||||||||||||||||||||||||
Royce Heritage Fund3 | 1,000.00 | 1,117.88 | 6.39 | 1,000.00 | 1,019.10 | 6.09 | 1.20 | ||||||||||||||||||||||||||||
Royce Opportunity Fund | 1,000.00 | 1,102.00 | 5.71 | 1,000.00 | 1,019.71 | 5.48 | 1.08 | ||||||||||||||||||||||||||||
Royce Special Equity Fund | 1,000.00 | 1,088.45 | 5.93 | 1,000.00 | 1,019.46 | 5.74 | 1.13 | ||||||||||||||||||||||||||||
Royce Value Fund | 1,000.00 | 1,115.10 | 6.38 | 1,000.00 | 1,019.10 | 6.09 | 1.20 | ||||||||||||||||||||||||||||
Royce Value Plus Fund | 1,000.00 | 1,087.64 | 7.14 | 1,000.00 | 1,018.30 | 6.90 | 1.36 | ||||||||||||||||||||||||||||
Royce 100 Fund | 1,000.00 | 1,096.45 | 6.27 | 1,000.00 | 1,019.15 | 6.04 | 1.19 | ||||||||||||||||||||||||||||
Royce Dividend Value Fund | 1,000.00 | 1,116.32 | 6.38 | 1,000.00 | 1,019.10 | 6.09 | 1.20 | ||||||||||||||||||||||||||||
Royce Global Value Fund | 1,000.00 | 1,115.64 | 7.66 | 1,000.00 | 1,017.90 | 7.30 | 1.44 | ||||||||||||||||||||||||||||
Service Class | |||||||||||||||||||||||||||||||||||
Royce Pennsylvania Mutual Fund | 1,000.00 | 1,099.56 | 6.65 | 1,000.00 | 1,018.80 | 6.39 | 1.26 | ||||||||||||||||||||||||||||
Royce Micro-Cap Fund | 1,000.00 | 1,051.33 | 8.56 | 1,000.00 | 1,016.79 | 8.42 | 1.66 | ||||||||||||||||||||||||||||
Royce Premier Fund | 1,000.00 | 1,084.04 | 6.86 | 1,000.00 | 1,018.55 | 6.65 | 1.31 | ||||||||||||||||||||||||||||
Royce Low-Priced Stock Fund | 1,000.00 | 1,055.83 | 7.70 | 1,000.00 | 1,017.65 | 7.56 | 1.49 | ||||||||||||||||||||||||||||
Royce Total Return Fund | 1,000.00 | 1,096.23 | 7.17 | 1,000.00 | 1,018.30 | 6.90 | 1.36 | ||||||||||||||||||||||||||||
Royce Heritage Fund3 | 1,000.00 | 1,116.41 | 7.66 | 1,000.00 | 1,017.90 | 7.30 | 1.44 | ||||||||||||||||||||||||||||
Royce Opportunity Fund | 1,000.00 | 1,100.65 | 7.60 | 1,000.00 | 1,017.90 | 7.30 | 1.44 | ||||||||||||||||||||||||||||
Royce Special Equity Fund | 1,000.00 | 1,087.39 | 7.29 | 1,000.00 | 1,018.15 | 7.05 | 1.39 | ||||||||||||||||||||||||||||
Royce Value Fund | 1,000.00 | 1,113.94 | 7.55 | 1,000.00 | 1,018.00 | �� | 7.20 | 1.42 | |||||||||||||||||||||||||||
Royce Value Plus Fund | 1,000.00 | 1,088.12 | 7.24 | 1,000.00 | 1,018.20 | 7.00 | 1.38 | ||||||||||||||||||||||||||||
Royce 100 Fund | 1,000.00 | 1,096.24 | 7.43 | 1,000.00 | 1,018.05 | 7.15 | 1.41 | ||||||||||||||||||||||||||||
Royce Dividend Value Fund | 1,000.00 | 1,115.31 | 7.82 | 1,000.00 | 1,017.75 | 7.46 | 1.47 | ||||||||||||||||||||||||||||
Royce Global Value Fund | 1,000.00 | 1,115.08 | 8.99 | 1,000.00 | 1,016.64 | 8.57 | 1.69 | ||||||||||||||||||||||||||||
Royce International Smaller-Companies Fund | 1,000.00 | 1,142.66 | 9.10 | 1,000.00 | 1,016.64 | 8.57 | 1.69 | ||||||||||||||||||||||||||||
| The Royce Funds 2012 Annual Report to Shareholders | 125 |
| Actual | Hypothetical (5% per year return before expenses) | ||||||||||||||||||||||||||||||||||
| Beginning | Ending | Expenses Paid | Beginning | Ending | Expenses Paid | Annualized | |||||||||||||||||||||||||||||
| Account Value | Account Value | During the | Account Value | Account Value | During the | Expense | |||||||||||||||||||||||||||||
| 7/1/12 | 12/31/12 | Period1 | 7/1/12 | 12/31/12 | Period1 | Ratio2 | |||||||||||||||||||||||||||||
Consultant Class | |||||||||||||||||||||||||||||||||||
Royce Pennsylvania Mutual Fund | $ | 1,000.00 | $ | 1,094.29 | $ | 10.90 | $ | 1,000.00 | $ | 1,014.73 | $ | 10.48 | 2.07 | % | |||||||||||||||||||||
Royce Micro-Cap Fund | 1,000.00 | 1,046.17 | 13.73 | 1,000.00 | 1,011.71 | 13.50 | 2.67 | ||||||||||||||||||||||||||||
Royce Premier Fund | 1,000.00 | 1,079.40 | 11.39 | 1,000.00 | 1,014.18 | 11.04 | 2.18 | ||||||||||||||||||||||||||||
Royce Total Return Fund | 1,000.00 | 1,090.92 | 12.14 | 1,000.00 | 1,013.52 | 11.69 | 2.31 | ||||||||||||||||||||||||||||
Royce Heritage Fund3 | 1,000.00 | 1,111.06 | 13.32 | 1,000.00 | 1,012.52 | 12.70 | 2.51 | ||||||||||||||||||||||||||||
Royce Opportunity Fund | 1,000.00 | 1,094.37 | 12.95 | 1,000.00 | 1,012.77 | 12.45 | 2.46 | ||||||||||||||||||||||||||||
Royce Special Equity Fund | 1,000.00 | 1,082.96 | 11.57 | 1,000.00 | 1,014.03 | 11.19 | 2.21 | ||||||||||||||||||||||||||||
Royce Value Fund | 1,000.00 | 1,110.02 | 12.30 | 1,000.00 | 1,013.47 | 11.74 | 2.32 | ||||||||||||||||||||||||||||
Royce Value Plus Fund | 1,000.00 | 1,081.70 | 12.92 | 1,000.00 | 1,012.72 | 12.50 | 2.47 | ||||||||||||||||||||||||||||
Royce Global Value Fund | 1,000.00 | 1,109.82 | 12.94 | 1,000.00 | 1,012.87 | 12.35 | 2.44 | ||||||||||||||||||||||||||||
Institutional Class | |||||||||||||||||||||||||||||||||||
Royce Pennsylvania Mutual Fund | 1,000.00 | 1,102.27 | 4.23 | 1,000.00 | 1,021.11 | 4.06 | 0.80 | ||||||||||||||||||||||||||||
Royce Premier Fund | 1,000.00 | 1,086.04 | 5.14 | 1,000.00 | 1,020.21 | 4.98 | 0.98 | ||||||||||||||||||||||||||||
Royce Low-Priced Stock Fund | 1,000.00 | 1,056.96 | 6.20 | 1,000.00 | 1,019.10 | 6.09 | 1.20 | ||||||||||||||||||||||||||||
Royce Total Return Fund | 1,000.00 | 1,098.31 | 5.43 | 1,000.00 | 1,019.96 | 5.23 | 1.03 | ||||||||||||||||||||||||||||
Royce Opportunity Fund | 1,000.00 | 1,102.91 | 5.50 | 1,000.00 | 1,019.91 | 5.28 | 1.04 | ||||||||||||||||||||||||||||
Royce Special Equity Fund | 1,000.00 | 1,089.13 | 5.36 | 1,000.00 | 1,020.01 | 5.18 | 1.02 | ||||||||||||||||||||||||||||
Royce Value Fund | 1,000.00 | 1,116.70 | 5.59 | 1,000.00 | 1,019.86 | 5.33 | 1.05 | ||||||||||||||||||||||||||||
Royce Value Plus Fund | 1,000.00 | 1,089.91 | 5.46 | 1,000.00 | 1,019.91 | 5.28 | 1.04 | ||||||||||||||||||||||||||||
Royce Dividend Value Fund | 1,000.00 | 1,085.15 | 3.50 | 1,000.00 | 1,012.77 | 3.37 | 1.04 | ||||||||||||||||||||||||||||
W Class | |||||||||||||||||||||||||||||||||||
Royce Premier Fund | 1,000.00 | 1,085.41 | 5.71 | 1,000.00 | 1,019.66 | 5.53 | 1.09 | ||||||||||||||||||||||||||||
Royce Total Return Fund | 1,000.00 | 1,097.74 | 6.27 | 1,000.00 | 1,019.15 | 6.04 | 1.19 | ||||||||||||||||||||||||||||
R Class | |||||||||||||||||||||||||||||||||||
Royce Pennsylvania Mutual Fund | 1,000.00 | 1,098.11 | 7.86 | 1,000.00 | 1,017.65 | 7.56 | 1.49 | ||||||||||||||||||||||||||||
Royce Premier Fund | 1,000.00 | 1,082.24 | 8.85 | 1,000.00 | 1,016.64 | 8.57 | 1.69 | ||||||||||||||||||||||||||||
Royce Low-Priced Stock Fund | 1,000.00 | 1,053.80 | 9.50 | 1,000.00 | 1,015.89 | 9.32 | 1.84 | ||||||||||||||||||||||||||||
Royce Total Return Fund | 1,000.00 | 1,093.80 | 9.32 | 1,000.00 | 1,016.24 | 8.97 | 1.77 | ||||||||||||||||||||||||||||
Royce Heritage Fund | 1,000.00 | 1,113.94 | 9.78 | 1,000.00 | 1,015.89 | 9.32 | 1.84 | ||||||||||||||||||||||||||||
Royce Opportunity Fund | 1,000.00 | 1,098.51 | 9.71 | 1,000.00 | 1,015.89 | 9.32 | 1.84 | ||||||||||||||||||||||||||||
Royce Value Fund | 1,000.00 | 1,111.41 | 10.35 | 1,000.00 | 1,015.33 | 9.88 | 1.95 | ||||||||||||||||||||||||||||
Royce Value Plus Fund | 1,000.00 | 1,085.14 | 9.64 | 1,000.00 | 1,015.89 | 9.32 | 1.84 | ||||||||||||||||||||||||||||
Royce 100 Fund | 1,000.00 | 1,092.75 | 9.68 | 1,000.00 | 1,015.89 | 9.32 | 1.84 | ||||||||||||||||||||||||||||
Royce Global Value Fund | 1,000.00 | 1,112.24 | 10.57 | 1,000.00 | 1,015.13 | 10.08 | 1.99 | ||||||||||||||||||||||||||||
K Class | |||||||||||||||||||||||||||||||||||
Royce Pennsylvania Mutual Fund | 1,000.00 | 1,099.50 | 6.07 | 1,000.00 | 1,019.36 | 5.84 | 1.15 | ||||||||||||||||||||||||||||
Royce Premier Fund | 1,000.00 | 1,083.77 | 7.70 | 1,000.00 | 1,017.75 | 7.46 | 1.47 | ||||||||||||||||||||||||||||
Royce Low-Priced Stock Fund | 1,000.00 | 1,055.18 | 8.21 | 1,000.00 | 1,017.14 | 8.06 | 1.59 | ||||||||||||||||||||||||||||
Royce Total Return Fund | 1,000.00 | 1,097.03 | 7.54 | 1,000.00 | 1,017.95 | 7.25 | 1.43 | ||||||||||||||||||||||||||||
Royce Heritage Fund | 1,000.00 | 1,116.33 | 8.46 | 1,000.00 | 1,017.14 | 8.06 | 1.59 | ||||||||||||||||||||||||||||
Royce Opportunity Fund | 1,000.00 | 1,100.45 | 8.34 | 1,000.00 | 1,017.19 | 8.01 | 1.58 | ||||||||||||||||||||||||||||
Royce Value Fund | 1,000.00 | 1,113.58 | 8.18 | 1,000.00 | 1,017.39 | 7.81 | 1.54 | ||||||||||||||||||||||||||||
Royce Value Plus Fund | 1,000.00 | 1,086.02 | 8.34 | 1,000.00 | 1,017.14 | 8.06 | 1.59 | ||||||||||||||||||||||||||||
Royce 100 Fund | 1,000.00 | 1,094.01 | 8.37 | 1,000.00 | 1,017.14 | 8.06 | 1.59 | ||||||||||||||||||||||||||||
Royce Global Value Fund | 1,000.00 | 1,115.29 | 9.25 | 1,000.00 | 1,016.39 | 8.82 | 1.74 | ||||||||||||||||||||||||||||
| 126 | The Royce Funds 2012 Annual Report to Shareholders |
| % | Long-Term Capital | |||||||||||||||||||
| % | % U.S. Govt | Income Qualifying | Gain Distribution or | |||||||||||||||||
| Fund | QDI | Income | For DRD | Maximum Allowable (000’s) | ||||||||||||||||
Royce Pennsylvania Mutual Fund | 100.00 | % | N/A | 100.00 | % | $ | 303,973 | |||||||||||||
Royce Micro-Cap Fund | 100.00 | % | N/A | 100.00 | % | 55,624 | ||||||||||||||
Royce Premier Fund | 100.00 | % | N/A | 100.00 | % | 391,764 | ||||||||||||||
Royce Low-Priced Stock Fund | 100.00 | % | N/A | 97.20 | % | 193,626 | ||||||||||||||
Royce Total Return Fund | 100.00 | % | N/A | �� | 100.00 | % | 188,094 | |||||||||||||
Royce Heritage Fund | 100.00 | % | N/A | 100.00 | % | 6,791 | ||||||||||||||
Royce Opportunity Fund | 81.89 | % | N/A | 82.10 | % | 78,255 | ||||||||||||||
Royce Special Equity Fund | 100.00 | % | N/A | 100.00 | % | 143,718 | ||||||||||||||
Royce Value Fund | 100.00 | % | N/A | 100.00 | % | 59,275 | ||||||||||||||
Royce Value Plus Fund | N/A | N/A | N/A | N/A | ||||||||||||||||
Royce 100 Fund | 100.00 | % | N/A | 100.00 | % | 23,231 | ||||||||||||||
Royce Dividend Value Fund | 100.00 | % | N/A | 100.00 | % | 932 | ||||||||||||||
Royce Global Value Fund | 100.00 | % | N/A | 8.64 | % | N/A | ||||||||||||||
Royce International Smaller-Companies Fund | 100.00 | % | N/A | 0.00 | % | N/A | ||||||||||||||
% U.S. Govt Income: % of investment income paid from U.S. Government obligations.
% Income Qualifying for DRD: % of investment income eligible for the corporate dividend received deduction.
| Net Foreign | ||||||||||||||||||||
| Net Foreign | Source Income | Foreign | Foreign | |||||||||||||||||
| Fund | Source Income | Per Share | Tax | Tax Per Share | ||||||||||||||||
| Royce Global Value Fund | $ | 3,338,072 | $ | .1418 | $ | 742,323 | $ | .0315 | ||||||||||||
| Royce International Smaller-Companies Fund | 389,382 | .1702 | 56,049 | .0245 | ||||||||||||||||
| The Royce Funds 2012 Annual Report to Shareholders | 127 |
| Trustees and Officers |
| All Trustees and Officers may be reached c/o The Royce Funds, 745 Fifth Avenue, New York, NY 10151 |
Charles M. Royce, Trustee1, President
Age: 73 | Number of Funds Overseen: 34 | Tenure: Since 1982
Non-Royce Directorships: Director of TICC Capital Corp.
Principal Occupation(s) During Past Five Years: President, Co-Chief Investment Officer, and Member of Board of Managers of Royce & Associates, LLC (“Royce”), the Trust’s investment adviser.
Patricia W. Chadwick, Trustee
Age: 64 | Number of Funds Overseen: 34 | Tenure: Since 2009
Non-Royce Directorships: Trustee of ING Mutual Funds and Director of Wisconsin Energy Corp.
Principal Occupation(s) During Past 5 Years: Consultant and President of Ravengate Partners LLC (since 2000).
Richard M. Galkin, Trustee
Age: 74 | Number of Funds Overseen: 34 | Tenure: Since 1982
Non-Royce Directorships: None
Principal Occupation(s) During Past Five Years: Private investor. Mr. Galkin’s prior business experience includes having served as President of Richard M. Galkin Associates, Inc., telecommunications consultants, President of Manhattan Cable Television (a subsidiary of Time, Inc.), President of Haverhills Inc. (another Time, Inc. subsidiary), President of Rhode Island Cable Television, and Senior Vice President of Satellite Television Corp. (a subsidiary of Comsat).
Stephen L. Isaacs, Trustee
Age: 73 | Number of Funds Overseen: 34 | Tenure: Since 1989
Non-Royce Directorships: None
Principal Occupation(s) During Past Five Years: President of The Center for Health and Social Policy (since September 1996); Attorney and President of Health Policy Associates, Inc., consultants. Mr. Isaacs’s prior business experience includes having served as Director of Columbia University Development Law and Policy Program and Professor at Columbia University (until August 1996).
Arthur S. Mehlman, Trustee
Age: 70 | Number of Funds Overseen: 48 | Tenure: Since 2004
Non-Royce Directorships: Director/Trustee of registered investment companies constituting the 14 Legg Mason Funds.
Principal Occupation(s) During Past Five Years: Director of The League for People with Disabilities, Inc.; Director of University of Maryland Foundation (non-profits). Formerly: Director of Municipal Mortgage & Equity, LLC (from October 2004 to April 1, 2011); Director of University of Maryland College Park Foundation (non-profit) (from 1998 to 2005); Partner, KPMG LLP (international accounting firm) (from 1972 to 2002); Director of Maryland Business Roundtable for Education (from July 1984 to June 2002).
David L. Meister, Trustee
Age: 73 | Number of Funds Overseen: 34 | Tenure: Since 1982
Non-Royce Directorships: None
Principal Occupation(s) During Past Five Years: Consultant. Chairman and Chief Executive Officer of The Tennis Channel (from June 2000 to March 2005). Mr. Meister’s prior business experience includes having served as Chief Executive Officer of Seniorlife.com, a consultant to the communications industry, President of Financial News Network, Senior Vice President of HBO, President of Time-Life Films, and Head of Broadcasting for Major League Baseball.
G. Peter O’Brien, Trustee
Age: 67 | Number of Funds Overseen: 48 | Tenure: Since 2001
Non-Royce Directorships: Director/Trustee of registered investment companies constituting the 14 Legg Mason Funds; Director of TICC Capital Corp.
Principal Occupation(s) During Past Five Years: Trustee Emeritus of Colgate University (since 2005); Board Member of Hill House, Inc. (since 1999); Formerly: Trustee of Colgate University (from 1996 to 2005), President of Hill House, Inc. (from 2001 to 2005) and Managing Director/Equity Capital Markets Group of Merrill Lynch & Co. (from 1971 to 1999).
John D. Diederich, Vice President and Treasurer
Age: 61 | Tenure: Since 2001
Principal Occupation(s) During Past Five Years: Chief Operating Officer, Managing Director and member of the Board of Managers of Royce; Chief Financial Officer of Royce; Director of Administration of the Trust; and President of RFS, having been employed by Royce since April 1993.
Jack E. Fockler, Jr., Vice President
Age: 54 | Tenure: Since 1995
Principal Occupation(s) During Past Five Years: Managing Director and Vice President of Royce, and Vice President of RFS, having been employed by Royce since October 1989.
W. Whitney George, Vice President
Age: 54 | Tenure: Since 1995
Principal Occupation(s) During Past Five Years: Co-Chief Investment Officer, Managing Director and Vice President of Royce, having been employed by Royce since October 1991.
Daniel A. O’Byrne, Vice President and Assistant Secretary
Age: 50 | Tenure: Since 1994
Principal Occupation(s) During Past Five Years: Principal and Vice President of Royce, having been employed by Royce since October 1986.
John E. Denneen, Secretary and Chief Legal Officer
Age: 45 | Tenure: 1996-2001 and Since April 2002
Principal Occupation(s) During Past Five Years: General Counsel, Principal, Chief Legal and Compliance Officer, and Secretary of Royce; Secretary and Chief Legal Officer of The Royce Funds.
Lisa Curcio, Chief Compliance Officer
Age: 53 | Tenure: Since 2004
Principal Occupation(s) During Past Five Years: Chief Compliance Officer of The Royce Funds (since October 2004) and Compliance Officer of Royce (since June 2004).
1 Interested Trustee.
Trustees will hold office until their successors have been duly elected and qualified or until their earlier resignation or removal. The Statement of Additional Information, which contains additional information about the Trust’s trustees and officers, is available and can be obtained without charge at www.roycefunds.com or by calling (800) 221-4268.
| 128 | The Royce Funds 2012 Annual Report to Shareholders |
| Notes to Performance and Other Important Information |
The thoughts expressed in this report concerning recent market movements and future prospects for small company stocks are solely the opinion of Royce at December 31, 2012, and, of course, historical market trends are not necessarily indicative of future market movements. Statements regarding the future prospects for particular securities held in the Funds’ portfolios and Royce’s investment intentions with respect to those securities reflect Royce’s opinions as of December 31, 2012 and are subject to change at any time without notice. There can be no assurance that securities mentioned in this report will be included in any Royce-managed portfolio in the future. Sector weightings are determined using the Global Industry Classification Standard (“GICS”). GICS was developed by, and is the exclusive property of, Standard & Poor’s Financial Services LLC (“S&P”) and MSCI Inc. (“MSCI”). GICS is the trademark of S&P and MSCI. “Global Industry Classification Standard (GICS)” and “GICS Direct” are service marks of S&P and MSCI. All indexes referred to are unmanaged and capitalization weighted. Each index’s returns include net reinvested dividends and/or interest income. Russell Investment Group is the source and owner of the trademarks, service marks, and copyrights related to the Russell Indexes. Russell® is a trademark of Russell Investment Group. The Russell 2000 is an index of domestic small-cap stocks. It measures the performance of the 2,000 smallest publicly traded U.S. companies in the Russell 3000 Index. The Russell 1000 Index is an index of domestic large-cap stocks. It measures the performance of the 1,000 largest publicly traded U.S. companies in the Russell 3000 Index. The Russell 2000 Value and Growth Indexes consist of the respective value and growth stocks within the Russell 2000 as determined by Russell Investments. The Russell Microcap Index includes 1,000 of the smallest securities in the Russell 2000 Index, along with the next smallest eligible securities as determined by Russell. The Russell 2500 is an index of domestic small- to mid-cap stocks. It includes approximately 2,500 of the smallest securities in the Russell 3000 Index. The returns for the Russell 2500—Financial Services Sector represent those of the financial services companies within the Russell 2500 Index. The Russell Midcap Index measures the performance of the mid-cap segment of the U.S. equity universe. It includes approximately 800 of the smallest securities in the Russell 1000 Index. The Russell Global Small Cap Index is an index of global small-cap stocks. The Russell Global ex-U.S. Large Cap Index is an index of global large-cap stocks, excluding the United States. The Russell Global ex-U.S. Small Cap Index is an index of global small-cap stocks, excluding the United States. The S&P 500 is an index of U.S. large-cap stocks, selected by Standard & Poor’s based on market size, liquidity, and industry grouping, among other factors. The Nasdaq Composite is an index of the more than 3,000 common equities listed on the Nasdaq stock exchange. Returns for the market indexes used in this report were based on information supplied to Royce by Russell Investments. Royce has not independently verified the above described information. The Price-Earnings, or P/E, Ratio is calculated by dividing a company’s share price by its trailing 12-month earnings-per share (EPS). The Price-to-Book, or P/B, Ratio is calculated by dividing a company’s share price by its book value per share. The Sharpe Ratio is calculated for a specified period by dividing a fund’s annualized excess returns by its annualized standard deviation. The higher the Sharpe Ratio, the better the fund’s historical risk-adjusted performance. Standard deviation is a statistical measure within which a fund’s total returns have varied over time. The greater the standard deviation, the greater a fund’s volatility. The Royce Funds is a service mark of The Royce Funds. Distributor: Royce Fund Services, Inc. Investments in securities of micro-cap, small-cap and/or mid-cap companies may involve considerably more risk than investments in securities of larger-cap companies. (Please see “Primary Risks for Fund Investors” in the prospectus.) Certain Royce Funds may invest up to 25% (100% for Royce Global Value and International Smaller-Companies Funds, 35% of Heritage, Low-Priced Stock and Micro-Cap Funds, 10% of Opportunity Fund and 5% of Special Equity Fund) of their respective assets in foreign securities, which generally may involve political, economic, currency and other risks not encountered in U.S. investments. (Please see “Investing in Foreign Securities” in the prospectus.) Please read the prospectus carefully before investing or sending money. A copy of the Funds’ current prospectus and Statement of Additional Information may be obtained by calling (800) 221-4268, or by visiting www.roycefunds.com. All publicly released material Fund information is disclosed by the Funds on their website at www.roycefunds.com. |
| Forward-Looking Statements | |
This material contains forward-looking statements within the meaning of the Securities Exchange Act of 1934, as amended (the “Exchange Act”), that involve risks and uncertainties, including, among others, statements as to: | |
| • | the Funds’ future operating results, |
| • | the prospects of the Funds’ portfolio companies, |
| • | the impact of investments that the Funds have made or may make, |
| • | the dependence of the Funds’ future success on the general economy and its impact on the companies and industries in which the Funds invest, and |
| • | the ability of the Funds’ portfolio companies to achieve their objectives. |
This review and report use words such as “anticipates,” “believes,” “expects,” “future,” “intends,” and similar expressions to identify forward-looking statements. Actual results may differ materially from those projected in the forward-looking statements for any reason. | |
The Royce Funds have based the forward-looking statements included in this review and report on information available to us on the date of the report, and we assume no obligation to update any such forward-looking statements. Although The Royce Funds undertake no obligation to revise or update any forward-looking statements, whether as a result of new information, future events or otherwise, you are advised to consult any additional disclosures that we may make through future shareholder communications or reports. | |
| Proxy Voting |
A copy of the policies and procedures that The Royce Funds use to determine how to vote proxies relating to portfolio securities and information regarding how each of The Royce Funds voted proxies relating to portfolio securities during the most recent 12-month period ended June 30 is available, without charge, on The Royce Funds’ website at www.roycefunds.com, by calling (800) 221-4268 (toll-free) and on the website of the Securities and Exchange Commission (“SEC”), at www.sec.gov. |
| Form N-Q Filing |
The Funds file their complete schedules of investments with the SEC for the first and third quarters of each fiscal year on Form N-Q. The Funds’ Forms N-Q are available on the SEC’s website at www.sec.gov. The Royce Funds’ holdings are also on the Funds’ website approximately 15 to 20 days after each calendar quarter end and remain available until the next quarter’s holdings are posted. The Funds’ Forms N-Q may also be reviewed and copied at the SEC’s Public Reference Room in Washington, D.C. To find out more about this public service, call the SEC at (202) 942-8090. The Funds’ complete schedules of investments are updated quarterly, and are available at www.roycefunds.com. |
| The Royce Funds 2012 Annual Report to Shareholders | 129 |
| 2012: In Quotes |
History has shown that lousy economic conditions, or even dismal corporate results, don’t necessarily lead to disappointing stock market returns in any given year—or decade, for that matter. - Paul J. Lim, nytimes.com, December 15, 2012 |
Points To Ponder Bonds are thought to be lower-risk investments; we believe that, at today’s prices, long-term bonds are very risky. - Bill Nygren, Oakmark Funds, Morningstar Advisor, October 12, 2012 Our national wealth didn’t come from politicians of any ilk, level, office or ideology. It came from the long-term, much defiled 1% of the population and their dedicated followers via the marvelous magic of capitalism. - Ken Fisher, Forbes, November 19, 2012 Profit margins are probably the most mean-reverting series in finance, and if profit margins do not mean-revert, then something has gone badly wrong with capitalism. If high profits do not attract competition, there is something wrong with the system and it is not functioning properly. - Jeremy Grantham Individual and institutional investors are insuring that they will lose money on Treasuries [after inflation] over the next 10 years when they by-pass the chance to make money in equities. - Noah Blackstein, Barron’s, July 14, 2012 It is important to recognize that results in the short term reflect a lot of randomness. Even skillful managers will slump, and unskillful managers will shine. But over the long haul, good process wins. - Michael Mauboussin, Daily News & Analysis, June 4, 2012 The market always does what it’s supposed to do only never when it’s supposed to do it. - Arnold Van De Berg Do not trust financial market risk models. Despite the predilection of some analysts to model the financial markets using sophisticated mathematics, the markets are governed by behavioral science, not physical science. - Seth Klarman In Absolute Agreement Whenever you find yourself on the side of the majority, it is time to pause and reflect. - Mark Twain To preserve independence, we must not let our rulers load us with perpetual debt. We must make our election between economy and liberty, or profusion and servitude. - Thomas Jefferson It’s never as good as you think it is when it’s great, and never as bad as you think it is when it’s bad. - Preston Athey, Barron’s, June 16, 2012 Leverage reduces the investor’s critical asset: patience. -Jeremy Grantham, GMO Letter, February 2012 We don’t have to be smarter than the rest. We have to be more disciplined than the rest. - Warren Buffett, 2002 Cocktail Conversation A decade ago, jewelry accounted for more than 90% of global gold demand...Jewelry accounted for just 43% of global demand in the 2012 first half. - The Wall Street Journal, November 12, 2012 The one who follows the crowd will usually get no further than the crowd. The one who walks alone is likely to find himself in places no one has ever been. - Albert Einstein Timeless Tidbits The key to happiness is good health and a bad memory. - Ingrid Bergman The things that will destroy America are prosperity at any price, peace at any price, safety first instead of duty first and love of soft living and the get-rich-quick theory of life. - Theodore Roosevelt You can’t live a perfect day without doing something for someone who will never be able to repay you. - John Wooden |
| The thoughts expressed above represent solely the opinions of the persons quoted and, of course, there can be no assurance of future market trends or performance. |
| 130 | This page is not part of the 2012 Annual Report to Shareholders |
| Making Headlines |
At The Royce Funds, the integrity of our process and the reputation of our people are as important to us as the success of our portfolios, so it is always gratifying when the results of these three efforts are recognized in the wider world. Through the years, we have been fortunate enough to have a number of positive things written about The Royce Funds, our firm and our people. Below is a summary of what we think were among the best media mentions from the last year. |
February 21, 2012 Whitney George Shares His Small-Cap Experience with Value Investor Insight Royce Co-Chief Investment Officer, Portfolio Manager, and Managing Director Whitney George revealed his investment strategy in the Value Investor Insight article “Staying Power.” The in-depth interview covers examples of companies Whitney was interested in, why he is slow to fall in love with a stock, and why small-caps require an even greater focus on margins of safety. “We believe our edge is in bringing a formidable amount of knowledge and experience to a part of the stock market that is not always well understood or effectively followed.” Having a long-term time horizon of three to five years is an added edge as it gives Royce managers the ability to buy companies that are out of favor due to lackluster short-term outlooks. As Whitney points out in the article, “It’s a good deal easier to know what’s likely to happen than to know precisely when it’s going to happen.” March 23, 2012 Seeking Alpha Points to Royce Micro-Cap Fund In his February 29, 2012 article, Seeking Alpha contributor Ian Cassel looked at the five-and 10-year performances of ten micro-cap funds. Cassel says, “Even though most people broad-brush micro-cap as ‘NOT investable,’ some of the greatest managers of all time like Peter Lynch and Warren Buffett started in the micro- and small-cap arenas.” Jenifer Taylor manages Royce Micro-Cap Fund, which invests primarily in companies with market capitalizations up to $500 million. July 10, 2012 Investor’s Business Daily: David Nadel Talks Emerging Markets For his June 26, 2012 “Emerging-Market Funds’ Flows Soar As Investors Thrive” article, Paul Katzeff took insights from David Nadel, Royce Portfolio Manager and Director of International Research. Katzeff noted that Nadel invests in emerging markets in several ways. One is to invest in companies based in a developed market that generate a lot of revenue from emerging markets and another is to invest in companies that do business globally but have facilities in emerging markets. David Nadel spoke at the 2012 Morningstar Investment Conference in Chicago, IL. November 9, 2012 Chuck Royce Featured in WSJ’s Article “Funds Prepare for Eventual Succession” “I’m not remotely thinking about retirement or anything like it,” said Chuck Royce in a recent article published in The Wall Street Journal, clearing any assumptions his appointment of Whitney George as Co-Chief Investment Officer in 2009 might have aroused. “I believe we have built a firm that does not rely on any one person’s contribution,” he added. The November 4, 2012 article, written by Staff Reporter Joe Light and titled “Funds Prepare for Eventual Succession,” took a look at six top-performing managers who are either past or approaching traditional retirement age. Making the list was Chuck Royce, who at age 73 has spent 40 years at Royce & Associates, LLC as the company’s President, Co-Chief Investment Officer, and Portfolio Manager. According to Morningstar, Chuck belongs to a small group of Portfolio Managers who have a term of such length. December 10, 2012 Jay Kaplan Shares His Investment Strategy with Value Investor Insight Published November 30, 2012, the most recent issue of Value Investor Insight took interest in Portfolio Manager and Principal Jay Kaplan, who for 12 years has been a key contributor to our work. The interview, titled “Not-Great Expectations,” engaged Jay through a variety of topics, touching on his long-term, contrarian investment approach, valuation metrics, where he is finding opportunities today, and the quality characteristics of a few companies that he has held for years. “I’m trying not to buy hopes and dreams, but the here and now,” said Jay with regards to Royce’s general approach to valuation. “If the hopes and dreams come true, all the better,” he added. |
| This page is not part of the 2012 Annual Report to Shareholders | 131 |
| The Lessons of 40 Years |

The thoughts in this essay concerning the stock market are solely those of Royce & Associates and, of course, there can be no assurance with regard to future market movements.
| 132 | This page is not part of the 2012 Annual Report to Shareholders |
| |||||||||||||||||||
 | |||||||||||||||||||
About The Royce Funds This Review and Report must be accompanied or preceded by a current prospectus for the Funds. Please read the prospectus carefully before investing or sending money. | |||||||||||||||||||
| Contact Us | |||||||||||||||||||
| General Information Additional Report Copies and Prospectus Inquiries (800) 221-4268 | RIA/BD Services Fund Materials and Performance Updates (800) 33-ROYCE (337-6923) | Shareholder Services Transactions and Account Inquiries (800) 841-1180 | Royce InfoLine 24-Hour Automated Telephone Service (800) 78-ROYCE (787-6923) |  | |||||||||||||||
|
ANNUAL
REVIEW AND REPORT
TO SHAREHOLDERS
Royce Select Fund I Royce Select Fund II Royce Global Select Long/Short Fund Royce Enterprise Select Fund Royce Opportunity Select Fund Royce Financial Services Fund Royce Micro-Cap Discovery Fund Royce SMid-Cap Value Fund Royce Focus Value Fund Royce Partners Fund Royce Special Equity Multi-Cap Fund Royce European Smaller-Companies Fund Royce Global Dividend Value Fund Royce International Micro-Cap Fund Royce International Premier Fund | ||
www.roycefunds.com | | |
| Online Update |
| Visit www.roycefunds.com for Fund performance information, special messages and commentary from Co-CIOs Chuck Royce, Whitney George, and other portfolio managers, news, literature, and tools to help you better understand and compare our Funds. |

eDelivery Saves! Sign Up Now. eDelivery saves paper, time, and fund expenses.1 Sign up now to view statements, prospectuses, financial reports, and tax forms online. > www.roycefunds.com/edelivery 1 Any direct Royce Funds IRA investor who chooses eDelivery of prospectuses, financial reports, and RWord will be exempt from the $15 annual IRA maintenance fee. (We will continue to also waive the fee for investors with more than $20,000 invested in Royce IRAs at the time the fee is charged, and for new transfer and rollover accounts in their first year.) Stay Informed Follow us on Twitter, watch us on YouTube, subscribe to our RSS feed, and sign up for our monthly eWord newsletter to stay up to date on the latest from The Royce Funds. www.twitter.com/roycefunds www.youtube.com/roycefunds www.roycefunds.com/eword www.youtube.com/roycefunds www.roycefunds.com/ewordFinancial Professionals Login to our Financial Professional website to access up-to-date research, insights, and whitepapers including: What’s in a Name? How Small-Caps Have Evolved While the adoption of small-cap is now wide-spread, there remain differences in how the category is defined in the U.S. and abroad. Consider Micro-Caps: Why Now Might be a Good Time Low expectations, a history of strong, above-average returns, and solid near-term results may mean the start of something good for the underfollowed and underappreciated micro-cap asset class. > www.roycefunds.com/research Quarterly Advisor Materials Log into our Financial Professional site and manage your preferences to receive alerts about our: • Quarterly Review Book • Fund Impact and Attribution Reports • Longitudinal Studies • Fact Sheets > www.roycefunds.com/advisors |
| This page is not part of the 2012 Annual Report to Shareholders |
| Table of Contents | |
| Annual Review | |
| Fund Guide | 2 |
| Performance and Expenses | 4 |
| Portfolio Characteristics | 5 |
| Letter to Our Shareholders | 6 |
| Postscript: The Lessons of 40 Years | Inside Back Cover |
| Annual Report to Shareholders | 13 |
| |
| This page is not part of the 2012 Annual Report to Shareholders | 1 |
| Royce Fund Guide |
| Value-Oriented Small-Cap Offerings Tailored to Specific Investor Needs |
| INVESTMENT UNIVERSE BREAKDOWN1 |
|
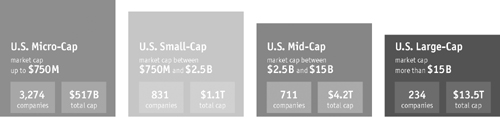
The size and diversity of the small-company universe make it a unique and fertile area for investment. For 40 years, it has been our primary area of focus. Over that time, this universe has evolved into an established asset class, used by a wide range of investors, including institutions, consultants, advisors, and individuals. Today, there are numerous small-cap and micro-cap indexes and ETFs. Importantly, the continuous regeneration of the asset class, through the entrance of new companies, spin-offs and IPOs, makes it an evergreen source of investment opportunities. This is why we have elected to focus on the smaller-company universe and believe it is ideally suited for a variety of distinct offerings. Market Cap The smaller company universe consists of more than 4,1001 publicly traded companies in the U.S. (and more than 28,0001 outside the U.S.). We break it down into two distinct market segments: micro-cap—companies with market caps up to $750 million—and small-cap—companies with market caps between $750 million and $2.5 billion. Sorting the universe into two markets is critical because, in our experience, each requires a portfolio approach based primarily on diversification needs. Our portfolio managers share a common investment approach, one that emphasizes paying attention to risk and buying what each thinks are strong businesses at discounted prices, but our portfolios also possess important differences that make each one unique. Each portfolio falls within the small-cap universe, in terms of both constituent names and average market cap. Portfolio Approach Our portfolio managers possess broad latitude within our investment universe, though in general they seek a combination of quality—measured by the balance sheet and returns on invested capital—and valuation. Portfolios that invest more heavily in micro-caps are, in general, more broadly diversified due to liquidity considerations; those that invest primarily in the upper end of the small-cap portfolios tend to be more focused. In addition, we seek to take advantage of pockets of opportunity, such as dividend-paying companies, low-priced companies, turnarounds, special situations, etc., within each universe. Broadly Diversified Portfolios A diversified portfolio at Royce is one that generally holds more than 100 securities and whose top positions generally do not exceed 2% of net assets. Focused Portfolios A focused portfolio at Royce is one that either (i) generally invests in no more than 100 companies, and whose top positions generally exceed 2% of net assets, or (ii) invests primarily in a single sector. |
1 Reuters as of 12/31/12 |
| The Royce Funds, other than Royce Special Equity Multi-Cap Fund, invest primarily in micro-cap, small-cap, and/or mid-cap stocks, which may involve considerably more risk than investing in larger-cap stocks (Please see “Primary Risks for Fund Investors” in the prospectus). Each Fund may invest a portion of its net assets in foreign securities, which may involve political, economic, currency, and other risks not encountered in U.S. investments (Please see “Investing in Foreign Securities” in the prospectus). Distributor: Royce Fund Services, Inc. |
| 2 | This page is not part of the 2012 Annual Report to Shareholders |
This guide is designed to help investors better understand both the different approaches and the common ground among our portfolios. Looking closely at our Fund Guide allows investors to see other important differences—in levels of volatility, sector orientation, and investment themes—within the context of our two key differentiators, namely, market cap and portfolio approach. We think that understanding these differences can inform asset allocation decisions, especially when investors incorporate more than one Royce offering within their portfolios. Listed below are the Royce Funds included in this Annual Report, arranged by average market cap. For a complete listing of our Funds and their attributes please visit our website at www.roycefunds.com. |
| Fund Tools Go online for more tools to help you better understand our Funds. Compare Funds > www.roycefunds.com/compare Prices & Performance > www.roycefunds.com/prices |
 |
1 Geometric Average. This weighted calculation uses each portfolio holding’s market cap in a way designed to not skew the effect of very large or small holdings; instead, it aims to better identify the portfolio’s center, which Royce believes offers a more accurate measure of average market cap than a simple mean or median. |
| This page is not part of the 2012 Annual Report to Shareholders | 3 |
| Performance and Expenses | Through December 31, 2012 |
| Average Annual Total Returns | |||||||||||||||||||||||||||
| Gross Annual | Net Annual | ||||||||||||||||||||||||||
| Since | Since | Operating | Operating | ||||||||||||||||||||||||
| Fund | 1-Year | 5-Year | 10-Year | Inception | Inception Date | Expenses | Expenses | ||||||||||||||||||||
| Royce Select Fund I | 13.68 | % | 6.01 | % | 12.84 | % | 13.38 | % | 11/18/98 | 1.14 | % | 1.14 | % | ||||||||||||||
| Royce Select Fund II | 13.77 | 5.60 | n.a. | 6.39 | 6/30/05 | 2.76 | 1.68 | ||||||||||||||||||||
| Royce Global Select Long/Short Fund | 14.02 | 5.05 | n.a. | 10.56 | 6/30/05 | 1.76 | 1.65 | ||||||||||||||||||||
| Royce Enterprise Select Fund | 15.68 | 4.59 | n.a. | 4.47 | 9/28/07 | 4.24 | 1.25 | ||||||||||||||||||||
| Royce Opportunity Select Fund | 35.14 | n.a. | n.a. | 17.41 | 8/31/10 | 2.83 | 1.44 | ||||||||||||||||||||
| Royce Financial Services Fund | 20.72 | 1.61 | n.a. | 5.81 | 12/31/03 | 1.89 | 1.54 | ||||||||||||||||||||
| Royce Micro-Cap Discovery Fund | 3.10 | -0.29 | n.a. | 4.35 | 10/3/03 | 2.99 | 1.49 | ||||||||||||||||||||
| Royce SMid-Cap Value Fund | 15.45 | 3.21 | n.a. | 3.08 | 9/28/07 | 1.95 | 1.35 | ||||||||||||||||||||
| Royce Focus Value Fund | 9.20 | n.a. | n.a. | 14.10 | 2/27/09 | 1.98 | 1.36 | ||||||||||||||||||||
| Royce Partners Fund | 20.74 | n.a. | n.a. | 10.92 | 4/27/09 | 4.28 | 1.38 | ||||||||||||||||||||
| Royce Special Equity Multi-Cap Fund | 11.62 | n.a. | n.a. | 9.39 | 12/31/10 | 1.97 | 1.39 | ||||||||||||||||||||
| Royce European Smaller-Companies Fund | 23.83 | 2.44 | n.a. | 2.27 | 12/29/06 | 2.10 | 1.70 | ||||||||||||||||||||
| Royce Global Dividend Value Fund | 22.52 | n.a. | n.a. | 1.83 | 12/31/10 | 3.48 | 1.70 | ||||||||||||||||||||
| Royce International Micro-Cap Fund | 13.59 | n.a. | n.a. | -5.58 | 12/31/10 | 4.01 | 1.78 | ||||||||||||||||||||
| Royce International Premier Fund | 23.40 | n.a. | n.a. | 1.36 | 12/31/10 | 3.77 | 1.69 | ||||||||||||||||||||
| 1 Not annualized | |||||||||||||||||||||||||||
Important Performance, Expense, and Risk Information
All performance information in this Review and Report reflects past performance, is presented on a total return basis, reflects the reinvestment of distributions, and does not reflect the deduction of taxes a shareholder would pay on fund distributions or the redemption of fund shares. Past performance is no guarantee of future results. Investment return and principal value of an investment will fluctuate, so that shares may be worth more or less than their original cost when redeemed. Shares redeemed within 180 days of purchase may be subject to a 1% redemption fee payable to the Fund (2% for Royce European Smaller-Companies, Global Dividend Value, International Micro-Cap, and International Premier Funds). Redemption fees are not reflected in the performance shown above; if they were, performance would be lower. Current performance may be higher or lower than performance quoted. Current month-end performance may be obtained at www.roycefunds.com. All performance and expense information reflects results of the Fund’s oldest share Class (Investment Class or Service Class, as the case may be). Price and total return information is based on net asset values calculated for shareholder transactions. Gross annual operating expenses reflect the Fund’s gross total annual operating expenses and include management fees, any 12b-1 distribution and service fees, other expenses, and any applicable acquired fund fees and expenses. Net annual operating expenses, reflect contractual fee waivers and/or reimbursements. All expense information is reported as of the Fund’s most current prospectus. Royce & Associates has contractually agreed to waive fees and/or reimburse operating expenses, other than acquired fund fees and expenses, if any, to the extent necessary to maintain net operating expenses at or below: 1.35% for Royce Focus Value, Partners, and SMid-Cap Value Funds; 1.49% for Royce Financial Services and Micro-Cap Discovery Funds through April 30, 2013 and at or below 1.99% for Royce Partners and Micro-Cap Discovery Funds through April 30, 2022; and at or below 1.39% for Royce Special Equity Multi-Cap Fund through April 30, 2014; and at or below 1.49% for Royce Select Fund II and Global Select Long/Short Funds and at or below 1.24% for Royce Enterprise Select and Opportunity Select Funds through April 30, 2015. Acquired fund fees and expenses reflect the estimated amount of fees and expenses incurred indirectly by the Fund through its investments in mutual funds, hedge funds, private equity funds and other investment companies. Shares of the Funds’ Service Class bear an annual distribution expense that is not borne by the Funds’ Investment Class. Investments in securities of micro-cap, small-cap and/or mid-cap companies may involve considerably more risk than investments in securities of larger-cap companies. (Please see “Primary Risks for Fund Investors” in the prospectus.) Royce Global Select Long/Short, European Smaller-Companies, Global Dividend Value, International Micro-Cap, and International Premier Funds invest a significant portion of their respective assets in foreign companies that may be subject to different risks than investments in securities of U.S. companies, including adverse political, social, economic or other developments that are unique to a particular country or region. (Please see “Investing in foreign securities” in the prospectus.) Therefore, the prices of securities of foreign companies, in particular countries or regions may, at times, move in a different direction than those of securities of U.S. companies. (Please see “Primary Risk of Fund Investors” in the prospectus.) Please read the prospectus carefully before investing or sending money. Distributor: Royce Fund Services, Inc. |
| 4 | This page is not part of the 2012 Annual Report to Shareholders |
| Portfolio Characteristics | As of December 31, 2012 |
| Longevity | % of | |||||||||||||||||||||
| of Fund | Portfolio | Fund Assets | Market Cap | Non-U.S. | Portfolio | |||||||||||||||||
| Fund | (in years) | Approach | (in millions) | Breakdown | Securities | Volatility2 | ||||||||||||||||
| Royce Select Fund I | 14 | | $50 |  | 9.9 | % | Moderate | |||||||||||||||
| Royce Select Fund II | 7 | | 4 | | 35.9 | Higher | ||||||||||||||||
| Royce Global Select Long/Short Fund | 7 | | 21 |  | 73.5 | Moderate | ||||||||||||||||
| Royce Enterprise Select Fund | 5 | | 1 |  | 9.7 | Lower | ||||||||||||||||
| Royce Opportunity Select Fund1 | 2 | | 3 |  | 4.6 | — | ||||||||||||||||
| Royce Financial Services Fund | 9 | | 17 |  | 29.9 | Moderate | ||||||||||||||||
| Royce Micro-Cap Discovery Fund | 9 | | 4 |  | 5.9 | Moderate | ||||||||||||||||
| Royce SMid-Cap Value Fund | 5 | | 11 |  | 33.2 | Higher | ||||||||||||||||
| Royce Focus Value Fund | 3 | | 9 |  | 24.9 | Lower | ||||||||||||||||
| Royce Partners Fund | 3 | | 2 |  | 22.7 | Lower | ||||||||||||||||
| Royce Special Equity Multi-Cap Fund1 | 2 | | 109 |  | 0.0 | — | ||||||||||||||||
| Royce European Smaller-Companies Fund | 6 | | 16 |  | 95.8 | Higher | ||||||||||||||||
| Royce Global Dividend Value Fund1 | 2 | | 7 |  | 87.1 | — | ||||||||||||||||
| Royce International Micro-Cap Fund1 | 2 | | 5 |  | 92.5 | — | ||||||||||||||||
| Royce International Premier Fund1 | 2 | | 6 |  | 94.3 | — | ||||||||||||||||
| 1 | The Fund does not have the three years of history required for calculating a volatility score. |
| 2 | Each Fund’s volatility is measured using Morningstar’s Risk Ratio, which measures variations in a fund’s monthly returns, with an emphasis on downside performance. Each Royce Fund’s overall Risk Ratio is a weighted combination of its three-, five- and 10-year scores, if applicable. Except as noted below, each Fund’s results reflect its score compared with all small-cap objective funds tracked by Morningstar with at least three years of history (374 funds as of 12/31/12). For Royce Global Select Long/Short Fund and Royce Select Fund II all world stock funds with weighted average market-caps of less than $5 billion tracked by Morningstar that have at least three years of history (24 funds as of 12/31/12) are included. For Royce Financial Services Fund, all financial funds tracked by the Morningstar with at least three years of history (32 funds as of 12/31/12) are included. For Royce Enterprise Select, SMid-Cap Value, Focus Value, and Partners Funds, all mid-cap stock funds with weighted average market caps between $750 million and $10 billion tracked by Morningstar with at least three years of history (390 funds as of 12/31/12) are included. For Royce European Smaller-Companies Fund, all European stock funds tracked by Morningstar with at least three years of history (32 funds as of 12/31/12) are included. We consider funds whose results rank in the top third of the category to have relatively low volatility; those in the middle third to have moderate volatility; and those in the bottom third to have high volatility. |
| Market Cap Breakdown Key: n <$750M n $750M–$2.5B n $2.5B–$15B n >$15B Broadly Diversified Focused |
| This page is not part of the 2012 Annual Report to Shareholders | 5 |
Charles M. Royce, President One of the most interesting recent developments in the equity markets, particularly in the small-cap space, has been the persistent disparity in performance between high- and low-quality companies. Over longer periods of time, higher-quality companies have differentiated themselves from a performance standpoint, especially compared to the lower quality segments of the market. While the aftermath of the financial crisis altered this script, there are signs that the dynamic is changing. Historically, lower-quality companies have tended to demonstrate their most robust outperformance when markets are in the initial recovery phase following a recession or bear market low. However, once economies and markets move from recovery to expansion, the rate of change in these inputs begins to slow while leadership tends to rotate back to higher- quality companies, whose business fundamentals are more compelling. Continued on page 8... | Letter to Our Shareholders Men can do nothing without the make-believe of a beginning. – George Eliot See a Little Light When seeing out one year and ushering in another, it is important to remember that the calendar, useful though it may be, provides only one way of tracking time. Some people, for example, choose to look to spring for a new beginning, while others, more habituated to the rhythms of the school year, prefer the arrival of fall. The stock market, in all its caprice and unpredictability, most often eschews 12-month spans in favor of its own irregularly paced seasons. So we find ourselves, as we look back on 2012 and peer ahead to 2013, at one of those curious, familiar junctures when the calendar compels a shift that the market seems to have anticipated months before. From our perspective as active small-cap managers, the recent market cycle change was something of a watershed. In fact, it seems very likely to us that the 2012 small-cap low on June 4 signaled the end of the closely correlated, range-bound cycle of the last few years, a cycle that created ample disappointments for those of us committed to high quality, risk management, and long-term absolute returns. It is not yet clear that this June low will prove as auspicious as it looks to us at this writing. Suffice it to say that major market inflection points seldom do any of us the favor of announcing their arrival. It is equally important to emphasize that our new-found sanguine attitude is contingent on seeing in 2013 more of what we saw in the second half of 2012, particularly in last year’s closing months. During this period, investors were looking more closely at companies that possess sustainable quality in the form of strong balance sheets, high returns on invested | ||
| 6 | This page is not part of the 2012 Annual Report to Shareholders |
capital, steady earnings, and reasonable dividends while paying a bit less attention to high-yield instruments, copiously leveraged stocks, and explosive growth surprises. We want to stress the extremely cautious nature of our optimism. The resurgence of quality off the June low was not decisive and has been thus far short lived. However, in our view, it did mark a subtle and significant shift that grew more pronounced in the fourth quarter, most notably in October and November when share prices went wobbly from the impact of Hurricane Sandy and the aftermath of the elections, which included periods of recurrent anxiety over the then-looming fiscal cliff. | From our perspective as active small- cap managers, the recent market cycle change was something of a watershed. In fact, it seems very likely to us that the 2012 small-cap low on June 4 signaled the end of the closely correlated, range- bound cycle of the last few years, a cycle that created ample disappointments for those of us committed to high quality, risk management, and long-term absolute returns. | |||
| This page is not part of the 2012 Annual Report to Shareholders | 7 |
| However, the four rounds of QE have created an extended tailwind for low-quality companies. Highly levered businesses—a low-quality attribute from our standpoint—have benefited from the sharp drop in the cost of capital that has accompanied the Fed’s bond buying programs. Access to capital has simultaneously improved, allowing weaker companies to stave off potential financing challenges. This is particularly relevant in the smaller company space where financing is often tenuous. Interestingly, companies with large net cash positions have also lagged as that cash has been viewed as an unproductive asset that generates little or no return, even though it provides a healthy margin of safety and is often the result of profitability. Even allowing for strong second-half results, high-quality small-caps look highly attractive to us relative to both their lower-quality counterparts and their high-quality peers in the large-cap space. The drop in market volatility back to pre-crisis levels, as measured by the VIX, has contributed to the relative strength of low-quality companies. Investors’ appetite for riskier assets tends to correlate with sharp moves—both up and down—in volatility. As the more violent swings Continued on page 10... | |||
| Letter to Our Shareholders | ||
to flirt with financial peril, and China was still growing at a slower pace than in previous boom years. In addition, there was a typically contentious presidential election preceded by a disastrous hurricane that swept through the world’s financial capital. Yet the market ultimately shrugged off most of these concerns. Share prices did not skyrocket following the June 4 small-cap low. July, in fact, saw a downturn for most stocks. But August and September were highly rewarding months that enabled equities to rally decisively enough to post impressive third-quarter results. For the quarter, the small-cap Russell 2000 Index gained 5.3% while the large-cap S&P 500 and Russell 1000 Indexes were up 6.4% and 6.3%, respectively, and the more tech-oriented Nasdaq Composite climbed 6.2%. Following the strong third quarter, equities took a bit of breather in October, before rallying again in November and December, which repeated to some degree the third quarter’s pattern, though with far more modest or slightly negative results. For the fourth quarter, the Russell 2000 was up 1.9%, the Russell 1000 rose 0.1%, the S&P 500 was off 0.4%, and the Nasdaq Composite fell 3.1%. The end result was a strong calendar year, especially compared to 2011, with each major equity index posting double-digit returns. In 2012, the Russell 2000 gained 16.3%, the S&P 500 rose 16.0%, the Russell 1000 was up 16.4%, and the Nasdaq Composite increased 15.9%. Three-year returns for the major indexes were also strong, with each again posting double-digit average annual total returns. For the three-year period ended December 31, 2012, the Russell 2000 led with a gain of 12.2%. The Russell 2000, Russell 1000, and S&P 500 each finished the year within 2.5% of their respective highs established during 2012’s third quarter, while the Nasdaq Composite remained 40.2% below its peak from March 10, 2000. Non-U.S. equities also enjoyed a strong second half after starting the year with generally lower gains when stacked against their domestic cousins. The Russell Global ex-U.S. Small Cap Index climbed 8.3% in the third quarter, while the Russell Global ex-U.S. Large Cap Index rose 7.7%. In contrast to the domestic indexes, these strong third-quarter performances were followed by consistently positive results in the fourth quarter. The Russell Global ex-U.S. Small Cap Index was up 4.8% versus a gain of 5.8% for the Russell Global ex-U.S. Large Cap Index. For the full year small-caps were the leaders, with the Russell Global ex-U.S. Small Cap Index gaining 18.8% while the Russell Global ex-U.S. Large Cap Index was up 17.0%. So while the perception persists that non-U.S. markets are a mess—a perception based on the uncertain debt and currency situations in Europe and slower-than-desired growth in developing countries—the reality is that stocks across the globe finished the year with highly attractive results. Shifting back stateside finds that micro-cap stocks enjoyed a very strong year. After finishing the first half with an enviable 13.0% return, the Russell Microcap Index climbed 5.9% in the third quarter and was essentially flat in the fourth, up 0.04%, which gave the index a 19.7% increase in 2012. Mid-cap stocks also experienced robust results for the calendar year—the Russell Midcap Index was up 17.3% in 2012. |
| 8 | This page is not part of the 2012 Annual Report to Shareholders |
Good-Bye to All That (We Hope) | An old adage has it that “the market climbs a wall of worry” during those times when stocks behave bullishly in the face of negative news or perceptions. It seems clear to us that in 2012 the market scaled just such a wall. | |||
| This page is not part of the 2012 Annual Report to Shareholders | 9 |
| in the market dissipated, investors were increasingly willing to embrace the added risk associated with lower quality enterprises. The current preference for passive strategies and ETFs at the expense of active management has also played a role. Within small-cap, active managers, especially those with a long-term orientation, tend to have a quality bias in their portfolios, while passive index vehicles, especially those meant to replicate the Russell 2000, have no bias other than market cap and therefore have a higher weighting in lower-quality companies. Persistent redemptions of actively managed funds combined with modest inflows to ETFs have further distorted the low quality/high performance differential. The key question, then, is when will this change? It is our view that it may already have begun. Interest rates, while at historic lows, cannot fall much lower. In fact, each successive round of quantitative easing is exerting less and less pressure on rates while at the same time raising the specter of increased inflation down the road. While liquidity should remain abundant, the rate of change in the cost of capital has clearly peaked. By the same token, the rate of decline in market volatility has Continued on page 12... | |||
| Letter to Our Shareholders | ||
| 2012 TOTAL RETURNS FOR THE ROYCE FUNDS VS. BENCHMARK INDEXES as of 12/31/12 | ||
 the Russell 2000 and other small-cap or mid-cap indexes in 2010, 2011, and the first half of 2012, which definitely hampered the effectiveness of our disciplined approach. This can be seen in many of the Funds’ one-, three., and even five-year results in some cases, through the end of 2012. We did not enjoy watching so many portfolio favorites languish. But not once did we consider changing our core principles. We knew that we were in a highly anomalous market, one that we may not see again for more than a generation. So we stayed patient and consistent while we waited for the cycle to shift. Our contention is that quality stocks underperformed through much of the recent cycle of correlation owing to both the zero-interest-rate policies that the Fed has implemented over the last few years and the related rounds of quantitative easing. With interest rates so low, companies were finding it very easy to restructure debt or take on more of it. The price companies were paying to do so was miniscule, so investors acted |
| 10 | This page is not part of the 2012 Annual Report to Shareholders |
 | ||
accordingly by rewarding a number of fast-growing, highly leveraged businesses while often ignoring those with strong balance sheets. In an environment where the cost of debt has been virtually nil, low-debt companies lost their traditional advantage. (Our Sidebar piece provides some more details.) However, we also suspect that we have reached a stage where this advantage is diminishing because rates have been historically low for a few years now and monetary stimulus no longer has the same dramatic impact it had with the first two or three rounds of quantitative easing. In addition to their stalwart second-half returns, we think this is a good sign for high-quality small-cap stocks. A Quality Cycle? As correlation continues to abate, we expect to see more opportunities for quality stocks to flourish. This is ultimately why we were not surprised by the market’s strength in the second half, even with ample ongoing uncertainty. We feel confident that the market has entered a cycle in which stock picking matters. Our optimism, cautious as it is, is bolstered by the fact that in the years ahead earnings growth can accelerate for small caps and should be robust as the economy continues to improve. While many companies are hesitant about capital expenditures, those issues have more to do with timing. That is, businesses were not willing to start spending until the President and Congress struck a deal. Yet our meetings with management teams have convinced us that there is no question about their willingness to invest. In this context, it is worth mentioning that the tax and stimulus deal that was struck early in January still left important matters such as infrastructure spending, entitlements, and the next debt ceiling increase unresolved. So there will be opportunities for political | We did not enjoy watching so many portfolio favorites languish. But not once did we consider changing our core principles. We knew that we were in a highly anomalous market, one that we may not see again for more than a generation. So we stayed patient and consistent while we waited for the cycle to shift. |
| This page is not part of the 2012 Annual Report to Shareholders | 11 |
| significantly slowed with the VIX now back to its long-run averages. And while the global economy continues to grow, GDP statistics are anything but robust. Low-quality companies have had an extended moment in the sun, but it is our strong belief that we are entering a new era for quality. | intransigence to potentially affect the markets in 2013, and it will be interesting to see how investors respond to additional rounds of fiscal gridlock. Our thought is that greater levels of attention to business fundamentals will remain high. We believe that equities will continue their positive performance into 2013, that quality-oriented companies and active management approaches, especially within the small-cap universe, will continue their resurgence, and that non-U.S. small-caps will continue to surprise on the upside. We are very happy to say that it looks like a new, more historically typical cycle has begun. | |||||
| Sincerely | ||||||
| | | ||||
| Charles M. Royce | W. Whitney George | Jack E. Fockler, Jr. | ||||
| President | Vice President | Vice President | ||||
| January 31, 2013 | ||||||
| 12 | This page is not part of the 2012 Annual Report to Shareholders |
| Table of Contents | |
| Annual Report to Shareholders | |
| Managers’ Discussions of Fund Performance | |
| Royce Select Fund I | 14 |
| Royce Select Fund II | 16 |
| Royce Global Select Long/Short Fund | 18 |
| Royce Enterprise Select Fund | 20 |
| Royce Opportunity Select Fund | 22 |
| Royce Financial Services Fund | 24 |
| Royce Micro-Cap Discovery Fund | 26 |
| Royce SMid-Cap Value Fund | 28 |
| Royce Focus Value Fund | 30 |
| Royce Partners Fund | 32 |
| Royce Special Equity Multi-Cap Fund | 34 |
| Royce European Smaller-Companies Fund | 36 |
| Royce Global Dividend Value Fund | 38 |
| Royce International Micro-Cap Fund | 40 |
| Royce International Premier Fund | 42 |
| Schedules of Investments and Financial Statements | 44 |
| Notes to Financial Statements | 87 |
| Report of Independent Registered Public Accounting Firm | 95 |
| Understanding Your Fund’s Expenses | 96 |
| Trustees and Officers | 98 |
| Notes to Performance and Other Important Information | 99 |
| The Royce Funds 2012 Annual Report to Shareholders | 13 |
| Royce Select Fund I |
AVERAGE ANNUAL TOTAL RETURNS Through 12/31/12 | ||||||||||
| July-December 20121 | 10.61 | % | ||||||||
| One-Year | 13.68 | |||||||||
| Three-Year | 8.99 | |||||||||
| Five-Year | 6.01 | |||||||||
| 10-Year | 12.84 | |||||||||
| Since Inception (11/18/98) | 13.38 | |||||||||
| ANNUAL EXPENSE RATIO | ||||||||||
| Operating Expenses | 1.14 | % | ||||||||
| 1 Not annualized | ||||||||||
| CALENDAR YEAR TOTAL RETURNS | ||||||||||
| Year | RS1 | Year | RS1 | |||||||
| 2012 | 13.7 | % | 2005 | 10.9 | % | |||||
| 2011 | -3.6 | 2004 | 19.1 | |||||||
| 2010 | 18.2 | 2003 | 48.7 | |||||||
| 2009 | 39.6 | 2002 | -15.8 | |||||||
| 2008 | -25.9 | 2001 | 24.5 | |||||||
| 2007 | 10.7 | 2000 | 15.0 | |||||||
| 2006 | 15.0 | 1999 | 35.4 | |||||||
| TOP 10 POSITIONS % of Net Assets | ||||||||||
| Reliance Steel & Aluminum | 3.1 | % | ||||||||
| Robert Half International | 2.9 | |||||||||
| Oil States International | 2.9 | |||||||||
| Helmerich & Payne | 2.9 | |||||||||
| Tetra Tech | 2.7 | |||||||||
| Alleghany Corporation | 2.6 | |||||||||
| GrafTech International | 2.5 | |||||||||
| Intrepid Potash | 2.5 | |||||||||
| Teradyne | 2.3 | |||||||||
| Minerals Technologies | 2.1 | |||||||||
| PORTFOLIO SECTOR BREAKDOWN % of Net Assets | ||||||||||
| Industrials | 26.6 | % | ||||||||
| Information Technology | 19.8 | |||||||||
| Energy | 13.9 | |||||||||
| Materials | 12.7 | |||||||||
| Consumer Discretionary | 8.7 | |||||||||
| Financials | 5.9 | |||||||||
| Health Care | 4.3 | |||||||||
| Consumer Staples | 1.0 | |||||||||
| Cash and Cash Equivalents | 7.1 | |||||||||
 | |||||||||
Manager’s Discussion In 2012 a somewhat frustrating first half was succeeded by a far better second half for Royce Select Fund I (RS1). The Fund was up 13.7% in 2012, behind the 16.3% gain for its small-cap benchmark, the Russell 2000 Index, for the same period. The year started on a positive note, and the Fund was up 11.5% in the year’s bullish opening quarter versus a 12.4% increase for the small-cap index. The bull phase was derailed when the Russell 2000 reached a high on March 26, 2012, just before the end of the first quarter. This made for a bearish second quarter despite mostly rising share prices in June, including a dramatic rally on that month’s final trading day to close out the first half of the year. Once again, a market rally was interrupted by investors’ concerns about European debt and the pace of growth here in the U.S. and China. During the second quarter, RS1 fell 7.8% (with most of the losses coming in a particularly brutal May) versus a loss of 3.5% for its small-cap benchmark. Small-caps reached their low for the year on June 4, 2012. Solid earnings from many companies, along with news that showed the U.S. economy slowly but surely improving, made the third quarter another bullish period, though overall returns were not quite as robust as they were in the first quarter. RS1 gained 4.4% in the third quarter compared to a 5.3% gain for the small-cap index. The Fund’s performance in the year’s last three months helped it to narrow the gap between it and its benchmark. This was particularly true in October, when RS1 gained 1.1% while the Russell 2000 fell 2.2%. For the fourth quarter, the Fund outperformed its benchmark, up 6.0% versus 1.9%. This quarterly advantage gave RS1 an edge for the second half of the year, with the Fund gaining 10.6% versus 7.2% for the Russell 2000. Longer-term returns remained strong. From the previous small-cap peak on July 13, 2007 through April 29, 2011, the Fund gained 32.9% versus 6.6% for the Russell 2000. From that same peak through December 31, 2012, RS1 was up 31.9% while the small-cap index was up a more modest 7.3%. The Fund outperformed the Russell 2000 for the five-, 10-year, and since inception (11/18/98) periods ended December 31, 2012. RS1’s average annual total return since inception was 13.4%. One reason for the Fund’s terrific second half was the resurgence of quality within small-cap, which benefited disciplined, bottom-up stock pickers such as ourselves. This could be seen at the sector, industry, and position levels. Each of the Fund’s eight equity sectors posted net gains in 2012. Industrials led by a hefty margin, though Consumer Discretionary and | |||||||||
| 14 | The Royce Funds 2012 Annual Report to Shareholders |
Performance and Portfolio Review Information Technology also did notably well. Industrials benefited from strong performances from utility infrastructure companies and those tied to the improving U.S. economy, particularly in construction. AZZ manufactures electrical and industrial products and provides galvanizing services. The company regularly exceeded quarterly earnings expectations and saw margin expansion in 2012 based on a pick-up in steel galvanizing activity and strong global demand for its utility infrastructure components used for power plant build outs. We took gains through much of the year. Valmont Industries is in a similar business—it makes fabricated metal products, pole and tower structures, and mechanized irrigation systems. The firm benefited from strong global utility infrastructure demand which bolstered its growth outlook. Severe droughts in the Midwest also helped sales of its irrigation systems to grow. Solid growth for architectural glass and installation projects at improved margins combined with a second-half improvement in the Architectural Billings Index—seen as a bellwether for commercial construction—drove the stock price of Apogee Enterprise higher. The CEO, who joined the firm in August 2011, also laid out feasible plans to expand margins via cost reduction and process improvement on top of the benefit from improved factory utilization rates. Small-cap M&A (merger & acquisitions) activity was not as robust as some were anticipating in 2012, though the portfolio benefited from the announcement on Halloween that apparel maker The Warnaco Group would be acquired for a more than 30% premium by a larger competitor in its business, PVH Corporation. The ensuing increase in Warnaco’s share price prompted us to sell our position in early November. IPG Photonics develops and manufactures high-power fiber-optic lasers and other laser products. Results improved through the year as its business in Asia reaccelerated while overall sentiment about fiber laser opportunities improved. We reduced our position in July. The higher cost structure in its industry hurt the profitability of Arkansas Best, a shipping and motorized transport company. An acquisition announced in spring put more leverage on its balance sheet than we were willing to accept, so we sold our shares in RS1’s portfolio in June. Major Drilling Group International provides contract drilling services for the metals industry. Although the firm continued to operate profitably, revenue and earnings were hurt as precious metals miners pared back development projects. This in turn seemed to spark fears of a possible decrease in demand for its services. We added to our stake at various points through the year. |
 |
| Includes reinvestment of distributions. | |||
| PORTFOLIO DIAGNOSTICS | |||
| Fund Net Assets | $50 million | ||
| Number of Holdings | 62 | ||
| Turnover Rate | 54% | ||
| Average Market Capitalization1 | $1,777 million | ||
| Weighted Average P/E Ratio2,3 | 14.5x | ||
| Weighted Average P/B Ratio2 | 1.7x | ||
| U.S. Investments (% of Net Assets) | 83.0% | ||
| Non-U.S. Investments (% of Net Assets) | 9.9% | ||
| Symbol | RYSFX | ||
1 Geometric Average. This weighted calculation uses each portfolio holding’s market cap in a way designed to not skew the effect of very large or small holdings; instead, it aims to better identify the portfolio’s center, which Royce believes offers a more accurate measure of average market cap than a simple mean or median. | |||
2 Harmonic Average. This weighted calculation evaluates a portfolio as if it were a single stock and measures it overall. It compares the total market value of the portfolio to the portfolio’s share in the earnings or book value, as the case may be, of its underlying stocks. | |||
| MORNINGSTAR STATISTICAL MEASURES1 | |||
| Sharpe Ratio | Standard Deviation | ||
| RS1 | 0.36 | 21.92 | |
| Russell 2000 | 0.25 | 24.55 | |
| Category Median | 0.24 | 24.07 | |
| Best Quartile Breakpoint | 0.30 | 22.94 | |
1 Five years ended 12/31/12. Category Median and Best Quartile Breakpoint based on 353 small-cap objective funds (oldest class) with at least five years of history. | |||
The Fund beat the Russell 2000 and performed within the Best Quartile of small-cap objective funds on a risk-adjusted basis, as shown by its Sharpe ratio. In addition, the Fund’s volatility ranked within the Best Quartile of small-cap objective funds, while the Fund also produced lower volatility than the Russell 2000. | |||
DOWN MARKET PERFORMANCE COMPARISON | |||
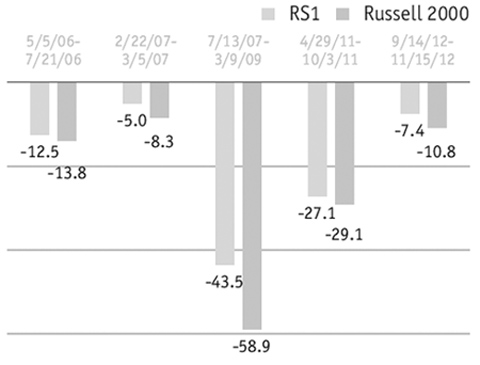 | |||
| The Royce Funds 2012 Annual Report to Shareholders | 15 |
| Royce Select Fund II |
AVERAGE ANNUAL TOTAL RETURNS Through 12/31/12 | ||||||||||
| July–December 20121 | 7.94 | % | ||||||||
| One-Year | 13.77 | |||||||||
| Three-Year | 5.77 | |||||||||
| Five-Year | 5.60 | |||||||||
| Since Inception (6/30/05) | 6.39 | |||||||||
| ANNUAL EXPENSE RATIO | ||||||||||
| Gross Operating Expenses | 2.76 | % | ||||||||
| Net Operating Expenses | 1.68 | |||||||||
| 1 Not annualized | ||||||||||
| CALENDAR YEAR TOTAL RETURNS | ||||||||||
| Year | RS2 | Year | RS2 | |||||||
| 2012 | 13.8 | % | 2008 | -33.4 | % | |||||
| 2011 | -14.0 | 2007 | -5.5 | |||||||
| 2010 | 21.0 | 2006 | 19.8 | |||||||
| 2009 | 66.6 | |||||||||
| TOP 10 POSITIONS % of Net Assets | ||||||||||
| Helmerich & Payne | 2.9 | % | ||||||||
| Teradyne | 2.4 | |||||||||
| Value Partners Group | 2.4 | |||||||||
| Photronics | 2.2 | |||||||||
| Bankrate | 2.1 | |||||||||
| Abercrombie & Fitch Cl. A | 2.0 | |||||||||
| Signet Jewelers | 1.9 | |||||||||
| Super Micro Computer | 1.9 | |||||||||
| Computer Task Group | 1.9 | |||||||||
| Minth Group | 1.9 | |||||||||
| SHORT POSITIONS % of Net Assets | ||||||||||
| iShares Barclays 20+ Year Treasury Bond Fund | -1.3 | % | ||||||||
| ProShares UltraShort QQQ | -1.2 | |||||||||
| ProShares UltraShort MSCI Emerging Markets | -1.1 | |||||||||
| ProShares UltraShort Oil & Gas | -1.1 | |||||||||
| ProShares UltraShort FTSE China 25 | -1.0 | |||||||||
| Direxion Daily Natural Gas Related Bear 3X Shares | -1.0 | |||||||||
| ProShares Short MSCI Emerging Markets | -0.2 | |||||||||
| PORTFOLIO SECTOR BREAKDOWN1 % of Net Assets | ||||||||||
| Information Technology | 34.8 | % | ||||||||
| Consumer Discretionary | 16.0 | |||||||||
| Industrials | 10.9 | |||||||||
| Financials | 10.4 | |||||||||
| Materials | 9.1 | |||||||||
| Energy | 7.6 | |||||||||
| Health Care | 4.8 | |||||||||
| Consumer Staples | 0.8 | |||||||||
| Miscellaneous | 2.6 | |||||||||
| Cash and Cash Equivalents | 3.0 | |||||||||
| 1 Long positions only | ||||||||||
 |
Manager’s Discussion Macro events loomed large over the market in 2012, with investors contending with matters such as eurozone debt, Hurricane Sandy, elections in the U.S. and elsewhere, and the fiscal cliff. The market also responded in a generally favorable fashion to the various stimulus actions taken by the Federal Reserve. In this context, we were very pleased with the absolute result for Royce Select Fund II (RS2) even as it lagged its small-cap benchmarks. The Fund was up 13.8% in 2012, trailing its two benchmarks, the Russell 2000 Index and the Russell Global Small Cap Index, which posted respective calendar-year gains of 16.3% and 17.7%. (The Fund has the ability to invest in U.S. and/or foreign securities, and since May 1, 2011 there has been no limit to its foreign exposure. As such, we introduced the Russell Global Small Cap Index as an additional benchmark. At the end of 2012, 35.8% of the Fund’s net assets were held in non-U.S. investments.) A bull run kicked off after small-caps reached a low on October 3, 2011. The rally lasted through most of 2012’s opening quarter, with small-cap reaching its first-half high on March 26. In the opening quarter of 2012 RS2 rose 11.7% while the Russell 2000 was up 12.4% and the Russell Global Small Cap climbed 13.7%. Share prices began to fall following the late March high, making the second quarter a bearish period fueled by fear of European debt and the speed of growth in the U.S. and Chinese economies. For the second quarter RS2 fell further behind its domestic benchmark, losing 5.6% compared to a 3.5% decline for the Russell 2000. However, RS2 did beat the Russell Global Small Cap, which declined 6.7% for the same period. While the rally that brightened the summer months was a positive for stocks as a whole, the Fund was unable to gain ground on either benchmark during the third quarter. Between the beginning of July and the end of September, RS2 gained 3.8% versus 5.3% for the Russell 2000 and 7.1% for its global benchmark. The final quarter was more volatile, though most small-caps finished the quarter with slight gains. RS2 gained 4.0% in the fourth quarter, ahead of the 1.9% gain for the Russell 2000 and the 3.6% increase for the Russell Global Small Cap. Longer-term |
| 16 | The Royce Funds 2012 Annual Report to Shareholders |
Performance and Portfolio Review |
| results were also better. The Fund outperformed each benchmark for the five-year and since inception (6/30/05) periods ended December 31, 2012. For the calendar year all of the Fund’s nine equity sectors were positive. Consumer Discretionary led all sectors by a considerable margin, spurred by very strong results in the specialty retail industry. This group made a larger contribution to returns than any of the portfolio’s other sectors. We initiated a position in clothing retailer Abercrombie & Fitch in June 2012 and were pleased to see its share price climb quickly in November when the firm announced better-than-expected results. The company operates more than 1,000 stores under its own name as well as Hollister and Gilly Hicks. Charming Shoppes is the largest plus-size retailer of women’s clothing in the U.S. After announcing plans in early December 2011 to conduct a strategic financial review, the firm was acquired by Ascena Retail Group in June. The Information Technology sector was also a key contributor to performance for the period. Three of that sector’s industries—computers & peripherals, semiconductors & semiconductor equipment, and internet software & services—were the Fund’s second-, third-, and fourth-best performing groups in 2012. Western Digital, a Lake Forest, California based company founded in 1970, manufactures storage products for the creation, management, and preservation of digital content. The company is benefiting from its leading market share in the Hard Disk Drive (HDDs) industry and the continued recovery in the enterprise segment. We reduced our position at various points throughout the year. The top two detractors to performance during 2012 were Chinese companies in the otherwise stalwart Information Technology sector that encountered difficulties that we ultimately saw as more long-lasting than we would prefer. Comba Telecom System is one of the leading wireless coverage solution providers in China, specializing in products that enhance the coverage of mobile networks. The company has been consistently under pressure due to year over year declines in capital expenditures from China Mobile and increased competition. Our take earlier in the year was that it could successfully weather these storms, but further declines in its share price led us to reevaluate. We sold our position between July and November. China High Precision Automation Group produces a wide range of industrial and technological equipment including display, measuring, and electrical power instruments, as well as industrial automation and control adjustment instruments. We sold our shares in early August after its shares plummeted 63% following an accounting review. |
 |
| Includes reinvestment of distributions. |
| PORTFOLIO DIAGNOSTICS | |||||
| Fund Net Assets | $4 million | ||||
| Number of Holdings | 87 | ||||
| Turnover Rate | 123% | ||||
| Average Market Capitalization1,4 | $1,014 million | ||||
| Weighted Average P/E Ratio2,3,4 | 13.7x | ||||
| Weighted Average P/B Ratio2,4 | 1.8x | ||||
| Symbol | RSFDX | ||||
1 Geometric Average. This weighted calculation uses each portfolio holding’s market cap in a way designed to not skew the effect of very large or small holdings; instead, it aims to better identify the portfolio’s center, which Royce believes offers a more accurate measure of average market cap than a simple mean or median. | |||||
2 Harmonic Average. This weighted calculation evaluates a portfolio as if it were a single stock and measures it overall. It compares the total market value of the portfolio to the portfolio’s share in the earnings or book value, as the case may be, of its underlying stocks. | |||||
3 The Fund’s P/E calculation excludes ETF’s and companies with zero or negative earnings (11% of portfolio holdings as of 12/31/12). | |||||
| MORNINGSTAR STATISTICAL MEASURES1 | |||||
| Sharpe Ratio | Standard Deviation | ||||
| RS2 | 0.33 | 25.08 | |||
| Russell 2000 | 0.25 | 24.55 | |||
| Category Median | 0.24 | 24.07 | |||
| Best Quartile Breakpoint | 0.30 | 22.94 | |||
1 Five years ended 12/31/12. Category Median and Best Quartile Breakpoint based on 353 small-cap objective funds (oldest class) with at least five years of history. | |||||
The Fund beat the Russell 2000 and performed within the Best Quartile of small-cap objective funds on a risk-adjusted basis, as shown by its Sharpe ratio. | |||||
| PORTFOLIO COUNTRY BREAKDOWN1,2 % of Net Assets | |||||
| United States | 61.2% | ||||
| China | 6.8 | ||||
| Hong Kong | 6.3 | ||||
| Canada | 6.1 | ||||
| United Kingdom | 3.8 | ||||
1 Represents countries that are 3% or more of net assets. | |||||
2 Long positions only are represented above and except in the case of ETF’s securities are categorized by the country of their headquarters. | |||||
DOWN MARKET PERFORMANCE COMPARISON All Down Periods of 7.5% or Greater in Percentages (%) 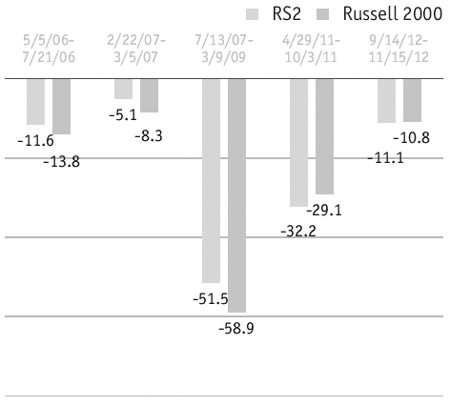 | |||||
| The Royce Funds 2012 Annual Report to Shareholders | 17 |
| Royce Global Select Long/Short Fund | (Formerly Royce Global Select Fund) | |
AVERAGE ANNUAL TOTAL RETURNS Through 12/31/12 | ||||||||||
| July–December 20121 | 10.29 | % | ||||||||
| One-Year | 14.02 | |||||||||
| Three-Year | 7.69 | |||||||||
| Five-Year | 5.05 | |||||||||
| Since Inception (6/30/05) | 10.56 | |||||||||
| ANNUAL EXPENSE RATIO | ||||||||||
| Gross Operating Expenses | 1.76 | % | ||||||||
| Net Operating Expenses | 1.65 | |||||||||
| 1 Not annualized | ||||||||||
| CALENDAR YEAR TOTAL RETURNS | ||||||||||
| Year | RGS | Year | RGS | |||||||
| 2012 | 14.0 | % | 2008 | -34.4 | % | |||||
| 2011 | -17.8 | 2007 | 18.2 | |||||||
| 2010 | 33.2 | 2006 | 19.4 | |||||||
| 2009 | 56.1 | |||||||||
| TOP 10 LONG POSITIONS % of Net Assets | ||||||||||
| Semperit AG Holding | 3.1 | % | ||||||||
| Mayr-Melnhof Karton | 3.1 | |||||||||
| Helmerich & Payne | 2.9 | |||||||||
| Recordati | 2.9 | |||||||||
| Ashmore Group | 2.8 | |||||||||
| FamilyMart | 2.4 | |||||||||
| USS | 2.2 | |||||||||
| Jupiter Fund Management | 2.2 | |||||||||
| Domino Printing Sciences | 2.2 | |||||||||
| MegaStudy | 2.1 | |||||||||
| TOP 10 SHORT POSITIONS % of Net Assets | ||||||||||
| ProShares Ultra Health Care | -2.2 | % | ||||||||
| Direxion Daily Emerging Markets Bull 3X Shares | -2.1 | |||||||||
| iShares MSCI Japan Index Fund | -2.0 | |||||||||
| iShares MSCI Canada Index Fund | -1.6 | |||||||||
| Deluxe Corporation | -1.5 | |||||||||
| United Rentals | -1.4 | |||||||||
| Direxion Daily Energy Bull 3X Shares | -1.3 | |||||||||
| Monster Beverage | -1.3 | |||||||||
| Direxion Daily Gold Miners Bull 3X Shares | -1.2 | |||||||||
| Accenture Cl. A | -1.1 | |||||||||
| PORTFOLIO SECTOR BREAKDOWN1 % of Net Assets | ||||||||||
| Industrials | 17.6 | % | ||||||||
| Materials | 17.6 | |||||||||
| Consumer Discretionary | 15.1 | |||||||||
| Financials | 11.9 | |||||||||
| Health Care | 9.1 | |||||||||
| Energy | 7.7 | |||||||||
| Consumer Staples | 6.9 | |||||||||
| Information Technology | 5.4 | |||||||||
| Cash and Cash Equivalents | 8.7 | |||||||||
| 1 Long positions only | ||||||||||
 | |||||||||
Manager’s Discussion Royce Global Select Long/Short Fund (RGS) gained 14.0% in 2012, lagging the Russell Global Small Cap Index, which was up 17.7%. The Fund’s benchmark is long only. In contrast, the Fund finished 2012 with 91.3% of our net assets invested long in common stocks, 8.7% in cash and cash equivalents, and 30.6% in short positions. In this context we were quite pleased with RGS’s calendar-year performance and note that its short exposure, which was a weak spot for the Fund in 2012, is meant in part to provide a measure of downside protection for times when the markets are less bullish. During the dynamic first quarter the Fund gained 12.7%, trailing its benchmark, which rose 13.7%. Concerns about European sovereign debt, the fragility of the U.S. economic recovery, and the slowing pace of growth in China all pressured global share prices in the second quarter. The Fund lost ground to its benchmark during the year’s bearish spring and early summer months due largely to the share price collapse of a long-held investment that became the top detractor in 2012—a long position in Lamprell. RGS fell 8.3% during the second quarter versus a decline of 6.7% for its benchmark. Global markets reversed in the third quarter after news came out of Europe in late June that more definitive action would be taken to shore up the finances of troubled Spain and Italy. However, the Fund’s shorts created a drag on third-quarter results as its 6.3% gain lagged its long-only benchmark’s increase of 7.1%. The pace of the rally slackened in the fourth quarter, though small-cap share prices in general continued to climb. RGS was up 3.8% in the fourth quarter versus a gain of 3.6% for the Russell Global Small Cap. From the June low through the end of December, RGS was up 14.4% compared to 18.8% for the benchmark. By contrast, RGS beat its benchmark for the longer-term five-year and since inception (6/30/05) periods ended December 31, 2012. The Fund’s average annual total return since inception was 10.6%. In addition to strength from long investments located in Japan, Mexico, Brazil, Australia, and Hong Kong, the Fund enjoyed success with several European long holdings. While many observers seem to have written Europe off thanks to its debt and currency issues, we see a more nuanced picture. One can almost color in a map of corporate Europe by the strength of balance sheets with the U.K. and the area north of the Alps (in particular Switzerland, Germany, France, Scandinavia, and northern Italy) showing both strong corporate balance | |||||||||
| 18 | The Royce Funds 2012 Annual Report to Shareholders |
Performance and Portfolio Review sheets and relatively resilient economies, while most of the bad news has been coming from peripheral markets such as Greece, Spain, Portugal and Ireland. The bulk of our European long investments have been in the former group, and we see many companies in those areas that we think can continue to flourish and create value as they did in 2012. Eight of the Fund’s nine equity sectors finished the year with net gains while net losses in the Diversified Investment Companies sector were modest. Materials led all sectors by a wide margin, though notable net gains also came from Industrials, Financials, Health Care, and Information Technology. London-based asset manager Jupiter Fund Management, RGS’s top performer in 2012, manages funds for retail and institutional investors; better-than-expected inflows helped its shares to climb, and we began to reduce our position in September. Japan’s Moshi Moshi Hotline operates call centers and offers back office services. After its stock soared in early August when the company significantly raised its consolidated mid-year outlook, we trimmed our position. Shares in Brazil’s Grendene, one of the world’s most profitable shoemakers, more than doubled in 2012 versus a flat Brazilian stock market, helping the Fund’s performance almost as much as Moshi Moshi Hotline. Top 2012 detractor Lamprell refurbishes offshore drilling rigs. It had been a long-time positive contributor to the Fund, but its share price fell dramatically in May when the company issued a profit warning—(the first of an eventual five in 2012)—after it encountered supply-chain problems stemming from its foray into an untested business line of building new rigs. Concluding that the new-build business line was structurally unattractive and a hindrance to managing the company as well as it had been before, we sold our investment in June. We initially thought that a recovery was possible for number-two detractor Li Ning, China’s largest sportswear maker and retailer, which led us to add shares in the first half. However, we sold our shares after the firm’s founder engaged in an inter-company transaction that we regarded as counter to the interests of minority shareholders. Lastly, a short position in ProShares Ultra Health Care—a hedge against that sector—was unprofitable in a generally strong year for many Health Care stocks, including the Fund’s own long positions in that sector. |
 |
| Includes reinvestment of distributions. | |||
| PORTFOLIO DIAGNOSTICS | |||
| Fund Net Assets | $21 million | ||
| Number of Holdings | 86 | ||
| Turnover Rate | 77% | ||
| Average Market Capitalization1,4 | $1,586 million | ||
| Weighted Average P/E Ratio2,3,4 | 13.1x | ||
| Weighted Average P/B Ratio2,4 | 2.0x | ||
| Symbol | RSFTX | ||
1 Geometric Average. This weighted calculation uses each portfolio holding’s market cap in a way designed to not skew the effect of very large or small holdings; instead, it aims to better identify the portfolio’s center, which Royce believes offers a more accurate measure of average market cap than a simple mean or median. | |||
2 Harmonic Average. This weighted calculation evaluates a portfolio as if it were a single stock and measures it overall. It compares the total market value of the portfolio to the portfolio’s share in the earnings or book value, as the case may be, of its underlying stocks. | |||
| MORNINGSTAR STATISTICAL MEASURES1 | |||
| Sharpe Ratio | Standard Deviation | ||
| RGS | 0.32 | 22.88 | |
| Russell Global Small Cap | 0.12 | 24.57 | |
| Category Median | 0.12 | 24.51 | |
| Best Quartile Breakpoint | 0.25 | 22.93 | |
1 Five years ended 12/31/12. Category Median and Best Quartile Breakpoint based on 21 world stock small-cap objective funds (oldest class) with at least five years of history. | |||
The Fund beat the Russell Global Small Cap and performed within the Best Quartile of world stock small-cap objective funds on a risk-adjusted basis, as shown by its Sharpe ratio. In addition, the Fund’s volatility ranked within the Best Quartile of world stock small-cap objective funds, while the Fund also produced lower volatility than the Russell Global Small Cap. | |||
| PORTFOLIO COUNTRY BREAKDOWN1,2 % of Net Assets | |||
| United Kingdom | 12.7% | ||
| Japan | 11.4 | ||
| United States | 8.8 | ||
| Austria | 6.2 | ||
| Hong Kong | 5.5 | ||
| Germany | 5.4 | ||
| Mexico | 5.2 | ||
| South Africa | 4.9 | ||
| Switzerland | 3.4 | ||
1 Represents countries that are 3% or more of net assets. | |||
2 Long positions only are represented above and, except in the case of ETF’s, securities are categorized by the country of their headquarters. | |||
| The Royce Funds 2012 Annual Report to Shareholders | 19 |
| Royce Enterprise Select Fund (Formerly Royce SMid-Cap Select Fund) |
| AVERAGE ANNUAL TOTAL RETURNS Through 12/31/12 | ||||||||||
| July–December 20121 | 9.37 | % | ||||||||
| One-Year | 15.68 | |||||||||
| Three-Year | 10.93 | |||||||||
| Five-Year | 4.59 | |||||||||
| Since Inception (9/28/07) | 4.47 | |||||||||
| ANNUAL EXPENSE RATIO | ||||||||||
| Gross Operating Expenses | 4.24 | % | ||||||||
| Net Operating Expenses | 1.25 | |||||||||
| 1 Not annualized | ||||||||||
| CALENDAR YEAR TOTAL RETURNS | ||||||||||
| Year | RSS | Year | RSS | |||||||
| 2012 | 15.7 | % | 2009 | 23.1 | % | |||||
| 2011 | 0.7 | 2008 | -25.5 | |||||||
| 2010 | 17.2 | |||||||||
| TOP 10 POSITIONS % of Net Assets | ||||||||||
| Alleghany Corporation | 3.8 | % | ||||||||
| PerkinElmer | 3.0 | |||||||||
| Leucadia National | 2.8 | |||||||||
| Garmin | 2.8 | |||||||||
| Moody’s Corporation | 2.8 | |||||||||
| Cabot Corporation | 2.5 | |||||||||
| Reliance Steel & Aluminum | 2.5 | |||||||||
| Kennametal | 2.5 | |||||||||
| Valmont Industries | 2.4 | |||||||||
| Myriad Genetics | 2.3 | |||||||||
| PORTFOLIO SECTOR BREAKDOWN % of Net Assets | ||||||||||
| Industrials | 18.2 | % | ||||||||
| Financials | 13.9 | |||||||||
| Consumer Discretionary | 13.3 | |||||||||
| Information Technology | 11.2 | |||||||||
| Materials | 10.2 | |||||||||
| Health Care | 9.7 | |||||||||
| Energy | 2.3 | |||||||||
| Utilities | 1.4 | |||||||||
| Miscellaneous | 1.3 | |||||||||
| Cash and Cash Equivalents | 18.5 | |||||||||
 |
Manager’s Discussion Royce Enterprise Select Fund (RSS), formerly known as Royce SMid-Cap Select Fund, focuses on mid-cap issues and the larger end of the small-cap asset class. The Fund posted a terrific absolute return for the calendar year, although it trailed its small-cap and mid-cap benchmark by a modest margin. The Fund gained 15.7% in 2012 compared to the Russell 2500 Index, which climbed 17.9% for the same period. In a similar fashion to the first halves of 2011 and 2010, the first six months of 2012 saw a highly volatile market as investors shifted quickly from confidence in equities to deep pessimism over the European debt crisis, the waning strength of emerging market economies—China and Brazil especially—and the muted and unpredictable rate of growth in the U.S. During the first quarter of 2012, investors were decidedly bullish. The Fed’s third round of quantitative easing, dubbed Operation Twist, debuted in the fall of 2011 and combined with solid corporate earnings helped to boost equity returns into the first quarter of 2012. RSS increased 11.6% in 2012’s opening quarter compared to the Russell 2500’s 13.0% gain. In the second quarter, the market retreated as spring began, creating losses for most stocks and market indexes. For the quarter RSS lost 5.3%, again trailing its benchmark, which lost 4.1%. True to its bipolar nature of late, the market then began a second solid rally following the June 4, 2012 small-cap low. For the third quarter, the Fund largely kept pace with its benchmark, gaining 5.1% compared to the index’s 5.6% increase. The fourth quarter saw the bull move diminish somewhat, with October showing negative results for most stocks. We were therefore pleased to see the Fund maintain its outperformance over the second half. For the fourth quarter RSS gained 4.1% versus 3.1% for the Russell 2500. Although we were disappointed that the Fund trailed its benchmark in 2012, we continue to believe strongly that our bottom-up, fundamentally focused approach can achieve robust absolute long-term results. We remain disciplined value investors with a relentless emphasis on managing risk and anticipate that such an approach can ultimately be successful. In addition, we continue to be focused on what we believe are high-quality businesses capable of generating high returns on invested capital that also possess superior balance sheets. We were also pleased that for the period ended December 31, 2012 RSS outperformed the Russell 2500 for the five-year and since inception (9/28/07) time frames. |
| 20 | The Royce Funds 2012 Annual Report to Shareholders |
Performance and Portfolio Review |
| The Industrials sector was the Fund’s top contributor in 2012 by a hefty margin. We benefited from its overweight position versus the benchmark as well as strong stock selection. Materials and Information Technology also made healthy contributions to returns in a calendar year that saw seven of the Fund’s eight equity sectors contribute positively. Energy was the only notable weak spot as overcapacity in energy services combined with sliding natural gas prices. At the industry level, net gains could be found in several groups, though machinery and electrical equipment were particularly impressive. Not surprisingly, energy equipment & services detracted most, followed by communications equipment and semiconductors & semiconductor equipment, though net losses in each group were comparatively small. The Fund’s largest individual detractor came from the Energy sector. We have long been attracted to Trican Well Service by its growing business, talented management, and pristine balance sheet. The company provides specialized equipment and services for the drilling, completion, and reworking of oil and gas wells. While the firm continued to execute successfully in its native Canada, it met with issues in some of its U.S. activities, an increase in raw materials costs, and persistently low natural gas prices. We continue to have a high opinion of this specialized equipment and service provider. While confident that an improved energy market will ultimately rekindle investor interest in the company’s prospects, we finished selling our position in early January 2013 as we saw more intriguing opportunities elsewhere. Between September and November we also sold our stake in International Rectifier, which makes power semiconductors. Declining revenues and a falling stock price prompted our decision to sell. Stella-Jones leapt to the top of the performance charts by performing well later in the year. This Canadian manufacturer of industrial structures and support components produced from pressure treated wood was a strong gainer as demand for railroad ties surged from Class 1 railroad companies. Hurricane Sandy provided another boost as damage to electrical infrastructure led to strong orders for utility poles. Hubbell was another solid gainer from the Industrials sector as this maker of electronic products for a broad range of commercial, industrial, and residential applications delivered excellent financial results with particular strength in residential lighting and construction driven by the improving U.S. housing market. Moody’s Corporation provides credit ratings, research, and risk analysis. Its shares were helped by strong credit markets and a brisk market for bond issuance, many of which receive their ratings from Moody’s. |
 |
| Includes reinvestment of distributions. |
| PORTFOLIO DIAGNOSTICS | |||||
| Fund Net Assets | $1 million | ||||
| Number of Holdings | 62 | ||||
| Turnover Rate | 127% | ||||
| Average Market Capitalization1 | $4,072 million | ||||
| Weighted Average P/E Ratio2,3 | 15.0x | ||||
| Weighted Average P/B Ratio2 | 2.0x | ||||
| U.S. Investments (% of Net Assets) | 71.7% | ||||
| Non-U.S. Investments (% of Net Assets) | 9.8% | ||||
| Symbol | RMISX | ||||
1 Geometric Average. This weighted calculation uses each portfolio holding’s market cap in a way designed to not skew the effect of very large or small holdings; instead, it aims to better identify the portfolio’s center, which Royce believes offers a more accurate measure of average market cap than a simple mean or median. | |||||
2 Harmonic Average. This weighted calculation evaluates a portfolio as if it were a single stock and measures it overall. It compares the total market value of the portfolio to the portfolio’s share in the earnings or book value, as the case may be, of its underlying stocks. | |||||
3 The Fund’s P/E calculation excludes companies with zero or negative earnings (2% of portfolio holdings as of 12/31/12). | |||||
| MORNINGSTAR STATISTICAL MEASURES1 | |||||
| Sharpe Ratio | Standard Deviation | ||||
| RSS | 0.33 | 16.98 | |||
| Russell 2500 | 0.28 | 23.67 | |||
| Category Median | 0.22 | 22.62 | |||
| Best Decile Breakpoint | 0.36 | 19.60 | |||
1 Five years ended 12/31/12. Category Median and Best Decile Breakpoint based on 364 mid-cap objective funds (oldest class) with at least five years of history. | |||||
The Fund beat the Russell 2500 and performed within the top 50% of mid-cap objective funds on a risk-adjusted basis, as shown by its Sharpe ratio. In addition, the Fund’s volatility ranked within the Best Decile of mid-cap objective funds, while the Fund also produced lower volatility than the Russell 2500. | |||||
| The Royce Funds 2012 Annual Report to Shareholders | 21 |
| Royce Opportunity Select Fund |
| AVERAGE ANNUAL TOTAL RETURNS Through 12/31/12 | ||||||||||
| July–December 20121 | 15.76 | % | ||||||||
| One-Year | 35.14 | |||||||||
| Since Inception (8/31/10) | 17.41 | |||||||||
| ANNUAL EXPENSE RATIO | ||||||||||
| Gross Operating Expenses | 2.83 | % | ||||||||
| Net Operating Expenses | 1.44 | |||||||||
| 1 Not annualized | ||||||||||
| CALENDAR YEAR TOTAL RETURNS | ||||||||||
| Year | ROS | Year | ROS | |||||||
| 2012 | 35.1 | % | 2011 | -17.1 | % | |||||
| TOP 10 LONG POSITIONS % of Net Assets | ||||||||||
| Exar Corporation | 3.1 | % | ||||||||
| BofI Holding | 2.6 | |||||||||
| Standard Pacific | 2.6 | |||||||||
| US Silica Holdings | 2.5 | |||||||||
| Ultratech | 2.3 | |||||||||
| Kratos Defense & Security Solutions | 2.3 | |||||||||
| Newpark Resources | 2.2 | |||||||||
| Builders FirstSource | 2.2 | |||||||||
| Hercules Offshore | 2.1 | |||||||||
| Radian Group | 2.1 | |||||||||
| TOP 10 SHORT POSITIONS % of Net Assets | ||||||||||
| Fresh Market | -2.6 | % | ||||||||
| Atlas Air Worldwide Holdings | -1.4 | |||||||||
| Cabot Corporation | -1.2 | |||||||||
| Rent-A-Center | -1.1 | |||||||||
| ANN | -1.1 | |||||||||
| Koppers Holdings | -0.8 | |||||||||
| Stamps.com | -0.8 | |||||||||
| Worthington Industries | -0.6 | |||||||||
| Spirit Airlines | -0.6 | |||||||||
| Bravo Brio Restaurant Group | -0.4 | |||||||||
| PORTFOLIO SECTOR BREAKDOWN1 % of Net Assets | ||||||||||
| Information Technology | 27.8 | % | ||||||||
| Industrials | 15.5 | |||||||||
| Consumer Discretionary | 14.5 | |||||||||
| Energy | 12.1 | |||||||||
| Financials | 9.4 | |||||||||
| Materials | 8.6 | |||||||||
| Miscellaneous | 3.1 | |||||||||
| Cash and Cash Equivalents | 9.0 | |||||||||
| 1 Long positions only | ||||||||||
 | |||||||||
Manager’s Discussion Royce Opportunity Select Fund made the most of its buying and selling opportunities in the calendar year with a truly impressive showing. The Fund gained 35.1% in 2012, well ahead of its small-cap benchmark, the Russell 2000 Index, which was up 16.3% for the same period. We were particularly happy that the Fund outpaced its benchmark during the year’s bullish and bearish periods. The former is something that we would typically expect, though the portfolio’s down market strength felt equally rewarding. The upturn that began off the October 2011 small-cap low lasted through March 26, 2012—that is, through most of 2012’s first quarter—a period in which ROS was up 18.1% compared to a 12.4% increase for the benchmark. Anxieties soon returned to the markets, centered on European sovereign debt and the strength of the U.S. and Chinese economies. This had the effect of driving stock prices down through April and May, with small-caps reaching a low for the year on June 4. During the bearish second quarter ROS effectively held its value, losing 1.1% versus a decline of 3.5% for the Russell 2000. Following the early June low, share prices mostly increased into mid-September, though certain small-cap stocks continued to climb through the end of the year. This made the second half less volatile and, for some companies, equally or slightly more bullish than the first. For the third quarter ROS gained 5.2%, essentially even with the small-cap index’s 5.3% increase. The fourth quarter was more volatile, but a strong December helped to keep most small-cap results in the black. The Fund climbed 10.0% in the year’s final quarter, easily beating the Russell 2000, which was up 1.9% for the same period. Since the Fund’s inception on August 31, 2010, we have focused on long-term opportunities in companies that appeared to be hitting a low point in their business cycle and/or were going through earnings disappointments. Our reasoning was that many of these businesses could benefit from a resumption in business activity and by extension a pick-up in earnings-driven growth. In most cases we anticipated that these companies would rebound at some point in 2012, and we were pleased that this was largely how events played out. ROS outperformed the Russell 2000 for the one- and two-year periods ended December 31, 2012 while also being very close to the small-cap index for the since inception period, in which the Russell 2000 was up 17.5%. The Fund’s average annual total return since inception was 17.4%. | |||||||||
| 22 | The Royce Funds 2012 Annual Report to Shareholders |
Performance and Portfolio Review While there continues to be great uncertainty and the pace of growth remains fairly muted, it is important to remember that the economy is nonetheless expanding. Moreover, certain resurgent areas were particularly strong in 2012, such as housing, automobiles, and many consumer areas. The market rewarded these industries over the last 12 months as many investors, flush with liquidity thanks to record low interest rates, were hungry for growth. The portfolio was well positioned to benefit from these developments, enjoying particular success with holdings related to housing. Contributions came from companies that ranged from builders to mortgage businesses. Ellie Mae provides business automation software for the mortgage industry that helps to speed up the application process and make it cheaper. It provides a great example of the good things that tend to happen when companies consistently exceed earnings expectations. We took gains in the second half. A rising stock price also led us to reduce our position in Standard Pacific, a California-based homebuilder. The company is strong in its home state and also in recent high-growth areas such as Texas, Colorado, and Arizona. Also benefiting from the resurgent housing market was chemical and building products company Georgia Gulf. Its business reaped a benefit from lower natural gas prices, as gas is used as a chemical feedstock. An improved cost structure also helped the business to operate more efficiently. We began to reduce our position in January and sold the last of our shares in April. Other investors seemed to be anticipating a quicker turnaround than we thought was possible for multi-line retailer J.C. Penney Company. With its shares looking very overpriced to us early in 2012, we began to short the stock. In June and July, we covered our position at a hefty gain. SUPERVALU was the opposite situation—a long position in a potential turnaround that by the end of December had still not reversed its misfortunes. We were drawn to its solid business operating pharmacies and supermarkets and attractive cash-flow characteristics, reasoning that these could help its business to recover. Events in early July then forced us to reconsider our analysis. We still see the potential for a turnaround, but a tough pricing environment and dismal sales led us to take our losses and move on. Our experience with Michael Kors Holdings was disappointing in that shares that looked expensive to us when we first took a short position continued to climb into the fall. We covered our short positions at net losses between August and September. |
 |
| Includes reinvestment of distributions. | |||
| PORTFOLIO DIAGNOSTICS | |||
| Fund Net Assets | $3 million | ||
| Number of Holdings | 83 | ||
| Turnover Rate | 196% | ||
| Average Market Capitalization1,3 | $613 million | ||
| Weighted Average P/B Ratio2,3 | 1.3x | ||
| U.S. Investments3 (% of Net Assets) | 86.3% | ||
| Non-U.S. Investments3 (% of Net Assets) | 4.7% | ||
| Symbol | ROSFX | ||
1 Geometric Average. This weighted calculation uses each portfolio holding’s market cap in a way designed to not skew the effect of very large or small holdings; instead, it aims to better identify the portfolio’s center, which Royce believes offers a more accurate measure of average market cap than a simple mean or median. | |||
2 Harmonic Average. This weighted calculation evaluates a portfolio as if it were a single stock and measures it overall. It compares the total market value of the portfolio to the portfolio’s share in the earnings or book value, as the case may be, of its underlying stocks. | |||
| The Royce Funds 2012 Annual Report to Shareholders | 23 |
| Royce Financial Services Fund |
| AVERAGE ANNUAL TOTAL RETURNS Through 12/31/12 | ||||||||||
| July–December 20121 | 11.54 | % | ||||||||
| One-Year | 20.72 | |||||||||
| Three-Year | 8.25 | |||||||||
| Five-Year | 1.61 | |||||||||
| Since Inception (12/11/03) | 5.81 | |||||||||
| ANNUAL EXPENSE RATIO | ||||||||||
| Gross Operating Expenses | 1.89 | % | ||||||||
| Net Operating Expenses | 1.54 | |||||||||
| 1 Not annualized | ||||||||||
| CALENDAR YEAR TOTAL RETURNS | ||||||||||
| Year | RFS | Year | RFS | |||||||
| 2012 | 20.7 | % | 2007 | -4.7 | % | |||||
| 2011 | -11.3 | 2006 | 24.8 | |||||||
| 2010 | 18.5 | 2005 | 12.2 | |||||||
| 2009 | 32.1 | 2004 | 15.1 | |||||||
| 2008 | -35.4 | |||||||||
| TOP 10 POSITIONS % of Net Assets | ||||||||||
| Jupiter Fund Management | 2.9 | % | ||||||||
| SEI Investments | 2.5 | |||||||||
| Northern Trust | 2.5 | |||||||||
| AllianceBernstein Holding L.P. | 2.4 | |||||||||
| Ashmore Group | 2.4 | |||||||||
| State Street | 2.4 | |||||||||
| Apollo Global Management LLC Cl. A | 2.3 | |||||||||
| Invesco | 2.1 | |||||||||
| MasterCard Cl. A | 2.0 | |||||||||
| Air Lease Cl. A | 2.0 | |||||||||
| PORTFOLIO INDUSTRY BREAKDOWN % of Net Assets | ||||||||||
| Capital Markets | 60.1 | % | ||||||||
| Insurance | 9.0 | |||||||||
| Diversified Financial Services | 7.7 | |||||||||
| Consumer Finance | 3.6 | |||||||||
| IT Services | 3.3 | |||||||||
| Commercial Banks | 3.0 | |||||||||
| Trading Companies & Distributors | 2.0 | |||||||||
| Software | 1.8 | |||||||||
| Media | 1.7 | |||||||||
| Professional Services | 1.7 | |||||||||
| Real Estate Management & Development | 1.6 | |||||||||
| Closed-End Funds | 0.9 | |||||||||
| Cash and Cash Equivalents | 3.6 | |||||||||
|
Manager’s Discussion The stocks of financial companies exhibited strong performance as a whole in 2012, as did Royce Financial Services Fund (RFS) on an absolute and relative basis. The Fund finished 2012 with a gain of 20.7%, besting both its small-cap benchmark, the Russell 2000 Index, which rose 16.3%, and the Russell 2500 Financial Services Index, which climbed 20.2% for the same period. A rally started for small-cap stocks following their 2011 low on October 3. Initially the Fund lagged, underperforming in 2011’s fourth quarter, although its performance was strong on an absolute basis. The first quarter of 2012 saw a welcome reversal of this trend as RFS climbed 15.4%, ahead of both the Russell 2000, which rose 12.4%, and the financial services component of the Russell 2500, which was up 12.5%. The second quarter was characterized by a market that grew progressively more bearish through the first week of June, with May showing the worst losses—during April and May the Russell 2000 fell 8.1%, RFS lost 10.0%, and the financial services companies in the Russell 2500 slipped a more modest 4.4%. For the second quarter as a whole the Fund fell 6.2% compared to respective declines of 3.5% and 0.2% for the benchmark and the Russell 2500 Financial Services Index. RFS’s second half-performance was both more impressive and less dramatic. Following the June 4, 2012 small-cap low, a rally added heat to the summer months. As was the case in 2012’s first quarter, the Fund acquitted itself well on an absolute and relative basis between the ends of June and September, outperforming both the small-cap index and the financial services index. For the third quarter, RFS gained 6.6% versus 5.3% for the Russell 2000 and 4.5% for the Russell 2500 Financial Services Index. The fourth quarter added some additional headwinds in the form of Hurricane Sandy, the elections, the looming fiscal cliff, and the initiation of a fourth round of monetary stimulus in mid-December. The combination made for a more unsettled period for stocks as a whole in which RFS gained 4.6% compared to respective increases of 1.9% for the Russell 2000 and 2.5% for the Russell 2500 Financial Services Index. For the second half as a whole, RFS climbed 11.5% versus 7.2% for its small-cap benchmark and 7.1% for the financial services component of the Russell 2500. |
| 24 | The Royce Funds 2012 Annual Report to Shareholders |
Performance and Portfolio Review Results over the last full market cycle were more mixed. RFS was up 1.2% from the previous small-cap peak on July 13, 2007 through the most recent peak on April 29, 2011 versus an increase of 6.6% for the Russell 2000 and a loss of 13.5% for the financial services component of the Russell 2500. The Fund outperformed the financial services companies in the Russell 2500 for the five-year and since inception (12/31/03) periods ended December 2012. Our disciplined approach to investing in what we believe are fundamentally strong, conservatively capitalized, and attractively valued financial companies has at times put us out of sync both with the benchmark and the index that tracks the performance of micro-cap, small-cap, and mid-cap financial services stocks. As was the case in the first half, the portfolio’s overweight in capital markets cut both ways during the calendar year, though the strong second half, particularly for asset management businesses, gave a distinct advantage to net contributors from this industry. The group housed eight of the Fund’s top-10 contributors and seven of its 10 most significant detractors. Top-10 positions Apollo Global Management and Invesco were among the portfolio’s top contributors. New York City based Apollo Global Management offers alternative asset and other investment management services including private equity, credit, and real estate funds. We like its core business, dividend, solid earnings history, and positive cash flows and were content to hold our shares through the year. We reduced our position in Invesco as its shares climbed. The company is an investment manager catering to high-net-worth individuals and institutions with a great dividend, attractive margins, and increased assets under management. Based in Cape Town, South Africa, Coronation Fund Managers is an asset management company offering a range of local and international products to institutional and individual investors. Accelerated net inflows were a major reason for the strong performance of its stock. The Fund’s most significant detractor for the annual period was Sprott, a Canadian investment management company with a history dating back to 1981. The firm underperformed mostly owing to its high exposure to the precious metals and mining industry. We added shares in June and July. Artio Global Investors is a New York City-based asset manager that first attracted us with its impressive long-term track record with non-U.S. equities. Its stock suffered as assets and revenues declined. We liked its dividend, its attractively low share price, and the company’s expertise in a market that we view as poised for growth. We were content to hold our shares at the end of 2012. |
GOOD IDEAS AT THE TIME | |
| Sprott | -0.57% |
| Artio Global Investors Cl. A | -0.48 |
| AGF Management Cl. B | -0.28 |
| U.S. Global Investors Cl. A | -0.23 |
| Air Lease Cl. A | -0.17 |
| 1 Net of dividends | |
| ROYCE FINANCIAL SERVICES FUND VS. RUSSELL 2000 AND RUSSELL 2500 FINANCIAL SERVICES Value of $10,000 Invested on 12/31/03 | |
 |
| Includes reinvestment of distributions. | |||
| PORTFOLIO DIAGNOSTICS | |||
| Fund Net Assets | $17 million | ||
| Number of Holdings | 78 | ||
| Turnover Rate | 26% | ||
| Average Market Capitalization1 | $2,525 million | ||
| Weighted Average P/E Ratio2,3 | 16.2x | ||
| Weighted Average P/B Ratio2 | 1.8x | ||
| U.S. Investments (% of Net Assets) | 66.5% | ||
| Non-U.S. Investments (% of Net Assets) | 29.9% | ||
| Symbol | RYFSX | ||
1 Geometric Average. This weighted calculation uses each portfolio holding’s market cap in a way designed to not skew the effect of very large or small holdings; instead, it aims to better identify the portfolio’s center, which Royce believes offers a more accurate measure of average market cap than a simple mean or median. | |||
2 Harmonic Average. This weighted calculation evaluates a portfolio as if it were a single stock and measures it overall. It compares the total market value of the portfolio to the portfolio’s share in the earnings or book value, as the case may be, of its underlying stocks. | |||
| MORNINGSTAR STATISTICAL MEASURES1 | |||
| Sharpe Ratio | Standard Deviation | ||
| RFS | 0.17 | 23.60 | |
| Russell 2000 | 0.28 | 24.55 | |
| Category Median | 0.01 | 25.67 | |
| Best Quartile Breakpoint | 0.07 | 23.29 | |
1 Five years ended 12/31/12. Category Median and Best Quartile Breakpoint based on 31 financial services objective funds (oldest class only) with at least five years of history. | |||
The Fund performed within the Best Quartile of financial services objective funds on a risk-adjusted basis, as shown by its Sharpe ratio. In addition, the Fund’s volatility ranked within the top 50% of financial services objective funds, while the Fund also produced lower volatility than the Russell 2000. | |||
DOWN MARKET PERFORMANCE COMPARISON | |||
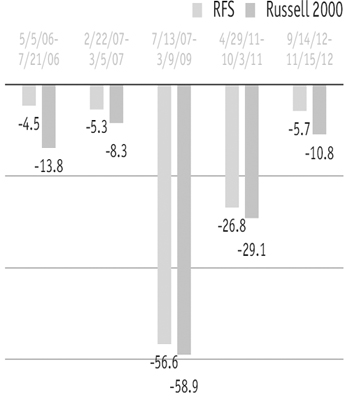 | |||
| The Royce Funds 2012 Annual Report to Shareholders | 25 |
| Royce Micro-Cap Discovery Fund (Formerly Royce Discovery Fund) |
| AVERAGE ANNUAL TOTAL RETURNS Through 12/31/12 | ||||||||||
| July–December 20121 | 3.10 | % | ||||||||
| One-Year | 3.10 | |||||||||
| Three-Year | 6.44 | |||||||||
| Five-Year | -0.29 | |||||||||
| Since Inception (10/3/03) | 4.35 | |||||||||
| ANNUAL EXPENSE RATIOS | ||||||||||
| Gross Operating Expenses | 2.99 | % | ||||||||
| Net Operating Expenses | 1.49 | |||||||||
| 1 Not annualized | ||||||||||
| CALENDAR YEAR TOTAL RETURNS | ||||||||||
| Year | RDF | Year | RDF | |||||||
| 2012 | 3.1 | % | 2007 | -7.4 | % | |||||
| 2011 | -2.2 | 2006 | 16.8 | |||||||
| 2010 | 19.6 | 2005 | 7.6 | |||||||
| 2009 | 25.9 | 2004 | 13.3 | |||||||
| 2008 | -35.1 | |||||||||
| TOP 10 POSITIONS % of Net Assets | ||||||||||
| Hi-Tech Pharmacal | 1.9 | % | ||||||||
| Computer Task Group | 1.9 | |||||||||
| Materion Corporation | 1.8 | |||||||||
| Standex International | 1.8 | |||||||||
| Young Innovations | 1.8 | |||||||||
| American Software Cl. A | 1.7 | |||||||||
| Miller Industries | 1.6 | |||||||||
| Kulicke & Soffa Industries | 1.6 | |||||||||
| Standard Motor Products | 1.6 | |||||||||
| TESSCO Technologies | 1.5 | |||||||||
| PORTFOLIO SECTOR BREAKDOWN % of Net Assets | ||||||||||
| Information Technology | 25.6 | % | ||||||||
| Industrials | 18.6 | |||||||||
| Materials | 14.1 | |||||||||
| Consumer Discretionary | 10.3 | |||||||||
| Health Care | 9.5 | |||||||||
| Energy | 5.8 | |||||||||
| Financials | 5.0 | |||||||||
| Consumer Staples | 2.1 | |||||||||
| Miscellaneous | 4.6 | |||||||||
| Cash and Cash Equivalents | 4.4 | |||||||||
 | |||||||||
Managers’ Discussion Two thousand twelve was a difficult year for Royce Micro-Cap Discovery Fund (RDF), formerly Royce Discovery Fund, though it was a fine one for many other micro-cap stocks. This made for a poor relative performance for the calendar year. The Fund was up 3.1% in 2012, trailing its benchmark, the Russell Microcap Index, which posted a calendar-year gain of 19.7%. RDF struggled to keep pace with the index following a micro-cap high on March 26, 2012 (this high lasted into September). During the first half of the year, the Fund was flat versus an increase of 13.0% for its benchmark. While the rally that invigorated the summer months was welcome for stocks as a whole, it bore too close a resemblance to 2012’s first quarter, a period in which the Fund acquitted itself well on an absolute basis but trailed the micro-cap index. For the third quarter, RDF gained 2.9% versus 5.9% for its benchmark. The Fund thus remained behind as it entered the fourth quarter, a more unsettled period in which we would typically expect the portfolio to have fared better, particularly on a relative basis. Attempting to make sense of Hurricane Sandy, the elections, the looming fiscal cliff, and the initiation of a fourth round of monetary stimulus in mid-December, the markets were more volatile, finishing the quarter for the most part flat to slightly negative. RDF was up 0.2% in the year’s final quarter compared to a gain of 0.04% for the Russell Microcap. As we have mentioned previously, since August 2010 the Fund’s approach moved from an exclusively quantitative value approach to one in which the portfolio managers evaluate the purchase and sale recommendations of its proprietary model using both quantitative and qualitative portfolio analysis before investment decisions are implemented. The Fund’s heavier weightings in more economically sensitive areas of the micro-cap space—including Information Technology and Materials—hindered results for the calendar year. This left us in a dilemma—our disciplined approach and preference for bargain-priced companies with strong fundamentals have led us to companies that have had limited participation in recent rallies and full participation during downturns. Needless to say, this pattern has persisted for far longer than any of us would like. | |||||||||
| GOOD IDEAS THAT WORKED Top Contributors to 2012 Performance1 | |||||||||||
| Presidential Life | 0.66% | ||||||||||
| Kensey Nash | 0.62 | ||||||||||
| Computer Task Group | 0.59 | ||||||||||
| ePlus | 0.55 | ||||||||||
| Stage Stores | 0.49 | ||||||||||
| 1 Includes dividends | |||||||||||
Important Performance and Expense Information All performance information in this Report reflects past performance, is presented on a total return basis, reflects the reinvestment of distributions, and does not reflect the deduction of taxes that a shareholder would pay on fund distributions or the redemption of fund shares. Past performance is no guarantee of future results. Investment return and principal value of an investment will fluctuate, so that shares may be worth more or less than their original cost when redeemed. Shares redeemed within 180 days of purchase may be subject to a 1% redemption fee payable to the Fund, which is not reflected in the performance shown above; if it were, performance would be lower. Current month-end performance may be higher or lower than performance quoted and may be obtained at www.roycefunds.com. Price and total return information is based on net asset values calculated for shareholder transactions. Certain immaterial adjustments were made to the net assets of Royce Micro-Cap Discovery Fund at 6/29/12 for financial reporting purposes, and as a result the net asset values for shareholder transactions on that date and calendar-year total returns based on those net asset values differ from the adjusted net asset values and calendar-year total returns reported in the Financial Highlights. Gross operating expenses reflect the Fund’s gross total annual operating expenses for the Service Class and include management fees, 12b-1 distribution and service fees, and other expenses. Net operating expenses reflect contractual fee waivers and/or expense reimbursements. All expense information is reported as of the Fund’s most current prospectus. Royce & Associates has contractually agreed to waive fees and/or reimburse operating expenses to the extent necessary to maintain the Service Class’s net annual operating expense ratio at or below 1.49% through April 30, 2013 and at or below 1.99% through April 30, 2022. Regarding the two “Good Ideas” tables shown above, the sum of all contributors to, and all detractors from, performance for all securities in the portfolio would approximate the Fund’s performance for 2012. | |||||||||||
| 26 | The Royce Funds 2012 Annual Report to Shareholders |
Performance and Portfolio Review There was significant bifurcation in the micro-cap market in 2012, where strong performance came from two extremes in the asset class while many companies left in the middle languished. This barbell-shaped market consisted of high-yielding, fixed-income-looking issues at one end—primarily REITs (real estate investment trusts) and MLPs (master limited partnerships), which many investors saw as more stable. The other end was made up of companies that were growing very quickly, but were mostly more speculative types of companies that lacked the strong business qualities that we seek for the portfolio. These were primarily higher-growth and higher-risk investments in sectors and industries such as biotech, fast-growing consumer oriented companies, and high-growth tech stocks. Very few investors were interested in the kinds of micro-cap companies that were attracting our attention—businesses with good balance sheets and solid returns on invested capital. The bulk of these stocks apparently looked too risky to one segment of investors and not fast-growing enough to another. At the end of the calendar-year period all but one of the Fund’s eight equity sectors were in positive territory. Health Care and Industrials were the Fund’s best-performing sectors. Chemicals, from the otherwise disappointing Materials sector, led all industry groups by a solid margin, followed by health care equipment & supplies, software, and construction & engineering. Financials was the only sector to detract from returns, though net losses for its industry groups were comparatively small. Information Technology remained the Fund’s largest sector. RDF ended the calendar year with 90 holdings, down from 112 holdings at the end of 2011. The most significant detractor at the individual position level was Richmont Mines, a Canadian gold producer. The company’s CEO resigned in February 2012 and the firm recently announced revised reserve and resource guidance on several mines which has pressured annual production estimates and driven its stock price down. We sold our shares in November. We parted ways that same month with Amtech Systems, a maker of capital equipment including silicon wafers and semiconductor processing equipment, after its share price fell further than we were prepared to accept. The for-profit education industry has been the subject of headlines emphasizing high dropout rates and poorly prepared students, though deteriorating financial results for Lincoln Educational Services were more of a factor in our decision to sell. The Fund’s top two contributors were acquisition targets. The purchase of Presidential Life, which offers fixed annuity, life insurance, and accident and health insurance, was announced in July, prompting us to sell our shares. Biomedical device Kensey Nash was acquired by Royal DSM following an announcement in May, when we sold our position. |
GOOD IDEAS AT THE TIME | |
| Richmont Mines | -1.28% |
| Amtech Systems | -0.76 |
| Lincoln Educational Services | -0.71 |
| Dynamics Research | -0.66 |
| Super Micro Computer | -0.63 |
| 1 Net of dividends | |
| ROYCE MICRO-CAP DISCOVERY FUND VS. RUSSELL MICROCAP Value of $10,000 Invested on 10/3/03 | |
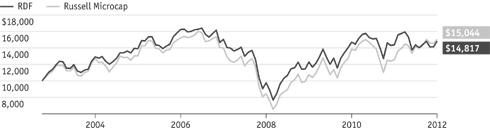 |
| Includes reinvestment of distributions. | |||
| PORTFOLIO DIAGNOSTICS | |||
| Fund Net Assets | $4 million | ||
| Number of Holdings | 90 | ||
| Turnover Rate | 87% | ||
| Average Market Capitalization1 | $426 million | ||
| Weighted Average P/E Ratio2,3 | 13.5x | ||
| Weighted Average P/B Ratio2 | 1.3x | ||
| U.S. Investments (% of Net Assets) | 89.6% | ||
| Non-U.S. Investments (% of Net Assets) | 6.0% | ||
| Symbol | RYDFX | ||
1 Geometric Average. This weighted calculation uses each portfolio holding’s market cap in a way designed to not skew the effect of very large or small holdings; instead, it aims to better identify the portfolio’s center, which Royce believes offers a more accurate measure of average market cap than a simple mean or median. | |||
2 Harmonic Average. This weighted calculation evaluates a portfolio as if it were a single stock and measures it overall. It compares the total market value of the portfolio to the portfolio’s share in the earnings or book value, as the case may be, of its underlying stocks. | |||
| MORNINGSTAR STATISTICAL MEASURES1 | |||
| Sharpe Ratio | Standard Deviation | ||
| RDF | 0.09 | 23.76 | |
| Russell Microcap | 0.17 | 25.61 | |
| Category Median | 0.23 | 24.99 | |
| Best Quartile Breakpoint | 0.29 | 24.31 | |
1 Five years ended 12/31/12. Category Median and Best Quartile Breakpoint based on 27 micro-cap objective funds (oldest class only) with at least five years of history. | |||
The Fund’s volatility ranked within the Best Quartile of micro-cap objective funds, while the Fund also produced lower volatility than the Russell Microcap. | |||
DOWN MARKET PERFORMANCE COMPARISON | |||
 | |||
| The Royce Funds 2012 Annual Report to Shareholders | 27 |
| Royce SMid-Cap Value Fund |
| AVERAGE ANNUAL TOTAL RETURNS Through 12/31/12 | ||||||||||
| July–December 20121 | 12.44 | % | ||||||||
| One-Year | 15.45 | |||||||||
| Three-Year | 8.75 | |||||||||
| Five-Year | 3.21 | |||||||||
| Since Inception (9/28/07) | 3.08 | |||||||||
| ANNUAL EXPENSE RATIO | ||||||||||
| Gross Operating Expenses | 1.95 | % | ||||||||
| Net Operating Expenses | 1.35 | |||||||||
| 1 Not annualized | ||||||||||
| CALENDAR YEAR TOTAL RETURNS | ||||||||||
| Year | RSV | Year | RSV | |||||||
| 2012 | 15.4 | % | 2009 | 28.7 | % | |||||
| 2011 | -11.6 | 2008 | -29.3 | |||||||
| 2010 | 26.0 | |||||||||
| TOP 10 POSITIONS % of Net Assets | ||||||||||
| Western Digital | 3.6 | % | ||||||||
| Helmerich & Payne | 3.5 | |||||||||
| Semperit AG Holding | 3.5 | |||||||||
| Reliance Steel & Aluminum | 3.3 | |||||||||
| Analog Devices | 3.2 | |||||||||
| Teradyne | 3.1 | |||||||||
| Westlake Chemical | 3.1 | |||||||||
| Pason Systems | 2.8 | |||||||||
| Globe Specialty Metals | 2.7 | |||||||||
| Ashmore Group | 2.7 | |||||||||
| PORTFOLIO SECTOR BREAKDOWN % of Net Assets | ||||||||||
| Materials | 20.6 | % | ||||||||
| Industrials | 15.7 | |||||||||
| Information Technology | 15.6 | |||||||||
| Financials | 13.9 | |||||||||
| Energy | 12.1 | |||||||||
| Consumer Discretionary | 10.4 | |||||||||
| Health Care | 3.6 | |||||||||
| Consumer Staples | 0.7 | |||||||||
| Cash and Cash Equivalents | 7.4 | |||||||||
| |
Managers’ Discussion As we reflect on the surprisingly strong year enjoyed by equity markets around the globe in 2012, we were pleased to see investors become increasingly willing to look past the steady stream of negative macroeconomic headlines and recognize the unique opportunities residing within select high-quality businesses. In the face of renewed recession in Europe and uneven economic footing in the U.S., there was clearly plenty to give investors pause. Compounding all of this were the uncertainties around future tax and healthcare policies and whether or not steps would be taken to effectively deal with structural deficits both in the U.S. and overseas. In the face of these systemic challenges, companies continued to forge ahead in their respective businesses, navigating these uncertain waters with a degree of caution but also with an eye toward exploiting opportunities when they arose. Generally speaking, balance sheets continued to strengthen and, while organic growth prospects remained somewhat elusive, margins and profits continued to improve throughout the year. Royce SMid-Cap Value Fund (RSV), with its mandate to explore the larger segment of the smaller company universe, posted a strong absolute result while lagging its benchmark, the Russell 2500 Index. RSV gained 15.4% for 2012 compared to the Russell 2500, which gained 17.9% for the same period. RSV made a very impressive showing in 2012’s first quarter, rising 15.2% and easily surpassing the 13.0% advance for the Russell 2500. The second quarter was more challenging as the Fund fell 10.9% compared to the more modest drop of 4.1% for the index. The second half proved more stable and constructive, with gains more evenly distributed across the final two quarters of 2012. The small-cap market hit a bottom on June 4 and pushed more or less steadily higher even in the face of the devastating effects of Hurricane Sandy, the highly contentious U.S. presidential election, and growing worries over the potential economic impact of the fiscal cliff. RSV had a solid third quarter as it gained 8.4%, nicely ahead of the index’s 5.6% gain. In 2012’s final quarter, small- and mid-cap stocks continued their advance, though at a slower pace. RSV again edged its benchmark with a gain of 3.7% for the quarter, ahead of the Russell 2500, which rose 3.1%. Recently celebrating its fifth anniversary, RSV has consistently and effectively applied its investment discipline of focusing on well-capitalized, high-quality businesses that we believe are mispriced in the marketplace. Launched in the midst of the recession and just prior to the |
| GOOD IDEAS THAT WORKED Top Contributors to 2012 Performance1 | |||||||||||
| Westlake Chemical | 2.94% | ||||||||||
| Stella-Jones | 1.32 | ||||||||||
| Valmont Industries | 1.08 | ||||||||||
| Reliance Steel & Aluminum | 0.92 | ||||||||||
| Autoliv | 0.82 | ||||||||||
| 1 Includes dividends | |||||||||||
Important Performance and Expense Information All performance information in this Report reflects past performance, is presented on a total return basis, reflects the reinvestment of distributions, and does not reflect the deduction of taxes that a shareholder would pay on fund distributions or the redemption of fund shares. Past performance is no guarantee of future results. Investment return and principal value of an investment will fluctuate, so that shares may be worth more or less than their original cost when redeemed. Shares redeemed within 180 days of purchase may be subject to a 1% redemption fee payable to the Fund, which is not reflected in the performance shown above; if it were, performance would be lower. Current month-end performance may be higher or lower than performance quoted and may be obtained at www.roycefunds.com. Gross operating expenses reflect gross total annual operating expenses for the Service Class and include management fees, 12b-1 distribution and service fees, and other expenses. Net operating expenses reflect contractual fee waivers and/or expense reimbursements. All expense information is reported as of the Fund’s most current prospectus. Royce & Associates has contractually agreed to waive fees and/or reimburse operating expenses to the extent necessary to maintain the Service Class’s net annual operating expenses at or below 1.35% through April 30, 2013. Regarding the two “Good Ideas” tables shown above, the sum of all contributors to, and all detractors from, performance for all securities in the portfolio would approximate the Fund’s performance for 2012. | |||||||||||
| 28 | The Royce Funds 2012 Annual Report to Shareholders |
Performance and Portfolio Review |
| financial crisis, the Fund experienced more than its fair share of volatility during its first half decade, which has made relative results somewhat disappointing. Performance over the course of 2012 was mostly positive from a sector standpoint as only one of the Fund’s eight equity sectors modestly detracted from returns. Leading the list of positive contributors was the Materials sector, followed by Industrials and Information Technology. Energy, a notable detractor in the first half, rebounded to finish the full year with modest net gains. Consumer Staples was the only sector in negative territory, albeit only slightly due to its limited exposure in the Fund. Results were largely consistent at the industry level. On the positive side, chemicals was a major bright spot leading all industry groups, followed by machinery and semiconductors & semiconductor equipment. Detracting from returns at the industry level were professional services and food products. Westlake Chemical, a manufacturer of basic chemicals, vinyls, polymers, and fabricated building products, was the top performer for the year. The company also makes plastics and high-end plastic films used to wrap food. Low natural gas prices gave it a significant cost advantage, as the company uses gas as a primary feedstock for plastic manufacture. We like this founder-controlled business for its conservative and intelligent management and think its ongoing prospects remain more than solid. Stella-Jones was another notable performer. This Canadian manufacturer of industrial structures and support components produced from pressure-treated wood was a strong gainer as demand for railroad ties surged from the Class 1 railroad companies. Hurricane Sandy provided another boost as damage to electrical infrastructure led to strong orders for utility poles. Valmont Industries benefited from a robust demand for global utility infrastructure equipment. This development improved the firm’s outlook for sustained growth, while its irrigation system sales grew in the wake of summer droughts in the Midwest. Sprott held the unpleasant distinction of being the Fund’s largest detractor for 2012. One of the largest hedge fund managers in Canada, the company focuses primarily on commodities and commodity-oriented businesses. Sprott struggled with performance issues that led to investor redemptions and a drop in assets under management. We continue to like its long-term prospects. We have long been attracted to the growing business, talented management, and pristine balance sheet of another Canadian company—Trican Well Service. The company provides specialized equipment and services for drilling, completion, and reworking oil and gas wells. As its stock price fell alongside commodity prices, we increased our stake, confident that an improved energy market can rekindle investor interest. |
GOOD IDEAS AT THE TIME | |
| Sprott | -0.53% |
| Trican Well Service | -0.52 |
| Kirkland Lake Gold | -0.51 |
| Silver Standard Resources | -0.37 |
| International Rectifier | -0.34 |
| 1 Net of dividends | |
| ROYCE SMID-CAP VALUE FUND VS. RUSSELL 2500 Value of $10,000 Invested on 9/28/07 | |
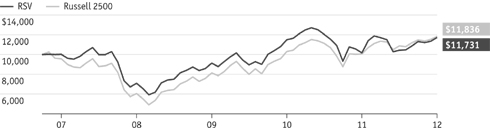 |
| Includes reinvestment of distributions. |
| PORTFOLIO DIAGNOSTICS | |||||
| Fund Net Assets | $11 million | ||||
| Number of Holdings | 51 | ||||
| Turnover Rate | 46% | ||||
| Average Market Capitalization1 | $3,140 million | ||||
| Weighted Average P/E Ratio2,3 | 14.0x | ||||
| Weighted Average P/B Ratio2 | 2.0x | ||||
| U.S. Investments (% of Net Assets) | 59.3% | ||||
| Non-U.S. Investments (% of Net Assets) | 33.3% | ||||
| Symbol | RMVSX | ||||
1 Geometric Average. This weighted calculation uses each portfolio holding’s market cap in a way designed to not skew the effect of very large or small holdings; instead, it aims to better identify the portfolio’s center, which Royce believes offers a more accurate measure of average market cap than a simple mean or median. | |||||
2 Harmonic Average. This weighted calculation evaluates a portfolio as if it were a single stock and measures it overall. It compares the total market value of the portfolio to the portfolio’s share in the earnings or book value, as the case may be, of its underlying stocks. | |||||
3 The Fund’s P/E ratio calculation excludes companies with zero or negative earnings (4% of portfolio holdings as of 12/31/12). | |||||
| MORNINGSTAR STATISTICAL MEASURES1 | |||||
| Sharpe Ratio | Standard Deviation | ||||
| RSV | 0.24 | 23.00 | |||
| Russell 2500 | 0.28 | 23.67 | |||
| Category Median | 0.22 | 22.62 | |||
| Best Quartile Breakpoint | 0.30 | 21.20 | |||
1 Five years ended 12/31/12. Category Median and Best Quartile Breakpoint based on 364 mid-cap objective funds (oldest class only) with at least five years of history. | |||||
| |||||
| The Royce Funds 2012 Annual Report to Shareholders | 29 |
| Royce Focus Value Fund |
| AVERAGE ANNUAL TOTAL RETURNS Through 12/31/12 | ||||||||||
| July–December 20121 | 9.20 | % | ||||||||
| One-Year | 9.20 | |||||||||
| Three-Year | 2.69 | |||||||||
| Since Inception (2/27/09) | 14.10 | |||||||||
| ANNUAL EXPENSE RATIOS | ||||||||||
| Gross Operating Expenses | 1.98 | % | ||||||||
| Net Operating Expenses | 1.36 | |||||||||
| 1 Not annualized | ||||||||||
| CALENDAR YEAR TOTAL RETURNS | ||||||||||
| Year | RFV | Year | RFV | |||||||
| 2012 | 9.2 | % | 2010 | 15.2 | % | |||||
| 2011 | -13.9 | |||||||||
| TOP 10 POSITIONS % of Net Assets | ||||||||||
| Western Digital | 3.6 | % | ||||||||
| Analog Devices | 3.6 | |||||||||
| Franklin Resources | 3.5 | |||||||||
| Berkshire Hathaway Cl. B | 3.5 | |||||||||
| Exxon Mobil | 3.4 | |||||||||
| Mosaic Company (The) | 3.2 | |||||||||
| Microsoft Corporation | 3.0 | |||||||||
| Apple | 3.0 | |||||||||
| Helmerich & Payne | 2.8 | |||||||||
| Pason Systems | 2.6 | |||||||||
| PORTFOLIO SECTOR BREAKDOWN % of Net Assets | ||||||||||
| Materials | 24.7 | % | ||||||||
| Information Technology | 21.7 | |||||||||
| Financials | 16.8 | |||||||||
| Energy | 14.6 | |||||||||
| Consumer Discretionary | 6.4 | |||||||||
| Industrials | 4.9 | |||||||||
| Consumer Staples | 4.9 | |||||||||
| Health Care | 2.1 | |||||||||
| Government Bonds | 1.2 | |||||||||
| Cash and Cash Equivalents | 2.7 | |||||||||
 | |||||||||
Managers’ Discussion A strong second half was not enough to undo the ill effects of a dismal first six months for Royce Focus Value Fund (RFV) in 2012. For the calendar year, the Fund was up 9.2% versus a gain of 17.9% for RFV’s small- and mid-cap benchmark, the Russell 2500 Index, for the same period. Although it trailed its benchmark in the bullish first quarter, the Fund posted a more-than-respectable return, gaining 10.5% versus 13.0% for the Russell 2500. This repeated the pattern established in the fourth quarter of 2011, another positive period in which the Fund failed to keep pace with the small- and mid-cap index. More trouble arrived when share prices began to retreat late in March, leading to losses for the Fund in April (-2.7% versus -0.7%) and steeper declines in May (-9.5% versus -6.8%). A June rally (+2.8% versus +3.6%) offered too little too late. RFV finished the second quarter with a loss of 9.5% compared to the more modest 4.1% loss for its benchmark. Stocks extended their June rebound with a solid third-quarter upswing that saw the Fund finally make up some ground against the Russell 2500. RFV rose 8.9% from the beginning of July through the end of September compared to its benchmark’s 5.6% return. The fourth quarter was also bullish, though less so than the first and third quarters. Investors paused a bit between mid-September and early November, in part due to the effects of Hurricane Sandy, the aftermath of the election, and the then-looming fiscal cliff. The Fund rose 0.3% in the fourth quarter, trailing its benchmark’s 3.1% gain. The Fund’s strong second half, in which it beat the Russell 2500 (+9.2% versus +8.8%), was encouraging. However, market cycle results have been well below our expectations since the Fund’s inception on February 27, 2009 (just prior to the last small-cap bottom on March 9, 2009). From that bottom through the most recent small-cap peak on April 29, 2011, RFV was up 93.8% compared to a gain of 162.5% for the benchmark. Despite these disappointing trough-to-peak results, the Fund provided solid longer-term absolute returns. Its average annual total return since inception was 14.1%. Seven of the Fund’s eight equity sectors finished 2012 in the black, with only Materials detracting from calendar-year results. Although results in this sector were disappointing, we were | |||||||||
| GOOD IDEAS THAT WORKED Top Contributors to 2012 Performance1 | |||||||||||
| Western Digital | 1.27% | ||||||||||
| Africa Oil | 1.13 | ||||||||||
| Franklin Resources | 0.97 | ||||||||||
| Analog Devices | 0.80 | ||||||||||
| Apple | 0.69 | ||||||||||
| 1 Includes dividends | |||||||||||
Important Performance and Expense Information All performance information in this Report reflects past performance, is presented on a total return basis, reflects the reinvestment of distributions, and does not reflect the deduction of taxes that a shareholder would pay on fund distributions or the redemption of fund shares. Past performance is no guarantee of future results. Investment return and principal value of an investment will fluctuate, so that shares may be worth more or less than their original cost when redeemed. Shares redeemed within 180 days of purchase may be subject to a 1% redemption fee payable to the Fund, which is not reflected in the performance shown above; if it were, performance would be lower. Current month-end performance may be higher or lower than performance quoted and may be obtained at www.roycefunds.com. Gross operating expenses reflect total gross annual operating expenses and include management fees, 12b-1 distribution and service fees, other expenses, and acquired fund fees and expenses. Net operating expenses reflect contractual fee waivers and/or reimbursements. All expense information is reported as of the Fund’s most current prospectus. Royce & Associates has contractually agreed to waive its fees and/or reimburse operating expenses to the extent necessary to maintain the Fund’s net annual operating expenses, other than acquired fund fees and expenses, at or below 1.35% through April 30, 2013. Acquired fund fees and expenses reflect the estimated amount of the fees and expenses incurred indirectly by the Fund through its investments in mutual funds, hedge funds, private equity funds, and other investment companies. Regarding the two “Good Ideas” tables shown above, the sum of all contributors to, and all detractors from, performance for all securities in the portfolio would approximate the Fund’s performance for 2012. | |||||||||||
| 30 | The Royce Funds 2012 Annual Report to Shareholders |
Performance and Portfolio Review pleased to see that sector’s chemicals group continue to post net gains between the end of June and December. We were also encouraged by positive second-half returns for select holdings in the otherwise dismal metals & mining group, including Allied Nevada Gold, Fresnillo, Nucor Corporation, and Reliance Steel & Aluminum. The Consumer Discretionary sector also posted losses in the first half of 2012, but strong results from RV and bus maker Thor Industries and retailer The Buckle helped it become a positive contributor in the year’s second half. Not every holding managed to turn things around in the year’s last six months. Major Drilling Group International provides contract drilling services for metals miners. Its share price suffered in 2012 as precious metals miners scaled back development, which seemed to create fears of lower demand for its business. This looked to us like a case of guilt by association. Our take was that its resilience in a challenging market for mining companies—the company was profitable in 2012—was a major positive. Trican Well Service is a long-time Royce favorite that first drew our attention with its well-run business and low-debt balance sheet. We added to our stake in March when its shares were sliding. While the firm continued to execute its Canadian operations with great success, it met with what we expect to be temporary issues with some of its U.S. activities, an increase in raw materials costs, and persistently low natural gas prices. We continue to have a high opinion of this specialized equipment and service provider for drilling, completion, and reworking oil and gas wells. It was a top-20 holding at the end of 2012. The share price of top contributor and number one holding Western Digital, which makes hard drives and related products, was quite volatile in 2012, though it was relatively more stable in the second half. After announcing in April that its disk prices were lower than they had been at the beginning of the year, its shares tumbled. The company bought back shares in the aftermath, which is nearly always a positive sign to us. The firm’s earnings then surprised on the upside for the next two quarters, giving a boost to its stock price. Liking its ongoing prospects as a leader in its field, we were happy to hold a large position at the end of 2012. A soaring share price gave us a very positive experience with Africa Oil, which explores for oil and gas primarily in East Africa but is based in Vancouver, British Columbia. Its stock price began to spout late in March on news that it had made the first major oil discovery in Kenya. Although its stock price peaked in May, its shares remained mostly healthy through the end of the year. We reduced our position between May and October before buying shares when its price dipped in November. |
| GOOD IDEAS AT THE TIME Top Detractors from 2012 Performance1 | |||||||||||
| Major Drilling Group International | -0.85% | ||||||||||
| Trican Well Service | -0.57 | ||||||||||
| Schnitzer Steel Industries Cl. A | -0.56 | ||||||||||
| Newmont Mining | -0.55 | ||||||||||
| Sprott | -0.45 | ||||||||||
| 1 Net of dividends | |||||||||||
| ROYCE FOCUS VALUE FUND VS. RUSSELL 2500 Value of $10,000 Invested on 2/27/09 | |||||||||||
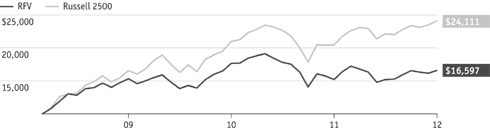 |
| Includes reinvestment of distributions. | |||
| PORTFOLIO DIAGNOSTICS | |||
| Fund Net Assets | $9 million | ||
| Number of Holdings | 50 | ||
| Turnover Rate | 21% | ||
| Average Market Capitalization1 | $6,114 million | ||
| Weighted Average P/E Ratio2,3 | 14.1x | ||
| Weighted Average P/B Ratio2 | 1.8x | ||
| U.S. Investments (% of Net Assets) | 72.4% | ||
| Non-U.S. Investments (% of Net Assets) | 24.9% | ||
| Symbol | RYFVX | ||
1 Geometric Average. This weighted calculation uses each portfolio holding’s market cap in a way designed to not skew the effect of very large or small holdings; instead, it aims to better identify the portfolio’s center, which Royce believes offers a more accurate measure of average market cap than a simple mean or median. | |||
2 Harmonic Average. This weighted calculation evaluates a portfolio as if it were a single stock and measures it overall. It compares the total market value of the portfolio to the portfolio’s share in the earnings or book value, as the case may be, of its underlying stocks. | |||
| MORNINGSTAR STATISTICAL MEASURES1 | |||
| Sharpe Ratio | Standard Deviation | ||
| RFV | 0.23 | 19.19 | |
| Russell 2500 | 0.74 | 19.24 | |
| Category Median | 0.67 | 18.24 | |
| Best Quartile Breakpoint | 0.76 | 17.07 | |
1 Three years ended 12/31/12. Category Median and Best Quartile Breakpoint based on 390 mid-cap objective funds (oldest class only) with at least three years of history. | |||
The Fund produced lower volatility than the Russell 2500. | |||
| The Royce Funds 2012 Annual Report to Shareholders | 31 |
| Royce Partners Fund |
| AVERAGE ANNUAL TOTAL RETURNS Through 12/31/12 | ||||||||||
| July–December 20121 | 12.50 | % | ||||||||
| One-Year | 20.74 | |||||||||
| Three-Year | 8.19 | |||||||||
| Since Inception (4/27/09) | 10.92 | |||||||||
| ANNUAL EXPENSE RATIOS | ||||||||||
| Gross Operating Expenses | 4.28 | % | ||||||||
| Net Operating Expenses | 1.38 | |||||||||
| 1 Not annualized | ||||||||||
| CALENDAR YEAR TOTAL RETURNS | ||||||||||
| Year | PTR | Year | PTR | |||||||
| 2012 | 20.7 | % | 2010 | 18.7 | % | |||||
| 2011 | -11.7 | |||||||||
| TOP 10 POSITIONS % of Net Assets | ||||||||||
| Value Partners Group | 3.5 | % | ||||||||
| Moody’s Corporation | 3.1 | |||||||||
| Ensco Cl. A | 2.8 | |||||||||
| Mayr-Melnhof Karton | 2.6 | |||||||||
| State Street | 2.5 | |||||||||
| Graco | 2.5 | |||||||||
| Northern Trust | 2.4 | |||||||||
| Verisk Analytics Cl. A | 2.4 | |||||||||
| MasterCard Cl. A | 2.4 | |||||||||
| Greif Cl. A | 2.3 | |||||||||
| PORTFOLIO SECTOR BREAKDOWN % of Net Assets | ||||||||||
| Financials | 32.4 | % | ||||||||
| Industrials | 26.8 | |||||||||
| Materials | 12.5 | |||||||||
| Information Technology | 11.9 | |||||||||
| Consumer Discretionary | 6.1 | |||||||||
| Energy | 6.0 | |||||||||
| Health Care | 1.8 | |||||||||
| Cash and Cash Equivalents | 2.5 | |||||||||
| |||||||||
Manager’s Discussion Given the litany of risks that confronted investors at the beginning of 2012, we were very pleased with both the absolute and relative performance of Royce Partners Fund (PTR) for the full calendar year. Economic prospects for the world’s major economies remained uncertain at best while new challenges continued to surface throughout the year. The eurozone fell back into recession during the second and third quarters as strict fiscal austerity measures were not offset by the open-ended liquidity measures enacted by the ECB. China continued to struggle with a decelerating economic activity that threw into question the ability of emerging markets economies to pick up the economic slack created by the slumping developed world. The Fund was up 20.7% in 2012, nicely ahead of its benchmark, the Russell 2500 Index, which rose 17.9% for the same period. In the strong first quarter, PTR produced a stellar return, advancing 15.7%, well ahead of the Russell 2500, which rose 13.0%. The second quarter, which included the difficult months of April and May followed by a partial recovery in June, saw PTR underperform as equities of all sizes fell. PTR lost 7.3% versus a 4.1% decline for the small- and mid-cap index. A welcome summer rally reversed most of these losses. During the third quarter PTR reestablished its leadership over the index by rising 6.0% compared to the Russell 2500’s gain of 5.6%. The fourth quarter proved to be more volatile as a series of events challenged the commitment of investors. Hurricane Sandy wreaked havoc on a large swath of the east coast, disrupting business activity for an extended period. Just afterward, we were treated to a highly contentious U.S. presidential election, which was then followed by the significant expansion of the Fed’s bond-buying program to include mortgage-backed securities. All of this was capped off by a budget debate that highlighted the deep divide between the two main political parties on the issues of taxes and revenues. PTR gained 6.1% in the volatile fourth quarter, ahead of the index’s increase of 3.1%. For the period ended December 31, 2012, the Fund’s average annual total return since inception (4/27/09) was 10.9%. PTR is one of a select group of Royce offerings with the flexibility to pursue opportunities up and down the market capitalization spectrum. Consistent with our view that leadership in the market will most likely rotate between small- and larger-cap stocks over time, this flexibility is of | |||||||||
| 32 | The Royce Funds 2012 Annual Report to Shareholders |
Performance and Portfolio Review great value, especially within the context of an asset class—equities—that looks broadly attractive to us versus other asset classes, particularly fixed income. We use the same rigorous criteria of strong balance sheets, high internal rates of return, and compelling valuation combined with a long-term investment horizon that has come to distinguish the Royce approach over the past four decades. So while a meaningful portion of the portfolio will continue to be sourced from our favored segment of smaller companies, the Fund also has the opportunity to apply our strict methodology to companies of all sizes. Six of the Fund’s seven equity sectors made positive contributions in 2012, with Financials leading by a considerable margin followed by strong net gains from Industrials. The Information Technology sector also posted solid results, with the Fund’s top individual performer coming from this sector. At the industry level, capital markets, machinery, and electronic equipment, instruments & components were the top contributors, though net gains came from several groups. IT services and electrical equipment were the two largest detractors at the industry level, although net losses were relatively modest. IPG Photonics is a leading manufacturer of fiber lasers and amplifiers for use in materials processing, telecommunications, and medical applications. Its business continued its winning ways as it experienced broad expansion in end markets for its fiber laser technology. The company surpassed its prior peak earnings levels and delivered solid results through the year. We believe that accelerating expansion in global end markets, combined with IPG’s first mover advantage in numerous laser applications, puts the company in position for continued success. Valmont Industries, which makes fabricated metal products, pole and tower structures, and mechanized irrigation systems, was also a standout for the year. Its galvanized steel electric utility poles business grew as it won a number of large bids for projects as infrastructure spending began to pick up. Western Union, the world’s largest money-transfer business, fell precipitously in the third quarter following management’s decision to reduce pricing in key corridors in an effort to rebuild market share. Once known for providing a premium service and demanding premium pricing, the growing commoditization of the money transfer business and increased competition led to a sharp cut in both revenue and earnings estimates for both 2013 and 2014. We sold our shares in November before reinitiating a position early in 2013. MoneyGram International, a competitor to Western Union in the consumer payments and transfer business, had its share of problems as well as concerns arose as to the magnitude of a settlement with the DOJ and U.S. Attorney’s office over consumer fraud and money laundering. We sold our stake early in January 2013. |
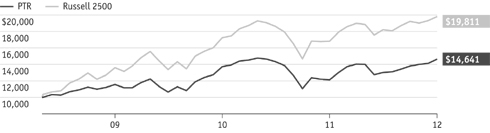 |
| Includes reinvestment of distributions. | ||||||||||
| PORTFOLIO DIAGNOSTICS | ||||||||||
| Fund Net Assets | $2 million | |||||||||
| Number of Holdings | 58 | |||||||||
| Turnover Rate | 31% | |||||||||
| Average Market Capitalization1 | $3,990 million | |||||||||
| Weighted Average P/E Ratio2,3 | 17.7x | |||||||||
| Weighted Average P/B Ratio2 | 2.1x | |||||||||
| U.S. Investments (% of Net Assets) | 74.6% | |||||||||
| Non-U.S. Investments (% of Net Assets) | 22.9% | |||||||||
| Symbol | RPTRX | |||||||||
1 Geometric Average. This weighted calculation uses each portfolio holding’s market cap in a way designed to not skew the effect of very large or small holdings; instead, it aims to better identify the portfolio’s center, which Royce believes offers a more accurate measure of average market cap than a simple mean or median. | ||||||||||
2 Harmonic Average. This weighted calculation evaluates a portfolio as if it were a single stock and measures it overall. It compares the total market value of the portfolio to the portfolio’s share in the earnings or book value, as the case may be, of its underlying stocks. | ||||||||||
| MORNINGSTAR STATISTICAL MEASURES1 | ||||||||||
| Sharpe Ratio | Standard Deviation | |||||||||
| PTR | 0.52 | 18.33 | ||||||||
| Russell 2500 | 0.74 | 19.24 | ||||||||
| Category Median | 0.67 | 18.24 | ||||||||
| Best Quartile Breakpoint | 0.76 | 17.07 | ||||||||
1 Three years ended 12/31/12. Category Median and Best Quartile Breakpoint based on 390 mid-cap objective funds (oldest class only) with at least three years of history. | ||||||||||
The Fund produced lower volatility than the Russell 2500. | ||||||||||
| The Royce Funds 2012 Annual Report to Shareholders | 33 |
| Royce Special Equity Multi-Cap Fund |
| AVERAGE ANNUAL TOTAL RETURNS Through 12/31/12 | ||||||||||
| July–December 20121 | 4.64 | % | ||||||||
| One-Year | 11.62 | |||||||||
| Since Inception (12/31/10) | 9.39 | |||||||||
| ANNUAL EXPENSE RATIOS | ||||||||||
| Gross Operating Expenses | 1.97 | % | ||||||||
| Net Operating Expenses | 1.39 | |||||||||
| 1 Not annualized | ||||||||||
| CALENDAR YEAR TOTAL RETURNS | ||||||||||
| Year | RSM | Year | RSM | |||||||
| 2012 | 11.6 | % | 2011 | 7.2 | % | |||||
| TOP 10 POSITIONS % of Net Assets | ||||||||||
| Emerson Electric | 4.0 | % | ||||||||
| Molex Cl. A | 3.9 | |||||||||
| Walgreen Company | 3.7 | |||||||||
| Dover Corporation | 3.6 | |||||||||
| Analog Devices | 3.5 | |||||||||
| Bed Bath & Beyond | 3.4 | |||||||||
| Gap (The) | 3.2 | |||||||||
| Cisco Systems | 3.2 | |||||||||
| Occidental Petroleum | 3.1 | |||||||||
| Nordstrom | 3.1 | |||||||||
| PORTFOLIO SECTOR BREAKDOWN % of Net Assets | ||||||||||
| Information Technology | 23.5 | % | ||||||||
| Industrials | 23.2 | |||||||||
| Consumer Discretionary | 23.2 | |||||||||
| Health Care | 14.6 | |||||||||
| Consumer Staples | 6.6 | |||||||||
| Energy | 3.1 | |||||||||
| Cash and Cash Equivalents | 5.8 | |||||||||
|
Manager’s Discussion In 2012, Royce Special Equity Multi-Cap Fund (RSM) gained 11.6% versus 16.4% for its benchmark, the Russell 1000 Index, for the same period. During the more extreme first half of the year, RSM underperformed the large-cap index, though its results were largely in line with our expectations. The Fund gained 12.1% in the first quarter, slightly underperforming its benchmark, which gained 12.9%. This bullish phase, which began after an October 2011 low, lasted until almost the end of March before the market switched modes, with April and May seeing mostly declining share prices. Although stocks began to rebound in June, it was not enough to lift second-quarter results into positive territory. During the second quarter RSM lost 4.9%, underperforming its benchmark, which lost 3.1%. The majority of the underperformance came in the dynamic up month of June when the Russell 1000 gained 3.8% while RSM only added 2.5%. The second half was a far less extreme period. RSM climbed 4.8% in the third quarter versus a 6.3% increase for the large-cap index. During the fourth quarter the Fund was close to its benchmark, down 0.1% while the Russell 1000 rose 0.1%. The Fund outperformed the Russell 1000 for the since inception (12/31/10) period ended December 31, 2012. RSM’s average annual total return since inception was 9.4%. We believe that our ability to differentiate among stocks is crucial at this juncture. One needs, within the confines of strict adherence to discerning metrics, to find securities that can benefit from whatever comes of our tangled fiscal situation. We believe that regardless of the ultimate outcome, inexpensive, quality businesses that generate free cash flow remain, at a minimum, relatively better than other investment choices; we continue to believe they can provide solid absolute returns as well. Companies that are inexpensively priced, that have high returns on capital, that are conservatively financed, and that are able to generate cash are likely to outperform. The ability to pay, and even increase, dividends also seems valuable to us in either scenario of inflation or deflation. Thus, we believe that the “tangibility” of dividends from companies generating stable cash flow will become increasingly important. The S&P 500 Dividend Aristocrats—those companies in the large-cap index that have continuously increased their dividends—have outperformed the S&P 500 for approximately three years—a trend that we think is only going to increase. We strive to find these kinds of |
| 34 | The Royce Funds 2012 Annual Report to Shareholders |
Performance and Portfolio Review |
| companies for the portfolio that also meet our other criteria. Since about one-half of household owned equities are held in tax-deferred accounts, and since most individuals buy dividend-yielding stocks for income and downside protection (less market volatility), we do not see the hike in taxes on dividends as a major event. Further, dividend yields after tax still compare favorably to the alternatives. People age 65 and over earned nearly 50% of all dividend income according to IRS data. This group is growing, as is their need for income. Our portfolio construction method remains firmly rooted in bottom-up stock selection. The process requires that a company possess very specific qualities to merit inclusion in the portfolio. We have not changed our discipline. In fact, the only recent tweak we have introduced has been to at times reduce our usual trailing 12-month EBIT (earnings before interest and taxes) used in our valuation metric to a lower figure in an effort to account for the high levels of global uncertainty, a move that we regard as stress-testing the attractiveness of a holding. Statistically, the market looks fairly priced as of this writing. However, in other parts of the world we have seen the self-inflicted market penalty caused by political division, lingering budget issues, and resulting debt. Opportunities exist amid this, and, as always, we intend to be opportunistically poised to find bargains, even assuming poor macro outcomes. Following the market’s strong second-half advance, its final month-and-a-half in particular, few opportunities have been apparent. That rise, the government’s poor performance in the fiscal cliff negotiations, and perhaps even poorer prospects for the U.S. to get its fiscal act together—both figuratively and literally—any time soon have caused us to do more selling than buying of late. All but one of the Fund’s six sectors were positive performers in 2012, with Consumer Discretionary, Industrials, and Information Technology having the largest impact. The Energy sector was the only detractor for the annual period. The Gap was the best performer in 2012. The company is a portfolio of specialty retail clothing brands including the Gap, Old Navy, Banana Republic, and most recently Piperlime, an online brand selling footwear and handbags. Occidental Petroleum and Staples were the largest detractors from performance. Occidental Petroleum is a globally diversified oil and gas company. Staples is a leading retailer in the office products distribution industry serving both consumers and businesses through its domestic and international stores. The company operates in 26 countries in North and South America, Europe, Asia, and Australia. Weaker-than-expected sales continue to weigh on the company as it tries to address a lackluster demand environment. |
 |
| Includes reinvestment of distributions. |
| PORTFOLIO DIAGNOSTICS | ||||
| Fund Net Assets | $109 million | |||
| Number of Holdings | 32 | |||
| Turnover Rate | 14% | |||
| Average Market Capitalization1 | $20,505 million | |||
| Weighted Average P/E Ratio2,3 | 14.5x | |||
| Weighted Average P/B Ratio2 | 2.4x | |||
| U.S. Investments (% of Net Assets) | 94.2% | |||
| Non-U.S. Investments (% of Net Assets) | 0.0% | |||
| Symbol | ||||
| Investment Class | RSMCX | |||
| Service Class | RSEMX | |||
| Institutional Class | RMUIX | |||
1 Geometric Average. This weighted calculation uses each portfolio holding’s market cap in a way designed to not skew the effect of very large or small holdings; instead, it aims to better identify the portfolio’s center, which Royce believes offers a more accurate measure of average market cap than a simple mean or median. | ||||
2 Harmonic Average. This weighted calculation evaluates a portfolio as if it were a single stock and measures it overall. It compares the total market value of the portfolio to the portfolio’s share in the earnings or book value, as the case may be, of its underlying stocks. | ||||
3 The Fund’s P/E ratio calculation excludes companies with zero or negative earnings (0% of portfolio holdings as of 12/31/12). | ||||
| The Royce Funds 2012 Annual Report to Shareholders | 35 |
| Royce European Smaller-Companies Fund |
| AVERAGE ANNUAL TOTAL RETURNS Through 12/31/12 | ||||||||||
| July-December 20121 | 17.47 | % | ||||||||
| One-Year | 23.83 | |||||||||
| Three-Year | 10.08 | |||||||||
| Five-Year | 2.44 | |||||||||
| Since Inception (12/29/06) | 2.27 | |||||||||
| ANNUAL EXPENSE RATIOS | ||||||||||
| Gross Operating Expenses | 2.10 | % | ||||||||
| Net Operating Expenses | 1.70 | |||||||||
| 1 Not annualized | ||||||||||
| CALENDAR YEAR TOTAL RETURNS | ||||||||||
| Year | RES | Year | RES | |||||||
| 2012 | 23.8 | % | 2009 | 57.7 | % | |||||
| 2011 | -20.3 | 2008 | -46.4 | |||||||
| 2010 | 35.2 | 2007 | 1.4 | |||||||
| TOP 10 POSITIONS % of Net Assets | ||||||||||
| Semperit AG Holding | 2.8 | % | ||||||||
| Mayr-Melnhof Karton | 2.5 | |||||||||
| Recordati | 2.3 | |||||||||
| Ashmore Group | 2.3 | |||||||||
| KWS Saat | 2.1 | |||||||||
| Takkt | 2.1 | |||||||||
| Partners Group Holding | 2.0 | |||||||||
| DiaSorin | 2.0 | |||||||||
| Ekornes | 2.0 | |||||||||
| Vetoquinol | 1.9 | |||||||||
| PORTFOLIO SECTOR BREAKDOWN % of Net Assets | ||||||||||
| Industrials | 18.9 | % | ||||||||
| Health Care | 18.3 | |||||||||
| Consumer Discretionary | 14.4 | |||||||||
| Financials | 14.3 | |||||||||
| Information Technology | 13.3 | |||||||||
| Materials | 10.1 | |||||||||
| Consumer Staples | 3.3 | |||||||||
| Energy | 3.3 | |||||||||
| Cash and Cash Equivalents | 4.1 | |||||||||
| PORTFOLIO COUNTRY BREAKDOWN1,2 % of Net Assets | ||||||||||
| United Kingdom | 18.2 | % | ||||||||
| France | 16.5 | |||||||||
| Germany | 13.5 | |||||||||
| Switzerland | 12.6 | |||||||||
| Italy | 7.0 | |||||||||
| Austria | 5.3 | |||||||||
| South Africa | 4.5 | |||||||||
| Belgium | 3.5 | |||||||||
| Norway | 3.1 | |||||||||
| 1 Represents countries that are 3% or more of net assets. | ||||||||||
| 2 Securities are categorized by the country of their headquarters. | ||||||||||
| |||||||||
Managers’ Discussion Following the sharp decline in the European equity markets that defined 2011, investors quickly shifted gears and climbed the proverbial wall of worry over the course of 2012. Still mired in the uncertainty around perilously high sovereign debt burdens and the strict regimen of fiscal austerity mandated by the ECB (European Central Bank), we were pleasantly surprised to see many markets in Europe begin to gradually return to normalcy. Royce European Smaller Companies Fund (RES), which seeks to invest in the highest conviction ideas we are finding in our European research efforts, performed well in absolute terms—our preferred measure—but lagged behind the stunning advance put in by its European benchmark. RES gained 23.8% in 2012, trailing the Russell Europe Small Cap Index, which advanced 28.9% for the same period. During the powerful rally that characterized the year’s first quarter, RES gained 16.0% while lagging its European small-cap benchmark, which advanced 19.7%. Investor confidence was shaken late in the first quarter as global economic growth once again began to stall and European efforts to manage the increasingly complex consequences of their prior fiscal mismanagement were deemed inadequate. RES fell 9.1% in 2012’s second quarter compared to a 9.6% decline for the Russell Europe Small Cap Index. The second half of the year proved to be more stable. Following news from the ECB in late June that more definitive action would be taken to shore up the finances of troubled Spain and Italy, the markets rallied. Positive conditions lasted for the most part through the end of the year and made for a solidly bullish third quarter. Once again, the Fund failed to keep pace with the heady advance of its benchmark. While gaining a more than respectable 8.4%, the Fund’s increase was behind the 10.2% gain recorded by the benchmark. The pace of the rally slowed for many small-caps elsewhere around the globe in the fourth quarter, though it remained dynamic for many smaller European equities. We were equally pleased that RES’s results were on par with those of the index. RES was up 8.4% in the fourth quarter, ahead of the 8.1% gain for the Russell Europe Small Cap Index. Now beginning its seventh year in operation, we are pleased that the Fund managed to generate positive returns in what has been one of the most challenging | |||||||||
| GOOD IDEAS THAT WORKED Top Contributors to 2012 Performance1 | |||||||||||
| Fuchs Petrolub | 1.30% | ||||||||||
| Keller Group | 1.23 | ||||||||||
| KWS Saat | 1.05 | ||||||||||
| Pfeiffer Vacuum Technology | 0.99 | ||||||||||
| Parrot | 0.97 | ||||||||||
| 1 Includes dividends | |||||||||||
Important Performance and Expense Information All performance information in this Report reflects past performance, is presented on a total return basis, reflects the reinvestment of distributions, and does not reflect the deduction of taxes that a shareholder would pay on fund distributions or the redemption of fund shares. Past performance is no guarantee of future results. Investment return and principal value of an investment will fluctuate, so that shares may be worth more or less than their original cost when redeemed. Shares redeemed within 180 days of purchase may be subject to a 2% redemption fee payable to the Fund, which is not reflected in the performance shown above; if it were, performance would be lower. Current month end performance may be higher or lower than performance quoted and may be obtained at www.roycefunds.com. Gross operating expenses reflect total gross annual operating expenses and include management fees, 12b-1 distribution and service fees, other expenses, and acquired fund fees and expenses. Net operating expenses reflect contractual fee waivers and/or expense reimbursements. All expense information is reported as of the Fund’s most current prospectus. Royce & Associates has contractually agreed to waive its fees and/or reimburse operating expenses to the extent necessary to maintain the Fund’s net annual operating expenses, other than acquired fund fees and expenses, at or below 1.69% through April 30, 2013 and at or below 1.99% through April 30, 2022. Acquired fund fees and expenses reflect the estimated amount of the fees and expenses incurred indirectly by the Fund through its investments in mutual funds, hedge funds, private equity funds, and other investment companies. Regarding the two “Good Ideas” tables shown above, the sum of all contributors to, and all detractors from, performance for all securities in the portfolio would approximate the Fund’s performance for 2012. | |||||||||||
| 36 | The Royce Funds 2012 Annual Report to Shareholders |
Performance and Portfolio Review investment environments in recent memory. RES also outperformed its benchmark over the three-, five-year and since inception periods (12/29/06) ended December 31, 2012. Led by Industrials, all eight of the Fund’s equity sectors generated positive performance in 2012. Health Care, Materials, Information Technology, and Financials also made notable contributions, demonstrating the breadth of the market’s strength with solid performance from both cyclical and more traditionally defensive areas of the market. The Energy sector was the most challenging for the year. The sector generated only modest gains for the Fund as overcapacity in the service segment and a challenging price environment for natural gas made for mostly lackluster performance. At the industry level, results were also strong across several groups. Machinery led by a wide margin, though capital markets and pharmaceuticals also posted strong net gains for the year. Not surprisingly, energy equipment & services was the largest detractor at the industry level. Semiconductors & semiconductor equipment, hotels, restaurants & leisure, and diversified consumer services were also in negative territory for the year, though net losses for these groups were decidedly modest. Lamprell, a leading UAE-based construction and engineering firm that specializes in the repair and refurbishment of oil and gas rigs, had the unfortunate distinction of being the Fund’s top loser for the year after having been a significant positive contributor in 2010. The company stumbled badly in the second quarter in its efforts to enter the rig construction business, mostly due to problems with suppliers. This was followed by a dramatic drop in its stock price during May when the first of an eventual five profit warnings were released. Concluding that the new-build business line was structurally unattractive and a hindrance to managing the company as well as it had been before, we sold our investment in June. Severfield-Rowen is the UK’s leading structural steelwork fabricator. Falling steel prices and delays to contract payments led the firm to issue a profit warning, lay off 5% of its workers, and ponder not paying its dividend near the end of 2012. Confident that the firm could rebound when steel prices stabilize, we chose to hold our shares. Fuchs Petrolub was the top individual gainer for the year. One of the world’s leading refiners and producers of industrial and automotive lubricants, this German company benefited from solid demand growth particularly in the emerging markets and from a decline in base oil prices, its primary raw material cost input. Another notable winner was Keller Group, which is the world’s largest independent ground engineering specialist with operations in Europe, the U.S., and Australia and a growing presence in the Middle East and Asia. It benefited from a pick up in the company’s core U.S. construction market. Although we think its prospects remain promising, especially in light of the rebound for housing in the U.S., we took gains in 2012. |
GOOD IDEAS AT THE TIME | |
| Lamprell | -1.32% |
| Severfield-Rowen | -0.48 |
| Audika Groupe | -0.32 |
| SMA Solar Technology | -0.31 |
| Ipsen | -0.30 |
| 1 Net of dividends | |
| ROYCE EUROPEAN SMALLER-COMPANIES FUND VS. RUSSELL EUROPE SMALL CAP Value of $10,000 Invested on 12/29/06 | |
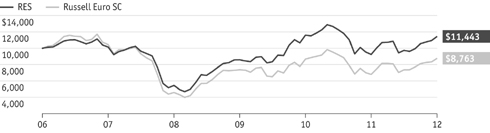 |
| Includes reinvestment of distributions. | |||
| PORTFOLIO DIAGNOSTICS | |||
| Fund Net Assets | $16 million | ||
| Number of Holdings | 73 | ||
| Turnover Rate | 22% | ||
| Average Market Capitalization1 | $1,303 million | ||
| Weighted Average P/E Ratio2,3 | 14.7x | ||
| Weighted Average P/B Ratio2 | 2.2x | ||
| Symbol | RISCX | ||
1 Geometric Average. This weighted calculation uses each portfolio holding’s market cap in a way designed to not skew the effect of very large or small holdings; instead, it aims to better identify the portfolio’s center, which Royce believes offers a more accurate measure of average market cap than a simple mean or median. | |||
2 Harmonic Average. This weighted calculation evaluates a portfolio as if it were a single stock and measures it overall. It compares the total market value of the portfolio to the portfolio’s share in the earnings or book value, as the case may be, of its underlying stocks. | |||
| MORNINGSTAR STATISTICAL MEASURES1 | |||
| Sharpe Ratio | Standard Deviation | ||
| RES | 0.21 | 26.38 | |
| Russell Europe Small Cap | 0.02 | 29.38 | |
| Category Median | -0.03 | 26.50 | |
| Best Quartile Breakpoint | 0.05 | 25.39 | |
1 Five years ended 12/31/12. Category Median and Best Quartile Breakpoint based on 29 European stock objective funds (oldest class only) with at least five years of history. | |||
The Fund beat the Russell Europe Small Cap and performed within the Best Quartile of European stock objective funds on a risk-adjusted basis, as shown by its Sharpe ratio. In addition, the Fund’s volatility ranked within the top 50% of European stock objective funds, while the Fund also produced lower volatility than the Russell Europe Small Cap. | |||
DOWN MARKET PERFORMANCE COMPARISON | |||
 | |||
| The Royce Funds 2012 Annual Report to Shareholders | 37 |
| Royce Global Dividend Value Fund |
| AVERAGE ANNUAL TOTAL RETURNS Through 12/31/12 | ||||||||||
| July–December 20121 | 15.83 | % | ||||||||
| One-Year | 22.52 | |||||||||
| Since Inception (12/31/10) | 1.83 | |||||||||
| ANNUAL EXPENSE RATIOS | ||||||||||
| Gross Operating Expenses | 3.48 | % | ||||||||
| Net Operating Expenses | 1.70 | |||||||||
| 1 Not annualized | ||||||||||
| CALENDAR YEAR TOTAL RETURNS | ||||||||||
| Year | RGD | Year | RGD | |||||||
| 2012 | 22.5 | % | 2011 | -15.4 | % | |||||
| TOP 10 POSITIONS % of Net Assets | ||||||||||
| Randgold Resources ADR | 1.6 | % | ||||||||
| Jupiter Fund Management | 1.6 | |||||||||
| Mayr-Melnhof Karton | 1.3 | |||||||||
| Tidewater | 1.2 | |||||||||
| SimCorp | 1.2 | |||||||||
| KBR | 1.2 | |||||||||
| Invesco | 1.1 | |||||||||
| Warsaw Stock Exchange | 1.1 | |||||||||
| USS | 1.1 | |||||||||
| Pfeiffer Vacuum Technology | 1.0 | |||||||||
| PORTFOLIO SECTOR BREAKDOWN % of Net Assets | ||||||||||
| Consumer Discretionary | 19.3 | % | ||||||||
| Industrials | 18.1 | |||||||||
| Financials | 15.9 | |||||||||
| Materials | 13.4 | |||||||||
| Health Care | 13.0 | |||||||||
| Information Technology | 10.0 | |||||||||
| Consumer Staples | 4.4 | |||||||||
| Energy | 3.4 | |||||||||
| Diversified Investment Companies | 0.5 | |||||||||
| Cash and Cash Equivalents | 2.0 | |||||||||
|
Manager’s Discussion Royce Global Dividend Value Fund (RGD) gained 22.5% for the annual period ended December 31, 2012 versus a 17.7% increase for its small-cap benchmark, the Russell Global Small Cap Index, for the same period. During the more extreme first half of the year RGD slightly underperformed the small-cap index, though its results were largely in line with our expectations. The Fund gained 15.3% in the first quarter compared to 13.7% for the Russell Global Small Cap Index. This bullish phase, which began after an October 2011 small-cap low, lasted nearly through the end of March. The market then shifted, with April and May seeing mostly declining share prices. Stocks began to rebound in June, but not enough to make returns for the second quarter positive. RGD was down 8.3% in the second quarter while its benchmark lost 6.7%. The second half was far less extreme, and the Fund fared better on both an absolute and relative basis. Small-cap stocks reached a low on June 4, 2012. While the domestic Russell 2000 reached a high for the year on September 14, the prices of many smaller companies continued to rise through the end of the year following some stumbles in a bearish October. RGD climbed 9.5% in the third quarter versus a 7.1% increase for its global small-cap benchmark. The fourth quarter was less bullish, though for many equities it remained a solidly positive period. The Fund rose 5.7% for the year’s final quarter, while its benchmark was up 3.6%. RGD outperformed its benchmark from the index’s low on June 4, 2012 through December 31, 2012, up 22.0% versus 18.8%. The Fund also outperformed its benchmark for the since inception (12/31/10) period ended December 31, 2012. The Fund has a global scope. In constructing its portfolio we primarily look for dividend-paying companies based in developed countries, including the U.S. From our point of view dividends have always been a marker of quality in the small-cap space—they can also potentially provide a cushion against high volatility. For the calendar year all but one of the Fund’s eight equity sectors were in the black. Energy, the only sector to detract from results, suffered relatively small losses for the year. Consumer Discretionary led all sectors, followed by strong net gains for Industrials, Financials, Information Technology, Materials, and Consumer Staples. At the industry level, capital markets led the advance, along with machinery, textiles, apparel & luxury goods, and food products. |
| 38 | The Royce Funds 2012 Annual Report to Shareholders |
Performance and Portfolio Review |
| Fuchs Petrolub, a German based provider of lubricants and greases, was the top contributor for the period. Founded in 1931, the company is the world’s largest independent lubricant manufacturer and the only independent lubricant company with a global presence. The company is active in more than 100 countries with 38 production plants. Its shares benefited from increased demand, especially in emerging markets, and a decline in base oil prices, its primary raw material cost input. We took gains in September and December. Moshi Moshi Hotline is a Japanese business that provides call centers, back office services, consulting, and other services. Its stock fell sharply following the March 2011 earthquake when we began to build a position. Its core businesses, dividend yield, and attractive valuation all drew our attention. Its stock began to climb in early August when the company significantly raised its consolidated mid-year revenue outlook based mostly on increased sales and improved business efficiency. We reduced our position in September and October. We initiated a position in Pandora A/S in RDV’s portfolio in July 2012 shortly before its stock took off. Based in Denmark, the company designs, manufactures, and distributes hand-finished jewelry. Its shares plunged 65% in August of 2011 after an unexpected profit warning. It then struggled to rebound, again tumbling dramatically in February 2012. All of this pulled its valuation down to levels that were even more attractive to us. Its shares then rose in August when the company released better-than-expected results. This trend continued when strong third-quarter results were released early in November, again sending its stock price higher. We sold more than half of our stake in November. Lamprell was the greatest detractor from performance during 2012. The company has a leading market position in the Arabian Gulf undertaking upgrades and refurbishment of jack-up rigs and land rigs. The business, which was incorporated in the mid 1970s, recently diversified into new rigs, a related business but one with different characteristics and structural issues. The company’s struggles with these challenges became more evident in the first half of 2012 via supply-chain problems. Its stock price then plummeted in May when the company issued the first of an eventual five profit warnings. These were more than enough problems for us, so we sold our position in the portfolio in June. Major Drilling Group International is a Canadian company that provides drilling services to the mining industry and is the second-largest mining driller in the world. Although it remained profitable, its business was pressured by softer demand and drilling outlook throughout the year. Liking its long-term prospects, we added to our stake from October through the end of the year. |
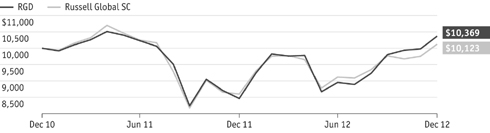 |
| Includes reinvestment of distributions. |
| PORTFOLIO DIAGNOSTICS | ||||
| Fund Net Assets | $7 million | |||
| Number of Holdings | 162 | |||
| Turnover Rate | 36% | |||
| Average Market Capitalization1 | $1,301 million | |||
| Weighted Average P/E Ratio2,3 | 14.2x | |||
| Weighted Average P/B Ratio2 | 2.1x | |||
| Symbol | RGVDX | |||
1 Geometric Average. This weighted calculation uses each portfolio holding’s market cap in a way designed to not skew the effect of very large or small holdings; instead, it aims to better identify the portfolio’s center, which Royce believes offers a more accurate measure of average market cap than a simple mean or median. | ||||
2 Harmonic Average. This weighted calculation evaluates a portfolio as if it were a single stock and measures it overall. It compares the total market value of the portfolio to the portfolio’s share in the earnings or book value, as the case may be, of its underlying stocks. | ||||
3 The Fund’s P/E ratio calculation excludes companies with zero or negative earnings (1% of portfolio holdings as of 12/31/12). | ||||
| PORTFOLIO COUNTRY BREAKDOWN1,2 % of Net Assets | ||||
| United States | 10.7 | % | ||
| Japan | 10.1 | |||
| United Kingdom | 9.0 | |||
| Switzerland | 8.9 | |||
| Hong Kong | 7.3 | |||
| Germany | 6.9 | |||
| France | 4.7 | |||
| Canada | 4.3 | |||
| South Africa | 3.9 | |||
| South Korea | 3.1 | |||
1 Represents countries that are 3% or more of net assets. | ||||
2 Securities are categorized by the country of their headquarters. | ||||
| The Royce Funds 2012 Annual Report to Shareholders | 39 |
| Royce International Micro-Cap Fund | ||
| AVERAGE ANNUAL TOTAL RETURNS Through 12/31/12 | ||||||||||
| July–December 20121 | 9.07 | % | ||||||||
| One-Year | 13.59 | |||||||||
| Since Inception (12/31/10) | -5.58 | |||||||||
| ANNUAL EXPENSE RATIOS | ||||||||||
| Gross Operating Expenses | 4.01 | % | ||||||||
| Net Operating Expenses | 1.78 | |||||||||
| 1 Not annualized | ||||||||||
| CALENDAR YEAR TOTAL RETURNS | ||||||||||
| Year | RMI | Year | RMI | |||||||
| 2012 | 13.6 | % | 2011 | -21.5% | % | |||||
| TOP 10 POSITIONS % of Net Assets | ||||||||||
| Vetoquinol | 1.5 | % | ||||||||
| Semperit AG Holding | 1.5 | |||||||||
| Nihon M&A Center | 1.4 | |||||||||
| Manutan International | 1.3 | |||||||||
| MegaStudy | 1.3 | |||||||||
| Miraial | 1.2 | |||||||||
| Parrot | 1.2 | |||||||||
| CSE Global | 1.2 | |||||||||
| Evolution Mining | 1.2 | |||||||||
| Elektrobudowa | 1.2 | |||||||||
| PORTFOLIO SECTOR BREAKDOWN % of Net Assets | ||||||||||
| Consumer Discretionary | 25.3 | % | ||||||||
| Industrials | 19.4 | |||||||||
| Materials | 13.8 | |||||||||
| Information Technology | 13.3 | |||||||||
| Health Care | 12.0 | |||||||||
| Financials | 6.3 | |||||||||
| Energy | 2.7 | |||||||||
| Consumer Staples | 1.7 | |||||||||
| Cash and Cash Equivalents | 5.5 | |||||||||
 | |||||||||
Manager’s Discussion International smaller companies perked up substantially over the course of the year’s second half to register solid gains for the full calendar year. Investors looked past several developments including a renewed recession in the eurozone and a worrisome deceleration in economic activity in China and other important emerging market economies and were ultimately rewarded with solid full year gains. Calendar-year results for Royce International Micro-Cap Fund (RMI) were solid from an absolute standpoint, but a bit disappointing on a relative basis. The Fund advanced 13.6% in 2012, lagging its benchmark, the Russell Global ex-US Small Cap Index, which rose 18.8% for the same period. The first half of 2012 saw similarly ample volatility for markets outside the U.S. and, while correlation was not quite as high as it was in prior years, returns stayed within a fairly narrow range. The first quarter was a generally bullish period that saw the Fund rise 15.7%, outpacing its international small-cap benchmark’s rise of 14.4%. The rally was short lived, however, as the aforementioned concerns about Europe, China, and the U.S. once again led to an exodus from stocks and thus extended the range-bound, risk-on/risk-off return pattern that has characterized the market for much of the past several years. The result was a disappointing second quarter for nearly all equity investors. April witnessed modest losses before May took a turn as the cruelest month. Several non-U.S. indexes showed double-digit losses before markets began to stabilize in June, helped by a powerful rally on the last trading day of the month. Given our disciplined and risk-averse approach, we were a bit disappointed that the Fund did not hold up better during this volatile period. RMI fell 10.0% in the second quarter, while its benchmark declined 8.5%.The Fund’s underperformance came in part from disappointing results from two overweight sectors—Materials and Consumer Discretionary. Small-cap prices across the globe reached a low on June 4, 2012. In the more bullish third quarter, RMI lost some ground to the international small-cap index, climbing 7.3% while the benchmark rallied 8.3%. The fourth quarter offered more of the same, albeit in a more volatile fashion. October saw some retrenchment of previous gains followed by a steady rally in equity prices through the end of the year. RMI added 1.6% in the final quarter of 2012 compared to a 4.8% gain for the Russell Global ex-U.S. Small Cap Index during the same period. Much of | |||||||||
| 40 | The Royce Funds 2012 Annual Report to Shareholders |
Performance and Portfolio Review this drag came from poor performance from holdings in the metals & mining industry, which is part of the Materials sector. While shorter-term results have been short of what we expect, we are confident that our disciplined approach can achieve strong absolute returns over the long term. Two of the Fund’s eight equity sectors finished 2012 in the red, though only the Materials sector posted substantial net losses. This was primarily due to poor results from holdings in the metals & mining group, where several companies suffered mostly from the combination of weaker precious metals prices and increased operating costs for miners. In March and July we built our stake in Canadian gold miner Richmont Mines as its price slid. Its near-term prospects were then seriously hurt by a dramatic reduction in reserve estimates at one of its properties. While the company has two mines in production—always a significant advantage for mining firms—that are both located in Canada, its recent difficulties, including its plummeting share price, were enough to convince us to sell our position in October. Based in Lancashire, England, Promethean World develops interactive learning software and other technologies. Recent substantial sales declines in North America were not offset by the company’s net gains from the rest of the world, which led to revised earnings guidance for fiscal 2012 and a commensurately weaker share price. We sold our shares early in July. Two purchases in March more than doubled our position in Vancouver, British Columbia-based Goldgroup Mining, signaling our confidence in the ability of its shares to recover. We like its pristine balance sheet, its management, and the fact that it is a smaller miner with proven gold-producing properties. Information Technology and Consumer Discretionary led all sectors in 2012, followed by Industrials and Financials. At the industry level, electronic equipment, instruments & component, and machinery took top honors, with the only notable detractor being the metals & mining industry. Based in Kuala Lumpur, Malaysia, Padini was the top individual performer for the Fund in 2012. Structured as an investment holding company with subsidiaries that distributes apparel, footwear, and accessories under seven different brands, strong cost management and stellar revenue growth allowed the company to increased margins and drive powerful earnings growth. We took gains between May and September. A second-half surge was the prescription for a healthy year for Daewoong Pharmaceuticals, a company with the largest prescription drug sales in Korea. Its rising stock price led us to sell our shares between September and November. Based in Paris, Parrot has invented several Bluetooth peripherals and released a number of well-received products in 2012, leading investors to embrace shares that still looked inexpensive to us at the end of the year. |
 |
| Includes reinvestment of distributions. | |||
| PORTFOLIO DIAGNOSTICS | |||
| Fund Net Assets | $5 million | ||
| Number of Holdings | 116 | ||
| Turnover Rate | 62% | ||
| Average Market Capitalization1 | $339 million | ||
| Weighted Average P/E Ratio2,3 | 10.4x | ||
| Weighted Average P/B Ratio2 | 1.4x | ||
| Symbol | ROIMX | ||
1 Geometric Average. This weighted calculation uses each portfolio holding’s market cap in a way designed to not skew the effect of very large or small holdings; instead, it aims to better identify the portfolio’s center, which Royce believes offers a more accurate measure of average market cap than a simple mean or median. | |||
2 Harmonic Average. This weighted calculation evaluates a portfolio as if it were a single stock and measures it overall. It compares the total market value of the portfolio to the portfolio’s share in the earnings or book value, as the case may be, of its underlying stocks. | |||
| PORTFOLIO COUNTRY BREAKDOWN1,2 % of Net Assets | |||
| France | 11.2% | ||
| Hong Kong | 9.9 | ||
| Japan | 9.7 | ||
| United Kingdom | 5.4 | ||
| Germany | 4.9 | ||
| Australia | 4.5 | ||
| Switzerland | 4.5 | ||
| India | 4.0 | ||
| Malaysia | 3.8 | ||
| Canada | 3.5 | ||
| South Africa | 3.1 | ||
| Italy | 3.1 | ||
1 Represents countries that are 3% or more of net assets. | |||
2 Securities are categorized by the country of their headquarters. | |||
| The Royce Funds 2012 Annual Report to Shareholders | 41 |
| Royce International Premier Fund | ||
| AVERAGE ANNUAL TOTAL RETURNS Through 12/31/12 | ||||||||||
| July–December 20121 | 13.63 | % | ||||||||
| One-Year | 23.40 | |||||||||
| Since Inception (12/31/10) | 1.36 | |||||||||
| ANNUAL EXPENSE RATIOS | ||||||||||
| Gross Operating Expenses | 3.77 | % | ||||||||
| Net Operating Expenses | 1.69 | |||||||||
| 1 Not annualized | ||||||||||
| CALENDAR YEAR TOTAL RETURNS | ||||||||||
| Year | RIP | Year | RIP | |||||||
| 2012 | 23.4 | % | 2011 | -16.8 | % | |||||
| TOP 10 POSITIONS % of Net Assets | ||||||||||
| Lewis Group | 3.2 | % | ||||||||
| DiaSorin | 3.1 | |||||||||
| Semperit AG Holding | 3.0 | |||||||||
| Mayr-Melnhof Karton | 3.0 | |||||||||
| Domino Printing Sciences | 2.9 | |||||||||
| MegaStudy | 2.7 | |||||||||
| MISUMI Group | 2.5 | |||||||||
| Stella International Holdings | 2.5 | |||||||||
| Partners Group Holding | 2.5 | |||||||||
| Virbac | 2.5 | |||||||||
| PORTFOLIO SECTOR BREAKDOWN % of Net Assets | ||||||||||
| Health Care | 24.1 | % | ||||||||
| Industrials | 21.4 | |||||||||
| Consumer Discretionary | 21.0 | |||||||||
| Information Technology | 10.6 | |||||||||
| Materials | 7.2 | |||||||||
| Financials | 6.5 | |||||||||
| Consumer Staples | 3.9 | |||||||||
| Cash and Cash Equivalents | 5.3 | |||||||||
| |||||||||
Managers’ Discussion We were pleased to see higher quality small-caps around the world rebound in 2012. This resurgence was reflected in the strong absolute and relative results for Royce International Premier Fund (RIP). The Fund gained 23.4% in 2012, ahead of the 18.8% increase for its benchmark, the Russell Global ex-U.S. Small Cap Index, over the same period. RIP made a fast start to the year, consistent with many non-U.S. companies, and rallied 14.8% in the first quarter while its benchmark rose 14.4%. In late March, the upturn gave way to a bearish run dominated by concerns over macroeconomic forces such as the European sovereign debt crisis, slow economic growth in the emerging economies of China and Brazil, and the sluggish pace of the U.S. recovery. For the second quarter, the Fund lost less than its benchmark, falling 5.4% compared to an 8.5% loss driven in part by portfolio strength in the Health Care (where RIP was overweight versus its benchmark) and Consumer Staples sectors. We were particularly pleased to see the Fund perform better through this brief downturn as preserving capital in down periods is always of paramount importance to us. Small-cap prices across the globe reached a low in 2012 on June 4. In the more bullish third quarter, RIP ceded some ground to the international small-cap index thanks in part to the portfolio’s underweight in the robust Financials sector. For the period the Fund climbed 6.9% while the benchmark increased 8.3%. We felt better about the Fund’s performance pattern in the fourth quarter. Stock prices in general were somewhat more volatile as the year moved toward its end, although the mostly bearish month of October proved harder on domestic issues than their overseas competitors. The Fund and its benchmark both fared well for the month and the final quarter as a whole. RIP rose 6.3% for the fourth quarter, edging out the 4.8% increase for the Russell Global ex-U.S. Small Cap Index. The Fund invests in a limited portfolio of our highest conviction ideas sourced from our international research efforts. RIP seeks what we believe are high quality non-U.S. businesses with strong balance sheets, a sustainable or competitive edge, solid-to-strong growth prospects, and a management team we see as capable of successfully guiding the business going forward. Annualized returns for the Fund over its short operating history were positive on an absolute basis, although more muted than we would like. Compared to the benchmark, however, the Fund’s disciplined approach to preserving capital and high-quality orientation provided a measure of safety and relative outperformance. For the periods ended December 31, 2012, RIP outperformed the Russell Global ex-U.S. Small Cap Index for the one-year and since inception (12/31/10) periods. | |||||||||
| 42 | The Royce Funds 2012 Annual Report to Shareholders |
Performance and Portfolio Review We were quite pleased that all eight of the Fund’s equity sectors generated positive performance in 2012, led by notably strong results from Materials, Health Care, and Industrials. Financials and Consumer Discretionary were the next strongest sectors, demonstrating solid performance from both cyclical and more traditionally defensive areas of the market. Not surprisingly, Telecommunication Services made the most modest contribution as this sector had very little representation in the Fund. At the industry level, results were also broadly positive. Machinery led by a sizable margin, followed by strong net contributions from pharmaceuticals, metals & mining, capital markets, chemicals, and textiles, apparel & luxury goods. Diversified consumer services, internet software & services, and semiconductors & semiconductor equipment formed the short list of industry groups in which the Fund suffered modest net losses. DiaSorin is an Italian business with a global presence that develops, produces, and distributes immunoreagent kits for clinical diagnostics with a focus on in vitro diagnostics. The Fund’s top performer in 2012, the company outperformed its competitors and produced solid earnings growth due in large part to its leadership position in the Vitamin D market, strong market gains in Japan, and a growing business in emerging markets. We increased our stake throughout the year. Fuchs Petrolub, a German business that refines and produces industrial and automotive lubricants, was another standout. The company benefited from growing demand, especially in emerging markets, and a decline in base oil prices, its primary raw material cost input. The result was a strong boost to earnings and profitability that drove its share price higher. MegaStudy, a South Korean educational firm that specializes in online tutoring and test preparation, was the most challenging position for the just completed year. Based on our confidence in the company’s long-term prospects in this rapidly growing field, we added to our position as its stock price fell on disappointing results for its business that stemmed from increased competition. We had less confidence in the ongoing prospects for Lung Kee, a Hong Kong based manufacturer of mold bases. The company saw pressure on its share price caused by declining demand for some of its key products. A new position for the Fund, it suffered from concerns over the credit crisis in Europe as well as the slowdown in domestic consumption in China, both of which led to a reduction in orders from its customers. Inflation on the ground in China also led to an increase in its input costs. We sold our shares in July. |
 |
| Includes reinvestment of distributions. | |||
| PORTFOLIO DIAGNOSTICS | |||
| Fund Net Assets | $6 million | ||
| Number of Holdings | 47 | ||
| Turnover Rate | 103% | ||
| Average Market Capitalization1 | $1,745 million | ||
| Weighted Average P/E Ratio2,3 | 16.6x | ||
| Weighted Average P/B Ratio2 | 3.0x | ||
| Symbol | RYIPX | ||
1 Geometric Average. This weighted calculation uses each portfolio holding’s market cap in a way designed to not skew the effect of very large or small holdings; instead, it aims to better identify the portfolio’s center, which Royce believes offers a more accurate measure of average market cap than a simple mean or median. | |||
2 Harmonic Average. This weighted calculation evaluates a portfolio as if it were a single stock and measures it overall. It compares the total market value of the portfolio to the portfolio’s share in the earnings or book value, as the case may be, of its underlying stocks. | |||
| PORTFOLIO COUNTRY BREAKDOWN1,2 % of Net Assets | |||
| United Kingdom | 16.7% | ||
| Switzerland | 14.7 | ||
| Germany | 11.3 | ||
| Japan | 10.7 | ||
| France | 7.9 | ||
| Austria | 6.0 | ||
| Italy | 5.2 | ||
| South Korea | 4.8 | ||
| Hong Kong | 3.9 | ||
| South Africa | 3.2 | ||
1 Represents countries that are 3% or more of net assets. | |||
2 Securities are categorized by the country of their headquarters. | |||
| The Royce Funds 2012 Annual Report to Shareholders | 43 |
Schedules of Investments
| Royce Select Fund I |
| SHARES | VALUE | ||||
| COMMON STOCKS – 92.9% | |||||
| Consumer Discretionary – 8.7% | |||||
| Auto Components - 2.1% | |||||
Drew Industries | 20,296 | $ | 654,546 | ||
Gentex Corporation | 20,300 | 382,046 | |||
| 1,036,592 | |||||
| Automobiles - 0.9% | |||||
Thor Industries | 11,900 | 445,417 | |||
| Diversified Consumer Services - 1.7% | |||||
Sotheby’s | 24,592 | 826,783 | |||
| Specialty Retail - 2.6% | |||||
†Ascena Retail Group 1 | 38,300 | 708,167 | |||
Men’s Wearhouse (The) | 19,200 | 598,272 | |||
| 1,306,439 | |||||
| Textiles, Apparel & Luxury Goods - 1.4% | |||||
Columbia Sportswear | 13,327 | 711,129 | |||
| Total (Cost $3,623,544) | 4,326,360 | ||||
| Consumer Staples – 1.0% | |||||
| Food Products - 1.0% | |||||
Cal-Maine Foods | 11,978 | 481,755 | |||
| Total (Cost $330,711) | 481,755 | ||||
| Energy – 13.9% | |||||
| Energy Equipment & Services - 13.9% | |||||
CARBO Ceramics | 3,400 | 266,356 | |||
Helmerich & Payne | 25,400 | 1,422,654 | |||
Oil States International 1 | 20,300 | 1,452,262 | |||
Pason Systems | 45,400 | 782,759 | |||
ShawCor Cl. A | 26,200 | 1,026,981 | |||
†Superior Energy Services 1 | 33,100 | 685,832 | |||
†Trican Well Service | 43,400 | 572,442 | |||
Unit Corporation 1 | 16,150 | 727,557 | |||
| Total (Cost $5,075,599) | 6,936,843 | ||||
| Financials – 5.9% | |||||
| Capital Markets - 3.3% | |||||
Lazard Cl. A | 28,000 | 835,520 | |||
SEI Investments | 35,100 | 819,234 | |||
| 1,654,754 | |||||
| Insurance - 2.6% | |||||
Alleghany Corporation 1 | 3,905 | 1,309,815 | |||
| Total (Cost $2,381,550) | 2,964,569 | ||||
| Health Care – 4.3% | |||||
| Health Care Providers & Services - 1.3% | |||||
VCA Antech 1 | 30,877 | 649,961 | |||
| Life Sciences Tools & Services - 3.0% | |||||
Bio-Rad Laboratories Cl. A 1 | 9,000 | 945,450 | |||
ICON ADR 1 | 18,824 | 522,554 | |||
| 1,468,004 | |||||
| Total (Cost $1,721,749) | 2,117,965 | ||||
| Industrials – 26.6% | |||||
| Aerospace & Defense - 1.3% | |||||
Teledyne Technologies 1 | 9,828 | 639,508 | |||
| Building Products - 1.6% | |||||
Apogee Enterprises | 33,732 | 808,556 | |||
| Commercial Services & Supplies - 3.6% | |||||
Sykes Enterprises 1 | 29,400 | 447,468 | |||
Tetra Tech 1 | 51,100 | 1,351,595 | |||
| 1,799,063 | |||||
| Electrical Equipment - 5.6% | |||||
AZZ | 22,710 | 872,745 | |||
†Global Power Equipment Group | 40,218 | 689,739 | |||
GrafTech International 1 | 133,859 | 1,256,936 | |||
| 2,819,420 | |||||
| Machinery - 7.9% | |||||
Astec Industries | 20,000 | 666,600 | |||
Gardner Denver | 4,300 | 294,550 | |||
Kennametal | 25,000 | 1,000,000 | |||
Lincoln Electric Holdings | 14,850 | 722,898 | |||
Valmont Industries | 5,600 | 764,680 | |||
Wabtec Corporation | 5,775 | 505,543 | |||
| 3,954,271 | |||||
| Professional Services - 5.4% | |||||
CRA International 1 | 24,279 | 479,996 | |||
Robert Half International | 45,900 | 1,460,538 | |||
†TrueBlue 1 | 46,900 | 738,675 | |||
| 2,679,209 | |||||
| Trading Companies & Distributors - 1.2% | |||||
MSC Industrial Direct Cl. A | 7,752 | 584,346 | |||
| Total (Cost $10,487,113) | 13,284,373 | ||||
| Information Technology – 19.8% | |||||
| Communications Equipment - 1.8% | |||||
ADTRAN | 47,300 | 924,242 | |||
| Electronic Equipment, Instruments & Components - 7.0% | |||||
Coherent | 14,881 | 753,276 | |||
Dolby Laboratories Cl. A | 25,200 | 739,116 | |||
†FARO Technologies 1 | 13,700 | 488,816 | |||
FEI Company | 4,852 | 269,092 | |||
IPG Photonics | 7,090 | 472,548 | |||
Rofin-Sinar Technologies 1 | 35,564 | 771,028 | |||
| 3,493,876 | |||||
| Office Electronics - 0.8% | |||||
Zebra Technologies Cl. A 1 | 9,900 | 388,872 | |||
| Semiconductors & Semiconductor Equipment - 10.2% | |||||
Aixtron ADR | 39,700 | 474,415 | |||
ATMI 1 | 39,400 | 822,672 | |||
Cabot Microelectronics | 15,091 | 535,882 | |||
Integrated Silicon Solution 1 | 78,000 | 702,000 | |||
Nanometrics 1 | 68,200 | 983,444 | |||
Teradyne 1 | 67,500 | 1,140,075 | |||
Veeco Instruments 1 | 14,100 | 416,232 | |||
| 5,074,720 | |||||
| Total (Cost $9,629,275) | 9,881,710 | ||||
| 44 | The Royce Funds 2012 Annual Report to Shareholders | THE ACCOMPANYING NOTES ARE AN INTEGRAL PART OF THESE FINANCIAL STATEMENTS. |
December 31, 2012 |
| SHARES | VALUE | |||||
| Materials – 12.7% | ||||||
| Chemicals - 6.6% | ||||||
Intrepid Potash | 57,958 | $ | 1,233,926 | |||
KMG Chemicals | 14,256 | 250,478 | ||||
LSB Industries 1 | 21,351 | 756,252 | ||||
Minerals Technologies | 25,740 | 1,027,541 | ||||
| 3,268,197 | ||||||
| Metals & Mining - 6.1% | ||||||
Allied Nevada Gold 1 | 10,100 | 304,313 | ||||
Major Drilling Group International | 73,300 | 722,168 | ||||
Reliance Steel & Aluminum | 24,800 | 1,540,080 | ||||
Sims Metal Management ADR | 49,370 | 486,788 | ||||
| 3,053,349 | ||||||
| Total (Cost $5,598,645) | 6,321,546 | |||||
| TOTAL COMMON STOCKS | ||||||
(Cost $38,848,186) | 46,315,121 | |||||
| REPURCHASE AGREEMENT – 7.2% | ||||||
Fixed Income Clearing Corporation, | 3,611,000 | |||||
| TOTAL INVESTMENTS – 100.1% | ||||||
(Cost $42,459,186) | 49,926,121 | |||||
| LIABILITIES LESS CASH | ||||||
AND OTHER ASSETS – (0.1)% | (70,000 | ) | ||||
| NET ASSETS – 100.0% | $ | 49,856,121 | ||||
| Royce Micro-Cap Discovery Fund |
| SHARES | VALUE | ||||
| COMMON STOCKS – 95.6% | |||||
| Consumer Discretionary – 10.3% | |||||
| Auto Components - 1.6% | |||||
Standard Motor Products | 3,200 | $ | 71,104 | ||
| Diversified Consumer Services - 2.8% | |||||
Capella Education 1 | 1,800 | 50,814 | |||
†Corinthian Colleges 1 | 17,800 | 43,432 | |||
Universal Technical Institute | 3,000 | 30,120 | |||
| 124,366 | |||||
| Hotels, Restaurants & Leisure - 1.0% | |||||
†Ruby Tuesday 1 | 5,500 | 43,230 | |||
| Household Durables - 0.5% | |||||
Hooker Furniture | 1,500 | 21,795 | |||
| Leisure Equipment & Products - 2.3% | |||||
Arctic Cat 1 | 1,700 | 56,763 | |||
†Johnson Outdoors Cl. A 1 | 2,400 | 47,808 | |||
| 104,571 | |||||
| Specialty Retail - 1.3% | |||||
†Stage Stores | 900 | 22,302 | |||
Stein Mart | 5,100 | 38,454 | |||
| 60,756 | |||||
| Textiles, Apparel & Luxury Goods - 0.8% | |||||
†True Religion Apparel | 1,400 | 35,588 | |||
| Total (Cost $451,990) | 461,410 | ||||
| Consumer Staples – 2.1% | |||||
| Food & Staples Retailing - 0.9% | |||||
Village Super Market Cl. A | 1,300 | 42,718 | |||
| Food Products - 1.2% | |||||
†Calavo Growers | 2,100 | 52,941 | |||
| Total (Cost $99,809) | 95,659 | ||||
| Energy – 5.8% | |||||
| Energy Equipment & Services - 1.7% | |||||
Matrix Service 1 | 3,300 | 37,950 | |||
†Natural Gas Services Group 1 | 2,200 | 36,124 | |||
| 74,074 | |||||
| Oil, Gas & Consumable Fuels - 4.1% | |||||
EPL Oil & Gas 1 | 2,200 | 49,610 | |||
TransGlobe Energy 1 | 3,500 | 32,830 | |||
VAALCO Energy 1 | 7,200 | 62,280 | |||
Warren Resources 1 | 14,000 | 39,340 | |||
| 184,060 | |||||
| Total (Cost $228,940) | 258,134 | ||||
| Financials – 5.0% | |||||
| Consumer Finance - 1.0% | |||||
Nicholas Financial | 3,500 | 43,400 | |||
| Insurance - 4.0% | |||||
American Safety Insurance Holdings 1 | 1,900 | 35,948 | |||
EMC Insurance Group | 1,500 | 35,820 | |||
Maiden Holdings | 6,100 | 56,059 | |||
| THE ACCOMPANYING NOTES ARE AN INTEGRAL PART OF THESE FINANCIAL STATEMENTS. | The Royce Funds 2012 Annual Report to Shareholders | 45 |
Schedules of Investments
| Royce Micro-Cap Discovery Fund (continued) |
| SHARES | VALUE | ||||
| Financials (continued) | |||||
| Insurance (continued) | |||||
Navigators Group 1 | 1,000 | $ | 51,070 | ||
| 178,897 | |||||
| Total (Cost $221,632) | 222,297 | ||||
| Health Care – 9.5% | |||||
| Health Care Equipment & Supplies - 4.3% | |||||
ICU Medical 1 | 900 | 54,837 | |||
†Invacare Corporation | 3,500 | 57,050 | |||
Young Innovations | 2,000 | 78,820 | |||
| 190,707 | |||||
| Health Care Providers & Services - 1.5% | |||||
Almost Family | 1,100 | 22,286 | |||
†National HealthCare | 1,000 | 47,020 | |||
| 69,306 | |||||
| Pharmaceuticals - 3.7% | |||||
Hi-Tech Pharmacal | 2,460 | 86,051 | |||
Obagi Medical Products 1 | 3,600 | 48,924 | |||
SciClone Pharmaceuticals 1 | 6,700 | 28,877 | |||
| 163,852 | |||||
| Total (Cost $374,036) | 423,865 | ||||
| Industrials – 18.6% | |||||
| Aerospace & Defense - 2.2% | |||||
†AeroVironment 1 | 2,000 | 43,480 | |||
National Presto Industries | 800 | 55,280 | |||
| 98,760 | |||||
| Commercial Services & Supplies - 2.2% | |||||
Intersections | 3,200 | 30,336 | |||
†Sykes Enterprises 1 | 4,300 | 65,446 | |||
| 95,782 | |||||
| Construction & Engineering - 4.8% | |||||
†Aegion Corporation 1 | 1,700 | 37,723 | |||
Baker (Michael) | 1,100 | 27,423 | |||
Comfort Systems USA | 2,800 | 34,048 | |||
MYR Group 1 | 2,900 | 64,525 | |||
†Primoris Services | 3,500 | 52,640 | |||
| 216,359 | |||||
| Industrial Conglomerates - 1.8% | |||||
†Standex International | 1,600 | 82,064 | |||
| Machinery - 4.6% | |||||
Alamo Group | 2,000 | 65,280 | |||
Foster (L.B.) Company | 750 | 32,580 | |||
†Lydall 1 | 2,500 | 35,850 | |||
Miller Industries | 4,720 | 71,980 | |||
| 205,690 | |||||
| Professional Services - 3.0% | |||||
ICF International 1 | 900 | 21,096 | |||
†Korn/Ferry International 1 | 3,000 | 47,580 | |||
†TrueBlue 1 | 4,000 | 63,000 | |||
| 131,676 | |||||
| Total (Cost $808,258) | 830,331 | ||||
| Information Technology – 25.6% | |||||
| Communications Equipment - 4.6% | |||||
Bel Fuse Cl. B | 1,000 | 19,550 | |||
Comtech Telecommunications | 1,900 | 48,222 | |||
Globecomm Systems 1 | 5,900 | 66,670 | |||
†TESSCO Technologies | 3,100 | 68,634 | |||
| 203,076 | |||||
| Computers & Peripherals - 3.3% | |||||
†QLogic Corporation 1 | 5,100 | 49,623 | |||
Super Micro Computer 1 | 5,600 | 57,120 | |||
Xyratex | 4,700 | 39,527 | |||
| 146,270 | |||||
| Electronic Equipment, Instruments & Components - 2.1% | |||||
Multi-Fineline Electronix 1 | 1,650 | 33,346 | |||
†PC Connection | 5,300 | 60,950 | |||
| 94,296 | |||||
| Internet Software & Services - 4.1% | |||||
†Dice Holdings 1 | 4,600 | 42,228 | |||
†Digital River 1 | 3,300 | 47,487 | |||
†QuinStreet 1 | 7,000 | 47,040 | |||
United Online | 8,500 | 47,515 | |||
| 184,270 | |||||
| IT Services - 2.6% | |||||
Computer Task Group 1 | 4,700 | 85,681 | |||
TeleTech Holdings 1 | 1,700 | 30,260 | |||
| 115,941 | |||||
| Semiconductors & Semiconductor Equipment - 4.7% | |||||
†Cabot Microelectronics | 1,500 | 53,265 | |||
Integrated Silicon Solution 1 | 2,900 | 26,100 | |||
IXYS Corporation | 6,600 | 60,324 | |||
Kulicke & Soffa Industries 1 | 6,000 | 71,940 | |||
| 211,629 | |||||
| Software - 4.2% | |||||
Actuate Corporation 1 | 10,300 | 57,680 | |||
American Software Cl. A | 9,700 | 75,272 | |||
ePlus | 1,300 | 53,742 | |||
| 186,694 | |||||
| Total (Cost $1,122,418) | 1,142,176 | ||||
| Materials – 14.1% | |||||
Chemicals - 6.4% | |||||
†FutureFuel Corporation | 5,700 | 67,488 | |||
Innospec | 1,600 | 55,184 | |||
†KMG Chemicals | 3,200 | 56,224 | |||
Schulman (A.) | 2,200 | 63,646 | |||
Stepan Company | 800 | 44,432 | |||
| 286,974 | |||||
| Metals & Mining - 6.3% | |||||
Aurizon Mines 1 | 10,600 | 36,888 | |||
Endeavour Silver 1 | 3,900 | 30,771 | |||
†Haynes International | 1,100 | 57,057 | |||
Horsehead Holding Corporation 1 | 3,912 | 39,942 | |||
Materion Corporation | 3,200 | 82,496 | |||
| 46 | The Royce Funds 2012 Annual Report to Shareholders | THE ACCOMPANYING NOTES ARE AN INTEGRAL PART OF THESE FINANCIAL STATEMENTS. |
December 31, 2012 |
| SHARES | VALUE | |||||
| Materials (continued) | ||||||
| Metals & Mining (continued) | ||||||
†Nevsun Resources | 8,100 | $ | 34,668 | |||
| 281,822 | ||||||
| Paper & Forest Products - 1.4% | ||||||
†Glatfelter | 3,600 | 62,928 | ||||
| Total (Cost $577,815) | 631,724 | |||||
| Miscellaneous 3 – 4.6% | ||||||
| Total (Cost $201,785) | 205,016 | |||||
| TOTAL COMMON STOCKS | ||||||
(Cost $4,086,683) | 4,270,612 | |||||
| REPURCHASE AGREEMENT – 4.7% | ||||||
Fixed Income Clearing Corporation, | 211,000 | |||||
| TOTAL INVESTMENTS – 100.3% | ||||||
(Cost $4,297,683) | 4,481,612 | |||||
| LIABILITIES LESS CASH | ||||||
AND OTHER ASSETS – (0.3)% | (13,386 | ) | ||||
| NET ASSETS – 100.0% | $ | 4,468,226 | ||||
| Royce Financial Services Fund |
| SHARES | VALUE | ||||
| COMMON STOCKS – 96.4% | |||||
| Capital Markets - 60.1% | |||||
Affiliated Managers Group 1 | 1,500 | $ | 195,225 | ||
AllianceBernstein Holding L.P. | 23,300 | 406,119 | |||
Apollo Global Management LLC Cl. A | 22,000 | 381,920 | |||
Artio Global Investors Cl. A | 25,000 | 47,500 | |||
Ashmore Group | 70,000 | 404,762 | |||
Banque Privee Edmond de Rothschild | 3 | 59,913 | |||
Blackstone Group L.P. | 16,300 | 254,117 | |||
Citadel Capital 1 | 150,000 | 91,038 | |||
Coronation Fund Managers | 62,000 | 290,480 | |||
Cowen Group 1 | 83,000 | 203,350 | |||
Daewoo Securities | 3,800 | 43,104 | |||
Diamond Hill Investment Group | 2,500 | 169,650 | |||
Egyptian Financial Group-Hermes Holding Company 1 | 31,875 | 55,230 | |||
Federated Investors Cl. B | 11,900 | 240,737 | |||
†Financial Engines 1 | 6,800 | 188,700 | |||
Invesco | 13,800 | 360,042 | |||
Investec | 8,500 | 57,894 | |||
IOOF Holdings | 11,528 | 87,487 | |||
Jefferies Group | 12,100 | 224,697 | |||
Jupiter Fund Management | 105,000 | 487,344 | |||
KKR & Co. L.P. | 18,300 | 278,709 | |||
Lazard Cl. A | 11,300 | 337,192 | |||
Manning & Napier | 17,800 | 224,280 | |||
MVC Capital | 3,800 | 46,170 | |||
Northern Trust | 8,400 | 421,344 | |||
†Oaktree Capital Group LLC | 6,100 | 277,489 | |||
Och-Ziff Capital Management Group LLC Cl. A | 15,300 | 145,350 | |||
Oppenheimer Holdings Cl. A | 11,500 | 198,605 | |||
Partners Group Holding | 1,000 | 230,971 | |||
Raymond James Financial | 5,100 | 196,503 | |||
Reinet Investments 1 | 5,500 | 100,302 | |||
Samsung Securities | 1,791 | 90,079 | |||
SEI Investments | 18,400 | 429,456 | |||
SHUAA Capital 1 | 580,000 | 86,747 | |||
Sprott | 70,500 | 280,667 | |||
†State Street | 8,500 | 399,585 | |||
Stifel Financial 1 | 6,073 | 194,154 | |||
T. Rowe Price Group | 3,500 | 227,955 | |||
†TD AMERITRADE Holding Corporation | 15,500 | 260,555 | |||
Tokai Tokyo Financial Holdings | 9,400 | 43,102 | |||
U.S. Global Investors Cl. A | 51,100 | 204,911 | |||
UOB-Kay Hian Holdings | 95,000 | 127,011 | |||
Value Partners Group | 430,000 | 288,655 | |||
Vontobel Holding | 3,000 | 92,630 | |||
Waddell & Reed Financial Cl. A | 5,900 | 205,438 | |||
Westwood Holdings Group | 5,300 | 216,770 | |||
WisdomTree Investments 1 | 48,000 | 293,760 | |||
| Total (Cost $9,747,792) | 10,147,699 | ||||
| THE ACCOMPANYING NOTES ARE AN INTEGRAL PART OF THESE FINANCIAL STATEMENTS. | The Royce Funds 2012 Annual Report to Shareholders | 47 |
Schedules of Investments
| Royce Financial Services Fund (continued) |
| SHARES | VALUE | ||||
| Closed-End Funds - 0.9% | |||||
†RIT Capital Partners | 8,500 | $ | 156,419 | ||
| Total (Cost $153,505) | 156,419 | ||||
| Commercial Banks - 3.0% | |||||
BLOM Bank GDR | 8,000 | 63,200 | |||
BOK Financial | 4,600 | 250,516 | |||
First Republic Bank | 5,600 | 183,568 | |||
| Total (Cost $435,273) | 497,284 | ||||
| Consumer Finance - 3.6% | |||||
Credit Acceptance 1 | 848 | 86,225 | |||
†Regional Management 1 | 18,200 | 301,210 | |||
World Acceptance 1 | 3,000 | 223,680 | |||
| Total (Cost $414,103) | 611,115 | ||||
| Diversified Financial Services - 7.7% | |||||
Bolsas y Mercados Espanoles | 4,000 | 96,684 | |||
Hellenic Exchanges | 36,000 | 207,437 | |||
Interactive Brokers Group | 12,800 | 175,104 | |||
†Moody’s Corporation | 6,000 | 301,920 | |||
MSCI Cl. A 1 | 2,800 | 86,772 | |||
RHJ International 1 | 10,000 | 52,570 | |||
Singapore Exchange | 25,000 | 144,935 | |||
Warsaw Stock Exchange | 19,000 | 238,913 | |||
| Total (Cost $1,288,610) | 1,304,335 | ||||
| Insurance - 9.0% | |||||
Brown & Brown | 2,600 | 66,196 | |||
E-L Financial | 400 | 174,927 | |||
First American Financial | 5,000 | 120,450 | |||
Greenlight Capital Re Cl. A 1 | 9,000 | 207,720 | |||
Marsh & McLennan | 7,400 | 255,078 | |||
Platinum Underwriters Holdings | 5,500 | 253,000 | |||
RLI Corp. | 1,100 | 71,126 | |||
State Auto Financial | 11,000 | 164,340 | |||
Willis Group Holdings | 6,100 | 204,533 | |||
| Total (Cost $1,313,031) | 1,517,370 | ||||
| IT Services - 3.3% | |||||
MasterCard Cl. A | 700 | 343,896 | |||
†Vantiv Cl. A 1 | 10,000 | 204,200 | |||
| Total (Cost $293,957) | 548,096 | ||||
| Media - 1.7% | |||||
Morningstar | 4,600 | 289,018 | |||
| Total (Cost $181,189) | 289,018 | ||||
| Professional Services - 1.7% | |||||
Verisk Analytics Cl. A 1 | 5,600 | 285,600 | |||
| Total (Cost $177,018) | 285,600 | ||||
| Real Estate Management & Development - 1.6% | |||||
Kennedy-Wilson Holdings | 19,676 | 275,070 | |||
| Total (Cost $186,246) | 275,070 | ||||
| Software - 1.8% | |||||
Fair Isaac | 7,400 | 311,022 | |||
| Total (Cost $153,499) | 311,022 | ||||
| Trading Companies & Distributors - 2.0% | |||||
Air Lease Cl. A 1 | 15,700 | 337,550 | |||
| Total (Cost $356,874) | 337,550 | ||||
| TOTAL COMMON STOCKS | |||||
(Cost $14,701,097) | 16,280,578 | ||||
| REPURCHASE AGREEMENT – 2.0% | |||||
| Fixed Income Clearing Corporation, 0.10% dated 12/31/12, due 1/2/13, maturity value $342,002 (collateralized by obligations of various U.S. Government Agencies, 0.75% due 8/15/13, valued at $352,297) (Cost $342,000) | 342,000 | ||||
| TOTAL INVESTMENTS – 98.4% | |||||
(Cost $15,043,097) | 16,622,578 | ||||
| CASH AND OTHER ASSETS | |||||
LESS LIABILITIES – 1.6% | 265,809 | ||||
| NET ASSETS – 100.0% | $ | 16,888,387 | |||
| 48 | The Royce Funds 2012 Annual Report to Shareholders | THE ACCOMPANYING NOTES ARE AN INTEGRAL PART OF THESE FINANCIAL STATEMENTS. |
December 31, 2012 |
| Royce Select Fund II |
| SHARES | VALUE | ||||
| COMMON STOCKS – 97.0% | |||||
| Consumer Discretionary – 16.0% | |||||
| Auto Components - 2.9% | |||||
Drew Industries 2 | 1,201 | $ | 38,732 | ||
Minth Group | 57,900 | 66,967 | |||
| 105,699 | |||||
| Internet & Catalog Retail - 1.0% | |||||
†CafePress 1 | 6,500 | 37,505 | |||
| Media - 1.1% | |||||
†IMAX Corporation 1 | 1,700 | 38,216 | |||
| Multiline Retail - 0.5% | |||||
New World Department Store China | 30,000 | 19,529 | |||
| Specialty Retail - 7.9% | |||||
†Abercrombie & Fitch Cl. A 2 | 1,500 | 71,955 | |||
American Eagle Outfitters 2 | 1,100 | 22,561 | |||
GameStop Corporation Cl. A | 1,200 | 30,108 | |||
Guess? | 700 | 17,178 | |||
Luk Fook Holdings (International) | 7,300 | 23,426 | |||
Signet Jewelers 2 | 1,300 | 69,420 | |||
†Stage Stores | 900 | 22,302 | |||
Tiffany & Co. | 500 | 28,670 | |||
| 285,620 | |||||
| Textiles, Apparel & Luxury Goods - 2.6% | |||||
Daphne International Holdings | 33,900 | 46,960 | |||
Stella International Holdings | 16,700 | 45,270 | |||
| 92,230 | |||||
| Total (Cost $474,323) | 578,799 | ||||
| Consumer Staples – 0.8% | |||||
| Food Products - 0.8% | |||||
First Resources | 16,800 | 27,987 | |||
| Total (Cost $18,385) | 27,987 | ||||
| Energy – 7.6% | |||||
Energy Equipment & Services - 7.6% | |||||
†C&J Energy Services 1 | 1,500 | 32,160 | |||
Helmerich & Payne | 1,890 | 105,859 | |||
RPC | 4,400 | 53,856 | |||
TGS-NOPEC Geophysical | 900 | 29,493 | |||
Total Energy Services | 3,600 | 54,252 | |||
| Total (Cost $229,959) | 275,620 | ||||
| Financials – 10.4% | |||||
| Capital Markets - 8.4% | |||||
Ashmore Group | 9,500 | 54,932 | |||
†Federated Investors Cl. B 2 | 2,900 | 58,667 | |||
Lazard Cl. A | 1,300 | 38,792 | |||
Sprott | 15,800 | 62,901 | |||
Value Partners Group | 131,700 | 88,409 | |||
| 303,701 | |||||
| Real Estate Management & Development - 2.0% | |||||
E-House China Holdings ADR 2 | 9,400 | 38,540 | |||
Midland Holdings | 69,300 | 33,653 | |||
| 72,193 | |||||
| Total (Cost $424,989) | 375,894 | ||||
| Health Care – 4.8% | |||||
| Health Care Equipment & Supplies - 3.6% | |||||
Analogic Corporation 2 | 700 | 52,010 | |||
†Invacare Corporation | 2,700 | 44,010 | |||
Kossan Rubber Industries | 32,635 | 35,850 | |||
| 131,870 | |||||
| Pharmaceuticals - 1.2% | |||||
Hi-Tech Pharmacal | 1,200 | 41,976 | |||
| Total (Cost $162,448) | 173,846 | ||||
| Industrials – 10.9% | |||||
| Aerospace & Defense - 2.5% | |||||
AeroVironment 1 | 1,500 | 32,610 | |||
†Astronics Corporation 1 | 2,530 | 57,886 | |||
| 90,496 | |||||
| Commercial Services & Supplies - 1.4% | |||||
Team 1,2 | 1,344 | 51,126 | |||
| Construction & Engineering - 1.3% | |||||
†Layne Christensen 1 | 1,900 | 46,113 | |||
| Electrical Equipment - 1.0% | |||||
†Global Power Equipment Group | 2,100 | 36,015 | |||
| Machinery - 2.6% | |||||
†Sarin Technologies | 50,700 | 41,851 | |||
†Sun Hydraulics | 2,000 | 52,160 | |||
| 94,011 | |||||
| Marine - 1.0% | |||||
†Clarkson | 1,900 | 37,603 | |||
| Professional Services - 1.1% | |||||
Acacia Research-Acacia Technologies 1 | 1,600 | 41,040 | |||
| Total (Cost $385,038) | 396,404 | ||||
| Information Technology – 34.8% | |||||
| Communications Equipment - 2.0% | |||||
Oplink Communications 1 | 2,382 | 37,111 | |||
Plantronics | 1,000 | 36,870 | |||
| 73,981 | |||||
| Computers & Peripherals - 5.5% | |||||
Logitech International | 7,000 | 52,780 | |||
Simplo Technology | 6,000 | 30,306 | |||
Super Micro Computer 1 | 6,700 | 68,340 | |||
Western Digital 2 | 1,100 | 46,739 | |||
| 198,165 | |||||
| Electronic Equipment, Instruments & Components - 4.4% | |||||
†Cognex Corporation | 600 | 22,092 | |||
†DTS 1,2 | 2,913 | 48,647 | |||
Hollysys Automation Technologies 1 | 3,300 | 39,171 | |||
IPG Photonics | 400 | 26,660 | |||
Vishay Intertechnology 1 | 2,100 | 22,323 | |||
| 158,893 | |||||
| THE ACCOMPANYING NOTES ARE AN INTEGRAL PART OF THESE FINANCIAL STATEMENTS. | The Royce Funds 2012 Annual Report to Shareholders | 49 |
Schedules of Investments
| Royce Select Fund II (continued) |
| SHARES | VALUE | |||||
| Information Technology (continued) | ||||||
| Internet Software & Services - 4.3% | ||||||
†Bankrate 1,2 | 6,100 | $ | 75,945 | |||
Stamps.com 1 | 1,500 | 37,800 | ||||
ValueClick 1,2 | 2,105 | 40,858 | ||||
| 154,603 | ||||||
| IT Services - 5.0% | ||||||
†Computer Task Group 1 | 3,700 | 67,451 | ||||
CSE Global | 87,100 | 56,099 | ||||
†Total System Services | 2,700 | 57,834 | ||||
| 181,384 | ||||||
| Semiconductors & Semiconductor Equipment - 11.2% | ||||||
Integrated Silicon Solution 1 | 3,367 | 30,303 | ||||
†Kulicke & Soffa Industries 1 | 4,100 | 49,159 | ||||
Miraial | 1,300 | 24,488 | ||||
MKS Instruments | 988 | 25,471 | ||||
Photronics 1 | 13,240 | 78,910 | ||||
RDA Microelectronics ADR | 5,200 | 55,900 | ||||
†Silicon Motion Technology ADR 1 | 3,800 | 54,036 | ||||
Teradyne 1,2 | 5,250 | 88,673 | ||||
| 406,940 | ||||||
| Software - 2.4% | ||||||
Actuate Corporation 1,2 | 8,400 | 47,040 | ||||
American Software Cl. A 2 | 5,164 | 40,073 | ||||
| 87,113 | ||||||
| Total (Cost $1,140,708) | 1,261,079 | |||||
| Materials – 9.1% | ||||||
| Chemicals - 2.3% | ||||||
†Innophos Holdings | 900 | 41,850 | ||||
Minerals Technologies | 1,000 | 39,920 | ||||
| 81,770 | ||||||
| Metals & Mining - 6.8% | ||||||
Haynes International | 899 | 46,631 | ||||
Hochschild Mining | 5,800 | 45,066 | ||||
Horsehead Holding Corporation 1 | 3,800 | 38,798 | ||||
Market Vectors Junior Gold Miners ETF 2 | 2,500 | 49,500 | ||||
†Pan American Silver | 1,700 | 31,841 | ||||
Seabridge Gold 1,2 | 1,900 | 34,143 | ||||
| 245,979 | ||||||
| Total (Cost $291,802) | 327,749 | |||||
| Miscellaneous 3 – 2.6% | ||||||
| Total (Cost $89,222) | 93,327 | |||||
| TOTAL COMMON STOCKS | ||||||
(Cost $3,216,874) | 3,510,705 | |||||
| REPURCHASE AGREEMENT – 10.3% | ||||||
Fixed Income Clearing Corporation, | 373,000 | |||||
| TOTAL INVESTMENTS – 107.3% | ||||||
(Cost $3,589,874) | 3,883,705 | |||||
| LIABILITIES LESS CASH | ||||||
AND OTHER ASSETS – (7.3)% | (263,647 | ) | ||||
| NET ASSETS – 100.0% | $ | 3,620,058 | ||||
| SECURITIES SOLD SHORT | ||||||
| COMMON STOCKS – 5.6% | ||||||
| Diversified Investment Companies – 3.5% | ||||||
| Exchange Traded Funds - 3.5% | ||||||
ProShares Short MSCI Emerging Markets | 300 | $ | 8,004 | |||
ProShares UltraShort FTSE China 25 | 2,100 | 36,918 | ||||
ProShares UltraShort MSCI Emerging Markets | 1,800 | 38,124 | ||||
ProShares UltraShort QQQ | 1,500 | 44,475 | ||||
| Total (Proceeds $131,416) | 127,521 | |||||
| Energy – 2.1% | ||||||
| Oil, Gas & Consumable Fuels - 2.1% | ||||||
Direxion Daily Natural Gas Related Bear 3X Shares | 2,100 | 36,330 | ||||
ProShares UltraShort Oil & Gas | 1,800 | 37,818 | ||||
| Total (Proceeds $72,391) | 74,148 | |||||
| FIXED INCOME – 1.3% | ||||||
| Government Bonds – 1.3% | ||||||
iShares Barclays 20+ Year Treasury Bond Fund | 400 | 48,472 | ||||
| Total (Proceeds $51,827) | 48,472 | |||||
| TOTAL SECURITIES SOLD SHORT | ||||||
(Proceeds $255,634) | $ | 250,141 | ||||
| 50 | The Royce Funds 2012 Annual Report to Shareholders | THE ACCOMPANYING NOTES ARE AN INTEGRAL PART OF THESE FINANCIAL STATEMENTS. |
December 31, 2012 |
| Royce Global Select Long/Short Fund |
| SHARES | VALUE | ||||
| COMMON STOCKS – 91.3% | |||||
| Australia – 1.2% | |||||
Medusa Mining | 45,000 | $ | 259,557 | ||
| Total (Cost $209,695) | 259,557 | ||||
| Austria – 6.2% | |||||
Mayr-Melnhof Karton 2 | 6,000 | 643,627 | |||
Semperit AG Holding 2 | 16,000 | 659,454 | |||
| Total (Cost $1,253,023) | 1,303,081 | ||||
| Belgium – 1.5% | |||||
Sipef | 4,000 | 313,347 | |||
| Total (Cost $271,698) | 313,347 | ||||
| Brazil – 2.8% | |||||
†Brasil Brokers Participacoes | 100,000 | 335,234 | |||
†Eternit | 65,000 | 259,240 | |||
| Total (Cost $665,470) | 594,474 | ||||
| Canada – 2.3% | |||||
Sprott 2 | 23,400 | 93,158 | |||
Trican Well Service 2 | 30,000 | 395,697 | |||
| Total (Cost $657,121) | 488,855 | ||||
| China – 1.8% | |||||
†Daphne International Holdings | 150,000 | 207,788 | |||
E-House China Holdings ADR 2 | 43,314 | 177,587 | |||
| Total (Cost $427,779) | 385,375 | ||||
| Denmark – 1.7% | |||||
†SimCorp | 1,600 | 358,163 | |||
| Total (Cost $273,210) | 358,163 | ||||
| Finland – 1.4% | |||||
Nokian Renkaat | 7,000 | 281,671 | |||
| Total (Cost $258,594) | 281,671 | ||||
| France – 1.4% | |||||
Societe Internationale de Plantations d’Heveas | 3,500 | 286,723 | |||
| Total (Cost $284,243) | 286,723 | ||||
| Germany – 5.4% | |||||
Carl Zeiss Meditec 2 | 11,500 | 330,402 | |||
Fuchs Petrolub 2 | 3,000 | 210,058 | |||
KWS Saat 2 | 900 | 289,303 | |||
Pfeiffer Vacuum Technology 2 | 2,500 | 302,724 | |||
| Total (Cost $589,039) | 1,132,487 | ||||
| Hong Kong – 5.5% | |||||
†Luk Fook Holdings (International) | 100,000 | 320,908 | |||
†Media Chinese International | 1,050,000 | 383,381 | |||
Value Partners Group | 650,000 | 436,339 | |||
| Total (Cost $1,091,086) | 1,140,628 | ||||
| India – 2.8% | |||||
Graphite India | 200,000 | 304,198 | |||
Maharashtra Seamless | 55,000 | 271,186 | |||
| Total (Cost $790,099) | 575,384 | ||||
| Italy – 2.9% | |||||
Recordati | 67,000 | 613,856 | |||
| Total (Cost $518,785) | 613,856 | ||||
| Japan – 11.4% | |||||
EPS Corporation 2 | 100 | 256,218 | |||
FamilyMart 2 | 12,000 | 493,970 | |||
†MISUMI Group | 10,000 | 271,382 | |||
Moshi Moshi Hotline 2 | 15,000 | 191,186 | |||
†Nihon M&A Center | 10,000 | 332,962 | |||
Santen Pharmaceutical | 10,000 | 382,866 | |||
USS | 4,500 | 466,445 | |||
| Total (Cost $1,984,980) | 2,395,029 | ||||
| Jersey – 1.0% | |||||
Randgold Resources ADR 2 | 2,000 | 198,500 | |||
| Total (Cost $141,021) | 198,500 | ||||
| Mexico – 5.2% | |||||
Fresnillo 2 | 12,500 | 387,860 | |||
Grupo SIMEC Ser. B 1 | 75,000 | 355,090 | |||
Industrias Bachoco ADR 2 | 12,500 | 349,000 | |||
| Total (Cost $857,627) | 1,091,950 | ||||
| Norway – 3.0% | |||||
Ekornes | 22,500 | 375,211 | |||
TGS-NOPEC Geophysical | 7,500 | 245,777 | |||
| Total (Cost $501,466) | 620,988 | ||||
| South Africa – 4.9% | |||||
Adcock Ingram Holdings 2 | 50,000 | 318,517 | |||
Lewis Group 2 | 50,000 | 407,848 | |||
Raubex Group | 144,507 | 289,034 | |||
| Total (Cost $1,182,618) | 1,015,399 | ||||
| South Korea – 2.1% | |||||
MegaStudy | 6,000 | 442,242 | |||
| Total (Cost $737,850) | 442,242 | ||||
| Switzerland – 3.4% | |||||
Burckhardt Compression Holding 2 | 1,000 | 327,983 | |||
Partners Group Holding 2 | 1,700 | 392,651 | |||
| Total (Cost $383,538) | 720,634 | ||||
| THE ACCOMPANYING NOTES ARE AN INTEGRAL PART OF THESE FINANCIAL STATEMENTS. | The Royce Funds 2012 Annual Report to Shareholders | 51 |
Schedules of Investments
| Royce Global Select Long/Short Fund (continued) |
| SHARES | VALUE | |||||
| Turkey – 1.9% | ||||||
†Koza Altin Isletmeleri | 4,000 | $ | 96,598 | |||
Mardin Cimento Sanayii | 100,000 | 299,356 | ||||
| Total (Cost $527,952) | 395,954 | |||||
| United Kingdom – 12.7% | ||||||
Ashmore Group 2 | 103,000 | 595,579 | ||||
†Domino Printing Sciences 2 | 48,000 | 455,829 | ||||
EnQuest 1 | 175,000 | 349,201 | ||||
Hochschild Mining 2 | 55,000 | 427,353 | ||||
Jupiter Fund Management | 100,000 | 464,137 | ||||
Spirax-Sarco Engineering 2 | 10,000 | 375,970 | ||||
| Total (Cost $2,075,692) | 2,668,069 | |||||
| United States – 8.8% | ||||||
†Dolby Laboratories Cl. A 2 | 11,000 | 322,630 | ||||
GrafTech International 1,2 | 30,000 | 281,700 | ||||
†Guess? 2 | 11,000 | 269,940 | ||||
Helmerich & Payne 2 | 11,000 | 616,110 | ||||
Kennametal 2 | 9,000 | 360,000 | ||||
| Total (Cost $1,905,422) | 1,850,380 | |||||
| TOTAL COMMON STOCKS | ||||||
(Cost $17,588,008) | 19,132,746 | |||||
| REPURCHASE AGREEMENT – 16.1% | ||||||
Fixed Income Clearing Corporation, | 3,386,000 | |||||
| TOTAL INVESTMENTS – 107.4% | ||||||
(Cost $20,974,008) | 22,518,746 | |||||
| LIABILITIES LESS CASH | ||||||
AND OTHER ASSETS – (7.4)% | (1,559,761 | ) | ||||
| NET ASSETS – 100.0% | $ | 20,958,985 | ||||
| SECURITIES SOLD SHORT | ||||||
| COMMON STOCKS – 30.6% | ||||||
| Argentina – 0.4% | ||||||
MercadoLibre | 1,000 | $ | 78,570 | |||
| Total (Proceeds $73,222) | 78,570 | |||||
| Brazil – 0.5% | ||||||
Petroleo Brasileiro ADR | 5,000 | 97,350 | ||||
| Total (Proceeds $97,187) | 97,350 | |||||
| Canada – 2.9% | ||||||
Goldcorp | 3,500 | 128,450 | ||||
iShares MSCI Canada Index Fund | 11,600 | 329,440 | ||||
lululemon athletica | 1,800 | 137,214 | ||||
| Total (Proceeds $575,563) | 595,104 | |||||
| Cayman Islands – 0.3% | ||||||
Herbalife | 2,000 | 65,880 | ||||
| Total (Proceeds $115,219) | 65,880 | |||||
| Germany – 0.6% | ||||||
Deutsche Bank | 3,000 | 132,870 | ||||
| Total (Proceeds $130,434) | 132,870 | |||||
| Hong Kong – 1.7% | ||||||
Focus Media Holding ADR | 5,500 | 141,240 | ||||
Michael Kors Holdings | 4,000 | 204,120 | ||||
| Total (Proceeds $299,783) | 345,360 | |||||
| India – 0.6% | ||||||
Direxion Daily India Bull 3X Shares | 6,500 | 130,910 | ||||
| Total (Proceeds $124,325) | 130,910 | |||||
| Ireland – 1.1% | ||||||
Accenture Cl. A | 3,500 | 232,750 | ||||
| Total (Proceeds $218,347) | 232,750 | |||||
| Japan – 2.7% | ||||||
Fast Retailing | 600 | 152,384 | ||||
iShares MSCI Japan Index Fund | 42,500 | 414,375 | ||||
| Total (Proceeds $519,405) | 566,759 | |||||
| Switzerland – 0.9% | ||||||
Compagnie Financiere Richemont Cl. A | 2,400 | 191,912 | ||||
| Total (Proceeds $132,876) | 191,912 | |||||
| United States – 16.8% | ||||||
Brunswick Corporation | 6,000 | 174,540 | ||||
Conn’s | 3,500 | 107,380 | ||||
Deluxe Corporation | 10,000 | 322,400 | ||||
Direxion Daily Energy Bull 3X Shares | 5,700 | 276,678 | ||||
Direxion Daily Gold Miners Bull 3X Shares | 22,500 | 247,500 | ||||
Equinix | 500 | 103,100 | ||||
GNC Holdings Cl. A | 5,000 | 166,400 | ||||
Monster Beverage | 5,000 | 264,400 | ||||
NCR Corporation | 7,000 | 178,360 | ||||
Panera Bread Cl. A | 1,200 | 190,596 | ||||
ProShares Ultra Basic Materials | 6,000 | 220,080 | ||||
ProShares Ultra Health Care | 5,500 | 461,065 | ||||
Simon Property Group | 800 | 126,472 | ||||
Terex Corporation | 6,200 | 174,282 | ||||
Toll Brothers | 7,000 | 226,310 | ||||
United Rentals | 6,500 | 295,880 | ||||
| Total (Proceeds $2,925,168) | 3,535,443 | |||||
| 52 | The Royce Funds 2012 Annual Report to Shareholders | THE ACCOMPANYING NOTES ARE AN INTEGRAL PART OF THESE FINANCIAL STATEMENTS. |
December 31, 2012 |
| SHARES | VALUE | ||||
| Non-Country Specific – 2.1% | |||||
Direxion Daily Emerging Markets Bull 3X Shares | 4,000 | $ | 437,120 | ||
| Total (Proceeds $349,093) | 437,120 | ||||
| TOTAL SECURITIES SOLD SHORT | |||||
(Proceeds $5,560,622) | $ | 6,410,028 | |||
| Royce European Smaller-Companies Fund |
| SHARES | VALUE | ||||
| COMMON STOCKS – 95.9% | |||||
| Austria – 5.3% | |||||
Mayr-Melnhof Karton | 3,700 | $ | 396,903 | ||
Semperit AG Holding | 10,700 | 441,010 | |||
| Total (Cost $880,473) | 837,913 | ||||
| Belgium – 3.5% | |||||
EVS Broadcast Equipment | 2,500 | 147,490 | |||
GIMV | 4,129 | 207,622 | |||
Sipef | 2,500 | 195,842 | |||
| Total (Cost $617,035) | 550,954 | ||||
| Denmark – 2.4% | |||||
H. Lundbeck | 10,000 | 146,395 | |||
SimCorp | 1,050 | 235,045 | |||
| Total (Cost $326,749) | 381,440 | ||||
| Finland – 2.0% | |||||
Nokian Renkaat | 4,750 | 191,134 | |||
Vaisala Cl. A | 5,700 | 119,727 | |||
| Total (Cost $393,799) | 310,861 | ||||
| France – 16.5% | |||||
Altamir Amboise | 17,400 | 170,122 | |||
Alten | 6,000 | 206,996 | |||
Audika Groupe | 14,950 | 163,376 | |||
Beneteau | 20,000 | 217,203 | |||
bioMerieux | 2,000 | 193,322 | |||
Boiron | 7,000 | 241,477 | |||
Manutan International | 4,500 | 199,637 | |||
Parrot 1 | 7,450 | 277,522 | |||
Piscines Desjoyaux | 10,000 | 75,440 | |||
Societe Internationale de Plantations d’Heveas | 2,000 | 163,842 | |||
†Stallergenes | 3,500 | 199,314 | |||
Vetoquinol | 8,700 | 305,041 | |||
Virbac | 1,000 | 197,733 | |||
| Total (Cost $2,854,456) | 2,611,025 | ||||
| Germany – 13.5% | |||||
Aixtron | 9,000 | 105,691 | |||
Carl Zeiss Meditec | 6,900 | 198,241 | |||
Fuchs Petrolub | 3,500 | 245,068 | |||
KWS Saat | 1,025 | 329,485 | |||
Nemetschek | 3,000 | 132,107 | |||
Pfeiffer Vacuum Technology | 2,300 | 278,506 | |||
PUMA | 900 | 267,132 | |||
Rational | 900 | 259,199 | |||
Takkt | 23,500 | 327,171 | |||
| Total (Cost $1,848,924) | 2,142,600 | ||||
| THE ACCOMPANYING NOTES ARE AN INTEGRAL PART OF THESE FINANCIAL STATEMENTS. | The Royce Funds 2012 Annual Report to Shareholders | 53 |
Schedules of Investments
| Royce European Smaller-Companies Fund (continued) |
| SHARES | VALUE | ||||
| Greece – 1.0% | |||||
JUMBO | 21,000 | $ | 166,099 | ||
| Total (Cost $148,952) | 166,099 | ||||
| Italy – 7.0% | |||||
Azimut Holding | 17,000 | 245,291 | |||
†DiaSorin | 8,000 | 320,894 | |||
Geox | 60,000 | 173,495 | |||
Recordati | 39,800 | 364,649 | |||
| Total (Cost $909,925) | 1,104,329 | ||||
| Netherlands – 1.6% | |||||
ASM International | 5,000 | 183,031 | |||
Beter Bed Holding | 4,000 | 70,173 | |||
| Total (Cost $240,079) | 253,204 | ||||
| Norway – 3.1% | |||||
Ekornes | 18,700 | 311,842 | |||
TGS-NOPEC Geophysical | 5,500 | 180,236 | |||
| Total (Cost $524,514) | 492,078 | ||||
| Poland – 0.9% | |||||
†Warsaw Stock Exchange | 12,000 | 150,893 | |||
| Total (Cost $129,779) | 150,893 | ||||
| South Africa – 4.5% | |||||
Adcock Ingram Holdings | 35,000 | 222,962 | |||
Lewis Group | 35,000 | 285,494 | |||
Raubex Group | 105,000 | 210,014 | |||
| Total (Cost $912,809) | 718,470 | ||||
| Spain – 1.7% | |||||
Almirall | 27,700 | 272,136 | |||
| Total (Cost $260,347) | 272,136 | ||||
| Sweden – 0.6% | |||||
Lundin Petroleum 1 | 4,100 | 94,603 | |||
| Total (Cost $81,941) | 94,603 | ||||
| Switzerland – 12.6% | |||||
Bank Sarasin & Co. Cl. B 1 | 5,480 | 159,547 | |||
Banque Privee Edmond de Rothschild | 5 | 99,854 | |||
Burckhardt Compression Holding | 900 | 295,185 | |||
Inficon Holding | 700 | 167,875 | |||
Logitech International | 22,500 | 171,548 | |||
Partners Group Holding | 1,400 | 323,360 | |||
Sika | 55 | 127,469 | |||
Sulzer | 1,580 | 250,395 | |||
†Tecan Group | 900 | 75,420 | |||
VZ Holding | 1,950 | 245,953 | |||
†Zehnder Group | 1,600 | 77,655 | |||
| Total (Cost $1,687,769) | 1,994,261 | ||||
| Turkey – 1.5% | |||||
†Koza Altin Isletmeleri | 2,800 | 67,618 | |||
Mardin Cimento Sanayii | 56,000 | 167,640 | |||
| Total (Cost $345,360) | 235,258 | ||||
| United Kingdom – 18.2% | |||||
Ashmore Group | 62,400 | 360,817 | |||
†Clarkson | 6,000 | 118,746 | |||
Diploma | 20,000 | 179,846 | |||
Domino Printing Sciences | 20,000 | 189,929 | |||
EnQuest 1 | 125,000 | 249,429 | |||
Hochschild Mining | 32,500 | 252,527 | |||
Jupiter Fund Management | 65,000 | 301,689 | |||
Keller Group | 17,500 | 198,530 | |||
†Latchways | 5,000 | 80,880 | |||
Michael Page International | 20,000 | 129,173 | |||
Rotork | 5,950 | 246,753 | |||
Severfield-Rowen | 67,500 | 105,897 | |||
Spirax-Sarco Engineering | 8,000 | 300,776 | |||
Victrex | 6,450 | 174,073 | |||
| Total (Cost $2,384,805) | 2,889,065 | ||||
| TOTAL COMMON STOCKS | |||||
(Cost $14,547,716) | 15,205,189 | ||||
| REPURCHASE AGREEMENT – 3.5% | |||||
Fixed Income Clearing Corporation, | 556,000 | ||||
| TOTAL INVESTMENTS – 99.4% | |||||
(Cost $15,103,716) | 15,761,189 | ||||
| CASH AND OTHER ASSETS | |||||
LESS LIABILITIES – 0.6% | 93,015 | ||||
| NET ASSETS – 100.0% | $ | 15,854,204 | |||
| 54 | The Royce Funds 2012 Annual Report to Shareholders | THE ACCOMPANYING NOTES ARE AN INTEGRAL PART OF THESE FINANCIAL STATEMENTS. |
December 31, 2012 |
| Royce Enterprise Select Fund |
| SHARES | VALUE | ||||
| COMMON STOCKS – 81.5% | |||||
| Consumer Discretionary – 13.3% | |||||
| Automobiles - 1.0% | |||||
Thor Industries | 340 | $ | 12,726 | ||
| Distributors - 0.6% | |||||
†Genuine Parts | 120 | 7,630 | |||
| Household Durables - 4.9% | |||||
Garmin | 900 | 36,738 | |||
Mohawk Industries 1 | 305 | 27,593 | |||
| 64,331 | |||||
| Multiline Retail - 1.2% | |||||
Dollar Tree 1 | 400 | 16,224 | |||
| Specialty Retail - 4.6% | |||||
Advance Auto Parts | 179 | 12,951 | |||
Ascena Retail Group 1 | 800 | 14,792 | |||
Monro Muffler Brake | 300 | 10,491 | |||
†Signet Jewelers | 290 | 15,486 | |||
Tiffany & Co. | 100 | 5,734 | |||
| 59,454 | |||||
| Textiles, Apparel & Luxury Goods - 1.0% | |||||
Gildan Activewear | 345 | 12,620 | |||
| Total (Cost $159,805) | 172,985 | ||||
| Energy – 2.3% | |||||
| Energy Equipment & Services - 2.3% | |||||
C&J Energy Services 1 | 100 | 2,144 | |||
Helmerich & Payne | 100 | 5,601 | |||
†Pason Systems | 900 | 15,517 | |||
Trican Well Service | 550 | 7,255 | |||
| Total (Cost $30,272) | 30,517 | ||||
| Financials – 13.9% | |||||
| Capital Markets - 1.3% | |||||
Affiliated Managers Group 1 | 130 | 16,919 | |||
| Diversified Financial Services - 5.6% | |||||
Leucadia National | 1,550 | 36,875 | |||
Moody’s Corporation | 710 | 35,727 | |||
| 72,602 | |||||
| Insurance - 4.4% | |||||
Alleghany Corporation 1 | 146 | 48,971 | |||
Berkley (W.R.) | 200 | 7,548 | |||
| 56,519 | |||||
| Real Estate Management & Development - 2.6% | |||||
Jones Lang LaSalle | 320 | 26,861 | |||
†Kennedy-Wilson Holdings | 513 | 7,172 | |||
| 34,033 | |||||
| Total (Cost $159,606) | 180,073 | ||||
| Health Care – 9.7% | |||||
| Biotechnology - 2.3% | |||||
†Myriad Genetics 1 | 1,100 | 29,975 | |||
| Health Care Equipment & Supplies - 1.7% | |||||
†Analogic Corporation | 186 | 13,820 | |||
C.R. Bard | 80 | 7,819 | |||
| 21,639 | |||||
| Health Care Providers & Services - 2.1% | |||||
Schein (Henry) 1,2 | 340 | 27,356 | |||
| Life Sciences Tools & Services - 3.0% | |||||
PerkinElmer | 1,240 | 39,358 | |||
| Pharmaceuticals - 0.6% | |||||
†Perrigo Company | 72 | 7,490 | |||
| Total (Cost $106,874) | 125,818 | ||||
| Industrials – 18.2% | |||||
| Air Freight & Logistics - 1.6% | |||||
Expeditors International of Washington | 520 | 20,566 | |||
| Commercial Services & Supplies - 2.0% | |||||
Cintas Corporation | 500 | 20,450 | |||
Copart 1 | 215 | 6,342 | |||
| 26,792 | |||||
| Electrical Equipment - 0.3% | |||||
Franklin Electric | 60 | 3,730 | |||
| Industrial Conglomerates - 0.6% | |||||
†Standex International | 150 | 7,694 | |||
| Machinery - 7.5% | |||||
†Crane Company | 220 | 10,182 | |||
Kennametal | 820 | 32,800 | |||
Valmont Industries | 230 | 31,406 | |||
Wabtec Corporation | 260 | 22,760 | |||
| 97,148 | |||||
| Marine - 1.3% | |||||
Kirby Corporation 1 | �� | 275 | 17,020 | ||
| Professional Services - 4.9% | |||||
Equifax | 270 | 14,612 | |||
ManpowerGroup | 550 | 23,342 | |||
Towers Watson & Company Cl. A | 450 | 25,295 | |||
| 63,249 | |||||
| Total (Cost $217,317) | 236,199 | ||||
| Information Technology – 11.2% | |||||
| Computers & Peripherals - 1.0% | |||||
Western Digital | 300 | 12,747 | |||
| Electronic Equipment, Instruments & Components - 4.8% | |||||
AVX Corporation | 1,703 | 18,358 | |||
Coherent | 430 | 21,767 | |||
FLIR Systems | 700 | 15,617 | |||
Trimble Navigation 1 | 100 | 5,978 | |||
| 61,720 | |||||
| IT Services - 1.4% | |||||
Fiserv 1 | 180 | 14,226 | |||
†Gartner 1 | 100 | 4,602 | |||
| 18,828 | |||||
| Semiconductors & Semiconductor Equipment - 4.0% | |||||
Analog Devices | 620 | 26,077 | |||
| THE ACCOMPANYING NOTES ARE AN INTEGRAL PART OF THESE FINANCIAL STATEMENTS. | The Royce Funds 2012 Annual Report to Shareholders | 55 |
Schedules of Investments
| Royce Enterprise Select Fund (continued) |
| SHARES | VALUE | |||||
| Information Technology (continued) | ||||||
| Semiconductors & Semiconductor Equipment (continued) | ||||||
Teradyne 1 | 1,510 | $ | 25,504 | |||
| 51,581 | ||||||
| Total (Cost $127,762) | 144,876 | |||||
| Materials – 10.2% | ||||||
| Chemicals - 4.2% | ||||||
Albemarle Corporation | 100 | 6,212 | ||||
Cabot Corporation | 830 | 33,026 | ||||
Sigma-Aldrich Corporation | 206 | 15,157 | ||||
| 54,395 | ||||||
| Metals & Mining - 4.1% | ||||||
Globe Specialty Metals | 500 | 6,875 | ||||
Pan American Silver | 720 | 13,486 | ||||
Reliance Steel & Aluminum | 530 | 32,913 | ||||
| 53,274 | ||||||
| Paper & Forest Products - 1.9% | ||||||
Stella-Jones | 320 | 24,652 | ||||
| Total (Cost $114,647) | 132,321 | |||||
| Utilities – 1.4% | ||||||
| Gas Utilities - 1.4% | ||||||
UGI Corporation 2 | 540 | 17,663 | ||||
| Total (Cost $13,917) | 17,663 | |||||
| Miscellaneous 3 – 1.3% | ||||||
| Total (Cost $17,346) | 17,363 | |||||
| TOTAL COMMON STOCKS | ||||||
(Cost $947,546) | 1,057,815 | |||||
| REPURCHASE AGREEMENT – 18.7% | ||||||
Fixed Income Clearing Corporation, | 243,000 | |||||
| TOTAL INVESTMENTS – 100.2% | ||||||
(Cost $1,190,546) | 1,300,815 | |||||
| LIABILITIES LESS CASH | ||||||
AND OTHER ASSETS – (0.2)% | (2,092 | ) | ||||
| NET ASSETS – 100.0% | $ | 1,298,723 | ||||
| Royce SMid-Cap Value Fund |
| SHARES | VALUE | ||||
| COMMON STOCKS – 92.6% | |||||
| Consumer Discretionary – 10.4% | |||||
| Auto Components - 1.7% | |||||
Autoliv | 2,900 | $ | 195,431 | ||
| Automobiles - 1.0% | |||||
Thor Industries | 2,900 | 108,547 | |||
| Household Durables - 2.6% | |||||
Garmin | 7,000 | 285,740 | |||
| Multiline Retail - 1.3% | |||||
Dollar Tree 1 | 3,500 | 141,960 | |||
| Specialty Retail - 3.3% | |||||
Ascena Retail Group 1 | 12,200 | 225,578 | |||
†Signet Jewelers | 2,720 | 145,248 | |||
| 370,826 | |||||
| Textiles, Apparel & Luxury Goods - 0.5% | |||||
Gildan Activewear | 1,600 | 58,528 | |||
| Total (Cost $1,074,752) | 1,161,032 | ||||
| Consumer Staples – 0.7% | |||||
| Food Products - 0.7% | |||||
Sanderson Farms | 1,700 | 80,835 | |||
| Total (Cost $90,213) | 80,835 | ||||
| Energy – 12.1% | |||||
| Energy Equipment & Services - 12.1% | |||||
C&J Energy Services 1 | 11,400 | 244,416 | |||
Helmerich & Payne | 7,000 | 392,070 | |||
Pason Systems | 17,800 | 306,896 | |||
Trican Well Service | 22,200 | 292,816 | |||
Unit Corporation 1 | 2,600 | 117,130 | |||
| Total (Cost $1,416,937) | 1,353,328 | ||||
| Financials – 13.9% | |||||
| Capital Markets - 10.2% | |||||
Affiliated Managers Group 1 | 1,800 | 234,270 | |||
Ashmore Group | 51,600 | 298,368 | |||
Partners Group Holding | 800 | 184,777 | |||
Sprott | 39,700 | 158,050 | |||
Value Partners Group | 384,000 | 257,775 | |||
| 1,133,240 | |||||
| Diversified Financial Services - 1.7% | |||||
Leucadia National | 7,900 | 187,941 | |||
| Real Estate Management & Development - 2.0% | |||||
Jones Lang LaSalle | 1,630 | 136,822 | |||
†Kennedy-Wilson Holdings | 6,100 | 85,278 | |||
| 222,100 | |||||
| Total (Cost $1,527,625) | 1,543,281 | ||||
| Health Care – 3.6% | |||||
| Biotechnology - 2.5% | |||||
Myriad Genetics 1 | 10,400 | 283,400 | |||
| 56 | The Royce Funds 2012 Annual Report to Shareholders | THE ACCOMPANYING NOTES ARE AN INTEGRAL PART OF THESE FINANCIAL STATEMENTS. |
December 31, 2012 |
| SHARES | VALUE | |||||
| Health Care (continued) | ||||||
| Health Care Providers & Services - 1.1% | ||||||
Schein (Henry) 1 | 1,500 | $ | 120,690 | |||
| Total (Cost $362,163) | 404,090 | |||||
| Industrials – 15.7% | ||||||
| Construction & Engineering - 2.6% | ||||||
Jacobs Engineering Group 1 | 6,700 | 285,219 | ||||
| Machinery - 10.0% | ||||||
Kennametal | 6,100 | 244,000 | ||||
Lincoln Electric Holdings | 1,900 | 92,492 | ||||
Semperit AG Holding | 9,500 | 391,551 | ||||
Valmont Industries | 1,925 | 262,859 | ||||
†Wabtec Corporation | 1,400 | 122,556 | ||||
| 1,113,458 | ||||||
| Marine - 1.2% | ||||||
Kirby Corporation 1 | 2,200 | 136,158 | ||||
| Professional Services - 1.9% | ||||||
ManpowerGroup | 2,600 | 110,344 | ||||
Towers Watson & Company Cl. A | 1,800 | 101,178 | ||||
| 211,522 | ||||||
| Total (Cost $1,638,541) | 1,746,357 | |||||
| Information Technology – 15.6% | ||||||
| Computers & Peripherals - 5.1% | ||||||
SanDisk Corporation 1 | 3,700 | 161,172 | ||||
Western Digital | 9,400 | 399,406 | ||||
| 560,578 | ||||||
| Electronic Equipment, Instruments & Components - 0.7% | ||||||
AVX Corporation | 7,100 | 76,538 | ||||
| Semiconductors & Semiconductor Equipment - 8.4% | ||||||
Analog Devices | 8,500 | 357,510 | ||||
International Rectifier 1 | 8,142 | 144,358 | ||||
†LSI Corporation 1 | 12,500 | 88,500 | ||||
Teradyne 1 | 20,650 | 348,778 | ||||
| 939,146 | ||||||
| Software - 1.4% | ||||||
†SimCorp | 700 | 156,697 | ||||
| Total (Cost $1,678,242) | 1,732,959 | |||||
| Materials – 20.6% | ||||||
| Chemicals - 4.3% | ||||||
Cabot Corporation | 3,400 | 135,286 | ||||
Westlake Chemical | 4,300 | 340,990 | ||||
| 476,276 | ||||||
| Metals & Mining - 14.2% | ||||||
†Alamos Gold | 5,700 | 99,995 | ||||
Allied Nevada Gold 1 | 5,600 | 168,728 | ||||
Globe Specialty Metals | 22,100 | 303,875 | ||||
Hochschild Mining | 21,300 | 165,502 | ||||
†Kirkland Lake Gold 1 | 8,500 | 49,990 | ||||
Pan American Silver | 14,700 | 275,331 | ||||
†Pretium Resources 1 | 11,800 | 155,878 | ||||
Reliance Steel & Aluminum | 5,900 | 366,390 | ||||
| 1,585,689 | ||||||
| Paper & Forest Products - 2.1% | ||||||
Stella-Jones | 3,025 | 233,041 | ||||
| Total (Cost $2,290,901) | 2,295,006 | |||||
| TOTAL COMMON STOCKS | ||||||
(Cost $10,079,374) | 10,316,888 | |||||
| REPURCHASE AGREEMENT – 7.8% | ||||||
| Fixed Income Clearing Corporation, 0.10% dated 12/31/12, due 1/2/13, maturity value $867,005 (collateralized by obligations of various U.S. Government Agencies, 0.30% due 12/4/13, valued at $886,199) (Cost $867,000) | 867,000 | |||||
| TOTAL INVESTMENTS – 100.4% | ||||||
(Cost $10,946,374) | 11,183,888 | |||||
| LIABILITIES LESS CASH | ||||||
AND OTHER ASSETS – (0.4)% | (43,447 | ) | ||||
| NET ASSETS – 100.0% | $ | 11,140,441 | ||||
| THE ACCOMPANYING NOTES ARE AN INTEGRAL PART OF THESE FINANCIAL STATEMENTS. | The Royce Funds 2012 Annual Report to Shareholders | 57 |
Schedules of Investments
| Royce Focus Value Fund |
| SHARES | VALUE | ||||
| COMMON STOCKS – 96.1% | |||||
| Consumer Discretionary – 6.4% | |||||
| Automobiles - 1.3% | |||||
Thor Industries | 3,000 | $ | 112,290 | ||
| Household Durables - 1.4% | |||||
†Garmin | 3,000 | 122,460 | |||
| Specialty Retail - 3.7% | |||||
Buckle (The) | 3,500 | 156,240 | |||
GameStop Corporation Cl. A | 7,000 | 175,630 | |||
| 331,870 | |||||
| Total (Cost $477,275) | 566,620 | ||||
| Consumer Staples – 4.9% | |||||
| Food Products - 3.4% | |||||
Cal-Maine Foods | 2,000 | 80,440 | |||
Industrias Bachoco ADR | 4,500 | 125,640 | |||
Sanderson Farms | 2,000 | 95,100 | |||
| 301,180 | |||||
| Personal Products - 1.5% | |||||
†Nu Skin Enterprises Cl. A | 3,500 | 129,675 | |||
| Total (Cost $366,150) | 430,855 | ||||
| Energy – 14.6% | |||||
| Energy Equipment & Services - 10.0% | |||||
†C&J Energy Services 1 | 6,000 | 128,640 | |||
Helmerich & Payne | 4,500 | 252,045 | |||
Pason Systems | 13,500 | 232,758 | |||
Trican Well Service | 14,000 | 184,659 | |||
Unit Corporation 1 | 2,000 | 90,100 | |||
| 888,202 | |||||
| Oil, Gas & Consumable Fuels - 4.6% | |||||
†Africa Oil 1 | 15,000 | 105,409 | |||
Exxon Mobil | 3,500 | 302,925 | |||
| 408,334 | |||||
| Total (Cost $1,018,872) | 1,296,536 | ||||
| Financials – 16.8% | |||||
| Capital Markets - 11.5% | |||||
Affiliated Managers Group 1 | 1,000 | 130,150 | |||
Ashmore Group | 30,000 | 173,470 | |||
Franklin Resources | 2,500 | 314,250 | |||
Partners Group Holding | 600 | 138,583 | |||
Sprott | 25,000 | 99,527 | |||
Value Partners Group | 250,000 | 167,823 | |||
| 1,023,803 | |||||
| Insurance - 3.6% | |||||
Berkshire Hathaway Cl. B 1 | 3,500 | 313,950 | |||
| Real Estate Management & Development - 1.7% | |||||
Kennedy-Wilson Holdings | 11,000 | 153,780 | |||
| Total (Cost $1,113,300) | 1,491,533 | ||||
| Health Care – 2.1% | |||||
| Biotechnology - 2.1% | |||||
Myriad Genetics 1 | 7,000 | 190,750 | |||
| Total (Cost $153,981) | 190,750 | ||||
| Industrials – 4.9% | |||||
| Construction & Engineering - 1.9% | |||||
Jacobs Engineering Group 1 | 4,000 | 170,280 | |||
| Machinery - 1.1% | |||||
†Lincoln Electric Holdings | 2,000 | 97,360 | |||
| Road & Rail - 1.9% | |||||
Patriot Transportation Holding 1 | 6,000 | 170,580 | |||
| Total (Cost $408,371) | 438,220 | ||||
| Information Technology – 21.7% | |||||
| Computers & Peripherals - 8.1% | |||||
Apple | 500 | 266,515 | |||
SanDisk Corporation 1 | 3,000 | 130,680 | |||
Western Digital | 7,500 | 318,675 | |||
| 715,870 | |||||
| Semiconductors & Semiconductor Equipment - 9.3% | |||||
Analog Devices | 7,500 | 315,450 | |||
MKS Instruments | 8,000 | 206,240 | |||
Teradyne 1 | 12,000 | 202,680 | |||
Veeco Instruments 1 | 3,500 | 103,320 | |||
| 827,690 | |||||
| Software - 4.3% | |||||
Microsoft Corporation | 10,000 | 267,300 | |||
†SimCorp | 500 | 111,926 | |||
| 379,226 | |||||
| Total (Cost $1,636,477) | 1,922,786 | ||||
| Materials – 24.7% | |||||
| Chemicals - 4.6% | |||||
LSB Industries 1 | 3,500 | 123,970 | |||
Mosaic Company (The) | 5,000 | 283,150 | |||
| 407,120 | |||||
| Metals & Mining - 20.1% | |||||
Allied Nevada Gold 1 | 6,500 | 195,845 | |||
Fresnillo | 4,000 | 124,115 | |||
Globe Specialty Metals | 11,700 | 160,875 | |||
Major Drilling Group International | 12,500 | 123,153 | |||
Newmont Mining | 4,500 | 208,980 | |||
Nucor Corporation | 3,000 | 129,540 | |||
Pan American Silver | 11,200 | 209,776 | |||
†Pretium Resources 1 | 12,000 | 158,520 | |||
Reliance Steel & Aluminum | 3,500 | 217,350 | |||
Schnitzer Steel Industries Cl. A | 4,000 | 121,320 | |||
Seabridge Gold 1 | 7,500 | 134,775 | |||
| 1,784,249 | |||||
| Total (Cost $2,105,432) | 2,191,369 | ||||
| TOTAL COMMON STOCKS | |||||
(Cost $7,279,858) | 8,528,669 | ||||
| 58 | The Royce Funds 2012 Annual Report to Shareholders | THE ACCOMPANYING NOTES ARE AN INTEGRAL PART OF THESE FINANCIAL STATEMENTS. |
December 31, 2012 |
| SHARES | VALUE | |||||
| FIXED INCOME – 1.2% | ||||||
| Government Bonds – 1.2% | ||||||
ProShares UltraShort 20+ Year Treasury 1 | 1,750 | $ | 111,037 | |||
| TOTAL FIXED INCOME | ||||||
(Cost $185,658) | 111,037 | |||||
| REPURCHASE AGREEMENT – 2.9% | ||||||
Fixed Income Clearing Corporation, | 257,000 | |||||
| TOTAL INVESTMENTS – 100.2% | ||||||
(Cost $7,722,516) | 8,896,706 | |||||
| LIABILITIES LESS CASH | ||||||
AND OTHER ASSETS – (0.2)% | (21,763 | ) | ||||
| NET ASSETS – 100.0% | $ | 8,874,943 | ||||
| Royce Partners Fund |
| SHARES | VALUE | ||||
| COMMON STOCKS – 97.5% | |||||
| Consumer Discretionary – 6.1% | |||||
| Household Durables - 2.9% | |||||
Hunter Douglas | 400 | $ | 15,542 | ||
NVR 1 | 50 | 46,000 | |||
| 61,542 | |||||
| Media - 1.8% | |||||
Morningstar | 600 | 37,698 | |||
| Specialty Retail - 1.4% | |||||
†Tiffany & Co. | 500 | 28,670 | |||
| Total (Cost $94,454) | 127,910 | ||||
| Energy – 6.0% | |||||
| Energy Equipment & Services - 6.0% | |||||
Ensco Cl. A | 1,000 | 59,280 | |||
Schlumberger | 360 | 24,944 | |||
†Tidewater | 900 | 40,212 | |||
| Total (Cost $114,969) | 124,436 | ||||
| Financials – 32.4% | |||||
| Capital Markets - 24.5% | |||||
AllianceBernstein Holding L.P. | 2,500 | 43,575 | |||
Artio Global Investors Cl. A | 1,400 | 2,660 | |||
Ashmore Group | 8,000 | 46,259 | |||
Bank of New York Mellon (The) | 1,700 | 43,690 | |||
Citadel Capital 1 | 16,000 | 9,711 | |||
†Coronation Fund Managers | 5,300 | 24,831 | |||
Egyptian Financial Group-Hermes Holding Company 1 | 4,375 | 7,581 | |||
Jupiter Fund Management | 8,800 | 40,844 | |||
†KKR & Co. L.P. | 1,300 | 19,799 | |||
Northern Trust | 1,000 | 50,160 | |||
SEI Investments | 2,000 | 46,680 | |||
SHUAA Capital 1 | 100,000 | 14,956 | |||
State Street | 1,100 | 51,711 | |||
Value Partners Group | 110,000 | 73,842 | |||
†WisdomTree Investments 1 | 5,600 | 34,272 | |||
| 510,571 | |||||
| Diversified Financial Services - 3.2% | |||||
Moody’s Corporation | 1,300 | 65,416 | |||
| Insurance - 3.1% | |||||
E-L Financial | 60 | 26,239 | |||
Marsh & McLennan | 1,100 | 37,917 | |||
| 64,156 | |||||
| Real Estate Management & Development - 1.6% | |||||
†Jones Lang LaSalle | 400 | 33,576 | |||
| Total (Cost $628,417) | 673,719 | ||||
| Health Care – 1.8% | |||||
| Biotechnology - 1.4% | |||||
†Myriad Genetics 1 | 1,100 | 29,975 | |||
| THE ACCOMPANYING NOTES ARE AN INTEGRAL PART OF THESE FINANCIAL STATEMENTS. | The Royce Funds 2012 Annual Report to Shareholders | 59 |
Schedules of Investments
| Royce Partners Fund (continued) |
| SHARES | VALUE | |||||
| Health Care (continued) | ||||||
| Pharmaceuticals - 0.4% | ||||||
Adcock Ingram Holdings | 1,300 | $ | 8,281 | |||
| Total (Cost $40,167) | 38,256 | |||||
| Industrials – 26.8% | ||||||
| Air Freight & Logistics - 0.9% | ||||||
Expeditors International of Washington | 500 | 19,775 | ||||
| Commercial Services & Supplies - 2.4% | ||||||
Brink’s Company (The) | 1,100 | 31,383 | ||||
Ritchie Bros. Auctioneers | 900 | 18,801 | ||||
| 50,184 | ||||||
| Construction & Engineering - 2.3% | ||||||
Fluor Corporation | 800 | 46,992 | ||||
| Electrical Equipment - 0.9% | ||||||
GrafTech International 1 | 2,050 | 19,249 | ||||
| Machinery - 7.6% | ||||||
Foster (L.B.) Company | 800 | 34,752 | ||||
Graco | 1,000 | 51,490 | ||||
Spirax-Sarco Engineering | 800 | 30,078 | ||||
Valmont Industries | 300 | 40,965 | ||||
| 157,285 | ||||||
| Professional Services - 7.9% | ||||||
Advisory Board (The) 1 | 1,000 | 46,790 | ||||
ManpowerGroup | 700 | 29,708 | ||||
Towers Watson & Company Cl. A | 700 | 39,347 | ||||
Verisk Analytics Cl. A 1 | 970 | 49,470 | ||||
| 165,315 | ||||||
| Road & Rail - 3.7% | ||||||
Landstar System | 800 | 41,968 | ||||
Patriot Transportation Holding 1 | 1,200 | 34,116 | ||||
| 76,084 | ||||||
| Trading Companies & Distributors - 1.1% | ||||||
Air Lease Cl. A 1 | 1,100 | 23,650 | ||||
| Total (Cost $441,460) | 558,534 | |||||
| Information Technology – 11.9% | ||||||
| Electronic Equipment, Instruments & Components - 5.2% | ||||||
Amphenol Corporation Cl. A | 300 | 19,410 | ||||
Anixter International | 500 | 31,990 | ||||
†FARO Technologies 1 | 600 | 21,408 | ||||
IPG Photonics | 550 | 36,658 | ||||
| 109,466 | ||||||
| IT Services - 3.7% | ||||||
MasterCard Cl. A | 100 | 49,128 | ||||
MoneyGram International 1 | 2,100 | 27,909 | ||||
| 77,037 | ||||||
| Office Electronics - 2.1% | ||||||
†Zebra Technologies Cl. A 1 | 1,100 | 43,208 | ||||
| Software - 0.9% | ||||||
Microsoft Corporation | 700 | 18,711 | ||||
| Total (Cost $197,080) | 248,422 | |||||
| Materials – 12.5% | ||||||
| Chemicals - 3.2% | ||||||
Airgas | 400 | 36,516 | ||||
Sigma-Aldrich Corporation | 400 | 29,432 | ||||
| 65,948 | ||||||
| Containers & Packaging - 4.9% | ||||||
Greif Cl. A | 1,100 | 48,950 | ||||
Mayr-Melnhof Karton | 500 | 53,636 | ||||
| 102,586 | ||||||
| Metals & Mining - 4.4% | ||||||
†Gold Fields ADR | 3,800 | 47,462 | ||||
†Reliance Steel & Aluminum | 700 | 43,470 | ||||
| 90,932 | ||||||
| Total (Cost $249,608) | 259,466 | |||||
| TOTAL COMMON STOCKS | ||||||
(Cost $1,766,155) | 2,030,743 | |||||
| REPURCHASE AGREEMENT – 7.8% | ||||||
Fixed Income Clearing Corporation, | 162,000 | |||||
| TOTAL INVESTMENTS – 105.3% | ||||||
(Cost $1,928,155) | 2,192,743 | |||||
| LIABILITIES LESS CASH | ||||||
AND OTHER ASSETS – (5.3)% | (109,694 | ) | ||||
| NET ASSETS – 100.0% | $ | 2,083,049 | ||||
| 60 | The Royce Funds 2012 Annual Report to Shareholders | THE ACCOMPANYING NOTES ARE AN INTEGRAL PART OF THESE FINANCIAL STATEMENTS. |
December 31, 2012 |
| Royce Opportunity Select Fund |
| SHARES | VALUE | ||||
| COMMON STOCKS – 91.0% | |||||
| Consumer Discretionary – 14.5% | |||||
| Hotels, Restaurants & Leisure - 1.3% | |||||
Orient-Express Hotels Cl. A 1 | 3,500 | $ | 40,915 | ||
| Household Durables - 5.9% | |||||
Furniture Brands International 1 | 16,000 | 16,960 | |||
Harman International Industries 2 | 900 | 40,176 | |||
Hovnanian Enterprises Cl. A 1 | 2,000 | 14,000 | |||
M.D.C. Holdings | 1,000 | 36,760 | |||
Standard Pacific 1,2 | 11,200 | 82,320 | |||
| 190,216 | |||||
| Leisure Equipment & Products - 0.8% | |||||
Callaway Golf 2 | 4,000 | 26,000 | |||
| Media - 1.0% | |||||
†Acquity Group ADR 1 | 4,000 | 30,840 | |||
| Specialty Retail - 2.9% | |||||
Lithia Motors Cl. A | 1,200 | 44,904 | |||
†Zumiez 1 | 2,500 | 48,525 | |||
| 93,429 | |||||
| Textiles, Apparel & Luxury Goods - 2.6% | |||||
Delta Apparel 1,2 | 1,900 | 26,562 | |||
Quiksilver 1 | 13,000 | 55,250 | |||
| 81,812 | |||||
| Total (Cost $351,118) | 463,212 | ||||
| Energy – 12.1% | |||||
| Energy Equipment & Services - 8.1% | |||||
Hercules Offshore 1 | 11,000 | 67,980 | |||
Key Energy Services 1 | 6,600 | 45,870 | |||
†Natural Gas Services Group 1 | 1,700 | 27,914 | |||
Newpark Resources 1 | 9,000 | 70,650 | |||
†Patterson-UTI Energy | 2,600 | 48,438 | |||
| 260,852 | |||||
| Oil, Gas & Consumable Fuels - 4.0% | |||||
Goodrich Petroleum 1 | 3,000 | 27,960 | |||
Scorpio Tankers 1 | 6,500 | 46,215 | |||
SM Energy 2 | 400 | 20,884 | |||
StealthGas 1 | 4,000 | 31,720 | |||
| 126,779 | |||||
| Total (Cost $321,160) | 387,631 | ||||
| Financials – 9.4% | |||||
| Real Estate Investment Trusts (REITs) - 4.7% | |||||
LaSalle Hotel Properties 2 | 2,000 | 50,780 | |||
PennyMac Mortgage Investment Trust | 2,600 | 65,754 | |||
RAIT Financial Trust | 6,000 | 33,900 | |||
| 150,434 | |||||
| Thrifts & Mortgage Finance - 4.7% | |||||
†BofI Holding 1 | 3,000 | 83,610 | |||
Radian Group 2 | 11,000 | 67,210 | |||
| 150,820 | |||||
| Total (Cost $268,199) | 301,254 | ||||
| Industrials – 15.5% | |||||
| Aerospace & Defense - 2.3% | |||||
†Kratos Defense & Security Solutions 1 | 14,500 | 72,935 | |||
| Air Freight & Logistics - 1.4% | |||||
†XPO Logistics 1 | 2,500 | 43,450 | |||
| Building Products - 4.0% | |||||
Ameresco Cl. A 1,2 | 3,500 | 34,335 | |||
Apogee Enterprises 2 | 1,000 | 23,970 | |||
†Builders FirstSource 1 | 12,500 | 69,750 | |||
| 128,055 | |||||
| Construction & Engineering - 0.7% | |||||
Northwest Pipe 1,2 | 1,000 | 23,860 | |||
| Machinery - 4.7% | |||||
Commercial Vehicle Group 1 | 3,100 | 25,451 | |||
Flow International 1,2 | 4,500 | 15,750 | |||
Hardinge | 2,000 | 19,880 | |||
Meritor 1 | 7,000 | 33,110 | |||
Mueller Water Products Cl. A | 10,000 | 56,100 | |||
| 150,291 | |||||
| Road & Rail - 0.6% | |||||
Swift Transportation 1,2 | 2,000 | 18,240 | |||
| Trading Companies & Distributors - 1.8% | |||||
†United Rentals 1 | 1,300 | 59,176 | |||
| Total (Cost $430,997) | 496,007 | ||||
| Information Technology – 27.8% | |||||
| Communications Equipment - 1.0% | |||||
Oclaro 1 | 7,500 | 11,775 | |||
Westell Technologies Cl. A 1 | 11,000 | 20,350 | |||
| 32,125 | |||||
| Computers & Peripherals - 0.9% | |||||
†Datalink Corporation 1 | 3,200 | 27,360 | |||
| Electronic Equipment, Instruments & Components - 2.7% | |||||
†Audience 1 | 3,000 | 31,170 | |||
Newport Corporation 1 | 4,200 | 56,490 | |||
| 87,660 | |||||
| IT Services - 0.8% | |||||
†Online Resources 1 | 11,400 | 25,878 | |||
| Semiconductors & Semiconductor Equipment - 17.4% | |||||
Alpha & Omega Semiconductor 1,2 | 4,500 | 37,800 | |||
AXT 1 | 3,000 | 8,430 | |||
†Exar Corporation 1,2 | 11,000 | 97,900 | |||
Inphi Corporation 1 | 3,000 | 28,740 | |||
Integrated Silicon Solution 1 | 2,500 | 22,500 | |||
Kulicke & Soffa Industries 1 | 3,500 | 41,965 | |||
MEMC Electronic Materials 1 | 12,500 | 40,125 | |||
†NeoPhotonics Corporation 1 | 8,800 | 50,512 | |||
†OmniVision Technologies 1 | 1,900 | 26,752 | |||
Rudolph Technologies 1 | 4,000 | 53,800 | |||
†SunPower Corporation 1 | 5,000 | 28,100 | |||
TriQuint Semiconductor 1 | 9,200 | 44,528 | |||
Ultratech 1 | 2,000 | 74,600 | |||
| 555,752 | |||||
| Software - 5.0% | |||||
Aspen Technology 1 | 1,500 | 41,460 | |||
Bottomline Technologies 1 | 2,100 | 55,419 | |||
| THE ACCOMPANYING NOTES ARE AN INTEGRAL PART OF THESE FINANCIAL STATEMENTS. | The Royce Funds 2012 Annual Report to Shareholders | 61 |
Schedules of Investments
| Royce Opportunity Select Fund (continued) |
| SHARES | VALUE | |||||
| Information Technology (continued) | ||||||
| Software (continued) | ||||||
†Ellie Mae 1 | 2,300 | $ | 63,825 | |||
| 160,704 | ||||||
| Total (Cost $777,305) | 889,479 | |||||
| Materials – 8.6% | ||||||
| Chemicals - 2.0% | ||||||
Ferro Corporation 1 | 5,000 | 20,900 | ||||
OM Group 1 | 1,900 | 42,180 | ||||
| 63,080 | ||||||
| Metals & Mining - 6.6% | ||||||
Century Aluminum 1 | 4,000 | 35,040 | ||||
RTI International Metals 1,2 | 1,500 | 41,340 | ||||
†US Silica Holdings | 4,700 | 78,631 | ||||
†Walter Energy | 1,600 | 57,408 | ||||
| 212,419 | ||||||
| Total (Cost $255,998) | 275,499 | |||||
| Miscellaneous 3 – 3.1% | ||||||
| Total (Cost $94,990) | 96,945 | |||||
| TOTAL COMMON STOCKS | ||||||
(Cost $2,499,767) | 2,910,027 | |||||
| REPURCHASE AGREEMENT – 10.1% | ||||||
Fixed Income Clearing Corporation, | 325,000 | |||||
| TOTAL INVESTMENTS – 101.1% | ||||||
(Cost $2,824,767) | 3,235,027 | |||||
| LIABILITIES LESS CASH | ||||||
AND OTHER ASSETS – (1.1)% | (36,624 | ) | ||||
| NET ASSETS – 100.0% | $ | 3,198,403 | ||||
| SECURITIES SOLD SHORT | ||||||
| COMMON STOCKS – 10.8% | ||||||
| Consumer Discretionary – 2.8% | ||||||
| Hotels, Restaurants & Leisure - 0.4% | ||||||
Bravo Brio Restaurant Group | 1,000 | $ | 13,430 | |||
| Specialty Retail - 2.4% | ||||||
ANN | 1,000 | 33,840 | ||||
Chico’s FAS | 500 | 9,230 | ||||
Rent-A-Center | 1,000 | 34,360 | ||||
| 77,430 | ||||||
| Total (Proceeds $92,461) | 90,860 | |||||
| Consumer Staples – 2.6% | ||||||
| Food & Staples Retailing - 2.6% | ||||||
Fresh Market | 1,700 | 81,753 | ||||
| Total (Proceeds $83,432) | 81,753 | |||||
| Industrials – 1.9% | ||||||
| Air Freight & Logistics - 1.4% | ||||||
Atlas Air Worldwide Holdings | 1,000 | 44,310 | ||||
| Airlines - 0.5% | ||||||
Spirit Airlines | 1,000 | 17,720 | ||||
| Total (Proceeds $61,947) | 62,030 | |||||
| Information Technology – 0.8% | ||||||
| Internet Software & Services - 0.8% | ||||||
Stamps.com | 1,000 | 25,200 | ||||
| Total (Proceeds $25,786) | 25,200 | |||||
| Materials – 2.7% | ||||||
| Chemicals - 2.1% | ||||||
Cabot Corporation | 1,000 | 39,790 | ||||
Koppers Holdings | 700 | 26,705 | ||||
| 66,495 | ||||||
| Metals & Mining - 0.6% | ||||||
Worthington Industries | 700 | 18,193 | ||||
| Total (Proceeds $76,547) | 84,688 | |||||
| TOTAL SECURITIES SOLD SHORT | ||||||
(Proceeds $340,173) | $ | 344,531 | ||||
| 62 | The Royce Funds 2012 Annual Report to Shareholders | THE ACCOMPANYING NOTES ARE AN INTEGRAL PART OF THESE FINANCIAL STATEMENTS. |
December 31, 2012 |
| Royce Global Dividend Value Fund |
| SHARES | VALUE | ||||
| COMMON STOCKS – 98.0% | |||||
| Australia – 1.0% | |||||
Cochlear | 300 | $ | 24,819 | ||
Medusa Mining | 8,000 | 46,143 | |||
| Total (Cost $83,001) | 70,962 | ||||
| Austria – 2.1% | |||||
Mayr-Melnhof Karton | 800 | 85,817 | |||
Semperit AG Holding | 1,300 | 53,581 | |||
| Total (Cost $161,092) | 139,398 | ||||
| Belgium – 1.6% | |||||
EVS Broadcast Equipment | 600 | 35,397 | |||
Sipef | 600 | 47,002 | |||
†Van de Velde | 600 | 27,134 | |||
| Total (Cost $120,845) | 109,533 | ||||
| Bermuda – 1.0% | |||||
†Lazard Cl. A | 2,160 | 64,454 | |||
| Total (Cost $64,117) | 64,454 | ||||
| Brazil – 1.5% | |||||
Eternit | 8,000 | 31,907 | |||
†Fleury | 1,700 | 19,164 | |||
Grendene | 6,500 | 52,673 | |||
| Total (Cost $102,560) | 103,744 | ||||
| Canada – 4.3% | |||||
Canadian Energy Services & Technology | 1,200 | 12,788 | |||
E-L Financial | 40 | 17,493 | |||
Major Drilling Group International | 6,600 | 65,025 | |||
Pan American Silver | 1,600 | 29,968 | |||
Pason Systems | 1,500 | 25,862 | |||
ShawCor Cl. A | 450 | 17,639 | |||
Sprott | 15,000 | 59,716 | |||
Stella-Jones | 400 | 30,815 | |||
Trican Well Service | 2,000 | 26,380 | |||
| Total (Cost $347,061) | 285,686 | ||||
| China – 2.1% | |||||
Anta Sports Products | 30,000 | 26,820 | |||
Daphne International Holdings | 45,000 | 62,336 | |||
E-House China Holdings ADR | 7,000 | 28,700 | |||
†Pacific Online | 70,000 | 24,820 | |||
| Total (Cost $162,723) | 142,676 | ||||
| Cyprus – 0.6% | |||||
Globaltrans Investment GDR | 2,500 | 41,781 | |||
| Total (Cost $33,391) | 41,781 | ||||
| Denmark – 2.0% | |||||
H. Lundbeck | 2,000 | 29,279 | |||
†Pandora | 1,300 | 28,645 | |||
SimCorp | 350 | 78,348 | |||
| Total (Cost $110,317) | 136,272 | ||||
| Egypt – 0.6% | |||||
Egyptian Financial Group-Hermes Holding | |||||
Company 1 | 21,875 | 37,903 | |||
| Total (Cost $61,534) | 37,903 | ||||
| Finland – 1.8% | |||||
Marimekko | 1,500 | 28,337 | |||
Nokian Renkaat | 700 | 28,167 | |||
Ponsse | 4,500 | 35,434 | |||
Vaisala Cl. A | 1,500 | 31,507 | |||
| Total (Cost $158,314) | 123,445 | ||||
| France – 4.7% | |||||
Alten | 1,500 | 51,749 | |||
Audika Groupe | 2,500 | 27,321 | |||
bioMerieux | 400 | 38,664 | |||
†Boiron | 1,000 | 34,497 | |||
Manutan International | 800 | 35,491 | |||
Piscines Desjoyaux | 3,000 | 22,632 | |||
Societe Internationale de Plantations d’Heveas | 750 | 61,441 | |||
Vetoquinol | 1,200 | 42,074 | |||
| Total (Cost $369,509) | 313,869 | ||||
| Germany – 6.9% | |||||
Carl Zeiss Meditec | 1,875 | 53,870 | |||
Fielmann | 200 | 19,271 | |||
Fuchs Petrolub | 960 | 67,218 | |||
KWS Saat | 75 | 24,109 | |||
Nemetschek | 1,430 | 62,971 | |||
Pfeiffer Vacuum Technology | 580 | 70,232 | |||
PUMA | 145 | 43,038 | |||
Rational | 160 | 46,080 | |||
STRATEC Biomedical | 500 | 24,962 | |||
Takkt | 3,500 | 48,728 | |||
| Total (Cost $406,601) | 460,479 | ||||
| Hong Kong – 7.3% | |||||
Arts Optical International Holdings | 76,000 | 19,905 | |||
Asian Citrus Holdings | 40,000 | 19,030 | |||
†Le Saunda Holdings | 72,000 | 23,866 | |||
Lung Kee (Bermuda) Holdings | 76,000 | 27,925 | |||
†Media Chinese International | 55,000 | 20,082 | |||
Midland Holdings | 60,000 | 29,136 | |||
New World Department Store China | 65,000 | 42,312 | |||
Pacific Textiles Holdings | 50,000 | 45,239 | |||
Pico Far East Holdings | 85,000 | 25,400 | |||
Stella International Holdings | �� | 10,000 | 27,108 | ||
†Television Broadcasts | 3,000 | 22,519 | |||
Texwinca Holdings | 50,000 | 47,754 | |||
Value Partners Group | 95,000 | 63,773 | |||
Win Hanverky Holdings | 276,000 | 28,644 | |||
| THE ACCOMPANYING NOTES ARE AN INTEGRAL PART OF THESE FINANCIAL STATEMENTS. | The Royce Funds 2012 Annual Report to Shareholders | 63 |
Schedules of Investments
| Royce Global Dividend Value Fund (continued) |
| SHARES | VALUE | ||||
| Hong Kong (continued) | |||||
Xtep International Holdings | 105,000 | $ | 45,438 | ||
| Total (Cost $552,681) | 488,131 | ||||
| Indonesia – 0.8% | |||||
Selamat Sempurna | 200,000 | 52,280 | |||
| Total (Cost $27,572) | 52,280 | ||||
| Italy – 1.3% | |||||
DiaSorin | 1,000 | 40,112 | |||
Recordati | 5,200 | 47,642 | |||
| Total (Cost $92,855) | 87,754 | ||||
| Japan – 10.1% | |||||
BML | 1,600 | 39,053 | |||
†Dr.Ci:Labo | 12 | 37,445 | |||
EPS Corporation | 20 | 51,243 | |||
FamilyMart | 1,600 | 65,863 | |||
Hisamitsu Pharmaceutical | 600 | 29,750 | |||
†Hogy Medical | 500 | 23,814 | |||
†Mandom Corporation | 700 | 19,270 | |||
†Miraial | 1,500 | 28,256 | |||
†MISUMI Group | 1,500 | 40,707 | |||
Moshi Moshi Hotline | 4,000 | 50,983 | |||
Nihon Kohden | 1,200 | 36,385 | |||
†Nihon M&A Center | 1,500 | 49,944 | |||
Santen Pharmaceutical | 1,800 | 68,916 | |||
Shimano | 800 | 51,010 | |||
TOTO | 2,000 | 15,023 | |||
USS | 700 | 72,558 | |||
| Total (Cost $585,555) | 680,220 | ||||
| Jersey – 1.6% | |||||
Randgold Resources ADR | 1,100 | 109,175 | |||
| Total (Cost $95,636) | 109,175 | ||||
| Lebanon – 0.2% | |||||
BLOM Bank GDR | 1,600 | 12,640 | |||
| Total (Cost $16,017) | 12,640 | ||||
| Malaysia – 1.1% | |||||
CB Industrial Product Holding | 40,000 | 35,811 | |||
Padini Holdings | 60,000 | 36,450 | |||
| Total (Cost $51,569) | 72,261 | ||||
| Mexico – 2.0% | |||||
Bolsa Mexicana de Valores | 21,200 | 53,466 | |||
Grupo Herdez | 17,500 | 53,801 | |||
Industrias Bachoco ADR | 1,100 | 30,712 | |||
| Total (Cost $99,656) | 137,979 | ||||
| Netherlands – 0.7% | |||||
Beter Bed Holding | 1,500 | 26,315 | |||
Hunter Douglas | 500 | 19,428 | |||
| Total (Cost $45,471) | 45,743 | ||||
| Norway – 2.0% | |||||
Ekornes | 4,200 | 70,039 | |||
TGS-NOPEC Geophysical | 2,000 | 65,541 | |||
| Total (Cost $138,843) | 135,580 | ||||
| Poland – 1.1% | |||||
Warsaw Stock Exchange | 6,000 | 75,446 | |||
| Total (Cost $88,081) | 75,446 | ||||
| Singapore – 2.3% | |||||
ARA Asset Management | 35,500 | 47,370 | |||
Armstrong Industrial | 90,000 | 19,412 | |||
Broadway Industrial Group | 90,000 | 22,965 | |||
†ComfortDelGro Corporation | 21,000 | 30,778 | |||
SATS | 6,600 | 15,703 | |||
Singapore Exchange | 2,900 | 16,813 | |||
| Total (Cost $162,437) | 153,041 | ||||
| South Africa – 3.9% | |||||
Adcock Ingram Holdings | 9,800 | 62,429 | |||
ADvTECH | 45,000 | 32,981 | |||
†Coronation Fund Managers | 9,200 | 43,104 | |||
†JSE | 4,000 | 36,876 | |||
Lewis Group | 4,500 | 36,706 | |||
Raubex Group | 25,000 | 50,003 | |||
| Total (Cost $291,773) | 262,099 | ||||
| South Korea – 3.1% | |||||
Bukwang Pharmaceutical | 1,653 | 21,798 | |||
Green Cross | 300 | 38,867 | |||
†GS Home Shopping | 300 | 42,730 | |||
MegaStudy | 910 | 67,073 | |||
Sung Kwang Bend | 1,500 | 34,681 | |||
| Total (Cost $211,910) | 205,149 | ||||
| Spain – 0.2% | |||||
Bolsas y Mercados Espanoles | 600 | 14,503 | |||
| Total (Cost $17,729) | 14,503 | ||||
| Switzerland – 8.9% | |||||
Belimo Holding | 15 | 29,013 | |||
Burckhardt Compression Holding | 200 | 65,597 | |||
Coltene Holding | 1,200 | 40,376 | |||
Inficon Holding | 250 | 59,955 | |||
†Kaba Holding | 100 | 42,392 | |||
LEM Holding | 104 | 57,400 | |||
Partners Group Holding | 190 | 43,885 | |||
Sika | 23 | 53,305 | |||
Straumann Holding | 250 | 30,900 | |||
Sulzer | 400 | 63,391 | |||
| 64 | The Royce Funds 2012 Annual Report to Shareholders | THE ACCOMPANYING NOTES ARE AN INTEGRAL PART OF THESE FINANCIAL STATEMENTS. |
December 31, 2012 |
| SHARES | VALUE | |||||
| Switzerland (continued) | ||||||
†Tecan Group | 300 | $ | 25,140 | |||
VZ Holding | 500 | 63,065 | ||||
†Zehnder Group | 500 | 24,267 | ||||
| Total (Cost $577,593) | 598,686 | |||||
| Thailand – 0.2% | ||||||
Hana Microelectronics | 18,000 | 13,450 | ||||
| Total (Cost $15,020) | 13,450 | |||||
| Turkey – 1.3% | ||||||
†Koza Altin Isletmeleri | 1,100 | 26,564 | ||||
Mardin Cimento Sanayii | 19,500 | 58,375 | ||||
| Total (Cost $101,697) | 84,939 | |||||
| United Kingdom – 9.0% | ||||||
Ashmore Group | 10,200 | 58,980 | ||||
†Clarkson | 2,000 | 39,582 | ||||
Close Brothers Group | 1,200 | 16,850 | ||||
De La Rue | 1,200 | 17,712 | ||||
Diploma | 4,100 | 36,869 | ||||
Domino Printing Sciences | 4,000 | 37,986 | ||||
Hochschild Mining | 7,500 | 58,275 | ||||
†Investec | 5,000 | 34,055 | ||||
Jupiter Fund Management | 22,500 | 104,431 | ||||
†Latchways | 1,200 | 19,411 | ||||
Michael Page International | 3,500 | 22,605 | ||||
†Oxford Instruments | 1,500 | 35,074 | ||||
Rathbone Brothers | 700 | 14,783 | ||||
†RIT Capital Partners | 1,700 | 31,284 | ||||
Severfield-Rowen | 10,200 | 16,002 | ||||
Spirax-Sarco Engineering | 1,500 | 56,396 | ||||
| Total (Cost $578,545) | 600,295 | |||||
| United States – 10.7% | ||||||
Apollo Global Management LLC Cl. A | 3,200 | 55,552 | ||||
†Cascade Corporation | 500 | 32,150 | ||||
†Compass Minerals International | 400 | 29,884 | ||||
†Dynamic Materials | 1,800 | 25,020 | ||||
Expeditors International of Washington | 1,200 | 47,460 | ||||
†FLIR Systems | 1,650 | 36,811 | ||||
Greif Cl. A | 1,100 | 48,950 | ||||
Harman International Industries | 800 | 35,712 | ||||
†Hecla Mining | 9,000 | 52,470 | ||||
Invesco | 2,900 | 75,661 | ||||
KBR | 2,600 | 77,792 | ||||
Sims Metal Management ADR | 4,500 | 44,370 | ||||
†Tidewater | 1,800 | 80,424 | ||||
WaterFurnace Renewable Energy | 1,000 | 14,517 | ||||
†Western Digital | 1,400 | 59,486 | ||||
| Total (Cost $701,128) | 716,259 | |||||
| TOTAL COMMON STOCKS | ||||||
(Cost $6,632,833) | 6,575,832 | |||||
| REPURCHASE AGREEMENT – 2.6% | ||||||
Fixed Income Clearing Corporation, | 175,000 | |||||
| TOTAL INVESTMENTS – 100.6% | ||||||
(Cost $6,807,833) | 6,750,832 | |||||
| LIABILITIES LESS CASH | ||||||
AND OTHER ASSETS – (0.6)% | (42,664 | ) | ||||
| NET ASSETS – 100.0% | $ | 6,708,168 | ||||
| THE ACCOMPANYING NOTES ARE AN INTEGRAL PART OF THESE FINANCIAL STATEMENTS. | The Royce Funds 2012 Annual Report to Shareholders | 65 |
Schedules of Investments
| Royce International Micro-Cap Fund |
| SHARES | VALUE | ||||
| COMMON STOCKS – 94.5% | |||||
| Australia – 4.5% | |||||
Evolution Mining 1 | 30,000 | $ | 54,344 | ||
Imdex | 25,000 | 44,682 | |||
Kingsrose Mining | 35,000 | 30,922 | |||
TFS Corporation 1 | 90,000 | 41,909 | |||
Troy Resources | 9,711 | 37,027 | |||
| Total (Cost $245,960) | 208,884 | ||||
| Austria – 1.5% | |||||
†Semperit AG Holding | 1,700 | 70,067 | |||
| Total (Cost $61,718) | 70,067 | ||||
| Belgium – 1.0% | |||||
†EVS Broadcast Equipment | 800 | 47,197 | |||
| Total (Cost $36,323) | 47,197 | ||||
| Bermuda – 0.8% | |||||
Northern Offshore | 20,000 | 35,893 | |||
| Total (Cost $39,962) | 35,893 | ||||
| Brazil – 2.2% | |||||
†Brasil Brokers Participacoes | 15,000 | 50,285 | |||
Eternit | 12,500 | 49,854 | |||
| Total (Cost $112,584) | 100,139 | ||||
| Canada – 3.5% | |||||
Alexco Resource 1 | 5,500 | 19,635 | |||
Goldgroup Mining 1 | 41,000 | 15,457 | |||
†IROC Energy Services | 9,500 | 21,393 | |||
†Major Drilling Group International | 4,000 | 39,409 | |||
Sprott Resource | 5,000 | 21,866 | |||
Total Energy Services | 3,000 | 45,210 | |||
| Total (Cost $203,329) | 162,970 | ||||
| China – 1.4% | |||||
E-House China Holdings ADR | 8,000 | 32,800 | |||
†Pacific Online | 80,000 | 28,366 | |||
Qunxing Paper Holdings 4 | 41,000 | 2,184 | |||
| Total (Cost $76,879) | 63,350 | ||||
| Denmark – 1.0% | |||||
†SimCorp | 200 | 44,770 | |||
| Total (Cost $32,266) | 44,770 | ||||
| Finland – 0.8% | |||||
Ponsse | 4,500 | 35,434 | |||
| Total (Cost $42,291) | 35,434 | ||||
| France – 11.2% | |||||
Altamir Amboise | 4,500 | 43,997 | |||
Audika Groupe | 4,500 | 49,177 | |||
†Boiron | 600 | 20,698 | |||
Exel Industries | 600 | 29,992 | |||
†Foraco International | 12,000 | 29,074 | |||
Manutan International | 1,400 | 62,109 | |||
Neurones | 4,500 | 49,418 | |||
Parrot 1 | 1,500 | 55,877 | |||
Piscines Desjoyaux | 3,500 | 26,404 | |||
†Societe Internationale de Plantations d’Heveas | 500 | 40,961 | |||
†Stallergenes | 700 | 39,863 | |||
Vetoquinol | 2,000 | 70,124 | |||
| Total (Cost $565,640) | 517,694 | ||||
| Germany – 4.9% | |||||
†Bertrandt | 200 | 20,021 | |||
Deutsche Beteiligungs | 1,000 | 25,679 | |||
†LPKF Laser & Electronics | 1,500 | 31,389 | |||
Mobotix | 700 | 16,781 | |||
Nemetschek | 1,000 | 44,036 | |||
†SMT Scharf | 1,400 | 39,173 | |||
†Takkt | 3,500 | 48,728 | |||
| Total (Cost $209,660) | 225,807 | ||||
| Greece – 0.4% | |||||
†JUMBO | 2,500 | 19,774 | |||
| Total (Cost $11,705) | 19,774 | ||||
| Hong Kong – 9.9% | |||||
Arts Optical International Holdings | 150,000 | 39,286 | |||
Dickson Concepts (International) | 45,000 | 23,947 | |||
†Embry Holdings | 50,000 | 28,854 | |||
Fairwood Holdings | 10,000 | 20,872 | |||
Goldlion Holdings | 100,000 | 53,986 | |||
†Le Saunda Holdings | 84,000 | 27,843 | |||
Lung Kee (Bermuda) Holdings | 100,000 | 36,744 | |||
Midland Holdings | 110,000 | 53,417 | |||
Oriental Watch Holdings | 90,000 | 31,688 | |||
Pico Far East Holdings | 150,000 | 44,824 | |||
Tse Sui Luen Jewellery (International) | 61,000 | 30,669 | |||
Win Hanverky Holdings | 350,000 | 36,324 | |||
†YGM Trading | 12,000 | 28,295 | |||
| Total (Cost $494,642) | 456,749 | ||||
| India – 4.0% | |||||
†Educomp Solutions | 15,000 | 38,625 | |||
FAG Bearings India | 1,700 | 53,223 | |||
Graphite India | 30,000 | 45,630 | |||
Maharashtra Seamless | 9,000 | 44,376 | |||
| Total (Cost $190,591) | 181,854 | ||||
| Indonesia – 0.6% | |||||
Selamat Sempurna | 100,000 | 26,140 | |||
| Total (Cost $13,006) | 26,140 | ||||
| 66 | The Royce Funds 2012 Annual Report to Shareholders | THE ACCOMPANYING NOTES ARE AN INTEGRAL PART OF THESE FINANCIAL STATEMENTS. |
December 31, 2012 |
| SHARES | VALUE | ||||
| Isle of Man – 0.7% | |||||
Geodrill 1 | 27,500 | $ | 29,858 | ||
| Total (Cost $59,209) | 29,858 | ||||
| Italy – 3.1% | |||||
†Geox | 11,500 | 33,253 | |||
†Interpump Group | 2,500 | 19,426 | |||
Nice | 15,000 | 52,010 | |||
Piquadro | 17,500 | 36,452 | |||
| Total (Cost $168,463) | 141,141 | ||||
| Japan – 9.7% | |||||
†Asahi Company | 3,000 | 42,942 | |||
†BML | 2,000 | 48,816 | |||
C. Uyemura & Co. | 1,500 | 47,468 | |||
EPS Corporation | 20 | 51,244 | |||
†Gurunavi | 4,000 | 40,918 | |||
†Hogy Medical | 400 | 19,051 | |||
†Mandom Corporation | 900 | 24,775 | |||
†Milbon | 900 | 28,399 | |||
Miraial | 3,000 | 56,512 | |||
†Moshi Moshi Hotline | 1,700 | 21,668 | |||
†Nihon M&A Center | 2,000 | 66,592 | |||
| Total (Cost $464,318) | 448,385 | ||||
| Malaysia – 3.8% | |||||
CB Industrial Product Holding | 55,000 | 49,240 | |||
†Coastal Contracts | 60,000 | 39,147 | |||
Kossan Rubber Industries | 40,000 | 43,941 | |||
Padini Holdings | 70,000 | 42,525 | |||
| Total (Cost $145,251) | 174,853 | ||||
| Mexico – 0.3% | |||||
†Medica Sur Ser. B | 8,500 | 15,986 | |||
| Total (Cost $15,744) | 15,986 | ||||
| Netherlands – 1.1% | |||||
Beter Bed Holding | 3,000 | 52,630 | |||
| Total (Cost $54,971) | 52,630 | ||||
| Norway – 1.1% | |||||
†Ekornes | 3,000 | 50,028 | |||
| Total (Cost $44,744) | 50,028 | ||||
| Poland – 2.1% | |||||
Elektrobudowa | 1,600 | 54,296 | |||
†Warsaw Stock Exchange | 3,500 | 44,010 | |||
| Total (Cost $117,405) | 98,306 | ||||
| Singapore – 2.9% | |||||
Armstrong Industrial | 125,000 | 26,961 | |||
CSE Global | 85,000 | 54,746 | |||
†Hour Glass (The) | 20,000 | 27,738 | |||
†Yoma Strategic Holdings | 40,000 | 23,426 | |||
| Total (Cost $147,262) | 132,871 | ||||
| South Africa – 3.1% | |||||
ADvTECH | 35,000 | 25,652 | |||
Bell Equipment 1 | 5,000 | 14,663 | |||
Merafe Resources 1 | 500,000 | 40,192 | |||
Raubex Group | 20,000 | 40,003 | |||
†Village Main Reef | 160,000 | 23,742 | |||
| Total (Cost $205,812) | 144,252 | ||||
| South Korea – 2.9% | |||||
†GS Home Shopping | 300 | 42,730 | |||
†Handsome Co. | 1,200 | 33,123 | |||
†MegaStudy | 800 | 58,965 | |||
| Total (Cost $115,446) | 134,818 | ||||
| Spain – 0.6% | |||||
Clinica Baviera | 5,500 | 28,401 | |||
| Total (Cost $42,906) | 28,401 | ||||
| Sri Lanka – 0.6% | |||||
†Distilleries Company of Sri Lanka | 20,000 | 25,951 | |||
| Total (Cost $22,213) | 25,951 | ||||
| Sweden – 0.9% | |||||
Bjoern Borg | 7,500 | 40,356 | |||
| Total (Cost $54,468) | 40,356 | ||||
| Switzerland – 4.5% | |||||
Calida Holding | 1,500 | 41,884 | |||
Coltene Holding | 1,000 | 33,647 | |||
Inficon Holding | 125 | 29,978 | |||
LEM Holding | 70 | 38,634 | |||
†VZ Holding | 300 | 37,839 | |||
†Zehnder Group | 500 | 24,267 | |||
| Total (Cost $201,073) | 206,249 | ||||
| Taiwan – 0.8% | |||||
†Makalot Industrial | 12,500 | 38,985 | |||
| Total (Cost $36,417) | 38,985 | ||||
| Turkey – 1.0% | |||||
Mardin Cimento Sanayii | 15,000 | 44,904 | |||
| Total (Cost $53,878) | 44,904 | ||||
| United Arab Emirates – 0.6% | |||||
†Aramex | 52,000 | 28,261 | |||
| Total (Cost $25,530) | 28,261 | ||||
| United Kingdom – 5.4% | |||||
†Clarkson | 2,000 | 39,582 | |||
†Clinigen Group 1 | 15,000 | 52,029 | |||
| THE ACCOMPANYING NOTES ARE AN INTEGRAL PART OF THESE FINANCIAL STATEMENTS. | The Royce Funds 2012 Annual Report to Shareholders | 67 |
Schedules of Investments
| Royce International Micro-Cap Fund (continued) |
| SHARES | VALUE | |||||
| United Kingdom (continued) | ||||||
Diploma | 4,500 | $ | 40,465 | |||
†Immunodiagnostic Systems Holdings | 7,500 | 38,364 | ||||
Latchways | 2,800 | 45,293 | ||||
Severfield-Rowen | 20,000 | 31,377 | ||||
| Total (Cost $246,752) | 247,110 | |||||
| United States – 1.6% | ||||||
Century Casinos 1 | 12,000 | 34,080 | ||||
WaterFurnace Renewable Energy | 2,600 | 37,744 | ||||
| Total (Cost $95,033) | 71,824 | |||||
| TOTAL COMMON STOCKS | ||||||
(Cost $4,653,451) | 4,351,891 | |||||
| REPURCHASE AGREEMENT – 7.9% | ||||||
Fixed Income Clearing Corporation, | 364,000 | |||||
| TOTAL INVESTMENTS – 102.4% | ||||||
(Cost $5,017,451) | 4,715,891 | |||||
| LIABILITIES LESS CASH | ||||||
AND OTHER ASSETS – (2.4)% | (112,446 | ) | ||||
| NET ASSETS – 100.0% | $ | 4,603,445 | ||||
| Royce International Premier Fund |
| SHARES | VALUE | ||||
| COMMON STOCKS – 94.7% | |||||
| Austria – 6.0% | |||||
Mayr-Melnhof Karton | 1,800 | $ | 193,088 | ||
Semperit AG Holding | 4,700 | 193,715 | |||
| Total (Cost $404,504) | 386,803 | ||||
| Belgium – 1.4% | |||||
EVS Broadcast Equipment | 1,500 | 88,494 | |||
| Total (Cost $87,886) | 88,494 | ||||
| China – 2.1% | |||||
Daphne International Holdings | 100,000 | 138,525 | |||
| Total (Cost $121,970) | 138,525 | ||||
| Finland – 2.8% | |||||
Nokian Renkaat | 3,000 | 120,716 | |||
†Vacon | 1,100 | 58,656 | |||
| Total (Cost $181,391) | 179,372 | ||||
| France – 7.9% | |||||
bioMerieux | 1,200 | 115,993 | |||
†Stallergenes | 2,500 | 142,367 | |||
Vetoquinol | 2,605 | 91,337 | |||
Virbac | 800 | 158,186 | |||
| Total (Cost $479,701) | 507,883 | ||||
| Germany – 11.3% | |||||
Carl Zeiss Meditec | 4,000 | 114,922 | |||
†Fielmann | 1,100 | 105,991 | |||
Fuchs Petrolub | 1,700 | 119,033 | |||
KWS Saat | 400 | 128,579 | |||
Pfeiffer Vacuum Technology | 1,200 | 145,308 | |||
Rational | 400 | 115,199 | |||
| Total (Cost $622,349) | 729,032 | ||||
| Hong Kong – 3.9% | |||||
†Media Chinese International | 250,000 | 91,281 | |||
Stella International Holdings | 60,000 | 162,649 | |||
| Total (Cost $265,795) | 253,930 | ||||
| Italy – 5.2% | |||||
DiaSorin | 5,000 | 200,559 | |||
Recordati | 14,700 | 134,682 | |||
| Total (Cost $296,204) | 335,241 | ||||
| Japan – 10.7% | |||||
FamilyMart | 3,000 | 123,493 | |||
†Kakaku.com | 3,500 | 115,251 | |||
†M3 | 50 | 79,480 | |||
†MISUMI Group | 6,000 | 162,829 | |||
Santen Pharmaceutical | 3,000 | 114,860 | |||
| 68 | The Royce Funds 2012 Annual Report to Shareholders | THE ACCOMPANYING NOTES ARE AN INTEGRAL PART OF THESE FINANCIAL STATEMENTS. |
December 31, 2012 |
| SHARES | VALUE | ||||
| Japan (continued) | |||||
USS | 900 | $ | 93,289 | ||
| Total (Cost $664,106) | 689,202 | ||||
| Malaysia – 1.8% | |||||
†Media Prima | 155,000 | 118,612 | |||
| Total (Cost $114,034) | 118,612 | ||||
| Norway – 2.2% | |||||
Ekornes | 8,400 | 140,079 | |||
| Total (Cost $163,636) | 140,079 | ||||
| South Africa – 3.2% | |||||
Lewis Group | 25,000 | 203,924 | |||
| Total (Cost $215,269) | 203,924 | ||||
| South Korea – 4.8% | |||||
Green Cross | 1,000 | 129,556 | |||
MegaStudy | 2,400 | 176,897 | |||
| Total (Cost $351,489) | 306,453 | ||||
| Switzerland – 14.7% | |||||
Belimo Holding | 76 | 147,000 | |||
Burckhardt Compression Holding | 350 | 114,794 | |||
Geberit | 330 | 73,055 | |||
†Kaba Holding | 275 | 116,578 | |||
LEM Holding | 130 | 71,750 | |||
Partners Group Holding | 700 | 161,680 | |||
Straumann Holding | 1,200 | 148,318 | |||
†VZ Holding | 900 | 113,516 | |||
| Total (Cost $868,893) | 946,691 | ||||
| United Kingdom – 16.7% | |||||
†Abcam | 20,000 | 125,602 | |||
Ashmore Group | 25,000 | 144,558 | |||
†Aveva Group | 3,000 | 106,681 | |||
†Domino Printing Sciences | 19,500 | 185,180 | |||
†Oxford Instruments | 5,000 | 116,915 | |||
Rotork | 3,000 | 124,413 | |||
Spirax-Sarco Engineering | 3,400 | 127,830 | |||
Victrex | 5,500 | 148,434 | |||
| Total (Cost $956,371) | 1,079,613 | ||||
| TOTAL COMMON STOCKS | |||||
(Cost $5,793,598) | 6,103,854 | ||||
| REPURCHASE AGREEMENT – 4.8% | |||||
Fixed Income Clearing Corporation, | 305,000 | ||||
| TOTAL INVESTMENTS – 99.5% | |||||
(Cost $6,098,598) | $ | 6,408,854 | |||
| CASH AND OTHER ASSETS | |||||
LESS LIABILITIES – 0.5% | 35,059 | ||||
| NET ASSETS – 100.0% | $ | 6,443,913 | |||
| THE ACCOMPANYING NOTES ARE AN INTEGRAL PART OF THESE FINANCIAL STATEMENTS. | The Royce Funds 2012 Annual Report to Shareholders | 69 |
Schedules of Investments
| Royce Special Equity Multi-Cap Fund |
| SHARES | VALUE | |||||
| COMMON STOCKS – 94.2% | ||||||
| Consumer Discretionary – 23.2% | ||||||
| Distributors - 2.8% | ||||||
Genuine Parts | 47,700 | $ | 3,032,766 | |||
| Leisure Equipment & Products - 2.7% | ||||||
Mattel | 80,000 | 2,929,600 | ||||
| Media - 2.4% | ||||||
Scripps Networks Interactive Cl. A | 44,000 | 2,548,480 | ||||
| Multiline Retail - 5.8% | ||||||
Kohl’s Corporation | 68,800 | 2,957,024 | ||||
Nordstrom | 63,550 | 3,399,925 | ||||
| 6,356,949 | ||||||
| Specialty Retail - 9.5% | ||||||
Bed Bath & Beyond 1 | 65,300 | 3,650,923 | ||||
Gap (The) | 113,550 | 3,524,592 | ||||
Staples | 279,500 | 3,186,300 | ||||
| 10,361,815 | ||||||
| Total (Cost $24,256,860) | 25,229,610 | |||||
| Consumer Staples – 6.6% | ||||||
| Food & Staples Retailing - 3.7% | ||||||
Walgreen Company | 109,325 | 4,046,118 | ||||
| Food Products - 2.9% | ||||||
Hormel Foods | 102,575 | 3,201,366 | ||||
| Total (Cost $6,727,788) | 7,247,484 | |||||
| Energy – 3.1% | ||||||
| Oil, Gas & Consumable Fuels - 3.1% | ||||||
Occidental Petroleum | 44,500 | 3,409,145 | ||||
| Total (Cost $3,943,995) | 3,409,145 | |||||
| Health Care – 14.6% | ||||||
| Health Care Equipment & Supplies - 8.9% | ||||||
C.R. Bard | 33,450 | 3,269,403 | ||||
Medtronic | 78,400 | 3,215,968 | ||||
Stryker Corporation | 59,350 | 3,253,567 | ||||
| 9,738,938 | ||||||
| Health Care Providers & Services - 3.1% | ||||||
Quest Diagnostics | 56,900 | 3,315,563 | ||||
| Pharmaceuticals - 2.6% | ||||||
Johnson & Johnson | 40,700 | 2,853,070 | ||||
| Total (Cost $15,205,645) | 15,907,571 | |||||
| Industrials – 23.2% | ||||||
| Aerospace & Defense - 5.4% | ||||||
Raytheon Company | 51,000 | 2,935,560 | ||||
United Technologies | 36,145 | 2,964,251 | ||||
| 5,899,811 | ||||||
| Electrical Equipment - 4.0% | ||||||
Emerson Electric | 81,700 | 4,326,832 | ||||
| Industrial Conglomerates - 2.9% | ||||||
3M | 33,600 | 3,119,760 | ||||
| Machinery - 10.9% | ||||||
†Cummins | 24,050 | 2,605,818 | ||||
Dover Corporation | 60,500 | 3,975,455 | ||||
Illinois Tool Works | 42,500 | 2,584,425 | ||||
†Parker Hannifin | 32,490 | 2,763,599 | ||||
| 11,929,297 | ||||||
| Total (Cost $23,274,765) | 25,275,700 | |||||
| Information Technology – 23.5% | ||||||
| Communications Equipment - 3.2% | ||||||
Cisco Systems | 176,600 | 3,470,190 | ||||
| Electronic Equipment, Instruments & Components - 6.0% | ||||||
†Avnet 1 | 73,500 | 2,249,835 | ||||
Molex Cl. A | 190,500 | 4,251,960 | ||||
| 6,501,795 | ||||||
| Semiconductors & Semiconductor Equipment - 11.3% | ||||||
Analog Devices | 90,600 | 3,810,636 | ||||
Applied Materials | 279,500 | 3,197,480 | ||||
Intel Corporation | 145,800 | 3,007,854 | ||||
†KLA-Tencor | 49,350 | 2,356,956 | ||||
| 12,372,926 | ||||||
| Software - 3.0% | ||||||
Microsoft Corporation | 122,200 | 3,266,406 | ||||
| Total (Cost $25,732,773) | 25,611,317 | |||||
| TOTAL COMMON STOCKS | ||||||
(Cost $99,141,826) | 102,680,827 | |||||
| REPURCHASE AGREEMENT – 8.0% | ||||||
Fixed Income Clearing Corporation, | 8,706,000 | |||||
| TOTAL INVESTMENTS – 102.2% | ||||||
(Cost $107,847,826) | 111,386,827 | |||||
| LIABILITIES LESS CASH | ||||||
AND OTHER ASSETS – (2.2)% | (2,416,988 | ) | ||||
| NET ASSETS – 100.0% | $ | 108,969,839 | ||||
| 70 | The Royce Funds 2012 Annual Report to Shareholders | THE ACCOMPANYING NOTES ARE AN INTEGRAL PART OF THESE FINANCIAL STATEMENTS. |
December 31, 2012 |
| † | New additions in 2012. | |
| 1 | Non-income producing. | |
| 2 | All or a portion of these securities have been segregated as collateral for short sales. | |
| 3 | Includes securities first acquired in 2012 and less than 1% of net assets. | |
| 4 | A security for which market quotations are not readily available represents 0.0% of net assets for Royce International Micro-Cap Fund. This security has been valued at its fair value under procedures approved by the Fund’s Board of Trustees. This security is defined as a Level 3 security due to the use of significant unobservable inputs in the determination of fair value. See Notes to Financial Statements. | |
| Securities of Global/International Funds are categorized by the country of their headquarters, with the exception of exchange-traded funds. | ||
Bold indicates a Fund’s 20 largest equity holdings in terms of December 31, 2012, market value. | ||
| THE ACCOMPANYING NOTES ARE AN INTEGRAL PART OF THESE FINANCIAL STATEMENTS. | The Royce Funds 2012 Annual Report to Shareholders | 71 |
Statements of Assets and Liabilities
| Royce | Royce Micro-Cap | Royce | Royce | |||||||||||||||
| Select | Discovery | Financial | Select | |||||||||||||||
| Fund I | Fund | Services Fund | Fund II | |||||||||||||||
| ASSETS: | ||||||||||||||||||
| Investments at value | $ | 46,315,121 | $ | 4,270,612 | $ | 16,280,578 | $ | 3,510,705 | ||||||||||
| Repurchase agreements (at cost and value) | 3,611,000 | 211,000 | 342,000 | 373,000 | ||||||||||||||
| Deposits with brokers for securities sold short | – | – | – | 49,741 | ||||||||||||||
| Cash and foreign currency | 305 | 11,926 | 1,660 | 6,359 | ||||||||||||||
| Receivable for investments sold | – | – | 336,908 | – | ||||||||||||||
| Receivable for capital shares sold | – | 8,772 | 66,302 | – | ||||||||||||||
| Receivable for dividends and interest | 18,625 | 810 | 8,292 | 651 | ||||||||||||||
| Prepaid expenses and other assets | – | 1 | 46 | – | ||||||||||||||
Total Assets | 49,945,051 | 4,503,121 | 17,035,786 | 3,940,456 | ||||||||||||||
| LIABILITIES: | ||||||||||||||||||
| Securities sold short, at fair value | – | – | – | 250,141 | ||||||||||||||
| Payable for investments purchased | – | – | 96,084 | – | ||||||||||||||
| Payable for capital shares redeemed | 88,930 | 6,059 | 7,951 | 70,150 | ||||||||||||||
| Payable for dividends and interest | – | – | – | 107 | ||||||||||||||
| Payable for investment advisory fees | – | 5,147 | 8,410 | – | ||||||||||||||
| Accrued expenses | – | 23,689 | 34,954 | – | ||||||||||||||
Total Liabilities | 88,930 | 34,895 | 147,399 | 320,398 | ||||||||||||||
Net Assets | $ | 49,856,121 | $ | 4,468,226 | $ | 16,888,387 | $ | 3,620,058 | ||||||||||
| ANALYSIS OF NET ASSETS: | ||||||||||||||||||
| Paid-in capital | $ | 42,383,308 | $ | 4,712,322 | $ | 16,056,342 | $ | 3,311,843 | ||||||||||
| Undistributed net investment income (loss) | 6,316 | – | 63,430 | (1,421 | ) | |||||||||||||
Accumulated net realized gain (loss) on investments and | ||||||||||||||||||
foreign currency | (332 | ) | (428,024 | ) | (810,871 | ) | 10,311 | |||||||||||
Net unrealized appreciation (depreciation) on investments and | ||||||||||||||||||
foreign currency | 7,466,829 | 183,928 | 1,579,486 | 299,325 | ||||||||||||||
Net Assets | $ | 49,856,121 | $ | 4,468,226 | $ | 16,888,387 | $ | 3,620,058 | ||||||||||
Investment Class | $ | 49,856,121 | $ | 3,620,058 | ||||||||||||||
Service Class | $ | 4,468,226 | $ | 16,888,387 | ||||||||||||||
SHARES OUTSTANDING (unlimited number of $.001 par value): | ||||||||||||||||||
Investment Class | 2,865,604 | 338,947 | ||||||||||||||||
Service Class | 854,703 | 2,473,692 | ||||||||||||||||
NET ASSET VALUES (Net Assets ÷ Shares Outstanding): | ||||||||||||||||||
Investment Class1 | $17.40 | $10.68 | ||||||||||||||||
Service Class2 | $5.23 | $6.83 | ||||||||||||||||
Investments at identified cost | $ | 38,848,186 | $ | 4,086,683 | $ | 14,701,097 | $ | 3,216,874 | ||||||||||
Proceeds of short sales | – | – | – | 255,634 | ||||||||||||||
Aggregate value of segregated securities | – | – | – | 700,705 | ||||||||||||||
| 1 | Offering and redemption price per share; shares held less than 365 days may be subject to a 2% redemption fee, payable to the Fund. Effective January 18, 2013, shares held less than 180 days may be subject to a 1% redemption fee, payable to the Fund. |
| 2 | Offering and redemption price per share; shares held less than 180 days may be subject to a 1% redemption fee, payable to the Fund. |
| 72 | The Royce Funds 2012 Annual Report to Shareholders | THE ACCOMPANYING NOTES ARE AN INTEGRAL PART OF THESE FINANCIAL STATEMENTS. |
December 31, 2012 |
| Royce | Royce | Royce | Royce | |||||||||||||||||
| Global Select | European Smaller- | Enterprise Select | SMid-Cap | |||||||||||||||||
| Long/Short Fund | Companies Fund | Fund | Value Fund | |||||||||||||||||
| ASSETS: | ||||||||||||||||||||
| Investments at value | $ | 19,132,746 | $ | 15,205,189 | $ | 1,057,815 | $ | 10,316,888 | ||||||||||||
| Repurchase agreements (at cost and value) | 3,386,000 | 556,000 | 243,000 | 867,000 | ||||||||||||||||
| Deposits with brokers for securities sold short | 4,055,678 | – | – | – | ||||||||||||||||
| Cash and foreign currency | 6,808 | 402 | 1,594 | 3,160 | ||||||||||||||||
| Receivable for investments sold | 955,503 | 21,990 | – | – | ||||||||||||||||
| Receivable for capital shares sold | – | 162,213 | – | 188 | ||||||||||||||||
| Receivable for dividends and interest | 25,772 | 36,564 | 654 | 10,342 | ||||||||||||||||
| Prepaid expenses and other assets | – | 45 | – | 1 | ||||||||||||||||
Total Assets | 27,562,507 | 15,982,403 | 1,303,063 | 11,197,579 | ||||||||||||||||
| LIABILITIES: | ||||||||||||||||||||
| Securities sold short, at fair value | 6,410,028 | – | – | – | ||||||||||||||||
| Payable for investments purchased | 67,148 | 28,761 | 2,053 | – | ||||||||||||||||
| Payable for capital shares redeemed | 123,625 | 48,808 | – | 20,759 | ||||||||||||||||
| Payable for dividends and interest | 2,091 | – | – | – | ||||||||||||||||
| Payable for investment advisory fees | – | 17,053 | 3 | 9,862 | ||||||||||||||||
| Accrued expenses | 630 | 33,577 | 2,284 | 26,517 | ||||||||||||||||
Total Liabilities | 6,603,522 | 128,199 | 4,340 | 57,138 | ||||||||||||||||
Net Assets | $ | 20,958,985 | $ | 15,854,204 | $ | 1,298,723 | $ | 11,140,441 | ||||||||||||
| ANALYSIS OF NET ASSETS: | ||||||||||||||||||||
| Paid-in capital | $ | 21,586,988 | $ | 17,836,147 | $ | 1,183,716 | $ | 16,848,029 | ||||||||||||
| Undistributed net investment income (loss) | – | (68,643 | ) | 2,068 | – | |||||||||||||||
Accumulated net realized gain (loss) on investments and | ||||||||||||||||||||
foreign currency | (1,321,917 | ) | (2,570,374 | ) | 2,671 | (5,944,979 | ) | |||||||||||||
Net unrealized appreciation (depreciation) on investments and | ||||||||||||||||||||
foreign currency | 693,914 | 657,074 | 110,268 | 237,391 | ||||||||||||||||
Net Assets | $ | 20,958,985 | $ | 15,854,204 | $ | 1,298,723 | $ | 11,140,441 | ||||||||||||
Investment Class | $ | 20,958,985 | $ | 1,298,723 | ||||||||||||||||
Service Class | $ | 15,854,204 | $ | 11,140,441 | ||||||||||||||||
SHARES OUTSTANDING (unlimited number of $.001 par value): | ||||||||||||||||||||
Investment Class | 1,229,754 | 125,328 | ||||||||||||||||||
Service Class | 1,529,532 | 955,287 | ||||||||||||||||||
NET ASSET VALUES (Net Assets ÷ Shares Outstanding): | ||||||||||||||||||||
Investment Class1 | $17.04 | $10.36 | ||||||||||||||||||
Service Class2 | $10.37 | $11.66 | ||||||||||||||||||
Investments at identified cost | $ | 17,588,008 | $ | 14,547,716 | $ | 947,546 | $ | 10,079,374 | ||||||||||||
Proceeds of short sales | 5,560,622 | – | – | – | ||||||||||||||||
Aggregate value of segregated securities | 9,627,387 | – | 16,665 | – | ||||||||||||||||
| 1 | Offering and redemption price per share; shares held less than 365 days may be subject to a 2% redemption fee, payable to the Fund. Effective January 18, 2013, shares held less than 180 days may be subject to a 1% redemption fee, payable to the Fund. |
| 2 | Offering and redemption price per share; shares held less than 180 days may be subject to a 2% redemption fee (Royce European Smaller-Companies Fund), or a 1% redemption fee (Royce SMid-Cap Value Fund), payable to the Fund. |
| THE ACCOMPANYING NOTES ARE AN INTEGRAL PART OF THESE FINANCIAL STATEMENTS. | The Royce Funds 2012 Annual Report to Shareholders | 73 |
Statements of Assets and Liabilities
| Royce | Royce | Royce | Royce | |||||||||||||||||
| Focus Value | Partners | Opportunity | Global Dividend | |||||||||||||||||
| Fund | Fund | Select Fund | Value Fund | |||||||||||||||||
| ASSETS: | ||||||||||||||||||||
| Investments at value | $ | 8,639,706 | $ | 2,030,743 | $ | 2,910,027 | $ | 6,575,832 | ||||||||||||
| Repurchase agreements (at cost and value) | 257,000 | 162,000 | 325,000 | 175,000 | ||||||||||||||||
| Deposits with brokers for securities sold short | – | – | 286,117 | – | ||||||||||||||||
| Cash and foreign currency | 2,032 | 302 | 3,386 | 16,275 | ||||||||||||||||
| Receivable for investments sold | – | 34,389 | – | 143,956 | ||||||||||||||||
| Receivable for capital shares sold | 1,451 | 913 | 60,000 | 34,000 | ||||||||||||||||
| Receivable for dividends and interest | 7,134 | 851 | 657 | 12,655 | ||||||||||||||||
| Prepaid expenses and other assets | 27 | 5 | – | 7 | ||||||||||||||||
Total Assets | 8,907,350 | 2,229,203 | 3,585,187 | 6,957,725 | ||||||||||||||||
| LIABILITIES: | ||||||||||||||||||||
| Securities sold short, at fair value | – | – | 344,531 | – | ||||||||||||||||
| Payable for investments purchased | – | 123,881 | 40,530 | 201,093 | ||||||||||||||||
| Payable for capital shares redeemed | – | 1,194 | – | 12,315 | ||||||||||||||||
| Payable for dividends and interest | – | – | 378 | – | ||||||||||||||||
| Payable for investment advisory fees | 6,694 | – | 29 | 9,575 | ||||||||||||||||
| Accrued expenses | 25,713 | 21,079 | 1,316 | 26,574 | ||||||||||||||||
Total Liabilities | 32,407 | 146,154 | 386,784 | 249,557 | ||||||||||||||||
Net Assets | $ | 8,874,943 | $ | 2,083,049 | $ | 3,198,403 | $ | 6,708,168 | ||||||||||||
| ANALYSIS OF NET ASSETS: | ||||||||||||||||||||
| Paid-in capital | $ | 7,937,279 | $ | 1,817,225 | $ | 2,786,913 | $ | 6,894,172 | ||||||||||||
| Undistributed net investment income (loss) | (67,891 | ) | 5,492 | (1,590 | ) | (2,214 | ) | |||||||||||||
Accumulated net realized gain (loss) on investments and | ||||||||||||||||||||
foreign currency | (168,609 | ) | (4,255 | ) | 7,178 | (127,013 | ) | |||||||||||||
Net unrealized appreciation (depreciation) on investments and | ||||||||||||||||||||
foreign currency | 1,174,164 | 264,587 | 405,902 | (56,777 | ) | |||||||||||||||
Net Assets | $ | 8,874,943 | $ | 2,083,049 | $ | 3,198,403 | $ | 6,708,168 | ||||||||||||
Investment Class | $ | 3,198,403 | ||||||||||||||||||
Service Class | $ | 8,874,943 | $ | 2,083,049 | $ | 6,708,168 | ||||||||||||||
SHARES OUTSTANDING (unlimited number of $.001 par value): | ||||||||||||||||||||
Investment Class | 249,638 | |||||||||||||||||||
Service Class | 602,128 | 173,018 | 664,043 | |||||||||||||||||
NET ASSET VALUES (Net Assets ÷ Shares Outstanding): | ||||||||||||||||||||
Investment Class1 | $12.81 | |||||||||||||||||||
Service Class2 | $14.74 | $12.04 | $10.10 | |||||||||||||||||
Investments at identified cost | $ | 7,465,516 | $ | 1,766,155 | $ | 2,499,767 | $ | 6,632,833 | ||||||||||||
Proceeds of short sales | – | – | 340,173 | – | ||||||||||||||||
Aggregate value of segregated securities | – | – | 497,701 | – | ||||||||||||||||
| 1 | Offering and redemption price per share; shares held less than 365 days may be subject to a 2% redemption fee, payable to the Fund. Effective January 18, 2013, shares held less than 180 days may be subject to a 1% redemption fee, payable to the Fund. |
| 2 | Offering and redemption price per share; shares held less than 180 days may be subject to a 1% redemption fee, or a 2% redemption fee, (Royce Global Dividend Value Fund), payable to the Fund. |
| 74 | The Royce Funds 2012 Annual Report to Shareholders | THE ACCOMPANYING NOTES ARE AN INTEGRAL PART OF THESE FINANCIAL STATEMENTS. |
December 31, 2012 |
| Royce | Royce | Royce | |||||||||||||
| International | International | Special Equity | |||||||||||||
| Micro-Cap Fund | Premier Fund | Multi-Cap Fund | |||||||||||||
| ASSETS: | |||||||||||||||
| Investments at value | $ | 4,351,891 | $ | 6,103,854 | $ | 102,680,827 | |||||||||
| Repurchase agreements (at cost and value) | 364,000 | 305,000 | 8,706,000 | ||||||||||||
| Cash and foreign currency | 14,361 | 879 | 112 | ||||||||||||
| Receivable for capital shares sold | 17,824 | 64,092 | 44,114 | ||||||||||||
| Receivable for dividends and interest | 4,410 | 9,622 | 76,681 | ||||||||||||
| Prepaid expenses and other assets | 12 | 1 | 221 | ||||||||||||
Total Assets | 4,752,498 | 6,483,448 | 111,507,955 | ||||||||||||
| LIABILITIES: | |||||||||||||||
| Payable for investments purchased | 118,181 | 3,510 | 2,351,131 | ||||||||||||
| Payable for capital shares redeemed | – | – | 68,890 | ||||||||||||
| Payable for investment advisory fees | 4,002 | 10,353 | 90,692 | ||||||||||||
| Accrued expenses | 26,870 | 25,672 | 27,403 | ||||||||||||
Total Liabilities | 149,053 | 39,535 | 2,538,116 | ||||||||||||
Net Assets | $ | 4,603,445 | $ | 6,443,913 | $ | 108,969,839 | |||||||||
| ANALYSIS OF NET ASSETS: | |||||||||||||||
| Paid-in capital | $ | 5,870,737 | $ | 6,659,541 | $ | 104,445,990 | |||||||||
| Undistributed net investment income (loss) | (13,170 | ) | (23,382 | ) | 17,610 | ||||||||||
Accumulated net realized gain (loss) on investments and | |||||||||||||||
foreign currency | (952,698 | ) | (502,510 | ) | 967,238 | ||||||||||
Net unrealized appreciation (depreciation) on investments and | |||||||||||||||
foreign currency | (301,424 | ) | 310,264 | 3,539,001 | |||||||||||
Net Assets | $ | 4,603,445 | $ | 6,443,913 | $ | 108,969,839 | |||||||||
Investment Class | $ | 34,374,879 | |||||||||||||
Service Class | $ | 4,603,445 | $ | 6,443,913 | 43,689,666 | ||||||||||
Institutional Class | 30,905,294 | ||||||||||||||
SHARES OUTSTANDING (unlimited number of $.001 par value): | |||||||||||||||
Investment Class | 2,953,358 | ||||||||||||||
Service Class | 534,788 | 643,460 | 3,741,039 | ||||||||||||
Institutional Class | 2,655,205 | ||||||||||||||
NET ASSET VALUES (Net Assets ÷ Shares Outstanding): | |||||||||||||||
Investment Class1 | $11.64 | ||||||||||||||
Service Class2 | $8.61 | $10.01 | 11.68 | ||||||||||||
Institutional Class3 | 11.64 | ||||||||||||||
Investments at identified cost | $ | 4,653,451 | $ | 5,793,598 | $ | 99,141,826 | |||||||||
| 1 | Offering and redemption price per share; shares held less than 180 days may be subject to a 1% redemption fee, payable to the Fund. |
| 2 | Offering and redemption price per share; shares held less than 180 days may be subject to a 2% redemption fee, or a 1% redemption fee (Royce Special Equity Multi-Cap Fund), payble to the Fund. |
| 3 | Offering and redemption price per share. |
| THE ACCOMPANYING NOTES ARE AN INTEGRAL PART OF THESE FINANCIAL STATEMENTS. | The Royce Funds 2012 Annual Report to Shareholders | 75 |
Statements of Changes in Net Assets
| Royce Micro-Cap | ||||||||||||||||||||||||||||||
| Royce Select Fund I | Discovery Fund | Royce Financial Services Fund | ||||||||||||||||||||||||||||
| Year ended | Year ended | Year ended | Year ended | Year ended | Year ended | |||||||||||||||||||||||||
| 12/31/12 | 12/31/11 | 12/31/12 | 12/31/11 | 12/31/12 | 12/31/11 | |||||||||||||||||||||||||
| INVESTMENT OPERATIONS: | ||||||||||||||||||||||||||||||
| Net investment income (loss) | $ | 829,042 | $ | (439,121 | ) | $ | 34,721 | $ | (26,392 | ) | $ | 241,534 | $ | 121,123 | ||||||||||||||||
Net realized gain (loss) on investments and | ||||||||||||||||||||||||||||||
foreign currency | 3,357,629 | 7,191,315 | 583 | 167,446 | 705,504 | (176,059 | ) | |||||||||||||||||||||||
Net change in unrealized appreciation | ||||||||||||||||||||||||||||||
(depreciation) on investments and | ||||||||||||||||||||||||||||||
foreign currency | 2,098,657 | (8,971,484 | ) | 125,030 | (258,889 | ) | 1,868,205 | (2,305,850 | ) | |||||||||||||||||||||
Net increase (decrease) in net assets from | ||||||||||||||||||||||||||||||
investment operations | 6,285,328 | (2,219,290 | ) | 160,334 | (117,835 | ) | 2,815,243 | (2,360,786 | ) | |||||||||||||||||||||
| DISTRIBUTIONS: | ||||||||||||||||||||||||||||||
| Net investment income | ||||||||||||||||||||||||||||||
Investment Class | (805,821 | ) | – | |||||||||||||||||||||||||||
Service Class | (40,240 | ) | (1,952 | ) | (153,360 | ) | (139,894 | ) | ||||||||||||||||||||||
Net realized gain on investments and | ||||||||||||||||||||||||||||||
foreign currency | ||||||||||||||||||||||||||||||
Investment Class | (4,035,586 | ) | (6,464,732 | ) | ||||||||||||||||||||||||||
Service Class | – | – | – | – | ||||||||||||||||||||||||||
| Total distributions | (4,841,407 | ) | (6,464,732 | ) | (40,240 | ) | (1,952 | ) | (153,360 | ) | (139,894 | ) | ||||||||||||||||||
| CAPITAL SHARE TRANSACTIONS: | ||||||||||||||||||||||||||||||
| Net capital share transactions | ||||||||||||||||||||||||||||||
Investment Class | 1,066,334 | (2,762,287 | ) | |||||||||||||||||||||||||||
Service Class | 727,013 | 94,984 | 127,677 | 1,897,713 | ||||||||||||||||||||||||||
| Shareholder redemption fees | ||||||||||||||||||||||||||||||
Investment Class | 635 | 3,979 | ||||||||||||||||||||||||||||
Service Class | 357 | 8,416 | 3,274 | 10,903 | ||||||||||||||||||||||||||
Net increase (decrease) in net assets from | ||||||||||||||||||||||||||||||
capital share transactions | 1,066,969 | (2,758,308 | ) | 727,370 | 103,400 | 130,951 | 1,908,616 | |||||||||||||||||||||||
NET INCREASE (DECREASE) IN NET ASSETS | 2,510,890 | (11,442,330 | ) | 847,464 | (16,387 | ) | 2,792,834 | (592,064 | ) | |||||||||||||||||||||
| NET ASSETS: | ||||||||||||||||||||||||||||||
Beginning of year | 47,345,231 | 58,787,561 | 3,620,762 | 3,637,149 | 14,095,553 | 14,687,617 | ||||||||||||||||||||||||
End of year | $ | 49,856,121 | $ | 47,345,231 | $ | 4,468,226 | $ | 3,620,762 | $ | 16,888,387 | $ | 14,095,553 | ||||||||||||||||||
UNDISTRIBUTED NET INVESTMENT INCOME | ||||||||||||||||||||||||||||||
(LOSS) AT END OF YEAR | $ | 6,316 | $ | – | $ | – | $ | – | $ | 63,430 | $ | (97,652 | ) | |||||||||||||||||
| 76 | The Royce Funds 2012 Annual Report to Shareholders | THE ACCOMPANYING NOTES ARE AN INTEGRAL PART OF THESE FINANCIAL STATEMENTS. |
| Royce Global Select | Royce European Smaller- | |||||||||||||||||||||||||||||
| Royce Select Fund II | Long/Short Fund | Companies Fund | ||||||||||||||||||||||||||||
| Year ended | Year ended | Year ended | Year ended | Year ended | Year ended | |||||||||||||||||||||||||
| 12/31/12 | 12/31/11 | 12/31/12 | 12/31/11 | 12/31/12 | 12/31/11 | |||||||||||||||||||||||||
| INVESTMENT OPERATIONS: | ||||||||||||||||||||||||||||||
| Net investment income (loss) | $ | 66,556 | $ | (4,183 | ) | $ | 581,341 | $ | 351,544 | $ | 201,539 | $ | 189,271 | |||||||||||||||||
Net realized gain (loss) on investments and | ||||||||||||||||||||||||||||||
foreign currency | 134,060 | 323,131 | (977,654 | ) | 702,435 | (220,323 | ) | 345,669 | ||||||||||||||||||||||
Net change in unrealized appreciation | ||||||||||||||||||||||||||||||
(depreciation) on investments and | ||||||||||||||||||||||||||||||
foreign currency | 277,321 | (944,657 | ) | 3,298,845 | (6,288,113 | ) | 3,337,255 | (5,588,818 | ) | |||||||||||||||||||||
Net increase (decrease) in net assets from | ||||||||||||||||||||||||||||||
investment operations | 477,937 | (625,709 | ) | 2,902,532 | (5,234,134 | ) | 3,318,471 | (5,053,878 | ) | |||||||||||||||||||||
| DISTRIBUTIONS: | ||||||||||||||||||||||||||||||
| Net investment income | ||||||||||||||||||||||||||||||
Investment Class | (55,366 | ) | – | (610,348 | ) | (353,292 | ) | |||||||||||||||||||||||
Service Class | (225,920 | ) | (191,729 | ) | ||||||||||||||||||||||||||
| Net realized gain on investments and | ||||||||||||||||||||||||||||||
foreign currency | ||||||||||||||||||||||||||||||
Investment Class | (160,636 | ) | (553,183 | ) | – | (994,032 | ) | |||||||||||||||||||||||
Service Class | – | – | ||||||||||||||||||||||||||||
| Total distributions | (216,002 | ) | (553,183 | ) | (610,348 | ) | (1,347,324 | ) | (225,920 | ) | (191,729 | ) | ||||||||||||||||||
| CAPITAL SHARE TRANSACTIONS: | ||||||||||||||||||||||||||||||
| Net capital share transactions | ||||||||||||||||||||||||||||||
Investment Class | (61,887 | ) | (542,487 | ) | (3,844,018 | ) | 12,712,725 | |||||||||||||||||||||||
Service Class | (3,163,201 | ) | 5,751,691 | |||||||||||||||||||||||||||
| Shareholder redemption fees | ||||||||||||||||||||||||||||||
Investment Class | – | 202 | 4,038 | 20,295 | ||||||||||||||||||||||||||
Service Class | 6,989 | 43,230 | ||||||||||||||||||||||||||||
Net increase (decrease) in net assets from | ||||||||||||||||||||||||||||||
capital share transactions | (61,887 | ) | (542,285 | ) | (3,839,980 | ) | 12,733,020 | (3,156,212 | ) | 5,794,921 | ||||||||||||||||||||
NET INCREASE (DECREASE) IN NET ASSETS | 200,048 | (1,721,177 | ) | (1,547,796 | ) | 6,151,562 | (63,661 | ) | 549,314 | |||||||||||||||||||||
| NET ASSETS: | ||||||||||||||||||||||||||||||
Beginning of year | 3,420,010 | 5,141,187 | 22,506,781 | 16,355,219 | 15,917,865 | 15,368,551 | ||||||||||||||||||||||||
End of year | $ | 3,620,058 | $ | 3,420,010 | $ | 20,958,985 | $ | 22,506,781 | $ | 15,854,204 | $ | 15,917,865 | ||||||||||||||||||
UNDISTRIBUTED NET INVESTMENT INCOME | ||||||||||||||||||||||||||||||
(LOSS) AT END OF YEAR | $ | (1,421 | ) | $ | (11,737 | ) | $ | – | $ | (3,930 | ) | $ | (68,643 | ) | $ | (46,571 | ) | |||||||||||||
| THE ACCOMPANYING NOTES ARE AN INTEGRAL PART OF THESE FINANCIAL STATEMENTS. | The Royce Funds 2012 Annual Report to Shareholders | 77 |
Statements of Changes in Net Assets
| Royce Enterprise Select Fund | Royce SMid-Cap Value Fund | Royce Focus Value Fund | ||||||||||||||||||||||||||||
| Year ended | Year ended | Year ended | Year ended | Year ended | Year ended | |||||||||||||||||||||||||
| 12/31/12 | 12/31/11 | 12/31/12 | 12/31/11 | 12/31/12 | 12/31/11 | |||||||||||||||||||||||||
| INVESTMENT OPERATIONS: | ||||||||||||||||||||||||||||||
| Net investment income (loss) | $ | 2,143 | $ | (4,614 | ) | $ | (3,245 | ) | $ | (57,490 | ) | $ | 31,675 | $ | (28,804 | ) | ||||||||||||||
Net realized gain (loss) on investments and | ||||||||||||||||||||||||||||||
foreign currency | 127,475 | 84,598 | (206,122 | ) | 371,294 | (105,119 | ) | 363,209 | ||||||||||||||||||||||
Net change in unrealized appreciation | ||||||||||||||||||||||||||||||
(depreciation) on investments and | ||||||||||||||||||||||||||||||
foreign currency | 46,734 | (73,989 | ) | 1,627,478 | (2,367,229 | ) | 871,968 | (1,706,389 | ) | |||||||||||||||||||||
Net increase (decrease) in net assets from | ||||||||||||||||||||||||||||||
investment operations | 176,352 | 5,995 | 1,418,111 | (2,053,425 | ) | 798,524 | (1,371,984 | ) | ||||||||||||||||||||||
| DISTRIBUTIONS: | ||||||||||||||||||||||||||||||
| Net investment income | ||||||||||||||||||||||||||||||
Investment Class | (80 | ) | – | |||||||||||||||||||||||||||
Service Class | – | (16,431 | ) | (155,697 | ) | – | ||||||||||||||||||||||||
| Net realized gain on investments and | ||||||||||||||||||||||||||||||
foreign currency | ||||||||||||||||||||||||||||||
Investment Class | (119,739 | ) | (63,941 | ) | ||||||||||||||||||||||||||
Service Class | – | – | (1,950 | ) | (333,049 | ) | ||||||||||||||||||||||||
| Total distributions | (119,819 | ) | (63,941 | ) | – | (16,431 | ) | (157,647 | ) | (333,049 | ) | |||||||||||||||||||
| CAPITAL SHARE TRANSACTIONS: | ||||||||||||||||||||||||||||||
| Net capital share transactions | ||||||||||||||||||||||||||||||
Investment Class | 119,229 | 22,838 | ||||||||||||||||||||||||||||
Service Class | (613,301 | ) | 6,195,095 | (494,067 | ) | 1,487,601 | ||||||||||||||||||||||||
| Shareholder redemption fees | ||||||||||||||||||||||||||||||
Investment Class | – | – | ||||||||||||||||||||||||||||
Service Class | 8,222 | 7,021 | 664 | 2,805 | ||||||||||||||||||||||||||
Net increase (decrease) in net assets from | ||||||||||||||||||||||||||||||
capital share transactions | 119,229 | 22,838 | (605,079 | ) | 6,202,116 | (493,403 | ) | 1,490,406 | ||||||||||||||||||||||
| NET INCREASE (DECREASE) IN NET ASSETS | 175,762 | (35,108 | ) | 813,032 | 4,132,260 | 147,474 | (214,627 | ) | ||||||||||||||||||||||
| NET ASSETS: | ||||||||||||||||||||||||||||||
Beginning of year | 1,122,961 | 1,158,069 | 10,327,409 | 6,195,149 | 8,727,469 | 8,942,096 | ||||||||||||||||||||||||
End of year | $ | 1,298,723 | $ | 1,122,961 | $ | 11,140,441 | $ | 10,327,409 | $ | 8,874,943 | $ | 8,727,469 | ||||||||||||||||||
UNDISTRIBUTED NET INVESTMENT INCOME | ||||||||||||||||||||||||||||||
(LOSS) AT END OF YEAR | $ | 2,068 | $ | – | $ | – | $ | (2,767 | ) | $ | (67,891 | ) | $ | (7,296 | ) | |||||||||||||||
| 78 | The Royce Funds 2012 Annual Report to Shareholders | THE ACCOMPANYING NOTES ARE AN INTEGRAL PART OF THESE FINANCIAL STATEMENTS. |
| Royce Global Dividend | ||||||||||||||||||||||||||||||
| Royce Partners Fund | Royce Opportunity Select Fund | Value Fund | ||||||||||||||||||||||||||||
| Year ended | Year ended | Year ended | Year ended | Year ended | Period ended | |||||||||||||||||||||||||
| 12/31/12 | 12/31/11 | 12/31/12 | 12/31/11 | 12/31/12 | 12/31/111 | |||||||||||||||||||||||||
| INVESTMENT OPERATIONS: | ||||||||||||||||||||||||||||||
| Net investment income (loss) | $ | 6,241 | $ | (4,575 | ) | $ | 16,146 | $ | 1,939 | $ | 110,305 | $ | 54,007 | |||||||||||||||||
Net realized gain (loss) on investments and | ||||||||||||||||||||||||||||||
foreign currency | 70,836 | 133,930 | 219,405 | 4,162 | (71,639 | ) | (57,178 | ) | ||||||||||||||||||||||
Net change in unrealized appreciation | ||||||||||||||||||||||||||||||
(depreciation) on investments and | ||||||||||||||||||||||||||||||
foreign currency | 274,404 | (347,167 | ) | 522,838 | (450,431 | ) | 1,214,840 | (1,271,617 | ) | |||||||||||||||||||||
Net increase (decrease) in net assets from | ||||||||||||||||||||||||||||||
investment operations | 351,481 | (217,812 | ) | 758,389 | (444,330 | ) | 1,253,506 | (1,274,788 | ) | |||||||||||||||||||||
| DISTRIBUTIONS: | ||||||||||||||||||||||||||||||
| Net investment income | ||||||||||||||||||||||||||||||
Investment Class | (27,185 | ) | (3,339 | ) | ||||||||||||||||||||||||||
Service Class | (632 | ) | (6,563 | ) | (109,924 | ) | (50,231 | ) | ||||||||||||||||||||||
Net realized gain on investments and | ||||||||||||||||||||||||||||||
foreign currency | ||||||||||||||||||||||||||||||
Investment Class | (205,395 | ) | (77,223 | ) | ||||||||||||||||||||||||||
Service Class | (76,810 | ) | (171,566 | ) | – | (5,036 | ) | |||||||||||||||||||||||
| Total distributions | (77,442 | ) | (178,129 | ) | (232,580 | ) | (80,562 | ) | (109,924 | ) | (55,267 | ) | ||||||||||||||||||
| CAPITAL SHARE TRANSACTIONS: | ||||||||||||||||||||||||||||||
| Net capital share transactions | ||||||||||||||||||||||||||||||
Investment Class | 570,739 | 712,770 | ||||||||||||||||||||||||||||
Service Class | 126,723 | 306,626 | (571,143 | ) | 7,459,390 | |||||||||||||||||||||||||
| Shareholder redemption fees | ||||||||||||||||||||||||||||||
Investment Class | – | 947 | ||||||||||||||||||||||||||||
Service Class | 31 | 76 | 1,040 | 5,354 | ||||||||||||||||||||||||||
Net increase (decrease) in net assets from | ||||||||||||||||||||||||||||||
capital share transactions | 126,754 | 306,702 | 570,739 | 713,717 | (570,103 | ) | 7,464,744 | |||||||||||||||||||||||
NET INCREASE (DECREASE) IN NET ASSETS | 400,793 | (89,239 | ) | 1,096,548 | 188,825 | 573,479 | 6,134,689 | |||||||||||||||||||||||
| NET ASSETS: | ||||||||||||||||||||||||||||||
Beginning of period | 1,682,256 | 1,771,495 | 2,101,855 | 1,913,030 | 6,134,689 | |||||||||||||||||||||||||
End of period | $ | 2,083,049 | $ | 1,682,256 | $ | 3,198,403 | $ | 2,101,855 | $ | 6,708,168 | $ | 6,134,689 | ||||||||||||||||||
UNDISTRIBUTED NET INVESTMENT INCOME | ||||||||||||||||||||||||||||||
(LOSS) AT END OF PERIOD | $ | 5,492 | $ | (28 | ) | $ | (1,590 | ) | $ | (566 | ) | $ | (2,214 | ) | $ | 320 | ||||||||||||||
1 The Fund commenced operations on January 3, 2011.
| THE ACCOMPANYING NOTES ARE AN INTEGRAL PART OF THESE FINANCIAL STATEMENTS. | The Royce Funds 2012 Annual Report to Shareholders | 79 |
Statements of Changes in Net Assets
| Royce International | Royce International | Royce Special Equity | ||||||||||||||||||||||||||||
| Micro-Cap Fund | Premier Fund | Multi-Cap Fund | ||||||||||||||||||||||||||||
| Year ended | Period ended | Year ended | Period ended | Year ended | Period ended | |||||||||||||||||||||||||
| 12/31/12 | 12/31/111 | 12/31/12 | 12/31/111 | 12/31/12 | 12/31/111 | |||||||||||||||||||||||||
| INVESTMENT OPERATIONS: | ||||||||||||||||||||||||||||||
| Net investment income (loss) | $ | 68,271 | $ | 48,932 | $ | 49,640 | $ | 26,443 | $ | 1,123,620 | $ | 190,225 | ||||||||||||||||||
Net realized gain (loss) on investments and | ||||||||||||||||||||||||||||||
foreign currency | (138,773 | ) | (805,059 | ) | (382,792 | ) | (113,170 | ) | 1,858,816 | 96,064 | ||||||||||||||||||||
Net change in unrealized appreciation | ||||||||||||||||||||||||||||||
(depreciation) on investments and | ||||||||||||||||||||||||||||||
foreign currency | 572,117 | (873,541 | ) | 1,268,471 | (958,207 | ) | 2,863,481 | 675,520 | ||||||||||||||||||||||
Net increase (decrease) in net assets from | ||||||||||||||||||||||||||||||
investment operations | 501,615 | (1,629,668 | ) | 935,319 | (1,044,934 | ) | 5,845,917 | 961,809 | ||||||||||||||||||||||
| DISTRIBUTIONS: | ||||||||||||||||||||||||||||||
| Net investment income | ||||||||||||||||||||||||||||||
Investment Class | (375,548 | ) | ||||||||||||||||||||||||||||
Service Class | (79,547 | ) | (63,419 | ) | (76,745 | ) | (28,433 | ) | (329,533 | ) | (191,929 | ) | ||||||||||||||||||
Institutional Class | (400,930 | ) | ||||||||||||||||||||||||||||
| Net realized gain on investments and | ||||||||||||||||||||||||||||||
foreign currency | ||||||||||||||||||||||||||||||
Investment Class | (280,238 | ) | ||||||||||||||||||||||||||||
Service Class | – | – | – | (835 | ) | (388,479 | ) | (44,040 | ) | |||||||||||||||||||||
Institutional Class | (273,181 | ) | ||||||||||||||||||||||||||||
| Return of capital | ||||||||||||||||||||||||||||||
Investment Class | – | |||||||||||||||||||||||||||||
Service Class | – | (3,157 | ) | – | (4,438 | ) | – | – | ||||||||||||||||||||||
Institutional Class | – | |||||||||||||||||||||||||||||
| Total distributions | (79,547 | ) | (66,576 | ) | (76,745 | ) | (33,706 | ) | (2,047,909 | ) | (235,969 | ) | ||||||||||||||||||
| CAPITAL SHARE TRANSACTIONS: | ||||||||||||||||||||||||||||||
| Net capital share transactions | ||||||||||||||||||||||||||||||
Investment Class | 34,833,917 | |||||||||||||||||||||||||||||
Service Class | 608,323 | 5,265,392 | 1,495,086 | 5,165,082 | 2,291,212 | 36,078,487 | ||||||||||||||||||||||||
Institutional Class | 31,218,929 | |||||||||||||||||||||||||||||
| Shareholder redemption fees | ||||||||||||||||||||||||||||||
Investment Class | 2,238 | |||||||||||||||||||||||||||||
Service Class | 1,344 | 2,562 | 462 | 3,349 | 14,274 | 6,934 | ||||||||||||||||||||||||
Net increase (decrease) in net assets from | ||||||||||||||||||||||||||||||
capital share transactions | 609,667 | 5,267,954 | 1,495,548 | 5,168,431 | 68,360,570 | 36,085,421 | ||||||||||||||||||||||||
NET INCREASE (DECREASE) IN NET ASSETS | 1,031,735 | 3,571,710 | 2,354,122 | 4,089,791 | 72,158,578 | 36,811,261 | ||||||||||||||||||||||||
| NET ASSETS: | ||||||||||||||||||||||||||||||
Beginning of period | 3,571,710 | 4,089,791 | 36,811,261 | |||||||||||||||||||||||||||
End of period | $ | 4,603,445 | $ | 3,571,710 | $ | 6,443,913 | $ | 4,089,791 | $ | 108,969,839 | $ | 36,811,261 | ||||||||||||||||||
UNDISTRIBUTED NET INVESTMENT INCOME | ||||||||||||||||||||||||||||||
(LOSS) AT END OF PERIOD | $ | (13,170 | ) | $ | (8,339 | ) | $ | (23,382 | ) | $ | – | $ | 17,610 | $ | – | |||||||||||||||
1 The Fund commenced operations on January 3, 2011.
| 80 | The Royce Funds 2012 Annual Report to Shareholders | THE ACCOMPANYING NOTES ARE AN INTEGRAL PART OF THESE FINANCIAL STATEMENTS. |
| Statements of Operations | Year Ended December 31, 2012 |
| Royce | Royce Micro-Cap | Royce | Royce | Royce | ||||||||||||||||
| Select | Discovery | Financial | Select | Global Select | ||||||||||||||||
| Fund I | Fund | Services Fund | Fund II | Long/Short Fund | ||||||||||||||||
| INVESTMENT INCOME: | ||||||||||||||||||||
| Income: | ||||||||||||||||||||
Dividends | $ | 836,892 | $ | 96,448 | $ | 487,963 | $ | 74,563 | $ | 766,713 | ||||||||||
Foreign withholding tax | (11,642 | ) | (1,240 | ) | (10,981 | ) | (1,379 | ) | (56,524 | ) | ||||||||||
Interest | 3,792 | 162 | 201 | 224 | 1,345 | |||||||||||||||
| Total income | 829,042 | 95,370 | 477,183 | 73,408 | 711,534 | |||||||||||||||
| Expenses: | ||||||||||||||||||||
Investment advisory fees | – | 40,704 | 158,153 | – | – | |||||||||||||||
Distribution fees | – | 10,176 | 39,538 | – | – | |||||||||||||||
Shareholder servicing | – | 23,087 | 27,602 | – | – | |||||||||||||||
Registration | – | 17,350 | 20,766 | – | – | |||||||||||||||
Audit | – | 14,004 | 14,015 | – | – | |||||||||||||||
Custody | – | 7,590 | 18,529 | – | – | |||||||||||||||
Shareholder reports | – | 4,507 | 13,296 | – | – | |||||||||||||||
Legal | – | 961 | 251 | – | – | |||||||||||||||
Administrative and office facilities | – | 472 | 1,887 | – | – | |||||||||||||||
Trustees’ fees | – | 136 | 536 | – | – | |||||||||||||||
Dividends on securities sold short | – | – | – | 3,467 | 47,878 | |||||||||||||||
Interest expense | – | – | – | 3,385 | 82,315 | |||||||||||||||
Other expenses | – | 693 | 985 | – | – | |||||||||||||||
| Total expenses | – | 119,680 | 295,558 | 6,852 | 130,193 | |||||||||||||||
| Compensating balance credits | – | (12 | ) | (34 | ) | – | – | |||||||||||||
| Fees waived by investment adviser and distributor | – | (40,704 | ) | (59,875 | ) | – | – | |||||||||||||
| Expenses reimbursed by investment adviser | – | (18,315 | ) | – | – | – | ||||||||||||||
| Net expenses | – | 60,649 | 235,649 | 6,852 | 130,193 | |||||||||||||||
| Net investment income (loss) | 829,042 | 34,721 | 241,534 | 66,556 | 581,341 | |||||||||||||||
REALIZED AND UNREALIZED GAIN (LOSS) ON INVESTMENTS AND FOREIGN CURRENCY: | ||||||||||||||||||||
| Net realized gain (loss): | ||||||||||||||||||||
Investments | 3,357,528 | 583 | 707,229 | 135,385 | (967,759 | ) | ||||||||||||||
Foreign currency transactions | 101 | – | (1,725 | ) | (1,325 | ) | (9,895 | ) | ||||||||||||
| Net change in unrealized appreciation (depreciation): | ||||||||||||||||||||
Investments and foreign currency translations | 2,098,837 | 125,030 | 1,867,933 | 277,321 | 3,298,999 | |||||||||||||||
Other assets and liabilities denominated in foreign currency | (180 | ) | – | 272 | – | (154 | ) | |||||||||||||
Net realized and unrealized gain (loss) on investments and foreign currency | 5,456,286 | 125,613 | 2,573,709 | 411,381 | 2,321,191 | |||||||||||||||
NET INCREASE (DECREASE) IN NET ASSETS | $ | 6,285,328 | $ | 160,334 | $ | 2,815,243 | $ | 477,937 | $ | 2,902,532 | ||||||||||
| THE ACCOMPANYING NOTES ARE AN INTEGRAL PART OF THESE FINANCIAL STATEMENTS. | The Royce Funds 2012 Annual Report to Shareholders | 81 |
| Statements of Operations | Year Ended December 31, 2012 |
| Royce | Royce | Royce | Royce | Royce | ||||||||||||||||
| European Smaller- | Enterprise Select | SMid-Cap | Focus Value | Partners | ||||||||||||||||
| Companies Fund | Fund | Value Fund | Fund | Fund | ||||||||||||||||
| INVESTMENT INCOME: | ||||||||||||||||||||
| Income: | ||||||||||||||||||||
Dividends | $ | 522,979 | $ | 12,079 | $ | 150,213 | $ | 156,574 | $ | 32,622 | ||||||||||
Foreign withholding tax | (58,664 | ) | (206 | ) | (6,144 | ) | (3,887 | ) | (666 | ) | ||||||||||
Interest | 499 | 173 | 792 | 231 | 30 | |||||||||||||||
| Total income | 464,814 | 12,046 | 144,861 | 152,918 | 31,986 | |||||||||||||||
| Expenses: | ||||||||||||||||||||
Investment advisory fees | 194,730 | 9,728 | 109,708 | 89,809 | 19,070 | |||||||||||||||
Distribution fees | 38,946 | – | 27,427 | 22,452 | 4,768 | |||||||||||||||
Shareholder servicing | 27,218 | 250 | 17,273 | 24,407 | 31,470 | |||||||||||||||
Registration | 19,432 | 1,085 | 19,076 | 15,485 | 7,389 | |||||||||||||||
Audit | 14,015 | 583 | 14,010 | 14,009 | 14,002 | |||||||||||||||
Custody | 26,545 | 350 | 15,174 | 14,578 | 14,185 | |||||||||||||||
Shareholder reports | 7,667 | 10 | 3,476 | 1,028 | 313 | |||||||||||||||
Legal | 272 | – | 172 | 144 | 29 | |||||||||||||||
Administrative and office facilities | 2,001 | 6 | 1,339 | 1,107 | 224 | |||||||||||||||
Trustees’ fees | 551 | 2 | 385 | 315 | 64 | |||||||||||||||
Interest expense | – | 7 | – | – | – | |||||||||||||||
Other expenses | 1,091 | 1 | 837 | 854 | 669 | |||||||||||||||
| Total expenses | 332,468 | 12,022 | 208,877 | 184,188 | 92,183 | |||||||||||||||
| Compensating balance credits | (33 | ) | 0 | (17 | ) | (10 | ) | (57 | ) | |||||||||||
| Fees waived by investment adviser and distributor | (69,160 | ) | (701 | ) | (60,754 | ) | (62,935 | ) | (19,070 | ) | ||||||||||
| Expenses reimbursed by investment adviser | – | (1,418 | ) | – | – | (47,311 | ) | |||||||||||||
| Net expenses | 263,275 | 9,903 | 148,106 | 121,243 | 25,745 | |||||||||||||||
| Net investment income (loss) | 201,539 | 2,143 | (3,245 | ) | 31,675 | 6,241 | ||||||||||||||
| REALIZED AND UNREALIZED GAIN (LOSS) ON INVESTMENTS AND FOREIGN CURRENCY: | ||||||||||||||||||||
| Net realized gain (loss): | ||||||||||||||||||||
Investments | (219,447 | ) | 127,470 | (205,351 | ) | (104,747 | ) | 70,925 | ||||||||||||
Foreign currency transactions | (876 | ) | 5 | (771 | ) | (372 | ) | (89 | ) | |||||||||||
| Net change in unrealized appreciation (depreciation): | ||||||||||||||||||||
Investments and foreign currency translations | 3,336,206 | 46,736 | 1,627,509 | 872,063 | 274,402 | |||||||||||||||
Other assets and liabilities denominated in foreign currency | 1,049 | (2 | ) | (31 | ) | (95 | ) | 2 | ||||||||||||
Net realized and unrealized gain (loss) on investments and foreign currency | 3,116,932 | 174,209 | 1,421,356 | 766,849 | 345,240 | |||||||||||||||
NET INCREASE (DECREASE) IN NET ASSETS | $ | 3,318,471 | $ | 176,352 | $ | 1,418,111 | $ | 798,524 | $ | 351,481 | ||||||||||
| 82 | The Royce Funds 2012 Annual Report to Shareholders | THE ACCOMPANYING NOTES ARE AN INTEGRAL PART OF THESE FINANCIAL STATEMENTS. |
| Statements of Operations | Year Ended December 31, 2012 |
| Royce | Royce | Royce | Royce | Royce | ||||||||||||||||
| Opportunity | Global Dividend | International | International | Special Equity | ||||||||||||||||
| Select Fund | Value Fund | Micro-Cap Fund | Premier Fund | Multi-Cap Fund | ||||||||||||||||
| INVESTMENT INCOME: | ||||||||||||||||||||
| Income: | ||||||||||||||||||||
Dividends | $ | 22,410 | $ | 236,529 | $ | 149,219 | $ | 132,348 | $ | 2,129,401 | ||||||||||
Foreign withholding tax | – | (17,674 | ) | (10,230 | ) | (12,016 | ) | – | ||||||||||||
Interest | 20 | 78 | 196 | 242 | 3,011 | |||||||||||||||
| Total income | 22,430 | 218,933 | 139,185 | 120,574 | 2,132,412 | |||||||||||||||
| Expenses: | ||||||||||||||||||||
Investment advisory fees | 1,085 | 80,346 | 54,549 | 52,466 | 812,304 | |||||||||||||||
Distribution fees | – | 16,069 | 10,490 | 10,493 | 107,535 | |||||||||||||||
Shareholder servicing | 252 | 25,386 | 26,363 | 23,295 | 59,189 | |||||||||||||||
Registration | – | 18,270 | 19,220 | 18,270 | 47,062 | |||||||||||||||
Audit | 583 | 14,006 | 19,351 | 16,019 | 30,822 | |||||||||||||||
Custody | 440 | 25,151 | 30,388 | 25,304 | 21,204 | |||||||||||||||
Shareholder reports | 11 | 2,854 | 1,840 | 1,149 | 12,444 | |||||||||||||||
Legal | 1 | 95 | 67 | 63 | 4,245 | |||||||||||||||
Administrative and office facilities | 11 | 774 | 499 | 493 | 7,013 | |||||||||||||||
Trustees’ fees | 1 | 227 | 140 | 140 | 2,332 | |||||||||||||||
Dividends on securities sold short | 3,412 | – | – | – | – | |||||||||||||||
Interest expense | 1,527 | – | – | – | – | |||||||||||||||
Other expenses | 20 | 764 | 740 | 993 | 3,267 | |||||||||||||||
| Total expenses | 7,343 | 183,942 | 163,647 | 148,685 | 1,107,417 | |||||||||||||||
| Compensating balance credits | (3 | ) | (30 | ) | (12 | ) | (7 | ) | (35 | ) | ||||||||||
| Fees waived by investment adviser and distributor | (1,056 | ) | (75,284 | ) | (54,969 | ) | (53,725 | ) | (43,276 | ) | ||||||||||
| Expenses reimbursed by investment adviser | – | – | (37,752 | ) | (24,019 | ) | (55,314 | ) | ||||||||||||
| Net expenses | 6,284 | 108,628 | 70,914 | 70,934 | 1,008,792 | |||||||||||||||
| Net investment income (loss) | 16,146 | 110,305 | 68,271 | 49,640 | 1,123,620 | |||||||||||||||
| REALIZED AND UNREALIZED GAIN (LOSS) ON INVESTMENTS AND FOREIGN CURRENCY: | ||||||||||||||||||||
| Net realized gain (loss): | ||||||||||||||||||||
Investments | 219,405 | (68,926 | ) | (135,350 | ) | (375,918 | ) | 1,858,816 | ||||||||||||
Foreign currency transactions | – | (2,713 | ) | (3,423 | ) | (6,874 | ) | – | ||||||||||||
| Net change in unrealized appreciation (depreciation): | ||||||||||||||||||||
Investments and foreign currency translations | 522,838 | 1,214,335 | 572,031 | 1,268,185 | 2,863,481 | |||||||||||||||
Other assets and liabilities denominated in foreign currency | – | 505 | 86 | 286 | – | |||||||||||||||
Net realized and unrealized gain (loss) on investments and foreign currency | 742,243 | 1,143,201 | 433,344 | 885,679 | 4,722,297 | |||||||||||||||
NET INCREASE (DECREASE) IN NET ASSETS | $ | 758,389 | $ | 1,253,506 | $ | 501,615 | $ | 935,319 | $ | 5,845,917 | ||||||||||
| THE ACCOMPANYING NOTES ARE AN INTEGRAL PART OF THESE FINANCIAL STATEMENTS. | The Royce Funds 2012 Annual Report to Shareholders | 83 |
|
Financial Highlights |
| |||||||||||||||||||||||||||||||||||||||||||||||||||||||||
|
| Net |
| Net |
| Net Realized and Unrealized |
|
| Distributions |
| Distributions from Net |
|
|
|
|
|
|
|
|
| Ratio of Expenses to Average Net Assets |
| Ratio of Net Investment |
|
| ||||||||||||||||||||||||||||||||
|
| Asset Value, |
| Investment |
| Gain (Loss) on |
| Total from Investment Operations |
| from Net Investment Income |
| Realized Gain on |
| Distributions |
| Total Distributions |
| Shareholder Redemption Fees |
| Net Asset |
| Total Return |
| Net Assets, |
| Prior to Fee |
| Prior |
| Net of |
| Income (Loss) |
| Portfolio Turnover Rate |
| ||||||||||||||||||||||
|
|
|
|
|
|
|
|
|
|
|
|
|
|
|
|
|
|
|
|
|
|
|
|
|
|
|
|
|
|
|
|
|
|
|
|
|
|
|
|
|
|
|
|
|
|
|
|
|
|
|
|
|
|
|
|
|
|
Royce Select Fund I – Investment Class | |||||||||||||||||||||||||||||||||||||||||||||||||||||||||
2012 |
| $ | 16.93 |
| $ | 0.31 |
| $ | 1.95 |
| $ | 2.26 |
| $ | (0.30 | ) | $ | (1.49 | ) | $ | – |
| $ | (1.79 | ) | $ | – |
| $ | 17.40 |
|
| 13.68 | % | $ | 49,856 |
|
| 0.00 | % |
|
| 0.00 | % |
|
| 0.00 | % |
|
| 1.68 | % |
|
| 54 | % |
|
2011 |
|
| 20.32 |
|
| (0.16 | ) |
| (0.67 | ) |
| (0.83 | ) |
| – |
|
| (2.56 | ) |
| – |
|
| (2.56 | ) |
| – |
|
| 16.93 |
|
| (3.61 | ) |
| 47,345 |
|
| 1.45 |
|
|
| 1.45 |
|
|
| 1.45 |
|
|
| (0.78 | ) |
|
| 63 |
|
|
2010 |
|
| 17.42 |
|
| (0.23 | ) |
| 3.39 |
|
| 3.16 |
|
| – |
|
| (0.26 | ) |
| – |
|
| (0.26 | ) |
| – |
|
| 20.32 |
|
| 18.15 |
|
| 58,788 |
|
| 2.37 |
|
|
| 2.37 |
|
|
| 2.37 |
|
|
| (1.26 | ) |
|
| 49 |
|
|
2009 |
|
| 12.59 |
|
| 0.15 |
|
| 4.83 |
|
| 4.98 |
|
| (0.15 | ) |
| – |
|
| – |
|
| (0.15 | ) |
| – |
|
| 17.42 |
|
| 39.59 |
|
| 33,896 |
|
| 0.01 |
|
|
| 0.01 |
|
|
| 0.01 |
|
|
| 1.28 |
|
|
| 80 |
|
|
2008 |
|
| 18.20 |
|
| 0.19 |
|
| (4.93 | ) |
| (4.74 | ) |
| (0.16 | ) |
| (0.71 | ) |
| – |
|
| (0.87 | ) |
| – |
|
| 12.59 |
|
| (25.91 | ) |
| 17,480 |
|
| 0.08 |
|
|
| 0.08 |
|
|
| 0.08 |
|
|
| 1.25 |
|
|
| 116 |
|
|
Royce Micro-Cap Discovery Fund – Service Class | |||||||||||||||||||||||||||||||||||||||||||||||||||||||||
2012 |
| $ | 5.12 |
| $ | 0.04 |
| $ | 0.12 |
| $ | 0.16 |
| $ | (0.05 | ) | $ | – |
| $ | – |
| $ | (0.05 | ) | $ | – |
| $ | 5.23 |
|
| 3.10 | % | $ | 4,468 |
|
| 2.94 | % |
|
| 2.94 | % |
|
| 1.49 | % |
|
| 0.85 | % |
|
| 87 | % |
|
2011 |
|
| 5.24 |
|
| (0.04 | ) |
| (0.09 | ) |
| (0.13 | ) |
| (0.00 | ) |
| – |
|
| – |
|
| (0.00 | ) |
| 0.01 |
|
| 5.12 |
|
| (2.24 | ) |
| 3,621 |
|
| 2.99 |
|
|
| 2.99 |
|
|
| 1.49 |
|
|
| (0.71 | ) |
|
| 72 |
|
|
2010 |
|
| 4.38 |
|
| (0.01 | ) |
| 0.87 |
|
| 0.86 |
|
| – |
|
| – |
|
| – |
|
| – |
|
| – |
|
| 5.24 |
|
| 19.63 |
|
| 3,637 |
|
| 3.04 |
|
|
| 3.04 |
|
|
| 1.49 |
|
|
| (0.19 | ) |
|
| 105 |
|
|
2009 |
|
| 3.48 |
|
| (0.01 | ) |
| 0.91 |
|
| 0.90 |
|
| – |
|
| – |
|
| – |
|
| – |
|
| – |
|
| 4.38 |
|
| 25.86 |
|
| 2,910 |
|
| 3.56 |
|
|
| 3.56 |
|
|
| 1.49 |
|
|
| (0.30 | ) |
|
| 13 |
|
|
2008 |
|
| 5.85 |
|
| (0.01 | ) |
| (2.06 | ) |
| (2.07 | ) |
| – |
|
| (0.30 | ) |
| – |
|
| (0.30 | ) |
| – |
|
| 3.48 |
|
| (35.07 | ) |
| 2,332 |
|
| 2.77 |
|
|
| 2.77 |
|
|
| 1.49 |
|
|
| (0.22 | ) |
|
| 63 |
|
|
Royce Financial Services Fund – Service Class | |||||||||||||||||||||||||||||||||||||||||||||||||||||||||
2012 |
| $ | 5.71 |
| $ | 0.10 |
| $ | 1.08 |
| $ | 1.18 |
| $ | (0.06 | ) | $ | – |
| $ | – |
| $ | (0.06 | ) | $ | – |
| $ | 6.83 |
|
| 20.72 | % | $ | 16,888 |
|
| 1.87 | % |
|
| 1.87 | % |
|
| 1.49 | % |
|
| 1.53 | % |
|
| 26 | % |
|
2011 |
|
| 6.50 |
|
| 0.05 |
|
| (0.78 | ) |
| (0.73 | ) |
| (0.06 | ) |
| – |
|
| – |
|
| (0.06 | ) |
| – |
|
| 5.71 |
|
| (11.29 | ) |
| 14,096 |
|
| 1.84 |
|
|
| 1.84 |
|
|
| 1.49 |
|
|
| 0.73 |
|
|
| 23 |
|
|
2010 |
|
| 5.57 |
|
| 0.07 |
|
| 0.96 |
|
| 1.03 |
|
| (0.10 | ) |
| – |
|
| – |
|
| (0.10 | ) |
| – |
|
| 6.50 |
|
| 18.45 |
|
| 14,688 |
|
| 1.94 |
|
|
| 1.94 |
|
|
| 1.49 |
|
|
| 1.14 |
|
|
| 16 |
|
|
2009 |
|
| 4.25 |
|
| 0.04 |
|
| 1.31 |
|
| 1.35 |
|
| (0.04 | ) |
| – |
|
| – |
|
| (0.04 | ) |
| 0.01 |
|
| 5.57 |
|
| 32.13 |
|
| 13,525 |
|
| 2.06 |
|
|
| 2.06 |
|
|
| 1.49 |
|
|
| 0.90 |
|
|
| 34 |
|
|
2008 |
|
| 6.71 |
|
| 0.07 |
|
| (2.46 | ) |
| (2.39 | ) |
| (0.05 | ) |
| (0.03 | ) |
| – |
|
| (0.08 | ) |
| 0.01 |
|
| 4.25 |
|
| (35.37 | ) |
| 9,553 |
|
| 2.35 |
|
|
| 2.34 |
|
|
| 1.49 |
|
|
| 1.85 |
|
|
| 48 |
|
|
Royce Select Fund II – Investment Class | |||||||||||||||||||||||||||||||||||||||||||||||||||||||||
2012 |
| $ | 9.95 |
| $ | 0.20 |
| $ | 1.19 |
| $ | 1.39 |
| $ | (0.17 | ) | $ | (0.49 | ) | $ | – |
| $ | (0.66 | ) | $ | – |
| $ | 10.68 |
|
| 14.23 | % | $ | 3,620 |
|
| 0.19 | % |
|
| 0.19 | % |
|
| 0.19 | % |
|
| 1.86 | % |
|
| 123 | % |
|
2011 |
|
| 13.90 |
|
| (0.01 | ) |
| (2.04 | ) |
| (2.05 | ) |
| – |
|
| (1.90 | ) |
| – |
|
| (1.90 | ) |
| – |
|
| 9.95 |
|
| (14.35 | ) |
| 3,420 |
|
| 1.29 |
|
|
| 1.29 |
|
|
| 1.29 |
|
|
| (0.09 | ) |
|
| 153 |
|
|
2010 |
|
| 11.62 |
|
| (0.18 | ) |
| 2.60 |
|
| 2.42 |
|
| (0.00 | ) |
| (0.15 | ) |
| – |
|
| (0.15 | ) |
| 0.01 |
|
| 13.90 |
|
| 20.96 |
|
| 5,141 |
|
| 2.77 |
|
|
| 2.77 |
|
|
| 2.77 |
|
|
| (1.47 | ) |
|
| 126 |
|
|
2009 |
|
| 7.02 |
|
| 0.03 |
|
| 4.64 |
|
| 4.67 |
|
| (0.07 | ) |
| – |
|
| – |
|
| (0.07 | ) |
| – |
|
| 11.62 |
|
| 66.58 |
|
| 4,109 |
|
| 0.67 |
|
|
| 0.67 |
|
|
| 0.67 |
|
|
| 0.53 |
|
|
| 114 |
|
|
2008 |
|
| 10.66 |
|
| 0.09 |
|
| (3.65 | ) |
| (3.56 | ) |
| (0.08 | ) |
| – |
|
| – |
|
| (0.08 | ) |
| – |
|
| 7.02 |
|
| (33.37 | ) |
| 1,698 |
|
| 0.24 |
|
|
| 0.24 |
|
|
| 0.24 |
|
|
| 0.98 |
|
|
| 268 |
|
|
Royce Global Select Long/Short Fund – Investment Class | |||||||||||||||||||||||||||||||||||||||||||||||||||||||||
2012 |
| $ | 15.38 |
| $ | 0.47 |
| $ | 1.68 |
| $ | 2.15 |
| $ | (0.49 | ) | $ | – |
| $ | – |
| $ | (0.49 | ) | $ | – |
| $ | 17.04 |
|
| 14.02 | % | $ | 20,959 |
|
| 0.57 | % |
|
| 0.57 | % |
|
| 0.57 | % |
|
| 2.57 | % |
|
| 77 | % |
|
2011 |
|
| 19.89 |
|
| 0.25 |
|
| (3.83 | ) |
| (3.58 | ) |
| (0.25 | ) |
| (0.70 | ) |
| – |
|
| (0.95 | ) |
| 0.02 |
|
| 15.38 |
|
| (17.77 | ) |
| 22,507 |
|
| 0.98 |
|
|
| 0.98 |
|
|
| 0.98 |
|
|
| 1.46 |
|
|
| 45 |
|
|
2010 |
|
| 14.97 |
|
| (0.26 | ) |
| 5.22 |
|
| 4.96 |
|
| (0.05 | ) |
| – |
|
| – |
|
| (0.05 | ) |
| 0.01 |
|
| 19.89 |
|
| 33.21 |
|
| 16,355 |
|
| 3.48 |
|
|
| 3.48 |
|
|
| 3.48 |
|
|
| (1.55 | ) |
|
| 80 |
|
|
2009 |
|
| 9.76 |
|
| 0.18 |
|
| 5.27 |
|
| 5.45 |
|
| (0.26 | ) |
| – |
|
| – |
|
| (0.26 | ) |
| 0.02 |
|
| 14.97 |
|
| 56.11 |
|
| 9,117 |
|
| 0.00 |
|
|
| 0.00 |
|
|
| 0.00 |
|
|
| 1.55 |
|
|
| 85 |
|
|
2008 |
|
| 15.01 |
|
| 0.23 |
|
| (5.40 | ) |
| (5.17 | ) |
| – |
|
| (0.09 | ) |
| – |
|
| (0.09 | ) |
| 0.01 |
|
| 9.76 |
|
| (34.39 | ) |
| 6,049 |
|
| 0.50 |
|
|
| 0.50 |
|
|
| 0.50 |
|
|
| 1.75 |
|
|
| 41 |
|
|
Royce European Smaller-Companies Fund – Service Class | |||||||||||||||||||||||||||||||||||||||||||||||||||||||||
2012 |
| $ | 8.50 |
| $ | 0.14 |
| $ | 1.88 |
| $ | 2.02 |
| $ | (0.15 | ) | $ | – |
| $ | – |
| $ | (0.15 | ) | $ | – |
| $ | 10.37 |
|
| 23.83 | % | $ | 15,854 |
|
| 2.13 | % |
|
| 2.13 | % |
|
| 1.69 | % |
|
| 1.29 | % |
|
| 22 | % |
|
2011 |
|
| 10.79 |
|
| 0.10 |
|
| (2.31 | ) |
| (2.21 | ) |
| (0.10 | ) |
| – |
|
| – |
|
| (0.10 | ) |
| 0.02 |
|
| 8.50 |
|
| (20.32 | ) |
| 15,918 |
|
| 2.09 |
|
|
| 2.09 |
|
|
| 1.69 |
|
|
| 0.95 |
|
|
| 36 |
|
|
2010 |
|
| 8.06 |
|
| 0.03 |
|
| 2.79 |
|
| 2.82 |
|
| (0.10 | ) |
| – |
|
| – |
|
| (0.10 | ) |
| 0.01 |
|
| 10.79 |
|
| 35.20 |
|
| 15,369 |
|
| 2.57 |
|
|
| 2.57 |
|
|
| 1.69 |
|
|
| 0.70 |
|
|
| 32 |
|
|
2009 |
|
| 5.19 |
|
| 0.06 |
|
| 2.93 |
|
| 2.99 |
|
| (0.12 | ) |
| – |
|
| – |
|
| (0.12 | ) |
| – |
|
| 8.06 |
|
| 57.69 |
|
| 6,887 |
|
| 3.21 |
|
|
| 3.21 |
|
|
| 1.69 |
|
|
| 1.11 |
|
|
| 51 |
|
|
2008 |
|
| 10.14 |
|
| 0.22 |
|
| (4.95 | ) |
| (4.73 | ) |
| (0.23 | ) |
| – |
|
| – |
|
| (0.23 | ) |
| 0.01 |
|
| 5.19 |
|
| (46.38 | ) |
| 4,044 |
|
| 2.74 |
|
|
| 2.72 |
|
|
| 1.69 |
|
|
| 2.22 |
|
|
| 88 |
|
|
|
|
|
84 | The Royce Funds 2012 Annual Report to Shareholders | THE ACCOMPANYING NOTES ARE AN INTEGRAL PART OF THESE FINANCIAL STATEMENTS. | |
|
Financial Highlights |
| |||||||||||||||||||||||||||||||||||||||||||||||||||||||||
|
| Net |
| Net |
| Net Realized and Unrealized |
|
| Distributions |
| Distributions from Net |
|
|
|
|
|
|
|
|
| Ratio of Expenses to Average Net Assets |
| Ratio of Net Investment |
|
| ||||||||||||||||||||||||||||||||
|
| Asset Value, |
| Investment |
| Gain (Loss) on |
| Total from Investment Operations |
| from Net Investment Income |
| Realized Gain on |
| Distributions |
| Total Distributions |
| Shareholder Redemption Fees |
| Net Asset |
| Total Return |
| Net Assets, |
| Prior to Fee |
| Prior |
| Net of |
| Income (Loss) |
| Portfolio Turnover Rate |
| ||||||||||||||||||||||
|
|
|
|
|
|
|
|
|
|
|
|
|
|
|
|
|
|
|
|
|
|
|
|
|
|
|
|
|
|
|
|
|
|
|
|
|
|
|
|
|
|
|
|
|
|
|
|
|
|
|
|
|
|
|
|
|
|
Royce Enterprise Select Fund – Investment Class | |||||||||||||||||||||||||||||||||||||||||||||||||||||||||
2012 |
| $ | 9.88 |
| $ | 0.02 |
| $ | 1.51 |
| $ | 1.53 |
| $ | (0.00 | ) | $ | (1.05 | ) | $ | – |
| $ | (1.05 | ) | $ | – |
| $ | 10.36 |
|
| 15.68 | % | $ | 1,299 |
|
| 0.98 | %2 |
|
| 0.98 | %2 |
|
| 0.81 | %2 |
|
| 0.18 | %2 |
|
| 127 | % |
|
2011 |
|
| 10.43 |
|
| (0.04 | ) |
| 0.09 |
|
| 0.05 |
|
| – |
|
| (0.60 | ) |
| – |
|
| (0.60 | ) |
| – |
|
| 9.88 |
|
| 0.66 |
|
| 1,123 |
|
| 1.31 |
|
|
| 1.31 |
|
|
| 1.31 |
|
|
| (0.42 | ) |
|
| 136 |
|
|
2010 |
|
| 8.95 |
|
| 0.05 |
|
| 1.49 |
|
| 1.54 |
|
| (0.06 | ) |
| – |
|
| – |
|
| (0.06 | ) |
| – |
|
| 10.43 |
|
| 17.22 |
|
| 1,158 |
|
| 0.70 |
|
|
| 0.70 |
|
|
| 0.70 |
|
|
| 0.50 |
|
|
| 166 |
|
|
2009 |
|
| 7.33 |
|
| 0.07 |
|
| 1.62 |
|
| 1.69 |
|
| (0.07 | ) |
| – |
|
| – |
|
| (0.07 | ) |
| – |
|
| 8.95 |
|
| 23.13 |
|
| 1,150 |
|
| 0.03 |
|
|
| 0.03 |
|
|
| 0.03 |
|
|
| 0.88 |
|
|
| 415 |
|
|
2008 |
|
| 10.04 |
|
| 0.13 |
|
| (2.80 | ) |
| (2.67 | ) |
| (0.12 | ) |
| (0.02 | ) |
| – |
|
| (0.14 | ) |
| 0.10 |
|
| 7.33 |
|
| (25.53 | ) |
| 917 |
|
| 0.28 |
|
|
| 0.28 |
|
|
| 0.28 |
|
|
| 1.48 |
|
|
| 764 |
|
|
Royce SMid-Cap Value Fund – Service Class | |||||||||||||||||||||||||||||||||||||||||||||||||||||||||
2012 |
| $ | 10.10 |
| $ | (0.00 | ) | $ | 1.55 |
| $ | 1.55 |
| $ | – |
| $ | – |
| $ | – |
| $ | – |
| $ | 0.01 |
| $ | 11.66 |
|
| 15.45 | % | $ | 11,140 |
|
| 1.90 | % |
|
| 1.90 | % |
|
| 1.35 | % |
|
| (0.03 | )% |
|
| 46 | % |
|
2011 |
|
| 11.44 |
|
| (0.06 | ) |
| (1.27 | ) |
| (1.33 | ) |
| (0.02 | ) |
| – |
|
| – |
|
| (0.02 | ) |
| 0.01 |
|
| 10.10 |
|
| (11.57 | ) |
| 10,327 |
|
| 1.95 |
|
|
| 1.95 |
|
|
| 1.49 |
|
|
| (0.54 | ) |
|
| 54 |
|
|
2010 |
|
| 9.08 |
|
| (0.03 | ) |
| 2.39 |
|
| 2.36 |
|
| – |
|
| – |
|
| – |
|
| – |
|
| – |
|
| 11.44 |
|
| 25.99 |
|
| 6,195 |
|
| 2.40 |
|
|
| 2.40 |
|
|
| 1.49 |
|
|
| (0.26 | ) |
|
| 126 |
|
|
2009 |
|
| 7.06 |
|
| (0.01 | ) |
| 2.03 |
|
| 2.02 |
|
| (0.01 | ) |
| – |
|
| – |
|
| (0.01 | ) |
| 0.01 |
|
| 9.08 |
|
| 28.75 |
|
| 7,365 |
|
| 2.03 |
|
|
| 2.03 |
|
|
| 1.49 |
|
|
| (0.20 | ) |
|
| 216 |
|
|
2008 |
|
| 9.99 |
|
| 0.02 |
|
| (2.96 | ) |
| (2.94 | ) |
| (0.01 | ) |
| – |
|
| – |
|
| (0.01 | ) |
| 0.02 |
|
| 7.06 |
|
| (29.27 | ) |
| 14,059 |
|
| 2.05 |
|
|
| 2.04 |
|
|
| 1.49 |
|
|
| 0.31 |
|
|
| 397 |
|
|
Royce Focus Value Fund – Service Class a | |||||||||||||||||||||||||||||||||||||||||||||||||||||||||
2012 |
| $ | 13.75 |
| $ | 0.06 |
| $ | 1.20 |
| $ | 1.26 |
| $ | (0.27 | ) | $ | (0.00 | ) | $ | – |
| $ | (0.27 | ) | $ | – |
| $ | 14.74 |
| $ | 9.20 | % | $ | 8,875 |
|
| 2.05 | % |
|
| 2.05 | % |
|
| 1.35 | % |
|
| 0.35 | % |
|
| 21 | % |
|
2011 |
|
| 16.59 |
|
| (0.05 | ) |
| (2.25 | ) |
| (2.30 | ) |
| – |
|
| (0.54 | ) |
| – |
|
| (0.54 | ) |
| – |
|
| 13.75 |
|
| (13.88 | ) |
| 8,727 |
|
| 1.97 |
|
|
| 1.97 |
|
|
| 1.49 |
|
|
| (0.31 | ) |
|
| 25 |
|
|
2010 |
|
| 14.82 |
|
| (0.06 | ) |
| 2.30 |
|
| 2.24 |
|
| (0.06 | ) |
| (0.41 | ) |
| – |
|
| (0.47 | ) |
| – |
|
| 16.59 |
|
| 15.16 |
|
| 8,942 |
|
| 1.95 |
|
|
| 1.95 |
|
|
| 1.49 |
|
|
| (0.32 | ) |
|
| 31 |
|
|
2009 |
|
| 10.00 |
|
| 0.00 |
|
| 5.31 |
|
| 5.31 |
|
| (0.05 | ) |
| (0.44 | ) |
| – |
|
| (0.49 | ) |
| – |
|
| 14.82 |
|
| 53.27 | 1 |
| 4,796 |
|
| 2.97 | 2 |
|
| 2.97 | 2 |
|
| 1.49 | 2 |
|
| 0.17 | 2 |
|
| 21 |
|
|
Royce Partners Fund – Service Class b | |||||||||||||||||||||||||||||||||||||||||||||||||||||||||
2012 |
| $ | 10.37 |
| $ | 0.04 |
| $ | 2.10 |
| $ | 2.14 |
| $ | (0.01 | ) | $ | (0.46 | ) | $ | – |
| $ | (0.47 | ) | $ | – |
| $ | 12.04 |
|
| 20.74 | % | $ | 2,083 |
|
| 4.83 | % |
|
| 4.83 | % |
|
| 1.35 | % |
|
| 0.33 | % |
|
| 31 | % |
|
2011 |
|
| 13.15 |
|
| (0.03 | ) |
| (1.52 | ) |
| (1.55 | ) |
| (0.05 | ) |
| (1.18 | ) |
| – |
|
| (1.23 | ) |
| – |
|
| 10.37 |
|
| (11.66 | ) |
| 1,682 |
|
| 4.25 |
|
|
| 4.25 |
|
|
| 1.49 |
|
|
| (0.25 | ) |
|
| 44 |
|
|
2010 |
|
| 11.56 |
|
| (0.01 | ) |
| 2.14 |
|
| 2.15 |
|
| (0.16 | ) |
| (0.41 | ) |
| – |
|
| (0.57 | ) |
| 0.01 |
|
| 13.15 |
|
| 18.74 |
|
| 1,771 |
|
| 3.72 |
|
|
| 3.72 |
|
|
| 1.49 |
|
|
| (0.10 | ) |
|
| 38 |
|
|
2009 |
|
| 10.00 |
|
| (0.05 | ) |
| 1.61 |
|
| 1.56 |
|
| – |
|
| – |
|
| – |
|
| – |
|
| – |
|
| 11.56 |
|
| 15.601 |
|
| 1,501 |
|
| 5.27 | 2 |
|
| 5.27 | 2 |
|
| 1.49 | 2 |
|
| (0.71 | )2 |
|
| 14 |
|
|
Royce Opportunity Select Fund – Investment Class c | |||||||||||||||||||||||||||||||||||||||||||||||||||||||||
2012 |
| $ | 10.33 |
| $ | 0.07 |
| $ | 3.50 |
| $ | 3.57 |
| $ | (0.13 | ) | $ | (0.96 | ) | $ | – |
| $ | (1.09 | ) | $ | – |
| $ | 12.81 |
|
| 35.14 | % | $ | 3,198 |
|
| 0.29 | %2 |
|
| 0.29 | %2 |
|
| 0.25 | %2 |
|
| 0.64 | %2 |
|
| 196 | % |
|
2011 |
|
| 12.99 |
|
| 0.01 |
|
| (2.26 | ) |
| (2.25 | ) |
| (0.02 | ) |
| (0.39 | ) |
| – |
|
| (0.41 | ) |
| – |
|
| 10.33 |
|
| (17.14 | ) |
| 2,102 |
|
| 1.14 |
|
|
| 1.14 |
|
|
| 1.14 |
|
|
| 0.08 |
|
|
| 299 |
|
|
2010 |
|
| 10.00 |
|
| (0.43 | ) |
| 3.42 |
|
| 2.99 |
|
| – |
|
| – |
|
| – |
|
| – |
|
| – |
|
| 12.99 |
|
| 29.90 | 1 |
| 1,913 |
|
| 4.01 | 1 |
|
| 4.01 | 1 |
|
| 4.01 | 1 |
|
| (3.79 | )1 |
|
| 95 |
|
|
Royce Global Dividend Value Fund – Service Class d | |||||||||||||||||||||||||||||||||||||||||||||||||||||||||
2012 |
| $ | 8.39 |
| $ | 0.17 |
| $ | 1.71 |
| $ | 1.88 |
| $ | (0.17 | ) | $ | – |
| $ | – |
| $ | (0.17 | ) | $ | – |
| $ | 10.10 |
|
| 22.52 | % | $ | 6,708 |
|
| 2.86 | % |
|
| 2.86 | % |
|
| 1.69 | % |
|
| 1.72 | % |
|
| 36 | % |
|
2011 |
|
| 10.00 |
|
| 0.08 |
|
| (1.62 | ) |
| (1.54 | ) |
| (0.07 | ) |
| (0.01 | ) |
| – |
|
| (0.08 | ) |
| 0.01 |
|
| 8.39 |
|
| (15.37 | )1 |
| 6,135 |
|
| 3.47 | 2 |
|
| 3.47 | 2 |
|
| 1.69 | 2 |
|
| 1.10 | 2 |
|
| 20 |
|
|
Royce International Micro-Cap Fund – Service Class d | |||||||||||||||||||||||||||||||||||||||||||||||||||||||||
2012 |
| $ | 7.72 |
| $ | 0.13 |
| $ | 0.92 |
| $ | 1.05 |
| $ | (0.16 | ) | $ | – |
| $ | – |
| $ | (0.16 | ) | $ | – |
| $ | 8.61 |
|
| 13.59 | % | $ | 4,603 |
|
| 3.90 | % |
|
| 3.90 | % |
|
| 1.69 | % |
|
| 1.63 | % |
|
| 62 | % |
|
2011 |
|
| 10.00 |
|
| 0.10 |
|
| (2.26 | ) |
| (2.16 | ) |
| (0.12 | ) |
| – |
|
| (0.01 | ) |
| (0.13 | ) |
| 0.01 |
|
| 7.72 |
|
| (21.51 | )1 |
| 3,572 |
|
| 3.92 | 2 |
|
| 3.92 | 2 |
|
| 1.69 | 2 |
|
| 1.08 | 2 |
|
| 71 |
|
|
Royce International Premier Fund – Service Class d | |||||||||||||||||||||||||||||||||||||||||||||||||||||||||
2012 |
| $ | 8.26 |
| $ | 0.12 |
| $ | 1.81 |
| $ | 1.93 |
| $ | (0.18 | ) | $ | – |
| $ | – |
| $ | (0.18 | ) | $ | – |
| $ | 10.01 |
|
| 23.40 | % | $ | 6,444 |
|
| 3.54 | % |
|
| 3.54 | % |
|
| 1.69 | % |
|
| 1.18 | % |
|
| 103 | % |
|
2011 |
|
| 10.00 |
|
| 0.05 |
|
| (1.73 | ) |
| (1.68 | ) |
| (0.06 | ) |
| (0.00 | ) |
| (0.01 | ) |
| (0.07 | ) |
| 0.01 |
|
| 8.26 |
|
| (16.75 | )1 |
| 4,090 |
|
| 3.77 | 2 |
|
| 3.77 | 2 |
|
| 1.69 | 2 |
|
| 0.67 | 2 |
|
| 42 |
|
|
Royce Special Equity Multi-Cap Fund – Investment Class e | |||||||||||||||||||||||||||||||||||||||||||||||||||||||||
2012 |
| $ | 11.54 |
| $ | 0.12 |
| $ | 0.22 |
| $ | 0.34 |
| $ | (0.14 | ) | $ | (0.10 | ) | $ | – |
| $ | (0.24 | ) | $ | – |
| $ | 11.64 |
|
| 3.00 | %1 | $ | 34,375 |
|
| 1.19 | %2 |
|
| 1.19 | %2 |
|
| 1.16 | %2 |
|
| 1.55 | %2 |
|
| 14 | % |
|
|
|
|
THE ACCOMPANYING NOTES ARE AN INTEGRAL PART OF THESE FINANCIAL STATEMENTS. | The Royce Funds 2012 Annual Report to Shareholders | 85 | |
|
Financial Highlights |
| |||||||||||||||||||||||||||||||||||||||||||||||||||||||||
|
| Net |
| Net |
| Net Realized and Unrealized |
|
| Distributions |
| Distributions from Net |
|
|
|
|
|
|
|
|
| Ratio of Expenses to Average Net Assets |
| Ratio of Net Investment |
|
| ||||||||||||||||||||||||||||||||
|
| Asset Value, |
| Investment |
| Gain (Loss) on |
| Total from Investment Operations |
| from Net Investment Income |
| Realized Gain on |
| Distributions |
| Total Distributions |
| Shareholder Redemption Fees |
| Net Asset |
| Total Return |
| Net Assets, |
| Prior to Fee |
| Prior |
| Net of |
| Income (Loss) |
| Portfolio Turnover Rate |
| ||||||||||||||||||||||
|
|
|
|
|
|
|
|
|
|
|
|
|
|
|
|
|
|
|
|
|
|
|
|
|
|
|
|
|
|
|
|
|
|
|
|
|
|
|
|
|
|
|
|
|
|
|
|
|
|
|
|
|
|
|
|
|
|
Royce Special Equity Multi-Cap Fund – Service Class f | |||||||||||||||||||||||||||||||||||||||||||||||||||||||||
2012 |
| $ | 10.64 |
| $ | 0.13 |
| $ | 1.10 |
| $ | 1.23 |
| $ | (0.09 | ) | $ | (0.10 | ) | $ | – |
| $ | (0.19 | ) | $ | – |
| $ | 11.68 |
|
| 11.62 | % | $ | 43,690 |
|
| 1.51 | % |
|
| 1.51 | % |
|
| 1.36 | % |
|
| 1.15 | % |
|
| 14 | % |
|
| 2011 | 10.00 | 0.06 | 0.65 | 0.71 | (0.06 | ) | (0.02 | ) | – | (0.08 | ) | 0.01 | 10.64 | 7.20 | 1 | 36,811 | 1.97 | 2 | 1.97 | 2 | 1.39 | 2 | 1.45 | 2 | 5 | ||||||||||||||||||||||||||||||||
Royce Special Equity Multi-Cap Fund – Institutional Class g | |||||||||||||||||||||||||||||||||||||||||||||||||||||||||
2012 |
| $ | 11.83 |
| $ | 0.10 |
| $ | (0.03 | ) | $ | 0.07 |
| $ | (0.16 | ) | $ | (0.10 | ) | $ | – |
| $ | (0.26 | ) | $ | – |
| $ | 11.64 |
|
| 0.61 | %1 | $ | 30,905 |
|
| 1.21 | %2 |
|
| 1.21 | %2 |
|
| 1.04 | %2 |
|
| 1.76 | %2 |
|
| 14 | % |
|
| 1 | Not annualized | |
| 2 | Annualized | |
| a | The Fund commenced operations on March 2, 2009. | |
| b | The Fund commenced operations on April 28, 2009. | |
| c | The Fund commenced operations on September 1, 2010. | |
| d | The Fund commenced operations on January 3, 2011. | |
| e | The Class commenced operations on March 1, 2012. | |
| f | The Class commenced operations on January 3, 2011. | |
| g | The Class commenced operations on April 18, 2012. |
|
|
|
86 | The Royce Funds 2012 Annual Report to Shareholders | THE ACCOMPANYING NOTES ARE AN INTEGRAL PART OF THESE FINANCIAL STATEMENTS. | |
| Notes to Financial Statements | |
| Summary of Significant Accounting Policies: |
Royce Select Fund I, Royce Micro-Cap Discovery Fund, Royce Financial Services Fund, Royce Select Fund II, Royce Global Select Long/Short Fund, Royce European Smaller-Companies Fund, Royce Enterprise Select Fund, Royce SMid-Cap Value Fund, Royce Focus Value Fund, Royce Partners Fund, Royce Opportunity Select Fund, Royce Global Dividend Value Fund, Royce International Micro-Cap Fund, Royce International Premier Fund and Royce Special Equity Multi-Cap Fund (the “Fund” or “Funds”), are fifteen series of The Royce Fund (the “Trust”), a diversified open-end management investment company organized as a Delaware statutory trust. Effective May 1, 2012, Royce Discovery Fund became Royce Micro-Cap Discovery Fund, Royce Global Select Fund became Royce Global Select Long/Short Fund and Royce SMid-Cap Select Fund became Royce Enterprise Select Fund. |
| Royce Select Fund I | 11 | % | Royce Enterprise Select Fund | 79 | % | Royce Global Dividend Value Fund | 12 | % | |||||
| Royce Micro-Cap Discovery Fund | 45 | % | Royce SMid-Cap Value Fund | 37 | % | Royce International Micro-Cap Fund | 39 | % | |||||
| Royce Financial Services Fund | 13 | % | Royce Focus Value Fund | 73 | % | Royce International Premier Fund | 22 | % | |||||
| Royce Select Fund II | 47 | % | Royce Partners Fund | 80 | % | ||||||||
| Royce Global Select Long/Short Fund | 14 | % | Royce Opportunity Select Fund | 62 | % |
| Valuation of Investments: |
Securities are valued as of the close of trading on the New York Stock Exchange (NYSE) (generally 4:00 p.m. Eastern time) on the valuation date. Securities that trade on an exchange, and securities traded on Nasdaq’s Electronic Bulletin Board, are valued at their last reported sales price or Nasdaq official closing price taken from the primary market in which each security trades or, if no sale is reported for such day, at their highest bid price (in the case of long positions) or at the lowest ask price (in the case of short positions). Other over-the-counter securities for which market quotations are readily available are valued at their highest bid price, except in the case of some bonds and other fixed income securities which may be valued by reference to other securities with comparable ratings, interest rates and maturities, using established independent pricing services. The Funds value their non-U.S. dollar denominated securities in U.S. dollars daily at the prevailing foreign currency exchange rates as quoted by a major bank. Securities for which market quotations are not readily available are valued at their fair value in accordance with the provisions of the 1940 Act, under procedures approved by the Fund’s Board of Trustees, and are reported as Level 3 securities. As a general principle, the fair value of a security is the amount which the Fund might reasonably expect to receive for the security upon its current sale. However, in light of the judgment involved in fair valuations, there can be no assurance that a fair value assigned to a particular security will be the amount which the Fund might be able to receive upon its current sale. In addition, if, between the time trading ends on a particular security and the close of the customary trading session on the NYSE, events occur that are significant and may make the closing price unreliable, a Fund may fair value the security. The Funds use an independent pricing service to provide fair value estimates for relevant non-U.S. equity securities on days when the U.S. market volatility exceeds a certain threshold. This pricing service uses proprietary correlations it has developed between the movement of prices of non-U.S. equity securities and indices of U.S.-traded securities, futures contracts and other indications to estimate the fair value of relevant non-U.S. securities. When fair value pricing is employed, the prices of securities used by a Fund may differ from quoted or published prices for the same security. Investments in money market funds are valued at net asset value per share. |
Various inputs are used in determining the value of each Fund’s investments, as noted above. These inputs are summarized in the three broad levels below: | |||
Level 1 – quoted prices in active markets for identical securities. | |||
Level 2 – other significant observable inputs (including quoted prices for similar securities, foreign securities that may be fair valued and repurchase agreements). The table below includes all Level 2 securities. Any Level 2 securities with values based on quoted prices for similar securities would be noted in the Schedules of Investments. | |||
Level 3 – significant unobservable inputs (including last trade price before trading was suspended, or at a discount thereto for lack of marketability or otherwise, market price information regarding other securities, information received from the company and/or published documents, including SEC filings and financial statements, or other publicly available information). | |||
The inputs or methodology used for valuing securities are not necessarily an indication of the risk associated with investing in those securities. | |||
The following is a summary of the inputs used to value each Fund’s investments as of December 31, 2012. For a detailed breakout of common stocks by sector classification or country, please refer to the Schedules of Investments. | |||
| The Royce Funds 2012 Annual Report to Shareholders | 87 |
| Notes to Financial Statements (continued) | |
| Valuation of Investments (continued): | ||||||||||||||||
| Level 1 | Level 2 | Level 3 | Total | |||||||||||||
| Royce Select Fund I | ||||||||||||||||
| Common Stocks | $ | 43,210,772 | $ | 3,104,349 | $ | – | $ | 46,315,121 | ||||||||
| Cash Equivalents | – | 3,611,000 | – | 3,611,000 | ||||||||||||
| Royce Micro-Cap Discovery Fund | ||||||||||||||||
| Common Stocks | 4,270,612 | – | – | 4,270,612 | ||||||||||||
| Cash Equivalents | – | 211,000 | – | 211,000 | ||||||||||||
| Royce Financial Services Fund | ||||||||||||||||
| Common Stocks | 12,291,277 | 3,989,301 | – | 16,280,578 | ||||||||||||
| Cash Equivalents | – | 342,000 | – | 342,000 | ||||||||||||
| Royce Select Fund II | ||||||||||||||||
| Common Stocks | 2,666,561 | 844,144 | – | 3,510,705 | ||||||||||||
| Cash Equivalents | – | 373,000 | – | 373,000 | ||||||||||||
| Royce Global Select Long/Short Fund | ||||||||||||||||
| Common Stocks | 2,930,557 | 16,202,189 | – | 19,132,746 | ||||||||||||
| Cash Equivalents | – | 3,386,000 | – | 3,386,000 | ||||||||||||
| Royce European Smaller-Companies Fund | ||||||||||||||||
| Common Stocks | – | 15,205,189 | – | 15,205,189 | ||||||||||||
| Cash Equivalents | – | 556,000 | – | 556,000 | ||||||||||||
| Royce Enterprise Select Fund | ||||||||||||||||
| Common Stocks | 1,010,391 | 47,424 | – | 1,057,815 | ||||||||||||
| Cash Equivalents | – | 243,000 | – | 243,000 | ||||||||||||
| Royce SMid-Cap Value Fund | ||||||||||||||||
| Common Stocks | 7,565,552 | 2,751,336 | – | 10,316,888 | ||||||||||||
| Cash Equivalents | – | 867,000 | – | 867,000 | ||||||||||||
| Royce Focus Value Fund | ||||||||||||||||
| Common Stocks | 6,908,726 | 1,619,943 | – | 8,528,669 | ||||||||||||
| Fixed Income | 111,037 | – | – | 111,037 | ||||||||||||
| Cash Equivalents | – | 257,000 | – | 257,000 | ||||||||||||
| Royce Partners Fund | ||||||||||||||||
| Common Stocks | 1,678,944 | 351,799 | – | 2,030,743 | ||||||||||||
| Cash Equivalents | – | 162,000 | – | 162,000 | ||||||||||||
| Royce Opportunity Select Fund | ||||||||||||||||
| Common Stocks | 2,910,027 | – | – | 2,910,027 | ||||||||||||
| Cash Equivalents | – | 325,000 | – | 325,000 | ||||||||||||
| Royce Global Dividend Value Fund | ||||||||||||||||
| Common Stocks | 1,117,352 | 5,458,480 | – | 6,575,832 | ||||||||||||
| Cash Equivalents | – | 175,000 | – | 175,000 | ||||||||||||
| Royce International Micro-Cap Fund | ||||||||||||||||
| Common Stocks | 216,176 | 4,133,531 | 2,184 | 4,351,891 | ||||||||||||
| Cash Equivalents | – | 364,000 | – | 364,000 | ||||||||||||
| Royce International Premier Fund | ||||||||||||||||
| Common Stocks | – | 6,103,854 | – | 6,103,854 | ||||||||||||
| Cash Equivalents | – | 305,000 | – | 305,000 | ||||||||||||
| Royce Special Equity Multi-Cap Fund | ||||||||||||||||
| Common Stocks | 102,680,827 | – | – | 102,680,827 | ||||||||||||
| Cash Equivalents | – | 8,706,000 | – | 8,706,000 | ||||||||||||
Short positions: | ||||||||||||||||
| Level 1 | Level 2 | Level 3 | Total | |||||||||||||
| Royce Select Fund II | ||||||||||||||||
| Common Stocks | $ | (201,669 | ) | $ | – | $ | – | $ | (201,669 | ) | ||||||
| Fixed Income | (48,472 | ) | – | – | (48,472 | ) | ||||||||||
| Royce Global Select Long/Short Fund | ||||||||||||||||
| Common Stocks | (6,065,732 | ) | (344,296 | ) | – | (6,410,028 | ) | |||||||||
| Royce Opportunity Select Fund | ||||||||||||||||
| Common Stocks | (344,531 | ) | – | – | (344,531 | ) | ||||||||||
For the year ended December 31, 2012, certain securities have transferred in and out of Level 1 and Level 2 measurements as a result of the fair value pricing procedures for international equities. The Funds recognize transfers between levels as of the end of the reporting period. At December 31, 2012, the following Funds had securities transfer from Level 2 to Level 1 within the fair value hierarchy: |
| Transfers from Level 2 | Transfers from Level 2 | |||||
| to Level 1 | to Level 1 | |||||
| Royce Global Dividend Value Fund | $139,960 | Royce International Micro-Cap Fund | $84,601 |
| 88 | The Royce Funds 2012 Annual Report to Shareholders |
| Valuation of Investments (continued): | ||||||||||||||||
| Level 3 Reconciliation: | ||||||||||||||||
| Balance as of | Realized and Unrealized | Balance as of | ||||||||||||||
| 12/31/11 | Sales | Gain (Loss)1 | 12/31/12 | |||||||||||||
| Royce Select Fund II | ||||||||||||||||
| Common Stocks | $ | 24,763 | $ | 23,626 | $ | (1,137 | ) | $ | – | |||||||
| Royce Global Select Long/Short Fund | ||||||||||||||||
| Common Stocks | 61,723 | 0 | (61,723 | ) | – | |||||||||||
| Royce International Micro-Cap Fund | ||||||||||||||||
| Common Stocks | 10,717 | 5,037 | (3,496 | ) | 2,184 | |||||||||||
| 1 | The net change in unrealized appreciation (depreciation) is included in the accompanying Statement of Operations. Change in unrealized appreciation (depreciation) includes net unrealized appreciation (depreciation) resulting from changes in investment values during the reporting period and the reversal of previously recorded unrealized appreciation (depreciation) when gains or losses are realized. Net realized gain (loss) from investments and foreign currency transactions is included in the accompanying Statement of Operations. |
Repurchase Agreements:
The Funds may enter into repurchase agreements with institutions that the Funds’ investment adviser has determined are creditworthy. Each Fund restricts repurchase agreements to maturities of no more than seven days. Securities pledged as collateral for repurchase agreements, which are held until maturity of the repurchase agreements, are marked-to-market daily and maintained at a value at least equal to the principal amount of the repurchase agreement (including accrued interest). Repurchase agreements could involve certain risks in the event of default or insolvency of the counter-party, including possible delays or restrictions upon the ability of each Fund to dispose of its underlying securities.
Foreign Currency:
Net realized foreign exchange gains or losses arise from sales and maturities of short-term securities, sales of foreign currencies, expiration of currency forward contracts, currency gains or losses realized between the trade and settlement dates on securities transactions, and the difference between the amounts of dividends, interest, and foreign withholding taxes recorded on each Fund’s books and the U.S. dollar equivalent of the amounts actually received or paid. Net unrealized foreign exchange gains and losses arise from changes in the value of assets and liabilities, including investments in securities at the end of the reporting period, as a result of changes in foreign currency exchange rates.
Short Sales:
The Funds may sell securities they do not own in anticipation of a decline in the fair value of that security. When a Fund sells a security short, it must borrow the security sold short and deliver it to the broker-dealer through which it made the short sale. A gain, limited to the price at which the Fund sold the security short, or a loss, unlimited in size, will be recognized upon the termination of a short sale. On ex-dividend date, dividends on short sales are recorded as an expense to the Fund.
Securities Lending:
The Funds loan securities through a lending agent to qualified institutional investors for the purpose of realizing additional income. Collateral for the Funds on all securities loaned is accepted in cash and cash equivalents and invested temporarily by the custodian. The collateral maintained is at least 100% of the current market value of the loaned securities. The market value of the loaned securities is determined at the close of business of the Funds and any additional required collateral is delivered to the Funds on the next business day. The Funds retain the risk of any loss on the securities on loan as well as incurring the potential loss on investments purchased with cash collateral received for securities lending. The Funds’ securities lending income consists of the income earned on investing cash collateral, plus any premium payments received for lending certain securities, less any rebates paid to borrowers and lending agent fees associated with the loan. The lending agent is not affiliated with Royce.
Distributions and Taxes:
As qualified regulated investment companies under Subchapter M of the Internal Revenue Code, the Funds are not subject to income taxes to the extent that each Fund distributes substantially all of its taxable income for its fiscal year.
Royce Global Dividend Value Fund pays any dividends from net investment income quarterly and makes any distributions from net realized gains annually in December. The other Funds pay any dividends and capital gain distributions annually in December. Dividends from net investment income are determined at a class level and distributions from capital gains are determined at a Fund level. Because federal income tax regulations differ from generally accepted accounting principles, income and capital gain distributions determined in accordance with tax regulations may differ from net investment income and realized gains recognized for financial reporting purposes. Accordingly, the character of distributions and composition of net assets for tax purposes differ from those reflected in the accompanying financial statements.
Investment Transactions and Related Investment Income:
Investment transactions are accounted for on the trade date. Dividend income is recorded on the ex-dividend date. Non-cash dividend income is recorded at the fair market value of the securities received. Interest income is recorded on an accrual basis. Premium and discounts on debt securities are amortized using the effective yield-to-maturity method. Realized gains and losses from investment transactions are determined on the basis of identified cost for book and tax purposes.
| The Royce Funds 2012 Annual Report to Shareholders | 89 |
| Notes to Financial Statements (continued) | |
Expenses:
The Funds incur direct and indirect expenses. Expenses directly attributable to a Fund are charged to the Fund’s operations, while expenses applicable to more than one of the Royce Funds are allocated equitably. Certain personnel, occupancy costs and other administrative expenses related to the Royce Funds are allocated by Royce under an administration agreement and are included in administrative and office facilities and legal expenses. The Fund has adopted a deferred fee agreement that allows the Trustees to defer the receipt of all or a portion of trustees’ fees otherwise payable. The deferred fees are invested in certain Royce Funds until distributed in accordance with the agreement.
Compensating Balance Credits:
The Funds have arrangements with their custodian bank and transfer agent, whereby a portion of the custodian’s fee and transfer agent’s fee is paid indirectly by credits earned on a Fund’s cash on deposit with the bank and transfer agent. These deposit arrangements are an alternative to purchasing overnight investments. Conversely, a Fund pays interest to the custodian on any cash overdrafts, to the extent they are not offset by credits earned on positive cash balances.
Line of Credit:
The Funds, along with certain other Royce Funds, participate in a $75 million line of credit (“Credit Agreement”) to be used for temporary or emergency purposes. This 364-day revolving Credit Agreement expires on July 12, 2013. Pursuant to the Credit Agreement, each participating Fund is liable only for principal and interest payments related to borrowings made by that Fund. Borrowings under the Credit Agreement bear interest at a rate equal to the higher of the federal funds rate + 1.25% or overnight LIBOR + 1.25%. The Funds did not utilize the line of credit during the year ended December 31, 2012.
Capital Share Transactions (in dollars):
| Shares issued for | Net increase (decrease) from | |||||||||||||||||||||||||||||||
| Shares sold | reinvestment of distributions | Shares redeemed | capital share transactions | |||||||||||||||||||||||||||||
| Period ended | Period ended | Period ended | Period ended | Period ended | Period ended | Period ended | Period ended | |||||||||||||||||||||||||
| 12/31/12 | 12/31/11 | 12/31/12 | 12/31/11 | 12/31/12 | 12/31/11 | 12/31/12 | 12/31/11 | |||||||||||||||||||||||||
| Royce Select Fund I | ||||||||||||||||||||||||||||||||
Investment Class | $ | 5,074,208 | $ | 3,885,367 | $ | 4,672,287 | $ | 6,201,698 | $ | (8,680,161 | ) | $ | (12,849,352 | ) | $ | 1,066,334 | $ | (2,762,287 | ) | |||||||||||||
| Royce Micro-Cap Discovery Fund | ||||||||||||||||||||||||||||||||
Service Class | 1,050,076 | 1,374,528 | 37,994 | 1,803 | (361,057 | ) | (1,281,347 | ) | 727,013 | 94,984 | ||||||||||||||||||||||
| Royce Financial Services Fund | ||||||||||||||||||||||||||||||||
Service Class | 4,612,568 | 7,530,782 | 149,100 | 136,589 | (4,633,991 | ) | (5,769,658 | ) | 127,677 | 1,897,713 | ||||||||||||||||||||||
| Royce Select Fund II | ||||||||||||||||||||||||||||||||
Investment Class | 6,284 | 367,444 | 215,961 | 553,183 | (284,132 | ) | (1,463,114 | ) | (61,887 | ) | (542,487 | ) | ||||||||||||||||||||
| Royce Global Select Long/Short Fund | ||||||||||||||||||||||||||||||||
Investment Class | 748,210 | 15,162,769 | 574,715 | 1,300,066 | (5,166,943 | ) | (3,750,110 | ) | (3,844,018 | ) | 12,712,725 | |||||||||||||||||||||
| Royce European Smaller-Companies Fund | ||||||||||||||||||||||||||||||||
Service Class | 3,702,876 | 13,766,916 | 219,038 | 184,460 | (7,085,115 | ) | (8,199,685 | ) | (3,163,201 | ) | 5,751,691 | |||||||||||||||||||||
| Royce Enterprise Select Fund | ||||||||||||||||||||||||||||||||
Investment Class | – | 70,238 | 119,819 | 63,941 | (590 | ) | (111,341 | ) | 119,229 | 22,838 | ||||||||||||||||||||||
| Royce SMid-Cap Value Fund | ||||||||||||||||||||||||||||||||
Service Class | 4,410,001 | 10,808,481 | – | 15,542 | (5,023,302 | ) | (4,628,928 | ) | (613,301 | ) | 6,195,095 | |||||||||||||||||||||
| Royce Focus Value Fund | ||||||||||||||||||||||||||||||||
Service Class | 701,475 | 1,859,177 | 157,460 | 333,049 | (1,353,002 | ) | (704,625 | ) | (494,067 | ) | 1,487,601 | |||||||||||||||||||||
| Royce Partners Fund | ||||||||||||||||||||||||||||||||
Service Class | 128,126 | 263,745 | 76,833 | 177,889 | (78,236 | ) | (135,008 | ) | 126,723 | 306,626 | ||||||||||||||||||||||
| Royce Opportunity Select Fund | ||||||||||||||||||||||||||||||||
Investment Class | 352,527 | 780,224 | 227,344 | 80,562 | (9,132 | ) | (148,016 | ) | 570,739 | 712,770 | ||||||||||||||||||||||
| Royce Global Dividend Value Fund | ||||||||||||||||||||||||||||||||
Service Class | 1,477,197 | 8,402,077 | 109,376 | 55,187 | (2,157,716 | ) | (997,874 | ) | (571,143 | ) | 7,459,390 | |||||||||||||||||||||
| Royce International Micro-Cap Fund | ||||||||||||||||||||||||||||||||
Service Class | 1,435,544 | 8,027,605 | 78,472 | 65,597 | (905,693 | ) | (2,827,810 | ) | 608,323 | 5,265,392 | ||||||||||||||||||||||
| Royce International Premier Fund | ||||||||||||||||||||||||||||||||
Service Class | 2,793,388 | 5,928,422 | 76,745 | 33,706 | (1,375,047 | ) | (797,046 | ) | 1,495,086 | 5,165,082 | ||||||||||||||||||||||
| Royce Special Equity Multi-Cap Fund | ||||||||||||||||||||||||||||||||
Investment Class | 36,724,835 | 653,344 | (2,544,262 | ) | 34,833,917 | |||||||||||||||||||||||||||
Service Class | 34,106,088 | 37,414,885 | 705,194 | 233,120 | (32,520,070 | ) | (1,569,518 | ) | 2,291,212 | 36,078,487 | ||||||||||||||||||||||
Institutional Class | 30,548,000 | 674,111 | (3,182 | ) | 31,218,929 | |||||||||||||||||||||||||||
| 90 | The Royce Funds 2012 Annual Report to Shareholders |
| Capital Share Transactions (in shares): |
| Shares issued for | Net increase (decrease) in | |||||||||||||||||||||||||||||||
| Shares sold | reinvestment of distributions | Shares redeemed | shares outstanding | |||||||||||||||||||||||||||||
| Period ended | Period ended | Period ended | Period ended | Period ended | Period ended | Period ended | Period ended | |||||||||||||||||||||||||
| 12/31/12 | 12/31/11 | 12/31/12 | 12/31/11 | 12/31/12 | 12/31/11 | 12/31/12 | 12/31/11 | |||||||||||||||||||||||||
| Royce Select Fund I | ||||||||||||||||||||||||||||||||
Investment Class | 280,124 | 187,707 | 276,467 | 379,773 | (488,288 | ) | (663,214 | ) | 68,303 | (95,734 | ) | |||||||||||||||||||||
| Royce Micro-Cap Discovery Fund | ||||||||||||||||||||||||||||||||
Service Class | 210,468 | 255,798 | 7,462 | 361 | (70,120 | ) | (243,232 | ) | 147,810 | 12,927 | ||||||||||||||||||||||
| Royce Financial Services Fund | ||||||||||||||||||||||||||||||||
Service Class | 713,267 | 1,139,664 | 22,252 | 24,005 | (729,615 | ) | (955,674 | ) | 5,904 | 207,995 | ||||||||||||||||||||||
| Royce Select Fund II | ||||||||||||||||||||||||||||||||
Investment Class | 593 | 27,667 | 20,866 | 57,265 | (26,289 | ) | (111,010 | ) | (4,830 | ) | (26,078 | ) | ||||||||||||||||||||
| Royce Global Select Long/Short Fund | ||||||||||||||||||||||||||||||||
Investment Class | 44,803 | 764,053 | 33,886 | 86,729 | (312,018 | ) | (209,902 | ) | (233,329 | ) | 640,880 | |||||||||||||||||||||
| Royce European Smaller-Companies Fund | ||||||||||||||||||||||||||||||||
Service Class | 388,293 | 1,255,164 | 21,926 | 21,524 | (752,653 | ) | (828,541 | ) | (342,434 | ) | 448,147 | |||||||||||||||||||||
| Royce Enterprise Select Fund | ||||||||||||||||||||||||||||||||
Investment Class | – | 6,232 | 11,724 | 6,702 | (59 | ) | (10,332 | ) | 11,665 | 2,602 | ||||||||||||||||||||||
| Royce SMid-Cap Value Fund | ||||||||||||||||||||||||||||||||
Service Class | 390,512 | 904,031 | – | 1,519 | (457,720 | ) | (424,769 | ) | (67,208 | ) | 480,781 | |||||||||||||||||||||
| Royce Focus Value Fund | ||||||||||||||||||||||||||||||||
Service Class | 48,418 | 116,985 | 10,988 | 23,960 | (91,922 | ) | (45,252 | ) | (32,516 | ) | 95,693 | |||||||||||||||||||||
| Royce Partners Fund | ||||||||||||||||||||||||||||||||
Service Class | 11,070 | 20,712 | 6,589 | 17,389 | (6,930 | ) | (10,504 | ) | 10,729 | 27,597 | ||||||||||||||||||||||
| Royce Opportunity Select Fund | ||||||||||||||||||||||||||||||||
Investment Class | 28,178 | 59,479 | 18,773 | 8,187 | (754 | ) | (11,464 | ) | 46,197 | 56,202 | ||||||||||||||||||||||
| Royce Global Dividend Value Fund | ||||||||||||||||||||||||||||||||
Service Class | 156,760 | 838,658 | 11,645 | 6,354 | (235,478 | ) | (113,895 | ) | (67,073 | ) | 731,117 | |||||||||||||||||||||
| Royce International Micro-Cap Fund | ||||||||||||||||||||||||||||||||
Service Class | 170,805 | 799,332 | 9,342 | 8,378 | (108,278 | ) | (344,791 | ) | 71,869 | 462,919 | ||||||||||||||||||||||
| Royce International Premier Fund | ||||||||||||||||||||||||||||||||
Service Class | 291,121 | 583,848 | 7,855 | 4,017 | (150,814 | ) | (92,567 | ) | 148,162 | 495,298 | ||||||||||||||||||||||
| Royce Special Equity Multi-Cap Fund | ||||||||||||||||||||||||||||||||
Investment Class | 3,113,219 | 56,659 | (216,520 | ) | 2,953,358 | |||||||||||||||||||||||||||
Service Class | 2,986,622 | 3,594,359 | 61,008 | 22,013 | (2,765,871 | ) | (157,093 | ) | 281,759 | 3,459,279 | ||||||||||||||||||||||
Institutional Class | 2,597,051 | 58,422 | (268 | ) | 2,655,205 | |||||||||||||||||||||||||||
| The Royce Funds 2012 Annual Report to Shareholders | 91 |
| Notes to Financial Statements (continued) |
Investment Adviser and Distributor:
Investment Adviser: Under the Trust’s investment advisory agreements with Royce, Royce is entitled to receive Investment Advisory fees that are computed daily and payable monthly. Royce’s commitment to waive its fees and reimburse class-specific expenses to the extent necessary to maintain certain Funds’ net annual operating expense ratios at specified levels through April 30, 2013, is shown below to the extent that it impacted net expenses for the period ended December 31, 2012. See the Prospectus for contractual waiver expiration dates.
Effective September 28, 2012, Royce Select Fund I, Royce Select Fund II, Royce Global Select Long/Short Fund, Royce Enterprise Select Fund and Royce Opportunity Select Fund have a traditional management fee structure consistent with the other series of The Royce Fund. Previously, for its services and for paying certain other ordinary expenses, Royce received from each Fund a performance fee of 12.5% of each Fund’s pre-fee total return, subject to a high watermark test. Royce will waive its compensation for services provided by it under the new agreement until a respective Fund’s pre-fee cumulative return exceeds its pre-fee total return as of the day on which a fee was last accrued under its former Investment Advisory Agreement, and agrees to reimburse certain ordinary operating expenses as well. Royce Enterprise Select Fund and Royce Opportunity Select Fund reached their high watermarks on December 11, 2012 and December 18, 2012, respectively. For the period ended December 31, 2012, Royce Enterprise Select Fund accrued $9,027 in performance fees. All other funds did not accrue a performance fee.
| Annual contractual | Committed net annual | Period ended | ||||||||||||||||||||||
| advisory fee as a | operating expense ratio cap | December 31, 20123 | ||||||||||||||||||||||
| percentage of | Investment | Service | Institutional | Net advisory | Advisory | |||||||||||||||||||
| average net assets1 | Class2 | Class2 | Class2 | fees | fees waived | |||||||||||||||||||
| Royce Select Fund I | 1.00 | % | 1.24 | % | N/A | N/A | $ | – | $ | – | ||||||||||||||
| Royce Micro-Cap Discovery Fund | 1.00 | % | N/A | 1.49 | % | N/A | – | 40,704 | ||||||||||||||||
| Royce Financial Services Fund | 1.00 | % | N/A | 1.49 | % | N/A | 98,278 | 59,875 | ||||||||||||||||
| Royce Select Fund II | 1.25 | % | 1.49 | % | N/A | N/A | – | – | ||||||||||||||||
| Royce Global Select Long/Short Fund | 1.25 | % | 1.49 | % | N/A | N/A | – | – | ||||||||||||||||
| Royce European Smaller-Companies Fund | 1.25 | % | N/A | 1.69 | % | N/A | 125,570 | 69,160 | ||||||||||||||||
| Royce Enterprise Select Fund | 1.00 | % | 1.24 | % | N/A | N/A | 9,027 | 701 | ||||||||||||||||
| Royce SMid-Cap Value Fund | 1.00 | % | N/A | 1.35 | % | N/A | 48,954 | 60,754 | ||||||||||||||||
| Royce Focus Value Fund | 1.00 | % | N/A | 1.35 | % | N/A | 26,874 | 62,935 | ||||||||||||||||
| Royce Partners Fund | 1.00 | % | N/A | 1.35 | % | N/A | – | 19,070 | ||||||||||||||||
| Royce Opportunity Select Fund | 1.00 | % | 1.24 | % | N/A | N/A | 29 | 1,056 | ||||||||||||||||
| Royce Global Dividend Value Fund | 1.25 | % | N/A | 1.69 | % | N/A | 5,062 | 75,284 | ||||||||||||||||
| Royce International Micro-Cap Fund | 1.30 | % | N/A | 1.69 | % | N/A | – | 54,549 | ||||||||||||||||
| Royce International Premier Fund | 1.25 | % | N/A | 1.69 | % | N/A | – | 52,466 | ||||||||||||||||
| Royce Special Equity Multi-Cap Fund | 1.00 | % | N/A | 1.39 | % | 1.04 | % | 786,233 | 26,071 | |||||||||||||||
| 1 | From a base annual rate of 1.00% (1.25% for Royce Select Fund II, Royce Global Select Long/Short Fund, Royce European Smaller-Companies Fund, Royce Global Dividend Value Fund and Royce International Premier Fund; 1.30% for Royce International Micro-Cap Fund), the annual rates of investment advisory fees payable by each of the Funds are reduced by the indicated amount at the following breakpoints applicable to a Fund's net assets in excess of $2 billion: more than $2 billion to $4 billion - .05% per annum; more than $4 billion to $6 billion - .10% per annum; over $6 billion - .15% per annum. |
| 2 | Committed net annual operating expense ratio cap excludes acquired fund fees and expenses. |
| 3 | Includes performance fees for Royce Enterprise Select Fund. |
Distributor: Royce Fund Services, Inc. (“RFS”), the distributor of the Trust’s shares, is a wholly owned subsidiary of Royce. RFS is entitled to receive distribution fees that are computed daily and payable monthly.
| Period ended December 31, 2012 | ||||||||||||
| Annual contractual distribution fee as | Net distribution | Distribution fees | ||||||||||
| a percentage of average net assets | fees | waived | ||||||||||
| Royce Micro-Cap Discovery Fund – Service Class | 0.25 | % | $ | 10,176 | $ | – | ||||||
| Royce Financial Services Fund – Service Class | 0.25 | % | 39,538 | – | ||||||||
| Royce European Smaller-Companies Fund – Service Class | 0.25 | % | 38,946 | – | ||||||||
| Royce SMid-Cap Value Fund – Service Class | 0.25 | % | 27,427 | – | ||||||||
| Royce Focus Value Fund – Service Class | 0.25 | % | 22,452 | – | ||||||||
| Royce Partners Fund – Service Class | 0.25 | % | 4,768 | – | ||||||||
| Royce Global Dividend Value Fund – Service Class | 0.25 | % | 16,069 | – | ||||||||
| Royce International Micro-Cap Fund – Service Class | 0.25 | % | 10,070 | 420 | ||||||||
| Royce International Premier Fund – Service Class | 0.25 | % | 9,234 | 1,259 | ||||||||
| Royce Special Equity Multi-Cap Fund – Service Class | 0.25 | % | 90,330 | 17,205 | ||||||||
| 92 | The Royce Funds 2012 Annual Report to Shareholders |
Purchases and Sales of Investment Securities:
For the period ended December 31, 2012, the costs of purchases and the proceeds from sales of investment securities, other than short-term securities, were as follows:
| Short | Purchases to | |||||||||||||||
| Purchases | Sales | Sales | Cover Short Sales | |||||||||||||
| Royce Select Fund I | $ | 23,493,669 | $ | 25,759,167 | $ | – | $ | – | ||||||||
| Royce Micro-Cap Discovery Fund | 4,051,986 | 3,306,435 | – | – | ||||||||||||
| Royce Financial Services Fund | 4,062,792 | 4,398,163 | – | – | ||||||||||||
| Royce Select Fund II | 3,405,802 | 3,735,373 | 596,040 | 548,342 | ||||||||||||
| Royce Global Select Long/Short Fund | 10,157,605 | 17,102,145 | 7,592,187 | 3,793,536 | ||||||||||||
| Royce European Smaller-Companies Fund | 3,208,209 | 6,806,476 | – | – | ||||||||||||
| Royce Enterprise Select Fund | 1,232,773 | 1,227,525 | – | – | ||||||||||||
| Royce SMid-Cap Value Fund | 4,579,264 | 5,819,220 | – | – | ||||||||||||
| Royce Focus Value Fund | 1,831,625 | 2,263,756 | – | – | ||||||||||||
| Royce Partners Fund | 665,175 | 577,949 | – | – | ||||||||||||
| Royce Opportunity Select Fund | 2,574,691 | 2,536,152 | 1,829,896 | 1,723,893 | ||||||||||||
| Royce Global Dividend Value Fund | 2,258,104 | 2,820,293 | – | – | ||||||||||||
| Royce International Micro-Cap Fund | 2,792,536 | 2,436,328 | – | – | ||||||||||||
| Royce International Premier Fund | 5,297,849 | 4,087,319 | – | – | ||||||||||||
| Royce Special Equity Multi-Cap Fund | 73,862,028 | 10,722,527 | – | – | ||||||||||||
Class Specific Expenses:
Class specific expenses, for Funds with multiple classes, were as follows for the period ended December 31, 2012:
| Class Level | ||||||||||||||||||||||||||||
| Transfer | Expenses | |||||||||||||||||||||||||||
| Net | Agent | Reimbursed by | ||||||||||||||||||||||||||
| Distribution | Shareholder | Shareholder | Balance | Investment | ||||||||||||||||||||||||
| Fees | Servicing | Reports | Registration | Credits | Total | Adviser | ||||||||||||||||||||||
| Royce Special Equity Multi-Cap Fund – | ||||||||||||||||||||||||||||
Investment Class | $ | – | $ | 8,577 | $ | 1,412 | $ | 16,458 | $ | (2 | ) | $ | 26,445 | $ | – | |||||||||||||
| Royce Special Equity Multi-Cap Fund – | ||||||||||||||||||||||||||||
Service Class | 90,330 | 44,652 | 10,999 | 15,271 | (27 | ) | 161,225 | 33,989 | ||||||||||||||||||||
| Royce Special Equity Multi-Cap Fund – | ||||||||||||||||||||||||||||
Institutional Class | – | 5,960 | 33 | 15,333 | – | 21,326 | 21,325 | |||||||||||||||||||||
| 90,330 | 59,189 | 12,444 | 47,062 | (29 | ) | 55,314 | ||||||||||||||||||||||
Tax Information:
At December 31, 2012, net unrealized appreciation (depreciation) based on identified cost for tax purposes was as follows:
| Net Unrealized | ||||||||||||||||
| Appreciation | Gross Unrealized | |||||||||||||||
| Tax Basis Cost | (Depreciation) | Appreciation | Depreciation | |||||||||||||
| Royce Select Fund I | $ | 42,475,523 | $ | 7,450,598 | $ | 8,548,980 | $ | 1,098,382 | ||||||||
| Royce Micro-Cap Discovery Fund | 4,298,705 | 182,907 | 407,087 | 224,180 | ||||||||||||
| Royce Financial Services Fund | 15,059,821 | 1,562,757 | 3,184,247 | 1,621,490 | ||||||||||||
| Royce Select Fund II | 3,340,734 | 292,830 | 464,542 | 171,712 | ||||||||||||
| Royce Global Select Long/Short Fund | 15,417,359 | 691,359 | 3,063,525 | 2,372,166 | ||||||||||||
| Royce European Smaller-Companies Fund | 15,190,444 | 570,745 | 2,249,824 | 1,679,079 | ||||||||||||
| Royce Enterprise Select Fund | 1,190,879 | 109,936 | 120,239 | 10,303 | ||||||||||||
| Royce SMid-Cap Value Fund | 10,949,121 | 234,767 | 1,046,328 | 811,561 | ||||||||||||
| Royce Focus Value Fund | 7,775,686 | 1,121,020 | 1,554,169 | 433,149 | ||||||||||||
| Royce Partners Fund | 1,928,155 | 264,588 | 337,371 | 72,783 | ||||||||||||
| Royce Opportunity Select Fund | 2,488,842 | 401,654 | 543,637 | 141,983 | ||||||||||||
| Royce Global Dividend Value Fund | 6,816,303 | (65,471 | ) | 687,400 | 752,871 | |||||||||||
| Royce International Micro-Cap Fund | 5,030,621 | (314,730 | ) | 355,004 | 669,734 | |||||||||||
| Royce International Premier Fund | 6,122,609 | 286,245 | 438,159 | 151,914 | ||||||||||||
| Royce Special Equity Multi-Cap Fund | 107,847,826 | 3,539,001 | 6,592,490 | 3,053,489 | ||||||||||||
The primary difference between book and tax basis cost is the timing of the recognition of losses on securities sold, dividends accrued from Real Estate Investment Trusts, investments in publicly traded partnerships and mark-to-market of Passive Foreign Investment Companies.
| The Royce Funds 2012 Annual Report to Shareholders | 93 |
| Notes to Financial Statements (continued) |
Tax Information (continued):
Distributions during the periods ended December 31, 2012 and 2011, were characterized as follows for tax purposes:
| Ordinary Income | Long-Term Capital Gains | Return of Capital | ||||||||||||||||||||||
| 2012 | 2011 | 2012 | 2011 | 2012 | 2011 | |||||||||||||||||||
| Royce Select Fund I | $ | 1,075,598 | $ | – | $ | 3,765,809 | $ | 6,464,732 | $ | – | $ | – | ||||||||||||
| Royce Micro-Cap Discovery Fund | 40,240 | 1,952 | – | – | – | – | ||||||||||||||||||
| Royce Financial Services Fund | 153,360 | 139,894 | – | – | – | – | ||||||||||||||||||
| Royce Select Fund II | 165,593 | 18,504 | 50,409 | 534,679 | – | – | ||||||||||||||||||
| Royce Global Select Long/Short Fund | 610,348 | 466,147 | – | 881,177 | – | – | ||||||||||||||||||
| Royce European Smaller-Companies Fund | 225,920 | 191,729 | – | – | – | – | ||||||||||||||||||
| Royce Enterprise Select Fund | 60,711 | 38,837 | 59,108 | 25,104 | – | – | ||||||||||||||||||
| Royce SMid-Cap Value Fund | – | 16,431 | – | – | – | – | ||||||||||||||||||
| Royce Focus Value Fund | 156,029 | 1,657 | 1,618 | 331,392 | – | – | ||||||||||||||||||
| Royce Partners Fund | 41,598 | 94,281 | 35,844 | 83,848 | – | – | ||||||||||||||||||
| Royce Opportunity Select Fund | 203,478 | 80,562 | 29,102 | – | – | – | ||||||||||||||||||
| Royce Global Dividend Value Fund | 109,924 | 55,267 | – | – | – | – | ||||||||||||||||||
| Royce International Micro-Cap Fund | 79,547 | 63,419 | – | – | – | 3,157 | ||||||||||||||||||
| Royce International Premier Fund | 76,745 | 29,268 | – | – | – | 4,438 | ||||||||||||||||||
| Royce Special Equity Multi-Cap Fund | 1,157,045 | 235,969 | 890,864 | – | – | – | ||||||||||||||||||
The tax basis components of distributable earnings at December 31, 2012, were as follows:
| Qualified | |||||||||||||||||||||||||||
| Late Year | |||||||||||||||||||||||||||
| Undistributed | Ordinary | ||||||||||||||||||||||||||
| Long-Term | and | ||||||||||||||||||||||||||
| Undistributed | Capital Gains or | Capital Loss | Net Unrealized | Post-October | Total | Capital Loss | |||||||||||||||||||||
| Ordinary | (Capital Loss | Carryforward | Appreciation | Loss | Distributable | Carryforward | |||||||||||||||||||||
| Income | Carryforward) | to 12/31/171 | (Depreciation)2 | Deferrals3 | Earnings | Utilized | |||||||||||||||||||||
Royce Select Fund I | $ | 6,423 | $ | 16,004 | $ | – | $ | 7,450,493 | $ | (107 | ) | $ | 7,472,813 | $ | – | ||||||||||||
| Royce Micro-Cap Discovery Fund | – | – | (280,364 | ) | 182,909 | (146,641 | ) | (244,096 | ) | 88,021 | |||||||||||||||||
| Royce Financial Services Fund | 91,558 | – | (473,820 | ) | 1,328,582 | (114,275 | ) | 832,045 | 732,189 | ||||||||||||||||||
| Royce Select Fund II | 19,514 | – | – | 292,830 | (4,129 | ) | 308,215 | – | |||||||||||||||||||
| Royce Global Select Long/Short | |||||||||||||||||||||||||||
Fund | – | (1,216,724 | ) | – | 689,939 | (101,218 | ) | (628,003 | ) | – | |||||||||||||||||
| Royce European Smaller- | |||||||||||||||||||||||||||
Companies Fund | 12,717 | (659,614 | ) | (1,854,110 | ) | 570,348 | (51,284 | ) | (1,981,943 | ) | – | ||||||||||||||||
| Royce Enterprise Select Fund | 5,058 | 15 | – | 109,934 | – | 115,007 | – | ||||||||||||||||||||
| Royce SMid-Cap Value Fund | – | (268,750 | ) | (5,664,728 | ) | 234,644 | (8,754 | ) | (5,707,588 | ) | – | ||||||||||||||||
| Royce Focus Value Fund | 3,453 | (123,732 | ) | – | 1,120,993 | (63,050 | ) | 937,664 | – | ||||||||||||||||||
| Royce Partners Fund | 8,220 | – | – | 264,586 | (6,982 | ) | 265,824 | – | |||||||||||||||||||
| Royce Opportunity Select Fund | 11,425 | – | – | 401,655 | (1,590 | ) | 411,490 | – | |||||||||||||||||||
| Royce Global Dividend Value Fund | 7,107 | (127,865 | ) | – | (65,246 | ) | – | (186,004 | ) | – | |||||||||||||||||
| Royce International Micro-Cap | |||||||||||||||||||||||||||
Fund | – | (946,163 | ) | – | (314,594 | ) | (6,535 | ) | (1,267,292 | ) | – | ||||||||||||||||
| Royce International Premier Fund | 68 | (453,519 | ) | – | 286,254 | (48,431 | ) | (215,628 | ) | – | |||||||||||||||||
| Royce Special Equity Multi-Cap | |||||||||||||||||||||||||||
Fund | 260,805 | 724,042 | – | 3,539,002 | – | 4,523,849 | – | ||||||||||||||||||||
| 1 | For Royce Micro-Cap Discovery Fund, this amount represents $276,611 expiring 12/31/17 and $3,753 expiring 12/31/18. For Royce European Smaller-Companies Fund, this amount represents $316,206 expiring 12/31/16 and $1,537,904 expiring 12/31/17. For Royce SMid-Cap Value Fund, this amount represents $1,794,610 expiring 12/31/16 and $3,870,118 expiring 12/31/17. On December 22, 2010, the Regulated Investment Company Modernization Act of 2010 (the “Act”) was enacted. Under the Act, net capital losses may be carried forward indefinitely, and their character is retained as short term and/or long-term losses. Previously, net capital losses were carried forward for eight years and treated as short term losses. As a transition rule, the Act requires that postenactment net capital losses be used before pre-enactment net capital losses. As a result of this ordering rule, pre-enactment capital loss carryforwards may expire unused, whereas under the previous rules these losses may have been utilized. This change is effective for fiscal years beginning after the date of enactment. |
| 2 | Includes timing differences on foreign currency, recognition of losses on securities sold, mark-to-market of Passive Foreign Investment Companies and investments in Real Estate Investment Trusts and publicly traded partnerships. |
| 3 | Under the current tax law, capital losses and qualified late year ordinary losses incurred after October 31 may be deferred and treated as occurring on the first day of the following fiscal year. |
| 94 | The Royce Funds 2012 Annual Report to Shareholders |
Tax Information (continued):
For financial reporting purposes, capital accounts and distributions to shareholders are adjusted to reflect the tax character of permanent book/tax differences. For the period ended December 31, 2012, the Funds recorded the following permanent reclassifications, which relate primarily to current net operating losses, distribution reclassifications, Real Estate Investment Trusts, publicly traded partnerships, foreign currency transactions and gains from the sale of Passive Foreign Investment Companies. Results of operations and net assets were not affected by these reclassifications.
| Undistributed | Accumulated | ||||||||||||
| Net Investment | Net Realized | Paid–in | |||||||||||
| Income (Loss) | Gain (Loss) | Capital | |||||||||||
| Royce Select Fund I | $ | (16,905 | ) | $ | 16,984 | $ | (79 | ) | |||||
| Royce Micro-Cap Discovery Fund | 5,519 | (1,694 | ) | (3,825 | ) | ||||||||
| Royce Financial Services Fund | 72,908 | (72,908 | ) | – | |||||||||
| Royce Select Fund II | (874 | ) | 878 | (4 | ) | ||||||||
| Royce Global Select Long/Short Fund | 32,937 | (2,108 | ) | (30,829 | ) | ||||||||
| Royce European Smaller-Companies | |||||||||||||
Fund | 2,308 | (2,308 | ) | – | |||||||||
| Royce Enterprise Select Fund | 5 | (5 | ) | – | |||||||||
| Royce SMid-Cap Value Fund | 6,012 | 772 | (6,784 | ) | |||||||||
| Royce Focus Value Fund | 63,428 | (63,428 | ) | – | |||||||||
| Royce Partners Fund | (89 | ) | 804 | (715 | ) | ||||||||
| Royce Opportunity Select Fund | 10,015 | (10,015 | ) | – | |||||||||
| Royce Global Dividend Value Fund | (2,915 | ) | 3,384 | (469 | ) | ||||||||
| Royce International Micro-Cap Fund | 6,445 | (2,718 | ) | (3,727 | ) | ||||||||
| Royce International Premier Fund | 3,723 | (3,723 | ) | – | |||||||||
| Royce Special Equity Multi-Cap Fund | – | – | – | ||||||||||
Management has analyzed the Funds’ tax positions taken on federal income tax returns for all open tax years (2009 – 2012) and has concluded that as of December 31, 2012, no provision for income tax is required in the Funds’ financial statements.
| Report of Independent Registered Public Accounting Firm |
To the Board of Trustees of The Royce Fund and the Shareholders of
Royce Select Fund I, Royce Micro-Cap Discovery Fund, Royce Financial Services Fund, Royce Select Fund II, Royce Global Select Long/Short Fund, Royce European Smaller-Companies Fund, Royce Enterprise Select Fund, Royce SMid-Cap Value Fund, Royce Focus Value Fund, Royce Partners Fund, Royce Opportunity Select Fund, Royce Global Dividend Value Fund, Royce International Micro-Cap Fund, Royce International Premier Fund and Royce Special Equity Multi-Cap Fund.
In our opinion, the accompanying statements of assets and liabilities, including the schedules of investments, and the related statements of operations and of changes in net assets and the financial highlights present fairly, in all material respects, the financial position of Royce Select Fund I, Royce Micro-Cap Discovery Fund, Royce Financial Services Fund, Royce Select Fund II, Royce Global Select Long/Short Fund, Royce European Smaller-Companies Fund, Royce Enterprise Select Fund, Royce SMid-Cap Value Fund, Royce Focus Value Fund, Royce Partners Fund, Royce Opportunity Select Fund, Royce Global Dividend Value Fund, Royce International Micro-Cap Fund, Royce International Premier Fund and Royce Special Equity Multi-Cap Fund (constituting The Royce Fund, hereafter referred to as the “Funds”) at December 31, 2012, the results of their operations for the year then ended, the changes in their net assets, and their financial highlights for each of the fiscal periods presented, in conformity with accounting principles generally accepted in the United States of America. These financial statements and financial highlights (hereafter referred to as “financial statements”) are the responsibility of the Funds’ management; our responsibility is to express an opinion on these financial statements based on our audits. We conducted our audits of these financial statements in accordance with the standards of the Public Company Accounting Oversight Board (United States). Those standards require that we plan and perform the audits to obtain reasonable assurance about whether the financial statements are free of material misstatement. An audit includes examining, on a test basis, evidence supporting the amounts and disclosures in the financial statements, assessing the accounting principles used and significant estimates made by management, and evaluating the overall financial statement presentation. We believe that our audits, which included confirmation of securities at December 31, 2012, by correspondence with the custodian and brokers, provide a reasonable basis for our opinion.
| PricewaterhouseCoopers LLP |
| Baltimore, Maryland |
| February 22, 2013 |
| The Royce Funds 2012 Annual Report to Shareholders | 95 |
| Understanding Your Fund’s Expenses (unaudited) |
As a shareholder of a mutual fund, you pay ongoing expenses, including management fees and other Fund expenses including, for some funds, distribution and/or service (12b-1) fees. Using the information below, you can estimate how these ongoing expenses (in dollars) affect your investment and compare them with the ongoing expenses of other funds. You may also incur one-time transaction expenses, including redemption fees, which are not shown in this section and would result in higher total costs. The example is based on an investment of $1,000 invested at July 1, 2012, and held for the entire six-month period ended December 31, 2012. Service Class shares are generally available only through certain brokers or retirement plan administrators who receive distribution and/or service fees from the Fund for services that they perform. Institutional Class shares are generally available only to institutions or intermediaries with a minimum account size of $1 million.
Actual Expenses
The first part of the table below provides information about actual account values and actual expenses. You may use the information in this section, together with the amount you invested, to estimate the expenses that you paid over the period. Simply divide your account value at December 31, 2012, by $1,000 (for example, an $8,600 account value divided by $1,000 = 8.6), then multiply the result by the number under the heading entitled “Expenses Paid During the Period” to estimate the expenses you paid on your account during this period.
Hypothetical Example for Comparison Purposes
The second part of the table below provides information about hypothetical account values and hypothetical expenses based on the Fund’s actual expense ratio and an assumed rate of return of 5% per year before expenses, which is not the Fund’s actual return. The hypothetical account values and expenses may not be used to estimate the actual ending account balance or expenses you paid for the period. You may use this information to compare the ongoing costs of investing in the Fund and other funds. To do so, compare this 5% hypothetical example with the 5% hypothetical examples that appear in the shareholder reports of the other funds.
Please note that the expenses shown in the table are meant to highlight your ongoing costs only and do not reflect any transactional costs, such as sales charges (loads), redemption fees, or exchange fees. Therefore, this section is useful in comparing ongoing costs only, and will not help you determine the relative total costs of owning different funds. In addition, if these transactional costs were included, your costs would have been higher.
| Actual | Hypothetical (5% per year return before expenses) | |||||||||||||||||||||||||||
| Beginning | Ending | Expenses Paid | Beginning | Ending | Expenses Paid | Annualized | ||||||||||||||||||||||
| Account Value | Account Value | During the | Account Value | Account Value | During the | Expense | ||||||||||||||||||||||
| 7/1/12 | 12/31/12 | Period1 | 7/1/12 | 12/31/12 | Period1 | Ratio2 | ||||||||||||||||||||||
| Investment Class | ||||||||||||||||||||||||||||
| Royce Select Fund I | $ | 1,000.00 | $ | 1,106.08 | $ | 6.56 | $ | 1,000.00 | $ | 1,018.90 | $ | 6.29 | 1.24 | % | ||||||||||||||
| Royce Select Fund II | 1,000.00 | 1,079.35 | 7.79 | 1,000.00 | 1,017.65 | 7.56 | 1.49 | |||||||||||||||||||||
| Royce Global Select | ||||||||||||||||||||||||||||
Long/Short Fund | 1,000.00 | 1,102.95 | 7.88 | 1,000.00 | 1,017.65 | 7.56 | 1.49 | |||||||||||||||||||||
| Royce Enterprise Select Fund | 1,000.00 | 1,093.70 | 6.53 | 1,000.00 | 1,018.90 | 6.29 | 1.24 | |||||||||||||||||||||
| Royce Opportunity Select Fund | 1,000.00 | 1,157.57 | 6.73 | 1,000.00 | 1,018.90 | 6.29 | 1.24 | |||||||||||||||||||||
| Royce Special Equity Multi- | ||||||||||||||||||||||||||||
Cap Fund | 1,000.00 | 1,047.27 | 6.18 | 1,000.00 | 1,019.10 | 6.09 | 1.20 | |||||||||||||||||||||
| Service Class | ||||||||||||||||||||||||||||
| Royce Micro-Cap Discovery Fund | 1,000.00 | 1,031.01 | 7.61 | 1,000.00 | 1,017.65 | 7.56 | 1.49 | |||||||||||||||||||||
| Royce Financial Services Fund | 1,000.00 | 1,115.41 | 7.92 | 1,000.00 | 1,017.65 | 7.56 | 1.49 | |||||||||||||||||||||
| Royce European Smaller- | ||||||||||||||||||||||||||||
Companies Fund | 1,000.00 | 1,174.74 | 9.24 | 1,000.00 | 1,016.64 | 8.57 | 1.69 | |||||||||||||||||||||
| Royce SMid-Cap Value Fund | 1,000.00 | 1,124.40 | 7.21 | 1,000.00 | 1,018.35 | 6.85 | 1.35 | |||||||||||||||||||||
| Royce Focus Value Fund | 1,000.00 | 1,091.96 | 7.10 | 1,000.00 | 1,018.35 | 6.85 | 1.35 | |||||||||||||||||||||
| Royce Partners Fund | 1,000.00 | 1,124.96 | 7.21 | 1,000.00 | 1,018.35 | 6.85 | 1.35 | |||||||||||||||||||||
| Royce Global Dividend | ||||||||||||||||||||||||||||
Value Fund | 1,000.00 | 1,158.32 | 9.17 | 1,000.00 | 1,016.64 | 8.57 | 1.69 | |||||||||||||||||||||
| Royce International Micro- | ||||||||||||||||||||||||||||
Cap Fund | 1,000.00 | 1,090.66 | 8.88 | 1,000.00 | 1,016.64 | 8.57 | 1.69 | |||||||||||||||||||||
| Royce International | ||||||||||||||||||||||||||||
Premier Fund | 1,000.00 | 1,136.34 | 9.08 | 1,000.00 | 1,016.64 | 8.57 | 1.69 | |||||||||||||||||||||
| Royce Special Equity Multi- | ||||||||||||||||||||||||||||
Cap Fund | 1,000.00 | 1,046.40 | 7.15 | 1,000.00 | 1,018.15 | 7.05 | 1.39 | |||||||||||||||||||||
| Institutional Class | ||||||||||||||||||||||||||||
| Royce Special Equity Multi- | ||||||||||||||||||||||||||||
Cap Fund | 1,000.00 | 1,048.62 | 5.36 | 1,000.00 | 1,019.91 | 5.28 | 1.04 | |||||||||||||||||||||
| 1 | Expenses are equal to the Fund's annualized expense ratio multiplied by the average account value for the period, multiplied by 184 days in the most recent fiscal half-year divided by 366 days (to reflect the half-year period for all funds existing for the full half-year period). |
| 2 | Annualized expense ratio used to derive figures in the table is based on the most recent fiscal half-year. For the Select Funds, the committed net annual operating expense ratio caps under the new Investment Advisory Agreement are used to derive figures in the table. |
| 96 | The Royce Funds 2012 Annual Report to Shareholders |
| Federal Tax Information |
In January 2013, taxable shareholders were mailed a Form 1099-DIV reporting the federal tax status of all distributions paid during the calendar year 2012.
2012 Supplemental Tax Information:
| % | Long-Term Capital | |||||||||||||||
| % | % U.S. Govt | Income Qualifying | Gain Distribution or | |||||||||||||
| Fund | QDI | Income | For DRD | Maximum Allowable (000’s) | ||||||||||||
| Royce Select Fund I | 75.95 | % | N/A | 69.11 | % | $ | 3,766 | |||||||||
| Royce Micro-Cap Discovery Fund | 100.00 | % | N/A | 100.00 | % | N/A | ||||||||||
| Royce Financial Services Fund | 100.00 | % | N/A | 100.00 | % | N/A | ||||||||||
| Royce Select Fund II | 26.95 | % | N/A | 19.95 | % | 50 | ||||||||||
| Royce Global Select Long/Short Fund | 93.30 | % | N/A | 2.93 | % | N/A | ||||||||||
| Royce European Smaller-Companies Fund | 100.00 | % | N/A | 0.00 | % | N/A | ||||||||||
| Royce Enterprise Select Fund | 19.09 | % | N/A | 14.79 | % | 59 | ||||||||||
| Royce SMid-Cap Value Fund | N/A | N/A | N/A | N/A | ||||||||||||
| Royce Focus Value Fund | 93.40 | % | N/A | 70.52 | % | 2 | ||||||||||
| Royce Partners Fund | 61.76 | % | N/A | 100.00 | % | 36 | ||||||||||
| Royce Opportunity Select Fund | 6.81 | % | N/A | 4.73 | % | 29 | ||||||||||
| Royce Global Dividend Value Fund | 100.00 | % | N/A | 0.00 | % | N/A | ||||||||||
| Royce International Micro-Cap Fund | 100.00 | % | N/A | 0.00 | % | N/A | ||||||||||
| Royce International Premier Fund | 100.00 | % | N/A | 0.00 | % | N/A | ||||||||||
| Royce Special Equity Multi-Cap Fund | 100.00 | % | N/A | 100.00 | % | 891 | ||||||||||
| Definitions: |
| % QDI: Qualified Dividend Income; % of net investment income and/or short-term capital gains distributions that qualify for treatment at long-term capital gain rates. |
| % U.S. Govt Income: % of investment income paid from U.S. Government obligations. |
| % Income Qualifying for DRD: % of investment income eligible for the corporate dividend received deduction. |
Foreign Tax Credit:
For the year ended December 31, 2012, the following funds had elected to pass through the credit for tax paid in foreign countries. The net foreign source income and foreign tax per share outstanding on the dividend distribution date are as follows:
| Net Foreign | ||||||||||||||||
| Net Foreign | Source Income | Foreign | Foreign | |||||||||||||
| Fund | Source Income | Per Share | Tax | Tax Per Share | ||||||||||||
| Royce Global Select Long/Short Fund | $ | 575,973 | $ | .4666 | $ | 56,297 | $ | .0456 | ||||||||
| Royce European Smaller-Companies Fund | 283,736 | .1884 | 58,540 | .0389 | ||||||||||||
| Royce Global Dividend Value Fund | 122,675 | .1669 | 16,865 | .0230 | ||||||||||||
| Royce International Micro-Cap Fund | 83,631 | .1630 | 9,758 | .0190 | ||||||||||||
| Royce International Premier Fund | 75,949 | .1767 | 11,940 | .0278 | ||||||||||||
| The Royce Funds 2012 Annual Report to Shareholders | 97 |
| Trustees and Officers |
| All Trustees and Officers may be reached c/o The Royce Funds, 745 Fifth Avenue, New York, NY 10151 |
Charles M. Royce, Trustee1, President
Age: 73 | Number of Funds Overseen: 34 | Tenure: Since 1982
Non-Royce Directorships: Director of TICC Capital Corp.
Principal Occupation(s) During Past Five Years: President, Co-Chief Investment Officer and Member of Board of Managers of Royce & Associates, LLC (“Royce”), the Trust’s investment adviser.
Patricia W. Chadwick, Trustee
Age: 64 | Number of Funds Overseen: 34 | Tenure: Since 2009
Non-Royce Directorships: Trustee of ING Mutual Funds and Director of Wisconsin Energy Corp.
Principal Occupation(s) During Past 5 Years: Consultant and President of Ravengate Partners LLC (since 2000).
Richard M. Galkin, Trustee
Age: 74 | Number of Funds Overseen: 34 | Tenure: Since 1982
Non-Royce Directorships: None
Principal Occupation(s) During Past Five Years: Private investor. Mr. Galkin’s prior business experience includes having served as President of Richard M. Galkin Associates, Inc., telecommunications consultants, President of Manhattan Cable Television (a subsidiary of Time, Inc.), President of Haverhills Inc. (another Time, Inc. subsidiary), President of Rhode Island Cable Television and Senior Vice President of Satellite Television Corp. (a subsidiary of Comsat).
Stephen L. Isaacs, Trustee
Age: 73 | Number of Funds Overseen: 34 | Tenure: Since 1989
Non-Royce Directorships: None
Principal Occupation(s) During Past Five Years: President of The Center for Health and Social Policy (since September 1996); Attorney and President of Health Policy Associates, Inc., consultants. Mr. Isaacs’s prior business experience includes having served as Director of Columbia University Development Law and Policy Program and Professor at Columbia University (until August 1996).
Arthur S. Mehlman, Trustee
Age: 70 | Number of Funds Overseen: 48 | Tenure: Since 2004
Non-Royce Directorships: Director/Trustee of registered investment companies constituting the 14 Legg Mason Funds.
Principal Occupation(s) During Past Five Years: Director of The League for People with Disabilities, Inc.; Director of University of Maryland Foundation (non-profits). Formerly: Director of Municipal Mortgage & Equity, LLC (from October 2004 to April 1, 2011); Director of University of Maryland College Park Foundation (non-profit) (from 1998 to 2005); Partner, KPMG LLP (international accounting firm) (from 1972 to 2002); Director of Maryland Business Roundtable for Education (from July 1984 to June 2002).
David L. Meister, Trustee
Age: 73 | Number of Funds Overseen: 34 | Tenure: Since 1982
Non-Royce Directorships: None
Principal Occupation(s) During Past Five Years: Consultant. Chairman and Chief Executive Officer of The Tennis Channel (from June 2000 to March 2005). Mr. Meister’s prior business experience includes having served as Chief Executive Officer of Seniorlife.com, a consultant to the communications industry, President of Financial News Network, Senior Vice President of HBO, President of Time-Life Films and Head of Broadcasting for Major League Baseball.
G. Peter O’Brien, Trustee
Age: 67 | Number of Funds Overseen: 48 | Tenure: Since 2001
Non-Royce Directorships: Director/Trustee of registered investment companies constituting the 14 Legg Mason Funds; Director of TICC Capital Corp.
Principal Occupation(s) During Past Five Years: Trustee Emeritus of Colgate University (since 2005); Board Member of Hill House, Inc. (since 1999); Formerly: Trustee of Colgate University (from 1996 to 2005), President of Hill House, Inc. (from 2001 to 2005) and Managing Director/Equity Capital Markets Group of Merrill Lynch & Co. (from 1971 to 1999).
John D. Diederich, Vice President and Treasurer
Age: 61 | Tenure: Since 2001
Principal Occupation(s) During Past Five Years: Chief Operating Officer, Managing Director and member of the Board of Managers of Royce; Chief Financial Officer of Royce; Director of Administration of the Trust; and President of RFS, having been employed by Royce since April 1993.
Jack E. Fockler, Jr., Vice President
Age: 54 | Tenure: Since 1995
Principal Occupation(s) During Past Five Years: Managing Director and Vice President of Royce, and Vice President of RFS, having been employed by Royce since October 1989.
W. Whitney George, Vice President
Age: 54 | Tenure: Since 1995
Principal Occupation(s) During Past Five Years: Co-Chief Investment Officer, Managing Director and Vice President of Royce, having been employed by Royce since October 1991.
Daniel A. O’Byrne, Vice President and Assistant Secretary
Age: 50 | Tenure: Since 1994
Principal Occupation(s) During Past Five Years: Principal and Vice President of Royce, having been employed by Royce since October 1986.
John E. Denneen, Secretary and Chief Legal Officer
Age: 45 | Tenure: 1996-2001 and Since April 2002
Principal Occupation(s) During Past Five Years: General Counsel, Principal, Chief Legal and Compliance Officer and Secretary of Royce; Secretary and Chief Legal Officer of The Royce Funds.
Lisa Curcio, Chief Compliance Officer
Age: 53 | Tenure: Since 2004
Principal Occupation(s) During Past Five Years: Chief Compliance Officer of The Royce Funds (since October 2004) and Compliance Officer of Royce (since June 2004).
1 Interested Trustee.
Trustees will hold office until their successors have been duly elected and qualified or until their earlier resignation or removal. The Statement of Additional Information, which contains additional information about the Trust’s trustees and officers, is available and can be obtained without charge at www.roycefunds.com or by calling (800) 221-4268.
| 98 | The Royce Funds 2012 Annual Report to Shareholders |
| Notes to Performance and Other Important Information |
The thoughts expressed in this report concerning recent market movements and future prospects for small company stocks are solely the opinion of Royce at December 31, 2012, and, of course, historical market trends are not necessarily indicative of future market movements. Statements regarding the future prospects for particular securities held in the Funds’ portfolios and Royce’s investment intentions with respect to those securities reflect Royce’s opinions as of December 31, 2012 and are subject to change at any time without notice. There can be no assurance that securities mentioned in this report will be included in any Royce-managed portfolio in the future. Sector weightings are determined using the Global Industry Classification Standard (“GICS”). GICS was developed by, and is the exclusive property of, Standard & Poor’s Financial Services LLC (“S&P”) and MSCI Inc. (“MSCI”). GICS is the trademark of S&P and MSCI. “Global Industry Classification Standard (GICS)” and “GICS Direct” are service marks of S&P and MSCI. All indexes referred to are unmanaged and capitalization weighted. Each index’s returns include net reinvested dividends and/or interest income. Russell Investment Group is the source and owner of the trademarks, service marks, and copyrights related to the Russell Indexes. Russell® is a trademark of Russell Investment Group. The Russell 2000 is an index of domestic small-cap stocks. It measures the performance of the 2,000 smallest publicly traded U.S. companies in the Russell 3000 Index. The Russell 1000 Index is an index of domestic large-cap stocks. It measures the performance of the 1,000 largest publicly traded U.S. companies in the Russell 3000 Index. The Russell 2000 Value and Growth Indexes consist of the respective value and growth stocks within the Russell 2000 as determined by Russell Investments. The Russell Microcap Index includes 1,000 of the smallest securities in the Russell 2000 Index, along with the next smallest eligible securities as determined by Russell. The Russell 2500 is an index of domestic small- to mid-cap stocks. It includes approximately 2,500 of the smallest securities in the Russell 3000 Index. The returns for the Russell 2500–Financial Services Sector represent those of the financial services companies within the Russell 2500 Index. The Russell Midcap Index measures the performance of the mid-cap segment of the U.S. equity universe. It includes approximately 800 of the smallest securities in the Russell 1000 Index. The Russell Global ex-U.S. Large Cap Index is an index of global large-cap stocks, excluding the United States. The Russell Global ex-U.S. Small Cap Index is an index of global small-cap stocks, excluding the United States. The S&P 500 is an index of U.S. large-cap stocks, selected by Standard & Poor’s based on market size, liquidity, and industry grouping, among other factors. The Nasdaq Composite is an index of the more than 3,000 common equities listed on the Nasdaq stock exchange. Returns for the market indexes used in this report were based on information supplied to Royce by Russell Investments. Royce has not independently verified the above described information. The Price-Earnings, or P/E, Ratio is calculated by dividing a company’s share price by its trailing 12-month earnings-per share (EPS). The Price-to-Book, or P/B, Ratio is calculated by dividing a company’s share price by its book value per share. The Sharpe Ratio is calculated for a specified period by dividing a fund’s annualized excess returns by its annualized standard deviation. The higher the Sharpe Ratio, the better the fund’s historical risk-adjusted performance. Standard deviation is a statistical measure within which a fund’s total returns have varied over time. The greater the standard deviation, the greater a fund’s volatility. The Royce Funds is a service mark of The Royce Funds. Distributor: Royce Fund Services, Inc. Investments in securities of micro-cap, small-cap and/or mid-cap companies may involve considerably more risk than investments in securities of larger-cap companies. (Please see “Primary Risks for Fund Investors” in the prospectus.) Certain Royce Funds may invest up to 25% (100% for Royce Global Select Long/Short Fund, Select Fund II, European Smaller-Companies, Global Dividend Value, International Micro-Cap and International Premier Fund, 35% of Focus Value, Partners, Financial Services and SMid-Cap Value Funds, 10% of Select Fund I and 5% of Special Equity Fund) of their respective assets in foreign securities, which generally may involve political, economic, currency and other risks not encountered in U.S. investments. (Please see “Investing in Foreign Securities” in the prospectus.) Please read the prospectus carefully before investing or sending money. A copy of the Funds’ current prospectus and Statement of Additional Information may be obtained by calling (800) 221-4268, or by visiting www.roycefunds.com. All publicly released material Fund information is disclosed by the Funds on their website at www.roycefunds.com. |
| Forward-Looking Statements | |
This material contains forward-looking statements within the meaning of the Securities Exchange Act of 1934, as amended (the “Exchange Act”), that involve risks and uncertainties, including, among others, statements as to: | |
| • | the Funds’ future operating results, |
| • | the prospects of the Funds’ portfolio companies, |
| • | the impact of investments that the Funds have made or may make, |
| • | the dependence of the Funds’ future success on the general economy and its impact on the companies and industries in which the Funds invest, and |
| • | the ability of the Funds’ portfolio companies to achieve their objectives. |
This review and report use words such as “anticipates,” “believes,” “expects,” “future,” “intends,” and similar expressions to identify forward-looking statements. Actual results may differ materially from those projected in the forward-looking statements for any reason. | |
The Royce Funds have based the forward-looking statements included in this review and report on information available to us on the date of the report, and we assume no obligation to update any such forward-looking statements. Although The Royce Funds undertake no obligation to revise or update any forward-looking statements, whether as a result of new information, future events or otherwise, you are advised to consult any additional disclosures that we may make through future shareholder communications or reports. | |
| Proxy Voting |
A copy of the policies and procedures that The Royce Funds use to determine how to vote proxies relating to portfolio securities and information regarding how each of The Royce Funds voted proxies relating to portfolio securities during the most recent 12-month period ended June 30 is available, without charge, on The Royce Funds’ website at www.roycefunds.com, by calling (800) 221-4268 (toll-free) and on the website of the Securities and Exchange Commission (“SEC”), at www.sec.gov. |
| Form N-Q Filing |
The Funds file their complete schedules of investments with the SEC for the first and third quarters of each fiscal year on Form N-Q. The Funds’ Forms N-Q are available on the SEC’s website at www.sec.gov. The Royce Funds’ holdings are also on the Funds’ website approximately 15 to 20 days after each calendar quarter end and remain available until the next quarter’s holdings are posted. The Funds’ Forms N-Q may also be reviewed and copied at the SEC’s Public Reference Room in Washington, D.C. To find out more about this public service, call the SEC at (202) 942-8090. The Funds’ complete schedules of investments are updated quarterly, and are available at www.roycefunds.com. |
| The Royce Funds 2012 Annual Report to Shareholders | 99 |
| Notes to Performance and Other Important Information |
The Royce Funds
Royce Select Fund I | Royce Select Fund II | Royce Global Select Long/Short Fund | Royce Enterprise Select Fund | Royce Opportunity Select Fund
| VOTES FOR | VOTES AGAINST | VOTES WITHHELD | ||||
| Royce Select Fund I | 1,315,647 | 115,714 | 9,619 | |||
| Royce Select Fund II | 174,880 | 5,608 | 0 | |||
| Royce Global Select Long/Short Fund | 878,708 | 140,610 | 61,286 | |||
| Royce Enterprise Select Fund | 107,793 | 0 | 0 | |||
| Royce Opportunity Select Fund | 171,510 | 9,398 | 0 | |||
2. To approve the elimination of the fundamental investment restriction that limits investment in the securities of foreign issuers.
| VOTES FOR | VOTES AGAINST | VOTES WITHHELD | ||||
| Royce Select Fund I | 1,362,967 | 70,140 | 8,233 | |||
| 100 | The Royce Funds 2012 Annual Report to Shareholders |
| The Lessons of 40 Years |
The thoughts in this essay concerning the stock market are solely those of Royce & Associates and, of course, there can be no assurance with regard to future market movements.
| This page is not part of the 2012 Annual Report to Shareholders |
| |||||||||||||||||||
| |||||||||||||||||||
About The Royce Funds Wealth Of Experience With approximately $35 billion in total assets under management, Royce & Associates is committed to the same small-company investing principles that have served us well for 40 years. Charles M. Royce, our President and Co-Chief Investment Officer, enjoys one of the longest tenures of any active mutual fund manager. Royce’s investment staff also includes Co-Chief Investment Officer W. Whitney George, 18 Portfolio Managers, four assistant portfolio managers and analysts, and eight traders. Multiple Funds, Common Focus Our goal is to offer both individual and institutional investors the best available smaller-cap portfolios. Unlike a lot of mutual fund groups with broad product offerings, we have chosen to concentrate on smaller-company investing by providing investors with a range of funds that take full advantage of this large and diverse sector. Consistent Discipline Our approach emphasizes paying close attention to risk and maintaining the same discipline, regardless of market movements and trends. The price we pay for a security must be significantly below our appraisal of its current worth. This requires a thorough analysis of the financial and business dynamics of an enterprise, as though we were purchasing the entire company. Co-Ownership Of Funds It is important that our employees, and shareholders share a common financial goal; our officers, employees and their families currently have approximately $147 million invested in The Royce Funds. This Review and Report must be accompanied or preceded by a current prospectus for the Funds. Please read the prospectus carefully before investing or sending money. | |||||||||||||||||||
| Contact Us | |||||||||||||||||||
| General Information Additional Report Copies and Prospectus Inquiries (800) 221-4268 | RIA Services Fund Materials and Performance Updates (800) 33-ROYCE (337-6923) | Broker/Dealer Services Fund Materials and Performance Updates (800) 59-ROYCE (597-6923) | Shareholder Services Transactions and Account Inquiries (800) 841-1180 | Royce InfoLine 24-Hour Automated Telephone Service (800) 78-ROYCE (787-6923) |  | ||||||||||||||
Item 2. Code(s) of Ethics. As of the end of the period covered by this report, the Registrant had adopted a code of ethics, as defined in Item 2 of Form N-CSR, applicable to its principal executive officer, principal financial officer, principal accounting officer or controller, or persons performing similar functions. A copy of this code of ethics is filed as an exhibit to this Form N-CSR. No substantive amendments were approved or waivers were granted to this code of ethics during the period covered by this report.
Item 3. Audit Committee Financial Expert.
| (a)(1) | The Board of Trustees of the Registrant has determined that it has an audit committee financial expert. | |
| (a)(2) | Arthur S. Mehlman and Patricia W. Chadwick were designated by the Board of Trustees as the Registrant’s Audit Committee Financial Experts, effective April 15, 2004 and April 8, 2010, respectively. Mr. Mehlman and Ms. Chadwick are “independent” as defined under Item 3 of Form N-CSR. |
Item 4. Principal Accountant Fees and Services.
| (a) | Audit Fees: | |
| Year ended December 31, 2012 - $589,919 | ||
| Year ended December 31, 2011 - $592,797 | ||
| (b) | Audit-Related Fees: | |
| Year ended December 31, 2012 - $0 | ||
| Year ended December 31, 2011 - $0 | ||
| (c) | Tax Fees: | |
| Year ended December 31, 2012 - $276,637 – Preparation of tax returns and excise tax review | ||
| Year ended December 31, 2011 - $252,979 – Preparation of tax returns and excise tax review | ||
| (d) | All Other Fees: | |
| Year ended December 31, 2012 - $0 | ||
| Year ended December 31, 2011 - $0 |
(e)(1) Annual Pre-Approval: On an annual basis, the Registrant’s independent auditor submits to the Audit Committee a schedule of proposed audit, audit-related, tax and other non-audit services to be rendered to the Registrant and/or investment adviser(s) for the following year that require pre-approval by the Audit Committee. This schedule provides a description of each type of service that is expected to require pre-approval and the maximum fees that can be paid for each such service without further Audit Committee approval. The Audit Committee then reviews and determines whether to approve the types of scheduled services and the projected fees for them. Any subsequent revision to already pre-approved services or fees (including fee increases) are presented for consideration at the next regularly scheduled Audit Committee meeting, as needed.
If subsequent to the annual pre-approval of services and fees by the Audit Committee, the Registrant or one of its affiliates determines that it would like to engage the Registrant’s independent auditor to perform a service not already pre-approved, the request is to be submitted to the Registrant’s Chief Financial Officer, and if he or she determines that the service fits within the independence guidelines (e.g., it is not a prohibited service), he or she will then arrange for a discussion of the proposed service and fee to be included on the agenda for the next regularly scheduled Audit Committee meeting so that pre-approval can be considered.
Interim Pre-Approval: If, in the judgment of the Registrant’s Chief Financial Officer, a proposed engagement needs to commence before the next regularly scheduled Audit Committee meeting, he or she shall submit a written summary of the proposed engagement to all members of the Audit Committee, outlining the services, the estimated maximum cost, the category of the services (e.g., audit, audit-related, tax or other) and the rationale for engaging the Registrant’s independent auditor to perform the services. To the extent the proposed engagement involves audit, audit-related or tax services, any individual member of the Audit Committee who is an independent Board member is authorized to pre-approve the engagement. To the extent the proposed engagement
involves non-audit services other than audit-related or tax, the Chairman of the Audit Committee is authorized to pre-approve the engagement. The Registrant’s Chief Financial Officer will arrange for this interim review and coordinate with the appropriate member(s) of the Committee. The independent auditor may not commence the engagement under consideration until the Registrant’s Chief Financial Officer has informed the auditor in writing that pre-approval has been obtained from the Audit Committee or an individual member who is an independent Board member. The member of the Audit Committee who pre-approves any engagements in between regularly scheduled Audit Committee meetings is to report, for informational purposes only, any pre-approval decisions to the Audit Committee at its next regularly scheduled meeting.
| (e)(2) | Not Applicable | |
| (f) | Not Applicable | |
| (g) | Year ended December 31, 2012 - $276,637 | |
| Year ended December 31, 2011 - $252,979 | ||
| (h) | No such services were rendered during 2012 or 2011. | |
Item 5. Audit Committee of Listed Registrants. Not Applicable.
Item 6. Investments.
(a) See Item 1.
(b) Not Applicable
Item 7. Disclosure of Proxy Voting Policies and Procedures for Closed-End Management Investment Companies. Not Applicable.
Item 8. Portfolio Managers of Closed-End Management Investment Companies. Not Applicable.
Item 9. Purchases of Equity Securities by Closed-End Management Investment Company and Affiliated Purchasers. Not Applicable
Item 10. Submission of Matters to a Vote of Security Holders. Not Applicable.
Item 11. Controls and Procedures.
(a) Disclosure Controls and Procedures. The Principal Executive and Financial Officers concluded that the Registrant’s Disclosure Controls and Procedures are effective based on their evaluation of the Disclosure Controls and Procedures as of a date within 90 days of the filing date of this report.
(b) Internal Control over Financial Reporting. There were no significant changes in Registrant’s internal control over financial reporting or in other factors that could significantly affect this control subsequent to the date of the evaluation, including any corrective actions with regard to significant deficiencies and material weaknesses during the second fiscal quarter of the period covered by this report.
Item 12. Exhibits. Attached hereto.
(a)(1) The Registrant’s code of ethics pursuant to Item 2 of Form N-CSR.
(a)(2) Separate certifications by the Registrant’s Principal Executive Officer and Principal Financial Officer as required by Rule 30a-2(a) under the Investment Company Act of 1940.
(a)(3) Not Applicable
(b) Separate certifications by the Registrant’s Principal Executive Officer and Principal Financial Officer, pursuant to Section 906 of the Sarbanes-Oxley Act of 2002 and required by Rule 30a-2(b) under the Investment Company Act of 1940.
Pursuant to the requirements of the Securities Exchange Act of 1934 and the Investment Company Act of 1940, the registrant has duly caused this report to be signed on its behalf by the undersigned, thereunto duly authorized.
| THE ROYCE FUND |
| BY: /s/ Charles M. Royce |
Charles M. Royce |
President |
| Date: March 1, 2013 |
Pursuant to the requirements of the Securities Exchange Act of 1934 and the Investment Company Act of 1940, this report has been signed below by the following persons on behalf of the registrant and in the capacities and on the dates indicated.
| THE ROYCE FUND | THE ROYCE FUND | |
| BY: /s/ Charles M. Royce | BY: /s/ John D. Diederich | |
Charles M. Royce | John D. Diederich | |
President | Chief Financial Officer | |
| Date: March 1, 2013 | Date: March 1, 2013 | |