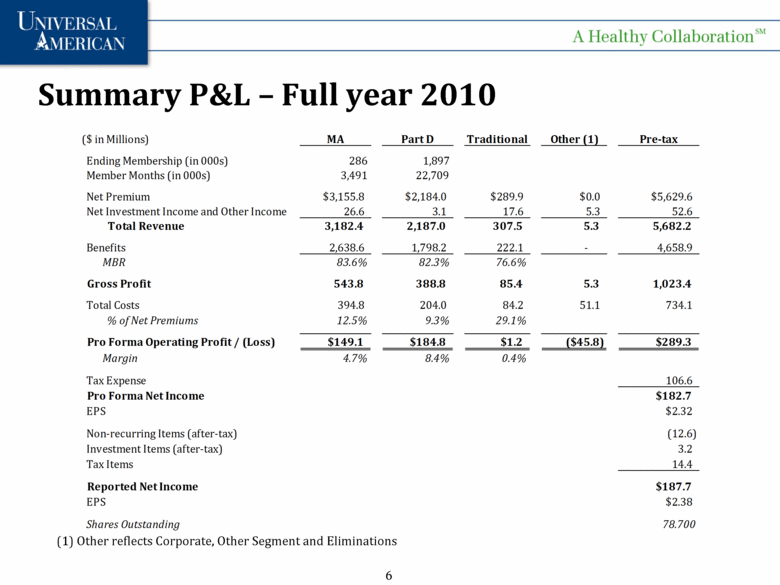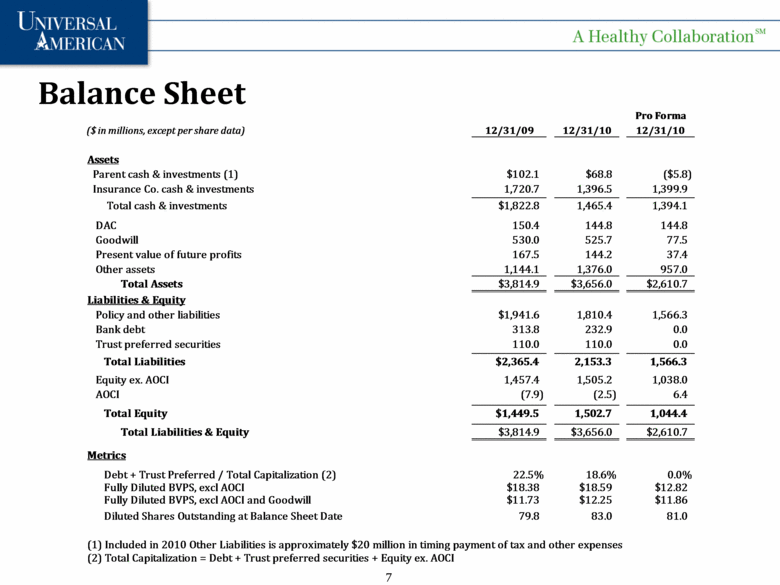
| Balance Sheet Pro Forma ($ in millions, except per share data) 12/31/09 12/31/10 12/31/10 Assets Parent cash & investments (1) $102.1 $68.8 ($5.8) Insurance Co. cash & investments 1,720.7 1,396.5 1,399.9 Total cash & investments $1,822.8 1,465.4 1,394.1 DAC 150.4 144.8 144.8 Goodwill 530.0 525.7 77.5 Present value of future profits 167.5 144.2 37.4 Other assets 1,144.1 1,376.0 957.0 Total Assets $3,814.9 $3,656.0 $2,610.7 Liabilities & Equity Policy and other liabilities $1,941.6 1,810.4 1,566.3 Bank debt 313.8 232.9 0.0 Trust preferred securities 110.0 110.0 0.0 0.0 0.0 Total Liabilities $2,365.4 2,153.3 1,566.3 Equity ex. AOCI 1,457.4 1,505.2 1,038.0 AOCI (7.9) (2.5) 6.4 Total Equity $1,449.5 1,502.7 1,044.4 Total Liabilities & Equity $3,814.9 $3,656.0 $2,610.7 Metrics Debt + Trust Preferred / Total Capitalization (2) 22.5% 18.6% 0.0% Fully Diluted BVPS, excl AOCI $18.38 $18.59 $12.82 Fully Diluted BVPS, excl AOCI and Goodwill $11.73 $12.25 $11.86 Diluted Shares Outstanding at Balance Sheet Date 79.8 83.0 81.0 (1) Included in 2010 Other Liabilities is approximately $20 million in timing payment of tax and other expenses (2) Total Capitalization = Debt + Trust preferred securities + Equity ex. AOCI |
