Exhibit 99.1
Deutsche Bank Annual Electric Power Conference
C. John Wilder Chief Executive Officer
June 15, 2005
Safe Harbor Statement & Regulation G
This presentation contains forward-looking statements, which are subject to various risks and uncertainties. Discussion of risks and uncertainties that could cause actual results to differ materially from management’s current projections, forecasts, estimates and expectations is contained in the company’s SEC filings. In addition to the risks and uncertainties set forth in the company’s SEC filings, the forward looking statements in this presentation could be affected by the ability of the company to implement initiatives that are part of the restructuring, operational improvement, and cost reduction program, and the terms under which the company executes those initiatives, and any adjustments as a result of the planned reevaluation of the financial strategy pursuant to the recent change of the company’s credit ratings by Standard & Poor’s Ratings Services.
Regulation G
This presentation includes certain non-GAAP financial measures. A reconciliation of these measures to the most directly comparable GAAP measure is included in the appendix of the printed version of the slides and the version included on the company’s website at www.txucorp.com under Investor Resources/Presentations.
1
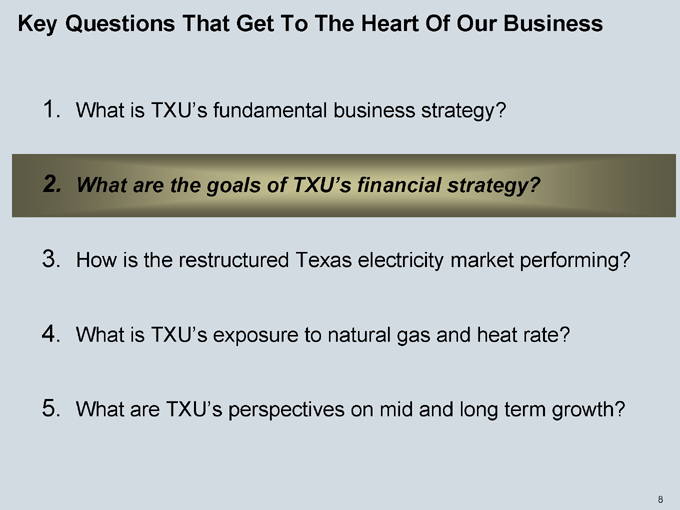
Key Questions That Get To The Heart Of Our Business
1. What is TXU’s fundamental business strategy?
2. What are the goals of TXU’s financial strategy?
3. How is the restructured Texas electricity market performing?
4. What is TXU’s exposure to natural gas and heat rate?
5. What are TXU’s perspectives on mid and long term growth?
2
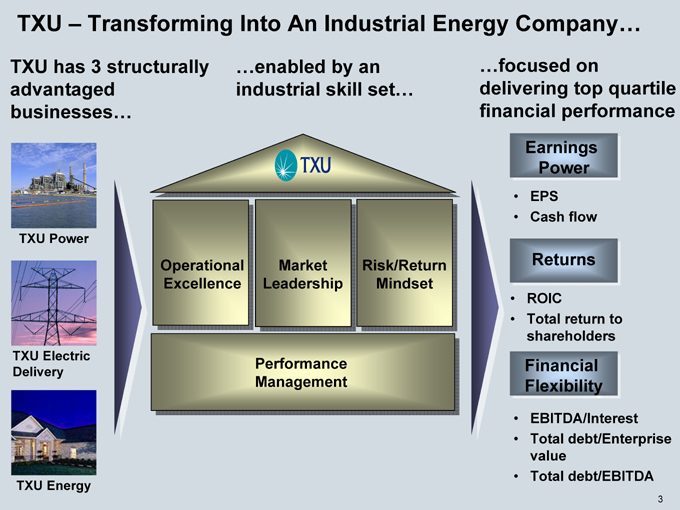
TXU – Transforming Into An Industrial Energy Company…
TXU has 3 structurally advantaged businesses…
…enabled by an industrial skill set…
…focused on delivering top quartile financial performance
TXU Power
TXU Electric Delivery
TXU Energy
Earnings Power
EPS Cash flow
Returns
ROIC
Total return to shareholders
Financial Flexibility
EBITDA/Interest Total debt/Enterprise value Total debt/EBITDA
Operational Market Risk/Return Excellence Leadership Mindset
Performance Management
3
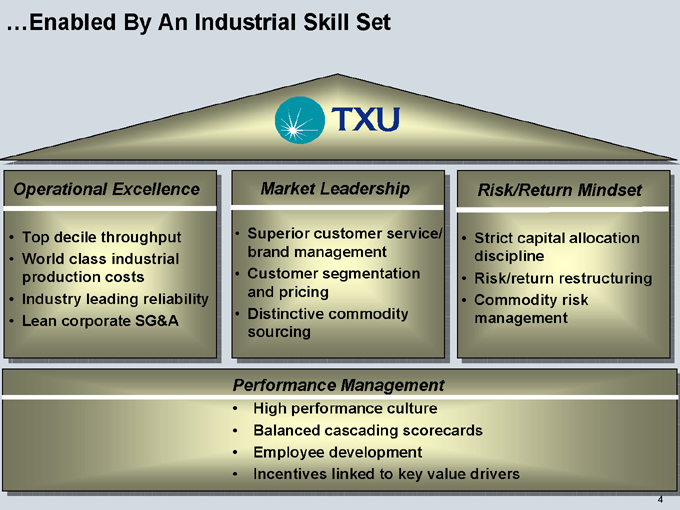
…Enabled By An Industrial Skill Set
Operational Excellence
Top decile throughput World class industrial production costs Industry leading reliability Lean corporate SG&A
Market Leadership
Superior customer service/ brand management Customer segmentation and pricing Distinctive commodity sourcing
Risk/Return Mindset
Strict capital allocation discipline Risk/return restructuring Commodity risk management
Performance Management
High performance culture Balanced cascading scorecards Employee development Incentives linked to key value drivers
4
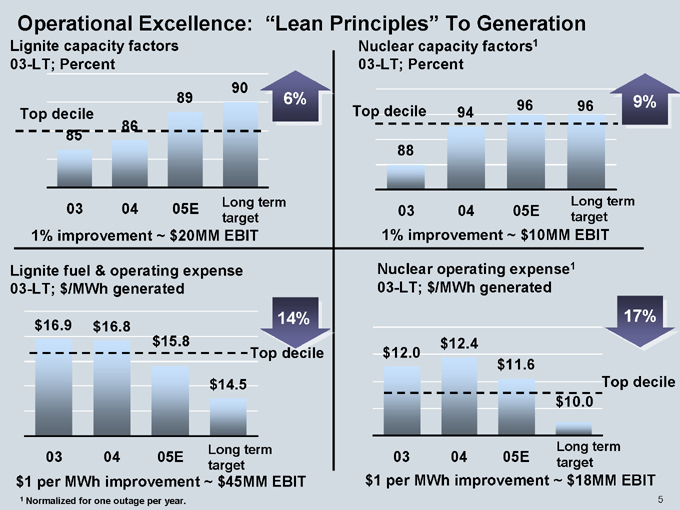
Operational Excellence: “Lean Principles” To Generation
Lignite capacity factors 03-LT; Percent
Top decile
85
86
89
90
6%
03
04
05E
Long term target
1% improvement ~ $20MM EBIT
Lignite fuel & operating expense 03-LT; $/MWh generated $16.9 $16.8 $15.8 $14.5
14%
Top decile
03 04
05E
Long term target $1 per MWh improvement ~ $45MM EBIT
1 Normalized for one outage per year.
Nuclear capacity factors1 03-LT; Percent
Top decile
88
94
96
96
9%
03 04 05E
Long term target
1% improvement ~ $10MM EBIT
Nuclear operating expense1 03-LT; $/MWh generated $12.0 $12.4 $11.6 $10.0
17%
Top decile
03
04
05E
Long term target $1 per MWh improvement ~ $18MM EBIT
5
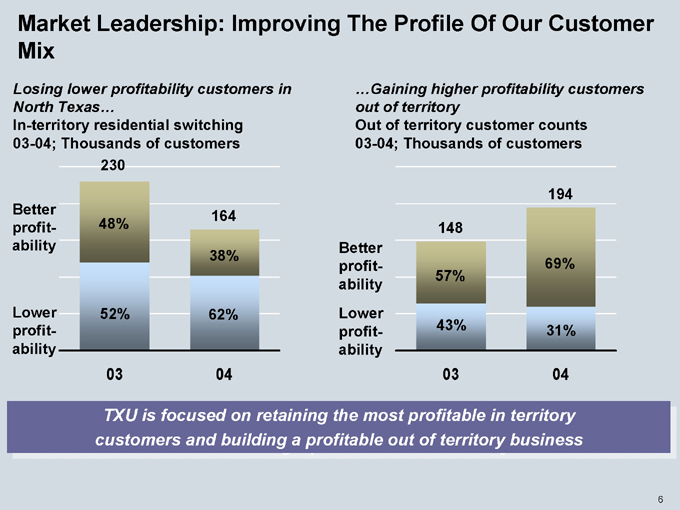
Market Leadership: Improving The Profile Of Our Customer Mix
Losing lower profitability customers in North Texas…
In-territory residential switching 03-04; Thousands of customers
Better profitability
Lower profitability
230
48%
52%
164
38%
62%
03 04
…Gaining higher profitability customers out of territory
Out of territory customer counts 03-04; Thousands of customers
Better profitability Lower profitability
148
57%
43%
194
69%
31%
03 04
TXU is focused on retaining the most profitable in territory customers and building a profitable out of territory business
6
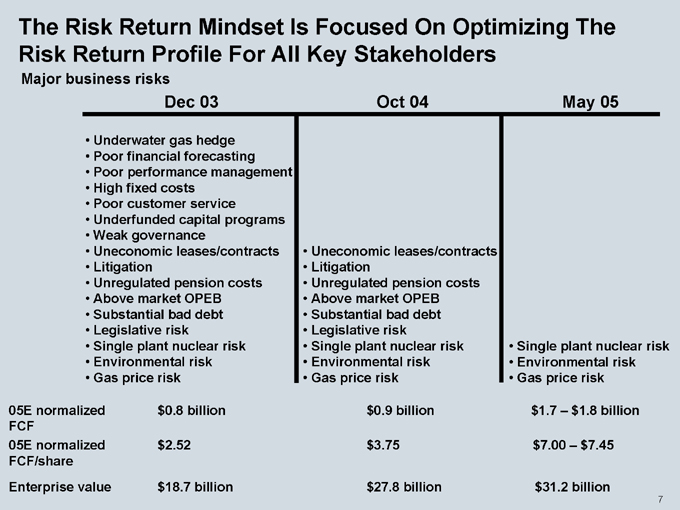
The Risk Return Mindset Is Focused On Optimizing The Risk Return Profile For All Key Stakeholders
Major business risks
Dec 03
Underwater gas hedge Poor financial forecasting Poor performance management High fixed costs Poor customer service Underfunded capital programs Weak governance Uneconomic leases/contracts Litigation Unregulated pension costs Above market OPEB
Substantial bad debt Legislative risk Single plant nuclear risk Environmental risk Gas price risk
Oct 04
Uneconomic leases/contracts Litigation Unregulated pension costs Above market OPEB
Substantial bad debt Legislative risk Single plant nuclear risk Environmental risk Gas price risk
May 05
Single plant nuclear risk Environmental risk Gas price risk
05E normalized $0.8 billion $0.9 billion $1.7 – $1.8 billion FCF
05E normalized $2.52 $3.75 $7.00 – $7.45 FCF/share Enterprise value $18.7 billion $27.8 billion $31.2 billion
7
Key Questions That Get To The Heart Of Our Business
1. What is TXU’s fundamental business strategy?
2. What are the goals of TXU’s financial strategy?
3. How is the restructured Texas electricity market performing?
4. What is TXU’s exposure to natural gas and heat rate?
5. What are TXU’s perspectives on mid and long term growth?
8
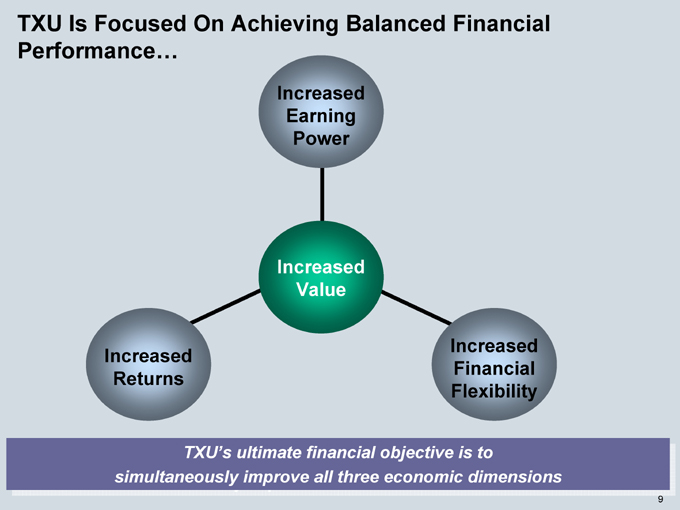
TXU Is Focused On Achieving Balanced Financial Performance…
Increased Earning Power
Increased Value
Increased Returns
Increased Financial Flexibility
TXU’s ultimate financial objective is to simultaneously improve all three economic dimensions
9
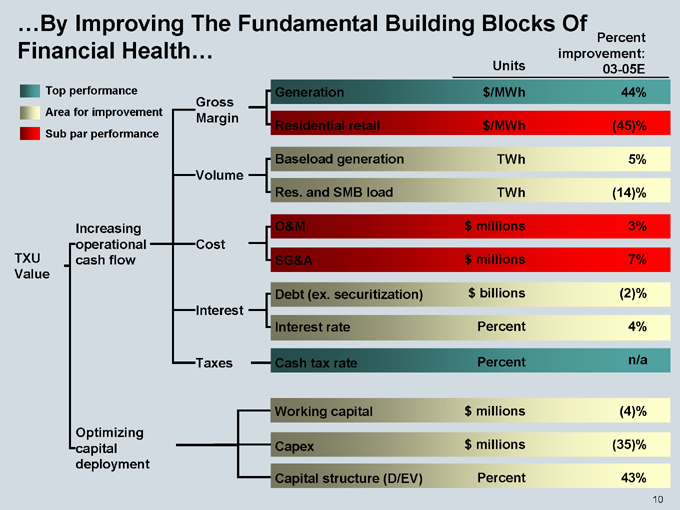
…By Improving The Fundamental Building Blocks Of
Percent
Financial Health… improvement:
Top performance Area for improvement Sub par performance
TXU Value
Increasing operational cash flow
Optimizing capital deployment
Gross Margin
Volume
Cost
Interest
Taxes
Units 03-05E
Generation $/MWh 44%
Residential retail $/MWh (45)%
Baseload generation TWh 5%
Res. and SMB load TWh (14)%
O&M $millions 3%
SG&A $millions 7%
Debt (ex. securitization) $billions (2)%
Interest rate Percent 4%
Cash tax rate Percent n/a
Working capital $millions (4)%
Capex $millions (35)%
Capital structure (D/EV) Percent 43%
10
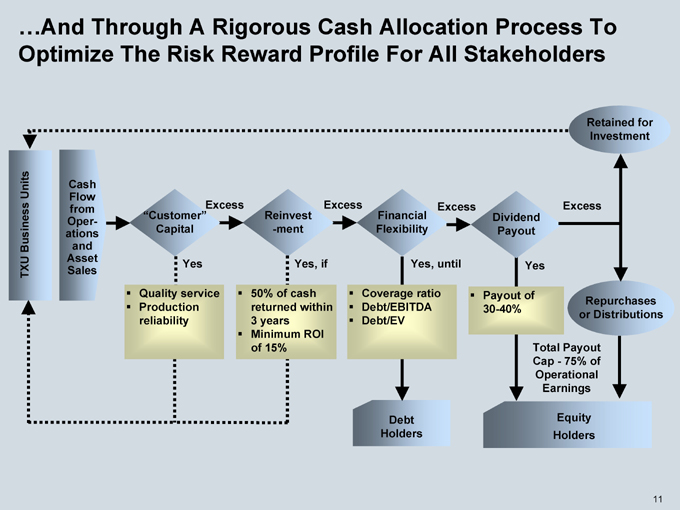
…And Through A Rigorous Cash Allocation Process To Optimize The Risk Reward Profile For All Stakeholders
Retained for Investment
TXU Business Units
Cash Flow from Operations and Asset Sales
“Customer” Capital
Excess
Reinvestment
Excess
Financial Flexibility
Excess
Dividend Payout
Excess
Yes
Yes, if
Yes, until
Yes
Quality service Production reliability
50% of cash returned within 3 years Minimum ROI of 15%
Coverage ratio Debt/EBITDA Debt/EV
Payout of 30-40%
Repurchases or Distributions
Total Payout Cap—75% of Operational Earnings
Debt Holders
Equity Holders
11
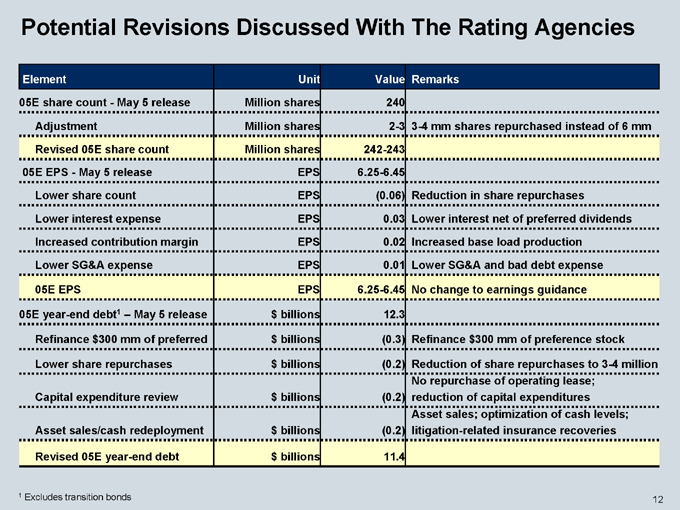
Potential Revisions Discussed With The Rating Agencies
Element Unit Value Remarks
05E share count—May 5 release Million shares 240
Adjustment Million shares 2-3 3-4 mm shares repurchased instead of 6 mm
Revised 05E share count Million shares 242-243
05E EPS—May 5 release EPS 6.25-6.45
Lower share count EPS (0.06) Reduction in share repurchases
Lower interest expense EPS 0.03 Lower interest net of preferred dividends
Increased contribution margin EPS 0.02 Increased base load production
Lower SG&A expense EPS 0.01 Lower SG&A and bad debt expense
05E EPS EPS 6.25-6.45 No change to earnings guidance
05E year-end debt1 – May 5 release $billions 12.3
Refinance $300 mm of preferred $billions (0.3) Refinance $300 mm of preference stock
Lower share repurchases $billions (0.2) Reduction of share repurchases to 3-4 million
No repurchase of operating lease;
Capital expenditure review $billions (0.2) reduction of capital expenditures
Asset sales; optimization of cash levels;
Asset sales/cash redeployment $billions (0.2) litigation-related insurance recoveries
Revised 05E year-end debt $billions 11.4
1 Excludes transition bonds
12
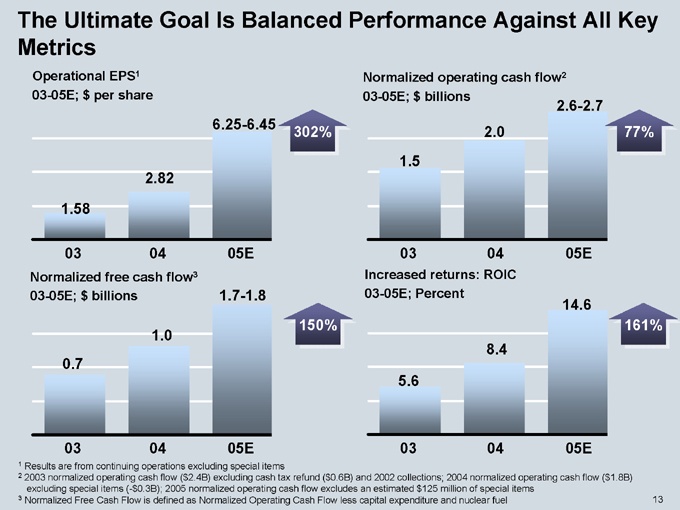
The Ultimate Goal Is Balanced Performance Against All Key Metrics
Operational EPS1 03-05E; $per share
1.58
2.82
6.25-6.45
03 04 05E
302%
Normalized free cash flow3 03-05E; $billions
0.7
1.0
1.7-1.8
03 04 05E
150%
Normalized operating cash flow2 03-05E; $billions
1.5
2.0
2.6-2.7
77%
03 04 05E
Increased returns: ROIC 03-05E; Percent
5.6
8.4
14.6
03 04 05E
161%
1 Results are from continuing operations excluding special items
2 2003 normalized operating cash flow ($2.4B) excluding cash tax refund ($0.6B) and 2002 collections; 2004 normalized operating cash flow ($1.8B) excluding special items (-$0.3B); 2005 normalized operating cash flow excludes an estimated $125 million of special items
3 Normalized Free Cash Flow is defined as Normalized Operating Cash Flow less capital expenditure and nuclear fuel
13
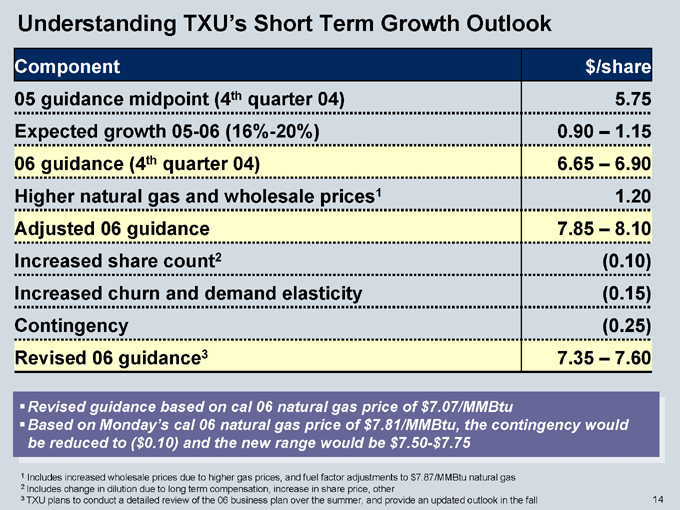
Understanding TXU’s Short Term Growth Outlook
Component $/share
05 guidance midpoint (4th quarter 04) 5.75
Expected growth 05-06 (16%-20%) 0.90 – 1.15
06 guidance (4th quarter 04) 6.65 – 6.90
Higher natural gas and wholesale prices1 1.20
Adjusted 06 guidance 7.85 – 8.10
Increased share count2 (0.10)
Increased churn and demand elasticity (0.15)
Contingency (0.25)
Revised 06 guidance3 7.35 – 7.60
Revised guidance based on cal 06 natural gas price ofRevised guidance based on cal 06 natural gas price of $7.07/MMBtu
Based on Monday’s cal 06 natural gas price of $7.81/MMBtu, the contingency would reduced to ($0.10) and the new range would be $7.75-$7.75
1 Includes increased wholesale prices due to higher gas prices, and fuel factor adjustments to $7.87/MMBtu natural gas
2 Includes change in dilution due to long term compensation, increase in share price, other
3 TXU plans to conduct a detailed review of the 06 business plan over the summer, and provide an updated outlook in the fall
14
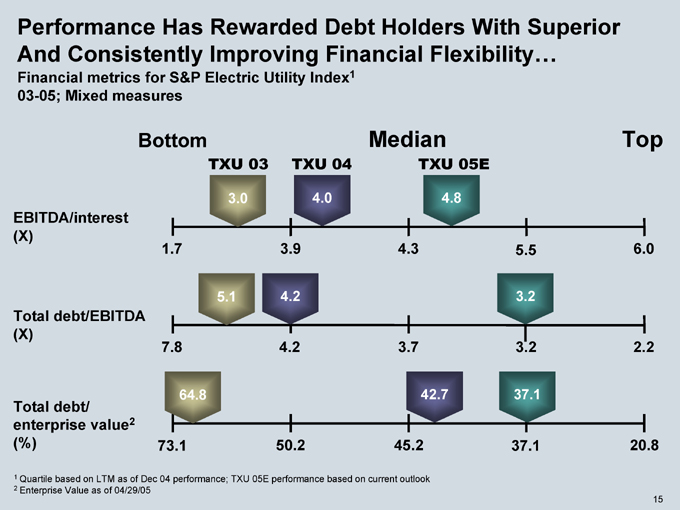
Performance Has Rewarded Debt Holders With Superior And Consistently Improving Financial Flexibility…
Financial metrics for S&P Electric Utility Index1 03-05; Mixed measures
Bottom Median Top
TXU 03 TXU 04 TXU 05E
EBITDA/interest (X)
Total debt/EBITDA (X)
Total debt/ enterprise value2 (%)
3.0
4.0
4.8
5.1
4.2
3.2
1.7 3.9 4.3 5.5 6.0
7.8 4.2 3.7 3.2 2.2
64.8
42.7
37.1
73.1 50.2 45.2 37.1 20.8
1 Quartile based on LTM as of Dec 04 performance; TXU 05E performance based on current outlook
2 Enterprise Value as of 04/29/05
15
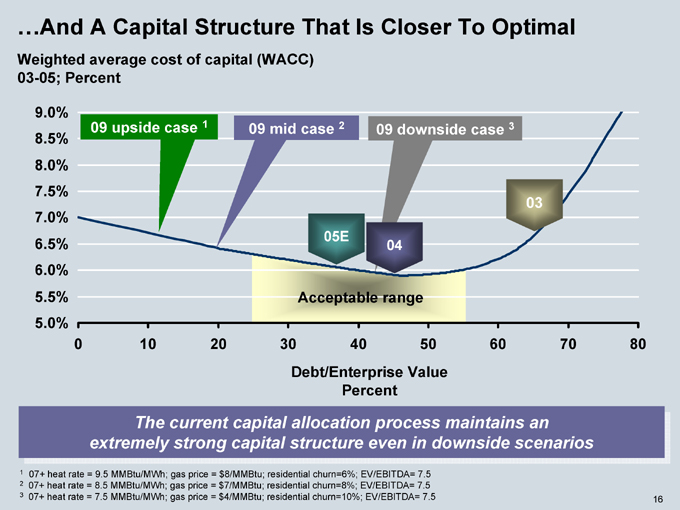
…And A Capital Structure That Is Closer To Optimal
Weighted average cost of capital (WACC) 03-05; Percent
9.0% 8.5% 8.0% 7.5% 7.0% 6.5% 6.0% 5.5% 5.0%
09 upside case 1
09 mid case 2
09 downside case 3
05E
04
03
Acceptable range
0 10 20 30 40 50 60 70 80
Debt/Enterprise Value Percent
The current capital allocation process maintains an extremely strong capital structure even in downside scenarios
1 07+ heat rate = 9.5 MMBtu/MWh; gas price = $8/MMBtu; residential churn=6%; EV/EBITDA= 7.5
2 07+ heat rate = 8.5 MMBtu/MWh; gas price = $7/MMBtu; residential churn=8%; EV/EBITDA= 7.5
3 07+ heat rate = 7.5 MMBtu/MWh; gas price = $4/MMBtu; residential churn=10%; EV/EBITDA= 7.5
16
Key Questions That Get To The Heart Of Our Business
1. What is TXU’s fundamental business strategy?
2. What are the goals of TXU’s financial strategy?
3. How is the restructured Texas electricity market performing?
4. What is TXU’s exposure to natural gas and heat rate?
5. What are TXU’s perspectives on mid and long term growth?
17
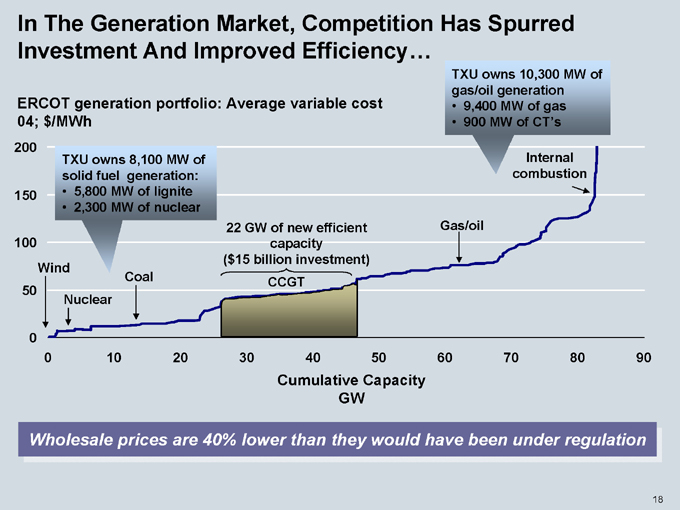
In The Generation Market, Competition Has Spurred Investment And Improved Efficiency…
TXU owns 10,300 MW of gas/oil generation
9,400 MW of gas 900 MW of CT’s
ERCOT generation portfolio: Average variable cost 04; $/MWh
200 150 100 50 0
TXU owns 8,100 MW of solid fuel generation:
5,800 MW of lignite 2,300 MW of nuclear
Wind
Nuclear
Coal
22 GW of new efficient capacity
($15 billion investment) CCGT
Gas/oil
Internal combustion
0 10 20 30 40 50 60 70 80 90
Cumulative Capacity GW
Wholesale prices are 40% lower than they would have been under regulation
18
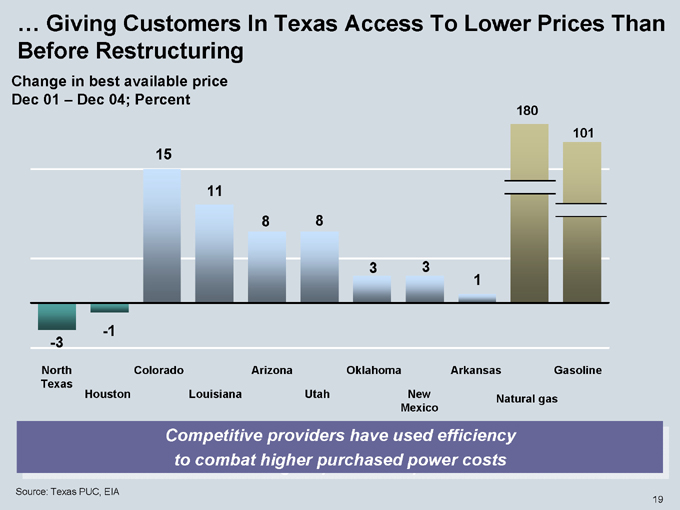
… Giving Customers In Texas Access To Lower Prices Than Before Restructuring
Change in best available price Dec 01 – Dec 04; Percent
15
11
8
8
3
3
1
180
101
-3
-1
North Texas
Houston
Colorado
Louisiana
Arizona
Utah
Oklahoma
New Mexico
Arkansas
Natural gas
Gasoline
Competitive providers have used efficiency to combat higher purchased power costs
Source: Texas PUC, EIA
19
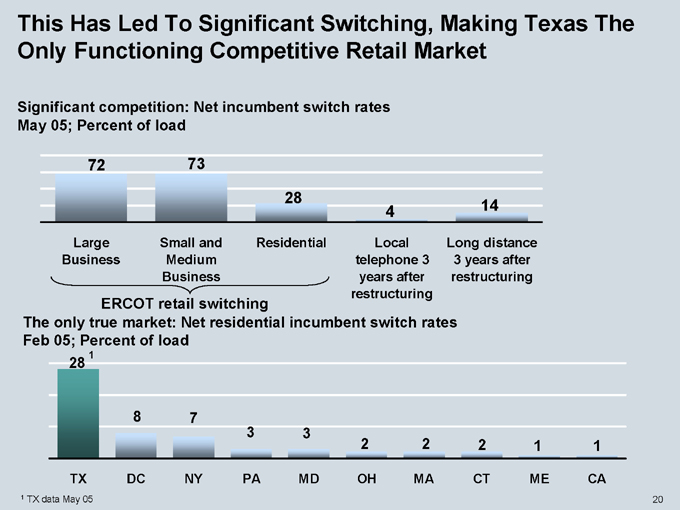
This Has Led To Significant Switching, Making Texas The Only Functioning Competitive Retail Market
Significant competition: Net incumbent switch rates May 05; Percent of load
72
73
28
4
14
Large Business
Small and Medium Business
Residential
Local telephone 3 years after restructuring
Long distance 3 years after restructuring
ERCOT retail switching
The only true market: Net residential incumbent switch rates Feb 05; Percent of load
28 1
8
7
3
3
2
2
2
1
1
TX DC NY PA MD OH MA CT ME CA
1 TX data May 05
20
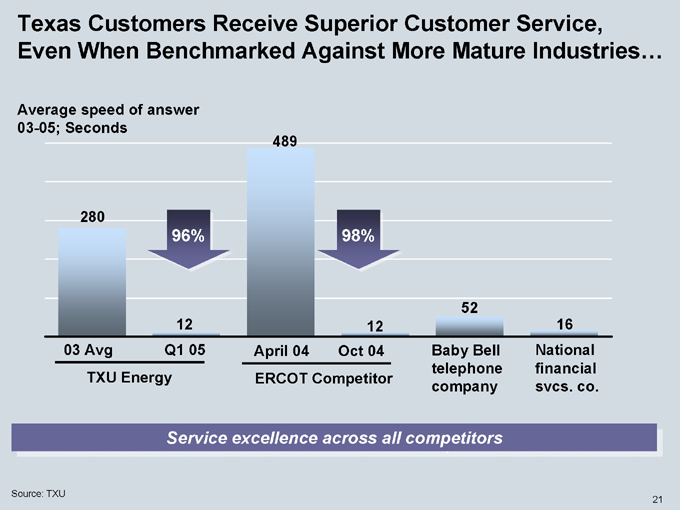
Texas Customers Receive Superior Customer Service, Even When Benchmarked Against More Mature Industries…
Average speed of answer 03-05; Seconds
280
96%
489
98%
12
12
52
16
03 Avg
Q1 05
TXU Energy
April 04
Oct 04
ERCOT Competitor
Baby Bell telephone company
National financial svcs. co.
Service excellence across all competitors
Source: TXU
21
Key Questions That Get To The Heart Of Our Business
1. What is TXU’s fundamental business strategy?
2. What are the goals of TXU’s financial strategy?
3. How is the restructured Texas electricity market performing?
4. What is TXU’s exposure to natural gas and heat rate?
5. What are TXU’s perspectives on mid and long term growth?
22
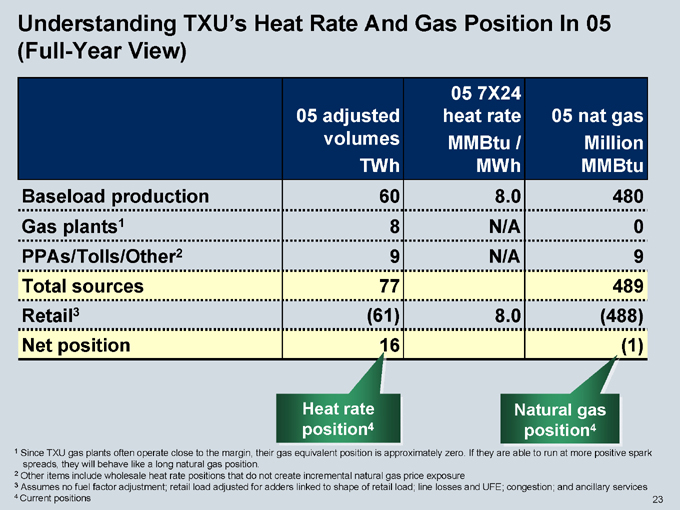
Understanding TXU’s Heat Rate And Gas Position In 05 (Full-Year View)
05 7X24
05 adjusted heat rate 05 nat gas
volumes MMBtu / Million
TWh MWh MMBtu
Baseload production 60 8.0 480
Gas plants1 8 N/A 0
PPAs/Tolls/Other2 9 N/A 9
Total sources 77 489
Retail3 (61) 8.0 (488)
Net position 16 (1)
Heat rate position4
Natural gas position4
1 Since TXU gas plants often operate close to the margin, their gas equivalent position is approximately zero. If they are able to run at more positive spark spreads, they will behave like a long natural gas position.
2 Other items include wholesale heat rate positions that do not create incremental natural gas price exposure
3 Assumes no fuel factor adjustment; retail load adjusted for adders linked to shape of retail load; line losses and UFE; congestion; and ancillary services
4 Current positions
23
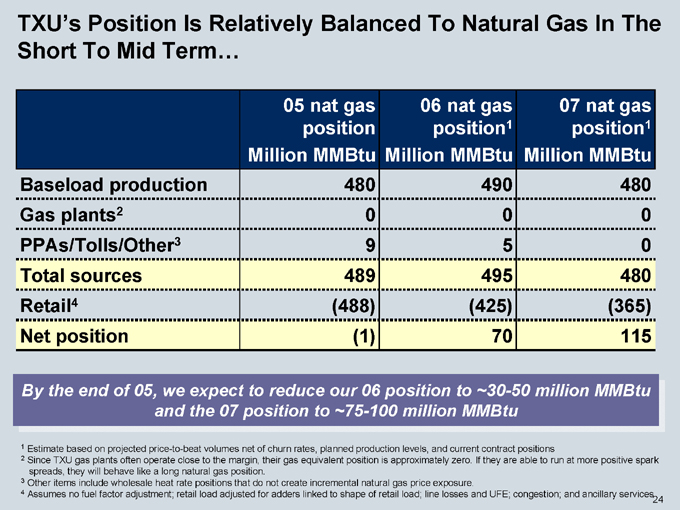
TXU’s Position Is Relatively Balanced To Natural Gas In The Short To Mid Term…
05 nat gas 06 nat gas 07 nat gas
position position1 position1
Million MMBtu Million MMBtu Million MMBtu
Baseload production 480 490 480
Gas plants2 0 0 0
PPAs/Tolls/Other3 9 5 0
Total sources 489 495 480
Retail4 (488) (425) (365)
Net position (1) 70 115
By the end of 05, we expect to reduce our 06 position to ~30-50 million MMBtu and the 07 position to ~75-100 million MMBtu
1 Estimate based on projected price-to-beat volumes net of churn rates, planned production levels, and current contract positions
2 Since TXU gas plants often operate close to the margin, their gas equivalent position is approximately zero. If they are able to run at more positive spark spreads, they will behave like a long natural gas position.
3 Other items include wholesale heat rate positions that do not create incremental natural gas price exposure.
4 Assumes no fuel factor adjustment; retail load adjusted for adders linked to shape of retail load; line losses and UFE; congestion; and ancillary services
24

… Especially Relative To Other Players In The Industry
Equivalent gas production1 Million MMBtu
Equivalent fixed price short2 Million MMBtu
Net gas position3 Million MMBtu
Company A Company B Company C
Company D
TXU Long-Term1
Company E
Company F
700
650
290
240
490
85
75
255
345
0
15
300
0
0
449
305
290
225
190
85
75
1 Estimated long term exposure (2010+)
2 Includes adders to account for shaping, line losses and congestion; Assumes residential, small, medium, and large business are short positions
3 Native risk position; excludes gas contracts and hedges
25
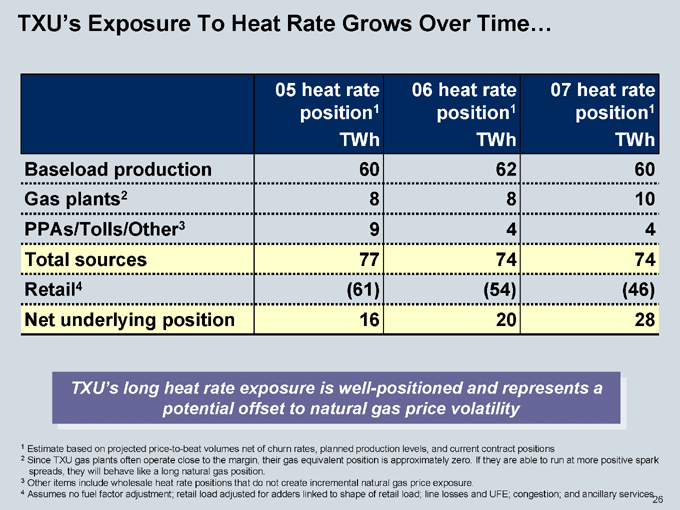
TXU’s Exposure To Heat Rate Grows Over Time…
05 heat rate 06 heat rate 07 heat rate
position1 position1 position1
TWh TWh TWh
Baseload production 60 62 60
Gas plants2 8 8 10
PPAs/Tolls/Other3 9 4 4
Total sources 77 74 74
Retail4 (61) (54) (46)
Net underlying position 16 20 28
TXU’s long heat rate exposure is well-positioned and represents a potential offset to natural gas price volatility
1 Estimate based on projected price-to-beat volumes net of churn rates, planned production levels, and current contract positions
2 Since TXU gas plants often operate close to the margin, their gas equivalent position is approximately zero. If they are able to run at more positive spark spreads, they will behave like a long natural gas position.
3 Other items include wholesale heat rate positions that do not create incremental natural gas price exposure.
4 Assumes no fuel factor adjustment; retail load adjusted for adders linked to shape of retail load; line losses and UFE; congestion; and ancillary services
26
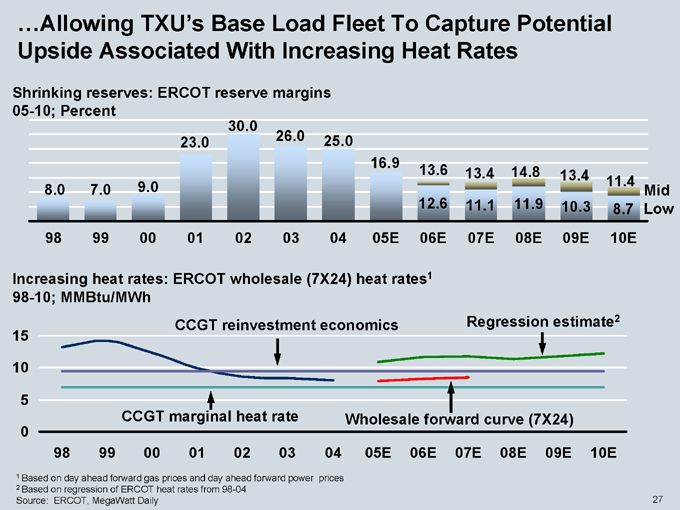
…Allowing TXU’s Base Load Fleet To Capture Potential Upside Associated With Increasing Heat Rates
Shrinking reserves: ERCOT reserve margins 05-10; Percent
8.0
7.0
9.0
23.0
30.0
26.0
25.0
16.9
13.6
13.4
14.8
13.4
11.4
Mid
12.6
11.1
11.9
10.3
8.7
Low
98 99 00 01 02 03 04 05E 06E 07E 08E 09E 10E
Increasing heat rates: ERCOT wholesale (7X24) heat rates1 98-10; MMBtu/MWh
CCGT reinvestment economics
Regression estimate2
15 10 5 0
CCGT marginal heat rate
Wholesale forward curve (7X24)
98 99 00 01 02 03 04 05E 06E 07E 08E 09E 10E
1 Based on day ahead forward gas prices and day ahead forward power prices
2 Based on regression of ERCOT heat rates from 98-04 Source: ERCOT, MegaWatt Daily
27
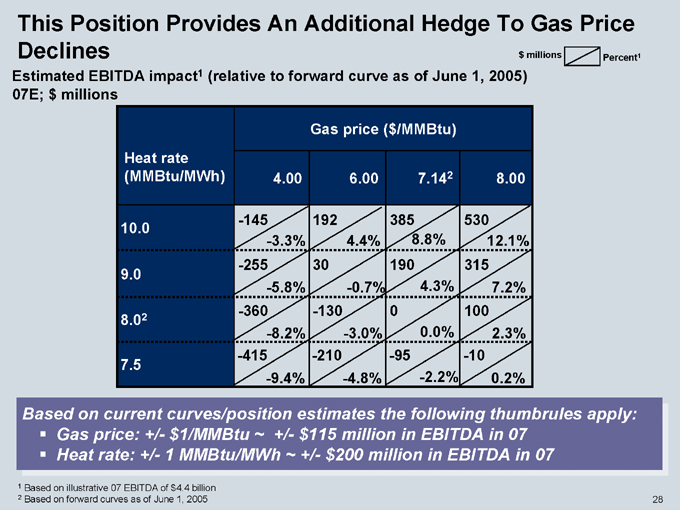
This Position Provides An Additional Hedge To Gas Price
Declines $millions Percent1
Estimated EBITDA impact1 (relative to forward curve as of June 1, 2005) 07E; $millions
Gas price ( $/MMBtu)
Heat rate
(MMBtu/MWh) 4.00 6.00 7.142 8.00
-145 192 385 530
10.0
-3.3% 4.4% 8.8% 12.1%
-255 30 190 315
9.0
-5.8% -0.7% 4.3% 7.2%
-360 -130 0 100
8.02
-8.2% -3.0% 0.0% 2.3%
-415 -210 -95 -10
7.5
-9.4% - -4.8% -2.2% 0.2%
Based on current curves/position estimates the following thumbrules apply: Gas price: +/-$1/MMBtu ~ +/- $115 million in EBITDA in 07 Heat rate: +/- 1 MMBtu/MWh~ +/-$200 million in EBITDA in 07
1 Based on illustrative 07 EBITDA of $4.4 billion
2 Based on forward curves as of June 1, 2005
28
Key Questions That Get To The Heart Of Our Business
1. What is TXU’s fundamental business strategy?
2. What are the goals of TXU’s financial strategy?
3. How is the restructured Texas electricity market performing?
4. What is TXU’s exposure to natural gas and heat rate?
5. What are TXU’s perspectives on mid and long term growth?
29
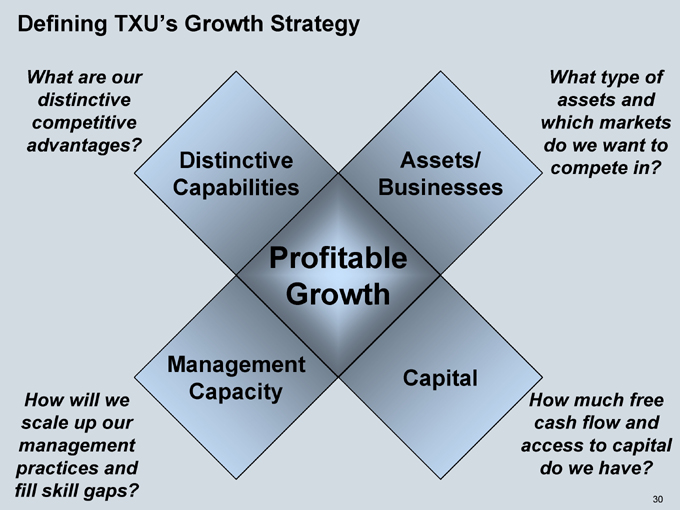
Defining TXU’s Growth Strategy
What are our distinctive competitive advantages?
Distinctive Capabilities
Assets/ Businesses
Profitable Growth
Management Capacity
Capital
What type of assets and which markets do we want to compete in?
How will we scale up our management practices and fill skill gaps?
How much free cash flow and access to capital do we have?
30
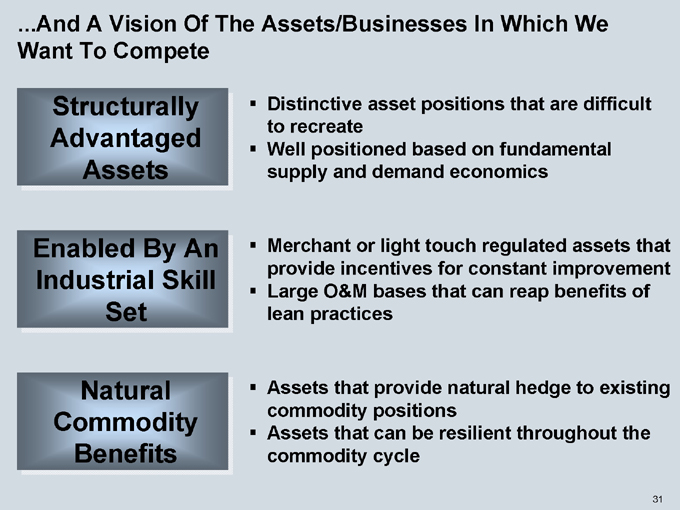
…And A Vision Of The Assets/Businesses In Which We Want To Compete
Structurally Advantaged Assets
Distinctive asset positions that are difficult to recreate Well positioned based on fundamental supply and demand economics
Enabled By An Industrial Skill Set
Merchant or light touch regulated assets that provide incentives for constant improvement Large O&M bases that can reap benefits of lean practices
Natural Commodity Benefits
Assets that provide natural hedge to existing commodity positions Assets that can be resilient throughout the commodity cycle
31
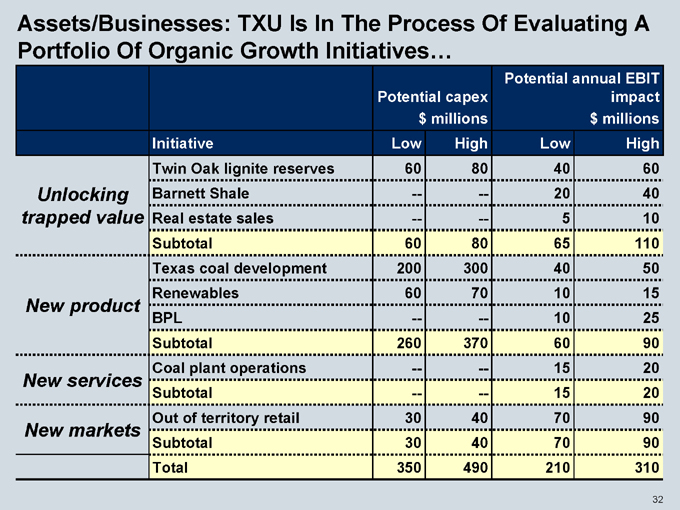
Potential annual EBIT
Potential capex impact
$millions $millions
Initiative Low High Low High
Twin Oak lignite reserves 60 80 40 60
Unlocking Barnett Shale — — 20 40
trapped value Real estate sales — — 5 10
Subtotal 60 80 65 110
Texas coal development 200 300 40 50
Renewables 60 70 10 15
New product
BPL — — 10 25
Subtotal 260 370 60 90
Coal plant operations — — 15 20
New services
Subtotal — — 15 20
Out of territory retail 30 40 70 90
New markets
Subtotal 30 40 70 90
Total 350 490 210 310
Assets/Businesses: TXU Is In The Process Of Evaluating A Portfolio Of Organic Growth Initiatives…
32
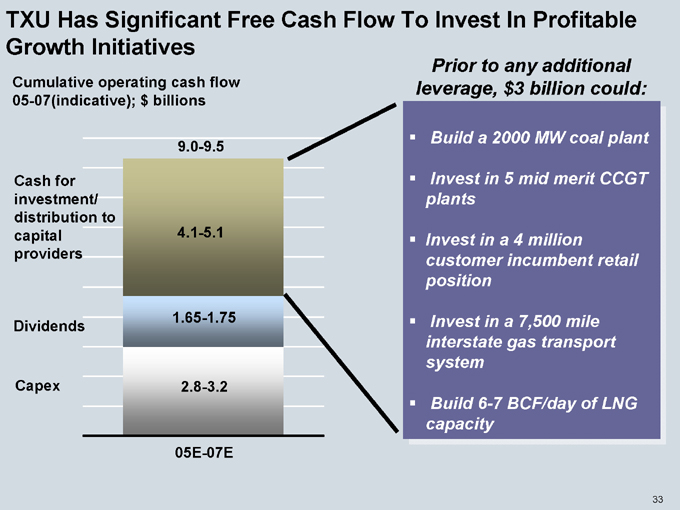
TXU Has Significant Free Cash Flow To Invest In Profitable Growth Initiatives
Cumulative operating cash flow 05-07(indicative); $billions
Cash for investment/ distribution to capital providers
Dividends
Capex
9.0-9.5
4.1-5.1
1.65-1.75
2.8-3.2
05E-07E
Prior to any additional leverage, $3 billion could:
Build a 2000 MW coal plant
Invest in 5 mid merit CCGT
Invest in a 4 million customer incumbent retail position
Invest in a 7,500 mile interstate gas transport system
Build 6-7 BCF/day of LNG capacity
33
TXU: A Structurally Advantaged Portfolio With Significant Upside
Focused on continuous improvement of three structurally advantaged core businesses to deliver superior financial metrics
2X earnings power
Double digit ROIC
Top quartile financial flexibility
Financial strategy based around maximizing cash returns to stakeholders
Integrated business model is resilient under multiple scenarios with relatively low gas risk and with large heat rate upside
Evaluating intrinsic and extrinsic growth options while maintaining a disciplined capital allocation approach
34

Q & A Discussion
35
Appendix – Financial Definitions and Regulation G Reconciliations
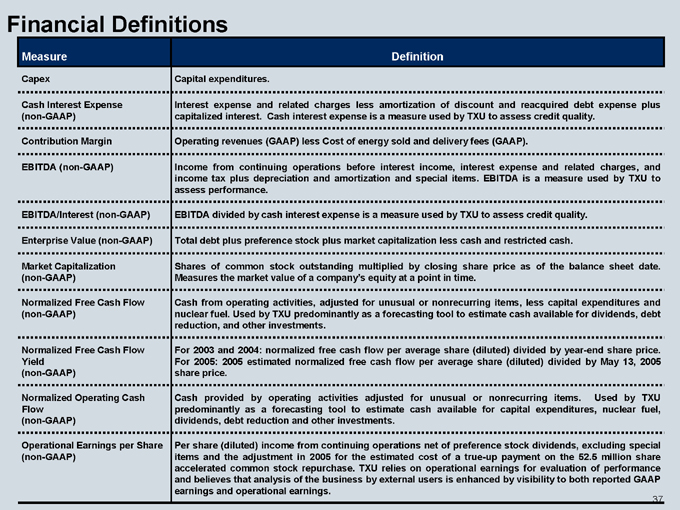
Financial Definitions
Measure Definition
Capex Capital expenditures.
Cash Interest Expense Interest expense and related charges less amortization of discount and reacquired debt expense plus
(non-GAAP) capitalized interest. Cash interest expense is a measure used by TXU to assess credit quality.
Contribution Margin Operating revenues (GAAP) less Cost of energy sold and delivery fees (GAAP).
EBITDA (non-GAAP) Income from continuing operations before interest income, interest expense and related charges, and
income tax plus depreciation and amortization and special items. EBITDA is a measure used by TXU to
assess performance.
EBITDA/Interest (non-GAAP) EBITDA divided by cash interest expense is a measure used by TXU to assess credit quality.
Enterprise Value (non-GAAP) Total debt plus preference stock plus market capitalization less cash and restricted cash.
Market Capitalization Shares of common stock outstanding multiplied by closing share price as of the balance sheet date.
(non-GAAP) Measures the market value of a company’s equity at a point in time.
Normalized Free Cash Flow Cash from operating activities, adjusted for unusual or nonrecurring items, less capital expenditures and
(non-GAAP) nuclear fuel. Used by TXU predominantly as a forecasting tool to estimate cash available for dividends, debt
reduction, and other investments.
Normalized Free Cash Flow For 2003 and 2004: normalized free cash flow per average share (diluted) divided by year-end share price.
Yield For 2005: 2005 estimated normalized free cash flow per average share (diluted) divided by May 13, 2005
(non-GAAP) share price.
Normalized Operating Cash Cash provided by operating activities adjusted for unusual or nonrecurring items. Used by TXU
Flow predominantly as a forecasting tool to estimate cash available for capital expenditures, nuclear fuel,
(non-GAAP) dividends, debt reduction and other investments.
Operational Earnings per Share Per share (diluted) income from continuing operations net of preference stock dividends, excluding special
(non-GAAP) items and the adjustment in 2005 for the estimated cost of a true-up payment on the 52.5 million share
accelerated common stock repurchase. TXU relies on operational earnings for evaluation of performance
and believes that analysis of the business by external users is enhanced by visibility to both reported GAAP
earnings and operational earnings.
37
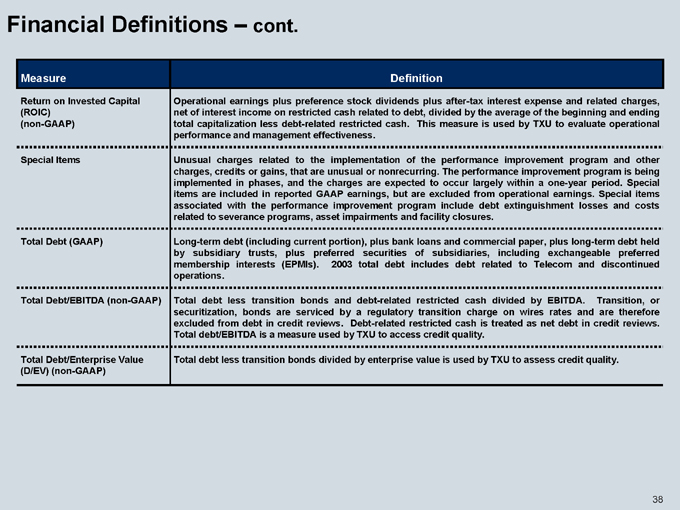
Financial Definitions – cont.
Measure Definition
Return on Invested Capital Operational earnings plus preference stock dividends plus after-tax interest expense and related charges,
(ROIC) net of interest income on restricted cash related to debt, divided by the average of the beginning and ending
(non-GAAP) total capitalization less debt-related restricted cash. This measure is used by TXU to evaluate operational
performance and management effectiveness.
Special Items Unusual charges related to the implementation of the performance improvement program and other
charges, credits or gains, that are unusual or nonrecurring. The performance improvement program is being
implemented in phases, and the charges are expected to occur largely within a one-year period. Special
items are included in reported GAAP earnings, but are excluded from operational earnings. Special items
associated with the performance improvement program include debt extinguishment losses and costs
related to severance programs, asset impairments and facility closures.
Total Debt (GAAP) Long-term debt (including current portion), plus bank loans and commercial paper, plus long-term debt held
by subsidiary trusts, plus preferred securities of subsidiaries, including exchangeable preferred
membership interests (EPMIs). 2003 total debt includes debt related to Telecom and discontinued
operations.
Total Debt/EBITDA (non-GAAP) Total debt less transition bonds and debt-related restricted cash divided by EBITDA. Transition, or
securitization, bonds are serviced by a regulatory transition charge on wires rates and are therefore
excluded from debt in credit reviews. Debt-related restricted cash is treated as net debt in credit reviews.
Total debt/EBITDA is a measure used by TXU to access credit quality.
Total Debt/Enterprise Value Total debt less transition bonds divided by enterprise value is used by TXU to assess credit quality.
(D/EV) (non-GAAP)
38

Table 1: TXU Corp. Operational Earnings Reconciliation Twelve Months Ended December 31, 2004 and 2003 $per share after tax
04 03
Net income (loss) to common (1.29) 1.62
Discontinued operations (1.26) (0.20)
Extraordinary gain (0.05) -
Cum. effect of changes in accounting principles (0.03) 0.15
Premium on EPMIs 2.83 -
Preference stock dividends 0.07 0.06
Income from continuing operations 0.27 1.63
Preference stock dividends (0.07) (0.06)
Effect of diluted shares calculation 0.04 0.01
Special items 2.58 -
Operational earnings 2.82 1.58
39
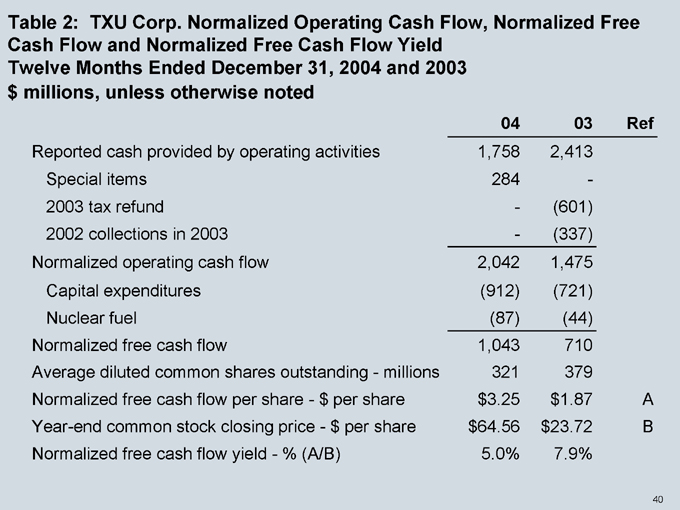
Table 2: TXU Corp. Normalized Operating Cash Flow, Normalized Free Cash Flow and Normalized Free Cash Flow Yield Twelve Months Ended December 31, 2004 and 2003 $millions, unless otherwise noted
04 03 Ref
Reported cash provided by operating activities 1,758 2,413
Special items 284 -
2003 tax refund - (601)
2002 collections in 2003 - (337)
Normalized operating cash flow 2,042 1,475
Capital expenditures (912) (721)
Nuclear fuel (87) (44)
Normalized free cash flow 1,043 710
Average diluted common shares outstanding—millions 321 379
Normalized free cash flow per share—$per share $ 3.25 $1.87 A
Year-end common stock closing price - $per share $ 64.56 $ 23.72 B
Normalized free cash flow yield - % (A/B) 5.0% 7.9%
40
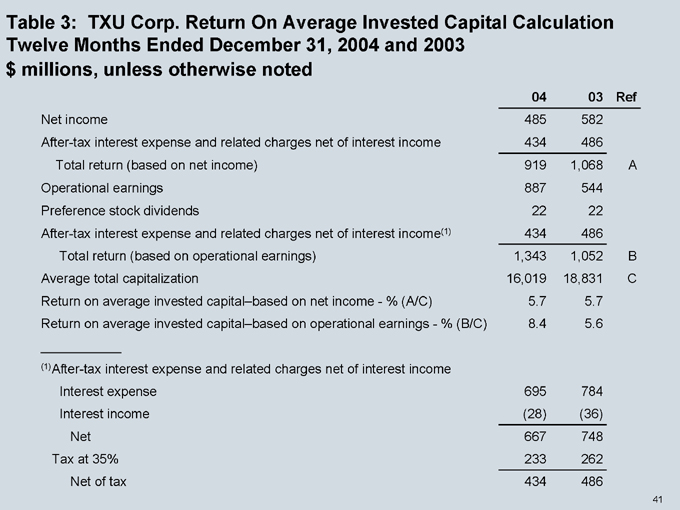
Table 3: TXU Corp. Return On Average Invested Capital Calculation Twelve Months Ended December 31, 2004 and 2003 $millions, unless otherwise noted
04 03 Ref
Net income 485 582
After-tax interest expense and related charges net of interest income 434 486
Total return (based on net income) 919 1,068 A
Operational earnings 887 544
Preference stock dividends 22 22
After-tax interest expense and related charges net of interest income(1) 434 486
Total return (based on operational earnings) 1,343 1,052 B
Average total capitalization 16,019 18,831 C
Return on average invested capital–based on net income - % (A/C) 5.7 5.7
Return on average invested capital–based on operational earnings - % (B/C) 8.4 5.6
(1)After-tax interest expense and related charges net of interest income
Interest expense 695 784
Interest income (28) (36)
Net 667 748
Tax at 35% 233 262
Net of tax 434 486
41
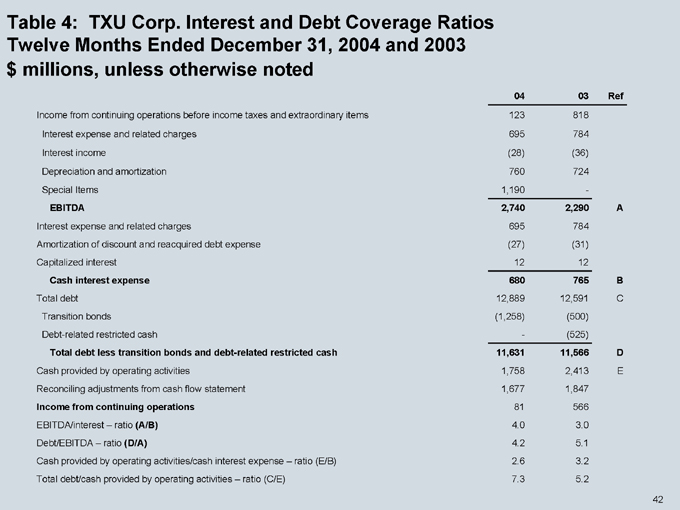
Table 4: TXU Corp. Interest and Debt Coverage Ratios Twelve Months Ended December 31, 2004 and 2003 $millions, unless otherwise noted
04 03 Ref
Income from continuing operations before income taxes and extraordinary items 123 818
Interest expense and related charges 695 784
Interest income (28) (36)
Depreciation and amortization 760 724
Special Items 1,190 -
EBITDA 2,740 2,290 A
Interest expense and related charges 695 784
Amortization of discount and reacquired debt expense (27) (31)
Capitalized interest 12 12
Cash interest expense 680 765 B
Total debt 12,889 12,591 C
Transition bonds (1,258) (500)
Debt-related restricted cash - (525)
Total debt less transition bonds and debt-related restricted cash 11,631 11,566 D
Cash provided by operating activities 1,758 2,413 E
Reconciling adjustments from cash flow statement 1,677 1,847
Income from continuing operations 81 566
EBITDA/interest – ratio (A/B) 4.0 3.0
Debt/EBITDA – ratio (D/A) 4.2 5.1
Cash provided by operating activities/cash interest expense – ratio (E/B) 2.6 3.2
Total debt/cash provided by operating activities – ratio (C/E) 7.3 5.2
42
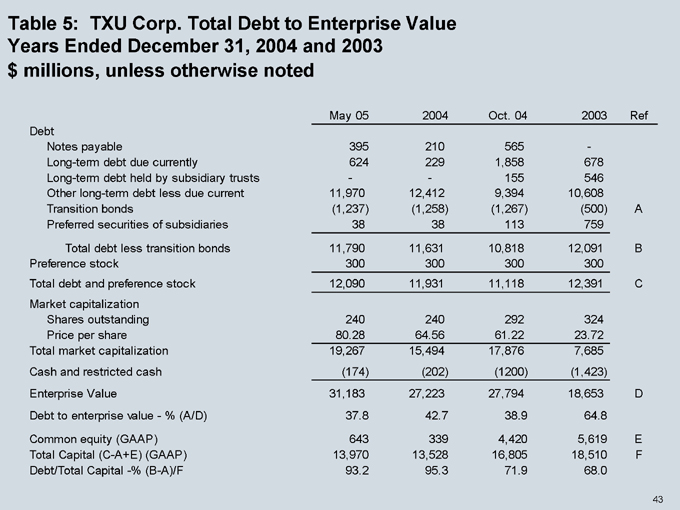
Table 5: TXU Corp. Total Debt to Enterprise Value Years Ended December 31, 2004 and 2003 $millions, unless otherwise noted
May 05 2004 Oct. 04 2003 Ref
Debt
Notes payable 395 210 565 -
Long-term debt due currently 624 229 1,858 678
Long-term debt held by subsidiary trusts - - 155 546
Other long-term debt less due current 11,970 12,412 9,394 10,608
Transition bonds (1,237) (1,258) (1,267) (500) A
Preferred securities of subsidiaries 38 38 113 759
Total debt less transition bonds 11,790 11,631 10,818 12,091 B
Preference stock 300 300 300 300
Total debt and preference stock 12,090 11,931 11,118 12,391 C
Market capitalization
Shares outstanding 240 240 292 324
Price per share 80.28 64.56 61.22 23.72
Total market capitalization 19,267 15,494 17,876 7,685
Cash and restricted cash (174) (202) (1200) (1,423)
Enterprise Value 31,183 27,223 27,794 18,653 D
Debt to enterprise value—% (A/D) 37.8 42.7 38.9 64.8
Common equity (GAAP) 643 339 4,420 5,619 E
Total Capital (C-A+E) (GAAP) 13,970 13,528 16,805 18,510 F
Debt/Total Capital -% (B-A)/F 93.2 95.3 71.9 68.0
43