UNITED STATES
SECURITIES AND EXCHANGE COMMISSION
Washington, D.C. 20549
FORM N-CSR
CERTIFIED SHAREHOLDER REPORT OF REGISTERED
MANAGEMENT INVESTMENT COMPANIES
Investment Company Act file number: 811-3618
METROPOLITAN SERIES FUND
(Exact name of registrant as specified in charter)
One Financial Center
Boston, MA 02111
(Address of principal executive offices)(Zip code)
| | |
| (Name and Address of Agent for Service) | | Copy to: |
| |
| Michael P. Lawlor | | David C. Mahaffey, Esq. |
c/o MetLife Advisers, LLC One Financial Center Boston, MA 02111 | | Sullivan & Worcester LLP 1666 K Street, N.W. Washington, D.C. 20006 |
Registrant’s telephone number, including area code: 617-578-4036
Date of fiscal year end: December 31
Date of reporting period: January 1, 2013 through December 31, 2013
| Item 1: | Report to Shareholders. |
The following is a copy of the report transmitted to stockholders pursuant to Rule 30e-1 under the Investment Company Act of 1940 (the “Act”):
Metropolitan Series Fund
Baillie Gifford International Stock Portfolio
Managed by Baillie Gifford Overseas Limited
Portfolio Manager Commentary*
PERFORMANCE
For the one year period ended December 31, 2013, the Class A, B, and E shares of the Baillie Gifford International Stock Portfolio returned 15.54%, 15.14%, and 15.30%, respectively. The Portfolio’s benchmark, the MSCI All Country World ex-U.S. Index1, returned 15.29%.
MARKET ENVIRONMENT / CONDITIONS
2013 was a healthy year overall in international equity markets, however there was a notable division between the strength of developed markets, where economic growth now appears to be on a rather sounder footing, and the emerging markets, mostly affecting countries with large current account deficits, such as Turkey. This weakness in emerging markets is in part due to cyclical factors, slowing economic growth, but was compounded by a return of liquidity to developed markets, most notably following indications that the Federal Reserve would begin tapering quantitative easing. While the market remained fixated on the fallout from the exceptional monetary policy of recent years, it was these longer term factors that were key for the companies. As growth gathered momentum in the developed markets, many worried that there was inflationary potential associated with the expansion of central bank balance sheets over recent years. We have instead recently considered the potential for Japanese efforts to weaken the yen and continuing shale gas development to act as deflationary forces within the world economy. In an open global economy, it is possible that structural factors combine to trump monetary orthodoxy, just as China’s industrialisation was generally held to be a contributor to the low inflation environment of the 2000’s.
Wages, in real terms, have either worsened or failed to improve for some years for many workers in the developed markets and measures of inequality illustrate a widening gap between poor and rich. News stories about companies which pay the minimum wage actively encouraging their workers to seek government assistance to supplement their wages have raised public awareness of the issue. With governments looking to reduce welfare spending, subsidies destined for working people seem an obvious place to start and the campaign for a living wage seems to be gathering attention in political discourse. In Switzerland, an initiative to vote on a guaranteed basic income for all citizens has raised the required number of petitioners to be put to a national vote. Obviously, labor costs are of key importance to us as equity investors. Rising wages could have a significant effect on corporate earnings in the absence of accompanying productivity gains. On the other hand, increasing automation already threatens many low wage jobs and, with high unemployment, companies hold a strong hand in negotiations. Meanwhile, labour unrest appears to be increasing at many of those companies most associated with the minimum wage, minimum benefit model in developed markets while producers in China, particularly in the export focused Eastern provinces, who have relied on low wages as a competitive advantage are now struggling to remain globally competitive. Increased emphasis on productivity, through investment in automation or improved incentives, would seem to be the logical response and requires a quite different management mindset.
The energy supply backdrop is an area where we have seen significant change which has partially contributed to share price weakness in the sector along with weaker growth in emerging markets. The most immediate catalyst for change has been the rapid rise of shale gas as an alternative source of supply within the U.S. and the use of fracking technology is now spreading further. Both the U.K. and China, for example, have potentially significant gas reserves with the U.K. having doubled reserve estimates during the year. The ‘peak oil’ debate seems to have quietened while the effect on the geo-politics of oil supply which have dominated foreign policy in the Middle East for decades are unclear. Whilst this is the most notable change within fossil fuel markets and has the most bearing on current energy costs, it would be naive to underestimate the potential for upsets from alternative sources. Solar power costs are falling rapidly, while battery and energy storage technology is improving significantly.
PORTFOLIO REVIEW / PERIOD END POSITIONING
Due to the bottom-up nature of the Portfolio, the majority of relative performance was driven by stock selection. Specifically, in the first half of the year stock selection in the U.K. and Developed Asia hurt relative performance whilst stock selection in Continental Europe and Emerging Markets was most helpful over the period. The second half of the year largely reversed that stock selection effect as U.K. and Developed Asian stocks contributed most to performance along with stock selection in Emerging Markets continuing to add value. Indeed, despite the market returns for Emerging Markets being the weakest of the benchmark regions, over 2013 as a whole it was Emerging Market stocks that contributed most positively to the relative Portfolio performance.
Among the more significant detractors over the year were the stocks that the Portfolio holds in the Energy sector, despite an underweight position. To a large extent we would attribute this to the general sentiment towards the sector, particularly fears over growth in China and the Emerging Markets though we took the decision to sell China Shenhua Energy (China) as coal demand slowed and the advantage of its dedicated rail network appears to be under threat. The Materials sector benchmark returns were yet worse. However, there we were helped by a slight underweight and stock selection within that though copper giant Antofagasta (Chile) and diversified miner Rio Tinto (Australia) both detracted. The Portfolio also had one stock specific disappointment in the Energy sector, Kunlun Energy (China). The Chairman of the company became embroiled in a corruption investigation into the activities of parent PetroChina and we took the decision to sell. In addition to earlier sales of Brazilian national oil company Petrobras (Brazil) and Japanese oil company Inpex (Japan), this has taken us from a neutral to underweight position in the Energy sector. We have no significant directional view on the oil price but note that the rapid adoption of fracking technology has changed the supply and cost backdrop materially within the sector with consequent effects for individual companies’ competitive advantages within it. Other detractors within the Energy sector included Tullow Oil (U.K.) which had some drilling disappointments over the latter
MSF-1
Metropolitan Series Fund
Baillie Gifford International Stock Portfolio
Managed by Baillie Gifford Overseas Limited
Portfolio Manager Commentary*—(Continued)
part of the year. However, we still consider that the quality of Tullow’s acreage and its long-term drilling record make it stand out from exploration & production peers. We are also heartened by the company’s efforts to draw back from the more ambitious production projects and seek partners in exploiting the many fields that it is bringing on stream.
Several of the Portfolio’s Emerging Markets holdings were particularly hard hit during the so called ‘taper tantrum’ when early indications of the Federal Reserve’s intentions to scale back quantitative easing were announced. The accompanying withdrawal of liquidity from Emerging Markets was primarily concentrated amongst those countries with large current account deficits including Turkey and India. For this reason, returns from holdings such as Turkish hard discount super market BIM (Turkey), Garanti Bank (Turkey) and infrastructure bank IDFC (India) were particularly negative. On an operational basis however, we remain satisfied that the long term factors underpinning our initial investment remain intact in each specific case.
By far the most significant positive contributors to performance over the year were internet related companies, particularly within the Emerging Markets. The Portfolio’s holdings in Naspers (South Africa—internet and media conglomerate), Baidu (China – search engine), Naver Corp (South Korea—search and messaging portal) and MercadoLibre (Argentinia—e-commerce platform) were all among the positive contributors over 2013. This contribution comes against a backdrop of strong returns across internet based companies. With valuations in the sector looking rather generous, we have cut back several of the holdings to re-invest elsewhere.
At a regional level, the Portfolio has maintained a sustained underweight to Japan for some time. As a growth manager, we have struggled to find attractive holdings within a domestic market experiencing deflation and deleveraging whilst the past strength of the Yen and competition from China have made life difficult for Japan’s large exporters. Thanks to the advent of ‘Abenomics’, Japan was one of the strongest markets during 2013, however our underweight position did not hurt performance thanks to stock selection, most notably holding the internet mall operator Rakuten (Japan) along with Fast Retailing (Japan), owner of the fast expanding Uniqlo brand.
After a sustained period of no exposure to the Telecom sector, the Portfolio purchased two holdings during the year, China Mobile (China), the dominant Chinese network and SK Telecom (South Korea). Our overweight exposure to the Industrials sector also increased over 2013; we took a holding in chemical distributor Brenntag (Germany) where we believe that there is scope for the industry to consolidate further, improving returns. We also took a position in aero and marine engine company, Rolls-Royce (U.K.). The market for jet engines is an attractive duopoly with long contracts and high value servicing.
Jonathan Bates
Angus Franklin
Portfolio Managers
Baillie Gifford Overseas Limited
* This commentary may include statements that constitute “forward-looking statements” under the U.S. securities laws. Forward-looking statements include, among other things, projections, estimates, and information about possible or future results related to the Portfolio, market or regulatory developments. The views expressed above are not guarantees of future performance or economic results and involve certain risks, uncertainties and assumptions that could cause actual outcomes and results to differ materially from the views expressed herein. The views expressed above are subject to change at any time based upon economic, market, or other conditions and the subadvisory firm undertakes no obligation to update the views expressed herein. Any discussions of specific securities should not be considered a recommendation to buy or sell those securities. The views expressed above (including any forward-looking statement) may not be relied upon as investment advice or as an indication of the Portfolio’s trading intent. Information about the Portfolio’s holdings, asset allocation or country diversification is historical and is not an indication of future Portfolio composition, which may vary. Direct investment in any index is not possible. The performance of any index mentioned in this commentary has not been adjusted for ongoing management, distribution and operating expenses, and sales charges applicable to mutual fund investments. In addition, the returns do not reflect additional fees charged by separate accounts or variable insurance contracts that an investor in the Portfolio may pay. If these additional fees were reflected, performance would have been lower.
MSF-2
Metropolitan Series Fund
Baillie Gifford International Stock Portfolio
A $10,000 INVESTMENT COMPARED TO THE MSCI ALL COUNTRY WORLD EX-U.S. INDEX

AVERAGE ANNUAL RETURNS (%) (FOR THE YEAR ENDED DECEMBER 31, 2013)
| | | | | | | | | | | | |
| | | 1 Year | | | 5 Year | | | 10 Year | |
| Baillie Gifford International Stock Portfolio | | | | | | | | | | | | |
Class A | | | 15.54 | | | | 7.70 | | | | 3.80 | |
Class B | | | 15.14 | | | | 7.41 | | | | 3.53 | |
Class E | | | 15.30 | | | | 7.54 | | | | 3.64 | |
| MSCI All Country World ex-U.S. Index | | | 15.29 | | | | 12.81 | | | | 7.57 | |
1 The MSCI All Country World ex-U.S. Index is an unmanaged free float-adjusted market capitalization index that is designed to measure equity market performance in the global developed and emerging markets, excluding the U.S. The Index returns shown above were calculated with net dividends: they reflect the reinvestment of dividends after the deduction of the maximum possible withholding taxes.
Portfolio performance is calculated including reinvestment of all income and capital gain distributions. Performance numbers are net of all Portfolio expenses but do not include any insurance, sales, separate account or administrative charges of variable annuity or life insurance contracts or any additional expenses that participants may bear relating to the operations of their plans. If these charges were included, the returns would be lower. The performance of any index referenced above has not been adjusted for ongoing management, distribution and operating expenses, and sales charges applicable to mutual fund investments. Direct investment in any index is not possible. The performance of Class A shares, as set forth in the line graph above, will differ from that of other classes because of the difference in expenses paid by policyholders investing in the different share classes.
This information represents past performance and is not indicative of future results. Investment return and principal value may fluctuate so that shares, upon redemption, may be worth more or less than the original cost.
PORTFOLIO COMPOSITION AS OF DECEMBER 31, 2013
Top Holdings
| | | | |
| | |
% of
Net Assets | |
| Samsung Electronics Co., Ltd. | | | 2.8 | |
| Nestle S.A. | | | 2.7 | |
| Naspers, Ltd. - N Shares | | | 2.7 | |
| Taiwan Semiconductor Manufacturing Co., Ltd. | | | 2.4 | |
| Rio Tinto plc | | | 2.4 | |
| Svenska Handelsbanken AB - A Shares | | | 2.3 | |
| ARM Holdings plc | | | 2.2 | |
| Kone Oyj - Class B | | | 2.1 | |
| Atlas Copco AB - B Shares | | | 2.0 | |
| British American Tobacco plc | | | 1.8 | |
Top Countries
| | | | |
| | | % of
Market Value of
Total Investments | |
| United Kingdom | | | 20.0 | |
| Japan | | | 9.6 | |
| Germany | | | 6.7 | |
| South Korea | | | 5.3 | |
| Sweden | | | 5.1 | |
| Ireland | | | 4.7 | |
| Switzerland | | | 4.1 | |
| Finland | | | 3.6 | |
| Denmark | | | 3.4 | |
| France | | | 3.2 | |
MSF-3
Metropolitan Series Fund
Baillie Gifford International Stock Portfolio
Understanding Your Portfolio’s Expenses
Shareholder Expense Example
As a shareholder of the Portfolio, you incur ongoing costs, including management fees; distribution and service (12b-1) fees; and other Portfolio expenses. This example is intended to help you understand your ongoing costs (in dollars) (referred to as “expenses”) of investing in the Portfolio and compare these costs with the ongoing costs of investing in other mutual funds. The example is based on an investment of $1,000 invested at the beginning of the period and held for the entire period, July 1, 2013 through December 31, 2013.
Actual Expenses
The first line for each share class of the Portfolio in the table below provides information about actual account values and actual expenses. You may use the information in this line, together with the amount you invested in the particular share class of the Portfolio, to estimate the expenses that you paid over the period. Simply divide your account value by $1,000 (for example, an $8,600 account value divided by $1,000 = 8.6), then multiply the result by the number in the first line under the heading entitled “Expenses Paid During Period” to estimate the expenses you paid on your account during this period.
Hypothetical Example for Comparison Purposes
The second line for each share class of the Portfolio in the table below provides information about hypothetical account values and hypothetical expenses based on the Portfolio’s actual expense ratio and an assumed rate of return of 5% per year before expenses, which is not the Portfolio’s actual return. The hypothetical account values and expenses may not be used to estimate the actual ending account balance or expenses you paid for the period. You may use this information to compare the ongoing costs of investing in the Portfolio and other funds. To do so, compare this 5% hypothetical example with the 5% hypothetical examples that appear in the shareholder reports of the other funds.
Please note that the expenses shown in the table are meant to highlight your ongoing costs only and do not reflect any fees or charges of your variable insurance product or any additional expenses that participants in certain eligible qualified plans may bear relating to the operations of their plan. Therefore, the second line for each share class in the table is useful in comparing ongoing costs only, and will not help you determine the relative total costs of owning different funds. In addition, if these other costs were included, your costs would have been higher.
| | | | | | | | | | | | | | | | | | |
Baillie Gifford International Stock Portfolio | | | | Annualized
Expense
Ratio | | | Beginning
Account Value
July 1,
2013 | | | Ending
Account Value
December 31,
2013 | | | Expenses Paid
During Period**
July 1, 2013
to
December 31,
2013 | |
Class A(a) | | Actual | | | 0.76 | % | | $ | 1,000.00 | | | $ | 1,167.20 | | | $ | 4.15 | |
| | Hypothetical* | | | 0.76 | % | | $ | 1,000.00 | | | $ | 1,021.37 | | | $ | 3.87 | |
| | | | | |
Class B(a) | | Actual | | | 1.03 | % | | $ | 1,000.00 | | | $ | 1,165.00 | | | $ | 5.62 | |
| | Hypothetical* | | | 1.03 | % | | $ | 1,000.00 | | | $ | 1,020.01 | | | $ | 5.24 | |
| | | | | |
Class E(a) | | Actual | | | 0.91 | % | | $ | 1,000.00 | | | $ | 1,166.70 | | | $ | 4.97 | |
| | Hypothetical* | | | 0.91 | % | | $ | 1,000.00 | | | $ | 1,020.62 | | | $ | 4.63 | |
* Hypothetical assumes a rate of return of 5% per year before expenses.
** Expenses paid are equal to the Portfolio’s annualized expense ratio for the most recent six month period, as shown above, multiplied by the average account value over the period, multiplied by the number of days (184 days) in the most recent fiscal half-year, divided by 365 (to reflect the one-half year period).
(a) The annualized expense ratio shown reflects the impact of the management fee waiver as described in Note 6 of the Notes to Financial Statements.
MSF-4
Metropolitan Series Fund
Baillie Gifford International Stock Portfolio
Schedule of Investments as of December 31, 2013
Common Stocks—98.6% of Net Assets
| | | | | | | | |
| Security Description | | Shares | | | Value | |
|
Argentina—1.2% | |
MercadoLibre, Inc. (a) | | | 241,338 | | | $ | 26,013,823 | |
| | | | | | | | |
|
Australia—3.0% | |
Brambles, Ltd. | | | 2,699,158 | | | | 22,060,730 | |
Cochlear, Ltd. (a) | | | 254,010 | | | | 13,367,661 | |
Treasury Wine Estates, Ltd. | | | 2,934,567 | | | | 12,633,590 | |
Woolworths, Ltd. | | | 545,520 | | | | 16,492,664 | |
| | | | | | | | |
| | | | | | | 64,554,645 | |
| | | | | | | | |
|
Brazil—1.4% | |
Embraer S.A. (ADR) | | | 596,376 | | | | 19,191,380 | |
Itau Unibanco Holding S.A. (ADR) | | | 745,490 | | | | 10,116,299 | |
| | | | | | | | |
| | | | | | | 29,307,679 | |
| | | | | | | | |
|
Canada—2.6% | |
Cenovus Energy, Inc. | | | 318,499 | | | | 9,114,963 | |
Fairfax Financial Holdings, Ltd. | | | 75,060 | | | | 29,968,178 | |
Ritchie Bros. Auctioneers, Inc. (a) | | | 509,626 | | | | 11,685,724 | |
Westport Innovations, Inc. (b) | | | 302,851 | | | | 5,927,298 | |
| | | | | | | | |
| | | | | | | 56,696,163 | |
| | | | | | | | |
|
China—2.7% | |
Baidu, Inc. (ADR) (b) | | | 171,400 | | | | 30,488,632 | |
Sun Art Retail Group, Ltd. (a) | | | 6,227,000 | | | | 8,761,800 | |
Want Want China Holdings, Ltd. (a) | | | 12,275,626 | | | | 17,787,129 | |
| | | | | | | | |
| | | | | | | 57,037,561 | |
| | | | | | | | |
|
Denmark—3.4% | |
DSV A/S | | | 864,812 | | | | 28,420,720 | |
Novo Nordisk A/S - Class B | | | 122,992 | | | | 22,658,983 | |
Novozymes A/S - B Shares | | | 517,776 | | | | 21,904,107 | |
| | | | | | | | |
| | | | | | | 72,983,810 | |
| | | | | | | | |
|
Finland—3.6% | |
Kone Oyj - Class B (a) | | | 982,020 | | | | 44,524,502 | |
Sampo Oyj - A Shares | | | 644,952 | | | | 31,831,363 | |
| | | | | | | | |
| | | | | | | 76,355,865 | |
| | | | | | | | |
|
France—3.2% | |
Edenred (a) | | | 595,720 | | | | 19,984,924 | |
Essilor International S.A. | | | 244,660 | | | | 26,066,172 | |
Lafarge S.A. | | | 294,243 | | | | 22,142,107 | |
| | | | | | | | |
| | | | | | | 68,193,203 | |
| | | | | | | | |
|
Germany—6.7% | |
Brenntag AG | | | 117,311 | | | | 21,793,100 | |
Continental AG | | | 139,901 | | | | 30,689,810 | |
Deutsche Boerse AG | | | 427,339 | | | | 35,485,790 | |
SAP AG | | | 267,608 | | | | 22,944,725 | |
Sky Deutschland AG (b) | | | 2,879,333 | | | | 31,801,521 | |
| | | | | | | | |
| | | | | | | 142,714,946 | |
| | | | | | | | |
|
Hong Kong—3.0% | |
China Mobile, Ltd. | | | 1,750,000 | | | | 18,182,656 | |
Hang Seng Bank, Ltd. | | | 1,066,800 | | | | 17,346,223 | |
Hong Kong Exchanges and Clearing, Ltd. | | | 1,785,700 | | | | 29,899,223 | |
| | | | | | | | |
| | | | | | | 65,428,102 | |
| | | | | | | | |
|
India—0.5% | |
IDFC, Ltd. | | | 5,752,537 | | | | 10,280,440 | |
| | | | | | | | |
|
Ireland—4.7% | |
CRH plc | | | 774,129 | | | | 19,551,952 | |
Experian plc | | | 1,520,300 | | | | 28,058,975 | |
James Hardie Industries plc | | | 2,036,075 | | | | 23,685,277 | |
Ryanair Holdings plc (ADR) (b) | | | 622,235 | | | | 29,201,489 | |
| | | | | | | | |
| | | | | | | 100,497,693 | |
| | | | | | | | |
|
Japan—9.5% | |
FANUC Corp. | | | 125,500 | | | | 23,013,762 | |
Fast Retailing Co., Ltd. | | | 71,400 | | | | 29,552,213 | |
Japan Exchange Group, Inc. | | | 755,900 | | | | 21,521,936 | |
Rakuten, Inc. (a) | | | 2,202,900 | | | | 32,775,771 | |
Shimano, Inc. | | | 198,600 | | | | 17,083,953 | |
SMC Corp. (a) | | | 114,500 | | | | 28,922,473 | |
Tokyo Electron, Ltd. | | | 273,800 | | | | 15,103,519 | |
Toyota Tsusho Corp. | | | 751,400 | | | | 18,660,152 | |
Trend Micro, Inc. (a) | | | 490,400 | | | | 17,186,746 | |
| | | | | | | | |
| | | | | | | 203,820,525 | |
| | | | | | | | |
|
Netherlands—2.6% | |
Heineken Holding NV | | | 419,645 | | | | 26,612,800 | |
Unilever NV | | | 718,592 | | | | 29,013,360 | |
| | | | | | | | |
| | | | | | | 55,626,160 | |
| | | | | | | | |
|
Norway—1.4% | |
Aker Solutions ASA (a) | | | 968,500 | | | | 17,315,780 | |
Seadrill, Ltd. (a) | | | 318,477 | | | | 13,053,800 | |
| | | | | | | | |
| | | | | | | 30,369,580 | |
| | | | | | | | |
|
Peru—0.9% | |
Credicorp, Ltd. | | | 140,726 | | | | 18,678,562 | |
| | | | | | | | |
|
Portugal—0.3% | |
Galp Energia SGPS S.A. | | | 468,009 | | | | 7,684,099 | |
| | | | | | | | |
|
Russia—2.3% | |
Magnit OJSC (GDR) | | | 475,817 | | | | 31,564,509 | |
Sberbank of Russia (ADR) | | | 1,362,889 | | | | 17,212,198 | |
| | | | | | | | |
| | | | | | | 48,776,707 | |
| | | | | | | | |
|
Singapore—1.4% | |
United Overseas Bank, Ltd. | | | 1,815,000 | | | | 30,600,552 | |
| | | | | | | | |
|
South Africa—3.2% | |
Massmart Holdings, Ltd. (a) | | | 889,941 | | | | 11,058,433 | |
Naspers, Ltd. - N Shares | | | 544,012 | | | | 56,881,487 | |
| | | | | | | | |
| | | | | | | 67,939,920 | |
| | | | | | | | |
See accompanying notes to financial statements.
MSF-5
Metropolitan Series Fund
Baillie Gifford International Stock Portfolio
Schedule of Investments as of December 31, 2013
Common Stocks—(Continued)
| | | | | | | | |
| Security Description | |
Shares | | | Value | |
|
South Korea—5.3% | |
Hyundai Mobis | | | 51,216 | | | $ | 14,259,427 | |
NAVER Corp. | | | 34,157 | | | | 23,539,569 | |
Samsung Electronics Co., Ltd. | | | 45,482 | | | | 59,444,759 | |
SK Telecom Co., Ltd. | | | 76,078 | | | | 16,617,116 | |
| | | | | | | | |
| | | | | | | 113,860,871 | |
| | | | | | | | |
|
Spain—1.7% | |
Inditex S.A. | | | 220,380 | | | | 36,466,278 | |
| | | | | | | | |
|
Sweden—5.1% | |
Atlas Copco AB - B Shares | | | 1,656,195 | | | | 42,173,653 | |
Svenska Handelsbanken AB - A Shares | | | 985,384 | | | | 48,675,239 | |
Volvo AB - B Shares | | | 1,382,666 | | | | 18,225,764 | |
| | | | | | | | |
| | | | | | | 109,074,656 | |
| | | | | | | | |
|
Switzerland—4.1% | |
Nestle S.A. | | | 801,802 | | | | 58,858,638 | |
Wolseley plc | | | 505,043 | | | | 28,681,011 | |
| | | | | | | | |
| | | | | | | 87,539,649 | |
| | | | | | | | |
|
Taiwan—3.1% | |
Hon Hai Precision Industry Co., Ltd. | | | 5,456,410 | | | | 14,686,533 | |
Taiwan Semiconductor Manufacturing Co., Ltd. | | | 14,711,000 | | | | 51,834,760 | |
| | | | | | | | |
| | | | | | | 66,521,293 | |
| | | | | | | | |
|
Turkey—1.2% | |
BIM Birlesik Magazalar A/S (a) | | | 743,940 | | | | 15,047,979 | |
Turkiye Garanti Bankasi A/S | | | 3,050,227 | | | | 9,912,978 | |
| | | | | | | | |
| | | | | | | 24,960,957 | |
| | | | | | | | |
|
United Kingdom—19.9% | |
Amlin plc | | | 3,181,100 | | | | 24,262,868 | |
Antofagasta plc | | | 978,543 | | | | 13,426,456 | |
ARM Holdings plc | | | 2,611,400 | | | | 47,491,170 | |
BG Group plc | | | 955,000 | | | | 20,580,496 | |
BHP Billiton plc | | | 545,800 | | | | 16,922,872 | |
British American Tobacco plc | | | 710,336 | | | | 38,112,387 | |
Burberry Group plc | | | 518,692 | | | | 13,031,517 | |
Capita Group plc | | | 1,714,300 | | | | 29,489,498 | |
Hargreaves Lansdown plc | | | 1,016,100 | | | | 22,848,344 | |
Petrofac, Ltd. (a) | | | 758,200 | | | | 15,387,095 | |
Premier Farnell plc | | | 3,453,984 | | | | 12,733,428 | |
Prudential plc | | | 1,638,669 | | | | 36,675,093 | |
Rio Tinto plc | | | 904,600 | | | | 51,046,142 | |
Rolls-Royce Holdings plc (b) | | | 1,139,027 | | | | 24,124,081 | |
St. James’s Place plc | | | 1,468,302 | | | | 17,703,409 | |
Standard Chartered plc | | | 772,280 | | | | 17,400,873 | |
Tullow Oil plc | | | 1,800,125 | | | | 25,562,024 | |
| | | | | | | | |
| | | | | | | 426,797,753 | |
| | | | | | | | |
|
United States—0.6% | |
Pricesmart, Inc. (a) | | | 120,985 | | | | 13,978,607 | |
| | | | | | | | |
Total Common Stocks
(Cost $1,723,808,959) | | | | | | | 2,112,760,099 | |
| | | | | | | | |
| Short-Term Investments—9.6% | |
| Security Description | | Shares/
Principal
Amount* | | | Value | |
|
Mutual Fund—8.6% | |
State Street Navigator Securities Lending MET Portfolio (c) | | | 182,998,393 | | | | 182,998,393 | |
| | | | | | | | |
|
Repurchase Agreement—1.0% | |
Fixed Income Clearing Corp.
Repurchase Agreement dated 12/31/13 at 0.000% to be repurchased at $21,869,000 on 01/02/14, collateralized by $22,285,000 U.S. Treasury Notes at 0.250% due 02/28/14 with a value of $22,309,714. | | | 21,869,000 | | | | 21,869,000 | |
| | | | | | | | |
Total Short-Term Investments
(Cost $204,867,393) | | | | | | | 204,867,393 | |
| | | | | | | | |
Total Investments—108.2%
(Cost $1,928,676,352) (d) | | | | | | | 2,317,627,492 | |
Other assets and liabilities
(net)—(8.2)% | | | | | | | (175,301,876 | ) |
| | | | | | | | |
| Net Assets—100.0% | | | | | | $ | 2,142,325,616 | |
| | | | | | | | |
| * | Principal amount stated in U.S. dollars unless otherwise noted. |
| (a) | All or a portion of the security was held on loan. As of December 31, 2013, the market value of securities loaned was $175,032,755 and the collateral received consisted of cash in the amount of $182,998,393 and non-cash collateral with a value of $28,694. The cash collateral is invested in a money market fund managed by an affiliate of the custodian. The non-cash collateral received consists primarily of government securities and bank letters of credit, and is held for the benefit of the Portfolio at the Portfolio’s custodian. The Portfolio cannot repledge or resell this collateral. As such, this collateral is excluded from the Statement of Assets and Liabilities. |
| (b) | Non-income producing security. |
| (c) | Represents investment of cash collateral received from securities lending transactions. |
| (d) | As of December 31, 2013, the aggregate cost of investments for federal income tax purposes was $1,934,449,613. The aggregate unrealized appreciation and depreciation of investments were $443,609,273 and $(60,431,394), respectively, resulting in net unrealized appreciation of $383,177,879 for federal income tax purposes. |
| (ADR)— | An American Depositary Receipt is a certificate issued by a custodian bank representing the right to receive securities of the foreign issuer described. Trading on exchanges not located in the United States or Canada significantly influences the value of ADRs. |
| (GDR)— | A Global Depositary Receipt is a negotiable certificate issued by one country’s bank against a certain number of shares of a company’s stock held in its custody but traded on the stock exchange of another country. |
See accompanying notes to financial statements.
MSF-6
Metropolitan Series Fund
Baillie Gifford International Stock Portfolio
Schedule of Investments as of December 31, 2013
Portfolio Composition as of December 31, 2013
| | | | |
Ten Largest Industries as of
December 31, 2013 (Unaudited) | | % of
Net Assets | |
Semiconductors & Semiconductor Equipment | | | 8.1 | |
Commercial Banks | | | 7.9 | |
Machinery | | | 7.6 | |
Insurance | | | 6.6 | |
Food Products | | | 4.9 | |
Diversified Financial Services | | | 4.6 | |
Food & Staples Retailing | | | 4.5 | |
Media | | | 4.2 | |
Metals & Mining | | | 3.8 | |
Internet Software & Services | | | 3.7 | |
See accompanying notes to financial statements.
MSF-7
Metropolitan Series Fund
Baillie Gifford International Stock Portfolio
Schedule of Investments as of December 31, 2013
Fair Value Hierarchy
Accounting principles generally accepted in the United States of America (“GAAP”) define fair market value as the price that the Portfolio would receive to sell an asset or pay to transfer a liability in an orderly transaction between market participants at the measurement date. It establishes a fair value hierarchy that prioritizes inputs to valuation methods and requires disclosure of the fair value hierarchy that segregates fair value measurements into three levels. Levels 1, 2 and 3 of the fair value hierarchy are defined as follows:
Level 1 - unadjusted quoted prices in active markets for identical investments
Level 2 - other significant observable inputs (including, but not limited to, unadjusted quoted prices for similar investments in markets that are either active or inactive; inputs other than quoted prices that are observable such as interest rates, yield curves, volatilities, prepayment speeds, loss severities, credit risks, default rates, etc.)
Level 3 - significant unobservable inputs based on the best information available in the circumstances, to the extent observable inputs are unavailable (including the Portfolio’s own assumptions in determining the fair value of investments)
The inputs or methodologies used for valuing investments are not necessarily an indication of the risk associated with investing in them. Changes to the inputs or methodologies used may result in transfers between levels, which will be recognized as of the beginning of the reporting period. Information on transfers between Level 1 and Level 2, if any, will be disclosed following the fair value hierarchy table below. A reconciliation of Level 3 securities, if any, will also be disclosed following the fair value hierarchy table. For more information about the Portfolio’s policy regarding the valuation of investments, please refer to the Notes to Financial Statements.
The following table summarizes the fair value hierarchy of the Portfolio’s investments as of December 31, 2013:
| | | | | | | | | | | | | | | | |
| Description | | Level 1 | | | Level 2 | | | Level 3 | | | Total | |
| Common Stocks | | | | | | | | | | | | | | | | |
Argentina | | $ | 26,013,823 | | | $ | — | | | $ | — | | | $ | 26,013,823 | |
Australia | | | — | | | | 64,554,645 | | | | — | | | | 64,554,645 | |
Brazil | | | 29,307,679 | | | | — | | | | — | | | | 29,307,679 | |
Canada | | | 56,696,163 | | | | — | | | | — | | | | 56,696,163 | |
China | | | 30,488,632 | | | | 26,548,929 | | | | — | | | | 57,037,561 | |
Denmark | | | — | | | | 72,983,810 | | | | — | | | | 72,983,810 | |
Finland | | | — | | | | 76,355,865 | | | | — | | | | 76,355,865 | |
France | | | — | | | | 68,193,203 | | | | — | | | | 68,193,203 | |
Germany | | | — | | | | 142,714,946 | | | | — | | | | 142,714,946 | |
Hong Kong | | | — | | | | 65,428,102 | | | | — | | | | 65,428,102 | |
India | | | — | | | | 10,280,440 | | | | — | | | | 10,280,440 | |
Ireland | | | 29,201,489 | | | | 71,296,204 | | | | — | | | | 100,497,693 | |
Japan | | | — | | | | 203,820,525 | | | | — | | | | 203,820,525 | |
Netherlands | | | — | | | | 55,626,160 | | | | — | | | | 55,626,160 | |
Norway | | | — | | | | 30,369,580 | | | | — | | | | 30,369,580 | |
Peru | | | 18,678,562 | | | | — | | | | — | | | | 18,678,562 | |
Portugal | | | — | | | | 7,684,099 | | | | — | | | | 7,684,099 | |
Russia | | | — | | | | 48,776,707 | | | | — | | | | 48,776,707 | |
Singapore | | | — | | | | 30,600,552 | | | | — | | | | 30,600,552 | |
South Africa | | | — | | | | 67,939,920 | | | | — | | | | 67,939,920 | |
South Korea | | | — | | | | 113,860,871 | | | | — | | | | 113,860,871 | |
Spain | | | — | | | | 36,466,278 | | | | — | | | | 36,466,278 | |
Sweden | | | — | | | | 109,074,656 | | | | — | | | | 109,074,656 | |
Switzerland | | | — | | | | 87,539,649 | | | | — | | | | 87,539,649 | |
Taiwan | | | — | | | | 66,521,293 | | | | — | | | | 66,521,293 | |
Turkey | | | — | | | | 24,960,957 | | | | — | | | | 24,960,957 | |
United Kingdom | | | — | | | | 426,797,753 | | | | — | | | | 426,797,753 | |
United States | | | 13,978,607 | | | | — | | | | — | | | | 13,978,607 | |
Total Common Stocks | | | 204,364,955 | | | | 1,908,395,144 | | | | — | | | | 2,112,760,099 | |
| Short-Term Investments | | | | | | | | | | | | | | | | |
Mutual Fund | | | 182,998,393 | | | | — | | | | — | | | | 182,998,393 | |
Repurchase Agreement | | | — | | | | 21,869,000 | | | | — | | | | 21,869,000 | |
Total Short-Term Investments | | | 182,998,393 | | | | 21,869,000 | | | | — | | | | 204,867,393 | |
Total Investments | | $ | 387,363,348 | | | $ | 1,930,264,144 | | | $ | — | | | $ | 2,317,627,492 | |
| | | | | | | | | | | | | | | | | |
Collateral for securities loaned (Liability) | | $ | — | | | $ | (182,998,393 | ) | | $ | — | | | $ | (182,998,393 | ) |
See accompanying notes to financial statements.
MSF-8
Metropolitan Series Fund
Baillie Gifford International Stock Portfolio
Statement of Assets and Liabilities
December 31, 2013
| | | | |
Assets | | | | |
Investments at value (a) (b) | | $ | 2,317,627,492 | |
Cash | | | 237 | |
Cash denominated in foreign currencies (c) | | | 7,956,888 | |
Receivable for: | | | | |
Fund shares sold | | | 543,842 | |
Dividends and interest | | | 1,285,189 | |
Prepaid expenses | | | 2,057 | |
| | | | |
Total Assets | | | 2,327,415,705 | |
Liabilities | | | | |
Collateral for securities loaned | | | 182,998,393 | |
Payables for: | | | | |
Fund shares redeemed | | | 462,050 | |
Accrued Expenses: | | | | |
Management fees | | | 1,172,508 | |
Distribution and service fees | | | 93,412 | |
Deferred trustees’ fees | | | 89,792 | |
Other expenses | | | 273,934 | |
| | | | |
Total Liabilities | | | 185,090,089 | |
| | | | |
Net Assets | | $ | 2,142,325,616 | |
| | | | |
Net Assets Consist of: | | | | |
Paid in surplus | | $ | 2,155,359,734 | |
Undistributed net investment income | | | 28,339,756 | |
Accumulated net realized loss | | | (430,437,772 | ) |
Unrealized appreciation on investments and foreign currency transactions | | | 389,063,898 | |
| | | | |
Net Assets | | $ | 2,142,325,616 | |
| | | | |
Net Assets | | | | |
Class A | | $ | 1,680,704,474 | |
Class B | | | 434,816,761 | |
Class E | | | 26,804,381 | |
Capital Shares Outstanding* | | | | |
Class A | | | 159,433,390 | |
Class B | | | 41,873,259 | |
Class E | | | 2,568,895 | |
Net Asset Value, Offering Price and Redemption Price Per Share | | | | |
Class A | | $ | 10.54 | |
Class B | | | 10.38 | |
Class E | | | 10.43 | |
| * | The Portfolio is authorized to issue an unlimited number of shares. |
| (a) | Identified cost of investments was $1,928,676,352. |
| (b) | Includes securities loaned at value of $175,032,755. |
| (c) | Identified cost of cash denominated in foreign currencies was $7,863,080. |
Statement of Operations
Year Ended December 31, 2013
| | | | |
Investment Income | | | | |
Dividends (a) | | $ | 43,394,253 | |
Interest | | | 3,413 | |
Securities lending income | | | 3,065,128 | |
| | | | |
Total investment income | | | 46,462,794 | |
Expenses | | | | |
Management fees | | | 15,031,762 | |
Administration fees | | | 26,198 | |
Custodian and accounting fees | | | 1,188,467 | |
Distribution and service fees—Class B | | | 807,280 | |
Distribution and service fees—Class E | | | 39,536 | |
Audit and tax services | | | 54,850 | |
Legal | | | 31,297 | |
Trustees’ fees and expenses | | | 36,812 | |
Shareholder reporting | | | 155,223 | |
Insurance | | | 13,334 | |
Miscellaneous | | | 32,112 | |
| | | | |
Total expenses | | | 17,416,871 | |
Less management fee waiver | | | (1,948,646 | ) |
| | | | |
Net expenses | | | 15,468,225 | |
| | | | |
Net Investment Income | | | 30,994,569 | |
| | | | |
Net Realized and Unrealized Gain | | | | |
| Net realized gain (loss) on: | | | | |
Investments | | | 22,284,529 | |
Foreign currency transactions | | | (368,761 | ) |
| | | | |
Net realized gain | | | 21,915,768 | |
| | | | |
| Net change in unrealized appreciation on: | | | | |
Investments | | | 229,271,371 | |
Foreign currency transactions | | | 123,887 | |
| | | | |
Net change in unrealized appreciation | | | 229,395,258 | |
| | | | |
Net realized and unrealized gain | | | 251,311,026 | |
| | | | |
Net Increase in Net Assets From Operations | | $ | 282,305,595 | |
| | | | |
| (a) | Net of foreign withholding taxes of $3,632,130. |
See accompanying notes to financial statements.
MSF-9
Metropolitan Series Fund
Baillie Gifford International Stock Portfolio
Statements of Changes in Net Assets
| | | | | | | | |
| | | Year Ended
December 31,
2013 | | | Year Ended
December 31,
2012 | |
Increase (Decrease) in Net Assets: | | | | | | | | |
From Operations | | | | | | | | |
Net investment income | | $ | 30,994,569 | | | $ | 22,849,411 | |
Net realized gain (loss) | | | 21,915,768 | | | | (26,381,556 | ) |
Net change in unrealized appreciation | | | 229,395,258 | | | | 211,663,014 | |
| | | | | | | | |
Increase in net assets from operations | | | 282,305,595 | | | | 208,130,869 | |
| | | | | | | | |
From Distributions to Shareholders | | | | | | | | |
Net investment income | | | | | | | | |
Class A | | | (24,733,409 | ) | | | (9,552,157 | ) |
Class B | | | (1,391,154 | ) | | | (1,051,687 | ) |
Class E | | | (402,216 | ) | | | (327,600 | ) |
| | | | | | | | |
Total distributions | | | (26,526,779 | ) | | | (10,931,444 | ) |
| | | | | | | | |
Increase in net assets from capital share transactions | | | 285,595,731 | | | | 665,354,920 | |
| | | | | | | | |
Total increase in net assets | | | 541,374,547 | | | | 862,554,345 | |
| | |
Net Assets | | | | | | | | |
Beginning of period | | | 1,600,951,069 | | | | 738,396,724 | |
| | | | | | | | |
End of period | | $ | 2,142,325,616 | | | $ | 1,600,951,069 | |
| | | | | | | | |
Undistributed net investment income | | | | | | | | |
End of period | | $ | 28,339,756 | | | $ | 22,364,659 | |
| | | | | | | | |
Other Information:
Capital Shares
Transactions in capital shares were as follows:
| | | | | | | | | | | | | | | | |
| | | Year Ended
December 31, 2013 | | | Year Ended
December 31, 2012 | |
| | | Shares | | | Value | | | Shares | | | Value | |
Class A | | | | | | | | | | | | | | | | |
Sales | | | 13,914,522 | | | $ | 132,496,071 | | | | 87,751,405 | | | $ | 746,036,157 | |
Reinvestments | | | 2,723,944 | | | | 24,733,409 | | | | 1,118,520 | | | | 9,552,157 | |
Redemptions | | | (16,279,447 | ) | | | (156,565,254 | ) | | | (9,093,856 | ) | | | (80,195,992 | ) |
| | | | | | | | | | | | | | | | |
Net increase | | | 359,019 | | | $ | 664,226 | | | | 79,776,069 | | | $ | 675,392,322 | |
| | | | | | | | | | | | | | | | |
Class B | | | | | | | | | | | | | | | | |
Sales | | | 1,400,012 | | | $ | 13,236,229 | | | | 1,027,524 | | | $ | 8,388,320 | |
Shares issued through acquisition | | | 36,865,244 | | | | 343,584,075 | | | | 0 | | | | 0 | |
Reinvestments | | | 155,090 | | | | 1,391,154 | | | | 124,755 | | | | 1,051,687 | |
Redemptions | | | (7,239,361 | ) | | | (69,828,994 | ) | | | (2,006,400 | ) | | | (16,946,656 | ) |
| | | | | | | | | | | | | | | | |
Net increase (decrease) | | | 31,180,985 | | | $ | 288,382,464 | | | | (854,121 | ) | | $ | (7,506,649 | ) |
| | | | | | | | | | | | | | | | |
Class E | | | | | | | | | | | | | | | | |
Sales | | | 171,847 | | | $ | 1,652,354 | | | | 400,246 | | | $ | 3,272,988 | |
Reinvestments | | | 44,691 | | | | 402,216 | | | | 38,723 | | | | 327,600 | |
Redemptions | | | (575,018 | ) | | | (5,505,529 | ) | | | (725,097 | ) | | | (6,131,341 | ) |
| | | | | | | | | | | | | | | | |
Net decrease | | | (358,480 | ) | | $ | (3,450,959 | ) | | | (286,128 | ) | | $ | (2,530,753 | ) |
| | | | | | | | | | | | | | | | |
Increase derived from capital shares transactions | | | | | | $ | 285,595,731 | | | | | | | $ | 665,354,920 | |
| | | | | | | | | | | | | | | | |
See accompanying notes to financial statements.
MSF-10
Metropolitan Series Fund
Baillie Gifford International Stock Portfolio
Financial Highlights
| | | | | | | | | | | | | | | | | | | | |
| Selected per share data | | | |
| | | Class A | |
| | | Year Ended December 31, | |
| | | 2013 | | | 2012 | | | 2011 | | | 2010 | | | 2009 | |
Net Asset Value, Beginning of Period | | $ | 9.28 | | | $ | 7.87 | | | $ | 9.98 | | | $ | 9.45 | | | $ | 7.80 | |
| | | | | | | | | | | | | | | | | | | | |
Income (Loss) from Investment Operations | | | | | | | | | | | | | | | | | | | | |
Net investment income (a) | | | 0.16 | | | | 0.16 | | | | 0.10 | | | | 0.10 | | | | 0.14 | |
Net realized and unrealized gain (loss) on investments | | | 1.26 | | | | 1.37 | | | | (2.04 | ) | | | 0.57 | | | | 1.57 | |
| | | | | | | | | | | | | | | | | | | | |
Total from investment operations | | | 1.42 | | | | 1.53 | | | | (1.94 | ) | | | 0.67 | | | | 1.71 | |
| | | | | | | | | | | | | | | | | | | | |
Less Distributions | | | | | | | | | | | | | | | | | | | | |
Distributions from net investment income | | | (0.16 | ) | | | (0.12 | ) | | | (0.17 | ) | | | (0.14 | ) | | | (0.06 | ) |
| | | | | | | | | | | | | | | | | | | | |
Total distributions | | | (0.16 | ) | | | (0.12 | ) | | | (0.17 | ) | | | (0.14 | ) | | | (0.06 | ) |
| | | | | | | | | | | | | | | | | | | | |
Net Asset Value, End of Period | | $ | 10.54 | | | $ | 9.28 | | | $ | 7.87 | | | $ | 9.98 | | | $ | 9.45 | |
| | | | | | | | | | | | | | | | | | | | |
Total Return (%) (b) | | | 15.54 | | | | 19.52 | | | | (19.87 | ) | | | 7.21 | | | | 22.17 | |
| | | | | |
Ratios/Supplemental Data | | | | | | | | | | | | | | | | | | | | |
Gross ratio of expenses to average net assets (%) | | | 0.87 | | | | 0.91 | | | | 0.95 | | | | 0.94 | | | | 0.96 | |
Net ratio of expenses to average net assets (%) (c) | | | 0.77 | | | | 0.81 | | | | 0.90 | | | | 0.91 | | | | 0.93 | |
Ratio of net investment income to average net assets (%) | | | 1.70 | | | | 1.83 | | | | 1.06 | | | | 1.10 | | | | 1.74 | |
Portfolio turnover rate (%) | | | 19 | | | | 62 | | | | 96 | | | | 140 | | | | 147 | |
Net assets, end of period (in millions) | | $ | 1,680.7 | | | $ | 1,476.3 | | | $ | 623.9 | | | $ | 1,183.7 | | | $ | 975.1 | |
| | | | | | | | | | | | | | | | | | | | |
| | | Class B | |
| | | Year Ended December 31, | |
| | | 2013 | | | 2012 | | | 2011 | | | 2010 | | | 2009 | |
Net Asset Value, Beginning of Period | | $ | 9.15 | | | $ | 7.75 | | | $ | 9.84 | | | $ | 9.33 | | | $ | 7.69 | |
| | | | | | | | | | | | | | | | | | | | |
Income (Loss) from Investment Operations | | | | | | | | | | | | | | | | | | | | |
Net investment income (a) | | | 0.13 | (d) | | | 0.14 | | | | 0.08 | | | | 0.07 | | | | 0.12 | |
Net realized and unrealized gain (loss) on investments | | | 1.23 | | | | 1.35 | | | | (2.03 | ) | | | 0.56 | | | | 1.55 | |
| | | | | | | | | | | | | | | | | | | | |
Total from investment operations | | | 1.36 | | | | 1.49 | | | | (1.95 | ) | | | 0.63 | | | | 1.67 | |
| | | | | | | | | | | | | | | | | | | | |
Less Distributions | | | | | | | | | | | | | | | | | | | | |
Distributions from net investment income | | | (0.13 | ) | | | (0.09 | ) | | | (0.14 | ) | | | (0.12 | ) | | | (0.03 | ) |
| | | | | | | | | | | | | | | | | | | | |
Total distributions | | | (0.13 | ) | | | (0.09 | ) | | | (0.14 | ) | | | (0.12 | ) | | | (0.03 | ) |
| | | | | | | | | | | | | | | | | | | | |
Net Asset Value, End of Period | | $ | 10.38 | | | $ | 9.15 | | | $ | 7.75 | | | $ | 9.84 | | | $ | 9.33 | |
| | | | | | | | | | | | | | | | | | | | |
Total Return (%) (b) | | | 15.14 | | | | 19.37 | | | | (20.13 | ) | | | 6.86 | | | | 21.89 | |
| | | | | |
Ratios/Supplemental Data | | | | | | | | | | | | | | | | | | | | |
Gross ratio of expenses to average net assets (%) | | | 1.13 | | | | 1.16 | | | | 1.20 | | | | 1.19 | | | | 1.21 | |
Net ratio of expenses to average net assets (%) (c) | | | 1.03 | | | | 1.06 | | | | 1.15 | | | | 1.16 | | | | 1.18 | |
Ratio of net investment income to average net assets (%) | | | 1.34 | (d) | | | 1.68 | | | | 0.87 | | | | 0.86 | | | | 1.47 | |
Portfolio turnover rate (%) | | | 19 | | | | 62 | | | | 96 | | | | 140 | | | | 147 | |
Net assets, end of period (in millions) | | $ | 434.8 | | | $ | 97.8 | | | $ | 89.5 | | | $ | 112.5 | | | $ | 106.4 | |
Please see following page for Financial Highlights footnote legend.
See accompanying notes to financial statements.
MSF-11
Metropolitan Series Fund
Baillie Gifford International Stock Portfolio
Financial Highlights
| | | | | | | | | | | | | | | | | | | | |
| Selected per share data | | | |
| | | Class E | |
| | | Year Ended December 31, | |
| | | 2013 | | | 2012 | | | 2011 | | | 2010 | | | 2009 | |
Net Asset Value, Beginning of Period | | $ | 9.19 | | | $ | 7.79 | | | $ | 9.88 | | | $ | 9.36 | | | $ | 7.72 | |
| | | | | | | | | | | | | | | | | | | | |
Income (Loss) from Investment Operations | | | | | | | | | | | | | | | | | | | | |
Net investment income (a) | | | 0.15 | | | | 0.15 | | | | 0.09 | | | | 0.09 | | | | 0.13 | |
Net realized and unrealized gain (loss) on investments | | | 1.23 | | | | 1.35 | | | | (2.03 | ) | | | 0.56 | | | | 1.55 | |
| | | | | | | | | | | | | | | | | | | | |
Total from investment operations | | | 1.38 | | | | 1.50 | | | | (1.94 | ) | | | 0.65 | | | | 1.68 | |
| | | | | | | | | | | | | | | | | | | | |
Less Distributions | | | | | | | | | | | | | | | | | | | | |
Distributions from net investment income | | | (0.14 | ) | | | (0.10 | ) | | | (0.15 | ) | | | (0.13 | ) | | | (0.04 | ) |
| | | | | | | | | | | | | | | | | | | | |
Total distributions | | | (0.14 | ) | | | (0.10 | ) | | | (0.15 | ) | | | (0.13 | ) | | | (0.04 | ) |
| | | | | | | | | | | | | | | | | | | | |
Net Asset Value, End of Period | | $ | 10.43 | | | $ | 9.19 | | | $ | 7.79 | | | $ | 9.88 | | | $ | 9.36 | |
| | | | | | | | | | | | | | | | | | | | |
Total Return (%) (b) | | | 15.30 | | | | 19.39 | | | | (19.98 | ) | | | 7.04 | | | | 21.96 | |
| | | | | |
Ratios/Supplemental Data | | | | | | | | | | | | | | | | | | | | |
Gross ratio of expenses to average net assets (%) | | | 1.02 | | | | 1.06 | | | | 1.10 | | | | 1.09 | | | | 1.11 | |
Net ratio of expenses to average net assets (%) (c) | | | 0.92 | | | | 0.96 | | | | 1.05 | | | | 1.06 | | | | 1.08 | |
Ratio of net investment income to average net assets (%) | | | 1.56 | | | | 1.79 | | | | 0.97 | | | | 0.99 | | | | 1.59 | |
Portfolio turnover rate (%) | | | 19 | | | | 62 | | | | 96 | | | | 140 | | | | 147 | |
Net assets, end of period (in millions) | | $ | 26.8 | | | $ | 26.9 | | | $ | 25.0 | | | $ | 36.5 | | | $ | 40.8 | |
| (a) | Per share amounts based on average shares outstanding during the period. |
| (b) | Total return does not reflect any insurance, sales, separate account or administrative charges of variable annuity or life insurance contracts or any additional expenses that contract owners may bear under their variable contracts. If these charges were included, the returns would be lower. |
| (c) | Net ratio of expenses to average net assets includes the effect of the management fee waivers as detailed in Note 6 of the Notes to Financial Statements. |
| (d) | Net investment income per share and the ratio of net investment income to average net assets for Class B during 2013 were impacted by the timing of dividends received from the Portfolio’s investments and the assets received through a merger with the Met Investors Series Trust American Funds International Portfolio. |
See accompanying notes to financial statements.
MSF-12
Metropolitan Series Fund
Baillie Gifford International Stock Portfolio
Notes to Financial Statements—December 31, 2013
1. Organization
Metropolitan Series Fund (the “Trust”) is organized as a Delaware statutory trust and registered under the Investment Company Act of 1940, as amended (the “1940 Act”), as an open-end management investment company. The Trust is currently comprised of thirty series, each of which operates as a distinct investment vehicle of the Trust. The portfolio included in this report is Baillie Gifford International Stock Portfolio (the “Portfolio”), which is diversified. Shares in the Portfolio are not offered directly to the general public and are currently available only to separate accounts established by Metropolitan Life Insurance Company (“MetLife”) and other affiliated life insurance companies.
The Portfolio has registered and offers three classes of shares: Class A, B, and E shares. Shares of each Class of the Portfolio represent an equal pro rata interest in the Portfolio and generally give the shareholder the same voting, dividend, liquidation, and other rights. Investment income, realized and unrealized capital gains and losses, the common expenses of the Portfolio, and certain Portfolio-level expense reductions, if any, are allocated on a pro rata basis to each Class based on the relative net assets of each Class to the net assets of the Portfolio. Each Class of shares differs in its respective distribution plan and such distribution expenses are allocated to that Class.
2. Significant Accounting Policies
The preparation of financial statements in conformity with accounting principles generally accepted in the United States of America (“GAAP”) requires management to make estimates and assumptions that affect the reported amounts of assets and liabilities and disclosure of contingent assets and liabilities as of the date of the financial statements and the reported amounts of income and expenses during the reporting period. Actual results could differ from those estimates. In the preparation of these financial statements, management has evaluated events and transactions subsequent to December 31, 2013 through the date the financial statements were issued.
The following is a summary of significant accounting policies consistently followed by the Portfolio in the preparation of its financial statements.
Investment Valuation and Fair Value Measurements - Debt securities (other than short term obligations with a remaining maturity of sixty days or less), including corporate, convertible and municipal bonds and notes; obligations of the U.S. treasury and U.S. government agencies; sovereign issues; floating rate loans; and non-U.S. bonds, are generally valued on the basis of evaluated or composite bid quotations obtained from independent pricing services and/or brokers and dealers selected by MetLife Advisers, LLC (“MetLife Advisers” or the “Adviser”), an affiliate of MetLife, Inc., pursuant to authorization of the Board of Trustees of the Trust (the “Board” or “Trustees”). Such quotations utilize matrix pricing, which considers observable inputs including, among other things, issuer details, maturity dates, interest rates, yield curves, rates of prepayment, credit risks/spreads, default rates, reported trades, broker dealer quotes and quoted prices for similar securities. Securities that use similar valuation techniques and inputs as described above are generally categorized as Level 2 within the fair value hierarchy.
Mortgage and asset-backed securities are usually issued as separate tranches, or classes, of securities within each deal. These securities are also generally valued on the basis of evaluated or composite bid quotations obtained from independent pricing services and/or brokers and dealers selected by the Adviser pursuant to authorization of the Board. The pricing models for these securities usually consider tranche-level attributes, estimated cash flows and market-based yield spreads for each tranche and current market data, and incorporate deal collateral performance, as available. Mortgage and asset-backed securities that use similar valuation techniques and inputs as described above are generally categorized as Level 2 within the fair value hierarchy.
Short term obligations with a remaining maturity of sixty days or less are generally valued at amortized cost, which approximates fair market value, and are generally categorized as Level 2 within the fair value hierarchy.
Domestic and foreign equity securities, such as common stock, exchange-traded funds, rights, warrants, and preferred stock, that are traded on a securities exchange, are generally valued at their last sale price on the exchange or market in which they are principally traded on the valuation date, or, if no sales occurred on that day, at the last reported bid price. Equity securities traded over-the-counter are generally valued at the last reported sale price. Valuation adjustments may be applied to certain foreign equity securities that are traded solely on foreign exchanges that close before the close of the U.S. market to account for the market movement between the close of the foreign exchanges and the close of the U.S. market. The Portfolio may use a systematic fair valuation model provided by an independent third party to value securities principally traded in these foreign markets in order to adjust for possible stale pricing that may occur between the close of the foreign exchanges and the time of the Portfolio valuation. Foreign equity securities using these valuation adjustments are generally categorized as Level 2 within the fair value hierarchy. Equity securities that are actively traded, and have no valuation adjustments applied, are categorized as Level 1 within the fair value hierarchy. Other equity securities traded on inactive markets, or valued in reference to similar instruments traded on active markets, are generally categorized as Level 2 within the fair value hierarchy.
MSF-13
Metropolitan Series Fund
Baillie Gifford International Stock Portfolio
Notes to Financial Statements—December 31, 2013—(Continued)
Investments in registered open-end management investment companies are valued at reported net asset value per share on the valuation date and are categorized as Level 1 within the fair value hierarchy.
Forward foreign currency exchange contracts are valued through an independent pricing service based on the mean between closing bid and ask prices of the forward currency rates in the London foreign exchange markets on a daily basis as provided by a reliable bank or dealer. These contracts are generally categorized as Level 2 within the fair value hierarchy.
Options, whether on securities, indices, futures contracts, or otherwise, traded on exchanges are valued at the last sale price available as of the close of business on the valuation date or, if there is no such price available, at the mean between the last reported bid and ask prices. These types of options are categorized as Level 1 within the fair value hierarchy. Futures contracts, which are traded on commodity exchanges, are valued at their closing prices as of the close of such exchanges and are categorized as Level 1 within the fair value hierarchy.
Options and futures contracts that are traded over-the-counter are generally valued on the basis of quotations provided by broker-dealers or prices provided by pricing service providers who use a series of techniques, including simulation pricing models, to determine the value of the contracts. The pricing models use inputs that are observed from actively quoted markets such as issuer details, indices, spreads, interest rates, yield curves, credit curves, measures of volatility and exchange rates. These contracts are generally categorized as Level 2 within the fair value hierarchy.
If no current market value quotation or other observable inputs are readily available or market value quotations are deemed to be unreliable for a security, the fair value of the security will be determined in accordance with procedures approved by and under the general supervision of the Board. In such a circumstance, the Board has delegated the determination of the fair value of a security to a Valuation Committee (“Committee”) of MetLife Advisers. The Committee provides general pricing oversight and fair value pricing determinations related to portfolio securities and meets on a regular basis to review reports relating to the valuation of the securities in the Portfolio. The Board has delegated to State Street Bank and Trust Company, the Trust’s custodian (“custodian”), the responsibility for calculating the net asset values (“NAVs”) of the Trust’s Portfolios. The Committee is responsible for overseeing the calculation of the NAVs of the Portfolios by the custodian. The Committee also periodically reviews pricing vendors, including the vendor providing fair value pricing for the Portfolio’s foreign securities, and is responsible for overseeing the correction of pricing errors and addressing other pricing issues that arise in the ordinary course of business, such as making real-time fair value determinations, as necessary.
No single standard for determining the fair value of a security can be set forth because fair value depends upon the facts and circumstances with respect to each security. Information relating to any relevant factors may be obtained by the Committee from any appropriate source, including the subadviser of the Portfolio, the custodian, a pricing service, market maker and/or broker for such security or the issuer. Appropriate methodologies for determining fair value under particular circumstances may include: matrix pricing, comparisons of securities with comparable characteristics, value based on multiples of earnings, discount from market price of similar marketable securities or a combination of these and other methods. The Committee maintains a detailed report tracking each fair-valued security that compares the fair value price to the next available trade, vendor or broker price, and provides information on how close the fair value price was to the next quoted price. The Committee reviews a summary of such report monthly. On a quarterly basis, the Board is provided with the following for consideration and ratification or adjustment: (1) a memorandum summarizing the actions taken by the Committee in the prior quarter; and (2) a list of the Portfolio’s securities as of the most recent quarter-end for which market quotations were not readily available.
Investment Transactions and Related Investment Income - Portfolio security transactions are recorded on the trade date. Dividend income is recorded on the ex-dividend date or, for certain foreign securities, when notified. Interest income, which includes amortization of premium and accretion of discount on debt securities, is recorded on the accrual basis. Realized gains and losses on investments are determined on the identified cost basis, which is the same basis used for federal income tax purposes. Foreign income and foreign capital gains on some foreign securities may be subject to foreign taxes, which are accrued as applicable. These foreign taxes have been provided for in accordance with the Portfolio’s understanding of the applicable countries’ tax rules and rates.
Foreign Currency Translation - The books and records of the Portfolio are maintained in U.S. dollars. The values of securities, currencies, and other assets and liabilities denominated in currencies other than the U.S. dollar are translated into U.S. dollars based upon foreign exchange rates prevailing at the end of the period. Purchases and sales of investment securities, income, and expenses are translated on the respective dates of such transactions. Because the values of investment securities are translated at the foreign exchange rates prevailing at the end of the period, that portion of the results of operations arising from changes in exchange rates and that portion of the results of operations reflecting fluctuations arising from changes in market prices of the investment securities are not separated. Such fluctuations are included in the net realized and unrealized gain or loss on investments.
Net realized foreign exchange gains or losses arise from activity in forward foreign currency exchange contracts, sales of foreign currency, currency gains or losses realized between the trade and settlement dates on securities transactions, and the difference between the amounts of dividends, interest, and foreign withholding taxes recorded by the Portfolio and the U.S. dollar equivalent of
MSF-14
Metropolitan Series Fund
Baillie Gifford International Stock Portfolio
Notes to Financial Statements—December 31, 2013—(Continued)
the amounts actually received or paid by the Portfolio. Net unrealized foreign exchange gains and losses arise from changes in the value of assets and liabilities, other than investment securities, resulting from changes in foreign exchange rates.
Income Taxes - It is the Portfolio’s policy to comply with the requirements of the Internal Revenue Code of 1986, as amended, and regulations thereunder, applicable to regulated investment companies and to distribute, with respect to each taxable year, all of its taxable income to shareholders. Therefore, no federal income tax provision is required. The Portfolio files U.S. federal tax returns. No income tax returns are currently under examination. The Portfolio’s federal tax returns for the prior three fiscal years remain subject to examination by the Internal Revenue Service. As of December 31, 2013, the Portfolio had no uncertain tax positions that would require financial statement recognition, or de-recognition or disclosure.
Dividends and Distributions to Shareholders - The Portfolio records dividends and distributions on the ex-dividend date. Net realized gains from security transactions (if any) are generally distributed annually to shareholders. The timing and characterization of certain income and capital gains distributions are determined in accordance with federal tax regulations that may differ from GAAP. Permanent book and tax basis differences relating to shareholder distributions will result in reclassification between under/over distributed net investment income, accumulated net realized gains/losses, and paid-in surplus.
Book-tax differences are primarily due to foreign currency transactions, passive foreign investment companies (PFICs), and tax basis merger adjustments. These adjustments have no impact on net assets or the results of operations.
Securities Lending - The Portfolio may lend its portfolio securities to certain qualified brokers who borrow securities in order to complete certain securities transactions. By lending its portfolio securities, the Portfolio attempts to increase its net investment income through the receipt of income on collateral held from securities on loan. Any gain or loss in the market price of the loaned securities that might occur and any interest earned or dividends declared during the term of the loan would accrue to the account of the Portfolio.
The Trust has entered into a securities lending arrangement with the custodian. Under this arrangement, the custodian is authorized to loan portfolio securities on the Portfolio’s behalf. In exchange, the Portfolio receives either cash or securities as collateral against the loaned securities. The Portfolio receives collateral at least equal to 102% of the market value of the loaned securities (105% for foreign equity securities), at each loan’s inception. Collateral representing at least 100% of the market value of the loaned securities must be maintained for the duration of the loan. A liability for cash collateral is reflected on the Statement of Assets and Liabilities, and is categorized as Level 2 within the fair value hierarchy. Cash collateral is generally invested in the State Street Navigator Securities Lending MET Portfolio (the “Navigator Portfolio”), a series of the State Street Navigator Securities Lending Trust that is managed by an affiliate of the custodian. The Navigator Portfolio is a registered money market fund that invests in a variety of high-quality, U.S. dollar-denominated instruments. If the market value of the collateral at the close of trading on a business day is less than 100% of the market value of the loaned securities at the close of trading on that day, the borrower shall be required to deliver, by the close of business on the following business day, an additional amount of collateral, so that the total amount of posted collateral is equal to at least 100% of the market value of all the loaned securities as of such preceding day. A portion of net income (income after the deduction of expenses and fees of the Navigator Portfolio) on the collateral is rebated to the borrower of the securities and the remainder is split between the custodian and the Portfolio. On loans collateralized by U.S. Treasuries, a fee is received from the borrower and is allocated between the Portfolio and the custodian. The risks associated with lending portfolio securities include, but are not limited to, possible delays in receiving additional collateral or in the recovery of the loaned securities, possible loss of rights in the collateral should the borrower fail financially, as well as risk of loss in the value of the collateral or the value of the investments made with the collateral. The lending agent has agreed to indemnify the Portfolio in the case of default of any securities borrower. Income received by the Portfolio in securities lending transactions during the year ended December 31, 2013 is reflected as Securities lending income on the Statement of Operations. Any outstanding loans by the Portfolio at December 31, 2013 are disclosed in the footnotes to the Schedule of Investments.
Repurchase Agreements - The Portfolio may enter into repurchase agreements, under the terms of a Master Repurchase Agreement, with selected commercial banks and broker-dealers, under which the Portfolio acquires securities as collateral and agrees to resell the securities at an agreed upon time and at an agreed-upon price. The Portfolio, through the custodian or a subcustodian, receives delivery of the underlying securities collateralizing any repurchase agreements. The Portfolio requires the custodian to take possession, to have legally segregated in the Federal Reserve Book Entry System, or to have segregated within the custodian’s vault, all securities held as collateral for repurchase agreements. It is the Portfolio’s policy that the market value of the collateral be at least equal to 100% of the repurchase price in the case of a repurchase agreement of one-day duration and at least equal to 102% of the repurchase price in the case of all other repurchase agreements. In the event of default or failure by a party to perform an obligation in connection with any repurchase transaction, the Master Repurchase Agreement gives the non-defaulting party the right to set-off claims and to apply property held by it in connection with any repurchase transaction against obligations owed to it.
At December 31, 2013, the Portfolio had investments in repurchase agreements with a gross value of $21,869,000, which is included as part of investments at value on the Statement of Assets and Liabilities. The value of the related collateral exceeded the value of the repurchase agreements at December 31, 2013.
MSF-15
Metropolitan Series Fund
Baillie Gifford International Stock Portfolio
Notes to Financial Statements—December 31, 2013—(Continued)
3. Investments in Derivative Instruments
Forward Foreign Currency Exchange Contracts - The Portfolio may enter into forward foreign currency exchange contracts to obtain investment exposure, enhance return or hedge or protect its portfolio holdings against the risk of future movements in certain foreign currency exchange rates. When entering into these contracts, the Portfolio agrees to receive or deliver a fixed quantity of foreign currency for an agreed-upon price on an agreed-upon future date. These contracts are valued daily and the Portfolio’s net equity therein, representing unrealized gain or loss on the contracts as measured by the difference between the forward foreign exchange rates at the dates of entry into the contracts and the forward foreign exchange rates at the valuation date, is included in the Statement of Assets and Liabilities. When a contract is closed, the Portfolio recognizes a realized gain or loss equal to the difference between the value of the contract at the time it was opened and the value at the time it was closed.
Realized and unrealized gains and losses on forward foreign currency exchange contracts are included in the Statement of Operations. These contracts involve market and/or credit risk in excess of the amount recognized in the Statement of Assets and Liabilities. The use of forward foreign currency exchange contracts does not eliminate fluctuations in the underlying prices of the securities of the Portfolio, but it does establish a rate of exchange that can be achieved in the future. Although forward foreign currency exchange contracts may limit the risk of loss due to a decline in the value of the currency holdings, they also limit any potential gain that might result should the value of the currency increase. In addition, the Portfolio could be exposed to losses if the counterparties to the contracts are unable to meet the terms of the contracts. The Portfolio’s maximum potential loss from such contracts is the aggregate face value in U.S. dollars at the time the contract was opened.
Transactions in derivative instruments during the year ended December 31, 2013 were as follows:
| | | | |
Statement of Operations Location—Net Realized Gain (Loss) | | Foreign
Exchange | |
Forward foreign currency transactions | | $ | (194,181 | ) |
| | | | |
For the year ended December 31, 2013, the average amount or number per contract outstanding for each derivative type was as follows:
| | | | |
Derivative Description | | Average
Notional Par or
Face Amount‡ | |
Forward Foreign currency transactions | | $ | 1,497,419 | |
| | ‡ | Averages are based on activity levels during 2013. |
4. Certain Risks
Market Risk: In the normal course of business, the Portfolio invests in securities and enters into transactions where risks exist due to fluctuations in the market (market risk) or failure of the other party to a transaction to perform (credit and counterparty risk). The value of securities held by the Portfolio may decline in response to certain events, including those directly involving the companies whose securities are owned by the Portfolio; conditions affecting the general economy; overall market changes; local, regional or global political, social or economic instability; currency, interest rate, and price fluctuations.
Credit and Counterparty Risk: The Portfolio may be exposed to counterparty risk, or the risk that an entity with which the Portfolio has unsettled or open transactions may default. The potential loss could exceed the value of the financial assets and liabilities recorded in the financial statements. Financial assets that potentially expose the Portfolio to credit and counterparty risk consist principally of cash due from counterparties and investments. The Portfolio manages counterparty risk by entering into agreements only with counterparties that it believes have the financial resources to honor their obligations and by monitoring the financial stability of those counterparties. The Portfolio’s investment adviser attempts to mitigate counterparty risk by (i) periodically assessing the creditworthiness of its trading partners, (ii) monitoring and/or limiting the amount of its net exposure to each individual counterparty based on its assessment, and (iii) requiring collateral from the counterparty for certain transactions. In order to preserve certain safeguards for non-standard settlement trades, the Portfolio restricts its exposure to credit and counterparty losses by entering into master netting agreements with counterparties (approved brokers) with whom it undertakes a significant volume of transactions. Master Agreements govern the terms of certain transactions, and reduce the counterparty risk associated with relevant transactions by specifying credit protection mechanisms and providing standardization that improves legal certainty. Master Agreements can also help limit counterparty risk by specifying collateral posting arrangements at pre-arranged exposure levels.
Repurchase and reverse repurchase agreements are primarily executed under Global Master Repurchase Agreements (“GMRAs”) or Master Repurchase Agreements (“MRAs”), which provide the rights to set-off. Each repurchase and reverse repurchase agreement is initially collateralized at the transaction level. In the event of default, the total market value exposure will be offset against collateral exchanged to date, which would result in a net receivable/(payable) that would be due from/to the counterparty.
MSF-16
Metropolitan Series Fund
Baillie Gifford International Stock Portfolio
Notes to Financial Statements—December 31, 2013—(Continued)
Foreign Investment Risk: The investments by the Portfolio in foreign securities may involve risks not present in domestic investments. Because securities may be denominated in foreign currencies, may require settlement in foreign currencies and may pay interest or dividends in foreign currencies, changes in the relationship of these foreign currencies to the U.S. dollar can significantly affect the value of the investments and earnings of the Portfolio. Foreign investments may also subject the Portfolio to foreign government exchange restrictions, expropriation, taxation or other political, social or economic developments, all of which could affect the market and/or credit risk of the investments. In addition to the risks described above, risks may arise from forward foreign currency contracts with respect to the potential inability of counterparties to meet the terms of their contracts.
Additional risks associated with each type of investment are described above within the respective security type notes. The Portfolio’s prospectus includes a discussion of the principal risks of investing in the Portfolio.
5. Investment Transactions
Aggregate cost of purchases and proceeds of sales of investment securities, excluding short-term securities, for the year ended December 31, 2013 were as follows:
| | | | | | | | | | | | |
Purchases | | | Sales | |
U.S. Government | | Non U.S. Government | | | U.S. Government | | | Non U.S. Government | |
| $0 | | $ | 347,963,787 | | | $ | 0 | | | $ | 403,423,726 | |
During the year ended December 31, 2013, the Portfolio engaged in security transactions with other affiliated portfolios. These amounted to $18,099,034 in sales of investments, which are included above.
With respect to the Portfolio’s merger with Met Investors Series Trust American Funds International Portfolio (see Note 9) on April 26, 2013, the Portfolio acquired long-term equity securities with a cost of $334,864,216 that are not included in the above non-U.S. Government purchases.
6. Investment Management Fees and Other Transactions with Affiliates
Investment Management Agreement - MetLife Advisers is the investment adviser to the Portfolio. The Trust has entered into an investment management agreement with MetLife Advisers with respect to the Portfolio. For providing investment management services to the Portfolio, MetLife Advisers receives monthly compensation at the annual rates:
| | | | | | |
Management
Fees earned by
MetLife Advisers
for the year ended
December 31, 2013 | | % per annum | | | Average Daily Net Assets |
| $15,031,762 | | | 0.860 | % | | Of the first $500 million |
| | | 0.800 | % | | Of the next $500 million |
| | | 0.750 | % | | On amounts in excess of $1 billion |
Certain officers and trustees of the Trust may also be officers of MetLife Advisers; however, such officers and trustees receive no compensation from the Trust.
MetLife Advisers has entered into an investment subadvisory agreement with respect to the Portfolio. Baillie Gifford Overseas Limited is compensated by MetLife Advisers to provide subadvisory services for the Portfolio.
Management Fee Waivers - Pursuant to an expense agreement, MetLife Advisers has agreed, for the period December 1, 2013 through April 27, 2014, to reduce its advisory fees set out above under “Investment Management Agreement” for each class of the Portfolio as follows:
| | |
% per annum reduction | | Average Daily Net Assets |
| 0.080% | | On amounts over $156.25 million and under $400 million |
| 0.180% | | Of the next $100 million |
| 0.120% | | Of the next to $400 million |
| 0.150% | | On amounts in excess of $900 million |
MSF-17
Metropolitan Series Fund
Baillie Gifford International Stock Portfolio
Notes to Financial Statements—December 31, 2013—(Continued)
Prior to December 1, 2013, the Adviser had agreed, for the period April 29, 2013 to November 30, 2013, to reduce its advisory fees set out above under “Investment Management Agreement” for each class of the Portfolio as follows:
| | |
% per annum reduction | | Average Daily Net Assets |
| 0.080% | | On amounts over $156.25 million and under $400 million |
| 0.180% | | Of the next $100 million |
| 0.120% | | Of the next $400 million |
| 0.150% | | Of the next $100 million |
| 0.100% | | On amounts in excess of $1 billion |
An identical expense agreement was in place for the period April 30, 2012 through April 28, 2013. Amounts waived for the year ended December 31, 2013 are shown as management fee waivers in the Statement of Operations.
Transfer Agency Agreement - MetLife serves as the transfer agent for the Trust. MetLife receives no fees for its services to the Trust under the transfer agency agreement.
Distribution and Service Fees - The Trust has a distribution agreement with MetLife Investors Distribution Company (“MIDC” or the “Distributor”) in which MIDC serves as the distributor for the Portfolio’s Class A, B and E Shares. MIDC is a wholly-owned subsidiary of MetLife Investors Group, Inc., an affiliate of the Adviser. The Trust has also adopted a Distribution and Service Plan under Rule 12b-1 of the 1940 Act for the Portfolio’s Class B and E Shares. Under the Distribution and Service Plan, the Class B and E Shares of the Portfolio pay a fee to compensate the Insurance Companies (or their affiliates) and other broker-dealers and financial intermediaries involved in the offer and sale of Portfolio shares for promoting or selling and servicing the Class B and E Shares. The fees under the Distribution and Service Plan for each class of the Portfolio’s shares are calculated as a percentage of the Portfolio’s average daily net assets that are attributable to that Class. Currently, the fee is 0.25% per year for Class B Shares and 0.15% per year for Class E Shares. Amounts incurred by the Portfolio for the year ended December 31, 2013 are shown as Distribution and service fees in the Statement of Operations.
Deferred Trustee Compensation - Each Trustee who is not currently an employee of the Adviser or any of its affiliates receives compensation from the Trust for his or her service to the Trust. A deferred compensation plan (the “Plan”) is available to the Trustees on a voluntary basis. Deferred amounts remain in the Trust until distributed in accordance with the provisions of the Plan. The value of a participating Trustee’s deferral account is based on theoretical investments of deferred amounts, on the normal payment dates in certain portfolios of the Trust or Met Investors Series Trust, an affiliate of the Trust, as designated by the participating Trustee. Changes in the value of participants’ deferral accounts are reflected as Trustees’ fees and expenses in the Statement of Operations. The portion of the accrued obligations allocated to the Portfolio under the Plan is reflected as Deferred trustees’ fees in the Statement of Assets and Liabilities.
7. Contractual Obligations
Under the Trust’s organizational documents, its officers and Trustees may be indemnified against certain liabilities and expenses arising out of the performance of their duties to the Trust. Additionally, the Trust has a variety of indemnification obligations under contracts with its service providers. The Trust’s maximum exposure under these arrangements is unknown, as this would involve future claims that may be made against the Trust that have not yet occurred.
8. Income Tax Information
The tax character of distributions paid for the periods ended December 31, 2013 and 2012 was as follows:
| | | | | | | | | | | | | | | | | | | | |
Ordinary Income | | | Long-Term Capital Gain | | | Total | |
2013 | | 2012 | | | 2013 | | | 2012 | | | 2013 | | | 2012 | |
| $26,526,779 | | $ | 10,931,444 | | | $ | — | | | $ | — | | | $ | 26,526,779 | | | $ | 10,931,444 | |
As of December 31, 2013, the components of distributable earnings (accumulated losses) on a federal income tax basis were as follows:
| | | | | | | | | | | | | | | | | | | | |
Undistributed
Ordinary
Income | | Undistributed
Long-Term
Capital Gain | | | Net
Unrealized
Appreciation | | | Loss Carryforwards | | | Other
Accumulated
Capital Losses | | | Total | |
| $28,429,548 | | $ | — | | | $ | 383,290,637 | | | $ | (414,093,824 | ) | | $ | (10,570,687 | ) | | $ | (12,944,326 | ) |
The Portfolio utilizes the provisions of the federal income tax laws that provide for the carryforward of capital losses for prior years, offsetting such losses against any future realized capital gains. Under the Regulated Investment Company Modernization Act of 2010 (the “Act”), net capital losses recognized after December 22, 2010 may be carried forward indefinitely and their character is retained
MSF-18
Metropolitan Series Fund
Baillie Gifford International Stock Portfolio
Notes to Financial Statements—December 31, 2013—(Continued)
as short-term and/or long-term losses. Previously, net capital losses were carried forward for up to eight years and treated as short-term losses. As a transition rule, the Act requires that post-enactment net capital losses be used before pre-enactment net capital losses.
As of December 31, 2013, the post-enactment accumulated short-term capital losses were $10,570,687. The pre-enactment accumulated capital loss carryforwards and expiration dates were as follows:
| | | | | | | | |
Expiring
12/31/2017 | | Expiring
12/31/2016 | | | Total | |
| $169,332,274 | | $ | 244,761,550 | | | $ | 414,093,824 | |
9. Acquisition
At the close of business on April 26, 2013, the Portfolio, with aggregate Class A, Class B, and Class E net assets of $1,514,112,574, $98,152,323, and $26,620,393 respectively, acquired all of the assets and liabilities of American Funds International Portfolio of the Met Investors Series Trust (“American Funds International”).
The acquisition was accomplished by a taxable exchange of 36,865,244 Class B shares of the Portfolio (valued at $343,584,075) for 41,617,864 Class C shares of American Funds International. Each shareholder of American Funds International received Class B shares of the Portfolio at the Class B’s NAV, as determined at the close of business on April 26, 2013. The transaction was part of a restructuring designed to eliminate the offering of overlapping Portfolios in the MetLife, Inc. families of funds with similar investment objectives and similar investment strategies that serve as funding vehicles for insurance contracts that are offered by affiliates of MetLife. Some of the investments held by the American Funds International Portfolio may have been purchased or sold prior to the acquisition for the purpose of complying with the anticipated investment policies or limitations of the Portfolio after the acquisition. If such purchases or sales occurred, the transaction costs were borne by the American Funds International Portfolio. All other costs associated with the merger were not borne by the shareholders of either Portfolio.
American Funds International’s net assets on April 26, 2013, were $343,584,075, all for Class C shares, with investments valued at $334,864,216. For financial reporting purposes, assets received, liabilities assumed, and shares issued by the Portfolio were recorded at fair value. The fair value of the investments received by the Portfolio became the new cost basis of the investments in the Portfolio.
The aggregate net assets of the Portfolio immediately after the acquisition were $1,982,469,365.
Assuming the acquisition had been completed on January 1, 2013, the Portfolio’s pro-forma results of operations for the year ended December 31, 2013 are as follows:
| | | | |
Net investment income | | $ | 30,222,657 | (a) |
Net realized and unrealized gain on investments | | | 258,968,602 | (b) |
| | | | |
Net increase in net assets from operations | | $ | 289,191,259 | |
| | | | |
Because the combined investment portfolios have been managed as a single integrated portfolio since the acquisition was completed, it is not practicable to separate the amounts of revenue and earnings of American Funds International that have been included in the Portfolio’s Statement of Operations since April 26, 2013.
| (a) | $30,994,569 net investment income as reported minus $428,522 from American Funds International pre-merger net investment loss, minus $724,668 in higher net advisory fees, plus $334,481 in lower distribution and service fees, plus $46,797 of pro-forma eliminated other expenses. |
| (b) | $389,063,898 unrealized appreciation as reported December 31, 2013 minus $184,533,324 pro-forma December 31, 2012 unrealized appreciation, plus $21,915,768 net realized gain as reported, plus $32,522,260 in net realized gain from American Funds International pre-merger. |
MSF-19
Metropolitan Series Fund
Baillie Gifford International Stock Portfolio
Report of Independent Registered Public Accounting Firm
To the Shareholders of Baillie Gifford International Stock Portfolio and the Board of Trustees of Metropolitan Series Fund:
We have audited the accompanying statement of assets and liabilities, including the schedule of investments, of the Baillie Gifford International Stock Portfolio, one of the portfolios constituting Metropolitan Series Fund, (the “Trust”), as of December 31, 2013, and the related statement of operations for the year then ended, the statements of changes in net assets for each of the two years in the period then ended, and the financial highlights for each of the five years in the period then ended. These financial statements and financial highlights are the responsibility of the Trust’s management. Our responsibility is to express an opinion on these financial statements and financial highlights based on our audits.
We conducted our audits in accordance with the standards of the Public Company Accounting Oversight Board (United States). Those standards require that we plan and perform the audit to obtain reasonable assurance about whether the financial statements and financial highlights are free of material misstatement. The Trust is not required to have, nor were we engaged to perform, an audit of its internal control over financial reporting. Our audits included consideration of internal control over financial reporting as a basis for designing audit procedures that are appropriate in the circumstances, but not for the purpose of expressing an opinion on the effectiveness of the Trust’s internal control over financial reporting. Accordingly, we express no such opinion. An audit also includes examining, on a test basis, evidence supporting the amounts and disclosures in the financial statements, assessing the accounting principles used and significant estimates made by management, as well as evaluating the overall financial statement presentation. Our procedures included confirmation of securities owned as of December 31, 2013, by correspondence with the custodian and brokers; where replies were not received from brokers, we performed other auditing procedures. We believe that our audits provide a reasonable basis for our opinion.
In our opinion, the financial statements and financial highlights referred to above present fairly, in all material respects, the financial position of the Baillie Gifford International Stock Portfolio of Metropolitan Series Fund, as of December 31, 2013, the results of its operations for the year then ended, the changes in its net assets for each of the two years in the period then ended, and the financial highlights for each of the five years in the period then ended, in conformity with accounting principles generally accepted in the United States of America.
Deloitte & Touche LLP
Boston, Massachusetts
February 27, 2014
MSF-20
Metropolitan Series Fund
Trustees and Officers of Metropolitan Series Fund
The Trustees and executive officers of the Trust, their ages and their principal occupations during the past five years are set forth below. Unless otherwise indicated, the business address of each is One Financial Center, Boston, MA 02111. Each Trustee who is deemed an “interested person,” as such term is defined in the 1940 Act, is indicated by an asterisk. Those Trustees who are not “interested persons” as defined in the 1940 Act are referred to as “Independent Trustees.” Additional information about the Trustees is available in the Statement of Additional Information, which is available without charge, upon request, by calling (800) 848-3854.
Trustees of the Trust
| | | | | | | | | | |
Name and Age | | Position(s)
Held with
Registrant | | Term of Office and
Length of Time
Served | | Principal Occupation(s) During the
Past 5 Years(1) | | Number of
Portfolios
in Fund
Complex(2)
overseen | | Other Directorships Held
by Trustee During the
Past 5 Years(1) |
| Interested Trustee | | | | | | | | | | |
| Elizabeth M. Forget* (47) | | Trustee, Chairman of the Board, President and Chief Executive Officer | | Indefinite; From May 2006 (President and Chief Executive Officer)/ August 2006 (Trustee and Chairman of the Board) to present | | Senior Vice President, MetLife Inc.; President, MetLife Advisers, LLC and a predecessor company. | | 79 | | Trustee, Met Investors Series Trust (the “MIST Trust”);** various MetLife-affiliated boards. |
| | | | | |
| Independent Trustees | | | | | | | | | | |
| Stephen M. Alderman (54) | | Trustee | | Indefinite; From April 2012 to present | | Shareholder in the law firm of Garfield & Merel, Ltd. | | 79 | | Trustee, MIST Trust;** Director, International Truck Leasing Corp. |
| | | | | |
| Robert J. Boulware (57) | | Trustee | | Indefinite; From April 2012 to present | | Managing Director, Pilgrim Funds, LLC (private equity fund). | | 79 | | Trustee, MIST Trust;** Trustee, Vertical Capital Income Fund (closed-end fund); Director, Gainsco, Inc. (auto insurance). |
| | | | | |
| Susan C. Gause (61) | | Trustee | | Indefinite; From April 2012 to present | | Private Investor. | | 79 | | Trustee, MIST Trust;** Trustee, HSBC Funds. |
| | | | | |
| Nancy Hawthorne (62) | | Trustee | | Indefinite; From May 2003 to present | | Chief Executive Officer, Clerestory LLC (corporate advisor). | | 79 | | MIST Trust;** Director, THL Credit, Inc.**; Director, Avid Technology, Inc.** |
| | | | | |
| Barbara A. Nugent (57) | | Trustee | | Indefinite; From January 2014 to present | | President, True North Board Governance, LLC (consulting); until 2014, partner in the law firm of Stradley Ronon Stevens & Young, LLP. | | 79 | | Trustee, MIST Trust**; Director, Episcopal Healthcare Foundation; until 2014, member, Mutual Fund Directors Forum Advisory Board. |
| | | | | |
| Keith M. Schappert (62) | | Trustee | | Indefinite; From August 2009 to present | | Principal, Schappert Consulting LLC (asset management consulting). | | 79 | | Trustee, MIST Trust;** Director, The Commonfund for Nonprofit Organizations; until 2011, Director, Trilogy Global Advisors; Director, Mirae Asset Discovery Funds,** Director, Calamos Investments. |
| | | | | |
| Linda B. Strumpf (66) | | Trustee | | Indefinite; From May 2000 to present | | Chair of the Investment Committee, Leona M. and Harry B. Helmsley Charitable Trust; until 2011, Chief Investment Officer, Leona M. and Harry B. Helmsley Charitable Trust. | | 79 | | Since 2012, Trustee, MIST Trust,** Trustee and Member of Investment Committee, The Pennsylvania State University. |
| | | | | |
| Dawn M. Vroegop (47) | | Trustee | | Indefinite; From May 2009 to present | | Private Investor. | | 79 | | Trustee, MIST Trust,** Trustee, Driehaus Mutual Funds; Director and Investment Committee Chair, City College of San Francisco Foundation. |
MSF-21
Metropolitan Series Fund
Trustees and Officers of Metropolitan Series Fund—(Continued)
Executive Officers of the Trust
| | | | | | |
Name and Age | | Position(s) Held with
Registrant | | Term of Office
and Length of
Time Served | | Principal Occupation(s) During Past 5 Years(1) |
| Elizabeth M. Forget (47) | | President, Chief Executive Officer, Trustee and Chairman of the Board | | From May
2006 (President
and Chief
Executive
Officer)/
August 2006
(Trustee and
Chairman of
the Board) to
present | | See principal occupation information in the table above. |
| | | |
| Jeffrey L. Bernier (42) | | Vice President | | From February
2008 to present | | Vice President, MetLife, Inc.; Senior Vice President, MetLife Advisers, LLC and a predecessor company. |
| | | |
| Peter H. Duffy (58) | | Chief Financial Officer and Treasurer | | From November
2000 to present | | Senior Vice President, MetLife Advisers, LLC; Vice President, MetLife, Inc. |
| | | |
| Andrew L. Gangolf (59) | | Secretary | | From May
2011to present | | Senior Vice President, MetLife Advisers, LLC; Senior Vice President & Assistant General Counsel, AllianceBerstein Investments, Inc. |
| | | |
| Jeffrey P. Halperin (46) | | Chief Compliance Officer | | From November
2005 to present | | Vice President, MetLife, Inc.; Chief Compliance Officer, MIST; Chief Compliance Officer, MSF Trust; Chief Compliance Officer, MetLife Advisers, LLC and a predecessor company; Chief Compliance Officer, MetLife Investment Management, LLC (formerly MetLife Investment Advisors Company, LLC). |
| | | |
| Alan C. Leland, Jr. (61) | | Vice President | | From February
2005 to present | | Treasurer and Chief Financial Officer, MetLife Advisers, LLC; Vice President, MetLife Group Inc.; Vice President, MetLife, Inc. |
| * | Ms. Forget is an “interested person” of the Trust because of her positions with MetLife Advisers, LLC and her ownership of securities issued by MetLife, Inc., the ultimate parent company of MetLife Advisers, LLC. |
| ** | Indicates a directorship with a registered investment company or a company subject to the reporting requirements of the Securities Exchange Act of 1934, as amended. |
| (1) | Previous positions during the past five years with the Trust, MetLife, Inc. or the Adviser are omitted if not materially different. |
| (2) | The Fund Complex includes 49 Portfolios of the MIST Trust and 30 Portfolios of the Trust. |
MSF-22
Metropolitan Series Fund
Baillie Gifford International Stock Portfolio
Board of Trustees’ Consideration of Advisory and Sub-Advisory Agreements
At an in-person meeting of the Boards of Trustees (the “Board”) of Met Investors Series Trust and Metropolitan Series Fund (“MIST” and “MSF,” respectively, and collectively, the “Trusts”) held on November 19-20, 2013, the Board, including a majority of the Trustees who are not considered to be “interested persons” of the Trusts (the “Independent Trustees”) under the Investment Company Act of 1940, as amended (the “1940 Act”), approved for an annual period the continuation of each Trust’s advisory agreement (the “Advisory Agreement”) with MetLife Advisers, LLC (the “Adviser”) and the applicable sub-advisory agreements (each a “Sub-Advisory Agreement,” and collectively with the Advisory Agreement, the “Agreements”) between the Adviser and the investment sub-advisers (each a “Sub-Adviser,” and collectively, the “Sub-Advisers”) for each of the series of the Trusts, including the Baillie Gifford International Stock Portfolio (each a “Portfolio,” and collectively, the “Portfolios”).1
In considering the Agreements, the Board reviewed a variety of materials provided by the Adviser and the Sub-Advisers relating to the Portfolios, including comparative performance, fee and expense information for an appropriate peer group of similar mutual funds, performance information for relevant benchmark indices and other information regarding the nature, extent and quality of services provided by the Adviser and the Sub-Advisers under their respective Agreements. The Board also took into account its experience with the Adviser and the Sub-Advisers and information provided to the Board in its meetings throughout the year with respect to the services provided by the Adviser and the Sub-Advisers, including quarterly performance reports prepared by management containing reviews of investment results, and periodic presentations from certain of the Sub-Advisers with respect to the Portfolios they manage. The Independent Trustees also assessed reports provided by the Board’s independent consultant, who reviewed and provided analyses regarding investment performance, fees and expenses, and other information provided by, or at the direction of, the Adviser and the Sub-Advisers, as more fully discussed below.
The Independent Trustees were separately advised by independent legal counsel throughout the process, and met with independent legal counsel in periodic executive sessions. Prior to voting to continue the Agreements at the November meeting, the Independent Trustees also received a memorandum from their independent counsel discussing the legal standards for their consideration of the proposed continuation of the Agreements. The Board also met in person with personnel of the Adviser on September 17, 2013 for the specific purpose of giving preliminary consideration to the proposed continuation of the Agreements and to request additional information they considered reasonably necessary to their deliberations. The Independent Trustees also discussed the proposed continuation of the Agreements in private sessions with their independent legal counsel at which no representatives of management were present.
In considering whether to approve the renewal of the Advisory Agreement with the Adviser and any applicable Sub-Advisory Agreements with respect to a Portfolio, the Board reviewed and analyzed the factors it deemed relevant, including: (1) the nature, extent and quality of the services to be provided to the Portfolios by the Adviser and the Sub-Advisers; (2) the performance of the Portfolios as compared to a peer group and an appropriate index; (3) the Adviser’s and each of the Sub-Adviser’s personnel and operations; (4) the financial condition of the Adviser and of the Sub-Advisers; (5) the level and method of computing each Portfolio’s advisory and sub-advisory fees; (6) the profitability of the Adviser under the Advisory Agreement and of certain of the Sub-Advisers under the Sub-Advisory Agreements; (7) any “fall-out” benefits to the Adviser, the Sub-Advisers and their affiliates (i.e., ancillary benefits realized by the Adviser, the Sub-Advisers or their affiliates from the Adviser’s or Sub-Advisers’ relationship with the Trusts); (8) the anticipated effect of growth in size on Portfolio expenses; (9) fees paid to certain of the Sub-Advisers by comparable institutional and retail accounts; and (10) possible conflicts of interest.
Nature, extent and quality of services. The Board evaluated the nature, extent and quality of the services that the Adviser, and the Sub-Advisers as relevant, have provided to the Portfolios. The Board considered the Adviser’s services as investment manager to the Portfolios, including services relating to the selection and oversight of the Sub-Advisers for the applicable Portfolios. The Board considered, among other things, the Adviser’s oversight of the provision of services to the Portfolios by the Sub-Advisers, including with respect to investment activities and trading practices, and the Sub-Adviser’s compliance with fund policies, objectives and Board directives, compliance policies and procedures and applicable law. The Adviser’s services in coordinating and overseeing the activities of the Trusts’ other service providers were also considered. The Board also evaluated the expertise and performance of the personnel of the Adviser who performed services for the Portfolios throughout the year.
The Board considered information received from the Trust’s Chief Compliance Officer (“CCO”) regarding the Portfolios’ compliance policies and procedures established pursuant to Rule 38a-l under the 1940 Act. The Board also evaluated the CCO’s ongoing reports concerning the CCO’s oversight of the risk assessment processes of the Sub-Advisers.
1 The Pyramis Managed Risk Portfolio recently commenced operations and, therefore, the Agreement with respect to this Portfolio was not up for renewal.
MSF-23
Metropolitan Series Fund
Baillie Gifford International Stock Portfolio
Board of Trustees’ Consideration of Advisory and Sub-Advisory Agreements—(Continued)
With respect to the services provided by each of the Sub-Advisers, the Board considered, among other things, information provided to the Board by each Sub-Adviser. The Board considered the Sub-Adviser’s current level of staffing and its overall resources, as well as its compensation program. The Board reviewed each Sub-Adviser’s history and investment experience, as well as information regarding the qualifications, background and responsibilities of the Sub-Adviser’s investment and compliance personnel who provide services to the Portfolios. The Board also considered, among other things, the Sub-Adviser’s compliance program and any disciplinary history. The Board also took into account the Sub-Adviser’s risk assessment and monitoring process. The Board noted each Sub-Adviser’s regulatory history, including whether it was currently involved in any regulatory actions or investigations as well as material litigation, and any settlements and amelioratory actions undertaken, as appropriate. The Board also noted that the CCO and his staff conduct regular, periodic compliance reviews with each of the Sub-Advisers and present reports to the Independent Trustees regarding the same, which includes evaluating the regulatory compliance systems of the Sub-Advisers and procedures reasonably designed by them to help assure compliance with the federal securities laws, including issues related to late trading and market timing, best execution, fair value pricing, and proxy voting procedures, among others. The Board also took into account the financial condition of each Sub-Adviser. In its review, the Board also received and took into account information regarding any services and/or payments provided to the Adviser by the Sub-Advisers in connection with marketing activities.
The Board considered each Sub-Adviser’s investment process and philosophy. The Board took into account that each Sub-Adviser’s responsibilities include the development and maintenance of an investment program for the applicable Portfolio which is consistent with the Portfolio’s investment objectives, the selection of investment securities and the placement of orders for the purchase and sale of such securities, as well as the implementation of compliance controls related to performance of these services. The Board also reviewed each Sub-Adviser’s brokerage policies and practices.
Performance. The Board considered the performance of the Portfolios as described in the quarterly reports prepared by management, and as also analyzed in reports prepared by the Independent Trustees’ independent consultant. The Board noted that the Adviser reviews with the Board on a quarterly basis detailed information about the Portfolios’ performance results, portfolio composition and investment strategies. The Board also reviewed and considered a separate report prepared by Lipper Inc. (“Lipper”), an independent third party, which provided a statistical analysis comparing the Portfolios’ investment performance, expenses, and fees to comparable funds underlying variable insurance products (the “Performance Universe”). In addition, the Independent Trustees met separately with a representative of Bobroff Consulting, Inc., an independent consultant (“Bobroff), at a special board meeting in September 2013, to review the separate reports prepared by such consultant (“Bobroff Report”), which analyzed the report prepared by Lipper. The Board also considered each Portfolio’s more recent performance subsequent to the performance period covered by the Lipper reports, and management’s discussion of the same, including the effect of current market conditions on each Portfolio’s more recent performance.
The Board reviewed the Portfolios’ performance records and the Adviser’s and Sub-Advisers’ management styles and long-term performance records with the Portfolios and comparable funds. The Board focused particular attention on Portfolios with less favorable performance records. The Board was mindful of the Adviser’s focus on each Sub-Adviser’s performance and noted that the Adviser has been active in monitoring and responding to any performance issues with respect to the Portfolios. The Board also took into account its discussions with management regarding factors that contributed to the performance of the Portfolios.
Among other data relating specifically to the Baillie Gifford International Stock Portfolio’s performance, the Board considered that the Portfolio underperformed the median of its Performance Universe and its Lipper Index for the one-, three- and five-year periods ended June 30, 2013. The Board further considered that the Portfolio underperformed its benchmark, the MSCI AC World Index ex USA for the one-, three- and five-year periods ended October 31, 2013. The Board also took into account management’s discussion of the Portfolio’s performance. The Board further noted that the Sub-Adviser assumed portfolio management responsibilities for the Portfolio effective February 1, 2012 and that performance prior to that date represents that of the previous sub-adviser.
Fees and Expenses. The Board gave consideration to the advisory fees payable under the Advisory Agreement and the sub-advisory fees payable under each of the Sub-Advisory Agreements. In this regard, the Board reviewed the advisory fees payable on a Portfolio-by-Portfolio basis based on information provided by the Adviser. The Independent Trustees, with the assistance of Bobroff, also examined the fees paid by a Portfolio in light of fees paid to other investment managers by comparable funds, as well as considered the fees charged by the Adviser to manage other comparable funds, as applicable. The Lipper report included comparisons of the Adviser’s fee schedule with that of its peers based on an asset-based analysis of relative fee structures according to the size of the Portfolio. In addition, the Board considered the Portfolios’ advisory and sub-advisory fees and total expenses as compared to similarly situated investment companies underlying variable insurance products deemed to be comparable to the Portfolios as determined by Lipper. The Board considered a Portfolio’s ranking within a smaller group of peer funds chosen by Lipper (the “Expense Group”), as well as
MSF-24
Metropolitan Series Fund
Baillie Gifford International Stock Portfolio
Board of Trustees’ Consideration of Advisory and Sub-Advisory Agreements—(Continued)
the Portfolio’s ranking within broader groups of funds (the “Expense Universe” and the “Sub-advised Expense Universe”). The Board also considered a Portfolio’s contractual sub-advisory fees, as applicable, as compared to the Sub-advised Expense Universe as well as a smaller group of funds (the “Sub-advised Expense Group”). In comparing a Portfolio’s actual and contractual management fee to that of comparable funds, the Board noted that such fee includes both advisory and administrative fees.
The Board noted that the sub-advisory fees for the Portfolios are paid by the Adviser, not the Portfolios, out of the advisory fee. It was further noted that the Adviser negotiates such fees at arm’s length. The Board also considered that the Adviser had entered into expense limitation agreements with certain of the Portfolios, pursuant to which the Adviser has agreed to waive a portion of its advisory fee and/or reimburse certain expenses as a means of limiting a Portfolio’s total annual operating expenses. The Board further considered the amount of sub-advisory fees paid out by the Adviser and the amount of the management fees that it retained in light of the services performed by Sub-Advisers and Adviser, respectively.
With respect to the Baillie Gifford International Stock Portfolio, the Board considered that the Portfolio’s actual management fee and total expenses (exclusive of 12b-1 fees) were below the Expense Group median, the Expense Universe median and Sub-advised Expense Universe median. The Board noted that the Portfolio’s contractual management fees were above the asset-weighted average of the Expense Group at the Portfolio’s current size. The Board also noted that the Portfolio’s contractual sub-advisory fees were below the average of the Sub-advised Expense Group and Sub-advised Expense Universe at the Portfolio’s current size. In addition, the Board noted that the Adviser had recently negotiated a reduction to the Portfolio’s sub-advisory fee schedule and that the Adviser agreed to waive a corresponding portion of its advisory fee in order for contractholders to benefit from the lower sub-advisory fee effective December 1, 2013. The Board further noted that the Adviser had waived fees and/or reimbursed expenses during the past year.
Profitability. The Board examined the profitability of the Adviser on a Portfolio-by-Portfolio basis. The Board also considered that the Distributor, MetLife Investors Distribution Company, receives Rule 12b-1 payments to support the distribution of the products. The Board considered the profitability to the Sub-Advisers and their affiliates as a result of their relationships with the Portfolios, and the Board considered the ability of the Adviser to negotiate the Sub-Advisory Agreements and the fees thereunder at arm’s length. The Board also reviewed Portfolio specific data with regard to the profitability of the Portfolios to each Sub-Adviser, as available.
Economies of scale. The Board also considered the effect of the Portfolios’ growth in size on their fees. The Board noted that the fee schedules for most of the Portfolios contain breakpoints that reduce the fee rate above specified asset levels. The Board noted those Portfolios that did not contain breakpoints in the advisory fee and took into account management’s discussion of the same. The Board noted that those Portfolios with advisory fee schedules containing breakpoints generally reflect the inclusion of breakpoints in the sub-advisory fee schedule for such Portfolios. The Board considered the effective fees under the Advisory Agreement for a Portfolio as a percentage of assets at different asset levels and possible economies of scale that may be realized if the assets of the Portfolio grow. Among other data, the Board examined the effect of a Portfolio’s growth in size on various fee schedules and reviewed the Lipper and Bobroff Reports, which compared fees among peers. The Board also generally noted that if a Portfolio’s assets increase over time, the Portfolio may realize other economies of scale if assets increase proportionally more than certain other fixed expenses. In addition, the Board noted that the Adviser had taken a number of steps to date intended to share the benefits of economies of scale with contractholders.
With respect to the Baillie Gifford International Stock Portfolio, the Board noted that the Portfolio’s advisory fee and sub-advisory fee each contains breakpoints that reduce the advisory fee rate on assets above certain specified asset levels. The Board considered the fact that the Portfolio’s fee levels decline as portfolio assets increase.
Other factors. As part of its evaluation of the Adviser’s compensation, the Board considered other benefits that may be realized by the Adviser and its affiliates from their relationship with the Trusts. Among them, the Board recognized that an affiliate of the Adviser, MetLife Investors Distribution Company, serves as the Distributor for the Trusts, and, as such, receives payments pursuant to Rule 12b-1 from the Portfolios to compensate it for providing shareholder services and selling activities, which could lead to growth in the Trusts’ assets and corresponding benefits from such growth, including economies of scale. The Board also considered that affiliates of the Adviser may benefit from certain indirect tax benefits relating to dividend received deductions and foreign tax credits. In conjunction with these considerations, the Board noted the costs of providing investment management and other services to the Portfolios and the ongoing commitment of the Adviser to the Portfolios.
The Board considered other benefits that may be realized by each Sub-Adviser and its affiliates from their relationship with the Trusts, including the opportunity to provide advisory services to additional portfolios of the Trusts and reputational benefits. In conjunction with these considerations, the Board noted the costs of providing investment advisory services to the Portfolios and the ongoing commitment of the Sub-Advisers to the Portfolios.
MSF-25
Metropolitan Series Fund
Baillie Gifford International Stock Portfolio
Board of Trustees’ Consideration of Advisory and Sub-Advisory Agreements—(Continued)
The Board considered possible conflicts of interest in the form of material benefits or detriments to the Trusts resulting from the nature of the Trusts’ and the Adviser’s or the Sub-Advisers’ affiliations and the services that are provided to the Trusts, and the manner in which such conflicts were mitigated.
Conclusions. After full consideration of the factors discussed above, the Board, including a majority of the Independent Trustees, approved the Advisory Agreement and the Sub-Advisory Agreement, as applicable, with respect to each Portfolio, unless otherwise noted. In making its approvals, the Board concluded that the nature, extent and quality of services provided by the Adviser and each Sub-Adviser supported the renewal of the Agreements. The Board also concluded that the investment performance of each Fund was such that each Agreement should continue. In addition, the Board concluded that fees paid by a Portfolio to the Adviser and, if applicable, the Sub-Adviser appeared to be acceptable in light of nature, extent and quality of the services provided by the Adviser and Sub-Adviser. Further, the Board concluded that the Adviser’s profitability in providing services under the Advisory Agreements did not appear unreasonably high in light of the nature, extent and quality of the services provided by the Adviser. Finally, the Board concluded that the Advisory and Sub-Advisory fees in some measure share economies of scale with contractholders. In approving the renewal of each of the Agreements, the Board, including the Independent Trustees, did not identify any single factor as controlling, and generally attributed different weights to various factors for the various Portfolios. The Board evaluated all information available to them on a Portfolio-by-Portfolio basis, and their decisions were made separately with respect to each Portfolio.
MSF-26
Metropolitan Series Fund
Barclays Aggregate Bond Index Portfolio
Managed by MetLife Investment Management, LLC
Portfolio Manager Commentary*
PERFORMANCE
For the one year period ended December 31, 2013, the Class A, B, E, and G shares of the Barclays Aggregate Bond Index Portfolio returned -2.33%, -2.53%, -2.41%, and -2.57%, respectively. The Portfolio’s benchmark, the Barclays U.S. Aggregate Bond Index1, returned -2.02%.
MARKET ENVIRONMENT / CONDITIONS
Growing confidence in the U.S. economy, reduced central bank stimulus and an increased investor risk appetite helped buoy the equity markets and pushed fixed income markets lower in 2013. The S&P 500 Index recorded a 32% gain in 2013, and most fixed income sectors reported negative annual total returns.
The Federal Open Market Committee (the “Committee”) met eight times during the one-year period and held the target range for the federal funds rate at 0 to 0.25%, a range set in December 2008. The Committee observed that labor market conditions improved and the unemployment rate declined. The Committee determined that there was sufficient economic and labor market stability to warrant a reduction in the pace of asset purchases. The Committee pledged that, beginning in January 2014, it would add to its holding of agency mortgage-backed securities (MBS) at a pace of $35 billion per month, down from $40 billion per month, and that it would add to its holdings of longer-term Treasury securities at a pace of $40 billion per month, down from $45 billion per month. The Committee also stated that it would maintain the program of reinvesting principal payments from its retained agency debt and agency MBS into agency MBS and would continue rolling over maturing Treasury securities at auction. The Committee indicated that it would likely further shrink the pace of asset purchases at future meetings.
At the end of the one year period, the yield curve steepened, and rates were significantly higher than the 2012 year-end levels. The 2-year Treasury closed at 0.38% (up from 0.25% on December 31, 2012), and the 30-year Treasury closed at 3.97% (up from 2.95% on December 31, 2012). Investment grade credit issuance surpassed the 2012 record for annual issuance (approximately $1.1 billion).
The price of crude oil fluctuated during the one-year period. Crude oil finished the year at approximately $98 per barrel, after posting a low of approximately $87 per barrel and a high of approximately $111 per barrel.
The Commercial Mortgage-Backed Securities (CMBS) sector was the strongest performing Index sector for the year on a total return basis and the only sector to post a positive annual total return. Total returns for the Index sectors were: 0.23% for CMBS; -0.27% for Asset-Backed Securities (ABS); -1.41% for MBS; -1.53% for Corporate; -2.71% for Government-Related; and -2.75% for Treasury.
PORTFOLIO REVIEW / PERIOD END POSITIONING
The Portfolio is managed utilizing a Stratified Sampling approach where the objective is to track the performance of the Index by holding a subset of Index constituents and neutralizing exposures across key characteristics (i.e., duration, term structure, high sector, sub-sector, quality). Factors that impact tracking error include: sampling, transaction costs, and sales and redemptions of Portfolio shares.
Stacey Lituchy
Tresa Lau
Tomas Cambara
Portfolio Managers
MetLife Investment Management, LLC
* This commentary may include statements that constitute “forward-looking statements” under the U.S. securities laws. Forward-looking statements include, among other things, projections, estimates, and information about possible or future results related to the Portfolio, market or regulatory developments. The views expressed above are not guarantees of future performance or economic results and involve certain risks, uncertainties and assumptions that could cause actual outcomes and results to differ materially from the views expressed herein. The views expressed above are subject to change at any time based upon economic, market, or other conditions and the subadvisory firm undertakes no obligation to update the views expressed herein. Any discussions of specific securities should not be considered a recommendation to buy or sell those securities. The views expressed above (including any forward-looking statement) may not be relied upon as investment advice or as an indication of the Portfolio’s trading intent. Information about the Portfolio’s holdings, asset allocation or country diversification is historical and is not an indication of future Portfolio composition, which may vary. Direct investment in any index is not possible. The performance of any index mentioned in this commentary has not been adjusted for ongoing management, distribution and operating expenses, and sales charges applicable to mutual fund investments. In addition, the returns do not reflect additional fees charged by separate accounts or variable insurance contracts that an investor in the Portfolio may pay. If these additional fees were reflected, performance would have been lower.
MSF-1
Metropolitan Series Fund
Barclays Aggregate Bond Index Portfolio
A $10,000 INVESTMENT COMPARED TO THE BARCLAYS U.S. AGGREGATE BOND INDEX

AVERAGE ANNUAL RETURNS (%) (FOR THE YEAR ENDED DECEMBER 31, 2013)
| | | | | | | | | | | | | | | | |
| | | 1 Year | | | 5 Year | | | 10 Year | | | Since Inception2 | |
| Barclays Aggregate Bond Index Portfolio | | | | | | | | | | | | | | | | |
Class A | | | -2.33 | | | | 4.00 | | | | 4.31 | | | | — | |
Class B | | | -2.53 | | | | 3.75 | | | | 4.05 | | | | — | |
Class E | | | -2.41 | | | | 3.86 | | | | 4.15 | | | | — | |
Class G | | | -2.57 | | | | — | | | | — | | | | 3.85 | |
| Barclays U.S. Aggregate Bond Index | | | -2.02 | | | | 4.44 | | | | 4.55 | | | | — | |
1 Barclays U.S. Aggregate Bond Index is a broad based benchmark that measures the investment grade, U.S. dollar-denominated, fixed-rate taxable bond market, including Treasuries, government-related and corporate securities, mortgage-backed securities, asset-backed securities, and commercial mortgage-backed securities.
2 Inception dates of the Class A, Class B, Class E, and Class G shares are 11/9/98,1/2/01, 5/1/01, and 4/28/09, respectively.
Portfolio performance is calculated including reinvestment of all income and capital gain distributions. Performance numbers are net of all Portfolio expenses but do not include any insurance, sales, separate account or administrative charges of variable annuity or life insurance contracts or any additional expenses that participants may bear relating to the operations of their plans. If these charges were included, the returns would be lower. The performance of any index referenced above has not been adjusted for ongoing management, distribution and operating expenses, and sales charges applicable to mutual fund investments. Direct investment in any index is not possible. The performance of Class A shares, as set forth in the line graph above, will differ from that of other classes because of the difference in expenses paid by policyholders investing in the different share classes.
This information represents past performance and is not indicative of future results. Investment return and principal value may fluctuate so that shares, upon redemption, may be worth more or less than the original cost.
PORTFOLIO COMPOSITION AS OF DECEMBER 31, 2013
Top Sectors
| | | | |
| | | % of
Market Value of
Total Long-Term
Investments | |
| U.S. Treasury & Government Agencies | | | 71.1 | |
| Corporate Bonds & Notes | | | 24.5 | |
| Foreign Government | | | 1.7 | |
| Mortgage-Backed Securities | | | 1.7 | |
| Municipals | | | 0.7 | |
| Asset-Backed Securities | | | 0.3 | |
MSF-2
Metropolitan Series Fund
Barclays Aggregate Bond Index Portfolio
Understanding Your Portfolio’s Expenses
Shareholder Expense Example
As a shareholder of the Portfolio, you incur ongoing costs, including management fees; distribution and service (12b-1) fees; and other Portfolio expenses. This example is intended to help you understand your ongoing costs (in dollars) (referred to as “expenses”) of investing in the Portfolio and compare these costs with the ongoing costs of investing in other mutual funds. The example is based on an investment of $1,000 invested at the beginning of the period and held for the entire period, July 1, 2013 through December 31, 2013.
Actual Expenses
The first line for each share class of the Portfolio in the table below provides information about actual account values and actual expenses. You may use the information in this line, together with the amount you invested in the particular share class of the Portfolio, to estimate the expenses that you paid over the period. Simply divide your account value by $1,000 (for example, an $8,600 account value divided by $1,000 = 8.6), then multiply the result by the number in the first line under the heading entitled “Expenses Paid During Period” to estimate the expenses you paid on your account during this period.
Hypothetical Example for Comparison Purposes
The second line for each share class of the Portfolio in the table below provides information about hypothetical account values and hypothetical expenses based on the Portfolio’s actual expense ratio and an assumed rate of return of 5% per year before expenses, which is not the Portfolio’s actual return. The hypothetical account values and expenses may not be used to estimate the actual ending account balance or expenses you paid for the period. You may use this information to compare the ongoing costs of investing in the Portfolio and other funds. To do so, compare this 5% hypothetical example with the 5% hypothetical examples that appear in the shareholder reports of the other funds.
Please note that the expenses shown in the table are meant to highlight your ongoing costs only and do not reflect any fees or charges of your variable insurance product or any additional expenses that participants in certain eligible qualified plans may bear relating to the operations of their plan. Therefore, the second line for each share class in the table is useful in comparing ongoing costs only, and will not help you determine the relative total costs of owning different funds. In addition, if these other costs were included, your costs would have been higher.
| | | | | | | | | | | | | | | | | | |
Barclays Aggregate Bond Index Portfolio | | | | Annualized
Expense
Ratio | | | Beginning
Account Value
July 1,
2013 | | | Ending
Account Value
December 31,
2013 | | | Expenses Paid
During Period**
July 1, 2013
to
December 31,
2013 | |
Class A(a) | | Actual | | | 0.27 | % | | $ | 1,000.00 | | | $ | 1,003.70 | | | $ | 1.36 | |
| | Hypothetical* | | | 0.27 | % | | $ | 1,000.00 | | | $ | 1,023.84 | | | $ | 1.38 | |
| | | | | |
Class B(a) | | Actual | | | 0.52 | % | | $ | 1,000.00 | | | $ | 1,001.90 | | | $ | 2.62 | |
| | Hypothetical* | | | 0.52 | % | | $ | 1,000.00 | | | $ | 1,022.58 | | | $ | 2.65 | |
| | | | | |
Class E(a) | | Actual | | | 0.42 | % | | $ | 1,000.00 | | | $ | 1,002.80 | | | $ | 2.12 | |
| | Hypothetical* | | | 0.42 | % | | $ | 1,000.00 | | | $ | 1,023.09 | | | $ | 2.14 | |
| | | | | |
Class G(a) | | Actual | | | 0.57 | % | | $ | 1,000.00 | | | $ | 1,001.90 | | | $ | 2.88 | |
| | Hypothetical* | | | 0.57 | % | | $ | 1,000.00 | | | $ | 1,022.33 | | | $ | 2.91 | |
* Hypothetical assumes a rate of return of 5% per year before expenses.
** Expenses paid are equal to the Portfolio’s annualized expense ratio for the most recent six month period, as shown above, multiplied by the average account value over the period, multiplied by the number of days (184 days) in the most recent fiscal half-year, divided by 365 (to reflect the one-half year period).
(a) The annualized expense ratio shown reflects the impact of the management fee waiver as described in Note 5 of the Notes to Financial Statements.
MSF-3
Metropolitan Series Fund
Barclays Aggregate Bond Index Portfolio
Schedule of Investments as of December 31, 2013
U.S. Treasury & Government Agencies—70.1% of Net Assets
| | | | | | | | |
| Security Description | | Principal
Amount* | | | Value | |
|
Agency Sponsored Mortgage-Backed—29.4% | |
Fannie Mae 15 Yr. Pool | | | | | | | | |
2.500%, 12/01/27 | | | 5,978,257 | | | $ | 5,924,722 | |
2.500%, 02/01/28 | | | 4,478,987 | | | | 4,437,960 | |
2.500%, 07/01/28 | | | 7,698,203 | | | | 7,629,164 | |
2.500%, 10/01/28 | | | 4,951,401 | | | | 4,906,995 | |
3.000%, 01/01/27 | | | 2,623,426 | | | | 2,679,557 | |
3.000%, 02/01/27 | | | 4,326,685 | | | | 4,419,316 | |
3.000%, 03/01/27 | | | 2,156,571 | | | | 2,202,741 | |
3.500%, 02/01/26 | | | 4,182,871 | | | | 4,377,212 | |
3.500%, 03/01/26 | | | 1,649,097 | | | | 1,725,716 | |
4.000%, 04/01/19 | | | 215,638 | | | | 228,393 | |
4.000%, 05/01/19 | | | 438,668 | | | | 464,614 | |
4.000%, 01/01/20 | | | 471,656 | | | | 499,660 | |
4.000%, 06/01/24 | | | 1,015,220 | | | | 1,075,795 | |
4.000%, 08/01/25 | | | 1,526,084 | | | | 1,617,337 | |
4.500%, 07/01/18 | | | 693,440 | | | | 737,864 | |
4.500%, 05/01/19 | | | 241,087 | | | | 256,577 | |
4.500%, 08/01/24 | | | 1,097,089 | | | | 1,168,042 | |
4.500%, 06/01/25 | | | 2,065,763 | | | | 2,199,620 | |
5.000%, 06/01/18 | | | 189,380 | | | | 201,729 | |
5.000%, 01/01/19 | | | 461,195 | | | | 491,389 | |
5.000%, 02/01/20 | | | 430,228 | | | | 458,381 | |
5.000%, 01/01/22 | | | 511,452 | | | | 544,991 | |
5.000%, 02/01/24 | | | 1,513,358 | | | | 1,612,226 | |
5.500%, 11/01/17 | | | 97,236 | | | | 104,467 | |
5.500%, 02/01/18 | | | 65,301 | | | | 70,745 | |
5.500%, 04/01/18 | | | 536,117 | | | | 580,809 | |
6.000%, 03/01/14 | | | 433 | | | | 433 | |
6.000%, 06/01/14 | | | 248 | | | | 249 | |
6.000%, 07/01/14 | | | 1,146 | | | | 1,150 | |
6.000%, 09/01/17 | | | 185,250 | | | | 199,936 | |
6.500%, 06/01/14 | | | 267 | | | | 268 | |
6.500%, 04/01/17 | | | 537,252 | | | | 565,474 | |
7.000%, 02/01/14 | | | 11 | | | | 11 | |
7.500%, 08/01/15 | | | 1,918 | | | | 1,967 | |
Fannie Mae 20 Yr. Pool | | | | | | | | |
3.000%, 02/01/33 | | | 2,712,235 | | | | 2,672,213 | |
3.500%, 04/01/32 | | | 2,910,588 | | | | 2,979,183 | |
4.000%, 02/01/31 | | | 1,561,373 | | | | 1,636,740 | |
4.500%, 08/01/30 | | | 1,066,464 | | | | 1,139,255 | |
5.000%, 02/01/24 | | | 353,802 | | | | 385,600 | |
5.000%, 09/01/25 | | | 350,933 | | | | 382,470 | |
5.500%, 07/01/23 | | | 255,007 | | | | 280,452 | |
5.500%, 01/01/24 | | | 164,884 | | | | 181,337 | |
5.500%, 07/01/24 | | | 464,754 | | | | 512,247 | |
7.000%, 10/01/21 | | | 23,206 | | | | 25,878 | |
Fannie Mae 30 Yr. Pool | | | | | | | | |
2.750%, 11/01/43 | | | 2,889,448 | | | | 2,976,276 | |
3.000%, 08/01/42 | | | 1,936,279 | | | | 1,843,840 | |
3.000%, 09/01/42 | | | 3,052,014 | | | | 2,906,309 | |
3.000%, 11/01/42 | | | 3,632,425 | | | | 3,459,010 | |
3.000%, 12/01/42 | | | 6,454,158 | | | | 6,146,032 | |
3.000%, 01/01/43 | | | 1,740,149 | | | | 1,657,073 | |
3.000%, 02/01/43 | | | 5,624,429 | | | | 5,346,669 | |
3.000%, 03/01/43 | | | 7,426,180 | | | | 7,071,303 | |
3.000%, 07/01/43 | | | 8,030,784 | | | | 7,647,014 | |
|
Agency Sponsored Mortgage-Backed—(Continued) | |
Fannie Mae 30 Yr. Pool | | | | | | | | |
3.000%, 09/01/43 | | | 4,131,751 | | | | 3,934,306 | |
3.500%, 12/01/40 | | | 3,101,193 | | | | 3,088,733 | |
3.500%, 03/01/42 | | | 1,921,112 | | | | 1,913,378 | |
3.500%, 04/01/42 | | | 4,199,816 | | | | 4,176,387 | |
3.500%, 05/01/42 | | | 5,158,640 | | | | 5,137,872 | |
3.500%, 06/01/42 | | | 3,802,271 | | | | 3,786,963 | |
3.500%, 08/01/42 | | | 2,595,285 | | | | 2,584,837 | |
3.500%, 09/01/42 | | | 6,402,684 | | | | 6,376,908 | |
3.500%, 10/01/42 | | | 3,479,345 | | | | 3,465,337 | |
3.500%, 01/01/43 | | | 3,042,336 | | | | 3,030,088 | |
3.500%, 02/01/43 | | | 4,837,834 | | | | 4,818,357 | |
3.500%, 06/01/43 | | | 2,870,412 | | | | 2,858,832 | |
4.000%, 08/01/39 | | | 2,389,899 | | | | 2,466,392 | |
4.000%, 09/01/39 | | | 1,792,687 | | | | 1,850,065 | |
4.000%, 12/01/39 | | | 2,327,525 | | | | 2,402,021 | |
4.000%, 06/01/40 | | | 2,095,591 | | | | 2,162,763 | |
4.000%, 09/01/40 | | | 1,498,961 | | | | 1,547,008 | |
4.000%, 12/01/40 | | | 9,310,359 | | | | 9,608,790 | |
4.000%, 01/01/41 | | | 5,788,942 | | | | 5,974,564 | |
4.000%, 12/01/41 | | | 2,545,278 | | | | 2,626,920 | |
4.000%, 02/01/42 | | | 2,631,189 | | | | 2,730,503 | |
4.000%, 09/01/43 | | | 3,767,911 | | | | 3,889,324 | |
4.500%, 08/01/33 | | | 452,091 | | | | 479,921 | |
4.500%, 10/01/33 | | | 512,799 | | | | 544,366 | |
4.500%, 04/01/34 | | | 291,194 | | | | 309,157 | |
4.500%, 01/01/39 | | | 431,476 | | | | 457,622 | |
4.500%, 07/01/39 | | | 2,936,606 | | | | 3,116,134 | |
4.500%, 09/01/39 | | | 5,002,949 | | | | 5,308,803 | |
4.500%, 10/01/39 | | | 1,983,121 | | | | 2,104,359 | |
4.500%, 05/01/40 | | | 2,466,284 | | | | 2,617,341 | |
4.500%, 11/01/40 | | | 2,480,736 | | | | 2,632,679 | |
4.500%, 12/01/40 | | | 3,438,417 | | | | 3,649,017 | |
4.500%, 04/01/41 | | | 4,490,657 | | | | 4,766,165 | |
4.500%, 05/01/41 | | | 2,260,542 | | | | 2,399,229 | |
5.000%, 07/01/33 | | | 352,138 | | | | 384,718 | |
5.000%, 08/01/33 | | | 880,840 | | | | 962,335 | |
5.000%, 09/01/33 | | | 471,339 | | | | 514,947 | |
5.000%, 10/01/33 | | | 3,647,016 | | | | 3,984,436 | |
5.000%, 03/01/34 | | | 532,178 | | | | 581,415 | |
5.000%, 04/01/34 | | | 1,282,578 | | | | 1,399,430 | |
5.000%, 05/01/34 | | | 209,927 | | | | 228,822 | |
5.000%, 09/01/34 | | | 524,853 | | | | 572,094 | |
5.000%, 02/01/35 | | | 465,286 | | | | 507,165 | |
5.000%, 04/01/35 | | | 327,539 | | | | 356,144 | |
5.000%, 05/01/35 | | | 97,637 | | | | 106,165 | |
5.000%, 11/01/35 | | | 418,392 | | | | 454,932 | |
5.000%, 03/01/36 | | | 1,379,193 | | | | 1,499,645 | |
5.000%, 07/01/37 | | | 1,256,528 | | | | 1,365,830 | |
5.000%, 01/01/39 | | | 1,194,638 | | | | 1,298,308 | |
5.000%, 04/01/40 | | | 3,361,991 | | | | 3,670,831 | |
5.000%, 07/01/41 | | | 2,591,797 | | | | 2,833,568 | |
5.500%, 07/01/25 | | | 381,844 | | | | 421,844 | |
5.500%, 10/01/32 | | | 62,393 | | | | 68,995 | |
5.500%, 02/01/33 | | | 290,489 | | | | 320,919 | |
5.500%, 03/01/33 | | | 711,267 | | | | 785,777 | |
See accompanying notes to financial statements.
MSF-4
Metropolitan Series Fund
Barclays Aggregate Bond Index Portfolio
Schedule of Investments as of December 31, 2013
U.S. Treasury & Government Agencies—(Continued)
| | | | | | | | |
| Security Description | | Principal
Amount* | | | Value | |
|
Agency Sponsored Mortgage-Backed—(Continued) | |
Fannie Mae 30 Yr. Pool | | | | | | | | |
5.500%, 05/01/33 | | | 2,203,793 | | | $ | 2,434,655 | |
5.500%, 08/01/33 | | | 1,240,970 | | | | 1,370,970 | |
5.500%, 10/01/33 | | | 170,910 | | | | 188,814 | |
5.500%, 12/01/33 | | | 1,578,885 | | | | 1,744,283 | |
5.500%, 02/01/34 | | | 604,474 | | | | 667,694 | |
5.500%, 03/01/34 | | | 274,265 | | | | 302,950 | |
5.500%, 04/01/34 | | | 128,792 | | | | 142,262 | |
5.500%, 06/01/34 | | | 467,314 | | | | 516,189 | |
5.500%, 09/01/34 | | | 462,484 | | | | 510,853 | |
5.500%, 12/01/34 | | | 1,153,590 | | | | 1,274,240 | |
5.500%, 01/01/35 | | | 381,614 | | | | 421,526 | |
5.500%, 02/01/35 | | | 837,393 | | | | 924,973 | |
5.500%, 04/01/35 | | | 488,811 | | | | 537,387 | |
5.500%, 06/01/35 | | | 1,787,930 | | | | 1,965,608 | |
5.500%, 01/01/37 | | | 704,545 | | | | 774,098 | |
5.500%, 05/01/37 | | | 298,957 | | | | 328,471 | |
5.500%, 05/01/38 | | | 387,703 | | | | 426,024 | |
5.500%, 06/01/38 | | | 402,637 | | | | 442,434 | |
5.500%, 07/01/38 | | | 379,384 | | | | 416,883 | |
6.000%, 08/01/28 | | | 3,770 | | | | 4,233 | |
6.000%, 11/01/28 | | | 1,228 | | | | 1,379 | |
6.000%, 12/01/28 | | | 1,783 | | | | 2,002 | |
6.000%, 06/01/31 | | | 76,815 | | | | 86,339 | |
6.000%, 09/01/32 | | | 198,379 | | | | 222,914 | |
6.000%, 01/01/33 | | | 54,100 | | | | 60,791 | |
6.000%, 02/01/33 | | | 112,006 | | | | 125,849 | |
6.000%, 03/01/33 | | | 194,645 | | | | 218,702 | |
6.000%, 04/01/33 | | | 453,504 | | | | 509,555 | |
6.000%, 05/01/33 | | | 416,470 | | | | 467,943 | |
6.000%, 05/01/34 | | | 557,673 | | | | 626,119 | |
6.000%, 09/01/34 | | | 472,407 | | | | 530,388 | |
6.000%, 11/01/34 | | | 738,855 | | | | 829,539 | |
6.000%, 01/01/35 | | | 366,671 | | | | 407,518 | |
6.000%, 07/01/36 | | | 156,883 | | | | 173,977 | |
6.000%, 09/01/36 | | | 402,904 | | | | 446,802 | |
6.000%, 07/01/37 | | | 535,951 | | | | 594,229 | |
6.000%, 08/01/37 | | | 593,159 | | | | 657,659 | |
6.000%, 09/01/37 | | | 1,513,176 | | | | 1,677,716 | |
6.000%, 10/01/37 | | | 559,948 | | | | 620,836 | |
6.000%, 05/01/38 | | | 1,805,902 | | | | 2,002,273 | |
6.000%, 12/01/38 | | | 493,220 | | | | 546,807 | |
6.500%, 05/01/28 | | | 92,960 | | | | 105,577 | |
6.500%, 12/01/28 | | | 232,990 | | | | 264,612 | |
6.500%, 03/01/29 | | | 6,708 | | | | 7,617 | |
6.500%, 04/01/29 | | | 43,597 | | | | 49,507 | |
6.500%, 05/01/29 | | | 9,661 | | | | 10,970 | |
6.500%, 08/01/29 | | | 1,803 | | | | 2,048 | |
6.500%, 05/01/30 | | | 34,170 | | | | 38,803 | |
6.500%, 09/01/31 | | | 6,688 | | | | 7,570 | |
6.500%, 02/01/32 | | | 8,069 | | | | 8,413 | |
6.500%, 06/01/32 | | | 57,760 | | | | 65,365 | |
6.500%, 09/01/33 | | | 23,389 | | | | 26,461 | |
6.500%, 10/01/33 | | | 138,811 | | | | 157,044 | |
6.500%, 10/01/34 | | | 504,444 | | | | 570,701 | |
6.500%, 10/01/37 | | | 293,342 | | | | 325,859 | |
|
Agency Sponsored Mortgage-Backed—(Continued) | |
Fannie Mae 30 Yr. Pool | | | | | | | | |
7.000%, 06/01/26 | | | 938 | | | | 1,037 | |
7.000%, 06/01/28 | | | 31,130 | | | | 35,866 | |
7.000%, 10/01/29 | | | 17,983 | | | | 20,721 | |
7.000%, 12/01/29 | | | 4,069 | | | | 4,689 | |
7.000%, 04/01/32 | | | 18,002 | | | | 20,687 | |
7.000%, 06/01/32 | | | 78,510 | | | | 90,218 | |
7.000%, 10/01/37 | | | 373,547 | | | | 421,093 | |
7.500%, 09/01/25 | | | 7,550 | | | | 8,790 | |
7.500%, 06/01/26 | | | 8,442 | | | | 9,292 | |
7.500%, 09/01/27 | | | 1,091 | | | | 1,131 | |
7.500%, 07/01/29 | | | 19,791 | | | | 22,732 | |
7.500%, 10/01/29 | | | 8,855 | | | | 9,860 | |
8.000%, 10/01/26 | | | 476 | | | | 508 | |
8.000%, 11/01/29 | | | 311 | | | | 377 | |
8.000%, 05/01/30 | | | 18,861 | | | | 19,913 | |
8.000%, 11/01/30 | | | 4,941 | | | | 5,744 | |
8.000%, 01/01/31 | | | 7,463 | | | | 8,602 | |
8.000%, 02/01/31 | | | 10,458 | | | | 12,156 | |
Fannie Mae ARM Pool | | | | | | | | |
2.780%, 02/01/42 (a) | | | 3,356,275 | | | | 3,456,752 | |
3.129%, 10/01/41 (a) | | | 1,312,921 | | | | 1,378,432 | |
3.490%, 05/01/41 (a) | | | 2,496,427 | | | | 2,639,263 | |
Freddie Mac 15 Yr. Gold Pool | | | | | | | | |
2.500%, 12/01/27 | | | 2,648,546 | | | | 2,626,892 | |
2.500%, 02/01/28 | | | 4,573,125 | | | | 4,538,709 | |
2.500%, 04/01/28 | | | 3,500,937 | | | | 3,472,266 | |
3.000%, 03/01/27 | | | 2,491,130 | | | | 2,538,614 | |
3.000%, 05/01/27 | | | 3,140,983 | | | | 3,200,951 | |
3.000%, 11/01/28 | | | 3,840,927 | | | | 3,914,484 | |
3.500%, 12/01/25 | | | 3,061,128 | | | | 3,193,320 | |
3.500%, 05/01/26 | | | 1,234,217 | | | | 1,287,591 | |
4.000%, 06/01/19 | | | 409,103 | | | | 431,596 | |
4.000%, 05/01/25 | | | 1,909,435 | | | | 2,016,874 | |
4.000%, 08/01/25 | | | 1,041,941 | | | | 1,100,569 | |
4.000%, 10/01/25 | | | 891,330 | | | | 941,483 | |
4.500%, 09/01/18 | | | 402,691 | | | | 427,199 | |
4.500%, 10/01/18 | | | 842,098 | | | | 893,349 | |
4.500%, 04/01/19 | | | 613,575 | | | | 651,031 | |
4.500%, 06/01/19 | | | 338,919 | | | | 359,607 | |
4.500%, 08/01/19 | | | 137,142 | | | | 145,514 | |
5.000%, 05/01/18 | | | 979,401 | | | | 1,041,985 | |
5.000%, 12/01/18 | | | 166,745 | | | | 177,399 | |
5.000%, 06/01/19 | | | 480,754 | | | | 512,819 | |
5.500%, 11/01/17 | | | 87,710 | | | | 94,431 | |
5.500%, 01/01/24 | | | 966,511 | | | | 1,056,954 | |
6.000%, 04/01/16 | | | 5,033 | | | | 5,380 | |
6.000%, 05/01/17 | | | 97,116 | | | | 104,803 | |
7.000%, 12/01/15 | | | 1,459 | | | | 1,463 | |
7.500%, 03/01/16 | | | 7,487 | | | | 7,806 | |
Freddie Mac 20 Yr. Gold Pool | | | | | | | | |
3.000%, 04/01/33 | | | 4,161,468 | | | | 4,110,455 | |
3.500%, 04/01/32 | | | 4,218,508 | | | | 4,304,893 | |
4.000%, 01/01/31 | | | 1,640,189 | | | | 1,721,573 | |
4.000%, 08/01/31 | | | 1,703,416 | | | | 1,787,937 | |
4.500%, 05/01/29 | | | 551,354 | | | | 587,937 | |
5.000%, 03/01/27 | | | 225,867 | | | | 243,933 | |
See accompanying notes to financial statements.
MSF-5
Metropolitan Series Fund
Barclays Aggregate Bond Index Portfolio
Schedule of Investments as of December 31, 2013
U.S. Treasury & Government Agencies—(Continued)
| | | | | | | | |
| Security Description | | Principal
Amount* | | | Value | |
|
Agency Sponsored Mortgage-Backed—(Continued) | |
Freddie Mac 30 Yr. Gold Pool | | | | | | | | |
2.500%, 07/01/43 | | | 3,385,227 | | | $ | 3,059,924 | |
3.000%, 10/01/42 | | | 3,530,461 | | | | 3,352,013 | |
3.000%, 01/01/43 | | | 3,224,327 | | | | 3,061,354 | |
3.000%, 03/01/43 | | | 7,349,486 | | | | 6,975,355 | |
3.000%, 04/01/43 | | | 6,076,082 | | | | 5,768,750 | |
3.000%, 06/01/43 | | | 2,079,939 | | | | 1,974,734 | |
3.500%, 01/01/42 | | | 2,241,828 | | | | 2,226,912 | |
3.500%, 03/01/42 | | | 1,967,792 | | | | 1,954,699 | |
3.500%, 08/01/42 | | | 6,567,076 | | | | 6,526,348 | |
3.500%, 02/01/43 | | | 2,706,877 | | | | 2,688,867 | |
3.500%, 05/01/43 | | | 4,865,727 | | | | 4,835,497 | |
3.500%, 06/01/43 | | | 2,828,842 | | | | 2,811,267 | |
4.000%, 06/01/39 | | | 2,016,936 | | | | 2,075,532 | |
4.000%, 12/01/39 | | | 2,575,080 | | | | 2,649,891 | |
4.000%, 11/01/40 | | | 2,321,099 | | | | 2,388,698 | |
4.000%, 04/01/41 | | | 2,171,830 | | | | 2,235,114 | |
4.000%, 09/01/41 | | | 2,345,221 | | | | 2,413,557 | |
4.000%, 11/01/41 | | | 2,378,961 | | | | 2,448,279 | |
4.000%, 10/01/43 | | | 4,790,497 | | | | 4,932,194 | |
4.500%, 10/01/35 | | | 1,055,937 | | | | 1,118,376 | |
4.500%, 06/01/38 | | | 1,582,667 | | | | 1,676,251 | |
4.500%, 02/01/39 | | | 1,018,382 | | | | 1,078,943 | |
4.500%, 03/01/39 | | | 1,127,320 | | | | 1,194,359 | |
4.500%, 04/01/39 | | | 1,270,788 | | | | 1,346,359 | |
4.500%, 09/01/39 | | | 1,409,153 | | | | 1,492,953 | |
4.500%, 11/01/39 | | | 1,452,706 | | | | 1,539,095 | |
4.500%, 01/01/40 | | | 932,355 | | | | 988,469 | |
4.500%, 05/01/40 | | | 1,676,126 | | | | 1,777,003 | |
4.500%, 11/01/40 | | | 1,839,806 | | | | 1,950,535 | |
4.500%, 02/01/41 | | | 1,324,641 | | | | 1,404,475 | |
4.500%, 05/01/41 | | | 1,391,534 | | | | 1,475,400 | |
4.500%, 06/01/41 | | | 1,062,579 | | | | 1,126,619 | |
4.500%, 12/01/43 | | | 2,778,345 | | | | 2,945,352 | |
5.000%, 10/01/33 | | | 932,689 | | | | 1,012,190 | |
5.000%, 03/01/34 | | | 262,309 | | | | 284,344 | |
5.000%, 08/01/35 | | | 1,316,934 | | | | 1,423,913 | |
5.000%, 09/01/35 | | | 573,744 | | | | 620,351 | |
5.000%, 10/01/35 | | | 488,906 | | | | 528,621 | |
5.000%, 01/01/36 | | | 1,110,472 | | | | 1,200,679 | |
5.000%, 04/01/38 | | | 707,405 | | | | 764,576 | |
5.000%, 11/01/39 | | | 2,876,032 | | | | 3,111,590 | |
5.000%, 05/01/40 | | | 3,762,400 | | | | 4,084,731 | |
5.500%, 06/01/34 | | | 1,002,838 | | | | 1,103,963 | |
5.500%, 10/01/35 | | | 587,094 | | | | 642,905 | |
5.500%, 12/01/35 | | | 1,307,998 | | | | 1,432,339 | |
5.500%, 01/01/36 | | | 1,072,601 | | | | 1,172,915 | |
5.500%, 12/01/37 | | | 900,528 | | | | 983,723 | |
5.500%, 04/01/38 | | | 4,620,072 | | | | 5,047,922 | |
5.500%, 07/01/38 | | | 594,869 | | | | 649,958 | |
5.500%, 08/01/38 | | | 1,067,277 | | | | 1,166,114 | |
6.000%, 11/01/28 | | | 17,209 | | | | 19,385 | |
6.000%, 12/01/28 | | | 12,709 | | | | 14,315 | |
6.000%, 02/01/29 | | | 26,383 | | | | 29,727 | |
6.000%, 04/01/29 | | | 9,219 | | | | 10,387 | |
6.000%, 05/01/29 | | | 2,179 | | | | 2,455 | |
|
Agency Sponsored Mortgage-Backed—(Continued) | |
Freddie Mac 30 Yr. Gold Pool | | | | | | | | |
6.000%, 06/01/31 | | | 3,613 | | | | 4,054 | |
6.000%, 07/01/31 | | | 1,484 | | | | 1,665 | |
6.000%, 09/01/31 | | | 72,717 | | | | 81,591 | |
6.000%, 04/01/32 | | | 224,322 | | | | 251,654 | |
6.000%, 11/01/32 | | | 49,670 | | | | 55,722 | |
6.000%, 06/01/34 | | | 304,383 | | | | 341,294 | |
6.000%, 11/01/35 | | | 153,610 | | | | 172,092 | |
6.000%, 02/01/36 | | | 332,344 | | | | 367,326 | |
6.000%, 08/01/36 | | | 334,419 | | | | 369,620 | |
6.000%, 10/01/36 | | | 446,741 | | | | 493,764 | |
6.000%, 11/01/36 | | | 260,241 | | | | 287,634 | |
6.000%, 01/01/37 | | | 315,912 | | | | 349,164 | |
6.000%, 02/01/38 | | | 434,117 | | | | 479,871 | |
6.000%, 11/01/39 | | | 3,953,028 | | | | 4,368,773 | |
6.000%, 04/01/40 | | | 981,857 | | | | 1,085,340 | |
6.500%, 02/01/30 | | | 10,044 | | | | 11,408 | |
6.500%, 08/01/31 | | | 17,341 | | | | 19,607 | |
6.500%, 10/01/31 | | | 7,889 | | | | 8,791 | |
6.500%, 11/01/31 | | | 37,480 | | | | 42,379 | |
6.500%, 03/01/32 | | | 562,236 | | | | 635,637 | |
6.500%, 04/01/32 | | | 507,531 | | | | 573,791 | |
6.500%, 09/01/36 | | | 909,722 | | | | 1,014,649 | |
6.500%, 11/01/37 | | | 663,342 | | | | 739,665 | |
7.000%, 12/01/27 | | | 2,351 | | | | 2,661 | |
7.000%, 11/01/28 | | | 6,450 | | | | 7,316 | |
7.000%, 04/01/29 | | | 6,973 | | | | 7,889 | |
7.000%, 05/01/29 | | | 1,617 | | | | 1,829 | |
7.000%, 06/01/29 | | | 6,603 | | | | 7,470 | |
7.000%, 07/01/29 | | | 3,170 | | | | 3,587 | |
7.000%, 01/01/31 | | | 110,661 | | | | 125,233 | |
7.500%, 08/01/24 | | | 26,684 | | | | 27,823 | |
7.500%, 10/01/27 | | | 15,191 | | | | 17,331 | |
7.500%, 10/01/29 | | | 24,363 | | | | 28,937 | |
7.500%, 05/01/30 | | | 15,106 | | | | 17,204 | |
8.000%, 02/01/27 | | | 5,795 | | | | 6,911 | |
8.000%, 10/01/28 | | | 10,617 | | | | 12,458 | |
Ginnie Mae I 15 Yr. Pool | | | | | | | | |
3.000%, 08/15/28 | | | 4,685,812 | | | | 4,809,677 | |
5.000%, 10/15/20 | | | 527,707 | | | | 564,894 | |
5.000%, 01/15/21 | | | 340,129 | | | | 364,671 | |
Ginnie Mae I 30 Yr. Pool | | | | | | | | |
3.000%, 11/15/42 | | | 4,421,086 | | | | 4,280,476 | |
3.000%, 12/15/42 | | | 3,126,678 | | | | 3,027,236 | |
3.000%, 02/15/43 | | | 2,718,247 | | | | 2,630,290 | |
3.000%, 03/15/43 | | | 3,657,508 | | | | 3,540,372 | |
3.000%, 05/15/43 | | | 4,730,578 | | | | 4,579,075 | |
3.000%, 07/15/43 | | | 3,052,097 | | | | 2,954,350 | |
3.500%, 01/15/42 | | | 4,575,167 | | | | 4,623,148 | |
3.500%, 02/15/42 | | | 2,277,557 | | | | 2,301,442 | |
3.500%, 03/15/42 | | | 3,358,872 | | | | 3,391,119 | |
3.500%, 05/15/42 | | | 2,920,036 | | | | 2,950,658 | |
3.500%, 09/15/42 | | | 2,650,640 | | | | 2,678,437 | |
3.500%, 05/15/43 | | | 2,929,268 | | | | 2,960,100 | |
4.000%, 07/15/39 | | | 4,037,283 | | | | 4,208,475 | |
4.000%, 07/15/40 | | | 2,631,644 | | | | 2,740,998 | |
See accompanying notes to financial statements.
MSF-6
Metropolitan Series Fund
Barclays Aggregate Bond Index Portfolio
Schedule of Investments as of December 31, 2013
U.S. Treasury & Government Agencies—(Continued)
| | | | | | | | |
| Security Description | | Principal
Amount* | | | Value | |
|
Agency Sponsored Mortgage-Backed—(Continued) | |
Ginnie Mae I 30 Yr. Pool | | | | | | | | |
4.000%, 03/15/41 | | | 2,056,499 | | | $ | 2,141,710 | |
4.000%, 10/15/41 | | | 4,157,344 | | | | 4,329,603 | |
4.500%, 01/15/39 | | | 750,507 | | | | 802,248 | |
4.500%, 04/15/39 | | | 1,816,931 | | | | 1,942,193 | |
4.500%, 05/15/39 | | | 4,377,190 | | | | 4,678,959 | |
4.500%, 08/15/39 | | | 1,860,334 | | | | 1,988,588 | |
4.500%, 01/15/40 | | | 2,117,826 | | | | 2,266,080 | |
4.500%, 04/15/40 | | | 2,266,378 | | | | 2,425,031 | |
4.500%, 02/15/41 | | | 1,532,170 | | | | 1,637,256 | |
4.500%, 04/15/41 | | | 1,518,469 | | | | 1,622,616 | |
5.000%, 12/15/35 | | | 673,849 | | | | 738,440 | |
5.000%, 12/15/36 | | | 568,627 | | | | 620,826 | |
5.000%, 01/15/39 | | | 2,436,602 | | | | 2,659,149 | |
5.000%, 02/15/39 | | | 578,635 | | | | 633,389 | |
5.000%, 08/15/39 | | | 3,710,729 | | | | 4,061,862 | |
5.000%, 09/15/39 | | | 783,917 | | | | 858,097 | |
5.000%, 12/15/39 | | | 1,350,070 | | | | 1,477,823 | |
5.000%, 05/15/40 | | | 2,740,861 | | | | 3,011,754 | |
5.500%, 03/15/36 | | | 766,829 | | | | 848,055 | |
5.500%, 01/15/37 | | | 1,230,855 | | | | 1,360,646 | |
5.500%, 11/15/37 | | | 869,729 | | | | 961,440 | |
5.500%, 09/15/38 | | | 646,334 | | | | 714,209 | |
5.500%, 08/15/39 | | | 2,344,439 | | | | 2,599,331 | |
6.000%, 01/15/29 | | | 8,617 | | | | 9,859 | |
6.000%, 01/15/33 | | | 359,790 | | | | 409,170 | |
6.000%, 03/15/35 | | | 418,027 | | | | 469,810 | |
6.000%, 12/15/35 | | | 266,519 | | | | 299,534 | |
6.000%, 06/15/36 | | | 399,105 | | | | 448,075 | |
6.000%, 09/15/36 | | | 527,916 | | | | 592,690 | |
6.000%, 07/15/38 | | | 2,014,862 | | | | 2,261,767 | |
6.500%, 05/15/23 | | | 3,316 | | | | 3,849 | |
6.500%, 02/15/27 | | | 48,059 | | | | 54,721 | |
6.500%, 07/15/28 | | | 15,200 | | | | 17,526 | |
6.500%, 08/15/28 | | | 19,506 | | | | 22,491 | |
6.500%, 11/15/28 | | | 13,257 | | | | 15,285 | |
6.500%, 12/15/28 | | | 11,765 | | | | 13,565 | |
6.500%, 07/15/29 | | | 2,389 | | | | 2,751 | |
6.500%, 05/15/36 | | | 316,110 | | | | 357,860 | |
7.000%, 01/15/28 | | | 2,732 | | | | 3,181 | |
7.000%, 04/15/28 | | | 3,467 | | | | 4,037 | |
7.000%, 05/15/28 | | | 19,337 | | | | 22,517 | |
7.000%, 06/15/28 | | | 11,600 | | | | 13,509 | |
7.000%, 10/15/28 | | | 10,510 | | | | 12,238 | |
7.000%, 06/15/29 | | | 2,211 | | | | 2,574 | |
7.000%, 09/15/29 | | | 21,969 | | | | 25,582 | |
7.000%, 01/15/31 | | | 1,444 | | | | 1,679 | |
7.000%, 03/15/31 | | | 29,809 | | | | 34,662 | |
7.000%, 07/15/31 | | | 663,894 | | | | 771,989 | |
7.000%, 08/15/31 | | | 98,709 | | | | 114,781 | |
7.000%, 02/15/32 | | | 32,813 | | | | 37,857 | |
7.000%, 07/15/32 | | | 42,927 | | | | 49,525 | |
7.500%, 08/15/29 | | | 475 | | | | 477 | |
7.500%, 04/15/30 | | | 8,993 | | | | 9,242 | |
8.000%, 08/15/26 | | | 4,091 | | | | 4,702 | |
8.000%, 09/15/26 | | | 5,101 | | | | 5,834 | |
|
Agency Sponsored Mortgage-Backed—(Continued) | |
Ginnie Mae I 30 Yr. Pool | | | | | | | | |
8.000%, 05/15/27 | | | 1,528 | | | | 1,574 | |
8.000%, 06/15/29 | | | 24,633 | | | | 26,778 | |
9.000%, 11/15/24 | | | 15,021 | | | | 16,357 | |
Ginnie Mae II 30 Yr. Pool | | | | | | | | |
3.000%, 12/20/42 | | | 4,052,698 | | | | 3,927,513 | |
3.000%, 03/20/43 | | | 4,977,965 | | | | 4,823,243 | |
3.500%, 12/20/41 | | | 2,944,607 | | | | 2,975,269 | |
3.500%, 08/20/42 | | | 2,774,167 | | | | 2,806,715 | |
3.500%, 01/20/43 | | | 8,194,132 | | | | 8,285,938 | |
3.500%, 04/20/43 | | | 2,885,009 | | | | 2,918,992 | |
4.000%, 11/20/40 | | | 3,112,162 | | | | 3,246,498 | |
4.000%, 12/20/40 | | | 2,799,464 | | | | 2,920,302 | |
4.000%, 11/20/43 | | | 2,844,397 | | | | 2,964,394 | |
4.500%, 08/20/40 | | | 3,073,480 | | | | 3,294,796 | |
4.500%, 12/20/40 | | | 1,733,407 | | | | 1,858,227 | |
4.500%, 04/20/41 | | | 1,737,834 | | | | 1,859,599 | |
4.500%, 03/20/42 | | | 1,296,766 | | | | 1,387,627 | |
4.500%, 10/20/43 | | | 2,782,524 | | | | 2,979,806 | |
5.000%, 08/20/40 | | | 1,363,272 | | | | 1,497,905 | |
5.000%, 10/20/40 | | | 1,308,178 | | | | 1,437,371 | |
6.500%, 06/20/31 | | | 40,847 | | | | 46,813 | |
6.500%, 11/20/38 | | | 1,184,624 | | | | 1,340,830 | |
7.500%, 02/20/28 | | | 4,685 | | | | 5,547 | |
| | | | | | | | |
| | | | | | | 591,802,556 | |
| | | | | | | | |
| | |
Federal Agencies—4.9% | | | | | | | | |
Federal Farm Credit Bank | | | | | | | | |
4.875%, 12/16/15 | | | 4,500,000 | | | | 4,891,794 | |
Federal Home Loan Banks | | | | | | | | |
0.375%, 06/24/16 (b) | | | 10,040,000 | | | | 9,996,769 | |
4.875%, 05/17/17 (b) | | | 4,420,000 | | | | 4,984,138 | |
5.375%, 05/18/16 | | | 2,900,000 | | | | 3,229,777 | |
Federal Home Loan Mortgage Corp. | | | | | | | | |
0.875%, 03/07/18 (b) | | | 17,000,000 | | | | 16,573,456 | |
1.250%, 10/02/19 (b) | | | 3,000,000 | | | | 2,847,089 | |
4.750%, 01/19/16 (b) | | | 2,850,000 | | | | 3,102,471 | |
5.125%, 11/17/17 (b) | | | 3,530,000 | | | | 4,037,423 | |
5.625%, 11/23/35 | | | 1,040,000 | | | | 1,093,238 | |
Federal National Mortgage Association | | | | | | | | |
0.500%, 03/30/16 (b) | | | 9,450,000 | | | | 9,451,194 | |
0.550%, 02/27/15 | | | 4,990,000 | | | | 4,992,155 | |
0.875%, 05/21/18 (b) | | | 10,160,000 | | | | 9,850,796 | |
5.375%, 07/15/16 (b) | | | 5,870,000 | | | | 6,568,678 | |
5.375%, 06/12/17 | | | 8,300,000 | | | | 9,488,990 | |
6.625%, 11/15/30 (b) | | | 2,450,000 | | | | 3,199,014 | |
Tennessee Valley Authority | | | | | | | | |
5.250%, 09/15/39 | | | 3,350,000 | | | | 3,563,578 | |
| | | | | | | | |
| | | | | | | 97,870,560 | |
| | | | | | | | |
| | |
U.S. Treasury—35.8% | | | | | | | | |
U.S. Treasury Bonds | | | | | | | | |
2.750%, 08/15/42 | | | 2,020,000 | | | | 1,600,729 | |
2.875%, 05/15/43 (b) | | | 4,760,000 | | | | 3,857,504 | |
3.125%, 02/15/42 | | | 1,800,000 | | | | 1,551,816 | |
See accompanying notes to financial statements.
MSF-7
Metropolitan Series Fund
Barclays Aggregate Bond Index Portfolio
Schedule of Investments as of December 31, 2013
U.S. Treasury & Government Agencies—(Continued)
| | | | | | | | |
| Security Description | | Principal
Amount* | | | Value | |
|
U.S. Treasury—(Continued) | |
U.S. Treasury Bonds | | | | | | | | |
3.125%, 02/15/43 | | | 3,270,000 | | | $ | 2,799,578 | |
3.500%, 02/15/39 | | | 2,080,000 | | | | 1,958,861 | |
3.750%, 08/15/41 (b) | | | 1,830,000 | | | | 1,783,994 | |
3.875%, 08/15/40 | | | 10,380,000 | | | | 10,382,595 | |
4.250%, 11/15/40 (b) | | | 7,280,000 | | | | 7,746,575 | |
4.375%, 11/15/39 | | | 3,900,000 | | | | 4,238,013 | |
4.375%, 05/15/40 | | | 5,220,000 | | | | 5,670,956 | |
4.375%, 05/15/41 (b) | | | 5,850,000 | | | | 6,347,075 | |
4.500%, 02/15/36 (b) | | | 5,675,000 | | | | 6,315,197 | |
4.500%, 05/15/38 | | | 4,950,000 | | | | 5,488,808 | |
5.000%, 05/15/37 (b) | | | 2,760,000 | | | | 3,284,345 | |
5.250%, 02/15/29 (b) | | | 750,000 | | | | 902,625 | |
5.375%, 02/15/31 | | | 3,075,000 | | | | 3,768,289 | |
6.125%, 11/15/27 (b) | | | 5,750,000 | | | | 7,480,463 | |
6.250%, 08/15/23 (b) | | | 7,700,000 | | | | 9,890,266 | |
6.375%, 08/15/27 | | | 2,800,000 | | | | 3,717,252 | |
6.500%, 11/15/26 | | | 1,000,000 | | | | 1,335,630 | |
7.125%, 02/15/23 (b) | | | 6,100,000 | | | | 8,224,996 | |
7.250%, 08/15/22 (b) | | | 6,120,000 | | | | 8,267,692 | |
7.875%, 02/15/21 (b) | | | 4,450,000 | | | | 6,053,424 | |
8.000%, 11/15/21 | | | 2,920,000 | | | | 4,055,588 | |
8.125%, 08/15/19 | | | 2,645,000 | | | | 3,523,642 | |
8.125%, 08/15/21 (b) | | | 1,250,000 | | | | 1,738,662 | |
8.500%, 02/15/20 | | | 6,700,000 | | | | 9,183,958 | |
8.750%, 08/15/20 (b) | | | 1,000,000 | | | | 1,403,200 | |
8.875%, 02/15/19 (b) | | | 10,215,000 | | | | 13,806,492 | |
9.125%, 05/15/18 | | | 1,600,000 | | | | 2,122,128 | |
9.250%, 02/15/16 | | | 1,375,000 | | | | 1,630,681 | |
U.S. Treasury Notes | | | | | | | | |
0.250%, 12/15/14 (b) | | | 7,000,000 | | | | 7,005,740 | |
0.375%, 11/15/14 | | | 7,980,000 | | | | 7,995,003 | |
0.375%, 03/15/15 | | | 8,020,000 | | | | 8,036,201 | |
0.625%, 05/31/17 | | | 5,000,000 | | | | 4,935,150 | |
0.625%, 08/31/17 | | | 21,700,000 | | | | 21,293,342 | |
0.625%, 04/30/18 (b) | | | 5,000,000 | | | | 4,822,050 | |
0.875%, 11/30/16 (b) | | | 23,800,000 | | | | 23,877,827 | |
1.000%, 08/31/16 | | | 11,820,000 | | | | 11,930,753 | |
1.000%, 09/30/16 | | | 13,850,000 | | | | 13,970,079 | |
1.000%, 10/31/16 | | | 7,010,000 | | | | 7,063,416 | |
1.000%, 03/31/17 | | | 7,850,000 | | | | 7,867,741 | |
1.250%, 08/31/15 (b) | | | 5,850,000 | | | | 5,943,541 | |
1.250%, 09/30/15 | | | 7,750,000 | | | | 7,872,295 | |
1.375%, 11/30/15 | | | 19,400,000 | | | | 19,776,748 | |
1.375%, 09/30/18 (b) | | | 12,890,000 | | | | 12,731,066 | |
1.625%, 11/15/22 (b) | | | 5,000,000 | | | | 4,512,450 | |
1.750%, 07/31/15 | | | 6,700,000 | | | | 6,856,579 | |
1.750%, 05/15/22 (b) | | | 4,900,000 | | | | 4,530,050 | |
1.750%, 05/15/23 (b) | | | 6,420,000 | | | | 5,785,897 | |
1.875%, 06/30/15 | | | 6,700,000 | | | | 6,863,212 | |
1.875%, 09/30/17 | | | 15,900,000 | | | | 16,307,357 | |
2.000%, 11/15/21 | | | 10,950,000 | | | | 10,449,476 | |
2.000%, 02/15/22 (b) | | | 3,800,000 | | | | 3,605,212 | |
2.000%, 02/15/23 | | | 6,900,000 | | | | 6,399,681 | |
2.125%, 05/31/15 | | | 12,000,000 | | | | 12,320,280 | |
2.125%, 02/29/16 | | | 4,790,000 | | | | 4,964,931 | |
|
U.S. Treasury—(Continued) | |
U.S. Treasury Notes | | | | | | | | |
2.125%, 08/15/21 | | | 8,710,000 | | | | 8,436,854 | |
2.375%, 02/28/15 | | | 15,000,000 | | | | 15,376,800 | |
2.375%, 03/31/16 (b) | | | 20,560,000 | | | | 21,447,368 | |
2.375%, 05/31/18 (b) | | | 31,000,000 | | | | 32,182,031 | |
2.500%, 04/30/15 (b) | | | 5,980,000 | | | | 6,160,776 | |
2.500%, 08/15/23 | | | 14,400,000 | | | | 13,826,880 | |
2.625%, 02/29/16 | | | 2,510,000 | | | | 2,629,526 | |
2.625%, 04/30/16 | | | 17,800,000 | | | | 18,672,200 | |
2.625%, 08/15/20 (b) | | | 6,000,000 | | | | 6,123,240 | |
2.750%, 05/31/17 (b) | | | 9,840,000 | | | | 10,417,805 | |
3.000%, 08/31/16 | | | 8,350,000 | | | | 8,869,620 | |
3.000%, 09/30/16 (b) | | | 18,100,000 | | | | 19,238,852 | |
3.000%, 02/28/17 | | | 14,980,000 | | | | 15,961,340 | |
3.125%, 05/15/19 | | | 3,000,000 | | | | 3,197,190 | |
3.250%, 05/31/16 | | | 8,230,000 | | | | 8,764,456 | |
3.375%, 11/15/19 (b) | | | 4,350,000 | | | | 4,679,338 | |
3.500%, 02/15/18 | | | 4,000,000 | | | | 4,343,040 | |
3.500%, 05/15/20 | | | 7,790,000 | | | | 8,404,398 | |
3.625%, 02/15/20 (b) | | | 17,190,000 | | | | 18,712,346 | |
3.750%, 11/15/18 | | | 4,550,000 | | | | 4,994,216 | |
3.875%, 05/15/18 | | | 4,700,000 | | | | 5,180,857 | |
4.000%, 02/15/15 | | | 27,230,000 | | | | 28,389,180 | |
4.000%, 08/15/18 | | | 9,620,000 | | | | 10,671,466 | |
4.250%, 08/15/15 | | | 2,300,000 | | | | 2,447,384 | |
4.250%, 11/15/17 (b) | | | 4,700,000 | | | | 5,233,638 | |
4.500%, 11/15/15 (b) | | | 8,950,000 | | | | 9,643,267 | |
4.500%, 02/15/16 | | | 4,520,000 | | | | 4,911,070 | |
4.625%, 02/15/17 | | | 8,475,000 | | | | 9,451,319 | |
4.875%, 08/15/16 (b) | | | 8,330,000 | | | | 9,253,631 | |
5.125%, 05/15/16 | | | 4,830,000 | | | | 5,351,881 | |
| | | | | | | | |
| | | | | | | 720,819,080 | |
| | | | | | | | |
Total U.S. Treasury & Government Agencies
(Cost $1,385,377,051) | | | | | | | 1,410,492,196 | |
| | | | | | | | |
|
| Corporate Bonds & Notes—24.1% | |
| | |
Aerospace/Defense—0.4% | | | | | | | | |
Boeing Co. (The)
7.250%, 06/15/25 (b) | | | 460,000 | | | | 577,120 | |
Lockheed Martin Corp.
6.150%, 09/01/36 (b) | | | 1,700,000 | | | | 1,926,735 | |
Northrop Grumman Systems Corp.
7.750%, 02/15/31 | | | 515,000 | | | | 657,453 | |
Raytheon Co.
3.125%, 10/15/20 | | | 1,000,000 | | | | 1,001,664 | |
United Technologies Corp. | | | | | | | | |
4.500%, 06/01/42 | | | 2,645,000 | | | | 2,564,115 | |
4.875%, 05/01/15 | | | 900,000 | | | | 951,436 | |
7.500%, 09/15/29 | | | 200,000 | | | | 267,144 | |
| | | | | | | | |
| | | | | | | 7,945,667 | |
| | | | | | | | |
See accompanying notes to financial statements.
MSF-8
Metropolitan Series Fund
Barclays Aggregate Bond Index Portfolio
Schedule of Investments as of December 31, 2013
Corporate Bonds & Notes—(Continued)
| | | | | | | | |
| Security Description | | Principal
Amount* | | | Value | |
| | |
Agriculture—0.2% | | | | | | | | |
Altria Group, Inc. | | | | | | | | |
9.700%, 11/10/18 | | | 750,000 | | | $ | 985,985 | |
Archer-Daniels-Midland Co.
4.479%, 03/01/21 | | | 2,000,000 | | | | 2,115,646 | |
Philip Morris International, Inc. | | | | | | | | |
4.500%, 03/26/20 | | | 925,000 | | | | 1,000,217 | |
6.875%, 03/17/14 (b) | | | 755,000 | | | | 765,054 | |
| | | | | | | | |
| | | | | | | 4,866,902 | |
| | | | | | | | |
|
Auto Manufacturers—0.2% | |
Daimler Finance North America LLC
8.500%, 01/18/31 | | | 1,050,000 | | | | 1,530,838 | |
Ford Motor Co.
7.450%, 07/16/31 | | | 2,200,000 | | | | 2,714,038 | |
| | | | | | | | |
| | | | | | | 4,244,876 | |
| | | | | | | | |
|
Banks—5.2% | |
American Express Centurion Bank
0.875%, 11/13/15 | | | 3,000,000 | | | | 3,002,167 | |
Bank of America Corp. | | | | | | | | |
4.100%, 07/24/23 | | | 2,905,000 | | | | 2,905,582 | |
5.750%, 08/15/16 | | | 2,850,000 | | | | 3,139,661 | |
5.875%, 02/07/42 (b) | | | 3,000,000 | | | | 3,395,842 | |
6.500%, 08/01/16 | | | 1,750,000 | | | | 1,974,894 | |
Bank of New York Mellon Corp. (The)
5.450%, 05/15/19 (b) | | | 2,000,000 | | | | 2,285,336 | |
Barclays Bank plc
5.000%, 09/22/16 (b) | | | 1,750,000 | | | | 1,926,948 | |
BB&T Corp.
3.200%, 03/15/16 | | | 1,865,000 | | | | 1,955,701 | |
BNP Paribas S.A.
5.000%, 01/15/21 (b) | | | 3,225,000 | | | | 3,533,478 | |
Capital One Financial Corp.
6.750%, 09/15/17 (b) | | | 1,200,000 | | | | 1,398,455 | |
Citigroup, Inc. | | | | | | | | |
5.375%, 08/09/20 | | | 2,200,000 | | | | 2,488,792 | |
5.850%, 08/02/16 (b) | | | 500,000 | | | | 554,750 | |
6.125%, 11/21/17 | | | 1,700,000 | | | | 1,958,478 | |
6.125%, 05/15/18 (b) | | | 1,900,000 | | | | 2,201,649 | |
Credit Suisse
4.375%, 08/05/20 (b) | | | 2,611,000 | | | | 2,806,952 | |
Deutsche Bank AG
6.000%, 09/01/17 | | | 1,500,000 | | | | 1,714,625 | |
Fifth Third Bancorp
8.250%, 03/01/38 | | | 1,175,000 | | | | 1,556,692 | |
Goldman Sachs Group, Inc. (The) | | | | | | | | |
3.625%, 02/07/16 | | | 2,825,000 | | | | 2,962,669 | |
6.000%, 06/15/20 | | | 2,000,000 | | | | 2,291,967 | |
6.125%, 02/15/33 (b) | | | 2,075,000 | | | | 2,333,835 | |
6.250%, 09/01/17 | | | 760,000 | | | | 869,630 | |
6.450%, 05/01/36 | | | 2,000,000 | | | | 2,110,801 | |
HSBC Holdings plc | | | | | | | | |
5.100%, 04/05/21 | | | 2,556,000 | | | | 2,849,530 | |
6.500%, 09/15/37 | | | 905,000 | | | | 1,064,738 | |
|
Banks—(Continued) | |
JPMorgan Chase & Co. | | | | | | | | |
3.250%, 09/23/22 | | | 2,850,000 | | | | 2,722,689 | |
4.950%, 03/25/20 | | | 2,650,000 | | | | 2,932,602 | |
6.300%, 04/23/19 | | | 1,900,000 | | | | 2,237,501 | |
JPMorgan Chase Bank N.A.
6.000%, 10/01/17 | | | 2,700,000 | | | | 3,089,513 | |
KFW | | | | | | | | |
1.000%, 06/11/18 (b) | | | 3,536,000 | | | | 3,445,062 | |
1.250%, 02/15/17 (b) | | | 3,000,000 | | | | 3,030,432 | |
2.375%, 08/25/21 (b) | | | 1,945,000 | | | | 1,881,110 | |
2.625%, 02/16/16 | | | 2,791,000 | | | | 2,910,089 | |
2.750%, 09/08/20 (b) | | | 2,300,000 | | | | 2,322,145 | |
4.875%, 01/17/17 (b) | | | 2,900,000 | | | | 3,242,638 | |
Lloyds TSB Bank plc | | | | | | | | |
6.375%, 01/21/21 (b) | | | 1,500,000 | | | | 1,766,780 | |
Morgan Stanley | | | | | | | | |
5.625%, 09/23/19 | | | 1,900,000 | | | | 2,151,219 | |
7.250%, 04/01/32 | | | 1,850,000 | | | | 2,306,980 | |
7.300%, 05/13/19 | | | 2,460,000 | | | | 2,989,101 | |
PNC Bank N.A. | | | | | | | | |
4.875%, 09/21/17 | | | 1,000,000 | | | | 1,097,409 | |
5.250%, 01/15/17 (b) | | | 1,600,000 | | | | 1,760,636 | |
State Street Bank and Trust Co. | | | | | | | | |
5.300%, 01/15/16 | | | 300,000 | | | | 324,283 | |
SunTrust Banks, Inc. | | | | | | | | |
3.600%, 04/15/16 | | | 1,450,000 | | | | 1,527,791 | |
Wachovia Corp. | | | | | | | | |
5.750%, 06/15/17 | | | 700,000 | | | | 798,856 | |
Wells Fargo & Co. | | | | | | | | |
3.676%, 06/15/16 | | | 2,775,000 | | | | 2,953,592 | |
5.000%, 11/15/14 | | | 2,000,000 | | | | 2,075,514 | |
Wells Fargo Bank N.A. | | | | | | | | |
5.950%, 08/26/36 | | | 1,900,000 | | | | 2,172,206 | |
Westpac Banking Corp. | | | | | | | | |
3.000%, 12/09/15 | | | 2,000,000 | | | | 2,087,011 | |
| | | | | | | | |
| | | | | | | 105,108,331 | |
| | | | | | | | |
|
Beverages—0.4% | |
Anheuser-Busch Cos. LLC | | | | | | | | |
5.000%, 01/15/15 | | | 1,950,000 | | | | 2,039,434 | |
6.450%, 09/01/37 | | | 880,000 | | | | 1,063,350 | |
Coca-Cola Co. (The) | | | | | | | | |
3.150%, 11/15/20 | | | 280,000 | | | | 282,982 | |
3.200%, 11/01/23 (b) | | | 3,000,000 | | | | 2,899,540 | |
Diageo Finance B.V. | | | | | | | | |
5.300%, 10/28/15 | | | 870,000 | | | | 941,842 | |
Pepsi Bottling Group, Inc. (The) | | | | | | | | |
7.000%, 03/01/29 | | | 300,000 | | | | 376,243 | |
PepsiCo, Inc. | | | | | | | | |
5.000%, 06/01/18 | | | 1,000,000 | | | | 1,126,752 | |
| | | | | | | | |
| | | | | | | 8,730,143 | |
| | | | | | | | |
See accompanying notes to financial statements.
MSF-9
Metropolitan Series Fund
Barclays Aggregate Bond Index Portfolio
Schedule of Investments as of December 31, 2013
Corporate Bonds & Notes—(Continued)
| | | | | | | | |
| Security Description | | Principal
Amount* | | | Value | |
|
Biotechnology—0.1% | |
Amgen, Inc. | | | | | | | | |
5.700%, 02/01/19 | | | 850,000 | | | $ | 980,483 | |
6.150%, 06/01/18 | | | 1,650,000 | | | | 1,925,294 | |
| | | | | | | | |
| | | | | | | 2,905,777 | |
| | | | | | | | |
|
Building Materials—0.1% | |
CRH America, Inc. | | | | | | | | |
6.000%, 09/30/16 | | | 900,000 | | | | 1,008,172 | |
| | | | | | | | |
|
Chemicals—0.4% | |
Dow Chemical Co. (The) | | | | | | | | |
4.250%, 11/15/20 | | | 2,750,000 | | | | 2,916,819 | |
9.400%, 05/15/39 | | | 650,000 | | | | 976,894 | |
E. I. du Pont de Nemours & Co. | | | | | | | | |
5.600%, 12/15/36 | | | 1,000,000 | | | | 1,089,156 | |
6.000%, 07/15/18 (b) | | | 1,000,000 | | | | 1,163,860 | |
Potash Corp. of Saskatchewan, Inc. | | | | | | | | |
4.875%, 03/30/20 | | | 970,000 | | | | 1,055,156 | |
Praxair, Inc. | | | | | | | | |
4.375%, 03/31/14 | | | 810,000 | | | | 817,797 | |
| | | | | | | | |
| | | | | | | 8,019,682 | |
| | | | | | | | |
|
Computers—0.4% | |
Apple, Inc. | | | | | | | | |
2.400%, 05/03/23 | | | 2,072,000 | | | | 1,856,746 | |
Hewlett-Packard Co. | | | | | | | | |
5.500%, 03/01/18 (b) | | | 1,950,000 | | | | 2,181,057 | |
International Business Machines Corp. | | | | | | | | |
4.000%, 06/20/42 (b) | | | 3,200,000 | | | | 2,829,380 | |
8.375%, 11/01/19 | | | 425,000 | | | | 558,704 | |
| | | | | | | | |
| | | | | | | 7,425,887 | |
| | | | | | | | |
|
Cosmetics/Personal Care—0.2% | |
Procter & Gamble Co. (The) | | | | | | | | |
2.300%, 02/06/22 (b) | | | 3,600,000 | | | | 3,368,681 | |
6.450%, 01/15/26 | | | 200,000 | | | | 247,380 | |
| | | | | | | | |
| | | | | | | 3,616,061 | |
| | | | | | | | |
|
Diversified Financial Services—1.1% | |
Associates Corp. of North America | | | | | | | | |
6.950%, 11/01/18 | | | 1,700,000 | | | | 2,026,289 | |
Bear Stearns Cos. LLC (The) | | | | | | | | |
5.700%, 11/15/14 | | | 900,000 | | | | 940,069 | |
BlackRock, Inc. | | | | | | | | |
3.500%, 12/10/14 | | | 1,500,000 | | | | 1,542,423 | |
General Electric Capital Corp. | | | | | | | | |
5.300%, 02/11/21 (b) | | | 1,915,000 | | | | 2,142,135 | |
5.400%, 02/15/17 | | | 2,000,000 | | | | 2,235,864 | |
5.875%, 01/14/38 | | | 2,050,000 | | | | 2,331,770 | |
6.750%, 03/15/32 | | | 1,250,000 | | | | 1,544,297 | |
7.500%, 08/21/35 | | | 100,000 | | | | 128,181 | |
HSBC Finance Corp. | | | | | | | | |
5.000%, 06/30/15 | | | 1,800,000 | | | | 1,900,204 | |
5.500%, 01/19/16 | | | 900,000 | | | | 974,961 | |
|
Diversified Financial Services—(Continued) | |
Merrill Lynch & Co., Inc. | | | | | | | | |
6.500%, 07/15/18 (b) | | | 200,000 | | | | 231,909 | |
Nomura Holdings, Inc. | | | | | | | | |
6.700%, 03/04/20 | | | 1,325,000 | | | | 1,502,882 | |
Toyota Motor Credit Corp. | | | | | | | | |
0.875%, 07/17/15 | | | 3,950,000 | | | | 3,973,622 | |
| | | | | | | | |
| | | | | | | 21,474,606 | |
| | | | | | | | |
|
Electric—1.7% | |
Consolidated Edison Co. of New York, Inc. | | | | | | | | |
5.850%, 04/01/18 (b) | | | 855,000 | | | | 986,649 | |
Dominion Resources, Inc. | | | | | | | | |
5.150%, 07/15/15 | | | 1,600,000 | | | | 1,702,773 | |
Duke Energy Carolinas LLC | | | | | | | | |
5.300%, 02/15/40 | | | 2,000,000 | | | | 2,171,163 | |
Exelon Corp. | | | | | | | | |
4.900%, 06/15/15 | | | 1,060,000 | | | | 1,115,062 | |
5.625%, 06/15/35 | | | 1,500,000 | | | | 1,486,898 | |
Florida Power & Light Co. | | | | | | | | |
5.950%, 02/01/38 | | | 1,700,000 | | | | 1,965,019 | |
Georgia Power Co. | | | | | | | | |
5.700%, 06/01/17 (b) | | | 1,400,000 | | | | 1,572,310 | |
Hydro-Quebec | | | | | | | | |
7.500%, 04/01/16 | | | 1,350,000 | | | | 1,543,557 | |
8.400%, 01/15/22 | | | 1,000,000 | | | | 1,307,377 | |
Northern States Power Co. | | | | | | | | |
6.250%, 06/01/36 (b) | | | 2,200,000 | | | | 2,636,414 | |
Ohio Power Co. | | | | | | | | |
5.375%, 10/01/21 (b) | | | 1,640,000 | | | | 1,834,406 | |
Oncor Electric Delivery Co. LLC | | | | | | | | |
7.000%, 05/01/32 | | | 950,000 | | | | 1,157,360 | |
Pacific Gas & Electric Co. | | | | | | | | |
5.400%, 01/15/40 | | | 3,320,000 | | | | 3,539,384 | |
PacifiCorp | | | | | | | | |
2.950%, 02/01/22 | | | 2,800,000 | | | | 2,700,552 | |
PPL Energy Supply LLC | | | | | | | | |
4.600%, 12/15/21 (b) | | | 3,019,000 | | | | 2,910,295 | |
Progress Energy, Inc. | | | | | | | | |
5.625%, 01/15/16 | | | 1,900,000 | | | | 2,064,175 | |
PSEG Power LLC | | | | | | | | |
8.625%, 04/15/31 | | | 1,000,000 | | | | 1,346,232 | |
Southern California Edison Co. | | | | | | | | |
5.000%, 01/15/16 | | | 1,500,000 | | | | 1,619,659 | |
| | | | | | | | |
| | | | | | | 33,659,285 | |
| | | | | | | | |
|
Electronics—0.2% | |
Honeywell International, Inc. | | | | | | | | |
5.000%, 02/15/19 (b) | | | 2,000,000 | | | | 2,250,441 | |
Koninklijke Philips NV | | | | | | | | |
5.750%, 03/11/18 | | | 900,000 | | | | 1,029,735 | |
| | | | | | | | |
| | | | | | | 3,280,176 | |
| | | | | | | | |
|
Environmental Control—0.1% | |
Waste Management, Inc. | | | | | | | | |
7.000%, 07/15/28 | | | 1,265,000 | | | | 1,523,126 | |
| | | | | | | | |
See accompanying notes to financial statements.
MSF-10
Metropolitan Series Fund
Barclays Aggregate Bond Index Portfolio
Schedule of Investments as of December 31, 2013
Corporate Bonds & Notes—(Continued)
| | | | | | | | |
| Security Description | | Principal
Amount* | | | Value | |
|
Food—0.6% | |
ConAgra Foods, Inc. | | | | | | | | |
5.819%, 06/15/17 | | | 1,000,000 | | | $ | 1,115,263 | |
General Mills, Inc. | | | | | | | | |
5.650%, 02/15/19 | | | 1,700,000 | | | | 1,952,584 | |
Mondelez International, Inc. | | | | | | | | |
4.125%, 02/09/16 | | | 2,200,000 | | | | 2,339,750 | |
5.375%, 02/10/20 | | | 1,800,000 | | | | 2,030,804 | |
Safeway, Inc. | | | | | | | | |
7.250%, 02/01/31 (b) | | | 813,000 | | | | 833,346 | |
Sysco Corp. | | | | | | | | |
2.600%, 06/12/22 (b) | | | 2,400,000 | | | | 2,192,366 | |
Unilever Capital Corp. | | | | | | | | |
5.900%, 11/15/32 | | | 1,500,000 | | | | 1,819,861 | |
| | | | | | | | |
| | | | | | | 12,283,974 | |
| | | | | | | | |
|
Forest Products & Paper—0.2% | |
Georgia-Pacific LLC | | | | | | | | |
8.000%, 01/15/24 | | | 1,800,000 | | | | 2,320,044 | |
International Paper Co. | | | | | | | | |
7.950%, 06/15/18 | | | 820,000 | | | | 1,001,971 | |
| | | | | | | | |
| | | | | | | 3,322,015 | |
| | | | | | | | |
| | |
Gas—0.1% | | | | | | | | |
Sempra Energy
6.150%, 06/15/18 (b) | | | 900,000 | | | | 1,034,090 | |
| | | | | | | | |
| | |
Healthcare - Products—0.2% | | | | | | | | |
Baxter International, Inc.
5.375%, 06/01/18 (b) | | | 1,400,000 | | | | 1,578,051 | |
Medtronic, Inc.
3.000%, 03/15/15 | | | 2,300,000 | | | | 2,366,594 | |
| | | | | | | | |
| | | | | | | 3,944,645 | |
| | | | | | | | |
| | |
Healthcare - Services—0.4% | | | | | | | | |
Aetna, Inc.
2.750%, 11/15/22 | | | 3,000,000 | | | | 2,763,032 | |
Laboratory Corp. of America Holdings
4.625%, 11/15/20 | | | 1,900,000 | | | | 1,987,260 | |
UnitedHealth Group, Inc.
5.375%, 03/15/16 (b) | | | 1,700,000 | | | | 1,855,337 | |
WellPoint, Inc.
5.850%, 01/15/36 | | | 1,800,000 | | | | 1,953,416 | |
| | | | | | | | |
| | | | | | | 8,559,045 | |
| | | | | | | | |
| | |
Household Products/Wares—0.0% | | | | | | | | |
Kimberly-Clark Corp.
6.125%, 08/01/17 (b) | | | 500,000 | | | | 580,610 | |
| | | | | | | | |
| | |
Insurance—0.8% | | | | | | | | |
Aflac, Inc.
3.625%, 06/15/23 | | | 2,975,000 | | | | 2,840,989 | |
Allstate Corp. (The) | | | | | | | | |
6.900%, 05/15/38 (b) | | | 150,000 | | | | 180,861 | |
7.450%, 05/16/19 | | | 1,700,000 | | | | 2,117,056 | |
| | |
Insurance—(Continued) | | | | | | | | |
American International Group, Inc. | | | | | | | | |
5.450%, 05/18/17 | | | 1,900,000 | | | | 2,120,610 | |
5.850%, 01/16/18 | | | 1,800,000 | | | | 2,061,154 | |
AXA S.A.
8.600%, 12/15/30 | | | 1,165,000 | | | | 1,435,862 | |
Berkshire Hathaway, Inc.
1.900%, 01/31/17 | | | 2,900,000 | | | | 2,940,245 | |
Chubb Corp. (The)
6.000%, 05/11/37 | | | 865,000 | | | | 997,006 | |
Hartford Financial Services Group, Inc.
6.100%, 10/01/41 (b) | | | 780,000 | | | | 882,967 | |
Prudential Financial, Inc.
5.700%, 12/14/36 | | | 1,525,000 | | | | 1,638,027 | |
| | | | | | | | |
| | | | | | | 17,214,777 | |
| | | | | | | | |
| | |
Iron/Steel—0.1% | | | | | | | | |
Vale Overseas, Ltd.
6.875%, 11/21/36 | | | 1,100,000 | | | | 1,142,553 | |
| | | | | | | | |
|
Machinery - Construction & Mining—0.1% | |
Caterpillar, Inc.
7.900%, 12/15/18 (b) | | | 1,757,000 | | | | 2,211,771 | |
| | | | | | | | |
| | |
Machinery - Diversified—0.1% | | | | | | | | |
Deere & Co.
2.600%, 06/08/22 (b) | | | 1,950,000 | | | | 1,821,760 | |
6.950%, 04/25/14 | | | 850,000 | | | | 867,440 | |
| | | | | | | | |
| | | | | | | 2,689,200 | |
| | | | | | | | |
| | |
Media—1.3% | | | | | | | | |
21st Century Fox America, Inc.
6.550%, 03/15/33 | | | 1,950,000 | | | | 2,229,585 | |
CBS Corp.
8.875%, 05/15/19 | | | 750,000 | | | | 950,965 | |
Comcast Corp. | | | | | | | | |
4.650%, 07/15/42 | | | 3,670,000 | | | | 3,399,271 | |
5.650%, 06/15/35 | | | 1,500,000 | | | | 1,607,674 | |
DIRECTV Holdings LLC / DIRECTV Financing Co., Inc.
5.000%, 03/01/21 | | | 2,600,000 | | | | 2,726,257 | |
Discovery Communications LLC
6.350%, 06/01/40 | | | 1,800,000 | | | | 1,999,385 | |
Thomson Reuters Corp.
6.500%, 07/15/18 | | | 800,000 | | | | 927,635 | |
Time Warner Cable, Inc. | | | | | | | | |
5.000%, 02/01/20 (b) | | | 1,900,000 | | | | 1,904,150 | |
5.850%, 05/01/17 | | | 1,800,000 | | | | 1,965,218 | |
6.550%, 05/01/37 | | | 100,000 | | | | 92,209 | |
Time Warner Entertainment Co. L.P.
8.375%, 03/15/23 | | | 380,000 | | | | 434,185 | |
Time Warner, Inc. | | | | | | | | |
6.100%, 07/15/40 | | | 925,000 | | | | 1,002,546 | |
7.700%, 05/01/32 | | | 685,000 | | | | 873,792 | |
See accompanying notes to financial statements.
MSF-11
Metropolitan Series Fund
Barclays Aggregate Bond Index Portfolio
Schedule of Investments as of December 31, 2013
Corporate Bonds & Notes—(Continued)
| | | | | | | | |
| Security Description | | Principal
Amount* | | | Value | |
| | |
Media—(Continued) | | | | | | | | |
Viacom, Inc. | | | | | | | | |
4.375%, 03/15/43 | | | 3,500,000 | | | $ | 2,932,493 | |
6.250%, 04/30/16 | | | 770,000 | | | | 859,738 | |
Walt Disney Co. (The)
2.750%, 08/16/21 | | | 1,930,000 | | | | 1,845,421 | |
| | | | | | | | |
| | | | | | | 25,750,524 | |
| | | | | | | | |
| | |
Mining—0.6% | | | | | | | | |
Alcoa, Inc. | | | | | | | | |
5.720%, 02/23/19 | | | 523,000 | | | | 555,983 | |
5.870%, 02/23/22 (b) | | | 101,000 | | | | 104,375 | |
Barrick North America Finance LLC
4.400%, 05/30/21 | | | 3,125,000 | | | | 3,002,953 | |
Freeport-McMoRan Copper & Gold, Inc.
3.550%, 03/01/22 (b) | | | 3,700,000 | | | | 3,484,292 | |
Newmont Mining Corp.
6.250%, 10/01/39 (b) | | | 1,800,000 | | | | 1,573,136 | |
Rio Tinto Alcan, Inc. | | | | | | | | |
5.000%, 06/01/15 | | | 1,050,000 | | | | 1,110,674 | |
6.125%, 12/15/33 | | | 1,751,000 | | | | 1,975,038 | |
| | | | | | | | |
| | | | | | | 11,806,451 | |
| | | | | | | | |
| | |
Miscellaneous Manufacturing—0.3% | | | | | | | | |
General Electric Co.
5.250%, 12/06/17 | | | 1,800,000 | | | | 2,039,173 | |
Tyco Electronics Group S.A.
6.550%, 10/01/17 | | | 1,600,000 | | | | 1,818,960 | |
Tyco International, Ltd.
6.875%, 01/15/21 (b) | | | 1,275,000 | | | | 1,476,145 | |
| | | | | | | | |
| | | | | | | 5,334,278 | |
| | | | | | | | |
|
Multi-National—1.3% | |
Asian Development Bank
5.500%, 06/27/16 | | | 3,850,000 | | | | 4,305,866 | |
European Bank for Reconstruction & Development
1.000%, 06/15/18 | | | 3,564,000 | | | | 3,471,371 | |
European Investment Bank | | | | | | | | |
1.125%, 04/15/15 | | | 1,900,000 | | | | 1,919,824 | |
1.625%, 06/15/17 (b) | | | 1,975,000 | | | | 2,007,358 | |
4.000%, 02/16/21 (b) | | | 1,700,000 | | | | 1,829,495 | |
4.875%, 02/15/36 | | | 3,700,000 | | | | 4,060,112 | |
5.125%, 05/30/17 (b) | | | 1,750,000 | | | | 1,983,274 | |
Inter-American Development Bank | | | | | | | | |
2.375%, 08/15/17 | | | 2,000,000 | | | | 2,087,197 | |
6.800%, 10/15/25 | | | 500,000 | | | | 632,754 | |
7.000%, 06/15/25 | | | 200,000 | | | | 257,514 | |
International Bank for Reconstruction & Development | | | | | | | | |
2.375%, 05/26/15 | | | 1,420,000 | | | | 1,460,794 | |
7.625%, 01/19/23 | | | 1,400,000 | | | | 1,886,705 | |
8.875%, 03/01/26 | | | 535,000 | | | | 783,585 | |
| | | | | | | | |
| | | | | | | 26,685,849 | |
| | | | | | | | |
|
Office/Business Equipment—0.1% | |
Xerox Corp.
6.350%, 05/15/18 (b) | | | 2,550,000 | | | | 2,949,818 | |
| | | | | | | | |
|
Oil & Gas—1.6% | |
Anadarko Petroleum Corp.
6.375%, 09/15/17 | | | 2,445,000 | | | | 2,802,702 | |
Apache Finance Canada Corp.
7.750%, 12/15/29 | | | 300,000 | | | | 387,009 | |
Canadian Natural Resources, Ltd.
6.250%, 03/15/38 | | | 1,800,000 | | | | 2,019,375 | |
Chevron Corp.
3.191%, 06/24/23 | | | 3,025,000 | | | | 2,908,166 | |
ConocoPhillips Canada Funding Co. I
5.950%, 10/15/36 | | | 1,550,000 | | | | 1,800,969 | |
ConocoPhillips Holding Co.
6.950%, 04/15/29 (b) | | | 700,000 | | | | 881,273 | |
Devon Energy Corp.
6.300%, 01/15/19 | | | 850,000 | | | | 985,962 | |
Marathon Oil Corp.
6.600%, 10/01/37 | | | 2,000,000 | | | | 2,380,450 | |
Petrobras International Finance Co. | | | | | | | | |
2.875%, 02/06/15 (b) | | | 2,900,000 | | | | 2,934,139 | |
6.125%, 10/06/16 | | | 600,000 | | | | 650,746 | |
Petroleos Mexicanos
4.875%, 03/15/15 (b) | | | 2,700,000 | | | | 2,808,000 | |
Shell International Finance B.V.
4.300%, 09/22/19 | | | 1,000,000 | | | | 1,096,676 | |
Statoil ASA
6.700%, 01/15/18 | | | 300,000 | | | | 353,963 | |
Suncor Energy, Inc.
6.100%, 06/01/18 (b) | | | 2,500,000 | | | | 2,890,187 | |
Total Capital International S.A.
2.700%, 01/25/23 | | | 3,000,000 | | | | 2,764,719 | |
Transocean, Inc.
6.375%, 12/15/21 | | | 2,035,000 | | | | 2,280,935 | |
XTO Energy, Inc.
6.500%, 12/15/18 | | | 1,600,000 | | | | 1,934,055 | |
| | | | | | | | |
| | | | | | | 31,879,326 | |
| | | | | | | | |
|
Oil & Gas Services—0.2% | |
Weatherford International, Ltd. | | | | | | | | |
4.500%, 04/15/22 (b) | | | 2,300,000 | | | | 2,317,738 | |
9.625%, 03/01/19 | | | 1,500,000 | | | | 1,919,417 | |
| | | | | | | | |
| | | | | | | 4,237,155 | |
| | | | | | | | |
|
Pharmaceuticals—1.0% | |
Abbott Laboratories
5.125%, 04/01/19 | | | 1,073,000 | | | | 1,200,771 | |
AbbVie, Inc.
4.400%, 11/06/42 | | | 3,200,000 | | | | 2,979,410 | |
AstraZeneca plc
5.400%, 06/01/14 | | | 639,000 | | | | 652,375 | |
Bristol-Myers Squibb Co.
5.875%, 11/15/36 | | | 2,000,000 | | | | 2,297,699 | |
See accompanying notes to financial statements.
MSF-12
Metropolitan Series Fund
Barclays Aggregate Bond Index Portfolio
Schedule of Investments as of December 31, 2013
Corporate Bonds & Notes—(Continued)
| | | | | | | | |
| Security Description | | Principal
Amount* | | | Value | |
|
Pharmaceuticals—(Continued) | |
Eli Lilly & Co.
4.200%, 03/06/14 | | | 900,000 | | | $ | 905,917 | |
Express Scripts Holding Co.
6.125%, 11/15/41 | | | 1,520,000 | | | | 1,714,482 | |
GlaxoSmithKline Capital, Inc.
6.375%, 05/15/38 | | | 2,100,000 | | | | 2,556,245 | |
Johnson & Johnson | | | | | | | | |
5.950%, 08/15/37 | | | 910,000 | | | | 1,086,419 | |
6.950%, 09/01/29 (b) | | | 250,000 | | | | 328,461 | |
Merck & Co., Inc.
6.550%, 09/15/37 | | | 1,000,000 | | | | 1,238,557 | |
Merck Sharp & Dohme Corp.
5.950%, 12/01/28 | | | 300,000 | | | | 350,197 | |
Novartis Capital Corp.
4.400%, 04/24/20 | | | 900,000 | | | | 976,959 | |
Sanofi
4.000%, 03/29/21 | | | 2,775,000 | | | | 2,897,847 | |
Wyeth LLC
5.500%, 02/15/16 | | | 1,700,000 | | | | 1,863,785 | |
| | | | | | | | |
| | | | | | | 21,049,124 | |
| | | | | | | | |
|
Pipelines—0.7% | |
El Paso Natural Gas Co. LLC
8.375%, 06/15/32 | | | 220,000 | | | | 281,721 | |
Energy Transfer Partners L.P.
4.650%, 06/01/21 | | | 1,950,000 | | | | 2,004,466 | |
Enterprise Products Operating LLC
6.300%, 09/15/17 | | | 1,900,000 | | | | 2,194,918 | |
Kinder Morgan Energy Partners L.P.
6.500%, 02/01/37 | | | 2,000,000 | | | | 2,205,025 | |
Plains All American Pipeline L.P. / PAA Finance Corp.
6.500%, 05/01/18 | | | 2,485,000 | | | | 2,903,216 | |
Tennessee Gas Pipeline Co. LLC | | | | | | | | |
7.000%, 10/15/28 | | | 1,050,000 | | | | 1,243,574 | |
7.625%, 04/01/37 | | | 640,000 | | | | 805,717 | |
TransCanada PipeLines, Ltd.
6.200%, 10/15/37 | | | 1,800,000 | | | | 2,058,478 | |
| | | | | | | | |
| | | | | | | 13,697,115 | |
| | | | | | | | |
|
Real Estate—0.0% | |
Regency Centers L.P. | | | | | | | | |
5.250%, 08/01/15 | | | 850,000 | | | | 899,874 | |
| | | | | | | | |
|
Real Estate Investment Trusts—0.5% | |
AvalonBay Communities, Inc. | | | | | | | | |
6.100%, 03/15/20 | | | 860,000 | | | | 984,363 | |
Boston Properties L.P. | | | | | | | | |
3.850%, 02/01/23 | | | 2,950,000 | | | | 2,881,950 | |
ERP Operating L.P. | | | | | | | | |
5.750%, 06/15/17 (b) | | | 900,000 | | | | 1,005,199 | |
HCP, Inc. | | | | | | | | |
5.375%, 02/01/21 | | | 2,591,000 | | | | 2,810,916 | |
Kimco Realty Corp. | | | | | | | | |
6.875%, 10/01/19 | | | 550,000 | | | | 652,568 | |
|
Real Estate Investment Trusts—(Continued) | |
Simon Property Group L.P. | | | | | | | | |
5.250%, 12/01/16 | | | 2,000,000 | | | | 2,202,985 | |
| | | | | | | | |
| | | | | | | 10,537,981 | |
| | | | | | | | |
|
Retail—0.7% | |
Costco Wholesale Corp. | | | | | | | | |
5.500%, 03/15/17 (b) | | | 465,000 | | | | 523,336 | |
Home Depot, Inc. (The) | | | | | | | | |
4.400%, 04/01/21 (b) | | | 1,450,000 | | | | 1,575,701 | |
5.400%, 03/01/16 | | | 900,000 | | | | 990,470 | |
Lowe’s Cos., Inc. | | | | | | | | |
6.875%, 02/15/28 | | | 1,000,000 | | | | 1,233,459 | |
McDonald’s Corp. | | | | | | | | |
5.350%, 03/01/18 | | | 885,000 | | | | 1,009,110 | |
Target Corp. | | | | | | | | |
6.350%, 11/01/32 | | | 1,000,000 | | | | 1,191,249 | |
Wal-Mart Stores, Inc. | | | | | | | | |
2.550%, 04/11/23 (b) | | | 4,000,000 | | | | 3,654,106 | |
5.250%, 09/01/35 | | | 935,000 | | | | 1,011,584 | |
5.625%, 04/15/41 | | | 1,900,000 | | | | 2,153,972 | |
Walgreen Co. | | | | | | | | |
5.250%, 01/15/19 | | | 900,000 | | | | 1,014,772 | |
| | | | | | | | |
| | | | | | | 14,357,759 | |
| | | | | | | | |
|
Semiconductors—0.1% | |
Intel Corp. | | | | | | | | |
2.700%, 12/15/22 (b) | | | 2,000,000 | | | | 1,847,664 | |
| | | | | | | | |
|
Software—0.4% | |
Adobe Systems, Inc. | | | | | | | | |
4.750%, 02/01/20 | | | 2,200,000 | | | | 2,354,782 | |
Microsoft Corp. | | | | | | | | |
4.200%, 06/01/19 | | | 2,700,000 | | | | 2,965,928 | |
Oracle Corp. | | | | | | | | |
5.250%, 01/15/16 | | | 2,000,000 | | | | 2,185,364 | |
| | | | | | | | |
| | | | | | | 7,506,074 | |
| | | | | | | | |
|
Telecommunications—1.7% | |
America Movil S.A.B. de C.V. | | | | | | | | |
2.375%, 09/08/16 | | | 2,875,000 | | | | 2,945,117 | |
AT&T Mobility LLC | | | | | | | | |
7.125%, 12/15/31 | | | 100,000 | | | | 123,012 | |
AT&T, Inc. | | | | | | | | |
5.800%, 02/15/19 | | | 1,700,000 | | | | 1,955,942 | |
6.300%, 01/15/38 | | | 1,300,000 | | | | 1,429,291 | |
British Telecommunications plc | | | | | | | | |
9.625%, 12/15/30 | | | 1,000,000 | | | | 1,502,604 | |
Cellco Partnership / Verizon Wireless Capital LLC | | | | | | | | |
8.500%, 11/15/18 | | | 750,000 | | | | 953,692 | |
Cisco Systems, Inc. | | | | | | | | |
5.500%, 01/15/40 (b) | | | 2,000,000 | | | | 2,130,803 | |
Deutsche Telekom International Finance B.V. | | | | | | | | |
5.750%, 03/23/16 | | | 460,000 | | | | 505,162 | |
8.750%, 06/15/30 | | | 1,000,000 | | | | 1,396,802 | |
See accompanying notes to financial statements.
MSF-13
Metropolitan Series Fund
Barclays Aggregate Bond Index Portfolio
Schedule of Investments as of December 31, 2013
Corporate Bonds & Notes—(Continued)
| | | | | | | | |
| Security Description | | Principal
Amount* | | | Value | |
|
Telecommunications—(Continued) | |
Orange S.A. | | | | | | | | |
2.750%, 09/14/16 (b) | | | 2,857,000 | | | $ | 2,961,566 | |
Rogers Communications, Inc. | | | | | | | | |
6.800%, 08/15/18 | | | 800,000 | | | | 943,976 | |
Telefonica Emisiones S.A.U. | | | | | | | | |
6.221%, 07/03/17 | | | 1,400,000 | | | | 1,576,930 | |
Verizon Communications, Inc. | | | | | | | | |
4.600%, 04/01/21 (b) | | | 2,400,000 | | | | 2,542,846 | |
5.150%, 09/15/23 | | | 3,510,000 | | | | 3,756,822 | |
6.100%, 04/15/18 | | | 1,600,000 | | | | 1,854,869 | |
6.550%, 09/15/43 | | | 3,304,000 | | | | 3,865,090 | |
Verizon New York, Inc. | | | | | | | | |
7.375%, 04/01/32 | | | 500,000 | | | | 572,790 | |
Vodafone Group plc | | | | | | | | |
6.150%, 02/27/37 | | | 2,170,000 | | | | 2,363,518 | |
| | | | | | | | |
| | | | | | | 33,380,832 | |
| | | | | | | | |
|
Transportation—0.3% | |
CSX Corp. | | | | | | | | |
6.150%, 05/01/37 | | | 1,600,000 | | | | 1,804,922 | |
7.900%, 05/01/17 | | | 500,000 | | | | 592,731 | |
Norfolk Southern Corp. | | | | | | | | |
3.000%, 04/01/22 | | | 1,911,000 | | | | 1,811,714 | |
5.590%, 05/17/25 | | | 28,000 | | | | 30,727 | |
Union Pacific Corp. | | | | | | | | |
6.625%, 02/01/29 | | | 1,200,000 | | | | 1,448,146 | |
United Parcel Service, Inc. | | | | | | | | |
5.125%, 04/01/19 | | | 760,000 | | | | 864,061 | |
| | | | | | | | |
| | | | | | | 6,552,301 | |
| | | | | | | | |
Total Corporate Bonds & Notes
(Cost $475,738,531) | | | | | | | 485,263,496 | |
| | | | | | | | |
| | |
| Foreign Government—1.7% | | | | | | | | |
|
Provincial—0.5% | |
Province of British Columbia | | | | | | | | |
2.000%, 10/23/22 (b) | | | 1,970,000 | | | | 1,771,581 | |
Province of Nova Scotia | | | | | | | | |
5.125%, 01/26/17 | | | 900,000 | | | | 1,006,261 | |
9.250%, 03/01/20 | | | 250,000 | | | | 329,789 | |
Province of Ontario | | | | | | | | |
2.450%, 06/29/22 (b) | | | 4,000,000 | | | | 3,699,080 | |
4.400%, 04/14/20 (b) | | | 2,100,000 | | | | 2,304,439 | |
Province of Quebec | | | | | | | | |
7.500%, 07/15/23 | | | 350,000 | | | | 449,328 | |
| | | | | | | | |
| | | | | | | 9,560,478 | |
| | | | | | | | |
|
Sovereign—1.2% | |
Brazilian Government International Bonds | | | | | | | | |
6.000%, 01/17/17 | | | 3,755,000 | | | | 4,181,192 | |
7.125%, 01/20/37 | | | 1,650,000 | | | | 1,897,500 | |
Colombia Government International Bond | | | | | | | | |
8.125%, 05/21/24 | | | 1,500,000 | | | | 1,925,625 | |
|
Sovereign—(Continued) | |
Italy Government International Bond | | | | | | | | |
4.500%, 01/21/15 | | | 1,475,000 | | | | 1,527,004 | |
Mexico Government International Bonds | | | | | | | | |
6.750%, 09/27/34 | | | 1,050,000 | | | | 1,237,425 | |
8.000%, 09/24/22 | | | 2,200,000 | | | | 2,882,000 | |
Panama Government International Bond | | | | | | | | |
5.200%, 01/30/20 | | | 1,370,000 | | | | 1,498,095 | |
Peruvian Government International Bond | | | | | | | | |
8.750%, 11/21/33 | | | 1,450,000 | | | | 2,077,125 | |
Philippine Government International Bond | | | | | | | | |
5.000%, 01/13/37 | | | 1,740,000 | | | | 1,807,425 | |
Republic of Korea | | | | | | | | |
7.125%, 04/16/19 | | | 1,600,000 | | | | 1,950,583 | |
Turkey Government International Bonds | | | | | | | | |
6.250%, 09/26/22 | | | 1,607,000 | | | | 1,654,406 | |
7.375%, 02/05/25 | | | 1,473,000 | | | | 1,590,104 | |
| | | | | | | | |
| | | | | | | 24,228,484 | |
| | | | | | | | |
Total Foreign Government
(Cost $34,555,576) | | | | | | | 33,788,962 | |
| | | | | | | | |
|
| Mortgage-Backed Securities—1.6% | |
|
Commercial Mortgage-Backed Securities—1.6% | |
Bear Stearns Commercial Mortgage Securities Trust | | | | | | | | |
5.540%, 09/11/41 | | | 1,000,000 | | | | 1,091,581 | |
5.694%, 06/11/50 (a) | | | 1,500,000 | | | | 1,681,592 | |
Citigroup / Deutsche Bank Commercial Mortgage Trust | | | | | | | | |
5.218%, 07/15/44 (a) | | | 2,000,000 | | | | 2,118,607 | |
Citigroup Commercial Mortgage Trust | | | | | | | | |
4.733%, 10/15/41 | | | 987,948 | | | | 1,005,154 | |
5.383%, 04/15/40 (a) | | | 737,362 | | | | 743,126 | |
5.431%, 10/15/49 | | | 1,500,000 | | | | 1,641,209 | |
5.778%, 03/15/49 (a) | | | 1,800,000 | | | | 1,953,433 | |
Commercial Mortgage Pass-Through Certificates | | | | | | | | |
5.800%, 12/10/49 (a) | | | 2,400,000 | | | | 2,709,418 | |
Credit Suisse First Boston Mortgage Securities Corp. | | | | | | | | |
4.691%, 10/15/39 | | | 301,662 | | | | 306,432 | |
GMAC Commercial Mortgage Securities, Inc. | | | | | | | | |
4.697%, 05/10/43 | | | 1,500,000 | | | | 1,553,817 | |
GS Mortgage Securities Corp. II | | | | | | | | |
4.751%, 07/10/39 | | | 1,974,148 | | | | 2,051,042 | |
GS Mortgage Securities Trust | | | | | | | | |
3.377%, 05/10/45 | | | 2,750,000 | | | | 2,733,921 | |
4.243%, 08/10/46 | | | 966,000 | | | | 996,781 | |
JPMorgan Chase Commercial Mortgage Securities Trust | | | | | | | | |
5.420%, 01/15/49 | | | 2,500,000 | | | | 2,744,542 | |
5.440%, 06/12/47 | | | 890,000 | | | | 977,787 | |
LB-UBS Commercial Mortgage Trust | | | | | | | | |
5.156%, 02/15/31 | | | 2,500,000 | | | | 2,669,249 | |
Merrill Lynch Mortgage Trust | | | | | | | | |
4.855%, 10/12/41 (a) | | | 480,789 | | | | 487,501 | |
See accompanying notes to financial statements.
MSF-14
Metropolitan Series Fund
Barclays Aggregate Bond Index Portfolio
Schedule of Investments as of December 31, 2013
Mortgage-Backed Securities—(Continued)
| | | | | | | | |
| Security Description | |
Principal
Amount* | | | Value | |
|
Commercial Mortgage-Backed Securities—(Continued) | |
Morgan Stanley Capital I Trust | | | | | | | | |
4.989%, 08/13/42 | | | 1,000,000 | | | $ | 1,046,567 | |
5.648%, 06/11/42 (a) | | | 2,000,000 | | | | 2,250,321 | |
5.910%, 06/11/49 (a) | | | 1,430,000 | | | | 1,597,961 | |
WF-RBS Commercial Mortgage Trust | |
3.488%, 06/15/46 | | | 1,054,000 | | | | 999,099 | |
| | | | | | | | |
Total Mortgage-Backed Securities
(Cost $31,914,016) | | | | | | | 33,359,140 | |
| | | | | | | | |
|
| Municipals—0.6% | |
Los Angeles Community College District | |
6.750%, 08/01/49 | | | 2,210,000 | | | | 2,770,522 | |
Los Angeles, Unified School District, Build America Bonds | | | | | | | | |
6.758%, 07/01/34 | | | 2,160,000 | | | | 2,654,943 | |
Municipal Electric Authority of Georgia | |
6.637%, 04/01/57 | | | 2,000,000 | | | | 2,102,280 | |
Oregon School Boards Association | |
5.680%, 06/30/28 | | | 1,900,000 | | | | 2,095,453 | |
State of California | |
7.300%, 10/01/39 | | | 2,000,000 | | | | 2,514,200 | |
State of Illinois | |
5.100%, 06/01/33 | | | 1,230,000 | | | | 1,142,596 | |
| | | | | | | | |
Total Municipals
(Cost $12,079,151) | | | | | | | 13,279,994 | |
| | | | | | | | |
|
| Asset-Backed Securities—0.3% | |
|
Asset-Backed - Automobile—0.2% | |
CarMax Auto Owner Trust | |
0.970%, 04/16/18 | | | 3,145,000 | | | | 3,151,760 | |
Honda Auto Receivables Owner Trust | |
0.770%, 05/15/17 | | | 355,000 | | | | 355,273 | |
| | | | | | | | |
| | | | | | | 3,507,033 | |
| | | | | | | | |
|
Asset-Backed - Credit Card—0.1% | |
Citibank Credit Card Issuance Trust | |
4.850%, 03/10/17 | | | 2,500,000 | | | | 2,627,215 | |
| | | | | | | | |
|
Asset-Backed - Home Equity—0.0% | |
Centex Home Equity Loan Trust | |
4.250%, 12/25/31 | | | 56,617 | | | | 56,731 | |
| | | | | | | | |
Total Asset-Backed Securities
(Cost $6,411,950) | | | | | | | 6,190,979 | |
| | | | | | | | |
|
| Short-Term Investments—18.5% | |
|
Discount Notes—0.8% | |
Federal Home Loan Bank | |
0.001%, 01/03/14 (c) | | | 1,000,000 | | | | 1,000,000 | |
0.020%, 01/13/14 (c) | | | 3,900,000 | | | | 3,899,974 | |
|
Discount Notes—(Continued) | |
Federal Home Loan Bank | |
0.091%, 03/12/14 (c) | | | 2,800,000 | | | $ | 2,799,510 | |
0.101%, 04/30/14 (c) | | | 6,300,000 | | | | 6,297,917 | |
0.127%, 01/06/14 (c) | | | 1,400,000 | | | | 1,399,976 | |
| | | | | | | | |
| | | | | | | 15,397,377 | |
| | | | | | | | |
|
Mutual Fund—16.7% | |
State Street Navigator Securities Lending MET Portfolio (d) | | | 335,477,699 | | | | 335,477,699 | |
| | | | | | | | |
|
U.S. Treasury—1.0% | |
U.S. Treasury Bills | | | | | | | | |
0.041%, 05/15/14 (b) (c) | | | 11,500,000 | | | | 11,498,288 | |
0.049%, 05/15/14 (b) (c) | | | 2,600,000 | | | | 2,599,536 | |
0.051%, 05/15/14 (b) (c) | | | 3,900,000 | | | | 3,899,274 | |
0.083%, 05/15/14 (b) (c) | | | 300,000 | | | | 299,908 | |
0.098%, 05/15/14 (b) (c) | | | 1,500,000 | | | | 1,499,458 | |
| | | | | | | | |
| | | | | | | 19,796,464 | |
| | | | | | | | |
Total Short-Term Investments
(Cost $370,671,540) | | | | | | | 370,671,540 | |
| | | | | | | | |
Total Investments—116.9%
(Cost $2,316,747,815) (e) | | | | | | | 2,353,046,307 | |
Other assets and liabilities
(net)—(16.9)% | | | | | | | (340,146,681 | ) |
| | | | | | | | |
| Net Assets—100.0% | | | | | | $ | 2,012,899,626 | |
| | | | | | | | |
| * | Principal amount stated in U.S. dollars unless otherwise noted. |
| (a) | Variable or floating rate security. The stated rate represents the rate at December 31, 2013. Maturity date shown for callable securities reflects the earliest possible call date. |
| (b) | All or a portion of the security was held on loan. As of December 31, 2013, the market value of securities loaned was $366,389,713 and the collateral received consisted of cash in the amount of $335,477,699 and non-cash collateral with a value of $41,849,844. The cash collateral is invested in a money market fund managed by an affiliate of the custodian. The non-cash collateral received consists primarily of government securities and bank letters of credit, and is held for the benefit of the Portfolio at the Portfolio’s custodian. The Portfolio cannot repledge or resell this collateral. As such, this collateral is excluded from the Statement of Assets and Liabilities. |
| (c) | The rate shown represents the discount rate at the time of purchase by the Portfolio. |
| (d) | Represents investment of cash collateral received from securities lending transactions. |
| (e) | As of December 31, 2013, the aggregate cost of investments for federal income tax purposes was $2,342,762,664. The aggregate unrealized appreciation and depreciation of investments were $50,682,215 and $(40,398,572), respectively, resulting in net unrealized appreciation of $10,283,643 for federal income tax purposes. |
| (ARM)— | Adjustable-Rate Mortgage |
See accompanying notes to financial statements.
MSF-15
Metropolitan Series Fund
Barclays Aggregate Bond Index Portfolio
Schedule of Investments as of December 31, 2013
Fair Value Hierarchy
Accounting principles generally accepted in the United States of America (“GAAP”) define fair market value as the price that the Portfolio would receive to sell an asset or pay to transfer a liability in an orderly transaction between market participants at the measurement date. It establishes a fair value hierarchy that prioritizes inputs to valuation methods and requires disclosure of the fair value hierarchy that segregates fair value measurements into three levels. Levels 1, 2 and 3 of the fair value hierarchy are defined as follows:
Level 1 - unadjusted quoted prices in active markets for identical investments
Level 2 - other significant observable inputs (including, but not limited to, unadjusted quoted prices for similar investments in markets that are either active or inactive; inputs other than quoted prices that are observable such as interest rates, yield curves, volatilities, prepayment speeds, loss severities, credit risks, default rates, etc.)
Level 3 - significant unobservable inputs based on the best information available in the circumstances, to the extent observable inputs are unavailable (including the Portfolio’s own assumptions in determining the fair value of investments)
The inputs or methodologies used for valuing investments are not necessarily an indication of the risk associated with investing in them. Changes to the inputs or methodologies used may result in transfers between levels, which will be recognized as of the beginning of the reporting period. Information on transfers between Level 1 and Level 2, if any, will be disclosed following the fair value hierarchy table below. A reconciliation of Level 3 securities, if any, will also be disclosed following the fair value hierarchy table. For more information about the Portfolio’s policy regarding the valuation of investments, please refer to the Notes to Financial Statements.
The following table summarizes the fair value hierarchy of the Portfolio’s investments as of December 31, 2013:
| | | | | | | | | | | | | | | | |
| Description | | Level 1 | | | Level 2 | | | Level 3 | | | Total | |
Total U.S. Treasury & Government Agencies* | | $ | — | | | $ | 1,410,492,196 | | | $ | — | | | $ | 1,410,492,196 | |
Total Corporate Bonds & Notes* | | | — | | | | 485,263,496 | | | | — | | | | 485,263,496 | |
Total Foreign Government* | | | — | | | | 33,788,962 | | | | — | | | | 33,788,962 | |
Total Mortgage-Backed Securities* | | | — | | | | 33,359,140 | | | | — | | | | 33,359,140 | |
Total Municipals | | | — | | | | 13,279,994 | | | | — | | | | 13,279,994 | |
Total Asset-Backed Securities* | | | — | | | | 6,190,979 | | | | — | | | | 6,190,979 | |
| Short-Term Investments | | | | | | | | | | | | | | | | |
Discount Notes | | | — | | | | 15,397,377 | | | | — | | | | 15,397,377 | |
Mutual Fund | | | 335,477,699 | | | | — | | | | — | | | | 335,477,699 | |
U.S. Treasury | | | — | | | | 19,796,464 | | | | — | | | | 19,796,464 | |
Total Short-Term Investments | | | 335,477,699 | | | | 35,193,841 | | | | — | | | | 370,671,540 | |
Total Investments | | $ | 335,477,699 | | | $ | 2,017,568,608 | | | $ | — | | | $ | 2,353,046,307 | |
| | | | | | | | | | | | | | | | | |
Collateral for securities loaned (Liability) | | $ | — | | | $ | (335,477,699 | ) | | $ | — | | | $ | (335,477,699 | ) |
| * | See Schedule of Investments for additional detailed categorizations. |
See accompanying notes to financial statements.
MSF-16
Metropolitan Series Fund
Barclays Aggregate Bond Index Portfolio
Statement of Assets and Liabilities
December 31, 2013
| | | | |
Assets | | | | |
Investments at value (a) (b) | | $ | 2,353,046,307 | |
Cash | | | 127,260 | |
Receivable for: | | | | |
Investments sold | | | 1,653,018 | |
Fund shares sold | | | 6,643,029 | |
Principal paydowns | | | 3,982 | |
Interest | | | 14,541,946 | |
Prepaid expenses | | | 4,978 | |
| | | | |
Total Assets | | | 2,376,020,520 | |
Liabilities | | | | |
Collateral for securities loaned | | | 335,477,699 | |
Payables for: | | | | |
Investments purchased | | | 25,927,318 | |
Fund shares redeemed | | | 834,883 | |
Accrued expenses: | | | | |
Management fees | | | 411,072 | |
Distribution and service fees | | | 257,049 | |
Deferred trustees’ fees | | | 48,554 | |
Other expenses | | | 164,319 | |
| | | | |
Total Liabilities | | | 363,120,894 | |
| | | | |
Net Assets | | $ | 2,012,899,626 | |
| | | | |
Net assets consist of: | | | | |
Paid in surplus | | $ | 1,970,186,289 | |
Undistributed net investment income | | | 61,017,865 | |
Accumulated net realized loss | | | (54,603,020 | ) |
Unrealized appreciation on investments | | | 36,298,492 | |
| | | | |
Net Assets | | $ | 2,012,899,626 | |
| | | | |
Net Assets | | | | |
Class A | | $ | 797,424,939 | |
Class B | | | 964,221,966 | |
Class E | | | 82,164,206 | |
Class G | | | 169,088,515 | |
Capital Shares Outstanding* | | | | |
Class A | | | 72,963,547 | |
Class B | | | 89,941,138 | |
Class E | | | 7,559,514 | |
Class G | | | 15,805,839 | |
Net Asset Value, Offering Price and Redemption Price Per Share | | | | |
Class A | | $ | 10.93 | |
Class B | | | 10.72 | |
Class E | | | 10.87 | |
Class G | | | 10.70 | |
| * | The Portfolio is authorized to issue an unlimited number of shares. |
| (a) | Identified cost of investments was $2,316,747,815. |
| (b) | Includes securities loaned at value of $366,389,713. |
Statement of Operations
Year Ended December 31, 2013
| | | | |
Investment Income | | | | |
Interest | | $ | 54,616,525 | |
Securities lending income | | | 381,953 | |
| | | | |
Total investment income | | | 54,998,478 | |
Expenses | | | | |
Management fees | | | 4,703,130 | |
Administration fees | | | 33,899 | |
Custodian and accounting fees | | | 211,311 | |
Distribution and service fees—Class B | | | 2,365,942 | |
Distribution and service fees—Class E | | | 127,295 | |
Distribution and service fees—Class G | | | 485,658 | |
Audit and tax services | | | 80,300 | |
Legal | | | 27,754 | |
Trustees’ fees and expenses | | | 44,482 | |
Shareholder reporting | | | 169,940 | |
Insurance | | | 9,280 | |
Miscellaneous | | | 14,925 | |
| | | | |
Total expenses | | | 8,273,916 | |
Less management fee waiver | | | (113,128 | ) |
| | | | |
Net expenses | | | 8,160,788 | |
| | | | |
Net Investment Income | | | 46,837,690 | |
| | | | |
Net Realized and Unrealized Gain (Loss) | | | | |
Net realized gain on investments | | | 2,850,150 | |
| | | | |
Net change in unrealized depreciation on investments | | | (95,736,003 | ) |
| | | | |
Net realized and unrealized loss | | | (92,885,853 | ) |
| | | | |
Net Decrease in Net Assets From Operations | | $ | (46,048,163 | ) |
| | | | |
See accompanying notes to financial statements.
MSF-17
Metropolitan Series Fund
Barclays Aggregate Bond Index Portfolio
Statements of Changes in Net Assets
| | | | | | | | |
| | | Year Ended
December 31,
2013 | | | Year Ended
December 31,
2012 | |
Increase (Decrease) in Net Assets: | | | | | | | | |
From Operations | | | | | | | | |
Net investment income | | $ | 46,837,690 | | | $ | 49,926,727 | |
Net realized gain | | | 2,850,150 | | | | 8,752,872 | |
Net change in unrealized appreciation (depreciation) | | | (95,736,003 | ) | | | 7,863,014 | |
| | | | | | | | |
Increase (decrease) in net assets from operations | | | (46,048,163 | ) | | | 66,542,613 | |
| | | | | | | | |
From Distributions to Shareholders | | | | | | | | |
Net investment income | | | | | | | | |
Class A | | | (23,062,199 | ) | | | (23,832,152 | ) |
Class B | | | (31,382,216 | ) | | | (32,987,091 | ) |
Class E | | | (2,913,429 | ) | | | (3,304,928 | ) |
Class G | | | (5,184,441 | ) | | | (5,043,307 | ) |
| | | | | | | | |
Total distributions | | | (62,542,285 | ) | | | (65,167,478 | ) |
| | | | | | | | |
Increase in net assets from capital share transactions | | | 304,136,062 | | | | 66,082,932 | |
| | | | | | | | |
Total increase in net assets | | | 195,545,614 | | | | 67,458,067 | |
| | |
Net Assets | | | | | | | | |
Beginning of period | | | 1,817,354,012 | | | | 1,749,895,945 | |
| | | | | | | | |
End of period | | $ | 2,012,899,626 | | | $ | 1,817,354,012 | |
| | | | | | | | |
| | |
Undistributed Net Investment Income | | | | | | | | |
End of period | | $ | 61,017,865 | | | $ | 62,261,379 | |
| | | | | | | | |
Other Information:
Capital Shares
Transactions in capital shares were as follows:
| | | | | | | | | | | | | | | | |
| | | Year Ended
December 31, 2013 | | | Year Ended
December 31, 2012 | |
| | | Shares | | | Value | | | Shares | | | Value | |
Class A | | | | | | | | | | | | | | | | |
Sales | | | 26,343,840 | | | $ | 291,120,706 | | | | 6,215,978 | | | $ | 71,885,257 | |
Reinvestments | | | 2,048,153 | | | | 23,062,199 | | | | 2,112,779 | | | | 23,832,152 | |
Redemptions | | | (10,424,131 | ) | | | (115,648,870 | ) | | | (7,813,726 | ) | | | (89,971,243 | ) |
| | | | | | | | | | | | | | | | |
Net increase | | | 17,967,862 | | | $ | 198,534,035 | | | | 515,031 | | | $ | 5,746,166 | |
| | | | | | | | | | | | | | | | |
Class B | | | | | | | | | | | | | | | | |
Sales | | | 11,245,979 | | | $ | 122,855,536 | | | | 9,806,090 | | | $ | 111,325,221 | |
Reinvestments | | | 2,834,888 | | | | 31,382,216 | | | | 2,974,490 | | | | 32,987,091 | |
Redemptions | | | (6,304,510 | ) | | | (68,745,878 | ) | | | (9,211,399 | ) | | | (104,120,645 | ) |
| | | | | | | | | | | | | | | | |
Net increase | | | 7,776,357 | | | $ | 85,491,874 | | | | 3,569,181 | | | $ | 40,191,667 | |
| | | | | | | | | | | | | | | | |
Class E | | | | | | | | | | | | | | | | |
Sales | | | 502,524 | | | $ | 5,578,029 | | | | 497,337 | | | $ | 5,722,865 | |
Reinvestments | | | 259,896 | | | | 2,913,429 | | | | 294,295 | | | | 3,304,928 | |
Redemptions | | | (845,983 | ) | | | (9,375,183 | ) | | | (1,116,500 | ) | | | (12,774,851 | ) |
| | | | | | | | | | | | | | | | |
Net decrease | | | (83,563 | ) | | $ | (883,725 | ) | | | (324,868 | ) | | $ | (3,747,058 | ) |
| | | | | | | | | | | | | | | | |
Class G | | | | | | | | | | | | | | | | |
Sales | | | 4,996,877 | | | $ | 54,265,414 | | | | 3,841,573 | | | $ | 43,481,589 | |
Reinvestments | | | 469,180 | | | | 5,184,441 | | | | 455,172 | | | | 5,043,307 | |
Redemptions | | | (3,533,045 | ) | | | (38,455,977 | ) | | | (2,181,267 | ) | | | (24,632,739 | ) |
| | | | | | | | | | | | | | | | |
Net increase | | | 1,933,012 | | | $ | 20,993,878 | | | | 2,115,478 | | | $ | 23,892,157 | |
| | | | | | | | | | | | | | | | |
Increase derived from capital shares transactions | | | | | | $ | 304,136,062 | | | | | | | $ | 66,082,932 | |
| | | | | | | | | | | | | | | | |
See accompanying notes to financial statements.
MSF-18
Metropolitan Series Fund
Barclays Aggregate Bond Index Portfolio
Financial Highlights
| | | | | | | | | | | | | | | | | | | | |
| Selected per share data | | | | | | | | | | | | | | | |
| | | Class A | |
| | | Year Ended December 31, | |
| | | 2013 | | | 2012 | | | 2011 | | | 2010 | | | 2009 | |
Net Asset Value, Beginning of Period | | $ | 11.59 | | | $ | 11.58 | | | $ | 11.17 | | | $ | 10.94 | | | $ | 11.10 | |
| | | | | | | | | | | | | | | | | | | | |
Income (Loss) from Investment Operations | | | | | | | | | | | | | | | | | | | | |
Net investment income (a) | | | 0.29 | | | | 0.34 | | | | 0.38 | | | | 0.40 | | | | 0.47 | |
Net realized and unrealized gain (loss) on investments | | | (0.55 | ) | | | 0.10 | | | | 0.43 | | | | 0.25 | | | | 0.07 | |
| | | | | | | | | | | | | | | | | | | | |
Total from investment operations | | | (0.26 | ) | | | 0.44 | | | | 0.81 | | | | 0.65 | | | | 0.54 | |
| | | | | | | | | | | | | | | | | | | | |
Less Distributions | | | | | | | | | | | | | | | | | | | | |
Distributions from net investment income | | | (0.40 | ) | | | (0.43 | ) | | | (0.40 | ) | | | (0.42 | ) | | | (0.70 | ) |
| | | | | | | | | | | | | | | | | | | | |
Total distributions | | | (0.40 | ) | | | (0.43 | ) | | | (0.40 | ) | | | (0.42 | ) | | | (0.70 | ) |
| | | | | | | | | | | | | | | | | | | | |
Net Asset Value, End of Period | | $ | 10.93 | | | $ | 11.59 | | | $ | 11.58 | | | $ | 11.17 | | | $ | 10.94 | |
| | | | | | | | | | | | | | | | | | | | |
Total Return (%) (b) | | | (2.33 | ) | | | 3.90 | | | | 7.51 | | | | 6.05 | | | | 5.17 | |
| | | | | |
Ratios/Supplemental Data | | | | | | | | | | | | | | | | | | | | |
Gross ratio of expenses to average net assets (%) | | | 0.28 | | | | 0.29 | | | | 0.28 | | | | 0.28 | | | | 0.30 | |
Net ratio of expenses to average net assets (%) (c) | | | 0.28 | | | | 0.28 | | | | 0.28 | | | | 0.27 | | | | 0.29 | |
Ratio of net investment income to average net assets (%) | | | 2.65 | | | | 2.92 | | | | 3.36 | | | | 3.63 | | | | 4.34 | |
Portfolio turnover rate (%) | | | 18 | | | | 24 | | | | 23 | | | | 21 | | | | 17 | |
Net assets, end of period (in millions) | | $ | 797.4 | | | $ | 637.3 | | | $ | 630.8 | | | $ | 662.7 | | | $ | 553.6 | |
| | | | | | | | | | | | | | | | | | | | |
| | | Class B | |
| | | Year Ended December 31, | |
| | | 2013 | | | 2012 | | | 2011 | | | 2010 | | | 2009 | |
Net Asset Value, Beginning of Period | | $ | 11.37 | | | $ | 11.37 | | | $ | 10.97 | | | $ | 10.76 | | | $ | 10.92 | |
| | | | | | | | | | | | | | | | | | | | |
Income (Loss) from Investment Operations | | | | | | | | | | | | | | | | | | | | |
Net investment income (a) | | | 0.26 | | | | 0.30 | | | | 0.34 | | | | 0.37 | | | | 0.43 | |
Net realized and unrealized gain (loss) on investments | | | (0.54 | ) | | | 0.10 | | | | 0.44 | | | | 0.23 | | | | 0.08 | |
| | | | | | | | | | | | | | | | | | | | |
Total from investment operations | | | (0.28 | ) | | | 0.40 | | | | 0.78 | | | | 0.60 | | | | 0.51 | |
| | | | | | | | | | | | | | | | | | | | |
Less Distributions | | | | | | | | | | | | | | | | | | | | |
Distributions from net investment income | | | (0.37 | ) | | | (0.40 | ) | | | (0.38 | ) | | | (0.39 | ) | | | (0.67 | ) |
| | | | | | | | | | | | | | | | | | | | |
Total distributions | | | (0.37 | ) | | | (0.40 | ) | | | (0.38 | ) | | | (0.39 | ) | | | (0.67 | ) |
| | | | | | | | | | | | | | | | | | | | |
Net Asset Value, End of Period | | $ | 10.72 | | | $ | 11.37 | | | $ | 11.37 | | | $ | 10.97 | | | $ | 10.76 | |
| | | | | | | | | | | | | | | | | | | | |
Total Return (%) (b) | | | (2.53 | ) | | | 3.62 | | | | 7.28 | | | | 5.69 | | | | 4.98 | |
| | | | | |
Ratios/Supplemental Data | | | | | | | | | | | | | | | | | | | | |
Gross ratio of expenses to average net assets (%) | | | 0.53 | | | | 0.54 | | | | 0.53 | | | | 0.53 | | | | 0.55 | |
Net ratio of expenses to average net assets (%) (c) | | | 0.53 | | | | 0.53 | | | | 0.53 | | | | 0.52 | | | | 0.54 | |
Ratio of net investment income to average net assets (%) | | | 2.40 | | | | 2.67 | | | | 3.12 | | | | 3.38 | | | | 4.06 | |
Portfolio turnover rate (%) | | | 18 | | | | 24 | | | | 23 | | | | 21 | | | | 17 | |
Net assets, end of period (in millions) | | $ | 964.2 | | | $ | 934.5 | | | $ | 893.8 | | | $ | 806.2 | | | $ | 637.0 | |
Please see following page for Financial Highlights footnote legend.
See accompanying notes to financial statements.
MSF-19
Metropolitan Series Fund
Barclays Aggregate Bond Index Portfolio
Financial Highlights
| | | | | | | | | | | | | | | | | | | | |
| Selected per share data | | | | | | | | | | | | | | | |
| | | Class E | |
| | | Year Ended December 31, | |
| | | 2013 | | | 2012 | | | 2011 | | | 2010 | | | 2009 | |
Net Asset Value, Beginning of Period | | $ | 11.52 | | | $ | 11.52 | | | $ | 11.11 | | | $ | 10.89 | | | $ | 11.04 | |
| | | | | | | | | | | | | | | | | | | | |
Income (Loss) from Investment Operations | | | | | | | | | | | | | | | | | | | | |
Net investment income (a) | | | 0.28 | | | | 0.32 | | | | 0.36 | | | | 0.39 | | | | 0.45 | |
Net realized and unrealized gain (loss) on investments | | | (0.55 | ) | | | 0.09 | | | | 0.44 | | | | 0.23 | | | | 0.08 | |
| | | | | | | | | | | | | | | | | | | | |
Total from investment operations | | | (0.27 | ) | | | 0.41 | | | | 0.80 | | | | 0.62 | | | | 0.53 | |
| | | | | | | | | | | | | | | | | | | | |
Less Distributions | | | | | | | | | | | | | | | | | | | | |
Distributions from net investment income | | | (0.38 | ) | | | (0.41 | ) | | | (0.39 | ) | | | (0.40 | ) | | | (0.68 | ) |
| | | | | | | | | | | | | | | | | | | | |
Total distributions | | | (0.38 | ) | | | (0.41 | ) | | | (0.39 | ) | | | (0.40 | ) | | | (0.68 | ) |
| | | | | | | | | | | | | | | | | | | | |
Net Asset Value, End of Period | | $ | 10.87 | | | $ | 11.52 | | | $ | 11.52 | | | $ | 11.11 | | | $ | 10.89 | |
| | | | | | | | | | | | | | | | | | | | |
Total Return (%) (b) | | | (2.41 | ) | | | 3.68 | | | | 7.38 | | | | 5.82 | | | | 5.13 | |
| | | | | |
Ratios/Supplemental Data | | | | | | | | | | | | | | | | | | | | |
Gross ratio of expenses to average net assets (%) | | | 0.43 | | | | 0.44 | | | | 0.43 | | | | 0.43 | | | | 0.45 | |
Net ratio of expenses to average net assets (%) (c) | | | 0.43 | | | | 0.43 | | | | 0.43 | | | | 0.42 | | | | 0.44 | |
Ratio of net investment income to average net assets (%) | | | 2.50 | | | | 2.77 | | | | 3.21 | | | | 3.49 | | | | 4.18 | |
Portfolio turnover rate (%) | | | 18 | | | | 24 | | | | 23 | | | | 21 | | | | 17 | |
Net assets, end of period (in millions) | | $ | 82.2 | | | $ | 88.1 | | | $ | 91.8 | | | $ | 110.8 | | | $ | 122.3 | |
| | | | | | | | | | | | | | | | | | | | |
| | | Class G | |
| | | Year Ended December 31, | |
| | | 2013 | | | 2012 | | | 2011 | | | 2010 | | | 2009(d) | |
Net Asset Value, Beginning of Period | | $ | 11.35 | | | $ | 11.35 | | | $ | 10.96 | | | $ | 10.75 | | | $ | 10.29 | |
| | | | | | | | | | | | | | | | | | | | |
Income (Loss) from Investment Operations | | | | | | | | | | | | | | | | | | | | |
Net investment income (a) | | | 0.26 | | | | 0.30 | | | | 0.34 | | | | 0.36 | | | | 0.27 | |
Net realized and unrealized gain (loss) on investments | | | (0.54 | ) | | | 0.10 | | | | 0.42 | | | | 0.23 | | | | 0.19 | |
| | | | | | | | | | | | | | | | | | | | |
Total from investment operations | | | (0.28 | ) | | | 0.40 | | | | 0.76 | | | | 0.59 | | | | 0.46 | |
| | | | | | | | | | | | | | | | | | | | |
Less Distributions | | | | | | | | | | | | | | | | | | | | |
Distributions from net investment income | | | (0.37 | ) | | | (0.40 | ) | | | (0.37 | ) | | | (0.38 | ) | | | 0.00 | |
| | | | | | | | | | | | | | | | | | | | |
Total distributions | | | (0.37 | ) | | | (0.40 | ) | | | (0.37 | ) | | | (0.38 | ) | | | 0.00 | |
| | | | | | | | | | | | | | | | | | | | |
Net Asset Value, End of Period | | $ | 10.70 | | | $ | 11.35 | | | $ | 11.35 | | | $ | 10.96 | | | $ | 10.75 | |
| | | | | | | | | | | | | | | | | | | | |
Total Return (%) (b) | | | (2.57 | ) | | | 3.58 | | | | 7.15 | | | | 5.65 | | | | 4.47 | (e) |
| | | | | |
Ratios/Supplemental Data | | | | | | | | | | | | | | | | | | | | |
Gross ratio of expenses to average net assets (%) | | | 0.58 | | | | 0.59 | | | | 0.58 | | | | 0.58 | | | | 0.60 | (f) |
Net ratio of expenses to average net assets (%) (c) | | | 0.58 | | | | 0.58 | | | | 0.58 | | | | 0.57 | | | | 0.59 | (f) |
Ratio of net investment income to average net assets (%) | | | 2.35 | | | | 2.62 | | | | 3.09 | | | | 3.31 | | | | 3.77 | (f) |
Portfolio turnover rate (%) | | | 18 | | | | 24 | | | | 23 | | | | 21 | | | | 17 | |
Net assets, end of period (in millions) | | $ | 169.1 | | | $ | 157.5 | | | $ | 133.5 | | | $ | 85.6 | | | $ | 25.0 | |
| (a) | Per share amounts based on average shares outstanding during the period. |
| (b) | Total return does not reflect any insurance, sales, separate account or administrative charges of variable annuity or life insurance contracts or any additional expenses that contract owners may bear under their variable contracts. If these charges were included, the returns would be lower. |
| (c) | Net ratio of expenses to average net assets includes the effect of management fee waivers as detailed in Note 5 of the Notes to Financial Statements. |
| (d) | Commencement of operations was April 28, 2009. |
| (e) | Periods less than one year are not computed on an annualized basis. |
| (f) | Computed on an annualized basis. |
See accompanying notes to financial statements.
MSF-20
Metropolitan Series Fund
Barclays Aggregate Bond Index Portfolio
Notes to Financial Statements—December 31, 2013
1. Organization
Metropolitan Series Fund (the “Trust”) is organized as a Delaware statutory trust and registered under the Investment Company Act of 1940, as amended (the “1940 Act”), as an open-end management investment company. The Trust is currently comprised of thirty series, each of which operates as a distinct investment vehicle of the Trust. The portfolio included in this report is Barclays Aggregate Bond Index Portfolio (the “Portfolio”), which is diversified. Shares in the Portfolio are not offered directly to the general public and are currently available only to separate accounts established by Metropolitan Life Insurance Company (“MetLife”) and other affiliated life insurance companies.
The Portfolio has registered and offers four classes of shares: Class A, B, E, and G shares. Shares of each Class of the Portfolio represent an equal pro rata interest in the Portfolio and generally give the shareholder the same voting, dividend, liquidation, and other rights. Investment income, realized and unrealized capital gains and losses, the common expenses of the Portfolio, and certain Portfolio-level expense reductions, if any, are allocated on a pro rata basis to each Class based on the relative net assets of each Class to the net assets of the Portfolio. Each Class of shares differs in its respective distribution plan and such distribution expenses are allocated to that Class.
2. Significant Accounting Policies
The preparation of financial statements in conformity with accounting principles generally accepted in the United States of America (“GAAP”) requires management to make estimates and assumptions that affect the reported amounts of assets and liabilities and disclosure of contingent assets and liabilities as of the date of the financial statements and the reported amounts of income and expenses during the reporting period. Actual results could differ from those estimates. In the preparation of these financial statements, management has evaluated events and transactions subsequent to December 31, 2013 through the date the financial statements were issued.
The following is a summary of significant accounting policies consistently followed by the Portfolio in the preparation of its financial statements.
Investment Valuation and Fair Value Measurements - Debt securities (other than short term obligations with a remaining maturity of sixty days or less), including corporate, convertible and municipal bonds and notes; obligations of the U.S. treasury and U.S. government agencies; sovereign issues; floating rate loans; and non-U.S. bonds, are generally valued on the basis of evaluated or composite bid quotations obtained from independent pricing services and/or brokers and dealers selected by MetLife Advisers, LLC (“MetLife Advisers” or the “Adviser”), an affiliate of MetLife, Inc., pursuant to authorization of the Board of Trustees of the Trust (the “Board” or “Trustees”). Such quotations utilize matrix pricing, which considers observable inputs including, among other things, issuer details, maturity dates, interest rates, yield curves, rates of prepayment, credit risks/spreads, default rates, reported trades, broker dealer quotes and quoted prices for similar securities. Securities that use similar valuation techniques and inputs as described above are generally categorized as Level 2 within the fair value hierarchy.
Mortgage and asset-backed securities are usually issued as separate tranches, or classes, of securities within each deal. These securities are also generally valued on the basis of evaluated or composite bid quotations obtained from independent pricing services and/or brokers and dealers selected by the Adviser pursuant to authorization of the Board. The pricing models for these securities usually consider tranche-level attributes, estimated cash flows and market-based yield spreads for each tranche and current market data, and incorporate deal collateral performance, as available. Mortgage and asset-backed securities that use similar valuation techniques and inputs as described above are generally categorized as Level 2 within the fair value hierarchy.
Short term obligations with a remaining maturity of sixty days or less are generally valued at amortized cost, which approximates fair market value, and are generally categorized as Level 2 within the fair value hierarchy.
Domestic and foreign equity securities, such as common stock, exchange-traded funds, rights, warrants, and preferred stock, that are traded on a securities exchange, are generally valued at their last sale price on the exchange or market in which they are principally traded on the valuation date, or, if no sales occurred on that day, at the last reported bid price. Equity securities traded over-the-counter are generally valued at the last reported sale price. Valuation adjustments may be applied to certain foreign equity securities that are traded solely on foreign exchanges that close before the close of the U.S. market to account for the market movement between the close of the foreign exchanges and the close of the U.S. market. The Portfolio may use a systematic fair valuation model provided by an independent third party to value securities principally traded in these foreign markets in order to adjust for possible stale pricing that may occur between the close of the foreign exchanges and the time of the Portfolio valuation. Foreign equity securities using these valuation adjustments are generally categorized as Level 2 within the fair value hierarchy. Equity securities that are actively traded, and have no valuation adjustments applied, are categorized as Level 1 within the fair value hierarchy. Other equity securities traded on inactive markets, or valued in reference to similar instruments traded on active markets, are generally categorized as Level 2 within the fair value hierarchy.
MSF-21
Metropolitan Series Fund
Barclays Aggregate Bond Index Portfolio
Notes to Financial Statements—December 31, 2013—(Continued)
Investments in registered open-end management investment companies are valued at reported net asset value per share on the valuation date and are categorized as Level 1 within the fair value hierarchy.
Forward foreign currency exchange contracts are valued through an independent pricing service based on the mean between closing bid and ask prices of the forward currency rates in the London foreign exchange markets on a daily basis as provided by a reliable bank or dealer. These contracts are generally categorized as Level 2 within the fair value hierarchy.
Options, whether on securities, indices, futures contracts, or otherwise, traded on exchanges are valued at the last sale price available as of the close of business on the valuation date or, if there is no such price available, at the mean between the last reported bid and ask prices. These types of options are categorized as Level 1 within the fair value hierarchy. Futures contracts, which are traded on commodity exchanges, are valued at their closing prices as of the close of such exchanges and are categorized as Level 1 within the fair value hierarchy.
Options and futures contracts that are traded over-the-counter are generally valued on the basis of quotations provided by broker-dealers or prices provided by pricing service providers who use a series of techniques, including simulation pricing models, to determine the value of the contracts. The pricing models use inputs that are observed from actively quoted markets such as issuer details, indices, spreads, interest rates, yield curves, credit curves, measures of volatility and exchange rates. These contracts are generally categorized as Level 2 within the fair value hierarchy.
If no current market value quotation or other observable inputs are readily available or market value quotations are deemed to be unreliable for a security, the fair value of the security will be determined in accordance with procedures approved by and under the general supervision of the Board. In such a circumstance, the Board has delegated the determination of the fair value of a security to a Valuation Committee (“Committee”) of MetLife Advisers. The Committee provides general pricing oversight and fair value pricing determinations related to portfolio securities and meets on a regular basis to review reports relating to the valuation of the securities in the Portfolio. The Board has delegated to State Street Bank and Trust Company, the Trust’s custodian (“custodian”), the responsibility for calculating the net asset values (“NAVs”) of the Trust’s Portfolios. The Committee is responsible for overseeing the calculation of the NAVs of the Portfolios by the custodian. The Committee also periodically reviews pricing vendors, including the vendor providing fair value pricing for the Portfolio’s foreign securities, and is responsible for overseeing the correction of pricing errors and addressing other pricing issues that arise in the ordinary course of business, such as making real-time fair value determinations, as necessary.
No single standard for determining the fair value of a security can be set forth because fair value depends upon the facts and circumstances with respect to each security. Information relating to any relevant factors may be obtained by the Committee from any appropriate source, including the subadviser of the Portfolio, the custodian, a pricing service, market maker and/or broker for such security or the issuer. Appropriate methodologies for determining fair value under particular circumstances may include: matrix pricing, comparisons of securities with comparable characteristics, value based on multiples of earnings, discount from market price of similar marketable securities or a combination of these and other methods. The Committee maintains a detailed report tracking each fair-valued security that compares the fair value price to the next available trade, vendor or broker price, and provides information on how close the fair value price was to the next quoted price. The Committee reviews a summary of such report monthly. On a quarterly basis, the Board is provided with the following for consideration and ratification or adjustment: (1) a memorandum summarizing the actions taken by the Committee in the prior quarter; and (2) a list of the Portfolio’s securities as of the most recent quarter-end for which market quotations were not readily available.
Investment Transactions and Related Investment Income - Portfolio security transactions are recorded on the trade date. Dividend income is recorded on the ex-dividend date or, for certain foreign securities, when notified. Interest income, which includes amortization of premium and accretion of discount on debt securities, is recorded on the accrual basis. Realized gains and losses on investments are determined on the identified cost basis, which is the same basis used for federal income tax purposes. Foreign income and foreign capital gains on some foreign securities may be subject to foreign taxes, which are accrued as applicable. These foreign taxes have been provided for in accordance with the Portfolio’s understanding of the applicable countries’ tax rules and rates.
Income Taxes - It is the Portfolio’s policy to comply with the requirements of the Internal Revenue Code of 1986, as amended, and regulations thereunder, applicable to regulated investment companies and to distribute, with respect to each taxable year, all of its taxable income to shareholders. Therefore, no federal income tax provision is required. The Portfolio files U.S. federal tax returns. No income tax returns are currently under examination. The Portfolio’s federal tax returns for the prior three fiscal years remain subject to examination by the Internal Revenue Service. As of December 31, 2013, the Portfolio had no uncertain tax positions that would require financial statement recognition, or de-recognition or disclosure.
Dividends and Distributions to Shareholders - The Portfolio records dividends and distributions on the ex-dividend date. Net realized gains from security transactions (if any) are generally distributed annually to shareholders. The timing and characterization of certain income and capital gains distributions are determined in accordance with federal tax regulations that may differ from GAAP. Permanent book and tax basis differences relating to shareholder distributions will result in reclassification between under/over
MSF-22
Metropolitan Series Fund
Barclays Aggregate Bond Index Portfolio
Notes to Financial Statements—December 31, 2013—(Continued)
distributed net investment income, accumulated net realized gains/losses, and paid-in surplus. Book-tax differences are primarily due to premium amortization of debt securities and paydown reclasses. These adjustments have no impact on net assets or the results of operations.
Securities Lending - The Portfolio may lend its portfolio securities to certain qualified brokers who borrow securities in order to complete certain securities transactions. By lending its portfolio securities, the Portfolio attempts to increase its net investment income through the receipt of income on collateral held from securities on loan. Any gain or loss in the market price of the loaned securities that might occur and any interest earned or dividends declared during the term of the loan would accrue to the account of the Portfolio.
The Trust has entered into a securities lending arrangement with the custodian. Under this arrangement, the custodian is authorized to loan portfolio securities on the Portfolio’s behalf. In exchange, the Portfolio receives either cash or securities as collateral against the loaned securities. The Portfolio receives collateral at least equal to 102% of the market value of the loaned securities (105% for foreign equity securities), at each loan’s inception. Collateral representing at least 100% of the market value of the loaned securities must be maintained for the duration of the loan. A liability for cash collateral is reflected on the Statement of Assets and Liabilities, and is categorized as Level 2 within the fair value hierarchy. Cash collateral is generally invested in the State Street Navigator Securities Lending MET Portfolio (the “Navigator Portfolio”), a series of the State Street Navigator Securities Lending Trust that is managed by an affiliate of the custodian. The Navigator Portfolio is a registered money market fund that invests in a variety of high-quality, U.S. dollar-denominated instruments. If the market value of the collateral at the close of trading on a business day is less than 100% of the market value of the loaned securities at the close of trading on that day, the borrower shall be required to deliver, by the close of business on the following business day, an additional amount of collateral, so that the total amount of posted collateral is equal to at least 100% of the market value of all the loaned securities as of such preceding day. A portion of net income (income after the deduction of expenses and fees of the Navigator Portfolio) on the collateral is rebated to the borrower of the securities and the remainder is split between the custodian and the Portfolio. On loans collateralized by U.S. Treasuries, a fee is received from the borrower and is allocated between the Portfolio and the custodian. The risks associated with lending portfolio securities include, but are not limited to, possible delays in receiving additional collateral or in the recovery of the loaned securities, possible loss of rights in the collateral should the borrower fail financially, as well as risk of loss in the value of the collateral or the value of the investments made with the collateral. The lending agent has agreed to indemnify the Portfolio in the case of default of any securities borrower. Income received by the Portfolio in securities lending transactions during the year ended December 31, 2013 is reflected as Securities lending income on the Statement of Operations. Any outstanding loans by the Portfolio at December 31, 2013 are disclosed in the footnotes to the Schedule of Investments.
Repurchase Agreements - The Portfolio may enter into repurchase agreements, under the terms of a Master Repurchase Agreement, with selected commercial banks and broker-dealers, under which the Portfolio acquires securities as collateral and agrees to resell the securities at an agreed upon time and at an agreed-upon price. The Portfolio, through the custodian or a subcustodian, receives delivery of the underlying securities collateralizing any repurchase agreements. The Portfolio requires the custodian to take possession, to have legally segregated in the Federal Reserve Book Entry System, or to have segregated within the custodian’s vault, all securities held as collateral for repurchase agreements. It is the Portfolio’s policy that the market value of the collateral be at least equal to 100% of the repurchase price in the case of a repurchase agreement of one-day duration and at least equal to 102% of the repurchase price in the case of all other repurchase agreements. In the event of default or failure by a party to perform an obligation in connection with any repurchase transaction, the Master Repurchase Agreement gives the non-defaulting party the right to set-off claims and to apply property held by it in connection with any repurchase transaction against obligations owed to it.
Mortgage Related and Other Asset-Backed Securities - The Portfolio may invest in mortgage-related or other asset-backed securities. These securities may include mortgage pass-through securities, collateralized mortgage obligations (“CMOs”), commercial mortgage-backed securities, CMO residuals, stripped mortgage backed securities (“SMBS”), and other securities that directly or indirectly represent a participation in, or are secured by or payable from, mortgage loans on real property or other receivables. The value of some mortgage- or asset-backed securities may be particularly sensitive to changes in prevailing interest rates. Early repayment of principal on some mortgage-related securities may expose the Portfolio to a lower rate of return upon reinvestment of principal. The value of these securities may fluctuate in response to the market’s perception of the creditworthiness of the issuers. Additionally, although mortgages and mortgage-related securities are generally supported by some form of government or private guarantee and/or insurance, there is no assurance that private guarantors or insurers will meet their obligations.
In one type of SMBS, one class receives all of the interest from the mortgage assets (the interest-only or “IO” class), while the other class will receive all of the principal (the principal-only or “PO” class). Because principal will not be received at the maturity of an IO, adjustments are made to the book value of the security until maturity. These adjustments are netted against payments received for the IOs and the net amount is included in interest income on the Statement of Operations of the Portfolio. Payments received for POs are treated as reductions to the cost and par value of the securities. Details of mortgage related and other asset-backed securities held by the Portfolio are included in the Portfolio’s Schedule of Investments.
MSF-23
Metropolitan Series Fund
Barclays Aggregate Bond Index Portfolio
Notes to Financial Statements—December 31, 2013—(Continued)
The Portfolio may invest a significant portion of its assets in securities of issuers that hold mortgage and asset-backed securities and direct investments in securities backed by commercial and residential mortgage loans and other financial assets. The value and related income of these securities are sensitive to changes in economic conditions, including delinquencies and/or defaults, and may be negatively impacted by increased volatility of market prices and periods of illiquidity.
TBA Purchase & Forward Sale Commitments - The Portfolio may enter into TBA commitments to purchase or sell securities for a fixed price at a future date. TBA commitments are considered securities in themselves, and involve a risk of loss if the value of the security to be purchased or sold declines or increases prior to settlement date, which is in addition to the risk of decline in the value of the Portfolio’s other assets. TBA forward sales commitments are valued at the current market value of the underlying securities, according to the procedures described under “Investment Valuation and Fair Value Measurements”.
When-Issued and Delayed-Delivery Securities - The Portfolio may purchase securities on a when-issued or delayed-delivery basis. Settlement of such transactions normally occurs within a month or more after the purchase commitment is made. The Portfolio may purchase securities under such conditions only with the intention of actually acquiring them, but may enter into a separate agreement to sell the securities before the settlement date. Since the value of securities purchased may fluctuate prior to settlement, the Portfolio may be required to pay more at settlement than the security is worth. In addition, the purchaser is not entitled to any of the interest earned prior to settlement.
Upon making a commitment to purchase a security on a when-issued or delayed-delivery basis, the Portfolio will hold liquid assets in a segregated account with the Portfolio’s custodian, or set aside liquid assets in the Portfolio’s records, worth at least the equivalent of the amount due. The liquid assets will be monitored on a daily basis and adjusted as necessary to maintain the necessary value.
3. Certain Risks
Market Risk: In the normal course of business, the Portfolio invests in securities and enters into transactions where risks exist due to fluctuations in the market (market risk) or failure of the other party to a transaction to perform (credit and counterparty risk). The value of securities held by the Portfolio may decline in response to certain events, including those directly involving the companies whose securities are owned by the Portfolio; conditions affecting the general economy; overall market changes; local, regional or global political, social or economic instability; currency, interest rate, and price fluctuations.
Credit and Counterparty Risk: The Portfolio may be exposed to counterparty risk, or the risk that an entity with which the Portfolio has unsettled or open transactions may default. The potential loss could exceed the value of the financial assets and liabilities recorded in the financial statements. Financial assets that potentially expose the Portfolio to credit and counterparty risk consist principally of cash due from counterparties and investments. The Portfolio manages counterparty risk by entering into agreements only with counterparties that it believes have the financial resources to honor their obligations and by monitoring the financial stability of those counterparties. The Portfolio’s investment adviser attempts to mitigate counterparty risk by (i) periodically assessing the creditworthiness of its trading partners, (ii) monitoring and/or limiting the amount of its net exposure to each individual counterparty based on its assessment, and (iii) requiring collateral from the counterparty for certain transactions. In order to preserve certain safeguards for non-standard settlement trades, the Portfolio restricts its exposure to credit and counterparty losses by entering into master netting agreements with counterparties (approved brokers) with whom it undertakes a significant volume of transactions. Master Agreements govern the terms of certain transactions, and reduce the counterparty risk associated with relevant transactions by specifying credit protection mechanisms and providing standardization that improves legal certainty. Master Agreements can also help limit counterparty risk by specifying collateral posting arrangements at pre-arranged exposure levels.
Additional risks associated with each type of investment are described above within the respective security type notes. The Portfolio’s prospectus includes a discussion of the principal risks of investing in the Portfolio.
4. Investment Transactions
Aggregate cost of purchases and proceeds of sales of investment securities, including mortgage dollar roll and TBA transactions but excluding short-term securities, for the year ended December 31, 2013 were as follows:
| | | | | | | | | | | | |
Purchases | | | Sales | |
U.S. Government | | Non U.S. Government | | | U.S. Government | | | Non U.S. Government | |
| $507,846,310 | | $ | 127,196,803 | | | $ | 294,594,908 | | | $ | 47,056,834 | |
5. Investment Management Fees and Other Transactions with Affiliates
Investment Management Agreement - MetLife Advisers is the investment adviser to the Portfolio. The Trust has entered into an investment management agreement with MetLife Advisers with respect to the Portfolio. For providing investment management services to the Portfolio, MetLife Advisers receives monthly compensation at the annual rate of 0.250% of average daily net assets. Fees earned by MetLife Advisers with respect to the Portfolio for the year ended December 31, 2013 were $4,703,130.
MSF-24
Metropolitan Series Fund
Barclays Aggregate Bond Index Portfolio
Notes to Financial Statements—December 31, 2013—(Continued)
MetLife Advisers has entered into an investment subadvisory agreement with MetLife Investment Management, LLC (“MIM”) with respect to the Portfolio. For providing subadvisory services to the Portfolio, MetLife Advisers has agreed to pay MIM an investment subadvisory fee for each class of the Portfolio as follows:
| | |
% per annum | | Average Daily Net Assets |
| 0.040% | | On the first $500 million |
| 0.030% | | Of the next $500 million |
| 0.015% | | On amounts over $1 billion |
Fees earned by MIM with respect to the Portfolio for the year ended December 31, 2013 were $482,188.
Management Fee Waivers - Pursuant to an expense agreement, MetLife Advisers has agreed, for the period April 29, 2013 through April 27, 2014, to reduce its advisory fees set out above under “Investment Management Agreement” for each class of the Portfolio as follows:
| | |
% per annum | | Average Daily Net Assets |
| 0.005% | | Over $500 million and under $1 billion |
| 0.010% | | Of the next $1 billion |
| 0.015% | | On amounts over $2 billion |
An identical expense agreement was in place for the period April 30, 2012 through April 28, 2013. Amounts waived for the year ended December 31, 2013 are shown as management fee waivers in the Statement of Operations.
Certain officers and trustees of the Trust may also be officers of MetLife Advisers; however, such officers and trustees receive no compensation from the Trust.
Transfer Agency Agreement - MetLife serves as the transfer agent for the Trust. MetLife receives no fees for its services to the Trust under the transfer agency agreement.
Distribution and Service Fees - The Trust has a distribution agreement with MetLife Investors Distribution Company (“MIDC” or the “Distributor”) in which MIDC serves as the distributor for the Portfolio’s Class A, B, E, and G Shares. MIDC is a wholly-owned subsidiary of MetLife Investors Group, Inc., an affiliate of the Adviser. The Trust has also adopted a Distribution and Service Plan under Rule 12b-1 of the 1940 Act for the Portfolio’s Class B, E, and G Shares. Under the Distribution and Service Plan, the Class B, E, and G Shares of the Portfolio pay a fee to compensate the Insurance Companies (or their affiliates) and other broker-dealers and financial intermediaries involved in the offer and sale of Portfolio shares for promoting or selling and servicing the Class B, E, and G Shares of the Portfolio. The fees under the Distribution and Service Plan for each class of the Portfolio’s shares are calculated as a percentage of the Portfolio’s average daily net assets that are attributable to that Class. Currently, the fee is 0.25% per year for Class B Shares, 0.15% per year for Class E Shares, and 0.30% per year for Class G Shares. Amounts incurred by the Portfolio for the year ended December 31, 2013 are shown as Distribution and service fees in the Statement of Operations.
Deferred Trustee Compensation - Each Trustee who is not currently an employee of the Adviser or any of its affiliates receives compensation from the Trust for his or her service to the Trust. A deferred compensation plan (the “Plan”) is available to the Trustees on a voluntary basis. Deferred amounts remain in the Trust until distributed in accordance with the provisions of the Plan. The value of a participating Trustee’s deferral account is based on theoretical investments of deferred amounts, on the normal payment dates in certain portfolios of the Trust or Met Investors Series Trust, an affiliate of the Trust, as designated by the participating Trustee. Changes in the value of participants’ deferral accounts are reflected as Trustees’ fees and expenses in the Statement of Operations. The portion of the accrued obligations allocated to the Portfolio under the Plan is reflected as Deferred trustees’ fees in the Statement of Assets and Liabilities.
6. Contractual Obligations
Under the Trust’s organizational documents, its officers and Trustees may be indemnified against certain liabilities and expenses arising out of the performance of their duties to the Trust. Additionally, the Trust has a variety of indemnification obligations under contracts with its service providers. The Trust’s maximum exposure under these arrangements is unknown, as this would involve future claims that may be made against the Trust that have not yet occurred.
7. Income Tax Information
The tax character of distributions paid for the years ended December 31, 2013 and 2012 was as follows:
| | | | | | | | | | | | | | | | | | | | |
Ordinary Income | | | Long-Term Capital Gain | | | Total | |
2013 | | 2012 | | | 2013 | | | 2012 | | | 2013 | | | 2012 | |
| $62,542,285 | | $ | 65,167,478 | | | $ | — | | | $ | — | | | $ | 62,542,285 | | | $ | 65,167,478 | |
MSF-25
Metropolitan Series Fund
Barclays Aggregate Bond Index Portfolio
Notes to Financial Statements—December 31, 2013—(Continued)
As of December 31, 2013, the components of distributable earnings (accumulated losses) on a federal income tax basis were as follows:
| | | | | | | | | | | | | | | | | | | | |
Undistributed
Ordinary
Income | | Undistributed
Long-Term
Capital Gain | | | Net
Unrealized
Appreciation | | | Loss Carryforwards | | | Other
Accumulated
Capital Losses | | | Total | |
| $61,066,419 | | $ | — | | | $ | 10,283,643 | | | $ | (23,168,582 | ) | | $ | (5,419,589 | ) | | $ | 42,761,891 | |
The Portfolio utilizes the provisions of the federal income tax laws that provide for the carryforward of capital losses for prior years, offsetting such losses against any future realized capital gains. Under the Regulated Investment Company Modernization Act of 2010 (the “Act”), net capital losses recognized after December 22, 2010 may be carried forward indefinitely and their character is retained as short-term and/or long-term losses. Previously, net capital losses were carried forward for up to eight years and treated as short-term losses. As a transition rule, the Act requires that post-enactment net capital losses be used before pre-enactment net capital losses.
As of December 31, 2013, the Portfolio had post-enactment short-term accumulated capital losses of $1,389,119, post-enactment long-term accumulated capital losses of $4,030,470, and pre-enactment accumulated capital loss carryforwards and expiration dates were as follows:
| | | | | | | | | | | | | | | | |
Expiring
12/31/17 | | Expiring
12/31/16 | | | Expiring
12/31/15 | | | Expiring
12/31/14 | | | Total | |
| $9,934,932 | | $ | 6,670,752 | | | $ | 4,015,637 | | | $ | 2,547,261 | | | $ | 23,168,582 | |
MSF-26
Metropolitan Series Fund
Barclays Aggregate Bond Index Portfolio
Report of Independent Registered Public Accounting Firm
To the Shareholders of Barclays Aggregate Bond Index Portfolio and the Board of Trustees of Metropolitan Series Fund:
We have audited the accompanying statement of assets and liabilities, including the schedule of investments, of Barclays Aggregate Bond Index Portfolio, one of the portfolios constituting Metropolitan Series Fund (the “Trust”) as of December 31, 2013, and the related statement of operations for the year then ended, the statements of changes in net assets for each of the two years in the period then ended, and the financial highlights for each of the five years in the period then ended. These financial statements and financial highlights are the responsibility of the Trust’s management. Our responsibility is to express an opinion on these financial statements and financial highlights based on our audits.
We conducted our audits in accordance with the standards of the Public Company Accounting Oversight Board (United States). Those standards require that we plan and perform the audit to obtain reasonable assurance about whether the financial statements and financial highlights are free of material misstatement. The Trust is not required to have, nor were we engaged to perform, an audit of its internal control over financial reporting. Our audits included consideration of internal control over financial reporting as a basis for designing audit procedures that are appropriate in the circumstances, but not for the purpose of expressing an opinion on the effectiveness of the Trust’s internal control over financial reporting. Accordingly, we express no such opinion. An audit also includes examining, on a test basis, evidence supporting the amounts and disclosures in the financial statements, assessing the accounting principles used and significant estimates made by management, as well as evaluating the overall financial statement presentation. Our procedures included confirmation of securities owned as of December 31, 2013, by correspondence with the custodian and brokers; where replies were not received from brokers, we performed other auditing procedures. We believe that our audits provide a reasonable basis for our opinion.
In our opinion, the financial statements and financial highlights referred to above present fairly, in all material respects, the financial position of Barclays Aggregate Bond Index Portfolio of Metropolitan Series Fund, as of December 31, 2013, the results of its operations for the year then ended, the changes in its net assets for each of the two years in the period then ended, and the financial highlights for each of the five years in the period then ended, in conformity with accounting principles generally accepted in the United States of America.
Deloitte & Touche LLP
Boston, Massachusetts
February 27, 2014
MSF-27
Metropolitan Series Fund
Trustees and Officers of Metropolitan Series Fund
The Trustees and executive officers of the Trust, their ages and their principal occupations during the past five years are set forth below. Unless otherwise indicated, the business address of each is One Financial Center, Boston, MA 02111. Each Trustee who is deemed an “interested person,” as such term is defined in the 1940 Act, is indicated by an asterisk. Those Trustees who are not “interested persons” as defined in the 1940 Act are referred to as “Independent Trustees.” Additional information about the Trustees is available in the Statement of Additional Information, which is available without charge, upon request, by calling (800) 848-3854.
Trustees of the Trust
| | | | | | | | | | |
Name and Age | | Position(s)
Held with
Registrant | | Term of Office and
Length of Time
Served | | Principal Occupation(s) During the
Past 5 Years(1) | | Number of
Portfolios
in Fund
Complex(2)
overseen | | Other Directorships Held
by Trustee During the
Past 5 Years(1) |
| Interested Trustee | | | | | | | | | | |
| Elizabeth M. Forget* (47) | | Trustee, Chairman of the Board, President and Chief Executive Officer | | Indefinite; From May 2006 (President and Chief Executive Officer)/ August 2006 (Trustee and Chairman of the Board) to present | | Senior Vice President, MetLife Inc.; President, MetLife Advisers, LLC and a predecessor company. | | 79 | | Trustee, Met Investors Series Trust (the “MIST Trust”);** various MetLife-affiliated boards. |
| | | | | |
| Independent Trustees | | | | | | | | | | |
| Stephen M. Alderman (54) | | Trustee | | Indefinite; From April 2012 to present | | Shareholder in the law firm of Garfield & Merel, Ltd. | | 79 | | Trustee, MIST Trust;** Director, International Truck Leasing Corp. |
| | | | | |
| Robert J. Boulware (57) | | Trustee | | Indefinite; From April 2012 to present | | Managing Director, Pilgrim Funds, LLC (private equity fund). | | 79 | | Trustee, MIST Trust;** Trustee, Vertical Capital Income Fund (closed-end fund); Director, Gainsco, Inc. (auto insurance). |
| | | | | |
| Susan C. Gause (61) | | Trustee | | Indefinite; From April 2012 to present | | Private Investor. | | 79 | | Trustee, MIST Trust;** Trustee, HSBC Funds. |
| | | | | |
| Nancy Hawthorne (62) | | Trustee | | Indefinite; From May 2003 to present | | Chief Executive Officer, Clerestory LLC (corporate advisor). | | 79 | | MIST Trust;** Director, THL Credit, Inc.**; Director, Avid Technology, Inc.** |
| | | | | |
| Barbara A. Nugent (57) | | Trustee | | Indefinite; From January 2014 to present | | President, True North Board Governance, LLC (consulting); until 2014, partner in the law firm of Stradley Ronon Stevens & Young, LLP. | | 79 | | Trustee, MIST Trust**; Director, Episcopal Healthcare Foundation; until 2014, member, Mutual Fund Directors Forum Advisory Board. |
| | | | | |
| Keith M. Schappert (62) | | Trustee | | Indefinite; From August 2009 to present | | Principal, Schappert Consulting LLC (asset management consulting). | | 79 | | Trustee, MIST Trust;** Director, The Commonfund for Nonprofit Organizations; until 2011, Director, Trilogy Global Advisors; Director, Mirae Asset Discovery Funds,** Director, Calamos Investments. |
| | | | | |
| Linda B. Strumpf (66) | | Trustee | | Indefinite; From May 2000 to present | | Chair of the Investment Committee, Leona M. and Harry B. Helmsley Charitable Trust; until 2011, Chief Investment Officer, Leona M. and Harry B. Helmsley Charitable Trust. | | 79 | | Since 2012, Trustee, MIST Trust,** Trustee and Member of Investment Committee, The Pennsylvania State University. |
| | | | | |
| Dawn M. Vroegop (47) | | Trustee | | Indefinite; From May 2009 to present | | Private Investor. | | 79 | | Trustee, MIST Trust,** Trustee, Driehaus Mutual Funds; Director and Investment Committee Chair, City College of San Francisco Foundation. |
MSF-28
Metropolitan Series Fund
Trustees and Officers of Metropolitan Series Fund—(Continued)
Executive Officers of the Trust
| | | | | | |
Name and Age | | Position(s) Held with
Registrant | | Term of Office
and Length of
Time Served | | Principal Occupation(s) During Past 5 Years(1) |
| Elizabeth M. Forget (47) | | President, Chief Executive Officer, Trustee and Chairman of the Board | | From May
2006 (President
and Chief
Executive
Officer)/
August 2006
(Trustee and
Chairman of
the Board) to
present | | See principal occupation information in the table above. |
| | | |
| Jeffrey L. Bernier (42) | | Vice President | | From February
2008 to present | | Vice President, MetLife, Inc.; Senior Vice President, MetLife Advisers, LLC and a predecessor company. |
| | | |
| Peter H. Duffy (58) | | Chief Financial Officer and Treasurer | | From November
2000 to present | | Senior Vice President, MetLife Advisers, LLC; Vice President, MetLife, Inc. |
| | | |
| Andrew L. Gangolf (59) | | Secretary | | From May
2011to present | | Senior Vice President, MetLife Advisers, LLC; Senior Vice President & Assistant General Counsel, AllianceBerstein Investments, Inc. |
| | | |
| Jeffrey P. Halperin (46) | | Chief Compliance Officer | | From November
2005 to present | | Vice President, MetLife, Inc.; Chief Compliance Officer, MIST; Chief Compliance Officer, MSF Trust; Chief Compliance Officer, MetLife Advisers, LLC and a predecessor company; Chief Compliance Officer, MetLife Investment Management, LLC (formerly MetLife Investment Advisors Company, LLC). |
| | | |
| Alan C. Leland, Jr. (61) | | Vice President | | From February
2005 to present | | Treasurer and Chief Financial Officer, MetLife Advisers, LLC; Vice President, MetLife Group Inc.; Vice President, MetLife, Inc. |
| * | Ms. Forget is an “interested person” of the Trust because of her positions with MetLife Advisers, LLC and her ownership of securities issued by MetLife, Inc., the ultimate parent company of MetLife Advisers, LLC. |
| ** | Indicates a directorship with a registered investment company or a company subject to the reporting requirements of the Securities Exchange Act of 1934, as amended. |
| (1) | Previous positions during the past five years with the Trust, MetLife, Inc. or the Adviser are omitted if not materially different. |
| (2) | The Fund Complex includes 49 Portfolios of the MIST Trust and 30 Portfolios of the Trust. |
MSF-29
Metropolitan Series Fund
Barclays Aggregate Bond Index Portfolio
Board of Trustees’ Consideration of Advisory and Sub-Advisory Agreements
At an in-person meeting of the Boards of Trustees (the “Board”) of Met Investors Series Trust and Metropolitan Series Fund (“MIST” and “MSF,” respectively, and collectively, the “Trusts”) held on November 19-20, 2013, the Board, including a majority of the Trustees who are not considered to be “interested persons” of the Trusts (the “Independent Trustees”) under the Investment Company Act of 1940, as amended (the “1940 Act”), approved for an annual period the continuation of each Trust’s advisory agreement (the “Advisory Agreement”) with MetLife Advisers, LLC (the “Adviser”) and the applicable sub-advisory agreements (each a “Sub-Advisory Agreement,” and collectively with the Advisory Agreement, the “Agreements”) between the Adviser and the investment sub-advisers (each a “Sub-Adviser,” and collectively, the “Sub-Advisers”) for each of the series of the Trusts, including the Barclays Aggregate Bond Index Portfolio (each a “Portfolio,” and collectively, the “Portfolios”).1
In considering the Agreements, the Board reviewed a variety of materials provided by the Adviser and the Sub-Advisers relating to the Portfolios, including comparative performance, fee and expense information for an appropriate peer group of similar mutual funds, performance information for relevant benchmark indices and other information regarding the nature, extent and quality of services provided by the Adviser and the Sub-Advisers under their respective Agreements. The Board also took into account its experience with the Adviser and the Sub-Advisers and information provided to the Board in its meetings throughout the year with respect to the services provided by the Adviser and the Sub-Advisers, including quarterly performance reports prepared by management containing reviews of investment results, and periodic presentations from certain of the Sub-Advisers with respect to the Portfolios they manage. The Independent Trustees also assessed reports provided by the Board’s independent consultant, who reviewed and provided analyses regarding investment performance, fees and expenses, and other information provided by, or at the direction of, the Adviser and the Sub-Advisers, as more fully discussed below.
The Independent Trustees were separately advised by independent legal counsel throughout the process, and met with independent legal counsel in periodic executive sessions. Prior to voting to continue the Agreements at the November meeting, the Independent Trustees also received a memorandum from their independent counsel discussing the legal standards for their consideration of the proposed continuation of the Agreements. The Board also met in person with personnel of the Adviser on September 17, 2013 for the specific purpose of giving preliminary consideration to the proposed continuation of the Agreements and to request additional information they considered reasonably necessary to their deliberations. The Independent Trustees also discussed the proposed continuation of the Agreements in private sessions with their independent legal counsel at which no representatives of management were present.
In considering whether to approve the renewal of the Advisory Agreement with the Adviser and any applicable Sub-Advisory Agreements with respect to a Portfolio, the Board reviewed and analyzed the factors it deemed relevant, including: (1) the nature, extent and quality of the services to be provided to the Portfolios by the Adviser and the Sub-Advisers; (2) the performance of the Portfolios as compared to a peer group and an appropriate index; (3) the Adviser’s and each of the Sub-Adviser’s personnel and operations; (4) the financial condition of the Adviser and of the Sub-Advisers; (5) the level and method of computing each Portfolio’s advisory and sub-advisory fees; (6) the profitability of the Adviser under the Advisory Agreement and of certain of the Sub-Advisers under the Sub-Advisory Agreements; (7) any “fall-out” benefits to the Adviser, the Sub-Advisers and their affiliates (i.e., ancillary benefits realized by the Adviser, the Sub-Advisers or their affiliates from the Adviser’s or Sub-Advisers’ relationship with the Trusts); (8) the anticipated effect of growth in size on Portfolio expenses; (9) fees paid to certain of the Sub-Advisers by comparable institutional and retail accounts; and (10) possible conflicts of interest.
Nature, extent and quality of services. The Board evaluated the nature, extent and quality of the services that the Adviser, and the Sub-Advisers as relevant, have provided to the Portfolios. The Board considered the Adviser’s services as investment manager to the Portfolios, including services relating to the selection and oversight of the Sub-Advisers for the applicable Portfolios. The Board considered, among other things, the Adviser’s oversight of the provision of services to the Portfolios by the Sub-Advisers, including with respect to investment activities and trading practices, and the Sub-Adviser’s compliance with fund policies, objectives and Board directives, compliance policies and procedures and applicable law. The Adviser’s services in coordinating and overseeing the activities of the Trusts’ other service providers were also considered. The Board also evaluated the expertise and performance of the personnel of the Adviser who performed services for the Portfolios throughout the year.
The Board considered information received from the Trust’s Chief Compliance Officer (“CCO”) regarding the Portfolios’ compliance policies and procedures established pursuant to Rule 38a-l under the 1940 Act. The Board also evaluated the CCO’s ongoing reports concerning the CCO’s oversight of the risk assessment processes of the Sub-Advisers.
1 The Pyramis Managed Risk Portfolio recently commenced operations and, therefore, the Agreement with respect to this Portfolio was not up for renewal.
MSF-30
Metropolitan Series Fund
Barclays Aggregate Bond Index Portfolio
Board of Trustees’ Consideration of Advisory and Sub-Advisory Agreements—(Continued)
With respect to the services provided by each of the Sub-Advisers, the Board considered, among other things, information provided to the Board by each Sub-Adviser. The Board considered the Sub-Adviser’s current level of staffing and its overall resources, as well as its compensation program. The Board reviewed each Sub-Adviser’s history and investment experience, as well as information regarding the qualifications, background and responsibilities of the Sub-Adviser’s investment and compliance personnel who provide services to the Portfolios. The Board also considered, among other things, the Sub-Adviser’s compliance program and any disciplinary history. The Board also took into account the Sub-Adviser’s risk assessment and monitoring process. The Board noted each Sub-Adviser’s regulatory history, including whether it was currently involved in any regulatory actions or investigations as well as material litigation, and any settlements and amelioratory actions undertaken, as appropriate. The Board also noted that the CCO and his staff conduct regular, periodic compliance reviews with each of the Sub-Advisers and present reports to the Independent Trustees regarding the same, which includes evaluating the regulatory compliance systems of the Sub-Advisers and procedures reasonably designed by them to help assure compliance with the federal securities laws, including issues related to late trading and market timing, best execution, fair value pricing, and proxy voting procedures, among others. The Board also took into account the financial condition of each Sub-Adviser. In its review, the Board also received and took into account information regarding any services and/or payments provided to the Adviser by the Sub-Advisers in connection with marketing activities.
The Board considered each Sub-Adviser’s investment process and philosophy. The Board took into account that each Sub-Adviser’s responsibilities include the development and maintenance of an investment program for the applicable Portfolio which is consistent with the Portfolio’s investment objectives, the selection of investment securities and the placement of orders for the purchase and sale of such securities, as well as the implementation of compliance controls related to performance of these services. The Board also reviewed each Sub-Adviser’s brokerage policies and practices.
Performance. The Board considered the performance of the Portfolios as described in the quarterly reports prepared by management, and as also analyzed in reports prepared by the Independent Trustees’ independent consultant. The Board noted that the Adviser reviews with the Board on a quarterly basis detailed information about the Portfolios’ performance results, portfolio composition and investment strategies. The Board also reviewed and considered a separate report prepared by Lipper Inc. (“Lipper”), an independent third party, which provided a statistical analysis comparing the Portfolios’ investment performance, expenses, and fees to comparable funds underlying variable insurance products (the “Performance Universe”). In addition, the Independent Trustees met separately with a representative of Bobroff Consulting, Inc., an independent consultant (“Bobroff), at a special board meeting in September 2013, to review the separate reports prepared by such consultant (“Bobroff Report”), which analyzed the report prepared by Lipper. The Board also considered each Portfolio’s more recent performance subsequent to the performance period covered by the Lipper reports, and management’s discussion of the same, including the effect of current market conditions on each Portfolio’s more recent performance.
The Board reviewed the Portfolios’ performance records and the Adviser’s and Sub-Advisers’ management styles and long-term performance records with the Portfolios and comparable funds. The Board focused particular attention on Portfolios with less favorable performance records. The Board was mindful of the Adviser’s focus on each Sub-Adviser’s performance and noted that the Adviser has been active in monitoring and responding to any performance issues with respect to the Portfolios. The Board also took into account its discussions with management regarding factors that contributed to the performance of the Portfolios.
Among other data relating specifically to the Barclays Aggregate Bond Index Portfolio’s performance, the Board considered that the Portfolio underperformed the median of its Performance Universe and its Lipper Index for the one-, three- and five-year periods ended June 30, 2013. The Board further considered that the Portfolio underperformed its benchmark, the Barclays Capital Aggregate Bond Index, for the one-, three-and five-year periods ended October 31, 2013.
Fees and Expenses. The Board gave consideration to the advisory fees payable under the Advisory Agreement and the sub-advisory fees payable under each of the Sub-Advisory Agreements. In this regard, the Board reviewed the advisory fees payable on a Portfolio-by-Portfolio basis based on information provided by the Adviser. The Independent Trustees, with the assistance of Bobroff, also examined the fees paid by a Portfolio in light of fees paid to other investment managers by comparable funds, as well as considered the fees charged by the Adviser to manage other comparable funds, as applicable. The Lipper report included comparisons of the Adviser’s fee schedule with that of its peers based on an asset-based analysis of relative fee structures according to the size of the Portfolio. In addition, the Board considered the Portfolios’ advisory and sub-advisory fees and total expenses as compared to similarly situated investment companies underlying variable insurance products deemed to be comparable to the Portfolios as determined by Lipper. The Board considered a Portfolio’s ranking within a smaller group of peer funds chosen by Lipper (the “Expense Group”), as well as the Portfolio’s ranking within broader groups of funds (the “Expense Universe” and the “Sub-advised Expense Universe”). The Board also considered a Portfolio’s contractual sub-advisory fees, as applicable, as compared to the Sub-advised Expense Universe as well as a
MSF-31
Metropolitan Series Fund
Barclays Aggregate Bond Index Portfolio
Board of Trustees’ Consideration of Advisory and Sub-Advisory Agreements—(Continued)
smaller group of funds (the “Sub-advised Expense Group”). In comparing a Portfolio’s actual and contractual management fee to that of comparable funds, the Board noted that such fee includes both advisory and administrative fees.
The Board noted that the sub-advisory fees for the Portfolios are paid by the Adviser, not the Portfolios, out of the advisory fee. It was further noted that the Adviser negotiates such fees at arm’s length. The Board also considered that the Adviser had entered into expense limitation agreements with certain of the Portfolios, pursuant to which the Adviser has agreed to waive a portion of its advisory fee and/or reimburse certain expenses as a means of limiting a Portfolio’s total annual operating expenses. The Board further considered the amount of sub-advisory fees paid out by the Adviser and the amount of the management fees that it retained in light of the services performed by Sub-Advisers and Adviser, respectively.
With respect to the Barclays Aggregate Bond Index Portfolio, the Board considered that the Portfolio’s actual management fee and total expenses (exclusive of 12b-1 fees) were below the Expense Group median, the Expense Universe median and Sub-advised Expense Universe median. The Board noted that the Portfolio’s contractual management fees were below the asset-weighted average of the Expense Group at the Portfolio’s current size. The Board also noted that the Portfolio’s contractual sub-advisory fees were below the average of the Sub-advised Expense Group and Sub-advised Expense Universe at the Portfolio’s current size. The Board noted that the Adviser had waived fees and/or reimbursed expenses during the past year.
Profitability. The Board examined the profitability of the Adviser on a Portfolio-by-Portfolio basis. The Board also considered that the Distributor, MetLife Investors Distribution Company, receives Rule 12b-1 payments to support the distribution of the products. The Board considered the profitability to the Sub-Advisers and their affiliates as a result of their relationships with the Portfolios, and the Board considered the ability of the Adviser to negotiate the Sub-Advisory Agreements and the fees thereunder at arm’s length. The Board also reviewed Portfolio specific data with regard to the profitability of the Portfolios to each Sub-Adviser, as available.
Economies of scale. The Board also considered the effect of the Portfolios’ growth in size on their fees. The Board noted that the fee schedules for most of the Portfolios contain breakpoints that reduce the fee rate above specified asset levels. The Board noted those Portfolios that did not contain breakpoints in the advisory fee and took into account management’s discussion of the same. The Board noted that those Portfolios with advisory fee schedules containing breakpoints generally reflect the inclusion of breakpoints in the sub-advisory fee schedule for such Portfolios. The Board considered the effective fees under the Advisory Agreement for a Portfolio as a percentage of assets at different asset levels and possible economies of scale that may be realized if the assets of the Portfolio grow. Among other data, the Board examined the effect of a Portfolio’s growth in size on various fee schedules and reviewed the Lipper and Bobroff Reports, which compared fees among peers. The Board also generally noted that if a Portfolio’s assets increase over time, the Portfolio may realize other economies of scale if assets increase proportionally more than certain other fixed expenses. In addition, the Board noted that the Adviser had taken a number of steps to date intended to share the benefits of economies of scale with contractholders.
With respect to the Barclays Aggregate Bond Index Portfolio, the Board noted that the Portfolio’s advisory fee does not contain breakpoints. The Board noted that the Portfolio’s management fees were below the asset-weighted average of comparable funds at all asset levels. The Board considered the effect of the Portfolio’s current size and potential growth on its performance and fees. The Board noted management’s discussion of the Portfolio’s advisory fee structure. The Board also noted that if the Portfolio’s assets increased over time, the Portfolio might realize other economies of scale if assets increased proportionally more than certain other fixed expenses.
Other factors. As part of its evaluation of the Adviser’s compensation, the Board considered other benefits that may be realized by the Adviser and its affiliates from their relationship with the Trusts. Among them, the Board recognized that an affiliate of the Adviser, MetLife Investors Distribution Company, serves as the Distributor for the Trusts, and, as such, receives payments pursuant to Rule 12b-1 from the Portfolios to compensate it for providing shareholder services and selling activities, which could lead to growth in the Trusts’ assets and corresponding benefits from such growth, including economies of scale. The Board also considered that affiliates of the Adviser may benefit from certain indirect tax benefits relating to dividend received deductions and foreign tax credits. In conjunction with these considerations, the Board noted the costs of providing investment management and other services to the Portfolios and the ongoing commitment of the Adviser to the Portfolios.
The Board considered other benefits that may be realized by each Sub-Adviser and its affiliates from their relationship with the Trusts, including the opportunity to provide advisory services to additional portfolios of the Trusts and reputational benefits. In conjunction with these considerations, the Board noted the costs of providing investment advisory services to the Portfolios and the ongoing commitment of the Sub-Advisers to the Portfolios.
MSF-32
Metropolitan Series Fund
Barclays Aggregate Bond Index Portfolio
Board of Trustees’ Consideration of Advisory and Sub-Advisory Agreements—(Continued)
The Board considered possible conflicts of interest in the form of material benefits or detriments to the Trusts resulting from the nature of the Trusts’ and the Adviser’s or the Sub-Advisers’ affiliations and the services that are provided to the Trusts, and the manner in which such conflicts were mitigated.
Conclusions. After full consideration of the factors discussed above, the Board, including a majority of the Independent Trustees, approved the Advisory Agreement and the Sub-Advisory Agreement, as applicable, with respect to each Portfolio, unless otherwise noted. In making its approvals, the Board concluded that the nature, extent and quality of services provided by the Adviser and each Sub-Adviser supported the renewal of the Agreements. The Board also concluded that the investment performance of each Fund was such that each Agreement should continue. In addition, the Board concluded that fees paid by a Portfolio to the Adviser and, if applicable, the Sub-Adviser appeared to be acceptable in light of nature, extent and quality of the services provided by the Adviser and Sub-Adviser. Further, the Board concluded that the Adviser’s profitability in providing services under the Advisory Agreements did not appear unreasonably high in light of the nature, extent and quality of the services provided by the Adviser. Finally, the Board concluded that the Advisory and Sub-Advisory fees in some measure share economies of scale with contractholders. In approving the renewal of each of the Agreements, the Board, including the Independent Trustees, did not identify any single factor as controlling, and generally attributed different weights to various factors for the various Portfolios. The Board evaluated all information available to them on a Portfolio-by-Portfolio basis, and their decisions were made separately with respect to each Portfolio.
MSF-33
Metropolitan Series Fund
BlackRock Bond Income Portfolio
Managed by BlackRock Advisors, LLC
Portfolio Manager Commentary*
PERFORMANCE
For the one year period ended December 31, 2013, the Class A, B, and E shares of the BlackRock Bond Income Portfolio returned -0.77%, -1.01%, and -0.91%, respectively. The Portfolio’s benchmark, the Barclays U.S. Aggregate Bond Index1, returned -2.02%.
MARKET ENVIRONMENT / CONDITIONS
The first quarter of 2013 was characterized by Japan’s flooding of the global financial markets with liquidity, which served to buoy all assets, including the very expensive risk-free rates in the beginning of the year.
During the second quarter of the year, interest rates rose sharply when markets misinterpreted the Federal Reserve’s (the “Fed”) announcement that it might consider tapering (reducing) its bond-buying program in the fourth quarter of 2013 as a precursor to increasing interest rates toward year end. The uncertainty and resulting volatility also had an impact on credit markets, which witnessed spread widening across all sectors, including corporate credit and structured products.
During the third quarter, two events occurred that led to an uptick in risk sentiment within fixed income markets. First, Larry Summers withdrew from the race for the chairmanship of the Fed. Second, the Fed surprised markets by deciding to refrain from tapering its bond-buying program due to a tightening of financial conditions. However, volatility returned to the markets toward the end of September due to the threat of a U.S. government shut-down and prolonged political wrangling over the debt ceiling issue.
During the last quarter of the year, U.S. Treasury rates generally rose across the yield curve. In December, the 5- to 10- year part of the yield curve significantly underperformed 30-year rates. About half of the rise in rates occurred in the first half of the month, consistent with stronger economic data releases in the U.S., and anticipation that the Fed may start to taper its bond-buying program sooner rather than later.
In light of stronger U.S. economic data, consistent labor market improvement, and reduced political risk, the Fed announced that it would reduce the pace of bond purchases beginning in January 2014 by $10 billion per month, split evenly between agency mortgage-backed securities (MBS) and U.S. Treasuries. Simultaneously, the Fed decided to provide qualitative enhancements to its “forward guidance” on interest rate policy. Specifically, new language was added to the statement, and the Fed’s expected path for policy rates shown in the Summary Economic Projections indicated a 25-basis-point reduction in the median value of the federal funds rate at the end of 2016. We believe that this qualitative guidance leaves the front end of the U.S. Treasury curve more vulnerable to positive data surprises which would lead to an increase in yield in the front end of the U.S. Treasury curve.
PORTFOLIO REVIEW / PERIOD END POSITIONING
The Portfolio maintained a neutral duration bias relative to its benchmark index for most of the period.
Throughout the one year period, the Portfolio was overweight relative to its benchmark index in non-government spread sectors and underweight in government-owned/government-related sectors which contributed to performance.
Corporate credit (mainly in the Industrials sector and high yield market) contributed significantly toward performance. Security selection and sector allocation within structured products (commercial mortgage-backed securities (CMBS), asset-backed securities (ABS), agency and non-agency residential MBS) also added to performance. Rounding out the contributors to performance was the Portfolio’s allocation to non-U.S. securities and currencies, particularly the euro and the Australian dollar.
On the negative side, detractors from Portfolio performance included an allocation to Treasury Inflation-Protected Securities (TIPS). Security selection in U.S. Treasuries, and an allocation to agency MBS, particularly 30-year pass-through securities, also detracted from performance.
At the end of the period, the Portfolio was overweight relative to the benchmark index in CMBS and ABS, with non-benchmark allocations to high yield bonds, non-agency residential MBS and TIPS. The Portfolio was underweight in investment grade credit, agency MBS, agency debentures and U.S. Treasuries. The Portfolio ended the period with a neutral duration versus the benchmark.
MSF-1
Metropolitan Series Fund
BlackRock Bond Income Portfolio
Managed by BlackRock Advisors, LLC
Portfolio Manager Commentary*—(Continued)
The Portfolio held derivatives during the period as a part of its investment strategy. Derivatives are used by the portfolio management team as a means to hedge and/or take outright views on interest rates, credit risk and/or foreign exchange positions in the Portfolio. Specifically, the Portfolio used Treasury futures to express a neutral bias for most of the period. In addition, the Portfolio held a yield-curve-flattening bias in the short end and a steepening bias in the long end of the curve, expressed by a combination of long-dated Treasury securities and short-to-intermediate Treasury futures. The overall impact of duration and yield curve positioning on performance was neutral over the period.
Rick Rieder
Bob Miller
Portfolio Managers
BlackRock Advisors, LLC
* This commentary may include statements that constitute “forward-looking statements” under the U.S. securities laws. Forward-looking statements include, among other things, projections, estimates, and information about possible or future results related to the Portfolio, market or regulatory developments. The views expressed above are not guarantees of future performance or economic results and involve certain risks, uncertainties and assumptions that could cause actual outcomes and results to differ materially from the views expressed herein. The views expressed above are subject to change at any time based upon economic, market, or other conditions and the subadvisory firm undertakes no obligation to update the views expressed herein. Any discussions of specific securities should not be considered a recommendation to buy or sell those securities. The views expressed above (including any forward-looking statement) may not be relied upon as investment advice or as an indication of the Portfolio’s trading intent. Information about the Portfolio’s holdings, asset allocation or country diversification is historical and is not an indication of future Portfolio composition, which may vary. Direct investment in any index is not possible. The performance of any index mentioned in this commentary has not been adjusted for ongoing management, distribution and operating expenses, and sales charges applicable to mutual fund investments. In addition, the returns do not reflect additional fees charged by separate accounts or variable insurance contracts that an investor in the Portfolio may pay. If these additional fees were reflected, performance would have been lower.
MSF-2
Metropolitan Series Fund
BlackRock Bond Income Portfolio
A $10,000 INVESTMENT COMPARED TO THE BARCLAYS U.S. AGGREGATE BOND INDEX

AVERAGE ANNUAL RETURNS (%) (FOR THE YEAR ENDED DECEMBER 31, 2013)
| | | | | | | | | | | | |
| | | 1 Year | | | 5 Year | | | 10 Year | |
| BlackRock Bond Income Portfolio | | | | | | | | | | | | |
Class A | | | -0.77 | | | | 6.17 | | | | 4.45 | |
Class B | | | -1.01 | | | | 5.90 | | | | 4.19 | |
Class E | | | -0.91 | | | | 6.01 | | | | 4.30 | |
| Barclays U.S. Aggregate Bond Index | | | -2.02 | | | | 4.44 | | | | 4.55 | |
1 Barclays U.S. Aggregate Bond Index is a broad based benchmark that measures the investment grade, U.S. dollar-denominated, fixed-rate taxable bond market, including Treasuries, government-related and corporate securities, mortgage-backed securities, asset-backed securities, and commercial mortgage-backed securities.
Portfolio performance is calculated including reinvestment of all income and capital gain distributions. Performance numbers are net of all Portfolio expenses but do not include any insurance, sales, separate account or administrative charges of variable annuity or life insurance contracts or any additional expenses that participants may bear relating to the operations of their plans. If these charges were included, the returns would be lower. The performance of any index referenced above has not been adjusted for ongoing management, distribution and operating expenses, and sales charges applicable to mutual fund investments. Direct investment in any index is not possible. The performance of Class A shares, as set forth in the line graph above, will differ from that of other classes because of the difference in expenses paid by policyholders investing in the different share classes.
This information represents past performance and is not indicative of future results. Investment return and principal value may fluctuate so that shares, upon redemption, may be worth more or less than the original cost.
PORTFOLIO COMPOSITION AS OF DECEMBER 31, 2013
Top Sectors
| | | | |
| | | % of
Market Value of
Total Long-Term Investments | |
| U.S. Treasury & Government Agencies | | | 46.1 | |
| Corporate Bonds & Notes | | | 21.6 | |
| Asset-Backed Securities | | | 18.4 | |
| Mortgage-Backed Securities | | | 12.1 | |
| Foreign Government | | | 1.0 | |
| Floating Rate Loans | | | 0.4 | |
| Preferred Stocks | | | 0.2 | |
| Municipals | | | 0.1 | |
| Purchased Options | | | 0.1 | |
MSF-3
Metropolitan Series Fund
BlackRock Bond Income Portfolio
Understanding Your Portfolio’s Expenses
Shareholder Expense Example
As a shareholder of the Portfolio, you incur ongoing costs, including management fees; distribution and service (12b-1) fees; and other Portfolio expenses. This example is intended to help you understand your ongoing costs (in dollars) (referred to as “expenses”) of investing in the Portfolio and compare these costs with the ongoing costs of investing in other mutual funds. The example is based on an investment of $1,000 invested at the beginning of the period and held for the entire period, July 1, 2013 through December 31, 2013.
Actual Expenses
The first line for each share class of the Portfolio in the table below provides information about actual account values and actual expenses. You may use the information in this line, together with the amount you invested in the particular share class of the Portfolio, to estimate the expenses that you paid over the period. Simply divide your account value by $1,000 (for example, an $8,600 account value divided by $1,000 = 8.6), then multiply the result by the number in the first line under the heading entitled “Expenses Paid During Period” to estimate the expenses you paid on your account during this period.
Hypothetical Example for Comparison Purposes
The second line for each share class of the Portfolio in the table below provides information about hypothetical account values and hypothetical expenses based on the Portfolio’s actual expense ratio and an assumed rate of return of 5% per year before expenses, which is not the Portfolio’s actual return. The hypothetical account values and expenses may not be used to estimate the actual ending account balance or expenses you paid for the period. You may use this information to compare the ongoing costs of investing in the Portfolio and other funds. To do so, compare this 5% hypothetical example with the 5% hypothetical examples that appear in the shareholder reports of the other funds.
Please note that the expenses shown in the table are meant to highlight your ongoing costs only and do not reflect any fees or charges of your variable insurance product or any additional expenses that participants in certain eligible qualified plans may bear relating to the operations of their plan. Therefore, the second line for each share class in the table is useful in comparing ongoing costs only, and will not help you determine the relative total costs of owning different funds. In addition, if these other costs were included, your costs would have been higher.
| | | | | | | | | | | | | | | | | | |
BlackRock Bond Income Portfolio | | | | Annualized
Expense
Ratio | | | Beginning
Account Value
July 1,
2013 | | | Ending
Account Value
December 31,
2013 | | | Expenses Paid
During Period**
July 1, 2013
to
December 31,
2013 | |
Class A | | Actual | | | 0.35 | % | | $ | 1,000.00 | | | $ | 1,011.10 | | | $ | 1.77 | |
| | Hypothetical* | | | 0.35 | % | | $ | 1,000.00 | | | $ | 1,023.44 | | | $ | 1.79 | |
| | | | | |
Class B | | Actual | | | 0.60 | % | | $ | 1,000.00 | | | $ | 1,009.90 | | | $ | 3.04 | |
| | Hypothetical* | | | 0.60 | % | | $ | 1,000.00 | | | $ | 1,022.18 | | | $ | 3.06 | |
| | | | | |
Class E | | Actual | | | 0.50 | % | | $ | 1,000.00 | | | $ | 1,010.30 | | | $ | 2.53 | |
| | Hypothetical* | | | 0.50 | % | | $ | 1,000.00 | | | $ | 1,022.69 | | | $ | 2.55 | |
* Hypothetical assumes a rate of return of 5% per year before expenses.
** Expenses paid are equal to the Portfolio’s annualized expense ratio for the most recent six month period, as shown above, multiplied by the average account value over the period, multiplied by the number of days (184 days) in the most recent fiscal half-year, divided by 365 (to reflect the one-half year period).
MSF-4
Metropolitan Series Fund
BlackRock Bond Income Portfolio
Schedule of Investments as of December 31, 2013
U.S. Treasury & Government Agencies—51.7% of Net Assets
| | | | | | | | |
| Security Description | | Principal
Amount* | | | Value | |
|
Agency Sponsored Mortgage-Backed—35.8% | |
Fannie Mae 15 Yr. Pool | | | | | | | | |
2.500%, 09/01/27 | | | 54,810,085 | | | $ | 54,308,022 | |
3.000%, TBA (a) | | | 32,400,000 | | | | 33,064,453 | |
3.500%, 07/01/28 | | | 3,777,412 | | | | 3,960,444 | |
3.500%, TBA (a) | | | 15,700,000 | | | | 16,418,153 | |
4.000%, 01/01/25 | | | 45,159 | | | | 48,339 | |
4.000%, 02/01/25 | | | 8,190,005 | | | | 8,684,501 | |
4.000%, 09/01/25 | | | 1,504,373 | | | | 1,594,581 | |
4.000%, 10/01/25 | | | 4,292,285 | | | | 4,551,092 | |
4.000%, 01/01/26 | | | 1,272,870 | | | | 1,349,641 | |
4.000%, 04/01/26 | | | 798,965 | | | | 851,623 | |
4.000%, 07/01/26 | | | 3,693,688 | | | | 3,916,219 | |
4.000%, 08/01/26 | | | 1,622,330 | | | | 1,720,180 | |
4.500%, 12/01/20 | | | 2,772,457 | | | | 2,954,355 | |
4.500%, 02/01/25 | | | 1,680,792 | | | | 1,789,140 | |
4.500%, 04/01/25 | | | 287,058 | | | | 305,588 | |
4.500%, 07/01/25 | | | 1,169,870 | | | | 1,245,517 | |
4.500%, 06/01/26 | | | 24,773,964 | | | | 26,366,533 | |
4.500%, TBA (a) | | | 12,900,000 | | | | 13,725,902 | |
5.000%, 09/01/35 | | | 16,256 | | | | 17,710 | |
5.500%, 11/01/32 | | | 298,896 | | | | 329,259 | |
Fannie Mae 20 Yr. Pool | | | | | | | | |
5.000%, 05/01/23 | | | 7,560 | | | | 8,205 | |
Fannie Mae 30 Yr. Pool | | | | | | | | |
3.000%, 01/01/43 | | | 5,220,726 | | | | 4,961,976 | |
3.000%, 02/01/43 | | | 15,400,543 | | | | 14,639,974 | |
3.000%, 03/01/43 | | | 31,403,262 | | | | 29,850,449 | |
3.000%, 04/01/43 | | | 21,671,304 | | | | 20,602,761 | |
3.000%, 05/01/43 | | | 29,900,533 | | | | 28,426,992 | |
3.000%, 06/01/43 | | | 3,700,666 | | | | 3,518,998 | |
3.000%, 08/01/43 | | | 11,555,000 | | | | 10,960,615 | |
3.000%, TBA (a) | | | 2,400,000 | | | | 2,278,313 | |
3.500%, 06/01/42 | | | 694,920 | | | | 691,676 | |
3.500%, 07/01/42 | | | 543,070 | | | | 540,366 | |
3.500%, 02/01/43 | | | 1,921,048 | | | | 1,912,081 | |
3.500%, 03/01/43 | | | 496,091 | | | | 493,473 | |
3.500%, 04/01/43 | | | 9,799,752 | | | | 9,739,714 | |
3.500%, 05/01/43 | | | 1,271,808 | | | | 1,265,104 | |
3.500%, 06/01/43 | | | 1,384,149 | | | | 1,377,290 | |
3.500%, 07/01/43 | | | 9,321,030 | | | | 9,275,080 | |
3.500%, 08/01/43 | | | 37,526,496 | | | | 37,343,921 | |
3.500%, 11/01/43 | | | 2,926,562 | | | | 2,912,949 | |
3.500%, 12/01/43 | | | 299,719 | | | | 298,232 | |
4.000%, 05/01/42 | | | 1,161,265 | | | | 1,200,854 | |
4.000%, 02/01/43 | | | 3,219,951 | | | | 3,324,897 | |
4.000%, 08/01/43 | | | 3,994,202 | | | | 4,120,655 | |
4.000%, 09/01/43 | | | 1,407,711 | | | | 1,452,183 | |
4.000%, 10/01/43 | | | 10,720,252 | | | | 11,043,491 | |
4.000%, 11/01/43 | | | 2,219,874 | | | | 2,286,680 | |
4.000%, 12/01/43 | | | 28,154,193 | | | | 29,039,601 | |
4.000%, 01/01/44 | | | 22,395,223 | | | | 23,101,952 | |
4.000%, TBA (a) | | | 24,800,000 | | | | 25,528,500 | |
4.500%, 11/01/39 | | | 659,505 | | | | 703,058 | |
4.500%, 08/01/41 | | | 290,033 | | | | 307,448 | |
4.500%, 09/01/41 | | | 1,814,501 | | | | 1,923,410 | |
4.500%, 06/01/42 | | | 12,647,954 | | | | 13,435,302 | |
|
Agency Sponsored Mortgage-Backed—(Continued) | |
Fannie Mae 30 Yr. Pool | | | | | | | | |
4.500%, 08/01/42 | | | 2,455,525 | | | | 2,605,167 | |
4.500%, 08/01/43 | | | 502,197 | | | | 532,637 | |
4.500%, 09/01/43 | | | 32,553,918 | | | | 34,539,611 | |
4.500%, 10/01/43 | | | 5,018,899 | | | | 5,325,880 | |
4.500%, 12/01/43 | | | 4,300,000 | | | | 4,561,962 | |
5.000%, 11/01/32 | | | 25,256 | | | | 27,538 | |
5.000%, 03/01/33 | | | 20,108 | | | | 21,827 | |
5.000%, 04/01/33 | | | 144,534 | | | | 157,561 | |
5.000%, 07/01/33 | | | 240,844 | | | | 262,237 | |
5.000%, 08/01/33 | | | 32,489 | | | | 35,288 | |
5.000%, 09/01/33 | | | 4,077,645 | | | | 4,442,234 | |
5.000%, 11/01/33 | | | 973,988 | | | | 1,061,062 | |
5.000%, 12/01/33 | | | 398,872 | | | | 434,489 | |
5.000%, 02/01/34 | | | 157,150 | | | | 171,159 | |
5.000%, 03/01/34 | | | 120,244 | | | | 130,811 | |
5.000%, 04/01/34 | | | 43,192 | | | | 46,992 | |
5.000%, 06/01/34 | | | 69,929 | | | | 76,047 | |
5.000%, 07/01/34 | | | 7,847,241 | | | | 8,526,506 | |
5.000%, 10/01/34 | | | 3,294,844 | | | | 3,589,706 | |
5.000%, 12/01/34 | | | 114,543 | | | | 124,645 | |
5.000%, 04/01/35 | | | 13,207 | | | | 14,362 | |
5.000%, 07/01/35 | | | 9,830,921 | | | | 10,705,390 | |
5.000%, 10/01/35 | | | 6,052,027 | | | | 6,591,679 | |
5.000%, 12/01/35 | | | 1,849,045 | | | | 2,008,912 | |
5.000%, 08/01/36 | | | 1,792,007 | | | | 1,946,414 | |
5.000%, 07/01/37 | | | 890,983 | | | | 970,453 | |
5.000%, 11/01/40 | | | 10,483,161 | | | | 11,411,092 | |
5.000%, 04/01/41 | | | 141,351 | | | | 154,212 | |
5.000%, 07/01/41 | | | 977,181 | | | | 1,066,304 | |
5.000%, 08/01/41 | | | 1,235,637 | | | | 1,348,968 | |
5.000%, 01/01/42 | | | 388,128 | | | | 423,287 | |
5.500%, 11/01/32 | | | 3,571,215 | | | | 3,939,740 | |
5.500%, 12/01/32 | | | 587,410 | | | | 647,380 | |
5.500%, 01/01/33 | | | 2,676,755 | | | | 2,952,692 | |
5.500%, 12/01/33 | | | 725,424 | | | | 799,333 | |
5.500%, 08/01/37 | | | 6,151,889 | | | | 6,770,782 | |
5.500%, 04/01/41 | | | 1,047,353 | | | | 1,159,209 | |
5.500%, 06/01/41 | | | 9,728,488 | | | | 10,602,827 | |
5.500%, TBA (a) | | | 5,000,000 | | | | 5,499,804 | |
6.000%, 02/01/34 | | | 621,137 | | | | 696,954 | |
6.000%, 08/01/34 | | | 484,998 | | | | 544,390 | |
6.000%, 04/01/35 | | | 7,374,611 | | | | 8,275,077 | |
6.000%, 06/01/36 | | | 1,325,219 | | | | 1,478,423 | |
6.000%, 02/01/38 | | | 1,757,101 | | | | 1,950,026 | |
6.000%, 03/01/38 | | | 703,548 | | | | 782,715 | |
6.000%, 05/01/38 | | | 2,063,886 | | | | 2,292,543 | |
6.000%, 10/01/38 | | | 2,696,561 | | | | 2,985,818 | |
6.000%, 12/01/38 | | | 810,865 | | | | 901,418 | |
6.000%, 04/01/40 | | | 8,549,808 | | | | 9,460,092 | |
6.000%, 09/01/40 | | | 872,959 | | | | 965,707 | |
6.000%, 06/01/41 | | | 1,774,267 | | | | 1,963,959 | |
6.000%, TBA (a) | | | 4,400,000 | | | | 4,876,094 | |
6.500%, 05/01/40 | | | 13,540,191 | | | | 15,042,676 | |
Fannie Mae ARM Pool | | | | | | | | |
3.011%, 03/01/41 (b) | | | 994,404 | | | | 1,049,397 | |
See accompanying notes to financial statements.
MSF-5
Metropolitan Series Fund
BlackRock Bond Income Portfolio
Schedule of Investments as of December 31, 2013
U.S. Treasury & Government Agencies—(Continued)
| | | | | | | | |
| Security Description | | Principal
Amount* | | | Value | |
|
Agency Sponsored Mortgage-Backed—(Continued) | |
Fannie Mae ARM Pool | | | | | | | | |
3.131%, 03/01/41 (b) | | | 1,205,018 | | | $ | 1,264,963 | |
3.222%, 12/01/40 (b) | | | 2,209,723 | | | | 2,314,227 | |
3.355%, 06/01/41 (b) | | | 4,568,649 | | | | 4,786,846 | |
3.496%, 09/01/41 (b) | | | 3,416,143 | | | | 3,589,190 | |
4.978%, 08/01/38 (b) | | | 1,432,580 | | | | 1,531,832 | |
Fannie Mae REMICS | | | | | | | | |
5.000%, 04/25/35 | | | 375,135 | | | | 403,385 | |
Fannie Mae-ACES | | | | | | | | |
3.329%, 10/25/23 (b) | | | 4,390,000 | | | | 4,289,061 | |
Freddie Mac 15 Yr. Gold Pool | | | | | | | | |
3.000%, TBA (a) | | | 11,100,000 | | | | 11,305,523 | |
Freddie Mac 30 Yr. Gold Pool | | | | | | | | |
2.500%, TBA (a) | | | 19,100,000 | | | | 18,923,176 | |
3.000%, 03/01/43 | | | 4,628,083 | | | | 4,390,016 | |
3.000%, 04/01/43 | | | 27,205,485 | | | | 25,806,044 | |
3.500%, 04/01/42 | | | 3,161,480 | | | | 3,144,556 | |
3.500%, 08/01/42 | | | 2,769,310 | | | | 2,755,256 | |
3.500%, 09/01/42 | | | 1,734,344 | | | | 1,723,727 | |
3.500%, 11/01/42 | | | 3,408,194 | | | | 3,386,349 | |
3.500%, TBA (a) | | | 85,900,000 | | | | 85,228,906 | |
4.000%, TBA (a) | | | 46,900,000 | | | | 48,017,538 | |
4.500%, 09/01/43 | | | 3,371,513 | | | | 3,576,791 | |
4.500%, 11/01/43 | | | 7,166,559 | | | | 7,602,319 | |
4.500%, TBA (a) | | | 26,400,000 | | | | 27,842,718 | |
5.000%, TBA (a) | | | 29,100,000 | | | | 31,382,531 | |
5.500%, TBA (a) | | | 2,300,000 | | | | 2,510,594 | |
Freddie Mac ARM Non-Gold Pool | | | | | | | | |
3.029%, 02/01/41 (b) | | | 1,911,898 | | | | 2,020,100 | |
Freddie Mac Multifamily Structured Pass-Through Certificates | | | | | | | | |
0.903%, 10/25/22 (b) (c) | | | 52,645,618 | | | | 3,208,961 | |
0.903%, 09/25/22 (b) (c) | | | 41,771,770 | | | | 2,495,989 | �� |
1.512%, 06/25/22 (b) (c) | | | 16,691,182 | | | | 1,638,356 | |
1.557%, 12/25/18 (b) (c) | | | 24,860,172 | | | | 1,638,236 | |
1.743%, 03/25/22 (b) (c) | | | 12,156,541 | | | | 1,318,207 | |
1.751%, 08/25/16 (b) (c) | | | 12,016,562 | | | | 374,676 | |
1.783%, 05/25/19 (b) (c) | | | 20,468,017 | | | | 1,647,266 | |
2.637%, 01/25/23 | | | 12,385,000 | | | | 11,631,137 | |
3.060%, 07/25/23 (b) | | | 6,340,000 | | | | 6,105,984 | |
3.300%, 04/25/23 (b) | | | 8,770,000 | | | | 8,635,845 | |
3.458%, 08/25/23 (b) | | | 3,985,000 | | | | 3,960,014 | |
Ginnie Mae (CMO) | | | | | | | | |
1.015%, 02/16/53 (b) (c) | | | 27,964,765 | | | | 2,053,844 | |
Ginnie Mae I 15 Yr. Pool | | | | | | | | |
7.500%, 12/15/14 | | | 9,254 | | | | 9,378 | |
8.500%, 01/15/17 | | | 4,464 | | | | 4,552 | |
8.500%, 03/15/17 | | | 1,172 | | | | 1,177 | |
8.500%, 11/15/21 | | | 3,036 | | | | 3,050 | |
9.000%, 10/15/16 | | | 1,691 | | | | 1,699 | |
Ginnie Mae I 30 Yr. Pool | | | | | | | | |
3.500%, 02/15/42 | | | 495,878 | | | | 501,518 | |
3.500%, 04/15/42 | | | 674,433 | | | | 682,102 | |
3.500%, 05/15/42 | | | 594,313 | | | | 601,073 | |
3.500%, 08/15/42 | | | 917,027 | | | | 926,557 | |
3.500%, 11/15/42 | | | 694,129 | | | | 701,893 | |
3.500%, 12/15/42 | | | 1,967,460 | | | | 1,989,457 | |
|
Agency Sponsored Mortgage-Backed—(Continued) | |
Ginnie Mae I 30 Yr. Pool | | | | | | | | |
3.500%, 01/15/43 | | | 793,070 | | | | 801,935 | |
3.500%, 02/15/43 | | | 1,276,505 | | | | 1,290,809 | |
3.500%, 03/15/43 | | | 653,711 | | | | 660,471 | |
3.500%, 04/15/43 | | | 2,479,480 | | | | 2,507,371 | |
3.500%, 05/15/43 | | | 4,682,678 | | | | 4,735,429 | |
3.500%, 06/15/43 | | | 1,176,078 | | | | 1,189,353 | |
3.500%, 07/15/43 | | | 3,957,552 | | | | 4,002,280 | |
4.000%, 12/15/41 | | | 183,615 | | | | 191,084 | |
4.000%, 05/15/42 | | | 156,565 | | | | 162,913 | |
4.000%, 09/15/42 | | | 20,528,122 | | | | 21,401,049 | |
4.500%, 02/15/42 | | | 35,071,510 | | | | 37,656,439 | |
4.500%, TBA (a) | | | 17,300,000 | | | | 18,458,289 | |
5.000%, 12/15/38 | | | 1,001,193 | | | | 1,088,720 | |
5.000%, 07/15/39 | | | 2,582,746 | | | | 2,802,546 | |
5.000%, 12/15/40 | | | 3,484,913 | | | | 3,786,014 | |
5.000%, TBA (a) | | | 26,700,000 | | | | 28,939,254 | |
5.500%, 04/15/33 | | | 72,702 | | | | 80,487 | |
5.500%, TBA (a) | | | 12,500,000 | | | | 13,728,515 | |
6.500%, 04/15/33 | | | 55,834 | | | | 62,316 | |
8.000%, 11/15/29 | | | 6,441 | | | | 6,579 | |
8.500%, 05/15/17 | | | 589 | | | | 592 | |
8.500%, 05/15/22 | | | 1,374 | | | | 1,464 | |
Ginnie Mae II 30 Yr. Pool | | | | | | | | |
3.000%, TBA (a) | | | 37,600,000 | | | | 36,328,063 | |
3.500%, TBA (a) | | | 58,500,000 | | | | 59,014,162 | |
4.000%, 11/20/43 | | | 78,046,258 | | | | 81,338,817 | |
4.500%, 05/20/41 | | | 34,679,678 | | | | 37,226,414 | |
4.500%, 06/20/41 | | | 3,369,009 | | | | 3,616,422 | |
4.500%, 07/20/41 | | | 2,077,215 | | | | 2,229,762 | |
5.000%, 10/20/33 | | | 2,328,922 | | | | 2,554,501 | |
5.000%, 10/20/39 | | | 1,048,206 | | | | 1,147,875 | |
| | | | | | | | |
| | | | | | | 1,379,655,484 | |
| | | | | | | | |
|
Federal Agencies—0.2% | |
Federal National Mortgage Association | | | | | | | | |
5.125%, 01/02/14 | | | 7,095,000 | | | | 7,095,894 | |
| | | | | | | | |
|
U.S. Treasury—15.7% | |
U.S. Treasury Bonds | | | | | | | | |
2.750%, 08/15/42 | | | 11,015,000 | | | | 8,727,669 | |
2.750%, 11/15/42 | | | 465,000 | | | | 367,641 | |
3.750%, 11/15/43 | | | 83,265,000 | | | | 80,480,785 | |
U.S. Treasury Inflation Indexed Bonds | | | | | | | | |
0.750%, 02/15/42 | | | 14,352,369 | | | | 11,537,956 | |
U.S. Treasury Inflation Indexed Notes | | | | | | | | |
0.125%, 01/15/23 | | | 7,412,094 | | | | 7,000,375 | |
0.375%, 07/15/23 | | | 49,921,054 | | | | 48,146,510 | |
U.S. Treasury Notes | | | | | | | | |
0.250%, 05/31/15 | | | 29,515,000 | | | | 29,528,843 | |
0.250%, 11/30/15 (d) | | | 16,660,000 | | | | 16,626,813 | |
0.500%, 12/15/16 (d) | | | 118,365,000 | | | | 117,884,201 | |
1.000%, 11/30/19 (e) | | | 91,390,000 | | | | 85,870,866 | |
1.250%, 11/30/18 | | | 37,927,800 | | | | 37,115,917 | |
1.500%, 12/31/18 | | | 33,600,000 | | | | 33,222,000 | |
1.625%, 11/15/22 | | | 6,432,200 | | | | 5,806,064 | |
See accompanying notes to financial statements.
MSF-6
Metropolitan Series Fund
BlackRock Bond Income Portfolio
Schedule of Investments as of December 31, 2013
U.S. Treasury & Government Agencies—(Continued)
| | | | | | | | |
| Security Description | | Principal
Amount* | | | Value | |
|
U.S. Treasury—(Continued) | |
U.S. Treasury Notes | | | | | | | | |
2.000%, 11/30/20 | | | 43,625,000 | | | $ | 42,466,233 | |
2.750%, 11/15/23 | | | 79,760,000 | | | | 78,027,693 | |
| | | | | | | | |
| | | | | | | 602,809,566 | |
| | | | | | | | |
Total U.S. Treasury & Government Agencies
(Cost $2,020,929,340) | | | | | | | 1,989,560,944 | |
| | | | | | | | |
|
| Corporate Bonds & Notes—24.2% | |
|
Agriculture—0.3% | |
Altria Group, Inc. | | | | | | | | |
4.000%, 01/31/24 (f) | | | 2,617,000 | | | | 2,557,892 | |
Philip Morris International, Inc. | | | | | | | | |
1.875%, 01/15/19 (f) | | | 5,706,000 | | | | 5,576,206 | |
4.875%, 11/15/43 | | | 1,871,000 | | | | 1,853,469 | |
| | | | | | | | |
| | | | | | | 9,987,567 | |
| | | | | | | | |
|
Airlines—0.2% | |
United Continental Holdings, Inc. | | | | | | | | |
6.000%, 07/15/28 | | | 2,120,000 | | | | 1,786,100 | |
8.000%, 07/15/24 (f) | | | 6,465,000 | | | | 6,484,395 | |
| | | | | | | | |
| | | | | | | 8,270,495 | |
| | | | | | | | |
|
Auto Manufacturers—0.1% | |
General Motors Co. | | | | | | | | |
4.875%, 10/02/23 (144A) (f) | | | 2,350,000 | | | | 2,379,375 | |
6.250%, 10/02/43 (144A) | | | 1,410,000 | | | | 1,464,637 | |
Jaguar Land Rover Automotive plc | | | | | | | | |
8.250%, 03/15/20 (GBP) | | | 220,000 | | | | 412,580 | |
| | | | | | | | |
| | | | | | | 4,256,592 | |
| | | | | | | | |
|
Auto Parts & Equipment—0.0% | |
Servus Luxembourg Holding SCA | | | | | | | | |
7.750%, 06/15/18 (EUR) | | | 115,000 | | | | 166,432 | |
| | | | | | | | |
|
Banks—4.5% | |
ABN Amro Bank NV | | | | | | | | |
6.375%, 04/27/21 (EUR) | | | 880,000 | | | | 1,398,849 | |
Bank of America Corp. | | | | | | | | |
2.600%, 01/15/19 | | | 4,726,000 | | | | 4,746,861 | |
3.300%, 01/11/23 | | | 16,510,000 | | | | 15,622,868 | |
3.700%, 09/01/15 | | | 12,180,000 | | | | 12,731,888 | |
4.100%, 07/24/23 (f) | | | 13,875,000 | | | | 13,933,872 | |
Bank of New York Mellon Corp. (The) | | | | | | | | |
2.100%, 01/15/19 | | | 7,550,000 | | | | 7,483,560 | |
Caixa Economica Federal | | | | | | | | |
2.375%, 11/06/17 (144A) | | | 4,670,000 | | | | 4,337,263 | |
Citigroup, Inc. | | | | | | | | |
3.375%, 03/01/23 | | | 11,270,000 | | | | 10,712,304 | |
4.450%, 01/10/17 | | | 2,290,000 | | | | 2,481,900 | |
Commerzbank AG | | | | | | | | |
6.375%, 03/22/19 (EUR) | | | 2,300,000 | | | | 3,499,963 | |
|
Banks—(Continued) | |
Cooperatieve Centrale Raiffeisen-Boerenleenbank BA | | | | | | | | |
5.750%, 12/01/43 (f) | | | 1,338,000 | | | | 1,418,395 | |
Discover Bank | | | | | | | | |
7.000%, 04/15/20 (f) | | | 1,678,000 | | | | 1,951,492 | |
Goldman Sachs Group, Inc. (The) | | | | | | | | |
1.838%, 11/29/23 (b) | | | 7,855,000 | | | | 7,976,548 | |
3.625%, 02/07/16 | | | 3,045,000 | | | | 3,195,667 | |
3.625%, 01/22/23 (f) | | | 9,055,000 | | | | 8,768,437 | |
5.750%, 01/24/22 | | | 2,466,000 | | | | 2,775,947 | |
HSBC Bank Brasil S.A. - Banco Multiplo | | | | | | | | |
4.000%, 05/11/16 (144A) | | | 13,340,000 | | | | 13,556,775 | |
JPMorgan Chase & Co. | | | | | | | | |
3.200%, 01/25/23 | | | 1,740,000 | | | | 1,649,565 | |
3.250%, 09/23/22 | | | 3,110,000 | | | | 2,980,378 | |
4.750%, 03/01/15 | | | 6,090,000 | | | | 6,371,486 | |
Morgan Stanley | | | | | | | | |
3.450%, 11/02/15 | | | 9,985,000 | | | | 10,393,446 | |
3.750%, 02/25/23 (f) | | | 7,480,000 | | | | 7,278,526 | |
3.800%, 04/29/16 | | | 2,730,000 | | | | 2,887,876 | |
5.000%, 11/24/25 | | | 8,360,000 | | | | 8,384,996 | |
State Street Capital Trust IV | | | | | | | | |
1.243%, 06/01/77 (b) | | | 420,000 | | | | 317,310 | |
US Bancorp | | | | | | | | |
1.950%, 11/15/18 | | | 7,250,000 | | | | 7,211,118 | |
Wells Fargo & Co. | | | | | | | | |
1.500%, 07/01/15 | | | 3,045,000 | | | | 3,087,819 | |
2.150%, 01/15/19 | | | 2,688,000 | | | | 2,679,581 | |
5.375%, 11/02/43 | | | 2,540,000 | | | | 2,600,975 | |
| | | | | | | | |
| | | | | | | 172,435,665 | |
| | | | | | | | |
|
Beverages—0.0% | |
PepsiCo, Inc. | | | | | | | | |
3.600%, 08/13/42 | | | 1,100,000 | | | | 905,418 | |
| | | | | | | | |
|
Biotechnology—0.4% | |
Amgen, Inc. | | | | | | | | |
5.150%, 11/15/41 | | | 2,330,000 | | | | 2,321,346 | |
5.650%, 06/15/42 | | | 4,045,000 | | | | 4,283,801 | |
Life Technologies Corp. | | | | | | | | |
6.000%, 03/01/20 | | | 6,995,000 | | | | 8,037,402 | |
| | | | | | | | |
| | | | | | | 14,642,549 | |
| | | | | | | | |
|
Building Materials—0.0% | |
Buzzi Unicem S.p.A. | | | | | | | | |
6.250%, 09/28/18 (EUR) | | | 140,000 | | | | 216,441 | |
| | | | | | | | |
|
Chemicals—0.6% | |
LYB International Finance BV | | | | | | | | |
5.250%, 07/15/43 | | | 46,000 | | | | 46,241 | |
LyondellBasell Industries NV | | | | | | | | |
5.000%, 04/15/19 | | | 19,662,000 | | | | 21,837,030 | |
Rain CII Carbon LLC / CII Carbon Corp | | | | | | | | |
8.500%, 01/15/21 (EUR) | | | 260,000 | | | | 363,047 | |
| | | | | | | | |
| | | | | | | 22,246,318 | |
| | | | | | | | |
See accompanying notes to financial statements.
MSF-7
Metropolitan Series Fund
BlackRock Bond Income Portfolio
Schedule of Investments as of December 31, 2013
Corporate Bonds & Notes—(Continued)
| | | | | | | | |
| Security Description | | Principal
Amount* | | | Value | |
|
Coal—0.1% | |
CONSOL Energy, Inc. | | | | | | | | |
8.250%, 04/01/20 | | | 743,000 | | | $ | 804,297 | |
Peabody Energy Corp. | | | | | | | | |
6.000%, 11/15/18 (f) | | | 497,000 | | | | 529,305 | |
6.250%, 11/15/21 (f) | | | 2,913,000 | | | | 2,942,130 | |
| | | | | | | | |
| | | | | | | 4,275,732 | |
| | | | | | | | |
|
Commercial Services—0.3% | |
EC Finance plc | | | | | | | | |
9.750%, 08/01/17 (EUR) | | | 247,000 | | | | 370,284 | |
La Financiere Atalian S.A. | | | | | | | | |
7.250%, 01/15/20 (EUR) | | | 230,000 | | | | 335,168 | |
TMF Group Holding B.V. | | | | | | | | |
9.875%, 12/01/19 (EUR) | | | 250,000 | | | | 372,051 | |
United Rentals North America, Inc. | | | | | | | | |
7.625%, 04/15/22 | | | 8,490,000 | | | | 9,434,512 | |
Verisure Holding AB | | | | | | | | |
8.750%, 12/01/18 (EUR) | | | 230,000 | | | | 342,515 | |
| | | | | | | | |
| | | | | | | 10,854,530 | |
| | | | | | | | |
|
Computers—0.1% | |
International Business Machines Corp. | | | | | | | | |
3.375%, 08/01/23 | | | 5,595,000 | | | | 5,451,231 | |
| | | | | | | | |
|
Diversified Financial Services—0.6% | |
Discover Financial Services | | | | | | | | |
3.850%, 11/21/22 | | | 2,178,000 | | | | 2,065,114 | |
Ford Motor Credit Co. LLC | | | | | | | | |
4.375%, 08/06/23 (f) | | | 1,902,000 | | | | 1,912,193 | |
5.000%, 05/15/18 (f) | | | 11,145,000 | | | | 12,414,516 | |
Lehman Brothers Holdings, Inc. | | | | | | | | |
6.750%, 12/28/17 (g) (h) | | | 4,775,000 | | | | 477 | |
Novus USA Trust | | | | | | | | |
1.538%, 02/28/14 (144A) (b) | | | 8,330,000 | | | | 8,340,383 | |
| | | | | | | | |
| | | | | | | 24,732,683 | |
| | | | | | | | |
|
Electric—1.4% | |
Cleveland Electric Illuminating Co. (The) | | | | | | | | |
5.950%, 12/15/36 | | | 2,527,000 | | | | 2,573,087 | |
8.875%, 11/15/18 | | | 1,390,000 | | | | 1,758,133 | |
Dominion Gas Holdings LLC | | | | | | | | |
4.800%, 11/01/43 (144A) | | | 486,000 | | | | 469,887 | |
Dominion Resources, Inc. | | | | | | | | |
1.950%, 08/15/16 | | | 6,100,000 | | | | 6,200,937 | |
Duke Energy Carolinas LLC | | | | | | | | |
4.250%, 12/15/41 | | | 3,680,000 | | | | 3,426,522 | |
Duke Energy Florida, Inc. | | | | | | | | |
6.400%, 06/15/38 | | | 1,300,000 | | | | 1,602,835 | |
Energy Future Intermediate Holding Co. LLC / EFIH Finance, Inc. | | | | | | | | |
10.000%, 12/01/20 | | | 18,170,000 | | | | 19,305,625 | |
Georgia Power Co. | | | | | | | | |
3.000%, 04/15/16 | | | 5,930,000 | | | | 6,181,331 | |
Jersey Central Power & Light Co. | | | | | | | | |
7.350%, 02/01/19 | | | 2,335,000 | | | | 2,757,416 | |
|
Electric—(Continued) | |
MidAmerican Energy Holdings Co. | | | | | | | | |
6.500%, 09/15/37 | | | 4,650,000 | | | | 5,401,161 | |
PacifiCorp | | | | | | | | |
4.100%, 02/01/42 | | | 2,700,000 | | | | 2,439,064 | |
Southern Co. (The) | | | | | | | | |
1.950%, 09/01/16 | | | 2,603,000 | | | | 2,656,408 | |
| | | | | | | | |
| | | | | | | 54,772,406 | |
| | | | | | | | |
|
Electronics—0.3% | |
Rexel S.A. | | | | | | | | |
5.125%, 06/15/20 (EUR) | | | 2,047,000 | | | | 2,958,549 | |
Thermo Fisher Scientific, Inc. | | | | | | | | |
2.400%, 02/01/19 | | | 6,712,000 | | | | 6,649,518 | |
5.300%, 02/01/44 | | | 511,000 | | | | 516,710 | |
Trionista Holdco GmbH | | | | | | | | |
5.000%, 04/30/20 (EUR) | | | 306,000 | | | | 432,541 | |
Trionista TopCo GmbH | | | | | | | | |
6.875%, 04/30/21 (EUR) | | | 131,000 | | | | 190,129 | |
| | | | | | | | |
| | | | | | | 10,747,447 | |
| | | | | | | | |
|
Engineering & Construction—0.1% | |
Odebrecht Offshore Drilling Finance, Ltd. | | | | | | | | |
6.750%, 10/01/22 (144A) | | | 3,222,596 | | | | 3,298,327 | |
| | | | | | | | |
|
Entertainment—0.0% | |
Gala Group Finance plc | | | | | | | | |
8.875%, 09/01/18 (GBP) | | | 210,000 | | | | 374,533 | |
GLP Capital L.P. / GLP Financing II, Inc. | | | | | | | | |
4.375%, 11/01/18 (144A) | | | 264,000 | | | | 269,940 | |
4.875%, 11/01/20 (144A) | | | 415,000 | | | | 415,000 | |
| | | | | | | | |
| | | | | | | 1,059,473 | |
| | | | | | | | |
|
Food—0.2% | |
Bakkavor Finance 2 plc | | | | | | | | |
8.750%, 06/15/20 (GBP) | | | 180,000 | | | | 324,898 | |
WM Wrigley Jr. Co.
2.900%, 10/21/19 (144A) | | | 6,381,000 | | | | 6,328,248 | |
| | | | | | | | |
| | | | | | | 6,653,146 | |
| | | | | | | | |
| | |
Forest Products & Paper—0.4% | | | | | | | | |
International Paper Co.
4.750%, 02/15/22 (f) | | | 15,469,000 | | | | 16,218,024 | |
| | | | | | | | |
| | |
Healthcare - Products—0.4% | | | | | | | | |
Boston Scientific Corp.
2.650%, 10/01/18 (f) | | | 8,781,000 | | | | 8,840,737 | |
Edwards Lifesciences Corp.
2.875%, 10/15/18 | | | 6,676,000 | | | | 6,637,039 | |
IDH Finance plc
6.000%, 12/01/18 (GBP) | | | 209,000 | | | | 349,555 | |
Ontex IV S.A.
9.000%, 04/15/19 (EUR) | | | 240,000 | | | | 358,232 | |
| | | | | | | | |
| | | | | | | 16,185,563 | |
| | | | | | | | |
See accompanying notes to financial statements.
MSF-8
Metropolitan Series Fund
BlackRock Bond Income Portfolio
Schedule of Investments as of December 31, 2013
Corporate Bonds & Notes—(Continued)
| | | | | | | | |
| Security Description | | Principal
Amount* | | | Value | |
| | |
Healthcare - Services—0.8% | | | | | | | | |
Coventry Health Care, Inc.
5.450%, 06/15/21 | | | 4,598,000 | | | $ | 5,115,850 | |
HCA, Inc.
7.250%, 09/15/20 | | | 8,300,000 | | | | 9,047,000 | |
Priory Group No. 3 plc
7.000%, 02/15/18 (GBP) | | | 270,000 | | | | 470,579 | |
Tenet Healthcare Corp.
6.250%, 11/01/18 (f) | | | 4,710,000 | | | | 5,216,325 | |
UnitedHealth Group, Inc.
3.375%, 11/15/21 | | | 1,560,000 | | | | 1,540,751 | |
WellPoint, Inc. | | | | | | | | |
1.875%, 01/15/18 | | | 5,170,000 | | | | 5,112,153 | |
2.300%, 07/15/18 | | | 4,280,000 | | | | 4,246,034 | |
| | | | | | | | |
| | | | | | | 30,748,692 | |
| | | | | | | | |
| |
Holding Companies - Diversified—0.0% | | | | | |
Odeon & UCI Finco plc
9.000%, 08/01/18 (GBP) | | | 109,000 | | | | 182,304 | |
| | | | | | | | |
| | |
Home Furnishings—0.0% | | | | | | | | |
DFS Furniture Holdings plc
7.625%, 08/15/18 (GBP) | | | 215,000 | | | | 380,261 | |
Magnolia BC S.A.
9.000%, 08/01/20 (EUR) | | | 100,000 | | | | 144,531 | |
| | | | | | | | |
| | | | | | | 524,792 | |
| | | | | | | | |
| | |
Household Products/Wares—0.4% | | | | | | | | |
Reynolds Group Issuer, Inc. / Reynolds Group Issuer LLC / Reynolds Group Issuer Lu | | | | | | | | |
6.875%, 02/15/21 (f) | | | 8,495,000 | | | | 9,153,362 | |
7.875%, 08/15/19 | | | 5,195,000 | | | | 5,740,475 | |
| | | | | | | | |
| | | | | | | 14,893,837 | |
| | | | | | | | |
| | |
Insurance—1.5% | | | | | | | | |
American International Group, Inc. | | | | | | | | |
3.375%, 08/15/20 (f) | | | 6,820,000 | | | | 6,859,665 | |
3.800%, 03/22/17 | | | 9,900,000 | | | | 10,572,200 | |
4.125%, 02/15/24 | | | 3,964,000 | | | | 3,941,021 | |
5.450%, 05/18/17 | | | 3,540,000 | | | | 3,956,729 | |
8.175%, 05/15/68 (b) | | | 3,600,000 | | | | 4,356,000 | |
Manulife Financial Corp.
3.400%, 09/17/15 | | | 1,510,000 | | | | 1,571,803 | |
Muenchener Rueckversicherungs AG
6.000%, 05/26/41 (EUR) (b) | | | 900,000 | | | | 1,432,054 | |
Prudential Financial, Inc. | | | | | | | | |
4.500%, 11/15/20 (f) | | | 2,500,000 | | | | 2,681,980 | |
4.750%, 09/17/15 | | | 4,010,000 | | | | 4,273,224 | |
5.375%, 06/21/20 (f) | | | 3,000,000 | | | | 3,390,339 | |
5.875%, 09/15/42 (b) (f) | | | 1,013,000 | | | | 1,029,461 | |
7.375%, 06/15/19 | | | 3,860,000 | | | | 4,738,872 | |
XL Group plc
6.500%, 04/15/17 (b) | | | 7,400,000 | | | | 7,279,750 | |
| | |
Insurance—(Continued) | | | | | | | | |
XLIT, Ltd. | | | | | | | | |
2.300%, 12/15/18 | | | 1,913,000 | | | | 1,878,927 | |
5.250%, 12/15/43 (f) | | | 871,000 | | | | 876,834 | |
| | | | | | | | |
| | | | | | | 58,838,859 | |
| | | | | | | | |
| | |
Internet—0.0% | | | | | | | | |
Cerved Group S.p.A.
8.000%, 01/15/21 (EUR) | | | 230,000 | | | | 334,858 | |
| | | | | | | | |
| | |
Leisure Time—0.0% | | | | | | | | |
Carnival Corp.
3.950%, 10/15/20 | | | 1,087,000 | | | | 1,087,839 | |
Cirsa Funding Luxembourg S.A.
8.750%, 05/15/18 (EUR) | | | 268,000 | | | | 390,809 | |
| | | | | | | | |
| | | | | | | 1,478,648 | |
| | | | | | | | |
| | |
Lodging—0.3% | | | | | | | | |
Paris Las Vegas Holding LLC | | | | | | | | |
8.000%, 10/01/20 (144A) (f) | | | 4,526,000 | | | | 4,707,040 | |
11.000%, 10/01/21 (144A) (f) | | | 5,018,000 | | | | 5,143,450 | |
| | | | | | | | |
| | | | | | | 9,850,490 | |
| | | | | | | | |
| | |
Media—2.2% | | | | | | | | |
CBS Corp. | | | | | | | | |
4.625%, 05/15/18 (f) | | | 1,525,000 | | | | 1,653,222 | |
5.750%, 04/15/20 | | | 770,000 | | | | 864,343 | |
8.875%, 05/15/19 | | | 2,705,000 | | | | 3,458,424 | |
Comcast Cable Communications LLC
8.500%, 05/01/27 | | | 2,400,000 | | | | 3,150,074 | |
Comcast Corp. | | | | | | | | |
4.650%, 07/15/42 | | | 5,987,000 | | | | 5,571,526 | |
5.875%, 02/15/18 | | | 2,684,000 | | | | 3,078,532 | |
COX Communications, Inc. | | | | | | | | |
4.700%, 12/15/42 (144A) | | | 2,559,000 | | | | 2,149,115 | |
8.375%, 03/01/39 (144A) | | | 9,635,000 | | | | 11,685,078 | |
DIRECTV Holdings LLC / DIRECTV Financing Co., Inc. | | | | | | | | |
3.800%, 03/15/22 (f) | | | 2,555,000 | | | | 2,454,425 | |
5.000%, 03/01/21 | | | 5,360,000 | | | | 5,630,728 | |
5.150%, 03/15/42 | | | 4,620,000 | | | | 4,149,231 | |
NBCUniversal Enterprise, Inc.
5.250%, 12/19/49 (144A) | | | 4,100,000 | | | | 4,059,000 | |
NBCUniversal Media LLC | | | | | | | | |
4.375%, 04/01/21 | | | 1,990,000 | | | | 2,106,260 | |
4.450%, 01/15/43 | | | 3,594,000 | | | | 3,219,591 | |
5.150%, 04/30/20 | | | 6,628,000 | | | | 7,408,421 | |
Time Warner Cable, Inc.
8.250%, 04/01/19 | | | 14,647,000 | | | | 17,159,034 | |
8.750%, 02/14/19 (f) | | | 6,070,000 | | | | 7,240,551 | |
Unitymedia Kabel BW GmbH | | | | | | | | |
9.500%, 03/15/21 (EUR) | | | 270,000 | | | | 431,207 | |
| | | | | | | | |
| | | | | | | 85,468,762 | |
| | | | | | | | |
See accompanying notes to financial statements.
MSF-9
Metropolitan Series Fund
BlackRock Bond Income Portfolio
Schedule of Investments as of December 31, 2013
Corporate Bonds & Notes—(Continued)
| | | | | | | | |
| Security Description | | Principal
Amount* | | | Value | |
|
Metal Fabricate/Hardware—0.0% | |
Eco-Bat Finance plc | | | | | | | | |
7.750%, 02/15/17 (EUR) | | | 230,000 | | | $ | 330,649 | |
| �� | | | | | | | |
|
Mining—0.4% | |
BHP Billiton Finance USA, Ltd. | | | | | | | | |
3.850%, 09/30/23 | | | 5,849,000 | | | | 5,874,373 | |
5.000%, 09/30/43 | | | 2,296,000 | | | | 2,334,437 | |
Novelis, Inc. | | | | | | | | |
8.750%, 12/15/20 (f) | | | 7,985,000 | | | | 8,883,313 | |
| | | | | | | | |
| | | | | | | 17,092,123 | |
| | | | | | | | |
|
Miscellaneous Manufacturing—0.0% | |
GCL Holdings SCA | | | | | | | | |
9.375%, 04/15/18 (EUR) | | | 220,000 | | | | 326,866 | |
| | | | | | | | |
|
Oil & Gas—3.3% | |
Apache Corp. | | | | | | | | |
4.250%, 01/15/44 (f) | | | 2,555,000 | | | | 2,297,119 | |
4.750%, 04/15/43 | | | 1,490,000 | | | | 1,445,219 | |
BP Capital Markets plc | | | | | | | | |
2.750%, 05/10/23 | | | 5,810,000 | | | | 5,305,088 | |
Laredo Petroleum, Inc. | | | | | | | | |
7.375%, 05/01/22 (f) | | | 3,500,000 | | | | 3,797,500 | |
Linn Energy LLC / Linn Energy Finance Corp. | | | | | | | | |
7.000%, 11/01/19 (144A) (f) | | | 4,115,000 | | | | 4,156,150 | |
MEG Energy Corp. | | | | | | | | |
6.500%, 03/15/21 (144A) (f) | | | 8,548,000 | | | | 8,996,770 | |
Murphy Oil Corp. | | | | | | | | |
2.500%, 12/01/17 (f) | | | 6,472,000 | | | | 6,511,356 | |
3.700%, 12/01/22 | | | 3,406,000 | | | | 3,147,161 | |
Nexen, Inc. | | | | | | | | |
5.875%, 03/10/35 | | | 280,000 | | | | 299,031 | |
Noble Energy, Inc. | | | | | | | | |
4.150%, 12/15/21 (f) | | | 3,040,000 | | | | 3,125,877 | |
5.250%, 11/15/43 | | | 4,025,000 | | | | 4,021,712 | |
6.000%, 03/01/41 | | | 3,290,000 | | | | 3,517,918 | |
8.250%, 03/01/19 | | | 3,001,000 | | | | 3,730,081 | |
Noble Holding International, Ltd. | | | | | | | | |
5.250%, 03/15/42 | | | 1,295,000 | | | | 1,242,529 | |
Petrobras International Finance Co. | | | | | | | | |
3.875%, 01/27/16 | | | 8,145,000 | | | | 8,384,968 | |
Range Resources Corp. | | | | | | | | |
5.750%, 06/01/21 (f) | | | 135,000 | | | | 143,100 | |
Shell International Finance BV | | | | | | | | |
2.000%, 11/15/18 (f) | | | 6,640,000 | | | | 6,644,190 | |
4.550%, 08/12/43 | | | 5,885,000 | | | | 5,739,894 | |
Statoil ASA | | | | | | | | |
2.900%, 11/08/20 | | | 7,535,000 | | | | 7,485,698 | |
Total Capital International S.A. | | | | | | | | |
3.700%, 01/15/24 | | | 5,940,000 | | | | 5,873,318 | |
Transocean, Inc. | | | | | | | | |
2.500%, 10/15/17 | | | 9,875,000 | | | | 9,979,616 | |
5.050%, 12/15/16 | | | 5,690,000 | | | | 6,285,578 | |
6.000%, 03/15/18 (f) | | | 14,428,000 | | | | 16,180,223 | |
6.500%, 11/15/20 (f) | | | 4,265,000 | | | | 4,870,374 | |
6.800%, 03/15/38 | | | 2,495,000 | | | | 2,776,967 | |
| | | | | | | | |
| | | | | | | 125,957,437 | |
| | | | | | | | |
|
Oil & Gas Services—0.1% | |
Schlumberger Investment S.A. | | | | | | | | |
3.650%, 12/01/23 | | | 2,451,000 | | | | 2,429,659 | |
| | | | | | | | |
|
Packaging & Containers—0.1% | |
Ardagh Glass Finance plc | | | | | | | | |
8.750%, 02/01/20 (EUR) | | | 133,000 | | | | 193,946 | |
Ardagh Packaging Finance plc | | | | | | | | |
9.250%, 10/15/20 (EUR) | | | 109,000 | | | | 163,072 | |
Rock Tenn Co. | | | | | | | | |
4.000%, 03/01/23 | | | 1,791,000 | | | | 1,710,568 | |
| | | | | | | | |
| | | | | | | 2,067,586 | |
| | | | | | | | |
|
Pharmaceuticals—0.4% | |
AbbVie, Inc. | | | | | | | | |
4.400%, 11/06/42 | | | 4,570,000 | | | | 4,262,320 | |
Actavis, Inc. | | | | | | | | |
4.625%, 10/01/42 (f) | | | 4,570,000 | | | | 4,157,786 | |
Bristol-Myers Squibb Co. | | | | | | | | |
4.500%, 03/01/44 | | | 5,231,000 | | | | 5,010,466 | |
Teva Pharmaceutical Finance Co. B.V. | | | | | | | | |
3.650%, 11/10/21 | | | 2,000,000 | | | | 1,961,640 | |
| | | | | | | | |
| | | | | | | 15,392,212 | |
| | | | | | | | |
|
Pipelines—1.1% | |
Energy Transfer Partners L.P. | | | | | | | | |
4.150%, 10/01/20 | | | 10,165,000 | | | | 10,313,216 | |
Enterprise Products Operating LLC | | | | | | | | |
4.450%, 02/15/43 | | | 2,945,000 | | | | 2,601,365 | |
Kinder Morgan Energy Partners L.P. | | | | | | | | |
4.150%, 02/01/24 (f) | | | 9,045,000 | | | | 8,750,775 | |
TransCanada PipeLines, Ltd. | | | | | | | | |
3.750%, 10/16/23 (f) | | | 2,865,000 | | | | 2,792,395 | |
Western Gas Partners L.P. | | | | | | | | |
4.000%, 07/01/22 | | | 3,048,000 | | | | 2,909,075 | |
5.375%, 06/01/21 | | | 4,913,000 | | | | 5,263,292 | |
Williams Cos., Inc. (The) | | | | | | | | |
3.700%, 01/15/23 (f) | | | 9,335,000 | | | | 8,147,663 | |
7.875%, 09/01/21 | | | 2,186,000 | | | | 2,520,701 | |
| | | | | | | | |
| | | | | | | 43,298,482 | |
| | | | | | | | |
|
Real Estate—0.1% | |
Realogy Group LLC | | | | | | | | |
7.875%, 02/15/19 (144A) (f) | | | 4,118,000 | | | | 4,519,505 | |
| | | | | | | | |
|
Real Estate Investment Trusts—0.0% | |
Ventas Realty L.P. / Ventas Capital Corp. | | | | | | | | |
2.700%, 04/01/20 | | | 1,454,000 | | | | 1,390,316 | |
| | | | | | | | |
|
Retail—0.3% | |
CVS Caremark Corp. | | | | | | | | |
5.300%, 12/05/43 | | | 929,000 | | | | 960,737 | |
Enterprise Inns plc | | | | | | | | |
6.500%, 12/06/18 (GBP) | | | 296,000 | | | | 508,542 | |
House of Fraser Funding plc | | | | | | | | |
8.875%, 08/15/18 (GBP) | | | 278,000 | | | | 502,937 | |
See accompanying notes to financial statements.
MSF-10
Metropolitan Series Fund
BlackRock Bond Income Portfolio
Schedule of Investments as of December 31, 2013
Corporate Bonds & Notes—(Continued)
| | | | | | | | |
| Security Description | | Principal
Amount* | | | Value | |
|
Retail—(Continued) | |
QVC, Inc. | | | | | | | | |
7.500%, 10/01/19 (144A) | | | 4,045,000 | | | $ | 4,359,891 | |
Unique Pub Finance Co. plc (The) | | | | | | | | |
5.659%, 06/30/27 (GBP) | | | 195,835 | | | | 317,808 | |
Wal-Mart Stores, Inc. | | | | | | | | |
4.000%, 04/11/43 | | | 3,337,000 | | | | 2,969,873 | |
| | | | | | | | |
| | | | | | | 9,619,788 | |
| | | | | | | | |
|
Software—0.0% | |
First Data Corp. | | | | | | | | |
7.375%, 06/15/19 (144A) | | | 1,245,000 | | | | 1,329,038 | |
Oracle Corp. | | | | | | | | |
3.625%, 07/15/23 | | | 302,000 | | | | 299,574 | |
| | | | | | | | |
| | | | | | | 1,628,612 | |
| | | | | | | | |
|
Storage/Warehousing—0.0% | |
Algeco Scotsman Global Finance plc | | | | | | | | |
9.000%, 10/15/18 (EUR) | | | 230,000 | | | | 342,515 | |
| | | | | | | | |
|
Telecommunications—3.1% | |
America Movil S.A.B. de C.V. | | | | | | | | |
2.375%, 09/08/16 | | | 7,975,000 | | | | 8,207,631 | |
AT&T, Inc. | | | | | | | | |
2.375%, 11/27/18 (f) | | | 3,846,000 | | | | 3,849,300 | |
CC Holdings GS V LLC / Crown Castle GS III Corp. | | | | | | | | |
3.849%, 04/15/23 | | | 4,386,000 | | | | 4,105,748 | |
Intelsat Jackson Holdings S.A. | | | | | | | | |
7.250%, 04/01/19 | | | 4,886,000 | | | | 5,276,880 | |
Level 3 Financing, Inc. | | | | | | | | |
8.125%, 07/01/19 | | | 5,270,000 | | | | 5,770,650 | |
MetroPCS Wireless, Inc. | | | | | | | | |
7.875%, 09/01/18 (f) | | | 270,000 | | | | 289,913 | |
Phones4u Finance plc | | | | | | | | |
9.500%, 04/01/18 (GBP) | | | 190,000 | | | | 333,115 | |
Sprint Communications, Inc. | | | | | | | | |
9.000%, 11/15/18 (144A) | | | 10,180,000 | | | | 12,266,900 | |
Sprint Corp. | | | | | | | | |
7.875%, 09/15/23 (144A) | | | 3,535,000 | | | | 3,800,125 | |
T-Mobile USA, Inc. | | | | | | | | |
6.464%, 04/28/19 | | | 410,000 | | | | 435,625 | |
6.633%, 04/28/21 (f) | | | 1,345,000 | | | | 1,415,612 | |
6.731%, 04/28/22 | | | 1,295,000 | | | | 1,350,037 | |
6.836%, 04/28/23 (f) | | | 410,000 | | | | 425,375 | |
Telenet Finance V Luxembourg SCA | | | | | | | | |
6.750%, 08/15/24 (EUR) | | | 320,000 | | | | 468,068 | |
Verizon Communications, Inc. | | | | | | | | |
3.650%, 09/14/18 | | | 15,505,000 | | | | 16,413,035 | |
3.850%, 11/01/42 (f) | | | 19,771,000 | | | | 16,149,032 | |
4.500%, 09/15/20 | | | 3,340,000 | | | | 3,575,690 | |
5.150%, 09/15/23 | | | 7,259,000 | | | | 7,793,930 | |
6.550%, 09/15/43 | | | 21,422,000 | | | | 25,062,862 | |
Virgin Media Secured Finance plc | | | | | | | | |
6.000%, 04/15/21 (GBP) | | | 240,000 | | | | 408,357 | |
| | | | | | | | |
| | | | | | | 117,397,885 | |
| | | | | | | | |
|
Transportation—0.1% | |
Burlington Northern Santa Fe LLC | | | | | | | | |
3.000%, 03/15/23 | | | 1,750,000 | | | | 1,629,707 | |
Gategroup Finance Luxembourg S.A. | | | | | | | | |
6.750%, 03/01/19 (EUR) | | | 230,000 | | | | 335,237 | |
| | | | | | | | |
| | | | | | | 1,964,944 | |
| | | | | | | | |
Total Corporate Bonds & Notes
(Cost $929,630,007) | | | | | | | 933,455,860 | |
| | | | | | | | |
|
| Asset-Backed Securities—20.6% | |
|
Asset-Backed - Automobile—6.7% | |
AmeriCredit Automobile Receivables Trust | | | | | | | | |
1.520%, 01/08/19 | | | 1,595,000 | | | | 1,589,421 | |
1.660%, 09/10/18 | | | 1,400,000 | | | | 1,404,847 | |
1.690%, 11/08/18 | | | 2,687,000 | | | | 2,682,736 | |
2.290%, 11/08/19 | | | 845,000 | | | | 845,024 | |
2.420%, 05/08/18 | | | 3,450,000 | | | | 3,511,441 | |
2.640%, 10/10/17 | | | 3,470,000 | | | | 3,568,340 | |
2.720%, 09/09/19 | | | 860,000 | | | | 870,101 | |
3.310%, 10/08/19 | | | 2,010,000 | | | | 2,038,192 | |
3.440%, 10/08/17 | | | 5,300,000 | | | | 5,486,671 | |
AUTO ABS SRL | | | | | | | | |
2.800%, 04/27/25 (EUR) | | | 4,179,023 | | | | 5,793,877 | |
Capital Auto Receivables Asset Trust | | | | | | | | |
1.740%, 10/22/18 | | | 6,080,000 | | | | 6,004,286 | |
Chesapeake Funding LLC | | | | | | | | |
1.768%, 11/07/23 (144A) (b) | | | 3,230,000 | | | | 3,242,549 | |
2.168%, 11/07/23 (144A) (b) | | | 2,075,000 | | | | 2,083,036 | |
Chrysler Capital Auto Receivables Trust | | | | | | | | |
0.560%, 12/15/16 (144A) | | | 5,250,000 | | | | 5,249,993 | |
0.850%, 05/15/18 (144A) | | | 4,595,000 | | | | 4,594,569 | |
1.270%, 03/15/19 (144A) | | | 3,175,000 | | | | 3,175,048 | |
1.780%, 06/17/19 (144A) | | | 1,455,000 | | | | 1,454,819 | |
2.240%, 09/16/19 (144A) | | | 1,515,000 | | | | 1,514,555 | |
2.890%, 10/15/20 (144A) | | | 1,485,000 | | | | 1,484,518 | |
Credit Acceptance Auto Loan Trust | | | | | | | | |
1.210%, 10/15/20 (144A) | | | 2,740,000 | | | | 2,741,899 | |
1.500%, 04/15/21 (144A) | | | 2,870,000 | | | | 2,869,317 | |
1.520%, 03/16/20 (144A) | | | 4,950,000 | | | | 4,963,905 | |
1.830%, 04/15/21 (144A) | | | 2,350,000 | | | | 2,333,888 | |
2.200%, 09/16/19 (144A) | | | 10,500,000 | | | | 10,573,468 | |
DT Auto Owner Trust | | | | | | | | |
2.260%, 10/16/17 (144A) | | | 872,843 | | | | 873,451 | |
2.720%, 04/17/17 (144A) | | | 200,000 | | | | 201,617 | |
3.380%, 10/16/17 (144A) | | | 1,920,000 | | | | 1,930,312 | |
3.500%, 04/17/17 (144A) | | | 620,000 | | | | 621,296 | |
4.030%, 02/15/17 (144A) | | | 868,345 | | | | 869,396 | |
4.940%, 07/16/18 (144A) | | | 4,500,000 | | | | 4,641,813 | |
Hyundai Auto Receivables Trust | | | | | | | | |
2.610%, 05/15/18 | | | 5,570,000 | | | | 5,717,527 | |
Prestige Auto Receivables Trust | | | | | | | | |
1.090%, 02/15/18 (144A) | | | 7,668,384 | | | | 7,688,329 | |
1.330%, 05/15/19 (144A) | | | 6,000,000 | | | | 5,990,676 | |
5.180%, 07/16/18 (144A) | | | 3,900,000 | | | | 4,017,554 | |
See accompanying notes to financial statements.
MSF-11
Metropolitan Series Fund
BlackRock Bond Income Portfolio
Schedule of Investments as of December 31, 2013
Asset-Backed Securities—(Continued)
| | | | | | | | |
| Security Description | | Principal
Amount* | | | Value | |
|
Asset-Backed - Automobile—(Continued) | |
Santander Drive Auto Receivables Trust | | | | | | | | |
1.190%, 05/15/18 | | | 8,640,000 | | | $ | 8,601,716 | |
1.210%, 10/16/17 (144A) | | | 10,680,000 | | | | 10,690,146 | |
1.330%, 05/15/17 | | | 4,230,000 | | | | 4,242,030 | |
1.480%, 05/15/17 (144A) | | | 786,528 | | | | 786,919 | |
1.550%, 10/15/18 | | | 12,295,000 | | | | 12,275,057 | |
1.560%, 08/15/18 | | | 4,885,000 | | | | 4,918,115 | |
1.780%, 11/15/18 (144A) | | | 19,900,000 | | | | 19,846,449 | |
1.890%, 10/15/19 (144A) | | | 6,435,000 | | | | 6,476,699 | |
1.940%, 12/15/16 | | | 7,860,000 | | | | 7,932,304 | |
1.940%, 03/15/18 | | | 4,535,000 | | | | 4,571,357 | |
2.250%, 06/17/19 | | | 5,820,000 | | | | 5,800,101 | |
2.700%, 08/15/18 | | | 2,330,000 | | | | 2,393,406 | |
2.720%, 05/16/16 | | | 2,410,000 | | | | 2,436,751 | |
2.940%, 12/15/17 | | | 2,600,000 | | | | 2,675,803 | |
3.010%, 04/16/18 | | | 10,710,000 | | | | 11,021,779 | |
3.120%, 10/15/19 (144A) | | | 2,490,000 | | | | 2,553,766 | |
3.200%, 02/15/18 | | | 16,830,000 | | | | 17,297,066 | |
3.250%, 01/15/20 | | | 4,140,000 | | | | 4,253,130 | |
3.780%, 11/15/17 | | | 3,250,000 | | | | 3,360,230 | |
3.780%, 10/15/19 (144A) | | | 1,625,000 | | | | 1,675,196 | |
4.670%, 01/15/20 (144A) | | | 9,110,000 | | | | 9,353,674 | |
| | | | | | | | |
| | | | | | | 255,790,165 | |
| | | | | | | | |
|
Asset-Backed - Credit Card—0.8% | |
CHLUPA Trust | | | | | | | | |
3.326%, 08/15/20 (144A) | | | 7,346,169 | | | | 7,355,352 | |
World Financial Network Credit Card Master Trust | | | | | | | | |
2.150%, 04/17/23 | | | 13,085,000 | | | | 12,733,733 | |
2.230%, 08/15/22 | | | 10,290,000 | | | | 10,197,760 | |
| | | | | | | | |
| | | | | | | 30,286,845 | |
| | | | | | | | |
|
Asset-Backed - Home Equity—0.1% | |
GSAA Home Equity Trust | | | | | | | | |
0.445%, 10/25/35 (b) | | | 5,209,998 | | | | 4,751,487 | |
Option One Mortgage Loan Trust | | | | | | | | |
1.290%, 11/25/32 (b) | | | 204,571 | | | | 184,658 | |
| | | | | | | | |
| | | | | | | 4,936,145 | |
| | | | | | | | |
|
Asset-Backed - Other—7.8% | |
Alm Loan Funding | | | | | | | | |
1.691%, 01/20/26 (144A) (b) | | | 5,940,000 | | | | 5,933,852 | |
Apidos CDO | | | | | | | | |
1.689%, 01/19/25 (144A) (b) | | | 4,890,000 | | | | 4,882,103 | |
Battalion CLO, Ltd. | | | | | | | | |
1.689%, 10/22/25 (144A) (b) | | | 5,205,000 | | | | 5,169,533 | |
Benefit Street Partners CLO II, Ltd. | | | | | | | | |
1.472%, 07/15/24 (144A) (b) | | | 2,240,000 | | | | 2,214,616 | |
Carlyle Global Market Strategies, Ltd. | | | | | | | | |
1.632%, 01/20/25 (144A) (b) | | | 16,220,000 | | | | 16,206,440 | |
Cavalary CLO II | | | | | | | | |
2.244%, 01/17/24 (144A) (b) | | | 8,510,000 | | | | 8,353,067 | |
Cent CLO 19, Ltd. | | | | | | | | |
1.567%, 10/29/25 (144A) (b) | | | 5,695,000 | | | | 5,643,648 | |
|
Asset-Backed - Other—(Continued) | |
Chase Funding Trust | | | | | | | | |
6.333%, 04/25/32 | | | 974,968 | | | | 995,729 | |
CT CDO IV, Ltd. | | | | | | | | |
0.477%, 10/20/43 (144A) (b) | | | 4,263,954 | | | | 4,042,868 | |
First Franklin Mortgage Loan Trust | | | | | | | | |
0.375%, 12/25/36 (b) | | | 15,028,032 | | | | 7,686,358 | |
Ford Credit Floorplan Master Owner Trust | | | | | | | | |
1.667%, 01/15/16 (b) | | | 2,450,000 | | | | 2,451,027 | |
2.090%, 09/15/16 | | | 4,405,000 | | | | 4,430,945 | |
2.267%, 01/15/16 (b) | | | 4,460,000 | | | | 4,462,226 | |
2.860%, 01/15/19 | | | 1,125,000 | | | | 1,153,919 | |
3.500%, 01/15/19 | | | 1,980,000 | | | | 2,053,484 | |
GT Loan Financing I, Ltd. | | | | | | | | |
1.472%, 10/28/24 (144A) (b) | | | 5,670,000 | | | | 5,615,517 | |
HLSS Servicer Advance Receivables Backed Notes | | | | | | | | |
1.183%, 08/15/44 (144A) | | | 8,215,000 | | | | 8,205,142 | |
1.247%, 01/15/44 (144A) | | | 6,660,000 | | | | 6,658,002 | |
1.287%, 09/15/44 (144A) | | | 6,230,000 | | | | 6,226,262 | |
1.495%, 05/16/44 (144A) | | | 1,175,000 | | | | 1,170,652 | |
1.495%, 01/16/46 (144A) | | | 13,660,000 | | | | 13,609,458 | |
1.793%, 05/15/46 (144A) | | | 17,550,000 | | | | 17,170,920 | |
1.979%, 08/15/46 (144A) | | | 3,155,000 | | | | 3,156,577 | |
1.990%, 10/15/45 (144A) | | | 3,745,000 | | | | 3,769,717 | |
2.480%, 10/15/45 (144A) | | | 3,840,000 | | | | 3,874,944 | |
ING Investment Management Co. | | | | | | | | |
1.686%, 01/18/26 (144A) (b) | | | 6,925,000 | | | | 6,925,000 | |
1.774%, 10/15/22 (144A) (b) | | | 3,395,000 | | | | 3,395,295 | |
Jamestown CLO I, Ltd. | | | | | | | | |
1.668%, 11/05/24 (144A) (b) | | | 500,000 | | | | 494,752 | |
JG Wentworth XX LLC | | | | | | | | |
5.560%, 07/15/59 (144A) | | | 11,591,309 | | | | 12,931,659 | |
JG Wentworth XXI LLC | | | | | | | | |
4.070%, 01/15/48 (144A) | | | 2,004,378 | | | | 2,107,309 | |
JG Wentworth XXII LLC | | | | | | | | |
3.820%, 12/15/48 (144A) | | | 4,095,204 | | | | 4,259,180 | |
KKR Financial CLO, Ltd. | | | | | | | | |
1.394%, 07/15/25 (144A) (b) | | | 4,895,000 | | | | 4,800,218 | |
Knollwood CDO, Ltd. | | | | | | | | |
3.443%, 01/10/39 (144A) (b) (i) | | | 734,438 | | | | 7 | |
Merrill Lynch First Franklin Mortgage Loan Trust | | | | | | | | |
0.405%, 05/25/37 (b) | | | 15,255,687 | | | | 9,407,831 | |
Nationstar Mortgage Advance Receivable Trust | | | | | | | | |
1.080%, 06/20/44 (144A) | | | 9,870,000 | | | | 9,863,737 | |
1.679%, 06/20/46 (144A) | | | 14,045,000 | | | | 14,023,654 | |
Northwoods Capital Corp. / Northwoods Capital, Ltd. | | | | | | | | |
1.666%, 01/18/24 (144A) (b) | | | 5,070,000 | | | | 5,061,219 | |
2.496%, 01/18/24 (144A) (b) | | | 4,820,000 | | | | 4,827,466 | |
Octagon Investment Partners XVI, Ltd. | | | | | | | | |
1.392%, 07/17/25 (144A) (b) | | | 5,600,000 | | | | 5,513,620 | |
OHA Loan Funding, Ltd. | | | | | | | | |
1.680%, 08/23/24 (144A) (b) | | | 5,670,000 | | | | 5,621,499 | |
OZLM Funding IV, Ltd. | | | | | | | | |
1.739%, 07/22/25 (144A) (b) | | | 9,625,000 | | | | 9,448,651 | |
See accompanying notes to financial statements.
MSF-12
Metropolitan Series Fund
BlackRock Bond Income Portfolio
Schedule of Investments as of December 31, 2013
Asset-Backed Securities—(Continued)
| | | | | | | | |
| Security Description | | Principal
Amount* | | | Value | |
|
Asset-Backed - Other—(Continued) | |
OZLM Funding, Ltd. | | | | | | | | |
1.716%, 10/30/23 (144A) (b) | | | 8,930,000 | | | $ | 8,907,961 | |
PFS Financing Corp. | | | | | | | | |
1.267%, 02/15/18 (144A) (b) | | | 4,230,000 | | | | 4,211,896 | |
1.367%, 02/15/16 (144A) (b) | | | 6,350,000 | | | | 6,354,166 | |
Race Point CLO, Ltd. | | | | | | | | |
1.659%, 11/08/24 (144A) (b) | | | 500,000 | | | | 497,877 | |
Sound Point CLO, Ltd. | | | | | | | | |
1.653%, 01/21/26 (144A) (b) | | | 2,185,000 | | | | 2,185,000 | |
SpringCastle America Funding LLC | | | | | | | | |
3.750%, 04/03/21 (144A) | | | 15,440,546 | | | | 15,469,561 | |
Vibrant CLO, Ltd. | | | | | | | | |
1.724%, 07/17/24 (144A) (b) | | | 16,240,000 | | | | 16,165,280 | |
2.644%, 07/17/24 (144A) (b) | | | 3,060,000 | | | | 3,071,331 | |
| | | | | | | | |
| | | | | | | 300,681,175 | |
| | | | | | | | |
|
Asset-Backed - Student Loan—5.2% | |
Nelnet Student Loan Trust | | | | | | | | |
0.348%, 08/23/27 (b) | | | 1,190,000 | | | | 1,161,668 | |
1.888%, 11/25/24 (b) | | | 6,095,000 | | | | 6,332,614 | |
Scholar Funding Trust | | | | | | | | |
0.817%, 01/30/45 (144A) (b) | | | 17,819,480 | | | | 17,663,486 | |
1.138%, 10/28/43 (144A) (b) | | | 1,861,102 | | | | 1,863,117 | |
SLC Private Student Loan Trust
0.414%, 07/15/36 (b) | | | 10,195,000 | | | | 10,054,543 | |
SLM Private Credit Student Loan Trust | | | | | | | | |
0.423%, 03/15/23 (b) | | | 9,688,302 | | | | 9,476,215 | |
0.443%, 06/15/21 (b) | | | 6,157,410 | | | | 6,084,691 | |
0.793%, 12/16/30 (b) | | | 5,222,132 | | | | 5,090,597 | |
SLM Private Education Loan Trust | | | | | | | | |
0.767%, 08/15/22 (144A) (b) | | | 2,598,973 | | | | 2,595,005 | |
0.817%, 07/15/22 (144A) (b) | | | 8,088,512 | | | | 8,084,467 | |
1.017%, 02/15/22 (144A) (b) | | | 8,879,974 | | | | 8,904,420 | |
1.267%, 08/15/23 (144A) (b) | | | 2,026,098 | | | | 2,037,560 | |
1.567%, 08/15/25 (144A) (b) | | | 2,756,021 | | | | 2,782,493 | |
1.567%, 10/15/31 (144A) (b) | | | 3,740,000 | | | | 3,748,097 | |
1.770%, 05/17/27 (144A) | | | 3,985,000 | | | | 3,865,243 | |
1.850%, 06/17/30 (144A) | | | 23,220,000 | | | | 22,392,787 | |
2.090%, 06/15/45 (144A) | | | 4,455,000 | | | | 4,391,570 | |
2.940%, 10/15/31 (144A) | | | 7,000,000 | | | | 7,073,773 | |
2.950%, 02/15/46 (144A) | | | 16,045,000 | | | | 16,366,766 | |
3.310%, 10/15/46 (144A) | | | 12,475,000 | | | | 12,900,585 | |
3.480%, 10/15/30 (144A) | | | 870,000 | | | | 908,704 | |
3.740%, 02/15/29 (144A) | | | 1,685,000 | | | | 1,757,442 | |
3.830%, 01/17/45 (144A) | | | 8,460,000 | | | | 8,778,189 | |
4.540%, 10/17/44 (144A) | | | 5,040,000 | | | | 5,413,963 | |
SLM Student Loan Trust | | | | | | | | |
0.819%, 06/26/28 (b) | | | 9,620,000 | | | | 9,620,231 | |
0.993%, 12/15/25 (144A) (b) | | | 9,185,000 | | | | 9,108,094 | |
1.938%, 07/25/23 (b) | | | 11,355,000 | | | | 11,870,120 | |
| | | | | | | | |
| | | | | | | 200,326,440 | |
| | | | | | | | |
Total Asset-Backed Securities
(Cost $785,973,661) | | | | | | | 792,020,770 | |
| | | | | | | | |
| Mortgage-Backed Securities—13.6% | |
| Security Description | | Principal
Amount* | | | Value | |
|
Collateralized Mortgage Obligations—1.2% | |
Banc of America Alternative Loan Trust
5.500%, 10/25/35 | | | 3,417,440 | | | $ | 3,020,948 | |
Countrywide Alternative Loan Trust | | | | | | | | |
0.357%, 03/20/47 (b) | | | 3,498,376 | | | | 2,553,336 | |
5.500%, 11/25/35 | | | 2,473,767 | | | | 2,230,239 | |
5.500%, 04/25/37 | | | 1,869,933 | | | | 1,387,836 | |
6.500%, 09/25/37 | | | 13,256,120 | | | | 10,232,452 | |
Countrywide Home Loan Mortgage Pass-Through Trust | | | | | | | | |
0.365%, 04/25/46 (b) | | | 1,305,300 | | | | 997,436 | |
6.000%, 04/25/36 | | | 1,455,942 | | | | 1,253,039 | |
6.250%, 09/25/36 | | | 1,930,407 | | | | 1,663,754 | |
Credit Suisse Mortgage Capital Certificates | | | | | | | | |
2.533%, 03/27/37 (144A) (b) | | | 1,855,123 | | | | 1,810,118 | |
2.556%, 08/27/46 (144A) (b) | | | 4,471,072 | | | | 4,120,920 | |
2.560%, 05/27/36 (144A) (b) | | | 3,943,891 | | | | 3,621,742 | |
Deutsche Alt-A Securities, Inc. Mortgage Loan Trust
0.315%, 12/25/36 (b) | | | 5,944,589 | | | | 4,675,568 | |
GSR Mortgage Loan Trust
6.000%, 07/25/37 | | | 2,292,889 | | | | 2,107,986 | |
JP Morgan Mortgage Trust
6.500%, 08/25/36 | | | 812,051 | | | | 707,878 | |
Merrill Lynch Mortgage Investors Trust
2.893%, 05/25/36 (b) | | | 3,748,883 | | | | 3,087,363 | |
Structured Adjustable Rate Mortgage Loan Trust
8.263%, 04/25/47 (b) | | | 2,554,629 | | | | 1,939,382 | |
Wells Fargo Mortgage Backed Securities Trust
2.631%, 07/25/36 (b) | | | 1,848,774 | | | | 1,826,082 | |
| | | | | | | | |
| | | | | | | 47,236,079 | |
| | | | | | | | |
|
Commercial Mortgage-Backed Securities—12.4% | |
Banc of America Commercial Mortgage Trust | | | | | | | | |
5.482%, 01/15/49 (b) | | | 630,000 | | | | 657,792 | |
5.649%, 06/10/49 (b) | | | 13,988,225 | | | | 15,289,152 | |
Banc of America Merrill Lynch Commercial Mortgage Trust
5.649%, 06/10/49 (b) | | | 194,540 | | | | 194,349 | |
Banc of America Merrill Lynch Commercial Mortgage, Inc.
4.621%, 07/10/43 | | | 5,225,000 | | | | 5,313,595 | |
Banc of America Re-REMIC Trust
5.010%, 12/20/41 (144A) (b) | | | 6,453,009 | | | | 6,578,004 | |
BB-UBS Trust
0.596%, 11/05/36 (144A) (b) (c) | | | 85,480,000 | | | | 4,785,769 | |
Bear Stearns Commercial Mortgage Securities Trust | | | | | | | | |
5.189%, 12/11/38 | | | 8,262,218 | | | | 9,031,133 | |
5.317%, 02/11/44 | | | 5,710,143 | | | | 6,253,040 | |
5.449%, 12/11/40 (b) | | | 780,000 | | | | 832,851 | |
5.650%, 06/11/50 (b) | | | 5,666,829 | | | | 6,269,241 | |
CD Mortgage Trust
6.118%, 11/15/44 (b) | | | 661,500 | | | | 736,895 | |
See accompanying notes to financial statements.
MSF-13
Metropolitan Series Fund
BlackRock Bond Income Portfolio
Schedule of Investments as of December 31, 2013
Mortgage-Backed Securities—(Continued)
| | | | | | | | |
| Security Description | | Principal
Amount* | | | Value | |
|
Commercial Mortgage-Backed Securities—(Continued) | |
Citigroup Commercial Mortgage Trust | | | | | | | | |
1.308%, 09/10/46 (b) (c) | | | 17,928,432 | | | $ | 1,331,598 | |
4.131%, 11/10/46 | | | 31,000 | | | | 31,388 | |
4.960%, 05/15/43 (b) | | | 6,750,000 | | | | 6,825,236 | |
6.132%, 12/10/49 (b) | | | 3,560,000 | | | | 3,945,811 | |
Commercial Mortgage Pass-Through Certificates | | | | | | | | |
1.055%, 08/10/46 (b) (c) | | | 134,466,756 | | | | 7,979,930 | |
1.556%, 03/10/46 (b) (c) | | | 66,863,609 | | | | 5,144,285 | |
1.612%, 03/10/46 (b) (c) | | | 42,026,850 | | | | 3,750,266 | |
1.684%, 10/13/28 (144A) (b) | | | 7,400,000 | | | | 7,425,197 | |
1.800%, 01/10/46 (b) (c) | | | 118,901,981 | | | | 11,404,959 | |
2.231%, 05/15/45 (b) (c) | | | 26,875,736 | | | | 3,215,628 | |
3.367%, 02/10/28 (144A) | | | 5,610,000 | | | | 5,333,096 | |
3.400%, 10/05/30 (144A) | | | 4,845,000 | | | | 4,484,576 | |
4.715%, 10/10/46 (b) | | | 1,565,000 | | | | 1,622,860 | |
4.798%, 08/10/46 (144A) (b) | | | 2,270,000 | | | | 2,294,534 | |
5.167%, 06/10/44 (b) | | | 7,050,000 | | | | 7,402,542 | |
5.347%, 12/10/46 | | | 5,320,000 | | | | 5,811,424 | |
5.543%, 12/11/49 (144A) (b) | | | 2,690,000 | | | | 2,901,168 | |
Credit Suisse Commercial Mortgage Trust
5.448%, 01/15/49 (b) | | | 75,347 | | | | 75,197 | |
Credit Suisse First Boston Mortgage Securities Corp.
4.771%, 07/15/37 | | | 1,090,000 | | | | 1,123,126 | |
Credit Suisse Mortgage Capital Certificates
0.437%, 04/15/22 (144A) (b) | | | 7,130,000 | | | | 6,849,584 | |
DBRR Trust | | | | | | | | |
1.636%, 12/18/49 (144A) (b) | | | 4,407,355 | | | | 4,414,243 | |
5.733%, 06/17/49 (144A) (b) | | | 3,160,000 | | | | 3,444,251 | |
Del Coronado Trust
5.167%, 03/15/18 (144A) (b) | | | 4,330,000 | | | | 4,345,155 | |
Extended Stay America Trust | | | | | | | | |
2.675%, 12/05/31 (144A) | | | 3,210,000 | | | | 3,135,958 | |
2.958%, 12/05/31 (144A) | | | 4,640,000 | | | | 4,502,633 | |
FREMF Mortgage Trust | | | | | | | | |
3.165%, 04/25/46 (144A) (b) | | | 665,000 | | | | 621,812 | |
3.562%, 08/25/45 (144A) (b) | | | 4,535,000 | | | | 4,410,895 | |
3.656%, 10/25/45 (144A) (b) | | | 3,440,000 | | | | 3,157,084 | |
3.741%, 04/25/45 (144A) (b) | | | 3,990,000 | | | | 3,776,830 | |
4.023%, 11/25/44 (144A) (b) | | | 769,500 | | | | 744,080 | |
GE Capital Commercial Mortgage Corp.
4.578%, 06/10/48 | | | 2,088,654 | | | | 2,107,483 | |
Greenwich Capital Commercial Mortgage Trust | | | | | | | | |
5.736%, 12/10/49 | | | 2,210,000 | | | | 2,468,046 | |
5.867%, 12/10/49 (b) | | | 3,255,000 | | | | 3,566,595 | |
GS Mortgage Securities Corp. II | | | | | | | | |
1.766%, 02/10/46 (b) (c) | | | 108,614,253 | | | | 11,601,740 | |
3.249%, 11/08/29 (144A) (b) (c) | | | 59,510,000 | | | | 2,744,137 | |
3.435%, 12/10/27 (144A) (b) | | | 9,462,358 | | | | 8,233,709 | |
GS Mortgage Securities Corp. Trust | | | | | | | | |
2.933%, 06/05/31 (144A) | | | 2,515,000 | | | | 2,512,530 | |
3.551%, 04/10/34 (144A) | | | 8,321,000 | | | | 8,181,324 | |
3.633%, 06/05/31 (144A) | | | 965,000 | | | | 967,843 | |
|
Commercial Mortgage-Backed Securities—(Continued) | |
GS Mortgage Securities Trust | | | | | | | | |
5.591%, 11/10/39 | | | 1,830,000 | | | | 2,005,830 | |
5.622%, 11/10/39 | | | 3,595,000 | | | | 3,520,893 | |
5.804%, 08/10/45 (b) | | | 6,314,952 | | | | 6,932,567 | |
Hilton USA Trust | | | | | | | | |
1.668%, 11/05/30 (144A) (b) (c) | | | 64,000,000 | | | | 1,066,496 | |
4.407%, 11/05/30 | | | 2,790,000 | | | | 2,792,277 | |
5.222%, 11/05/30 (144A) (b) | | | 7,860,000 | | | | 7,904,535 | |
JP Morgan Chase Commercial Mortgage Securities Corp. | | | | | | | | |
1.945%, 12/15/47 (b) (c) | | | 9,933,481 | | | | 1,038,009 | |
4.158%, 01/12/39 (144A) | | | 1,283,999 | | | | 1,287,733 | |
JP Morgan Chase Commercial Mortgage Securities Trust | | | | | | | | |
0.587%, 04/15/46 (b) (c) | | | 4,900,000 | | | | 218,290 | |
1.043%, 08/15/46 (b) (c) | | | 75,866,326 | | | | 3,847,864 | |
1.587%, 04/15/46 (b) (c) | | | 27,858,171 | | | | 2,658,951 | |
2.013%, 06/15/45 (b) (c) | | | 24,755,909 | | | | 2,433,481 | |
3.958%, 04/15/46 (b) | | | 2,230,000 | | | | 2,047,236 | |
4.161%, 12/15/47 (b) | | | 2,165,000 | | | | 2,042,996 | |
5.372%, 05/15/47 | | | 1,220,000 | | | | 1,288,919 | |
5.431%, 06/12/47 (b) | | | 11,722,114 | | | | 12,852,196 | |
5.439%, 01/15/49 | | | 8,482,429 | | | | 9,347,595 | |
5.445%, 12/12/44 (b) | | | 3,600,000 | | | | 3,865,514 | |
5.447%, 06/12/47 | | | 883,054 | | | | 893,183 | |
5.806%, 06/15/49 (b) | | | 1,415,673 | | | | 1,512,927 | |
5.850%, 02/15/51 (b) | | | 10,789,379 | | | | 12,110,160 | |
5.951%, 06/15/43 (144A) | | | 8,060,000 | | | | 9,189,641 | |
LB Commercial Mortgage Trust
5.884%, 07/15/44 (b) | | | 1,515,000 | | | | 1,681,788 | |
LB-UBS Commercial Mortgage Trust | | | | | | | | |
5.205%, 04/15/30 (b) | | | 3,610,000 | | | | 3,737,440 | |
5.347%, 11/15/38 | | | 7,141,255 | | | | 7,840,805 | |
5.866%, 09/15/45 (b) | | | 8,557,202 | | | | 9,490,434 | |
6.164%, 09/15/45 (b) | | | 2,580,000 | | | | 2,948,927 | |
Merrill Lynch Mortgage Trust | | | | | | | | |
5.280%, 11/12/37 (b) | | | 5,045,000 | | | | 5,305,842 | |
5.859%, 06/12/50 (b) | | | 3,331,496 | | | | 3,565,963 | |
Morgan Stanley Bank of America Merrill Lynch Trust | | | | | | | | |
1.256%, 11/15/46 (b) (c) | | | 33,905,000 | | | | 2,712,095 | |
1.747%, 02/15/46 (b) (c) | | | 25,023,222 | | | | 2,456,254 | |
4.896%, 11/15/46 (b) | | | 3,960,000 | | | | 3,869,340 | |
Morgan Stanley Capital I Trust | | | | | | | | |
2.669%, 03/15/45 (144A) (b) (c) | | | 45,050,866 | | | | 5,564,187 | |
5.312%, 03/15/44 | | | 11,259,102 | | | | 12,333,851 | |
5.406%, 03/15/44 | | | 3,090,000 | | | | 3,358,815 | |
5.597%, 04/12/49 (b) | | | 8,065,000 | | | | 8,800,488 | |
5.665%, 04/15/49 (b) | | | 4,352,634 | | | | 4,751,632 | |
5.910%, 06/11/49 (b) | | | 7,020,000 | | | | 7,551,912 | |
Morgan Stanley Capital I, Inc. | | | | | | | | |
6.340%, 07/15/30 (144A) (b) | | | 579,152 | | | | 586,480 | |
Morgan Stanley Re-REMIC Trust | | | | | | | | |
Zero Coupon, 03/23/51 (144A) (j) | | | 4,050,000 | | | | 3,887,757 | |
Zero Coupon, 07/17/56 (144A) (j) | | | 4,468,528 | | | | 4,397,032 | |
1.000%, 03/27/51 (144A) | | | 2,885,016 | | | | 2,884,958 | |
See accompanying notes to financial statements.
MSF-14
Metropolitan Series Fund
BlackRock Bond Income Portfolio
Schedule of Investments as of December 31, 2013
Mortgage-Backed Securities—(Continued)
| | | | | | | | |
| Security Description | | Principal
Amount* | | | Value | |
|
Commercial Mortgage-Backed Securities—(Continued) | |
Morgan Stanley Re-REMIC Trust | | | | | | | | |
1.000%, 03/27/51 (144) (144A) | | | 3,140,000 | | | $ | 3,077,200 | |
2.000%, 07/27/49 (144A) | | | 5,054,596 | | | | 5,095,033 | |
2.500%, 03/23/51 (144A) | | | 2,145,151 | | | | 2,172,609 | |
Motel 6 Trust | | | | | | | | |
2.743%, 10/05/25 (144A) | | | 3,135,000 | | | | 3,109,393 | |
RBSCF Trust | | | | | | | | |
5.925%, 02/16/51 (144A) (b) | | | 9,220,327 | | | | 10,073,189 | |
S2 Hospitality LLC | | | | | | | | |
4.500%, 04/15/25 (144A) | | | 35,313 | | | | 35,313 | |
SCG Trust | | | | | | | | |
1.567%, 11/15/26 (144A) (b) | | | 5,285,000 | | | | 5,291,088 | |
2.117%, 11/15/26 (144A) (b) | | | 3,290,000 | | | | 3,290,046 | |
STRIPs, Ltd. | | | | | | | | |
1.500%, 12/25/44 (144A) | | | 8,336,094 | | | | 8,252,733 | |
Wachovia Bank Commercial Mortgage Trust | | | | | | | | |
5.925%, 02/15/51 (b) | | | 4,072,000 | | | | 4,078,580 | |
Wells Fargo Resecuritization Trust | | | | | | | | |
1.750%, 08/20/21 (144A) | | | 4,723,596 | | | | 4,695,254 | |
WF-RBS Commercial Mortgage Trust | | | | | | | | |
0.717%, 08/15/46 (b) (c) | | | 45,242,300 | | | | 1,910,130 | |
1.521%, 03/15/48 (b) (c) | | | 65,583,769 | | | | 5,894,735 | |
1.829%, 12/15/45 (144A) (b) (c) | | | 42,888,198 | | | | 4,604,477 | |
3.037%, 03/15/45 | | | 6,910,000 | | | | 6,548,863 | |
| | | | | | | | |
| | | | | | | 476,542,510 | |
| | | | | | | | |
Total Mortgage-Backed Securities
(Cost $532,389,717) | | | | | | | 523,778,589 | |
| | | | | | | | |
|
| Foreign Government—1.1% | |
|
Sovereign—1.1% | |
Brazilian Government International Bond | | | | | | | | |
7.125%, 01/20/37 | | | 1,520,000 | | | | 1,740,400 | |
Hellenic Republic Government Bond | | | | | | | | |
2.000%, 02/24/23 (EUR) (b) | | | 5,010,000 | | | | 4,637,715 | |
Italy Government International Bond | | | | | | | | |
2.550%, 10/22/16 (EUR) | | | 6,966,094 | | | | 9,810,854 | |
Mexico Government International Bond | | | | | | | | |
4.000%, 10/02/23 | | | 9,610,000 | | | | 9,513,900 | |
Poland Government International Bond | | | | | | | | |
5.000%, 03/23/22 | | | 3,500,000 | | | | 3,740,625 | |
South Africa Government International Bond | | | | | | | | |
4.665%, 01/17/24 (f) | | | 2,600,000 | | | | 2,486,250 | |
Spain Government Bonds | | | | | | | | |
4.400%, 10/31/23 (144A) (EUR) | | | 7,335,000 | | | | 10,273,397 | |
| | | | | | | | |
Total Foreign Government
(Cost $42,272,930) | | | | | | | 42,203,141 | |
| | | | | | | | |
| Floating Rate Loans (b)—0.4% | |
| Security Description | | Shares/ Principal/
Contracts/
Notional
Amount* | | | Value | |
| | |
Lodging—0.4% | | | | | | | | |
Hilton Fort Lauderdale | | | | | | | | |
Mezzanine Term Loan, 7.360%, 02/22/16 | | | 8,060,000 | | | | 8,060,000 | |
Motel 6 Trust | | | | | | | | |
Mezzanine Term Loan, 10.000%, 10/15/17 (i) | | | 7,220,610 | | | | 7,527,486 | |
| | | | | | | | |
Total Floating Rate Loans
(Cost $15,249,369) | | | | | | | 15,587,486 | |
| | | | | | | | |
|
| Preferred Stocks—0.2% | |
|
Diversified Financial Services—0.2% | |
Citigroup Capital XIII, 7.875% (f) | | | 272,339 | | | | 7,421,238 | |
| | | | | | | | |
|
Thrifts & Mortgage Finance—0.0% | |
Federal Home Loan Mortgage Corp. Series Z, 8.375% | | | 70,000 | | | | 627,900 | |
Federal National Mortgage Association Series S, 8.250% | | | 70,000 | | | | 612,500 | |
| | | | | | | | |
| | | | | | | 1,240,400 | |
| | | | | | | | |
Total Preferred Stocks
(Cost $9,820,743) | | | | | | | 8,661,638 | |
| | | | | | | | |
|
| Municipals—0.1% | |
New York City Municipal Water Finance Authority | | | | | | | | |
5.375%, 06/15/43 | | | 2,360,000 | | | | 2,489,210 | |
5.500%, 06/15/43 | | | 2,825,000 | | | | 3,009,275 | |
| | | | | | | | |
Total Municipals
(Cost $5,112,096) | | | | | | | 5,498,485 | |
| | | | | | | | |
|
| Purchased Options—0.1% | |
|
Call Options—0.0% | |
10 Year Interest Rate Swap, Exercise Rate 4.50, Expires 02/26/14 (Counterparty - Barclays Bank plc) (AUD) | | | 58,160,000 | | | | 323,333 | |
| | | | | | | | |
|
Put Options—0.1% | |
10 Year Interest Rate Swap, Exercise Rate 1.10, Expires 06/05/14 (Counterparty - Barclays Bank plc) (JPY) | | | 4,039,000,000 | | | | 277,326 | |
10 Year Interest Rate Swap, Exercise Rate 1.10, Expires 06/06/14 (Counterparty - Barclays Bank plc) (JPY) | | | 2,020,000,000 | | | | 139,714 | |
10 Year Interest Rate Swap, Exercise Rate 1.10, Expires 06/09/14 (Counterparty - Bank of America N.A.) (JPY) | | | 4,201,000,000 | | | | 292,834 | |
AUD Currency, Strike Price USD 0.89, Expires 02/01/14 (Counterparty - Deutsche Bank AG) (AUD) | | | 131,505,000 | | | | 1,744,757 | |
See accompanying notes to financial statements.
MSF-15
Metropolitan Series Fund
BlackRock Bond Income Portfolio
Schedule of Investments as of December 31, 2013
Purchased Options—(Continued)
| | | | | | | | |
| Security Description | | Shares/ Principal/
Contracts/
Notional
Amount* | | | Value | |
|
Put Options—(Continued) | |
Eurodollar Midcurve 2 Year Futures @ 98.75, Expires 03/01/14 | | | 4,752,500 | | | $ | 1,283,175 | |
USD Currency, Strike Price TRY 1.98, Expires 01/21/14 (Counterparty - Morgan Stanley Capital Services) | | | 9,860,000 | | | | 256 | |
USD Currency, Strike Price TRY 1.99, Expires 01/03/14 (Counterparty - Morgan Stanley Capital Services) | | | 9,860,000 | | | | 0 | |
| | | | | | | | |
| | | | | | | 3,738,062 | |
| | | | | | | | |
Total Purchased Options
(Cost $3,104,628) | | | | | | | 4,061,395 | |
| | | | | | | | |
|
| Short-Term Investments—3.0% | |
|
Mutual Fund—2.9% | |
State Street Navigator Securities Lending MET Portfolio (k) | | | 110,019,464 | | | | 110,019,464 | |
| | | | | | | | |
|
Repurchase Agreement—0.1% | |
Fixed Income Clearing Corp. Repurchase Agreement dated 12/31/13 at 0.000% to be repurchased at $4,351,000 on 01/02/14, collateralized by $4,030,000 U.S. Treasury Note at 3.625% due 02/15/20 with a value of $4,443,075. | | | 4,351,000 | | | | 4,351,000 | |
| | | | | | | | |
Total Short-Term Investments
(Cost $114,370,464) | | | | | | | 114,370,464 | |
| | | | | | | | |
Total Investments—115.0%
(Cost $4,458,852,955) (l) | | | | | | | 4,429,198,772 | |
Other assets and liabilities (net)—(15.0)% | | | | | | | (577,450,149 | ) |
| | | | | | | | |
| Net Assets—100.0% | | | | | | $ | 3,851,748,623 | |
| | | | | | | | |
| * | Principal amount stated in U.S. dollars unless otherwise noted. |
| (a) | TBA (To Be Announced) Securities are purchased on a forward commitment basis with an approximate principal amount and no defined maturity date. The actual principal and maturity date will be determined upon settlement date. |
| (b) | Variable or floating rate security. The stated rate represents the rate at December 31, 2013. Maturity date shown for callable securities reflects the earliest possible call date. |
| (c) | Interest only security. |
| (d) | All or a portion of the security was pledged as collateral against open reverse repurchase agreements. As of December 31, 2013, the value of securities pledged amounted to $71,403,403. |
| (e) | All or a portion of the security was pledged as collateral against open futures contracts. As of December 31, 2013, the market value of securities pledged was $3,899,377. |
| (f) | All or a portion of the security was held on loan. As of December 31, 2013, the market value of securities loaned was $111,269,740 and the collateral received consisted of cash in the amount of $110,019,464 and non-cash collateral with a value of $5,276,950. The cash collateral is invested in a money market fund managed by an affiliate of the custodian. The non-cash collateral received consists primarily of government securities and bank letters of credit, and is held for the benefit of the Portfolio at the Portfolio’s custodian. The Portfolio cannot repledge or resell this collateral. As such, this collateral is excluded from the Statement of Assets and Liabilities. |
| (g) | Non-income producing; Security is in default and/or issuer is in bankruptcy. |
| (h) | Illiquid security. As of December 31, 2013, these securities represent 0.0% of net assets. |
| (i) | Restricted securities are not registered under the Securities Act of 1933 and are subject to legal restrictions on resale. These securities generally may be resold in transactions exempt from registration or to the public if the securities are subsequently registered. Disposal of these securities may involve time-consuming negotiations and prompt sale at an acceptable price may be difficult. As of December 31, 2013, the market value of restricted securities was $7,527,493, which is 0.2% of net assets. See details shown in the Restricted Securities table that follows. |
| (j) | Principal only security. |
| (k) | Represents investment of cash collateral received from securities lending transactions. |
| (l) | As of December 31, 2013, the aggregate cost of investments for federal income tax purposes was $4,467,186,661. The aggregate unrealized appreciation and depreciation of investments were $52,392,777 and $(90,380,666), respectively, resulting in net unrealized depreciation of $(37,987,889) for federal income tax purposes. |
| (144A)— | Securities exempt from registration under Rule 144A of the Securities Act of 1933. These securities may be resold in transactions exempt from registration, normally to qualified institutional buyers. As of December 31, 2013, the market value of 144A securities was $850,697,266, which is 22.1% of net assets. |
| (ACES)— | Alternative Credit Enhancement Securities. |
| (ARM)— | Adjustable-Rate Mortgage |
| (CDO)— | Collateralized Debt Obligation |
| (CLO)— | Collateralized Loan Obligation |
| (CMO)— | Collateralized Mortgage Obligation |
| (REMIC)— | Real Estate Mortgage Investment Conduit |
See accompanying notes to financial statements.
MSF-16
Metropolitan Series Fund
BlackRock Bond Income Portfolio
Schedule of Investments as of December 31, 2013
| | | | | | | | | | | | | | |
Restricted Securities | | Acquisition
Date | | Principal
Amount | | | Cost | | | Value | |
Knollwood CDO, Ltd. | | 02/10/04 | | $ | 734,438 | | | $ | 734,438 | | | $ | 7 | |
Motel 6 Trust Mezzanine Term Loan | | 07/11/12 | | | 7,220,610 | | | | 7,220,610 | | | | 7,527,486 | |
Forward Foreign Currency Exchange Contracts
| | | | | | | | | | | | | | | | | | | | | | |
Contracts to Buy | | | Counterparty | | Settlement
Date | | | In Exchange
for | | | Unrealized
Appreciation/
(Depreciation) | |
| AUD | | | 17,288,000 | | | Westpac Banking Corp. | | | 03/19/14 | | | | USD | | | | 15,300,157 | | | $ | 60,319 | |
| EUR | | | 7,557,000 | | | Barclays Bank plc | | | 01/22/14 | | | | USD | | | | 10,272,291 | | | | 123,777 | |
| INR | | | 598,329,960 | | | BNP Paribas S.A. | | | 03/19/14 | | | | USD | | | | 9,435,000 | | | | 66,643 | |
| INR | | | 2,389,838,348 | | | UBS AG | | | 03/19/14 | | | | USD | | | | 38,020,000 | | | | (68,715 | ) |
| MXN | | | 104,757,200 | | | Deutsche Bank AG | | | 03/19/14 | | | | USD | | | | 8,080,000 | | | | (104,899 | ) |
| MXN | | | 311,701,433 | | | Royal Bank of Canada | | | 03/19/14 | | | | USD | | | | 23,790,000 | | | | (60,361 | ) |
| | | | | |
Contracts to Deliver | | | | | | | | | | | | | | | |
| AUD | | | 17,288,000 | | | Bank of America N.A. | | | 03/19/14 | | | | USD | | | | 15,332,624 | | | | (27,852 | ) |
| EUR | | | 45,385,000 | | | Barclays Bank plc | | | 01/22/14 | | | | USD | | | | 61,286,724 | | | | (1,148,836 | ) |
| GBP | | | 3,339,000 | | | Barclays Bank plc | | | 01/23/14 | | | | USD | | | | 5,389,096 | | | | (139,388 | ) |
| JPY | | | 801,553,875 | | | Barclays Bank plc | | | 03/19/14 | | | | USD | | | | 7,825,000 | | | | 210,888 | |
| TRY | | | 10,602,658 | | | BNP Paribas S.A. | | | 01/06/14 | | | | USD | | | | 4,902,000 | | | | (27,767 | ) |
| TRY | | | 8,220,703 | | | Deutsche Bank AG | | | 01/06/14 | | | | USD | | | | 3,805,000 | | | | (17,263 | ) |
| TRY | | | 3,931,268 | | | Deutsche Bank AG | | | 01/06/14 | | | | USD | | | | 1,880,000 | | | | 52,136 | |
| TRY | | | 6,551,090 | | | Morgan Stanley Capital Services | | | 01/06/14 | | | | USD | | | | 3,130,000 | | | | 84,033 | |
| | | | |
Cross Currency
Contracts to Buy | | | | | | | | | | | | |
| PLN | | | 29,311,194 | | | Citibank N.A. | | | 03/19/14 | | | | EUR | | | | 6,975,000 | | | | 61,897 | |
| | | | | | | | | | | | | | | | | | | | | | |
Net Unrealized Depreciation | | | $ | (935,388 | ) |
| | | | | | | | | | | | | | | | | | | | | | |
Forward Sale Commitments
| | | | | | | | | | | | | | | | | | |
Security Description | | Interest Rate | | Maturity | | | Face
Amount | | | Proceeds | | | Value | |
Fannie Mae 15 Yr. Pool | | 2.500% | | | TBA | | | | (7,600,000 | ) | | $ | (7,534,688 | ) | | $ | (7,521,625 | ) |
Fannie Mae 15 Yr. Pool | | 4.000% | | | TBA | | | | (21,400,000 | ) | | | (22,721,617 | ) | | | (22,675,641 | ) |
Fannie Mae 30 Yr. Pool | | 4.500% | | | TBA | | | | (5,200,000 | ) | | | (5,476,250 | ) | | | (5,492,703 | ) |
Fannie Mae 30 Yr. Pool | | 5.000% | | | TBA | | | | (24,700,000 | ) | | | (26,648,984 | ) | | | (26,747,398 | ) |
Fannie Mae 30 Yr. Pool | | 3.500% | | | TBA | | | | (51,975,000 | ) | | | (51,650,156 | ) | | | (51,475,554 | ) |
Freddie Mac 30 Yr. Gold Pool | | 3.000% | | | TBA | | | | (18,900,000 | ) | | | (17,999,297 | ) | | | (17,901,844 | ) |
GNMA I 30 Yr. Pool | | 3.500% | | | TBA | | | | (20,300,000 | ) | | | (20,571,195 | ) | | | (20,459,387 | ) |
GNMA I 30 Yr. Pool | | 4.000% | | | TBA | | | | (20,800,000 | ) | | | (21,745,750 | ) | | | (21,613,313 | ) |
GNMA II 30 Yr. Pool | | 5.000% | | | TBA | | | | (1,200,000 | ) | | | (1,304,250 | ) | | | (1,300,266 | ) |
GNMA II 30 Yr. Pool | | 4.500% | | | TBA | | | | (40,100,000 | ) | | | (43,163,891 | ) | | | (42,872,538 | ) |
GNMA II 30 Yr. Pool | | 4.000% | | | TBA | | | | (43,800,000 | ) | | | (45,620,438 | ) | | | (45,540,025 | ) |
| | | | | | | | | | | | | | | | | | |
Total | | | $ | (264,436,516 | ) | | $ | (263,600,294 | ) |
| | | | | | | | | | | | | | | | | | |
Futures Contracts
| | | | | | | | | | | | | | | | | | | | |
Futures Contracts—Long | | Expiration
Date | | | Number of
Contracts | | | Notional
Amount | | | Unrealized
Appreciation/
(Depreciation) | |
U.S. Treasury Long Bond Futures | | | 03/20/14 | | | | 652 | | | | USD | | | | 85,052,990 | | | $ | (1,393,240 | ) |
U.S. Treasury Note 2 Year Futures | | | 03/31/14 | | | | 965 | | | | USD | | | | 212,389,950 | | | | (270,888 | ) |
U.S. Treasury Ultra Long Bond Futures | | | 03/20/14 | | | | 1,175 | | | | USD | | | | 162,068,351 | | | | (1,974,601 | ) |
See accompanying notes to financial statements.
MSF-17
Metropolitan Series Fund
BlackRock Bond Income Portfolio
Schedule of Investments as of December 31, 2013
Futures Contracts—(Continued)
| | | | | | | | | | | | | | | | | | | | |
Futures Contracts—Short | | Expiration
Date | | | Number of
Contracts | | | Notional
Amount | | | Unrealized
Appreciation/
(Depreciation) | |
90 Day Euro Dollar Futures | | | 12/14/15 | | | | (248 | ) | | | USD | | | | (61,410,640 | ) | | $ | 108,141 | |
Euro Bund Futures | | | 03/06/14 | | | | (19 | ) | | | EUR | | | | (2,682,323 | ) | | | 52,405 | |
U.S. Treasury Note 10 Year Futures | | | 03/20/14 | | | | (2,177 | ) | | | USD | | | | (272,306,518 | ) | | | 4,433,471 | |
U.S. Treasury Note 5 Year Futures | | | 03/31/14 | | | | (688 | ) | | | USD | | | | (82,393,400 | ) | | | 306,400 | |
| | | | | | | | | | | | | | | | | | | | |
Net Unrealized Appreciation | | | $ | 1,261,688 | |
| | | | | | | | | | | | | | | | | | | | |
Written Options
| | | | | | | | | | | | | | | | | | | | | | | | | | | | | | |
Foreign Currency Written
Options | | Strike
Price | | | Counterparty | | Expiration
Date | | | Notional Amount | | | Premiums
Received | | | Market
Value | | | Unrealized
Appreciation | |
Call - USD vs TRY | | | TRY 2.10 | | | Morgan Stanley Capital Services | | | 01/03/14 | | | | USD | | | | (9,860,000 | ) | | $ | (42,152 | ) | | $ | (251,223 | ) | | $ | (209,071 | ) |
Call - USD vs TRY | | | TRY 2.15 | | | Morgan Stanley Capital Services | | | 01/21/14 | | | | USD | | | | (9,860,000 | ) | | | (36,235 | ) | | | (171,495 | ) | | | (135,260 | ) |
Put - AUD vs USD | | | USD 0.85 | | | Deutsche Bank AG | | | 02/07/14 | | | | AUD | | | | (43,825,000 | ) | | | (138,573 | ) | | | (68,323 | ) | | | 70,250 | |
Put - AUD vs USD | | | USD 0.85 | | | Deutsche Bank AG | | | 02/07/14 | | | | AUD | | | | (43,840,000 | ) | | | (156,802 | ) | | | (68,347 | ) | | | 88,455 | |
Put - AUD vs USD | | | USD 0.85 | | | Citibank N.A. | | | 02/07/14 | | | | AUD | | | | (43,840,000 | ) | | | (166,718 | ) | | | (68,347 | ) | | | 98,371 | |
| | | | | | | | | | | | | | | | | | | | | | | | | | | | | | |
Total | | | $ | (540,480 | ) | | $ | (627,735 | ) | | $ | (87,255 | ) |
| | | | | | | | | | | | | | | | | | | | | | | | | | | | | | |
| | | | | | | | | | | | | | | | | | | | | | | | | | | | | | | | |
Interest Rate
Swaptions | | Exercise
Rate | | Counterparty | | Floating Rate
Index | | Pay/
Receive
Floating
Rate | | Expiration
Date | | | Notional
Amount | | | Premiums
Received | | | Market
Value | | | Unrealized
Appreciation/
(Depreciation) | |
Put - OTC - 10 Year Interest Rate Swap | | 1.400% | | Barclays Bank plc | | 6-Month JPY-LIBOR | | Pay | | | 06/06/14 | | | | JPY | | | | (2,020,000,000 | ) | | $ | (49,574 | ) | | $ | (48,178 | ) | | $ | 1,396 | |
Put - OTC - 10 Year Interest Rate Swap | | 1.400% | | Barclays Bank plc | | 6-Month JPY-LIBOR | | Pay | | | 06/05/14 | | | | JPY | | | | (4,039,000,000 | ) | | | (87,352 | ) | | | (95,105 | ) | | | (7,753 | ) |
Put - OTC - 10 Year Interest Rate Swap | | 1.400% | | Bank of America N.A. | | 6-Month JPY-LIBOR | | Pay | | | 06/09/14 | | | | JPY | | | | (4,201,000,000 | ) | | | (127,998 | ) | | | (101,445 | ) | | | 26,553 | |
| | | | | | | | | | | | | | | | | | | | | | | | | | | | | | | | |
Totals | | | $ | (264,924 | ) | | $ | (244,728 | ) | | $ | 20,196 | |
| | | | | | | | | | | | | | | | | | | | | | | | | | | | | | | | |
| | | | | | | | | | | | | | | | | | | | | | |
Options on Exchange-Traded Futures Contracts | | Exercise
Price | | | Expiration
Date | | | Number
of Contracts | | Premiums
Received | | | Market
Value | | | Unrealized
Appreciation | |
Put - Eurodollar Midcurve 2 Year Futures | | $ | 98.25 | | | | 03/14/14 | | | (1,901) | | $ | (138,868 | ) | | $ | (308,912 | ) | | $ | (170,044 | ) |
Reverse Repurchase Agreements
| | | | | | | | | | | | | | | | | | | | | | | | |
Counterparty | | Interest
Rate | | | Settlement
Date | | | Maturity
Date | | | Principal
Amount | | | Net Closing
Amount | |
BNP Paribas S.A. | | | (0.38 | %) | | | 12/31/13 | | | | 01/02/14 | | | | USD | | | | 16,639,175 | | | $ | 16,639,175 | |
Deutsche Bank AG | | | (0.46 | %) | | | 12/31/13 | | | | 01/02/14 | | | | USD | | | | 54,793,750 | | | | 54,793,750 | |
| | | | | | | | | | | | | | | | | | | | | | | | |
Total | | | $ | 71,432,925 | |
| | | | | | | | | | | | | | | | | | | | | | | | |
Securities pledged as collateral against open reverse repurchase agreements are noted in the Schedule of Investments.
Swap Agreements
OTC Interest Rate Swap Agreements
| | | | | | | | | | | | | | | | | | | | | | | | | | | | |
Pay/Receive
Floating Rate | | Floating
Rate Index | | Fixed
Rate | | Maturity
Date | | Counterparty | | Notional
Amount | | | Market
Value | | | Upfront
Premium
Paid/(Received) | | | Unrealized
Appreciation/
(Depreciation) | |
Receive | | 3M LIBOR | | 1.758% | | 06/25/22 | | JPMorgan Chase Bank N.A. | | | USD | | | | 18,000,000 | | | $ | 1,473,653 | | | $ | — | | | $ | 1,473,653 | |
Pay | | 6M EURIBOR | | 2.800% | | 11/10/41 | | Bank of America N.A. | | | EUR | | | | 8,300,000 | | | | 144,967 | | | | — | | | | 144,967 | |
Receive | | 6M EURIBOR | | 2.783% | | 11/10/41 | | Deutsche Bank AG | | | EUR | | | | 8,300,000 | | | | (105,034 | ) | | | — | | | | (105,034 | ) |
See accompanying notes to financial statements.
MSF-18
Metropolitan Series Fund
BlackRock Bond Income Portfolio
Schedule of Investments as of December 31, 2013
Swap Agreements—(Continued)
| | | | | | | | | | | | | | | | | | | | | | | | | | | | |
Pay/Receive
Floating Rate | | Floating
Rate Index | | Fixed
Rate | | Maturity
Date | | Counterparty | | Notional
Amount | | | Market
Value | | | Upfront
Premium
Paid/(Received) | | | Unrealized
Appreciation/
(Depreciation) | |
Pay | | BRL CDI | | 11.430% | | 01/04/16 | | Barclays Bank plc | | | BRL | | | | 47,481,184 | | | $ | (33,416 | ) | | $ | — | | | $ | (33,416 | ) |
Pay | | BRL CDI | | 11.410% | | 01/04/16 | | Credit Suisse International | | | BRL | | | | 13,863,816 | | | | (11,495 | ) | | | — | | | | (11,495 | ) |
Pay | | MXN TIIE | | 6.360% | | 10/18/23 | | Deutsche Bank AG | | | MXN | | | | 50,510,000 | | | | (123,527 | ) | | | — | | | | (123,527 | ) |
Pay | | MXN TIIE | | 6.830% | | 11/03/23 | | JPMorgan Chase Bank N.A. | | | MXN | | | | 99,545,000 | | | | 19,962 | | | | — | | | | 19,962 | |
| | | | | | | | | | | | | | | | | | | | | | | | | | | | |
Totals | | | $ | 1,365,110 | | | $ | — | | | $ | 1,365,110 | |
| | | | | | | | | | | | | | | | | | | | | | | | | | | | |
Centrally Cleared Interest Rate Swap agreements
| | | | | | | | | | | | | | | | | | | | | | |
Pay/Receive Floating Rate | | Floating
Rate Index | | Fixed
Rate | | | Maturity
Date | | | Notional
Amount | | | Unrealized
Appreciation/
(Depreciation) | |
Receive | | 3M LIBOR | | | 0.648 | % | | | 11/26/16 | | | | USD | | | | 14,540,000 | | | $ | 75,626 | |
Receive | | 3M LIBOR | | | 2.820 | % | | | 11/18/23 | | | | USD | | | | 6,575,000 | | | | 137,742 | |
Receive | | 6-Month JPY-LIBOR | | | 0.789 | % | | | 11/28/23 | | | | JPY | | | | 2,141,850,000 | | | | 245,476 | |
Receive | | 6-Month JPY-LIBOR | | | 0.815 | % | | | 11/25/23 | | | | JPY | | | | 1,963,365,000 | | | | 25,431 | |
| | | | | | | | | | | | | | | | | | | | | | |
Total | | | $ | 484,275 | |
| | | | | | | | | | | | | | | | | | | | | | |
Centrally Cleared Credit Default Swap Agreements on Credit Indices—Buy Protection (a)
| | | | | | | | | | | | | | | | | | | | | | |
Reference Obligation | | Fixed Deal
(Pay) Rate | | | Maturity
Date | | | Implied Credit
Spread at
December 31,
2013(b) | | Notional
Amount(c) | | | Unrealized
Depreciation | |
Markit CDX North America High Yield Index, Series 21, Version 1 | | | (5.000%) | | | | 12/20/18 | | | 3.063% | | | USD | | | | 39,585,000 | | | $ | (715,077) | |
| | | | | | | | | | | | | | | | | | | | | | |
OTC Credit Default Swaps on Corporate Issues—Sell Protection (d)
| | | | | | | | | | | | | | | | | | | | | | | | | | | | | | | | | | |
Reference Obligation | | Fixed Deal
Receive Rate | | | Maturity
Date | | | Counterparty | | Implied Credit
Spread at
December 31,
2013(b) | | | Notional
Amount(c) | | | Market
Value | | | Upfront
Premium
(Received) | | | Unrealized
Appreciation | |
Goldman Sachs Group, Inc. (The)
5.950%, due 01/18/2018 | | | 1.000% | | | | 12/20/18 | | | Deutsche Bank AG | | | 0.884% | | | | USD | | | | 13,800,000 | | | $ | 76,392 | | | $ | (120,308) | | | $ | 196,700 | |
| | | | | | | | | | | | | | | | | | | | | | | | | | | | | | | | | | |
OTC Credit Default Swaps on Credit Indices—Buy Protection (a)
| | | | | | | | | | | | | | | | | | | | | | | | | | | | | | | | | | |
Reference Obligation | | Fixed Deal
(Pay) Rate | | | Maturity
Date | | | Counterparty | | Implied Credit
Spread at
December 31,
2013(b) | | | Notional
Amount(c) | | | Market
Value | | | Upfront
Premium
Paid | | | Unrealized
Depreciation | |
Markit CMBX North America AAA-Rated Index, AM Tranche, Version 6 | | | (0.500%) | | | | 05/11/63 | | | Credit Suisse International | | | N/A | | | | USD | | | | 1,386,000 | | | $ | 35,104 | | | $ | 47,571 | | | $ | (12,467) | |
Markit CMBX North America AAA-Rated Index, AM Tranche, Version 6 | | | (0.500%) | | | | 05/11/63 | | | Morgan Stanley Capital Services | | | N/A | | | | USD | | | | 4,085,000 | | | | 103,462 | | | | 152,577 | | | | (49,115) | |
| | | | | | | | | | | | | | | | | | | | | | | | | | | | | | | | | | |
Totals | | | $ | 138,566 | | | $ | 200,148 | | | $ | (61,582) | |
| | | | | | | | | | | | | | | | | | | | | | | | | | | | | | | | | | |
See accompanying notes to financial statements.
MSF-19
Metropolitan Series Fund
BlackRock Bond Income Portfolio
Schedule of Investments as of December 31, 2013
OTC Credit Default Swaps on credit indices—Sell Protection (d)
| | | | | | | | | | | | | | | | | | | | | | | | | | | | | | | | | | |
Reference Obligation | | Fixed Deal
Receive Rate | | | Maturity
Date | | | Counterparty | | Implied Credit
Spread at
December 31,
2013(b) | | | Notional
Amount(c) | | | Market
Value | | | Upfront
Premium
Paid/(Received) | | | Unrealized
Appreciation/
(Depreciation) | |
Markit CDX Emerging Markets Index, Series 20, Version 1 | | | 5.000% | | | | 12/20/18 | | | Bank of America N.A. | | | 2.734% | | | | USD | | | | 2,810,000 | | | $ | 285,192 | | | $ | 288,025 | | | $ | (2,833) | |
Markit CDX Emerging Markets Index, Series 20, Version 1 | | | 5.000% | | | | 12/20/18 | | | Barclays Bank plc | | | 2.734% | | | | USD | | | | 5,396,000 | | | | 547,650 | | | | 542,298 | | | | 5,352 | |
Markit CDX Emerging Markets Index, Series 20, Version 1 | | | 5.000% | | | | 12/20/18 | | | Barclays Bank plc | | | 2.734% | | | | USD | | | | 4,947,000 | | | | 502,081 | | | | 497,174 | | | | 4,907 | |
Markit CDX Emerging Markets Index, Series 20, Version 1 | | | 5.000% | | | | 12/20/18 | �� | | Barclays Bank plc | | | 2.734% | | | | USD | | | | 2,812,000 | | | | 285,395 | | | | 292,448 | | | | (7,053) | |
Markit CMBX North America AAA-Rated Index, AM Tranche, Version 2 | | | 0.500% | | | | 03/15/49 | | | Deutsche Bank AG | | | N/A | | | | USD | | | | 7,025,000 | | | | (173,430) | | | | (1,031,895) | | | | 858,465 | |
Markit CMBX North America AAA-Rated Index, AM Tranche, Version 4 | | | 0.500% | | | | 02/17/51 | | | Deutsche Bank AG | | | N/A | | | | USD | | | | 2,370,000 | | | | (162,464) | | | | (359,977) | | | | 197,513 | |
| | | | | | | | | | | | | | | | | | | | | | | | | | | | | | | | | | |
Totals | | | $ | 1,284,424 | | | $ | 228,073 | | | $ | 1,056,351 | |
| | | | | | | | | | | | | | | | | | | | | | | | | | | | | | | | | | |
A security with market value of $649,727 has been received at the custodian bank as collateral for swap contracts.
| (a) | If the Portfolio is a buyer of protection and a credit event occurs, as defined under the terms of that particular swap agreement, the Portfolio will either (i) receive from the seller of protection an amount equal to the notional amount of the swap and deliver the referenced obligation or underlying securities comprising the referenced index or (ii) receive a net settlement amount in the form of cash or securities equal to the notional amount of the swap less the recovery value of the referenced obligation or underlying securities comprising the referenced index. |
| (b) | Implied credit spreads, represented in absolute terms, utilized in determining the market value of credit default swap agreements on corporate issues or indices as of period end serve as an indicator of the current status of the payment/performance risk and represent the likelihood or risk of default for the credit derivative. The implied credit spread of a particular referenced entity reflects the cost of buying/selling protection and may include upfront payments required to be made to enter into the agreement. Wider credit spreads represent a deterioration of the referenced entity’s credit soundness and a greater likelihood or risk of default or other credit event occurring as defined under the terms of the agreement. A credit spread identified as “Defaulted” indicates a credit event has occurred for the referenced entity or obligation. |
| (c) | The maximum potential amount of future undiscounted payments that the Portfolio could be required to make under a credit default swap contract would be the notional amount of the contract. These potential amounts would be partially offset by any recovery values of the referenced debt obligation or net amounts received from the settlement purchased protection credit default swap contracts entered into by the Portfolio for the same referenced debt obligation. |
| (d) | If the Portfolio is a seller of protection and a credit event occurs, as defined under the terms of that particular swap agreement, the Portfolio will either (i) pay to the buyer of protection an amount equal to the notional amount of the swap and take delivery of the referenced obligation or underlying securities comprising the referenced index or (ii) pay a net settlement amount in the form of cash or securities equal to the notional amount of the swap less the recovery value of the referenced obligation or underlying securities comprising the referenced index. |
| (CDI)— | Brazil Interbank Deposit Rate |
| (EURIBOR)— | Euro InterBank Offered Rate |
| (LIBOR)— | London InterBank Offered Rate |
| (TIIE)— | Interbank Equilibrium Interest Rate |
See accompanying notes to financial statements.
MSF-20
Metropolitan Series Fund
BlackRock Bond Income Portfolio
Schedule of Investments as of December 31, 2013
Fair Value Hierarchy
Accounting principles generally accepted in the United States of America (“GAAP”) define fair market value as the price that the Portfolio would receive to sell an asset or pay to transfer a liability in an orderly transaction between market participants at the measurement date. It establishes a fair value hierarchy that prioritizes inputs to valuation methods and requires disclosure of the fair value hierarchy that segregates fair value measurements into three levels. Levels 1, 2 and 3 of the fair value hierarchy are defined as follows:
Level 1 - unadjusted quoted prices in active markets for identical investments
Level 2 - other significant observable inputs (including, but not limited to, unadjusted quoted prices for similar investments in markets that are either active or inactive; inputs other than quoted prices that are observable such as interest rates, yield curves, volatilities, prepayment speeds, loss severities, credit risks, default rates, etc.)
Level 3 - significant unobservable inputs based on the best information available in the circumstances, to the extent observable inputs are unavailable (including the Portfolio’s own assumptions in determining the fair value of investments)
The inputs or methodologies used for valuing investments are not necessarily an indication of the risk associated with investing in them. Changes to the inputs or methodologies used may result in transfers between levels, which will be recognized as of the beginning of the reporting period. Information on transfers between Level 1 and Level 2, if any, will be disclosed following the fair value hierarchy table below. A reconciliation of Level 3 securities, if any, will also be disclosed following the fair value hierarchy table. For more information about the Portfolio’s policy regarding the valuation of investments, please refer to the Notes to Financial Statements.
The following table summarizes the fair value hierarchy of the Portfolio’s investments as of December 31, 2013:
| | | | | | | | | | | | | | | | |
| Description | | Level 1 | | | Level 2 | | | Level 3 | | | Total | |
Total U.S. Treasury & Government Agencies* | | $ | — | | | $ | 1,989,560,944 | | | $ | — | | | $ | 1,989,560,944 | |
Total Corporate Bonds & Notes* | | | — | | | | 933,455,860 | | | | — | | | | 933,455,860 | |
Total Asset-Backed Securities* | | | — | | | | 792,020,770 | | | | — | | | | 792,020,770 | |
Total Mortgage-Backed Securities* | | | — | | | | 523,778,589 | | | | — | | | | 523,778,589 | |
Total Foreign Government* | | | — | | | | 42,203,141 | | | | — | | | | 42,203,141 | |
Total Floating Rate Loans* | | | — | | | | 15,587,486 | | | | — | | | | 15,587,486 | |
Total Preferred Stocks* | | | 8,661,638 | | | | — | | | | — | | | | 8,661,638 | |
Total Municipals | | | — | | | | 5,498,485 | | | | — | | | | 5,498,485 | |
| Purchased Options | | | | | | | | | | | | | | | | |
Call Options | | | — | | | | 323,333 | | | | — | | | | 323,333 | |
Put Options | | | 1,283,175 | | | | 2,454,887 | | | | — | | | | 3,738,062 | |
Total Purchased Options | | | 1,283,175 | | | | 2,778,220 | | | | — | | | | 4,061,395 | |
| Short-Term Investments | | | | | | | | | | | | | | | | |
Mutual Fund | | | 110,019,464 | | | | — | | | | — | | | | 110,019,464 | |
Repurchase Agreement | | | — | | | | 4,351,000 | | | | — | | | | 4,351,000 | |
Total Short-Term Investments | | | 110,019,464 | | | | 4,351,000 | | | | — | | | | 114,370,464 | |
Total Investments | | $ | 119,964,277 | | | $ | 4,309,234,495 | | | $ | — | | | $ | 4,429,198,772 | |
| | | | | | | | | | | | | | | | | |
Collateral for securities loaned (Liability) | | $ | — | | | $ | (110,019,464 | ) | | $ | — | | | $ | (110,019,464 | ) |
Forward Sales Commitments | | $ | — | | | $ | (263,600,294 | ) | | $ | — | | | $ | (263,600,294 | ) |
| Forward Contracts | | | | | | | | | | | | | | | | |
Forward Foreign Currency Exchange Contracts (Unrealized Appreciation) | | $ | — | | | $ | 659,693 | | | $ | — | | | $ | 659,693 | |
Forward Foreign Currency Exchange Contracts (Unrealized Depreciation) | | | — | | | | (1,595,081 | ) | | | — | | | | (1,595,081 | ) |
Total Forward Contracts | | $ | — | | | $ | (935,388 | ) | | $ | — | | | $ | (935,388 | ) |
| Futures Contracts | | | | | | | | | | | | | | | | |
Futures Contracts (Unrealized Appreciation) | | $ | 4,900,417 | | | $ | — | | | $ | — | | | $ | 4,900,417 | |
Futures Contracts (Unrealized Depreciation) | | | (3,638,729 | ) | | | — | | | | — | | | | (3,638,729 | ) |
Total Futures Contracts | | $ | 1,261,688 | | | $ | — | | | $ | — | | | $ | 1,261,688 | |
| Written Options | | | | | | | | | | | | | | | | |
Foreign Currency Written Options at Value | | $ | — | | | $ | (627,735 | ) | | $ | — | | | $ | (627,735 | ) |
Interest Rate Swaptions at Value | | | — | | | | (244,728 | ) | | | — | | | | (244,728 | ) |
Options on Exchange-Traded Futures Contracts at Value | | | (308,912 | ) | | | — | | | | — | | | | (308,912 | ) |
Total Written Options | | $ | (308,912 | ) | | $ | (872,463 | ) | | $ | — | | | $ | (1,181,375 | ) |
See accompanying notes to financial statements.
MSF-21
Metropolitan Series Fund
BlackRock Bond Income Portfolio
Schedule of Investments as of December 31, 2013
Fair Value Hierarchy—(Continued)
| | | | | | | | | | | | | | | | |
| Description | | Level 1 | | | Level 2 | | | Level 3 | | | Total | |
| Centrally Cleared Swap Contracts | | | | | | | | | | | | | | | | |
Centrally Cleared Swap Contracts (Unrealized Appreciation) | | $ | — | | | $ | 484,275 | | | $ | — | | | $ | 484,275 | |
Centrally Cleared Swap Contracts (Unrealized Depreciation) | | | — | | | | (715,077 | ) | | | — | | | | (715,077 | ) |
Total Centrally Cleared Swap Contracts | | $ | — | | | $ | (230,802 | ) | | $ | — | | | $ | (230,802 | ) |
| OTC Swap Contracts | | | | | | | | | | | | | | | | |
OTC Swap Contracts at Value (Assets) | | $ | — | | | $ | 3,473,858 | | | $ | — | | | $ | 3,473,858 | |
OTC Swap Contracts at Value (Liabilities) | | | — | | | | (609,366 | ) | | | — | | | | (609,366 | ) |
Total OTC Swap Contracts | | $ | — | | | $ | 2,864,492 | | | $ | — | | | $ | 2,864,492 | |
Total Reverse Repurchase Agreements (Liability) | | $ | — | | | $ | (71,432,925 | ) | | $ | — | | | $ | (71,432,925 | ) |
| * | See Schedule of Investments for additional detailed categorizations. |
Following is a reconciliation of Level 3 assets for which significant unobservable inputs were used to determine fair value:
| | | | | | | | | | | | | | | | | | | | | | | | | | | | | | | | | | | | |
Investments in Securities | | Balance as of
December 31,
2012 | | | Realized
Gain/(Loss) | | | Change in
Unrealized
Appreciation/
(Depreciation) | | | Purchases | | | Sales | | | Transfers
in to
Level 3 | | | Transfers
out of
Level 3 | | | Balance
as of
December 31,
2013 | | | Change in
Unrealized
Appreciation/
(Depreciation)
from investments
still held at
December 31,
2013 | |
| Asset-Backed Securities | | | | | | | | | | | | | | | | | | | | | | | | | | | | | | | | | | | | |
Asset Backed-Other | | $ | 19,235,740 | | | $ | — | | | $ | — | | | $ | — | | | $ | — | | | $ | — | | | $ | (19,235,740 | ) | | $ | — | | | $ | — | |
| | | | | | | | | | | | | | | | | | | | | | | | | | | | | | | | | | | | |
Asset-backed securities were transferred out of level 3 due to the initiation of a vendor or broker providing quotations based on market activity which has been determined to be a significant observable input.
See accompanying notes to financial statements.
MSF-22
Metropolitan Series Fund
BlackRock Bond Income Portfolio
Statement of Assets and Liabilities
December 31, 2013
| | | | |
Assets | | | | |
Investments at value (a) (b) | | $ | 4,429,198,772 | |
Cash | | | 569,850 | |
Cash denominated in foreign currencies (c) | | | 10,931,491 | |
Cash collateral for swap contracts | | | 3,135,000 | |
OTC swap contracts at market value (d) | | | 3,473,858 | |
Unrealized appreciation on forward foreign currency exchange contracts | | | 659,693 | |
Receivable for: | | | | |
Investments sold | | | 101,347,953 | |
Open swap contracts cash collateral | | | 30,000 | |
TBA securities sold (e) | | | 786,639,644 | |
Fund shares sold | | | 2,842,538 | |
Interest | | | 21,332,414 | |
Interest on swap contracts | | | 113,353 | |
Prepaid expenses | | | 10,240 | |
| | | | |
Total Assets | | | 5,360,284,806 | |
Liabilities | | | | |
Written options at value (f) | | | 1,181,375 | |
Forward sales commitments, at value | | | 263,600,294 | |
Reverse repurchase agreements | | | 71,432,925 | |
OTC swap contracts at market value (g) | | | 609,366 | |
Cash collateral for swap contracts | | | 1,690,000 | |
Unrealized depreciation on forward foreign currency exchange contracts | | | 1,595,081 | |
Collateral for securities loaned | | | 110,019,464 | |
Payables for: | | | | |
Investments purchased | | | 47,335,782 | |
TBA securities purchased | | | 1,007,264,571 | |
Fund shares redeemed | | | 752,908 | |
Variation margin on futures contracts | | | 773,807 | |
Variation margin on swap contracts | | | 283,695 | |
Interest on forward sales commitments | | | 458,699 | |
Interest on swap contracts | | | 71,475 | |
Accrued Expenses: | | | | |
Management fees | | | 1,070,519 | |
Distribution and service fees | | | 123,089 | |
Deferred trustees’ fees | | | 52,804 | |
Other expenses | | | 220,329 | |
| | | | |
Total Liabilities | | | 1,508,536,183 | |
| | | | |
Net Assets | | $ | 3,851,748,623 | |
| | | | |
Net Assets Consist of: | | | | |
Paid in surplus | | $ | 3,783,933,129 | |
Undistributed net investment income | | | 135,358,735 | |
Accumulated net realized loss | | | (41,155,413 | ) |
Unrealized depreciation on investments, written options, futures contracts, swap contracts and foreign currency transactions | | | (26,387,828 | ) |
| | | | |
Net Assets | | $ | 3,851,748,623 | |
| | | | |
Net Assets | | | | |
Class A | | $ | 3,212,953,476 | |
Class B | | | 488,138,959 | |
Class E | | | 150,656,188 | |
Capital Shares Outstanding* | | | | |
Class A | | | 29,934,522 | |
Class B | | | 4,620,979 | |
Class E | | | 1,415,806 | |
Net Asset Value, Offering Price and Redemption Price Per Share | | | | |
Class A | | $ | 107.33 | |
Class B | | | 105.64 | |
Class E | | | 106.41 | |
| * | The Portfolio is authorized to issue an unlimited number of shares. |
| (a) | Identified cost of investments was $4,458,852,955. |
| (b) | Includes securities loaned at value of $111,269,740. |
| (c) | Identified cost of cash denominated in foreign currencies was $10,930,637. |
| (d) | Net premium paid on swap contracts was $1,699,785. |
| (e) | Includes $264,436,516 related to TBA sale commitments. |
| (f) | Premiums received on written options were $944,272. |
| (g) | Net premium received on swap contracts was $1,391,872. |
Statement of Operations
Year Ended December 31, 2013
| | | | |
Investment Income | | | | |
Dividends | | $ | 487,889 | |
Interest | | | 130,692,648 | |
Securities lending income | | | 203,985 | |
| | | | |
Total investment income | | | 131,384,522 | |
Expenses | | | | |
Management fees | | | 12,607,700 | |
Administration fees | | | 53,038 | |
Custodian and accounting fees | | | 474,802 | |
Distribution and service fees—Class B | | | 1,243,791 | |
Distribution and service fees—Class E | | | 244,470 | |
Interest expense | | | 3,561 | |
Audit and tax services | | | 105,087 | |
Legal | | | 27,754 | |
Trustees’ fees and expenses | | | 35,358 | |
Shareholder reporting | | | 201,746 | |
Insurance | | | 18,224 | |
Miscellaneous | | | 30,725 | |
| | | | |
Total expenses | | | 15,046,256 | |
| | | | |
Net Investment Income | | | 116,338,266 | |
| | | | |
Net Realized and Unrealized Loss | | | | |
| Net realized gain (loss) on: | | | | |
Investments | | | (87,326,636 | ) |
Futures contracts | | | 7,771,466 | |
Written options | | | 29,586,298 | |
Swap contracts | | | 45,357,955 | |
Foreign currency transactions | | | 3,247,576 | |
| | | | |
Net realized loss | | | (1,363,341 | ) |
| | | | |
| Net change in unrealized appreciation (depreciation) on: | | | | |
Investments | | | (138,377,495 | ) |
Futures contracts | | | (2,826,675 | ) |
Written options | | | 3,606,593 | |
Swap contracts | | | (3,835,325 | ) |
Foreign currency transactions | | | (1,402,866 | ) |
| | | | |
Net change in unrealized depreciation | | | (142,835,768 | ) |
| | | | |
Net realized and unrealized loss | | | (144,199,109 | ) |
| | | | |
Net Decrease in Net Assets From Operations | | $ | (27,860,843 | ) |
| | | | |
See accompanying notes to financial statements.
MSF-23
Metropolitan Series Fund
BlackRock Bond Income Portfolio
Statements of Changes in Net Assets
| | | | | | | | |
| | | Year Ended
December 31,
2013 | | | Year Ended
December 31,
2012 | |
Increase (Decrease) in Net Assets: | | | | | | | | |
From Operations | | | | | | | | |
Net investment income | | $ | 116,338,266 | | | $ | 112,846,361 | |
Net realized gain (loss) | | | (1,363,341 | ) | | | 113,624,069 | |
Net change in unrealized appreciation (depreciation) | | | (142,835,768 | ) | | | 63,027,702 | |
| | | | | | | | |
Increase (decrease) in net assets from operations | | | (27,860,843 | ) | | | 289,498,132 | |
| | | | | | | | |
From Distributions to Shareholders | | | | | | | | |
Net investment income | | | | | | | | |
Class A | | | (118,542,001 | ) | | | (88,521,069 | ) |
Class B | | | (18,814,715 | ) | | | (12,343,891 | ) |
Class E | | | (6,389,864 | ) | | | (4,857,014 | ) |
Net realized capital gains | | | | | | | | |
Class A | | | (72,254,675 | ) | | | (21,332,126 | ) |
Class B | | | (12,218,854 | ) | | | (3,261,236 | ) |
Class E | | | (4,063,983 | ) | | | (1,236,117 | ) |
| | | | | | | | |
Total distributions | | | (232,284,092 | ) | | | (131,551,453 | ) |
| | | | | | | | |
Increase (decrease) in net assets from capital share transactions | | | (42,270,795 | ) | | | 201,983,827 | |
| | | | | | | | |
Total increase (decrease) in net assets | | | (302,415,730 | ) | | | 359,930,506 | |
| | |
Net Assets | | | | | | | | |
Beginning of period | | | 4,154,164,353 | | | | 3,794,233,847 | |
| | | | | | | | |
End of period | | $ | 3,851,748,623 | | | $ | 4,154,164,353 | |
| | | | | | | | |
| | |
Undistributed net investment income | | | | | | | | |
End of period | | $ | 135,358,735 | | | $ | 136,865,987 | |
| | | | | | | | |
Other Information:
Capital Shares
Transactions in capital shares were as follows:
| | | | | | | | | | | | | | | | |
| | | Year Ended
December 31, 2013 | | | Year Ended
December 31, 2012 | |
| | | Shares | | | Value | | | Shares | | | Value | |
Class A | | | | | | | | | | | | | | | | |
Sales | | | 3,864,722 | | | $ | 423,292,236 | | | | 3,042,642 | | | $ | 341,933,943 | |
Reinvestments | | | 1,737,516 | | | | 190,796,676 | | | | 1,004,051 | | | | 109,853,195 | |
Redemptions | | | (5,807,267 | ) | | | (663,471,380 | ) | | | (2,070,522 | ) | | | (232,524,133 | ) |
| | | | | | | | | | | | | | | | |
Net increase (decrease) | | | (205,029 | ) | | $ | (49,382,468 | ) | | | 1,976,171 | | | $ | 219,263,005 | |
| | | | | | | | | | | | | | | | |
Class B | | | | | | | | | | | | | | | | |
Sales | | | 566,927 | | | $ | 61,547,056 | | | | 600,267 | | | $ | 66,695,948 | |
Reinvestments | | | 286,658 | | | | 31,033,569 | | | | 144,532 | | | | 15,605,127 | |
Redemptions | | | (667,478 | ) | | | (71,881,722 | ) | | | (674,930 | ) | | | (74,821,954 | ) |
| | | | | | | | | | | | | | | | |
Net increase | | | 186,107 | | | $ | 20,698,903 | | | | 69,869 | | | $ | 7,479,121 | |
| | | | | | | | | | | | | | | | |
Class E | | | | | | | | | | | | | | | | |
Sales | | | 99,801 | | | $ | 10,863,633 | | | | 103,239 | | | $ | 11,511,651 | |
Reinvestments | | | 95,925 | | | | 10,453,847 | | | | 56,096 | | | | 6,093,131 | |
Redemptions | | | (321,377 | ) | | | (34,904,710 | ) | | | (380,256 | ) | | | (42,363,081 | ) |
| | | | | | | | | | | | | | | | |
Net decrease | | | (125,651 | ) | | $ | (13,587,230 | ) | | | (220,921 | ) | | $ | (24,758,299 | ) |
| | | | | | | | | | | | | | | | |
Increase (decrease) derived from capital shares transactions | | | | | | $ | (42,270,795 | ) | | | | | | $ | 201,983,827 | |
| | | | | | | | | | | | | | | | |
See accompanying notes to financial statements.
MSF-24
Metropolitan Series Fund
BlackRock Bond Income Portfolio
Financial Highlights
| | | | | | | | | | | | | | | | | | | | |
| Selected per share data | | | |
| | | Class A | |
| | | Year Ended December 31, | |
| | | 2013 | | | 2012 | | | 2011 | | | 2010 | | | 2009 | |
Net Asset Value, Beginning of Period | | $ | 115.27 | | | $ | 110.90 | | | $ | 108.32 | | | $ | 104.15 | | | $ | 102.51 | |
| | | | | | | | | | | | | | | | | | | | |
Income (Loss) from Investment Operations | | | | | | | | | | | | | | | | | | | | |
Net investment income (a) | | | 3.36 | | | | 3.21 | | | | 3.69 | | | | 4.08 | | | | 4.38 | |
Net realized and unrealized gain (loss) on investments | | | (4.07 | ) | | | 4.95 | | | | 3.22 | | | | 4.39 | | | | 4.68 | |
| | | | | | | | | | | | | | | | | | | | |
Total from investment operations | | | (0.71 | ) | | | 8.16 | | | | 6.91 | | | | 8.47 | | | | 9.06 | |
| | | | | | | | | | | | | | | | | | | | |
Less Distributions | | | | | | | | | | | | | | | | | | | | |
Distributions from net investment income | | | (4.49 | ) | | | (3.05 | ) | | | (4.33 | ) | | | (4.30 | ) | | | (7.42 | ) |
Distributions from net realized capital gains | | | (2.74 | ) | | | (0.74 | ) | | | 0.00 | | | | 0.00 | | | | 0.00 | |
| | | | | | | | | | | | | | | | | | | | |
Total distributions | | | (7.23 | ) | | | (3.79 | ) | | | (4.33 | ) | | | (4.30 | ) | | | (7.42 | ) |
| | | | | | | | | | | | | | | | | | | | |
Net Asset Value, End of Period | | $ | 107.33 | | | $ | 115.27 | | | $ | 110.90 | | | $ | 108.32 | | | $ | 104.15 | |
| | | | | | | | | | | | | | | | | | | | |
Total Return (%) (b) | | | (0.77 | ) | | | 7.55 | | | | 6.56 | | | | 8.34 | | | | 9.47 | |
| | | | | |
Ratios/Supplemental Data | | | | | | | | | | | | | | | | | | | | |
Gross ratio of expenses to average net assets (%) | | | 0.35 | | | | 0.36 | | | | 0.37 | | | | 0.40 | | | | 0.43 | |
Net ratio of expenses to average net assets (%) (c) | | | 0.35 | | | | 0.36 | | | | 0.36 | | | | 0.38 | | | | 0.42 | |
Ratio of net investment income to average net assets (%) | | | 3.07 | | | | 2.85 | | | | 3.44 | | | | 3.82 | | | | 4.32 | |
Portfolio turnover rate (%) | | | 801 | (d) | | | 1,002 | (d) | | | 1,483 | | | | 2,064 | | | | 1,476 | |
Net assets, end of period (in millions) | | $ | 3,213.0 | | | $ | 3,474.3 | | | $ | 3,123.2 | | | $ | 1,522.5 | | | $ | 1,181.4 | |
| | | | | | | | | | | | | | | | | | | | |
| | | Class B | |
| | | Year Ended December 31, | |
| | | 2013 | | | 2012 | | | 2011 | | | 2010 | | | 2009 | |
Net Asset Value, Beginning of Period | | $ | 113.56 | | | $ | 109.31 | | | $ | 106.83 | | | $ | 102.78 | | | $ | 101.23 | |
| | | | | | | | | | | | | | | | | | | | |
Income (Loss) from Investment Operations | | | | | | | | | | | | | | | | | | | | |
Net investment income (a) | | | 3.05 | | | | 2.89 | | | | 3.48 | | | | 3.77 | | | | 4.16 | |
Net realized and unrealized gain (loss) on investments | | | (4.01 | ) | | | 4.88 | | | | 3.06 | | | | 4.32 | | | | 4.55 | |
| | | | | | | | | | | | | | | | | | | | |
Total from investment operations | | | (0.96 | ) | | | 7.77 | | | | 6.54 | | | | 8.09 | | | | 8.71 | |
| | | | | | | | | | | | | | | | | | | | |
Less Distributions | | | | | | | | | | | | | | | | | | | | |
Distributions from net investment income | | | (4.22 | ) | | | (2.78 | ) | | | (4.06 | ) | | | (4.04 | ) | | | (7.16 | ) |
Distributions from net realized capital gains | | | (2.74 | ) | | | (0.74 | ) | | | 0.00 | | | | 0.00 | | | | 0.00 | |
| | | | | | | | | | | | | | | | | | | | |
Total distributions | | | (6.96 | ) | | | (3.52 | ) | | | (4.06 | ) | | | (4.04 | ) | | | (7.16 | ) |
| | | | | | | | | | | | | | | | | | | | |
Net Asset Value, End of Period | | $ | 105.64 | | | $ | 113.56 | | | $ | 109.31 | | | $ | 106.83 | | | $ | 102.78 | |
| | | | | | | | | | | | | | | | | | | | |
Total Return (%) (b) | | | (1.01 | ) | | | 7.28 | | | | 6.30 | | | | 8.07 | | | | 9.18 | |
| | | | | |
Ratios/Supplemental Data | | | | | | | | | | | | | | | | | | | | |
Gross ratio of expenses to average net assets (%) | | | 0.60 | | | | 0.61 | | | | 0.62 | | | | 0.65 | | | | 0.68 | |
Net ratio of expenses to average net assets (%) (c) | | | 0.60 | | | | 0.61 | | | | 0.61 | | | | 0.63 | | | | 0.67 | |
Ratio of net investment income to average net assets (%) | | | 2.82 | | | | 2.60 | | | | 3.25 | | | | 3.57 | | | | 4.14 | |
Portfolio turnover rate (%) | | | 801 | (d) | | | 1,002 | (d) | | | 1,483 | | | | 2,064 | | | | 1,476 | |
Net assets, end of period (in millions) | | $ | 488.1 | | | $ | 503.6 | | | $ | 477.1 | | | $ | 453.5 | | | $ | 356.6 | |
Please see following page for Financial Highlights footnote legend.
See accompanying notes to financial statements.
MSF-25
Metropolitan Series Fund
BlackRock Bond Income Portfolio
Financial Highlights
| | | | | | | | | | | | | | | | | | | | |
| Selected per share data | | | |
| | | Class E | |
| | | Year Ended December 31, | |
| | | 2013 | | | 2012 | | | 2011 | | | 2010 | | | 2009 | |
Net Asset Value, Beginning of Period | | $ | 114.32 | | | $ | 110.02 | | | $ | 107.49 | | | $ | 103.38 | | | $ | 101.79 | |
| | | | | | | | | | | | | | | | | | | | |
Income (Loss) from Investment Operations | | | | | | | | | | | | | | | | | | | | |
Net investment income (a) | | | 3.18 | | | | 3.02 | | | | 3.63 | | | | 3.91 | | | | 4.36 | |
Net realized and unrealized gain (loss) on investments | | | (4.04 | ) | | | 4.91 | | | | 3.07 | | | | 4.34 | | | | 4.49 | |
| | | | | | | | | | | | | | | | | | | | |
Total from investment operations | | | (0.86 | ) | | | 7.93 | | | | 6.70 | | | | 8.25 | | | | 8.85 | |
| | | | | | | | | | | | | | | | | | | | |
Less Distributions | | | | | | | | | | | | | | | | | | | | |
Distributions from net investment income | | | (4.31 | ) | | | (2.89 | ) | | | (4.17 | ) | | | (4.14 | ) | | | (7.26 | ) |
Distributions from net realized capital gains | | | (2.74 | ) | | | (0.74 | ) | | | 0.00 | | | | 0.00 | | | | 0.00 | |
| | | | | | | | | | | | | | | | | | | | |
Total distributions | | | (7.05 | ) | | | (3.63 | ) | | | (4.17 | ) | | | (4.14 | ) | | | (7.26 | ) |
| | | | | | | | | | | | | | | | | | | | |
Net Asset Value, End of Period | | $ | 106.41 | | | $ | 114.32 | | | $ | 110.02 | | | $ | 107.49 | | | $ | 103.38 | |
| | | | | | | | | | | | | | | | | | | | |
Total Return (%) (b) | | | (0.91 | ) | | | 7.38 | | | | 6.41 | | | | 8.18 | | | | 9.30 | |
| | | | | |
Ratios/Supplemental Data | | | | | | | | | | | | | | | | | | | | |
Gross ratio of expenses to average net assets (%) | | | 0.50 | | | | 0.51 | | | | 0.52 | | | | 0.55 | | | | 0.58 | |
Net ratio of expenses to average net assets (%) (c) | | | 0.50 | | | | 0.51 | | | | 0.51 | | | | 0.53 | | | | 0.57 | |
Ratio of net investment income to average net assets (%) | | | 2.92 | | | | 2.70 | | | | 3.36 | | | | 3.67 | | | | 4.31 | |
Portfolio turnover rate (%) | | | 801 | (d) | | | 1,002 | (d) | | | 1,483 | | | | 2,064 | | | | 1,476 | |
Net assets, end of period (in millions) | | $ | 150.7 | | | $ | 176.2 | | | $ | 193.9 | | | $ | 226.6 | | | $ | 236.7 | |
| (a) | Per share amounts based on average shares outstanding during the period. |
| (b) | Total return does not reflect any insurance, sales, separate account or administrative charges of variable annuity or life insurance contracts or any additional expenses that contract owners may bear under their variable contracts. If these charges were included, the returns would be lower. |
| (c) | Net ratio of expenses to average net assets includes the effect of the management fee waivers as detailed in Note 6 of the Notes to Financial Statements. |
| (d) | Includes mortgage dollar roll and TBA transactions; excluding these transactions the portfolio turnover rate would have been 267% and 390% for 2013 and 2012, respectively. |
See accompanying notes to financial statements.
MSF-26
Metropolitan Series Fund
BlackRock Bond Income Portfolio
Notes to Financial Statements—December 31, 2013
1. Organization
Metropolitan Series Fund (the “Trust”) is organized as a Delaware statutory trust and registered under the Investment Company Act of 1940, as amended (the “1940 Act”), as an open-end management investment company. The Trust is currently comprised of thirty series, each of which operates as a distinct investment vehicle of the Trust. The portfolio included in this report is BlackRock Bond Income Portfolio (the “Portfolio”), which is diversified. Shares in the Portfolio are not offered directly to the general public and are currently available only to separate accounts established by Metropolitan Life Insurance Company (“MetLife”) and other affiliated life insurance companies.
The Portfolio has registered and offers three classes of shares: Class A, B, and E shares. Shares of each Class of the Portfolio represent an equal pro rata interest in the Portfolio and generally give the shareholder the same voting, dividend, liquidation, and other rights. Investment income, realized and unrealized capital gains and losses, the common expenses of the Portfolio, and certain Portfolio-level expense reductions, if any, are allocated on a pro rata basis to each Class based on the relative net assets of each Class to the net assets of the Portfolio. Each Class of shares differs in its respective distribution plan and such distribution expenses are allocated to that Class.
2. Significant Accounting Policies
The preparation of financial statements in conformity with accounting principles generally accepted in the United States of America (“GAAP”) requires management to make estimates and assumptions that affect the reported amounts of assets and liabilities and disclosure of contingent assets and liabilities as of the date of the financial statements and the reported amounts of income and expenses during the reporting period. Actual results could differ from those estimates. In the preparation of these financial statements, management has evaluated events and transactions subsequent to December 31, 2013 through the date the financial statements were issued.
The following is a summary of significant accounting policies consistently followed by the Portfolio in the preparation of its financial statements.
Investment Valuation and Fair Value Measurements - Debt securities (other than short term obligations with a remaining maturity of sixty days or less), including corporate, convertible and municipal bonds and notes; obligations of the U.S. treasury and U.S. government agencies; sovereign issues; floating rate loans; and non-U.S. bonds, are generally valued on the basis of evaluated or composite bid quotations obtained from independent pricing services and/or brokers and dealers selected by MetLife Advisers, LLC (“MetLife Advisers” or the “Adviser”), an affiliate of MetLife, Inc., pursuant to authorization of the Board of Trustees of the Trust (the “Board” or “Trustees”). Such quotations utilize matrix pricing, which considers observable inputs including, among other things, issuer details, maturity dates, interest rates, yield curves, rates of prepayment, credit risks/spreads, default rates, reported trades, broker dealer quotes and quoted prices for similar securities. Securities that use similar valuation techniques and inputs as described above are generally categorized as Level 2 within the fair value hierarchy.
Mortgage and asset-backed securities are usually issued as separate tranches, or classes, of securities within each deal. These securities are also generally valued on the basis of evaluated or composite bid quotations obtained from independent pricing services and/or brokers and dealers selected by the Adviser pursuant to authorization of the Board. The pricing models for these securities usually consider tranche-level attributes, estimated cash flows and market-based yield spreads for each tranche and current market data, and incorporate deal collateral performance, as available. Mortgage and asset-backed securities that use similar valuation techniques and inputs as described above are generally categorized as Level 2 within the fair value hierarchy.
Short term obligations with a remaining maturity of sixty days or less are generally valued at amortized cost, which approximates fair market value, and are generally categorized as Level 2 within the fair value hierarchy.
Domestic and foreign equity securities, such as common stock, exchange-traded funds, rights, warrants, and preferred stock, that are traded on a securities exchange, are generally valued at their last sale price on the exchange or market in which they are principally traded on the valuation date, or, if no sales occurred on that day, at the last reported bid price. Equity securities traded over-the-counter are generally valued at the last reported sale price. Valuation adjustments may be applied to certain foreign equity securities that are traded solely on foreign exchanges that close before the close of the U.S. market to account for the market movement between the close of the foreign exchanges and the close of the U.S. market. The Portfolio may use a systematic fair valuation model provided by an independent third party to value securities principally traded in these foreign markets in order to adjust for possible stale pricing that may occur between the close of the foreign exchanges and the time of the Portfolio valuation. Foreign equity securities using these valuation adjustments are generally categorized as Level 2 within the fair value hierarchy. Equity securities that are actively traded, and have no valuation adjustments applied, are categorized as Level 1 within the fair value hierarchy. Other equity securities traded on inactive markets, or valued in reference to similar instruments traded on active markets, are generally categorized as Level 2 within the fair value hierarchy.
MSF-27
Metropolitan Series Fund
BlackRock Bond Income Portfolio
Notes to Financial Statements—December 31, 2013—(Continued)
Investments in registered open-end management investment companies are valued at reported net asset value per share on the valuation date and are categorized as Level 1 within the fair value hierarchy.
Forward foreign currency exchange contracts are valued through an independent pricing service based on the mean between closing bid and ask prices of the forward currency rates in the London foreign exchange markets on a daily basis as provided by a reliable bank or dealer. These contracts are generally categorized as Level 2 within the fair value hierarchy.
Options, whether on securities, indices, futures contracts, or otherwise, traded on exchanges are valued at the last sale price available as of the close of business on the valuation date or, if there is no such price available, at the mean between the last reported bid and ask prices. These types of options are categorized as Level 1 within the fair value hierarchy. Futures contracts, which are traded on commodity exchanges, are valued at their closing prices as of the close of such exchanges and are categorized as Level 1 within the fair value hierarchy.
Options and futures contracts that are traded over-the-counter are generally valued on the basis of quotations provided by broker-dealers or prices provided by pricing service providers who use a series of techniques, including simulation pricing models, to determine the value of the contracts. The pricing models use inputs that are observed from actively quoted markets such as issuer details, indices, spreads, interest rates, yield curves, credit curves, measures of volatility and exchange rates. These contracts are generally categorized as Level 2 within the fair value hierarchy.
Swap contracts (other than centrally cleared swaps) are marked-to-market daily based on quotations and prices supplied by market makers, broker-dealers and other pricing services. Such quotations and prices are derived utilizing significant observable data, including the underlying reference securities or indices. These contracts are generally categorized as Level 2 within the fair value hierarchy.
Centrally cleared swaps listed or traded on a multilateral or trade facility platform, such as a registered exchange, are valued at the daily settlement price determined by the respective exchange or an independent pricing service when the exchange price is not available. For centrally cleared credit default swaps the clearing facility requires its members to provide actionable price levels across complete term structures. These levels along with external third party prices are used to produce daily settlement prices. These securities are categorized as Level 2 of the fair value hierarchy. Centrally cleared interest rate swaps are valued using a pricing model that references the underlying rates including the overnight index swap rate and London Interbank Offered Rate (“LIBOR”) forward rate to produce the daily settlement price. These securities are categorized as Level 2 of the fair value hierarchy.
If no current market value quotation or other observable inputs are readily available or market value quotations are deemed to be unreliable for a security, the fair value of the security will be determined in accordance with procedures approved by and under the general supervision of the Board. In such a circumstance, the Board has delegated the determination of the fair value of a security to a Valuation Committee (“Committee”) of MetLife Advisers. The Committee provides general pricing oversight and fair value pricing determinations related to portfolio securities and meets on a regular basis to review reports relating to the valuation of the securities in the Portfolio. The Board has delegated to State Street Bank and Trust Company, the Trust’s custodian (“custodian”), the responsibility for calculating the net asset values (“NAVs”) of the Trust’s Portfolios. The Committee is responsible for overseeing the calculation of the NAVs of the Portfolios by the custodian. The Committee also periodically reviews pricing vendors, including the vendor providing fair value pricing for the Portfolio’s foreign securities, and is responsible for overseeing the correction of pricing errors and addressing other pricing issues that arise in the ordinary course of business, such as making real-time fair value determinations, as necessary.
No single standard for determining the fair value of a security can be set forth because fair value depends upon the facts and circumstances with respect to each security. Information relating to any relevant factors may be obtained by the Committee from any appropriate source, including the subadviser of the Portfolio, the custodian, a pricing service, market maker and/or broker for such security or the issuer. Appropriate methodologies for determining fair value under particular circumstances may include: matrix pricing, comparisons of securities with comparable characteristics, value based on multiples of earnings, discount from market price of similar marketable securities or a combination of these and other methods. The Committee maintains a detailed report tracking each fair-valued security that compares the fair value price to the next available trade, vendor or broker price, and provides information on how close the fair value price was to the next quoted price. The Committee reviews a summary of such report monthly. On a quarterly basis, the Board is provided with the following for consideration and ratification or adjustment: (1) a memorandum summarizing the actions taken by the Committee in the prior quarter; and (2) a list of the Portfolio’s securities as of the most recent quarter-end for which market quotations were not readily available.
Investment Transactions and Related Investment Income - Portfolio security transactions are recorded on the trade date. Dividend income is recorded on the ex-dividend date or, for certain foreign securities, when notified. Interest income, which includes amortization of premium and accretion of discount on debt securities, is recorded on the accrual basis. Realized gains and losses on investments are determined on the identified cost basis, which is the same basis used for federal income tax purposes. Foreign income and foreign capital gains on some foreign securities may be subject to foreign taxes, which are accrued as applicable. These foreign taxes have been provided for in accordance with the Portfolio’s understanding of the applicable countries’ tax rules and rates.
MSF-28
Metropolitan Series Fund
BlackRock Bond Income Portfolio
Notes to Financial Statements—December 31, 2013—(Continued)
Foreign Currency Translation - The books and records of the Portfolio are maintained in U.S. dollars. The values of securities, currencies, and other assets and liabilities denominated in currencies other than the U.S. dollar are translated into U.S. dollars based upon foreign exchange rates prevailing at the end of the period. Purchases and sales of investment securities, income, and expenses are translated on the respective dates of such transactions. Because the values of investment securities are translated at the foreign exchange rates prevailing at the end of the period, that portion of the results of operations arising from changes in exchange rates and that portion of the results of operations reflecting fluctuations arising from changes in market prices of the investment securities are not separated. Such fluctuations are included in the net realized and unrealized gain or loss on investments.
Net realized foreign exchange gains or losses arise from activity in forward foreign currency exchange contracts, sales of foreign currency, currency gains or losses realized between the trade and settlement dates on securities transactions, and the difference between the amounts of dividends, interest, and foreign withholding taxes recorded by the Portfolio and the U.S. dollar equivalent of the amounts actually received or paid by the Portfolio. Net unrealized foreign exchange gains and losses arise from changes in the value of assets and liabilities, other than investment securities, resulting from changes in foreign exchange rates.
Income Taxes - It is the Portfolio’s policy to comply with the requirements of the Internal Revenue Code of 1986, as amended, and regulations thereunder, applicable to regulated investment companies and to distribute, with respect to each taxable year, all of its taxable income to shareholders. Therefore, no federal income tax provision is required. The Portfolio files U.S. federal tax returns. No income tax returns are currently under examination. The Portfolio’s federal tax returns for the prior three fiscal years remain subject to examination by the Internal Revenue Service. As of December 31, 2013, the Portfolio had no uncertain tax positions that would require financial statement recognition, or de-recognition or disclosure.
Dividends and Distributions to Shareholders - The Portfolio records dividends and distributions on the ex-dividend date. Net realized gains from security transactions (if any) are generally distributed annually to shareholders. The timing and characterization of certain income and capital gains distributions are determined in accordance with federal tax regulations that may differ from GAAP. Permanent book and tax basis differences relating to shareholder distributions will result in reclassification between under/over distributed net investment income, accumulated net realized gains/losses, and paid-in surplus.
Book-tax differences are primarily due to foreign currency transactions, convertible preferred stock adjustments, premium amortization, distribution re-designations, paydown gain/loss reclasses, dollar roll transactions, and swap contract transactions. These adjustments have no impact on net assets or the results of operations.
Securities Lending - The Portfolio may lend its portfolio securities to certain qualified brokers who borrow securities in order to complete certain securities transactions. By lending its portfolio securities, the Portfolio attempts to increase its net investment income through the receipt of income on collateral held from securities on loan. Any gain or loss in the market price of the loaned securities that might occur and any interest earned or dividends declared during the term of the loan would accrue to the account of the Portfolio.
The Trust has entered into a securities lending arrangement with the custodian. Under this arrangement, the custodian is authorized to loan portfolio securities on the Portfolio’s behalf. In exchange, the Portfolio receives either cash or securities as collateral against the loaned securities. The Portfolio receives collateral at least equal to 102% of the market value of the loaned securities (105% for foreign equity securities), at each loan’s inception. Collateral representing at least 100% of the market value of the loaned securities must be maintained for the duration of the loan. A liability for cash collateral is reflected on the Statement of Assets and Liabilities, and is categorized as Level 2 within the fair value hierarchy. Cash collateral is generally invested in the State Street Navigator Securities Lending MET Portfolio (the “Navigator Portfolio”), a series of the State Street Navigator Securities Lending Trust that is managed by an affiliate of the custodian. The Navigator Portfolio is a registered money market fund that invests in a variety of high-quality, U.S. dollar-denominated instruments. If the market value of the collateral at the close of trading on a business day is less than 100% of the market value of the loaned securities at the close of trading on that day, the borrower shall be required to deliver, by the close of business on the following business day, an additional amount of collateral, so that the total amount of posted collateral is equal to at least 100% of the market value of all the loaned securities as of such preceding day. A portion of net income (income after the deduction of expenses and fees of the Navigator Portfolio) on the collateral is rebated to the borrower of the securities and the remainder is split between the custodian and the Portfolio. On loans collateralized by U.S. Treasuries, a fee is received from the borrower and is allocated between the Portfolio and the custodian. The risks associated with lending portfolio securities include, but are not limited to, possible delays in receiving additional collateral or in the recovery of the loaned securities, possible loss of rights in the collateral should the borrower fail financially, as well as risk of loss in the value of the collateral or the value of the investments made with the collateral. The lending agent has agreed to indemnify the Portfolio in the case of default of any securities borrower. Income received by the Portfolio in securities lending transactions during the year ended December 31, 2013 is reflected as Securities lending income on the Statement of Operations. Any outstanding loans by the Portfolio at December 31, 2013 are disclosed in the footnotes to the Schedule of Investments.
Repurchase Agreements - The Portfolio may enter into repurchase agreements, under the terms of a Master Repurchase Agreement (“MRA”), with selected commercial banks and broker-dealers, under which the Portfolio acquires securities as collateral and agrees to
MSF-29
Metropolitan Series Fund
BlackRock Bond Income Portfolio
Notes to Financial Statements—December 31, 2013—(Continued)
resell the securities at an agreed upon time and at an agreed-upon price. The Portfolio, through the custodian or a subcustodian, receives delivery of the underlying securities collateralizing any repurchase agreements. The Portfolio requires the custodian to take possession, to have legally segregated in the Federal Reserve Book Entry System, or to have segregated within the custodian’s vault, all securities held as collateral for repurchase agreements. It is the Portfolio’s policy that the market value of the collateral be at least equal to 100% of the repurchase price in the case of a repurchase agreement of one-day duration and at least equal to 102% of the repurchase price in the case of all other repurchase agreements. In the event of default or failure by a party to perform an obligation in connection with any repurchase transaction, the Master Repurchase Agreement gives the non-defaulting party the right to set-off claims and to apply property held by it in connection with any repurchase transaction against obligations owed to it.
At December 31, 2013, the Portfolio had investments in repurchase agreements with a gross value of $4,351,000, which is included as part of investments at value on the Statement of Assets and Liabilities. The value of the related collateral exceeded the value of the repurchase agreements at December 31, 2013.
Reverse Repurchase Agreements - The Portfolio may enter into reverse repurchase agreements with qualified institutions. In a reverse repurchase agreement, the Portfolio transfers securities in exchange for cash to a financial institution or counterparty, concurrently with an agreement by the Portfolio to re-acquire the same securities at an agreed upon price and date. During the reverse repurchase agreement period, the Portfolio continues to receive principal and interest payments on these securities. The Portfolio will establish a segregated account with its custodian in which it will maintain liquid assets equal in value to its obligations in respect of reverse repurchase agreements. Reverse repurchase agreements involve the risk that the market value of the securities transferred by the Portfolio may decline below the agreed-upon reacquisition price of the securities. In the event of default or failure by a party to perform an obligation in connection with any reverse repurchase transaction, the Master Repurchase Agreement entitles the non-defaulting party with a right to set-off claims and apply property held by it in respect of any reverse repurchase transaction against obligations owed to it. Cash received in exchange for securities transferred under reverse repurchase agreements plus accrued interest payments to be made by the Portfolio to counterparties are reflected as liabilities on the Statement of Assets and Liabilities.
For the year ended December 31, 2013, the Portfolio had an outstanding reverse repurchase agreement balance of 79 days. The average amount of borrowings was $124,625,869 and the weighted average interest rate was (0.233%) during the 79 day period.
The following table is a summary of open reverse repurchase agreements by counterparty which are subject to offset under a MRA on a net basis as of December 31, 2013:
| | | | | | | | | | | | |
Counterparty | | Reverse Repurchase
Agreements | | | Collateral Pledged | | | Net Amount1 | |
BNP Paribas S.A | | $ | 16,639,175 | | | ($ | 16,626,813 | ) | | $ | 12,362 | |
Deutsche Bank AG | | | 54,793,750 | | | | (54,776,590 | ) | | | 17,160 | |
| | | | | | | | | | | | |
| | $ | 71,432,925 | | | ($ | 71,403,403 | ) | | $ | 29,522 | |
| | | | | | | | | | | | |
| | 1 | Net amount represents the net amount payable to the counterparty in the event of default. |
Secured Borrowing Transactions - The Portfolio may enter into transactions consisting of a transfer of a security by the Portfolio to a financial institution or counterparty, with a simultaneous agreement to reacquire the same, or substantially the same security, at an agreed-upon price and future settlement date. Such transactions are treated as secured borrowings, and not as purchases and sales. The Portfolio receives cash from the transfer of the security to use for other investment purposes. During the year ended December 31, 2013, the Portfolio entered into secured borrowing transactions involving U.S. Treasury. During the term of the borrowing, the Portfolio is not entitled to receive principal and interest payments, if any, made on the security transferred to the counterparty during the term of the agreement. The difference between the transfer price and the reacquisition price, known as the “price drop”, is included in net investment income with the cost of the secured borrowing transaction being recorded as interest expense over the term of the borrowing. The agreed upon proceeds for securities to be reacquired by the Portfolio are reflected as a liability on the Statement of Assets and Liabilities.
For the year ended December 31, 2013, the Portfolio’s average amount of borrowings was $306,989,765 and the weighted average interest rate was (0.0014%). At December 31, 2013, the Portfolio had no outstanding borrowings. For the year ended December 31, 2013, the Portfolio had an outstanding secured borrowing transaction balance for 205 days.
Mortgage Dollar Rolls - The Portfolio may enter into mortgage “dollar rolls” in which a Portfolio sells to-be-announced (“TBA”) mortgage-backed securities for delivery in the current month and simultaneously contracts to repurchase substantially similar (same type, coupon, and maturity) securities on a specified future date. For the duration of the transaction, or roll period, the Portfolio foregoes principal (including prepayments of principal) and interest paid on the securities sold. Dollar rolls are accounted for as purchase and sale transactions; gain or loss is recognized at the commencement of the term of the dollar roll and each time the mortgage-backed security is rolled.
MSF-30
Metropolitan Series Fund
BlackRock Bond Income Portfolio
Notes to Financial Statements—December 31, 2013—(Continued)
Treasury and mortgage dollar roll transactions involve the risk that the market value of the securities that the Portfolio is required to repurchase or reacquire may be less than the agreed-upon repurchase price of those securities and that the investment performance of securities purchased with proceeds from these transactions does not exceed the income, capital appreciation, and gain or loss that would have been realized on the securities transferred or sold, as applicable, as part of the treasury or mortgage dollar roll.
Mortgage Related and Other Asset-Backed Securities - The Portfolio may invest in mortgage-related or other asset-backed securities. These securities may include mortgage pass-through securities, collateralized mortgage obligations (“CMOs”), commercial mortgage-backed securities, CMO residuals, stripped mortgage backed securities (“SMBS”), and other securities that directly or indirectly represent a participation in, or are secured by or payable from, mortgage loans on real property or other receivables. The value of some mortgage- or asset-backed securities may be particularly sensitive to changes in prevailing interest rates. Early repayment of principal on some mortgage-related securities may expose the Portfolio to a lower rate of return upon reinvestment of principal. The value of these securities may fluctuate in response to the market’s perception of the creditworthiness of the issuers. Additionally, although mortgages and mortgage-related securities are generally supported by some form of government or private guarantee and/or insurance, there is no assurance that private guarantors or insurers will meet their obligations.
In one type of SMBS, one class receives all of the interest from the mortgage assets (the interest-only or “IO” class), while the other class will receive all of the principal (the principal-only or “PO” class). Because principal will not be received at the maturity of an IO, adjustments are made to the book value of the security until maturity. These adjustments are netted against payments received for the IOs and the net amount is included in interest income on the Statement of Operations of the Portfolio. Payments received for POs are treated as reductions to the cost and par value of the securities. Details of mortgage related and other asset-backed securities held by the Portfolio are included in the Portfolio’s Schedule of Investments.
The Portfolio may invest a significant portion of its assets in securities of issuers that hold mortgage and asset-backed securities and direct investments in securities backed by commercial and residential mortgage loans and other financial assets. The value and related income of these securities are sensitive to changes in economic conditions, including delinquencies and/or defaults, and may be negatively impacted by increased volatility of market prices and periods of illiquidity.
TBA Purchase & Forward Sale Commitments - The Portfolio may enter into TBA commitments to purchase or sell securities for a fixed price at a future date. TBA commitments are considered securities in themselves, and involve a risk of loss if the value of the security to be purchased or sold declines or increases prior to settlement date, which is in addition to the risk of decline in the value of the Portfolio’s other assets. TBA forward sales commitments are valued at the current market value of the underlying securities, according to the procedures described under “Investment Valuation and Fair Value Measurements”.
When-Issued and Delayed-Delivery Securities - The Portfolio may purchase securities on a when-issued or delayed-delivery basis. Settlement of such transactions normally occurs within a month or more after the purchase commitment is made. The Portfolio may purchase securities under such conditions only with the intention of actually acquiring them, but may enter into a separate agreement to sell the securities before the settlement date. Since the value of securities purchased may fluctuate prior to settlement, the Portfolio may be required to pay more at settlement than the security is worth. In addition, the purchaser is not entitled to any of the interest earned prior to settlement.
Upon making a commitment to purchase a security on a when-issued or delayed-delivery basis, the Portfolio will hold liquid assets in a segregated account with the Portfolio’s custodian, or set aside liquid assets in the Portfolio’s records, worth at least the equivalent of the amount due. The liquid assets will be monitored on a daily basis and adjusted as necessary to maintain the necessary value.
High Yield Debt Securities - The Portfolio may invest in high yield debt securities, or “junk bonds,” which are securities that are rated below “investment grade” or, if not rated, are of equivalent quality. A portfolio with high yield debt securities generally will be exposed to greater market risk and credit risk than a portfolio that invests only in investment grade debt securities because issuers of high yield debt securities are generally less secure financially, are more likely to default on their obligations, and their securities are more sensitive to interest rate changes and downturns in the economy. In addition, the secondary market for lower-rated debt securities may not be as liquid as that for more highly rated debt securities. As a result, the Portfolio’s Subadviser may find it more difficult to value lower-rated debt securities or sell them and may have to sell them at prices significantly lower than the values assigned to them by the Portfolio.
3. Investments in Derivative Instruments
Forward Foreign Currency Exchange Contracts - The Portfolio may enter into forward foreign currency exchange contracts to obtain investment exposure, enhance return or hedge or protect its portfolio holdings against the risk of future movements in certain foreign currency exchange rates. When entering into these contracts, the Portfolio agrees to receive or deliver a fixed quantity of foreign currency for an agreed-upon price on an agreed-upon future date. These contracts are valued daily and the Portfolio’s net equity therein, representing unrealized gain or loss on the contracts as measured by the difference between the forward foreign exchange rates at the dates of entry into the contracts and the forward foreign exchange rates at the valuation date, is included in the Statement
MSF-31
Metropolitan Series Fund
BlackRock Bond Income Portfolio
Notes to Financial Statements—December 31, 2013—(Continued)
of Assets and Liabilities. When a contract is closed, the Portfolio recognizes a realized gain or loss equal to the difference between the value of the contract at the time it was opened and the value at the time it was closed.
Realized and unrealized gains and losses on forward foreign currency exchange contracts are included in the Statement of Operations. These contracts involve market and/or credit risk in excess of the amount recognized in the Statement of Assets and Liabilities. The use of forward foreign currency exchange contracts does not eliminate fluctuations in the underlying prices of the securities of the Portfolio, but it does establish a rate of exchange that can be achieved in the future. Although forward foreign currency exchange contracts may limit the risk of loss due to a decline in the value of the currency holdings, they also limit any potential gain that might result should the value of the currency increase. In addition, the Portfolio could be exposed to losses if the counterparties to the contracts are unable to meet the terms of the contracts. The Portfolio’s maximum potential loss from such contracts is the aggregate face value in U.S. dollars at the time the contract was opened.
Futures Contracts - The Portfolio may buy and sell futures contracts as a hedge, to maintain investment exposure to a target asset class or to enhance return. The Portfolio may be subject to fluctuations in equity prices, interest rates, commodity prices, and foreign currency exchange rates in the normal course of pursuing its investment objective. Futures contracts are standardized agreements to buy or sell a security, or deliver a final cash settlement price in connection with an index, interest rate, currency, or other asset. The Portfolio must deposit an amount (“initial margin”) equal to a certain percentage of the face value of the futures contract. The initial margin may be in the form of cash or securities, which is returned when the Portfolio’s obligations under the contract have been satisfied. If cash is deposited as the initial margin, it is shown as cash collateral on the Statement of Assets and Liabilities. Futures contracts are marked-to-market daily, and subsequent payments (“variation margin”) are made or received by the Portfolio depending on whether unrealized gains or losses are incurred. These amounts are reflected as receivables or payables on the Statement of Assets and Liabilities and as a component of net change in unrealized appreciation/depreciation on the Statement of Operations. When the contract is closed or expires, the Portfolio records a realized gain or loss equal to the difference between the value of the contract at the time it was opened and the value at the time it was closed. Risks of entering into futures contracts (and related options) include the possibility that the market for these instruments may be illiquid and that a change in the value of the contract or option may not correlate perfectly with changes in the value of the underlying instrument. Futures contracts are exchange-traded and the exchange’s clearinghouse, as counterparty to all exchange-traded futures, guarantees the futures contracts against default. For over-the-counter futures the Portfolio’s ability to terminate the positions may be more limited than in the case of exchange-traded positions and may also involve the risk that securities dealers participating in such transactions would fail to meet their obligations to the Portfolio.
Options Contracts - An option contract purchased by the Portfolio gives the Portfolio the right, but not the obligation, to buy (call) or sell (put) an underlying instrument at a fixed exercise price during a specified period. Call options written by the Portfolio give the holder the right to buy the underlying instrument from the Portfolio at a fixed exercise price; put options written by the Portfolio give the holder the right to sell the underlying instrument to the Portfolio at a fixed exercise price.
The Portfolio may use options to hedge against changes in values of securities the Portfolio owns or expects to purchase, to maintain exposure to the broad equity markets or to enhance return. Writing puts or buying calls tends to increase the Portfolio’s exposure to the underlying instrument and writing calls or buying puts tends to decrease the Portfolio’s exposure to the underlying instrument, and can be used to hedge other Portfolio investments. For options used to hedge the Portfolio’s investments, the potential risk to the Portfolio is that the change in value of options contracts may not correspond perfectly to the change in value of the hedged instruments. The Portfolio also bears the risk of an unfavorable change in the value of the underlying instrument or the risk that the Portfolio may not be able to enter into a closing transaction due to an illiquid market. The Portfolio’s maximum risk of loss from counterparty credit risk, as opposed to investment and other types of risk, in respect of purchased options is typically the premium initially paid for the option plus any unrealized gains.
The main risk associated with purchasing an option is that the option expires without being exercised. In this case, the option is worthless when it expires and the premium paid for the option is considered a realized loss. The risk associated with writing a call option is that the Portfolio may forgo the opportunity for a profit if the market value of the underlying instrument increases and the option is exercised, requiring the Portfolio to sell the underlying instrument at a price below its market value. When the Portfolio writes a call option on a security it does not own, its exposure on such an option is theoretically unlimited. The risk in writing a put option is that the Portfolio may incur a loss if the market value of the underlying instrument decreases and the option is exercised, requiring the Portfolio to purchase the underlying instrument at a price above its market value. In addition, the Portfolio risks not being able to enter into a closing transaction for the written option as the result of an illiquid market for the option.
Purchases of put and call options are recorded as investments, the value of which are marked-to-market daily. When a purchased option expires without being exercised, the Portfolio will realize a loss equal to the premium paid. When the Portfolio enters into a closing sale transaction, the Portfolio will realize a gain or loss depending on whether the sales proceeds from the closing sale transaction are greater or less than the premium initially paid for the option. When the Portfolio exercises a put option, it will realize a gain or loss from the sale of the underlying instrument and the proceeds from such sale will be decreased by the premium originally paid for the put option. When the Portfolio exercises a call option, the cost of the security which the Portfolio purchases upon exercise will be increased by the premium originally paid for the call option.
MSF-32
Metropolitan Series Fund
BlackRock Bond Income Portfolio
Notes to Financial Statements—December 31, 2013—(Continued)
The premium received for a written option is recorded as an asset and an equivalent liability. The liability is subsequently marked to market to reflect the current value of the option written. When a written option expires without being exercised or the Portfolio enters into a closing purchase transaction, the Portfolio realizes a gain (or loss if the cost of the closing purchase transaction exceeds the premium received when the option was sold) without regard to any unrealized gain or loss on the underlying instrument and the liability related to such option is eliminated. When a written call option is exercised, the Portfolio realizes a gain or loss, as adjusted for the premium received, from the sale of the underlying instrument. When a written put option is exercised, the premium received is offset against the amount paid for the purchase of the underlying instrument.
The purpose of inflation-capped options is to protect the buyer from inflation, above a specified rate, eroding the value of investments in inflation-linked products with a given notional exposure. Inflation-capped options are used to give downside protection to investments in inflation-linked products by establishing a floor on the value of such products.
Written Options
The Portfolio transactions in written options during the year December 31, 2013:
| | | | | | | | | | | | |
Call Options | | Local Notional
Amount | | | Number of
Contracts | | | Premium
Received | |
Options outstanding December 31, 2012 | | | 247,810,000 | | | | — | | | $ | 4,286,245 | |
Options written | | | 627,126,000 | | | | 4,571 | | | | 20,816,007 | |
Options bought back | | | 0 | | | | (4,571 | ) | | | (1,942,786 | ) |
Options expired | | | (855,216,000 | ) | | | — | | | | (23,081,079 | ) |
| | | | | | | | | | | | |
Options outstanding December 31, 2013 | | | 19,720,000 | | | | — | | | $ | 78,387 | |
| | | | | | | | | | | | |
| | | |
Put Options | | Local Notional
Amount | | | Number of
Contracts | | | Premium
Received | |
Options outstanding December 31, 2012 | | | 33,500,000 | | | | — | | | $ | 622,653 | |
Options written | | | 10,890,190,000 | | | | 12,692 | | | | 12,784,635 | |
Options bought back | | | (33,500,000 | ) | | | (10,791 | ) | | | (4,108,231 | ) |
Options expired | | | (498,685,000 | ) | | | — | | | | (8,433,172 | ) |
| | | | | | | | | | | | |
Options outstanding December 31, 2013 | | | 10,391,505,000 | | | | 1,901 | | | $ | 865,885 | |
| | | | | | | | | | | | |
Swap Agreements - The Portfolio may enter into swap agreements in which the Portfolio and a counterparty agree to either make periodic net payments on a specified notional amount or net payment upon termination. Swap agreements are either privately negotiated in the over-the-counter market (“OTC swaps”) or executed in a multilateral or other trade facility platform, such as a registered commodities exchange (“centrally-cleared swaps”). The Portfolio may enter into swap agreements for the purposes of managing exposure to interest rate, credit or market risk, or for other purposes. In connection with these agreements, securities or cash may be paid or received, as applicable, by the Portfolio as collateral or margin in accordance with the terms of the respective swap agreements to provide assets of value and recourse in the event of default or bankruptcy/insolvency. Securities posted by the Portfolio as collateral for swap contracts are identified in the Schedule of Investments and restricted cash, if any, is reflected on the Statement of Assets and Liabilities.
Centrally-Cleared Swaps: Certain clearinghouses currently offer clearing for limited types of derivatives transactions, principally credit derivatives. In a cleared derivative transaction, a Portfolio typically enters into the transaction with a financial institution counterparty, and performance of the transaction is effectively guaranteed by a central clearinghouse, thereby reducing or eliminating the Portfolio’s exposure to the credit risk of the original counterparty. The Portfolio typically will be required to post specified levels of margin with the clearinghouse or at the instruction of the clearinghouse; the margin required by a clearinghouse may be greater than the margin the Portfolio would be required to post in an uncleared derivative transaction. Only a limited number of derivative transactions are currently eligible for clearing.
Swap agreements are marked-to-market daily. The fair value of an OTC swap is reflected on the Statement of Assets and Liabilities. The changes in value, if any, are reflected as a component of net change in unrealized appreciation/depreciation on the Statement of Operations. Daily changes in valuation of centrally cleared swaps, if any, are recorded as a receivable or payable for variation margin on the Statement of Assets and Liabilities and as a component of unrealized appreciation/depreciation on the Statement of Operations. Upfront payments paid or received upon entering into the swap agreement compensate for differences between the stated terms of the swap agreement and prevailing market conditions (such as credit spreads, currency exchange rates, interest rates, and other relevant factors). Upon termination or maturity of the swap, upfront premiums are recorded as realized gains or losses on the Statement of Operations. A liquidation payment received or made at the termination of the swap is recorded as realized gain or loss on the Statement of Operations. Net periodic payments received or paid by the Portfolio are included as part of realized gains or losses on the Statement of Operations.
MSF-33
Metropolitan Series Fund
BlackRock Bond Income Portfolio
Notes to Financial Statements—December 31, 2013—(Continued)
Swap transactions involve, to varying degrees, elements of interest rate, credit, and market risk in excess of the amounts recognized in the Statement of Assets and Liabilities. Such risks involve the possibility that there will be no liquid market for these agreements, that the counterparty to the agreements may default on its obligation to perform, or that there may be unfavorable changes in market conditions or interest rates. In addition, entering into swap agreements involves documentation risk resulting from the possibility that the parties to a swap agreement may disagree as to the meaning of contractual terms in the agreement. The Portfolio may enter into swap transactions with counterparties in accordance with guidelines established by the Board. These guidelines provide for a minimum credit rating for each counterparty and various credit enhancement techniques (for example, collateralization of amounts due from counterparties) to limit exposure to counterparties that have lower credit ratings. A Portfolio’s maximum risk of loss from counterparty credit risk is the discounted value of the net cash flows to be received from the counterparty over the contract’s remaining life, to the extent that amount is positive, or the fair value of the contract. The risk may be mitigated by having a master netting arrangement between the Portfolio and the counterparty and by the posting of collateral by the counterparty to cover the Portfolio’s exposure to the counterparty. Counterparty risk related to centrally-cleared swaps is mitigated due to the protection against defaults provided by the exchange on which these contracts trade.
Credit Default Swaps: The Portfolio is subject to credit risk in the normal course of pursuing its investment objectives. The Portfolio may enter into credit default swaps to manage its exposure to the market or certain sectors of the market, to reduce its risk exposure to defaults of corporate and/or sovereign issuers, or to create exposure to corporate and/or sovereign issuers to which they are not otherwise exposed. Credit default swaps involve one party making a stream of payments (referred to as the buyer of protection) to another party (the seller of protection) in exchange for the right to receive a specified return if a credit event occurs for the referenced entity, obligation or index. A credit event is defined under the terms of each swap agreement and may include, but is not limited to, underlying entity default, bankruptcy, write-down, principal shortfall or interest shortfall. As the seller of protection, if an underlying credit event occurs, the Portfolio will either pay the buyer an amount equal to the notional amount of the swap and take delivery of the referenced obligation (or underlying securities comprising the referenced index), or pay a net settlement amount in the form of cash or securities equal to the notional amount of the swap less the recovery value of the referenced obligation (or underlying securities comprising the referenced index). In return, the Portfolio would receive from the counterparty an upfront or periodic stream of payments throughout the life of the credit default swap agreement provided that no credit event has occurred. As the seller of protection, the Portfolio would effectively add leverage to its portfolio because, in addition to its total net assets, the Portfolio would be subject to investment exposure on the notional amount of the credit default swap.
The Portfolio may also purchase credit default swap contracts in order to hedge against the risk of default of debt securities held in its portfolio. This would involve the risk that the investment may be worthless when it expires and would only generate income in the event of an actual default by the issuer of the underlying obligation (as opposed to a credit downgrade or other indication of financial instability). It would also involve credit risk, whereby the seller may fail to satisfy its payment obligations to the Portfolio in the event of a default. As the buyer of protection, if an underlying credit event occurs, the Portfolio will either receive from the seller of protection an amount equal to the notional amount of the swap and deliver the referenced obligation (or underlying securities comprising the referenced index), or receive a net settlement amount in the form of cash or securities equal to the notional amount of the swap less the recovery value of the referenced obligation (or underlying securities comprising the referenced index). If no credit event occurs and the Portfolio is a buyer of protection, the Portfolio will typically recover nothing under the credit default swap agreement, but it will have had to pay the required upfront payment or stream of continuing payments under the credit default swap agreement. Recovery values are at times established through the credit event auction process in which market participants are ensured that a transparent price has been set for the defaulted obligation.
Credit default swap agreements on credit indices involve one party making a stream of payments to another party in exchange for the right to receive a specified return in the event of a write-down, principal shortfall, interest shortfall or default of all or part of the referenced entities comprising the credit index. A credit index is a basket of credit instruments or exposures designed to be representative of some part of the credit market as a whole. An index credit default swap references all the names in the index, and if there is a credit event involving an entity in the index, the credit event is settled based on that entity’s weight in the index. A Portfolio may use credit default swaps on credit indices as a hedge for credit default swaps or bonds held in the portfolio, which is less expensive than it would be to buy many individual credit default swaps to achieve similar effect. Credit default swaps on indices are benchmarks for protecting investors owning bonds against default, and may be used to speculate on changes in credit quality.
Implied credit spreads, represented in absolute terms, utilized in determining the market value of credit default swap agreements on a credit index or corporate or sovereign issuer, serve as some indication of the status of the payment/performance risk and the likelihood or risk of default for the credit derivative. The implied credit spread of a particular referenced entity or index also reflects the cost of buying/selling protection and may reflect upfront payments required to be made to enter into the agreement. Wider credit spreads generally represent a deterioration of the referenced entity’s credit soundness and a greater likelihood or risk of default or other credit event occurring as defined under the terms of the particular swap agreement. When no implied credit spread is available for a credit default swap, the current unrealized appreciation/depreciation on the position may be used as an indicator of the current status of the payment/performance risk.
MSF-34
Metropolitan Series Fund
BlackRock Bond Income Portfolio
Notes to Financial Statements—December 31, 2013—(Continued)
The maximum potential amount of future payments (undiscounted) that the Portfolio as a seller of protection could be required to make under a credit default swap agreement would be an amount equal to the notional amount of the agreement. Notional amounts of all credit default swap agreements outstanding as of December 31, 2013, for which the Portfolio is the seller of protection, are disclosed in the Schedule of Investments. These potential amounts would be partially offset by any recovery values of the respective referenced obligations, upfront payments received upon entering into the agreement or net amounts received from the settlement of buy protection credit default swap agreements entered into by the Portfolio for the same referenced entity or entities.
Interest Rate Swaps: The Portfolio may enter into interest rate swaps to manage its exposure to interest rates or to protect against currency fluctuations, to adjust the interest rate sensitivity (duration), to preserve a return or spread on a particular investment, or otherwise as a substitute for a direct investment in debt securities. The Portfolio is subject to interest rate risk exposure in the normal course of pursuing its investment objectives. Because the Portfolio holds fixed rate bonds, the value of these bonds may decrease if interest rates rise. To help hedge against this risk and to maintain its ability to generate income at prevailing market rates, the Portfolio may enter into interest rate swap agreements. Interest rate swaps are agreements in which one party pays a stream of interest payments, either fixed or floating rate, for another party’s stream of interest payments, either fixed or floating, on the same notional amount for a specified period of time. Other forms of interest rate swap agreements may include: (1) interest rate caps, under which, in return for a premium, one party agrees to make payments to the other to the extent that interest rates exceed a specified rate, or “cap”; (2) interest rate floors, under which, in return for a premium, one party agrees to make payments to the other to the extent that interest rates fall below a specified rate, or “floor”; and (3) interest rate collars, under which a party sells a cap and purchases a floor or vice versa in an attempt to protect itself against interest rate movements exceeding given minimum or maximum levels. The Portfolio’s maximum risk of loss from counterparty credit risk, as opposed to investment and other types of risk, in respect of interest rate swaps is typically the discounted net value of the cash flows to be received from the counterparty over the contract’s remaining life, to the extent that amount is positive.
At December 31, 2013, the Portfolio had the following derivatives, categorized by risk exposure:
| | | | | | | | | | | | |
| | | Asset Derivatives | | | Liability Derivatives | |
Risk Exposure | | Statement of Assets &
Liabilities Location | | Fair Value | | | Statement of Assets &
Liabilities Location | | Fair Value | |
Interest Rate | | Investments at market value (a)(d) | | $ | 2,316,382 | | | OTC swap contracts at market value (b) | | $ | 273,472 | |
| | OTC swap contracts at market value (b) | | | 1,638,582 | | | Unrealized depreciation on futures contracts* (c) | | | 3,638,729 | |
| | Unrealized appreciation on centrally cleared swap contracts (c)** | | | 484,275 | | | Written options at value (e) | | | 553,640 | |
| | Unrealized appreciation on futures contracts* (c) | | | 4,900,417 | | | Unrealized depreciation on centrally cleared swap contracts (c)** | | | 715,077 | |
| Credit | | OTC swap contracts at market value (b) | | | 1,835,276 | | | OTC swap contracts at market value (b) | | | 335,894 | |
| Foreign Exchange | | Investments at market value (a) | | | 1,745,013 | | | Unrealized depreciation on forward foreign currency exchange contracts | | | 1,595,081 | |
| | Unrealized appreciation on forward foreign currency exchange contracts | | | 659,693 | | | Written options at value | |
| 627,735
|
|
| | | | | | | | | | | | |
| Total | | | | $ | 13,579,638 | | | | | $ | 7,739,628 | |
| | | | | | | | | | | | |
| | * | Includes cumulative appreciation/depreciation of futures contracts as reported in the Schedule of Investments. Only the current day’s variation margin is reported within the Statement of Assets and Liabilities. |
| | ** | Represents the unrealized appreciation/depreciation of centrally cleared swap contracts as reported in the Schedule of Investments. Only the variation margin is reported within the Statement of Assets and Liabilities. |
| | (a) | Includes purchased options which are part of investments as shown in the Statement of Assets and Liabilities and net realized gain (loss) on investments and net change in unrealized appreciation (depreciation) on investments as shown in the Statement of Operations. |
| | (b) | Excludes interest receivable on swap contracts of $113,353 and interest payable on swap contracts of $71,475. |
| | (c) | Financial instrument not subject to a master netting agreement. |
| | (d) | Includes an exchange traded purchased option with a value of $1,283,175 that is not subject to a master netting agreement. |
| | (e) | Includes an exchange traded written option with a value of $308,912 that is not subject to a master netting agreement. |
The Portfolio is required to disclose the impact of offsetting assets and liabilities represented in the Statement of Assets and Liabilities to enable users of the financial statements to evaluate the effect or potential effect of netting arrangements on its financial position for recognized assets and liabilities.
MSF-35
Metropolitan Series Fund
BlackRock Bond Income Portfolio
Notes to Financial Statements—December 31, 2013—(Continued)
The following table presents the Portfolio’s derivative assets by counterparty net of amounts available for offset under a master netting agreement (“MNA”), or similar agreement, and net of the related collateral received by the Portfolio as of December 31, 2013.
| | | | | | | | | | | | | | | | |
Counterparty | | Derivative Assets
subject to a MNA
by Counterparty | | | Financial
Instruments
available for offset | | | Collateral
Received† | | | Net Amount* | |
Bank of America N.A. | | $ | 722,993 | | | $ | (129,297 | ) | | $ | (200,000 | ) | | $ | 393,696 | |
Barclays Bank plc | | | 2,410,164 | | | | (1,464,923 | ) | | | (649,270 | ) | | | 295,971 | |
BNP Paribas S.A. | | | 66,643 | | | | (27,767 | ) | | | — | | | | 38,876 | |
Citibank N.A. | | | 61,897 | | | | (61,897 | ) | | | — | | | | — | |
Credit Suisse International | | | 35,104 | | | | (11,495 | ) | | | — | | | | 23,609 | |
Deutsche Bank AG | | | 1,873,285 | | | | (823,287 | ) | | | — | | | | 1,049,998 | |
JPMorgan Chase Bank N.A. | | | 1,493,615 | | | | — | | | | (1,160,000 | ) | | | 333,615 | |
Morgan Stanley Capital Services | | | 187,751 | | | | (187,751 | ) | | | — | | | | — | |
Westpac Banking Corp. | | | 60,319 | | | | — | | | | — | | | | 60,319 | |
| | | | | | | | | | | | | | | | |
| | $ | 6,911,771 | | | $ | (2,706,417 | ) | | $ | (2,009,270 | ) | | $ | 2,196,084 | |
| | | | | | | | | | | | | | | | |
The following table presents the Portfolio’s derivative liabilities by counterparty net of amounts available for offset under a master netting agreement, or similar agreement, and net of the related collateral pledged by the Portfolio as of December 31, 2013.
| | | | | | | | | | | | | | | | |
Counterparty | | Derivative Liabilities
subject to a MNA
by Counterparty | | | Financial
Instruments
available for offset | | | Collateral
Pledged† | | | Net Amount** | |
Bank of America N.A. | | $ | 129,297 | | | $ | (129,297 | ) | | $ | — | | | $ | — | |
Barclays Bank plc | | | 1,464,923 | | | | (1,464,923 | ) | | | — | | | | — | |
BNP Paribas S.A. | | | 27,767 | | | | (27,767 | ) | | | — | | | | — | |
Citibank N.A. | | | 68,347 | | | | (61,897 | ) | | | — | | | | 6,450 | |
Credit Suisse International | | | 11,495 | | | | (11,495 | ) | | | — | | | | — | |
Deutsche Bank AG | | | 823,287 | | | | (823,287 | ) | | | — | | | | — | |
Morgan Stanley Capital Services | | | 422,718 | | | | (187,751 | ) | | | (234,967 | ) | | | — | |
Royal Bank of Canada | | | 60,361 | | | | — | | | | — | | | | 60,361 | |
UBS AG | | | 68,715 | | | | — | | | | — | | | | 68,715 | |
| | | | | | | | | | | | | | | | |
| | $ | 3,076,910 | | | $ | (2,706,417 | ) | | $ | (234,967 | ) | | $ | 135,526 | |
| | | | | | | | | | | | | | | | |
| | * | Net amount represents the net amount receivable from the counterparty in the event of default. |
| | ** | Net amount represents the net amount payable due to the counterparty in the event of default. |
| | † | In some instances, the actual collateral received and/or pledged may be more than the amount shown here due to overcollateralization. |
Transactions in derivative instruments during the year ended December 31, 2013 were as follows:
| | | | | | | | | | | | | | | | |
Statement of Operations Location—Net Realized Gain (Loss) | | Interest Rate | | | Credit | | | Foreign
Exchange | | | Total | |
Investments (a) | | $ | 3,363,262 | | | $ | — | | | $ | (18,118,795 | ) | | $ | (14,755,533 | ) |
Forward foreign currency transactions | | | — | | | | — | | | | 870,421 | | | | 870,421 | |
Futures contracts | | | 7,771,466 | | | | — | | | | — | | | | 7,771,466 | |
Swap contracts | | | 35,776,598 | | | | 9,581,357 | | | | — | | | | 45,357,955 | |
Written options | | | (1,927,954 | ) | | | — | | | | 31,514,252 | | | | 29,586,298 | |
| | | | | | | | | | | | | | | | |
| | $ | 44,983,372 | | | $ | 9,581,357 | | | $ | 14,265,878 | | | $ | 68,830,607 | |
| | | | | | | | | | | | | | | | |
| | | | |
Statement of Operations Location—Net Change in Unrealized Appreciation
(Depreciation) | | Interest Rate | | | Credit | | | Foreign
Exchange | | | Total | |
Investments (a) | | $ | 570,110 | | | $ | — | | | $ | (6,590,653 | ) | | $ | (6,020,543 | ) |
Forward foreign currency transactions | | | — | | | | — | | | | (1,423,026 | ) | | | (1,423,026 | ) |
Futures contracts | | | (2,826,675 | ) | | | — | | | | — | | | | (2,826,675 | ) |
Swap contracts | | | 1,863,685 | | | | (5,699,010 | ) | | | — | | | | (3,835,325 | ) |
Written options | | | (356,009 | ) | | | — | | | | 3,962,602 | | | | 3,606,593 | |
| | | | | | | | | | | | | | | | |
| | $ | (748,889 | ) | | $ | (5,699,010 | ) | | $ | (4,051,077 | ) | | $ | (10,498,976 | ) |
| | | | | | | | | | | | | | | | |
MSF-36
Metropolitan Series Fund
BlackRock Bond Income Portfolio
Notes to Financial Statements—December 31, 2013—(Continued)
For the year ended December 31, 2013, the average amount or number per contract outstanding for each derivative type was as follows:
| | | | |
Derivative Description | | Average
Notional Par or
Face Amount‡ | |
Investments (a) | | $ | 566,113,339 | |
Forward foreign currency transactions | | | 585,898,907 | |
Futures contracts long | | | 980,473,104 | |
Futures contracts short | | | (514,417,712 | ) |
Swap contracts | | | 906,588,736 | |
Written options | | | (336,178,348 | ) |
| | ‡ | Averages are based on activity levels during 2013. |
| | (a) | Includes purchased options which are part of investments as shown in the Statement of Assets and Liabilities and net realized gain (loss) on investments and net change in unrealized appreciation (depreciation) on investments as shown in the Statement of Operations. |
4. Certain Risks
Market Risk: In the normal course of business, the Portfolio invests in securities and enters into transactions where risks exist due to fluctuations in the market (market risk) or failure of the other party to a transaction to perform (credit and counterparty risk). The value of securities held by the Portfolio may decline in response to certain events, including those directly involving the companies whose securities are owned by the Portfolio; conditions affecting the general economy; overall market changes; local, regional or global political, social or economic instability; currency, interest rate, and price fluctuations.
Credit and Counterparty Risk: The Portfolio may be exposed to counterparty risk, or the risk that an entity with which the Portfolio has unsettled or open transactions may default. The potential loss could exceed the value of the financial assets and liabilities recorded in the financial statements. Financial assets that potentially expose the Portfolio to credit and counterparty risk consist principally of cash due from counterparties and investments. The Portfolio manages counterparty risk by entering into agreements only with counterparties that it believes have the financial resources to honor their obligations and by monitoring the financial stability of those counterparties. The Portfolio’s investment adviser attempts to mitigate counterparty risk by (i) periodically assessing the creditworthiness of its trading partners, (ii) monitoring and/or limiting the amount of its net exposure to each individual counterparty based on its assessment, and (iii) requiring collateral from the counterparty for certain transactions. In order to preserve certain safeguards for non-standard settlement trades, the Portfolio restricts its exposure to credit and counterparty losses by entering into master netting agreements with counterparties (approved brokers) with whom it undertakes a significant volume of transactions. Master Agreements govern the terms of certain transactions, and reduce the counterparty risk associated with relevant transactions by specifying credit protection mechanisms and providing standardization that improves legal certainty. Master Agreements can also help limit counterparty risk by specifying collateral posting arrangements at pre-arranged exposure levels. Collateral requirements may differ by type of derivative or investment, as applicable. Collateral or margin requirements are set by the broker or exchange clearing house for exchange traded derivatives (e.g., futures contracts and exchange traded options) while collateral terms are contract specific for over-the-counter traded derivatives (e.g., forward foreign currency exchange contracts, swap agreements and over-the-counter options).
For derivatives traded under an International Swaps and Derivatives Association, Inc. Master Agreement (“ISDA Master Agreement”) or similar master agreement, the collateral requirements are netted across all transactions traded under such agreement and one amount is posted from one party to the other to collateralize such obligations. The ISDA Master Agreement gives each party to the agreement the right to terminate all transactions traded under such agreement if there is a certain deterioration in the credit quality of the other party. The ISDA Master Agreement gives the Portfolio the right, upon an event of default by the applicable counterparty or a termination of the agreement, to close out all transactions traded under such agreement and to net amounts owed under each transaction to one net amount payable by one party to the other. This right to close out and net payments across all transactions traded under the ISDA Master Agreement could result in a reduction of the Portfolio’s credit risk to such counterparty equal to any amounts payable by the Portfolio under the applicable transactions, if any. However, absent an event of default by the counterparty or a termination of the agreement, the ISDA Master Agreement does not result in an offset of reported amounts of assets and liabilities in the Statement of Assets and Liabilities across transactions between the Portfolio and the applicable counterparty. The enforceability of the right to offset may vary by jurisdiction. Cash collateral that has been pledged to cover obligations of the Portfolio under derivative contracts, if any, will be reported separately in the Statement of Assets and Liabilities. Securities pledged as collateral, if any, for the same purpose are noted in the Schedule of Investments.
Repurchase and reverse repurchase agreements are primarily executed under Global Master Repurchase Agreements (“GMRAs”) or Master Repurchase Agreements (“MRAs”), which provide the rights to set-off. Each repurchase and reverse repurchase agreement is initially collateralized at the transaction level. In the event of default, the total market value exposure will be offset against collateral exchanged to date, which would result in a net receivable/(payable) that would be due from/to the counterparty.
MSF-37
Metropolitan Series Fund
BlackRock Bond Income Portfolio
Notes to Financial Statements—December 31, 2013—(Continued)
Master Securities Forward Transaction Agreements (“Master Forward Agreements”) govern the considerations and factors surrounding the settlement of certain forward settling transactions, such as To-Be-Announced securities, delayed-delivery or secured borrowings transactions by and between the Portfolio and select counterparties. The Master Forward Agreements maintain provisions for, among other things, initiation and confirmation, payment and transfer, events of default, termination, and maintenance of collateral.
Customer Account Agreements and related addendums govern cleared derivatives transactions such as futures, options on futures, and cleared OTC derivatives. Cleared derivative transactions require posting of initial margin as determined by each relevant clearing agency which is segregated at a broker account registered with the Commodities Futures Trading Commission (CFTC), or the applicable regulator. In the U.S., counterparty risk is significantly reduced as creditors of the futures broker do not have claim to Portfolio assets in the segregated account. Additionally, portability of exposure in the event of default further reduces risk to the Portfolio. Variation margin, or changes in market value, are exchanged daily, but may not be netted between futures and cleared OTC derivatives.
Foreign Investment Risk: The investments by the Portfolio in foreign securities may involve risks not present in domestic investments. Because securities may be denominated in foreign currencies, may require settlement in foreign currencies and may pay interest or dividends in foreign currencies, changes in the relationship of these foreign currencies to the U.S. dollar can significantly affect the value of the investments and earnings of the Portfolio. Foreign investments may also subject the Portfolio to foreign government exchange restrictions, expropriation, taxation or other political, social or economic developments, all of which could affect the market and/or credit risk of the investments. In addition to the risks described above, risks may arise from forward foreign currency contracts with respect to the potential inability of counterparties to meet the terms of their contracts.
Additional risks associated with each type of investment are described above within the respective security type notes. The Portfolio’s prospectus includes a discussion of the principal risks of investing in the Portfolio.
5. Investment Transactions
Aggregate cost of purchases and proceeds of sales of investment securities, including mortgage dollar roll and TBA transactions but excluding short-term securities, for the year ended December 31, 2013 were as follows:
| | | | | | | | | | | | | | |
| Purchases | | | Sales | |
| U.S. Government | | | Non U.S. Government | | | U.S. Government | | | Non U.S. Government | |
| $ | 31,796,471,458 | | | $ | 2,223,357,094 | | | $ | 32,427,502,983 | | | $ | 2,076,724,373 | |
Purchases and sales of mortgage dollar rolls and TBA transactions for the year ended December 31, 2013 were as follows:
| | | | | | |
| Purchases | | | Sales | |
| $ | 23,253,080,130 | | | $ | 23,535,040,479 | |
6. Investment Management Fees and Other Transactions with Affiliates
Investment Management Agreement - MetLife Advisers is the investment adviser to the Portfolio. The Trust has entered into an investment management agreement with MetLife Advisers with respect to the Portfolio. For providing investment management services to the Portfolio, MetLife Advisers receives monthly compensation at the annual rates:
| | | | | | |
Management
Fees earned by
MetLife Advisers
for the year ended
December 31, 2013 | | % per annum | | | Average Daily Net Assets |
| $12,607,700 | | | 0.400 | % | | Of the first $1 billion |
| | | 0.350 | % | | Of the next $1 billion |
| | | 0.300 | % | | Of the next $1 billion |
| | | 0.250 | % | | On amounts in excess of $3 billion |
Certain officers and trustees of the Trust may also be officers of MetLife Advisers; however, such officers and trustees receive no compensation from the Trust.
MetLife Advisers has entered into an investment subadvisory agreement with respect to the Portfolio. BlackRock Advisors, LLC is compensated by MetLife Advisers to provide subadvisory services for the Portfolio.
MSF-38
Metropolitan Series Fund
BlackRock Bond Income Portfolio
Notes to Financial Statements—December 31, 2013—(Continued)
Management Fee Waivers - Pursuant to an expense agreement, MetLife Advisers has agreed, for the period April 29, 2013 through April 27, 2014, to reduce its advisory fees set out above under “Investment Management Agreement” for each class of the Portfolio as follows:
| | |
| % per annum | | Average Daily Net Assets |
| 0.030% | | Of the first $1 billion |
| 0.025% | | Of the next $1 billion |
Any reductions in total advisory fees paid by the Portfolio due to these waivers may be reduced or eliminated by changes in the advisory fee structure at higher asset levels. MetLife Advisers will receive advisory fees equal to 0.325% of the Portfolio’s average daily net assets for amounts over $2 billion but less than $3 billion (0.025% over the contractual advisory fee rate) and 0.325% for amounts over $3 billion but less than $3.4 billion (0.075% over the contractual advisory fee rate). As a result, the dollar amount of the waiver will be reduced as assets grow beyond $2 billion up to $3.4 billion, but the advisory fee net of waivers will never exceed the contractual dollar amount that would otherwise be payable under the advisory fee.
An identical expense agreement was in place for the period April 30, 2012 through April 28, 2013.
Transfer Agency Agreement - MetLife serves as the transfer agent for the Trust. MetLife receives no fees for its services to the Trust under the transfer agency agreement.
Distribution and Service Fees - The Trust has a distribution agreement with MetLife Investors Distribution Company (“MIDC” or the “Distributor”) in which MIDC serves as the distributor for the Portfolio’s Class A, B and E Shares. MIDC is a wholly-owned subsidiary of MetLife Investors Group, Inc., an affiliate of the Adviser. The Trust has also adopted a Distribution and Service Plan under Rule 12b-1 of the 1940 Act for the Portfolio’s Class B and E Shares. Under the Distribution and Service Plan, the Class B and E Shares of the Portfolio pay a fee to compensate the Insurance Companies (or their affiliates) and other broker-dealers and financial intermediaries involved in the offer and sale of Portfolio shares for promoting or selling and servicing the Class B and E Shares. The fees under the Distribution and Service Plan for each class of the Portfolio’s shares are calculated as a percentage of the Portfolio’s average daily net assets that are attributable to that Class. Currently, the fee is 0.25% per year for Class B Shares and 0.15% per year for Class E Shares. Amounts incurred by the Portfolio for the year ended December 31, 2013 are shown as Distribution and service fees in the Statement of Operations.
Deferred Trustee Compensation - Each Trustee who is not currently an employee of the Adviser or any of its affiliates receives compensation from the Trust for his or her service to the Trust. A deferred compensation plan (the “Plan”) is available to the Trustees on a voluntary basis. Deferred amounts remain in the Trust until distributed in accordance with the provisions of the Plan. The value of a participating Trustee’s deferral account is based on theoretical investments of deferred amounts, on the normal payment dates in certain portfolios of the Trust or Met Investors Series Trust, an affiliate of the Trust, as designated by the participating Trustee. Changes in the value of participants’ deferral accounts are reflected as Trustees’ fees and expenses in the Statement of Operations. The portion of the accrued obligations allocated to the Portfolio under the Plan is reflected as Deferred trustees’ fees in the Statement of Assets and Liabilities.
7. Contractual Obligations
Under the Trust’s organizational documents, its officers and Trustees may be indemnified against certain liabilities and expenses arising out of the performance of their duties to the Trust. Additionally, the Trust has a variety of indemnification obligations under contracts with its service providers. The Trust’s maximum exposure under these arrangements is unknown, as this would involve future claims that may be made against the Trust that have not yet occurred.
8. Income Tax Information
The tax character of distributions paid for the periods ended December 31, 2013 and 2012 was as follows:
| | | | | | | | | | | | | | | | | | | | | | |
| Ordinary Income | | | Long-Term Capital Gain | | | Total | |
| 2013 | | | 2012 | | | 2013 | | | 2012 | | | 2013 | | | 2012 | |
| $ | 201,565,998 | | | $ | 131,551,453 | | | $ | 30,718,094 | | | $ | — | | | $ | 232,284,092 | | | $ | 131,551,453 | |
As of December 31, 2013, the components of distributable earnings (accumulated losses) on a federal income tax basis were as follows:
| | | | | | | | | | | | | | | | | | | | | | |
Undistributed
Ordinary
Income | | | Undistributed
Long-Term
Capital Gain | | | Net
Unrealized
Depreciation | | | Loss Carryforwards | | | Other Accumulated
Capital Losses | | | Total | |
| $ | 135,054,402 | | | $ | — | | | $ | (36,119,405 | ) | | $ | — | | | $ | (31,066,700 | ) | | $ | 67,868,297 | |
MSF-39
Metropolitan Series Fund
BlackRock Bond Income Portfolio
Notes to Financial Statements—December 31, 2013—(Continued)
The Portfolio utilizes the provisions of the federal income tax laws that provide for the carryforward of capital losses for prior years, offsetting such losses against any future realized capital gains. Under the Regulated Investment Company Modernization Act of 2010 (the “Act”), net capital losses recognized after December 22, 2010 may be carried forward indefinitely and their character is retained as short-term and/or long-term losses. Previously, net capital losses were carried forward for up to eight years and treated as shortterm losses. As a transition rule, the Act requires that post-enactment net capital losses be used before pre-enactment net capital losses.
As of December 31, 2013, the Portfolio had post-enactment short-term accumulated capital losses of $31,066,700 and no pre-enactment accumulated capital loss carryforwards.
MSF-40
Metropolitan Series Fund
BlackRock Bond Income Portfolio
Report of Independent Registered Public Accounting Firm
To the Shareholders of BlackRock Bond Income Portfolio and the Board of Trustees of Metropolitan Series Fund:
We have audited the accompanying statement of assets and liabilities, including the schedule of investments, of BlackRock Bond Income Portfolio, one of the portfolios constituting Metropolitan Series Fund (the “Trust”) as of December 31, 2013, and the related statement of operations for the year then ended, the statements of changes in net assets for each of the two years in the period then ended, and the financial highlights for each of the five years in the period then ended. These financial statements and financial highlights are the responsibility of the Trust’s management. Our responsibility is to express an opinion on these financial statements and financial highlights based on our audits.
We conducted our audits in accordance with the standards of the Public Company Accounting Oversight Board (United States). Those standards require that we plan and perform the audit to obtain reasonable assurance about whether the financial statements and financial highlights are free of material misstatement. The Trust is not required to have, nor were we engaged to perform, an audit of its internal control over financial reporting. Our audits included consideration of internal control over financial reporting as a basis for designing audit procedures that are appropriate in the circumstances, but not for the purpose of expressing an opinion on the effectiveness of the Trust’s internal control over financial reporting. Accordingly, we express no such opinion. An audit also includes examining, on a test basis, evidence supporting the amounts and disclosures in the financial statements, assessing the accounting principles used and significant estimates made by management, as well as evaluating the overall financial statement presentation. Our procedures included confirmation of securities owned as of December 31, 2013, by correspondence with the custodian and brokers; where replies were not received from brokers, we performed other auditing procedures. We believe that our audits provide a reasonable basis for our opinion.
In our opinion, the financial statements and financial highlights referred to above present fairly, in all material respects, the financial position of BlackRock Bond Income Portfolio of Metropolitan Series Fund, as of December 31, 2013, the results of its operations for the year then ended, the changes in its net assets for each of the two years in the period then ended, and the financial highlights for each of the five years in the period then ended, in conformity with accounting principles generally accepted in the United States of America.
Deloitte & Touche LLP
Boston, Massachusetts
February 27, 2014
MSF-41
Metropolitan Series Fund
Trustees and Officers of Metropolitan Series Fund
The Trustees and executive officers of the Trust, their ages and their principal occupations during the past five years are set forth below. Unless otherwise indicated, the business address of each is One Financial Center, Boston, MA 02111. Each Trustee who is deemed an “interested person,” as such term is defined in the 1940 Act, is indicated by an asterisk. Those Trustees who are not “interested persons” as defined in the 1940 Act are referred to as “Independent Trustees.” Additional information about the Trustees is available in the Statement of Additional Information, which is available without charge, upon request, by calling (800) 848-3854.
Trustees of the Trust
| | | | | | | | | | |
Name and Age | | Position(s)
Held with
Registrant | | Term of Office and
Length of Time
Served | | Principal Occupation(s) During the
Past 5 Years(1) | | Number of
Portfolios
in Fund
Complex(2)
overseen | | Other Directorships Held
by Trustee During the
Past 5 Years(1) |
| Interested Trustee | | | | | | | | | | |
| Elizabeth M. Forget* (47) | | Trustee, Chairman of the Board, President and Chief Executive Officer | | Indefinite; From May 2006 (President and Chief Executive Officer)/ August 2006 (Trustee and Chairman of the Board) to present | | Senior Vice President, MetLife Inc.; President, MetLife Advisers, LLC and a predecessor company. | | 79 | | Trustee, Met Investors Series Trust (the “MIST Trust”);** various MetLife-affiliated boards. |
| | | | | |
| Independent Trustees | | | | | | | | | | |
| Stephen M. Alderman (54) | | Trustee | | Indefinite; From April 2012 to present | | Shareholder in the law firm of Garfield & Merel, Ltd. | | 79 | | Trustee, MIST Trust;** Director, International Truck Leasing Corp. |
| | | | | |
| Robert J. Boulware (57) | | Trustee | | Indefinite; From April 2012 to present | | Managing Director, Pilgrim Funds, LLC (private equity fund). | | 79 | | Trustee, MIST Trust;** Trustee, Vertical Capital Income Fund (closed-end fund); Director, Gainsco, Inc. (auto insurance). |
| | | | | |
| Susan C. Gause (61) | | Trustee | | Indefinite; From April 2012 to present | | Private Investor. | | 79 | | Trustee, MIST Trust;** Trustee, HSBC Funds. |
| | | | | |
| Nancy Hawthorne (62) | | Trustee | | Indefinite; From May 2003 to present | | Chief Executive Officer, Clerestory LLC (corporate advisor). | | 79 | | MIST Trust;** Director, THL Credit, Inc.**; Director, Avid Technology, Inc.** |
| | | | | |
| Barbara A. Nugent (57) | | Trustee | | Indefinite; From January 2014 to present | | President, True North Board Governance, LLC (consulting); until 2014, partner in the law firm of Stradley Ronon Stevens & Young, LLP. | | 79 | | Trustee, MIST Trust**; Director, Episcopal Healthcare Foundation; until 2014, member, Mutual Fund Directors Forum Advisory Board. |
| | | | | |
| Keith M. Schappert (62) | | Trustee | | Indefinite; From August 2009 to present | | Principal, Schappert Consulting LLC (asset management consulting). | | 79 | | Trustee, MIST Trust;** Director, The Commonfund for Nonprofit Organizations; until 2011, Director, Trilogy Global Advisors; Director, Mirae Asset Discovery Funds,** Director, Calamos Investments. |
| | | | | |
| Linda B. Strumpf (66) | | Trustee | | Indefinite; From May 2000 to present | | Chair of the Investment Committee, Leona M. and Harry B. Helmsley Charitable Trust; until 2011, Chief Investment Officer, Leona M. and Harry B. Helmsley Charitable Trust. | | 79 | | Since 2012, Trustee, MIST Trust,** Trustee and Member of Investment Committee, The Pennsylvania State University. |
| | | | | |
| Dawn M. Vroegop (47) | | Trustee | | Indefinite; From May 2009 to present | | Private Investor. | | 79 | | Trustee, MIST Trust,** Trustee, Driehaus Mutual Funds; Director and Investment Committee Chair, City College of San Francisco Foundation. |
MSF-42
Metropolitan Series Fund
Trustees and Officers of Metropolitan Series Fund—(Continued)
Executive Officers of the Trust
| | | | | | |
Name and Age | | Position(s) Held with
Registrant | | Term of Office
and Length of
Time Served | | Principal Occupation(s) During Past 5 Years(1) |
| Elizabeth M. Forget (47) | | President, Chief Executive Officer, Trustee and Chairman of the Board | | From May
2006 (President
and Chief
Executive
Officer)/
August 2006
(Trustee and
Chairman of
the Board) to
present | | See principal occupation information in the table above. |
| | | |
| Jeffrey L. Bernier (42) | | Vice President | | From February
2008 to present | | Vice President, MetLife, Inc.; Senior Vice President, MetLife Advisers, LLC and a predecessor company. |
| | | |
| Peter H. Duffy (58) | | Chief Financial Officer and Treasurer | | From November
2000 to present | | Senior Vice President, MetLife Advisers, LLC; Vice President, MetLife, Inc. |
| | | |
| Andrew L. Gangolf (59) | | Secretary | | From May
2011to present | | Senior Vice President, MetLife Advisers, LLC; Senior Vice President & Assistant General Counsel, AllianceBerstein Investments, Inc. |
| | | |
| Jeffrey P. Halperin (46) | | Chief Compliance Officer | | From November
2005 to present | | Vice President, MetLife, Inc.; Chief Compliance Officer, MIST; Chief Compliance Officer, MSF Trust; Chief Compliance Officer, MetLife Advisers, LLC and a predecessor company; Chief Compliance Officer, MetLife Investment Management, LLC (formerly MetLife Investment Advisors Company, LLC). |
| | | |
| Alan C. Leland, Jr. (61) | | Vice President | | From February
2005 to present | | Treasurer and Chief Financial Officer, MetLife Advisers, LLC; Vice President, MetLife Group Inc.; Vice President, MetLife, Inc. |
| * | Ms. Forget is an “interested person” of the Trust because of her positions with MetLife Advisers, LLC and her ownership of securities issued by MetLife, Inc., the ultimate parent company of MetLife Advisers, LLC. |
| ** | Indicates a directorship with a registered investment company or a company subject to the reporting requirements of the Securities Exchange Act of 1934, as amended. |
| (1) | Previous positions during the past five years with the Trust, MetLife, Inc. or the Adviser are omitted if not materially different. |
| (2) | The Fund Complex includes 49 Portfolios of the MIST Trust and 30 Portfolios of the Trust. |
MSF-43
Metropolitan Series Fund
BlackRock Bond Income Portfolio
Board of Trustees’ Consideration of Advisory and Sub-Advisory Agreements
At an in-person meeting of the Boards of Trustees (the “Board”) of Met Investors Series Trust and Metropolitan Series Fund (“MIST” and “MSF,” respectively, and collectively, the “Trusts”) held on November 19-20, 2013, the Board, including a majority of the Trustees who are not considered to be “interested persons” of the Trusts (the “Independent Trustees”) under the Investment Company Act of 1940, as amended (the “1940 Act”), approved for an annual period the continuation of each Trust’s advisory agreement (the “Advisory Agreement”) with MetLife Advisers, LLC (the “Adviser”) and the applicable sub-advisory agreements (each a “Sub-Advisory Agreement,” and collectively with the Advisory Agreement, the “Agreements”) between the Adviser and the investment sub-advisers (each a “Sub-Adviser,” and collectively, the “Sub-Advisers”) for each of the series of the Trusts, including the BlackRock Bond Income Portfolio (each a “Portfolio,” and collectively, the “Portfolios”).1
In considering the Agreements, the Board reviewed a variety of materials provided by the Adviser and the Sub-Advisers relating to the Portfolios, including comparative performance, fee and expense information for an appropriate peer group of similar mutual funds, performance information for relevant benchmark indices and other information regarding the nature, extent and quality of services provided by the Adviser and the Sub-Advisers under their respective Agreements. The Board also took into account its experience with the Adviser and the Sub-Advisers and information provided to the Board in its meetings throughout the year with respect to the services provided by the Adviser and the Sub-Advisers, including quarterly performance reports prepared by management containing reviews of investment results, and periodic presentations from certain of the Sub-Advisers with respect to the Portfolios they manage. The Independent Trustees also assessed reports provided by the Board’s independent consultant, who reviewed and provided analyses regarding investment performance, fees and expenses, and other information provided by, or at the direction of, the Adviser and the Sub-Advisers, as more fully discussed below.
The Independent Trustees were separately advised by independent legal counsel throughout the process, and met with independent legal counsel in periodic executive sessions. Prior to voting to continue the Agreements at the November meeting, the Independent Trustees also received a memorandum from their independent counsel discussing the legal standards for their consideration of the proposed continuation of the Agreements. The Board also met in person with personnel of the Adviser on September 17, 2013 for the specific purpose of giving preliminary consideration to the proposed continuation of the Agreements and to request additional information they considered reasonably necessary to their deliberations. The Independent Trustees also discussed the proposed continuation of the Agreements in private sessions with their independent legal counsel at which no representatives of management were present.
In considering whether to approve the renewal of the Advisory Agreement with the Adviser and any applicable Sub-Advisory Agreements with respect to a Portfolio, the Board reviewed and analyzed the factors it deemed relevant, including: (1) the nature, extent and quality of the services to be provided to the Portfolios by the Adviser and the Sub-Advisers; (2) the performance of the Portfolios as compared to a peer group and an appropriate index; (3) the Adviser’s and each of the Sub-Adviser’s personnel and operations; (4) the financial condition of the Adviser and of the Sub-Advisers; (5) the level and method of computing each Portfolio’s advisory and sub-advisory fees; (6) the profitability of the Adviser under the Advisory Agreement and of certain of the Sub-Advisers under the Sub-Advisory Agreements; (7) any “fall-out” benefits to the Adviser, the Sub-Advisers and their affiliates (i.e., ancillary benefits realized by the Adviser, the Sub-Advisers or their affiliates from the Adviser’s or Sub-Advisers’ relationship with the Trusts); (8) the anticipated effect of growth in size on Portfolio expenses; (9) fees paid to certain of the Sub-Advisers by comparable institutional and retail accounts; and (10) possible conflicts of interest.
Nature, extent and quality of services. The Board evaluated the nature, extent and quality of the services that the Adviser, and the Sub-Advisers as relevant, have provided to the Portfolios. The Board considered the Adviser’s services as investment manager to the Portfolios, including services relating to the selection and oversight of the Sub-Advisers for the applicable Portfolios. The Board considered, among other things, the Adviser’s oversight of the provision of services to the Portfolios by the Sub-Advisers, including with respect to investment activities and trading practices, and the Sub-Adviser’s compliance with fund policies, objectives and Board directives, compliance policies and procedures and applicable law. The Adviser’s services in coordinating and overseeing the activities of the Trusts’ other service providers were also considered. The Board also evaluated the expertise and performance of the personnel of the Adviser who performed services for the Portfolios throughout the year.
The Board considered information received from the Trust’s Chief Compliance Officer (“CCO”) regarding the Portfolios’ compliance policies and procedures established pursuant to Rule 38a-l under the 1940 Act. The Board also evaluated the CCO’s ongoing reports concerning the CCO’s oversight of the risk assessment processes of the Sub-Advisers.
1 The Pyramis Managed Risk Portfolio recently commenced operations and, therefore, the Agreement with respect to this Portfolio was not up for renewal.
MSF-44
Metropolitan Series Fund
BlackRock Bond Income Portfolio
Board of Trustees’ Consideration of Advisory and Sub-Advisory Agreements—(Continued)
With respect to the services provided by each of the Sub-Advisers, the Board considered, among other things, information provided to the Board by each Sub-Adviser. The Board considered the Sub-Adviser’s current level of staffing and its overall resources, as well as its compensation program. The Board reviewed each Sub-Adviser’s history and investment experience, as well as information regarding the qualifications, background and responsibilities of the Sub-Adviser’s investment and compliance personnel who provide services to the Portfolios. The Board also considered, among other things, the Sub-Adviser’s compliance program and any disciplinary history. The Board also took into account the Sub-Adviser’s risk assessment and monitoring process. The Board noted each Sub-Adviser’s regulatory history, including whether it was currently involved in any regulatory actions or investigations as well as material litigation, and any settlements and amelioratory actions undertaken, as appropriate. The Board also noted that the CCO and his staff conduct regular, periodic compliance reviews with each of the Sub-Advisers and present reports to the Independent Trustees regarding the same, which includes evaluating the regulatory compliance systems of the Sub-Advisers and procedures reasonably designed by them to help assure compliance with the federal securities laws, including issues related to late trading and market timing, best execution, fair value pricing, and proxy voting procedures, among others. The Board also took into account the financial condition of each Sub-Adviser. In its review, the Board also received and took into account information regarding any services and/or payments provided to the Adviser by the Sub-Advisers in connection with marketing activities.
The Board considered each Sub-Adviser’s investment process and philosophy. The Board took into account that each Sub-Adviser’s responsibilities include the development and maintenance of an investment program for the applicable Portfolio which is consistent with the Portfolio’s investment objectives, the selection of investment securities and the placement of orders for the purchase and sale of such securities, as well as the implementation of compliance controls related to performance of these services. The Board also reviewed each Sub-Adviser’s brokerage policies and practices.
Performance. The Board considered the performance of the Portfolios as described in the quarterly reports prepared by management, and as also analyzed in reports prepared by the Independent Trustees’ independent consultant. The Board noted that the Adviser reviews with the Board on a quarterly basis detailed information about the Portfolios’ performance results, portfolio composition and investment strategies. The Board also reviewed and considered a separate report prepared by Lipper Inc. (“Lipper”), an independent third party, which provided a statistical analysis comparing the Portfolios’ investment performance, expenses, and fees to comparable funds underlying variable insurance products (the “Performance Universe”). In addition, the Independent Trustees met separately with a representative of Bobroff Consulting, Inc., an independent consultant (“Bobroff), at a special board meeting in September 2013, to review the separate reports prepared by such consultant (“Bobroff Report”), which analyzed the report prepared by Lipper. The Board also considered each Portfolio’s more recent performance subsequent to the performance period covered by the Lipper reports, and management’s discussion of the same, including the effect of current market conditions on each Portfolio’s more recent performance.
The Board reviewed the Portfolios’ performance records and the Adviser’s and Sub-Advisers’ management styles and long-term performance records with the Portfolios and comparable funds. The Board focused particular attention on Portfolios with less favorable performance records. The Board was mindful of the Adviser’s focus on each Sub-Adviser’s performance and noted that the Adviser has been active in monitoring and responding to any performance issues with respect to the Portfolios. The Board also took into account its discussions with management regarding factors that contributed to the performance of the Portfolios.
Among other data relating specifically to the BlackRock Bond Income Portfolio’s performance, the Board considered that the Portfolio outperformed the median of its Performance Universe and its Lipper Index for the one- and three-year periods ended June 30, 2013 and underperformed the median of its Performance Universe and its Lipper Index for the five-year period ended June 30, 2013. The Board further considered that the Portfolio outperformed its benchmark, the Barclays Capital Aggregate Bond Index, for the one-, three- and five-year periods ended October 31, 2013.
Fees and Expenses. The Board gave consideration to the advisory fees payable under the Advisory Agreement and the sub-advisory fees payable under each of the Sub-Advisory Agreements. In this regard, the Board reviewed the advisory fees payable on a Portfolio-by-Portfolio basis based on information provided by the Adviser. The Independent Trustees, with the assistance of Bobroff, also examined the fees paid by a Portfolio in light of fees paid to other investment managers by comparable funds, as well as considered the fees charged by the Adviser to manage other comparable funds, as applicable. The Lipper report included comparisons of the Adviser’s fee schedule with that of its peers based on an asset-based analysis of relative fee structures according to the size of the Portfolio. In addition, the Board considered the Portfolios’ advisory and sub-advisory fees and total expenses as compared to similarly situated investment companies underlying variable insurance products deemed to be comparable to the Portfolios as determined by Lipper. The Board considered a Portfolio’s ranking within a smaller group of peer funds chosen by Lipper (the “Expense Group”), as well as the Portfolio’s ranking within broader groups of funds (the “Expense Universe” and the “Sub-advised Expense Universe”). The Board
MSF-45
Metropolitan Series Fund
BlackRock Bond Income Portfolio
Board of Trustees’ Consideration of Advisory and Sub-Advisory Agreements—(Continued)
also considered a Portfolio’s contractual sub-advisory fees, as applicable, as compared to the Sub-advised Expense Universe as well as a smaller group of funds (the “Sub-advised Expense Group”). In comparing a Portfolio’s actual and contractual management fee to that of comparable funds, the Board noted that such fee includes both advisory and administrative fees.
The Board noted that the sub-advisory fees for the Portfolios are paid by the Adviser, not the Portfolios, out of the advisory fee. It was further noted that the Adviser negotiates such fees at arm’s length. The Board also considered that the Adviser had entered into expense limitation agreements with certain of the Portfolios, pursuant to which the Adviser has agreed to waive a portion of its advisory fee and/or reimburse certain expenses as a means of limiting a Portfolio’s total annual operating expenses. The Board further considered the amount of sub-advisory fees paid out by the Adviser and the amount of the management fees that it retained in light of the services performed by Sub-Advisers and Adviser, respectively.
With respect to the BlackRock Bond Income Portfolio, the Board considered that the Portfolio’s actual management fee and total expenses (exclusive of 12b-l fees) were below the Expense Group median, the Expense Universe median and Sub-advised Expense Universe median. The Board noted that the Portfolio’s contractual management fees were below the asset-weighted average of the Expense Group at the Portfolio’s current size. The Board also noted that the Portfolio’s contractual sub-advisory fees were below the average of the Sub-advised Expense Group and Sub-advised Expense Universe at the Portfolio’s current size.
Profitability. The Board examined the profitability of the Adviser on a Portfolio-by-Portfolio basis. The Board also considered that the Distributor, MetLife Investors Distribution Company, receives Rule 12b-1 payments to support the distribution of the products. The Board considered the profitability to the Sub-Advisers and their affiliates as a result of their relationships with the Portfolios, and the Board considered the ability of the Adviser to negotiate the Sub-Advisory Agreements and the fees thereunder at arm’s length. The Board also reviewed Portfolio specific data with regard to the profitability of the Portfolios to each Sub-Adviser, as available.
Economies of scale. The Board also considered the effect of the Portfolios’ growth in size on their fees. The Board noted that the fee schedules for most of the Portfolios contain breakpoints that reduce the fee rate above specified asset levels. The Board noted those Portfolios that did not contain breakpoints in the advisory fee and took into account management’s discussion of the same. The Board noted that those Portfolios with advisory fee schedules containing breakpoints generally reflect the inclusion of breakpoints in the sub-advisory fee schedule for such Portfolios. The Board considered the effective fees under the Advisory Agreement for a Portfolio as a percentage of assets at different asset levels and possible economies of scale that may be realized if the assets of the Portfolio grow. Among other data, the Board examined the effect of a Portfolio’s growth in size on various fee schedules and reviewed the Lipper and Bobroff Reports, which compared fees among peers. The Board also generally noted that if a Portfolio’s assets increase over time, the Portfolio may realize other economies of scale if assets increase proportionally more than certain other fixed expenses. In addition, the Board noted that the Adviser had taken a number of steps to date intended to share the benefits of economies of scale with contractholders.
With respect to the BlackRock Bond Income Portfolio, the Board noted that the Portfolio’s advisory fee and sub-advisory fee each contains breakpoints that reduce the advisory fee rate on assets above certain specified asset levels. The Board considered the fact that the Portfolio’s fee levels decline as portfolio assets increase.
Other factors. As part of its evaluation of the Adviser’s compensation, the Board considered other benefits that may be realized by the Adviser and its affiliates from their relationship with the Trusts. Among them, the Board recognized that an affiliate of the Adviser, MetLife Investors Distribution Company, serves as the Distributor for the Trusts, and, as such, receives payments pursuant to Rule 12b-1 from the Portfolios to compensate it for providing shareholder services and selling activities, which could lead to growth in the Trusts’ assets and corresponding benefits from such growth, including economies of scale. The Board also considered that affiliates of the Adviser may benefit from certain indirect tax benefits relating to dividend received deductions and foreign tax credits. In conjunction with these considerations, the Board noted the costs of providing investment management and other services to the Portfolios and the ongoing commitment of the Adviser to the Portfolios.
The Board considered other benefits that may be realized by each Sub-Adviser and its affiliates from their relationship with the Trusts, including the opportunity to provide advisory services to additional portfolios of the Trusts and reputational benefits. In conjunction with these considerations, the Board noted the costs of providing investment advisory services to the Portfolios and the ongoing commitment of the Sub-Advisers to the Portfolios.
The Board considered possible conflicts of interest in the form of material benefits or detriments to the Trusts resulting from the nature of the Trusts’ and the Adviser’s or the Sub-Advisers’ affiliations and the services that are provided to the Trusts, and the manner in which such conflicts were mitigated.
MSF-46
Metropolitan Series Fund
BlackRock Bond Income Portfolio
Board of Trustees’ Consideration of Advisory and Sub-Advisory Agreements—(Continued)
Conclusions. After full consideration of the factors discussed above, the Board, including a majority of the Independent Trustees, approved the Advisory Agreement and the Sub-Advisory Agreement, as applicable, with respect to each Portfolio, unless otherwise noted. In making its approvals, the Board concluded that the nature, extent and quality of services provided by the Adviser and each Sub-Adviser supported the renewal of the Agreements. The Board also concluded that the investment performance of each Fund was such that each Agreement should continue. In addition, the Board concluded that fees paid by a Portfolio to the Adviser and, if applicable, the Sub-Adviser appeared to be acceptable in light of nature, extent and quality of the services provided by the Adviser and Sub-Adviser. Further, the Board concluded that the Adviser’s profitability in providing services under the Advisory Agreements did not appear unreasonably high in light of the nature, extent and quality of the services provided by the Adviser. Finally, the Board concluded that the Advisory and Sub-Advisory fees in some measure share economies of scale with contractholders. In approving the renewal of each of the Agreements, the Board, including the Independent Trustees, did not identify any single factor as controlling, and generally attributed different weights to various factors for the various Portfolios. The Board evaluated all information available to them on a Portfolio-by-Portfolio basis, and their decisions were made separately with respect to each Portfolio.
MSF-47
Metropolitan Series Fund
BlackRock Capital Appreciation Portfolio
Managed by BlackRock Advisors, LLC
Portfolio Manager Commentary*
PERFORMANCE
For the one year period ended December 31, 2013, the Class A, B, and E shares of the BlackRock Capital Appreciation Portfolio returned 34.22%, 33.90%, and 34.04%, respectively. The Portfolio’s benchmark, the Russell 1000 Growth Index1, returned 33.48%.
MARKET ENVIRONMENT / CONDITIONS
U.S. stocks had another impressive year, hitting all-time highs in May, continuing to build on the momentum, and capping off 2013 with strong year-end gains. The broad-market S&P 500 Index posted its strongest annual return since 1995. Market strength was buoyed late in the year by news that Congress was making progress on a budget agreement, as well as a series of better-than-expected economic data that included upward revisions to third-quarter gross domestic product (“GDP”) growth. Accordingly, cyclical sectors led, with notable outperformance coming from Information Technology (“IT”) and Industrials, while defensive sectors lagged. Concern that economic strength and political stability would strengthen the case of the more hawkish voices at the Federal Reserve (the “Fed”) was confirmed by the announcement that starting in January 2014, the Fed’s monthly bond purchases would be “tapered” from $85 to $75 billion.
PORTFOLIO REVIEW / PERIOD END POSITIONING
The Portfolio outperformed the Russell 1000 Growth Index during the 12-month period. An underweight position in Consumer Staples was the primary contributor to relative performance, as the sector lagged the benchmark index for the period. Within the sector, the largest contributor to performance was a lack of exposure to tobacco companies.
Within Telecom, a position in SoftBank Corporation drove the Portfolio’s strong results as the stock advanced more than 38%. Part of this stock’s strong performance was attributable to news of a $1 billion stake being taken in the company by a well-known investor. In addition, there was continued investor appreciation for the value of private Chinese e-commerce giant Alibaba Group (“Alibaba”), in which SoftBank owns a 37% stake. Alibaba appears to be headed for an initial public offering (IPO) in 2014, and BlackRock’s value estimate of its core e-commerce business is not yet priced into SoftBank’s stock. In addition, the Portfolio’s underweight in the sector contributed to results, as Telecom was the weakest-performing sector in the benchmark index over the year.
An overweight to the Consumer Discretionary sector also contributed to performance. Within the sector, media company Viacom and Macau casino operator Melco Crown Entertainment (“Melco Crown”) were the main drivers of outperformance. Viacom shares advanced as the company reported strong earnings, while also doubling its stock repurchase program to $20 billion. The position in Viacom was sold in the fourth quarter. Shares of Melco Crown surged amid expanding growth in the mass market in China, where the company is picking up share. In addition, Amazon.com contributed to the strong performance in the sector, as its stock rose more than 40%.
Stock selection within the IT sector added to performance and provided some of the year’s biggest winners. Not holding poor-performing International Business Machines Corp. (“IBM”) was the leading positive contributor. The structural shift towards new technology architectures is impacting legacy technology vendors such as IBM and the company missed its earnings forecast for the first time since 2005. Yahoo! Inc. was another top contributor in the segment, with shares gaining more than 36% during the year. Similar to SoftBank, Yahoo! benefited from excitement around Alibaba, in which it owns a 24% stake. In addition, Yahoo! was able to raise convertible debt capital at a 0.0% coupon, and company management consequently announced a $5 billion boost to its share buyback program. Finally, a position in data analytics software maker, Splunk, Inc., proved additive as did a significant underweight in Apple, Inc., which declined significantly over the period.
Positioning within the Health Care sector was the largest detractor from performance, with pharmacy benefit manager Catamaran Corp. and drug maker Allergan, Inc., accounting for the majority of the disappointment. Catamaran stock first lost ground in May 2013 following a modest revenue miss and uncertainty over its contract renewal with key customer Cigna (an agreement that was later signed). Shares subsequently rallied, hitting a 52-week high, but declined again in the third quarter amid uncertainty over the impact of some larger employers unexpectedly shifting their employees to private health insurance exchanges. The position in Catamaran was sold in the fourth quarter. Shares of Allergan, Inc., fell in the first half of the reporting period as concerns about a delay in the commercialization of the company’s new eye drug overshadowed an otherwise positive first-quarter earnings report.
In addition, the Energy sector also detracted from performance, as many of the Portfolio’s holdings traded lower due to the decline in commodity prices.
A more than 30% run-up in U.S. stocks for 2013 has naturally given rise to worries about stretched valuations and the sustainability of the bull market rally. Though pockets of overvaluation may exist, we take a longer-term view of the investments we make, in particular focusing on businesses for which the magnitude and/or duration of future growth prospects are underestimated by the market. On that score, we continue to find reasonable valuations for great companies with strong earnings potential, large addressable markets and dominant market positions that we believe can thrive irrespective of macroeconomic ebbs and flows. Best-in-class business models continue to take share globally, and selective opportunities in both the Superior Growth and Durable Growth areas remain. Coupled with the impressive innovation and strong execution by our holdings’ management teams, we remain optimistic about the long-term outlooks for the Portfolio’s holdings.
At period end, the Portfolio maintained a diversified mix of Durable and Superior Growth holdings, supplemented by a small group of Periodic Growth names. The Portfolio’s largest overweight relative to
MSF-1
Metropolitan Series Fund
BlackRock Capital Appreciation Portfolio
Managed by BlackRock Advisors, LLC
Portfolio Manager Commentary*—(Continued)
the Russell 1000 Growth Index remained Consumer Discretionary, while the most notable underweight was Consumer Staples. The Consumer Discretionary overweight reflects our favorable view of companies that continue to take share in the expanding growth of consumer wealth globally, as well as those poised to benefit from the rise in e-commerce.
Lawrence Kemp
Portfolio Manager
BlackRock Advisors, LLC
* This commentary may include statements that constitute “forward-looking statements” under the U.S. securities laws. Forward-looking statements include, among other things, projections, estimates, and information about possible or future results related to the Portfolio, market or regulatory developments. The views expressed above are not guarantees of future performance or economic results and involve certain risks, uncertainties and assumptions that could cause actual outcomes and results to differ materially from the views expressed herein. The views expressed above are subject to change at any time based upon economic, market, or other conditions and the subadvisory firm undertakes no obligation to update the views expressed herein. Any discussions of specific securities should not be considered a recommendation to buy or sell those securities. The views expressed above (including any forward-looking statement) may not be relied upon as investment advice or as an indication of the Portfolio’s trading intent. Information about the Portfolio’s holdings, asset allocation or country diversification is historical and is not an indication of future Portfolio composition, which may vary. Direct investment in any index is not possible. The performance of any index mentioned in this commentary has not been adjusted for ongoing management, distribution and operating expenses, and sales charges applicable to mutual fund investments. In addition, the returns do not reflect additional fees charged by separate accounts or variable insurance contracts that an investor in the Portfolio may pay. If these additional fees were reflected, performance would have been lower.
MSF-2
Metropolitan Series Fund
BlackRock Capital Appreciation Portfolio
A $10,000 INVESTMENT COMPARED TO THE RUSSELL 1000 GROWTH INDEX
AVERAGE ANNUAL RETURNS (%) (FOR THE YEAR ENDED DECEMBER 31, 2013)
| | | | | | | | | | | | |
| | | 1 Year | | | 5 Year | | | 10 Year | |
| BlackRock Capital Appreciation Portfolio | | | | | | | | | | | | |
Class A | | | 34.22 | | | | 18.03 | | | | 7.67 | |
Class B | | | 33.90 | | | | 17.74 | | | | 7.40 | |
Class E | | | 34.04 | | | | 17.86 | | | | 7.51 | |
| Russell 1000 Growth Index | | | 33.48 | | | | 20.39 | | | | 7.83 | |
1 The Russell 1000 Growth Index is an unmanaged measure of performance of the largest capitalized U.S. companies, within the Russell 1000 companies, that have higher price-to-book ratios and forecasted growth values.
Portfolio performance is calculated including reinvestment of all income and capital gain distributions. Performance numbers are net of all Portfolio expenses but do not include any insurance, sales, separate account or administrative charges of variable annuity or life insurance contracts or any additional expenses that participants may bear relating to the operations of their plans. If these charges were included, the returns would be lower. The performance of any index referenced above has not been adjusted for ongoing management, distribution and operating expenses, and sales charges applicable to mutual fund investments. Direct investment in any index is not possible. The performance of Class A shares, as set forth in the line graph above, will differ from that of other classes because of the difference in expenses paid by policyholders investing in the different share classes.
This information represents past performance and is not indicative of future results. Investment return and principal value may fluctuate so that shares, upon redemption, may be worth more or less than the original cost.
PORTFOLIO COMPOSITION AS OF DECEMBER 31, 2013
Top Holdings
| | | | |
| | |
% of
Net Assets | |
| Google, Inc.—Class A | | | 4.8 | |
| Visa, Inc.—Class A | | | 3.9 | |
| SoftBank Corp. | | | 3.8 | |
| Amazon.com, Inc. | | | 3.8 | |
| Precision Castparts Corp. | | | 3.3 | |
| Comcast Corp.—Class A | | | 3.0 | |
| Yahoo!, Inc. | | | 2.6 | |
| Liberty Global plc—Class A | | | 2.6 | |
| Autodesk, Inc. | | | 2.5 | |
| Eaton Corp. plc | | | 2.4 | |
Top Sectors
| | | | |
| | | % of
Market Value of
Total Long-Term Investments | |
| Information Technology | | | 29.3 | |
| Consumer Discretionary | | | 28.7 | |
| Industrials | | | 13.3 | |
| Health Care | | | 12.9 | |
| Telecommunication Services | | | 5.1 | |
| Energy | | | 3.4 | |
| Financials | | | 3.2 | |
| Consumer Staples | | | 2.2 | |
| Materials | | | 1.9 | |
MSF-3
Metropolitan Series Fund
BlackRock Capital Appreciation Portfolio
Understanding Your Portfolio’s Expenses
Shareholder Expense Example
As a shareholder of the Portfolio, you incur ongoing costs, including management fees; distribution and service (12b-1) fees; and other Portfolio expenses. This example is intended to help you understand your ongoing costs (in dollars) (referred to as “expenses”) of investing in the Portfolio and compare these costs with the ongoing costs of investing in other mutual funds. The example is based on an investment of $1,000 invested at the beginning of the period and held for the entire period, July 1, 2013 through December 31, 2013.
Actual Expenses
The first line for each share class of the Portfolio in the table below provides information about actual account values and actual expenses. You may use the information in this line, together with the amount you invested in the particular share class of the Portfolio, to estimate the expenses that you paid over the period. Simply divide your account value by $1,000 (for example, an $8,600 account value divided by $1,000 = 8.6), then multiply the result by the number in the first line under the heading entitled “Expenses Paid During Period” to estimate the expenses you paid on your account during this period.
Hypothetical Example for Comparison Purposes
The second line for each share class of the Portfolio in the table below provides information about hypothetical account values and hypothetical expenses based on the Portfolio’s actual expense ratio and an assumed rate of return of 5% per year before expenses, which is not the Portfolio’s actual return. The hypothetical account values and expenses may not be used to estimate the actual ending account balance or expenses you paid for the period. You may use this information to compare the ongoing costs of investing in the Portfolio and other funds. To do so, compare this 5% hypothetical example with the 5% hypothetical examples that appear in the shareholder reports of the other funds.
Please note that the expenses shown in the table are meant to highlight your ongoing costs only and do not reflect any fees or charges of your variable insurance product or any additional expenses that participants in certain eligible qualified plans may bear relating to the operations of their plan. Therefore, the second line for each share class in the table is useful in comparing ongoing costs only, and will not help you determine the relative total costs of owning different funds. In addition, if these other costs were included, your costs would have been higher.
| | | | | | | | | | | | | | | | | | |
BlackRock Capital Appreciation Portfolio | | | | Annualized
Expense
Ratio | | | Beginning
Account Value
July 1,
2013 | | | Ending
Account Value
December 31,
2013 | | | Expenses Paid
During Period**
July 1, 2013
to
December 31,
2013 | |
Class A(a) | | Actual | | | 0.70 | % | | $ | 1,000.00 | | | $ | 1,238.10 | | | $ | 3.95 | |
| | Hypothetical* | | | 0.70 | % | | $ | 1,000.00 | | | $ | 1,021.68 | | | $ | 3.57 | |
| | | | | |
Class B(a) | | Actual | | | 0.95 | % | | $ | 1,000.00 | | | $ | 1,236.50 | | | $ | 5.36 | |
| | Hypothetical* | | | 0.95 | % | | $ | 1,000.00 | | | $ | 1,020.42 | | | $ | 4.84 | |
| | | | | |
Class E(a) | | Actual | | | 0.85 | % | | $ | 1,000.00 | | | $ | 1,237.50 | | | $ | 4.79 | |
| | Hypothetical* | | | 0.85 | % | | $ | 1,000.00 | | | $ | 1,020.92 | | | $ | 4.33 | |
* Hypothetical assumes a rate of return of 5% per year before expenses.
** Expenses paid are equal to the Portfolio’s annualized expense ratio for the most recent six month period, as shown above, multiplied by the average account value over the period, multiplied by the number of days (184 days) in the most recent fiscal half-year, divided by 365 (to reflect the one-half year period).
(a) The annualized expense ratio shown reflects the impact of the management fee waiver as described in Note 6 of the Notes to Financial Statements.
MSF-4
Metropolitan Series Fund
BlackRock Capital Appreciation Portfolio
Schedule of Investments as of December 31, 2013
Common Stocks—100.3% of Net Assets
| | | | | | | | |
| Security Description | | Shares | | | Value | |
|
Aerospace & Defense—5.2% | |
Precision Castparts Corp. | | | 262,082 | | | $ | 70,578,682 | |
United Technologies Corp. | | | 372,406 | | | | 42,379,803 | |
| | | | | | | | |
| | | | | | | 112,958,485 | |
| | | | | | | | |
|
Auto Components—0.9% | |
Delphi Automotive plc | | | 324,721 | | | | 19,525,474 | |
| | | | | | | | |
|
Biotechnology—5.9% | |
Gilead Sciences, Inc. (a) | | | 612,549 | | | | 46,033,057 | |
Regeneron Pharmaceuticals, Inc. (a) | | | 124,301 | | | | 34,212,607 | |
United Therapeutics Corp. (a) (b) | | | 409,317 | | | | 46,285,567 | |
| | | | | | | | |
| | | | | | | 126,531,231 | |
| | | | | | | | |
|
Chemicals—1.9% | |
Eastman Chemical Co. | | | 94,222 | | | | 7,603,715 | |
Monsanto Co. | | | 279,253 | | | | 32,546,937 | |
| | | | | | | | |
| | | | | | | 40,150,652 | |
| | | | | | | | |
|
Consumer Finance—0.9% | |
Discover Financial Services | | | 345,487 | | | | 19,329,998 | |
| | | | | | | | |
|
Diversified Financial Services—2.3% | |
IntercontinentalExchange Group, Inc. | | | 102,829 | | | | 23,128,298 | |
Moody’s Corp. | | | 348,823 | | | | 27,372,141 | |
| | | | | | | | |
| | | | | | | 50,500,439 | |
| | | | | | | | |
|
Diversified Telecommunication Services—1.3% | |
Vivendi S.A. | | | 1,097,209 | | | | 29,025,685 | |
| | | | | | | | |
|
Electrical Equipment —3.9% | |
Eaton Corp. plc | | | 665,539 | | | | 50,660,829 | |
Roper Industries, Inc. | | | 118,090 | | | | 16,376,721 | |
Solarcity Corp. (a) | | | 315,198 | | | | 17,909,550 | |
| | | | | | | | |
| | | | | | | 84,947,100 | |
| | | | | | | | |
|
Energy Equipment & Services—1.1% | |
FMC Technologies, Inc. (a) | | | 438,288 | | | | 22,883,016 | |
| | | | | | | | |
|
Food Products—0.9% | |
Mondelez International, Inc. - Class A | | | 549,729 | | | | 19,405,434 | |
| | | | | | | | |
|
Health Care Equipment & Supplies—1.7% | |
Intuitive Surgical, Inc. (a) | | | 97,423 | | | | 37,418,226 | |
| | | | | | | | |
|
Hotels, Restaurants & Leisure—4.1% | |
Melco Crown Entertainment, Ltd. (ADR) (a) (b) | | | 475,567 | | | | 18,651,738 | |
Starbucks Corp. | | | 459,607 | | | | 36,028,592 | |
Wynn Resorts, Ltd. | | | 168,967 | | | | 32,815,081 | |
| | | | | | | | |
| | | | | | | 87,495,411 | |
| | | | | | | | |
|
Internet & Catalog Retail—7.6% | |
Amazon.com, Inc. (a) | | | 203,756 | | | | 81,255,855 | |
Expedia, Inc. | | | 465,434 | | | | 32,422,133 | |
|
Internet & Catalog Retail—(Continued) | |
priceline.com, Inc. (a) | | | 42,548 | | | $ | 49,457,795 | |
| | | | | | | | |
| | | | | | | 163,135,783 | |
| | | | | | | | |
|
Internet Software & Services—17.7% | |
AOL, Inc. (a) | | | 287,500 | | | | 13,403,250 | |
eBay, Inc. (a) | | | 493,674 | | | | 27,097,766 | |
Facebook, Inc. - Class A (a) | | | 271,038 | | | | 14,814,937 | |
Google, Inc. - Class A (a) | | | 92,580 | | | | 103,755,332 | |
LinkedIn Corp. - Class A (a) | | | 210,790 | | | | 45,705,596 | |
SINA Corp. (a) | | | 438,410 | | | | 36,936,043 | |
Yahoo!, Inc. (a) | | | 1,408,851 | | | | 56,973,934 | |
Yandex NV - Class A (a) | | | 614,540 | | | | 26,517,401 | |
Yelp, Inc. (a) | | | 554,021 | | | | 38,199,748 | |
Youku Tudou, Inc. (ADR) (a) | | | 577,628 | | | | 17,502,128 | |
| | | | | | | | |
| | | | | | | 380,906,135 | |
| | | | | | | | |
|
IT Services—6.7% | |
Alliance Data Systems Corp. (a) (b) | | | 123,501 | | | | 32,472,118 | |
MasterCard, Inc. - Class A | | | 32,391 | | | | 27,061,385 | |
Visa, Inc. - Class A | | | 381,362 | | | | 84,921,690 | |
| | | | | | | | |
| | | | | | | 144,455,193 | |
| | | | | | | | |
|
Media—11.9% | |
Comcast Corp. - Class A | | | 1,258,041 | | | | 65,374,100 | |
Liberty Global plc - Class A (a) | | | 619,434 | | | | 55,123,432 | |
Sirius XM Holdings, Inc. (a) (b) | | | 10,282,256 | | | | 35,885,073 | |
Time Warner, Inc. | | | 714,755 | | | | 49,832,719 | |
Walt Disney Co. (The) | | | 660,303 | | | | 50,447,149 | |
| | | | | | | | |
| | | | | | | 256,662,473 | |
| | | | | | | | |
|
Oil, Gas & Consumable Fuels—2.4% | |
Cabot Oil & Gas Corp. | | | 431,381 | | | | 16,720,327 | |
Concho Resources, Inc. (a) | | | 137,813 | | | | 14,883,804 | |
Laredo Petroleum Holdings, Inc. (a) | | | 698,617 | | | | 19,344,705 | |
| | | | | | | | |
| | | | | | | 50,948,836 | |
| | | | | | | | |
|
Personal Products—1.3% | |
Estee Lauder Cos., Inc. (The) - Class A | | | 365,202 | | | | 27,507,015 | |
| | | | | | | | |
|
Pharmaceuticals—5.4% | |
AbbVie, Inc. | | | 855,969 | | | | 45,203,723 | |
Allergan, Inc. | | | 197,452 | | | | 21,932,968 | |
Valeant Pharmaceuticals International, Inc. (a) | | | 409,372 | | | | 48,060,273 | |
| | | | | | | | |
| | | | | | | 115,196,964 | |
| | | | | | | | |
|
Professional Services—1.1% | |
Verisk Analytics, Inc. - Class A (a) | | | 349,729 | | | | 22,984,190 | |
| | | | | | | | |
|
Road & Rail—2.9% | |
Canadian Pacific Railway, Ltd. | | | 103,825 | | | | 15,710,799 | |
Union Pacific Corp. | | | 283,308 | | | | 47,595,744 | |
| | | | | | | | |
| | | | | | | 63,306,543 | |
| | | | | | | | |
See accompanying notes to financial statements.
MSF-5
Metropolitan Series Fund
BlackRock Capital Appreciation Portfolio
Schedule of Investments as of December 31, 2013
Common Stocks—(Continued)
| | | | | | | | |
| Security Description | | Shares | | | Value | |
|
Software—5.0% | |
Autodesk, Inc. (a) | | | 1,072,206 | | | $ | 53,964,128 | |
Splunk, Inc. (a) | | | 449,578 | | | | 30,872,521 | |
VMware, Inc. - Class A (a) (b) | | | 259,202 | | | | 23,253,012 | |
| | | | | | | | |
| | | | | | | 108,089,661 | |
| | | | | | | | |
|
Specialty Retail—1.3% | |
CarMax, Inc. (a) | | | 344,342 | | | | 16,190,961 | |
Lumber Liquidators Holdings, Inc. (a) | | | 109,907 | | | | 11,308,331 | |
| | | | | | | | |
| | | | | | | 27,499,292 | |
| | | | | | | | |
|
Textiles, Apparel & Luxury Goods—3.0% | |
Michael Kors Holdings, Ltd. (a) | | | 230,641 | | | | 18,725,743 | |
NIKE, Inc. - Class B | | | 587,646 | | | | 46,212,481 | |
| | | | | | | | |
| | | | | | | 64,938,224 | |
| | | | | | | | |
|
Trading Companies & Distributors—0.1% | |
United Rentals, Inc. (a) (b) | | | 30,905 | | | | 2,409,045 | |
| | | | | | | | |
|
Wireless Telecommunication Services—3.8% | |
SoftBank Corp. | | | 928,300 | | | | 81,377,199 | |
| | | | | | | | |
Total Common Stocks
(Cost $1,704,474,218) | | | | | | | 2,159,587,704 | |
| | | | | | | | |
|
| Short-Term Investments—6.0% | |
| |
Mutual Fund—6.0% | | | | | |
State Street Navigator Securities Lending MET Portfolio (c) | | | 129,171,009 | | | | 129,171,009 | |
| | | | | | | | |
| | | | | | | | |
| Security Description | | Principal
Amount* | | | Value | |
| |
Repurchase Agreement—0.0% | | | | | |
Fixed Income Clearing Corp. Repurchase Agreement dated 12/31/13 at 0.000% to be repurchased at $602,000 on 01/02/14, collateralized by $625,000 U.S. Treasury Note at 0.625% due 08/31/17 with a value of $615,625. | | | 602,000 | | | $ | 602,000 | |
| | | | | | | | |
Total Short-Term Investments
(Cost $129,773,009) | | | | | | | 129,773,009 | |
| | | | | | | | |
Total Investments—106.3%
(Cost $1,834,247,227) (d) | | | | | | | 2,289,360,713 | |
Other assets and liabilities (net)—(6.3)% | | | | | | | (135,184,877 | ) |
| | | | | | | | |
| Net Assets—100.0% | | | | | | $ | 2,154,175,836 | |
| | | | | | | | |
| * | Principal amount stated in U.S. dollars unless otherwise noted. |
| (a) | Non-income producing security. |
| (b) | All or a portion of the security was held on loan. As of December 31, 2013, the market value of securities loaned was $119,804,564 and the collateral received consisted of cash in the amount of $129,171,009. The cash collateral is invested in a money market fund managed by an affiliate of the custodian. |
| (c) | Represents investment of cash collateral received from securities lending transactions. |
| (d) | As of December 31, 2013, the aggregate cost of investments for federal income tax purposes was $1,837,274,814. The aggregate unrealized appreciation and depreciation of investments were $454,655,034 and $(2,569,135), respectively, resulting in net unrealized appreciation of $452,085,899 for federal income tax purposes. |
| (ADR)— | An American Depositary Receipt is a certificate issued by a custodian bank representing the right to receive securities of the foreign issuer described. Trading on exchanges not located in the United States or Canada significantly influences the value of ADRs. |
Forward Foreign Currency Exchange Contracts
| | | | | | | | | | | | | | | | | | |
Contracts to Deliver | | | Counterparty | | Settlement Date | | | In Exchange
for | | | Unrealized
Appreciation | |
| JPY | | | 6,150,457,031 | | | Barclays Bank plc | | | 02/28/14 | | | $ | 59,068,866 | | | $ | 650,605 | |
| | | | | | | | | | | | | | | | | | |
See accompanying notes to financial statements.
MSF-6
Metropolitan Series Fund
BlackRock Capital Appreciation Portfolio
Schedule of Investments as of December 31, 2013
Fair Value Hierarchy
Accounting principles generally accepted in the United States of America (“GAAP”) define fair market value as the price that the Portfolio would receive to sell an asset or pay to transfer a liability in an orderly transaction between market participants at the measurement date. It establishes a fair value hierarchy that prioritizes inputs to valuation methods and requires disclosure of the fair value hierarchy that segregates fair value measurements into three levels. Levels 1, 2 and 3 of the fair value hierarchy are defined as follows:
Level 1 - unadjusted quoted prices in active markets for identical investments
Level 2 - other significant observable inputs (including, but not limited to, unadjusted quoted prices for similar investments in markets that are either active or inactive; inputs other than quoted prices that are observable such as interest rates, yield curves, volatilities, prepayment speeds, loss severities, credit risks, default rates, etc.)
Level 3 - significant unobservable inputs based on the best information available in the circumstances, to the extent observable inputs are unavailable (including the Portfolio’s own assumptions in determining the fair value of investments)
The inputs or methodologies used for valuing investments are not necessarily an indication of the risk associated with investing in them. Changes to the inputs or methodologies used may result in transfers between levels, which will be recognized as of the beginning of the reporting period. Information on transfers between Level 1 and Level 2, if any, will be disclosed following the fair value hierarchy table below. A reconciliation of Level 3 securities, if any, will also be disclosed following the fair value hierarchy table. For more information about the Portfolio’s policy regarding the valuation of investments, please refer to the Notes to Financial Statements.
The following table summarizes the fair value hierarchy of the Portfolio’s investments as of December 31, 2013:
| | | | | | | | | | | | | | | | |
| Description | | Level 1 | | | Level 2 | | | Level 3 | | | Total | |
| Common Stocks | | | | | | | | | | | | | | | | |
Aerospace & Defense | | $ | 112,958,485 | | | $ | — | | | $ | — | | | $ | 112,958,485 | |
Auto Components | | | 19,525,474 | | | | — | | | | — | | | | 19,525,474 | |
Biotechnology | | | 126,531,231 | | | | — | | | | — | | | | 126,531,231 | |
Chemicals | | | 40,150,652 | | | | — | | | | — | | | | 40,150,652 | |
Consumer Finance | | | 19,329,998 | | | | — | | | | — | | | | 19,329,998 | |
Diversified Financial Services | | | 50,500,439 | | | | — | | | | — | | | | 50,500,439 | |
Diversified Telecommunication Services | | | — | | | | 29,025,685 | | | | — | | | | 29,025,685 | |
Electrical Equipment | | | 84,947,100 | | | | — | | | | — | | | | 84,947,100 | |
Energy Equipment & Services | | | 22,883,016 | | | | — | | | | — | | | | 22,883,016 | |
Food Products | | | 19,405,434 | | | | — | | | | — | | | | 19,405,434 | |
Health Care Equipment & Supplies | | | 37,418,226 | | | | — | | | | — | | | | 37,418,226 | |
Hotels, Restaurants & Leisure | | | 87,495,411 | | | | — | | | | — | | | | 87,495,411 | |
Internet & Catalog Retail | | | 163,135,783 | | | | — | | | | — | | | | 163,135,783 | |
Internet Software & Services | | | 380,906,135 | | | | — | | | | — | | | | 380,906,135 | |
IT Services | | | 144,455,193 | | | | — | | | | — | | | | 144,455,193 | |
Media | | | 256,662,473 | | | | — | | | | — | | | | 256,662,473 | |
Oil, Gas & Consumable Fuels | | | 50,948,836 | | | | — | | | | — | | | | 50,948,836 | |
Personal Products | | | 27,507,015 | | | | — | | | | — | | | | 27,507,015 | |
Pharmaceuticals | | | 115,196,964 | | | | — | | | | — | | | | 115,196,964 | |
Professional Services | | | 22,984,190 | | | | — | | | | — | | | | 22,984,190 | |
Road & Rail | | | 63,306,543 | | | | — | | | | — | | | | 63,306,543 | |
Software | | | 108,089,661 | | | | — | | | | — | | | | 108,089,661 | |
Specialty Retail | | | 27,499,292 | | | | — | | | | — | | | | 27,499,292 | |
Textiles, Apparel & Luxury Goods | | | 64,938,224 | | | | — | | | | — | | | | 64,938,224 | |
Trading Companies & Distributors | | | 2,409,045 | | | | — | | | | — | | | | 2,409,045 | |
Wireless Telecommunication Services | | | — | | | | 81,377,199 | | | | — | | | | 81,377,199 | |
Total Common Stocks | | | 2,049,184,820 | | | | 110,402,884 | | | | — | | | | 2,159,587,704 | |
| Short-Term Investments | | | | | | | | | | | | | | | | |
Mutual Fund | | | 129,171,009 | | | | — | | | | — | | | | 129,171,009 | |
Repurchase Agreement | | | — | | | | 602,000 | | | | — | | | | 602,000 | |
Total Short-Term Investments | | | 129,171,009 | | | | 602,000 | | | | — | | | | 129,773,009 | |
Total Investments | | $ | 2,178,355,829 | | | $ | 111,004,884 | | | $ | — | | | $ | 2,289,360,713 | |
| | | | | | | | | | | | | | | | | |
Collateral for Securities Loaned (Liability) | | $ | — | | | $ | (129,171,009 | ) | | $ | — | | | $ | (129,171,009 | ) |
| Forward Contracts | | | | | | | | | | | | | | | | |
Forward Foreign Currency Exchange Contracts (Unrealized Appreciation) | | $ | — | | | $ | 650,605 | | | $ | — | | | $ | 650,605 | |
See accompanying notes to financial statements.
MSF-7
Metropolitan Series Fund
BlackRock Capital Appreciation Portfolio
Statement of Assets and Liabilities
December 31, 2013
| | | | |
Assets | | | | |
Investments at value (a) (b) | | $ | 2,289,360,713 | |
Cash | | | 169 | |
Unrealized appreciation on forward foreign currency exchange contracts | | | 650,605 | |
Receivable for: | | | | |
Investments sold | | | 21,617,447 | |
Fund shares sold | | | 32,611 | |
Dividends | | | 1,295,998 | |
Prepaid expenses | | | 4,686 | |
| | | | |
Total Assets | | | 2,312,962,229 | |
Liabilities | | | | |
Due to bank cash denominated in foreign currencies (c) | | | 7,643 | |
Collateral for securities loaned | | | 129,171,009 | |
Payables for: | | | | |
Investments purchased | | | 25,856,016 | |
Fund shares redeemed | | | 2,322,709 | |
Accrued Expenses: | | | | |
Management fees | | | 1,214,174 | |
Distribution and service fees | | | 45,439 | |
Deferred trustees’ fees | | | 57,243 | |
Other expenses | | | 112,160 | |
| | | | |
Total Liabilities | | | 158,786,393 | |
| | | | |
Net Assets | | $ | 2,154,175,836 | |
| | | | |
Net assets consist of: | | | | |
Paid in surplus | | $ | 1,704,040,839 | |
Undistributed net investment income | | | 910,319 | |
Accumulated net realized loss | | | (6,539,443 | ) |
Unrealized appreciation on investments and foreign currency transactions | | | 455,764,121 | |
| | | | |
Net Assets | | $ | 2,154,175,836 | |
| | | | |
Net Assets | | | | |
Class A | | $ | 1,917,929,994 | |
Class B | | | 190,539,083 | |
Class E | | | 45,706,759 | |
Capital Shares Outstanding* | | | | |
Class A | | | 50,673,642 | |
Class B | | | 5,126,388 | |
Class E | | | 1,218,635 | |
Net Asset Value, Offering Price and Redemption Price Per Share | | | | |
Class A | | $ | 37.85 | |
Class B | | | 37.17 | |
Class E | | | 37.51 | |
| * | The Portfolio is authorized to issue an unlimited number of shares. |
| (a) | Includes securities loaned at value of $119,804,564. |
| (b) | Identified cost of investments was $1,834,247,227 |
| (c) | Identified cost of cash denominated in foreign currencies due to custodian was $7,689. |
Statement of Operations
Year Ended December 31, 2013
| | | | |
Investment Income | | | | |
Dividends (a) | | $ | 13,788,003 | |
Interest | | | 835 | |
Securities lending income | | | 610,174 | |
| | | | |
Total investment income | | | 14,399,012 | |
Expenses | | | | |
Management fees | | | 12,538,309 | |
Administration fees | | | 32,768 | |
Custodian and accounting fees | | | 140,267 | |
Distribution and service fees—Class B | | | 438,248 | |
Distribution and service fees—Class E | | | 65,676 | |
Audit and tax services | | | 37,723 | |
Legal | | | 28,910 | |
Trustees’ fees and expenses | | | 35,357 | |
Shareholder reporting | | | 65,207 | |
Insurance | | | 8,781 | |
Miscellaneous | | | 15,125 | |
| | | | |
Total expenses | | | 13,406,371 | |
Less management fee waiver | | | (174,998 | ) |
Less broker commission recapture | | | (51,815 | ) |
| | | | |
Net expenses | | | 13,179,558 | |
| | | | |
Net Investment Income | | | 1,219,454 | |
| | | | |
Net Realized and Unrealized Gain | | | | |
| Net realized gain (loss) on: | | | | |
Investments | | | 281,777,149 | |
Net increase from payments by affiliates (b) | | | 776,322 | |
Futures contracts | | | 188,096 | |
Foreign currency transactions | | | (102,400 | ) |
| | | | |
Net realized gain | | | 282,639,167 | |
| | | | |
| Net change in unrealized appreciation on: | | | | |
Investments | | | 260,898,446 | |
Foreign currency transactions | | | 650,635 | |
| | | | |
Net change in unrealized appreciation | | | 261,549,081 | |
| | | | |
Net realized and unrealized gain | | | 544,188,248 | |
| | | | |
Net Increase in Net Assets from Operations | | $ | 545,407,702 | |
| | | | |
| (a) | Net of foreign withholding taxes of $18,555. |
| (b) | See Note 6 of the Notes to Financial Statements. |
See accompanying notes to financial statements.
MSF-8
Metropolitan Series Fund
BlackRock Capital Appreciation Portfolio
Statements of Changes in Net Assets
| | | | | | | | |
| | | Year Ended
December 31,
2013 | | | Year Ended
December 31,
2012 | |
Increase (Decrease) in Net Assets: | | | | | | | | |
From Operations | | | | | | | | |
Net investment income | | $ | 1,219,454 | | | $ | 14,655,614 | |
Net realized gain | | | 282,639,167 | | | | 14,846,433 | |
Net change in unrealized appreciation | | | 261,549,081 | | | | 186,168,554 | |
| | | | | | | | |
Increase in net assets from operations | | | 545,407,702 | | | | 215,670,601 | |
| | | | | | | | |
From Distributions to Shareholders | | | | | | | | |
Net investment income | | | | | | | | |
Class A | | | (13,139,735 | ) | | | (4,424,259 | ) |
Class B | | | (1,085,499 | ) | | | (117,264 | ) |
Class E | | | (308,668 | ) | | | (72,969 | ) |
| | | | | | | | |
Total distributions | | | (14,533,902 | ) | | | (4,614,492 | ) |
| | | | | | | | |
Increase (decrease) in net assets from capital share transactions | | | 6,097,339 | | | | (103,754,869 | ) |
| | | | | | | | |
Total increase in net assets | | | 536,971,139 | | | | 107,301,240 | |
| | |
Net Assets | | | | | | | | |
Beginning of period | | | 1,617,204,697 | | | | 1,509,903,457 | |
| | | | | | | | |
End of period | | $ | 2,154,175,836 | | | $ | 1,617,204,697 | |
| | | | | | | | |
| | |
Undistributed net investment income | | | | | | | | |
End of period | | $ | 910,319 | | | $ | 14,378,982 | |
| | | | | | | | |
Other Information:
Capital Shares
Transactions in capital shares were as follows:
| | | | | | | | | | | | | | | | |
| | | Year Ended
December 31, 2013 | | | Year Ended
December 31, 2012 | |
| | | Shares | | | Value | | | Shares | | | Value | |
Class A | | | | | | | | | | | | | | | | |
Sales | | | 8,135,961 | | | $ | 270,708,814 | | | | 2,738,967 | | | $ | 74,272,198 | |
Reinvestments | | | 445,868 | | | | 13,139,735 | | | | 157,111 | | | | 4,424,259 | |
Redemptions | | | (7,488,997 | ) | | | (243,962,049 | ) | | | (5,991,764 | ) | | | (166,746,053 | ) |
| | | | | | | | | | | | | | | | |
Net increase (decrease) | | | 1,092,832 | | | $ | 39,886,500 | | | | (3,095,686 | ) | | $ | (88,049,596 | ) |
| | | | | | | | | | | | | | | | |
Class B | | | | | | | | | | | | | | | | |
Sales | | | 277,663 | | | $ | 8,605,449 | | | | 558,880 | | | $ | 15,033,213 | |
Reinvestments | | | 37,444 | | | | 1,085,499 | | | | 4,232 | | | | 117,264 | |
Redemptions | | | (1,093,181 | ) | | | (34,711,377 | ) | | | (929,388 | ) | | | (25,417,688 | ) |
| | | | | | | | | | | | | | | | |
Net decrease | | | (778,074 | ) | | $ | (25,020,429 | ) | | | (366,276 | ) | | $ | (10,267,211 | ) |
| | | | | | | | | | | | | | | | |
Class E | | | | | | | | | | | | | | | | |
Sales | | | 99,567 | | | $ | 3,098,565 | | | | 189,738 | | | $ | 5,162,641 | |
Reinvestments | | | 10,560 | | | | 308,668 | | | | 2,612 | | | | 72,969 | |
Redemptions | | | (377,071 | ) | | | (12,175,965 | ) | | | (389,795 | ) | | | (10,673,672 | ) |
| | | | | | | | | | | | | | | | |
Net decrease | | | (266,944 | ) | | $ | (8,768,732 | ) | | | (197,445 | ) | | $ | (5,438,062 | ) |
| | | | | | | | | | | | | | | | |
Increase (decrease) derived from capital shares transactions | | | | | | $ | 6,097,339 | | | | | | | $ | (103,754,869 | ) |
| | | | | | | | | | | | | | | | |
See accompanying notes to financial statements.
MSF-9
Metropolitan Series Fund
BlackRock Capital Appreciation Portfolio
Financial Highlights
| | | | | | | | | | | | | | | | | | | | |
| Selected per share data | | | | | | | | | | | | | | | |
| | | Class A | |
| | | Year Ended December 31, | |
| | | 2013 | | | 2012 | | | 2011 | | | 2010 | | | 2009 | |
Net Asset Value, Beginning of Period | | $ | 28.45 | | | $ | 24.96 | | | $ | 27.45 | | | $ | 22.96 | | | $ | 16.91 | |
| | | | | | | | | | | | | | | | | | | | |
Income (Loss) from Investment Operations | | | | | | | | | | | | | | | | | | | | |
Net investment income (a) | | | 0.03 | | | | 0.26 | | | | 0.11 | | | | 0.05 | | | | 0.08 | |
Net realized and unrealized gain (loss) on investments | | | 9.63 | | | | 3.32 | | | | (2.55 | ) | | | 4.49 | | | | 6.10 | |
| | | | | | | | | | | | | | | | | | | | |
Total from investment operations | | | 9.66 | | | | 3.58 | | | | (2.44 | ) | | | 4.54 | | | | 6.18 | |
| | | | | | | | | | | | | | | | | | | | |
Less Distributions | | | | | | | | | | | | | | | | | | | | |
Distributions from net investment income | | | (0.26 | ) | | | (0.09 | ) | | | (0.05 | ) | | | (0.05 | ) | | | (0.13 | ) |
| | | | | | | | | | | | | | | | | | | | |
Total distributions | | | (0.26 | ) | | | (0.09 | ) | | | (0.05 | ) | | | (0.05 | ) | | | (0.13 | ) |
| | | | | | | | | | | | | | | | | | | | |
Net Asset Value, End of Period | | $ | 37.85 | | | $ | 28.45 | | | $ | 24.96 | | | $ | 27.45 | | | $ | 22.96 | |
| | | | | | | | | | | | | | | | | | | | |
Total Return (%) (b) | | | 34.22 | (c) | | | 14.37 | | | | (8.95 | ) | | | 19.82 | | | | 36.79 | |
| | | | | |
Ratios/Supplemental Data | | | | | | | | | | | | | | | | | | | | |
Gross ratio of expenses to average net assets (%) | | | 0.71 | | | | 0.73 | | | | 0.73 | | | | 0.77 | | | | 0.83 | |
Net ratio of expenses to average net assets (%) (d) | | | 0.70 | | | | 0.72 | | | | 0.72 | | | | 0.75 | | | | 0.82 | |
Ratio of net investment income to average net assets (%) | | | 0.10 | | | | 0.93 | | | | 0.41 | | | | 0.23 | | | | 0.42 | |
Portfolio turnover rate (%) | | | 160 | | | | 59 | | | | 83 | | | | 72 | | | | 84 | |
Net assets, end of period (in millions) | | $ | 1,917.9 | | | $ | 1,410.4 | | | $ | 1,314.6 | | | $ | 649.7 | | | $ | 633.2 | |
| | | | | | | | | | | | | | | | | | | | |
| | | Class B | |
| | | Year Ended December 31, | |
| | | 2013 | | | 2012 | | | 2011 | | | 2010 | | | 2009 | |
Net Asset Value, Beginning of Period | | $ | 27.94 | | | $ | 24.52 | | | $ | 26.99 | | | $ | 22.59 | | | $ | 16.61 | |
| | | | | | | | | | | | | | | | | | | | |
Income (Loss) from Investment Operations | | | | | | | | | | | | | | | | | | | | |
Net investment income (loss) (a) | | | (0.05 | ) | | | 0.18 | | | | 0.03 | | | | (0.01 | ) | | | 0.03 | |
Net realized and unrealized gain (loss) on investments | | | 9.47 | | | | 3.26 | | | | (2.50 | ) | | | 4.42 | | | | 6.01 | |
| | | | | | | | | | | | | | | | | | | | |
Total from investment operations | | | 9.42 | | | | 3.44 | | | | (2.47 | ) | | | 4.41 | | | | 6.04 | |
| | | | | | | | | | | | | | | | | | | | |
Less Distributions | | | | | | | | | | | | | | | | | | | | |
Distributions from net investment income | | | (0.19 | ) | | | (0.02 | ) | | | 0.00 | | | | (0.01 | ) | | | (0.06 | ) |
| | | | | | | | | | | | | | | | | | | | |
Total distributions | | | (0.19 | ) | | | (0.02 | ) | | | 0.00 | | | | (0.01 | ) | | | (0.06 | ) |
| | | | | | | | | | | | | | | | | | | | |
Net Asset Value, End of Period | | $ | 37.17 | | | $ | 27.94 | | | $ | 24.52 | | | $ | 26.99 | | | $ | 22.59 | |
| | | | | | | | | | | | | | | | | | | | |
Total Return (%) (b) | | | 33.90 | (c) | | | 14.07 | | | | (9.15 | ) | | | 19.47 | | | | 36.50 | |
| | | | | |
Ratios/Supplemental Data | | | | | | | | | | | | | | | | | | | | |
Gross ratio of expenses to average net assets (%) | | | 0.96 | | | | 0.98 | | | | 0.98 | | | | 1.02 | | | | 1.08 | |
Net ratio of expenses to average net assets (%) (d) | | | 0.95 | | | | 0.97 | | | | 0.97 | | | | 1.00 | | | | 1.07 | |
Ratio of net investment income (loss) to average net assets (%) | | | (0.16 | ) | | | 0.68 | | | | 0.12 | | | | (0.03 | ) | | | 0.18 | |
Portfolio turnover rate (%) | | | 160 | | | | 59 | | | | 83 | | | | 72 | | | | 84 | |
Net assets, end of period (in millions) | | $ | 190.5 | | | $ | 165.0 | | | $ | 153.7 | | | $ | 145.4 | | | $ | 111.9 | |
Please see following page for Financial Highlights footnote legend.
See accompanying notes to financial statements.
MSF-10
Metropolitan Series Fund
BlackRock Capital Appreciation Portfolio
Financial Highlights
| | | | | | | | | | | | | | | | | | | | |
| Selected per share data | | | | | | | | | | | | | | | |
| | | Class E | |
| | | Year Ended December 31, | |
| | | 2013 | | | 2012 | | | 2011 | | | 2010 | | | 2009 | |
Net Asset Value, Beginning of Period | | $ | 28.19 | | | $ | 24.73 | | | $ | 27.21 | | | $ | 22.77 | | | $ | 16.75 | |
| | | | | | | | | | | | | | | | | | | | |
Income (Loss) from Investment Operations | | | | | | | | | | | | | | | | | | | | |
Net investment income (loss) (a) | | | (0.02 | ) | | | 0.21 | | | | 0.06 | | | | 0.02 | | | | 0.05 | |
Net realized and unrealized gain (loss) on investments | | | 9.56 | | | | 3.30 | | | | (2.52 | ) | | | 4.45 | | | | 6.06 | |
| | | | | | | | | | | | | | | | | | | | |
Total from investment operations | | | 9.54 | | | | 3.51 | | | | (2.46 | ) | | | 4.47 | | | | 6.11 | |
| | | | | | | | | | | | | | | | | | | | |
Less Distributions | | | | | | | | | | | | | | | | | | | | |
Distributions from net investment income | | | (0.22 | ) | | | (0.05 | ) | | | (0.02 | ) | | | (0.03 | ) | | | (0.09 | ) |
| | | | | | | | | | | | | | | | | | | | |
Total distributions | | | (0.22 | ) | | | (0.05 | ) | | | (0.02 | ) | | | (0.03 | ) | | | (0.09 | ) |
| | | | | | | | | | | | | | | | | | | | |
Net Asset Value, End of Period | | $ | 37.51 | | | $ | 28.19 | | | $ | 24.73 | | | $ | 27.21 | | | $ | 22.77 | |
| | | | | | | | | | | | | | | | | | | | |
Total Return (%) (b) | | | 34.04 | (c) | | | 14.17 | | | | (9.06 | ) | | | 19.62 | | | | 36.62 | |
| | | | | |
Ratios/Supplemental Data | | | | | | | | | | | | | | | | | | | | |
Gross ratio of expenses to average net assets (%) | | | 0.86 | | | | 0.88 | | | | 0.88 | | | | 0.92 | | | | 0.98 | |
Net ratio of expenses to average net assets (%) (d) | | | 0.85 | | | | 0.87 | | | | 0.87 | | | | 0.90 | | | | 0.97 | |
Ratio of net investment income (loss) to average net assets (%) | | | (0.06 | ) | | | 0.78 | | | | 0.21 | | | | 0.07 | | | | 0.28 | |
Portfolio turnover rate (%) | | | 160 | | | | 59 | | | | 83 | | | | 72 | | | | 84 | |
Net assets, end of period (in millions) | | $ | 45.7 | | | $ | 41.9 | | | $ | 41.6 | | | $ | 51.9 | | | $ | 48.8 | |
| (a) | Per share amounts based on average shares outstanding during the period. |
| (b) | Total return does not reflect any insurance, sales, separate account or administrative charges of variable annuity or life insurance contracts or any additional expenses that contract owners may bear under their variable contracts. If these charges were included, the returns would be lower. |
| (c) | In 2013 0.03%, 0.03% and 0.03% of the Portfolio’s total return for Class A, Class B and Class E, respectively, consists of a voluntary reimbursement by the subadvisor (See Note 6 of the Notes to Financial Statements). Excluding this item, total return would have been 34.19%, 33.87% and 34.01% for Class A, Class B and Class E, respectively. |
| (d) | Net ratio of expenses to average net assets includes the effect of management fee waivers as detailed in Note 6 of the Notes to Financial Statements. |
See accompanying notes to financial statements.
MSF-11
Metropolitan Series Fund
BlackRock Capital Appreciation Portfolio
Notes to Financial Statements—December 31, 2013
1. Organization
Metropolitan Series Fund (the “Trust”) is organized as a Delaware statutory trust and registered under the Investment Company Act of 1940, as amended (the “1940 Act”), as an open-end management investment company. The Trust is currently comprised of thirty series, each of which operates as a distinct investment vehicle of the Trust. The portfolio included in this report is BlackRock Capital Appreciation Portfolio (the “Portfolio”), which is diversified. Shares in the Portfolio are not offered directly to the general public and are currently available only to separate accounts established by Metropolitan Life Insurance Company (“MetLife”) and other affiliated life insurance companies.
The Portfolio has registered and offers three classes of shares: Class A, B, and E shares. Shares of each Class of the Portfolio represent an equal pro rata interest in the Portfolio and generally give the shareholder the same voting, dividend, liquidation, and other rights. Investment income, realized and unrealized capital gains and losses, the common expenses of the Portfolio, and certain Portfolio-level expense reductions, if any, are allocated on a pro rata basis to each Class based on the relative net assets of each Class to the net assets of the Portfolio. Each Class of shares differs in its respective distribution plan and such distribution expenses are allocated to that Class.
2. Significant Accounting Policies
The preparation of financial statements in conformity with accounting principles generally accepted in the United States of America (“GAAP”) requires management to make estimates and assumptions that affect the reported amounts of assets and liabilities and disclosure of contingent assets and liabilities as of the date of the financial statements and the reported amounts of income and expenses during the reporting period. Actual results could differ from those estimates. In the preparation of these financial statements, management has evaluated events and transactions subsequent to December 31, 2013 through the date the financial statements were issued.
The following is a summary of significant accounting policies consistently followed by the Portfolio in the preparation of its financial statements.
Investment Valuation and Fair Value Measurements - Debt securities (other than short term obligations with a remaining maturity of sixty days or less), including corporate, convertible and municipal bonds and notes; obligations of the U.S. treasury and U.S. government agencies; sovereign issues; floating rate loans; and non-U.S. bonds, are generally valued on the basis of evaluated or composite bid quotations obtained from independent pricing services and/or brokers and dealers selected by MetLife Advisers, LLC (“MetLife Advisers” or the “Adviser”), an affiliate of MetLife, Inc., pursuant to authorization of the Board of Trustees of the Trust (the “Board” or “Trustees”). Such quotations utilize matrix pricing, which considers observable inputs including, among other things, issuer details, maturity dates, interest rates, yield curves, rates of prepayment, credit risks/spreads, default rates, reported trades, broker dealer quotes and quoted prices for similar securities. Securities that use similar valuation techniques and inputs as described above are generally categorized as Level 2 within the fair value hierarchy.
Mortgage and asset-backed securities are usually issued as separate tranches, or classes, of securities within each deal. These securities are also generally valued on the basis of evaluated or composite bid quotations obtained from independent pricing services and/or brokers and dealers selected by the Adviser pursuant to authorization of the Board. The pricing models for these securities usually consider tranche-level attributes, estimated cash flows and market-based yield spreads for each tranche and current market data, and incorporate deal collateral performance, as available. Mortgage and asset-backed securities that use similar valuation techniques and inputs as described above are generally categorized as Level 2 within the fair value hierarchy.
Short term obligations with a remaining maturity of sixty days or less are generally valued at amortized cost, which approximates fair market value, and are generally categorized as Level 2 within the fair value hierarchy.
Domestic and foreign equity securities, such as common stock, exchange-traded funds, rights, warrants, and preferred stock, that are traded on a securities exchange, are generally valued at their last sale price on the exchange or market in which they are principally traded on the valuation date, or, if no sales occurred on that day, at the last reported bid price. Equity securities traded over-the-counter are generally valued at the last reported sale price. Valuation adjustments may be applied to certain foreign equity securities that are traded solely on foreign exchanges that close before the close of the U.S. market to account for the market movement between the close of the foreign exchanges and the close of the U.S. market. The Portfolio may use a systematic fair valuation model provided by an independent third party to value securities principally traded in these foreign markets in order to adjust for possible stale pricing that may occur between the close of the foreign exchanges and the time of the Portfolio valuation. Foreign equity securities using these valuation adjustments are generally categorized as Level 2 within the fair value hierarchy. Equity securities that are actively traded, and have no valuation adjustments applied, are categorized as Level 1 within the fair value hierarchy. Other equity securities traded on inactive markets, or valued in reference to similar instruments traded on active markets, are generally categorized as Level 2 within the fair value hierarchy.
MSF-12
Metropolitan Series Fund
BlackRock Capital Appreciation Portfolio
Notes to Financial Statements—December 31, 2013—(Continued)
Investments in registered open-end management investment companies are valued at reported net asset value per share on the valuation date and are categorized as Level 1 within the fair value hierarchy.
Forward foreign currency exchange contracts are valued through an independent pricing service based on the mean between closing bid and ask prices of the forward currency rates in the London foreign exchange markets on a daily basis as provided by a reliable bank or dealer. These contracts are generally categorized as Level 2 within the fair value hierarchy.
Options, whether on securities, indices, futures contracts, or otherwise, traded on exchanges are valued at the last sale price available as of the close of business on the valuation date or, if there is no such price available, at the mean between the last reported bid and ask prices. These types of options are categorized as Level 1 within the fair value hierarchy. Futures contracts, which are traded on commodity exchanges, are valued at their closing prices as of the close of such exchanges and are categorized as Level 1 within the fair value hierarchy.
Options and futures contracts that are traded over-the-counter are generally valued on the basis of quotations provided by broker-dealers or prices provided by pricing service providers who use a series of techniques, including simulation pricing models, to determine the value of the contracts. The pricing models use inputs that are observed from actively quoted markets such as issuer details, indices, spreads, interest rates, yield curves, credit curves, measures of volatility and exchange rates. These contracts are generally categorized as Level 2 within the fair value hierarchy.
If no current market value quotation or other observable inputs are readily available or market value quotations are deemed to be unreliable for a security, the fair value of the security will be determined in accordance with procedures approved by and under the general supervision of the Board. In such a circumstance, the Board has delegated the determination of the fair value of a security to a Valuation Committee (“Committee”) of MetLife Advisers. The Committee provides general pricing oversight and fair value pricing determinations related to portfolio securities and meets on a regular basis to review reports relating to the valuation of the securities in the Portfolio. The Board has delegated to State Street Bank and Trust Company, the Trust’s custodian (“custodian”), the responsibility for calculating the net asset values (“NAVs”) of the Trust’s Portfolios. The Committee is responsible for overseeing the calculation of the NAVs of the Portfolios by the custodian. The Committee also periodically reviews pricing vendors, including the vendor providing fair value pricing for the Portfolio’s foreign securities, and is responsible for overseeing the correction of pricing errors and addressing other pricing issues that arise in the ordinary course of business, such as making real-time fair value determinations, as necessary.
No single standard for determining the fair value of a security can be set forth because fair value depends upon the facts and circumstances with respect to each security. Information relating to any relevant factors may be obtained by the Committee from any appropriate source, including the subadviser of the Portfolio, the custodian, a pricing service, market maker and/or broker for such security or the issuer. Appropriate methodologies for determining fair value under particular circumstances may include: matrix pricing, comparisons of securities with comparable characteristics, value based on multiples of earnings, discount from market price of similar marketable securities or a combination of these and other methods. The Committee maintains a detailed report tracking each fair-valued security that compares the fair value price to the next available trade, vendor or broker price, and provides information on how close the fair value price was to the next quoted price. The Committee reviews a summary of such report monthly. On a quarterly basis, the Board is provided with the following for consideration and ratification or adjustment: (1) a memorandum summarizing the actions taken by the Committee in the prior quarter; and (2) a list of the Portfolio’s securities as of the most recent quarter-end for which market quotations were not readily available.
Investment Transactions and Related Investment Income - Portfolio security transactions are recorded on the trade date. Dividend income is recorded on the ex-dividend date or, for certain foreign securities, when notified. Interest income, which includes amortization of premium and accretion of discount on debt securities, is recorded on the accrual basis. Realized gains and losses on investments are determined on the identified cost basis, which is the same basis used for federal income tax purposes. Foreign income and foreign capital gains on some foreign securities may be subject to foreign taxes, which are accrued as applicable. These foreign taxes have been provided for in accordance with the Portfolio’s understanding of the applicable countries’ tax rules and rates.
Foreign Currency Translation - The books and records of the Portfolio are maintained in U.S. dollars. The values of securities, currencies, and other assets and liabilities denominated in currencies other than the U.S. dollar are translated into U.S. dollars based upon foreign exchange rates prevailing at the end of the period. Purchases and sales of investment securities, income, and expenses are translated on the respective dates of such transactions. Because the values of investment securities are translated at the foreign exchange rates prevailing at the end of the period, that portion of the results of operations arising from changes in exchange rates and that portion of the results of operations reflecting fluctuations arising from changes in market prices of the investment securities are not separated. Such fluctuations are included in the net realized and unrealized gain or loss on investments.
Net realized foreign exchange gains or losses arise from activity in forward foreign currency exchange contracts, sales of foreign currency, currency gains or losses realized between the trade and settlement dates on securities transactions, and the difference between the amounts of dividends, interest, and foreign withholding taxes recorded by the Portfolio and the U.S. dollar equivalent of
MSF-13
Metropolitan Series Fund
BlackRock Capital Appreciation Portfolio
Notes to Financial Statements—December 31, 2013—(Continued)
the amounts actually received or paid by the Portfolio. Net unrealized foreign exchange gains and losses arise from changes in the value of assets and liabilities, other than investment securities, resulting from changes in foreign exchange rates.
Income Taxes - It is the Portfolio’s policy to comply with the requirements of the Internal Revenue Code of 1986, as amended, and regulations thereunder, applicable to regulated investment companies and to distribute, with respect to each taxable year, all of its taxable income to shareholders. Therefore, no federal income tax provision is required. The Portfolio files U.S. federal tax returns. No income tax returns are currently under examination. The Portfolio’s federal tax returns for the prior three fiscal years remain subject to examination by the Internal Revenue Service. As of December 31, 2013, the Portfolio had no uncertain tax positions that would require financial statement recognition, or de-recognition or disclosure.
Dividends and Distributions to Shareholders - The Portfolio records dividends and distributions on the ex-dividend date. Net realized gains from security transactions (if any) are generally distributed annually to shareholders. The timing and characterization of certain income and capital gains distributions are determined in accordance with federal tax regulations that may differ from GAAP. Permanent book and tax basis differences relating to shareholder distributions will result in reclassification between under/over distributed net investment income, accumulated net realized gains/losses, and paid-in surplus. Book-tax differences are primarily due to broker commission recapture reclasses and foreign currency transactions. These adjustments have no impact on net assets or the results of operations.
Securities Lending - The Portfolio may lend its portfolio securities to certain qualified brokers who borrow securities in order to complete certain securities transactions. By lending its portfolio securities, the Portfolio attempts to increase its net investment income through the receipt of income on collateral held from securities on loan. Any gain or loss in the market price of the loaned securities that might occur and any interest earned or dividends declared during the term of the loan would accrue to the account of the Portfolio.
The Trust has entered into a securities lending arrangement with the custodian. Under this arrangement, the custodian is authorized to loan portfolio securities on the Portfolio’s behalf. In exchange, the Portfolio receives either cash or securities as collateral against the loaned securities. The Portfolio receives collateral at least equal to 102% of the market value of the loaned securities (105% for foreign equity securities), at each loan’s inception. Collateral representing at least 100% of the market value of the loaned securities must be maintained for the duration of the loan. A liability for cash collateral is reflected on the Statement of Assets and Liabilities, and is categorized as Level 2 within the fair value hierarchy. Cash collateral is generally invested in the State Street Navigator Securities Lending MET Portfolio (the “Navigator Portfolio”), a series of the State Street Navigator Securities Lending Trust that is managed by an affiliate of the custodian. The Navigator Portfolio is a registered money market fund that invests in a variety of high-quality, U.S. dollar-denominated instruments. If the market value of the collateral at the close of trading on a business day is less than 100% of the market value of the loaned securities at the close of trading on that day, the borrower shall be required to deliver, by the close of business on the following business day, an additional amount of collateral, so that the total amount of posted collateral is equal to at least 100% of the market value of all the loaned securities as of such preceding day. A portion of net income (income after the deduction of expenses and fees of the Navigator Portfolio) on the collateral is rebated to the borrower of the securities and the remainder is split between the custodian and the Portfolio. On loans collateralized by U.S. Treasuries, a fee is received from the borrower and is allocated between the Portfolio and the custodian. The risks associated with lending portfolio securities include, but are not limited to, possible delays in receiving additional collateral or in the recovery of the loaned securities, possible loss of rights in the collateral should the borrower fail financially, as well as risk of loss in the value of the collateral or the value of the investments made with the collateral. Income received by the Portfolio in securities lending transactions during the year ended December 31, 2013 is reflected as Securities lending income on the Statement of Operations. Any outstanding loans by the Portfolio at December 31, 2013 are disclosed in the footnotes to the Schedule of Investments.
Repurchase Agreements - The Portfolio may enter into repurchase agreements, under the terms of a Master Repurchase Agreement, with selected commercial banks and broker-dealers, under which the Portfolio acquires securities as collateral and agrees to resell the securities at an agreed upon time and at an agreed-upon price. The Portfolio, through the custodian or a subcustodian, receives delivery of the underlying securities collateralizing any repurchase agreements. The Portfolio requires the custodian to take possession, to have legally segregated in the Federal Reserve Book Entry System, or to have segregated within the custodian’s vault, all securities held as collateral for repurchase agreements. It is the Portfolio’s policy that the market value of the collateral be at least equal to 100% of the repurchase price in the case of a repurchase agreement of one-day duration and at least equal to 102% of the repurchase price in the case of all other repurchase agreements. In the event of default or failure by a party to perform an obligation in connection with any repurchase transaction, the Master Repurchase Agreement gives the non-defaulting party the right to set-off claims and to apply property held by it in connection with any repurchase transaction against obligations owed to it.
At December 31, 2013, the Portfolio had investments in repurchase agreements with a gross value of $602,000, which is included as part of investments at value on the Statement of Assets and Liabilities. The value of the related collateral exceeded the value of the repurchase agreements at December 31, 2013.
Directed Brokerage Agreement - The Trust has entered into a directed brokerage arrangement with State Street Global Markets (“SSGM”). Under this arrangement, the Portfolio directs certain trades to SSGM in return for a recapture credit. SSGM issues a cash
MSF-14
Metropolitan Series Fund
BlackRock Capital Appreciation Portfolio
Notes to Financial Statements—December 31, 2013—(Continued)
rebate to the Portfolio. Amounts paid to the Portfolio are shown separately as broker commission recapture on the Statement of Operations of the Portfolio. Additionally, these amounts have been excluded from the calculation of the net ratio of expenses to average net assets presented in the Financial Highlights for each share class.
3. Investments in Derivative Instruments
Forward Foreign Currency Exchange Contracts - The Portfolio may enter into forward foreign currency exchange contracts to obtain investment exposure, enhance return or hedge or protect its portfolio holdings against the risk of future movements in certain foreign currency exchange rates. When entering into these contracts, the Portfolio agrees to receive or deliver a fixed quantity of foreign currency for an agreed-upon price on an agreed-upon future date. These contracts are valued daily and the Portfolio’s net equity therein, representing unrealized gain or loss on the contracts as measured by the difference between the forward foreign exchange rates at the dates of entry into the contracts and the forward foreign exchange rates at the valuation date, is included in the Statement of Assets and Liabilities. When a contract is closed, the Portfolio recognizes a realized gain or loss equal to the difference between the value of the contract at the time it was opened and the value at the time it was closed.
Realized and unrealized gains and losses on forward foreign currency exchange contracts are included in the Statement of Operations. These contracts involve market and/or credit risk in excess of the amount recognized in the Statement of Assets and Liabilities. The use of forward foreign currency exchange contracts does not eliminate fluctuations in the underlying prices of the securities of the Portfolio, but it does establish a rate of exchange that can be achieved in the future. Although forward foreign currency exchange contracts may limit the risk of loss due to a decline in the value of the currency holdings, they also limit any potential gain that might result should the value of the currency increase. In addition, the Portfolio could be exposed to losses if the counterparties to the contracts are unable to meet the terms of the contracts. The Portfolio’s maximum potential loss from such contracts is the aggregate face value in U.S. dollars at the time the contract was opened.
Futures Contracts - The Portfolio may buy and sell futures contracts as a hedge, to maintain investment exposure to a target asset class or to enhance return. The Portfolio may be subject to fluctuations in equity prices, interest rates, commodity prices, and foreign currency exchange rates in the normal course of pursuing its investment objective. Futures contracts are standardized agreements to buy or sell a security, or deliver a final cash settlement price in connection with an index, interest rate, currency, or other asset. The Portfolio must deposit an amount (“initial margin”) equal to a certain percentage of the face value of the futures contract. The initial margin may be in the form of cash or securities, which is returned when the Portfolio’s obligations under the contract have been satisfied. If cash is deposited as the initial margin, it is shown as cash collateral on the Statement of Assets and Liabilities. Futures contracts are marked-to-market daily, and subsequent payments (“variation margin”) are made or received by the Portfolio depending on whether unrealized gains or losses are incurred. These amounts are reflected as receivables or payables on the Statement of Assets and Liabilities and as a component of net change in unrealized appreciation/depreciation on the Statement of Operations. When the contract is closed or expires, the Portfolio records a realized gain or loss equal to the difference between the value of the contract at the time it was opened and the value at the time it was closed. Risks of entering into futures contracts (and related options) include the possibility that the market for these instruments may be illiquid and that a change in the value of the contract or option may not correlate perfectly with changes in the value of the underlying instrument. Futures contracts are exchange-traded and the exchange’s clearinghouse, as counterparty to all exchange-traded futures, guarantees the futures contracts against default. For over-the-counter futures the Portfolio’s ability to terminate the positions may be more limited than in the case of exchange-traded positions and may also involve the risk that securities dealers participating in such transactions would fail to meet their obligations to the Portfolio.
At December 31, 2013, the Portfolio had the following derivatives, categorized by risk exposure:
| | | | | | |
| | | Asset Derivatives | |
Risk Exposure | | Statement of Assets & Liabilities Location | | Fair Value | |
| Foreign Exchange | | Unrealized appreciation on forward foreign currency exchange contracts | | $ | 650,605 | |
| | | | | | |
The Portfolio is required to disclose the impact of offsetting assets and liabilities represented in the Statement of Assets and Liabilities to enable users of the financial statements to evaluate the effect or potential effect of netting arrangements on its financial position for recognized assets and liabilities.
The following table presents the Portfolio’s derivative assets by counterparty net of amounts available for offset under a master netting agreement (“MNA”), or similar agreement, and net of the related collateral received by the Portfolio as of December 31, 2013.
| | | | | | | | | | | | | | | | |
Counterparty | | Derivative Assets
subject to a MNA
by Counterparty | | | Financial
Instruments
available for offset | | | Collateral
Received† | | | Net
Amount* | |
Barclays Bank plc | | $ | 650,605 | | | $ | — | | | $ | — | | | $ | 650,605 | |
| | | | | | | | | | | | | | | | |
| | * | Net amount represents the net amount receivable from the counterparty in the event of default. |
| | † | In some instances, the actual collateral received and/or pledged may be more than the amount shown here due to overcollateralization. |
MSF-15
Metropolitan Series Fund
BlackRock Capital Appreciation Portfolio
Notes to Financial Statements—December 31, 2013—(Continued)
Transactions in derivative instruments during the year ended December 31, 2013 were as follows:
| | | | | | | | | | | | |
Statement of Operations Location—Net Realized Gain (Loss) | | Equity | | | Foreign
Exchange | | | Total | |
Futures contracts | | $ | 188,096 | | | $ | — | | | $ | 188,096 | |
| | | | | | | | | | | | |
| | | |
Statement of Operations Location—Net Change in Unrealized Appreciation (Depreciation) | | Equity | | | Foreign
Exchange | | | Total | |
Forward foreign currency transactions | | $ | — | | | $ | 650,605 | | | $ | 650,605 | |
| | | | | | | | | | | | |
For the year ended December 31, 2013, the average amount or number per contract outstanding for each derivative type was as follows:
| | | | |
Derivative Description | | Average
Notional Par or
Face Amount‡ | |
Forward Foreign currency transactions (a) | | $ | 59,068,866 | |
Futures contracts long (a) | | | 67,180 | |
| | ‡ | Averages are based on activity levels during 2013. |
| | (a) | Average notional amount reflects activity over a period outstanding (less than one month). |
4. Certain Risks
Market Risk: In the normal course of business, the Portfolio invests in securities and enters into transactions where risks exist due to fluctuations in the market (market risk) or failure of the other party to a transaction to perform (credit and counterparty risk). The value of securities held by the Portfolio may decline in response to certain events, including those directly involving the companies whose securities are owned by the Portfolio; conditions affecting the general economy; overall market changes; local, regional or global political, social or economic instability; currency, interest rate, and price fluctuations.
Credit and Counterparty Risk: The Portfolio may be exposed to counterparty risk, or the risk that an entity with which the Portfolio has unsettled or open transactions may default. The potential loss could exceed the value of the financial assets and liabilities recorded in the financial statements. Financial assets that potentially expose the Portfolio to credit and counterparty risk consist principally of cash due from counterparties and investments. The Portfolio manages counterparty risk by entering into agreements only with counterparties that it believes have the financial resources to honor their obligations and by monitoring the financial stability of those counterparties. The Portfolio’s investment adviser attempts to mitigate counterparty risk by (i) periodically assessing the creditworthiness of its trading partners, (ii) monitoring and/or limiting the amount of its net exposure to each individual counterparty based on its assessment, and (iii) requiring collateral from the counterparty for certain transactions. In order to preserve certain safeguards for non-standard settlement trades, the Portfolio restricts its exposure to credit and counterparty losses by entering into master netting agreements with counterparties (approved brokers) with whom it undertakes a significant volume of transactions. Master Agreements govern the terms of certain transactions, and reduce the counterparty risk associated with relevant transactions by specifying credit protection mechanisms and providing standardization that improves legal certainty. Master Agreements can also help limit counterparty risk by specifying collateral posting arrangements at pre-arranged exposure levels. Collateral requirements may differ by type of derivative or investment, as applicable. Collateral or margin requirements are set by the broker or exchange clearing house for exchange traded derivatives (e.g., futures contracts and exchange traded options) while collateral terms are contract specific for over-the-counter traded derivatives (e.g., forward foreign currency exchange contracts, swap agreements and over-the-counter options).
For derivatives traded under an International Swaps and Derivatives Association, Inc. Master Agreement (“ISDA Master Agreement”) or similar master agreement, the collateral requirements are netted across all transactions traded under such agreement and one amount is posted from one party to the other to collateralize such obligations. The ISDA Master Agreement gives each party to the agreement the right to terminate all transactions traded under such agreement if there is a certain deterioration in the credit quality of the other party. The ISDA Master Agreement gives the Portfolio the right, upon an event of default by the applicable counterparty or a termination of the agreement, to close out all transactions traded under such agreement and to net amounts owed under each transaction to one net amount payable by one party to the other. This right to close out and net payments across all transactions traded under the ISDA Master Agreement could result in a reduction of the Portfolio’s credit risk to such counterparty equal to any amounts payable by the Portfolio under the applicable transactions, if any. However, absent an event of default by the counterparty or a termination of the agreement, the ISDA Master Agreement does not result in an offset of reported amounts of assets and liabilities in the Statement of Assets and Liabilities across transactions between the Portfolio and the applicable counterparty. The enforceability of the right to offset may vary by jurisdiction. Cash collateral that has been pledged to cover obligations of the Portfolio under
MSF-16
Metropolitan Series Fund
BlackRock Capital Appreciation Portfolio
Notes to Financial Statements—December 31, 2013—(Continued)
derivative contracts, if any, will be reported separately in the Statement of Assets and Liabilities. Securities pledged as collateral, if any, for the same purpose are noted in the Schedule of Investments.
Repurchase and reverse repurchase agreements are primarily executed under Global Master Repurchase Agreements (“GMRAs”) or Master Repurchase Agreements (“MRAs”), which provide the rights to set-off. Each repurchase and reverse repurchase agreement is initially collateralized at the transaction level. In the event of default, the total market value exposure will be offset against collateral exchanged to date, which would result in a net receivable/(payable) that would be due from/to the counterparty.
Master Securities Forward Transaction Agreements (“Master Forward Agreements”) govern the considerations and factors surrounding the settlement of certain forward settling transactions, such as To-Be-Announced securities, delayed-delivery or secured borrowings transactions by and between the Portfolio and select counterparties. The Master Forward Agreements maintain provisions for, among other things, initiation and confirmation, payment and transfer, events of default, termination, and maintenance of collateral.
Customer Account Agreements and related addendums govern cleared derivatives transactions such as futures, options on futures, and cleared OTC derivatives. Cleared derivative transactions require posting of initial margin as determined by each relevant clearing agency which is segregated at a broker account registered with the Commodities Futures Trading Commission (CFTC), or the applicable regulator. In the U.S., counterparty risk is significantly reduced as creditors of the futures broker do not have claim to Portfolio assets in the segregated account. Additionally, portability of exposure in the event of default further reduces risk to the Portfolio. Variation margin, or changes in market value, are exchanged daily, but may not be netted between futures and cleared OTC derivatives.
Additional risks associated with each type of investment are described above within the respective security type notes. The Portfolio’s prospectus includes a discussion of the principal risks of investing in the Portfolio.
5. Investment Transactions
Aggregate cost of purchases and proceeds of sales of investment securities, excluding short-term securities, for the year ended December 31, 2013 were as follows:
| | | | | | | | | | | | |
Purchases | | | Sales | |
U.S. Government | | Non U.S. Government | | | U.S. Government | | | Non U.S. Government | |
| $0 | | $ | 2,892,299,634 | | | $ | 0 | | | $ | 2,869,481,817 | |
The Portfolio engaged in security transactions with other accounts managed by BlackRock Advisors, LLC that amounted to $1,591,998 in purchases and $1,592,350 in sales of investments, which are included above.
During the year ended December 31, 2013, the Portfolio engaged in security transactions with other affiliated portfolios. These amounted to $78,463,509 in purchases of investments, which are included above.
6. Investment Management Fees and Other Transactions with Affiliates
Investment Management Agreement - MetLife Advisers is the investment adviser to the Portfolio. The Trust has entered into an investment management agreement with MetLife Advisers with respect to the Portfolio. For providing investment management services to the Portfolio, MetLife Advisers receives monthly compensation at the following annual rates:
| | | | | | |
Management
Fees earned by
MetLife Advisers
for the year ended
December 31, 2013 | | % per annum | | | Average daily net assets |
| $12,538,309 | | | 0.730 | % | | Of the first $1 billion |
| | | 0.650 | % | | On amounts in excess of $1 billion |
MetLife Advisers has entered into an investment subadvisory agreement with respect to the Portfolio. BlackRock Advisors, LLC is compensated by MetLife Advisers to provide subadvisory services for the Portfolio.
Management Fee Waivers - Pursuant to an expense agreement, MetLife Advisers has agreed, for the period April 29, 2013 through April 27, 2014, to reduce its advisory fees set out above under “Investment Management Agreement” for each class of the Portfolio as follows:
| | | | |
% per annum | | Average daily net assets | |
| 0.025% | | Over $ | 300 million and less than $1 billion | |
MSF-17
Metropolitan Series Fund
BlackRock Capital Appreciation Portfolio
Notes to Financial Statements—December 31, 2013—(Continued)
An identical expense agreement was in place for the period April 30, 2012 through April 28, 2013. Amounts waived for the year ended December 31, 2013 are shown as management fee waivers in the Statement of Operations.
Certain officers and trustees of the Trust may also be officers of the Adviser; however, such officers and trustees receive no compensation from the Trust.
During the year ended December 31, 2013, the Subadvisor voluntarily reimbursed the Portfolio for certain trading costs during a transition of the Portfolio. This reimbursement is reflected as net increase from payments by affiliates in the Statement of Operations.
Transfer Agency Agreement - MetLife serves as the transfer agent for the Trust. MetLife receives no fees for its services to the Trust under the transfer agency agreement.
Distribution and Service Fees - The Trust has a distribution agreement with MetLife Investors Distribution Company (“MIDC” or the “Distributor”) in which MIDC serves as the distributor for the Portfolio’s Class A, B and E Shares. MIDC is a wholly-owned subsidiary of MetLife Investors Group, Inc., an affiliate of the Adviser. The Trust has also adopted a Distribution and Service Plan under Rule 12b-1 of the 1940 Act for the Portfolio’s Class B and E Shares. Under the Distribution and Service Plan, the Class B and E Shares of the Portfolio pay a fee to compensate the Insurance Companies (or their affiliates) and other broker-dealers and financial intermediaries involved in the offer and sale of Portfolio shares for promoting or selling and servicing the Class B and E Shares. The fees under the Distribution and Service Plan for each class of the Portfolio’s shares are calculated as a percentage of the Portfolio’s average daily net assets that are attributable to that Class. Currently, the fee is 0.25% per year for Class B Shares and 0.15% per year for Class E Shares. Amounts incurred by the Portfolio for the year ended December 31, 2013 are shown as Distribution and service fees in the Statement of Operations.
Deferred Trustee Compensation - Each Trustee who is not currently an employee of the Adviser or any of its affiliates receives compensation from the Trust for his or her service to the Trust. A deferred compensation plan (the “Plan”) is available to the Trustees on a voluntary basis. Deferred amounts remain in the Trust until distributed in accordance with the provisions of the Plan. The value of a participating Trustee’s deferral account is based on theoretical investments of deferred amounts, on the normal payment dates in certain portfolios of the Trust or Met Investors Series Trust, an affiliate of the Trust, as designated by the participating Trustee. Changes in the value of participants’ deferral accounts are reflected as Trustees’ fees and expenses in the Statement of Operations. The portion of the accrued obligations allocated to the Portfolio under the Plan is reflected as Deferred trustees’ fees in the Statement of Assets and Liabilities.
7. Contractual Obligations
Under the Trust’s organizational documents, its officers and Trustees may be indemnified against certain liabilities and expenses arising out of the performance of their duties to the Trust. Additionally, the Trust has a variety of indemnification obligations under contracts with its service providers. The Trust’s maximum exposure under these arrangements is unknown, as this would involve future claims that may be made against the Trust that have not yet occurred.
8. Income Tax Information
The tax character of distributions paid for the periods ended December 31, 2013 and 2012 was as follows:
| | | | | | | | | | | | | | | | | | | | |
Ordinary Income | | | Long-Term Capital Gain | | | Total | |
2013 | | 2012 | | | 2013 | | | 2012 | | | 2013 | | | 2012 | |
| $14,533,902 | | $ | 4,614,492 | | | $ | — | | | $ | — | | | $ | 14,533,902 | | | $ | 4,614,492 | |
As of December 31, 2013, the components of distributable earnings (accumulated losses) on a federal income tax basis were as follows:
| | | | | | | | | | | | | | | | |
Undistributed
Ordinary
Income | | Undistributed
Long-Term
Capital Gain | | | Net
Unrealized
Appreciation | | | Loss Carryforwards | | | Total | |
$1,618,167 | | $ | — | | | $ | 452,085,929 | | | $ | (3,511,856 | ) | | $ | 450,192,240 | |
The Portfolio utilizes the provisions of the federal income tax laws that provide for the carryforward of capital losses for prior years, offsetting such losses against any future realized capital gains. Under the Regulated Investment Company Modernization Act of 2010 (the “Act”), net capital losses recognized after December 22, 2010 may be carried forward indefinitely and their character is retained as short-term and/or long-term losses. Previously, net capital losses were carried forward for up to eight years and treated as short-term losses. As a transition rule, the Act requires that post-enactment net capital losses be used before pre-enactment net capital losses.
As of December 31, 2013, there were no post-enactment accumulated capital losses and the pre-enactment accumulated capital loss carryforwards expiring on December 31, 2017 were $3,511,856.
During the year ended December 31, 2013, the Portfolio utilized capital loss carryforwards of $285,463,710.
MSF-18
Metropolitan Series Fund
BlackRock Capital Appreciation Portfolio
Report of Independent Registered Public Accounting Firm
To the Shareholders of BlackRock Capital Appreciation Portfolio and the Board of Trustees of Metropolitan Series Fund:
We have audited the accompanying statement of assets and liabilities, including the schedule of investments, of BlackRock Capital Appreciation Portfolio, one of the portfolios constituting Metropolitan Series Fund, (the “Trust”) as of December 31, 2013, and the related statement of operations for the year then ended, the statements of changes in net assets for each of the two years in the period then ended, and the financial highlights for each of the five years in the period then ended. These financial statements and financial highlights are the responsibility of the Trust’s management. Our responsibility is to express an opinion on these financial statements and financial highlights based on our audits.
We conducted our audits in accordance with the standards of the Public Company Accounting Oversight Board (United States). Those standards require that we plan and perform the audit to obtain reasonable assurance about whether the financial statements and financial highlights are free of material misstatement. The Trust is not required to have, nor were we engaged to perform, an audit of its internal control over financial reporting. Our audits included consideration of internal control over financial reporting as a basis for designing audit procedures that are appropriate in the circumstances, but not for the purpose of expressing an opinion on the effectiveness of the Trust’s internal control over financial reporting. Accordingly, we express no such opinion. An audit also includes examining, on a test basis, evidence supporting the amounts and disclosures in the financial statements, assessing the accounting principles used and significant estimates made by management, as well as evaluating the overall financial statement presentation. Our procedures included confirmation of securities owned as of December 31, 2013, by correspondence with the custodian and brokers; where replies were not received from brokers, we performed other auditing procedures. We believe that our audits provide a reasonable basis for our opinion.
In our opinion, the financial statements and financial highlights referred to above present fairly, in all material respects, the financial position of the BlackRock Capital Appreciation Portfolio of Metropolitan Series Fund, as of December 31, 2013, the results of its operations for the year then ended, the changes in its net assets for each of the two years in the period then ended, and the financial highlights for each of the five years in the period then ended, in conformity with accounting principles generally accepted in the United States of America.
Deloitte & Touche LLP
Boston, Massachusetts
February 26, 2014
MSF-19
Metropolitan Series Fund
Trustees and Officers of Metropolitan Series Fund
The Trustees and executive officers of the Trust, their ages and their principal occupations during the past five years are set forth below. Unless otherwise indicated, the business address of each is One Financial Center, Boston, MA 02111. Each Trustee who is deemed an “interested person,” as such term is defined in the 1940 Act, is indicated by an asterisk. Those Trustees who are not “interested persons” as defined in the 1940 Act are referred to as “Independent Trustees.” Additional information about the Trustees is available in the Statement of Additional Information, which is available without charge, upon request, by calling (800) 848-3854.
Trustees of the Trust
| | | | | | | | | | |
Name and Age | | Position(s)
Held with
Registrant | | Term of Office
and Length of
Time Served | | Principal Occupation(s) During the Past 5
Years(1) | | Number of
Portfolios
in Fund
Complex(2)
overseen | | Other Directorships Held
by Trustee During the
Past 5 Years(1) |
| Interested Trustee | | | | | | | | | | |
| Elizabeth M. Forget* (47) | | Trustee, Chairman of the Board, President and Chief Executive Officer | | Indefinite;
From
May
2006
(President
and Chief
Executive
Officer)/
August
2006
(Trustee
and
Chairman
of the
Board) to
present | | Senior Vice President, MetLife Inc.; President, MetLife Advisers, LLC and a predecessor company. | | 79 | | Trustee, Met Investors Series Trust (the “MIST Trust”);** various MetLife-affiliated boards. |
| | | | | |
| Independent Trustees | | | | | | | | | | |
| Stephen M. Alderman (54) | | Trustee | | Indefinite;
From
April
2012 to
present | | Shareholder in the law firm of Garfield & Merel, Ltd. | | 79 | | Trustee, MIST Trust;** Director, International Truck Leasing Corp. |
| | | | | |
| Robert J. Boulware (57) | | Trustee | | Indefinite;
From
April
2012 to
present | | Managing Director, Pilgrim Funds, LLC (private equity fund). | | 79 | | Trustee, MIST Trust;** Trustee, Vertical Capital Income Fund (closed-end fund); Director, Gainsco, Inc. (auto insurance). |
| | | | | |
| Susan C. Gause (61) | | Trustee | | Indefinite;
From
April
2012 to
present | | Private Investor. | | 79 | | Trustee, MIST Trust;** Trustee, HSBC Funds. |
| | | | | |
| Nancy Hawthorne (62) | | Trustee | | Indefinite;
From
May
2003 to
present | | Chief Executive Officer, Clerestory LLC (corporate advisor). | | 79 | | MIST Trust;** Director, THL Credit, Inc.**; Director, Avid Technology, Inc.** |
| | | | | |
| Barbara A. Nugent (57) | | Trustee | | Indefinite;
From
January
2014 to
present | | President, True North Board Governance, LLC (consulting); until 2014, partner in the law firm of Stradley Ronon Stevens & Young, LLP. | | 79 | | Trustee, MIST Trust**; Director, Episcopal Healthcare Foundation; until 2014, member, Mutual Fund Directors Forum Advisory Board. |
MSF-20
Metropolitan Series Fund
Trustees and Officers of Metropolitan Series Fund—(Continued)
| | | | | | | | | | |
Name and Age | | Position(s)
Held with
Registrant | | Term of Office
and Length of
Time Served | | Principal Occupation(s) During the Past 5
Years(1) | | Number of
Portfolios
in Fund
Complex(2)
overseen | | Other Directorships Held
by Trustee During the
Past 5 Years(1) |
| Keith M. Schappert (62) | | Trustee | | Indefinite;
From
August
2009 to
present | | Principal, Schappert Consulting LLC (asset management consulting). | | 79 | | Trustee, MIST Trust;** Director, The Commonfund for Nonprofit Organizations; until 2011, Director, Trilogy Global Advisors; Director, Mirae Asset Discovery Funds,** Director, Calamos Investments. |
| | | | | |
| Linda B. Strumpf (66) | | Trustee | | Indefinite;
From
May
2000 to
present | | Chair of the Investment Committee, Leona M. and Harry B. Helmsley Charitable Trust; until 2011, Chief Investment Officer, Leona M. and Harry B. Helmsley Charitable Trust. | | 79 | | Since 2012, Trustee, MIST Trust,** Trustee and Member of Investment Committee, The Pennsylvania State University. |
| | | | | |
| Dawn M. Vroegop (47) | | Trustee | | Indefinite;
From
May
2009 to
present | | Private Investor. | | 79 | | Trustee, MIST Trust,** Trustee, Driehaus Mutual Funds; Director and Investment Committee Chair, City College of San Francisco Foundation. |
Executive Officers of the Trust
| | | | | | |
Name and Age | | Position(s) Held with
Registrant | | Term of Office
and Length of
Time Served | | Principal Occupation(s) During Past 5 Years(1) |
| Elizabeth M. Forget (47) | | President, Chief Executive Officer, Trustee and Chairman of the Board | | From May
2006 (President
and Chief
Executive
Officer)/
August 2006
(Trustee and
Chairman of
the Board) to
present | | See principal occupation information in the table above. |
| | | |
| Jeffrey L. Bernier (42) | | Vice President | | From February
2008 to present | | Vice President, MetLife, Inc.; Senior Vice President, MetLife Advisers, LLC and a predecessor company. |
| | | |
| Peter H. Duffy (58) | | Chief Financial Officer and Treasurer | | From November
2000 to present | | Senior Vice President, MetLife Advisers, LLC; Vice President, MetLife, Inc. |
| | | |
| Andrew L. Gangolf (59) | | Secretary | | From May
2011to present | | Senior Vice President, MetLife Advisers, LLC; Senior Vice President & Assistant General Counsel, AllianceBerstein Investments, Inc. |
| | | |
| Jeffrey P. Halperin (46) | | Chief Compliance Officer | | From November
2005 to present | | Vice President, MetLife, Inc.; Chief Compliance Officer, MIST; Chief Compliance Officer, MSF Trust; Chief Compliance Officer, MetLife Advisers, LLC and a predecessor company; Chief Compliance Officer, MetLife Investment Management, LLC (formerly MetLife Investment Advisors Company, LLC). |
| | | |
| Alan C. Leland, Jr. (61) | | Vice President | | From February
2005 to present | | Treasurer and Chief Financial Officer, MetLife Advisers, LLC; Vice President, MetLife Group Inc.; Vice President, MetLife, Inc. |
| * | Ms. Forget is an “interested person” of the Trust because of her positions with MetLife Advisers, LLC and her ownership of securities issued by MetLife, Inc., the ultimate parent company of MetLife Advisers, LLC. |
| ** | Indicates a directorship with a registered investment company or a company subject to the reporting requirements of the Securities Exchange Act of 1934, as amended. |
| (1) | Previous positions during the past five years with the Trust, MetLife, Inc. or the Adviser are omitted if not materially different. |
| (2) | The Fund Complex includes 49 Portfolios of the MIST Trust and 30 Portfolios of the Trust. |
MSF-21
Metropolitan Series Fund
BlackRock Capital Appreciation Portfolio
Board of Trustees’ Consideration of Advisory and Sub-Advisory Agreements
At an in-person meeting of the Boards of Trustees (the “Board”) of Met Investors Series Trust and Metropolitan Series Fund (“MIST” and “MSF,” respectively, and collectively, the “Trusts”) held on November 19-20, 2013, the Board, including a majority of the Trustees who are not considered to be “interested persons” of the Trusts (the “Independent Trustees”) under the Investment Company Act of 1940, as amended (the “1940 Act”), approved for an annual period the continuation of each Trust’s advisory agreement (the “Advisory Agreement”) with MetLife Advisers, LLC (the “Adviser”) and the applicable sub-advisory agreements (each a “Sub-Advisory Agreement,” and collectively with the Advisory Agreement, the “Agreements”) between the Adviser and the investment sub-advisers (each a “Sub-Adviser,” and collectively, the “Sub-Advisers”) for each of the series of the Trusts, including the BlackRock Capital Appreciation Portfolio (each a “Portfolio,” and collectively, the “Portfolios”).1
In considering the Agreements, the Board reviewed a variety of materials provided by the Adviser and the Sub-Advisers relating to the Portfolios, including comparative performance, fee and expense information for an appropriate peer group of similar mutual funds, performance information for relevant benchmark indices and other information regarding the nature, extent and quality of services provided by the Adviser and the Sub-Advisers under their respective Agreements. The Board also took into account its experience with the Adviser and the Sub-Advisers and information provided to the Board in its meetings throughout the year with respect to the services provided by the Adviser and the Sub-Advisers, including quarterly performance reports prepared by management containing reviews of investment results, and periodic presentations from certain of the Sub-Advisers with respect to the Portfolios they manage. The Independent Trustees also assessed reports provided by the Board’s independent consultant, who reviewed and provided analyses regarding investment performance, fees and expenses, and other information provided by, or at the direction of, the Adviser and the Sub-Advisers, as more fully discussed below.
The Independent Trustees were separately advised by independent legal counsel throughout the process, and met with independent legal counsel in periodic executive sessions. Prior to voting to continue the Agreements at the November meeting, the Independent Trustees also received a memorandum from their independent counsel discussing the legal standards for their consideration of the proposed continuation of the Agreements. The Board also met in person with personnel of the Adviser on September 17, 2013 for the specific purpose of giving preliminary consideration to the proposed continuation of the Agreements and to request additional information they considered reasonably necessary to their deliberations. The Independent Trustees also discussed the proposed continuation of the Agreements in private sessions with their independent legal counsel at which no representatives of management were present.
In considering whether to approve the renewal of the Advisory Agreement with the Adviser and any applicable Sub-Advisory Agreements with respect to a Portfolio, the Board reviewed and analyzed the factors it deemed relevant, including: (1) the nature, extent and quality of the services to be provided to the Portfolios by the Adviser and the Sub-Advisers; (2) the performance of the Portfolios as compared to a peer group and an appropriate index; (3) the Adviser’s and each of the Sub-Adviser’s personnel and operations; (4) the financial condition of the Adviser and of the Sub-Advisers; (5) the level and method of computing each Portfolio’s advisory and sub-advisory fees; (6) the profitability of the Adviser under the Advisory Agreement and of certain of the Sub-Advisers under the Sub-Advisory Agreements; (7) any “fall-out” benefits to the Adviser, the Sub-Advisers and their affiliates (i.e., ancillary benefits realized by the Adviser, the Sub-Advisers or their affiliates from the Adviser’s or Sub-Advisers’ relationship with the Trusts); (8) the anticipated effect of growth in size on Portfolio expenses; (9) fees paid to certain of the Sub-Advisers by comparable institutional and retail accounts; and (10) possible conflicts of interest.
Nature, extent and quality of services. The Board evaluated the nature, extent and quality of the services that the Adviser, and the Sub-Advisers as relevant, have provided to the Portfolios. The Board considered the Adviser’s services as investment manager to the Portfolios, including services relating to the selection and oversight of the Sub-Advisers for the applicable Portfolios. The Board considered, among other things, the Adviser’s oversight of the provision of services to the Portfolios by the Sub-Advisers, including with respect to investment activities and trading practices, and the Sub-Adviser’s compliance with fund policies, objectives and Board directives, compliance policies and procedures and applicable law. The Adviser’s services in coordinating and overseeing the activities of the Trusts’ other service providers were also considered. The Board also evaluated the expertise and performance of the personnel of the Adviser who performed services for the Portfolios throughout the year.
The Board considered information received from the Trust’s Chief Compliance Officer (“CCO”) regarding the Portfolios’ compliance policies and procedures established pursuant to Rule 38a-l under the 1940 Act. The Board also evaluated the CCO’s ongoing reports concerning the CCO’s oversight of the risk assessment processes of the Sub-Advisers.
1 The Pyramis Managed Risk Portfolio recently commenced operations and, therefore, the Agreement with respect to this Portfolio was not up for renewal.
MSF-22
Metropolitan Series Fund
BlackRock Capital Appreciation Portfolio
Board of Trustees’ Consideration of Advisory and Sub-Advisory Agreements—(Continued)
With respect to the services provided by each of the Sub-Advisers, the Board considered, among other things, information provided to the Board by each Sub-Adviser. The Board considered the Sub-Adviser’s current level of staffing and its overall resources, as well as its compensation program. The Board reviewed each Sub-Adviser’s history and investment experience, as well as information regarding the qualifications, background and responsibilities of the Sub-Adviser’s investment and compliance personnel who provide services to the Portfolios. The Board also considered, among other things, the Sub-Adviser’s compliance program and any disciplinary history. The Board also took into account the Sub-Adviser’s risk assessment and monitoring process. The Board noted each Sub-Adviser’s regulatory history, including whether it was currently involved in any regulatory actions or investigations as well as material litigation, and any settlements and amelioratory actions undertaken, as appropriate. The Board also noted that the CCO and his staff conduct regular, periodic compliance reviews with each of the Sub-Advisers and present reports to the Independent Trustees regarding the same, which includes evaluating the regulatory compliance systems of the Sub-Advisers and procedures reasonably designed by them to help assure compliance with the federal securities laws, including issues related to late trading and market timing, best execution, fair value pricing, and proxy voting procedures, among others. The Board also took into account the financial condition of each Sub-Adviser. In its review, the Board also received and took into account information regarding any services and/or payments provided to the Adviser by the Sub-Advisers in connection with marketing activities.
The Board considered each Sub-Adviser’s investment process and philosophy. The Board took into account that each Sub-Adviser’s responsibilities include the development and maintenance of an investment program for the applicable Portfolio which is consistent with the Portfolio’s investment objectives, the selection of investment securities and the placement of orders for the purchase and sale of such securities, as well as the implementation of compliance controls related to performance of these services. The Board also reviewed each Sub-Adviser’s brokerage policies and practices.
Performance. The Board considered the performance of the Portfolios as described in the quarterly reports prepared by management, and as also analyzed in reports prepared by the Independent Trustees’ independent consultant. The Board noted that the Adviser reviews with the Board on a quarterly basis detailed information about the Portfolios’ performance results, portfolio composition and investment strategies. The Board also reviewed and considered a separate report prepared by Lipper Inc. (“Lipper”), an independent third party, which provided a statistical analysis comparing the Portfolios’ investment performance, expenses, and fees to comparable funds underlying variable insurance products (the “Performance Universe”). In addition, the Independent Trustees met separately with a representative of Bobroff Consulting, Inc., an independent consultant (“Bobroff), at a special board meeting in September 2013, to review the separate reports prepared by such consultant (“Bobroff Report”), which analyzed the report prepared by Lipper. The Board also considered each Portfolio’s more recent performance subsequent to the performance period covered by the Lipper reports, and management’s discussion of the same, including the effect of current market conditions on each Portfolio’s more recent performance.
The Board reviewed the Portfolios’ performance records and the Adviser’s and Sub-Advisers’ management styles and long-term performance records with the Portfolios and comparable funds. The Board focused particular attention on Portfolios with less favorable performance records. The Board was mindful of the Adviser’s focus on each Sub-Adviser’s performance and noted that the Adviser has been active in monitoring and responding to any performance issues with respect to the Portfolios. The Board also took into account its discussions with management regarding factors that contributed to the performance of the Portfolios.
Among other data relating specifically to the BlackRock Capital Appreciation Portfolio’s performance, the Board considered that the Portfolio underperformed the median of its Performance Universe and its Lipper Index for the one-, three- and five-year periods ended June 30, 2013. The Board further considered that the Portfolio underperformed its benchmark, the Russell 1000 Growth Index, for the one-, three- and five-year periods ended October 31, 2013. The Board also took into account management’s discussion of the Portfolio’s performance and the change in the Portfolio’s investment management team in January 2013.
Fees and Expenses. The Board gave consideration to the advisory fees payable under the Advisory Agreement and the sub-advisory fees payable under each of the Sub-Advisory Agreements. In this regard, the Board reviewed the advisory fees payable on a Portfolio-by-Portfolio basis based on information provided by the Adviser. The Independent Trustees, with the assistance of Bobroff, also examined the fees paid by a Portfolio in light of fees paid to other investment managers by comparable funds, as well as considered the fees charged by the Adviser to manage other comparable funds, as applicable. The Lipper report included comparisons of the Adviser’s fee schedule with that of its peers based on an asset-based analysis of relative fee structures according to the size of the Portfolio. In addition, the Board considered the Portfolios’ advisory and sub-advisory fees and total expenses as compared to similarly situated investment companies underlying variable insurance products deemed to be comparable to the Portfolios as determined by Lipper. The Board considered a Portfolio’s ranking within a smaller group of peer funds chosen by Lipper (the “Expense Group”), as well as the Portfolio’s ranking within broader groups of funds (the “Expense Universe” and the “Sub-advised Expense Universe”). The Board
MSF-23
Metropolitan Series Fund
BlackRock Capital Appreciation Portfolio
Board of Trustees’ Consideration of Advisory and Sub-Advisory Agreements—(Continued)
also considered a Portfolio’s contractual sub-advisory fees, as applicable, as compared to the Sub-advised Expense Universe as well as a smaller group of funds (the “Sub-advised Expense Group”). In comparing a Portfolio’s actual and contractual management fee to that of comparable funds, the Board noted that such fee includes both advisory and administrative fees.
The Board noted that the sub-advisory fees for the Portfolios are paid by the Adviser, not the Portfolios, out of the advisory fee. It was further noted that the Adviser negotiates such fees at arm’s length. The Board also considered that the Adviser had entered into expense limitation agreements with certain of the Portfolios, pursuant to which the Adviser has agreed to waive a portion of its advisory fee and/or reimburse certain expenses as a means of limiting a Portfolio’s total annual operating expenses. The Board further considered the amount of sub-advisory fees paid out by the Adviser and the amount of the management fees that it retained in light of the services performed by Sub-Advisers and Adviser, respectively.
With respect to the BlackRock Capital Appreciation Portfolio, the Board considered that the Portfolio’s total expenses (exclusive of 12b-1 fees) were below the Expense Universe median and the Sub-advised Expense Universe median but slightly above the Expense Group median. The Board also considered that the actual management fee was above the Expense Group median, the Expense Universe median and Sub-advised Expense Universe median. The Board noted that the Portfolio’s contractual management fees were above the asset-weighted average of the Expense Group at the Portfolio’s current size. The Board also noted that the Portfolio’s contractual sub-advisory fees were above the average of the Sub-advised Expense Group but below the average of the Sub-advised Expense Universe at the Portfolio’s current size. The Board noted that the Adviser had waived fees and/or reimbursed expenses during the past year.
Profitability. The Board examined the profitability of the Adviser on a Portfolio-by-Portfolio basis. The Board also considered that the Distributor, MetLife Investors Distribution Company, receives Rule 12b-1 payments to support the distribution of the products. The Board considered the profitability to the Sub-Advisers and their affiliates as a result of their relationships with the Portfolios, and the Board considered the ability of the Adviser to negotiate the Sub-Advisory Agreements and the fees thereunder at arm’s length. The Board also reviewed Portfolio specific data with regard to the profitability of the Portfolios to each Sub-Adviser, as available.
Economies of scale. The Board also considered the effect of the Portfolios’ growth in size on their fees. The Board noted that the fee schedules for most of the Portfolios contain breakpoints that reduce the fee rate above specified asset levels. The Board noted those Portfolios that did not contain breakpoints in the advisory fee and took into account management’s discussion of the same. The Board noted that those Portfolios with advisory fee schedules containing breakpoints generally reflect the inclusion of breakpoints in the sub-advisory fee schedule for such Portfolios. The Board considered the effective fees under the Advisory Agreement for a Portfolio as a percentage of assets at different asset levels and possible economies of scale that may be realized if the assets of the Portfolio grow. Among other data, the Board examined the effect of a Portfolio’s growth in size on various fee schedules and reviewed the Lipper and Bobroff Reports, which compared fees among peers. The Board also generally noted that if a Portfolio’s assets increase over time, the Portfolio may realize other economies of scale if assets increase proportionally more than certain other fixed expenses. In addition, the Board noted that the Adviser had taken a number of steps to date intended to share the benefits of economies of scale with contractholders.
With respect to the BlackRock Capital Appreciation Portfolio, the Board noted that the Portfolio’s advisory fee and sub-advisory fee each contains breakpoints that reduce the advisory fee rate on assets above certain specified asset levels. The Board considered the fact that the Portfolio’s fee levels decline as portfolio assets increase.
Other factors. As part of its evaluation of the Adviser’s compensation, the Board considered other benefits that may be realized by the Adviser and its affiliates from their relationship with the Trusts. Among them, the Board recognized that an affiliate of the Adviser, MetLife Investors Distribution Company, serves as the Distributor for the Trusts, and, as such, receives payments pursuant to Rule 12b-1 from the Portfolios to compensate it for providing shareholder services and selling activities, which could lead to growth in the Trusts’ assets and corresponding benefits from such growth, including economies of scale. The Board also considered that affiliates of the Adviser may benefit from certain indirect tax benefits relating to dividend received deductions and foreign tax credits. In conjunction with these considerations, the Board noted the costs of providing investment management and other services to the Portfolios and the ongoing commitment of the Adviser to the Portfolios.
The Board considered other benefits that may be realized by each Sub-Adviser and its affiliates from their relationship with the Trusts, including the opportunity to provide advisory services to additional portfolios of the Trusts and reputational benefits. In conjunction with these considerations, the Board noted the costs of providing investment advisory services to the Portfolios and the ongoing commitment of the Sub-Advisers to the Portfolios.
MSF-24
Metropolitan Series Fund
BlackRock Capital Appreciation Portfolio
Board of Trustees’ Consideration of Advisory and Sub-Advisory Agreements—(Continued)
The Board considered possible conflicts of interest in the form of material benefits or detriments to the Trusts resulting from the nature of the Trusts’ and the Adviser’s or the Sub-Advisers’ affiliations and the services that are provided to the Trusts, and the manner in which such conflicts were mitigated.
Conclusions. After full consideration of the factors discussed above, the Board, including a majority of the Independent Trustees, approved the Advisory Agreement and the Sub-Advisory Agreement, as applicable, with respect to each Portfolio, unless otherwise noted. In making its approvals, the Board concluded that the nature, extent and quality of services provided by the Adviser and each Sub-Adviser supported the renewal of the Agreements. The Board also concluded that the investment performance of each Fund was such that each Agreement should continue. In addition, the Board concluded that fees paid by a Portfolio to the Adviser and, if applicable, the Sub-Adviser appeared to be acceptable in light of nature, extent and quality of the services provided by the Adviser and Sub-Adviser. Further, the Board concluded that the Adviser’s profitability in providing services under the Advisory Agreements did not appear unreasonably high in light of the nature, extent and quality of the services provided by the Adviser. Finally, the Board concluded that the Advisory and Sub-Advisory fees in some measure share economies of scale with contractholders. In approving the renewal of each of the Agreements, the Board, including the Independent Trustees, did not identify any single factor as controlling, and generally attributed different weights to various factors for the various Portfolios. The Board evaluated all information available to them on a Portfolio-by-Portfolio basis, and their decisions were made separately with respect to each Portfolio.
MSF-25
Metropolitan Series Fund
BlackRock Large Cap Value Portfolio
Managed by BlackRock Advisors, LLC
Portfolio Manager Commentary*
PERFORMANCE
For the one year period ended December 31, 2013, the Class A, B, and E shares of the BlackRock Large Cap Value Portfolio returned 32.05%, 31.74%, and 31.88%, respectively. The Portfolio’s benchmark, the Russell 1000 Value Index1, returned 32.53%.
MARKET ENVIRONMENT / CONDITIONS
Most broad-based indices were up more than 30% in 2013, for the most part unscathed by ongoing political and economic uncertainty. Furthermore, accommodative monetary policy and the avoidance of major risks made 2013 a strong year for U.S. stocks and the Russell 1000 Value Index ended the year up by more than 30%.
U.S. stocks had an impressive start to the year, strongly outpacing most other developed markets and emerging market equities. The U.S. stock rally continued to gather momentum as investors latched onto the latest favorable data on the economy and corporate earnings.
While monetary policy was the main driving force behind the rally in risk assets, it was also the main culprit for the bouts of volatility during the year. In May, comments from the Federal Reserve (the “Fed”) suggesting a possible reduction of its bond-buying program before the end of 2013 roiled markets around the world. Equities plummeted and a dramatic increase in U.S. Treasury yields resulted in tumbling bond prices. Risk assets rebounded in late June, however, when the Fed’s tone turned more dovish, and improving economic indicators and better corporate earnings helped extend gains through most of the summer.
The Fed defied market expectations with its decision to delay tapering in the fall. Easing of earlier political tensions boosted investor sentiment, but higher volatility returned in late September when the U.S. Treasury Department warned that the national debt would soon breach its statutory maximum. The ensuing political brinksmanship led to a partial government shut-down, roiling global financial markets through the first half of October. The rally quickly resumed when politicians engineered a compromise to reopen the government and extend the debt ceiling, at least temporarily. By the end of 2013, concern that economic strength and political stability would lead to a hawkish Fed was confirmed by the December announcement of starting to taper bond purchases by $10 billion per month beginning in January 2014.
PORTFOLIO REVIEW / PERIOD END POSITIONING
The Portfolio underperformed the Russell 1000 Value Index during the 12-month period. Negative performance in the Health Care, Information Technology (“IT”), and Energy sectors detracted from relative performance. In Health Care, weakness was most notable among for-profit health insurers in the Providers & Services industry, where UnitedHealth Group had the greatest negative impact. Positioning in the Pharmaceuticals industry was an additional source of weakness.
Within the IT sector, the Computers & Peripherals industry was the largest detractor. Positioning in Apple, Inc. was a notable detractor as the stock tumbled amid investors’ increasing concerns about weakening profit margins and the company’s ability to continue to innovate and drive demand for its products. An additional drag on performance came from underexposure to Hewlett-Packard Co., which performed well.
Oil, Gas & Consumable Fuel holdings were the greatest detractors in the Energy sector. In addition, volatility in crude oil prices and the narrowing of crack spreads (i.e., the difference between the price of crude oil and prices of the petroleum products derived from it) raised concerns about the sustainability of profit margins for oil refiners held by the Portfolio, including PBF Energy, Inc. Shares of Canadian Oil & Gas Refiner Suncor Energy, Inc., also detracted.
Conversely, an intentional underweight in expensive, defensive segments contributed meaningfully to performance relative to the benchmark index. An analysis of real estate investment trusts (“REITs”) and the Consumer Staples, Utilities, and Telecommunication Services (Telecom) sectors in early 2013 suggested that relative valuations in these sectors represented a premium to the rest of the market that was nearly as high as any seen in the last 35 years. This confirmed our view and during the year, we widened already existing underweights and remained mostly underweight throughout the year.
Elsewhere in the Portfolio, stock selection proved beneficial in the Industrials, Financials, Materials sectors and in select positions in the Consumer Discretionary sector. Within Industrials, United Continental (“UAL”) performed well as industry pricing data points remained positive and the Department of Justice approved the merger of American Airlines and U.S. Airways, which will likely lead to further consolidation of the U.S. airline industry. UAL also held an “investor day” during which it outlined aggressive cost-saving initiatives and a strong outlook for earnings growth. Our position in The Boeing Co. was also a top contributor.
In addition to not owning REITs, an overweight in U.S. money center banks such as Bank of America boosted returns in the Financials sector. Within Materials, an underweight in the Metals & Mining industry and positions in the Containers & Packaging industry drove returns. Within Consumer Discretionary, Twenty-First Century Fox was a significant contributor as shares soared following the completed spin-off transaction of the News Corp. publishing division, a catalyst we had anticipated would highlight the strong growth and capital allocation characteristics of the company.
On December 2, 2013, the Portfolio transitioned to a new portfolio management team led by Bart Geer with Carrie King assisting. This management transition naturally involved repositioning which was completed by December 16, 2013. Thus many of the previously mentioned holdings are no longer in the Portfolio.
MSF-1
Metropolitan Series Fund
BlackRock Large Cap Value Portfolio
Managed by BlackRock Advisors, LLC
Portfolio Manager Commentary*—(Continued)
At period-end, the Portfolio held notable overweights relative to the Russell 1000 Value Index in the Health Care, Consumer Discretionary, and Financials sectors, while holding significant underweights in Industrials, Utilities, and Telecommunication Services.
Peter Stournaras
Portfolio Manager (January 1, 2013 – December 1, 2013)
Bart Geer
Carrie King
Portfolio Managers (December 2, 2013 – December 31, 2013)
BlackRock Advisors, LLC
* This commentary may include statements that constitute “forward-looking statements” under the U.S. securities laws. Forward-looking statements include, among other things, projections, estimates, and information about possible or future results related to the Portfolio, market or regulatory developments. The views expressed above are not guarantees of future performance or economic results and involve certain risks, uncertainties and assumptions that could cause actual outcomes and results to differ materially from the views expressed herein. The views expressed above are subject to change at any time based upon economic, market, or other conditions and the subadvisory firm undertakes no obligation to update the views expressed herein. Any discussions of specific securities should not be considered a recommendation to buy or sell those securities. The views expressed above (including any forward-looking statement) may not be relied upon as investment advice or as an indication of the Portfolio’s trading intent. Information about the Portfolio’s holdings, asset allocation or country diversification is historical and is not an indication of future Portfolio composition, which may vary. Direct investment in any index is not possible. The performance of any index mentioned in this commentary has not been adjusted for ongoing management, distribution and operating expenses, and sales charges applicable to mutual fund investments. In addition, the returns do not reflect additional fees charged by separate accounts or variable insurance contracts that an investor in the Portfolio may pay. If these additional fees were reflected, performance would have been lower.
MSF-2
Metropolitan Series Fund
BlackRock Large Cap Value Portfolio
A $10,000 INVESTMENT COMPARED TO THE RUSSELL 1000 VALUE INDEX

AVERAGE ANNUAL RETURNS (%) (FOR THE YEAR ENDED DECEMBER 31, 2013)
| | | | | | | | | | | | |
| | | 1 Year | | | 5 Year | | | 10 Year | |
| BlackRock Large Cap Value Portfolio | | | | | | | | | | | | |
Class A | | | 32.05 | | | | 13.41 | | | | 6.12 | |
Class B | | | 31.74 | | | | 13.14 | | | | 5.85 | |
Class E | | | 31.88 | | | | 13.25 | | | | 5.96 | |
| Russell 1000 Value Index | | | 32.53 | | | | 16.67 | | | | 7.58 | |
1 The Russell 1000 Value Index is an unmanaged measure of the largest capitalized U.S. domiciled companies with a less than average growth orientation. Companies in this Index generally have a low price-to-book and price-to-earnings ratio, higher dividend yields and lower forecasted growth values.
Portfolio performance is calculated including reinvestment of all income and capital gain distributions. Performance numbers are net of all Portfolio expenses but do not include any insurance, sales, separate account or administrative charges of variable annuity or life insurance contracts or any additional expenses that participants may bear relating to the operations of their plans. If these charges were included, the returns would be lower. The performance of any index referenced above has not been adjusted for ongoing management, distribution and operating expenses, and sales charges applicable to mutual fund investments. Direct investment in any index is not possible. The performance of Class A shares, as set forth in the line graph above, will differ from that of other classes because of the difference in expenses paid by policyholders investing in the different share classes.
This information represents past performance and is not indicative of future results. Investment return and principal value may fluctuate so that shares, upon redemption, may be worth more or less than the original cost.
PORTFOLIO COMPOSITION AS OF DECEMBER 31, 2013
Top Holdings
| | | | |
| | |
% of
Net Assets | |
| JPMorgan Chase & Co. | | | 4.2 | |
| Citigroup, Inc. | | | 4.1 | |
| Exxon Mobil Corp. | | | 3.5 | |
| Pfizer, Inc. | | | 3.4 | |
| Marathon Oil Corp. | | | 3.3 | |
| Medtronic, Inc. | | | 3.0 | |
| Cisco Systems, Inc. | | | 2.8 | |
| Wells Fargo & Co. | | | 2.4 | |
| Viacom, Inc.—Class B | | | 2.4 | |
| Microsoft Corp. | | | 2.3 | |
Top Sectors
| | | | |
| | | % of
Market Value of
Total Long-Term Investments | |
| Financials | | | 31.1 | |
| Health Care | | | 17.1 | |
| Energy | | | 16.6 | |
| Consumer Discretionary | | | 10.6 | |
| Information Technology | | | 10.1 | |
| Industrials | | | 5.4 | |
| Consumer Staples | | | 3.8 | |
| Utilities | | | 3.0 | |
| Materials | | | 2.3 | |
MSF-3
Metropolitan Series Fund
BlackRock Large Cap Value Portfolio
Understanding Your Portfolio’s Expenses
Shareholder Expense Example
As a shareholder of the Portfolio, you incur ongoing costs, including management fees; distribution and service (12b-1) fees; and other Portfolio expenses. This example is intended to help you understand your ongoing costs (in dollars) (referred to as “expenses”) of investing in the Portfolio and compare these costs with the ongoing costs of investing in other mutual funds. The example is based on an investment of $1,000 invested at the beginning of the period and held for the entire period, July 1, 2013 through December 31, 2013.
Actual Expenses
The first line for each share class of the Portfolio in the table below provides information about actual account values and actual expenses. You may use the information in this line, together with the amount you invested in the particular share class of the Portfolio, to estimate the expenses that you paid over the period. Simply divide your account value by $1,000 (for example, an $8,600 account value divided by $1,000 = 8.6), then multiply the result by the number in the first line under the heading entitled “Expenses Paid During Period” to estimate the expenses you paid on your account during this period.
Hypothetical Example for Comparison Purposes
The second line for each share class of the Portfolio in the table below provides information about hypothetical account values and hypothetical expenses based on the Portfolio’s actual expense ratio and an assumed rate of return of 5% per year before expenses, which is not the Portfolio’s actual return. The hypothetical account values and expenses may not be used to estimate the actual ending account balance or expenses you paid for the period. You may use this information to compare the ongoing costs of investing in the Portfolio and other funds. To do so, compare this 5% hypothetical example with the 5% hypothetical examples that appear in the shareholder reports of the other funds.
Please note that the expenses shown in the table are meant to highlight your ongoing costs only and do not reflect any fees or charges of your variable insurance product or any additional expenses that participants in certain eligible qualified plans may bear relating to the operations of their plan. Therefore, the second line for each share class in the table is useful in comparing ongoing costs only, and will not help you determine the relative total costs of owning different funds. In addition, if these other costs were included, your costs would have been higher.
| | | | | | | | | | | | | | | | | | |
BlackRock Large Cap Value Portfolio | | | | Annualized
Expense
Ratio | | | Beginning
Account Value
July 1,
2013 | | | Ending
Account Value
December 31,
2013 | | | Expenses Paid
During Period**
July 1, 2013
to
December 31,
2013 | |
Class A(a) | | Actual | | | 0.56 | % | | $ | 1,000.00 | | | $ | 1,150.20 | | | $ | 3.04 | |
| | Hypothetical* | | | 0.56 | % | | $ | 1,000.00 | | | $ | 1,022.38 | | | $ | 2.85 | |
| | | | | |
Class B(a) | | Actual | | | 0.81 | % | | $ | 1,000.00 | | | $ | 1,148.20 | | | $ | 4.39 | |
| | Hypothetical* | | | 0.81 | % | | $ | 1,000.00 | | | $ | 1,021.12 | | | $ | 4.13 | |
| | | | | |
Class E(a) | | Actual | | | 0.71 | % | | $ | 1,000.00 | | | $ | 1,148.80 | | | $ | 3.85 | |
| | Hypothetical* | | | 0.71 | % | | $ | 1,000.00 | | | $ | 1,021.63 | | | $ | 3.62 | |
* Hypothetical assumes a rate of return of 5% per year before expenses.
** Expenses paid are equal to the Portfolio’s annualized expense ratio for the most recent six month period, as shown above, multiplied by the average account value over the period, multiplied by the number of days (184 days) in the most recent fiscal half-year, divided by 365 (to reflect the one-half year period).
(a) The annualized expense ratio shown reflects the impact of the management fee waiver as described in Note 6 of the Notes to Financial Statements.
MSF-4
Metropolitan Series Fund
BlackRock Large Cap Value Portfolio
Schedule of Investments as of December 31, 2013
Common Stocks—99.3% of Net Assets
| | | | | | | | |
| Security Description | | Shares | | | Value | |
|
Aerospace & Defense—3.9% | |
Boeing Co. (The) | | | 76,700 | | | $ | 10,468,783 | |
Honeywell International, Inc. | | | 228,300 | | | | 20,859,771 | |
Northrop Grumman Corp. | | | 233,000 | | | | 26,704,130 | |
Raytheon Co. | | | 226,775 | | | | 20,568,492 | |
| | | | | | | | |
| | | | | | | 78,601,176 | |
| | | | | | | | |
|
Airlines—0.4% | |
Delta Air Lines, Inc. | | | 286,800 | | | | 7,878,396 | |
| | | | | | | | |
|
Auto Components—1.9% | |
Lear Corp. (a) | | | 349,100 | | | | 28,266,627 | |
TRW Automotive Holdings Corp. (b) | | | 120,348 | | | | 8,952,688 | |
| | | | | | | | |
| | | | | | | 37,219,315 | |
| | | | | | | | |
|
Automobiles—1.9% | |
Ford Motor Co. | | | 340,600 | | | | 5,255,458 | |
General Motors Co. (b) | | | 798,600 | | | | 32,638,782 | |
| | | | | | | | |
| | | | | | | 37,894,240 | |
| | | | | | | | |
|
Capital Markets—1.0% | |
Morgan Stanley | | | 404,800 | | | | 12,694,528 | |
State Street Corp. | | | 90,700 | | | | 6,656,473 | |
| | | | | | | | |
| | | | | | | 19,351,001 | |
| | | | | | | | |
|
Chemicals—2.0% | |
Akzo Nobel NV (ADR) (a) | | | 545,500 | | | | 14,112,085 | |
Ashland, Inc. | | | 103,600 | | | | 10,053,344 | |
Celanese Corp. - Series A | | | 3,600 | | | | 199,116 | |
LyondellBasell Industries NV - Class A | | | 185,000 | | | | 14,851,800 | |
| | | | | | | | |
| | | | | | | 39,216,345 | |
| | | | | | | | |
|
Commercial Banks—3.7% | |
Regions Financial Corp. | | | 1,773,721 | | | | 17,542,101 | |
U.S. Bancorp | | | 223,850 | | | | 9,043,540 | |
Wells Fargo & Co. | | | 1,064,700 | | | | 48,337,380 | |
| | | | | | | | |
| | | | | | | 74,923,021 | |
| | | | | | | | |
|
Communications Equipment—3.6% | |
Cisco Systems, Inc. | | | 2,506,300 | | | | 56,266,435 | |
Telefonaktiebolaget LM Ericsson (ADR) | | | 1,231,200 | | | | 15,069,888 | |
| | | | | | | | |
| | | | | | | 71,336,323 | |
| | | | | | | | |
|
Computers & Peripherals—0.1% | |
Apple, Inc. | | | 3,600 | | | | 2,019,996 | |
| | | | | | | | |
|
Consumer Finance—4.3% | |
Capital One Financial Corp. | | | 579,300 | | | | 44,380,173 | |
Discover Financial Services | | | 757,250 | | | | 42,368,137 | |
| | | | | | | | |
| | | | | | | 86,748,310 | |
| | | | | | | | |
|
Diversified Financial Services—9.6% | |
Citigroup, Inc. | | | 1,573,851 | | | | 82,013,375 | |
JPMorgan Chase & Co. | | | 1,449,837 | | | | 84,786,468 | |
|
Diversified Financial Services—(Continued) | |
NASDAQ OMX Group, Inc. (The) | | | 662,775 | | | $ | 26,378,445 | |
| | | | | | | | |
| | | | | | | 193,178,288 | |
| | | | | | | | |
|
Electric Utilities—0.4% | |
Edison International | | | 178,310 | | | | 8,255,753 | |
| | | | | | | | |
|
Electronic Equipment, Instruments & Components—0.4% | |
Corning, Inc. | | | 434,400 | | | | 7,741,008 | |
| | | | | | | | |
|
Energy Equipment & Services—0.5% | |
Halliburton Co. | | | 198,600 | | | | 10,078,950 | |
| | | | | | | | |
|
Food & Staples Retailing—2.5% | |
CVS Caremark Corp. | | | 136,150 | | | | 9,744,256 | |
Kroger Co. (The) | | | 929,300 | | | | 36,735,229 | |
Walgreen Co. | | | 60,500 | | | | 3,475,120 | |
| | | | | | | | |
| | | | | | | 49,954,605 | |
| | | | | | | | |
|
Gas Utilities—0.7% | |
UGI Corp. | | | 347,400 | | | | 14,403,204 | |
| | | | | | | | |
|
Health Care Equipment & Supplies—7.2% | |
Baxter International, Inc. | | | 43,200 | | | | 3,004,560 | |
Hologic, Inc. (a) (b) | | | 113,900 | | | | 2,545,665 | |
Medtronic, Inc. | | | 1,032,500 | | | | 59,255,175 | |
St. Jude Medical, Inc. | | | 658,467 | | | | 40,792,031 | |
Zimmer Holdings, Inc. | | | 424,600 | | | | 39,568,474 | |
| | | | | | | | |
| | | | | | | 145,165,905 | |
| | | | | | | | |
|
Health Care Providers & Services—0.7% | |
Quest Diagnostics, Inc. (a) | | | 254,800 | | | | 13,641,992 | |
| | | | | | | | |
|
Household Durables—1.5% | |
Garmin, Ltd. (a) | | | 53,950 | | | | 2,493,569 | |
Newell Rubbermaid, Inc. | | | 852,400 | | | | 27,626,284 | |
| | | | | | | | |
| | | | | | | 30,119,853 | |
| | | | | | | | |
|
Household Products—1.3% | |
Energizer Holdings, Inc. | | | 241,700 | | | | 26,161,608 | |
Kimberly-Clark Corp. | | | 3,800 | | | | 396,948 | |
| | | | | | | | |
| | | | | | | 26,558,556 | |
| | | | | | | | |
|
Independent Power Producers & Energy Traders—1.8% | |
AES Corp. (The) | | | 2,497,800 | | | | 36,243,078 | |
| | | | | | | | |
|
Industrial Conglomerates—1.0% | |
General Electric Co. | | | 694,600 | | | | 19,469,638 | |
| | | | | | | | |
|
Insurance—11.4% | |
ACE, Ltd. | | | 263,000 | | | | 27,228,390 | |
Aflac, Inc. | | | 412,900 | | | | 27,581,720 | |
Genworth Financial, Inc. - Class A (b) | | | 1,710,600 | | | | 26,565,618 | |
Hartford Financial Services Group, Inc. | | | 847,500 | | | | 30,704,925 | |
Lincoln National Corp. | | | 593,500 | | | | 30,636,470 | |
PartnerRe, Ltd. | | | 19,100 | | | | 2,013,713 | |
See accompanying notes to financial statements.
MSF-5
Metropolitan Series Fund
BlackRock Large Cap Value Portfolio
Schedule of Investments as of December 31, 2013
Common Stocks—(Continued)
| | | | | | | | |
| Security Description | | Shares | | | Value | |
|
Insurance—(Continued) | |
Prudential Financial, Inc. | | | 422,500 | | | $ | 38,962,950 | |
Travelers Cos., Inc. (The) | | | 274,400 | | | | 24,844,176 | |
XL Group plc | | | 598,100 | | | | 19,043,504 | |
| | | | | | | | |
| | | | | | | 227,581,466 | |
| | | | | | | | |
|
IT Services—0.9% | |
Western Union Co. (The) (a) | | | 1,103,500 | | | | 19,035,375 | |
| | | | | | | | |
|
Media—4.5% | |
Comcast Corp. - Special Class A | | | 329,400 | | | | 16,430,472 | |
Time Warner, Inc. | | | 375,700 | | | | 26,193,804 | |
Viacom, Inc. - Class B | | | 550,700 | | | | 48,098,138 | |
| | | | | | | | |
| | | | | | | 90,722,414 | |
| | | | | | | | |
|
Metals & Mining—0.3% | |
Reliance Steel & Aluminum Co. | | | 88,500 | | | | 6,711,840 | |
| | | | | | | | |
|
Multiline Retail—0.7% | |
Kohl’s Corp. | | | 213,200 | | | | 12,099,100 | |
Macy’s, Inc. | | | 37,200 | | | | 1,986,480 | |
| | | | | | | | |
| | | | | | | 14,085,580 | |
| | | | | | | | |
|
Office Electronics—0.7% | |
Xerox Corp. | | | 1,076,500 | | | | 13,101,005 | |
| | | | | | | | |
|
Oil, Gas & Consumable Fuels—16.0% | |
Apache Corp. | | | 218,900 | | | | 18,812,266 | |
Cobalt International Energy, Inc. (b) | | | 910,300 | | | | 14,974,435 | |
Exxon Mobil Corp. | | | 700,225 | | | | 70,862,770 | |
Gulfport Energy Corp. (b) | | | 347,500 | | | | 21,944,625 | |
Marathon Oil Corp. | | | 1,872,200 | | | | 66,088,660 | |
Marathon Petroleum Corp. | | | 370,826 | | | | 34,015,869 | |
Phillips 66 | | | 76,800 | | | | 5,923,584 | |
Suncor Energy, Inc. | | | 800,800 | | | | 28,068,040 | |
Total S.A. (ADR) | | | 456,800 | | | | 27,988,136 | |
Valero Energy Corp. | | | 631,700 | | | | 31,837,680 | |
| | | | | | | | |
| | | | | | | 320,516,065 | |
| | | | | | | | |
|
Paper & Forest Products—0.0% | |
International Paper Co. | | | 12,900 | | | | 632,487 | |
| | | | | | | | |
|
Pharmaceuticals—9.1% | |
AstraZeneca plc (ADR) (a) | | | 591,800 | | | | 35,135,166 | |
Eli Lilly & Co. | | | 789,225 | | | | 40,250,475 | |
Hospira, Inc. (b) | | | 158,800 | | | | 6,555,264 | |
Johnson & Johnson | | | 165,775 | | | | 15,183,332 | |
Merck & Co., Inc. | | | 56,265 | | | | 2,816,063 | |
Pfizer, Inc. | | | 2,230,775 | | | | 68,328,639 | |
Teva Pharmaceutical Industries, Ltd. (ADR) | | | 350,900 | | | | 14,064,072 | |
| | | | | | | | |
| | | | | | | 182,333,011 | |
| | | | | | | | |
|
Real Estate Management & Development—0.9% | |
CBRE Group, Inc. - Class A (b) | | | 143,600 | | | | 3,776,680 | |
|
Real Estate Management & Development—(Continued) | |
Jones Lang LaSalle, Inc. | | | 142,000 | | | | 14,539,380 | |
| | | | | | | | |
| | | | | | | 18,316,060 | |
| | | | | | | | |
|
Semiconductors & Semiconductor Equipment—0.6% | |
KLA-Tencor Corp. | | | 22,200 | | | | 1,431,012 | |
Teradyne, Inc. (a) (b) | | | 574,308 | | | | 10,119,307 | |
| | | | | | | | |
| | | | | | | 11,550,319 | |
| | | | | | | | |
|
Software—3.8% | |
Microsoft Corp. | | | 1,243,100 | | | | 46,529,233 | |
Oracle Corp. | | | 413,500 | | | | 15,820,510 | |
Symantec Corp. | | | 609,100 | | | | 14,362,578 | |
| | | | | | | | |
| | | | | | | 76,712,321 | |
| | | | | | | | |
Total Common Stocks
(Cost $1,808,374,376) | | | | | | | 1,991,296,896 | |
| | | | | | | | |
|
| Convertible Preferred Stock—0.1% | |
|
Machinery—0.1% | |
Stanley Black & Decker, Inc.
(Cost $1,379,332) | | | 13,600 | | | | 1,403,520 | |
| | | | | | | | |
|
| Short-Term Investments—5.3% | |
|
Mutual Fund—5.0% | |
State Street Navigator Securities Lending MET Portfolio (c) | | | 99,975,719 | | | | 99,975,719 | |
| | | | | | | | |
|
Repurchase Agreement—0.3% | |
Fixed Income Clearing Corp. Repurchase Agreement dated 12/31/13 at 0.000% to be repurchased at $6,079,000 on 01/02/14, collateralized by $6,205,000 U.S. Treasury Bill at 0.000% due 06/19/14 with a value of $6,201,898. | | | 6,079,000 | | | | 6,079,000 | |
| | | | | | | | |
Total Short-Term Investments
(Cost $106,054,719) | | | | | | | 106,054,719 | |
| | | | | | | | |
Total Investments—104.7%
(Cost $1,915,808,427) (d) | | | | | | | 2,098,755,135 | |
Other assets and liabilities (net)—(4.7)% | | | | | | | (94,191,451 | ) |
| | | | | | | | |
| Net Assets—100.0% | | | | | | $ | 2,004,563,684 | |
| | | | | | | | |
| * | Principal amount stated in U.S. dollars unless otherwise noted. |
| (a) | All or a portion of the security was held on loan. As of December 31, 2013, the market value of securities loaned was $97,529,205 and the collateral received consisted of cash in the amount of $99,975,719. The cash collateral is invested in a money market fund managed by an affiliate of the custodian. |
| (b) | Non-income producing security. |
See accompanying notes to financial statements.
MSF-6
Metropolitan Series Fund
BlackRock Large Cap Value Portfolio
Schedule of Investments as of December 31, 2013
| (c) | Represents investment of cash collateral received from securities lending transactions. |
| (d) | As of December 31, 2013, the aggregate cost of investments for federal income tax purposes was $1,926,016,791. The aggregate unrealized appreciation and depreciation of investments were $191,225,734 and $(18,487,390), respectively, resulting in net unrealized appreciation of $172,738,344 for federal income tax purposes. |
| (ADR)— | An American Depositary Receipt is a certificate issued by a custodian bank representing the right to receive securities of the foreign issuer described. Trading on exchanges not located in the United States or Canada significantly influences the value of ADRs. |
Fair Value Hierarchy
Accounting principles generally accepted in the United States of America (“GAAP”) define fair market value as the price that the Portfolio would receive to sell an asset or pay to transfer a liability in an orderly transaction between market participants at the measurement date. It establishes a fair value hierarchy that prioritizes inputs to valuation methods and requires disclosure of the fair value hierarchy that segregates fair value measurements into three levels. Levels 1, 2 and 3 of the fair value hierarchy are defined as follows:
Level 1 - unadjusted quoted prices in active markets for identical investments
Level 2 - other significant observable inputs (including, but not limited to, unadjusted quoted prices for similar investments in markets that are either active or inactive; inputs other than quoted prices that are observable such as interest rates, yield curves, volatilities, prepayment speeds, loss severities, credit risks, default rates, etc.)
Level 3 - significant unobservable inputs based on the best information available in the circumstances, to the extent observable inputs are unavailable (including the Portfolio’s own assumptions in determining the fair value of investments)
The inputs or methodologies used for valuing investments are not necessarily an indication of the risk associated with investing in them. Changes to the inputs or methodologies used may result in transfers between levels, which will be recognized as of the beginning of the reporting period. Information on transfers between Level 1 and Level 2, if any, will be disclosed following the fair value hierarchy table below. A reconciliation of Level 3 securities, if any, will also be disclosed following the fair value hierarchy table. For more information about the Portfolio’s policy regarding the valuation of investments, please refer to the Notes to Financial Statements.
The following table summarizes the fair value hierarchy of the Portfolio’s investments as of December 31, 2013:
| | | | | | | | | | | | | | | | |
| Description | | Level 1 | | | Level 2 | | | Level 3 | | | Total | |
Total Common Stocks* | | $ | 1,991,296,896 | | | $ | — | | | $ | — | | | $ | 1,991,296,896 | |
Total Convertible Preferred Stock* | | | 1,403,520 | | | | — | | | | — | | | | 1,403,520 | |
| Short-Term Investments | | | | | | | | | | | | | | | | |
Mutual Fund | | | 99,975,719 | | | | — | | | | — | | | | 99,975,719 | |
Repurchase Agreement | | | — | | | | 6,079,000 | | | | — | | | | 6,079,000 | |
Total Short-Term Investments | | | 99,975,719 | | | | 6,079,000 | | | | — | | | | 106,054,719 | |
Total Investments | | $ | 2,092,676,135 | | | $ | 6,079,000 | | | $ | — | | | $ | 2,098,755,135 | |
| | | | | | | | | | | | | | | | | |
Collateral for Securities Loaned (Liability) | | $ | — | | | $ | (99,975,719 | ) | | $ | — | | | $ | (99,975,719 | ) |
| * | See Schedule of Investments for additional detailed categorizations. |
See accompanying notes to financial statements.
MSF-7
Metropolitan Series Fund
BlackRock Large Cap Value Portfolio
Statement of Assets and Liabilities
December 31, 2013
| | | | |
Assets | | | | |
Investments at value (a) (b) | | $ | 2,098,755,135 | |
Cash | | | 198,355 | |
Receivable for: | | | | |
Investments sold | | | 20,365,398 | |
Fund shares sold | | | 281,850 | |
Dividends | | | 1,703,591 | |
Prepaid expenses | | | 5,196 | |
| | | | |
Total Assets | | | 2,121,309,525 | |
Liabilities | | | | |
Collateral for securities loaned | | | 99,975,719 | |
Payables for: | | | | |
Investments purchased | | | 14,761,244 | |
Fund shares redeemed | | | 1,303,628 | |
Accrued expenses: | | | | |
Management fees | | | 509,195 | |
Distribution and service fees | | | 65,812 | |
Deferred trustees’ fees | | | 48,242 | |
Other expenses | | | 82,001 | |
| | | | |
Total Liabilities | | | 116,745,841 | |
| | | | |
Net Assets | | $ | 2,004,563,684 | |
| | | | |
Net assets consist of: | | | | |
Paid in surplus | | $ | 1,344,578,405 | |
Undistributed net investment income | | | 24,435,426 | |
Accumulated net realized gain | | | 452,603,145 | |
Unrealized appreciation on investments | | | 182,946,708 | |
| | | | |
Net Assets | | $ | 2,004,563,684 | |
| | | | |
Net Assets | | | | |
Class A | | $ | 1,666,090,780 | |
Class B | | | 278,606,205 | |
Class E | | | 59,866,699 | |
Capital Shares Outstanding* | | | | |
Class A | | | 138,652,906 | |
Class B | | | 23,357,555 | |
Class E | | | 5,002,326 | |
Net Asset Value, Offering Price and Redemption Price Per Share | | | | |
Class A | | $ | 12.02 | |
Class B | | | 11.93 | |
Class E | | | 11.97 | |
| * | The Portfolio is authorized to issue an unlimited number of shares. |
| (a) | Identified cost of investments was $1,915,808,427. |
| (b) | Includes securities loaned at value of $97,529,205. |
Statement of Operations
Year Ended December 31, 2013
| | | | |
Investment Income | | | | |
Dividends (a) | | $ | 36,063,958 | |
Interest | | | 3,985 | |
Securities lending income | | | 336,508 | |
| | | | |
Total investment income | | | 36,404,451 | |
Expenses | | | | |
Management fees | | | 11,794,670 | |
Administration fees | | | 34,079 | |
Custodian and accounting fees | | | 133,222 | |
Distribution and service fees—Class B | | | 645,390 | |
Distribution and service fees—Class E | | | 82,830 | |
Audit and tax services | | | 37,723 | |
Legal | | | 27,754 | |
Trustees’ fees and expenses | | | 44,794 | |
Shareholder reporting | | | 68,517 | |
Insurance | | | 9,645 | |
Miscellaneous | | | 13,594 | |
| | | | |
Total expenses | | | 12,892,218 | |
Less management fee waiver | | | (1,098,940 | ) |
| | | | |
Net expenses | | | 11,793,278 | |
| | | | |
Net Investment Income | | | 24,611,173 | |
| | | | |
Net Realized and Unrealized Gain | | | | |
| Net realized gain on: | | | | |
Investments | | | 466,982,923 | |
Net increase from payments by affiliates (b) | | | 934,692 | |
Futures contracts | | | 655,210 | |
Foreign currency transactions | | | 1,171 | |
| | | | |
Net realized gain | | | 468,573,996 | |
| | | | |
Net change in unrealized appreciation on investments | | | 24,861,022 | |
| | | | |
Net realized and unrealized gain | | | 493,435,018 | |
| | | | |
Net Increase in Net Assets from Operations | | $ | 518,046,191 | |
| | | | |
| (a) | Net of foreign withholding taxes of $167,463. |
| (b) | See Note 6 of the Notes to Financial Statements. |
See accompanying notes to financial statements.
MSF-8
Metropolitan Series Fund
BlackRock Large Cap Value Portfolio
Statements of Changes in Net Assets
| | | | | | | | |
| | | Year Ended
December 31,
2013 | | | Year Ended
December 31,
2012 | |
Increase (Decrease) in Net Assets: | | | | | | | | |
From Operations | | | | | | | | |
Net investment income | | $ | 24,611,173 | | | $ | 26,280,266 | |
Net realized gain | | | 468,573,996 | | | | 98,658,393 | |
Net change in unrealized appreciation | | | 24,861,022 | | | | 60,208,297 | |
| | | | | | | | |
Increase in net assets from operations | | | 518,046,191 | | | | 185,146,956 | |
| | | | | | | | |
From Distributions to Shareholders | | | | | | | | |
Net investment income | | | | | | | | |
Class A | | | (22,342,316 | ) | | | (15,946,608 | ) |
Class B | | | (3,019,181 | ) | | | (3,183,756 | ) |
Class E | | | (698,604 | ) | | | (743,261 | ) |
Net realized capital gains | | | | | | | | |
Class A | | | (86,380,800 | ) | | | (155,325,246 | ) |
Class B | | | (13,883,657 | ) | | | (36,212,657 | ) |
Class E | | | (2,986,287 | ) | | | (7,941,634 | ) |
| | | | | | | | |
Total distributions | | | (129,310,845 | ) | | | (219,353,162 | ) |
| | | | | | | | |
Increase (decrease) in net assets from capital share transactions | | | (75,741,307 | ) | | | 524,069,312 | |
| | | | | | | | |
Total increase in net assets | | | 312,994,039 | | | | 489,863,106 | |
| | |
Net Assets | | | | | | | | |
Beginning of period | | | 1,691,569,645 | | | | 1,201,706,539 | |
| | | | | | | | |
End of period | | $ | 2,004,563,684 | | | $ | 1,691,569,645 | |
| | | | | | | | |
| | |
Undistributed Net Investment Income | | | | | | | | |
End of period | | $ | 24,435,426 | | | $ | 25,900,568 | |
| | | | | | | | |
Other Information:
Capital Shares
Transactions in capital shares were as follows:
| | | | | | | | | | | | | | | | |
| | | Year Ended
December 31, 2013 | | | Year Ended
December 31, 2012 | |
| | | Shares | | | Value | | | Shares | | | Value | |
Class A | | | | | | | | | | | | | | | | |
Sales | | | 5,678,161 | | | $ | 62,157,473 | | | | 41,753,329 | | | $ | 392,781,573 | |
Reinvestments | | | 10,905,026 | | | | 108,723,116 | | | | 18,337,457 | | | | 171,271,854 | |
Redemptions | | | (22,293,363 | ) | | | (243,089,360 | ) | | | (6,623,469 | ) | | | (69,237,623 | ) |
| | | | | | | | | | | | | | | | |
Net increase (decrease) | | | (5,710,176 | ) | | $ | (72,208,771 | ) | | | 53,467,317 | | | $ | 494,815,804 | |
| | | | | | | | | | | | | | | | |
Class B | | | | | | | | | | | | | | | | |
Sales | | | 1,990,621 | | | $ | 21,535,137 | | | | 2,184,800 | | | $ | 21,522,198 | |
Reinvestments | | | 1,703,915 | | | | 16,902,838 | | | | 4,240,733 | | | | 39,396,413 | |
Redemptions | | | (3,924,903 | ) | | | (42,703,963 | ) | | | (3,481,801 | ) | | | (34,082,409 | ) |
| | | | | | | | | | | | | | | | |
Net increase (decrease) | | | (230,367 | ) | | $ | (4,265,988 | ) | | | 2,943,732 | | | $ | 26,836,202 | |
| | | | | | | | | | | | | | | | |
Class E | | | | | | | | | | | | | | | | |
Sales | | | 899,485 | | | $ | 9,788,145 | | | | 502,087 | | | $ | 4,978,153 | |
Reinvestments | | | 370,713 | | | | 3,684,891 | | | | 931,856 | | | | 8,684,895 | |
Redemptions | | | (1,171,740 | ) | | | (12,739,584 | ) | | | (1,150,967 | ) | | | (11,245,742 | ) |
| | | | | | | | | | | | | | | | |
Net increase | | | 98,458 | | | $ | 733,452 | | | | 282,976 | | | $ | 2,417,306 | |
| | | | | | | | | | | | | | | | |
Increase (decrease) derived from capital shares transactions | | | | | | $ | (75,741,307 | ) | | | | | | $ | 524,069,312 | |
| | | | | | | | | | | | | | | | |
See accompanying notes to financial statements.
MSF-9
Metropolitan Series Fund
BlackRock Large Cap Value Portfolio
Financial Highlights
| | | | | | | | | | | | | | | | | | | | |
| Selected per share data | | | | | | | | | | | | | | | |
| | | Class A | |
| | | Year Ended December 31, | |
| | | 2013 | | | 2012 | | | 2011 | | | 2010 | | | 2009 | |
Net Asset Value, Beginning of Period | | $ | 9.80 | | | $ | 10.36 | | | $ | 10.23 | | | $ | 9.46 | | | $ | 8.66 | |
| | | | | | | | | | | | | | | | | | | | |
Income (Loss) from Investment Operations | | | | | | | | | | | | | | | | | | | | |
Net investment income (a) | | | 0.15 | | | | 0.17 | | | | 0.15 | | | | 0.13 | | | | 0.14 | |
Net realized and unrealized gain on investments | | | 2.84 | | | | 1.21 | | | | 0.10 | | | | 0.74 | | | | 0.80 | |
| | | | | | | | | | | | | | | | | | | | |
Total from investment operations | | | 2.99 | | | | 1.38 | | | | 0.25 | | | | 0.87 | | | | 0.94 | |
| | | | | | | | | | | | | | | | | | | | |
Less Distributions | | | | | | | | | | | | | | | | | | | | |
Distributions from net investment income | | | (0.16 | ) | | | (0.18 | ) | | | (0.12 | ) | | | (0.10 | ) | | | (0.14 | ) |
Distributions from net realized capital gains | | | (0.61 | ) | | | (1.76 | ) | | | 0.00 | | | | 0.00 | | | | 0.00 | |
| | | | | | | | | | | | | | | | | | | | |
Total distributions | | | (0.77 | ) | | | (1.94 | ) | | | (0.12 | ) | | | (0.10 | ) | | | (0.14 | ) |
| | | | | | | | | | | | | | | | | | | | |
Net Asset Value, End of Period | | $ | 12.02 | | | $ | 9.80 | | | $ | 10.36 | | | $ | 10.23 | | | $ | 9.46 | |
| | | | | | | | | | | | | | | | | | | | |
Total Return (%) (b) | | | 32.05 | (c) | | | 14.28 | | | | 2.35 | | | | 9.22 | | | | 11.21 | |
| | | | | |
Ratios/Supplemental Data | | | | | | | | | | | | | | | | | | | | |
Gross ratio of expenses to average net assets (%) | | | 0.65 | | | | 0.66 | | | | 0.66 | | | | 0.65 | | | | 0.67 | |
Net ratio of expenses to average net assets (%) (d) | | | 0.59 | | | | 0.63 | | | | 0.63 | | | | 065 | | | | 0.67 | |
Ratio of net investment income to average net assets (%) | | | 1.35 | | | | 1.80 | | | | 1.41 | | | | 1.34 | | | | 1.61 | |
Portfolio turnover rate (%) | | | 113 | | | | 107 | | | | 107 | | | | 135 | | | | 113 | |
Net assets, end of period (in millions) | | $ | 1,666.1 | | | $ | 1,414.2 | | | $ | 941.4 | | | $ | 1,643.5 | | | $ | 1,671.2 | |
| | | | | | | | | | | | | | | | | | | | |
| | | Class B | |
| | | Year Ended December 31, | |
| | | 2013 | | | 2012 | | | 2011 | | | 2010 | | | 2009 | |
Net Asset Value, Beginning of Period | | $ | 9.73 | | | $ | 10.30 | | | $ | 10.18 | | | $ | 9.42 | | | $ | 8.61 | |
| | | | | | | | | | | | | | | | | | | | |
Income (Loss) from Investment Operations | | | | | | | | | | | | | | | | | | | | |
Net investment income (a) | | | 0.12 | | | | 0.15 | | | | 0.14 | | | | 0.10 | | | | 0.12 | |
Net realized and unrealized gain on investments | | | 2.82 | | | | 1.20 | | | | 0.08 | | | | 0.74 | | | | 0.80 | |
| | | | | | | | | | | | | | | | | | | | |
Total from investment operations | | | 2.94 | | | | 1.35 | | | | 0.22 | | | | 0.84 | | | | 0.92 | |
| | | | | | | | | | | | | | | | | | | | |
Less Distributions | | | | | | | | | | | | | | | | | | | | |
Distributions from net investment income | | | (0.13 | ) | | | (0.16 | ) | | | (0.10 | ) | | | (0.08 | ) | | | (0.11 | ) |
Distributions from net realized capital gains | | | (0.61 | ) | | | (1.76 | ) | | | 0.00 | | | | 0.00 | | | | 0.00 | |
| | | | | | | | | | | | | | | | | | | | |
Total distributions | | | (0.74 | ) | | | (1.92 | ) | | | (0.10 | ) | | | (0.08 | ) | | | (0.11 | ) |
| | | | | | | | | | | | | | | | | | | | |
Net Asset Value, End of Period | | $ | 11.93 | | | $ | 9.73 | | | $ | 10.30 | | | $ | 10.18 | | | $ | 9.42 | |
| | | | | | | | | | | | | | | | | | | | |
Total Return (%) (b) | | | 31.74 | (c) | | | 13.97 | | | | 2.05 | | | | 8.92 | | | | 11.05 | |
| | | | | |
Ratios/Supplemental Data | | | | | | | | | | | | | | | | | | | | |
Gross ratio of expenses to average net assets (%) | | | 0.90 | | | | 0.91 | | | | 0.91 | | | | 0.90 | | | | 0.92 | |
Net ratio of expenses to average net assets (%) (d) | | | 0.84 | | | | 0.88 | | | | 0.88 | | | | 0.90 | | | | 0.92 | |
Ratio of net investment income to average net assets (%) | | | 1.10 | | | | 1.52 | | | | 1.30 | | | | 1.08 | | | | 1.41 | |
Portfolio turnover rate (%) | | | 113 | | | | 107 | | | | 107 | | | | 135 | | | | 113 | |
Net assets, end of period (in millions) | | $ | 278.6 | | | $ | 229.5 | | | $ | 212.6 | | | $ | 200.8 | | | $ | 173.2 | |
Please see following page for Financial Highlights footnote legend.
See accompanying notes to financial statements.
MSF-10
Metropolitan Series Fund
BlackRock Large Cap Value Portfolio
Financial Highlights
| | | | | | | | | | | | | | | | | | | | |
| Selected per share data | | | | | | | | | | | | | | | |
| | | Class E | |
| | | Year Ended December 31, | |
| | | 2013 | | | 2012 | | | 2011 | | | 2010 | | | 2009 | |
Net Asset Value, Beginning of Period | | $ | 9.76 | | | $ | 10.32 | | | $ | 10.20 | | | $ | 9.44 | | | $ | 8.63 | |
| | | | | | | | | | | | | | | | | | | | |
Income (Loss) from Investment Operations | | | | | | | | | | | | | | | | | | | | |
Net investment income (a) | | | 0.13 | | | | 0.16 | | | | 0.14 | | | | 0.11 | | | | 0.13 | |
Net realized and unrealized gain on investments | | | 2.83 | | | | 1.21 | | | | 0.09 | | | | 0.74 | | | | 0.80 | |
| | | | | | | | | | | | | | | | | | | | |
Total from investment operations | | | 2.96 | | | | 1.37 | | | | 0.23 | | | | 0.85 | | | | 0.93 | |
| | | | | | | | | | | | | | | | | | | | |
Less Distributions | | | | | | | | | | | | | | | | | | | | |
Distributions from net investment income | | | (0.14 | ) | | | (0.17 | ) | | | (0.11 | ) | | | (0.09 | ) | | | (0.12 | ) |
Distributions from net realized capital gains | | | (0.61 | ) | | | (1.76 | ) | | | 0.00 | | | | 0.00 | | | | 0.00 | |
| | | | | | | | | | | | | | | | | | | | |
Total distributions | | | (0.75 | ) | | | (1.93 | ) | | | (0.11 | ) | | | (0.09 | ) | | | (0.12 | ) |
| | | | | | | | | | | | | | | | | | | | |
Net Asset Value, End of Period | | $ | 11.97 | | | $ | 9.76 | | | $ | 10.32 | | | $ | 10.20 | | | $ | 9.44 | |
| | | | | | | | | | | | | | | | | | | | |
Total Return (%) (b) | | | 31.88 | (c) | | | 14.14 | | | | 2.13 | | | | 9.00 | | | | 11.18 | |
| | | | | |
Ratios/Supplemental Data | | | | | | | | | | | | | | | | | | | | |
Gross ratio of expenses to average net assets (%) | | | 0.80 | | | | 0.81 | | | | 0.81 | | | | 0.80 | | | | 0.82 | |
Net ratio of expenses to average net assets (%) (d) | | | 0.74 | | | | 0.78 | | | | 0.78 | | | | 0.80 | | | | 0.82 | |
Ratio of net investment income to average net assets (%) | | | 1.20 | | | | 1.62 | | | | 1.37 | | | | 1.18 | | | | 1.55 | |
Portfolio turnover rate (%) | | | 113 | | | | 107 | | | | 107 | | | | 135 | | | | 113 | |
Net assets, end of period (in millions) | | $ | 59.9 | | | $ | 47.9 | | | $ | 47.7 | | | $ | 53.5 | | | $ | 57.5 | |
| (a) | Per share amounts based on average shares outstanding during the period. |
| (b) | Total return does not reflect any insurance, sales, separate account or administrative charges of variable annuity or life insurance contracts or any additional expenses that contract owners may bear under their variable contracts. If these charges were included, the returns would be lower. |
| (c) | In 2013 0.11%, 0.11% and 0.11% of the Portfolio’s total return for Class A, Class B and Class E, respectively, consists of a voluntary reimbursement by the subadvisor (See Note 6 of the Notes to Financial Statements). Excluding this item, total return would have been 31.94%, 31.63% and 31.77% for Class A, Class B and Class E, respectively. |
| (d) | Net ratio of expenses to average net assets includes the effect of management fee waivers as detailed in Note 6 of the Notes to Financial Statements. |
See accompanying notes to financial statements.
MSF-11
Metropolitan Series Fund
BlackRock Large Cap Value Portfolio
Notes to Financial Statements—December 31, 2013
1. Organization
Metropolitan Series Fund (the “Trust”) is organized as a Delaware statutory trust and registered under the Investment Company Act of 1940, as amended (the “1940 Act”), as an open-end management investment company. The Trust is currently comprised of thirty series, each of which operates as a distinct investment vehicle of the Trust. The portfolio included in this report is BlackRock Large Cap Value Portfolio (the “Portfolio”), which is diversified. Shares in the Portfolio are not offered directly to the general public and are currently available only to separate accounts established by Metropolitan Life Insurance Company (“MetLife”) and other affiliated life insurance companies.
The Portfolio has registered and offers three classes of shares: Class A, B, and E shares. Shares of each Class of the Portfolio represent an equal pro rata interest in the Portfolio and generally give the shareholder the same voting, dividend, liquidation, and other rights. Investment income, realized and unrealized capital gains and losses, the common expenses of the Portfolio, and certain Portfolio-level expense reductions, if any, are allocated on a pro rata basis to each Class based on the relative net assets of each Class to the net assets of the Portfolio. Each Class of shares differs in its respective distribution plan and such distribution expenses are allocated to that Class.
2. Significant Accounting Policies
The preparation of financial statements in conformity with accounting principles generally accepted in the United States of America (“GAAP”) requires management to make estimates and assumptions that affect the reported amounts of assets and liabilities and disclosure of contingent assets and liabilities as of the date of the financial statements and the reported amounts of income and expenses during the reporting period. Actual results could differ from those estimates. In the preparation of these financial statements, management has evaluated events and transactions subsequent to December 31, 2013 through the date the financial statements were issued.
The following is a summary of significant accounting policies consistently followed by the Portfolio in the preparation of its financial statements.
Investment Valuation and Fair Value Measurements - Debt securities (other than short term obligations with a remaining maturity of sixty days or less), including corporate, convertible and municipal bonds and notes; obligations of the U.S. treasury and U.S. government agencies; sovereign issues; floating rate loans; and non-U.S. bonds, are generally valued on the basis of evaluated or composite bid quotations obtained from independent pricing services and/or brokers and dealers selected by MetLife Advisers, LLC (“MetLife Advisers” or the “Adviser”), an affiliate of MetLife, Inc., pursuant to authorization of the Board of Trustees of the Trust (the “Board” or “Trustees”). Such quotations utilize matrix pricing, which considers observable inputs including, among other things, issuer details, maturity dates, interest rates, yield curves, rates of prepayment, credit risks/spreads, default rates, reported trades, broker dealer quotes and quoted prices for similar securities. Securities that use similar valuation techniques and inputs as described above are generally categorized as Level 2 within the fair value hierarchy.
Mortgage and asset-backed securities are usually issued as separate tranches, or classes, of securities within each deal. These securities are also generally valued on the basis of evaluated or composite bid quotations obtained from independent pricing services and/or brokers and dealers selected by the Adviser pursuant to authorization of the Board. The pricing models for these securities usually consider tranche-level attributes, estimated cash flows and market-based yield spreads for each tranche and current market data, and incorporate deal collateral performance, as available. Mortgage and asset-backed securities that use similar valuation techniques and inputs as described above are generally categorized as Level 2 within the fair value hierarchy.
Short term obligations with a remaining maturity of sixty days or less are generally valued at amortized cost, which approximates fair market value, and are generally categorized as Level 2 within the fair value hierarchy.
Domestic and foreign equity securities, such as common stock, exchange-traded funds, rights, warrants, and preferred stock, that are traded on a securities exchange, are generally valued at their last sale price on the exchange or market in which they are principally traded on the valuation date, or, if no sales occurred on that day, at the last reported bid price. Equity securities traded over-the-counter are generally valued at the last reported sale price. Valuation adjustments may be applied to certain foreign equity securities that are traded solely on foreign exchanges that close before the close of the U.S. market to account for the market movement between the close of the foreign exchanges and the close of the U.S. market. The Portfolio may use a systematic fair valuation model provided by an independent third party to value securities principally traded in these foreign markets in order to adjust for possible stale pricing that may occur between the close of the foreign exchanges and the time of the Portfolio valuation. Foreign equity securities using these valuation adjustments are generally categorized as Level 2 within the fair value hierarchy. Equity securities that are actively traded, and have no valuation adjustments applied, are categorized as Level 1 within the fair value hierarchy. Other equity securities traded on inactive markets, or valued in reference to similar instruments traded on active markets, are generally categorized as Level 2 within the fair value hierarchy.
MSF-12
Metropolitan Series Fund
BlackRock Large Cap Value Portfolio
Notes to Financial Statements—December 31, 2013—(Continued)
Investments in registered open-end management investment companies are valued at reported net asset value per share on the valuation date and are categorized as Level 1 within the fair value hierarchy.
Forward foreign currency exchange contracts are valued through an independent pricing service based on the mean between closing bid and ask prices of the forward currency rates in the London foreign exchange markets on a daily basis as provided by a reliable bank or dealer. These contracts are generally categorized as Level 2 within the fair value hierarchy.
Options, whether on securities, indices, futures contracts, or otherwise, traded on exchanges are valued at the last sale price available as of the close of business on the valuation date or, if there is no such price available, at the mean between the last reported bid and ask prices. These types of options are categorized as Level 1 within the fair value hierarchy. Futures contracts, which are traded on commodity exchanges, are valued at their closing prices as of the close of such exchanges and are categorized as Level 1 within the fair value hierarchy.
Options and futures contracts that are traded over-the-counter are generally valued on the basis of quotations provided by broker-dealers or prices provided by pricing service providers who use a series of techniques, including simulation pricing models, to determine the value of the contracts. The pricing models use inputs that are observed from actively quoted markets such as issuer details, indices, spreads, interest rates, yield curves, credit curves, measures of volatility and exchange rates. These contracts are generally categorized as Level 2 within the fair value hierarchy.
If no current market value quotation or other observable inputs are readily available or market value quotations are deemed to be unreliable for a security, the fair value of the security will be determined in accordance with procedures approved by and under the general supervision of the Board. In such a circumstance, the Board has delegated the determination of the fair value of a security to a Valuation Committee (“Committee”) of MetLife Advisers. The Committee provides general pricing oversight and fair value pricing determinations related to portfolio securities and meets on a regular basis to review reports relating to the valuation of the securities in the Portfolio. The Board has delegated to State Street Bank and Trust Company, the Trust’s custodian (“custodian”), the responsibility for calculating the net asset values (“NAVs”) of the Trust’s Portfolios. The Committee is responsible for overseeing the calculation of the NAVs of the Portfolios by the custodian. The Committee also periodically reviews pricing vendors, including the vendor providing fair value pricing for the Portfolio’s foreign securities, and is responsible for overseeing the correction of pricing errors and addressing other pricing issues that arise in the ordinary course of business, such as making real-time fair value determinations, as necessary.
No single standard for determining the fair value of a security can be set forth because fair value depends upon the facts and circumstances with respect to each security. Information relating to any relevant factors may be obtained by the Committee from any appropriate source, including the subadviser of the Portfolio, the custodian, a pricing service, market maker and/or broker for such security or the issuer. Appropriate methodologies for determining fair value under particular circumstances may include: matrix pricing, comparisons of securities with comparable characteristics, value based on multiples of earnings, discount from market price of similar marketable securities or a combination of these and other methods. The Committee maintains a detailed report tracking each fair-valued security that compares the fair value price to the next available trade, vendor or broker price, and provides information on how close the fair value price was to the next quoted price. The Committee reviews a summary of such report monthly. On a quarterly basis, the Board is provided with the following for consideration and ratification or adjustment: (1) a memorandum summarizing the actions taken by the Committee in the prior quarter; and (2) a list of the Portfolio’s securities as of the most recent quarter-end for which market quotations were not readily available.
Investment Transactions and Related Investment Income - Portfolio security transactions are recorded on the trade date. Dividend income is recorded on the ex-dividend date or, for certain foreign securities, when notified. Interest income, which includes amortization of premium and accretion of discount on debt securities, is recorded on the accrual basis. Realized gains and losses on investments are determined on the identified cost basis, which is the same basis used for federal income tax purposes. Foreign income and foreign capital gains on some foreign securities may be subject to foreign taxes, which are accrued as applicable. These foreign taxes have been provided for in accordance with the Portfolio’s understanding of the applicable countries’ tax rules and rates.
Foreign Currency Translation - The books and records of the Portfolio are maintained in U.S. dollars. The values of securities, currencies, and other assets and liabilities denominated in currencies other than the U.S. dollar are translated into U.S. dollars based upon foreign exchange rates prevailing at the end of the period. Purchases and sales of investment securities, income, and expenses are translated on the respective dates of such transactions. Because the values of investment securities are translated at the foreign exchange rates prevailing at the end of the period, that portion of the results of operations arising from changes in exchange rates and that portion of the results of operations reflecting fluctuations arising from changes in market prices of the investment securities are not separated. Such fluctuations are included in the net realized and unrealized gain or loss on investments.
Net realized foreign exchange gains or losses arise from activity in forward foreign currency exchange contracts, sales of foreign currency, currency gains or losses realized between the trade and settlement dates on securities transactions, and the difference between the amounts of dividends, interest, and foreign withholding taxes recorded by the Portfolio and the U.S. dollar equivalent of
MSF-13
Metropolitan Series Fund
BlackRock Large Cap Value Portfolio
Notes to Financial Statements—December 31, 2013—(Continued)
the amounts actually received or paid by the Portfolio. Net unrealized foreign exchange gains and losses arise from changes in the value of assets and liabilities, other than investment securities, resulting from changes in foreign exchange rates.
Income Taxes - It is the Portfolio’s policy to comply with the requirements of the Internal Revenue Code of 1986, as amended, and regulations thereunder, applicable to regulated investment companies and to distribute, with respect to each taxable year, all of its taxable income to shareholders. Therefore, no federal income tax provision is required. The Portfolio files U.S. federal tax returns. No income tax returns are currently under examination. The Portfolio’s federal tax returns for the prior three fiscal years remain subject to examination by the Internal Revenue Service. As of December 31, 2013, the Portfolio had no uncertain tax positions that would require financial statement recognition, or de-recognition or disclosure.
Dividends and Distributions to Shareholders - The Portfolio records dividends and distributions on the ex-dividend date. Net realized gains from security transactions (if any) are generally distributed annually to shareholders. The timing and characterization of certain income and capital gains distributions are determined in accordance with federal tax regulations that may differ from GAAP. Permanent book and tax basis differences relating to shareholder distributions will result in reclassification between under/over distributed net investment income, accumulated net realized gains/losses, and paid-in surplus. Book-tax differences are primarily due to foreign currency transactions. These adjustments have no impact on net assets or the results of operations.
Securities Lending - The Portfolio may lend its portfolio securities to certain qualified brokers who borrow securities in order to complete certain securities transactions. By lending its portfolio securities, the Portfolio attempts to increase its net investment income through the receipt of income on collateral held from securities on loan. Any gain or loss in the market price of the loaned securities that might occur and any interest earned or dividends declared during the term of the loan would accrue to the account of the Portfolio.
The Trust has entered into a securities lending arrangement with the custodian. Under this arrangement, the custodian is authorized to loan portfolio securities on the Portfolio’s behalf. In exchange, the Portfolio receives either cash or securities as collateral against the loaned securities. The Portfolio receives collateral at least equal to 102% of the market value of the loaned securities (105% for foreign equity securities), at each loan’s inception. Collateral representing at least 100% of the market value of the loaned securities must be maintained for the duration of the loan. A liability for cash collateral is reflected on the Statement of Assets and Liabilities, and is categorized as Level 2 within the fair value hierarchy. Cash collateral is generally invested in the State Street Navigator Securities Lending MET Portfolio (the “Navigator Portfolio”), a series of the State Street Navigator Securities Lending Trust that is managed by an affiliate of the custodian. The Navigator Portfolio is a registered money market fund that invests in a variety of high-quality, U.S. dollar-denominated instruments. If the market value of the collateral at the close of trading on a business day is less than 100% of the market value of the loaned securities at the close of trading on that day, the borrower shall be required to deliver, by the close of business on the following business day, an additional amount of collateral, so that the total amount of posted collateral is equal to at least 100% of the market value of all the loaned securities as of such preceding day. A portion of net income (income after the deduction of expenses and fees of the Navigator Portfolio) on the collateral is rebated to the borrower of the securities and the remainder is split between the custodian and the Portfolio. On loans collateralized by U.S. Treasuries, a fee is received from the borrower and is allocated between the Portfolio and the custodian. The risks associated with lending portfolio securities include, but are not limited to, possible delays in receiving additional collateral or in the recovery of the loaned securities, possible loss of rights in the collateral should the borrower fail financially, as well as risk of loss in the value of the collateral or the value of the investments made with the collateral. The lending agent has agreed to indemnify the Portfolio in the case of default of any securities borrower. Income received by the Portfolio in securities lending transactions during the year ended December 31, 2013 is reflected as Securities lending income on the Statement of Operations. Any outstanding loans by the Portfolio at December 31, 2013 are disclosed in the footnotes to the Schedule of Investments.
Repurchase Agreements - The Portfolio may enter into repurchase agreements, under the terms of a Master Repurchase Agreement, with selected commercial banks and broker-dealers, under which the Portfolio acquires securities as collateral and agrees to resell the securities at an agreed upon time and at an agreed-upon price. The Portfolio, through the custodian or a subcustodian, receives delivery of the underlying securities collateralizing any repurchase agreements. The Portfolio requires the custodian to take possession, to have legally segregated in the Federal Reserve Book Entry System, or to have segregated within the custodian’s vault, all securities held as collateral for repurchase agreements. It is the Portfolio’s policy that the market value of the collateral be at least equal to 100% of the repurchase price in the case of a repurchase agreement of one-day duration and at least equal to 102% of the repurchase price in the case of all other repurchase agreements. In the event of default or failure by a party to perform an obligation in connection with any repurchase transaction, the Master Repurchase Agreement gives the non-defaulting party the right to set-off claims and to apply property held by it in connection with any repurchase transaction against obligations owed to it.
At December 31, 2013, the Portfolio had investments in repurchase agreements with a gross value of $6,079,000, which is included as part of investments at value on the Statement of Assets and Liabilities. The value of the related collateral exceeded the value of the repurchase agreements at December 31, 2013.
MSF-14
Metropolitan Series Fund
BlackRock Large Cap Value Portfolio
Notes to Financial Statements—December 31, 2013—(Continued)
3. Investments in Derivative Instruments
Futures Contracts - The Portfolio may buy and sell futures contracts as a hedge, to maintain investment exposure to a target asset class or to enhance return. The Portfolio may be subject to fluctuations in equity prices, interest rates, commodity prices, and foreign currency exchange rates in the normal course of pursuing its investment objective. Futures contracts are standardized agreements to buy or sell a security, or deliver a final cash settlement price in connection with an index, interest rate, currency, or other asset. The Portfolio must deposit an amount (“initial margin”) equal to a certain percentage of the face value of the futures contract. The initial margin may be in the form of cash or securities, which is returned when the Portfolio’s obligations under the contract have been satisfied. If cash is deposited as the initial margin, it is shown as cash collateral on the Statement of Assets and Liabilities. Futures contracts are marked-to-market daily, and subsequent payments (“variation margin”) are made or received by the Portfolio depending on whether unrealized gains or losses are incurred. These amounts are reflected as receivables or payables on the Statement of Assets and Liabilities and as a component of net change in unrealized appreciation/depreciation on the Statement of Operations. When the contract is closed or expires, the Portfolio records a realized gain or loss equal to the difference between the value of the contract at the time it was opened and the value at the time it was closed. Risks of entering into futures contracts (and related options) include the possibility that the market for these instruments may be illiquid and that a change in the value of the contract or option may not correlate perfectly with changes in the value of the underlying instrument. Futures contracts are exchange-traded and the exchange’s clearinghouse, as counterparty to all exchange-traded futures, guarantees the futures contracts against default. For over-the-counter futures the Portfolio’s ability to terminate the positions may be more limited than in the case of exchange-traded positions and may also involve the risk that securities dealers participating in such transactions would fail to meet their obligations to the Portfolio.
During the year ended December 31, 2013, the Portfolio entered into equity index futures contracts which were subject to equity price risk. During the period May 8, 2013 through August 2, 2013, the Portfolio had bought and sold $103,454,293 in equity index futures contracts. At December 31, 2013, the Portfolio did not have any open futures contracts. For the year ended December 31, 2013, the Portfolio had realized gains in the amount of $655,210 which are shown under Net realized gain on futures contracts in the Statement of Operations.
4. Certain Risks
Market Risk: In the normal course of business, the Portfolio invests in securities and enters into transactions where risks exist due to fluctuations in the market (market risk) or failure of the other party to a transaction to perform (credit and counterparty risk). The value of securities held by the Portfolio may decline in response to certain events, including those directly involving the companies whose securities are owned by the Portfolio; conditions affecting the general economy; overall market changes; local, regional or global political, social or economic instability; currency, interest rate, and price fluctuations.
Credit and Counterparty Risk: The Portfolio may be exposed to counterparty risk, or the risk that an entity with which the Portfolio has unsettled or open transactions may default. The potential loss could exceed the value of the financial assets and liabilities recorded in the financial statements. Financial assets that potentially expose the Portfolio to credit and counterparty risk consist principally of cash due from counterparties and investments. The Portfolio manages counterparty risk by entering into agreements only with counterparties that it believes have the financial resources to honor their obligations and by monitoring the financial stability of those counterparties. The Portfolio’s investment adviser attempts to mitigate counterparty risk by (i) periodically assessing the creditworthiness of its trading partners, (ii) monitoring and/or limiting the amount of its net exposure to each individual counterparty based on its assessment, and (iii) requiring collateral from the counterparty for certain transactions. In order to preserve certain safeguards for non-standard settlement trades, the Portfolio restricts its exposure to credit and counterparty losses by entering into master netting agreements with counterparties (approved brokers) with whom it undertakes a significant volume of transactions. Master Agreements govern the terms of certain transactions, and reduce the counterparty risk associated with relevant transactions by specifying credit protection mechanisms and providing standardization that improves legal certainty. Master Agreements can also help limit counterparty risk by specifying collateral posting arrangements at pre-arranged exposure levels. Collateral requirements may differ by type of derivative or investment, as applicable. Collateral or margin requirements are set by the broker or exchange clearing house for exchange traded derivatives (e.g., futures contracts and exchange traded options) while collateral terms are contract specific for over-the-counter traded derivatives (e.g., forward foreign currency exchange contracts, swap agreements and over-the-counter options).
Repurchase and reverse repurchase agreements are primarily executed under Global Master Repurchase Agreements (“GMRAs”) or Master Repurchase Agreements (“MRAs”), which provide the rights to set-off. Each repurchase and reverse repurchase agreement is initially collateralized at the transaction level. In the event of default, the total market value exposure will be offset against collateral exchanged to date, which would result in a net receivable/(payable) that would be due from/to the counterparty.
Customer Account Agreements and related addendums govern cleared derivatives transactions such as futures, options on futures, and cleared OTC derivatives. Cleared derivative transactions require posting of initial margin as determined by each relevant clearing agency which is segregated at a broker account registered with the Commodities Futures Trading Commission (CFTC), or the
MSF-15
Metropolitan Series Fund
BlackRock Large Cap Value Portfolio
Notes to Financial Statements—December 31, 2013—(Continued)
applicable regulator. In the U.S., counterparty risk is significantly reduced as creditors of the futures broker do not have claim to Portfolio assets in the segregated account. Additionally, portability of exposure in the event of default further reduces risk to the Portfolio. Variation margin, or changes in market value, are exchanged daily, but may not be netted between futures and cleared OTC derivatives.
Additional risks associated with each type of investment are described above within the respective security type notes. The Portfolio’s prospectus includes a discussion of the principal risks of investing in the Portfolio.
5. Investment Transactions
Aggregate cost of purchases and proceeds of sales of investment securities, excluding short-term securities, for the year ended December 31, 2013 were as follows:
| | | | | | | | | | | | |
Purchases | | | Sales | |
U.S. Government | | Non U.S. Government | | | U.S. Government | | | Non U.S. Government | |
| $0 | | $ | 2,058,467,286 | | | $ | 0 | | | $ | 2,236,309,129 | |
During the year ended December 31, 2013, the Portfolio engaged in security transactions with other affiliated portfolios. These amounted to $32,210,418 in purchases of investments, which are included above.
6. Investment Management Fees and Other Transactions with Affiliates
Investment Management Agreement - MetLife Advisers is the investment adviser to the Portfolio. The Trust has entered into an investment management agreement with MetLife Advisers with respect to the Portfolio. For providing investment management services to the Portfolio, MetLife Advisers receives monthly compensation at the following annual rates:
| | | | | | |
Management
Fees earned by
MetLife Advisers
for the year ended
December 31, 2013 | | % per annum | | | Average Daily Net Assets |
| $11,794,670 | | | 0.700 | % | | On the first $250 million |
| | | 0.650 | % | | Of the next $500 million |
| | | 0.600 | % | | On amounts in excess of $750 million |
MetLife Advisers has entered into an investment subadvisory agreement with respect to the Portfolio. BlackRock Advisors, LLC (“BlackRock”) is compensated by MetLife Advisers to provide subadvisory services for the Portfolio.
Management Fee Waivers - Pursuant to an expense agreement, MetLife Advisers has agreed, for the period April 29, 2013 through April 27, 2014, to reduce its advisory fees set out above under “Investment Management Agreement” for each class of the Portfolio as follows:
| | |
% per annum | | Average Daily Net Assets |
| 0.020% | | Of the first $250 million |
| 0.025% | | On the next $500 million |
| 0.050% | | On amounts in excess of $1 billion |
An identical expense agreement was in place for the period April 30, 2012 through April 28, 2013. Amounts waived for the year ended December 31, 2013 amounted to $616,222 and are included in the total amount shown as management fee waivers in the Statement of Operations.
Additionally, BlackRock has agreed to waive subadvisory fees for the period December 2, 2013 through April 30, 2014. MetLife Advisers has agreed to reduce its advisory fee for the Portfolio by the amount waived by BlackRock. Amounts waived for the year ended December 31, 2013 amounted to $482,718 and are included in the total amount shown as management fee waivers in the Statement of Operations.
Certain officers and trustees of the Trust may also be officers of the Adviser; however, such officers and trustees receive no compensation from the Trust.
During the year ended December 31, 2013, the Subadvisor voluntarily reimbursed the Portfolio for certain trading costs during a transition of the Portfolio. This reimbursement is reflected as net increase from payments by affiliates in the Statement of Operations.
MSF-16
Metropolitan Series Fund
BlackRock Large Cap Value Portfolio
Notes to Financial Statements—December 31, 2013—(Continued)
Transfer Agency Agreement - MetLife serves as the transfer agent for the Trust. MetLife receives no fees for its services to the Trust under the transfer agency agreement.
Distribution and Service Fees - The Trust has a distribution agreement with MetLife Investors Distribution Company (“MIDC” or the “Distributor”) in which MIDC serves as the distributor for the Portfolio’s Class A, B and E Shares. MIDC is a wholly-owned subsidiary of MetLife Investors Group, Inc., an affiliate of the Adviser. The Trust has also adopted a Distribution and Service Plan under Rule 12b-1 of the 1940 Act for the Portfolio’s Class B and E Shares. Under the Distribution and Service Plan, the Class B and E Shares of the Portfolio pay a fee to compensate the Insurance Companies (or their affiliates) and other broker-dealers and financial intermediaries involved in the offer and sale of Portfolio shares for promoting or selling and servicing the Class B and E Shares. The fees under the Distribution and Service Plan for each class of the Portfolio’s shares are calculated as a percentage of the Portfolio’s average daily net assets that are attributable to that Class. Currently, the fee is 0.25% per year for Class B Shares and 0.15% per year for Class E Shares. Amounts incurred by the Portfolio for the year ended December 31, 2013 are shown as Distribution and service fees in the Statement of Operations.
Deferred Trustee Compensation - Each Trustee who is not currently an employee of the Adviser or any of its affiliates receives compensation from the Trust for his or her service to the Trust. A deferred compensation plan (the “Plan”) is available to the Trustees on a voluntary basis. Deferred amounts remain in the Trust until distributed in accordance with the provisions of the Plan. The value of a participating Trustee’s deferral account is based on theoretical investments of deferred amounts, on the normal payment dates in certain portfolios of the Trust or Met Investors Series Trust, an affiliate of the Trust, as designated by the participating Trustee. Changes in the value of participants’ deferral accounts are reflected as Trustees’ fees and expenses in the Statement of Operations. The portion of the accrued obligations allocated to the Portfolio under the Plan is reflected as Deferred trustees’ fees in the Statement of Assets and Liabilities.
7. Contractual Obligations
Under the Trust’s organizational documents, its officers and Trustees may be indemnified against certain liabilities and expenses arising out of the performance of their duties to the Trust. Additionally, the Trust has a variety of indemnification obligations under contracts with its service providers. The Trust’s maximum exposure under these arrangements is unknown, as this would involve future claims that may be made against the Trust that have not yet occurred.
8. Income Tax Information
The tax character of distributions paid for the periods ended December 31, 2013 and 2012 was as follows:
| | | | | | | | | | | | | | | | | | | | |
Ordinary Income | | | Long-Term Capital Gain | | | Total | |
2013 | | 2012 | | | 2013 | | | 2012 | | | 2013 | | | 2012 | |
| $59,229,615 | | $ | 49,065,752 | | | $ | 70,081,230 | | | $ | 170,287,410 | | | $ | 129,310,845 | | | $ | 219,353,162 | |
As of December 31, 2013, the components of distributable earnings (accumulated losses) on a federal income tax basis were as follows:
| | | | | | | | | | | | | | | | |
Undistributed
Ordinary
Income | | Undistributed
Long-Term
Capital Gain | | | Net
Unrealized
Appreciation | | | Loss
Carryforwards | | | Total | |
| $168,822,312 | | $ | 318,472,864 | | | $ | 172,738,344 | | | $ | — | | | $ | 660,033,520 | |
The Portfolio utilizes the provisions of the federal income tax laws that provide for the carryforward of capital losses for prior years, offsetting such losses against any future realized capital gains. Under the Regulated Investment Company Modernization Act of 2010 (the “Act”), net capital losses recognized after December 22, 2010 may be carried forward indefinitely and their character is retained as short-term and/or long-term losses. Previously, net capital losses were carried forward for up to eight years and treated as short-term losses. As a transition rule, the Act requires that post-enactment net capital losses be used before pre-enactment net capital losses.
As of December 31, 2013, the Portfolio had no post-enactment accumulated capital losses and no pre-enactment accumulated capital loss carryforwards.
MSF-17
Metropolitan Series Fund
BlackRock Large Cap Value Portfolio
Report of Independent Registered Public Accounting Firm
To the Shareholders of BlackRock Large Cap Value Portfolio and the Board of Trustees of Metropolitan Series Fund:
We have audited the accompanying statement of assets and liabilities, including the schedule of investments, of BlackRock Large Cap Value Portfolio, one of the portfolios constituting Metropolitan Series Fund, (the “Trust”) as of December 31, 2013, and the related statement of operations for the year then ended, the statements of changes in net assets for each of the two years in the period then ended, and the financial highlights for each of the five years in the period then ended. These financial statements and financial highlights are the responsibility of the Trust’s management. Our responsibility is to express an opinion on these financial statements and financial highlights based on our audits.
We conducted our audits in accordance with the standards of the Public Company Accounting Oversight Board (United States). Those standards require that we plan and perform the audit to obtain reasonable assurance about whether the financial statements and financial highlights are free of material misstatement. The Trust is not required to have, nor were we engaged to perform, an audit of its internal control over financial reporting. Our audits included consideration of internal control over financial reporting as a basis for designing audit procedures that are appropriate in the circumstances, but not for the purpose of expressing an opinion on the effectiveness of the Trust’s internal control over financial reporting. Accordingly, we express no such opinion. An audit also includes examining, on a test basis, evidence supporting the amounts and disclosures in the financial statements, assessing the accounting principles used and significant estimates made by management, as well as evaluating the overall financial statement presentation. Our procedures included confirmation of securities owned as of December 31, 2013, by correspondence with the custodian and brokers; where replies were not received from brokers, we performed other auditing procedures. We believe that our audits provide a reasonable basis for our opinion.
In our opinion, the financial statements and financial highlights referred to above present fairly, in all material respects, the financial position of BlackRock Large Cap Value Portfolio of Metropolitan Series Fund, as of December 31, 2013, the results of its operations for the year then ended, the changes in its net assets for each of the two years in the period then ended, and the financial highlights for each of the five years in the period then ended, in conformity with accounting principles generally accepted in the United States of America.
Deloitte & Touche LLP
Boston, Massachusetts
February 26, 2014
MSF-18
Metropolitan Series Fund
Trustees and Officers of Metropolitan Series Fund
The Trustees and executive officers of the Trust, their ages and their principal occupations during the past five years are set forth below. Unless otherwise indicated, the business address of each is One Financial Center, Boston, MA 02111. Each Trustee who is deemed an “interested person,” as such term is defined in the 1940 Act, is indicated by an asterisk. Those Trustees who are not “interested persons” as defined in the 1940 Act are referred to as “Independent Trustees.” Additional information about the Trustees is available in the Statement of Additional Information, which is available without charge, upon request, by calling (800) 848-3854.
Trustees of the Trust
| | | | | | | | | | |
Name and Age | | Position(s)
Held with
Registrant | | Term of Office
and Length of
Time Served | | Principal Occupation(s) During the Past 5
Years(1) | | Number of
Portfolios
in Fund
Complex(2)
overseen | | Other Directorships Held
by Trustee During the
Past 5 Years(1) |
| Interested Trustee | | | | | | | | | | |
| Elizabeth M. Forget* (47) | | Trustee, Chairman of the Board, President and Chief Executive Officer | | Indefinite;
From
May
2006
(President
and Chief
Executive
Officer)/
August
2006
(Trustee
and
Chairman
of the
Board) to
present | | Senior Vice President, MetLife Inc.; President, MetLife Advisers, LLC and a predecessor company. | | 79 | | Trustee, Met Investors Series Trust (the “MIST Trust”);** various MetLife-affiliated boards. |
| | | | | |
| Independent Trustees | | | | | | | | | | |
| Stephen M. Alderman (54) | | Trustee | | Indefinite;
From
April
2012 to
present | | Shareholder in the law firm of Garfield & Merel, Ltd. | | 79 | | Trustee, MIST Trust;** Director, International Truck Leasing Corp. |
| | | | | |
| Robert J. Boulware (57) | | Trustee | | Indefinite;
From
April
2012 to
present | | Managing Director, Pilgrim Funds, LLC (private equity fund). | | 79 | | Trustee, MIST Trust;** Trustee, Vertical Capital Income Fund (closed-end fund); Director, Gainsco, Inc. (auto insurance). |
| | | | | |
| Susan C. Gause (61) | | Trustee | | Indefinite;
From
April
2012 to
present | | Private Investor. | | 79 | | Trustee, MIST Trust;** Trustee, HSBC Funds. |
| | | | | |
| Nancy Hawthorne (62) | | Trustee | | Indefinite;
From
May
2003 to
present | | Chief Executive Officer, Clerestory LLC (corporate advisor). | | 79 | | MIST Trust;** Director, THL Credit, Inc.**; Director, Avid Technology, Inc.** |
| | | | | |
| Barbara A. Nugent (57) | | Trustee | | Indefinite;
From
January
2014 to
present | | President, True North Board Governance, LLC (consulting); until 2014, partner in the law firm of Stradley Ronon Stevens & Young, LLP. | | 79 | | Trustee, MIST Trust**; Director, Episcopal Healthcare Foundation; until 2014, member, Mutual Fund Directors Forum Advisory Board. |
MSF-19
Metropolitan Series Fund
Trustees and Officers of Metropolitan Series Fund—(Continued)
| | | | | | | | | | |
Name and Age | | Position(s)
Held with
Registrant | | Term of Office
and Length of
Time Served | | Principal Occupation(s) During the Past 5
Years(1) | | Number of
Portfolios
in Fund
Complex(2)
overseen | | Other Directorships Held
by Trustee During the
Past 5 Years(1) |
| Keith M. Schappert (62) | | Trustee | | Indefinite;
From
August
2009 to
present | | Principal, Schappert Consulting LLC (asset management consulting). | | 79 | | Trustee, MIST Trust;** Director, The Commonfund for Nonprofit Organizations; until 2011, Director, Trilogy Global Advisors; Director, Mirae Asset Discovery Funds,** Director, Calamos Investments. |
| | | | | |
| Linda B. Strumpf (66) | | Trustee | | Indefinite;
From
May
2000 to
present | | Chair of the Investment Committee, Leona M. and Harry B. Helmsley Charitable Trust; until 2011, Chief Investment Officer, Leona M. and Harry B. Helmsley Charitable Trust. | | 79 | | Since 2012, Trustee, MIST Trust,** Trustee and Member of Investment Committee, The Pennsylvania State University. |
| | | | | |
| Dawn M. Vroegop (47) | | Trustee | | Indefinite;
From
May
2009 to
present | | Private Investor. | | 79 | | Trustee, MIST Trust,** Trustee, Driehaus Mutual Funds; Director and Investment Committee Chair, City College of San Francisco Foundation. |
Executive Officers of the Trust
| | | | | | |
Name and Age | | Position(s) Held with
Registrant | | Term of Office
and Length of
Time Served | | Principal Occupation(s) During Past 5 Years(1) |
| Elizabeth M. Forget (47) | | President, Chief Executive Officer, Trustee and Chairman of the Board | | From May
2006 (President
and Chief
Executive
Officer)/
August 2006
(Trustee and
Chairman of
the Board) to
present | | See principal occupation information in the table above. |
| | | |
| Jeffrey L. Bernier (42) | | Vice President | | From February
2008 to present | | Vice President, MetLife, Inc.; Senior Vice President, MetLife Advisers, LLC and a predecessor company. |
| | | |
| Peter H. Duffy (58) | | Chief Financial Officer and Treasurer | | From November
2000 to present | | Senior Vice President, MetLife Advisers, LLC; Vice President, MetLife, Inc. |
| | | |
| Andrew L. Gangolf (59) | | Secretary | | From May
2011to present | | Senior Vice President, MetLife Advisers, LLC; Senior Vice President & Assistant General Counsel, AllianceBerstein Investments, Inc. |
| | | |
| Jeffrey P. Halperin (46) | | Chief Compliance Officer | | From November
2005 to present | | Vice President, MetLife, Inc.; Chief Compliance Officer, MIST; Chief Compliance Officer, MSF Trust; Chief Compliance Officer, MetLife Advisers, LLC and a predecessor company; Chief Compliance Officer, MetLife Investment Management, LLC (formerly MetLife Investment Advisors Company, LLC). |
| | | |
| Alan C. Leland, Jr. (61) | | Vice President | | From February
2005 to present | | Treasurer and Chief Financial Officer, MetLife Advisers, LLC; Vice President, MetLife Group Inc.; Vice President, MetLife, Inc. |
| * | Ms. Forget is an “interested person” of the Trust because of her positions with MetLife Advisers, LLC and her ownership of securities issued by MetLife, Inc., the ultimate parent company of MetLife Advisers, LLC. |
| ** | Indicates a directorship with a registered investment company or a company subject to the reporting requirements of the Securities Exchange Act of 1934, as amended. |
| (1) | Previous positions during the past five years with the Trust, MetLife, Inc. or the Adviser are omitted if not materially different. |
| (2) | The Fund Complex includes 49 Portfolios of the MIST Trust and 30 Portfolios of the Trust. |
MSF-20
Metropolitan Series Fund
BlackRock Large Cap Value Portfolio
Board of Trustees’ Consideration of Advisory and Sub-Advisory Agreements
At an in-person meeting of the Boards of Trustees (the “Board”) of Met Investors Series Trust and Metropolitan Series Fund (“MIST” and “MSF,” respectively, and collectively, the “Trusts”) held on November 19-20, 2013, the Board, including a majority of the Trustees who are not considered to be “interested persons” of the Trusts (the “Independent Trustees”) under the Investment Company Act of 1940, as amended (the “1940 Act”), approved for an annual period the continuation of each Trust’s advisory agreement (the “Advisory Agreement”) with MetLife Advisers, LLC (the “Adviser”) and the applicable sub-advisory agreements (each a “Sub-Advisory Agreement,” and collectively with the Advisory Agreement, the “Agreements”) between the Adviser and the investment sub-advisers (each a “Sub-Adviser,” and collectively, the “Sub-Advisers”) for each of the series of the Trusts, including the BlackRock Large Cap Value Portfolio (each a “Portfolio,” and collectively, the “Portfolios”).1
In considering the Agreements, the Board reviewed a variety of materials provided by the Adviser and the Sub-Advisers relating to the Portfolios, including comparative performance, fee and expense information for an appropriate peer group of similar mutual funds, performance information for relevant benchmark indices and other information regarding the nature, extent and quality of services provided by the Adviser and the Sub-Advisers under their respective Agreements. The Board also took into account its experience with the Adviser and the Sub-Advisers and information provided to the Board in its meetings throughout the year with respect to the services provided by the Adviser and the Sub-Advisers, including quarterly performance reports prepared by management containing reviews of investment results, and periodic presentations from certain of the Sub-Advisers with respect to the Portfolios they manage. The Independent Trustees also assessed reports provided by the Board’s independent consultant, who reviewed and provided analyses regarding investment performance, fees and expenses, and other information provided by, or at the direction of, the Adviser and the Sub-Advisers, as more fully discussed below.
The Independent Trustees were separately advised by independent legal counsel throughout the process, and met with independent legal counsel in periodic executive sessions. Prior to voting to continue the Agreements at the November meeting, the Independent Trustees also received a memorandum from their independent counsel discussing the legal standards for their consideration of the proposed continuation of the Agreements. The Board also met in person with personnel of the Adviser on September 17, 2013 for the specific purpose of giving preliminary consideration to the proposed continuation of the Agreements and to request additional information they considered reasonably necessary to their deliberations. The Independent Trustees also discussed the proposed continuation of the Agreements in private sessions with their independent legal counsel at which no representatives of management were present.
In considering whether to approve the renewal of the Advisory Agreement with the Adviser and any applicable Sub-Advisory Agreements with respect to a Portfolio, the Board reviewed and analyzed the factors it deemed relevant, including: (1) the nature, extent and quality of the services to be provided to the Portfolios by the Adviser and the Sub-Advisers; (2) the performance of the Portfolios as compared to a peer group and an appropriate index; (3) the Adviser’s and each of the Sub-Adviser’s personnel and operations; (4) the financial condition of the Adviser and of the Sub-Advisers; (5) the level and method of computing each Portfolio’s advisory and sub-advisory fees; (6) the profitability of the Adviser under the Advisory Agreement and of certain of the Sub-Advisers under the Sub-Advisory Agreements; (7) any “fall-out” benefits to the Adviser, the Sub-Advisers and their affiliates (i.e., ancillary benefits realized by the Adviser, the Sub-Advisers or their affiliates from the Adviser’s or Sub-Advisers’ relationship with the Trusts); (8) the anticipated effect of growth in size on Portfolio expenses; (9) fees paid to certain of the Sub-Advisers by comparable institutional and retail accounts; and (10) possible conflicts of interest.
Nature, extent and quality of services. The Board evaluated the nature, extent and quality of the services that the Adviser, and the Sub-Advisers as relevant, have provided to the Portfolios. The Board considered the Adviser’s services as investment manager to the Portfolios, including services relating to the selection and oversight of the Sub-Advisers for the applicable Portfolios. The Board considered, among other things, the Adviser’s oversight of the provision of services to the Portfolios by the Sub-Advisers, including with respect to investment activities and trading practices, and the Sub-Adviser’s compliance with fund policies, objectives and Board directives, compliance policies and procedures and applicable law. The Adviser’s services in coordinating and overseeing the activities of the Trusts’ other service providers were also considered. The Board also evaluated the expertise and performance of the personnel of the Adviser who performed services for the Portfolios throughout the year.
The Board considered information received from the Trust’s Chief Compliance Officer (“CCO”) regarding the Portfolios’ compliance policies and procedures established pursuant to Rule 38a-l under the 1940 Act. The Board also evaluated the CCO’s ongoing reports concerning the CCO’s oversight of the risk assessment processes of the Sub-Advisers.
1 The Pyramis Managed Risk Portfolio recently commenced operations and, therefore, the Agreement with respect to this Portfolio was not up for renewal.
MSF-21
Metropolitan Series Fund
BlackRock Large Cap Value Portfolio
Board of Trustees’ Consideration of Advisory and Sub-Advisory Agreements—(Continued)
With respect to the services provided by each of the Sub-Advisers, the Board considered, among other things, information provided to the Board by each Sub-Adviser. The Board considered the Sub-Adviser’s current level of staffing and its overall resources, as well as its compensation program. The Board reviewed each Sub-Adviser’s history and investment experience, as well as information regarding the qualifications, background and responsibilities of the Sub-Adviser’s investment and compliance personnel who provide services to the Portfolios. The Board also considered, among other things, the Sub-Adviser’s compliance program and any disciplinary history. The Board also took into account the Sub-Adviser’s risk assessment and monitoring process. The Board noted each Sub-Adviser’s regulatory history, including whether it was currently involved in any regulatory actions or investigations as well as material litigation, and any settlements and amelioratory actions undertaken, as appropriate. The Board also noted that the CCO and his staff conduct regular, periodic compliance reviews with each of the Sub-Advisers and present reports to the Independent Trustees regarding the same, which includes evaluating the regulatory compliance systems of the Sub-Advisers and procedures reasonably designed by them to help assure compliance with the federal securities laws, including issues related to late trading and market timing, best execution, fair value pricing, and proxy voting procedures, among others. The Board also took into account the financial condition of each Sub-Adviser. In its review, the Board also received and took into account information regarding any services and/or payments provided to the Adviser by the Sub-Advisers in connection with marketing activities.
The Board considered each Sub-Adviser’s investment process and philosophy. The Board took into account that each Sub-Adviser’s responsibilities include the development and maintenance of an investment program for the applicable Portfolio which is consistent with the Portfolio’s investment objectives, the selection of investment securities and the placement of orders for the purchase and sale of such securities, as well as the implementation of compliance controls related to performance of these services. The Board also reviewed each Sub-Adviser’s brokerage policies and practices.
Performance. The Board considered the performance of the Portfolios as described in the quarterly reports prepared by management, and as also analyzed in reports prepared by the Independent Trustees’ independent consultant. The Board noted that the Adviser reviews with the Board on a quarterly basis detailed information about the Portfolios’ performance results, portfolio composition and investment strategies. The Board also reviewed and considered a separate report prepared by Lipper Inc. (“Lipper”), an independent third party, which provided a statistical analysis comparing the Portfolios’ investment performance, expenses, and fees to comparable funds underlying variable insurance products (the “Performance Universe”). In addition, the Independent Trustees met separately with a representative of Bobroff Consulting, Inc., an independent consultant (“Bobroff), at a special board meeting in September 2013, to review the separate reports prepared by such consultant (“Bobroff Report”), which analyzed the report prepared by Lipper. The Board also considered each Portfolio’s more recent performance subsequent to the performance period covered by the Lipper reports, and management’s discussion of the same, including the effect of current market conditions on each Portfolio’s more recent performance.
The Board reviewed the Portfolios’ performance records and the Adviser’s and Sub-Advisers’ management styles and long-term performance records with the Portfolios and comparable funds. The Board focused particular attention on Portfolios with less favorable performance records. The Board was mindful of the Adviser’s focus on each Sub-Adviser’s performance and noted that the Adviser has been active in monitoring and responding to any performance issues with respect to the Portfolios. The Board also took into account its discussions with management regarding factors that contributed to the performance of the Portfolios.
Among other data relating specifically to the BlackRock Large Cap Value Portfolio’s performance, the Board considered that the Portfolio underperformed the median of its Performance Universe and its Lipper Index for the one-, three- and five-year periods ended June 30, 2013. The Board further considered that the Portfolio underperformed its benchmark, the Russell 1000 Value Index, for the one-, three- and five-year periods ended October 31, 2013. The Board also took into account management’s discussion of the Portfolio’s performance. The Board further noted the pending change in the Portfolio’s portfolio managers.
Fees and Expenses. The Board gave consideration to the advisory fees payable under the Advisory Agreement and the sub-advisory fees payable under each of the Sub-Advisory Agreements. In this regard, the Board reviewed the advisory fees payable on a Portfolio-by-Portfolio basis based on information provided by the Adviser. The Independent Trustees, with the assistance of Bobroff, also examined the fees paid by a Portfolio in light of fees paid to other investment managers by comparable funds, as well as considered the fees charged by the Adviser to manage other comparable funds, as applicable. The Lipper report included comparisons of the Adviser’s fee schedule with that of its peers based on an asset-based analysis of relative fee structures according to the size of the Portfolio. In addition, the Board considered the Portfolios’ advisory and sub-advisory fees and total expenses as compared to similarly situated investment companies underlying variable insurance products deemed to be comparable to the Portfolios as determined by Lipper. The Board considered a Portfolio’s ranking within a smaller group of peer funds chosen by Lipper (the “Expense Group”), as well as the Portfolio’s ranking within broader groups of funds (the “Expense Universe” and the “Sub-advised Expense Universe”). The Board
MSF-22
Metropolitan Series Fund
BlackRock Large Cap Value Portfolio
Board of Trustees’ Consideration of Advisory and Sub-Advisory Agreements—(Continued)
also considered a Portfolio’s contractual sub-advisory fees, as applicable, as compared to the Sub-advised Expense Universe as well as a smaller group of funds (the “Sub-advised Expense Group”). In comparing a Portfolio’s actual and contractual management fee to that of comparable funds, the Board noted that such fee includes both advisory and administrative fees.
The Board noted that the sub-advisory fees for the Portfolios are paid by the Adviser, not the Portfolios, out of the advisory fee. It was further noted that the Adviser negotiates such fees at arm’s length. The Board also considered that the Adviser had entered into expense limitation agreements with certain of the Portfolios, pursuant to which the Adviser has agreed to waive a portion of its advisory fee and/or reimburse certain expenses as a means of limiting a Portfolio’s total annual operating expenses. The Board further considered the amount of sub-advisory fees paid out by the Adviser and the amount of the management fees that it retained in light of the services performed by Sub-Advisers and Adviser, respectively.
With respect to the BlackRock Large Cap Value Portfolio, the Board considered that the Portfolio’s actual management fees and total expenses (exclusive of 12b-1 fees) were below the Expense Group median, the Expense Universe median, and the Sub-advised Expense Universe median. The Board further noted that the Portfolio’s contractual management fees were below the asset-weighted average of the Expense Group at the Portfolio’s current size. The Board also noted that the Portfolio’s contractual sub-advisory fees were below the average of the Sub-advised Expense Group and Sub-advised Expense Universe at the Portfolio’s current size. The Board further noted that the Adviser had waived fees and/or reimbursed expenses during the past year.
Profitability. The Board examined the profitability of the Adviser on a Portfolio-by-Portfolio basis. The Board also considered that the Distributor, MetLife Investors Distribution Company, receives Rule 12b-1 payments to support the distribution of the products. The Board considered the profitability to the Sub-Advisers and their affiliates as a result of their relationships with the Portfolios, and the Board considered the ability of the Adviser to negotiate the Sub-Advisory Agreements and the fees thereunder at arm’s length. The Board also reviewed Portfolio specific data with regard to the profitability of the Portfolios to each Sub-Adviser, as available.
Economies of scale. The Board also considered the effect of the Portfolios’ growth in size on their fees. The Board noted that the fee schedules for most of the Portfolios contain breakpoints that reduce the fee rate above specified asset levels. The Board noted those Portfolios that did not contain breakpoints in the advisory fee and took into account management’s discussion of the same. The Board noted that those Portfolios with advisory fee schedules containing breakpoints generally reflect the inclusion of breakpoints in the sub-advisory fee schedule for such Portfolios. The Board considered the effective fees under the Advisory Agreement for a Portfolio as a percentage of assets at different asset levels and possible economies of scale that may be realized if the assets of the Portfolio grow. Among other data, the Board examined the effect of a Portfolio’s growth in size on various fee schedules and reviewed the Lipper and Bobroff Reports, which compared fees among peers. The Board also generally noted that if a Portfolio’s assets increase over time, the Portfolio may realize other economies of scale if assets increase proportionally more than certain other fixed expenses. In addition, the Board noted that the Adviser had taken a number of steps to date intended to share the benefits of economies of scale with contractholders.
With respect to the BlackRock Large Cap Value Portfolio, the Board noted that the Portfolio’s advisory fee and sub-advisory fee each contains breakpoints that reduce the advisory fee rate on assets above certain specified asset levels. The Board considered the fact that the Portfolio’s fee levels decline as portfolio assets increase.
Other factors. As part of its evaluation of the Adviser’s compensation, the Board considered other benefits that may be realized by the Adviser and its affiliates from their relationship with the Trusts. Among them, the Board recognized that an affiliate of the Adviser, MetLife Investors Distribution Company, serves as the Distributor for the Trusts, and, as such, receives payments pursuant to Rule 12b-1 from the Portfolios to compensate it for providing shareholder services and selling activities, which could lead to growth in the Trusts’ assets and corresponding benefits from such growth, including economies of scale. The Board also considered that affiliates of the Adviser may benefit from certain indirect tax benefits relating to dividend received deductions and foreign tax credits. In conjunction with these considerations, the Board noted the costs of providing investment management and other services to the Portfolios and the ongoing commitment of the Adviser to the Portfolios.
The Board considered other benefits that may be realized by each Sub-Adviser and its affiliates from their relationship with the Trusts, including the opportunity to provide advisory services to additional portfolios of the Trusts and reputational benefits. In conjunction with these considerations, the Board noted the costs of providing investment advisory services to the Portfolios and the ongoing commitment of the Sub-Advisers to the Portfolios.
The Board considered possible conflicts of interest in the form of material benefits or detriments to the Trusts resulting from the nature of the Trusts’ and the Adviser’s or the Sub-Advisers’ affiliations and the services that are provided to the Trusts, and the manner in which such conflicts were mitigated.
MSF-23
Metropolitan Series Fund
BlackRock Large Cap Value Portfolio
Board of Trustees’ Consideration of Advisory and Sub-Advisory Agreements—(Continued)
Conclusions. After full consideration of the factors discussed above, the Board, including a majority of the Independent Trustees, approved the Advisory Agreement and the Sub-Advisory Agreement, as applicable, with respect to each Portfolio, unless otherwise noted. In making its approvals, the Board concluded that the nature, extent and quality of services provided by the Adviser and each Sub-Adviser supported the renewal of the Agreements. The Board also concluded that the investment performance of each Fund was such that each Agreement should continue. In addition, the Board concluded that fees paid by a Portfolio to the Adviser and, if applicable, the Sub-Adviser appeared to be acceptable in light of nature, extent and quality of the services provided by the Adviser and Sub-Adviser. Further, the Board concluded that the Adviser’s profitability in providing services under the Advisory Agreements did not appear unreasonably high in light of the nature, extent and quality of the services provided by the Adviser. Finally, the Board concluded that the Advisory and Sub-Advisory fees in some measure share economies of scale with contractholders. In approving the renewal of each of the Agreements, the Board, including the Independent Trustees, did not identify any single factor as controlling, and generally attributed different weights to various factors for the various Portfolios. The Board evaluated all information available to them on a Portfolio-by-Portfolio basis, and their decisions were made separately with respect to each Portfolio.
MSF-24
Metropolitan Series Fund
BlackRock Money Market Portfolio
Managed by BlackRock Advisors, LLC
Portfolio Manager Commentary*
PERFORMANCE
For the one year period ended December 31, 2013, the Class A, B, and E shares of the BlackRock Money Market Portfolio returned 0.00%, 0.00%, and 0.00%; respectively. The Portfolio’s benchmark, the Bank of America/Merrill Lynch 3-month U.S. Treasury Index1, returned 0.07%.
MARKET ENVIRONMENT / CONDITIONS
Modest economic growth and persistently high unemployment led the Federal Open Market Committee (the “Committee”) to maintain its target range for the federal funds rate at 0.00% to 0.25% throughout 2013. At its regularly scheduled meeting on December 18, the Committee took the long-expected step of modestly reducing by $10 billion the pace of its monthly asset purchases. Citing “the cumulative progress toward maximum employment and the improvement in the outlook for labor market conditions,” the Committee decided that beginning in January it would purchase long-term U.S. Treasury bonds at a pace of $40 billion per month rather than $45 billion, and that it would add to its holdings of agency mortgage-backed securities at a pace of $35 billion per month rather than $40 billion.
In late September, the U.S. Treasury warned that the national debt would breach its statutory maximum soon after October 17. As political brinksmanship over fiscal policy ensued in the first half of October, volatility in the short-term Treasury bill market escalated dramatically, with investors selling short-dated Treasury bills into thin markets characterized by wide bid/offer spreads. After a last-minute deal was reached, extending the nation’s borrowing authority into the first quarter of 2014, the Treasury bill market quickly normalized.
In Europe, sub-par growth and a weak inflation environment compelled policymakers to employ an increasingly accommodative monetary policy throughout 2013. Late in the first quarter of the year, a severe banking crisis led to drastic measures in Cyprus. To the surprise of many, European leaders and Cypriot officials agreed upon a plan to impose a levy on bank depositors as a condition for the country to preserve its membership in the euro currency bloc. While the reaction in financial markets was short-lived, critics contend the move sets a dangerous precedent at a decisive time for the region. Subsequent to these events, the currency bloc received a crucial vote of confidence in September with the decisive re-election of Chancellor Angela Merkel in Germany. This was seen as an endorsement by German voters of her strong support for the euro. Ongoing efforts on the part of the European Central Bank (the “ECB”) to resuscitate the eurozone economy with record-low interest rates met only limited success in lifting growth measures. At the same time, inflation measures drifted lower, falling to 0.7% in October, less than half the ECB’s target rate. These conditions prompted the ECB to unexpectedly cut its main rate to 0.25% from 0.50% in November. This unexpectedly swift reaction reinforced the widely held view that ECB president Mario Draghi would do “whatever it takes” to preserve the eurozone. London Interbank Offered Rates (“LIBOR”) notched lower over the 12 months, due in large part to central bank liquidity measures, coupled with decreasing supply in the money market space. All told, three-month LIBOR fell 0.06% to close at 0.25% as of December 31, 2013.
PORTFOLIO REVIEW / PERIOD END POSITIONING
To begin 2013, the Portfolio maintained a laddered structure with a bias toward a longer weighted average maturity (“WAM”). Duration was added through the purchase of commercial paper and certificates of deposit out to a maximum maturity of 365 days. Exposures to U.S. Treasury securities were also increased. Toward the latter half of the year, yields in the very front end of the curve began to move lower, causing investors to concentrate their investments in the 3- to 6-month sector. This shift in investor strategy caused the yield curve on credits maturing in 6 months or less to compress. To adjust for this environment, the Portfolio shifted its strategy to a more barbell structure by adding exposures to select, highly-rated credits in the 12-month space, while offsetting this with investments 30 days and shorter. Additionally, exposures to variable-rate bank obligations maturing in 12 months were increased to effectively manage WAM limits, while also being an effective way to lock in exposure at an attractive spread. Said investments reset off the daily Fed Funds Effective Rate, the 1-month LIBOR Index, or the 3-month LIBOR Index. The Portfolio continued to purchase U.S. Treasury securities based on valuation amidst the declining supply of eligible alternatives. However, total U.S. Treasury holdings decreased toward the end of the year and certain maturities were avoided due to increased concerns surrounding the U.S. debt ceiling limit.
The WAM of the Portfolio stood at 55 days on December 31, 2013.
BlackRock Liquidity Team
Portfolio Managers
BlackRock Advisors, LLC
1 The Bank of America/Merrill Lynch 3-Month U.S. Treasury Bill Index is composed of a single 90-day Treasury Bill issue, or potentially a seasoned 6-month or 1-year Treasury Bill issue, that is replaced on a monthly basis.
* This commentary may include statements that constitute “forward-looking statements” under the U.S. securities laws. Forward-looking statements include, among other things, projections, estimates, and information about possible or future results related to the Portfolio, market or regulatory developments. The views expressed above are not guarantees of future performance or economic results and involve certain risks, uncertainties and assumptions that could cause actual outcomes and results to differ materially from the views expressed herein. The views expressed above are subject to change at any time based upon economic, market, or other conditions and the subadvisory firm undertakes no obligation to update the views expressed herein. Any discussions of specific securities should not be considered a recommendation to buy or sell those securities. The views expressed above (including any forward-looking statement) may not be relied upon as investment advice or as an indication of the Portfolio’s trading intent. Information about the Portfolio’s holdings, asset allocation or country diversification is historical and is not an indication of future Portfolio composition, which may vary. Direct investment in any index is not possible. The performance of any index mentioned in this commentary has not been adjusted for ongoing management, distribution and operating expenses, and sales charges applicable to mutual fund investments. In addition, the returns do not reflect additional fees charged by separate accounts or variable insurance contracts that an investor in the Portfolio may pay. If these additional fees were reflected, performance would have been lower.
MSF-1
Metropolitan Series Fund
BlackRock Money Market Portfolio
Understanding Your Portfolio’s Expenses
Shareholder Expense Example
As a shareholder of the Portfolio, you incur ongoing costs, including management fees; distribution and service (12b-1) fees; and other Portfolio expenses. This example is intended to help you understand your ongoing costs (in dollars) (referred to as “expenses”) of investing in the Portfolio and compare these costs with the ongoing costs of investing in other mutual funds. The example is based on an investment of $1,000 invested at the beginning of the period and held for the entire period, July 1, 2013 through December 31, 2013.
Actual Expenses
The first line for each share class of the Portfolio in the table below provides information about actual account values and actual expenses. You may use the information in this line, together with the amount you invested in the particular share class of the Portfolio, to estimate the expenses that you paid over the period. Simply divide your account value by $1,000 (for example, an $8,600 account value divided by $1,000 = 8.6), then multiply the result by the number in the first line under the heading entitled “Expenses Paid During Period” to estimate the expenses you paid on your account during this period.
Hypothetical Example for Comparison Purposes
The second line for each share class of the Portfolio in the table below provides information about hypothetical account values and hypothetical expenses based on the Portfolio’s actual expense ratio and an assumed rate of return of 5% per year before expenses, which is not the Portfolio’s actual return. The hypothetical account values and expenses may not be used to estimate the actual ending account balance or expenses you paid for the period. You may use this information to compare the ongoing costs of investing in the Portfolio and other funds. To do so, compare this 5% hypothetical example with the 5% hypothetical examples that appear in the shareholder reports of the other funds.
Please note that the expenses shown in the table are meant to highlight your ongoing costs only and do not reflect any fees or charges of your variable insurance product or any additional expenses that participants in certain eligible qualified plans may bear relating to the operations of their plan. Therefore, the second line for each share class in the table is useful in comparing ongoing costs only, and will not help you determine the relative total costs of owning different funds. In addition, if these other costs were included, your costs would have been higher.
| | | | | | | | | | | | | | | | | | |
BlackRock Money Market Portfolio | | | | Annualized
Expense
Ratio | | | Beginning
Account Value
July 1,
2013 | | | Ending
Account Value
December 31,
2013 | | | Expenses Paid
During Period**
July 1, 2013
to
December 31,
2013 | |
Class A(a) | | Actual | | | 0.22 | % | | $ | 1,000.00 | | | $ | 1,000.00 | | | $ | 1.11 | |
| | Hypothetical* | | | 0.22 | % | | $ | 1,000.00 | | | $ | 1,024.10 | | | $ | 1.12 | |
| | | | | |
Class B(a) | | Actual | | | 0.22 | % | | $ | 1,000.00 | | | $ | 1,000.00 | | | $ | 1.11 | |
| | Hypothetical* | | | 0.22 | % | | $ | 1,000.00 | | | $ | 1,024.10 | | | $ | 1.12 | |
| | | | | |
Class E(a) | | Actual | | | 0.22 | % | | $ | 1,000.00 | | | $ | 1,000.00 | | | $ | 1.11 | |
| | Hypothetical* | | | 0.22 | % | | $ | 1,000.00 | | | $ | 1,024.10 | | | $ | 1.12 | |
* Hypothetical assumes a rate of return of 5% per year before expenses.
** Expenses paid are equal to the Portfolio’s annualized expense ratio for the most recent six month period, as shown above, multiplied by the average account value over the period, multiplied by the number of days (184 days) in the most recent fiscal half-year, divided by 365 (to reflect the one-half year period).
(a) The annualized expense ratio shown reflects the impact of the management fee waiver as described in Note 4 of the Notes to Financial Statements.
MSF-2
Metropolitan Series Fund
BlackRock Money Market Portfolio
Schedule of Investments as of December 31, 2013
Short-Term Investments—100.3% of Net Assets
Certificate of Deposit—33.5%
| | | | | | | | |
| Security Description | | Principal
Amount* | | | Value | |
|
Foreign Banks Yankee Dollar—29.2% | |
Bank of Montreal (Chicago)
0.200%, 01/15/14 | | | 5,000,000 | | | $ | 5,000,000 | |
0.238%, 09/05/14 (a) | | | 10,000,000 | | | | 10,000,000 | |
0.344%, 01/10/14 (a) | | | 10,000,000 | | | | 10,000,000 | |
Bank of Nova Scotia (Houston)
0.280%, 08/08/14 | | | 5,000,000 | | | | 5,000,000 | |
BNP Paribas S.A. (NY)
0.298%, 05/09/15 | | | 7,000,000 | | | | 7,000,000 | |
0.329%, 02/03/14 (a) | | | 8,000,000 | | | | 8,000,000 | |
0.700%, 02/14/14 | | | 5,000,000 | | | | 5,002,586 | |
Canadian Imperial Bank of Commerce (NY)
0.244%, 06/13/14 (a) | | | 2,900,000 | | | | 2,900,000 | |
0.270%, 02/04/14 (a) | | | 8,000,000 | | | | 8,000,000 | |
0.270%, 03/03/14 (a) | | | 8,000,000 | | | | 8,000,000 | |
Credit Suisse (NY)
0.260%, 03/18/14 | | | 8,000,000 | | | | 8,000,000 | |
0.260%, 04/22/14 | | | 14,000,000 | | | | 14,000,000 | |
0.319%, 06/06/14 (a) | | | 5,000,000 | | | | 5,000,000 | |
Deutsche Bank AG (NY)
0.260%, 04/30/14 | | | 10,000,000 | | | | 10,000,000 | |
0.290%, 02/28/14 (a) | | | 10,000,000 | | | | 10,000,000 | |
Mitsubishi UFJ Trust & Banking Corp. (NY)
0.280%, 02/20/14 | | | 8,000,000 | | | | 8,000,000 | |
Mizuho Bank, Ltd. (NY)
0.230%, 03/14/14 | | | 10,000,000 | | | | 10,000,000 | |
National Australia Bank, Ltd. (NY)
0.239%, 08/08/14 (a) | | | 8,000,000 | | | | 8,000,562 | |
0.239%, 08/13/14 (a) | | | 5,000,000 | | | | 5,000,000 | |
Natixis (NY)
0.289%, 03/06/14 (a) | | | 10,000,000 | | | | 9,999,319 | |
Nordea Bank Finland plc (NY)
0.250%, 01/30/14 | | | 5,000,000 | | | | 4,999,980 | |
0.250%, 02/03/14 | | | 5,000,000 | | | | 5,000,000 | |
Norinchukin Bank (NY)
0.100%, 01/06/14 | | | 55,000,000 | | | | 55,000,000 | |
Rabobank Nederland (NY)
0.278%, 09/16/14 | | | 29,000,000 | | | | 29,000,000 | |
0.390%, 01/17/14 | | | 15,000,000 | | | | 15,000,000 | |
0.405%, 01/08/14 | | | 14,000,000 | | | | 14,000,000 | |
Royal Bank of Canada (NY)
0.230%, 01/15/14 (a) | | | 7,000,000 | | | | 7,000,000 | |
0.245%, 03/27/14 (a) | | | 6,000,000 | | | | 6,000,000 | |
0.270%, 10/10/14 (a) | | | 5,500,000 | | | | 5,500,000 | |
Societe Generale (NY)
0.336%, 09/19/14 (a) | | | 8,000,000 | | | | 8,000,000 | |
Sumitomo Mitsui Banking Corp. (NY)
0.230%, 02/10/14 | | | 20,000,000 | | | | 20,000,000 | |
Sumitomo Mitsui Trust Bank, Ltd. (NY)
0.220%, 04/04/14 | | | 10,000,000 | | | | 10,000,000 | |
Svenska Handelsbanken (NY)
0.255%, 01/17/14 | | | 8,000,000 | | | | 8,000,018 | |
Toronto Dominion Bank (NY)
0.166%, 02/19/14 (a) | | | 10,000,000 | | | | 10,000,000 | |
0.234%, 07/24/14 (a) | | | 8,000,000 | | | | 8,000,000 | |
|
Foreign Banks Yankee Dollar—(Continued) | |
Toronto Dominion Bank (NY)
0.240%, 09/04/14 | | | 10,000,000 | | | | 10,000,000 | |
0.250%, 08/12/14 | | | 12,000,000 | | | | 12,000,000 | |
Westpac Banking Corp. (NY)
0.238%, 10/08/14 (a) | | | 10,000,000 | | | | 10,000,000 | |
0.247%, 08/28/14 (a) | | | 7,000,000 | | | | 7,000,000 | |
0.280%, 04/15/14 (a) | | | 14,500,000 | | | | 14,500,000 | |
| | | | | | | | |
| | | | | | | 415,902,465 | |
| | | | | | | | |
|
Domestic Banks—2.6% | |
Wells Fargo Bank N.A.
0.190%, 03/12/14 | | | 10,000,000 | | | | 10,000,000 | |
0.220%, 02/10/14 | | | 10,000,000 | | | | 10,000,000 | |
0.235%, 11/26/14 | | | 12,000,000 | | | | 12,000,000 | |
0.250%, 09/09/14 | | | 5,000,000 | | | | 5,000,698 | |
| | | | | | | | |
| | | | | | | 37,000,698 | |
| | | | | | | | |
|
Foreign Banks Eurodollar—1.7% | |
National Australia Bank, Ltd. (London) | | | | | | | | |
0.240%, 10/23/14 | | | 14,000,000 | | | | 14,000,000 | |
0.250%, 03/07/14 | | | 10,000,000 | | | | 10,000,000 | |
| | | | | | | | |
| | | | | | | 24,000,000 | |
| | | | | | | | |
Total Certificate of Deposit
(Cost $476,903,163) | | | | | | | 476,903,163 | |
| | | | | | | | |
|
| Financial Company Commercial Paper (b)—30.8% | |
Australia & New Zealand Banking Group, Ltd.
0.275%, 02/25/14 | | | 10,000,000 | | | | 10,000,000 | |
0.314%, 01/17/14 | | | 10,000,000 | | | | 10,000,000 | |
Bank of Tokyo Mitsubishi UFJ, Ltd. (NY)
0.203%, 01/27/14 | | | 31,975,000 | | | | 31,970,381 | |
BNP Paribas Finance, Inc.
0.315%, 03/18/14 | | | 6,000,000 | | | | 5,996,073 | |
0.325%, 06/10/14 | | | 5,000,000 | | | | 4,992,889 | |
0.335%, 06/06/14 | | | 8,000,000 | | | | 7,988,560 | |
BNZ International Funding, Ltd.
0.162%, 03/11/14 | | | 10,000,000 | | | | 9,996,933 | |
0.244%, 02/21/14 | | | 8,000,000 | | | | 7,997,280 | |
Collateralized Commercial Paper Co., LLC
0.305%, 03/11/14 | | | 10,000,000 | | | | 9,994,250 | |
Collateralized Commercial Paper II Co., LLC
0.305%, 03/11/14 | | | 11,000,000 | | | | 10,993,675 | |
Commonwealth Bank of Australia
0.204%, 02/24/14 | | | 5,000,000 | | | | 5,000,000 | |
0.208%, 03/03/14 | | | 6,000,000 | | | | 5,999,949 | |
0.237%, 05/15/14 | | | 10,000,000 | | | | 10,000,000 | |
0.238%, 11/20/14 | | | 3,000,000 | | | | 3,000,000 | |
0.239%, 05/02/14 | | | 8,000,000 | | | | 8,000,000 | |
0.264%, 03/28/14 | | | 7,000,000 | | | | 7,001,037 | |
DnB Bank ASA
0.233%, 01/28/14 | | | 10,000,000 | | | | 9,998,275 | |
0.259%, 02/06/14 | | | 7,000,000 | | | | 6,998,215 | |
See accompanying notes to financial statements.
MSF-3
Metropolitan Series Fund
BlackRock Money Market Portfolio
Schedule of Investments as of December 31, 2013
Short-Term Investments—(Continued)
Financial Company Commercial Paper (b)—(Continued)
| | | | | | | | |
| Security Description | | Principal
Amount* | | | Value | |
DnB Bank ASA
0.264%, 01/22/14 | | | 10,000,000 | | | $ | 9,998,483 | |
0.264%, 01/27/14 | | | 10,000,000 | | | | 9,998,122 | |
Erste Abwicklungsanstalt
0.213%, 03/10/14 | | | 7,000,000 | | | | 6,997,223 | |
HSBC Bank plc
0.244%, 10/30/14 | | | 13,000,000 | | | | 13,000,000 | |
0.255%, 10/22/14 | | | 13,000,000 | | | | 13,000,000 | |
0.268%, 09/09/14 | | | 6,000,000 | | | | 6,000,000 | |
0.271%, 09/11/14 | | | 7,000,000 | | | | 7,000,000 | |
ING U.S. Funding, LLC
0.294%, 02/07/14 | | | 10,000,000 | | | | 9,997,020 | |
Lloyds Bank plc
0.030%, 01/02/14 | | | 20,000,000 | | | | 19,999,983 | |
Mizuho Funding, LLC
0.203%, 02/26/14 | | | 8,000,000 | | | | 7,997,511 | |
0.218%, 01/06/14 | | | 8,000,000 | | | | 7,999,761 | |
0.223%, 01/22/14 | | | 10,000,000 | | | | 9,998,717 | |
0.228%, 02/03/14 | | | 10,000,000 | | | | 9,997,938 | |
Nederlandse Waterschapsbank NV
0.217%, 08/13/14 | | | 10,000,000 | | | | 10,000,000 | |
0.237%, 02/18/14 | | | 6,000,000 | | | | 6,000,000 | |
0.248%, 11/03/14 | | | 8,000,000 | | | | 8,000,000 | |
0.276%, 07/30/14 | | | 2,000,000 | | | | 2,000,233 | |
0.278%, 07/28/14 | | | 2,000,000 | | | | 2,000,231 | |
Nordea Bank AB
0.244%, 08/12/14 | | | 15,000,000 | | | | 14,977,700 | |
0.254%, 01/09/14 | | | 10,250,000 | | | | 10,249,431 | |
0.259%, 01/10/14 | | | 4,000,000 | | | | 3,999,745 | |
Skandinaviska Enskilda Banken AB
0.279%, 04/09/14 | | | 14,000,000 | | | | 13,989,520 | |
0.279%, 05/07/14 | | | 11,000,000 | | | | 10,989,413 | |
Societe Generale North America, Inc.
0.254%, 03/06/14 | | | 10,000,000 | | | | 9,995,764 | |
Sumitomo Mitsui Banking Corp.
0.208%, 03/06/14 | | | 7,000,000 | | | | 6,997,449 | |
Svenska Handelsbanken, Inc.
0.208%, 05/08/14 | | | 20,000,000 | | | | 19,985,536 | |
0.254%, 02/04/14 | | | 7,000,000 | | | | 6,998,347 | |
Westpac Banking Corp.
0.235%, 10/30/14 | | | 15,000,000 | | | | 15,000,000 | |
| | | | | | | | |
Total Financial Company Commercial Paper (Cost $439,095,644) | | | | | | | 439,095,644 | |
| | | | | | | | |
|
| Asset Backed Commercial Paper (b)—22.1% | |
Antalis U.S. Funding Corp.
0.264%, 02/07/14 | | | 5,700,000 | | | | 5,698,477 | |
Barton Capital, LLC
0.061%, 01/02/14 | | | 7,000,000 | | | | 6,999,988 | |
0.071%, 01/06/14 | | | 20,000,000 | | | | 19,999,806 | |
Bedford Row Funding Corp.
0.274%, 07/01/14 | | | 10,000,000 | | | | 9,986,425 | |
0.305%, 03/17/14 | | | 10,000,000 | | | | 9,993,750 | |
0.305%, 03/19/14 | | | 7,000,000 | | | | 6,995,508 | |
0.305%, 11/25/14 | | | 5,000,000 | | | | 4,986,333 | |
Cancara Asset Securitisation, LLC
0.041%, 01/02/14 | | | 20,000,000 | | | | 19,999,978 | |
Gemini Securitization, LLC
0.101%, 01/02/14 | | | 35,000,000 | | | | 34,999,903 | |
Jupiter Securitization Co., LLC
0.234%, 06/02/14 | | | 5,000,000 | | | | 4,995,144 | |
Kells Funding, LLC
0.238%, 10/15/14 | | | 5,000,000 | | | | 4,999,601 | |
Liberty Street Funding, LLC
0.010%, 01/02/14 | | | 30,000,000 | | | | 29,999,992 | |
0.152%, 02/03/14 | | | 10,775,000 | | | | 10,773,518 | |
LMA Americas, LLC
0.091%, 01/02/14 | | | 15,000,000 | | | | 14,999,963 | |
Matchpoint Master Trust
0.051%, 01/02/14 | | | 15,000,000 | | | | 14,999,979 | |
Mont Blanc Capital Corp.
0.254%, 02/10/14 | | | 12,000,000 | | | | 11,996,667 | |
Nieuw Amsterdam Receivables Corp.
0.172%, 01/09/14 | | | 5,000,000 | | | | 4,999,811 | |
0.172%, 01/21/14 | | | 5,000,000 | | | | 4,999,528 | |
0.172%, 03/03/14 | | | 12,000,000 | | | | 11,996,543 | |
Old Line Funding, LLC
0.234%, 06/09/14 | | | 3,000,000 | | | | 2,996,953 | |
0.244%, 03/17/14 | | | 10,000,000 | | | | 9,995,000 | |
Scaldis Capital, LLC
0.203%, 02/13/14 | | | 5,000,000 | | | | 4,998,806 | |
Starbird Funding Corp.
0.071%, 01/02/14 | | | 20,000,000 | | | | 19,999,961 | |
0.162%, 02/03/14 | | | 10,000,000 | | | | 9,998,533 | |
Victory Receivables Corp.
0.142%, 01/24/14 | | | 12,000,000 | | | | 11,998,927 | |
0.172%, 01/07/14 | | | 10,000,000 | | | | 9,999,717 | |
0.172%, 01/22/14 | | | 10,000,000 | | | | 9,999,008 | |
| | | | | | | | |
Total Asset Backed Commercial Paper
(Cost $314,407,819) | | | | | | | 314,407,819 | |
| | | | | | | | |
|
| Treasury Debt—8.2% | |
U.S. Treasury Bills
0.086%, 08/21/14 (b) | | | 15,000,000 | | | | 14,991,783 | |
0.107%, 11/13/14 (b) | | | 10,000,000 | | | | 9,990,783 | |
0.112%, 12/11/14 (b) | | | 9,214,000 | | | | 9,204,315 | |
0.122%, 11/13/14 (b) | | | 10,000,000 | | | | 9,989,467 | |
0.132%, 12/11/14 (b) | | | 8,000,000 | | | | 7,990,062 | |
U.S. Treasury Notes
0.250%, 10/31/14 | | | 11,000,000 | | | | 11,010,628 | |
1.750%, 01/31/14 | | | 19,286,000 | | | | 19,311,254 | |
1.875%, 02/28/14 | | | 10,000,000 | | | | 10,027,228 | |
2.375%, 10/31/14 | | | 14,000,000 | | | | 14,257,040 | |
4.750%, 05/15/14 | | | 10,000,000 | | | | 10,168,594 | |
| | | | | | | | |
Total Treasury Debt
(Cost $116,941,154) | | | | | | | 116,941,154 | |
| | | | | | | | |
See accompanying notes to financial statements.
MSF-4
Metropolitan Series Fund
BlackRock Money Market Portfolio
Schedule of Investments as of December 31, 2013
Short-Term Investments—(Continued)
Other Instrument—3.1%
| | | | | | | | |
| Security Description | | Principal
Amount* | | | Value | |
Natixis
0.050%, 01/02/14 | | | 45,000,000 | | | $ | 45,000,000 | |
| | | | | | | | |
Total Other Instrument
(Cost $45,000,000) | | | | | | | 45,000,000 | |
| | | | | | | | |
|
| Government Agency Debt—1.0% | |
Fannie Mae
0.135%, 02/27/15 (a) | | | 15,000,000 | | | | 14,995,639 | |
| | | | | | | | |
Total Government Agency Debt
(Cost $14,995,639) | | | | | | | 14,995,639 | |
| | | | | | | | |
|
| Other Note—0.8% | |
Svenska Handelsbanken AB
0.277%, 05/13/16 (144A) (a) | | | 11,100,000 | | | | 11,100,000 | |
| | | | | | | | |
Total Other Note
(Cost $11,100,000) | | | | | | | 11,100,000 | |
| | | | | | | | |
| Government Agency Repurchase Agreement—0.8% | |
| Security Description | | Principal
Amount* | | | Value | |
Deutsche Bank Securities, Inc.
Repurchase Agreement dated 12/31/13 at 0.020% to be repurchased at $11,000,012 on 01/02/14 collateralized by $21,309,000 U.S. Government Agency Obligations with a rates ranging from of 0.000% - 3.150%, maturity dates ranging from 04/25/28 - 12/27/32 with a value of $11,220,130. | | | 11,000,000 | | | | 11,000,000 | |
| | | | | | | | |
Total Government Agency Repurchase Agreement
(Cost $11,000,000) | | | | | | | 11,000,000 | |
| | | | | | | | |
Total Short-Term Investments
(Cost $1,429,443,419) | | | | | | | 1,429,443,419 | |
| | | | | | | | |
Total Investments—100.3%
(Cost $1,429,443,419) (c) | | | | | | | 1,429,443,419 | |
Other assets and liabilities (net)—(0.3)% | | | | | | | (4,683,466 | ) |
| | | | | | | | |
| Net Assets—100.0% | | | | | | $ | 1,424,759,953 | |
| | | | | | | | |
| * | Principal amount stated in U.S. dollars unless otherwise noted. |
| (a) | Variable or floating rate security. The stated rate represents the rate at December 31, 2013. Maturity date shown for callable securities reflects the earliest possible call date. |
| (b) | The rate shown represents the discount rate at the time of purchase by the Portfolio unless otherwise noted. |
| (c) | As of December 31, 2013, the aggregate cost of investments for federal income tax purposes was $1,429,443,419. |
| (144A)— | Securities exempt from registration under Rule 144A of the Securities Act of 1933. These securities may be resold in transactions exempt from registration, normally to qualified institutional buyers. As of December 31, 2013, the market value of 144A securities was $11,100,000, which is 0.8% of net assets. |
See accompanying notes to financial statements.
MSF-5
Metropolitan Series Fund
BlackRock Money Market Portfolio
Schedule of Investments as of December 31, 2013
Fair Value Hierarchy
Accounting principles generally accepted in the United States of America (“GAAP”) define fair market value as the price that the Portfolio would receive to sell an asset or pay to transfer a liability in an orderly transaction between market participants at the measurement date. It establishes a fair value hierarchy that prioritizes inputs to valuation methods and requires disclosure of the fair value hierarchy that segregates fair value measurements into three levels. Levels 1, 2 and 3 of the fair value hierarchy are defined as follows:
Level 1 - unadjusted quoted prices in active markets for identical investments
Level 2 - other significant observable inputs (including, but not limited to, unadjusted quoted prices for similar investments in markets that are either active or inactive; inputs other than quoted prices that are observable such as interest rates, yield curves, volatilities, prepayment speeds, loss severities, credit risks, default rates, etc.)
Level 3 - significant unobservable inputs based on the best information available in the circumstances, to the extent observable inputs are unavailable (including the Portfolio’s own assumptions in determining the fair value of investments)
The inputs or methodologies used for valuing investments are not necessarily an indication of the risk associated with investing in them. Changes to the inputs or methodologies used may result in transfers between levels, which will be recognized as of the beginning of the reporting period. Information on transfers between Level 1 and Level 2, if any, will be disclosed following the fair value hierarchy table below. A reconciliation of Level 3 securities, if any, will also be disclosed following the fair value hierarchy table. For more information about the Portfolio’s policy regarding the valuation of investments, please refer to the Notes to Financial Statements.
The following table summarizes the fair value hierarchy of the Portfolio’s investments as of December 31, 2013:
| | | | | | | | | | | | | | | | |
| Description | | Level 1 | | | Level 2 | | | Level 3 | | | Total | |
| Short-Term Investments | | | | | | | | | | | | | | | | |
Certificate of Deposit* | | $ | — | | | $ | 476,903,163 | | | $ | — | | | $ | 476,903,163 | |
Financial Company Commercial Paper | | | — | | | | 439,095,644 | | | | — | | | | 439,095,644 | |
Asset Backed Commercial Paper | | | — | | | | 314,407,819 | | | | — | | | | 314,407,819 | |
Treasury Debt | | | — | | | | 116,941,154 | | | | — | | | | 116,941,154 | |
Other Instrument | | | — | | | | 45,000,000 | | | | — | | | | 45,000,000 | |
Government Agency Debt | | | — | | | | 14,995,639 | | | | — | | | | 14,995,639 | |
Other Note | | | — | | | | 11,100,000 | | | | — | | | | 11,100,000 | |
Government Agency Repurchase Agreement | | | — | | | | 11,000,000 | | | | — | | | | 11,000,000 | |
Total Short-Term Investments | | | — | | | | 1,429,443,419 | | | | — | | | | 1,429,443,419 | |
Total Investments | | $ | — | | | $ | 1,429,443,419 | | | $ | — | | | $ | 1,429,443,419 | |
| | | | | | | | | | | | | | | | | |
| * | See Schedule of Investments for additional detailed categorizations. |
See accompanying notes to financial statements.
MSF-6
Metropolitan Series Fund
BlackRock Money Market Portfolio
Statement of Assets and Liabilities
December 31, 2013
| | | | |
Assets | | | | |
Investments at amortized cost | | $ | 1,429,443,419 | |
Cash | | | 75,755 | |
Receivable for: | | | | |
Fund shares sold | | | 3,656,085 | |
Interest | | | 653,309 | |
Prepaid expenses | | | 4,020 | |
| | | | |
Total Assets | | | 1,433,832,588 | |
Liabilities | | | | |
Payables for: | | | | |
Fund shares redeemed | | | 8,691,712 | |
Accrued expenses: | | | | |
Management fees | | | 254,792 | |
Deferred trustees’ fees | | | 52,947 | |
Other expenses | | | 73,184 | |
| | | | |
Total Liabilities | | | 9,072,635 | |
| | | | |
Net Assets | | $ | 1,424,759,953 | |
| | | | |
Net assets consist of: | | | | |
Paid in surplus | | $ | 1,424,808,157 | |
Undistributed net investment loss | | | (52,948 | ) |
Accumulated net realized gain | | | 4,744 | |
| | | | |
Net Assets | | $ | 1,424,759,953 | |
| | | | |
Net Assets | | | | |
Class A | | $ | 536,372,732 | |
Class B | | | 651,279,134 | |
Class E | | | 237,108,087 | |
Capital Shares Outstanding* | | | | |
Class A | | | 5,363,708 | |
Class B | | | 6,512,828 | |
Class E | | | 2,371,091 | |
Net Asset Value, Offering Price and Redemption Price Per Share | | | | |
Class A | | $ | 100.00 | |
Class B | | | 100.00 | |
Class E | | | 100.00 | |
| * | The Portfolio is authorized to issue an unlimited number of shares. |
Statement of Operations
Year Ended December 31, 2013
| | | | |
Investment Income | | | | |
Interest | | $ | 3,532,956 | |
| | | | |
Total investment income | | | 3,532,956 | |
Expenses | | | | |
Management fees | | | 5,067,088 | |
Administration fees | | | 22,043 | |
Custodian and accounting fees | | | 127,348 | |
Distribution and service fees—Class B | | | 1,717,923 | |
Distribution and service fees—Class E | | | 411,044 | |
Audit and tax services | | | 27,901 | |
Legal | | | 27,755 | |
Trustees’ fees and expenses | | | 35,356 | |
Shareholder reporting | | | 55,104 | |
Insurance | | | 7,649 | |
Miscellaneous | | | 15,136 | |
| | | | |
Total expenses | | | 7,514,347 | |
Less distribution and service fee waivers | | | (2,128,967 | ) |
Less management fee waiver | | | (1,852,424 | ) |
| | | | |
Net expenses | | | 3,532,956 | |
| | | | |
Net Investment Income | | | — | |
| | | | |
See accompanying notes to financial statements.
MSF-7
Metropolitan Series Fund
BlackRock Money Market Portfolio
Statements of Changes in Net Assets
| | | | | | | | |
| | | Year Ended
December 31,
2013 | | | Year Ended
December 31,
2012 | |
Increase (Decrease) in Net Assets: | | | | | | | | |
From Operations | | | | | | | | |
Net investment income | | $ | — | | | $ | — | |
| | | | | | | | |
Increase in net assets from operations | | | — | | | | — | |
| | | | | | | | |
Decrease in net assets from capital share transactions | | | (208,038,907 | ) | | | (313,473,829 | ) |
| | | | | | | | |
Total decrease in net assets | | | (208,038,907 | ) | | | (313,473,829 | ) |
| | | | | | | | |
Net Assets | | | | | | | | |
Beginning of period | | | 1,632,798,860 | | | | 1,946,272,689 | |
| | | | | | | | |
End of period | | $ | 1,424,759,953 | | | $ | 1,632,798,860 | |
| | | | | | | | |
Undistributed Net Investment Loss | | | | | | | | |
End of period | | $ | (52,948 | ) | | $ | (48,204 | ) |
| | | | | | | | |
Other Information:
Capital Shares
Transactions in capital shares were as follows:
| | | | | | | | | | | | | | | | |
| | | Year Ended
December 31, 2013 | | | Year Ended
December 31, 2012 | |
| | | Shares | | | Value | | | Shares | | | Value | |
Class A | | | | | | | | | | | | | | | | |
Sales | | | 3,898,725 | | | $ | 389,872,252 | | | | 2,924,409 | | | $ | 292,440,214 | |
Redemptions | | | (4,053,585 | ) | | | (405,358,526 | ) | | | (4,484,216 | ) | | | (448,421,558 | ) |
| | | | | | | | | | | | | | | | |
Net decrease | | | (154,860 | ) | | $ | (15,486,274 | ) | | | (1,559,807 | ) | | $ | (155,981,344 | ) |
| | | | | | | | | | | | | | | | |
Class B | | | | | | | | | | | | | | | | |
Sales | | | 4,421,002 | | | $ | 442,100,037 | | | | 4,362,373 | | | $ | 436,236,871 | |
Redemptions | | | (5,622,674 | ) | | | (562,267,377 | ) | | | (5,294,949 | ) | | | (529,494,843 | ) |
| | | | | | | | | | | | | | | | |
Net decrease | | | (1,201,672 | ) | | $ | (120,167,340 | ) | | | (932,576 | ) | | $ | (93,257,972 | ) |
| | | | | | | | | | | | | | | | |
Class E | | | | | | | | | | | | | | | | |
Sales | | | 1,476,172 | | | $ | 147,617,026 | | | | 1,694,630 | | | $ | 169,462,443 | |
Redemptions | | | (2,200,023 | ) | | | (220,002,319 | ) | | | (2,336,970 | ) | | | (233,696,956 | ) |
| | | | | | | | | | | | | | | | |
Net decrease | | | (723,851 | ) | | $ | (72,385,293 | ) | | | (642,340 | ) | | $ | (64,234,513 | ) |
| | | | | | | | | | | | | | | | |
Decrease derived from capital shares transactions | | | | | | $ | (208,038,907 | ) | | | | | | $ | (313,473,829 | ) |
| | | | | | | | | | | | | | | | |
See accompanying notes to financial statements.
MSF-8
Metropolitan Series Fund
BlackRock Money Market Portfolio
Financial Highlights
| | | | | | | | | | | | | | | | | | | | |
| Selected per share data | | | | | | | | | | | | | | | |
| | | Class A | |
| | | Year Ended December 31, | |
| | | 2013 | | | 2012 | | | 2011 | | | 2010 | | | 2009 | |
Net Asset Value, Beginning of Period | | $ | 100.00 | | | $ | 100.00 | | | $ | 100.00 | | | $ | 100.00 | | | $ | 100.00 | |
| | | | | | | | | | | | | | | | | | | | |
Income (Loss) from Investment Operations | | | | | | | | | | | | | | | | | | | | |
Net investment income (a) | | | 0.00 | | | | 0.00 | | | | 0.00 | | | | 0.01 | | | | 0.42 | |
| | | | | | | | | | | | | | | | | | | | |
Total from investment operations | | | 0.00 | | | | 0.00 | | | | 0.00 | | | | 0.01 | | | | 0.42 | |
| | | | | | | | | | | | | | | | | | | | |
Less Distributions | | | | | | | | | | | | | | | | | | | | |
Distributions from net investment income | | | 0.00 | | | | 0.00 | | | | 0.00 | | | | (0.01 | ) | | | (0.42 | ) |
| | | | | | | | | | | | | | | | | | | | |
Total distributions | | | 0.00 | | | | 0.00 | | | | 0.00 | | | | (0.01 | ) | | | (0.42 | ) |
| | | | | | | | | | | | | | | | | | | | |
Net Asset Value, End of Period | | $ | 100.00 | | | $ | 100.00 | | | $ | 100.00 | | | $ | 100.00 | | | $ | 100.00 | |
| | | | | | | | | | | | | | | | | | | | |
Total Return (%) (b) | | | 0.00 | | | | 0.00 | | | | 0.00 | | | | 0.01 | | | | 0.42 | |
| | | | | |
Ratios/Supplemental Data | | | | | | | | | | | | | | | | | | | | |
Gross ratio of expenses to average net assets (%) | | | 0.35 | | | | 0.35 | | | | 0.35 | | | | 0.34 | | | | 0.37 | |
Net ratio of expenses to average net assets (%) (c) | | | 0.23 | | | | 0.28 | | | | 0.26 | | | | 0.30 | | | | 0.36 | |
Ratio of net investment income to average net assets (%) | | | 0.00 | | | | 0.00 | | | | 0.00 | | | | 0.01 | | | | 0.45 | |
Net assets, end of period (in millions) | | $ | 536.4 | | | $ | 551.9 | | | $ | 707.8 | | | $ | 712.9 | | | $ | 1,023.8 | |
| | | | | | | | | | | | | | | | | | | | |
| | | Class B | |
| | | Year Ended December 31, | |
| | | 2013 | | | 2012 | | | 2011 | | | 2010 | | | 2009 | |
Net Asset Value, Beginning of Period | | $ | 100.00 | | | $ | 100.00 | | | $ | 100.00 | | | $ | 100.00 | | | $ | 100.00 | |
| | | | | | | | | | | | | | | | | | | | |
Income (Loss) from Investment Operations | | | | | | | | | | | | | | | | | | | | |
Net investment income (a) | | | 0.00 | | | | 0.00 | | | | 0.00 | | | | 0.00 | | | | 0.25 | |
| | | | | | | | | | | | | | | | | | | | |
Total from investment operations | | | 0.00 | | | | 0.00 | | | | 0.00 | | | | 0.00 | | | | 0.25 | |
| | | | | | | | | | | | | | | | | | | | |
Less Distributions | | | | | | | | | | | | | | | | | | | | |
Distributions from net investment income | | | 0.00 | | | | 0.00 | | | | 0.00 | | | | 0.00 | | | | (0.25 | ) |
| | | | | | | | | | | | | | | | | | | | |
Total distributions | | | 0.00 | | | | 0.00 | | | | 0.00 | | | | 0.00 | | | | (0.25 | ) |
| | | | | | | | | | | | | | | | | | | | |
Net Asset Value, End of Period | | $ | 100.00 | | | $ | 100.00 | | | $ | 100.00 | | | $ | 100.00 | | | $ | 100.00 | |
| | | | | | | | | | | | | | | | | | | | |
Total Return (%) (b) | | | 0.00 | | | | 0.00 | | | | 0.00 | | | | 0.00 | | | | 0.25 | |
| | | | | |
Ratios/Supplemental Data | | | | | | | | | | | | | | | | | | | | |
Gross ratio of expenses to average net assets (%) | | | 0.60 | | | | 0.60 | | | | 0.60 | | | | 0.59 | | | | 0.62 | |
Net ratio of expenses to average net assets (%) (c) | | | 0.23 | | | | 0.28 | | | | 0.26 | | | | 0.31 | | | | 0.54 | |
Ratio of net investment income to average net assets (%) | | | 0.00 | | | | 0.00 | | | | 0.00 | | | | 0.00 | | | | 0.26 | |
Net assets, end of period (in millions) | | $ | 651.3 | | | $ | 771.5 | | | $ | 864.7 | | | $ | 793.6 | | | $ | 992.9 | |
Please see following page for Financial Highlights footnote legend.
See accompanying notes to financial statements.
MSF-9
Metropolitan Series Fund
BlackRock Money Market Portfolio
Financial Highlights
| | | | | | | | | | | | | | | | | | | | |
| Selected per share data | | | | | | | | | | | | | | | |
| | | Class E | |
| | | Year Ended December 31, | |
| | | 2013 | | | 2012 | | | 2011 | | | 2010 | | | 2009 | |
Net Asset Value, Beginning of Period | | $ | 100.00 | | | $ | 100.00 | | | $ | 100.00 | | | $ | 100.00 | | | $ | 100.00 | |
| | | | | | | | | | | | | | | | | | | | |
Income (Loss) from Investment Operations | | | | | | | | | | | | | | | | | | | | |
Net investment income (a) | | | 0.00 | | | | 0.00 | | | | 0.00 | | | | 0.00 | | | | 0.31 | |
| | | | | | | | | | | | | | | | | | | | |
Total from investment operations | | | 0.00 | | | | 0.00 | | | | 0.00 | | | | 0.00 | | | | 0.31 | |
| | | | | | | | | | | | | | | | | | | | |
Less Distributions | | | | | | | | | | | | | | | | | | | | |
Distributions from net investment income | | | 0.00 | | | | 0.00 | | | | 0.00 | | | | 0.00 | | | | (0.31 | ) |
| | | | | | | | | | | | | | | | | | | | |
Total distributions | | | 0.00 | | | | 0.00 | | | | 0.00 | | | | 0.00 | | | | (0.31 | ) |
| | | | | | | | | | | | | | | | | | | | |
Net Asset Value, End of Period | | $ | 100.00 | | | $ | 100.00 | | | $ | 100.00 | | | $ | 100.00 | | | $ | 100.00 | |
| | | | | | | | | | | | | | | | | | | | |
Total Return (%) (b) | | | 0.00 | | | | 0.00 | | | | 0.00 | | | | 0.00 | | | | 0.30 | |
| | | | | |
Ratios/Supplemental Data | | | | | | | | | | | | | | | | | | | | |
Gross ratio of expenses to average net assets (%) | | | 0.50 | | | | 0.50 | | | | 0.50 | | | | 0.51 | | | | 0.52 | |
Net ratio of expenses to average net assets (%) (c) | | | 0.23 | | | | 0.28 | | | | 0.26 | | | | 0.34 | | | | 0.48 | |
Ratio of net investment income to average net assets (%) | | | 0.00 | | | | 0.00 | | | | 0.00 | | | | 0.00 | | | | 0.35 | |
Net assets, end of period (in millions) | | $ | 237.1 | | | $ | 309.5 | | | $ | 373.7 | | | $ | 409.0 | | | $ | 10.0 | |
| (a) | Per share amounts based on average shares outstanding during the period. |
| (b) | Total return does not reflect any insurance, sales, separate account or administrative charges of variable annuity or life insurance contracts or any additional expenses that contract owners may bear under their variable contracts. If these charges were included, the returns would be lower. |
| (c) | Net ratio of expenses to average net assets includes the effect of the management fee waivers and voluntary distribution & services fee waiver as detailed in Note 4 of the Notes to Financial Statements. |
See accompanying notes to financial statements.
MSF-10
Metropolitan Series Fund
BlackRock Money Market Portfolio
Notes to Financial Statements—December 31, 2013
1. Organization
Metropolitan Series Fund (the “Trust”) is organized as a Delaware statutory trust and registered under the Investment Company Act of 1940, as amended (the “1940 Act”), as an open-end management investment company. The Trust is currently comprised of thirty series, each of which operates as a distinct investment vehicle of the Trust. The portfolio included in this report is BlackRock Money Market Portfolio (the “Portfolio”), which is diversified. Shares in the Portfolio are not offered directly to the general public and are currently available only to separate accounts established by Metropolitan Life Insurance Company (“MetLife”) and other affiliated life insurance companies.
The Portfolio has registered and offers three classes of shares: Class A, B, and E shares. Shares of each Class of the Portfolio represent an equal pro rata interest in the Portfolio and generally give the shareholder the same voting, dividend, liquidation, and other rights. Investment income, realized and unrealized capital gains and losses, the common expenses of the Portfolio, and certain Portfolio-level expense reductions, if any, are allocated on a pro rata basis to each Class based on the relative net assets of each Class to the net assets of the Portfolio. Each Class of shares differs in its respective distribution plan and such distribution expenses are allocated to that Class.
2. Significant Accounting Policies
The preparation of financial statements in conformity with accounting principles generally accepted in the United States of America (“GAAP”) requires management to make estimates and assumptions that affect the reported amounts of assets and liabilities and disclosure of contingent assets and liabilities as of the date of the financial statements and the reported amounts of income and expenses during the reporting period. Actual results could differ from those estimates. In the preparation of these financial statements, management has evaluated events and transactions subsequent to December 31, 2013 through the date the financial statements were issued.
The following is a summary of significant accounting policies consistently followed by the Portfolio in the preparation of its financial statements.
Investment Valuation and Fair Value Measurements - As permitted by Rule 2a-7 under the 1940 Act, and subject to certain conditions therein, the Portfolio employs the amortized cost method of security valuation that the Board of Trustees of the Trust (the “Board” or “Trustees”) has determined approximates the fair market net asset value per share of the Portfolio. The Board monitors the deviations between the Portfolio’s net asset value per share, as determined by using available market quotations, and its amortized cost price per share. If the deviation exceeds 1/2 of 1%, the Board will consider what action, if any, should be initiated. This method of valuation is considered a Level 2 in the fair value hierarchy.
If no current market value quotation or other observable inputs are readily available or market value quotations are deemed to be unreliable for a security, the fair value of the security will be determined in accordance with procedures approved by and under the general supervision of the Board. In such a circumstance, the Board has delegated the determination of the fair value of a security to a Valuation Committee (“Committee”) of MetLife Advisers, LLC (“MetLife Advisers” or the “Adviser”), an affiliate of MetLife, Inc. The Committee provides general pricing oversight and fair value pricing determinations related to portfolio securities and meets on a regular basis to review reports relating to the valuation of the securities in the Portfolio. The Board has delegated to State Street Bank and Trust Company, the Trust’s custodian (“custodian”), the responsibility for calculating the net asset values (“NAVs”) of the Trust’s Portfolios. The Committee is responsible for overseeing the calculation of the NAVs of the Portfolios by the custodian. The Committee also periodically reviews pricing vendors, including the vendor providing fair value pricing for the Portfolio’s foreign securities, and is responsible for overseeing the correction of pricing errors and addressing other pricing issues that arise in the ordinary course of business, such as making real-time fair value determinations, as necessary.
No single standard for determining the fair value of a security can be set forth because fair value depends upon the facts and circumstances with respect to each security. Information relating to any relevant factors may be obtained by the Committee from any appropriate source, including the subadviser of the Portfolio, the custodian, a pricing service, market maker and/or broker for such security or the issuer. Appropriate methodologies for determining fair value under particular circumstances may include: matrix pricing, comparisons of securities with comparable characteristics, value based on multiples of earnings, discount from market price of similar marketable securities or a combination of these and other methods. The Committee maintains a detailed report tracking each fair-valued security that compares the fair value price to the next available trade, vendor or broker price, and provides information on how close the fair value price was to the next quoted price. The Committee reviews a summary of such report monthly. On a quarterly basis, the Board is provided with the following for consideration and ratification or adjustment: (1) a memorandum summarizing the actions taken by the Committee in the prior quarter; and (2) a list of the Portfolio’s securities as of the most recent quarter-end for which market quotations were not readily available.
Investment Transactions and Related Investment Income - Portfolio security transactions are recorded on the trade date. Dividend income is recorded on the ex-dividend date or, for certain foreign securities, when notified. Interest income, which includes
MSF-11
Metropolitan Series Fund
BlackRock Money Market Portfolio
Notes to Financial Statements—December 31, 2013—(Continued)
amortization of premium and accretion of discount on debt securities, is recorded on the accrual basis. Realized gains and losses on investments are determined on the identified cost basis, which is the same basis used for federal income tax purposes. Foreign income and foreign capital gains on some foreign securities may be subject to foreign taxes, which are accrued as applicable. These foreign taxes have been provided for in accordance with the Portfolio’s understanding of the applicable countries’ tax rules and rates.
Income Taxes - It is the Portfolio’s policy to comply with the requirements of the Internal Revenue Code of 1986, as amended, and regulations thereunder, applicable to regulated investment companies and to distribute, with respect to each taxable year, all of its taxable income to shareholders. Therefore, no federal income tax provision is required. The Portfolio files U.S. federal tax returns. No income tax returns are currently under examination. The Portfolio’s federal tax returns for the prior three fiscal years remain subject to examination by the Internal Revenue Service. As of December 31, 2013, the Portfolio had no uncertain tax positions that would require financial statement recognition, or de-recognition or disclosure.
Dividends and Distributions to Shareholders - The Portfolio records dividends and distributions on the ex-dividend date. Net realized gains from security transactions (if any) are generally distributed annually to shareholders. The timing and characterization of certain income and capital gains distributions are determined in accordance with federal tax regulations that may differ from GAAP. Permanent book and tax basis differences relating to shareholder distributions will result in reclassification between under/over distributed net investment income, accumulated net realized gains/losses, and paid-in surplus. Book-tax differences are primarily due to ordinary loss netting and short-term capital gains reclasses from ordinary income. These adjustments have no impact on net assets or the results of operation.
Repurchase Agreements - The Portfolio may enter into repurchase agreements, under the terms of a Master Repurchase Agreement, with selected commercial banks and broker-dealers, under which the Portfolio acquires securities as collateral and agrees to resell the securities at an agreed upon time and at an agreed-upon price. The Portfolio, through the custodian or a subcustodian, receives delivery of the underlying securities collateralizing any repurchase agreements. The Portfolio requires the custodian to take possession, to have legally segregated in the Federal Reserve Book Entry System, or to have segregated within the custodian’s vault, all securities held as collateral for repurchase agreements. It is the Portfolio’s policy that the market value of the collateral be at least equal to 100% of the repurchase price in the case of a repurchase agreement of one-day duration and at least equal to 102% of the repurchase price in the case of all other repurchase agreements. In the event of default or failure by a party to perform an obligation in connection with any repurchase transaction, the Master Repurchase Agreement gives the non-defaulting party the right to set-off claims and to apply property held by it in connection with any repurchase transaction against obligations owed to it.
At December 31, 2013, the Portfolio had investments in repurchase agreements with a gross value of $11,000,000, which is included as part of investments at value on the Statement of Assets and Liabilities. The value of the related collateral exceeded the value of the repurchase agreements at December 31, 2013.
3. Certain Risks
Market Risk: In the normal course of business, the Portfolio invests in securities and enters into transactions where risks exist due to fluctuations in the market (market risk) or failure of the other party to a transaction to perform (credit and counterparty risk). The value of securities held by the Portfolio may decline in response to certain events, including those directly involving the companies whose securities are owned by the Portfolio; conditions affecting the general economy; overall market changes; local, regional or global political, social or economic instability; currency, interest rate, and price fluctuations.
Credit and Counterparty Risk: The Portfolio may be exposed to counterparty risk, or the risk that an entity with which the Portfolio has unsettled or open transactions may default. The potential loss could exceed the value of the financial assets and liabilities recorded in the financial statements. Financial assets that potentially expose the Portfolio to credit and counterparty risk consist principally of cash due from counterparties and investments. The Portfolio manages counterparty risk by entering into agreements only with counterparties that it believes have the financial resources to honor their obligations and by monitoring the financial stability of those counterparties. The Portfolio’s investment adviser attempts to mitigate counterparty risk by (i) periodically assessing the creditworthiness of its trading partners, (ii) monitoring and/or limiting the amount of its net exposure to each individual counterparty based on its assessment, and (iii) requiring collateral from the counterparty for certain transactions. In order to preserve certain safeguards for non-standard settlement trades, the Portfolio restricts its exposure to credit and counterparty losses by entering into master netting agreements with counterparties (approved brokers) with whom it undertakes a significant volume of transactions. Master Agreements govern the terms of certain transactions, and reduce the counterparty risk associated with relevant transactions by specifying credit protection mechanisms and providing standardization that improves legal certainty. Master Agreements can also help limit counterparty risk by specifying collateral posting arrangements at pre-arranged exposure levels.
Repurchase and reverse repurchase agreements are primarily executed under Global Master Repurchase Agreements (“GMRAs”) or Master Repurchase Agreements (“MRAs”), which provide the rights to set-off. Each repurchase and reverse repurchase agreement is initially collateralized at the transaction level. In the event of default, the total market value exposure will be offset against collateral exchanged to date, which would result in a net receivable/(payable) that would be due from/to the counterparty.
Additional risks associated with each type of investment are described above within the respective security type notes. The Portfolio’s prospectus includes a discussion of the principal risks of investing in the Portfolio.
MSF-12
Metropolitan Series Fund
BlackRock Money Market Portfolio
Notes to Financial Statements—December 31, 2013—(Continued)
4. Investment Management Fees and Other Transactions with Affiliates
Investment Management Agreement - MetLife Advisers is the investment adviser to the Portfolio. The Trust has entered into an investment management agreement with MetLife Advisers with respect to the Portfolio. For providing investment management services to the Portfolio, MetLife Advisers receives monthly compensation at the annual rates:
| | | | | | |
Management
Fees earned by
MetLife Advisers
for the year ended
December 31, 2013 | | % per annum | | | Average Daily Net Assets |
| $5,067,088 | | | 0.350 | % | | Of the first $1 billion |
| | | 0.300 | % | | Of amount in excess of $1 billion |
Certain officers and trustees of the Trust may also be officers of MetLife Advisers; however, such officers and trustees receive no compensation from the Trust.
MetLife Advisers has entered into an investment subadvisory agreement with respect to the Portfolio. BlackRock Advisors, LLC is compensated by MetLife Advisers to provide subadvisory services for the Portfolio.
Management Fee Waivers - Pursuant to an expense agreement, MetLife Advisers has agreed, for the period April 29, 2013 through April 27, 2014, to reduce its advisory fees set out above under “Investment Management Agreement” as follows:
| | |
% per annum | | Average Daily Net Assets |
| 0.025% | | Of the first $1 billion |
For the period May 1, 2012 through April 28, 2013, an identical expense agreement was in place. Pursuant to the expense agreement, $250,000 was waived for the year ended December 31, 2013 and is included in the management fee waivers shown in the Statement of Operations.
In addition to the contractual fee waiver, MetLife Advisers and/or its affiliates have voluntarily agreed, if the yield on any share Class of the Portfolio turns negative on a given day, to waive their fees or reimburse certain Portfolio expenses to raise the yield of that share Class to 0.00% for that day. The waiver will first be applied to 12b-1 expenses. If the amount of the waiver exceeds the Class B or Class E 12b-1 expenses on a given day, MetLife Advisers and/or its affiliates would then waive fees or reimburse expenses pro rata across all share Classes. This voluntary waiver/expense reimbursement may be discontinued by MetLife Advisers and/or its affiliates at any time without notice. During year ended December 31, 2013, $2,128,967 of 12b-1 expenses were waived as shown on the Statement of Operations. Class B shares waived $1,717,923 and Class E shares waived $411,044. In addition, during the year ended December 31, 2013, $1,602,424 of management fees were voluntarily waived and are included in the management fee waivers shown in the Statement of Operations.
Transfer Agency Agreement - MetLife serves as the transfer agent for the Trust. MetLife receives no fees for its services to the Trust under the transfer agency agreement.
Distribution and Service Fees - The Trust has a distribution agreement with MetLife Investors Distribution Company (“MIDC” or the “Distributor”) in which MIDC serves as the distributor for the Portfolio’s Class A, B and E Shares. MIDC is a wholly-owned subsidiary of MetLife Investors Group, Inc., an affiliate of the Adviser. The Trust has also adopted a Distribution and Service Plan under Rule 12b-1 of the 1940 Act for the Portfolio’s Class B and E Shares. Under the Distribution and Service Plan, the Class B and E Shares of the Portfolio pay a fee to compensate the Insurance Companies (or their affiliates) and other broker-dealers and financial intermediaries involved in the offer and sale of Portfolio shares for promoting or selling and servicing the Class B and E Shares. The fees under the Distribution and Service Plan for each class of the Portfolio’s shares are calculated as a percentage of the Portfolio’s average daily net assets that are attributable to that Class. Currently, the fee is 0.25% per year for Class B Shares and 0.15% per year for Class E Shares. Amounts incurred by the Portfolio for the year ended December 31, 2013 are shown as Distribution and service fees in the Statement of Operations.
Deferred Trustee Compensation - Each Trustee who is not currently an employee of the Adviser or any of its affiliates receives compensation from the Trust for his or her service to the Trust. A deferred compensation plan (the “Plan”) is available to the Trustees on a voluntary basis. Deferred amounts remain in the Trust until distributed in accordance with the provisions of the Plan. The value of a participating Trustee’s deferral account is based on theoretical investments of deferred amounts, on the normal payment dates in certain portfolios of the Trust or Met Investors Series Trust, an affiliate of the Trust, as designated by the participating Trustee. Changes in the value of participants’ deferral accounts are reflected as Trustees’ fees and expenses in the Statement of Operations. The portion of the accrued obligations allocated to the Portfolio under the Plan is reflected as Deferred trustees’ fees in the Statement of Assets and Liabilities.
MSF-13
Metropolitan Series Fund
BlackRock Money Market Portfolio
Notes to Financial Statements—December 31, 2013—(Continued)
5. Contractual Obligations
Under the Trust’s organizational documents, its officers and Trustees may be indemnified against certain liabilities and expenses arising out of the performance of their duties to the Trust. Additionally, the Trust has a variety of indemnification obligations under contracts with its service providers. The Trust’s maximum exposure under these arrangements is unknown, as this would involve future claims that may be made against the Trust that have not yet occurred.
6. Income Tax Information
There were no distributions paid for the year ended December 31, 2013 and 2012.
As of December 31, 2013, the components of distributable earnings (accumulated losses) on a federal income tax basis were as follows:
| | | | | | | | | | | | | | | | | | | | |
Undistributed
Ordinary
Income | | Undistributed
Long-Term
Capital Gain | | | Net
Unrealized
Appreciation | | | Loss Carryforwards | | | Other
Accumulated
Capital Losses | | | Total | |
| $4,744 | | $ | — | | | $ | — | | | $ | — | | | $ | — | | | $ | 4,744 | |
The Portfolio utilizes the provisions of the federal income tax laws that provide for the carryforward of capital losses for prior years, offsetting such losses against any future realized capital gains. Under the Regulated Investment Company Modernization Act of 2010 (the “Act”), net capital losses recognized after December 22, 2010 may be carried forward indefinitely, and their character is retained as short-term and/or long-term losses. Previously, net capital losses were carried forward for up to eight years and treated as short-term losses. As a transition rule, the Act requires that post-enactment net capital losses be used before pre-enactment net capital losses.
As of December 31, 2013, the Portfolio had no post-enactment accumulated capital losses or pre-enactment accumulated capital loss carryforwards.
MSF-14
Metropolitan Series Fund
BlackRock Money Market Portfolio
Report of Independent Registered Public Accounting Firm
To the Shareholders of BlackRock Money Market Portfolio and the Board of Trustees of Metropolitan Series Fund:
We have audited the accompanying statement of assets and liabilities, including the schedule of investments, of BlackRock Money Market Portfolio, one of the portfolios constituting Metropolitan Series Fund (the “Trust”) as of December 31, 2013, and the related statement of operations for the year then ended, the statements of changes in net assets for each of the two years in the period then ended, and the financial highlights for each of the five years in the period then ended. These financial statements and financial highlights are the responsibility of the Trust’s management. Our responsibility is to express an opinion on these financial statements and financial highlights based on our audits.
We conducted our audits in accordance with the standards of the Public Company Accounting Oversight Board (United States). Those standards require that we plan and perform the audit to obtain reasonable assurance about whether the financial statements and financial highlights are free of material misstatement. The Trust is not required to have, nor were we engaged to perform, an audit of its internal control over financial reporting. Our audits included consideration of internal control over financial reporting as a basis for designing audit procedures that are appropriate in the circumstances, but not for the purpose of expressing an opinion on the effectiveness of the Trust’s internal control over financial reporting. Accordingly, we express no such opinion. An audit also includes examining, on a test basis, evidence supporting the amounts and disclosures in the financial statements, assessing the accounting principles used and significant estimates made by management, as well as evaluating the overall financial statement presentation. Our procedures included confirmation of securities owned as of December 31, 2013, by correspondence with the custodian and brokers; where replies were not received from brokers, we performed other auditing procedures. We believe that our audits provide a reasonable basis for our opinion.
In our opinion, the financial statements and financial highlights referred to above present fairly, in all material respects, the financial position of BlackRock Money Market Portfolio of Metropolitan Series Fund, as of December 31, 2013, the results of its operations for the year then ended, the changes in its net assets for each of the two years in the period then ended, and the financial highlights for each of the five years in the period then ended, in conformity with accounting principles generally accepted in the United States of America.
Deloitte & Touche LLP
Boston, Massachusetts
February 27, 2014
MSF-15
Metropolitan Series Fund
Trustees and Officers of Metropolitan Series Fund
The Trustees and executive officers of the Trust, their ages and their principal occupations during the past five years are set forth below. Unless otherwise indicated, the business address of each is One Financial Center, Boston, MA 02111. Each Trustee who is deemed an “interested person,” as such term is defined in the 1940 Act, is indicated by an asterisk. Those Trustees who are not “interested persons” as defined in the 1940 Act are referred to as “Independent Trustees.” Additional information about the Trustees is available in the Statement of Additional Information, which is available without charge, upon request, by calling (800) 848-3854.
Trustees of the Trust
| | | | | | | | | | |
Name and Age | | Position(s)
Held with
Registrant | | Term of Office and
Length of Time
Served | | Principal Occupation(s) During the
Past 5 Years(1) | | Number of
Portfolios
in Fund
Complex(2)
overseen | | Other Directorships Held
by Trustee During the
Past 5 Years(1) |
| Interested Trustee | | | | | | | | | | |
| Elizabeth M. Forget* (47) | | Trustee, Chairman of the Board, President and Chief Executive Officer | | Indefinite; From May 2006 (President and Chief Executive Officer)/ August 2006 (Trustee and Chairman of the Board) to present | | Senior Vice President, MetLife Inc.; President, MetLife Advisers, LLC and a predecessor company. | | 79 | | Trustee, Met Investors Series Trust (the “MIST Trust”);** various MetLife-affiliated boards. |
| | | | | |
| Independent Trustees | | | | | | | | | | |
| Stephen M. Alderman (54) | | Trustee | | Indefinite; From April 2012 to present | | Shareholder in the law firm of Garfield & Merel, Ltd. | | 79 | | Trustee, MIST Trust;** Director, International Truck Leasing Corp. |
| | | | | |
| Robert J. Boulware (57) | | Trustee | | Indefinite; From April 2012 to present | | Managing Director, Pilgrim Funds, LLC (private equity fund). | | 79 | | Trustee, MIST Trust;** Trustee, Vertical Capital Income Fund (closed-end fund); Director, Gainsco, Inc. (auto insurance). |
| | | | | |
| Susan C. Gause (61) | | Trustee | | Indefinite; From April 2012 to present | | Private Investor. | | 79 | | Trustee, MIST Trust;** Trustee, HSBC Funds. |
| | | | | |
| Nancy Hawthorne (62) | | Trustee | | Indefinite; From May 2003 to present | | Chief Executive Officer, Clerestory LLC (corporate advisor). | | 79 | | MIST Trust;** Director, THL Credit, Inc.**; Director, Avid Technology, Inc.** |
| | | | | |
| Barbara A. Nugent (57) | | Trustee | | Indefinite; From January 2014 to present | | President, True North Board Governance, LLC (consulting); until 2014, partner in the law firm of Stradley Ronon Stevens & Young, LLP. | | 79 | | Trustee, MIST Trust**; Director, Episcopal Healthcare Foundation; until 2014, member, Mutual Fund Directors Forum Advisory Board. |
| | | | | |
| Keith M. Schappert (62) | | Trustee | | Indefinite; From August 2009 to present | | Principal, Schappert Consulting LLC (asset management consulting). | | 79 | | Trustee, MIST Trust;** Director, The Commonfund for Nonprofit Organizations; until 2011, Director, Trilogy Global Advisors; Director, Mirae Asset Discovery Funds,** Director, Calamos Investments. |
| | | | | |
| Linda B. Strumpf (66) | | Trustee | | Indefinite; From May 2000 to present | | Chair of the Investment Committee, Leona M. and Harry B. Helmsley Charitable Trust; until 2011, Chief Investment Officer, Leona M. and Harry B. Helmsley Charitable Trust. | | 79 | | Since 2012, Trustee, MIST Trust,** Trustee and Member of Investment Committee, The Pennsylvania State University. |
| | | | | |
| Dawn M. Vroegop (47) | | Trustee | | Indefinite; From May 2009 to present | | Private Investor. | | 79 | | Trustee, MIST Trust,** Trustee, Driehaus Mutual Funds; Director and Investment Committee Chair, City College of San Francisco Foundation. |
MSF-16
Metropolitan Series Fund
Trustees and Officers of Metropolitan Series Fund—(Continued)
Executive Officers of the Trust
| | | | | | |
Name and Age | | Position(s) Held with
Registrant | | Term of Office
and Length of
Time Served | | Principal Occupation(s) During Past 5 Years(1) |
| Elizabeth M. Forget (47) | | President, Chief Executive Officer, Trustee and Chairman of the Board | | From May
2006 (President
and Chief
Executive
Officer)/
August 2006
(Trustee and
Chairman of
the Board) to
present | | See principal occupation information in the table above. |
| | | |
| Jeffrey L. Bernier (42) | | Vice President | | From February
2008 to present | | Vice President, MetLife, Inc.; Senior Vice President, MetLife Advisers, LLC and a predecessor company. |
| | | |
| Peter H. Duffy (58) | | Chief Financial Officer and Treasurer | | From November
2000 to present | | Senior Vice President, MetLife Advisers, LLC; Vice President, MetLife, Inc. |
| | | |
| Andrew L. Gangolf (59) | | Secretary | | From May
2011to present | | Senior Vice President, MetLife Advisers, LLC; Senior Vice President & Assistant General Counsel, AllianceBerstein Investments, Inc. |
| | | |
| Jeffrey P. Halperin (46) | | Chief Compliance Officer | | From November
2005 to present | | Vice President, MetLife, Inc.; Chief Compliance Officer, MIST; Chief Compliance Officer, MSF Trust; Chief Compliance Officer, MetLife Advisers, LLC and a predecessor company; Chief Compliance Officer, MetLife Investment Management, LLC (formerly MetLife Investment Advisors Company, LLC). |
| | | |
| Alan C. Leland, Jr. (61) | | Vice President | | From February
2005 to present | | Treasurer and Chief Financial Officer, MetLife Advisers, LLC; Vice President, MetLife Group Inc.; Vice President, MetLife, Inc. |
| * | Ms. Forget is an “interested person” of the Trust because of her positions with MetLife Advisers, LLC and her ownership of securities issued by MetLife, Inc., the ultimate parent company of MetLife Advisers, LLC. |
| ** | Indicates a directorship with a registered investment company or a company subject to the reporting requirements of the Securities Exchange Act of 1934, as amended. |
| (1) | Previous positions during the past five years with the Trust, MetLife, Inc. or the Adviser are omitted if not materially different. |
| (2) | The Fund Complex includes 49 Portfolios of the MIST Trust and 30 Portfolios of the Trust. |
MSF-17
Metropolitan Series Fund
BlackRock Money Market Portfolio
Board of Trustees’ Consideration of Advisory and Sub-Advisory Agreements
At an in-person meeting of the Boards of Trustees (the “Board”) of Met Investors Series Trust and Metropolitan Series Fund (“MIST” and “MSF,” respectively, and collectively, the “Trusts”) held on November 19-20, 2013, the Board, including a majority of the Trustees who are not considered to be “interested persons” of the Trusts (the “Independent Trustees”) under the Investment Company Act of 1940, as amended (the “1940 Act”), approved for an annual period the continuation of each Trust’s advisory agreement (the “Advisory Agreement”) with MetLife Advisers, LLC (the “Adviser”) and the applicable sub-advisory agreements (each a “Sub-Advisory Agreement,” and collectively with the Advisory Agreement, the “Agreements”) between the Adviser and the investment sub-advisers (each a “Sub-Adviser,” and collectively, the “Sub-Advisers”) for each of the series of the Trusts, including the BlackRock Money Market Portfolio (each a “Portfolio,” and collectively, the “Portfolios”).1
In considering the Agreements, the Board reviewed a variety of materials provided by the Adviser and the Sub-Advisers relating to the Portfolios, including comparative performance, fee and expense information for an appropriate peer group of similar mutual funds, performance information for relevant benchmark indices and other information regarding the nature, extent and quality of services provided by the Adviser and the Sub-Advisers under their respective Agreements. The Board also took into account its experience with the Adviser and the Sub-Advisers and information provided to the Board in its meetings throughout the year with respect to the services provided by the Adviser and the Sub-Advisers, including quarterly performance reports prepared by management containing reviews of investment results, and periodic presentations from certain of the Sub-Advisers with respect to the Portfolios they manage. The Independent Trustees also assessed reports provided by the Board’s independent consultant, who reviewed and provided analyses regarding investment performance, fees and expenses, and other information provided by, or at the direction of, the Adviser and the Sub-Advisers, as more fully discussed below.
The Independent Trustees were separately advised by independent legal counsel throughout the process, and met with independent legal counsel in periodic executive sessions. Prior to voting to continue the Agreements at the November meeting, the Independent Trustees also received a memorandum from their independent counsel discussing the legal standards for their consideration of the proposed continuation of the Agreements. The Board also met in person with personnel of the Adviser on September 17, 2013 for the specific purpose of giving preliminary consideration to the proposed continuation of the Agreements and to request additional information they considered reasonably necessary to their deliberations. The Independent Trustees also discussed the proposed continuation of the Agreements in private sessions with their independent legal counsel at which no representatives of management were present.
In considering whether to approve the renewal of the Advisory Agreement with the Adviser and any applicable Sub-Advisory Agreements with respect to a Portfolio, the Board reviewed and analyzed the factors it deemed relevant, including: (1) the nature, extent and quality of the services to be provided to the Portfolios by the Adviser and the Sub-Advisers; (2) the performance of the Portfolios as compared to a peer group and an appropriate index; (3) the Adviser’s and each of the Sub-Adviser’s personnel and operations; (4) the financial condition of the Adviser and of the Sub-Advisers; (5) the level and method of computing each Portfolio’s advisory and sub-advisory fees; (6) the profitability of the Adviser under the Advisory Agreement and of certain of the Sub-Advisers under the Sub-Advisory Agreements; (7) any “fall-out” benefits to the Adviser, the Sub-Advisers and their affiliates (i.e., ancillary benefits realized by the Adviser, the Sub-Advisers or their affiliates from the Adviser’s or Sub-Advisers’ relationship with the Trusts); (8) the anticipated effect of growth in size on Portfolio expenses; (9) fees paid to certain of the Sub-Advisers by comparable institutional and retail accounts; and (10) possible conflicts of interest.
Nature, extent and quality of services. The Board evaluated the nature, extent and quality of the services that the Adviser, and the Sub-Advisers as relevant, have provided to the Portfolios. The Board considered the Adviser’s services as investment manager to the Portfolios, including services relating to the selection and oversight of the Sub-Advisers for the applicable Portfolios. The Board considered, among other things, the Adviser’s oversight of the provision of services to the Portfolios by the Sub-Advisers, including with respect to investment activities and trading practices, and the Sub-Adviser’s compliance with fund policies, objectives and Board directives, compliance policies and procedures and applicable law. The Adviser’s services in coordinating and overseeing the activities of the Trusts’ other service providers were also considered. The Board also evaluated the expertise and performance of the personnel of the Adviser who performed services for the Portfolios throughout the year.
The Board considered information received from the Trust’s Chief Compliance Officer (“CCO”) regarding the Portfolios’ compliance policies and procedures established pursuant to Rule 38a-l under the 1940 Act. The Board also evaluated the CCO’s ongoing reports concerning the CCO’s oversight of the risk assessment processes of the Sub-Advisers.
1 The Pyramis Managed Risk Portfolio recently commenced operations and, therefore, the Agreement with respect to this Portfolio was not up for renewal.
MSF-18
Metropolitan Series Fund
BlackRock Money Market Portfolio
Board of Trustees’ Consideration of Advisory and Sub-Advisory Agreements—(Continued)
With respect to the services provided by each of the Sub-Advisers, the Board considered, among other things, information provided to the Board by each Sub-Adviser. The Board considered the Sub-Adviser’s current level of staffing and its overall resources, as well as its compensation program. The Board reviewed each Sub-Adviser’s history and investment experience, as well as information regarding the qualifications, background and responsibilities of the Sub-Adviser’s investment and compliance personnel who provide services to the Portfolios. The Board also considered, among other things, the Sub-Adviser’s compliance program and any disciplinary history. The Board also took into account the Sub-Adviser’s risk assessment and monitoring process. The Board noted each Sub-Adviser’s regulatory history, including whether it was currently involved in any regulatory actions or investigations as well as material litigation, and any settlements and amelioratory actions undertaken, as appropriate. The Board also noted that the CCO and his staff conduct regular, periodic compliance reviews with each of the Sub-Advisers and present reports to the Independent Trustees regarding the same, which includes evaluating the regulatory compliance systems of the Sub-Advisers and procedures reasonably designed by them to help assure compliance with the federal securities laws, including issues related to late trading and market timing, best execution, fair value pricing, and proxy voting procedures, among others. The Board also took into account the financial condition of each Sub-Adviser. In its review, the Board also received and took into account information regarding any services and/or payments provided to the Adviser by the Sub-Advisers in connection with marketing activities.
The Board considered each Sub-Adviser’s investment process and philosophy. The Board took into account that each Sub-Adviser’s responsibilities include the development and maintenance of an investment program for the applicable Portfolio which is consistent with the Portfolio’s investment objectives, the selection of investment securities and the placement of orders for the purchase and sale of such securities, as well as the implementation of compliance controls related to performance of these services. The Board also reviewed each Sub-Adviser’s brokerage policies and practices.
Performance. The Board considered the performance of the Portfolios as described in the quarterly reports prepared by management, and as also analyzed in reports prepared by the Independent Trustees’ independent consultant. The Board noted that the Adviser reviews with the Board on a quarterly basis detailed information about the Portfolios’ performance results, portfolio composition and investment strategies. The Board also reviewed and considered a separate report prepared by Lipper Inc. (“Lipper”), an independent third party, which provided a statistical analysis comparing the Portfolios’ investment performance, expenses, and fees to comparable funds underlying variable insurance products (the “Performance Universe”). In addition, the Independent Trustees met separately with a representative of Bobroff Consulting, Inc., an independent consultant (“Bobroff), at a special board meeting in September 2013, to review the separate reports prepared by such consultant (“Bobroff Report”), which analyzed the report prepared by Lipper. The Board also considered each Portfolio’s more recent performance subsequent to the performance period covered by the Lipper reports, and management’s discussion of the same, including the effect of current market conditions on each Portfolio’s more recent performance.
The Board reviewed the Portfolios’ performance records and the Adviser’s and Sub-Advisers’ management styles and long-term performance records with the Portfolios and comparable funds. The Board focused particular attention on Portfolios with less favorable performance records. The Board was mindful of the Adviser’s focus on each Sub-Adviser’s performance and noted that the Adviser has been active in monitoring and responding to any performance issues with respect to the Portfolios. The Board also took into account its discussions with management regarding factors that contributed to the performance of the Portfolios.
Among other data relating specifically to the BlackRock Money Market Portfolio’s performance, the Board considered that the Portfolio outperformed the median of its Performance Universe for the one- and five-year periods ended June 30, 2013 and underperformed the median of its Performance Universe for the three-year period ended June 30, 2013. The Board also considered that the Portfolio outperformed its Lipper Index for the five-year period ended June 30, 2013, performed equally to its Lipper Index for the one-year period ended June 30, 2013 and slightly underperformed its Lipper Index for the three-year period ended June 30, 2013. The Board further considered that the Portfolio underperformed its benchmark, the Merrill Lynch 3-Month Treasury Bills Index, for the one- and three-year periods ended October 31, 2013 and outperformed its benchmark for the five-year period ended October 31, 2013.
Fees and Expenses. The Board gave consideration to the advisory fees payable under the Advisory Agreement and the sub-advisory fees payable under each of the Sub-Advisory Agreements. In this regard, the Board reviewed the advisory fees payable on a Portfolio-by-Portfolio basis based on information provided by the Adviser. The Independent Trustees, with the assistance of Bobroff, also examined the fees paid by a Portfolio in light of fees paid to other investment managers by comparable funds, as well as considered the fees charged by the Adviser to manage other comparable funds, as applicable. The Lipper report included comparisons of the Adviser’s fee schedule with that of its peers based on an asset-based analysis of relative fee structures according to the size of the Portfolio. In addition, the Board considered the Portfolios’ advisory and sub-advisory fees and total expenses as compared to similarly situated investment companies underlying variable insurance products deemed to be comparable to the Portfolios as determined by Lipper.
MSF-19
Metropolitan Series Fund
BlackRock Money Market Portfolio
Board of Trustees’ Consideration of Advisory and Sub-Advisory Agreements—(Continued)
The Board considered a Portfolio’s ranking within a smaller group of peer funds chosen by Lipper (the “Expense Group”), as well as the Portfolio’s ranking within broader groups of funds (the “Expense Universe” and the “Sub-advised Expense Universe”). The Board also considered a Portfolio’s contractual sub-advisory fees, as applicable, as compared to the Sub-advised Expense Universe as well as a smaller group of funds (the “Sub-advised Expense Group”). In comparing a Portfolio’s actual and contractual management fee to that of comparable funds, the Board noted that such fee includes both advisory and administrative fees.
The Board noted that the sub-advisory fees for the Portfolios are paid by the Adviser, not the Portfolios, out of the advisory fee. It was further noted that the Adviser negotiates such fees at arm’s length. The Board also considered that the Adviser had entered into expense limitation agreements with certain of the Portfolios, pursuant to which the Adviser has agreed to waive a portion of its advisory fee and/or reimburse certain expenses as a means of limiting a Portfolio’s total annual operating expenses. The Board further considered the amount of sub-advisory fees paid out by the Adviser and the amount of the management fees that it retained in light of the services performed by Sub-Advisers and Adviser, respectively.
With respect to the BlackRock Money Market Portfolio, the Board considered that the Portfolio’s actual management fees were above the Expense Group median, the Expense Universe median and the Sub-advised Expense Universe median. The Board also considered that the Portfolio’s total expenses (exclusive of 12b-1 fees) were above the Expense Group median and the Sub-advised Expense Universe median and equal to the Expense Universe median. The Board further noted that the Portfolio’s contractual management fees were below the asset-weighted average of the Expense Group at the Portfolio’s current size. The Board also noted that the Portfolio’s contractual sub-advisory fees were below the average of the Sub-advised Expense Group and Sub-advised Expense Universe at the Portfolio’s current size. The Board further noted that the Adviser had waived fees and/or reimbursed expenses during the past year.
Profitability. The Board examined the profitability of the Adviser on a Portfolio-by-Portfolio basis. The Board also considered that the Distributor, MetLife Investors Distribution Company, receives Rule 12b-1 payments to support the distribution of the products. The Board considered the profitability to the Sub-Advisers and their affiliates as a result of their relationships with the Portfolios, and the Board considered the ability of the Adviser to negotiate the Sub-Advisory Agreements and the fees thereunder at arm’s length. The Board also reviewed Portfolio specific data with regard to the profitability of the Portfolios to each Sub-Adviser, as available.
Economies of scale. The Board also considered the effect of the Portfolios’ growth in size on their fees. The Board noted that the fee schedules for most of the Portfolios contain breakpoints that reduce the fee rate above specified asset levels. The Board noted those Portfolios that did not contain breakpoints in the advisory fee and took into account management’s discussion of the same. The Board noted that those Portfolios with advisory fee schedules containing breakpoints generally reflect the inclusion of breakpoints in the sub-advisory fee schedule for such Portfolios. The Board considered the effective fees under the Advisory Agreement for a Portfolio as a percentage of assets at different asset levels and possible economies of scale that may be realized if the assets of the Portfolio grow. Among other data, the Board examined the effect of a Portfolio’s growth in size on various fee schedules and reviewed the Lipper and Bobroff Reports, which compared fees among peers. The Board also generally noted that if a Portfolio’s assets increase over time, the Portfolio may realize other economies of scale if assets increase proportionally more than certain other fixed expenses. In addition, the Board noted that the Adviser had taken a number of steps to date intended to share the benefits of economies of scale with contractholders.
With respect to the BlackRock Money Market Portfolio, the Board noted that the Portfolio’s advisory fee contains breakpoints that reduce the advisory fee rate on assets above certain specified asset levels. The Board considered the fact that the Portfolio’s fee levels decline as portfolio assets increase.
Other factors. As part of its evaluation of the Adviser’s compensation, the Board considered other benefits that may be realized by the Adviser and its affiliates from their relationship with the Trusts. Among them, the Board recognized that an affiliate of the Adviser, MetLife Investors Distribution Company, serves as the Distributor for the Trusts, and, as such, receives payments pursuant to Rule 12b-1 from the Portfolios to compensate it for providing shareholder services and selling activities, which could lead to growth in the Trusts’ assets and corresponding benefits from such growth, including economies of scale. The Board also considered that affiliates of the Adviser may benefit from certain indirect tax benefits relating to dividend received deductions and foreign tax credits. In conjunction with these considerations, the Board noted the costs of providing investment management and other services to the Portfolios and the ongoing commitment of the Adviser to the Portfolios.
The Board considered other benefits that may be realized by each Sub-Adviser and its affiliates from their relationship with the Trusts, including the opportunity to provide advisory services to additional portfolios of the Trusts and reputational benefits. In conjunction with these considerations, the Board noted the costs of providing investment advisory services to the Portfolios and the ongoing commitment of the Sub-Advisers to the Portfolios.
MSF-20
Metropolitan Series Fund
BlackRock Money Market Portfolio
Board of Trustees’ Consideration of Advisory and Sub-Advisory Agreements—(Continued)
The Board considered possible conflicts of interest in the form of material benefits or detriments to the Trusts resulting from the nature of the Trusts’ and the Adviser’s or the Sub-Advisers’ affiliations and the services that are provided to the Trusts, and the manner in which such conflicts were mitigated.
Conclusions. After full consideration of the factors discussed above, the Board, including a majority of the Independent Trustees, approved the Advisory Agreement and the Sub-Advisory Agreement, as applicable, with respect to each Portfolio, unless otherwise noted. In making its approvals, the Board concluded that the nature, extent and quality of services provided by the Adviser and each Sub-Adviser supported the renewal of the Agreements. The Board also concluded that the investment performance of each Fund was such that each Agreement should continue. In addition, the Board concluded that fees paid by a Portfolio to the Adviser and, if applicable, the Sub-Adviser appeared to be acceptable in light of nature, extent and quality of the services provided by the Adviser and Sub-Adviser. Further, the Board concluded that the Adviser’s profitability in providing services under the Advisory Agreements did not appear unreasonably high in light of the nature, extent and quality of the services provided by the Adviser. Finally, the Board concluded that the Advisory and Sub-Advisory fees in some measure share economies of scale with contractholders. In approving the renewal of each of the Agreements, the Board, including the Independent Trustees, did not identify any single factor as controlling, and generally attributed different weights to various factors for the various Portfolios. The Board evaluated all information available to them on a Portfolio-by-Portfolio basis, and their decisions were made separately with respect to each Portfolio.
MSF-21
Metropolitan Series Fund
Frontier Mid Cap Growth Portfolio
Managed By Frontier Capital Management Company, LLC
Portfolio Manager Commentary*
PERFORMANCE
For the one year period ended December 31, 2013, the Class A, B, D, and E shares of the Frontier Mid Cap Growth Portfolio returned 32.77%, 32.43%, 32.63% and 32.59%, respectively. The Portfolio’s benchmark, the Russell Midcap Growth Index1, returned 35.74%.
Frontier Capital Management Company, LLC assumed management of the Portfolio on January 7, 2013, prior to which the Portfolio was subadvised by BlackRock Advisors, LLC.
MARKET ENVIRONMENT / CONDITIONS
Stocks advanced strongly during 2013 with the Russell Midcap Growth Index rising 35.4%. This marked the largest gain in over a decade leaving aside the 2009 rebound from 2008’s collapse. The market’s stellar performance was driven by ample liquidity, improving economic momentum throughout the year, steady monetary policy and relative calm in financial markets. All of which led to improved investor confidence and higher multiples, after three years of great angst stemming from fits and starts to the recovery and the persistent fear that the European financial situation would worsen, and in so doing drag down the U.S. markets.
Interestingly, the one factor that did not contribute to the markets gain was earnings. Indeed, earnings estimates for 2013 and 2014 (looking at the S&P 500 Index as a market proxy) were largely unchanged during the year and as such the advance was driven entirely by multiple expansion. Specifically, after absorbing upwards of $200 billion in fiscal drag during the first quarter of 2013 when the economy grew just 1.1%, output has accelerated. Real Gross Domestic product (“GDP”) grew 2.5% in the second quarter and jumped to 4.1% in the third quarter, which is close to where it appears to have grown in the fourth quarter.
PORTFOLIO REVIEW / PERIOD END POSITIONING
The Portfolio’s relative performance was hindered equally by both stock and sector selection accompanied by a modest drag from cash. In terms of stock selection, performance was restrained principally by a small number of stocks that were not owned but which recorded substantial gains in the index. Indeed, not owning just three stocks, namely Tesla Motors, Vertex Pharmaceuticals, and LinkedIn Corp., hampered relative performance by 1.2%. Each was previously evaluated as not fitting within our investment process due to risk and valuation considerations. More specifically, each traded at valuations to sales that we have traditionally found to be unattractive from a risk/reward perspective. With Tesla Motors classified in Consumer Discretionary, this sector was the largest detractor to performance. From the perspective of direct holdings, the Portfolio incurred limited setbacks in Energy and Information Technology (“IT”). Specifically, within Energy our holdings in Kodiak Oil & Gas and Interoil Corp. were hurt by resource development setbacks. Within IT, our investments in Teradata Corp. and Citrix Systems were hindered by tight capital budgets and changing competitive dynamics. Stock selection was strong in Health Care and Industrials.
Sector selection was an equal detractor to performance during the period. This was hindered by our underweight position in Consumer Discretionary (the best performing sector for this time period) which is due to our view that there is more pent up demand and better risk/reward characteristics in other sectors. Additionally, being underweight in Consumer Staples stocks also hurt. We believed the sector was richly valued for relatively modest growth and think the market is overpaying for the visible growth provided by stocks during a period of lackluster overall growth. As economic activity broadens, we expect other sectors of the market to offer greater growth and current valuations reflect much lower expectations thus setting up a much more promising trade off. Combined, these two sectors represented the majority of our negative sector selection.
Throughout the year the Portfolio exhibited solid characteristics in terms of our active holdings as our top ten names contributed 9.6% to performance, while our ten most significant detractors dragged performance down by just 2.0%. Performance was aided by stock selection in Health Care, Producer Durables, and Financial Services. In Health Care, a focus on companies helping to limit the cost of health care, such as generic drug manufacturers, helped deliver solid performance at prudent risk levels. In Industrials, our holdings in the Aerospace industry continue to prosper due to the ramp up in commercial aircraft deliveries at Boeing and Airbus. In Financials, our focus on recurring revenues and improving consumer credit aided performance.
At the end of the period, this discipline has led us to increase our positions in select Industrials areas such as the Construction & Engineering industry. Companies like Chicago Bridge & Iron and Jacobs Engineering Group benefit from the renaissance in both domestic energy production and manufacturing given the build out of associated infrastructure. Finally, we continued to see attractive stock specific opportunities in Health Care where there is not only strong
MSF-1
Metropolitan Series Fund
Frontier Mid Cap Growth Portfolio
Managed By Frontier Capital Management Company, LLC
Portfolio Manager Commentary*—(Continued)
secular growth but also companies gaining share through innovation and consolidation such as Actavis in generic pharmaceuticals and Cooper Cos. in vision care.
Our process continues to focus on companies that have attractive business models, that have company specific catalysts to drive substantial earnings power and that trade at attractive valuations. In the current low growth environment, the Portfolio has positioned behind secular beneficiaries that can gain share in growth markets and possess multiple levers to reward investors beyond relying on just vibrant top line growth given the realities of the economic recovery with which we are faced.
Stephen M. Knightly
Christopher J. Scarpa
Portfolio Managers
Frontier Capital Management Company, LLC
*This commentary may include statements that constitute “forward-looking statements” under the U.S. securities laws. Forward-looking statements include, among other things, projections, estimates, and information about possible or future results related to the Portfolio, market or regulatory developments. The views expressed above are not guarantees of future performance or economic results and involve certain risks, uncertainties and assumptions that could cause actual outcomes and results to differ materially from the views expressed herein. The views expressed above are subject to change at any time based upon economic, market, or other conditions and the subadvisory firm undertakes no obligation to update the views expressed herein. Any discussions of specific securities should not be considered a recommendation to buy or sell those securities. The views expressed above (including any forward-looking statement) may not be relied upon as investment advice or as an indication of the Portfolio’s trading intent. Information about the Portfolio’s holdings, asset allocation or country diversification is historical and is not an indication of future Portfolio composition, which may vary. Direct investment in any index is not possible. The performance of any index mentioned in this commentary has not been adjusted for ongoing management, distribution and operating expenses, and sales charges applicable to mutual fund investments. In addition, the returns do not reflect additional fees charged by separate accounts or variable insurance contracts that an investor in the Portfolio may pay. If these additional fees were reflected, performance would have been lower.
MSF-2
Metropolitan Series Fund
Frontier Mid Cap Growth Portfolio
A $10,000 INVESTMENT COMPARED TO THE RUSSELL MIDCAP GROWTH INDEX

AVERAGE ANNUAL RETURNS (%) (FOR THE YEAR ENDED DECEMBER 31, 2013)
| | | | | | | | | | | | | | | | |
| | | 1 Year | | | 5 Year | | | 10 Year | | | Since Inception2 | |
| Frontier Mid Cap Growth Portfolio | | | | | | | | | | | | | | | | |
Class A | | | 32.77 | | | | 19.75 | | | | 7.96 | | | | — | |
Class B | | | 32.43 | | | | 19.44 | | | | — | | | | 7.41 | |
Class D | | | 32.63 | | | | 19.61 | | | | — | | | | 6.13 | |
Class E | | | 32.59 | | | | 19.57 | | | | 7.80 | | | | — | |
| Russell Midcap Growth Index | | | 35.74 | | | | 23.37 | | | | 9.77 | | | | — | |
1 The Russell Midcap Growth Index is an unmanaged measure of performance of those Russell Midcap companies (the 800 smallest companies in the Russell 1000 Index) with higher price-to-book ratios and forecasted growth values.
2 Inception dates of the Class A, Class B, Class D, and Class E shares are 4/29/88, 4/26/04, 5/2/06, and 5/1/01, respectively.
Portfolio performance is calculated including reinvestment of all income and capital gain distributions. Performance numbers are net of all Portfolio expenses but do not include any insurance, sales, separate account or administrative charges of variable annuity or life insurance contracts or any additional expenses that participants may bear relating to the operations of their plans. If these charges were included, the returns would be lower. The performance of any index referenced above has not been adjusted for ongoing management, distribution and operating expenses, and sales charges applicable to mutual fund investments. Direct investment in any index is not possible. The performance of Class A shares, as set forth in the line graph above, will differ from that of other classes because of the difference in expenses paid by policyholders investing in the different share classes.
This information represents past performance and is not indicative of future results. Investment return and principal value may fluctuate so that shares, upon redemption, may be worth more or less than the original cost.
PORTFOLIO COMPOSITION AS OF DECEMBER 31, 2013
Top Holdings
| | | | |
| | |
% of
Net Assets | |
| BE Aerospace, Inc. | | | 4.0 | |
| Actavis plc | | | 3.1 | |
| Alliance Data Systems Corp. | | | 2.8 | |
| FMC Corp. | | | 2.6 | |
| GNC Holdings, Inc. - Class A | | | 2.3 | |
| Perrigo Co. plc | | | 2.2 | |
| Harley-Davidson, Inc. | | | 1.9 | |
| Cooper Cos., Inc. (The) | | | 1.9 | |
| LKQ Corp. | | | 1.8 | |
| Alkermes plc | | | 1.7 | |
Top Sectors
| | | | |
| | | % of
Market Value of
Total Long-Term Investments | |
| Consumer Discretionary | | | 22.1 | |
| Industrials | | | 20.0 | |
| Information Technology | | | 17.4 | |
| Health Care | | | 17.1 | |
| Financials | | | 8.0 | |
| Energy | | | 7.0 | |
| Materials | | | 6.8 | |
| Consumer Staples | | | 1.1 | |
| Telecommunication Services | | | 0.5 | |
MSF-3
Metropolitan Series Fund
Frontier Mid Cap Growth Portfolio
Understanding Your Portfolio’s Expenses
Shareholder Expense Example
As a shareholder of the Portfolio, you incur ongoing costs, including management fees; distribution and service (12b-1) fees; and other Portfolio expenses. This example is intended to help you understand your ongoing costs (in dollars) (referred to as “expenses”) of investing in the Portfolio and compare these costs with the ongoing costs of investing in other mutual funds. The example is based on an investment of $1,000 invested at the beginning of the period and held for the entire period, July 1, 2013 through December 31, 2013.
Actual Expenses
The first line for each share class of the Portfolio in the table below provides information about actual account values and actual expenses. You may use the information in this line, together with the amount you invested in the particular share class of the Portfolio, to estimate the expenses that you paid over the period. Simply divide your account value by $1,000 (for example, an $8,600 account value divided by $1,000 = 8.6), then multiply the result by the number in the first line under the heading entitled “Expenses Paid During Period” to estimate the expenses you paid on your account during this period.
Hypothetical Example for Comparison Purposes
The second line for each share class of the Portfolio in the table below provides information about hypothetical account values and hypothetical expenses based on the Portfolio’s actual expense ratio and an assumed rate of return of 5% per year before expenses, which is not the Portfolio’s actual return. The hypothetical account values and expenses may not be used to estimate the actual ending account balance or expenses you paid for the period. You may use this information to compare the ongoing costs of investing in the Portfolio and other funds. To do so, compare this 5% hypothetical example with the 5% hypothetical examples that appear in the shareholder reports of the other funds.
Please note that the expenses shown in the table are meant to highlight your ongoing costs only and do not reflect any fees or charges of your variable insurance product or any additional expenses that participants in certain eligible qualified plans may bear relating to the operations of their plan. Therefore, the second line for each share class in the table is useful in comparing ongoing costs only, and will not help you determine the relative total costs of owning different funds. In addition, if these other costs were included, your costs would have been higher.
| | | | | | | | | | | | | | | | | | |
Frontier Mid Cap Growth Portfolio | | | | Annualized
Expense
Ratio | | | Beginning
Account Value
July 1,
2013 | | | Ending
Account Value
December 31,
2013 | | | Expenses Paid
During Period**
July 1, 2013
to
December 31,
2013 | |
Class A(a) | | Actual | | | 0.73 | % | | $ | 1,000.00 | | | $ | 1,192.20 | | | $ | 4.03 | |
| | Hypothetical* | | | 0.73 | % | | $ | 1,000.00 | | | $ | 1,021.53 | | | $ | 3.72 | |
| | | | | |
Class B(a) | | Actual | | | 0.98 | % | | $ | 1,000.00 | | | $ | 1,190.60 | | | $ | 5.41 | |
| | Hypothetical* | | | 0.98 | % | | $ | 1,000.00 | | | $ | 1,020.27 | | | $ | 4.99 | |
| | | | | |
Class D(a) | | Actual | | | 0.83 | % | | $ | 1,000.00 | | | $ | 1,191.50 | | | $ | 4.58 | |
| | Hypothetical* | | | 0.83 | % | | $ | 1,000.00 | | | $ | 1,021.02 | | | $ | 4.23 | |
| | | | | |
Class E(a) | | Actual | | | 0.88 | % | | $ | 1,000.00 | | | $ | 1,191.50 | | | $ | 4.86 | |
| | Hypothetical* | | | 0.88 | % | | $ | 1,000.00 | | | $ | 1,020.77 | | | $ | 4.48 | |
* Hypothetical assumes a rate of return of 5% per year before expenses.
** Expenses paid are equal to the Portfolio’s annualized expense ratio for the most recent six month period, as shown above, multiplied by the average account value over the period, multiplied by the number of days (184 days) in the most recent fiscal half-year, divided by 365 (to reflect the one-half year period).
(a) The annualized expense ratio shown reflects the impact of the management fee waiver as described in Note 6 of the Notes to Financial Statements.
MSF-4
Metropolitan Series Fund
Frontier Mid Cap Growth Portfolio
Schedule of Investments as of December 31, 2013
Common Stocks—99.6% of Net Assets
| | | | | | | | |
| Security Description | | Shares | | | Value | |
|
Aerospace & Defense—4.0% | |
BE Aerospace, Inc. (a) | | | 595,890 | | | $ | 51,860,307 | |
| | | | | | | | |
|
Airlines—1.4% | |
United Continental Holdings, Inc. (a) | | | 478,750 | | | | 18,111,113 | |
| | | | | | | | |
|
Auto Components—2.8% | |
Delphi Automotive plc | | | 308,600 | | | | 18,556,118 | |
TRW Automotive Holdings Corp. (a) | | | 238,610 | | | | 17,750,198 | |
| | | | | | | | |
| | | | | | | 36,306,316 | |
| | | | | | | | |
|
Automobiles—2.0% | |
Harley-Davidson, Inc. | | | 366,200 | | | | 25,355,688 | |
| | | | | | | | |
|
Beverages—1.1% | |
Brown-Forman Corp. - Class B | | | 185,400 | | | | 14,010,678 | |
| | | | | | | | |
|
Biotechnology—3.1% | |
Alkermes plc (a) | | | 552,293 | | | | 22,456,233 | |
Incyte Corp., Ltd. (a) | | | 256,603 | | | | 12,991,810 | |
Intrexon Corp. (a) (b) | | | 181,500 | | | | 4,319,700 | |
| | | | | | | | |
| | | | | | | 39,767,743 | |
| | | | | | | | |
|
Building Products—1.0% | |
Armstrong World Industries, Inc. (a) | | | 235,000 | | | | 13,538,350 | |
| | | | | | | | |
|
Capital Markets—2.6% | |
E*Trade Financial Corp. (a) | | | 917,201 | | | | 18,013,828 | |
Raymond James Financial, Inc. | | | 309,834 | | | | 16,170,236 | |
| | | | | | | | |
| | | | | | | 34,184,064 | |
| | | | | | | | |
|
Chemicals—5.3% | |
Albemarle Corp. | | | 106,200 | | | | 6,732,018 | |
Celanese Corp. - Series A | | | 199,000 | | | | 11,006,690 | |
Cytec Industries, Inc. | | | 93,550 | | | | 8,715,118 | |
FMC Corp. | | | 451,400 | | | | 34,062,644 | |
Sherwin-Williams Co. (The) | | | 48,100 | | | | 8,826,350 | |
| | | | | | | | |
| | | | | | | 69,342,820 | |
| | | | | | | | |
|
Commercial Banks—1.5% | |
Signature Bank (a) | | | 181,400 | | | | 19,485,988 | |
| | | | | | | | |
|
Commercial Services & Supplies—1.7% | |
KAR Auction Services, Inc. | | | 450,050 | | | | 13,298,978 | |
Stericycle, Inc. (a) | | | 75,300 | | | | 8,747,601 | |
| | | | | | | | |
| | | | | | | 22,046,579 | |
| | | | | | | | |
|
Construction & Engineering—2.4% | |
Chicago Bridge & Iron Co. NV | | | 195,628 | | | | 16,264,512 | |
Jacobs Engineering Group, Inc. (a) | | | 242,000 | | | | 15,243,580 | |
| | | | | | | | |
| | | | | | | 31,508,092 | |
| | | | | | | | |
|
Construction Materials—1.4% | |
Eagle Materials, Inc. | | | 242,100 | | | | 18,745,803 | |
| | | | | | | | |
|
Distributors—1.8% | |
LKQ Corp. (a) | | | 712,800 | | | $ | 23,451,120 | |
| | | | | | | | |
|
Diversified Telecommunication Services—0.5% | |
Cogent Communications Group, Inc. | | | 151,135 | | | | 6,107,365 | |
| | | | | | | | |
|
Electronic Equipment, Instruments & Components—1.2% | |
Amphenol Corp.—Class A | | | 179,318 | | | | 15,991,579 | |
| | | | | | | | |
|
Energy Equipment & Services—1.6% | |
Cameron International Corp. (a) | | | 241,800 | | | | 14,394,354 | |
Oceaneering International, Inc. | | | 83,400 | | | | 6,578,592 | |
| | | | | | | | |
| | | | | | | 20,972,946 | |
| | | | | | | | |
|
Health Care Equipment & Supplies—1.9% | |
Cooper Cos., Inc. (The) | | | 194,950 | | | | 24,142,608 | |
| | | | | | | | |
|
Health Care Providers & Services—2.3% | |
Catamaran Corp. (a) | | | 247,502 | | | | 11,751,395 | |
MEDNAX, Inc. (a) | | | 351,648 | | | | 18,770,970 | |
| | | | | | | | |
| | | | | | | 30,522,365 | |
| | | | | | | | |
|
Health Care Technology—0.7% | |
Cerner Corp. (a) | | | 154,400 | | | | 8,606,256 | |
| | | | | | | | |
|
Hotels, Restaurants & Leisure—3.7% | |
Chipotle Mexican Grill, Inc. (a) | | | 12,350 | | | | 6,579,833 | |
Dunkin’ Brands Group, Inc. (b) | | | 203,100 | | | | 9,789,420 | |
Starwood Hotels & Resorts Worldwide, Inc. | | | 273,000 | | | | 21,689,850 | |
Wyndham Worldwide Corp. | | | 142,200 | | | | 10,478,718 | |
| | | | | | | | |
| | | | | | | 48,537,821 | |
| | | | | | | | |
|
Insurance—3.8% | |
Allied World Assurance Co. Holdings AG | | | 192,956 | | | | 21,767,366 | |
Aon plc | | | 178,801 | | | | 14,999,616 | |
Arthur J. Gallagher & Co. | | | 279,200 | | | | 13,102,856 | |
| | | | | | | | |
| | | | | | | 49,869,838 | |
| | | | | | | | |
|
Internet & Catalog Retail—0.6% | |
Netflix, Inc. (a) | | | 22,800 | | | | 8,394,276 | |
| | | | | | | | |
|
Internet Software & Services—1.4% | |
Akamai Technologies, Inc. (a) | | | 109,800 | | | | 5,180,364 | |
Pandora Media, Inc. (a) | | | 227,900 | | | | 6,062,140 | |
Yelp, Inc. (a) | | | 94,400 | | | | 6,508,880 | |
| | | | | | | | |
| | | | | | | 17,751,384 | |
| | | | | | | | |
|
IT Services—7.3% | |
Alliance Data Systems Corp. (a) (b) | | | 136,350 | | | | 35,850,505 | |
Gartner, Inc. (a) | | | 196,800 | | | | 13,982,640 | |
Jack Henry & Associates, Inc. | | | 360,700 | | | | 21,357,047 | |
MAXIMUS, Inc. | | | 148,012 | | | | 6,511,048 | |
WEX, Inc. (a) | | | 169,200 | | | | 16,755,876 | |
| | | | | | | | |
| | | | | | | 94,457,116 | |
| | | | | | | | |
See accompanying notes to financial statements.
MSF-5
Metropolitan Series Fund
Frontier Mid Cap Growth Portfolio
Schedule of Investments as of December 31, 2013
Common Stocks—(Continued)
| | | | | | | | |
| Security Description | | Shares | | | Value | |
|
Life Sciences Tools & Services—2.2% | |
Covance, Inc. (a) | | | 173,200 | | | $ | 15,251,992 | |
Illumina, Inc. (a) (b) | | | 120,000 | | | | 13,274,400 | |
| | | | | | | | |
| | | | | | | 28,526,392 | |
| | | | | | | | |
|
Machinery—3.6% | |
Chart Industries, Inc. (a) (b) | | | 39,900 | | | | 3,816,036 | |
Pall Corp. | | | 183,650 | | | | 15,674,528 | |
Pentair, Ltd. | | | 200,027 | | | | 15,536,097 | |
Wabtec Corp. | | | 158,400 | | | | 11,764,368 | |
| | | | | | | | |
| | | | | | | 46,791,029 | |
| | | | | | | | |
|
Marine—1.4% | |
Kirby Corp. (a) (b) | | | 185,600 | | | | 18,420,800 | |
| | | | | | | | |
|
Media—2.6% | |
Discovery Communications, Inc. - Class A (a) | | | 207,400 | | | | 18,753,108 | |
Imax Corp. (a) (b) | | | 520,300 | | | | 15,338,444 | |
| | | | | | | | |
| | | | | | | 34,091,552 | |
| | | | | | | | |
|
Oil, Gas & Consumable Fuels—5.4% | |
Cabot Oil & Gas Corp. | | | 507,800 | | | | 19,682,328 | |
Concho Resources, Inc. (a) | | | 137,600 | | | | 14,860,800 | |
Continental Resources, Inc. (a) (b) | | | 173,600 | | | | 19,533,472 | |
InterOil Corp. (a) (b) | | | 138,200 | | | | 7,115,918 | |
SandRidge Energy, Inc. (a) (b) | | | 1,579,400 | | | | 9,586,958 | |
| | | | | | | | |
| | | | | | | 70,779,476 | |
| | | | | | | | |
|
Pharmaceuticals—6.9% | |
Actavis plc (a) | | | 240,100 | | | | 40,336,800 | |
Mylan, Inc. (a) | | | 481,700 | | | | 20,905,780 | |
Perrigo Co. plc | | | 188,779 | | | | 28,970,025 | |
| | | | | | | | |
| | | | | | | 90,212,605 | |
| | | | | | | | |
|
Professional Services—1.1% | |
IHS, Inc. - Class A (a) | | | 122,750 | | | | 14,693,175 | |
| | | | | | | | |
|
Road & Rail—2.1% | |
Genesee & Wyoming, Inc. - Class A (a) | | | 182,825 | | | | 17,560,341 | |
J.B. Hunt Transport Services, Inc. | | | 125,700 | | | | 9,716,610 | |
| | | | | | | | |
| | | | | | | 27,276,951 | |
| | | | | | | | |
|
Semiconductors & Semiconductor Equipment—4.3% | |
Avago Technologies, Ltd. | | | 313,248 | | | | 16,567,687 | |
NXP Semiconductor NV (a) | | | 472,824 | | | | 21,716,806 | |
Xilinx, Inc. | | | 393,500 | | | | 18,069,520 | |
| | | | | | | | |
| | | | | | | 56,354,013 | |
| | | | | | | | |
|
Software—3.1% | |
Cadence Design Systems, Inc. (a) (b) | | | 1,271,426 | | | | 17,825,393 | |
Citrix Systems, Inc. (a) | | | 106,700 | | | | 6,748,775 | |
Electronic Arts, Inc. (a) (b) | | | 715,600 | | | | 16,415,864 | |
| | | | | | | | |
| | | | | | | 40,990,032 | |
| | | | | | | | |
|
Specialty Retail—6.5% | |
Bed Bath & Beyond, Inc. (a) | | | 106,200 | | | | 8,527,860 | |
CarMax, Inc. (a) | | | 135,100 | | | | 6,352,402 | |
Dick’s Sporting Goods, Inc. | | | 155,500 | | | | 9,034,550 | |
GNC Holdings, Inc. - Class A | | | 515,600 | | | | 30,136,820 | |
O’Reilly Automotive, Inc. (a) | | | 155,050 | | | | 19,956,486 | |
Tiffany & Co. | | | 111,000 | | | | 10,298,580 | |
| | | | | | | | |
| | | | | | | 84,306,698 | |
| | | | | | | | |
|
Textiles, Apparel & Luxury Goods—2.1% | |
PVH Corp. | | | 81,800 | | | | 11,126,436 | |
VF Corp. | | | 257,000 | | | | 16,021,380 | |
| | | | | | | | |
| | | | | | | 27,147,816 | |
| | | | | | | | |
| |
Trading Companies & Distributors—1.2% | | | | | |
WESCO International, Inc. (a) (b) | | | 171,900 | | | | 15,654,933 | |
| | | | | | | | |
Total Common Stock
(Cost $1,029,384,587) | | | | | | | 1,298,313,687 | |
| | | | | | | | |
|
| Short-Term Investments—12.3% | |
| |
Mutual Fund—11.3% | | | | | |
State Street Navigator Securities Lending MET Portfolio (c) | | | 146,638,431 | | | | 146,638,431 | |
| | | | | | | | |
| |
Repurchase Agreement—1.0% | | | | | |
Fixed Income Clearing Corp.
Repurchase Agreement dated 12/31/13 at 0.000% to be repurchased at $13,302,000 on 01/02/14, collateralized by $13,575,000 U.S. Treasury Bill at 0.000% due 06/19/14 with a value of $13,568,213. | | | 13,302,000 | | | | 13,302,000 | |
| | | | | | | | |
Total Short-Term Investments
(Cost $159,940,431) | | | | | | | 159,940,431 | |
| | | | | | | | |
Total Investments—111.9%
(Cost $1,189,325,018) (d) | | | | | | | 1,458,254,118 | |
Other assets and liabilities (net)—(11.9)% | | | | | | | (154,983,140 | ) |
| | | | | | | | |
| Net Assets—100.0% | | | | | | $ | 1,303,270,978 | |
| | | | | | | | |
| * | Principal amount stated in U.S. dollars unless otherwise noted. |
| (a) | Non-income producing security. |
| (b) | All or a portion of the security was held on loan. As of December 31, 2013, the market value of securities loaned was $159,983,914 and the collateral received consisted of cash in the amount of $146,638,431 and non-cash collateral with a value of $15,851,017. The cash collateral is invested in a money market fund managed by an affiliate of the custodian. The non-cash collateral received consists primarily of government securities and bank letters of credit, and is held for the benefit of the Portfolio at the Portfolio’s custodian. The Portfolio cannot repledge or resell this collateral. As such, this collateral is excluded from the Statement of Assets and Liabilities. |
| (c) | Represents investment of cash collateral received from securities lending transactions. |
See accompanying notes to financial statements.
MSF-6
Metropolitan Series Fund
Frontier Mid Cap Growth Portfolio
Schedule of Investments as of December 31, 2013
| (d) | As of December 31, 2013, the aggregate cost of investments for federal income tax purposes was $1,189,512,899. The aggregate unrealized appreciation and depreciation of investments were $274,482,085 and $(5,740,866), respectively, resulting in net unrealized appreciation of $268,741,219 for federal income tax purposes. |
Fair Value Hierarchy
Accounting principles generally accepted in the United States of America (“GAAP”) define fair market value as the price that the Portfolio would receive to sell an asset or pay to transfer a liability in an orderly transaction between market participants at the measurement date. It establishes a fair value hierarchy that prioritizes inputs to valuation methods and requires disclosure of the fair value hierarchy that segregates fair value measurements into three levels. Levels 1, 2 and 3 of the fair value hierarchy are defined as follows:
Level 1 - unadjusted quoted prices in active markets for identical investments
Level 2 - other significant observable inputs (including, but not limited to, unadjusted quoted prices for similar investments in markets that are either active or inactive; inputs other than quoted prices that are observable such as interest rates, yield curves, volatilities, prepayment speeds, loss severities, credit risks, default rates, etc.)
Level 3 - significant unobservable inputs based on the best information available in the circumstances, to the extent observable inputs are unavailable (including the Portfolio’s own assumptions in determining the fair value of investments)
The inputs or methodologies used for valuing investments are not necessarily an indication of the risk associated with investing in them. Changes to the inputs or methodologies used may result in transfers between levels, which will be recognized as of the beginning of the reporting period. Information on transfers between Level 1 and Level 2, if any, will be disclosed following the fair value hierarchy table below. A reconciliation of Level 3 securities, if any, will also be disclosed following the fair value hierarchy table. For more information about the Portfolio’s policy regarding the valuation of investments, please refer to the Notes to Financial Statements.
The following table summarizes the fair value hierarchy of the Portfolio’s investments as of December 31, 2013:
| | | | | | | | | | | | | | | | |
| Description | | Level 1 | | | Level 2 | | | Level 3 | | | Total | |
Total Common Stocks* | | $ | 1,298,313,687 | | | $ | — | | | $ | — | | | $ | 1,298,313,687 | |
| Short-Term Investments | | | | | | | | | | | | | | | | |
Mutual Fund | | | 146,638,431 | | | | — | | | | — | | | | 146,638,431 | |
Repurchase Agreement | | | — | | | | 13,302,000 | | | | — | | | | 13,302,000 | |
Total Short-Term Investments | | | 146,638,431 | | | | 13,302,000 | | | | — | | | | 159,940,431 | |
Total Investments | | $ | 1,444,952,118 | | | $ | 13,302,000 | | | $ | — | | | $ | 1,458,254,118 | |
| | | | | | | | | | | | | | | | | |
Collateral for Securities Loaned (Liability) | | $ | — | | | $ | (146,638,431 | ) | | $ | — | | | $ | (146,638,431 | ) |
| * | See Schedule of Investments for additional detailed categorizations. |
See accompanying notes to financial statements.
MSF-7
Metropolitan Series Fund
Frontier Mid Cap Growth Portfolio
Statement of Assets and Liabilities
December 31, 2013
| | | | |
Assets | | | | |
Investments at value (a) (b) | | $ | 1,458,254,118 | |
Cash | | | 833 | |
Receivable for: | | | | |
Fund shares sold | | | 262,197 | |
Dividends | | | 424,666 | |
Prepaid expenses | | | 2,806 | |
| | | | |
Total Assets | | | 1,458,944,620 | |
Liabilities | | | | |
Collateral for securities loaned | | | 146,638,431 | |
Payables for: | | | | |
Investments purchased | | | 7,227,640 | |
Fund shares redeemed | | | 773,848 | |
Accrued expenses: | | | | |
Management fees | | | 761,783 | |
Distribution and service fees | | | 52,657 | |
Deferred trustees’ fees | | | 89,792 | |
Other expenses | | | 129,491 | |
| | | | |
Total Liabilities | | | 155,673,642 | |
| | | | |
Net Assets | | $ | 1,303,270,978 | |
| | | | |
Net assets consist of: | | | | |
Paid in surplus | | $ | 919,038,707 | |
Distributions in excess of net investment income | | | (65,851 | ) |
Accumulated net realized gain | | | 115,369,022 | |
Unrealized appreciation on investments | | | 268,929,100 | |
| | | | |
Net Assets | | $ | 1,303,270,978 | |
| | | | |
Net Assets | | | | |
Class A | | $ | 982,625,476 | |
Class B | | | 201,916,180 | |
Class D | | | 107,054,412 | |
Class E | | | 11,674,910 | |
Capital Shares Outstanding* | | | | |
Class A | | | 26,630,555 | |
Class B | | | 5,803,783 | |
Class D | | | 2,931,090 | |
Class E | | | 320,252 | |
Net Asset Value, Offering Price and Redemption Price Per Share | | | | |
Class A | | $ | 36.90 | |
Class B | | | 34.79 | |
Class D | | | 36.52 | |
Class E | | | 36.46 | |
| * | The Portfolio is authorized to issue an unlimited number of shares. |
| (a) | Identified cost of investments was $1,189,325,018. |
| (b) | Includes securities loaned at value of $159,983,914. |
Statement of Operations
Year Ended December 31, 2013
| | | | |
Investment Income | | | | |
Dividends (a) | | $ | 6,337,873 | |
Interest | | | 973 | |
Securities lending income | | | 1,573,965 | |
| | | | |
Total investment income | | | 7,912,811 | |
Expenses | | | | |
Management fees | | | 7,822,214 | |
Administration fees | | | 20,829 | |
Custodian and accounting fees | | | 92,819 | |
Distribution and service fees—Class B | | | 400,448 | |
Distribution and service fees—Class D | | | 102,634 | |
Distribution and service fees—Class E | | | 16,464 | |
Audit and tax services | | | 37,283 | |
Legal | | | 58,079 | |
Trustees’ fees and expenses | | | 36,569 | |
Shareholder reporting | | | 141,793 | |
Insurance | | | 5,591 | |
Miscellaneous | | | 30,569 | |
| | | | |
Total expenses | | | 8,765,292 | |
Less management fee waiver | | | (110,661 | ) |
Less broker commission recapture | | | (73,413 | ) |
| | | | |
Net expenses | | | 8,581,218 | |
| | | | |
Net Investment Loss | | | (668,407 | ) |
| | | | |
Net Realized and Unrealized Gain | | | | |
| Net realized gain (loss) on: | | | | |
Investments | | | 124,036,428 | |
Futures contracts | | | (2,064,048 | ) |
| | | | |
Net realized gain | | | 121,972,380 | |
| | | | |
Net change in unrealized appreciation on investments | | | 187,726,392 | |
| | | | |
Net realized and unrealized gain | | | 309,698,772 | |
| | | | |
Net Increase in Net Assets from Operations | | $ | 309,030,365 | |
| | | | |
| (a) | Net of foreign withholding taxes of $17,406. |
See accompanying notes to financial statements.
MSF-8
Metropolitan Series Fund
Frontier Mid Cap Growth Portfolio
Statements of Changes in Net Assets
| | | | | | | | |
| | | Year Ended
December 31,
2013 | | | Year Ended
December 31,
2012 | |
Increase (Decrease) in Net Assets: | | | | | | | | |
From Operations | | | | | | | | |
Net investment income (loss) | | $ | (668,407 | ) | | $ | 9,251,574 | |
Net realized gain | | | 121,972,380 | | | | 44,428,871 | |
Net change in unrealized appreciation | | | 187,726,392 | | | | 29,329,361 | |
| | | | | | | | |
Increase in net assets from operations | | | 309,030,365 | | | | 83,009,806 | |
| | | | | | | | |
From Distributions to Shareholders | | | | | | | | |
Net investment income | | | | | | | | |
Class A | | | (10,148,727 | ) | | | 0 | |
Class B | | | (1,011,597 | ) | | | 0 | |
Class D | | | (1,225,160 | ) | | | 0 | |
Class E | | | (126,525 | ) | | | 0 | |
Net realized capital gains | | | | | | | | |
Class A | | | (19,126,447 | ) | | | 0 | |
Class B | | | (2,305,500 | ) | | | 0 | |
Class D | | | (2,521,064 | ) | | | 0 | |
Class E | | | (269,552 | ) | | | 0 | |
| | | | | | | | |
Total distributions | | | (36,734,572 | ) | | | 0 | |
| | | | | | | | |
Increase (decrease) in net assets from capital share transactions | | | 265,115,462 | | | | (91,274,010 | ) |
| | | | | | | | |
Total increase (decrease) in net assets | | | 537,411,255 | | | | (8,264,204 | ) |
| | |
Net Assets | | | | | | | | |
Beginning of period | | | 765,859,723 | | | | 774,123,927 | |
| | | | | | | | |
End of period | | $ | 1,303,270,978 | | | $ | 765,859,723 | |
| | | | | | | | |
| | |
Undistributed (Distributions in excess of) Net Investment Income | | | | | | | | |
End of period | | $ | (65,851 | ) | | $ | 12,827,535 | |
| | | | | | | | |
Other Information:
Capital Shares
Transactions in capital shares were as follows:
| | | | | | | | | | | | | | | | |
| | | Year Ended
December 31, 2013 | | | Year Ended
December 31, 2012 | |
| | | Shares | | | Value | | | Shares | | | Value | |
Class A | | | | | | | | | | | | | | | | |
Sales | | | 6,356,029 | | | $ | 200,658,424 | | | | 446,109 | | | $ | 12,621,552 | |
Shares issued through acquisition | | | 2,821,283 | | | | 85,795,220 | | | | 0 | | | | 0 | |
Reinvestments | | | 989,361 | | | | 29,275,174 | | | | 0 | | | | 0 | |
Redemptions | | | (3,301,717 | ) | | | (107,258,219 | ) | | | (2,486,073 | ) | | | (70,442,350 | ) |
| | | | | | | | | | | | | | | | |
Net increase (decrease) | | | 6,864,956 | | | $ | 208,470,599 | | | | (2,039,964 | ) | | $ | (57,820,798 | ) |
| | | | | | | | | | | | | | | | |
Class B | | | | | | | | | | | | | | | | |
Sales | | | 259,826 | | | $ | 8,047,547 | | | | 316,757 | | | $ | 8,439,378 | |
Shares issued through acquisition | | | 3,508,655 | | | | 100,768,563 | | | | 0 | | | | 0 | |
Reinvestments | | | 118,680 | | | | 3,317,097 | | | | 0 | | | | 0 | |
Redemptions | | | (1,158,635 | ) | | | (36,083,506 | ) | | | (526,940 | ) | | | (14,159,857 | ) |
| | | | | | | | | | | | | | | | |
Net increase (decrease) | | | 2,728,526 | | | $ | 76,049,701 | | | | (210,183 | ) | | $ | (5,720,479 | ) |
| | | | | | | | | | | | | | | | |
Class D | | | | | | | | | | | | | | | | |
Sales | | | 126,997 | | | $ | 4,059,104 | | | | 180,453 | | | $ | 5,066,882 | |
Reinvestments | | | 127,814 | | | | 3,746,224 | | | | 0 | | | | 0 | |
Redemptions | | | (813,613 | ) | | | (25,910,235 | ) | | | (1,102,797 | ) | | | (30,995,322 | ) |
| | | | | | | | | | | | | | | | |
Net decrease | | | (558,802 | ) | | $ | (18,104,907 | ) | | | (922,344 | ) | | $ | (25,928,440 | ) |
| | | | | | | | | | | | | | | | |
Class E | | | | | | | | | | | | | | | | |
Sales | | | 17,095 | | | $ | 550,306 | | | | 40,014 | | | $ | 1,115,614 | |
Reinvestments | | | 13,537 | | | | 396,077 | | | | 0 | | | | 0 | |
Redemptions | | | (70,032 | ) | | | (2,246,314 | ) | | | (104,021 | ) | | | (2,919,907 | ) |
| | | | | | | | | | | | | | | | |
Net decrease | | | (39,400 | ) | | $ | (1,299,931 | ) | | | (64,007 | ) | | $ | (1,804,293 | ) |
| | | | | | | | | | | | | | | | |
Increase (decrease) derived from capital shares transactions | | | | | | $ | 265,115,462 | | | | | | | $ | (91,274,010 | ) |
| | | | | | | | | | | | | | | | |
See accompanying notes to financial statements.
MSF-9
Metropolitan Series Fund
Frontier Mid Cap Growth Portfolio
Financial Highlights
| | | | | | | | | | | | | | | | | | | | |
| Selected per share data | | | |
| | | Class A | |
| | | Year Ended December 31, | |
| | | 2013 | | | 2012 | | | 2011 | | | 2010 | | | 2009 | |
Net Asset Value, Beginning of Period | | $ | 28.92 | | | $ | 26.06 | | | $ | 26.94 | | | $ | 23.38 | | | $ | 15.68 | |
| | | | | | | | | | | | | | | | | | | | |
Income (Loss) from Investment Operations | | | | | | | | | | | | | | | | | | | | |
Net investment income (a) | | | (0.00 | ) (b) | | | 0.34 | | | | 0.02 | | | | 0.10 | | | | 0.02 | |
Net realized and unrealized gain (loss) on investments | | | 9.18 | | | | 2.52 | | | | (0.82 | ) | | | 3.48 | | | | 7.72 | |
| | | | | | | | | | | | | | | | | | | | |
Total from investment operations | | | 9.18 | | | | 2.86 | | | | (0.80 | ) | | | 3.58 | | | | 7.74 | |
| | | | | | | | | | | | | | | | | | | | |
Less Distributions | | | | | | | | | | | | | | | | | | | | |
Distributions from net investment income | | | (0.42 | ) | | | 0.00 | | | | (0.08 | ) | | | (0.02 | ) | | | (0.04 | ) |
Distributions from net realized capital gains | | | (0.78 | ) | | | 0.00 | | | | 0.00 | | | | 0.00 | | | | 0.00 | |
| | | | | | | | | | | | | | | | | | | | |
Total distributions | | | (1.20 | ) | | | 0.00 | | | | (0.08 | ) | | | (0.02 | ) | | | (0.04 | ) |
| | | | | | | | | | | | | | | | | | | | |
Net Asset Value, End of Period | | $ | 36.90 | | | $ | 28.92 | | | $ | 26.06 | | | $ | 26.94 | | | $ | 23.38 | |
| | | | | | | | | | | | | | | | | | | | |
Total Return (%) (c) | | | 32.77 | | | | 10.97 | | | | (3.00 | ) | | | 15.30 | | | | 49.44 | |
| | | | | |
Ratios/Supplemental Data | | | | | | | | | | | | | | | | | | | | |
Gross ratio of expenses to average net assets (%) | | | 0.75 | | | | 0.78 | | | | 0.77 | | | | 0.77 | | | | 0.79 | |
Net ratio of expenses to average net assets (%) (d) | | | 0.74 | | | | 0.78 | | | | 0.77 | | | | 0.77 | | | | 0.79 | |
Ratio of net investment income (loss) to average net assets (%) | | | (0.01 | ) | | | 1.21 | | | | 0.09 | | | | 0.40 | | | | 0.11 | |
Portfolio turnover rate (%) | | | 120 | | | | 78 | | | | 111 | | | | 91 | | | | 55 | |
Net assets, end of period (in millions) | | $ | 982.6 | | | $ | 571.6 | | | $ | 568.2 | | | $ | 644.6 | | | $ | 622.8 | |
| | | | | | | | | | | | | | | | | | | | |
| | | Class B | |
| | | Year Ended December 31, | |
| | | 2013 | | | 2012 | | | 2011 | | | 2010 | | | 2009 | |
Net Asset Value, Beginning of Period | | $ | 27.33 | | | $ | 24.69 | | | $ | 25.54 | | | $ | 22.21 | | | $ | 14.90 | |
| | | | | | | | | | | | | | | | | | | | |
Income (Loss) from Investment Operations | | | | | | | | | | | | | | | | | | | | |
Net investment income (loss) (a) | | | (0.08 | ) | | | 0.26 | | | | (0.04 | ) | | | 0.04 | | | | (0.02 | ) |
Net realized and unrealized gain (loss) on investments | | | 8.66 | | | | 2.38 | | | | (0.79 | ) | | | 3.29 | | | | 7.33 | |
| | | | | | | | | | | | | | | | | | | | |
Total from investment operations | | | 8.58 | | | | 2.64 | | | | (0.83 | ) | | | 3.33 | | | | 7.31 | |
| | | | | | | | | | | | | | | | | | | | |
Less Distributions | | | | | | | | | | | | | | | | | | | | |
Distributions from net investment income | | | (0.34 | ) | | | 0.00 | | | | (0.02 | ) | | | 0.00 | | | | 0.00 | |
Distributions from net realized capital gains | | | (0.78 | ) | | | 0.00 | | | | 0.00 | | | | 0.00 | | | | 0.00 | |
| | | | | | | | | | | | | | | | | | | | |
Total distributions | | | (1.12 | ) | | | 0.00 | | | | (0.02 | ) | | | 0.00 | | | | 0.00 | |
| | | | | | | | | | | | | | | | | | | | |
Net Asset Value, End of Period | | $ | 34.79 | | | $ | 27.33 | | | $ | 24.69 | | | $ | 25.54 | | | $ | 22.21 | |
| | | | | | | | | | | | | | | | | | | | |
Total Return (%) (c) | | | 32.43 | | | | 10.69 | | | | (3.24 | ) | | | 14.99 | | | | 49.06 | |
| | | | | |
Ratios/Supplemental Data | | | | | | | | | | | | | | | | | | | | |
Gross ratio of expenses to average net assets (%) | | | 1.00 | | | | 1.03 | | | | 1.02 | | | | 1.02 | | | | 1.04 | |
Net ratio of expenses to average net assets (%) (d) | | | 0.99 | | | | 1.03 | | | | 1.02 | | | | 1.02 | | | | 1.04 | |
Ratio of net investment income (loss) to average net assets (%) | | | (0.25 | ) | | | 0.98 | | | | (0.15 | ) | | | 0.18 | | | | (0.13 | ) |
Portfolio turnover rate (%) | | | 120 | | | | 78 | | | | 111 | | | | 91 | | | | 55 | |
Net assets, end of period (in millions) | | $ | 201.9 | | | $ | 84.1 | | | $ | 81.1 | | | $ | 83.4 | | | $ | 67.6 | |
Please see following page for Financial Highlights footnote legend.
See accompanying notes to financial statements.
MSF-10
Metropolitan Series Fund
Frontier Mid Cap Growth Portfolio
Financial Highlights
| | | | | | | | | | | | | | | | | | | | |
| Selected per share data | | | |
| | | Class D | |
| | | Year Ended December 31, | |
| | | 2013 | | | 2012 | | | 2011 | | | 2010 | | | 2009 | |
Net Asset Value, Beginning of Period | | $ | 28.63 | | | $ | 25.82 | | | $ | 26.71 | | | $ | 23.19 | | | $ | 15.54 | |
| | | | | | | | | | | | | | | | | | | | |
Income (Loss) from Investment Operations | | | | | | | | | | | | | | | | | | | | |
Net investment income (loss) (a) | | | (0.04 | ) | | | 0.30 | | | | (0.01 | ) | | | 0.07 | | | | 0.00 | (b) |
Net realized and unrealized gain (loss) on investments | | | 9.09 | | | | 2.51 | | | | (0.82 | ) | | | 3.45 | | | | 7.66 | |
| | | | | | | | | | | | | | | | | | | | |
Total from investment operations | | | 9.05 | | | | 2.81 | | | | (0.83 | ) | | | 3.52 | | | | 7.66 | |
| | | | | | | | | | | | | | | | | | | | |
Less Distributions | | | | | | | | | | | | | | | | | | | | |
Distributions from net investment income | | | (0.38 | ) | | | 0.00 | | | | (0.06 | ) | | | 0.00 | | | | (0.01 | ) |
Distributions from net realized capital gains | | | (0.78 | ) | | | 0.00 | | | | 0.00 | | | | 0.00 | | | | 0.00 | |
| | | | | | | | | | | | | | | | | | | | |
Total distributions | | | (1.16 | ) | | | 0.00 | | | | (0.06 | ) | | | 0.00 | | | | (0.01 | ) |
| | | | | | | | | | | | | | | | | | | | |
Net Asset Value, End of Period | | $ | 36.52 | | | $ | 28.63 | | | $ | 25.82 | | | $ | 26.71 | | | $ | 23.19 | |
| | | | | | | | | | | | | | | | | | | | |
Total Return (%) (c) | | | 32.63 | | | | 10.88 | | | | (3.14 | ) | | | 15.18 | | | | 49.24 | |
| | | | | |
Ratios/Supplemental Data | | | | | | | | | | | | | | | | | | | | |
Gross ratio of expenses to average net assets (%) | | | 0.85 | | | | 0.88 | | | | 0.87 | | | | 0.87 | | | | 0.89 | |
Net ratio of expenses to average net assets (%) (d) | | | 0.84 | | | | 0.88 | | | | 0.87 | | | | 0.87 | | | | 0.89 | |
Ratio of net investment income (loss) to average net assets (%) | | | (0.13 | ) | | | 1.06 | | | | (0.03 | ) | | | 0.29 | | | | 0.01 | |
Portfolio turnover rate (%) | | | 120 | | | | 78 | | | | 111 | | | | 91 | | | | 55 | |
Net assets, end of period (in millions) | | $ | 107.1 | | | $ | 99.9 | | | $ | 113.9 | | | $ | 148.1 | | | $ | 152.3 | |
| | | | | | | | | | | | | | | | | | | | |
| | | Class E | |
| | | Year Ended December 31, | |
| | | 2013 | | | 2012 | | | 2011 | | | 2010 | | | 2009 | |
Net Asset Value, Beginning of Period | | $ | 28.58 | | | $ | 25.79 | | | $ | 26.68 | | | $ | 23.16 | | | $ | 15.53 | |
| | | | | | | | | | | | | | | | | | | | |
Income (Loss) from Investment Operations | | | | | | | | | | | | | | | | | | | | |
Net investment income (loss) (a) | | | (0.06 | ) | | | 0.29 | | | | (0.02 | ) | | | 0.05 | | | | (0.01 | ) |
Net realized and unrealized gain (loss) on investments | | | 9.09 | | | | 2.50 | | | | (0.82 | ) | | | 3.47 | | | | 7.64 | |
| | | | | | | | | | | | | | | | | | | | |
Total from investment operations | | | 9.03 | | | | 2.79 | | | | (0.84 | ) | | | 3.52 | | | | 7.63 | |
| | | | | | | | | | | | | | | | | | | | |
Less Distributions | | | | | | | | | | | | | | | | | | | | |
Distributions from net investment income | | | (0.37 | ) | | | 0.00 | | | | (0.05 | ) | | | 0.00 | | | | 0.00 | |
Distributions from net realized capital gains | | | (0.78 | ) | | | 0.00 | | | | 0.00 | | | | 0.00 | | | | 0.00 | |
| | | | | | | | | | | | | | | | | | | | |
Total distributions | | | (1.15 | ) | | | 0.00 | | | | (0.05 | ) | | | 0.00 | | | | 0.00 | |
| | | | | | | | | | | | | | | | | | | | |
Net Asset Value, End of Period | | $ | 36.46 | | | $ | 28.58 | | | $ | 25.79 | | | $ | 26.68 | | | $ | 23.16 | |
| | | | | | | | | | | | | | | | | | | | |
Total Return (%) (c) | | | 32.59 | | | | 10.82 | | | | (3.19 | ) | | | 15.20 | | | | 49.17 | |
| | | | | |
Ratios/Supplemental Data | | | | | | | | | | | | | | | | | | | | |
Gross ratio of expenses to average net assets (%) | | | 0.90 | | | | 0.93 | | | | 0.92 | | | | 0.92 | | | | 0.94 | |
Net ratio of expenses to average net assets (%) (d) | | | 0.89 | | | | 0.93 | | | | 0.92 | | | | 0.92 | | | | 0.94 | |
Ratio of net investment income (loss) to average net assets (%) | | | (0.17 | ) | | | 1.04 | | | | (0.07 | ) | | | 0.23 | | | | (0.03 | ) |
Portfolio turnover rate (%) | | | 120 | | | | 78 | | | | 111 | | | | 91 | | | | 55 | |
Net assets, end of period (in millions) | | $ | 11.7 | | | $ | 10.3 | | | $ | 10.9 | | | $ | 13.9 | | | $ | 15.0 | |
| (a) | Per share amounts based on average shares outstanding during the period. |
| (b) | Net investment income (loss) was less than $0.01. |
| (c) | Total return does not reflect any insurance, sales, separate account or administrative charges of variable annuity or life insurance contracts or any additional expenses that contract owners may bear under their variable contracts. If these charges were included, the returns would be lower. |
| (d) | Net ratio of expenses to average net assets includes the effect of management fee waivers as detailed in Note 6 of the Notes to Financial Statements. |
See accompanying notes to financial statements.
MSF-11
Metropolitan Series Fund
Frontier Mid Cap Growth Portfolio
Notes to Financial Statements—December 31, 2013
1. Organization
Metropolitan Series Fund (the “Trust”) is organized as a Delaware statutory trust and registered under the Investment Company Act of 1940, as amended (the “1940 Act”), as an open-end management investment company. The Trust is currently comprised of thirty series, each of which operates as a distinct investment vehicle of the Trust. The portfolio included in this report is Frontier Mid Cap Growth Portfolio (the “Portfolio”), which is diversified. On January 7, 2013, Frontier Capital Management Company, LLC succeeded BlackRock Advisors, LLC as the subadviser to the Portfolio and the name of the Portfolio was changed from the BlackRock Aggressive Growth Portfolio to the Frontier Mid Cap Growth Portfolio. Shares in the Portfolio are not offered directly to the general public and are currently available only to separate accounts established by Metropolitan Life Insurance Company (“MetLife”) and other affiliated life insurance companies.
The Portfolio has registered and offers four classes of shares: Class A, B, D, and E shares. Shares of each Class of the Portfolio represent an equal pro rata interest in the Portfolio and generally give the shareholder the same voting, dividend, liquidation, and other rights. Investment income, realized and unrealized capital gains and losses, the common expenses of the Portfolio, and certain Portfolio-level expense reductions, if any, are allocated on a pro rata basis to each Class based on the relative net assets of each Class to the net assets of the Portfolio. Each Class of shares differs in its respective distribution plan and such distribution expenses are allocated to that Class.
2. Significant Accounting Policies
The preparation of financial statements in conformity with accounting principles generally accepted in the United States of America (“GAAP”) requires management to make estimates and assumptions that affect the reported amounts of assets and liabilities and disclosure of contingent assets and liabilities as of the date of the financial statements and the reported amounts of income and expenses during the reporting period. Actual results could differ from those estimates. In the preparation of these financial statements, management has evaluated events and transactions subsequent to December 31, 2013 through the date the financial statements were issued.
The following is a summary of significant accounting policies consistently followed by the Portfolio in the preparation of its financial statements.
Investment Valuation and Fair Value Measurements - Debt securities (other than short term obligations with a remaining maturity of sixty days or less), including corporate, convertible and municipal bonds and notes; obligations of the U.S. treasury and U.S. government agencies; sovereign issues; floating rate loans; and non-U.S. bonds, are generally valued on the basis of evaluated or composite bid quotations obtained from independent pricing services and/or brokers and dealers selected by MetLife Advisers, LLC (“MetLife Advisers” or the “Adviser”), an affiliate of MetLife, Inc., pursuant to authorization of the Board of Trustees of the Trust (the “Board” or “Trustees”). Such quotations utilize matrix pricing, which considers observable inputs including, among other things, issuer details, maturity dates, interest rates, yield curves, rates of prepayment, credit risks/spreads, default rates, reported trades, broker dealer quotes and quoted prices for similar securities. Securities that use similar valuation techniques and inputs as described above are generally categorized as Level 2 within the fair value hierarchy.
Mortgage and asset-backed securities are usually issued as separate tranches, or classes, of securities within each deal. These securities are also generally valued on the basis of evaluated or composite bid quotations obtained from independent pricing services and/or brokers and dealers selected by the Adviser pursuant to authorization of the Board. The pricing models for these securities usually consider tranche-level attributes, estimated cash flows and market-based yield spreads for each tranche and current market data, and incorporate deal collateral performance, as available. Mortgage and asset-backed securities that use similar valuation techniques and inputs as described above are generally categorized as Level 2 within the fair value hierarchy.
Short term obligations with a remaining maturity of sixty days or less are generally valued at amortized cost, which approximates fair market value, and are generally categorized as Level 2 within the fair value hierarchy.
Domestic and foreign equity securities, such as common stock, exchange-traded funds, rights, warrants, and preferred stock, that are traded on a securities exchange, are generally valued at their last sale price on the exchange or market in which they are principally traded on the valuation date, or, if no sales occurred on that day, at the last reported bid price. Equity securities traded over-the-counter are generally valued at the last reported sale price. Valuation adjustments may be applied to certain foreign equity securities that are traded solely on foreign exchanges that close before the close of the U.S. market to account for the market movement between the close of the foreign exchanges and the close of the U.S. market. The Portfolio may use a systematic fair valuation model provided by an independent third party to value securities principally traded in these foreign markets in order to adjust for possible stale pricing that may occur between the close of the foreign exchanges and the time of the Portfolio valuation. Foreign equity securities using these valuation adjustments are generally categorized as Level 2 within the fair value hierarchy. Equity securities that are actively traded, and have no valuation adjustments applied, are categorized as Level 1 within the fair value hierarchy. Other equity securities traded on inactive markets, or valued in reference to similar instruments traded on active markets, are generally categorized as Level 2 within the fair value hierarchy.
MSF-12
Metropolitan Series Fund
Frontier Mid Cap Growth Portfolio
Notes to Financial Statements—December 31, 2013—(Continued)
Investments in registered open-end management investment companies are valued at reported net asset value per share on the valuation date and are categorized as Level 1 within the fair value hierarchy.
Forward foreign currency exchange contracts are valued through an independent pricing service based on the mean between closing bid and ask prices of the forward currency rates in the London foreign exchange markets on a daily basis as provided by a reliable bank or dealer. These contracts are generally categorized as Level 2 within the fair value hierarchy.
Options, whether on securities, indices, futures contracts, or otherwise, traded on exchanges are valued at the last sale price available as of the close of business on the valuation date or, if there is no such price available, at the mean between the last reported bid and ask prices. These types of options are categorized as Level 1 within the fair value hierarchy. Futures contracts, which are traded on commodity exchanges, are valued at their closing prices as of the close of such exchanges and are categorized as Level 1 within the fair value hierarchy.
Options and futures contracts that are traded over-the-counter are generally valued on the basis of quotations provided by broker-dealers or prices provided by pricing service providers who use a series of techniques, including simulation pricing models, to determine the value of the contracts. The pricing models use inputs that are observed from actively quoted markets such as issuer details, indices, spreads, interest rates, yield curves, credit curves, measures of volatility and exchange rates. These contracts are generally categorized as Level 2 within the fair value hierarchy.
If no current market value quotation or other observable inputs are readily available or market value quotations are deemed to be unreliable for a security, the fair value of the security will be determined in accordance with procedures approved by and under the general supervision of the Board. In such a circumstance, the Board has delegated the determination of the fair value of a security to a Valuation Committee (“Committee”) of MetLife Advisers. The Committee provides general pricing oversight and fair value pricing determinations related to portfolio securities and meets on a regular basis to review reports relating to the valuation of the securities in the Portfolio. The Board has delegated to State Street Bank and Trust Company, the Trust’s custodian (“custodian”), the responsibility for calculating the net asset values (“NAVs”) of the Trust’s Portfolios. The Committee is responsible for overseeing the calculation of the NAVs of the Portfolios by the custodian. The Committee also periodically reviews pricing vendors, including the vendor providing fair value pricing for the Portfolio’s foreign securities, and is responsible for overseeing the correction of pricing errors and addressing other pricing issues that arise in the ordinary course of business, such as making real-time fair value determinations, as necessary.
No single standard for determining the fair value of a security can be set forth because fair value depends upon the facts and circumstances with respect to each security. Information relating to any relevant factors may be obtained by the Committee from any appropriate source, including the subadviser of the Portfolio, the custodian, a pricing service, market maker and/or broker for such security or the issuer. Appropriate methodologies for determining fair value under particular circumstances may include: matrix pricing, comparisons of securities with comparable characteristics, value based on multiples of earnings, discount from market price of similar marketable securities or a combination of these and other methods. The Committee maintains a detailed report tracking each fair-valued security that compares the fair value price to the next available trade, vendor or broker price, and provides information on how close the fair value price was to the next quoted price. The Committee reviews a summary of such report monthly. On a quarterly basis, the Board is provided with the following for consideration and ratification or adjustment: (1) a memorandum summarizing the actions taken by the Committee in the prior quarter; and (2) a list of the Portfolio’s securities as of the most recent quarter-end for which market quotations were not readily available.
Investment Transactions and Related Investment Income - Portfolio security transactions are recorded on the trade date. Dividend income is recorded on the ex-dividend date or, for certain foreign securities, when notified. Interest income, which includes amortization of premium and accretion of discount on debt securities, is recorded on the accrual basis. Realized gains and losses on investments are determined on the identified cost basis, which is the same basis used for federal income tax purposes. Foreign income and foreign capital gains on some foreign securities may be subject to foreign taxes, which are accrued as applicable. These foreign taxes have been provided for in accordance with the Portfolio’s understanding of the applicable countries’ tax rules and rates.
Foreign Currency Translation - The books and records of the Portfolio are maintained in U.S. dollars. The values of securities, currencies, and other assets and liabilities denominated in currencies other than the U.S. dollar are translated into U.S. dollars based upon foreign exchange rates prevailing at the end of the period. Purchases and sales of investment securities, income, and expenses are translated on the respective dates of such transactions. Because the values of investment securities are translated at the foreign exchange rates prevailing at the end of the period, that portion of the results of operations arising from changes in exchange rates and that portion of the results of operations reflecting fluctuations arising from changes in market prices of the investment securities are not separated. Such fluctuations are included in the net realized and unrealized gain or loss on investments.
Net realized foreign exchange gains or losses arise from activity in forward foreign currency exchange contracts, sales of foreign currency, currency gains or losses realized between the trade and settlement dates on securities transactions, and the difference between the amounts of dividends, interest, and foreign withholding taxes recorded by the Portfolio and the U.S. dollar equivalent of
MSF-13
Metropolitan Series Fund
Frontier Mid Cap Growth Portfolio
Notes to Financial Statements—December 31, 2013—(Continued)
the amounts actually received or paid by the Portfolio. Net unrealized foreign exchange gains and losses arise from changes in the value of assets and liabilities, other than investment securities, resulting from changes in foreign exchange rates.
Income Taxes - It is the Portfolio’s policy to comply with the requirements of the Internal Revenue Code of 1986, as amended, and regulations thereunder, applicable to regulated investment companies and to distribute, with respect to each taxable year, all of its taxable income to shareholders. Therefore, no federal income tax provision is required. The Portfolio files U.S. federal tax returns. No income tax returns are currently under examination. The Portfolio’s federal tax returns for the prior three fiscal years remain subject to examination by the Internal Revenue Service. As of December 31, 2013, the Portfolio had no uncertain tax positions that would require financial statement recognition, or de-recognition or disclosure.
Dividends and Distributions to Shareholders - The Portfolio records dividends and distributions on the ex-dividend date. Net realized gains from security transactions (if any) are generally distributed annually to shareholders. The timing and characterization of certain income and capital gains distributions are determined in accordance with federal tax regulations that may differ from GAAP. Permanent book and tax basis differences relating to shareholder distributions will result in reclassification between under/over distributed net investment income, accumulated net realized gains/losses, and paid-in surplus. Book-tax differences are primarily due to ordinary loss netting to reduce short term capital gains, distribution re-designations, merger related adjustments and broker commission recapture reclasses. These adjustments have no impact on net assets or the results of operations.
Securities Lending - The Portfolio may lend its portfolio securities to certain qualified brokers who borrow securities in order to complete certain securities transactions. By lending its portfolio securities, the Portfolio attempts to increase its net investment income through the receipt of income on collateral held from securities on loan. Any gain or loss in the market price of the loaned securities that might occur and any interest earned or dividends declared during the term of the loan would accrue to the account of the Portfolio.
The Trust has entered into a securities lending arrangement with the custodian. Under this arrangement, the custodian is authorized to loan portfolio securities on the Portfolio’s behalf. In exchange, the Portfolio receives either cash or securities as collateral against the loaned securities. The Portfolio receives collateral at least equal to 102% of the market value of the loaned securities (105% for foreign equity securities), at each loan’s inception. Collateral representing at least 100% of the market value of the loaned securities must be maintained for the duration of the loan. A liability for cash collateral is reflected on the Statement of Assets and Liabilities, and is categorized as Level 2 within the fair value hierarchy. Cash collateral is generally invested in the State Street Navigator Securities Lending MET Portfolio (the “Navigator Portfolio”), a series of the State Street Navigator Securities Lending Trust that is managed by an affiliate of the custodian. The Navigator Portfolio is a registered money market fund that invests in a variety of high-quality, U.S. dollar-denominated instruments. If the market value of the collateral at the close of trading on a business day is less than 100% of the market value of the loaned securities at the close of trading on that day, the borrower shall be required to deliver, by the close of business on the following business day, an additional amount of collateral, so that the total amount of posted collateral is equal to at least 100% of the market value of all the loaned securities as of such preceding day. A portion of net income (income after the deduction of expenses and fees of the Navigator Portfolio) on the collateral is rebated to the borrower of the securities and the remainder is split between the custodian and the Portfolio. On loans collateralized by U.S. Treasuries, a fee is received from the borrower and is allocated between the Portfolio and the custodian. The risks associated with lending portfolio securities include, but are not limited to, possible delays in receiving additional collateral or in the recovery of the loaned securities, possible loss of rights in the collateral should the borrower fail financially, as well as risk of loss in the value of the collateral or the value of the investments made with the collateral. The lending agent has agreed to indemnify the Portfolio in the case of default of any securities borrower. Income received by the Portfolio in securities lending transactions during the year ended December 31, 2013 is reflected as Securities lending income on the Statement of Operations. Any outstanding loans by the Portfolio at December 31, 2013 are disclosed in the footnotes to the Schedule of Investments.
Repurchase Agreements - The Portfolio may enter into repurchase agreements, under the terms of a Master Repurchase Agreement, with selected commercial banks and broker-dealers, under which the Portfolio acquires securities as collateral and agrees to resell the securities at an agreed upon time and at an agreed-upon price. The Portfolio, through the custodian or a subcustodian, receives delivery of the underlying securities collateralizing any repurchase agreements. The Portfolio requires the custodian to take possession, to have legally segregated in the Federal Reserve Book Entry System, or to have segregated within the custodian’s vault, all securities held as collateral for repurchase agreements. It is the Portfolio’s policy that the market value of the collateral be at least equal to 100% of the repurchase price in the case of a repurchase agreement of one-day duration and at least equal to 102% of the repurchase price in the case of all other repurchase agreements. In the event of default or failure by a party to perform an obligation in connection with any repurchase transaction, the Master Repurchase Agreement gives the non-defaulting party the right to set-off claims and to apply property held by it in connection with any repurchase transaction against obligations owed to it.
At December 31, 2013, the Portfolio had investments in repurchase agreements with a gross value of $13,302,000, which is included as part of investments at value on the Statement of Assets and Liabilities. The value of the related collateral exceeded the value of the repurchase agreements at December 31, 2013.
MSF-14
Metropolitan Series Fund
Frontier Mid Cap Growth Portfolio
Notes to Financial Statements—December 31, 2013—(Continued)
Directed Brokerage Agreement - The Trust has entered into a directed brokerage arrangement with State Street Global Markets (“SSGM”). Under this arrangement, the Portfolio directs certain trades to SSGM in return for a recapture credit. SSGM issues a cash rebate to the Portfolio. Amounts paid to the Portfolio are shown separately as broker commission recapture on the Statement of Operations of the Portfolio. Additionally, these amounts have been excluded from the calculation of the net ratio of expenses to average net assets presented in the Financial Highlights for each share class.
3. Investments in Derivative Instruments
Futures Contracts - The Portfolio may buy and sell futures contracts as a hedge, to maintain investment exposure to a target asset class or to enhance return. The Portfolio may be subject to fluctuations in equity prices, interest rates, commodity prices, and foreign currency exchange rates in the normal course of pursuing its investment objective. Futures contracts are standardized agreements to buy or sell a security, or deliver a final cash settlement price in connection with an index, interest rate, currency, or other asset. The Portfolio must deposit an amount (“initial margin”) equal to a certain percentage of the face value of the futures contract. The initial margin may be in the form of cash or securities, which is returned when the Portfolio’s obligations under the contract have been satisfied. If cash is deposited as the initial margin, it is shown as cash collateral on the Statement of Assets and Liabilities. Futures contracts are marked-to-market daily, and subsequent payments (“variation margin”) are made or received by the Portfolio depending on whether unrealized gains or losses are incurred. These amounts are reflected as receivables or payables on the Statement of Assets and Liabilities and as a component of net change in unrealized appreciation/depreciation on the Statement of Operations. When the contract is closed or expires, the Portfolio records a realized gain or loss equal to the difference between the value of the contract at the time it was opened and the value at the time it was closed. Risks of entering into futures contracts (and related options) include the possibility that the market for these instruments may be illiquid and that a change in the value of the contract or option may not correlate perfectly with changes in the value of the underlying instrument. Futures contracts are exchange-traded and the exchange’s clearinghouse, as counterparty to all exchange-traded futures, guarantees the futures contracts against default. For over-the-counter futures the Portfolio’s ability to terminate the positions may be more limited than in the case of exchange-traded positions and may also involve the risk that securities dealers participating in such transactions would fail to meet their obligations to the Portfolio.
During the year ended December 31, 2013, the Portfolio entered into equity index futures contracts which were subject to equity price risk. During the period April 16, 2013 through April 18, 2013, the Portfolio had bought and sold $142,588,296 in equity index futures contracts. At December 31, 2013, the Portfolio did not have any open futures contracts. For the year ended December 31, 2013, the Portfolio had realized losses in the amount of $2,064,048 which are shown under Net realized loss on futures contracts in the Statement of Operations.
4. Certain Risks
Market Risk: In the normal course of business, the Portfolio invests in securities and enters into transactions where risks exist due to fluctuations in the market (market risk) or failure of the other party to a transaction to perform (credit and counterparty risk). The value of securities held by the Portfolio may decline in response to certain events, including those directly involving the companies whose securities are owned by the Portfolio; conditions affecting the general economy; overall market changes; local, regional or global political, social or economic instability; currency, interest rate, and price fluctuations.
Credit and Counterparty Risk: The Portfolio may be exposed to counterparty risk, or the risk that an entity with which the Portfolio has unsettled or open transactions may default. The potential loss could exceed the value of the financial assets and liabilities recorded in the financial statements. Financial assets that potentially expose the Portfolio to credit and counterparty risk consist principally of cash due from counterparties and investments. The Portfolio manages counterparty risk by entering into agreements only with counterparties that it believes have the financial resources to honor their obligations and by monitoring the financial stability of those counterparties. The Portfolio’s investment adviser attempts to mitigate counterparty risk by (i) periodically assessing the creditworthiness of its trading partners, (ii) monitoring and/or limiting the amount of its net exposure to each individual counterparty based on its assessment, and (iii) requiring collateral from the counterparty for certain transactions. In order to preserve certain safeguards for non-standard settlement trades, the Portfolio restricts its exposure to credit and counterparty losses by entering into master netting agreements with counterparties (approved brokers) with whom it undertakes a significant volume of transactions. Master Agreements govern the terms of certain transactions, and reduce the counterparty risk associated with relevant transactions by specifying credit protection mechanisms and providing standardization that improves legal certainty. Master Agreements can also help limit counterparty risk by specifying collateral posting arrangements at pre-arranged exposure levels. Collateral requirements may differ by type of derivative or investment, as applicable. Collateral or margin requirements are set by the broker or exchange clearing house for exchange traded derivatives (e.g., futures contracts and exchange traded options) while collateral terms are contract specific for over-the-counter traded derivatives (e.g., forward foreign currency exchange contracts, swap agreements and over-the-counter options).
Repurchase and reverse repurchase agreements are primarily executed under Global Master Repurchase Agreements (“GMRAs”) or Master Repurchase Agreements (“MRAs”), which provide the rights to set-off. Each repurchase and reverse repurchase agreement is
MSF-15
Metropolitan Series Fund
Frontier Mid Cap Growth Portfolio
Notes to Financial Statements—December 31, 2013—(Continued)
initially collateralized at the transaction level. In the event of default, the total market value exposure will be offset against collateral exchanged to date, which would result in a net receivable/(payable) that would be due from/to the counterparty.
Customer Account Agreements and related addendums govern cleared derivatives transactions such as futures, options on futures, and cleared OTC derivatives. Cleared derivative transactions require posting of initial margin as determined by each relevant clearing agency which is segregated at a broker account registered with the Commodities Futures Trading Commission (CFTC), or the applicable regulator. In the U.S., counterparty risk is significantly reduced as creditors of the futures broker do not have claim to Portfolio assets in the segregated account. Additionally, portability of exposure in the event of default further reduces risk to the Portfolio. Variation margin, or changes in market value, are exchanged daily, but may not be netted between futures and cleared OTC derivatives.
Additional risks associated with each type of investment are described above within the respective security type notes. The Portfolio’s prospectus includes a discussion of the principal risks of investing in the Portfolio.
5. Investment Transactions
Aggregate cost of purchases and proceeds of sales of investment securities, excluding short-term securities, for the year ended December 31, 2013 were as follows:
| | | | | | | | | | | | |
Purchases | | | Sales | |
U.S. Government | | Non U.S. Government | | | U.S. Government | | | Non U.S. Government | |
| $0 | | $ | 1,353,066,866 | | | $ | 0 | | | $ | 1,290,431,390 | |
During the year ended December 31, 2013, the Portfolio engaged in security transactions with other affiliated portfolios. These amounted to $19,388,905 in purchases of investments, which are included above.
With respect to the Portfolio’s merger with Turner Mid Cap Growth Portfolio (see Note 9) on April 26, 2013, the Portfolio acquired long-term securities with a cost of $175,369,211 that are not included in the above non-U.S. Government purchases value.
6. Investment Management Fees and Other Transactions with Affiliates
Investment Management Agreement - MetLife Advisers is the investment adviser to the Portfolio. The Trust has entered into an investment management agreement with MetLife Advisers with respect to the Portfolio. For providing investment management services to the Portfolio, MetLife Advisers receives monthly compensation at the following annual rates:
| | | | | | |
Management
Fees earned by
MetLife Advisers
for the year ended
December 31, 2013 | | % per annum | | | Average Daily Net Assets |
| $7,822,214 | | | 0.750 | % | | Of the first $500 million |
| | | 0.700 | % | | Of the next $500 million |
| | | 0.650 | % | | On amounts in excess of $1 billion |
MetLife Advisers has entered into an investment subadvisory agreement with respect to the Portfolio. Effective January 7, 2013, Frontier Capital Management Company, LLC is compensated by MetLife Advisers to provide subadvisory services for the Portfolio. Prior to January 7, 2013, BlackRock Advisors, LLC was compensated by MetLife Advisers to provide subadvisory services for the Portfolio.
Management Fee Waiver - Pursuant to a management fee waiver agreement, the Adviser has agreed, for the period April 29, 2013 to April 27, 2014, to reduce its advisory fees set out above under “Investment Management Agreement” for each class of the Portfolio as follows:
| | | | |
| % per annum reduction | | | Average Daily Net Assets |
| | 0.025 | % | | On the first $500 million |
| | 0.025 | % | | Over $850 million and less than $1 billion |
| | (0.025 | )% | | On the next $250 million |
An identical agreement was in place for the period January 7, 2013 through April 28, 2013. Amounts waived, if applicable, for the year ended December 31, 2013 are shown as a management fee waiver in the Statement of Operations.
Certain officers and trustees of the Trust may also be officers of MetLife Advisers; however, such officers and trustees receive no compensation from the Trust.
MSF-16
Metropolitan Series Fund
Frontier Mid Cap Growth Portfolio
Notes to Financial Statements—December 31, 2013—(Continued)
Transfer Agency Agreement - MetLife serves as the transfer agent for the Trust. MetLife receives no fees for its services to the Trust under the transfer agency agreement.
Distribution and Service Fees - The Trust has a distribution agreement with MetLife Investors Distribution Company (“MIDC” or the “Distributor”) in which MIDC serves as the distributor for the Portfolio’s Class A, B, D, and E Shares. MIDC is a wholly-owned subsidiary of MetLife Investors Group, Inc., an affiliate of the Adviser. The Trust has also adopted a Distribution and Service Plan under Rule 12b-1 of the 1940 Act for the Portfolio’s Class B, D, and E Shares. Under the Distribution and Service Plan, the Class B, D, and E Shares of the Portfolio pay a fee to compensate the Insurance Companies (or their affiliates) and other broker-dealers and financial intermediaries involved in the offer and sale of Portfolio shares for promoting or selling and servicing the Class B, D, and E Shares. The fees under the Distribution and Service Plan for each class of the Portfolio’s shares are calculated as a percentage of the Portfolio’s average daily net assets that are attributable to that Class. Currently, the fee is 0.25% per year for Class B Shares, 0.10% per year for Class D Shares, and 0.15% per year for Class E Shares. Amounts incurred by the Portfolio for the year ended December 31, 2013 are shown as Distribution and service fees in the Statement of Operations.
Deferred Trustee Compensation - Each Trustee who is not currently an employee of the Adviser or any of its affiliates receives compensation from the Trust for his or her service to the Trust. A deferred compensation plan (the “Plan”) is available to the Trustees on a voluntary basis. Deferred amounts remain in the Trust until distributed in accordance with the provisions of the Plan. The value of a participating Trustee’s deferral account is based on theoretical investments of deferred amounts, on the normal payment dates in certain portfolios of the Trust or Met Investors Series Trust, an affiliate of the Trust, as designated by the participating Trustee. Changes in the value of participants’ deferral accounts are reflected as Trustees’ fees and expenses in the Statement of Operations. The portion of the accrued obligations allocated to the Portfolio under the Plan is reflected as Deferred trustees’ fees in the Statement of Assets and Liabilities.
7. Contractual Obligations
Under the Trust’s organizational documents, its officers and Trustees may be indemnified against certain liabilities and expenses arising out of the performance of their duties to the Trust. Additionally, the Trust has a variety of indemnification obligations under contracts with its service providers. The Trust’s maximum exposure under these arrangements is unknown, as this would involve future claims that may be made against the Trust that have not yet occurred.
8. Income Tax Information
The tax character of distributions paid for the periods ended December 31, 2013 and 2012 was as follows:
| | | | | | | | | | | | | | | | | | | | |
Ordinary Income | | | Long-Term Capital Gain | | | Total | |
2013 | | 2012 | | | 2013 | | | 2012 | | | 2013 | | | 2012 | |
| $12,512,009 | | $ | — | | | $ | 24,222,563 | | | $ | — | | | $ | 36,734,572 | | | $ | — | |
As of December 31, 2013, the components of distributable earnings (accumulated losses) on a federal income tax basis were as follows:
| | | | | | | | | | | | | | | | |
Undistributed
Ordinary
Income | | Undistributed
Long-Term
Capital Gain | | | Net
Unrealized
Appreciation | | | Loss Carryforwards | | | Total | |
| $65,383,574 | | $ | 50,173,330 | | | $ | 268,741,219 | | | $ | — | | | $ | 384,298,123 | |
The Portfolio utilizes the provisions of the federal income tax laws that provide for the carryforward of capital losses for prior years, offsetting such losses against any future realized capital gains. Under the Regulated Investment Company Modernization Act of 2010 (the “Act”), net capital losses recognized after December 22, 2010 may be carried forward indefinitely and their character is retained as short-term and/or long-term losses. Previously, net capital losses were carried forward for up to eight years and treated as short-term losses. As a transition rule, the Act requires that post-enactment net capital losses be used before pre-enactment net capital losses.
As of December 31, 2013, the Portfolio had no post-enactment accumulated capital losses and no pre-enactment accumulated capital loss carryforwards.
9. Acquisition
At the close of business on April 26, 2013, the Portfolio, with aggregate Class A, Class B, Class D and Class E net assets of $770,948,460, $87,526,126, $100,247,347 and $10,678,097, respectively, acquired all of the assets and liabilities of Turner Mid Cap Growth Portfolio of the Met Investors Series Trust (“Turner Mid Cap Growth”).
MSF-17
Metropolitan Series Fund
Frontier Mid Cap Growth Portfolio
Notes to Financial Statements—December 31, 2013—(Continued)
The acquisition was accomplished by a tax-free exchange of 2,821,283 Class A shares of the Portfolio (valued at $85,795,220) for 10,021,231 Class A shares of Turner Mid Cap Growth and 3,508,655 Class B shares of the Portfolio (valued at $100,768,563) for 12,227,115 Class B shares of Turner Mid Cap Growth. Each shareholder of Turner Mid Cap Growth received shares of the Portfolio with the same class designation and at the respective Class NAV, as determined at the close of business on April 26, 2013. The transaction was part of a restructuring designed to eliminate the offering of overlapping Portfolios in the MetLife, Inc. families of funds with similar investment objectives and similar investment strategies that serve as funding vehicles for insurance contracts that are offered by affiliates of MetLife. Some of the investments held by Turner Mid Cap Growth may have been purchased or sold prior to the acquisition for the purpose of complying with the anticipated investment policies or limitations of the Portfolio after the acquisition. If such purchases or sales occurred, the transaction costs were borne by Turner Mid Cap Growth. All other costs associated with the merger were not borne by the shareholders of either portfolio.
Turner Mid Cap Growth’s net assets on April 26, 2013, were $85,795,220 and $100,768,563 for Class A and Class B shares, respectively, including investments valued at $186,797,884 with a cost basis of $180,617,211. For financial reporting purposes, assets received, liabilities assumed and shares issued by the Portfolio were recorded at fair value; however, the cost basis of the investments received by the Portfolio from Turner Mid Cap Growth were carried forward to align ongoing reporting of the Portfolio’s realized and unrealized gains and losses with amounts distributable to shareholders for tax purposes.
The aggregate net assets of the Portfolio immediately after the acquisition were $1,155,963,813, which included $6,180,673 of acquired unrealized appreciation.
Assuming the acquisition had been completed on January 1, 2013, the Portfolio’s pro-forma results of operations for the year ended December 31, 2013 are as follows:
| | | | |
Net Investment loss | | $ | (837,902 | )(a) |
Net realized and unrealized gain on investments | | | 325,035,491 | (b) |
| | | | |
Net increase in net assets from operations | | $ | 324,197,589 | |
| | | | |
Because the combined investment portfolios have been managed as a single integrated portfolio since the acquisition was completed, it is not practicable to separate the amounts of revenue and earnings of Turner Mid Cap Growth that have been included in the Portfolio’s Statement of Operations since April 26, 2013.
| (a) | $668,407 net investment loss as reported minus $278,402 from Turner Mid Cap Growth pre-merger net investment loss, plus $74,459 in lower advisory fees, plus $34,448 of pro-forma eliminated other expenses. |
| (b) | $268,929,100 unrealized appreciation as reported minus $91,035,845 pro-forma December 31, 2012 unrealized appreciation, plus $121,972,380 net realized gain as reported, plus $25,169,856 in net realized gain from Turner Mid Cap Growth pre-merger. |
MSF-18
Metropolitan Series Fund
Frontier Mid Cap Growth Portfolio
Report of Independent Registered Public Accounting Firm
To the Shareholders of Frontier Mid Cap Growth Portfolio and the Board of Trustees of Metropolitan Series Fund:
We have audited the accompanying statement of assets and liabilities, including the schedule of investments, of Frontier Mid Cap Growth Portfolio, one of the portfolios constituting Metropolitan Series Fund, (the “Trust”) as of December 31, 2013, and the related statement of operations for the year then ended, the statements of changes in net assets for each of the two years in the period then ended, and the financial highlights for each of the five years in the period then ended. These financial statements and financial highlights are the responsibility of the Trust’s management. Our responsibility is to express an opinion on these financial statements and financial highlights based on our audits.
We conducted our audits in accordance with the standards of the Public Company Accounting Oversight Board (United States). Those standards require that we plan and perform the audit to obtain reasonable assurance about whether the financial statements and financial highlights are free of material misstatement. The Trust is not required to have, nor were we engaged to perform, an audit of its internal control over financial reporting. Our audits included consideration of internal control over financial reporting as a basis for designing audit procedures that are appropriate in the circumstances, but not for the purpose of expressing an opinion on the effectiveness of the Trust’s internal control over financial reporting. Accordingly, we express no such opinion. An audit also includes examining, on a test basis, evidence supporting the amounts and disclosures in the financial statements, assessing the accounting principles used and significant estimates made by management, as well as evaluating the overall financial statement presentation. Our procedures included confirmation of securities owned as of December 31, 2013, by correspondence with the custodian and brokers; where replies were not received from brokers, we performed other auditing procedures. We believe that our audits provide a reasonable basis for our opinion.
In our opinion, the financial statements and financial highlights referred to above present fairly, in all material respects, the financial position of Frontier Mid Cap Growth Portfolio of Metropolitan Series Fund, as of December 31, 2013, the results of its operations for the year then ended, the changes in its net assets for each of the two years in the period then ended, and the financial highlights for each of the five years in the period then ended, in conformity with accounting principles generally accepted in the United States of America.
Deloitte & Touche LLP
Boston, Massachusetts
February 26, 2014
MSF-19
Metropolitan Series Fund
Trustees and Officers of Metropolitan Series Fund
The Trustees and executive officers of the Trust, their ages and their principal occupations during the past five years are set forth below. Unless otherwise indicated, the business address of each is One Financial Center, Boston, MA 02111. Each Trustee who is deemed an “interested person,” as such term is defined in the 1940 Act, is indicated by an asterisk. Those Trustees who are not “interested persons” as defined in the 1940 Act are referred to as “Independent Trustees.” Additional information about the Trustees is available in the Statement of Additional Information, which is available without charge, upon request, by calling (800) 848-3854.
Trustees of the Trust
| | | | | | | | | | |
Name and Age | | Position(s)
Held with
Registrant | | Term of Office
and Length of
Time Served | | Principal Occupation(s) During the Past 5
Years(1) | | Number of
Portfolios
in Fund
Complex(2)
overseen | | Other Directorships Held
by Trustee During the
Past 5 Years(1) |
| Interested Trustee | | | | | | | | | | |
| Elizabeth M. Forget* (47) | | Trustee, Chairman of the Board, President and Chief Executive Officer | | Indefinite;
From
May
2006
(President
and Chief
Executive
Officer)/
August
2006
(Trustee
and
Chairman
of the
Board) to
present | | Senior Vice President, MetLife Inc.; President, MetLife Advisers, LLC and a predecessor company. | | 79 | | Trustee, Met Investors Series Trust (the “MIST Trust”);** various MetLife-affiliated boards. |
| | | | | |
| Independent Trustees | | | | | | | | | | |
| Stephen M. Alderman (54) | | Trustee | | Indefinite;
From
April
2012 to
present | | Shareholder in the law firm of Garfield & Merel, Ltd. | | 79 | | Trustee, MIST Trust;** Director, International Truck Leasing Corp. |
| | | | | |
| Robert J. Boulware (57) | | Trustee | | Indefinite;
From
April
2012 to
present | | Managing Director, Pilgrim Funds, LLC (private equity fund). | | 79 | | Trustee, MIST Trust;** Trustee, Vertical Capital Income Fund (closed-end fund); Director, Gainsco, Inc. (auto insurance). |
| | | | | |
| Susan C. Gause (61) | | Trustee | | Indefinite;
From
April
2012 to
present | | Private Investor. | | 79 | | Trustee, MIST Trust;** Trustee, HSBC Funds. |
| | | | | |
| Nancy Hawthorne (62) | | Trustee | | Indefinite;
From
May
2003 to
present | | Chief Executive Officer, Clerestory LLC (corporate advisor). | | 79 | | MIST Trust;** Director, THL Credit, Inc.**; Director, Avid Technology, Inc.** |
| | | | | |
| Barbara A. Nugent (57) | | Trustee | | Indefinite;
From
January
2014 to
present | | President, True North Board Governance, LLC (consulting); until 2014, partner in the law firm of Stradley Ronon Stevens & Young, LLP. | | 79 | | Trustee, MIST Trust**; Director, Episcopal Healthcare Foundation; until 2014, member, Mutual Fund Directors Forum Advisory Board. |
MSF-20
Metropolitan Series Fund
Trustees and Officers of Metropolitan Series Fund—(Continued)
| | | | | | | | | | |
Name and Age | | Position(s)
Held with
Registrant | | Term of Office
and Length of
Time Served | | Principal Occupation(s) During the Past 5
Years(1) | | Number of
Portfolios
in Fund
Complex(2)
overseen | | Other Directorships Held
by Trustee During the
Past 5 Years(1) |
| Keith M. Schappert (62) | | Trustee | | Indefinite;
From
August
2009 to
present | | Principal, Schappert Consulting LLC (asset management consulting). | | 79 | | Trustee, MIST Trust;** Director, The Commonfund for Nonprofit Organizations; until 2011, Director, Trilogy Global Advisors; Director, Mirae Asset Discovery Funds,** Director, Calamos Investments. |
| | | | | |
| Linda B. Strumpf (66) | | Trustee | | Indefinite;
From
May
2000 to
present | | Chair of the Investment Committee, Leona M. and Harry B. Helmsley Charitable Trust; until 2011, Chief Investment Officer, Leona M. and Harry B. Helmsley Charitable Trust. | | 79 | | Since 2012, Trustee, MIST Trust,** Trustee and Member of Investment Committee, The Pennsylvania State University. |
| | | | | |
| Dawn M. Vroegop (47) | | Trustee | | Indefinite;
From
May
2009 to
present | | Private Investor. | | 79 | | Trustee, MIST Trust,** Trustee, Driehaus Mutual Funds; Director and Investment Committee Chair, City College of San Francisco Foundation. |
Executive Officers of the Trust
| | | | | | |
Name and Age | | Position(s) Held with
Registrant | | Term of Office
and Length of
Time Served | | Principal Occupation(s) During Past 5 Years(1) |
| Elizabeth M. Forget (47) | | President, Chief Executive Officer, Trustee and Chairman of the Board | | From May
2006 (President
and Chief
Executive
Officer)/
August 2006
(Trustee and
Chairman of
the Board) to
present | | See principal occupation information in the table above. |
| | | |
| Jeffrey L. Bernier (42) | | Vice President | | From February
2008 to present | | Vice President, MetLife, Inc.; Senior Vice President, MetLife Advisers, LLC and a predecessor company. |
| | | |
| Peter H. Duffy (58) | | Chief Financial Officer and Treasurer | | From November
2000 to present | | Senior Vice President, MetLife Advisers, LLC; Vice President, MetLife, Inc. |
| | | |
| Andrew L. Gangolf (59) | | Secretary | | From May
2011to present | | Senior Vice President, MetLife Advisers, LLC; Senior Vice President & Assistant General Counsel, AllianceBerstein Investments, Inc. |
| | | |
| Jeffrey P. Halperin (46) | | Chief Compliance Officer | | From November
2005 to present | | Vice President, MetLife, Inc.; Chief Compliance Officer, MIST; Chief Compliance Officer, MSF Trust; Chief Compliance Officer, MetLife Advisers, LLC and a predecessor company; Chief Compliance Officer, MetLife Investment Management, LLC (formerly MetLife Investment Advisors Company, LLC). |
| | | |
| Alan C. Leland, Jr. (61) | | Vice President | | From February
2005 to present | | Treasurer and Chief Financial Officer, MetLife Advisers, LLC; Vice President, MetLife Group Inc.; Vice President, MetLife, Inc. |
| * | Ms. Forget is an “interested person” of the Trust because of her positions with MetLife Advisers, LLC and her ownership of securities issued by MetLife, Inc., the ultimate parent company of MetLife Advisers, LLC. |
| ** | Indicates a directorship with a registered investment company or a company subject to the reporting requirements of the Securities Exchange Act of 1934, as amended. |
| (1) | Previous positions during the past five years with the Trust, MetLife, Inc. or the Adviser are omitted if not materially different. |
| (2) | The Fund Complex includes 49 Portfolios of the MIST Trust and 30 Portfolios of the Trust. |
MSF-21
Metropolitan Series Fund
Frontier Mid Cap Growth Portfolio
Board of Trustees’ Consideration of Advisory Agreement
At an in-person meeting of the Boards of Trustees (the “Board”) of Met Investors Series Trust and Metropolitan Series Fund (“MIST” and “MSF,” respectively, and collectively, the “Trusts”) held on November 19-20, 2013, the Board, including a majority of the Trustees who are not considered to be “interested persons” of the Trusts (the “Independent Trustees”) under the Investment Company Act of 1940, as amended (the “1940 Act”), approved for an annual period the continuation of each Trust’s advisory agreement (the “Advisory Agreement”) with MetLife Advisers, LLC (the “Adviser”) and the applicable sub-advisory agreements (each a “Sub-Advisory Agreement,” and collectively with the Advisory Agreement, the “Agreements”) between the Adviser and the investment sub-advisers (each a “Sub-Adviser,” and collectively, the “Sub-Advisers”) for each of the series of the Trusts, including the Frontier Mid Cap Growth Portfolio (each a “Portfolio,” and collectively, the “Portfolios”).1 With respect to the Frontier Mid Cap Growth Portfolio, the Sub-Advisory Agreement for this Portfolio went into effect on January 7, 2013 when Frontier Capital Management Company, LLC assumed the role of Sub-Adviser. The Board approved the Sub-Advisory Agreement at a Board meeting held on November 12-13, 2012, and the Agreement terminates on December 31, 2014. Therefore, the Board did not re-approve this Sub-Advisory Agreement at the Board meeting held on November 19-20, 2013. The Board, however, did approve the Portfolio’s Advisory Agreement at this November meeting, as explained in greater detail below.
In considering the Agreement, the Board reviewed a variety of materials provided by the Adviser relating to the Portfolios, including comparative performance, fee and expense information for an appropriate peer group of similar mutual funds, performance information for relevant benchmark indices and other information regarding the nature, extent and quality of services provided by the Adviser under the Agreement. The Board also took into account its experience with the Adviser and information provided to the Board in its meetings throughout the year with respect to the services provided by the Adviser, including quarterly performance reports prepared by management containing reviews of investment results. The Independent Trustees also assessed reports provided by the Board’s independent consultant, who reviewed and provided analyses regarding investment performance, fees and expenses, and other information provided by, or at the direction of, the Adviser, as more fully discussed below.
The Independent Trustees were separately advised by independent legal counsel throughout the process, and met with independent legal counsel in periodic executive sessions. Prior to voting to continue the Agreements at the November meeting, the Independent Trustees also received a memorandum from their independent counsel discussing the legal standards for their consideration of the proposed continuation of the Agreements. The Board also met in person with personnel of the Adviser on September 17, 2013 for the specific purpose of giving preliminary consideration to the proposed continuation of the Agreements and to request additional information they considered reasonably necessary to their deliberations. The Independent Trustees also discussed the proposed continuation of the Agreements in private sessions with their independent legal counsel at which no representatives of management were present.
In considering whether to approve the renewal of the Advisory Agreement with the Adviser with respect to a Portfolio, the Board reviewed and analyzed the factors it deemed relevant, including: (1) the nature, extent and quality of the services to be provided to the Portfolio by the Adviser; (2) the performance of the Portfolio as compared to a peer group and an appropriate index; (3) the Adviser’s personnel and operations; (4) the financial condition of the Adviser; (5) the level and method of computing each Portfolio’s advisory fees; (6) the profitability of the Adviser under the Advisory Agreement; (7) any “fall-out” benefits to the Adviser and its affiliates (i.e., ancillary benefits realized by the Adviser or its affiliates from the Adviser’s relationship with the Trusts); (8) the anticipated effect of growth in size on Portfolio expenses; and (9) possible conflicts of interest.
Nature, extent and quality of services. The Board evaluated the nature, extent and quality of the services that the Adviser has provided to the Portfolios. The Board considered the Adviser’s services as investment manager to the Portfolios. The Adviser’s services in coordinating and overseeing the activities of the Trusts’ other service providers were also considered. The Board also evaluated the expertise and performance of the personnel of the Adviser who performed services for the Portfolios throughout the year.
The Board considered information received from the Trust’s Chief Compliance Officer (“CCO”) regarding the Portfolios’ compliance policies and procedures established pursuant to Rule 38a-l under the 1940 Act.
Performance. The Board considered the performance of the Portfolios as described in the quarterly reports prepared by management, and as also analyzed in reports prepared by the Independent Trustees’ independent consultant. The Board noted that the Adviser reviews with the Board on a quarterly basis detailed information about the Portfolios’ performance results, portfolio composition and investment strategies. The Board also reviewed and considered a separate report prepared by Lipper Inc. (“Lipper”), an independent third party, which provided a statistical analysis comparing the Portfolios’ investment performance, expenses, and fees to comparable funds underlying variable insurance products (the “Performance Universe”). In addition, the Independent Trustees met separately
1 The Pyramis Managed Risk Portfolio recently commenced operations and, therefore, the Agreement with respect to this Portfolio was not up for renewal.
MSF-22
Metropolitan Series Fund
Frontier Mid Cap Growth Portfolio
Board of Trustees’ Consideration of Advisory Agreement—(Continued)
with a representative of Bobroff Consulting, Inc., an independent consultant (“Bobroff”), at a special board meeting in September 2013, to review the separate reports prepared by such consultant (“Bobroff Report”), which analyzed the report prepared by Lipper. The Board also considered each Portfolio’s more recent performance subsequent to the performance period covered by the Lipper reports, and management’s discussion of the same, including the effect of current market conditions on each Portfolio’s more recent performance.
The Board reviewed the Portfolios’ performance records and the Adviser’s management styles and long-term performance records with the Portfolios and comparable funds. The Board focused particular attention on Portfolios with less favorable performance records. The Board noted that the Adviser has been active in monitoring and responding to any performance issues with respect to the Portfolios. The Board also took into account its discussions with management regarding factors that contributed to the performance of the Portfolios.
Among other data relating specifically to the Frontier Mid Cap Growth Portfolio’s performance, the Board considered that the Portfolio underperformed the median of its Performance Universe and its Lipper Index for the one-, three- and five-year periods ended June 30, 2013. The Board further considered that the Portfolio underperformed its benchmark, the Russell Midcap Growth Index for the one-, three- and five-year periods ended October 31, 2013. The Board further noted that the Sub-Adviser assumed portfolio management responsibilities for the Portfolio effective January 7, 2013 and that performance prior to that date represents that of the previous sub-adviser.
Fees and Expenses. The Board gave consideration to the advisory fees payable under the Advisory Agreement. In this regard, the Board reviewed the advisory fees payable on a Portfolio-by-Portfolio basis based on information provided by the Adviser. The Independent Trustees, with the assistance of Bobroff, also examined the fees paid by a Portfolio in light of fees paid to other investment managers by comparable funds, as well as considered the fees charged by the Adviser to manage other comparable funds, as applicable. The Lipper report included comparisons of the Adviser’s fee schedule with that of its peers based on an asset-based analysis of relative fee structures according to the size of the Portfolio. In addition, the Board considered the Portfolios’ advisory fees and total expenses as compared to similarly situated investment companies underlying variable insurance products deemed to be comparable to the Portfolios as determined by Lipper. The Board considered a Portfolio’s ranking within a smaller group of peer funds chosen by Lipper (the “Expense Group”), as well as the Portfolio’s ranking within broader groups of funds (the “Expense Universe” and the “Sub-advised Expense Universe”). The Board also considered a Portfolio’s contractual sub-advisory fees, as applicable, as compared to the Sub-advised Expense Universe as well as a smaller group of funds (the “Sub-advised Expense Group”). In comparing a Portfolio’s actual and contractual management fee to that of comparable funds, the Board noted that such fee includes both advisory and administrative fees. The Board also considered that the Adviser had entered into expense limitation agreements with certain of the Portfolios, pursuant to which the Adviser has agreed to waive a portion of its advisory fee and/or reimburse certain expenses as a means of limiting a Portfolio’s total annual operating expenses.
The Board also considered that the Adviser had entered into expense limitation agreements with certain of the Portfolios, pursuant to which the Adviser has agreed to waive a portion of its advisory fee and/or reimburse certain expenses as a means of limiting a Portfolio’s total annual operating expenses.
With respect to the Frontier Mid Cap Growth Portfolio, the Board considered that the Portfolio’s actual management fee and total expenses (exclusive of 12b-1 fees) were below the Expense Group median, the Expense Universe median and Sub-advised Expense Universe median. The Board noted that the Portfolio’s contractual management fees were below the asset-weighted average of the Expense Group at the Portfolio’s current size. The Board also noted that the Portfolio’s contractual sub-advisory fees were above the average of the Sub-advised Expense Group but below the average of the Sub-advised Expense Universe at the Portfolio’s current size. In addition, the Board noted that the Adviser had recently negotiated a reduction to the Portfolio’s sub-advisory fee schedule and that the Adviser agreed to waive a corresponding portion of its advisory fee in order for contractholders to benefit from the lower sub-advisory fee effective January 7, 2013.
Profitability. The Board examined the profitability of the Adviser on a Portfolio-by-Portfolio basis. The Board also considered that the Distributor, MetLife Investors Distribution Company, receives Rule 12b-1 payments to support the distribution of the products.
Economies of scale. The Board also considered the effect of the Portfolios’ growth in size on their fees. The Board noted that the fee schedules for most of the Portfolios contain breakpoints that reduce the fee rate above specified asset levels. The Board noted those Portfolios that did not contain breakpoints in the advisory fee and took into account management’s discussion of the same. The Board noted that those Portfolios with advisory fee schedules containing breakpoints generally reflect the inclusion of breakpoints in the sub-advisory fee schedule for such Portfolios. The Board considered the effective fees under the Advisory Agreement for a Portfolio as a
MSF-23
Metropolitan Series Fund
Frontier Mid Cap Growth Portfolio
Board of Trustees’ Consideration of Advisory Agreement—(Continued)
percentage of assets at different asset levels and possible economies of scale that may be realized if the assets of the Portfolio grow. Among other data, the Board examined the effect of a Portfolio’s growth in size on various fee schedules and reviewed the Lipper and Bobroff Reports, which compared fees among peers. The Board also generally noted that if a Portfolio’s assets increase over time, the Portfolio may realize other economies of scale if assets increase proportionally more than certain other fixed expenses. In addition, the Board noted that the Adviser had taken a number of steps to date intended to share the benefits of economies of scale with contractholders.
With respect to the Frontier Mid Cap Growth Portfolio, the Board noted that the Portfolio’s advisory fee and sub-advisory fee each contains breakpoints that reduce the advisory fee rate on assets above certain specified asset levels. The Board considered the fact that the Portfolio’s fee levels decline as portfolio assets increase.
Other factors. As part of its evaluation of the Adviser’s compensation, the Board considered other benefits that may be realized by the Adviser and its affiliates from their relationship with the Trusts. Among them, the Board recognized that an affiliate of the Adviser, MetLife Investors Distribution Company, serves as the Distributor for the Trusts, and, as such, receives payments pursuant to Rule 12b-1 from the Portfolios to compensate it for providing shareholder services and selling activities, which could lead to growth in the Trusts’ assets and corresponding benefits from such growth, including economies of scale. The Board also considered that affiliates of the Adviser may benefit from certain indirect tax benefits relating to dividend received deductions and foreign tax credits. In conjunction with these considerations, the Board noted the costs of providing investment management and other services to the Portfolios and the ongoing commitment of the Adviser to the Portfolios.
The Board considered possible conflicts of interest in the form of material benefits or detriments to the Trusts resulting from the nature of the Trusts’ and the Adviser’s and the services that are provided to the Trusts, and the manner in which such conflicts were mitigated.
Conclusions. After full consideration of the factors discussed above, the Board, including a majority of the Independent Trustees, approved the Advisory Agreement and the Sub-Advisory Agreement, as applicable, with respect to each Portfolio, unless otherwise noted. In making its approvals, the Board concluded that the nature, extent and quality of services provided by the Adviser supported the renewal of the Agreements. The Board also concluded that the investment performance of each Fund was such that each Agreement should continue. In addition, the Board concluded that fees paid by a Portfolio to the Adviser appeared to be acceptable in light of nature, extent and quality of the services provided by the Adviser. Further, the Board concluded that the Adviser’s profitability in providing services under the Advisory Agreements did not appear unreasonably high in light of the nature, extent and quality of the services provided by the Adviser. Finally, the Board concluded that the Advisory fees in some measure share economies of scale with contractholders. In approving the renewal of each of the Agreements, the Board, including the Independent Trustees, did not identify any single factor as controlling, and generally attributed different weights to various factors for the various Portfolios. The Board evaluated all information available to them on a Portfolio-by-Portfolio basis, and their decisions were made separately with respect to each Portfolio.
MSF-24
Metropolitan Series Fund
Frontier Mid Cap Growth Portfolio
Board of Trustees’ Consideration of the Subadvisory Agreement
At an in-person meeting of the Board of Trustees (the “Board”) of the Metropolitan Series Fund (the “Trust”) held on November 12-13, 2012, the Board, including a majority of the Trustees who are not considered to be “interested persons” of the Trust, MetLife Advisers, LLC (“MetLife Advisers”), Frontier Capital Management Company, LLC (“Frontier”) or MetLife Investors Distribution Company (as that term is defined in the Investment Company Act of 1940, as amended) (the “Independent Trustees”), approved the investment subadvisory agreement between MetLife Advisers, the investment adviser to the Trust, and Frontier for the BlackRock Aggressive Growth Portfolio (to be renamed the Frontier Mid Cap Growth Portfolio) (the “Portfolio”) (the “New Subadvisory Agreement”). Representatives of management informed the Board that, if approved by the Board, the New Subadvisory Agreement would become effective on January 7, 2013.
In considering the New Subadvisory Agreement, the Board reviewed a variety of materials provided by MetLife Advisers and Frontier relating to the Portfolio and Frontier, including comparative performance, fee and expense information for an appropriate peer group of similar mutual funds, performance information for relevant benchmark indices and other information regarding the nature, extent and quality of services to be provided by Frontier under the New Subadvisory Agreement.
The Independent Trustees were separately advised by independent legal counsel throughout the process. The Independent Trustees discussed the proposed approval of the New Subadvisory Agreement in a private session with their independent legal counsel at which no representatives of management were present.
In considering whether to approve the New Subadvisory Agreement with Frontier with respect to the Portfolio, the Board reviewed and analyzed the factors it deemed relevant, including: (1) the nature, extent and quality of the services to be provided to the Portfolio by Frontier; (2) the performance of the Portfolio and another fund subadvised in part by Frontier (the “Frontier Portfolio”), which is managed in substantially the same manner as the Portfolio would be managed, as compared to a peer group and an appropriate index; (3) Frontier’s personnel and operations; (4) the financial condition of Frontier; (5) the level and method of computing the Portfolio’s proposed subadvisory fee; (6) the anticipated profitability of Frontier under the New Subadvisory Agreement; (7) any “fall-out” benefits that may accrue to Frontier and its affiliates (i.e., ancillary benefits that may be realized by Frontier or its affiliates from Frontier’s relationship with the Trust); (8) the anticipated effect of growth in size on the Portfolio’s performance and expenses; (9) fees paid by comparable institutional and retail accounts; and (10) possible conflicts of interest.
Nature, extent and quality of services. In considering the nature, extent and quality of the services to be provided by Frontier to the Portfolio, the Board considered information provided to the Board by Frontier, including Frontier’s Form ADV. The Board considered Frontier’s current level of staffing and its overall resources, as well as its compensation program. The Board reviewed Frontier’s history and investment experience, as well as information regarding the qualifications, background and responsibilities of Frontier’s investment and compliance personnel who would be providing services to the Portfolio. The Board also considered, among
other things, Frontier’s compliance program and its disciplinary history. The Board noted Frontier’s regulatory history, including whether it was currently involved in any regulatory actions or investigations as well as material litigation, and any settlements and ameliatory actions undertaken, as appropriate. The Board also noted that the Trust’s Chief Compliance Officer and his staff would be conducting regular, periodic compliance reviews with Frontier and present reports to the Independent Trustees regarding the same, which would include evaluating the regulatory compliance system of Frontier and procedures reasonably designed by Frontier to assure compliance with the federal securities laws, including issues related to late trading and market timing, best execution, fair value pricing, and proxy voting procedures, among others. The Board also took into account the financial condition of Frontier.
The Board considered Frontier’s investment process and philosophy. The Board took into account that Frontier’s responsibilities would include the development and maintenance of an investment program for the Portfolio which would be consistent with the Portfolio’s investment objectives, the selection of investment securities and the placement of orders for the purchase and sale of such securities, as well as the implementation of compliance controls related to performance of these services. The Board also reviewed Frontier’s brokerage policies and practices, including with respect to best execution and soft dollars. The Board also took into consideration that MetLife Advisers was recommending that, subject to shareholder approval, another portfolio in the MetLife Funds complex be merged into the Portfolio on or about April 29, 2013 and that Frontier manage the combined Portfolio.
Based on its consideration and review of the foregoing information, the Board concluded that the nature, extent and quality of services to be provided by Frontier were satisfactory and that there was a reasonable basis on which to conclude that Frontier would provide a high quality of investment services to the Portfolio.
Performance. The Board considered the performance of the Portfolio as described in the quarterly reports prepared by management. The Board noted that MetLife Advisers reviews with the Board on a quarterly basis detailed information about the Portfolio’s performance results, portfolio composition and investment strategies. The Board also considered information comparing the
MSF-25
Metropolitan Series Fund
Frontier Mid Cap Growth Portfolio
Board of Trustees’ Consideration of the Subadvisory Agreement—(Continued)
performance of the Portfolio with the Frontier Portfolio. The Board noted that the Portfolio underperformed its benchmark, the Russell Midcap Growth Index, for the three-, five- and ten-year periods ending September 30, 2012. The Board also noted that as of September 30, 2012 the Portfolio had underperformed its benchmark by an annualized -2.03% since the Portfolio’s inception in October 2002. The Board also considered the performance of the Frontier Portfolio. Among other data relating specifically to the Frontier Portfolio, the Board noted that the Frontier Portfolio had outperformed the Portfolio for the one-, three-, and ten-year periods ended September 30, 2012. The Board also noted that the Frontier Portfolio had outperformed its benchmark, the Russell Midcap Growth Index, for the five- and ten-year periods ended September 30, 2012. The Trustees took into account that the portfolio managers who managed the Frontier Portfolio were expected to manage the Portfolio. In addition, the Trustees took into consideration the differences in principal investment strategies between the Portfolio and the Frontier Portfolio. Based on its review, the Board concluded that the replacement of BlackRock Advisers, LLC (“BlackRock”), the current subadviser to the Portfolio, by Frontier was appropriate given the comparative performance records of the Portfolio and Frontier Portfolio.
Fees and expenses. The Board considered the subadvisory fee payable under the New Subadvisory Agreement. The Board noted that the rate of compensation in the New Subadvisory Agreement’s fee schedule is lower at current asset levels than the rate of compensation MetLife Advisory pays to BlackRock for managing the Portfolio under the investment subadvisory agreement between MetLife Advisers and BlackRock (the “Previous Subadvisory Agreement”). The Board also noted that the proposed subadvisory fee for the Portfolio would be paid by MetLife Advisers, not the Portfolio, out of the management fee. It was further noted that MetLife Advisers negotiated such fees at arm’s length.
Profitability. In considering the anticipated profitability to Frontier and its affiliates of their relationships with the Portfolio, the Board took into account that the rate of compensation provided in the New Subadvisory Agreement’s fee schedule at current asset levels is lower than the rate of compensation in the Previous Subadvisory Agreement’s fee schedule. The Board noted that the proposed subadvisory fee under the New Subadvisory Agreement would be paid by MetLife Advisers, not the Portfolio, out of the management fee that it would receive under the management agreement with the Trust. The Board also relied on the ability of MetLife Advisers to negotiate the New Subadvisory Agreement and the fee thereunder at arm’s length.
Economies of scale. The Board also considered the effect of the Portfolio’s growth in size on its performance and fees. The Board noted that the Portfolio’s management fee and proposed subadvisory fee each contained breakpoints that would reduce the fee rate on assets above certain specified asset levels. The Board considered the fact that the Portfolio’s fee levels decline as portfolio assets increase. The Board noted that if the Portfolio’s assets increase over time, the Portfolio may realize economies of scale if assets increase proportionally more than certain other fixed expenses. The Board concluded that the management fee structure for the Portfolio, including breakpoints, was reasonable.
Other factors. The Board considered other benefits that may be realized by Frontier and its affiliates from their relationship with the Trust, including the opportunity to provide advisory services to additional portfolios of the Trust and reputational benefits. The Board concluded that the benefits that may accrue to Frontier and its affiliates by virtue of Frontier’s relationship to the Portfolio were fair and reasonable in light of the anticipated costs of providing investment advisory services to the Portfolio and the anticipated commitment of Frontier to the Portfolio.
The Board also took into account the expected transaction costs to the Portfolio of the change in subadviser and concluded that the potential benefits from changing subadvisers outweighed those costs. The Board also took into consideration that MetLife Advisers had agreed to waive a portion of its management fee beginning on January 7, 2013 through April 2014.
The Board considered any possible conflicts of interest in the form of material benefits or detriments to the Trust resulting from the nature of the Trust’s and Frontier’s affiliations. Here, the Board considered possible conflicts of interest that may arise between the Trust and Frontier in connection with the services to be provided to the Trust and the various relationships that Frontier and its affiliates may have with the Trust. The Board considered the procedures for monitoring and managing such potential conflicts.
Conclusion. In considering the approval of the New Subadvisory Agreement, the Board, including the Independent Trustees, did not identify any single factor as controlling, and each Trustee may have attributed different weights to various factors. Based on all of the above-mentioned considerations, and the recommendations of management, the Board, including a majority of the Independent Trustees, determined that approval of the New Subadvisory Agreement was in the best interests of the Portfolio. After full consideration of these and other factors, the Board, including a majority of the Independent Trustees, with the assistance of independent legal counsel, approved the New Subadvisory Agreement with respect to the Portfolio.
MSF-26
Metropolitan Series Fund
Jennison Growth Portfolio
Managed by Jennison Associates LLC
Portfolio Manager Commentary*
PERFORMANCE
For the one year period ended December 31, 2013, the Class A, B, and E shares of the Jennison Growth Portfolio returned 37.00%, 36.73%, and 36.90%, respectively. The Portfolio’s benchmark, the Russell 1000 Growth Index1, returned 33.48%.
MARKET ENVIRONMENT / CONDITIONS
The U.S. equity market advanced strongly in the 12 months ended December 31, 2013, reflecting a more optimistic economic outlook. Housing and employment indicators improved, consumer confidence rose, and strength in corporate profits continued. Conditions in Europe appeared to stabilize, relieving earlier worries of sustained deterioration. In China, economic growth slowed but to levels sufficiently expansionary to give investors conviction that global gross domestic product, although moderating, remained solid. Concerns that the Federal Reserve would begin scaling back its quantitative easing program took a toll in early summer. However, the market soon refocused on individual company fundamentals and showed renewed appreciation for companies with strong growth.
PORTFOLIO REVIEW / PERIOD END POSITIONING
Consumer Discretionary positions, which hold a major weight in the Portfolio, were strong contributors to return as both an overweight and stock selection were beneficial. Amazon.com accelerated its business investment to drive robust longer-term growth not only in its core retail business but through the proliferation of digital commerce via the mobile market, all of which was rewarded with substantial revenue growth. Gross bookings growth increased at online travel company Priceline.com, which we believe is poised to benefit from the long-term shift to online travel spending.
Health Care holdings, in particular biopharmaceutical companies, were strong contributors to return. The Food and Drug Administration (“FDA”) approved Biogen Idec’s Tecfidera for multiple sclerosis. We believe the drug’s ease of use could support broad adoption and potential market leadership. Tecfidera may also eventually treat other neurodegenerative diseases such as ALS and Parkinson’s. The FDA also approved Gilead Sciences’ Sovaldi for the treatment of hepatitis C. Many patients infected with the liver virus now will be treated with pills only, obviating injections of interferon, which often has debilitating side effects. Sovaldi could also shorten treatment duration, and trial data indicate that it is significantly more effective than current regimens. Gilead’s oncology pipeline also looks promising.
Stock selection was beneficial in Information Technology. MasterCard’s revenue and earnings were driven by strong growth in global dollar volume and processed transactions. We expect MasterCard to continue to benefit from the long-term shift from cash to electronic credit/debit transactions. Google performed well, reflecting its competitive position, strong advertising revenue, and YouTube monetization opportunities. LinkedIn’s revenue and earnings exceeded consensus expectations significantly. The company is a leading global online professional network that provides what we consider unique access to a scale database of active and passive job candidates. Facebook’s ad revenue advanced strongly, driven by gains in mobile. We view Facebook as the world’s preeminent Internet-based social network with a dominance we believe no rival can easily match and a network effect that creates formidable barriers to entry.
Technology holdings that detracted from performance included Rackspace Hosting, due to business execution issues and concerns about the commoditization of its business, and Teradata, which saw a marked weakness in its Asia Pacific business. We eliminated the Portfolio’s positions in Rackspace and Teradata.
In Industrials, Boeing reported strong earning per share, revenue, cash flow, and margins. Of particular note, the profitability of the company’s 787 Dreamliner improved, driven by an accelerated production rate.
Portfolio holdings in Energy and Materials posted solid double-digit gains but lagged the returns of the benchmark sectors.
MSF-1
Metropolitan Series Fund
Jennison Growth Portfolio
Managed by Jennison Associates LLC
Portfolio Manager Commentary*—(Continued)
The Portfolio is built from the bottom up, with stocks selected one at a time, based on the fundamentals of individual companies. Sector weights were largely stable over the past year; exposure to Consumer Discretionary increased, while exposure to Information Technology decreased. Relative to the Russell 1000 Growth Index, the Portfolio was overweight Consumer Discretionary and Health Care, and underweight Consumer Staples and Industrials as of December 31, 2013.
Kathleen A. McCarragher
Spiros “Sig” Segalas
Michael A. Del Balso
Portfolio Managers
Jennison Associates LLC
* This commentary may include statements that constitute “forward-looking statements” under the U.S. securities laws. Forward-looking statements include, among other things, projections, estimates, and information about possible or future results related to the Portfolio, market or regulatory developments. The views expressed above are not guarantees of future performance or economic results and involve certain risks, uncertainties and assumptions that could cause actual outcomes and results to differ materially from the views expressed herein. The views expressed above are subject to change at any time based upon economic, market, or other conditions and the subadvisory firm undertakes no obligation to update the views expressed herein. Any discussions of specific securities should not be considered a recommendation to buy or sell those securities. The views expressed above (including any forward-looking statement) may not be relied upon as investment advice or as an indication of the Portfolio’s trading intent. Information about the Portfolio’s holdings, asset allocation or country diversification is historical and is not an indication of future Portfolio composition, which may vary. Direct investment in any index is not possible. The performance of any index mentioned in this commentary has not been adjusted for ongoing management, distribution and operating expenses, and sales charges applicable to mutual fund investments. In addition, the returns do not reflect additional fees charged by separate accounts or variable insurance contracts that an investor in the Portfolio may pay. If these additional fees were reflected, performance would have been lower.
MSF-2
Metropolitan Series Fund
Jennison Growth Portfolio
A $10,000 INVESTMENT COMPARED TO THE RUSSELL 1000 GROWTH INDEX

AVERAGE ANNUAL RETURNS (%) (FOR THE YEAR ENDED DECEMBER 31, 2013)
| | | | | | | | | | | | | | | | |
| | | 1 Year | | | 5 Year | | | 10 Year | | | Since Inception2 | |
| Jennison Growth Portfolio | | | | | | | | | | | | | | | | |
Class A | | | 37.00 | | | | 20.03 | | | | 8.50 | | | | — | |
Class B | | | 36.73 | | | | 19.73 | | | | 8.23 | | | | — | |
Class E | | | 36.90 | | | | 19.86 | | | | — | | | | 9.42 | |
| Russell 1000 Growth Index | | | 33.48 | | | | 20.39 | | | | 7.83 | | | | — | |
1 The Russell 1000 Growth Index is an unmanaged measure of performance of the largest capitalized U.S. companies, within the Russell 1000 companies, that have higher price-to-book ratios and forecasted growth values.
2 Inception dates of the Class A, Class B, and Class E shares are 5/1/02, 5/1/02, and 4/27/05, respectively.
Portfolio performance is calculated including reinvestment of all income and capital gain distributions. Performance numbers are net of all Portfolio expenses but do not include any insurance, sales, separate account or administrative charges of variable annuity or life insurance contracts or any additional expenses that participants may bear relating to the operations of their plans. If these charges were included, the returns would be lower. The performance of any index referenced above has not been adjusted for ongoing management, distribution and operating expenses, and sales charges applicable to mutual fund investments. Direct investment in any index is not possible. The performance of Class A shares, as set forth in the line graph above, will differ from that of other classes because of the difference in expenses paid by policyholders investing in the different share classes.
This information represents past performance and is not indicative of future results. Investment return and principal value may fluctuate so that shares, upon redemption, may be worth more or less than the original cost.
PORTFOLIO COMPOSITION AS OF DECEMBER 31, 2013
Top Holdings
| | | | |
| |
| | | % of
Net Assets | |
| Apple, Inc. | | | 4.7 | |
| Google, Inc.—Class A | | | 4.3 | |
| MasterCard, Inc.—Class A | | | 4.2 | |
| Amazon.com, Inc. | | | 3.7 | |
| priceline.com, Inc. | | | 2.8 | |
| Monsanto Co. | | | 2.4 | |
| Visa, Inc.—Class A | | | 2.4 | |
| Biogen Idec, Inc. | | | 2.4 | |
| TJX Cos., Inc. | | | 2.4 | |
| NIKE, Inc.—Class B | | | 2.0 | |
Top Sectors
| | | | |
| | | % of
Market Value of
Total Long-Term Investments | |
| Information Technology | | | 29.6 | |
| Consumer Discretionary | | | 26.0 | |
| Health Care | | | 17.5 | |
| Industrials | | | 9.0 | |
| Consumer Staples | | | 7.4 | |
| Financials | | | 4.1 | |
| Energy | | | 4.0 | |
| Materials | | | 2.4 | |
MSF-3
Metropolitan Series Fund
Jennison Growth Portfolio
Understanding Your Portfolio’s Expenses
Shareholder Expense Example
As a shareholder of the Portfolio, you incur ongoing costs, including management fees; distribution and service (12b-1) fees; and other Portfolio expenses. This example is intended to help you understand your ongoing costs (in dollars) (referred to as “expenses”) of investing in the Portfolio and compare these costs with the ongoing costs of investing in other mutual funds. The example is based on an investment of $1,000 invested at the beginning of the period and held for the entire period, July 1, 2013 through December 31, 2013.
Actual Expenses
The first line for each share class of the Portfolio in the table below provides information about actual account values and actual expenses. You may use the information in this line, together with the amount you invested in the particular share class of the Portfolio, to estimate the expenses that you paid over the period. Simply divide your account value by $1,000 (for example, an $8,600 account value divided by $1,000 = 8.6), then multiply the result by the number in the first line under the heading entitled “Expenses Paid During Period” to estimate the expenses you paid on your account during this period.
Hypothetical Example for Comparison Purposes
The second line for each share class of the Portfolio in the table below provides information about hypothetical account values and hypothetical expenses based on the Portfolio’s actual expense ratio and an assumed rate of return of 5% per year before expenses, which is not the Portfolio’s actual return. The hypothetical account values and expenses may not be used to estimate the actual ending account balance or expenses you paid for the period. You may use this information to compare the ongoing costs of investing in the Portfolio and other funds. To do so, compare this 5% hypothetical example with the 5% hypothetical examples that appear in the shareholder reports of the other funds.
Please note that the expenses shown in the table are meant to highlight your ongoing costs only and do not reflect any fees or charges of your variable insurance product or any additional expenses that participants in certain eligible qualified plans may bear relating to the operations of their plan. Therefore, the second line for each share class in the table is useful in comparing ongoing costs only, and will not help you determine the relative total costs of owning different funds. In addition, if these other costs were included, your costs would have been higher.
| | | | | | | | | | | | | | | | | | |
Jennison Growth Portfolio | | | | Annualized
Expense
Ratio | | | Beginning
Account Value
July 1,
2013 | | | Ending
Account Value
December 31,
2013 | | | Expenses Paid
During Period**
July 1, 2013
to
December 31,
2013 | |
Class A(a) | | Actual | | | 0.54 | % | | $ | 1,000.00 | | | $ | 1,255.60 | | | $ | 3.07 | |
| | Hypothetical* | | | 0.54 | % | | $ | 1,000.00 | | | $ | 1,022.48 | | | $ | 2.75 | |
| | | | | |
Class B(a) | | Actual | | | 0.79 | % | | $ | 1,000.00 | | | $ | 1,254.80 | | | $ | 4.49 | |
| | Hypothetical* | | | 0.79 | % | | $ | 1,000.00 | | | $ | 1,021.22 | | | $ | 4.02 | |
| | | | | |
Class E(a) | | Actual | | | 0.69 | % | | $ | 1,000.00 | | | $ | 1,255.00 | | | $ | 3.92 | |
| | Hypothetical* | | | 0.69 | % | | $ | 1,000.00 | | | $ | 1,021.73 | | | $ | 3.52 | |
* Hypothetical assumes a rate of return of 5% per year before expenses.
** Expenses paid are equal to the Portfolio’s annualized expense ratio for the most recent six month period, as shown above, multiplied by the average account value over the period, multiplied by the number of days (184 days) in the most recent fiscal half-year, divided by 365 (to reflect the one-half year period).
(a) The annualized expense ratio shown reflects the impact of the management fee waiver as described in Note 6 of the Notes to Financial Statements.
MSF-4
Metropolitan Series Fund
Jennison Growth Portfolio
Schedule of Investments as of December 31, 2013
Common Stocks—99.9% of Net Assets
| | | | | | | | |
| Security Description | | Shares | | | Value | |
|
Aerospace & Defense—6.1% | |
Boeing Co. (The) | | | 471,873 | | | $ | 64,405,946 | |
Precision Castparts Corp. | | | 252,052 | | | | 67,877,603 | |
Rolls-Royce Holdings plc (a) | | | 993,364 | | | | 21,039,004 | |
United Technologies Corp. | | | 442,876 | | | | 50,399,289 | |
| | | | | | | | |
| | | | | | | 203,721,842 | |
| | | | | | | | |
| | |
Automobiles—0.7% | | | | | | | | |
Tesla Motors, Inc. (a) (b) | | | 156,935 | | | | 23,599,885 | |
| | | | | | | | |
| | |
Beverages—0.8% | | | | | | | | |
Diageo plc | | | 815,026 | | | | 26,921,314 | |
| | | | | | | | |
| | |
Biotechnology—8.3% | | | | | | | | |
Alexion Pharmaceuticals, Inc. (a) | | | 425,248 | | | | 56,583,499 | |
Biogen Idec, Inc. (a) | | | 282,099 | | | | 78,917,195 | |
Celgene Corp. (a) | | | 195,968 | | | | 33,110,753 | |
Gilead Sciences, Inc. (a) | | | 773,390 | | | | 58,120,259 | |
Vertex Pharmaceuticals, Inc. (a) | | | 640,361 | | | | 47,578,822 | |
| | | | | | | | |
| | | | | | | 274,310,528 | |
| | | | | | | | |
|
Capital Markets—3.2% | |
Goldman Sachs Group, Inc. (The) | | | 336,537 | | | | 59,654,549 | |
Morgan Stanley | | | 1,456,539 | | | | 45,677,063 | |
| | | | | | | | |
| | | | | | | 105,331,612 | |
| | | | | | | | |
| | |
Chemicals—2.4% | | | | | | | | |
Monsanto Co. | | | 685,936 | | | | 79,945,841 | |
| | | | | | | | |
|
Computers & Peripherals—4.7% | |
Apple, Inc. | | | 279,151 | | | | 156,634,418 | |
| | | | | | | | |
|
Energy Equipment & Services—1.8% | |
FMC Technologies, Inc. (a) | | | 317,482 | | | | 16,575,735 | |
Schlumberger, Ltd. | | | 471,895 | | | | 42,522,459 | |
| | | | | | | | |
| | | | | | | 59,098,194 | |
| | | | | | | | |
|
Food & Staples Retailing—3.5% | |
Costco Wholesale Corp. | | | 522,462 | | | | 62,178,203 | |
Sprouts Farmers Market, Inc. (a) (b) | | | 188,942 | | | | 7,261,041 | |
Whole Foods Market, Inc. | | | 833,459 | | | | 48,198,934 | |
| | | | | | | | |
| | | | | | | 117,638,178 | |
| | | | | | | | |
| | |
Food Products—1.5% | | | | | | | | |
Mondelez International, Inc. - Class A | | | 1,453,100 | | | | 51,294,430 | |
| | | | | | | | |
|
Health Care Equipment & Supplies—1.3% | |
Abbott Laboratories | | | 1,130,342 | | | | 43,326,009 | |
| | | | | | | | |
|
Health Care Providers & Services—1.0% | |
Express Scripts Holding Co. (a) | | | 476,902 | | | | 33,497,596 | |
| | | | | | | | |
|
Hotels, Restaurants & Leisure—3.4% | |
Chipotle Mexican Grill, Inc. (a) | | | 64,502 | | | | 34,365,376 | |
Dunkin’ Brands Group, Inc. (b) | | | 817,401 | | | | 39,398,728 | |
|
Hotels, Restaurants & Leisure—(Continued) | |
Starbucks Corp. | | | 487,270 | | | $ | 38,197,095 | |
| | | | | | | | |
| | | | | | | 111,961,199 | |
| | | | | | | | |
|
Internet & Catalog Retail—8.1% | |
Amazon.com, Inc. (a) | | | 307,700 | | | | 122,707,683 | |
Netflix, Inc. (a) (b) | | | 101,317 | | | | 37,301,880 | |
priceline.com, Inc. (a) | | | 78,896 | | | | 91,708,710 | |
TripAdvisor, Inc. (a) | | | 196,320 | | | | 16,261,186 | |
| | | | | | | | |
| | | | | | | 267,979,459 | |
| | | | | | | | |
|
Internet Software & Services—9.6% | |
eBay, Inc. (a) | | | 526,471 | | | | 28,897,993 | |
Facebook, Inc. - Class A (a) | | | 1,212,215 | | | | 66,259,672 | |
Google, Inc. - Class A (a) | | | 127,604 | | | | 143,007,079 | |
LinkedIn Corp. - Class A (a) | | | 275,074 | | | | 59,644,295 | |
Twitter, Inc. (a) (b) | | | 264,030 | | | | 16,805,509 | |
Youku Tudou, Inc. (ADR) (a) | | | 121,995 | | | | 3,696,449 | |
| | | | | | | | |
| | | | | | | 318,310,997 | |
| | | | | | | | |
|
IT Services—6.6% | |
MasterCard, Inc. - Class A | | | 165,725 | | | | 138,456,608 | |
Visa, Inc. - Class A | | | 357,195 | | | | 79,540,183 | |
| | | | | | | | |
| | | | | | | 217,996,791 | |
| | | | | | | | |
|
Life Sciences Tools & Services—0.0% | |
Illumina, Inc. (a) (b) | | | 8,900 | | | | 984,518 | |
| | | | | | | | |
|
Media—3.7% | |
Discovery Communications, Inc. - Class A (a) | | | 536,970 | | | | 48,552,827 | |
Twenty-First Century Fox, Inc. - Class A | | | 491,232 | | | | 17,281,542 | |
Walt Disney Co. (The) | | | 741,283 | | | | 56,634,021 | |
| | | | | | | | |
| | | | | | | 122,468,390 | |
| | | | | | | | |
|
Oil, Gas & Consumable Fuels—2.2% | |
Concho Resources, Inc. (a) | | | 319,609 | | | | 34,517,772 | |
EOG Resources, Inc. | | | 237,965 | | | | 39,940,046 | |
| | | | | | | | |
| | | | | | | 74,457,818 | |
| | | | | | | | |
|
Personal Products—1.5% | |
Estee Lauder Cos., Inc. (The) - Class A | | | 645,822 | | | | 48,643,313 | |
| | | | | | | | |
|
Pharmaceuticals—6.8% | |
Allergan, Inc. | | | 551,832 | | | | 61,297,498 | |
Bristol-Myers Squibb Co. | | | 1,176,884 | | | | 62,551,385 | |
Merck & Co., Inc. | | | 303,192 | | | | 15,174,760 | |
Novo Nordisk A/S (ADR) | | | 292,247 | | | | 53,995,556 | |
Perrigo Co. plc | | | 224,064 | | | | 34,384,861 | |
| | | | | | | | |
| | | | | | | 227,404,060 | |
| | | | | | | | |
|
Real Estate Investment Trusts—1.0% | |
American Tower Corp. | | | 404,486 | | | | 32,286,072 | |
| | | | | | | | |
|
Road & Rail—2.9% | |
Canadian Pacific Railway, Ltd. | | | 263,162 | | | | 39,821,674 | |
See accompanying notes to financial statements.
MSF-5
Metropolitan Series Fund
Jennison Growth Portfolio
Schedule of Investments as of December 31, 2013
Common Stocks—(Continued)
| | | | | | | | |
| Security Description | | Shares | | | Value | |
|
Road & Rail—(Continued) | |
Kansas City Southern | | | 131,768 | | | $ | 16,316,831 | |
Union Pacific Corp. | | | 240,654 | | | | 40,429,872 | |
| | | | | | | | |
| | | | | | | 96,568,377 | |
| | | | | | | | |
|
Semiconductors & Semiconductor Equipment—0.9% | |
ARM Holdings plc (ADR) (b) | | | 577,512 | | | | 31,613,007 | |
| | | | | | | | |
|
Software—7.8% | |
Adobe Systems, Inc. (a) | | | 558,137 | | | | 33,421,243 | |
FireEye, Inc. (a) (b) | | | 161,733 | | | | 7,053,176 | |
Red Hat, Inc. (a) | | | 831,915 | | | | 46,620,517 | |
Salesforce.com, Inc. (a) | | | 1,017,069 | | | | 56,132,038 | |
Splunk, Inc. (a) | | | 529,440 | | | | 36,356,645 | |
Tableau Software, Inc. - Class A (a) | | | 97,412 | | | | 6,714,609 | |
VMware, Inc. - Class A (a) (b) | | | 488,927 | | | | 43,861,641 | |
Workday, Inc. - Class A (a) (b) | | | 331,485 | | | | 27,566,293 | |
| | | | | | | | |
| | | | | | | 257,726,162 | |
| | | | | | | | |
|
Specialty Retail—4.4% | |
Inditex S.A. | | | 406,989 | | | | 67,344,469 | |
TJX Cos., Inc. | | | 1,226,596 | | | | 78,170,963 | |
| | | | | | | | |
| | | | | | | 145,515,432 | |
| | | | | | | | |
|
Textiles, Apparel & Luxury Goods—5.7% | |
Michael Kors Holdings, Ltd. (a) | | | 361,217 | | | | 29,327,208 | |
NIKE, Inc. - Class B | | | 864,825 | | | | 68,009,838 | |
Ralph Lauren Corp. | | | 171,580 | | | | 30,295,881 | |
Swatch Group AG (The) | | | 49,702 | | | | 32,979,177 | |
Under Armour, Inc. - Class A (a) (b) | | | 347,657 | | | | 30,350,456 | |
| | | | | | | | |
| | | | | | | 190,962,560 | |
| | | | | | | | |
Total Common Stocks
(Cost $2,224,850,885) | | | | | | | 3,320,198,002 | |
| | | | | | | | |
| Short-Term Investment—4.1% | |
| Security Description | | Shares | | | Value | |
|
Mutual Fund—4.1% | |
State Street Navigator Securities Lending MET Portfolio (c) | | | 135,384,739 | | | $ | 135,384,739 | |
| | | | | | | | |
Total Short-Term Investment
(Cost $135,384,739) | | | | | | | 135,384,739 | |
| | | | | | | | |
Total Investments—104.0%
(Cost $2,360,235,624) (d) | | | | | | | 3,455,582,741 | |
Other assets and liabilities (net)—(4.0)% | | | | | | | (134,399,302 | ) |
| | | | | | | | |
| Net Assets—100.0% | | | | | | $ | 3,321,183,439 | |
| | | | | | | | |
| (a) | Non-income producing security. |
| (b) | All or a portion of the security was held on loan. As of December 31, 2013, the market value of securities loaned was $133,373,186 and the collateral received consisted of cash in the amount of $135,384,739. The cash collateral is invested in a money market fund managed by an affiliate of the custodian. |
| (c) | Represents investment of cash collateral received from securities lending transactions. |
| (d) | As of December 31, 2013, the aggregate cost of investments for federal income tax purposes was $2,361,389,419. The aggregate unrealized appreciation and depreciation of investments were $1,097,709,780 and $(3,516,458), respectively, resulting in net unrealized appreciation of $1,094,193,322 for federal income tax purposes. |
| (ADR)— | An American Depositary Receipt is a certificate issued by a custodian bank representing the right to receive securities of the foreign issuer described. Trading on exchanges not located in the United States or Canada significantly influences the value of ADRs. |
See accompanying notes to financial statements.
MSF-6
Metropolitan Series Fund
Jennison Growth Portfolio
Schedule of Investments as of December 31, 2013
Fair Value Hierarchy
Accounting principles generally accepted in the United States of America (“GAAP”) define fair market value as the price that the Portfolio would receive to sell an asset or pay to transfer a liability in an orderly transaction between market participants at the measurement date. It establishes a fair value hierarchy that prioritizes inputs to valuation methods and requires disclosure of the fair value hierarchy that segregates fair value measurements into three levels. Levels 1, 2 and 3 of the fair value hierarchy are defined as follows:
Level 1 - unadjusted quoted prices in active markets for identical investments
Level 2 - other significant observable inputs (including, but not limited to, unadjusted quoted prices for similar investments in markets that are either active or inactive; inputs other than quoted prices that are observable such as interest rates, yield curves, volatilities, prepayment speeds, loss severities, credit risks, default rates, etc.)
Level 3 - significant unobservable inputs based on the best information available in the circumstances, to the extent observable inputs are unavailable (including the Portfolio’s own assumptions in determining the fair value of investments)
The inputs or methodologies used for valuing investments are not necessarily an indication of the risk associated with investing in them. Changes to the inputs or methodologies used may result in transfers between levels, which will be recognized as of the beginning of the reporting period. Information on transfers between Level 1 and Level 2, if any, will be disclosed following the fair value hierarchy table below. A reconciliation of Level 3 securities, if any, will also be disclosed following the fair value hierarchy table. For more information about the Portfolio’s policy regarding the valuation of investments, please refer to the Notes to Financial Statements.
The following table summarizes the fair value hierarchy of the Portfolio’s investments as of December 31, 2013:
| | | | | | | | | | | | | | | | |
| Description | | Level 1 | | | Level 2 | | | Level 3 | | | Total | |
| Common Stocks | | | | | | | | | | | | | | | | |
Aerospace & Defense | | $ | 182,682,838 | | | $ | 21,039,004 | | | $ | — | | | $ | 203,721,842 | |
Automobiles | | | 23,599,885 | | | | — | | | | — | | | | 23,599,885 | |
Beverages | | | — | | | | 26,921,314 | | | | — | | | | 26,921,314 | |
Biotechnology | | | 274,310,528 | | | | — | | | | — | | | | 274,310,528 | |
Capital Markets | | | 105,331,612 | | | | — | | | | — | | | | 105,331,612 | |
Chemicals | | | 79,945,841 | | | | — | | | | — | | | | 79,945,841 | |
Computers & Peripherals | | | 156,634,418 | | | | — | | | | — | | | | 156,634,418 | |
Energy Equipment & Services | | | 59,098,194 | | | | — | | | | — | | | | 59,098,194 | |
Food & Staples Retailing | | | 117,638,178 | | | | — | | | | — | | | | 117,638,178 | |
Food Products | | | 51,294,430 | | | | — | | | | — | | | | 51,294,430 | |
Health Care Equipment & Supplies | | | 43,326,009 | | | | — | | | | — | | | | 43,326,009 | |
Health Care Providers & Services | | | 33,497,596 | | | | — | | | | — | | | | 33,497,596 | |
Hotels, Restaurants & Leisure | | | 111,961,199 | | | | — | | | | — | | | | 111,961,199 | |
Internet & Catalog Retail | | | 267,979,459 | | | | — | | | | — | | | | 267,979,459 | |
Internet Software & Services | | | 318,310,997 | | | | — | | | | — | | | | 318,310,997 | |
IT Services | | | 217,996,791 | | | | — | | | | — | | | | 217,996,791 | |
Life Sciences Tools & Services | | | 984,518 | | | | — | | | | — | | | | 984,518 | |
Media | | | 122,468,390 | | | | — | | | | — | | | | 122,468,390 | |
Oil, Gas & Consumable Fuels | | | 74,457,818 | | | | — | | | | — | | | | 74,457,818 | |
Personal Products | | | 48,643,313 | | | | — | | | | — | | | | 48,643,313 | |
Pharmaceuticals | | | 227,404,060 | | | | — | | | | — | | | | 227,404,060 | |
Real Estate Investment Trusts | | | 32,286,072 | | | | — | | | | — | | | | 32,286,072 | |
Road & Rail | | | 96,568,377 | | | | — | | | | — | | | | 96,568,377 | |
Semiconductors & Semiconductor Equipment | | | 31,613,007 | | | | — | | | | — | | | | 31,613,007 | |
Software | | | 257,726,162 | | | | — | | | | — | | | | 257,726,162 | |
Specialty Retail | | | 78,170,963 | | | | 67,344,469 | | | | — | | | | 145,515,432 | |
Textiles, Apparel & Luxury Goods | | | 157,983,383 | | | | 32,979,177 | | | | — | | | | 190,962,560 | |
Total Common Stocks | | | 3,171,914,038 | | | | 148,283,964 | | | | — | | | | 3,320,198,002 | |
Total Short-Term Investment* | | | 135,384,739 | | | | — | | | | — | | | | 135,384,739 | |
Total Investments | | $ | 3,307,298,777 | | | $ | 148,283,964 | | | $ | — | | | $ | 3,455,582,741 | |
| | | | | | | | | | | | | | | | | |
Collateral for Securities Loaned (Liability) | | $ | — | | | $ | (135,384,739 | ) | | $ | — | | | $ | (135,384,739 | ) |
| * | See Schedule of Investments for additional detailed categorizations. |
See accompanying notes to financial statements.
MSF-7
Metropolitan Series Fund
Jennison Growth Portfolio
Statement of Assets and Liabilities
December 31, 2013
| | | | |
Assets | | | | |
Investments at value (a) (b) | | $ | 3,455,582,741 | |
Cash | | | 347,279 | |
Receivable for: | | | | |
Investments sold | | | 6,072,875 | |
Fund shares sold | | | 395,197 | |
Dividends | | | 2,209,192 | |
Prepaid expenses | | | 7,866 | |
| | | | |
Total Assets | | | 3,464,615,150 | |
Liabilities | | | | |
Collateral for securities loaned | | | 135,384,739 | |
Payables for: | | | | |
Investments purchased | | | 4,405,541 | |
Fund shares redeemed | | | 1,708,644 | |
Accrued expenses: | | | | |
Management fees | | | 1,426,443 | |
Distribution and service fees | | | 205,385 | |
Deferred trustees’ fees | | | 120,565 | |
Other expenses | | | 180,394 | |
| | | | |
Total Liabilities | | | 143,431,711 | |
| | | | |
Net Assets | | $ | 3,321,183,439 | |
| | | | |
Net assets consist of: | | | | |
Paid in surplus | | $ | 2,049,335,359 | |
Undistributed net investment income | | | 5,944,003 | |
Accumulated net realized gain | | | 170,552,836 | |
Unrealized appreciation on investments and foreign currency transactions | | | 1,095,351,241 | |
| | | | |
Net Assets | | $ | 3,321,183,439 | |
| | | | |
Net Assets | | | | |
Class A | | $ | 2,332,001,576 | |
Class B | | | 976,688,049 | |
Class E | | | 12,493,814 | |
Capital Shares Outstanding* | | | | |
Class A | | | 147,375,072 | |
Class B | | | 62,374,656 | |
Class E | | | 793,099 | |
Net Asset Value, Offering Price and Redemption Price Per Share | | | | |
Class A | | $ | 15.82 | |
Class B | | | 15.66 | |
Class E | | | 15.75 | |
| * | The Portfolio is authorized to issue an unlimited number of shares. |
| (a) | Identified cost of investments was $2,360,235,624. |
| (b) | Includes securities loaned at value of $133,373,186. |
Statement of Operations
Year Ended December 31, 2013
| | | | |
Investment Income | | | | |
Dividends (a) | | $ | 23,957,147 | |
Interest | | | 1,106 | |
Securities lending income | | | 265,954 | |
| | | | |
Total investment income | | | 24,224,207 | |
Expenses | | | | |
Management fees | | | 17,034,652 | |
Administration fees | | | 48,067 | |
Custodian and accounting fees | | | 272,411 | |
Distribution and service fees—Class B | | | 2,217,636 | |
Distribution and service fees—Class E | | | 17,752 | |
Audit and tax services | | | 38,784 | |
Legal | | | 39,767 | |
Trustees’ fees and expenses | | | 40,083 | |
Shareholder reporting | | | 234,728 | |
Insurance | | | 14,183 | |
Miscellaneous | | | 7,741 | |
| | | | |
Total expenses | | | 19,965,804 | |
Less management fee waiver | | | (2,138,605 | ) |
Less broker commission recapture | | | (134,080 | ) |
| | | | |
Net expenses | | | 17,693,119 | |
| | | | |
Net Investment Income | | | 6,531,088 | |
| | | | |
Net Realized and Unrealized Gain | | | | |
| Net realized gain (loss) on: | | | | |
Investments | | | 242,137,118 | |
Futures contracts | | | 176,024 | |
Foreign currency transactions | | | (86,407 | ) |
| | | | |
Net realized gain | | | 242,226,735 | |
| | | | |
Net change in unrealized appreciation on: | | | | |
Investments | | | 661,106,093 | |
Foreign currency transactions | | | 4,127 | |
| | | | |
Net change in unrealized appreciation | | | 661,110,220 | |
| | | | |
Net realized and unrealized gain | | | 903,336,955 | |
| | | | |
Net Increase in Net Assets from Operations | | $ | 909,868,043 | |
| | | | |
| (a) | Net of foreign withholding taxes of $117,869. |
See accompanying notes to financial statements.
MSF-8
Metropolitan Series Fund
Jennison Growth Portfolio
Statements of Changes in Net Assets
| | | | | | | | |
| | | Year Ended
December 31,
2013 | | | Year Ended
December 31,
2012 | |
Increase (Decrease) in Net Assets: | | | | | | | | |
From Operations | | | | | | | | |
Net investment income | | $ | 6,531,088 | | | $ | 10,131,635 | |
Net realized gain | | | 242,226,735 | | | | 89,531,892 | |
Net change in unrealized appreciation | | | 661,110,220 | | | | 107,460,828 | |
| | | | | | | | |
Increase in net assets from operations | | | 909,868,043 | | | | 207,124,355 | |
| | | | | | | | |
From Distributions to Shareholders | | | | | | | | |
Net investment income | | | | | | | | |
Class A | | | (8,081,431 | ) | | | (2,536,299 | ) |
Class B | | | (1,843,777 | ) | | | (73,928 | ) |
Class E | | | (34,556 | ) | | | (10,456 | ) |
Net realized capital gains | | | | | | | | |
Class A | | | (19,836,239 | ) | | | (178,693,809 | ) |
Class B | | | (8,889,638 | ) | | | (85,941,554 | ) |
Class E | | | (126,083 | ) | | | (1,736,367 | ) |
| | | | | | | | |
Total distributions | | | (38,811,724 | ) | | | (268,992,413 | ) |
| | | | | | | | |
Increase (decrease) in net assets from capital share transactions | | | (110,487,570 | ) | | | 1,186,551,020 | |
| | | | | | | | |
Total increase in net assets | | | 760,568,749 | | | | 1,124,682,962 | |
| | |
Net Assets | | | | | | | | |
Beginning of period | | | 2,560,614,690 | | | | 1,435,931,728 | |
| | | | | | | | |
End of period | | $ | 3,321,183,439 | | | $ | 2,560,614,690 | |
| | | | | | | | |
| | |
Undistributed Net Investment Income | | | | | | | | |
End of period | | $ | 5,944,003 | | | $ | 9,633,454 | |
| | | | | | | | |
Other Information:
Capital Shares
Transactions in capital shares were as follows:
| | | | | | | | | | | | | | | | |
| | | Year Ended
December 31, 2013 | | | Year Ended
December 31, 2012 | |
| | | Shares | | | Value | | | Shares | | | Value | |
Class A | | | | | | | | | | | | | | | | |
Sales | | | 24,269,288 | | | $ | 331,339,004 | | | | 34,280,327 | | | $ | 399,435,526 | |
Shares issued through acquisition | | | 0 | | | | 0 | | | | 30,745,873 | | | | 371,717,609 | |
Reinvestments | | | 2,324,536 | | | | 27,917,670 | | | | 15,242,229 | | | | 181,230,108 | |
Redemptions | | | (28,011,394 | ) | | | (369,171,740 | ) | | | (13,640,782 | ) | | | (172,548,131 | ) |
| | | | | | | | | | | | | | | | |
Net increase (decrease) | | | (1,417,570 | ) | | $ | (9,915,066 | ) | | | 66,627,647 | | | $ | 779,835,112 | |
| | | | | | | | | | | | | | | | |
Class B | | | | | | | | | | | | | | | | |
Sales | | | 3,132,463 | | | $ | 40,981,221 | | | | 10,649,213 | | | $ | 127,251,009 | |
Shares issued through acquisition | | | 5,250,311 | | | | 64,841,343 | | | | 27,950,699 | | | | 335,128,887 | |
Reinvestments | | | 901,968 | | | | 10,733,415 | | | | 7,295,630 | | | | 86,015,482 | |
Redemptions | | | (16,188,001 | ) | | | (214,267,119 | ) | | | (12,339,040 | ) | | | (144,947,691 | ) |
| | | | | | | | | | | | | | | | |
Net increase (decrease) | | | (6,903,259 | ) | | $ | (97,711,140 | ) | | | 33,556,502 | | | $ | 403,447,687 | |
| | | | | | | | | | | | | | | | |
Class E | | | | | | | | | | | | | | | | |
Sales | | | 44,641 | | | $ | 609,299 | | | | 168,836 | | | $ | 2,047,396 | |
Shares issued through acquisition | | | 0 | | | | 0 | | | | 421,431 | | | | 5,078,240 | |
Reinvestments | | | 13,431 | | | | 160,639 | | | | 147,411 | | | | 1,746,823 | |
Redemptions | | | (274,458 | ) | | | (3,631,302 | ) | | | (466,195 | ) | | | (5,604,238 | ) |
| | | | | | | | | | | | | | | | |
Net increase (decrease) | | | (216,386 | ) | | $ | (2,861,364 | ) | | | 271,483 | | | $ | 3,268,221 | |
| | | | | | | | | | | | | | | | |
Increase (decrease) derived from capital shares transactions | | | | | | $ | (110,487,570 | ) | | | | | | $ | 1,186,551,020 | |
| | | | | | | | | | | | | | | | |
See accompanying notes to financial statements.
MSF-9
Metropolitan Series Fund
Jennison Growth Portfolio
Financial Highlights
| | | | | | | | | | | | | | | | | | | | |
| Selected per share data | | | | | | | | | | | | | | | |
| | | Class A | |
| | | Year Ended December 31, | |
| | | 2013 | | | 2012 | | | 2011 | | | 2010 | | | 2009 | |
Net Asset Value, Beginning of Period | | $ | 11.73 | | | $ | 12.14 | | | $ | 12.11 | | | $ | 10.91 | | | $ | 7.81 | |
| | | | | | | | | | | | | | | | | | | | |
Income (Loss) from Investment Operations | | | | | | | | | | | | | | | | | | | | |
Net investment income (a) | | | 0.04 | | | | 0.07 | | | | 0.03 | | | | 0.04 | | | | 0.04 | |
Net realized and unrealized gain on investments | | | 4.25 | | | | 1.88 | | | | 0.03 | | | | 1.23 | | | | 3.08 | |
| | | | | | | | | | | | | | | | | | | | |
Total from investment operations | | | 4.29 | | | | 1.95 | | | | 0.06 | | | | 1.27 | | | | 3.12 | |
| | | | | | | | | | | | | | | | | | | | |
Less Distributions | | | | | | | | | | | | | | | | | | | | |
Distributions from net investment income | | | (0.06 | ) | | | (0.03 | ) | | | (0.03 | ) | | | (0.07 | ) | | | (0.02 | ) |
Distributions from net realized capital gains | | | (0.14 | ) | | | (2.33 | ) | | | 0.00 | | | | 0.00 | | | | 0.00 | |
| | | | | | | | | | | | | | | | | | | | |
Total distributions | | | (0.20 | ) | | | (2.36 | ) | | | (0.03 | ) | | | (0.07 | ) | | | (0.02 | ) |
| | | | | | | | | | | | | | | | | | | | |
Net Asset Value, End of Period | | $ | 15.82 | | | $ | 11.73 | | | $ | 12.14 | | | $ | 12.11 | | | $ | 10.91 | |
| | | | | | | | | | | | | | | | | | | | |
Total Return (%) (b) | | | 37.00 | | | | 15.78 | | | | 0.51 | | | | 11.63 | | | | 39.99 | |
| | | | | |
Ratios/Supplemental Data | | | | | | | | | | | | | | | | | | | | |
Gross ratio of expenses to average net assets (%) | | | 0.62 | | | | 0.64 | | | | 0.64 | | | | 0.64 | | | | 0.66 | |
Net ratio of expenses to average net assets (%) (c) | | | 0.55 | | | | 0.57 | | | | 0.57 | | | | 0.59 | | | | 0.64 | |
Ratio of net investment income to average net assets (%) | | | 0.31 | | | | 0.58 | | | | 0.22 | | | | 0.35 | | | | 0.44 | |
Portfolio turnover rate (%) | | | 36 | | | | 41 | | | | 47 | | | | 66 | | | | 58 | |
Net assets, end of period (in millions) | | $ | 2,332.0 | | | $ | 1,744.7 | | | $ | 997.2 | | | $ | 1,852.8 | | | $ | 1,621.0 | |
| | | | | | | | | | | | | | | | | | | | |
| | | Class B | |
| | | Year Ended December 31, | |
| | | 2013 | | | 2012 | | | 2011 | | | 2010 | | | 2009 | |
Net Asset Value, Beginning of Period | | $ | 11.61 | | | $ | 12.03 | | | $ | 12.01 | | | $ | 10.83 | | | $ | 7.76 | |
| | | | | | | | | | | | | | | | | | | | |
Income (Loss) from Investment Operations | | | | | | | | | | | | | | | | | | | | |
Net investment income (a) | | | 0.01 | | | | 0.03 | | | | 0.00 | (d) | | | 0.01 | | | | 0.02 | |
Net realized and unrealized gain on investments | | | 4.21 | | | | 1.88 | | | | 0.03 | | | | 1.21 | | | | 3.05 | |
| | | | | | | | | | | | | | | | | | | | |
Total from investment operations | | | 4.22 | | | | 1.91 | | | | 0.03 | | | | 1.22 | | | | 3.07 | |
| | | | | | | | | | | | | | | | | | | | |
Less Distributions | | | | | | | | | | | | | | | | | | | | |
Distributions from net investment income | | | (0.03 | ) | | | (0.00 | )(e) | | | (0.01 | ) | | | (0.04 | ) | | | 0.00 | |
Distributions from net realized capital gains | | | (0.14 | ) | | | (2.33 | ) | | | 0.00 | | | | 0.00 | | | | 0.00 | |
| | | | | | | | | | | | | | | | | | | | |
Total distributions | | | (0.17 | ) | | | (2.33 | ) | | | (0.01 | ) | | | (0.04 | ) | | | 0.00 | |
| | | | | | | | | | | | | | | | | | | | |
Net Asset Value, End of Period | | $ | 15.66 | | | $ | 11.61 | | | $ | 12.03 | | | $ | 12.01 | | | $ | 10.83 | |
| | | | | | | | | | | | | | | | | | | | |
Total Return (%) (b) | | | 36.73 | | | | 15.56 | | | | 0.22 | | | | 11.31 | | | | 39.56 | |
| | | | | |
Ratios/Supplemental Data | | | | | | | | | | | | | | | | | | | | |
Gross ratio of expenses to average net assets (%) | | | 0.87 | | | | 0.89 | | | | 0.89 | | | | 0.89 | | | | 0.91 | |
Net ratio of expenses to average net assets (%) (c) | | | 0.80 | | | | 0.82 | | | | 0.82 | | | | 0.84 | | | | 0.89 | |
Ratio of net investment income to average net assets (%) | | | 0.06 | | | | 0.30 | | | | 0.02 | | | | 0.10 | | | | 0.20 | |
Portfolio turnover rate (%) | | | 36 | | | | 41 | | | | 47 | | | | 66 | | | | 58 | |
Net assets, end of period (in millions) | | $ | 976.7 | | | $ | 804.2 | | | $ | 429.9 | | | $ | 425.0 | | | $ | 351.5 | |
Please see following page for Financial Highlights footnote legend.
See accompanying notes to financial statements.
MSF-10
Metropolitan Series Fund
Jennison Growth Portfolio
Financial Highlights
| | | | | | | | | | | | | | | | | | | | |
| Selected per share data | | | | | | | | | | | | | | | |
| | | Class E | |
| | | Year Ended December 31, | |
| | | 2013 | | | 2012 | | | 2011 | | | 2010 | | | 2009 | |
Net Asset Value, Beginning of Period | | $ | 11.67 | | | $ | 12.09 | | | $ | 12.07 | | | $ | 10.88 | | | $ | 7.78 | |
| | | | | | | | | | | | | | | | | | | | |
Income (Loss) from Investment Operations | | | | | | | | | | | | | | | | | | | | |
Net investment income (a) | | | 0.02 | | | | 0.04 | | | | 0.01 | | | | 0.02 | | | | 0.03 | |
Net realized and unrealized gain on investments | | | 4.24 | | | | 1.88 | | | | 0.03 | | | | 1.22 | | | | 3.07 | |
| | | | | | | | | | | | | | | | | | | | |
Total from investment operations | | | 4.26 | | | | 1.92 | | | | 0.04 | | | | 1.24 | | | | 3.10 | |
| | | | | | | | | | | | | | | | | | | | |
Less Distributions | | | | | | | | | | | | | | | | | | | | |
Distributions from net investment income | | | (0.04 | ) | | | (0.01 | ) | | | (0.02 | ) | | | (0.05 | ) | | | (0.00 | )(e) |
Distributions from net realized capital gains | | | (0.14 | ) | | | (2.33 | ) | | | 0.00 | | | | 0.00 | | | | 0.00 | |
| | | | | | | | | | | | | | | | | | | | |
Total distributions | | | (0.18 | ) | | | (2.34 | ) | | | (0.02 | ) | | | (0.05 | ) | | | (0.00 | ) |
| | | | | | | | | | | | | | | | | | | | |
Net Asset Value, End of Period | | $ | 15.75 | | | $ | 11.67 | | | $ | 12.09 | | | $ | 12.07 | | | $ | 10.88 | |
| | | | | | | | | | | | | | | | | | | | |
Total Return (%) (b) | | | 36.90 | | | | 15.58 | | | | 0.31 | | | | 11.44 | | | | 39.88 | |
| | | | | |
Ratios/Supplemental Data | | | | | | | | | | | | | | | | | | | | |
Gross ratio of expenses to average net assets (%) | | | 0.77 | | | | 0.79 | | | | 0.79 | | | | 0.79 | | | | 0.81 | |
Net ratio of expenses to average net assets (%) (c) | | | 0.70 | | | | 0.72 | | | | 0.72 | | | | 0.74 | | | | 0.79 | |
Ratio of net investment income to average net assets (%) | | | 0.16 | | | | 0.38 | | | | 0.12 | | | | 0.21 | | | | 0.30 | |
Portfolio turnover rate (%) | | | 36 | | | | 41 | | | | 47 | | | | 66 | | | | 58 | |
Net assets, end of period (in millions) | | $ | 12.5 | | | $ | 11.8 | | | $ | 8.9 | | | $ | 10.2 | | | $ | 9.5 | |
| (a) | Per share amounts based on average shares outstanding during the period. |
| (b) | Total return does not reflect any insurance, sales, separate account or administrative charges of variable annuity or life insurance contracts or any additional expenses that contract owners may bear under their variable contracts. If these charges were included, the returns would be lower. |
| (c) | Net ratio of expenses to average net assets includes the effect of management fee waivers as detailed in Note 6 of the Notes to Financial Statements. |
| (d) | Net investment income (loss) was less than $0.01. |
| (e) | Distributions from net investment income were less than $0.01. |
See accompanying notes to financial statements.
MSF-11
Metropolitan Series Fund
Jennison Growth Portfolio
Notes to Financial Statements—December 31, 2013
1. Organization
Metropolitan Series Fund (the “Trust”) is organized as a Delaware statutory trust and registered under the Investment Company Act of 1940, as amended (the “1940 Act”), as an open-end management investment company. The Trust is currently comprised of thirty series, each of which operates as a distinct investment vehicle of the Trust. The portfolio included in this report is Jennison Growth Portfolio (the “Portfolio”), which is diversified. Shares in the Portfolio are not offered directly to the general public and are currently available only to separate accounts established by Metropolitan Life Insurance Company (“MetLife”) and other affiliated life insurance companies.
The Portfolio has registered and offers three classes of shares: Class A, B, and E shares. Shares of each Class of the Portfolio represent an equal pro rata interest in the Portfolio and generally give the shareholder the same voting, dividend, liquidation, and other rights. Investment income, realized and unrealized capital gains and losses, the common expenses of the Portfolio, and certain Portfolio-level expense reductions, if any, are allocated on a pro rata basis to each Class based on the relative net assets of each Class to the net assets of the Portfolio. Each Class of shares differs in its respective distribution plan and such distribution expenses are allocated to that Class.
2. Significant Accounting Policies
The preparation of financial statements in conformity with accounting principles generally accepted in the United States of America (“GAAP”) requires management to make estimates and assumptions that affect the reported amounts of assets and liabilities and disclosure of contingent assets and liabilities as of the date of the financial statements and the reported amounts of income and expenses during the reporting period. Actual results could differ from those estimates. In the preparation of these financial statements, management has evaluated events and transactions subsequent to December 31, 2013 through the date the financial statements were issued.
The following is a summary of significant accounting policies consistently followed by the Portfolio in the preparation of its financial statements.
Investment Valuation and Fair Value Measurements - Debt securities (other than short term obligations with a remaining maturity of sixty days or less), including corporate, convertible and municipal bonds and notes; obligations of the U.S. treasury and U.S. government agencies; sovereign issues; floating rate loans; and non-U.S. bonds, are generally valued on the basis of evaluated or composite bid quotations obtained from independent pricing services and/or brokers and dealers selected by MetLife Advisers, LLC (“MetLife Advisers” or the “Adviser”), an affiliate of MetLife, Inc., pursuant to authorization of the Board of Trustees of the Trust (the “Board” or “Trustees”). Such quotations utilize matrix pricing, which considers observable inputs including, among other things, issuer details, maturity dates, interest rates, yield curves, rates of prepayment, credit risks/spreads, default rates, reported trades, broker dealer quotes and quoted prices for similar securities. Securities that use similar valuation techniques and inputs as described above are generally categorized as Level 2 within the fair value hierarchy.
Mortgage and asset-backed securities are usually issued as separate tranches, or classes, of securities within each deal. These securities are also generally valued on the basis of evaluated or composite bid quotations obtained from independent pricing services and/or brokers and dealers selected by the Adviser pursuant to authorization of the Board. The pricing models for these securities usually consider tranche-level attributes, estimated cash flows and market-based yield spreads for each tranche and current market data, and incorporate deal collateral performance, as available. Mortgage and asset-backed securities that use similar valuation techniques and inputs as described above are generally categorized as Level 2 within the fair value hierarchy.
Short term obligations with a remaining maturity of sixty days or less are generally valued at amortized cost, which approximates fair market value, and are generally categorized as Level 2 within the fair value hierarchy.
Domestic and foreign equity securities, such as common stock, exchange-traded funds, rights, warrants, and preferred stock, that are traded on a securities exchange, are generally valued at their last sale price on the exchange or market in which they are principally traded on the valuation date, or, if no sales occurred on that day, at the last reported bid price. Equity securities traded over-the-counter are generally valued at the last reported sale price. Valuation adjustments may be applied to certain foreign equity securities that are traded solely on foreign exchanges that close before the close of the U.S. market to account for the market movement between the close of the foreign exchanges and the close of the U.S. market. The Portfolio may use a systematic fair valuation model provided by an independent third party to value securities principally traded in these foreign markets in order to adjust for possible stale pricing that may occur between the close of the foreign exchanges and the time of the Portfolio valuation. Foreign equity securities using these valuation adjustments are generally categorized as Level 2 within the fair value hierarchy. Equity securities that are actively traded, and have no valuation adjustments applied, are categorized as Level 1 within the fair value hierarchy. Other equity securities traded on inactive markets, or valued in reference to similar instruments traded on active markets, are generally categorized as Level 2 within the fair value hierarchy.
MSF-12
Metropolitan Series Fund
Jennison Growth Portfolio
Notes to Financial Statements—December 31, 2013—(Continued)
Investments in registered open-end management investment companies are valued at reported net asset value per share on the valuation date and are categorized as Level 1 within the fair value hierarchy.
Forward foreign currency exchange contracts are valued through an independent pricing service based on the mean between closing bid and ask prices of the forward currency rates in the London foreign exchange markets on a daily basis as provided by a reliable bank or dealer. These contracts are generally categorized as Level 2 within the fair value hierarchy.
Options, whether on securities, indices, futures contracts, or otherwise, traded on exchanges are valued at the last sale price available as of the close of business on the valuation date or, if there is no such price available, at the mean between the last reported bid and ask prices. These types of options are categorized as Level 1 within the fair value hierarchy. Futures contracts, which are traded on commodity exchanges, are valued at their closing prices as of the close of such exchanges and are categorized as Level 1 within the fair value hierarchy.
Options and futures contracts that are traded over-the-counter are generally valued on the basis of quotations provided by broker-dealers or prices provided by pricing service providers who use a series of techniques, including simulation pricing models, to determine the value of the contracts. The pricing models use inputs that are observed from actively quoted markets such as issuer details, indices, spreads, interest rates, yield curves, credit curves, measures of volatility and exchange rates. These contracts are generally categorized as Level 2 within the fair value hierarchy.
If no current market value quotation or other observable inputs are readily available or market value quotations are deemed to be unreliable for a security, the fair value of the security will be determined in accordance with procedures approved by and under the general supervision of the Board. In such a circumstance, the Board has delegated the determination of the fair value of a security to a Valuation Committee (“Committee”) of MetLife Advisers. The Committee provides general pricing oversight and fair value pricing determinations related to portfolio securities and meets on a regular basis to review reports relating to the valuation of the securities in the Portfolio. The Board has delegated to State Street Bank and Trust Company, the Trust’s custodian (“custodian”), the responsibility for calculating the net asset values (“NAVs”) of the Trust’s Portfolios. The Committee is responsible for overseeing the calculation of the NAVs of the Portfolios by the custodian. The Committee also periodically reviews pricing vendors, including the vendor providing fair value pricing for the Portfolio’s foreign securities, and is responsible for overseeing the correction of pricing errors and addressing other pricing issues that arise in the ordinary course of business, such as making real-time fair value determinations, as necessary.
No single standard for determining the fair value of a security can be set forth because fair value depends upon the facts and circumstances with respect to each security. Information relating to any relevant factors may be obtained by the Committee from any appropriate source, including the subadviser of the Portfolio, the custodian, a pricing service, market maker and/or broker for such security or the issuer. Appropriate methodologies for determining fair value under particular circumstances may include: matrix pricing, comparisons of securities with comparable characteristics, value based on multiples of earnings, discount from market price of similar marketable securities or a combination of these and other methods. The Committee maintains a detailed report tracking each fair-valued security that compares the fair value price to the next available trade, vendor or broker price, and provides information on how close the fair value price was to the next quoted price. The Committee reviews a summary of such report monthly. On a quarterly basis, the Board is provided with the following for consideration and ratification or adjustment: (1) a memorandum summarizing the actions taken by the Committee in the prior quarter; and (2) a list of the Portfolio’s securities as of the most recent quarter-end for which market quotations were not readily available.
Investment Transactions and Related Investment Income - Portfolio security transactions are recorded on the trade date. Dividend income is recorded on the ex-dividend date or, for certain foreign securities, when notified. Interest income, which includes amortization of premium and accretion of discount on debt securities, is recorded on the accrual basis. Realized gains and losses on investments are determined on the identified cost basis, which is the same basis used for federal income tax purposes. Foreign income and foreign capital gains on some foreign securities may be subject to foreign taxes, which are accrued as applicable. These foreign taxes have been provided for in accordance with the Portfolio’s understanding of the applicable countries’ tax rules and rates.
Foreign Currency Translation - The books and records of the Portfolio are maintained in U.S. dollars. The values of securities, currencies, and other assets and liabilities denominated in currencies other than the U.S. dollar are translated into U.S. dollars based upon foreign exchange rates prevailing at the end of the period. Purchases and sales of investment securities, income, and expenses are translated on the respective dates of such transactions. Because the values of investment securities are translated at the foreign exchange rates prevailing at the end of the period, that portion of the results of operations arising from changes in exchange rates and that portion of the results of operations reflecting fluctuations arising from changes in market prices of the investment securities are not separated. Such fluctuations are included in the net realized and unrealized gain or loss on investments.
Net realized foreign exchange gains or losses arise from activity in forward foreign currency exchange contracts, sales of foreign currency, currency gains or losses realized between the trade and settlement dates on securities transactions, and the difference between the amounts of dividends, interest, and foreign withholding taxes recorded by the Portfolio and the U.S. dollar equivalent of
MSF-13
Metropolitan Series Fund
Jennison Growth Portfolio
Notes to Financial Statements—December 31, 2013—(Continued)
the amounts actually received or paid by the Portfolio. Net unrealized foreign exchange gains and losses arise from changes in the value of assets and liabilities, other than investment securities, resulting from changes in foreign exchange rates.
Income Taxes - It is the Portfolio’s policy to comply with the requirements of the Internal Revenue Code of 1986, as amended, and regulations thereunder, applicable to regulated investment companies and to distribute, with respect to each taxable year, all of its taxable income to shareholders. Therefore, no federal income tax provision is required. The Portfolio files U.S. federal tax returns. No income tax returns are currently under examination. The Portfolio’s federal tax returns for the prior three fiscal years remain subject to examination by the Internal Revenue Service. As of December 31, 2013, the Portfolio had no uncertain tax positions that would require financial statement recognition, or de-recognition or disclosure.
Dividends and Distributions to Shareholders - The Portfolio records dividends and distributions on the ex-dividend date. Net realized gains from security transactions (if any) are generally distributed annually to shareholders. The timing and characterization of certain income and capital gains distributions are determined in accordance with federal tax regulations that may differ from GAAP. Permanent book and tax basis differences relating to shareholder distributions will result in reclassification between under/over distributed net investment income, accumulated net realized gains/losses, and paid-in surplus. Book-tax differences are primarily due to foreign currency transactions, broker commission recapture reclasses, and merger related adjustments. These adjustments have no impact on net assets or the results of operations.
Securities Lending - The Portfolio may lend its portfolio securities to certain qualified brokers who borrow securities in order to complete certain securities transactions. By lending its portfolio securities, the Portfolio attempts to increase its net investment income through the receipt of income on collateral held from securities on loan. Any gain or loss in the market price of the loaned securities that might occur and any interest earned or dividends declared during the term of the loan would accrue to the account of the Portfolio.
The Trust has entered into a securities lending arrangement with the custodian. Under this arrangement, the custodian is authorized to loan portfolio securities on the Portfolio’s behalf. In exchange, the Portfolio receives either cash or securities as collateral against the loaned securities. The Portfolio receives collateral at least equal to 102% of the market value of the loaned securities (105% for foreign equity securities), at each loan’s inception. Collateral representing at least 100% of the market value of the loaned securities must be maintained for the duration of the loan. A liability for cash collateral is reflected on the Statement of Assets and Liabilities, and is categorized as Level 2 within the fair value hierarchy. Cash collateral is generally invested in the State Street Navigator Securities Lending MET Portfolio (the “Navigator Portfolio”), a series of the State Street Navigator Securities Lending Trust that is managed by an affiliate of the custodian. The Navigator Portfolio is a registered money market fund that invests in a variety of high-quality, U.S. dollar-denominated instruments. If the market value of the collateral at the close of trading on a business day is less than 100% of the market value of the loaned securities at the close of trading on that day, the borrower shall be required to deliver, by the close of business on the following business day, an additional amount of collateral, so that the total amount of posted collateral is equal to at least 100% of the market value of all the loaned securities as of such preceding day. A portion of net income (income after the deduction of expenses and fees of the Navigator Portfolio) on the collateral is rebated to the borrower of the securities and the remainder is split between the custodian and the Portfolio. On loans collateralized by U.S. Treasuries, a fee is received from the borrower and is allocated between the Portfolio and the custodian. The risks associated with lending portfolio securities include, but are not limited to, possible delays in receiving additional collateral or in the recovery of the loaned securities, possible loss of rights in the collateral should the borrower fail financially, as well as risk of loss in the value of the collateral or the value of the investments made with the collateral. The lending agent has agreed to indemnify the Portfolio in the case of default of any securities borrower. Income received by the Portfolio in securities lending transactions during the year ended December 31, 2013 is reflected as Securities lending income on the Statement of Operations. Any outstanding loans by the Portfolio at December 31, 2013 are disclosed in the footnotes to the Schedule of Investments.
Repurchase Agreements - The Portfolio may enter into repurchase agreements, under the terms of a Master Repurchase Agreement, with selected commercial banks and broker-dealers, under which the Portfolio acquires securities as collateral and agrees to resell the securities at an agreed upon time and at an agreed-upon price. The Portfolio, through the custodian or a subcustodian, receives delivery of the underlying securities collateralizing any repurchase agreements. The Portfolio requires the custodian to take possession, to have legally segregated in the Federal Reserve Book Entry System, or to have segregated within the custodian’s vault, all securities held as collateral for repurchase agreements. It is the Portfolio’s policy that the market value of the collateral be at least equal to 100% of the repurchase price in the case of a repurchase agreement of one-day duration and at least equal to 102% of the repurchase price in the case of all other repurchase agreements. In the event of default or failure by a party to perform an obligation in connection with any repurchase transaction, the Master Repurchase Agreement gives the non-defaulting party the right to set-off claims and to apply property held by it in connection with any repurchase transaction against obligations owed to it.
Directed Brokerage Agreement - The Trust has entered into a directed brokerage arrangement with State Street Global Markets (“SSGM”). Under this arrangement, the Portfolio directs certain trades to SSGM in return for a recapture credit. SSGM issues a cash rebate to the Portfolio. Amounts paid to the Portfolio are shown separately as broker commission recapture on the Statement of Operations of the Portfolio. Additionally, these amounts have been excluded from the calculation of the net ratio of expenses to average net assets presented in the Financial Highlights for each share class.
MSF-14
Metropolitan Series Fund
Jennison Growth Portfolio
Notes to Financial Statements—December 31, 2013—(Continued)
3. Investments in Derivative Instruments
Futures Contracts - The Portfolio may buy and sell futures contracts as a hedge, to maintain investment exposure to a target asset class or to enhance return. The Portfolio may be subject to fluctuations in equity prices, interest rates, commodity prices, and foreign currency exchange rates in the normal course of pursuing its investment objective. Futures contracts are standardized agreements to buy or sell a security, or deliver a final cash settlement price in connection with an index, interest rate, currency, or other asset. The Portfolio must deposit an amount (“initial margin”) equal to a certain percentage of the face value of the futures contract. The initial margin may be in the form of cash or securities, which is returned when the Portfolio’s obligations under the contract have been satisfied. If cash is deposited as the initial margin, it is shown as cash collateral on the Statement of Assets and Liabilities. Futures contracts are marked-to-market daily, and subsequent payments (“variation margin”) are made or received by the Portfolio depending on whether unrealized gains or losses are incurred. These amounts are reflected as receivables or payables on the Statement of Assets and Liabilities and as a component of net change in unrealized appreciation/depreciation on the Statement of Operations. When the contract is closed or expires, the Portfolio records a realized gain or loss equal to the difference between the value of the contract at the time it was opened and the value at the time it was closed. Risks of entering into futures contracts (and related options) include the possibility that the market for these instruments may be illiquid and that a change in the value of the contract or option may not correlate perfectly with changes in the value of the underlying instrument. Futures contracts are exchange-traded and the exchange’s clearinghouse, as counterparty to all exchange-traded futures, guarantees the futures contracts against default. For over-the-counter futures the Portfolio’s ability to terminate the positions may be more limited than in the case of exchange-traded positions and may also involve the risk that securities dealers participating in such transactions would fail to meet their obligations to the Portfolio.
During the year ended December 31, 2013, the Portfolio entered into equity index futures contracts which were subject to equity price risk. During the period October 31, 2013 through November 1, 2013, the Portfolio had bought and sold $112,495,141 in equity index futures contracts. At December 31, 2013, the Portfolio did not have any open futures contracts. For the year ended December 31, 2013, the Portfolio had realized gains in the amount of $176,024 which are shown under Net realized gain on futures contracts in the Statement of Operations.
4. Certain Risks
Market Risk: In the normal course of business, the Portfolio invests in securities and enters into transactions where risks exist due to fluctuations in the market (market risk) or failure of the other party to a transaction to perform (credit and counterparty risk). The value of securities held by the Portfolio may decline in response to certain events, including those directly involving the companies whose securities are owned by the Portfolio; conditions affecting the general economy; overall market changes; local, regional or global political, social or economic instability; currency, interest rate, and price fluctuations.
Credit and Counterparty Risk: The Portfolio may be exposed to counterparty risk, or the risk that an entity with which the Portfolio has unsettled or open transactions may default. The potential loss could exceed the value of the financial assets and liabilities recorded in the financial statements. Financial assets that potentially expose the Portfolio to credit and counterparty risk consist principally of cash due from counterparties and investments. The Portfolio manages counterparty risk by entering into agreements only with counterparties that it believes have the financial resources to honor their obligations and by monitoring the financial stability of those counterparties. The Portfolio’s investment adviser attempts to mitigate counterparty risk by (i) periodically assessing the creditworthiness of its trading partners, (ii) monitoring and/or limiting the amount of its net exposure to each individual counterparty based on its assessment, and (iii) requiring collateral from the counterparty for certain transactions. In order to preserve certain safeguards for non-standard settlement trades, the Portfolio restricts its exposure to credit and counterparty losses by entering into master netting agreements with counterparties (approved brokers) with whom it undertakes a significant volume of transactions. Master Agreements govern the terms of certain transactions, and reduce the counterparty risk associated with relevant transactions by specifying credit protection mechanisms and providing standardization that improves legal certainty. Master Agreements can also help limit counterparty risk by specifying collateral posting arrangements at pre-arranged exposure levels. Collateral requirements may differ by type of derivative or investment, as applicable. Collateral or margin requirements are set by the broker or exchange clearing house for exchange traded derivatives (e.g., futures contracts and exchange traded options) while collateral terms are contract specific for over-the-counter traded derivatives (e.g., forward foreign currency exchange contracts, swap agreements and over-the-counter options).
Repurchase and reverse repurchase agreements are primarily executed under Global Master Repurchase Agreements (“GMRAs”) or Master Repurchase Agreements (“MRAs”), which provide the rights to set-off. Each repurchase and reverse repurchase agreement is initially collateralized at the transaction level. In the event of default, the total market value exposure will be offset against collateral exchanged to date, which would result in a net receivable/(payable) that would be due from/to the counterparty.
Customer Account Agreements and related addendums govern cleared derivatives transactions such as futures, options on futures, and cleared OTC derivatives. Cleared derivative transactions require posting of initial margin as determined by each relevant clearing agency which is segregated at a broker account registered with the Commodities Futures Trading Commission (CFTC), or the
MSF-15
Metropolitan Series Fund
Jennison Growth Portfolio
Notes to Financial Statements—December 31, 2013—(Continued)
applicable regulator. In the U.S., counterparty risk is significantly reduced as creditors of the futures broker do not have claim to Portfolio assets in the segregated account. Additionally, portability of exposure in the event of default further reduces risk to the Portfolio. Variation margin, or changes in market value, are exchanged daily, but may not be netted between futures and cleared OTC derivatives.
Additional risks associated with each type of investment are described above within the respective security type notes. The Portfolio’s prospectus includes a discussion of the principal risks of investing in the Portfolio.
5. Investment Transactions
Aggregate cost of purchases and proceeds of sales of investment securities, excluding short-term securities, for the year ended December 31, 2013 were as follows:
| | | | | | | | | | | | |
Purchases | | | Sales | |
U.S. Government | | Non U.S. Government | | | U.S. Government | | | Non U.S. Government | |
| $0 | | $ | 1,009,084,502 | | | $ | 0 | | | $ | 1,176,429,797 | |
With respect to the Portfolio’s merger with Jennison Large Cap Equity Portfolio (see Note 9) on April 26, 2013, the Portfolio acquired long-term securities with a cost of $56,250,966 that are not included in the above non-U.S. Government purchases value.
During the year ended December 31, 2013, the Portfolio engaged in security transactions with other affiliated portfolios. These amounted to $46,176,518 in purchases of investments, which are included above.
6. Investment Management Fees and Other Transactions with Affiliates
Investment Management Agreement - MetLife Advisers is the investment adviser to the Portfolio. The Trust has entered into an investment management agreement with MetLife Advisers with respect to the Portfolio. For providing investment management services to the Portfolio, MetLife Advisers receives monthly compensation at the following annual rates:
| | | | | | |
Management
Fees earned by
MetLife Advisers
for the year ended
December 31, 2013 | | % per annum | | | Average Daily Net Assets |
| $17,034,652 | | | 0.700 | % | | Of the first $200 million |
| | | 0.650 | % | | Of the next $300 million |
| | | 0.600 | % | | Of the next $1.5 billion |
| | | 0.550 | % | | On amounts in excess of $2 billion |
MetLife Advisers has entered into an investment subadvisory agreement with respect to the Portfolio. Jennison Associates LLC (the “Subadviser”) is compensated by MetLife Advisers to provide subadvisory services for the Portfolio.
Management Fee Waivers - Pursuant to an expense agreement, MetLife Advisers has agreed, for the period April 29, 2013 through April 27, 2014, to reduce its advisory fees set out above under “Investment Management Agreement” for each class of the Portfolio as follows:
| | |
% per annum | | Average Daily Net Assets |
| 0.050% | | Of the first $200 million |
| 0.050% | | Over $300 million and less than $1 billion |
| 0.100% | | On the next $1 billion |
| 0.080% | | On amounts in excess of $2 billion |
An identical expense agreement was in place for the period April 30, 2012 through April 28, 2013. Amounts waived for the year ended December 31, 2013 amounted to $2,131,412 and are included in the total amounts shown as management fee waivers in the Statement of Operations.
In addition to the above expense agreement, the Subadviser had agreed for the period November 2, 2012 through April 28, 2013, to waive a portion of their subadvisory fees by calculating the fees for assets under management by the Subadviser for the Portfolio and the Met Investors Series Trust Jennison Large Cap Equity Portfolio in the aggregate, and then apportioning the resulting subadvisory fee among the two Portfolios based on average daily net assets. The Adviser has voluntarily agreed to reduce its management fee for the Portfolio by the amount waived (if any) by the Subadviser for the Portfolio pursuant to this voluntary subadvisory fee waiver. Amounts voluntarily waived by MetLife Advisers for the year ended December 31, 2013 amounted to $7,193 and are included in the total amounts shown as management fee waivers in the Statement of Operations.
MSF-16
Metropolitan Series Fund
Jennison Growth Portfolio
Notes to Financial Statements—December 31, 2013—(Continued)
Certain officers and trustees of the Trust may also be officers of MetLife Advisers; however, such officers and trustees receive no compensation from the Trust.
Transfer Agency Agreement - MetLife serves as the transfer agent for the Trust. MetLife receives no fees for its services to the Trust under the transfer agency agreement.
Distribution and Service Fees - The Trust has a distribution agreement with MetLife Investors Distribution Company (“MIDC” or the “Distributor”) in which MIDC serves as the distributor for the Portfolio’s Class A, B and E Shares. MIDC is a wholly-owned subsidiary of MetLife Investors Group, Inc., an affiliate of the Adviser. The Trust has also adopted a Distribution and Service Plan under Rule 12b-1 of the 1940 Act for the Portfolio’s Class B and E Shares. Under the Distribution and Service Plan, the Class B and E Shares of the Portfolio pay a fee to compensate the Insurance Companies (or their affiliates) and other broker-dealers and financial intermediaries involved in the offer and sale of Portfolio shares for promoting or selling and servicing the Class B and E Shares. The fees under the Distribution and Service Plan for each class of the Portfolio’s shares are calculated as a percentage of the Portfolio’s average daily net assets that are attributable to that Class. Currently, the fee is 0.25% per year for Class B Shares and 0.15% per year for Class E Shares. Amounts incurred by the Portfolio for the year ended December 31, 2013 are shown as Distribution and service fees in the Statement of Operations.
Deferred Trustee Compensation - Each Trustee who is not currently an employee of the Adviser or any of its affiliates receives compensation from the Trust for his or her service to the Trust. A deferred compensation plan (the “Plan”) is available to the Trustees on a voluntary basis. Deferred amounts remain in the Trust until distributed in accordance with the provisions of the Plan. The value of a participating Trustee’s deferral account is based on theoretical investments of deferred amounts, on the normal payment dates in certain portfolios of the Trust or Met Investors Series Trust, an affiliate of the Trust, as designated by the participating Trustee. Changes in the value of participants’ deferral accounts are reflected as Trustees’ fees and expenses in the Statement of Operations. The portion of the accrued obligations allocated to the Portfolio under the Plan is reflected as Deferred trustees’ fees in the Statement of Assets and Liabilities.
7. Contractual Obligations
Under the Trust’s organizational documents, its officers and Trustees may be indemnified against certain liabilities and expenses arising out of the performance of their duties to the Trust. Additionally, the Trust has a variety of indemnification obligations under contracts with its service providers. The Trust’s maximum exposure under these arrangements is unknown, as this would involve future claims that may be made against the Trust that have not yet occurred.
8. Income Tax Information
The tax character of distributions paid for the periods ended December 31, 2013 and 2012 was as follows:
| | | | | | | | | | | | | | | | | | | | |
Ordinary Income | | | Long-Term Capital Gain | | | Total | |
2013 | | 2012 | | | 2013 | | | 2012 | | | 2013 | | | 2012 | |
| $9,959,764 | | $ | 2,620,683 | | | $ | 28,851,960 | | | $ | 266,371,730 | | | $ | 38,811,724 | | | $ | 268,992,413 | |
As of December 31, 2013, the components of distributable earnings (accumulated losses) on a federal income tax basis were as follows:
| | | | | | | | | | | | | | | | |
Undistributed
Ordinary
Income | | Undistributed
Long-Term
Capital Gain | | | Net
Unrealized
Appreciation | | | Loss
Carryforwards | | | Total | |
| $6,053,013 | | $ | 171,706,632 | | | $ | 1,094,209,001 | | | $ | — | | | $ | 1,271,968,646 | |
The Portfolio utilizes the provisions of the federal income tax laws that provide for the carryforward of capital losses for prior years, offsetting such losses against any future realized capital gains. Under the Regulated Investment Company Modernization Act of 2010 (the “Act”), net capital losses recognized after December 22, 2010 may be carried forward indefinitely and their character is retained as short-term and/or long-term losses. Previously, net capital losses were carried forward for up to eight years and treated as short-term losses. As a transition rule, the Act requires that post-enactment net capital losses be used before pre-enactment net capital losses.
As of December 31, 2013 the Portfolio had no post-enactment accumulated capital losses and no pre-enactment accumulated capital loss carryforwards.
On April 27, 2012, the Portfolio acquired the assets and liabilities of Oppenheimer Capital Appreciation Portfolio in a tax free reorganization. The Portfolio acquired $130,875,591 in capital loss carryforwards from the Oppenheimer Capital Appreciation Portfolio.
MSF-17
Metropolitan Series Fund
Jennison Growth Portfolio
Notes to Financial Statements—December 31, 2013—(Continued)
The utilization of the capital loss carryforward acquired as part of the merger may be limited under section 381 of the Internal Revenue Code. The Portfolio utilized $60,903,503 and $69,972,088 in capital loss carryforwards as of December 31, 2012 and December 31, 2013, respectively.
9. Acquisition
At the close of business on April 26, 2013, the Portfolio, with aggregate Class A, Class B and Class E net assets of $1,857,306,830, $819,988,734 and $11,676,860, respectively, acquired all of the assets and liabilities of Jennison Large Cap Equity Portfolio of the Met Investors Series Trust (“Jennison Large Cap Equity”).
The acquisition was accomplished by a tax-free exchange of 5,250,311 Class B shares of the Portfolio (valued at $64,841,343) for 467,420,337 Class B shares of Jennison Large Cap Equity. Each shareholder of Jennison Large Cap Equity received Class B shares of the Portfolio at the Portfolio’s Class B NAV, as determined at the close of business on April 26, 2013. The transaction was part of a restructuring designed to eliminate the offering of overlapping Portfolios in the MetLife, Inc. families of funds with similar investment objectives and similar investment strategies that serve as funding vehicles for insurance contracts that are offered by affiliates of MetLife. Some of the investments held by Jennison Large Cap Equity may have been purchased or sold prior to the acquisition for the purpose of complying with the anticipated investment policies or limitations of the Portfolio after the acquisition. If such purchases or sales occurred, the transaction costs were borne by Jennison Large Cap Equity. All other costs associated with the merger were not borne by the shareholders of either portfolio.
Jennison Large Cap Equity’s net assets on April 26, 2013, were $64,841,343 for Class B shares, including investments valued at $64,401,707 with a cost basis of $57,348,966. For financial reporting purposes, assets received, liabilities assumed and shares issued by the Portfolio were recorded at fair value; however, the cost basis of the investments received by the Portfolio from Jennison Large Cap Equity were carried forward to align ongoing reporting of the Portfolio’s realized and unrealized gains and losses with amounts distributable to shareholders for tax purposes.
The aggregate net assets of the Portfolio immediately after the acquisition were $2,753,813,767, which included $7,052,741 of acquired unrealized appreciation.
Assuming the acquisition had been completed on January 1, 2013, the Portfolio’s pro-forma results of operations for the year ended December 31, 2013 are as follows:
| | | | |
Net Investment income | | $ | 6,562,470 | (a) |
Net realized and unrealized gain on investments and foreign currency transactions | | $ | 908,460,659 | (b) |
| | | | |
Net increase in net assets from operations | | $ | 915,023,129 | |
| | | | |
Because the combined investment portfolios have been managed as a single integrated portfolio since the acquisition was completed, it is not practicable to separate the amounts of revenue and earnings of Jennison Large Cap Equity that have been included in the Portfolio’s Statement of Operations since April 26, 2013.
| (a) | $6,531,088 net investment income as reported minus $30,183 from Jennison Large Cap Equity pre-merger net investment income, plus $24,296 in lower advisory fees, plus $37,269 of pro-forma eliminated other expenses. |
| (b) | $1,095,351,241 unrealized appreciation as reported minus $430,673,341 pro-forma December 31, 2012 unrealized appreciation, plus $242,226,735 net realized gain as reported, plus $1,556,024 in net realized gain from Jennison Large Cap Equity pre-merger. |
At the close of business on April 27, 2012, the Portfolio, with aggregate Class A, Class B, and Class E net assets of $1,149,299,079, $534,466,997, and $10,788,869 respectively, acquired all of the assets and liabilities of Oppenheimer Capital Appreciation Portfolio of the Met Investors Series Trust (“Oppenheimer Capital Appreciation”). The acquisition was accomplished by a tax-free exchange of 30,745,873 Class A shares of the Portfolio (valued at $371,717,609) for 54,557,702 Class A shares of Oppenheimer Capital Appreciation; 27,950,699 Class B shares of the Portfolio (valued at $335,128,887) for 49,738,988 Class B shares of Oppenheimer Capital Appreciation; and 421,431 Class E shares of the Portfolio (valued at $5,078,240) for 747,503 Class E shares of Oppenheimer Capital Appreciation. The transaction was part of a restructuring designed to eliminate the offering of overlapping Portfolios in the MetLife, Inc. families of funds with similar investment objectives and similar investment strategies that serve as funding vehicles for insurance contracts that are offered by affiliates of MetLife. The reorganization was proposed because Oppenheimer Capital Appreciation had experienced a significant decline in assets, which, if it continued, would affect the Portfolio’s ability to maintain certain operational efficiencies.
Oppenheimer Capital Appreciation’s net assets on April 27, 2012, were $371,717,609, $335,128,887, and $5,078,240 for Class A, Class B, and Class E shares respectively, including investments valued at $711,572,341 with a cost basis of $616,828,807. For financial reporting purposes, assets received, liabilities assumed, and shares issued by the Portfolio were recorded at fair value; however, the cost basis of the Portfolio’s realized and unrealized gains and losses with amounts distributable to shareholders for tax purposes. The Portfolio acquired $130,875,591 in capital loss carry forwards from Oppenheimer Capital Appreciation.
MSF-18
Metropolitan Series Fund
Jennison Growth Portfolio
Notes to Financial Statements—December 31, 2013—(Continued)
The aggregate net assets of the Portfolio immediately after the acquisition were $2,406,479,681, which included $94,776,584 of acquired unrealized appreciation on investments and foreign currency transactions.
Assuming the acquisition had been completed on January 1, 2012, the Portfolio’s pro-forma results of operations for the period ended December 31, 2012 are as follows:
| | | | |
(Unaudited) | | | |
Net Investment income | | $ | 11,560,035 | (a) |
Net realized and unrealized gain on investments | | $ | 279,779,226 | (b) |
| | | | |
Net increase in net assets from operations | | $ | 291,339,261 | |
| | | | |
Because the combined investment portfolios have been managed as a single integrated portfolio since the acquisition was completed, it is not practicable to separate the amounts of revenue and earnings of Oppenheimer Capital Appreciation that have been included in the Portfolio’s Statement of Operations since April 27, 2012.
| (a) | $10,131,635 net investment income as reported plus $1,422,593 from Oppenheimer Capital Appreciation pre-merger net investment income, minus $13,146 in higher net advisory fees, plus $18,953 of pro-forma eliminated other expenses. |
| (b) | $427,188,280 unrealized appreciation as reported minus $323,897,070 pro-forma December 31, 2011 unrealized appreciation, plus $89,531,892 net realized gain as reported, plus $86,956,124 in net realized gain from Oppenheimer Capital Appreciation pre-merger. |
MSF-19
Metropolitan Series Fund
Jennison Growth Portfolio
Report of Independent Registered Public Accounting Firm
To the Shareholders of Jennison Growth Portfolio and the Board of Trustees of Metropolitan Series Fund:
We have audited the accompanying statement of assets and liabilities, including the schedule of investments, of Jennison Growth Portfolio, one of the portfolios constituting Metropolitan Series Fund, (the “Trust”) as of December 31, 2013, and the related statement of operations for the year then ended, the statements of changes in net assets for each of the two years in the period then ended, and the financial highlights for each of the five years in the period then ended. These financial statements and financial highlights are the responsibility of the Trust’s management. Our responsibility is to express an opinion on these financial statements and financial highlights based on our audits.
We conducted our audits in accordance with the standards of the Public Company Accounting Oversight Board (United States). Those standards require that we plan and perform the audit to obtain reasonable assurance about whether the financial statements and financial highlights are free of material misstatement. The Trust is not required to have, nor were we engaged to perform, an audit of its internal control over financial reporting. Our audits included consideration of internal control over financial reporting as a basis for designing audit procedures that are appropriate in the circumstances, but not for the purpose of expressing an opinion on the effectiveness of the Trust’s internal control over financial reporting. Accordingly, we express no such opinion. An audit also includes examining, on a test basis, evidence supporting the amounts and disclosures in the financial statements, assessing the accounting principles used and significant estimates made by management, as well as evaluating the overall financial statement presentation. Our procedures included confirmation of securities owned as of December 31, 2013, by correspondence with the custodian and brokers; where replies were not received from brokers, we performed other auditing procedures. We believe that our audits provide a reasonable basis for our opinion.
In our opinion, the financial statements and financial highlights referred to above present fairly, in all material respects, the financial position of the Jennison Growth Portfolio of Metropolitan Series Fund, as of December 31, 2013, the results of its operations for the year then ended, the changes in its net assets for each of the two years in the period then ended, and the financial highlights for each of the five years in the period then ended, in conformity with accounting principles generally accepted in the United States of America.
Deloitte & Touche LLP
Boston, Massachusetts
February 26, 2014
MSF-20
Metropolitan Series Fund
Trustees and Officers of Metropolitan Series Fund
The Trustees and executive officers of the Trust, their ages and their principal occupations during the past five years are set forth below. Unless otherwise indicated, the business address of each is One Financial Center, Boston, MA 02111. Each Trustee who is deemed an “interested person,” as such term is defined in the 1940 Act, is indicated by an asterisk. Those Trustees who are not “interested persons” as defined in the 1940 Act are referred to as “Independent Trustees.” Additional information about the Trustees is available in the Statement of Additional Information, which is available without charge, upon request, by calling (800) 848-3854.
Trustees of the Trust
| | | | | | | | | | |
Name and Age | | Position(s)
Held with
Registrant | | Term of Office
and Length of
Time Served | | Principal Occupation(s) During the Past 5
Years(1) | | Number of
Portfolios
in Fund
Complex(2)
overseen | | Other Directorships Held
by Trustee During the
Past 5 Years(1) |
| Interested Trustee | | | | | | | | | | |
| Elizabeth M. Forget* (47) | | Trustee, Chairman of the Board, President and Chief Executive Officer | | Indefinite;
From
May
2006
(President
and Chief
Executive
Officer)/
August
2006
(Trustee
and
Chairman
of the
Board) to
present | | Senior Vice President, MetLife Inc.; President, MetLife Advisers, LLC and a predecessor company. | | 79 | | Trustee, Met Investors Series Trust (the “MIST Trust”);** various MetLife-affiliated boards. |
| | | | | |
| Independent Trustees | | | | | | | | | | |
| Stephen M. Alderman (54) | | Trustee | | Indefinite;
From
April
2012 to
present | | Shareholder in the law firm of Garfield & Merel, Ltd. | | 79 | | Trustee, MIST Trust;** Director, International Truck Leasing Corp. |
| | | | | |
| Robert J. Boulware (57) | | Trustee | | Indefinite;
From
April
2012 to
present | | Managing Director, Pilgrim Funds, LLC (private equity fund). | | 79 | | Trustee, MIST Trust;** Trustee, Vertical Capital Income Fund (closed-end fund); Director, Gainsco, Inc. (auto insurance). |
| | | | | |
| Susan C. Gause (61) | | Trustee | | Indefinite;
From
April
2012 to
present | | Private Investor. | | 79 | | Trustee, MIST Trust;** Trustee, HSBC Funds. |
| | | | | |
| Nancy Hawthorne (62) | | Trustee | | Indefinite;
From
May
2003 to
present | | Chief Executive Officer, Clerestory LLC (corporate advisor). | | 79 | | MIST Trust;** Director, THL Credit, Inc.**; Director, Avid Technology, Inc.** |
| | | | | |
| Barbara A. Nugent (57) | | Trustee | | Indefinite;
From
January
2014 to
present | | President, True North Board Governance, LLC (consulting); until 2014, partner in the law firm of Stradley Ronon Stevens & Young, LLP. | | 79 | | Trustee, MIST Trust**; Director, Episcopal Healthcare Foundation; until 2014, member, Mutual Fund Directors Forum Advisory Board. |
MSF-21
Metropolitan Series Fund
Trustees and Officers of Metropolitan Series Fund—(Continued)
| | | | | | | | | | |
Name and Age | | Position(s)
Held with
Registrant | | Term of Office
and Length of
Time Served | | Principal Occupation(s) During the Past 5
Years(1) | | Number of
Portfolios
in Fund
Complex(2)
overseen | | Other Directorships Held
by Trustee During the
Past 5 Years(1) |
| Keith M. Schappert (62) | | Trustee | | Indefinite;
From
August
2009 to
present | | Principal, Schappert Consulting LLC (asset management consulting). | | 79 | | Trustee, MIST Trust;** Director, The Commonfund for Nonprofit Organizations; until 2011, Director, Trilogy Global Advisors; Director, Mirae Asset Discovery Funds,** Director, Calamos Investments. |
| | | | | |
| Linda B. Strumpf (66) | | Trustee | | Indefinite;
From
May
2000 to
present | | Chair of the Investment Committee, Leona M. and Harry B. Helmsley Charitable Trust; until 2011, Chief Investment Officer, Leona M. and Harry B. Helmsley Charitable Trust. | | 79 | | Since 2012, Trustee, MIST Trust,** Trustee and Member of Investment Committee, The Pennsylvania State University. |
| | | | | |
| Dawn M. Vroegop (47) | | Trustee | | Indefinite;
From
May
2009 to
present | | Private Investor. | | 79 | | Trustee, MIST Trust,** Trustee, Driehaus Mutual Funds; Director and Investment Committee Chair, City College of San Francisco Foundation. |
Executive Officers of the Trust
| | | | | | |
Name and Age | | Position(s) Held with
Registrant | | Term of Office
and Length of
Time Served | | Principal Occupation(s) During Past 5 Years(1) |
| Elizabeth M. Forget (47) | | President, Chief Executive Officer, Trustee and Chairman of the Board | | From May
2006 (President
and Chief
Executive
Officer)/
August 2006
(Trustee and
Chairman of
the Board) to
present | | See principal occupation information in the table above. |
| | | |
| Jeffrey L. Bernier (42) | | Vice President | | From February
2008 to present | | Vice President, MetLife, Inc.; Senior Vice President, MetLife Advisers, LLC and a predecessor company. |
| | | |
| Peter H. Duffy (58) | | Chief Financial Officer and Treasurer | | From November
2000 to present | | Senior Vice President, MetLife Advisers, LLC; Vice President, MetLife, Inc. |
| | | |
| Andrew L. Gangolf (59) | | Secretary | | From May
2011to present | | Senior Vice President, MetLife Advisers, LLC; Senior Vice President & Assistant General Counsel, AllianceBerstein Investments, Inc. |
| | | |
| Jeffrey P. Halperin (46) | | Chief Compliance Officer | | From November
2005 to present | | Vice President, MetLife, Inc.; Chief Compliance Officer, MIST; Chief Compliance Officer, MSF Trust; Chief Compliance Officer, MetLife Advisers, LLC and a predecessor company; Chief Compliance Officer, MetLife Investment Management, LLC (formerly MetLife Investment Advisors Company, LLC). |
| | | |
| Alan C. Leland, Jr. (61) | | Vice President | | From February
2005 to present | | Treasurer and Chief Financial Officer, MetLife Advisers, LLC; Vice President, MetLife Group Inc.; Vice President, MetLife, Inc. |
| * | Ms. Forget is an “interested person” of the Trust because of her positions with MetLife Advisers, LLC and her ownership of securities issued by MetLife, Inc., the ultimate parent company of MetLife Advisers, LLC. |
| ** | Indicates a directorship with a registered investment company or a company subject to the reporting requirements of the Securities Exchange Act of 1934, as amended. |
| (1) | Previous positions during the past five years with the Trust, MetLife, Inc. or the Adviser are omitted if not materially different. |
| (2) | The Fund Complex includes 49 Portfolios of the MIST Trust and 30 Portfolios of the Trust. |
MSF-22
Metropolitan Series Fund
Jennison Growth Portfolio
Board of Trustees’ Consideration of Advisory and Sub-Advisory Agreements
At an in-person meeting of the Boards of Trustees (the “Board”) of Met Investors Series Trust and Metropolitan Series Fund (“MIST” and “MSF,” respectively, and collectively, the “Trusts”) held on November 19-20, 2013, the Board, including a majority of the Trustees who are not considered to be “interested persons” of the Trusts (the “Independent Trustees”) under the Investment Company Act of 1940, as amended (the “1940 Act”), approved for an annual period the continuation of each Trust’s advisory agreement (the “Advisory Agreement”) with MetLife Advisers, LLC (the “Adviser”) and the applicable sub-advisory agreements (each a “Sub-Advisory Agreement,” and collectively with the Advisory Agreement, the “Agreements”) between the Adviser and the investment sub-advisers (each a “Sub-Adviser,” and collectively, the “Sub-Advisers”) for each of the series of the Trusts, including the Jennison Growth Portfolio (each a “Portfolio,” and collectively, the “Portfolios”).1
In considering the Agreements, the Board reviewed a variety of materials provided by the Adviser and the Sub-Advisers relating to the Portfolios, including comparative performance, fee and expense information for an appropriate peer group of similar mutual funds, performance information for relevant benchmark indices and other information regarding the nature, extent and quality of services provided by the Adviser and the Sub-Advisers under their respective Agreements. The Board also took into account its experience with the Adviser and the Sub-Advisers and information provided to the Board in its meetings throughout the year with respect to the services provided by the Adviser and the Sub-Advisers, including quarterly performance reports prepared by management containing reviews of investment results, and periodic presentations from certain of the Sub-Advisers with respect to the Portfolios they manage. The Independent Trustees also assessed reports provided by the Board’s independent consultant, who reviewed and provided analyses regarding investment performance, fees and expenses, and other information provided by, or at the direction of, the Adviser and the Sub-Advisers, as more fully discussed below.
The Independent Trustees were separately advised by independent legal counsel throughout the process, and met with independent legal counsel in periodic executive sessions. Prior to voting to continue the Agreements at the November meeting, the Independent Trustees also received a memorandum from their independent counsel discussing the legal standards for their consideration of the proposed continuation of the Agreements. The Board also met in person with personnel of the Adviser on September 17, 2013 for the specific purpose of giving preliminary consideration to the proposed continuation of the Agreements and to request additional information they considered reasonably necessary to their deliberations. The Independent Trustees also discussed the proposed continuation of the Agreements in private sessions with their independent legal counsel at which no representatives of management were present.
In considering whether to approve the renewal of the Advisory Agreement with the Adviser and any applicable Sub-Advisory Agreements with respect to a Portfolio, the Board reviewed and analyzed the factors it deemed relevant, including: (1) the nature, extent and quality of the services to be provided to the Portfolios by the Adviser and the Sub-Advisers; (2) the performance of the Portfolios as compared to a peer group and an appropriate index; (3) the Adviser’s and each of the Sub-Adviser’s personnel and operations; (4) the financial condition of the Adviser and of the Sub-Advisers; (5) the level and method of computing each Portfolio’s advisory and sub-advisory fees; (6) the profitability of the Adviser under the Advisory Agreement and of certain of the Sub-Advisers under the Sub-Advisory Agreements; (7) any “fall-out” benefits to the Adviser, the Sub-Advisers and their affiliates (i.e., ancillary benefits realized by the Adviser, the Sub-Advisers or their affiliates from the Adviser’s or Sub-Advisers’ relationship with the Trusts); (8) the anticipated effect of growth in size on Portfolio expenses; (9) fees paid to certain of the Sub-Advisers by comparable institutional and retail accounts; and (10) possible conflicts of interest.
Nature, extent and quality of services. The Board evaluated the nature, extent and quality of the services that the Adviser, and the Sub-Advisers as relevant, have provided to the Portfolios. The Board considered the Adviser’s services as investment manager to the Portfolios, including services relating to the selection and oversight of the Sub-Advisers for the applicable Portfolios. The Board considered, among other things, the Adviser’s oversight of the provision of services to the Portfolios by the Sub-Advisers, including with respect to investment activities and trading practices, and the Sub-Adviser’s compliance with fund policies, objectives and Board directives, compliance policies and procedures and applicable law. The Adviser’s services in coordinating and overseeing the activities of the Trusts’ other service providers were also considered. The Board also evaluated the expertise and performance of the personnel of the Adviser who performed services for the Portfolios throughout the year.
The Board considered information received from the Trust’s Chief Compliance Officer (“CCO”) regarding the Portfolios’ compliance policies and procedures established pursuant to Rule 38a-l under the 1940 Act. The Board also evaluated the CCO’s ongoing reports concerning the CCO’s oversight of the risk assessment processes of the Sub-Advisers.
1 The Pyramis Managed Risk Portfolio recently commenced operations and, therefore, the Agreement with respect to this Portfolio was not up for renewal.
MSF-23
Metropolitan Series Fund
Jennison Growth Portfolio
Board of Trustees’ Consideration of Advisory and Sub-Advisory Agreements—(Continued)
With respect to the services provided by each of the Sub-Advisers, the Board considered, among other things, information provided to the Board by each Sub-Adviser. The Board considered the Sub-Adviser’s current level of staffing and its overall resources, as well as its compensation program. The Board reviewed each Sub-Adviser’s history and investment experience, as well as information regarding the qualifications, background and responsibilities of the Sub-Adviser’s investment and compliance personnel who provide services to the Portfolios. The Board also considered, among other things, the Sub-Adviser’s compliance program and any disciplinary history. The Board also took into account the Sub-Adviser’s risk assessment and monitoring process. The Board noted each Sub-Adviser’s regulatory history, including whether it was currently involved in any regulatory actions or investigations as well as material litigation, and any settlements and amelioratory actions undertaken, as appropriate. The Board also noted that the CCO and his staff conduct regular, periodic compliance reviews with each of the Sub-Advisers and present reports to the Independent Trustees regarding the same, which includes evaluating the regulatory compliance systems of the Sub-Advisers and procedures reasonably designed by them to help assure compliance with the federal securities laws, including issues related to late trading and market timing, best execution, fair value pricing, and proxy voting procedures, among others. The Board also took into account the financial condition of each Sub-Adviser. In its review, the Board also received and took into account information regarding any services and/or payments provided to the Adviser by the Sub-Advisers in connection with marketing activities.
The Board considered each Sub-Adviser’s investment process and philosophy. The Board took into account that each Sub-Adviser’s responsibilities include the development and maintenance of an investment program for the applicable Portfolio which is consistent with the Portfolio’s investment objectives, the selection of investment securities and the placement of orders for the purchase and sale of such securities, as well as the implementation of compliance controls related to performance of these services. The Board also reviewed each Sub-Adviser’s brokerage policies and practices.
Performance. The Board considered the performance of the Portfolios as described in the quarterly reports prepared by management, and as also analyzed in reports prepared by the Independent Trustees’ independent consultant. The Board noted that the Adviser reviews with the Board on a quarterly basis detailed information about the Portfolios’ performance results, portfolio composition and investment strategies. The Board also reviewed and considered a separate report prepared by Lipper Inc. (“Lipper”), an independent third party, which provided a statistical analysis comparing the Portfolios’ investment performance, expenses, and fees to comparable funds underlying variable insurance products (the “Performance Universe”). In addition, the Independent Trustees met separately with a representative of Bobroff Consulting, Inc., an independent consultant (“Bobroff), at a special board meeting in September 2013, to review the separate reports prepared by such consultant (“Bobroff Report”), which analyzed the report prepared by Lipper. The Board also considered each Portfolio’s more recent performance subsequent to the performance period covered by the Lipper reports, and management’s discussion of the same, including the effect of current market conditions on each Portfolio’s more recent performance.
The Board reviewed the Portfolios’ performance records and the Adviser’s and Sub-Advisers’ management styles and long-term performance records with the Portfolios and comparable funds. The Board focused particular attention on Portfolios with less favorable performance records. The Board was mindful of the Adviser’s focus on each Sub-Adviser’s performance and noted that the Adviser has been active in monitoring and responding to any performance issues with respect to the Portfolios. The Board also took into account its discussions with management regarding factors that contributed to the performance of the Portfolios.
Among other data relating specifically to the Jennison Growth Portfolio’s performance, the Board considered that the Portfolio underperformed the median of its Performance Universe and its Lipper Index for the one- and three-year periods ended June 30, 2013, and outperformed the median of its Performance Universe and its Lipper Index for the five-year period ended June 30, 2013. The Board further considered that the Portfolio outperformed its benchmark, the Russell 1000 Growth Index, for the one-year period ended October 31, 2013 and underperformed its benchmark for the three- and five-year periods ended October 31, 2013. The Board took into account management’s discussion of the Portfolio’s performance, including the impact of recent market conditions on the Sub-Adviser’s investment style.
Fees and Expenses. The Board gave consideration to the advisory fees payable under the Advisory Agreement and the sub-advisory fees payable under each of the Sub-Advisory Agreements. In this regard, the Board reviewed the advisory fees payable on a Portfolio-by-Portfolio basis based on information provided by the Adviser. The Independent Trustees, with the assistance of Bobroff, also examined the fees paid by a Portfolio in light of fees paid to other investment managers by comparable funds, as well as considered the fees charged by the Adviser to manage other comparable funds, as applicable. The Lipper report included comparisons of the Adviser’s fee schedule with that of its peers based on an asset-based analysis of relative fee structures according to the size of the Portfolio. In addition, the Board considered the Portfolios’ advisory and sub-advisory fees and total expenses as compared to similarly situated investment companies underlying variable insurance products deemed to be comparable to the Portfolios as determined by Lipper.
MSF-24
Metropolitan Series Fund
Jennison Growth Portfolio
Board of Trustees’ Consideration of Advisory and Sub-Advisory Agreements—(Continued)
The Board considered a Portfolio’s ranking within a smaller group of peer funds chosen by Lipper (the “Expense Group”), as well as the Portfolio’s ranking within broader groups of funds (the “Expense Universe” and the “Sub-advised Expense Universe”). The Board also considered a Portfolio’s contractual sub-advisory fees, as applicable, as compared to the Sub-advised Expense Universe as well as a smaller group of funds (the “Sub-advised Expense Group”). In comparing a Portfolio’s actual and contractual management fee to that of comparable funds, the Board noted that such fee includes both advisory and administrative fees.
The Board noted that the sub-advisory fees for the Portfolios are paid by the Adviser, not the Portfolios, out of the advisory fee. It was further noted that the Adviser negotiates such fees at arm’s length. The Board also considered that the Adviser had entered into expense limitation agreements with certain of the Portfolios, pursuant to which the Adviser has agreed to waive a portion of its advisory fee and/or reimburse certain expenses as a means of limiting a Portfolio’s total annual operating expenses. The Board further considered the amount of sub-advisory fees paid out by the Adviser and the amount of the management fees that it retained in light of the services performed by Sub-Advisers and Adviser, respectively.
With respect to the Jennison Growth Portfolio, the Board considered that the Portfolio’s actual management fees and total expenses (exclusive of 12b-l fees) were below the Expense Group median, the Expense Universe median and the Sub-advised Expense Universe median. The Board further noted that the Portfolio’s contractual management fees were below the asset-weighted average of the Expense Group at the Portfolio’s current size. The Board took into account that the Portfolio’s contractual sub-advisory fees were below the average of the Sub-advised Expense Group and the Sub-advised Expense Universe at the Portfolio’s current size. The Board also noted that the Adviser had waived fees and/or reimbursed expenses during the past year.
Profitability. The Board examined the profitability of the Adviser on a Portfolio-by-Portfolio basis. The Board also considered that the Distributor, MetLife Investors Distribution Company, receives Rule 12b-1 payments to support the distribution of the products. The Board considered the profitability to the Sub-Advisers and their affiliates as a result of their relationships with the Portfolios, and the Board considered the ability of the Adviser to negotiate the Sub-Advisory Agreements and the fees thereunder at arm’s length. The Board also reviewed Portfolio specific data with regard to the profitability of the Portfolios to each Sub-Adviser, as available.
Economies of scale. The Board also considered the effect of the Portfolios’ growth in size on their fees. The Board noted that the fee schedules for most of the Portfolios contain breakpoints that reduce the fee rate above specified asset levels. The Board noted those Portfolios that did not contain breakpoints in the advisory fee and took into account management’s discussion of the same. The Board noted that those Portfolios with advisory fee schedules containing breakpoints generally reflect the inclusion of breakpoints in the sub-advisory fee schedule for such Portfolios. The Board considered the effective fees under the Advisory Agreement for a Portfolio as a percentage of assets at different asset levels and possible economies of scale that may be realized if the assets of the Portfolio grow. Among other data, the Board examined the effect of a Portfolio’s growth in size on various fee schedules and reviewed the Lipper and Bobroff Reports, which compared fees among peers. The Board also generally noted that if a Portfolio’s assets increase over time, the Portfolio may realize other economies of scale if assets increase proportionally more than certain other fixed expenses. In addition, the Board noted that the Adviser had taken a number of steps to date intended to share the benefits of economies of scale with contractholders.
With respect to the Jennison Growth Portfolio, the Board noted that the Portfolio’s advisory fee and sub-advisory fee schedule each contains breakpoints that reduce the advisory fee rate on assets above certain specified asset levels. The Board considered the fact that the Portfolio’s fee levels decline as portfolio assets increase.
Other factors. As part of its evaluation of the Adviser’s compensation, the Board considered other benefits that may be realized by the Adviser and its affiliates from their relationship with the Trusts. Among them, the Board recognized that an affiliate of the Adviser, MetLife Investors Distribution Company, serves as the Distributor for the Trusts, and, as such, receives payments pursuant to Rule 12b-1 from the Portfolios to compensate it for providing shareholder services and selling activities, which could lead to growth in the Trusts’ assets and corresponding benefits from such growth, including economies of scale. The Board also considered that affiliates of the Adviser may benefit from certain indirect tax benefits relating to dividend received deductions and foreign tax credits. In conjunction with these considerations, the Board noted the costs of providing investment management and other services to the Portfolios and the ongoing commitment of the Adviser to the Portfolios.
The Board considered other benefits that may be realized by each Sub-Adviser and its affiliates from their relationship with the Trusts, including the opportunity to provide advisory services to additional portfolios of the Trusts and reputational benefits. In conjunction with these considerations, the Board noted the costs of providing investment advisory services to the Portfolios and the ongoing commitment of the Sub-Advisers to the Portfolios.
MSF-25
Metropolitan Series Fund
Jennison Growth Portfolio
Board of Trustees’ Consideration of Advisory and Sub-Advisory Agreements—(Continued)
The Board considered possible conflicts of interest in the form of material benefits or detriments to the Trusts resulting from the nature of the Trusts’ and the Adviser’s or the Sub-Advisers’ affiliations and the services that are provided to the Trusts, and the manner in which such conflicts were mitigated.
Conclusions. After full consideration of the factors discussed above, the Board, including a majority of the Independent Trustees, approved the Advisory Agreement and the Sub-Advisory Agreement, as applicable, with respect to each Portfolio, unless otherwise noted. In making its approvals, the Board concluded that the nature, extent and quality of services provided by the Adviser and each Sub-Adviser supported the renewal of the Agreements. The Board also concluded that the investment performance of each Fund was such that each Agreement should continue. In addition, the Board concluded that fees paid by a Portfolio to the Adviser and, if applicable, the Sub-Adviser appeared to be acceptable in light of nature, extent and quality of the services provided by the Adviser and Sub-Adviser. Further, the Board concluded that the Adviser’s profitability in providing services under the Advisory Agreements did not appear unreasonably high in light of the nature, extent and quality of the services provided by the Adviser. Finally, the Board concluded that the Advisory and Sub-Advisory fees in some measure share economies of scale with contractholders. In approving the renewal of each of the Agreements, the Board, including the Independent Trustees, did not identify any single factor as controlling, and generally attributed different weights to various factors for the various Portfolios. The Board evaluated all information available to them on a Portfolio-by-Portfolio basis, and their decisions were made separately with respect to each Portfolio.
MSF-26
Metropolitan Series Fund
Loomis Sayles Small Cap Core Portfolio
Managed by Loomis, Sayles & Company, L.P.
Portfolio Manager Commentary*
PERFORMANCE
For the one year period ended December 31, 2013, the Class A, B, and E shares of the Loomis Sayles Small Cap Core Portfolio returned 41.04%, 40.68%, and 40.83%, respectively. The Portfolio’s benchmark, the Russell 2000 Index1, returned 38.82%.
MARKET ENVIRONMENT / CONDITIONS
Capping out one of the best years on record, stocks closed 2013 with strong, broadly distributed gains that cut across investment styles, market cap ranges and a majority of economic sectors. Market returns were driven by higher valuations and the continued flow of funds out of fixed income investments and into stocks. Investor sentiment and optimism toward equities was supported by the assumption the U.S. economy was transitioning from an extended recovery stage following the financial crisis, to an expansionary stage. Monetary conditions remained accommodative, and investors were satisfied with the data dependent and measured pace the Federal Reserve is maintaining with plans to withdraw monetary stimulus. For the calendar year, small cap stocks outperformed large cap stocks and value stocks dramatically underperformed growth stocks with the Small Cap Russell 2000 Index posting its ninth best return since 1950.
PORTFOLIO REVIEW / PERIOD END POSITIONING
The Portfolio out performed its benchmark, the Russell 2000 Index over the last twelve months due to strong stock selection with overall sector allocation a slight positive. Relative to the benchmark, the Industrials sector had the greatest impact to the Portfolio, followed by the Energy and Financials sectors. Strong stock selection was evident in all three sectors.
MarketAxess Holdings, Inc., WageWorks, Inc. and Financial Engines, Inc. were the largest contributors to the Portfolio’s outperformance. MarketAxess Holdings, a provider of electronic trading platforms for U.S. and international corporate bonds, outperformed due to higher trading volumes associated with rising long-term interest rates. In addition, the company’s strategic alliance with Blackrock, an acquisition in Europe, and opportunities in the high yield, emerging markets, and credit default swap businesses all improved the outlook and supported a higher valuation. WageWorks is a leading on-demand provider of tax-advantaged programs for consumer-directed health, commuter and other employee spending account benefits in the U.S. WageWorks continued to execute strategic acquisitions that further augmented growth. The stock has also been helped as the Affordable Care Act has increased the role of consumer- and employee-driven benefits. Long-time holding Financial Engines, Inc., a provider of investment advice to 401(k) plan participants, rose over 150% in 2013. The company reported a strong third quarter with robust adoption rates and a positive outlook for the remainder of the year, which pushed its share price higher.
DFC Global Group, Titan Machinery, Inc., and American Campus Communities all detracted from the Portfolio’s performance. DFC Global offers financial services such as consumer loans, secured pawn loans and check cashing services, as well as, buying gold. DFC Global underperformed as they lowered guidance due to United Kingdom regulatory actions in the payday industry, which remain unresolved. In addition, the lower price of gold has an impact on the pawn business. While the Portfolio continues to own the shares, the position has been reduced. Titan Machinery is a full-service specialty retailer of new and used agricultural and construction equipment and related products and services. The shares were eliminated as the agriculture environment remained challenging due to dry conditions and high temperatures in the farm land, while the construction segment was impacted by a weak economic recovery. American Campus Communities owns and operates on- and off-campus housing within close proximity to colleges and universities. The stock declined on concerns over rising interest rates and slowing rent growth due to aggressive leasing by under-occupied competitors. The Portfolio reduced the position during 2013.
Some additions to the Portfolio during the period included Insperity, Inc., Masonite International Corp., and Retail Opportunity Investments Corp. Insperity, Inc. is a Professional Employer Organization (PEO), providing human resources services such as payroll, employment administration, employee benefits, workers compensation, government compliance, performance management, and training & development services to small- and medium-sized businesses. With small- and medium-sized businesses facing significant changes in regulation and increases in health care costs, the value proposition of a PEO is set to increase in 2014. Masonite International Corp. is a leading manufacturer of interior doors for residential new construction, repair, renovation and remodeling markets. The company emerged from bankruptcy in 2009, and has since pursued a strategy of consolidating a previously fragmented market. With a stronger market share and a rationalized cost base, operating leverage should be favorably driven by improved volumes and better pricing. Retail Opportunity Investments Corp. is a real estate investment trust (REIT) that manages a Portfolio of 51 assets–all shopping or grocery store anchored–on the West Coast, primarily in California. The strategy is to acquire properties, including off-market properties selling at attractive prices, in addition to well located but undermanaged properties that require redevelopment or re-tenanting or other management.
The Portfolio also eliminated some securities on diminished fundamental prospects. Positions in some holdings were reduced on price appreciation following acquisition announcements or on price strength. While we do not make major adjustments to the Portfolio based on near-term macroeconomic expectations, they are part of the mosaic of inputs and we can adjust position sizes to reflect our fundamental level of conviction and the risk/reward outlook.
MSF-1
Metropolitan Series Fund
Loomis Sayles Small Cap Core Portfolio
Managed by Loomis, Sayles & Company, L.P.
Portfolio Manager Commentary*—(Continued)
As a result of the individual stock decisions we made, the weight in the Financials sector increased about 2.3% while the Information Technology sector declined about 1.5% and the Materials sector declined by about 1.1%. All other sectors weightings remained relatively unchanged.
Our equity management philosophy is built around what we view as our greatest strength: selecting attractive companies through rigorous, fundamental, bottom-up analysis. Our philosophy is rooted in the belief that strong fundamental research conducted by a team of dedicated investment professionals is key to positive stock selection. The style emphasizes security selection as opposed to sector rotation or market timing and seeks to invest in small sized companies, which we believe are attractively valued and have prospects for sustainable growth and profitability.
Mark Burns
John Slavik
Joe Gatz
Jeff Schwartz
Portfolio Managers
Loomis, Sayles & Company, L.P.
* This commentary may include statements that constitute “forward-looking statements” under the U.S. securities laws. Forward-looking statements include, among other things, projections, estimates, and information about possible or future results related to the Portfolio, market or regulatory developments. The views expressed above are not guarantees of future performance or economic results and involve certain risks, uncertainties and assumptions that could cause actual outcomes and results to differ materially from the views expressed herein. The views expressed above are subject to change at any time based upon economic, market, or other conditions and the subadvisory firm undertakes no obligation to update the views expressed herein. Any discussions of specific securities should not be considered a recommendation to buy or sell those securities. The views expressed above (including any forward-looking statement) may not be relied upon as investment advice or as an indication of the Portfolio’s trading intent. Information about the Portfolio’s holdings, asset allocation or country diversification is historical and is not an indication of future Portfolio composition, which may vary. Direct investment in any index is not possible. The performance of any index mentioned in this commentary has not been adjusted for ongoing management, distribution and operating expenses, and sales charges applicable to mutual fund investments. In addition, the returns do not reflect additional fees charged by separate accounts or variable insurance contracts that an investor in the Portfolio may pay. If these additional fees were reflected, performance would have been lower.
MSF-2
Metropolitan Series Fund
Loomis Sayles Small Cap Core Portfolio
A $10,000 INVESTMENT COMPARED TO THE RUSSELL 2000 INDEX

AVERAGE ANNUAL RETURNS (%) (FOR THE YEAR ENDED DECEMBER 31, 2013)
| | | | | | | | | | | | |
| | | 1 Year | | | 5 Year | | | 10 Year | |
| Loomis Sayles Small Cap Core Portfolio | | | | | | | | | | | | |
Class A | | | 41.04 | | | | 21.97 | | | | 10.89 | |
Class B | | | 40.68 | | | | 21.67 | | | | 10.63 | |
Class E | | | 40.83 | | | | 21.79 | | | | 10.73 | |
| Russell 2000 Index | | | 38.82 | | | | 20.08 | | | | 9.07 | |
1 The Russell 2000 Index is an unmanaged measure of performance of the 2,000 smallest companies in the Russell 3000® Index.
Portfolio performance is calculated including reinvestment of all income and capital gain distributions. Performance numbers are net of all Portfolio expenses but do not include any insurance, sales, separate account or administrative charges of variable annuity or life insurance contracts or any additional expenses that participants may bear relating to the operations of their plans. If these charges were included, the returns would be lower. The performance of any index referenced above has not been adjusted for ongoing management, distribution and operating expenses, and sales charges applicable to mutual fund investments. Direct investment in any index is not possible. The performance of Class A shares, as set forth in the line graph above, will differ from that of other classes because of the difference in expenses paid by policyholders investing in the different share classes.
This information represents past performance and is not indicative of future results. Investment return and principal value may fluctuate so that shares, upon redemption, may be worth more or less than the original cost.
PORTFOLIO COMPOSITION AS OF DECEMBER 31, 2013
Top Holdings
| | | | |
| | |
% of
Net Assets | |
RBC Bearings, Inc. | | | 1.0 | |
Helix Energy Solutions Group, Inc. | | | 0.9 | |
MarketAxess Holdings, Inc. | | | 0.9 | |
Genesee & Wyoming, Inc. - Class A | | | 0.8 | |
Jarden Corp. | | | 0.7 | |
Cathay General Bancorp | | | 0.7 | |
Euronet Worldwide, Inc. | | | 0.7 | |
Dealertrack Technologies, Inc. | | | 0.7 | |
Semtech Corp. | | | 0.7 | |
Littelfuse, Inc. | | | 0.7 | |
Top Sectors
| | | | |
| | | % of
Market Value of
Total Long-Term Investments | |
Industrials | | | 21.6 | |
Financials | | | 20.8 | |
Information Technology | | | 18.0 | |
Consumer Discretionary | | | 16.7 | |
Health Care | | | 9.9 | |
Energy | | | 4.9 | |
Materials | | | 3.8 | |
Utilities | | | 2.1 | |
Consumer Staples | | | 1.9 | |
| Telecommunication Services | | | 0.3 | |
MSF-3
Metropolitan Series Fund
Loomis Sayles Small Cap Core Portfolio
Understanding Your Portfolio’s Expenses
Shareholder Expense Example
As a shareholder of the Portfolio, you incur ongoing costs, including management fees; distribution and service (12b-1) fees; and other Portfolio expenses. This example is intended to help you understand your ongoing costs (in dollars) (referred to as “expenses”) of investing in the Portfolio and compare these costs with the ongoing costs of investing in other mutual funds. The example is based on an investment of $1,000 invested at the beginning of the period and held for the entire period, July 1, 2013 through December 31, 2013.
Actual Expenses
The first line for each share class of the Portfolio in the table below provides information about actual account values and actual expenses. You may use the information in this line, together with the amount you invested in the particular share class of the Portfolio, to estimate the expenses that you paid over the period. Simply divide your account value by $1,000 (for example, an $8,600 account value divided by $1,000 = 8.6), then multiply the result by the number in the first line under the heading entitled “Expenses Paid During Period” to estimate the expenses you paid on your account during this period.
Hypothetical Example for Comparison Purposes
The second line for each share class of the Portfolio in the table below provides information about hypothetical account values and hypothetical expenses based on the Portfolio’s actual expense ratio and an assumed rate of return of 5% per year before expenses, which is not the Portfolio’s actual return. The hypothetical account values and expenses may not be used to estimate the actual ending account balance or expenses you paid for the period. You may use this information to compare the ongoing costs of investing in the Portfolio and other funds. To do so, compare this 5% hypothetical example with the 5% hypothetical examples that appear in the shareholder reports of the other funds.
Please note that the expenses shown in the table are meant to highlight your ongoing costs only and do not reflect any fees or charges of your variable insurance product or any additional expenses that participants in certain eligible qualified plans may bear relating to the operations of their plan. Therefore, the second line for each share class in the table is useful in comparing ongoing costs only, and will not help you determine the relative total costs of owning different funds. In addition, if these other costs were included, your costs would have been higher.
| | | | | | | | | | | | | | | | | | |
Loomis Sayles Small Cap Core Portfolio | | | | Annualized
Expense
Ratio | | | Beginning
Account Value
July 1,
2013 | | | Ending
Account Value
December 31,
2013 | | | Expenses Paid
During Period**
July 1, 2013
to
December 31,
2013 | |
Class A(a) | | Actual | | | 0.87 | % | | $ | 1,000.00 | | | $ | 1,195.70 | | | $ | 4.81 | |
| | Hypothetical* | | | 0.87 | % | | $ | 1,000.00 | | | $ | 1,020.82 | | | $ | 4.43 | |
| | | | | |
Class B(a) | | Actual | | | 1.12 | % | | $ | 1,000.00 | | | $ | 1,194.20 | | | $ | 6.19 | |
| | Hypothetical* | | | 1.12 | % | | $ | 1,000.00 | | | $ | 1,019.56 | | | $ | 5.70 | |
| | | | | |
Class E(a) | | Actual | | | 1.02 | % | | $ | 1,000.00 | | | $ | 1,194.80 | | | $ | 5.64 | |
| | Hypothetical* | | | 1.02 | % | | $ | 1,000.00 | | | $ | 1,020.06 | | | $ | 5.19 | |
* Hypothetical assumes a rate of return of 5% per year before expenses.
** Expenses paid are equal to the Portfolio’s annualized expense ratio for the most recent six month period, as shown above, multiplied by the average account value over the period, multiplied by the number of days (184 days) in the most recent fiscal half-year, divided by 365 (to reflect the one-half year period).
(a) The annualized expense ratio shown reflects the impact of the management fee waiver as described in Note 5 of the Notes to Financial Statements.
MSF-4
Metropolitan Series Fund
Loomis Sayles Small Cap Core Portfolio
Schedule of Investments as of December 31, 2013
Common Stocks—98.9% of Net Assets
| | | | | | | | |
| Security Description | | Shares | | | Value | |
|
Aerospace & Defense—0.5% | |
Hexcel Corp. (a) | | | 56,890 | | | $ | 2,542,414 | |
| | | | | | | | |
|
Air Freight & Logistics—0.4% | |
XPO Logistics, Inc. (a) (b) | | | 86,188 | | | | 2,265,883 | |
| | | | | | | | |
|
Airlines—0.5% | |
Spirit Airlines, Inc. (a) | | | 55,272 | | | | 2,509,902 | |
| | | | | | | | |
|
Auto Components—1.7% | |
Dana Holding Corp. | | | 94,923 | | | | 1,862,389 | |
Dorman Products, Inc. (a) (b) | | | 40,935 | | | | 2,295,226 | |
Drew Industries, Inc. | | | 34,185 | | | | 1,750,272 | |
Remy International, Inc. | | | 48,785 | | | | 1,137,666 | |
Tenneco, Inc. (a) | | | 29,634 | | | | 1,676,395 | |
| | | | | | | | |
| | | | | | | 8,721,948 | |
| | | | | | | | |
|
Biotechnology—1.9% | |
Alkermes plc (a) | | | 49,983 | | | | 2,032,309 | |
Cubist Pharmaceuticals, Inc. (a) (b) | | | 22,256 | | | | 1,532,771 | |
Emergent Biosolutions, Inc. (a) | | | 74,982 | | | | 1,723,836 | |
Exact Sciences Corp. (a) (b) | | | 115,572 | | | | 1,351,037 | |
InterMune, Inc. (a) (b) | | | 90,483 | | | | 1,332,814 | |
NPS Pharmaceuticals, Inc. (a) | | | 56,413 | | | | 1,712,699 | |
| | | | | | | | |
| | | | | | | 9,685,466 | |
| | | | | | | | |
|
Building Products—1.1% | |
Apogee Enterprises, Inc. | | | 49,580 | | | | 1,780,418 | |
Armstrong World Industries, Inc. (a) | | | 36,335 | | | | 2,093,259 | |
Masonite International Corp. (a) (b) | | | 27,473 | | | | 1,648,380 | |
| | | | | | | | |
| | | | | | | 5,522,057 | |
| | | | | | | | |
|
Capital Markets—2.7% | |
Ares Capital Corp. | | | 113,498 | | | | 2,016,860 | |
Artisan Partners Asset Management, Inc. - Class A | | | 36,878 | | | | 2,404,077 | |
Fifth Street Finance Corp. | | | 161,981 | | | | 1,498,324 | |
Financial Engines, Inc. | | | 30,217 | | | | 2,099,477 | |
Hercules Technology Growth Capital, Inc. (b) | | | 86,461 | | | | 1,417,960 | |
Safeguard Scientifics, Inc. (a) (b) | | | 76,218 | | | | 1,531,220 | |
Stifel Financial Corp. (a) | | | 57,595 | | | | 2,759,952 | |
| | | | | | | | |
| | | | | | | 13,727,870 | |
| | | | | | | | |
|
Chemicals—2.0% | |
Cabot Corp. | | | 57,263 | | | | 2,943,318 | |
Flotek Industries, Inc. (a) (b) | | | 79,800 | | | | 1,601,586 | |
Minerals Technologies, Inc. | | | 16,874 | | | | 1,013,621 | |
Olin Corp. (b) | | | 27,839 | | | | 803,155 | |
Tronox, Ltd. - Class A | | | 79,193 | | | | 1,826,983 | |
WR Grace & Co. (a) | | | 13,728 | | | | 1,357,288 | |
Zep, Inc. | | | 31,302 | | | | 568,444 | |
| | | | | | | | |
| | | | | | | 10,114,395 | |
| | | | | | | | |
|
Commercial Banks—8.7% | |
BancorpSouth, Inc. (b) | | | 127,001 | | | | 3,228,365 | |
Bank of the Ozarks, Inc. (b) | | | 39,909 | | | | 2,258,450 | |
Boston Private Financial Holdings, Inc. | | | 120,809 | | | | 1,524,610 | |
|
Commercial Banks—(Continued) | |
Cathay General Bancorp | | | 135,566 | | | $ | 3,623,679 | |
City National Corp. | | | 36,994 | | | | 2,930,665 | |
CVB Financial Corp. (b) | | | 114,593 | | | | 1,956,103 | |
First Financial Bancorp | | | 114,736 | | | | 1,999,849 | |
First Financial Bankshares, Inc. (b) | | | 28,306 | | | | 1,877,254 | |
Iberiabank Corp. | | | 38,629 | | | | 2,427,833 | |
PacWest Bancorp (b) | | | 74,074 | | | | 3,127,404 | |
Pinnacle Financial Partners, Inc. | | | 60,554 | | | | 1,969,822 | |
Popular, Inc. (a) | | | 55,215 | | | | 1,586,327 | |
PrivateBancorp, Inc. | | | 52,236 | | | | 1,511,187 | |
Prosperity Bancshares, Inc. (b) | | | 44,806 | | | | 2,840,252 | |
Signature Bank (a) | | | 29,853 | | | | 3,206,809 | |
SVB Financial Group (a) | | | 19,752 | | | | 2,071,195 | |
Texas Capital Bancshares, Inc. (a) | | | 39,235 | | | | 2,440,417 | |
Tristate Capital Holdings, Inc. (a) (b) | | | 101,863 | | | | 1,208,095 | |
Wintrust Financial Corp. (b) | | | 64,603 | | | | 2,979,490 | |
| | | | | | | | |
| | | | | | | 44,767,806 | |
| | | | | | | | |
|
Commercial Services & Supplies—3.4% | |
ACCO Brands Corp. (a) (b) | | | 163,879 | | | | 1,101,267 | |
Interface, Inc. | | | 96,531 | | | | 2,119,821 | |
KAR Auction Services, Inc. | | | 99,809 | | | | 2,949,356 | |
Knoll, Inc. | | | 101,308 | | | | 1,854,949 | |
McGrath RentCorp | | | 35,716 | | | | 1,421,497 | |
Performant Financial Corp. (a) | | | 58,519 | | | | 602,746 | |
Rollins, Inc. | | | 69,966 | | | | 2,119,270 | |
Viad Corp. | | | 52,318 | | | | 1,453,394 | |
Waste Connections, Inc. (b) | | | 44,866 | | | | 1,957,504 | |
West Corp. (b) | | | 67,685 | | | | 1,740,181 | |
| | | | | | | | |
| | | | | | | 17,319,985 | |
| | | | | | | | |
|
Communications Equipment—0.6% | |
Ciena Corp. (a) (b) | | | 80,289 | | | | 1,921,316 | |
Harmonic, Inc. (a) | | | 78,908 | | | | 582,341 | |
NETGEAR, Inc. (a) (b) | | | 24,685 | | | | 813,124 | |
| | | | | | | | |
| | | | | | | 3,316,781 | |
| | | | | | | | |
|
Computers & Peripherals—0.3% | |
QLogic Corp. (a) | | | 128,975 | | | | 1,525,774 | |
| | | | | | | | |
|
Construction & Engineering—1.1% | |
MasTec, Inc. (a) (b) | | | 52,286 | | | | 1,710,798 | |
MYR Group, Inc. (a) | | | 62,597 | | | | 1,569,933 | |
Primoris Services Corp. | | | 81,283 | | | | 2,530,340 | |
| | | | | | | | |
| | | | | | | 5,811,071 | |
| | | | | | | | |
|
Consumer Finance—0.9% | |
Credit Acceptance Corp. (a) | | | 10,851 | | | | 1,410,522 | |
DFC Global Corp. (a) | | | 70,861 | | | | 811,358 | |
Encore Capital Group, Inc. (a) (b) | | | 43,354 | | | | 2,178,972 | |
| | | | | | | | |
| | | | | | | 4,400,852 | |
| | | | | | | | |
|
Distributors—0.7% | |
Core-Mark Holding Co., Inc. | | | 21,478 | | | | 1,630,825 | |
See accompanying notes to financial statements.
MSF-5
Metropolitan Series Fund
Loomis Sayles Small Cap Core Portfolio
Schedule of Investments as of December 31, 2013
Common Stocks—(Continued)
| | | | | | | | |
| Security Description | | Shares | | | Value | |
|
Distributors—(Continued) | |
Pool Corp. | | | 36,325 | | | $ | 2,111,935 | |
| | | | | | | | |
| | | | | | | 3,742,760 | |
| | | | | | | | |
|
Diversified Consumer Services—1.4% | |
Bright Horizons Family Solutions, Inc. (a) | | | 49,681 | | | | 1,825,280 | |
Grand Canyon Education, Inc. (a) | | | 75,160 | | | | 3,276,976 | |
LifeLock, Inc. (a) (b) | | | 142,607 | | | | 2,340,181 | |
| | | | | | | | |
| | | | | | | 7,442,437 | |
| | | | | | | | |
|
Diversified Financial Services—0.9% | |
MarketAxess Holdings, Inc. | | | 68,718 | | | | 4,595,173 | |
| | | | | | | | |
|
Diversified Telecommunication Services—0.3% | |
8x8, Inc. (a) | | | 152,852 | | | | 1,552,976 | |
| | | | | | | | |
|
Electric Utilities—1.5% | |
ALLETE, Inc. | | | 66,280 | | | | 3,306,046 | |
ITC Holdings Corp. (b) | | | 14,935 | | | | 1,431,072 | |
UIL Holdings Corp. (b) | | | 78,533 | | | | 3,043,154 | |
| | | | | | | | |
| | | | | | | 7,780,272 | |
| | | | | | | | |
|
Electrical Equipment—2.0% | |
AZZ, Inc. | | | 59,955 | | | | 2,929,401 | |
EnerSys, Inc. (b) | | | 35,811 | | | | 2,509,993 | |
General Cable Corp. (b) | | | 39,621 | | | | 1,165,254 | |
Global Power Equipment Group, Inc. | | | 35,735 | | | | 699,334 | |
Polypore International, Inc. (a) (b) | | | 40,784 | | | | 1,586,497 | |
Thermon Group Holdings, Inc. (a) | | | 61,200 | | | | 1,672,596 | |
| | | | | | | | |
| | | | | | | 10,563,075 | |
| | | | | | | | |
|
Electronic Equipment, Instruments & Components—4.2% | |
Belden, Inc. | | | 38,619 | | | | 2,720,709 | |
Checkpoint Systems, Inc. (a) | | | 81,022 | | | | 1,277,717 | |
Cognex Corp. | | | 25,048 | | | | 956,333 | |
FEI Co. | | | 24,140 | | | | 2,157,150 | |
IPG Photonics Corp. (a) (b) | | | 25,818 | | | | 2,003,735 | |
Littelfuse, Inc. | | | 36,799 | | | | 3,419,731 | |
Measurement Specialties, Inc. (a) | | | 39,337 | | | | 2,387,362 | |
Methode Electronics, Inc. | | | 55,977 | | | | 1,913,854 | |
Rogers Corp. (a) | | | 41,534 | | | | 2,554,341 | |
Vishay Intertechnology, Inc. (a) (b) | | | 172,997 | | | | 2,293,940 | |
| | | | | | | | |
| | | | | | | 21,684,872 | |
| | | | | | | | |
|
Energy Equipment & Services—2.7% | |
Bristow Group, Inc. | | | 35,264 | | | | 2,646,916 | |
Dril-Quip, Inc. (a) | | | 18,350 | | | | 2,017,215 | |
Forum Energy Technologies, Inc. (a) | | | 66,930 | | | | 1,891,442 | |
Helix Energy Solutions Group, Inc. (a) | | | 206,384 | | | | 4,783,981 | |
Parker Drilling Co. (a) | | | 345,529 | | | | 2,809,151 | |
| | | | | | | | |
| | | | | | | 14,148,705 | |
| | | | | | | | |
|
Food & Staples Retailing—1.0% | |
Casey’s General Stores, Inc. | | | 22,528 | | | | 1,582,592 | |
Spartan Stores, Inc. | | | 74,863 | | | | 1,817,674 | |
|
Food & Staples Retailing—(Continued) | |
Susser Holdings Corp. (a) (b) | | | 30,903 | | | | 2,023,837 | |
| | | | | | | | |
| | | | | | | 5,424,103 | |
| | | | | | | | |
|
Food Products—0.8% | |
Darling International, Inc. (a) | | | 76,427 | | | | 1,595,796 | |
Ingredion, Inc. | | | 18,098 | | | | 1,238,989 | |
J&J Snack Foods Corp. (b) | | | 12,914 | | | | 1,144,051 | |
| | | | | | | | |
| | | | | | | 3,978,836 | |
| | | | | | | | |
|
Health Care Equipment & Supplies—3.4% | |
Analogic Corp. | | | 15,815 | | | | 1,400,576 | |
Cardiovascular Systems, Inc. (a) | | | 31,864 | | | | 1,092,617 | |
Endologix, Inc. (a) | | | 100,313 | | | | 1,749,459 | |
Globus Medical, Inc. - Class A (a) | | | 76,982 | | | | 1,553,497 | |
Insulet Corp. (a) | | | 53,020 | | | | 1,967,042 | |
Novadaq Technologies, Inc. (a) | | | 114,042 | | | | 1,880,553 | |
Quidel Corp. (a) | | | 60,087 | | | | 1,856,087 | |
Spectranetics Corp. (a) | | | 95,843 | | | | 2,396,075 | |
SurModics, Inc. (a) | | | 34,711 | | | | 846,601 | |
Teleflex, Inc. (b) | | | 26,766 | | | | 2,512,257 | |
| | | | | | | | |
| | | | | | | 17,254,764 | |
| | | | | | | | |
|
Health Care Providers & Services—2.6% | |
Acadia Healthcare Co., Inc. (a) (b) | | | 49,638 | | | | 2,349,367 | |
Bio-Reference Labs, Inc. (a) (b) | | | 58,145 | | | | 1,485,023 | |
Hanger, Inc. (a) | | | 46,020 | | | | 1,810,427 | |
IPC The Hospitalist Co., Inc. (a) | | | 16,439 | | | | 976,312 | |
MEDNAX, Inc. (a) | | | 28,434 | | | | 1,517,807 | |
MWI Veterinary Supply, Inc. (a) | | | 5,814 | | | | 991,810 | |
Team Health Holdings, Inc. (a) | | | 45,303 | | | | 2,063,552 | |
WellCare Health Plans, Inc. (a) | | | 29,809 | | | | 2,099,150 | |
| | | | | | | | |
| | | | | | | 13,293,448 | |
| | | | | | | | |
|
Health Care Technology—0.7% | |
MedAssets, Inc. (a) | | | 89,453 | | | | 1,773,853 | |
Medidata Solutions, Inc. (a) | | | 31,986 | | | | 1,937,392 | |
| | | | | | | | |
| | | | | | | 3,711,245 | |
| | | | | | | | |
|
Hotels, Restaurants & Leisure—3.8% | |
AFC Enterprises, Inc. (a) | | | 46,623 | | | | 1,794,986 | |
Churchill Downs, Inc. | | | 34,541 | | | | 3,096,601 | |
Cracker Barrel Old Country Store, Inc. | | | 13,948 | | | | 1,535,256 | |
Diamond Resorts International, Inc. (a) | | | 115,289 | | | | 2,128,235 | |
Marriott Vacations Worldwide Corp. (a) | | | 55,619 | | | | 2,934,459 | |
Noodles & Co. (a) | | | 32,882 | | | | 1,181,121 | |
Six Flags Entertainment Corp. (b) | | | 64,383 | | | | 2,370,582 | |
Texas Roadhouse, Inc. | | | 72,245 | | | | 2,008,411 | |
Vail Resorts, Inc. | | | 31,257 | | | | 2,351,464 | |
| | | | | | | | |
| | | | | | | 19,401,115 | |
| | | | | | | | |
|
Household Durables—1.0% | |
Jarden Corp. (a) | | | 60,700 | | | | 3,723,945 | |
La-Z-Boy, Inc. | | | 40,040 | | | | 1,241,240 | |
| | | | | | | | |
| | | | | | | 4,965,185 | |
| | | | | | | | |
See accompanying notes to financial statements.
MSF-6
Metropolitan Series Fund
Loomis Sayles Small Cap Core Portfolio
Schedule of Investments as of December 31, 2013
Common Stocks—(Continued)
| | | | | | | | |
| Security Description | | Shares | | | Value | |
|
Industrial Conglomerates—0.6% | |
Raven Industries, Inc. (b) | | | 75,215 | | | $ | 3,094,345 | |
| | | | | | | | |
|
Insurance—2.3% | |
Employers Holdings, Inc. | | | 107,047 | | | | 3,388,038 | |
HCC Insurance Holdings, Inc. | | | 69,909 | | | | 3,225,601 | |
ProAssurance Corp. | | | 52,352 | | | | 2,538,025 | |
Reinsurance Group of America, Inc. | | | 32,808 | | | | 2,539,667 | |
| | | | | | | | |
| | | | | | | 11,691,331 | |
| | | | | | | | |
|
Internet & Catalog Retail—1.6% | |
HomeAway, Inc. (a) (b) | | | 75,887 | | | | 3,102,260 | |
HSN, Inc. | | | 38,029 | | | | 2,369,207 | |
Liberty Ventures - Series A (a) | | | 20,807 | | | | 2,550,730 | |
| | | | | | | | |
| | | | | | | 8,022,197 | |
| | | | | | | | |
|
Internet Software & Services—3.0% | |
Cornerstone OnDemand, Inc. (a) | | | 39,032 | | | | 2,081,967 | |
CoStar Group, Inc. (a) | | | 12,218 | | | | 2,255,198 | |
Dealertrack Technologies, Inc. (a) | | | 72,070 | | | | 3,465,126 | |
Envestnet, Inc. (a) | | | 44,765 | | | | 1,804,030 | |
OpenTable, Inc. (a) (b) | | | 24,538 | | | | 1,947,581 | |
Perficient, Inc. (a) | | | 85,020 | | | | 1,991,168 | |
Shutterstock, Inc. (a) | | | 21,732 | | | | 1,817,447 | |
| | | | | | | | |
| | | | | | | 15,362,517 | |
| | | | | | | | |
|
IT Services—2.8% | |
Cardtronics, Inc. (a) | | | 29,939 | | | | 1,300,850 | |
Convergys Corp. | | | 110,010 | | | | 2,315,711 | |
EPAM Systems, Inc. (a) | | | 61,383 | | | | 2,144,722 | |
Euronet Worldwide, Inc. (a) | | | 72,751 | | | | 3,481,135 | |
InterXion Holding NV (a) | | | 78,357 | | | | 1,850,009 | |
WEX, Inc. (a) | | | 34,282 | | | | 3,394,946 | |
| | | | | | | | |
| | | | | | | 14,487,373 | |
| | | | | | | | |
|
Life Sciences Tools & Services—0.3% | |
Fluidigm Corp. (a) | | | 40,344 | | | | 1,545,982 | |
| | | | | | | | |
|
Machinery—5.4% | |
Actuant Corp. - Class A (b) | | | 37,357 | | | | 1,368,760 | |
Alamo Group, Inc. | | | 19,031 | | | | 1,154,991 | |
Albany International Corp. - Class A | | | 55,990 | | | | 2,011,721 | |
Altra Industrial Motion Corp. | | | 88,411 | | | | 3,025,424 | |
John Bean Technologies Corp. | | | 92,012 | | | | 2,698,712 | |
Manitowoc Co., Inc. (The) | | | 100,290 | | | | 2,338,763 | |
Middleby Corp. (The) (a) | | | 8,981 | | | | 2,155,171 | |
Proto Labs, Inc. (a) | | | 25,624 | | | | 1,823,916 | |
RBC Bearings, Inc. (a) | | | 74,540 | | | | 5,273,705 | |
Trimas Corp. (a) | | | 68,765 | | | | 2,743,036 | |
Wabtec Corp. | | | 42,806 | | | | 3,179,202 | |
| | | | | | | | |
| | | | | | | 27,773,401 | |
| | | | | | | | |
|
Marine—0.6% | |
Kirby Corp. (a) (b) | | | 29,200 | | | | 2,898,100 | |
| | | | | | | | |
|
Media—1.8% | |
Carmike Cinemas, Inc. (a) | | | 82,640 | | | | 2,300,698 | |
EW Scripps Co. - Class A (a) | | | 72,606 | | | | 1,577,002 | |
John Wiley & Sons, Inc. - Class A (b) | | | 40,942 | | | | 2,259,999 | |
Live Nation Entertainment, Inc. (a) | | | 67,867 | | | | 1,341,052 | |
National CineMedia, Inc. | | | 91,543 | | | | 1,827,198 | |
| | | | | | | | |
| | | | | | | 9,305,949 | |
| | | | | | | | |
|
Metals & Mining—1.7% | |
Globe Specialty Metals, Inc. | | | 63,725 | | | | 1,147,687 | |
Haynes International, Inc. | | | 43,111 | | | | 2,381,451 | |
Horsehead Holding Corp. (a) (b) | | | 118,895 | | | | 1,927,288 | |
Reliance Steel & Aluminum Co. | | | 9,801 | | | | 743,308 | |
SunCoke Energy, Inc. (a) | | | 122,912 | | | | 2,803,623 | |
| | | | | | | | |
| | | | | | | 9,003,357 | |
| | | | | | | | |
|
Multi-Utilities—0.5% | |
NorthWestern Corp. | | | 56,084 | | | | 2,429,559 | |
| | | | | | | | |
|
Multiline Retail—0.2% | |
Fred’s, Inc. - Class A | | | 70,479 | | | | 1,305,271 | |
| | | | | | | | |
|
Oil, Gas & Consumable Fuels—2.1% | |
Diamondback Energy, Inc. (a) | | | 33,490 | | | | 1,770,281 | |
EPL Oil & Gas, Inc. (a) | | | 108,437 | | | | 3,090,454 | |
Gulfport Energy Corp. (a) | | | 34,246 | | | | 2,162,635 | |
Oasis Petroleum, Inc. (a) | | | 41,915 | | | | 1,968,748 | |
Rosetta Resources, Inc. (a) | | | 34,527 | | | | 1,658,677 | |
| | | | | | | | |
| | | | | | | 10,650,795 | |
| | | | | | | | |
|
Pharmaceuticals—1.0% | |
Mallinckrodt plc (a) (b) | | | 29,220 | | | | 1,527,037 | |
Medicines Co. (The) (a) | | | 26,690 | | | | 1,030,768 | |
Pacira Pharmaceuticals, Inc. (a) | | | 23,228 | | | | 1,335,378 | |
Sagent Pharmaceuticals, Inc. (a) | | | 43,415 | | | | 1,101,872 | |
| | | | | | | | |
| | | | | | | 4,995,055 | |
| | | | | | | | |
|
Professional Services—2.2% | |
Advisory Board Co. (The) (a) (b) | | | 28,712 | | | | 1,828,093 | |
Corporate Executive Board Co. (The) | | | 35,054 | | | | 2,714,231 | |
Huron Consulting Group, Inc. (a) | | | 33,076 | | | | 2,074,527 | |
Insperity, Inc. | | | 11,971 | | | | 432,512 | |
On Assignment, Inc. (a) | | | 58,038 | | | | 2,026,687 | |
WageWorks, Inc. (a) | | | 35,918 | | | | 2,134,966 | |
| | | | | | | | |
| | | | | | | 11,211,016 | |
| | | | | | | | |
|
Real Estate Investment Trusts—4.7% | |
American Campus Communities, Inc. | | | 37,789 | | | | 1,217,184 | |
BioMed Realty Trust, Inc. | | | 125,651 | | | | 2,276,796 | |
CubeSmart | | | 168,425 | | | | 2,684,694 | |
DuPont Fabros Technology, Inc. (b) | | | 32,518 | | | | 803,520 | |
Hersha Hospitality Trust | | | 393,951 | | | | 2,194,307 | |
Home Properties, Inc. | | | 29,420 | | | | 1,577,500 | |
Mid-America Apartment Communities, Inc. | | | 38,920 | | | | 2,364,001 | |
National Retail Properties, Inc. (b) | | | 48,564 | | | | 1,472,946 | |
Omega Healthcare Investors, Inc. | | | 78,661 | | | | 2,344,098 | |
See accompanying notes to financial statements.
MSF-7
Metropolitan Series Fund
Loomis Sayles Small Cap Core Portfolio
Schedule of Investments as of December 31, 2013
Common Stocks—(Continued)
| | | | | | | | |
| Security Description | | Shares | | | Value | |
|
Real Estate Investment Trusts—(Continued) | |
Potlatch Corp. | | | 56,027 | | | $ | 2,338,567 | |
Retail Opportunity Investments Corp. (b) | | | 146,641 | | | | 2,158,555 | |
Sovran Self Storage, Inc. | | | 43,715 | | | | 2,848,907 | |
| | | | | | | | |
| | | | | | | 24,281,075 | |
| | | | | | | | |
|
Road & Rail—1.9% | |
Avis Budget Group, Inc. (a) | | | 54,502 | | | | 2,202,971 | |
Genesee & Wyoming, Inc. - Class A (a) | | | 44,359 | | | | 4,260,682 | |
Old Dominion Freight Line, Inc. (a) | | | 62,631 | | | | 3,320,695 | |
| | | | | | | | |
| | | | | | | 9,784,348 | |
| | | | | | | | |
|
Semiconductors & Semiconductor Equipment—2.9% | |
Cavium, Inc. (a) | | | 46,802 | | | | 1,615,137 | |
Hittite Microwave Corp. (a) | | | 29,591 | | | | 1,826,652 | |
Magnachip Semiconductor Corp. (a) | | | 85,453 | | | | 1,666,334 | |
Monolithic Power Systems, Inc. (a) | | | 52,049 | | | | 1,804,018 | |
Semtech Corp. (a) | | | 135,803 | | | | 3,433,100 | |
Silicon Laboratories, Inc. (a) | | | 39,456 | | | | 1,708,839 | |
Teradyne, Inc. (a) (b) | | | 154,309 | | | | 2,718,925 | |
| | | | | | | | |
| | | | | | | 14,773,005 | |
| | | | | | | | |
|
Software—4.0% | |
Aspen Technology, Inc. (a) | | | 65,457 | | | | 2,736,103 | |
CommVault Systems, Inc. (a) | | | 25,778 | | | | 1,930,257 | |
FleetMatics Group plc (a) | | | 26,741 | | | | 1,156,548 | |
Guidewire Software, Inc. (a) (b) | | | 56,437 | | | | 2,769,364 | |
Imperva, Inc. (a) | | | 41,200 | | | | 1,982,956 | |
Monotype Imaging Holdings, Inc. | | | 37,424 | | | | 1,192,329 | |
SS&C Technologies Holdings, Inc. (a) | | | 58,143 | | | | 2,573,409 | |
Synchronoss Technologies, Inc. (a) | | | 70,262 | | | | 2,183,040 | |
Ultimate Software Group, Inc. (a) | | | 17,933 | | | | 2,747,694 | |
Verint Systems, Inc. (a) | | | 33,226 | | | | 1,426,724 | |
| | | | | | | | |
| | | | | | | 20,698,424 | |
| | | | | | | | |
|
Specialty Retail—3.1% | |
Asbury Automotive Group, Inc. (a) | | | 36,487 | | | | 1,960,811 | |
Barnes & Noble, Inc. (a) | | | 70,158 | | | | 1,048,862 | |
Cabela’s, Inc. (a) | | | 23,772 | | | | 1,584,641 | |
Chico’s FAS, Inc. | | | 81,771 | | | | 1,540,566 | |
Genesco, Inc. (a) | | | 42,478 | | | | 3,103,443 | |
Hibbett Sports, Inc. (a) (b) | | | 32,103 | | | | 2,157,643 | |
Rent-A-Center, Inc. (b) | | | 34,039 | | | | 1,134,860 | |
Restoration Hardware Holdings, Inc. (a) | | | 20,702 | | | | 1,393,244 | |
Sally Beauty Holdings, Inc. (a) | | | 74,307 | | | | 2,246,301 | |
| | | | | | | | |
| | | | | | | 16,170,371 | |
| | | | | | | | |
|
Textiles, Apparel & Luxury Goods—1.2% | |
Deckers Outdoor Corp. (a) (b) | | | 23,820 | | | | 2,011,837 | |
Oxford Industries, Inc. | | | 30,060 | | | | 2,424,940 | |
Tumi Holdings, Inc. (a) | | | 75,991 | | | | 1,713,597 | |
| | | | | | | | |
| | | | | | | 6,150,374 | |
| | | | | | | | |
|
Thrifts & Mortgage Finance—0.4% | |
Capitol Federal Financial, Inc. | | | 117,259 | | | | 1,420,006 | |
Federal Agricultural Mortgage Corp. - Class C | | | 22,206 | | | | 760,556 | |
| | | | | | | | |
| | | | | | | 2,180,562 | |
| | | | | | | | |
|
Trading Companies & Distributors—1.1% | |
DXP Enterprises, Inc. (a) | | | 23,152 | | | | 2,667,110 | |
H&E Equipment Services, Inc. (a) | | | 38,169 | | | | 1,130,948 | |
Rush Enterprises, Inc. - Class A (a) | | | 64,177 | | | | 1,902,848 | |
| | | | | | | | |
| | | | | | | 5,700,906 | |
| | | | | | | | |
|
Transportation Infrastructure—0.6% | |
Macquarie Infrastructure Co. LLC | | | 35,213 | | | | 1,916,643 | |
Wesco Aircraft Holdings, Inc. (a) | | | 55,891 | | | | 1,225,131 | |
| | | | | | | | |
| | | | | | | 3,141,774 | |
| | | | | | | | |
|
Water Utilities—0.1% | |
Middlesex Water Co. | | | 26,943 | | | | 564,186 | |
| | | | | | | | |
Total Common Stocks
(Cost $326,789,716) | | | | | | | 508,992,443 | |
| | | | | | | | |
|
| Short-Term Investments—17.9% | |
|
Mutual Fund—16.7% | |
State Street Navigator Securities Lending MET Portfolio (c) | | | 85,783,470 | | | | 85,783,470 | |
| | | | | | | | |
|
Repurchase Agreement—1.2% | |
Fixed Income Clearing Corp.
Repurchase Agreement dated 12/31/13 at 0.000% to be repurchased at $6,131,000 on 01/02/14, collateralized by $6,225,000 U.S. Treasury Note at 0.875% due 01/31/17 with a value of $6,256,125. | | | 6,131,000 | | | | 6,131,000 | |
| | | | | | | | |
Total Short-Term Investments
(Cost $91,914,470) | | | | | | | 91,914,470 | |
| | | | | | | | |
Total Investments—116.8%
(Cost $418,704,186) (d) | | | | | | | 600,906,913 | |
Other assets and liabilities (net)—(16.8)% | | | | | | | (86,597,805 | ) |
| | | | | | | | |
| Net Assets—100.0% | | | | | | $ | 514,309,108 | |
| | | | | | | | |
| * | Principal amount stated in U.S. dollars unless otherwise noted. |
| (a) | Non-income producing security. |
| (b) | All or a portion of the security was held on loan. As of December 31, 2013, the market value of securities loaned was $84,111,923 and the collateral received consisted of cash in the amount of $85,783,470 and non-cash collateral with a value of $243,527. The cash collateral is invested in a money market fund managed by an affiliate of the custodian. The non-cash collateral received consists primarily of government securities and bank letters of credit, and is held for the |
See accompanying notes to financial statements.
MSF-8
Metropolitan Series Fund
Loomis Sayles Small Cap Core Portfolio
Schedule of Investments as of December 31, 2013
| | benefit of the Portfolio at the Portfolio’s custodian. The Portfolio cannot repledge or resell this collateral. As such, this collateral is excluded from the Statement of Assets and Liabilities. |
| (c) | Represents investment of cash collateral received from securities lending transactions. |
| (d) | As of December 31, 2013, the aggregate cost of investments for federal income tax purposes was $418,549,577. The aggregate unrealized appreciation and depreciation of investments were $185,488,110 and $(3,130,774), respectively, resulting in net unrealized appreciation of $182,357,336 for federal income tax purposes. |
Fair Value Hierarchy
Accounting principles generally accepted in the United States of America (“GAAP”) define fair market value as the price that the Portfolio would receive to sell an asset or pay to transfer a liability in an orderly transaction between market participants at the measurement date. It establishes a fair value hierarchy that prioritizes inputs to valuation methods and requires disclosure of the fair value hierarchy that segregates fair value measurements into three levels. Levels 1, 2 and 3 of the fair value hierarchy are defined as follows:
Level 1 - unadjusted quoted prices in active markets for identical investments
Level 2 - other significant observable inputs (including, but not limited to, unadjusted quoted prices for similar investments in markets that are either active or inactive; inputs other than quoted prices that are observable such as interest rates, yield curves, volatilities, prepayment speeds, loss severities, credit risks, default rates, etc.)
Level 3 - significant unobservable inputs based on the best information available in the circumstances, to the extent observable inputs are unavailable (including the Portfolio’s own assumptions in determining the fair value of investments)
The inputs or methodologies used for valuing investments are not necessarily an indication of the risk associated with investing in them. Changes to the inputs or methodologies used may result in transfers between levels, which will be recognized as of the beginning of the reporting period. Information on transfers between Level 1 and Level 2, if any, will be disclosed following the fair value hierarchy table below. A reconciliation of Level 3 securities, if any, will also be disclosed following the fair value hierarchy table. For more information about the Portfolio’s policy regarding the valuation of investments, please refer to the Notes to Financial Statements.
The following table summarizes the fair value hierarchy of the Portfolio’s investments as of December 31, 2013:
| | | | | | | | | | | | | | | | |
| Description | | Level 1 | | | Level 2 | | | Level 3 | | | Total | |
Total Common Stocks* | | $ | 508,992,443 | | | $ | — | | | $ | — | | | $ | 508,992,443 | |
| Short-Term Investments | | | | | | | | | | | | | | | | |
Mutual Fund | | | 85,783,470 | | | | — | | | | — | | | | 85,783,470 | |
Repurchase Agreement | | | — | | | | 6,131,000 | | | | — | | | | 6,131,000 | |
Total Short-Term Investments | | | 85,783,470 | | | | 6,131,000 | | | | — | | | | 91,914,470 | |
Total Investments | | $ | 594,775,913 | | | $ | 6,131,000 | | | $ | — | | | $ | 600,906,913 | |
| | | | | | | | | | | | | | | | | |
Collateral for securities loaned (Liability) | | $ | — | | | $ | (85,783,470 | ) | | $ | — | | | $ | (85,783,470 | ) |
| * | See Schedule of Investments for additional detailed categorizations. |
See accompanying notes to financial statements.
MSF-9
Metropolitan Series Fund
Loomis Sayles Small Cap Core Portfolio
Statement of Assets and Liabilities
December 31, 2013
| | | | |
Assets | | | | |
Investments at value (a) (b) | | $ | 600,906,913 | |
Cash | | | 49,026 | |
Receivable for: | | | | |
Investments sold | | | 144,066 | |
Fund shares sold | | | 371,755 | |
Dividends | | | 421,405 | |
Prepaid expenses | | | 14,609 | |
| | | | |
Total Assets | | | 601,907,774 | |
Liabilities | | | | |
Collateral for securities loaned | | | 85,783,470 | |
Payables for: | | | | |
Investments purchased | | | 564,024 | |
Fund shares redeemed | | | 735,307 | |
Accrued expenses: | | | | |
Management fees | | | 350,959 | |
Distribution and service fees | | | 44,293 | |
Deferred trustees’ fees | | | 55,012 | |
Other expenses | | | 65,601 | |
| | | | |
Total Liabilities | | | 87,598,666 | |
| | | | |
Net Assets | | $ | 514,309,108 | |
| | | | |
Net assets consist of: | | | | |
Paid in surplus | | $ | 267,136,793 | |
Undistributed net investment loss | | | (17,991 | ) |
Accumulated net realized gain | | | 64,987,579 | |
Unrealized appreciation on investments | | | 182,202,727 | |
| | | | |
Net Assets | | $ | 514,309,108 | |
| | | | |
Net Assets | | | | |
Class A | | $ | 285,953,525 | |
Class B | | | 190,073,761 | |
Class E | | | 38,281,822 | |
Capital Shares Outstanding* | | | | |
Class A | | | 886,383 | |
Class B | | | 606,310 | |
Class E | | | 120,726 | |
Net Asset Value, Offering Price and Redemption Price Per Share | | | | |
Class A | | $ | 322.61 | |
Class B | | | 313.49 | |
Class E | | | 317.10 | |
| * | The Portfolio is authorized to issue an unlimited number of shares. |
| (a) | Identified cost of investments was $418,704,186. |
| (b) | Includes securities loaned at value of $84,111,923. |
Statement of Operations
Year Ended December 31, 2013
| | | | |
Investment Income | | | | |
Dividends | | $ | 4,597,457 | |
Interest | | | 428 | |
Securities lending income | | | 277,255 | |
| | | | |
Total investment income | | | 4,875,140 | |
Expenses | | | | |
Management fees | | | 4,158,330 | |
Administration fees | | | 6,820 | |
Custodian and accounting fees | | | 58,364 | |
Distribution and service fees—Class B | | | 426,182 | |
Distribution and service fees—Class E | | | 54,525 | |
Audit and tax services | | | 37,723 | |
Legal | | | 27,754 | |
Trustees’ fees and expenses | | | 35,359 | |
Shareholder reporting | | | 73,351 | |
Insurance | | | 2,809 | |
Miscellaneous | | | 9,272 | |
| | | | |
Total expenses | | | 4,890,489 | |
Less management fee waiver | | | (361,703 | ) |
Less broker commission recapture | | | (26,793 | ) |
| | | | |
Net expenses | | | 4,501,993 | |
| | | | |
Net Investment Income | | | 373,147 | |
| | | | |
Net Realized and Unrealized Gain | | | | |
Net realized gain on investments | | | 64,835,389 | |
| | | | |
Net change in unrealized appreciation on investments | | | 91,746,038 | |
| | | | |
Net realized and unrealized gain | | | 156,581,427 | |
| | | | |
Net Increase in Net Assets From Operations | | $ | 156,954,574 | |
| | | | |
See accompanying notes to financial statements.
MSF-10
Metropolitan Series Fund
Loomis Sayles Small Cap Core Portfolio
Statements of Changes in Net Assets
| | | | | | | | |
| | | Year Ended
December 31,
2013 | | | Year Ended
December 31,
2012 | |
Increase (Decrease) in Net Assets: | | | | | | | | |
From Operations | | | | | | | | |
Net investment income | | $ | 373,147 | | | $ | 2,249,538 | |
Net realized gain | | | 64,835,389 | | | | 34,227,721 | |
Net change in unrealized appreciation | | | 91,746,038 | | | | 18,324,180 | |
| | | | | | | | |
Increase in net assets from operations | | | 156,954,574 | | | | 54,801,439 | |
| | | | | | | | |
From Distributions to Shareholders | | | | | | | | |
Net investment income | | | | | | | | |
Class A | | | (1,108,880 | ) | | | 0 | |
Class B | | | (391,616 | ) | | | 0 | |
Class E | | | (114,151 | ) | | | 0 | |
Net realized capital gains | | | | | | | | |
Class A | | | (18,804,683 | ) | | | (5,655,967 | ) |
Class B | | | (12,961,708 | ) | | | (3,818,870 | ) |
Class E | | | (2,795,689 | ) | | | (866,084 | ) |
| | | | | | | | |
Total distributions | | | (36,176,727 | ) | | | (10,340,921 | ) |
| | | | | | | | |
Decrease in net assets from capital share transactions | | | (13,242,863 | ) | | | (34,078,363 | ) |
| | | | | | | | |
Total increase in net assets | | | 107,534,984 | | | | 10,382,155 | |
| | |
Net Assets | | | | | | | | |
Beginning of period | | | 406,774,124 | | | | 396,391,969 | |
| | | | | | | | |
End of period | | $ | 514,309,108 | | | $ | 406,774,124 | |
| | | | | | | | |
| | |
Undistributed Net Investment Income (Loss) | | | | | | | | |
End of period | | $ | (17,991 | ) | | $ | 2,170,452 | |
| | | | | | | | |
Other Information:
Capital Shares
Transactions in capital shares were as follows:
| | | | | | | | | | | | | | | | |
| | | Year Ended
December 31, 2013 | | | Year Ended
December 31, 2012 | |
| | | Shares | | | Value | | | Shares | | | Value | |
Class A | | | | | | | | | | | | | | | | |
Sales | | | 43,599 | | | $ | 12,263,636 | | | | 26,861 | | | $ | 6,409,510 | |
Reinvestments | | | 81,068 | | | | 19,913,563 | | | | 23,747 | | | | 5,655,967 | |
Redemptions | | | (126,915 | ) | | | (35,702,694 | ) | | | (143,242 | ) | | | (34,209,621 | ) |
| | | | | | | | | | | | | | | | |
Net decrease | | | (2,248 | ) | | $ | (3,525,495 | ) | | | (92,634 | ) | | $ | (22,144,144 | ) |
| | | | | | | | | | | | | | | | |
Class B | | | | | | | | | | | | | | | | |
Sales | | | 51,845 | | | $ | 14,548,502 | | | | 53,113 | | | $ | 12,439,394 | |
Reinvestments | | | 55,844 | | | | 13,353,324 | | | | 16,431 | | | | 3,818,870 | |
Redemptions | | | (121,124 | ) | | | (33,321,684 | ) | | | (101,301 | ) | | | (23,714,171 | ) |
| | | | | | | | | | | | | | | | |
Net decrease | | | (13,435 | ) | | $ | (5,419,858 | ) | | | (31,757 | ) | | $ | (7,455,907 | ) |
| | | | | | | | | | | | | | | | |
Class E | | | | | | | | | | | | | | | | |
Sales | | | 8,871 | | | $ | 2,471,043 | | | | 10,198 | | | $ | 2,402,207 | |
Reinvestments | | | 12,039 | | | | 2,909,840 | | | | 3,691 | | | | 866,084 | |
Redemptions | | | (34,655 | ) | | | (9,678,393 | ) | | | (32,769 | ) | | | (7,746,603 | ) |
| | | | | | | | | | | | | | | | |
Net decrease | | | (13,745 | ) | | $ | (4,297,510 | ) | | | (18,880 | ) | | $ | (4,478,312 | ) |
| | | | | | | | | | | | | | | | |
Decrease derived from capital shares transactions | | | | | | $ | (13,242,863 | ) | | | | | | $ | (34,078,363 | ) |
| | | | | | | | | | | | | | | | |
See accompanying notes to financial statements.
MSF-11
Metropolitan Series Fund
Loomis Sayles Small Cap Core Portfolio
Financial Highlights
| | | | | | | | | | | | | | | | | | | | |
| Selected per share data | | | |
| | | Class A | |
| | | Year Ended December 31, | |
| | | 2013 | | | 2012 | | | 2011 | | | 2010 | | | 2009 | |
Net Asset Value, Beginning of Period | | $ | 250.37 | | | $ | 224.06 | | | $ | 222.98 | | | $ | 175.00 | | | $ | 134.79 | |
| | | | | | | | | | | | | | | | | | | | |
Income (Loss) from Investment Operations | | | | | | | | | | | | | | | | | | | | |
Net investment income (a) | | | 0.53 | | | | 1.56 | | | | 0.13 | | | | 0.43 | | | | 0.31 | |
Net realized and unrealized gain on investments | | | 94.94 | | | | 30.73 | | | | 1.20 | | | | 47.73 | | | | 40.31 | |
| | | | | | | | | | | | | | | | | | | | |
Total from investment operations | | | 95.47 | | | | 32.29 | | | | 1.33 | | | | 48.16 | | | | 40.62 | |
| | | | | | | | | | | | | | | | | | | | |
Less Distributions | | | | | | | | | | | | | | | | | | | | |
Distributions from net investment income | | | (1.29 | ) | | | 0.00 | | | | (0.25 | ) | | | (0.18 | ) | | | (0.41 | ) |
Distributions from net realized capital gains | | | (21.94 | ) | | | (5.98 | ) | | | 0.00 | | | | 0.00 | | | | 0.00 | |
| | | | | | | | | | | | | | | | | | | | |
Total distributions | | | (23.23 | ) | | | (5.98 | ) | | | (0.25 | ) | | | (0.18 | ) | | | (0.41 | ) |
| | | | | | | | | | | | | | | | | | | | |
Net Asset Value, End of Period | | $ | 322.61 | | | $ | 250.37 | | | $ | 224.06 | | | $ | 222.98 | | | $ | 175.00 | |
| | | | | | | | | | | | | | | | | | | | |
Total Return (%) (b) | | | 41.04 | | | | 14.55 | | | | 0.59 | | | | 27.53 | | | | 30.25 | |
| | | | | |
Ratios/Supplemental Data | | | | | | | | | | | | | | | | | | | | |
Gross ratio of expenses to average net assets (%) | | | 0.95 | | | | 0.97 | | | | 0.96 | | | | 0.96 | | | | 0.99 | |
Net ratio of expenses to average net assets (%) (c) | | | 0.88 | | | | 0.89 | | | | 0.91 | | | | 0.91 | | | | 0.94 | |
Ratio of net investment income to average net assets (%) | | | 0.19 | | | | 0.65 | | | | 0.06 | | | | 0.23 | | | | 0.22 | |
Portfolio turnover rate (%) | | | 36 | | | | 38 | | | | 49 | | | | 61 | | | | 68 | |
Net assets, end of period (in millions) | | $ | 286.0 | | | $ | 222.5 | | | $ | 219.9 | | | $ | 244.4 | | | $ | 218.1 | |
| | | | | | | | | | | | | | | | | | | | |
| | | Class B | |
| | | Year Ended December 31, | |
| | | 2013 | | | 2012 | | | 2011 | | | 2010 | | | 2009 | |
Net Asset Value, Beginning of Period | | $ | 243.89 | | | $ | 218.94 | | | $ | 218.20 | | | $ | 171.53 | | | $ | 132.03 | |
| | | | | | | | | | | | | | | | | | | | |
Income (Loss) from Investment Operations | | | | | | | | | | | | | | | | | | | | |
Net investment income (loss) (a) | | | (0.18 | ) | | | 0.96 | | | | (0.41 | ) | | | (0.02 | ) | | | (0.05 | ) |
Net realized and unrealized gain on investments | | | 92.38 | | | | 29.97 | | | | 1.15 | | | | 46.69 | | | | 39.55 | |
| | | | | | | | | | | | | | | | | | | | |
Total from investment operations | | | 92.20 | | | | 30.93 | | | | 0.74 | | | | 46.67 | | | | 39.50 | |
| | | | | | | | | | | | | | | | | | | | |
Less Distributions | | | | | | | | | | | | | | | | | | | | |
Distributions from net investment income | | | (0.66 | ) | | | 0.00 | | | | 0.00 | | | | 0.00 | | | | 0.00 | |
Distributions from net realized capital gains | | | (21.94 | ) | | | (5.98 | ) | | | 0.00 | | | | 0.00 | | | | 0.00 | |
| | | | | | | | | | | | | | | | | | | | |
Total distributions | | | (22.60 | ) | | | (5.98 | ) | | | 0.00 | | | | 0.00 | | | | 0.00 | |
| | | | | | | | | | | | | | | | | | | | |
Net Asset Value, End of Period | | $ | 313.49 | | | $ | 243.89 | | | $ | 218.94 | | | $ | 218.20 | | | $ | 171.53 | |
| | | | | | | | | | | | | | | | | | | | |
Total Return (%) (b) | | | 40.68 | | | | 14.27 | | | | 0.34 | | | | 27.21 | | | | 29.93 | |
| | | | | |
Ratios/Supplemental Data | | | | | | | | | | | | | | | | | | | | |
Gross ratio of expenses to average net assets (%) | | | 1.20 | | | | 1.22 | | | | 1.21 | | | | 1.21 | | | | 1.24 | |
Net ratio of expenses to average net assets (%) (c) | | | 1.13 | | | | 1.14 | | | | 1.16 | | | | 1.16 | | | | 1.19 | |
Ratio of net investment income (loss) to average net assets (%) | | | (0.07 | ) | | | 0.41 | | | | (0.19 | ) | | | (0.01 | ) | | | (0.03 | ) |
Portfolio turnover rate (%) | | | 36 | | | | 38 | | | | 49 | | | | 61 | | | | 68 | |
Net assets, end of period (in millions) | | $ | 190.1 | | | $ | 151.2 | | | $ | 142.6 | | | $ | 141.7 | | | $ | 112.2 | |
Please see following page for Financial Highlights footnote legend.
See accompanying notes to financial statements.
MSF-12
Metropolitan Series Fund
Loomis Sayles Small Cap Core Portfolio
Financial Highlights
| | | | | | | | | | | | | | | | | | | | |
| Selected per share data | | | |
| | | Class E | |
| | | Year Ended December 31, | |
| | | 2013 | | | 2012 | | | 2011 | | | 2010 | | | 2009 | |
Net Asset Value, Beginning of Period | | $ | 246.44 | | | $ | 220.96 | | | $ | 219.99 | | | $ | 172.77 | | | $ | 132.99 | |
| | | | | | | | | | | | | | | | | | | | |
Income (Loss) from Investment Operations | | | | | | | | | | | | | | | | | | | | |
Net investment income (loss) (a) | | | 0.09 | | | | 1.18 | | | | (0.22 | ) | | | 0.14 | | | | 0.09 | |
Net realized and unrealized gain on investments | | | 93.41 | | | | 30.28 | | | | 1.19 | | | | 47.08 | | | | 39.83 | |
| | | | | | | | | | | | | | | | | | | | |
Total from investment operations | | | 93.50 | | | | 31.46 | | | | 0.97 | | | | 47.22 | | | | 39.92 | |
| | | | | | | | | | | | | | | | | | | | |
Less Distributions | | | | | | | | | | | | | | | | | | | | |
Distributions from net investment income | | | (0.90 | ) | | | 0.00 | | | | 0.00 | | | | 0.00 | | | | (0.14 | ) |
Distributions from net realized capital gains | | | (21.94 | ) | | | (5.98 | ) | | | 0.00 | | | | 0.00 | | | | 0.00 | |
| | | | | | | | | | | | | | | | | | | | |
Total distributions | | | (22.84 | ) | | | (5.98 | ) | | | 0.00 | | | | 0.00 | | | | (0.14 | ) |
| | | | | | | | | | | | | | | | | | | | |
Net Asset Value, End of Period | | $ | 317.10 | | | $ | 246.44 | | | $ | 220.96 | | | $ | 219.99 | | | $ | 172.77 | |
| | | | | | | | | | | | | | | | | | | | |
Total Return (%) (b) | | | 40.83 | | | | 14.38 | | | | 0.44 | | | | 27.34 | | | | 30.05 | |
| | | | | |
Ratios/Supplemental Data | | | | | | | | | | | | | | | | | | | | |
Gross ratio of expenses to average net assets (%) | | | 1.10 | | | | 1.12 | | | | 1.11 | | | | 1.11 | | | | 1.14 | |
Net ratio of expenses to average net assets (%) (c) | | | 1.03 | | | | 1.04 | | | | 1.06 | | | | 1.06 | | | | 1.09 | |
Ratio of net investment income (loss) to average net assets (%) | | | 0.03 | | | | 0.50 | | | | (0.10 | ) | | | 0.08 | | | | 0.07 | |
Portfolio turnover rate (%) | | | 36 | | | | 38 | | | | 49 | | | | 61 | | | | 68 | |
Net assets, end of period (in millions) | | $ | 38.3 | | | $ | 33.1 | | | $ | 33.9 | | | $ | 41.8 | | | $ | 40.2 | |
| (a) | Per share amounts based on average shares outstanding during the period. |
| (b) | Total return does not reflect any insurance, sales, separate account or administrative charges of variable annuity or life insurance contracts or any additional expenses that contract owners may bear under their variable contracts. If these charges were included, the returns would be lower. |
| (c) | Net ratio of expenses to average net assets includes the effect of the management fee waivers as detailed in Note 5 of the Notes to Financial Statements. |
See accompanying notes to financial statements.
MSF-13
Metropolitan Series Fund
Loomis Sayles Small Cap Core Portfolio
Notes to Financial Statements—December 31, 2013
1. Organization
Metropolitan Series Fund (the “Trust”) is organized as a Delaware statutory trust and registered under the Investment Company Act of 1940, as amended (the “1940 Act”), as an open-end management investment company. The Trust is currently comprised of thirty series, each of which operates as a distinct investment vehicle of the Trust. The portfolio included in this report is Loomis Sayles Small Cap Core Portfolio (the “Portfolio”), which is diversified. Shares in the Portfolio are not offered directly to the general public and are currently available only to separate accounts established by Metropolitan Life Insurance Company (“MetLife”) and other affiliated life insurance companies.
The Portfolio has registered and offers three classes of shares: Class A, B, and E shares. Shares of each Class of the Portfolio represent an equal pro rata interest in the Portfolio and generally give the shareholder the same voting, dividend, liquidation, and other rights. Investment income, realized and unrealized capital gains and losses, the common expenses of the Portfolio, and certain Portfolio-level expense reductions, if any, are allocated on a pro rata basis to each Class based on the relative net assets of each Class to the net assets of the Portfolio. Each Class of shares differs in its respective distribution plan and such distribution expenses are allocated to that Class.
2. Significant Accounting Policies
The preparation of financial statements in conformity with accounting principles generally accepted in the United States of America (“GAAP”) requires management to make estimates and assumptions that affect the reported amounts of assets and liabilities and disclosure of contingent assets and liabilities as of the date of the financial statements and the reported amounts of income and expenses during the reporting period. Actual results could differ from those estimates. In the preparation of these financial statements, management has evaluated events and transactions subsequent to December 31, 2013 through the date the financial statements were issued.
The following is a summary of significant accounting policies consistently followed by the Portfolio in the preparation of its financial statements.
Investment Valuation and Fair Value Measurements - Debt securities (other than short term obligations with a remaining maturity of sixty days or less), including corporate, convertible and municipal bonds and notes; obligations of the U.S. treasury and U.S. government agencies; sovereign issues; floating rate loans; and non-U.S. bonds, are generally valued on the basis of evaluated or composite bid quotations obtained from independent pricing services and/or brokers and dealers selected by MetLife Advisers, LLC (“MetLife Advisers” or the “Adviser”), an affiliate of MetLife, Inc., pursuant to authorization of the Board of Trustees of the Trust (the “Board” or “Trustees”). Such quotations utilize matrix pricing, which considers observable inputs including, among other things, issuer details, maturity dates, interest rates, yield curves, rates of prepayment, credit risks/spreads, default rates, reported trades, broker dealer quotes and quoted prices for similar securities. Securities that use similar valuation techniques and inputs as described above are generally categorized as Level 2 within the fair value hierarchy.
Mortgage and asset-backed securities are usually issued as separate tranches, or classes, of securities within each deal. These securities are also generally valued on the basis of evaluated or composite bid quotations obtained from independent pricing services and/or brokers and dealers selected by the Adviser pursuant to authorization of the Board. The pricing models for these securities usually consider tranche-level attributes, estimated cash flows and market-based yield spreads for each tranche and current market data, and incorporate deal collateral performance, as available. Mortgage and asset-backed securities that use similar valuation techniques and inputs as described above are generally categorized as Level 2 within the fair value hierarchy.
Short term obligations with a remaining maturity of sixty days or less are generally valued at amortized cost, which approximates fair market value, and are generally categorized as Level 2 within the fair value hierarchy.
Domestic and foreign equity securities, such as common stock, exchange-traded funds, rights, warrants, and preferred stock, that are traded on a securities exchange, are generally valued at their last sale price on the exchange or market in which they are principally traded on the valuation date, or, if no sales occurred on that day, at the last reported bid price. Equity securities traded over-the-counter are generally valued at the last reported sale price. Valuation adjustments may be applied to certain foreign equity securities that are traded solely on foreign exchanges that close before the close of the U.S. market to account for the market movement between the close of the foreign exchanges and the close of the U.S. market. The Portfolio may use a systematic fair valuation model provided by an independent third party to value securities principally traded in these foreign markets in order to adjust for possible stale pricing that may occur between the close of the foreign exchanges and the time of the Portfolio valuation. Foreign equity securities using these valuation adjustments are generally categorized as Level 2 within the fair value hierarchy. Equity securities that are actively traded, and have no valuation adjustments applied, are categorized as Level 1 within the fair value hierarchy. Other equity securities traded on inactive markets, or valued in reference to similar instruments traded on active markets, are generally categorized as Level 2 within the fair value hierarchy.
MSF-14
Metropolitan Series Fund
Loomis Sayles Small Cap Core Portfolio
Notes to Financial Statements—December 31, 2013—(Continued)
Investments in registered open-end management investment companies are valued at reported net asset value per share on the valuation date and are categorized as Level 1 within the fair value hierarchy.
Forward foreign currency exchange contracts are valued through an independent pricing service based on the mean between closing bid and ask prices of the forward currency rates in the London foreign exchange markets on a daily basis as provided by a reliable bank or dealer. These contracts are generally categorized as Level 2 within the fair value hierarchy.
Options, whether on securities, indices, futures contracts, or otherwise, traded on exchanges are valued at the last sale price available as of the close of business on the valuation date or, if there is no such price available, at the mean between the last reported bid and ask prices. These types of options are categorized as Level 1 within the fair value hierarchy. Futures contracts, which are traded on commodity exchanges, are valued at their closing prices as of the close of such exchanges and are categorized as Level 1 within the fair value hierarchy.
Options and futures contracts that are traded over-the-counter are generally valued on the basis of quotations provided by broker-dealers or prices provided by pricing service providers who use a series of techniques, including simulation pricing models, to determine the value of the contracts. The pricing models use inputs that are observed from actively quoted markets such as issuer details, indices, spreads, interest rates, yield curves, credit curves, measures of volatility and exchange rates. These contracts are generally categorized as Level 2 within the fair value hierarchy.
If no current market value quotation or other observable inputs are readily available or market value quotations are deemed to be unreliable for a security, the fair value of the security will be determined in accordance with procedures approved by and under the general supervision of the Board. In such a circumstance, the Board has delegated the determination of the fair value of a security to a Valuation Committee (“Committee”) of MetLife Advisers. The Committee provides general pricing oversight and fair value pricing determinations related to portfolio securities and meets on a regular basis to review reports relating to the valuation of the securities in the Portfolio. The Board has delegated to State Street Bank and Trust Company, the Trust’s custodian (“custodian”), the responsibility for calculating the net asset values (“NAVs”) of the Trust’s Portfolios. The Committee is responsible for overseeing the calculation of the NAVs of the Portfolios by the custodian. The Committee also periodically reviews pricing vendors, including the vendor providing fair value pricing for the Portfolio’s foreign securities, and is responsible for overseeing the correction of pricing errors and addressing other pricing issues that arise in the ordinary course of business, such as making real-time fair value determinations, as necessary.
No single standard for determining the fair value of a security can be set forth because fair value depends upon the facts and circumstances with respect to each security. Information relating to any relevant factors may be obtained by the Committee from any appropriate source, including the subadviser of the Portfolio, the custodian, a pricing service, market maker and/or broker for such security or the issuer. Appropriate methodologies for determining fair value under particular circumstances may include: matrix pricing, comparisons of securities with comparable characteristics, value based on multiples of earnings, discount from market price of similar marketable securities or a combination of these and other methods. The Committee maintains a detailed report tracking each fair-valued security that compares the fair value price to the next available trade, vendor or broker price, and provides information on how close the fair value price was to the next quoted price. The Committee reviews a summary of such report monthly. On a quarterly basis, the Board is provided with the following for consideration and ratification or adjustment: (1) a memorandum summarizing the actions taken by the Committee in the prior quarter; and (2) a list of the Portfolio’s securities as of the most recent quarter-end for which market quotations were not readily available.
Investment Transactions and Related Investment Income - Portfolio security transactions are recorded on the trade date. Dividend income is recorded on the ex-dividend date or, for certain foreign securities, when notified. Interest income, which includes amortization of premium and accretion of discount on debt securities, is recorded on the accrual basis. Realized gains and losses on investments are determined on the identified cost basis, which is the same basis used for federal income tax purposes. Foreign income and foreign capital gains on some foreign securities may be subject to foreign taxes, which are accrued as applicable. These foreign taxes have been provided for in accordance with the Portfolio’s understanding of the applicable countries’ tax rules and rates.
Income Taxes - It is the Portfolio’s policy to comply with the requirements of the Internal Revenue Code of 1986, as amended, and regulations thereunder, applicable to regulated investment companies and to distribute, with respect to each taxable year, all of its taxable income to shareholders. Therefore, no federal income tax provision is required. The Portfolio files U.S. federal tax returns. No income tax returns are currently under examination. The Portfolio’s federal tax returns for the prior three fiscal years remain subject to examination by the Internal Revenue Service. As of December 31, 2013, the Portfolio had no uncertain tax positions that would require financial statement recognition, or de-recognition or disclosure.
Dividends and Distributions to Shareholders - The Portfolio records dividends and distributions on the ex-dividend date. Net realized gains from security transactions (if any) are generally distributed annually to shareholders. The timing and characterization of certain income and capital gains distributions are determined in accordance with federal tax regulations that may differ from GAAP. Permanent book and tax basis differences relating to shareholder distributions will result in reclassification between under/over
MSF-15
Metropolitan Series Fund
Loomis Sayles Small Cap Core Portfolio
Notes to Financial Statements—December 31, 2013—(Continued)
distributed net investment income, accumulated net realized gains/losses, and paid-in surplus. Book-tax differences are primarily due to broker commission recapture reclasses and real estate investment trust (REIT) adjustments. These adjustments have no impact on net assets or the results of operations.
Securities Lending - The Portfolio may lend its portfolio securities to certain qualified brokers who borrow securities in order to complete certain securities transactions. By lending its portfolio securities, the Portfolio attempts to increase its net investment income through the receipt of income on collateral held from securities on loan. Any gain or loss in the market price of the loaned securities that might occur and any interest earned or dividends declared during the term of the loan would accrue to the account of the Portfolio.
The Trust has entered into a securities lending arrangement with the custodian. Under this arrangement, the custodian is authorized to loan portfolio securities on the Portfolio’s behalf. In exchange, the Portfolio receives either cash or securities as collateral against the loaned securities. The Portfolio receives collateral at least equal to 102% of the market value of the loaned securities (105% for foreign equity securities), at each loan’s inception. Collateral representing at least 100% of the market value of the loaned securities must be maintained for the duration of the loan. A liability for cash collateral is reflected on the Statement of Assets and Liabilities, and is categorized as Level 2 within the fair value hierarchy. Cash collateral is generally invested in the State Street Navigator Securities Lending MET Portfolio (the “Navigator Portfolio”), a series of the State Street Navigator Securities Lending Trust that is managed by an affiliate of the custodian. The Navigator Portfolio is a registered money market fund that invests in a variety of high-quality, U.S. dollar-denominated instruments. If the market value of the collateral at the close of trading on a business day is less than 100% of the market value of the loaned securities at the close of trading on that day, the borrower shall be required to deliver, by the close of business on the following business day, an additional amount of collateral, so that the total amount of posted collateral is equal to at least 100% of the market value of all the loaned securities as of such preceding day. A portion of net income (income after the deduction of expenses and fees of the Navigator Portfolio) on the collateral is rebated to the borrower of the securities and the remainder is split between the custodian and the Portfolio. On loans collateralized by U.S. Treasuries, a fee is received from the borrower and is allocated between the Portfolio and the custodian. The risks associated with lending portfolio securities include, but are not limited to, possible delays in receiving additional collateral or in the recovery of the loaned securities, possible loss of rights in the collateral should the borrower fail financially, as well as risk of loss in the value of the collateral or the value of the investments made with the collateral. The lending agent has agreed to indemnify the Portfolio in the case of default of any securities borrower. Income received by the Portfolio in securities lending transactions during the year ended December 31, 2013 is reflected as Securities lending income on the Statement of Operations. Any outstanding loans by the Portfolio at December 31, 2013 are disclosed in the footnotes to the Schedule of Investments.
Repurchase Agreements - The Portfolio may enter into repurchase agreements, under the terms of a Master Repurchase Agreement, with selected commercial banks and broker-dealers, under which the Portfolio acquires securities as collateral and agrees to resell the securities at an agreed upon time and at an agreed-upon price. The Portfolio, through the custodian or a subcustodian, receives delivery of the underlying securities collateralizing any repurchase agreements. The Portfolio requires the custodian to take possession, to have legally segregated in the Federal Reserve Book Entry System, or to have segregated within the custodian’s vault, all securities held as collateral for repurchase agreements. It is the Portfolio’s policy that the market value of the collateral be at least equal to 100% of the repurchase price in the case of a repurchase agreement of one-day duration and at least equal to 102% of the repurchase price in the case of all other repurchase agreements. In the event of default or failure by a party to perform an obligation in connection with any repurchase transaction, the Master Repurchase Agreement gives the non-defaulting party the right to set-off claims and to apply property held by it in connection with any repurchase transaction against obligations owed to it.
At December 31, 2013, the Portfolio had investments in repurchase agreements with a gross value of $6,131,000, which is included as part of investments at value on the Statement of Assets and Liabilities. The value of the related collateral exceeded the value of the repurchase agreements at December 31, 2013.
Directed Brokerage Agreement - The Trust has entered into a directed brokerage arrangement with State Street Global Markets (“SSGM”). Under this arrangement, the Portfolio directs certain trades to SSGM in return for a recapture credit. SSGM issues a cash rebate to the Portfolio. Amounts paid to the Portfolio are shown separately as broker commission recapture on the Statement of Operations of the Portfolio. Additionally, these amounts have been excluded from the calculation of the net ratio of expenses to average net assets presented in the Financial Highlights for each share class.
3. Certain Risks
Market Risk: In the normal course of business, the Portfolio invests in securities and enters into transactions where risks exist due to fluctuations in the market (market risk) or failure of the other party to a transaction to perform (credit and counterparty risk). The value of securities held by the Portfolio may decline in response to certain events, including those directly involving the companies whose securities are owned by the Portfolio; conditions affecting the general economy; overall market changes; local, regional or global political, social or economic instability; currency, interest rate, and price fluctuations.
MSF-16
Metropolitan Series Fund
Loomis Sayles Small Cap Core Portfolio
Notes to Financial Statements—December 31, 2013—(Continued)
Credit and Counterparty Risk: The Portfolio may be exposed to counterparty risk, or the risk that an entity with which the Portfolio has unsettled or open transactions may default. The potential loss could exceed the value of the financial assets and liabilities recorded in the financial statements. Financial assets that potentially expose the Portfolio to credit and counterparty risk consist principally of cash due from counterparties and investments. The Portfolio manages counterparty risk by entering into agreements only with counterparties that it believes have the financial resources to honor their obligations and by monitoring the financial stability of those counterparties. The Portfolio’s investment adviser attempts to mitigate counterparty risk by (i) periodically assessing the creditworthiness of its trading partners, (ii) monitoring and/or limiting the amount of its net exposure to each individual counterparty based on its assessment, and (iii) requiring collateral from the counterparty for certain transactions. In order to preserve certain safeguards for non-standard settlement trades, the Portfolio restricts its exposure to credit and counterparty losses by entering into master netting agreements with counterparties (approved brokers) with whom it undertakes a significant volume of transactions. Master Agreements govern the terms of certain transactions, and reduce the counterparty risk associated with relevant transactions by specifying credit protection mechanisms and providing standardization that improves legal certainty. Master Agreements can also help limit counterparty risk by specifying collateral posting arrangements at pre-arranged exposure levels.
Repurchase agreements are primarily executed under Global Master Repurchase Agreements (“GMRAs”) or Master Repurchase Agreements (“MRAs”), which provide the rights to set-off. Each repurchase agreement is initially collateralized at the transaction level. In the event of default, the total market value exposure will be offset against collateral exchanged to date, which would result in a net receivable/(payable) that would be due from/to the counterparty. Securities pledged as collateral are noted in the Schedule of Investments.
Additional risks associated with each type of investment are described above within the respective security type notes. The Portfolio’s prospectus includes a discussion of the principal risks of investing in the Portfolio.
4. Investment Transactions
Aggregate cost of purchases and proceeds of sales of investment securities, excluding short-term securities, for the year ended December 31, 2013 were as follows:
| | | | | | | | | | | | |
Purchases | | | Sales | |
U.S. Government | | Non U.S. Government | | | U.S. Government | | | Non U.S. Government | |
| $0 | | $ | 161,128,152 | | | $ | 0 | | | $ | 208,235,349 | |
5. Investment Management Fees and Other Transactions with Affiliates
Investment Management Agreement - MetLife Advisers is the investment adviser to the Portfolio. The Trust has entered into an investment management agreement with MetLife Advisers with respect to the Portfolio. For providing investment management services to the Portfolio, MetLife Advisers receives monthly compensation at the annual rates:
| | | | | | |
Management
Fees earned by
MetLife Advisers
for the year ended
December 31, 2013 | | % per annum | | | Average Daily Net Assets |
| $4,158,330 | | | 0.900 | % | | Of the first $500 million |
| | | 0.850 | % | | On amounts in excess of $500 million |
Certain officers and trustees of the Trust may also be officers of MetLife Advisers; however, such officers and trustees receive no compensation from the Trust.
MetLife Advisers has entered into an investment subadvisory agreement with respect to the Portfolio. Loomis, Sayles & Company, L.P. is compensated by MetLife Advisers to provide subadvisory services for the Portfolio.
Management Fee Waivers - Pursuant to an expense agreement, MetLife Advisers has agreed, for the period April 29, 2013 through April 27, 2014, to reduce its advisory fees set out above under “Investment Management Agreement” for each class of the Portfolio as follows:
| | |
% per annum | | Average Daily Net Assets |
| 0.050% | | Of the first $200 million |
| 0.100% | | On the next $300 million |
| 0.050% | | On amounts in excess of $500 million |
An identical expense agreement was in place for the period April 30, 2012 through April 28, 2013. Amounts waived for the year ended December 31, 2013 are shown as management fee waivers in the Statement of Operations.
MSF-17
Metropolitan Series Fund
Loomis Sayles Small Cap Core Portfolio
Notes to Financial Statements—December 31, 2013—(Continued)
Transfer Agency Agreement - MetLife serves as the transfer agent for the Trust. MetLife receives no fees for its services to the Trust under the transfer agency agreement.
Distribution and Service Fees - The Trust has a distribution agreement with MetLife Investors Distribution Company (“MIDC” or the “Distributor”) in which MIDC serves as the distributor for the Portfolio’s Class A, B and E Shares. MIDC is a wholly-owned subsidiary of MetLife Investors Group, Inc., an affiliate of the Adviser. The Trust has also adopted a Distribution and Service Plan under Rule 12b-1 of the 1940 Act for the Portfolio’s Class B and E Shares. Under the Distribution and Service Plan, the Class B and E Shares of the Portfolio pay a fee to compensate the Insurance Companies (or their affiliates) and other broker-dealers and financial intermediaries involved in the offer and sale of Portfolio shares for promoting or selling and servicing the Class B and E Shares. The fees under the Distribution and Service Plan for each class of the Portfolio’s shares are calculated as a percentage of the Portfolio’s average daily net assets that are attributable to that Class. Currently, the fee is 0.25% per year for Class B Shares and 0.15% per year for Class E Shares. Amounts incurred by the Portfolio for the year ended December 31, 2013 are shown as Distribution and service fees in the Statement of Operations.
Deferred Trustee Compensation - Each Trustee who is not currently an employee of the Adviser or any of its affiliates receives compensation from the Trust for his or her service to the Trust. A deferred compensation plan (the “Plan”) is available to the Trustees on a voluntary basis. Deferred amounts remain in the Trust until distributed in accordance with the provisions of the Plan. The value of a participating Trustee’s deferral account is based on theoretical investments of deferred amounts, on the normal payment dates in certain portfolios of the Trust or Met Investors Series Trust, an affiliate of the Trust, as designated by the participating Trustee. Changes in the value of participants’ deferral accounts are reflected as Trustees’ fees and expenses in the Statement of Operations. The portion of the accrued obligations allocated to the Portfolio under the Plan is reflected as Deferred trustees’ fees in the Statement of Assets and Liabilities.
6. Contractual Obligations
Under the Trust’s organizational documents, its officers and Trustees may be indemnified against certain liabilities and expenses arising out of the performance of their duties to the Trust. Additionally, the Trust has a variety of indemnification obligations under contracts with its service providers. The Trust’s maximum exposure under these arrangements is unknown, as this would involve future claims that may be made against the Trust that have not yet occurred.
7. Income Tax Information
The tax character of distributions paid for the periods ended December 31, 2013 and 2012 was as follows:
| | | | | | | | | | | | | | | | | | | | |
Ordinary Income | | | Long-Term Capital Gain | | | Total | |
2013 | | 2012 | | | 2013 | | | 2012 | | | 2013 | | | 2012 | |
| $1,614,646 | | $ | — | | | $ | 34,562,081 | | | $ | 10,340,921 | | | $ | 36,176,727 | | | $ | 10,340,921 | |
As of December 31, 2013, the components of distributable earnings (accumulated losses) on a federal income tax basis were as follows:
| | | | | | | | | | | | | | | | |
Undistributed
Ordinary
Income | | Undistributed
Long-Term
Capital Gain | | | Net
Unrealized
Appreciation | | | Loss Carryforwards | | | Total | |
| $4,762,109 | | $ | 60,107,878 | | | $ | 182,357,336 | | | $ | — | | | $ | 247,227,323 | |
The Portfolio utilizes the provisions of the federal income tax laws that provide for the carryforward of capital losses for prior years, offsetting such losses against any future realized capital gains. Under the Regulated Investment Company Modernization Act of 2010 (the “Act”), net capital losses recognized after December 22, 2010 may be carried forward indefinitely and their character is retained as short-term and/or long-term losses. Previously, net capital losses were carried forward for up to eight years and treated as short term losses. As a transition rule, the Act requires that post-enactment net capital losses be used before pre-enactment net capital losses.
As of December 31, 2013, the Portfolio had no post-enactment accumulated capital losses and no pre-enactment accumulated capital loss carryforwards.
MSF-18
Metropolitan Series Fund
Loomis Sayles Small Cap Core Portfolio
Report of Independent Registered Public Accounting Firm
To the Shareholders of Loomis Sayles Small Cap Core Portfolio and the Board of Trustees of Metropolitan Series Fund:
We have audited the accompanying statement of assets and liabilities, including the schedule of investments, of Loomis Sayles Small Cap Core Portfolio, one of the portfolios constituting Metropolitan Series Fund (the “Trust”) as of December 31, 2013, and the related statement of operations for the year then ended, the statements of changes in net assets for each of the two years in the period then ended, and the financial highlights for each of the five years in the period then ended. These financial statements and financial highlights are the responsibility of the Trust’s management. Our responsibility is to express an opinion on these financial statements and financial highlights based on our audits.
We conducted our audits in accordance with the standards of the Public Company Accounting Oversight Board (United States). Those standards require that we plan and perform the audit to obtain reasonable assurance about whether the financial statements and financial highlights are free of material misstatement. The Trust is not required to have, nor were we engaged to perform, an audit of its internal control over financial reporting. Our audits included consideration of internal control over financial reporting as a basis for designing audit procedures that are appropriate in the circumstances, but not for the purpose of expressing an opinion on the effectiveness of the Trust’s internal control over financial reporting. Accordingly, we express no such opinion. An audit also includes examining, on a test basis, evidence supporting the amounts and disclosures in the financial statements, assessing the accounting principles used and significant estimates made by management, as well as evaluating the overall financial statement presentation. Our procedures included confirmation of securities owned as of December 31, 2013, by correspondence with the custodian and brokers; where replies were not received from brokers, we performed other auditing procedures. We believe that our audits provide a reasonable basis for our opinion.
In our opinion, the financial statements and financial highlights referred to above present fairly, in all material respects, the financial position of Loomis Sayles Small Cap Core Portfolio of Metropolitan Series Fund as of December 31, 2013, the results of its operations for the year then ended, the changes in its net assets for each of the two years in the period then ended, and the financial highlights for each of the five years in the period then ended, in conformity with accounting principles generally accepted in the United States of America.
Deloitte & Touche LLP
Boston, Massachusetts
February 26, 2014
MSF-19
Metropolitan Series Fund
Trustees and Officers of Metropolitan Series Fund
The Trustees and executive officers of the Trust, their ages and their principal occupations during the past five years are set forth below. Unless otherwise indicated, the business address of each is One Financial Center, Boston, MA 02111. Each Trustee who is deemed an “interested person,” as such term is defined in the 1940 Act, is indicated by an asterisk. Those Trustees who are not “interested persons” as defined in the 1940 Act are referred to as “Independent Trustees.” Additional information about the Trustees is available in the Statement of Additional Information, which is available without charge, upon request, by calling (800) 848-3854.
Trustees of the Trust
| | | | | | | | | | |
Name and Age | | Position(s)
Held with
Registrant | | Term of Office
and Length of
Time Served | | Principal Occupation(s) During the Past 5
Years(1) | | Number of
Portfolios
in Fund
Complex(2)
overseen | | Other Directorships Held
by Trustee During the
Past 5 Years(1) |
| Interested Trustee | | | | | | | | | | |
| Elizabeth M. Forget* (47) | | Trustee, Chairman of the Board, President and Chief Executive Officer | | Indefinite;
From
May
2006
(President
and Chief
Executive
Officer)/
August
2006
(Trustee
and
Chairman
of the
Board) to
present | | Senior Vice President, MetLife Inc.; President, MetLife Advisers, LLC and a predecessor company. | | 79 | | Trustee, Met Investors Series Trust (the “MIST Trust”);** various MetLife-affiliated boards. |
| | | | | |
| Independent Trustees | | | | | | | | | | |
| Stephen M. Alderman (54) | | Trustee | | Indefinite;
From
April
2012 to
present | | Shareholder in the law firm of Garfield & Merel, Ltd. | | 79 | | Trustee, MIST Trust;** Director, International Truck Leasing Corp. |
| | | | | |
| Robert J. Boulware (57) | | Trustee | | Indefinite;
From
April
2012 to
present | | Managing Director, Pilgrim Funds, LLC (private equity fund). | | 79 | | Trustee, MIST Trust;** Trustee, Vertical Capital Income Fund (closed-end fund); Director, Gainsco, Inc. (auto insurance). |
| | | | | |
| Susan C. Gause (61) | | Trustee | | Indefinite;
From
April
2012 to
present | | Private Investor. | | 79 | | Trustee, MIST Trust;** Trustee, HSBC Funds. |
| | | | | |
| Nancy Hawthorne (62) | | Trustee | | Indefinite;
From
May
2003 to
present | | Chief Executive Officer, Clerestory LLC (corporate advisor). | | 79 | | MIST Trust;** Director, THL Credit, Inc.**; Director, Avid Technology, Inc.** |
| | | | | |
| Barbara A. Nugent (57) | | Trustee | | Indefinite;
From
January
2014 to
present | | President, True North Board Governance, LLC (consulting); until 2014, partner in the law firm of Stradley Ronon Stevens & Young, LLP. | | 79 | | Trustee, MIST Trust**; Director, Episcopal Healthcare Foundation; until 2014, member, Mutual Fund Directors Forum Advisory Board. |
MSF-20
Metropolitan Series Fund
Trustees and Officers of Metropolitan Series Fund—(Continued)
| | | | | | | | | | |
Name and Age | | Position(s)
Held with
Registrant | | Term of Office
and Length of
Time Served | | Principal Occupation(s) During the Past 5
Years(1) | | Number of
Portfolios
in Fund
Complex(2)
overseen | | Other Directorships Held
by Trustee During the
Past 5 Years(1) |
| Keith M. Schappert (62) | | Trustee | | Indefinite;
From
August
2009 to
present | | Principal, Schappert Consulting LLC (asset management consulting). | | 79 | | Trustee, MIST Trust;** Director, The Commonfund for Nonprofit Organizations; until 2011, Director, Trilogy Global Advisors; Director, Mirae Asset Discovery Funds,** Director, Calamos Investments. |
| | | | | |
| Linda B. Strumpf (66) | | Trustee | | Indefinite;
From
May
2000 to
present | | Chair of the Investment Committee, Leona M. and Harry B. Helmsley Charitable Trust; until 2011, Chief Investment Officer, Leona M. and Harry B. Helmsley Charitable Trust. | | 79 | | Since 2012, Trustee, MIST Trust,** Trustee and Member of Investment Committee, The Pennsylvania State University. |
| | | | | |
| Dawn M. Vroegop (47) | | Trustee | | Indefinite;
From
May
2009 to
present | | Private Investor. | | 79 | | Trustee, MIST Trust,** Trustee, Driehaus Mutual Funds; Director and Investment Committee Chair, City College of San Francisco Foundation. |
Executive Officers of the Trust
| | | | | | |
Name and Age | | Position(s) Held with
Registrant | | Term of Office
and Length of
Time Served | | Principal Occupation(s) During Past 5 Years(1) |
| Elizabeth M. Forget (47) | | President, Chief Executive Officer, Trustee and Chairman of the Board | | From May
2006 (President
and Chief
Executive
Officer)/
August 2006
(Trustee and
Chairman of
the Board) to
present | | See principal occupation information in the table above. |
| | | |
| Jeffrey L. Bernier (42) | | Vice President | | From February
2008 to present | | Vice President, MetLife, Inc.; Senior Vice President, MetLife Advisers, LLC and a predecessor company. |
| | | |
| Peter H. Duffy (58) | | Chief Financial Officer and Treasurer | | From November
2000 to present | | Senior Vice President, MetLife Advisers, LLC; Vice President, MetLife, Inc. |
| | | |
| Andrew L. Gangolf (59) | | Secretary | | From May
2011to present | | Senior Vice President, MetLife Advisers, LLC; Senior Vice President & Assistant General Counsel, AllianceBerstein Investments, Inc. |
| | | |
| Jeffrey P. Halperin (46) | | Chief Compliance Officer | | From November
2005 to present | | Vice President, MetLife, Inc.; Chief Compliance Officer, MIST; Chief Compliance Officer, MSF Trust; Chief Compliance Officer, MetLife Advisers, LLC and a predecessor company; Chief Compliance Officer, MetLife Investment Management, LLC (formerly MetLife Investment Advisors Company, LLC). |
| | | |
| Alan C. Leland, Jr. (61) | | Vice President | | From February
2005 to present | | Treasurer and Chief Financial Officer, MetLife Advisers, LLC; Vice President, MetLife Group Inc.; Vice President, MetLife, Inc. |
| * | Ms. Forget is an “interested person” of the Trust because of her positions with MetLife Advisers, LLC and her ownership of securities issued by MetLife, Inc., the ultimate parent company of MetLife Advisers, LLC. |
| ** | Indicates a directorship with a registered investment company or a company subject to the reporting requirements of the Securities Exchange Act of 1934, as amended. |
| (1) | Previous positions during the past five years with the Trust, MetLife, Inc. or the Adviser are omitted if not materially different. |
| (2) | The Fund Complex includes 49 Portfolios of the MIST Trust and 30 Portfolios of the Trust. |
MSF-21
Metropolitan Series Fund
Loomis Sayles Small Cap Core Portfolio
Board of Trustees’ Consideration of Advisory and Sub-Advisory Agreements
At an in-person meeting of the Boards of Trustees (the “Board”) of Met Investors Series Trust and Metropolitan Series Fund (“MIST” and “MSF,” respectively, and collectively, the “Trusts”) held on November 19-20, 2013, the Board, including a majority of the Trustees who are not considered to be “interested persons” of the Trusts (the “Independent Trustees”) under the Investment Company Act of 1940, as amended (the “1940 Act”), approved for an annual period the continuation of each Trust’s advisory agreement (the “Advisory Agreement”) with MetLife Advisers, LLC (the “Adviser”) and the applicable sub-advisory agreements (each a “Sub-Advisory Agreement,” and collectively with the Advisory Agreement, the “Agreements”) between the Adviser and the investment sub-advisers (each a “Sub-Adviser,” and collectively, the “Sub-Advisers”) for each of the series of the Trusts, including the Loomis Sayles Small Cap Core Portfolio (each a “Portfolio,” and collectively, the “Portfolios”).1
In considering the Agreements, the Board reviewed a variety of materials provided by the Adviser and the Sub-Advisers relating to the Portfolios, including comparative performance, fee and expense information for an appropriate peer group of similar mutual funds, performance information for relevant benchmark indices and other information regarding the nature, extent and quality of services provided by the Adviser and the Sub-Advisers under their respective Agreements. The Board also took into account its experience with the Adviser and the Sub-Advisers and information provided to the Board in its meetings throughout the year with respect to the services provided by the Adviser and the Sub-Advisers, including quarterly performance reports prepared by management containing reviews of investment results, and periodic presentations from certain of the Sub-Advisers with respect to the Portfolios they manage. The Independent Trustees also assessed reports provided by the Board’s independent consultant, who reviewed and provided analyses regarding investment performance, fees and expenses, and other information provided by, or at the direction of, the Adviser and the Sub-Advisers, as more fully discussed below.
The Independent Trustees were separately advised by independent legal counsel throughout the process, and met with independent legal counsel in periodic executive sessions. Prior to voting to continue the Agreements at the November meeting, the Independent Trustees also received a memorandum from their independent counsel discussing the legal standards for their consideration of the proposed continuation of the Agreements. The Board also met in person with personnel of the Adviser on September 17, 2013 for the specific purpose of giving preliminary consideration to the proposed continuation of the Agreements and to request additional information they considered reasonably necessary to their deliberations. The Independent Trustees also discussed the proposed continuation of the Agreements in private sessions with their independent legal counsel at which no representatives of management were present.
In considering whether to approve the renewal of the Advisory Agreement with the Adviser and any applicable Sub-Advisory Agreements with respect to a Portfolio, the Board reviewed and analyzed the factors it deemed relevant, including: (1) the nature, extent and quality of the services to be provided to the Portfolios by the Adviser and the Sub-Advisers; (2) the performance of the Portfolios as compared to a peer group and an appropriate index; (3) the Adviser’s and each of the Sub-Adviser’s personnel and operations; (4) the financial condition of the Adviser and of the Sub-Advisers; (5) the level and method of computing each Portfolio’s advisory and sub-advisory fees; (6) the profitability of the Adviser under the Advisory Agreement and of certain of the Sub-Advisers under the Sub-Advisory Agreements; (7) any “fall-out” benefits to the Adviser, the Sub-Advisers and their affiliates (i.e., ancillary benefits realized by the Adviser, the Sub-Advisers or their affiliates from the Adviser’s or Sub-Advisers’ relationship with the Trusts); (8) the anticipated effect of growth in size on Portfolio expenses; (9) fees paid to certain of the Sub-Advisers by comparable institutional and retail accounts; and (10) possible conflicts of interest.
Nature, extent and quality of services. The Board evaluated the nature, extent and quality of the services that the Adviser, and the Sub-Advisers as relevant, have provided to the Portfolios. The Board considered the Adviser’s services as investment manager to the Portfolios, including services relating to the selection and oversight of the Sub-Advisers for the applicable Portfolios. The Board considered, among other things, the Adviser’s oversight of the provision of services to the Portfolios by the Sub-Advisers, including with respect to investment activities and trading practices, and the Sub-Adviser’s compliance with fund policies, objectives and Board directives, compliance policies and procedures and applicable law. The Adviser’s services in coordinating and overseeing the activities of the Trusts’ other service providers were also considered. The Board also evaluated the expertise and performance of the personnel of the Adviser who performed services for the Portfolios throughout the year.
The Board considered information received from the Trust’s Chief Compliance Officer (“CCO”) regarding the Portfolios’ compliance policies and procedures established pursuant to Rule 38a-l under the 1940 Act. The Board also evaluated the CCO’s ongoing reports concerning the CCO’s oversight of the risk assessment processes of the Sub-Advisers.
1 The Pyramis Managed Risk Portfolio recently commenced operations and, therefore, the Agreement with respect to this Portfolio was not up for renewal.
MSF-22
Metropolitan Series Fund
Loomis Sayles Small Cap Core Portfolio
Board of Trustees’ Consideration of Advisory and Sub-Advisory Agreements—(Continued)
With respect to the services provided by each of the Sub-Advisers, the Board considered, among other things, information provided to the Board by each Sub-Adviser. The Board considered the Sub-Adviser’s current level of staffing and its overall resources, as well as its compensation program. The Board reviewed each Sub-Adviser’s history and investment experience, as well as information regarding the qualifications, background and responsibilities of the Sub-Adviser’s investment and compliance personnel who provide services to the Portfolios. The Board also considered, among other things, the Sub-Adviser’s compliance program and any disciplinary history. The Board also took into account the Sub-Adviser’s risk assessment and monitoring process. The Board noted each Sub-Adviser’s regulatory history, including whether it was currently involved in any regulatory actions or investigations as well as material litigation, and any settlements and amelioratory actions undertaken, as appropriate. The Board also noted that the CCO and his staff conduct regular, periodic compliance reviews with each of the Sub-Advisers and present reports to the Independent Trustees regarding the same, which includes evaluating the regulatory compliance systems of the Sub-Advisers and procedures reasonably designed by them to help assure compliance with the federal securities laws, including issues related to late trading and market timing, best execution, fair value pricing, and proxy voting procedures, among others. The Board also took into account the financial condition of each Sub-Adviser. In its review, the Board also received and took into account information regarding any services and/or payments provided to the Adviser by the Sub-Advisers in connection with marketing activities.
The Board considered each Sub-Adviser’s investment process and philosophy. The Board took into account that each Sub-Adviser’s responsibilities include the development and maintenance of an investment program for the applicable Portfolio which is consistent with the Portfolio’s investment objectives, the selection of investment securities and the placement of orders for the purchase and sale of such securities, as well as the implementation of compliance controls related to performance of these services. The Board also reviewed each Sub-Adviser’s brokerage policies and practices.
Performance. The Board considered the performance of the Portfolios as described in the quarterly reports prepared by management, and as also analyzed in reports prepared by the Independent Trustees’ independent consultant. The Board noted that the Adviser reviews with the Board on a quarterly basis detailed information about the Portfolios’ performance results, portfolio composition and investment strategies. The Board also reviewed and considered a separate report prepared by Lipper Inc. (“Lipper”), an independent third party, which provided a statistical analysis comparing the Portfolios’ investment performance, expenses, and fees to comparable funds underlying variable insurance products (the “Performance Universe”). In addition, the Independent Trustees met separately with a representative of Bobroff Consulting, Inc., an independent consultant (“Bobroff), at a special board meeting in September 2013, to review the separate reports prepared by such consultant (“Bobroff Report”), which analyzed the report prepared by Lipper. The Board also considered each Portfolio’s more recent performance subsequent to the performance period covered by the Lipper reports, and management’s discussion of the same, including the effect of current market conditions on each Portfolio’s more recent performance.
The Board reviewed the Portfolios’ performance records and the Adviser’s and Sub-Advisers’ management styles and long-term performance records with the Portfolios and comparable funds. The Board focused particular attention on Portfolios with less favorable performance records. The Board was mindful of the Adviser’s focus on each Sub-Adviser’s performance and noted that the Adviser has been active in monitoring and responding to any performance issues with respect to the Portfolios. The Board also took into account its discussions with management regarding factors that contributed to the performance of the Portfolios.
Among other data relating specifically to the Loomis Sayles Small Cap Core Portfolio’s performance, the Board considered that the Portfolio outperformed the median of its Performance Universe and its Lipper Index for the one-, three- and five-year periods ended June 30, 2013. The Board further considered that the Portfolio outperformed its benchmark, the Russell 2000 Index, for the one-, three- and five year periods ended October 31, 2013.
Fees and Expenses. The Board gave consideration to the advisory fees payable under the Advisory Agreement and the sub-advisory fees payable under each of the Sub-Advisory Agreements. In this regard, the Board reviewed the advisory fees payable on a Portfolio-by-Portfolio basis based on information provided by the Adviser. The Independent Trustees, with the assistance of Bobroff, also examined the fees paid by a Portfolio in light of fees paid to other investment managers by comparable funds, as well as considered the fees charged by the Adviser to manage other comparable funds, as applicable. The Lipper report included comparisons of the Adviser’s fee schedule with that of its peers based on an asset-based analysis of relative fee structures according to the size of the Portfolio. In addition, the Board considered the Portfolios’ advisory and sub-advisory fees and total expenses as compared to similarly situated investment companies underlying variable insurance products deemed to be comparable to the Portfolios as determined by Lipper. The Board considered a Portfolio’s ranking within a smaller group of peer funds chosen by Lipper (the “Expense Group”), as well as the Portfolio’s ranking within broader groups of funds (the “Expense Universe” and the “Sub-advised Expense Universe”). The Board also considered a Portfolio’s contractual sub-advisory fees, as applicable, as compared to the Sub-advised Expense Universe as well as a
MSF-23
Metropolitan Series Fund
Loomis Sayles Small Cap Core Portfolio
Board of Trustees’ Consideration of Advisory and Sub-Advisory Agreements—(Continued)
smaller group of funds (the “Sub-advised Expense Group”). In comparing a Portfolio’s actual and contractual management fee to that of comparable funds, the Board noted that such fee includes both advisory and administrative fees.
The Board noted that the sub-advisory fees for the Portfolios are paid by the Adviser, not the Portfolios, out of the advisory fee. It was further noted that the Adviser negotiates such fees at arm’s length. The Board also considered that the Adviser had entered into expense limitation agreements with certain of the Portfolios, pursuant to which the Adviser has agreed to waive a portion of its advisory fee and/or reimburse certain expenses as a means of limiting a Portfolio’s total annual operating expenses. The Board further considered the amount of sub-advisory fees paid out by the Adviser and the amount of the management fees that it retained in light of the services performed by Sub-Advisers and Adviser, respectively.
With respect to the Loomis Sayles Small Cap Core Portfolio, the Board considered that the Portfolio’s actual management fees were above its Expense Group median and Expense Universe median, and below its Sub-advised Expense Universe median. The Board also considered that the Portfolio’s total expenses (exclusive of 12b-l fees) were above the Expense Group median and below the Expense Universe median and the Sub-advised Expense Universe median. The Board noted that the Portfolio’s contractual management fees were above the asset-weighted average of the Expense Group at the Portfolio’s current size. The Board further noted that the Portfolio’s contractual sub-advisory fees were below the average of the Sub-advised Expense Group at the Portfolio’s current size and were slightly above the average of the Sub-advised Expense Universe at the Portfolio’s current size. The Board took into account management’s discussion of the Portfolio’s expenses. The Board also considered that the Adviser had waived fees and/or reimbursed expenses during the past year.
Profitability. The Board examined the profitability of the Adviser on a Portfolio-by-Portfolio basis. The Board also considered that the Distributor, MetLife Investors Distribution Company, receives Rule 12b-1 payments to support the distribution of the products. The Board considered the profitability to the Sub-Advisers and their affiliates as a result of their relationships with the Portfolios, and the Board considered the ability of the Adviser to negotiate the Sub-Advisory Agreements and the fees thereunder at arm’s length. The Board also reviewed Portfolio specific data with regard to the profitability of the Portfolios to each Sub-Adviser, as available.
Economies of scale. The Board also considered the effect of the Portfolios’ growth in size on their fees. The Board noted that the fee schedules for most of the Portfolios contain breakpoints that reduce the fee rate above specified asset levels. The Board noted those Portfolios that did not contain breakpoints in the advisory fee and took into account management’s discussion of the same. The Board noted that those Portfolios with advisory fee schedules containing breakpoints generally reflect the inclusion of breakpoints in the sub-advisory fee schedule for such Portfolios. The Board considered the effective fees under the Advisory Agreement for a Portfolio as a percentage of assets at different asset levels and possible economies of scale that may be realized if the assets of the Portfolio grow. Among other data, the Board examined the effect of a Portfolio’s growth in size on various fee schedules and reviewed the Lipper and Bobroff Reports, which compared fees among peers. The Board also generally noted that if a Portfolio’s assets increase over time, the Portfolio may realize other economies of scale if assets increase proportionally more than certain other fixed expenses. In addition, the Board noted that the Adviser had taken a number of steps to date intended to share the benefits of economies of scale with contractholders.
With respect to the Loomis Sayles Small Cap Core Portfolio, the Board noted that the Portfolio’s advisory fee and sub-advisory fee each contains breakpoints that reduce the advisory fee rate on assets above certain specified asset levels. The Board considered the fact that the Portfolio’s fee levels decline as portfolio assets increase.
Other factors. As part of its evaluation of the Adviser’s compensation, the Board considered other benefits that may be realized by the Adviser and its affiliates from their relationship with the Trusts. Among them, the Board recognized that an affiliate of the Adviser, MetLife Investors Distribution Company, serves as the Distributor for the Trusts, and, as such, receives payments pursuant to Rule 12b-1 from the Portfolios to compensate it for providing shareholder services and selling activities, which could lead to growth in the Trusts’ assets and corresponding benefits from such growth, including economies of scale. The Board also considered that affiliates of the Adviser may benefit from certain indirect tax benefits relating to dividend received deductions and foreign tax credits. In conjunction with these considerations, the Board noted the costs of providing investment management and other services to the Portfolios and the ongoing commitment of the Adviser to the Portfolios.
The Board considered other benefits that may be realized by each Sub-Adviser and its affiliates from their relationship with the Trusts, including the opportunity to provide advisory services to additional portfolios of the Trusts and reputational benefits. In conjunction with these considerations, the Board noted the costs of providing investment advisory services to the Portfolios and the ongoing commitment of the Sub-Advisers to the Portfolios.
MSF-24
Metropolitan Series Fund
Loomis Sayles Small Cap Core Portfolio
Board of Trustees’ Consideration of Advisory and Sub-Advisory Agreements—(Continued)
The Board considered possible conflicts of interest in the form of material benefits or detriments to the Trusts resulting from the nature of the Trusts’ and the Adviser’s or the Sub-Advisers’ affiliations and the services that are provided to the Trusts, and the manner in which such conflicts were mitigated.
Conclusions. After full consideration of the factors discussed above, the Board, including a majority of the Independent Trustees, approved the Advisory Agreement and the Sub-Advisory Agreement, as applicable, with respect to each Portfolio, unless otherwise noted. In making its approvals, the Board concluded that the nature, extent and quality of services provided by the Adviser and each Sub-Adviser supported the renewal of the Agreements. The Board also concluded that the investment performance of each Fund was such that each Agreement should continue. In addition, the Board concluded that fees paid by a Portfolio to the Adviser and, if applicable, the Sub-Adviser appeared to be acceptable in light of nature, extent and quality of the services provided by the Adviser and Sub-Adviser. Further, the Board concluded that the Adviser’s profitability in providing services under the Advisory Agreements did not appear unreasonably high in light of the nature, extent and quality of the services provided by the Adviser. Finally, the Board concluded that the Advisory and Sub-Advisory fees in some measure share economies of scale with contractholders. In approving the renewal of each of the Agreements, the Board, including the Independent Trustees, did not identify any single factor as controlling, and generally attributed different weights to various factors for the various Portfolios. The Board evaluated all information available to them on a Portfolio-by-Portfolio basis, and their decisions were made separately with respect to each Portfolio.
MSF-25
Metropolitan Series Fund
Loomis Sayles Small Cap Growth Portfolio
Managed By Loomis, Sayles & Company, L.P.
Portfolio Manager Commentary*
PERFORMANCE
For the one year period ended December 31, 2013, the Class A, B, and E shares of the Loomis Sayles Small Cap Growth Portfolio returned 48.70%, 48.38%, and 48.54%, respectively. The Portfolio’s benchmark, the Russell 2000 Growth Index1, returned 43.30%.
MARKET ENVIRONMENT / CONDITIONS
2013 was a strong year for most domestic equity markets. Central banks throughout the world were friendly, fundamental stress in Europe faded and the U.S. showed signs of improving economic growth. The labor and housing markets were no longer drags on U.S. growth prospects and the Federal Reserve maintained low interest rates and continued to pump stimulus money into the system.
The factors at play in the small cap market persisted throughout most of the year. Three factors in particular, quality, size and growth, impacted performance. Lower quality companies appeared to outperform for the year, in general. However, this was not entirely the case. If you strip out non-earners (money losing companies), which are largely biotechnology, the non-earners group underperformed for the year and a different picture emerges. Non-earning companies in the Russell 2000 Growth Index returned 50.65% for the year, however when you strip out healthcare, that return is only 28.96%.
Growth was another factor that had a large influence on performance. For the year, those companies growing the fastest were the strongest performers. Given the nature of our Portfolio, this factor provided a tailwind for us during the year, contributing to our ability to outperform. Those companies with long-term earnings growth of less than 10% in the Russell 2000 Growth Index returned 44.2% for the year, while those companies with long-term earnings growth of more than 20% returned 47.6%.
PORTFOLIO REVIEW / PERIOD END POSITIONING
The Portfolio outperformed its benchmark, the Russell 2000 Growth Index, in 2013. Excess return was driven almost entirely by stock selection. Particularly strong stock selection was seen in the Industrials, Financials, and Health Care sectors. Within those sectors, Professional Services, Capital Markets, and Biotechnology were particularly strong. Stock selection in the Information Technology sector, particularly the Semiconductors industry contributed negatively to relative performance.
The largest individual contributors to performance were WageWorks, Financial Engines, and Alkermes. WageWorks reported strong quarterly results, raised their target for organic growth for the year, and continued to execute strategic acquisitions that further augmented growth. The stock had also been helped as the Affordable Care Act has increased the role of consumer- and employee-driven benefits. Financial Engines (“FNGN”) is a provider of investment advice to 401(k) plan participants via a quantitative model developed by Nobel Laureate Bill Sharpe. FNGN reported another strong quarter with robust adoption rates and a positive outlook for the remainder of the year, which pushed share prices higher. Also among our top contributors was Alkermes (“ALKS”), a biotech company that develops treatments for central nervous system disorders such as addiction, schizophrenia and depression. While ALKS continues to report solid fundamentals in its core business, it was the increased focus on their proprietary drug pipeline that has been driving its stock price higher. In particular, ALKS reported encouraging results for its phase two clinical trials for a new anti-depression drug, which had been largely unanticipated.
The largest detractors from performance during the year were Tile Shop, Emeritus Corp., and Ellie Mae, Inc. Tile Shop shares declined amidst a number of reports during the year relating to negative test results on products, potential accounting issues and questions surrounding the effectiveness of senior management. The rumors resulted in an increased short interest in the company, pressuring shares. Another detractor from performance was Emeritus Corp. (“ESC”), a provider of assisted living and retirement communities in North America. Like other real estate securities (including Real Estate Investment Trusts or REITs), ESC is sensitive to changes in interest rates. Shares of ESC declined sharply when interest rates increased in the wake of Federal Reserve Chairman Bernanke’s indication that Quantitative Easing programs would be tapered off. Ellie Mae, Inc. (“ELLI”), is a leading provider of enterprise level, on-demand automated solutions for the residential mortgage industry. Despite improving business fundamentals, negative sentiment around the ability of ELLI to sustain its high organic growth rate triggered a selloff in the stock.
Changes to the sector weights were modest resulting in no material change to the positioning of the Portfolio. As a result of individual stock selection, and the Portfolio’s holdings faring better than the benchmark’s during the year, sector weights in the Consumer Discretionary sector, in particular the Auto Components and Textiles Apparel & Luxury Goods industries, and to a lesser extent in the Industrial sector, increased. Two sectors that witnessed the largest decrease in sector weight relative to the benchmark were Information Technology, particularly the Software and Communications Equipment industries and Health Care, particularly the Biotechnology industry. The changes were largely due to stock selection. The Portfolio seeks high-quality under-exploited growth stocks. Our
MSF-1
Metropolitan Series Fund
Loomis Sayles Small Cap Growth Portfolio
Managed By Loomis, Sayles & Company, L.P.
Portfolio Manager Commentary*—(Continued)
bottom-up fundamental research and discounted cash flow valuation discipline help us identify these differentiated growth opportunities. Risk management is applied from the stock level to the portfolio level and from the buy discipline through the sell discipline. The Portfolio represents small cap growth investing with a low volatility approach.
Mark Burns
John Slavik
Portfolio Managers
Loomis, Sayles & Company, L.P.
* This commentary may include statements that constitute “forward-looking statements” under the U.S. securities laws. Forward-looking statements include, among other things, projections, estimates, and information about possible or future results related to the Portfolio, market or regulatory developments. The views expressed above are not guarantees of future performance or economic results and involve certain risks, uncertainties and assumptions that could cause actual outcomes and results to differ materially from the views expressed herein. The views expressed above are subject to change at any time based upon economic, market, or other conditions and the subadvisory firm undertakes no obligation to update the views expressed herein. Any discussions of specific securities should not be considered a recommendation to buy or sell those securities. The views expressed above (including any forward-looking statement) may not be relied upon as investment advice or as an indication of the Portfolio’s trading intent. Information about the Portfolio’s holdings, asset allocation or country diversification is historical and is not an indication of future Portfolio composition, which may vary. Direct investment in any index is not possible. The performance of any index mentioned in this commentary has not been adjusted for ongoing management, distribution and operating expenses, and sales charges applicable to mutual fund investments. In addition, the returns do not reflect additional fees charged by separate accounts or variable insurance contracts that an investor in the Portfolio may pay. If these additional fees were reflected, performance would have been lower.
MSF-2
Metropolitan Series Fund
Loomis Sayles Small Cap Growth Portfolio
A $10,000 INVESTMENT COMPARED TO THE RUSSELL 2000 GROWTH INDEX

AVERAGE ANNUAL RETURNS (%) (FOR THE YEAR ENDED DECEMBER 31, 2013)
| | | | | | | | | | | | |
| | | 1 Year | | | 5 Year | | | 10 Year | |
| Loomis Sayles Small Cap Growth Portfolio | | | | | | | | | | | | |
Class A | | | 48.70 | | | | 23.85 | | | | 8.68 | |
Class B | | | 48.38 | | | | 23.56 | | | | 8.42 | |
Class E | | | 48.54 | | | | 23.70 | | | | 8.53 | |
| Russell 2000 Growth Index | | | 43.30 | | | | 22.58 | | | | 9.41 | |
1 The Russell 2000 Growth Index is an unmanaged measure of performance of those Russell 2000 companies (small capitalization companies) that have higher price-to book ratios and higher forecasted growth values.
Portfolio performance is calculated including reinvestment of all income and capital gain distributions. Performance numbers are net of all Portfolio expenses but do not include any insurance, sales, separate account or administrative charges of variable annuity or life insurance contracts or any additional expenses that participants may bear relating to the operations of their plans. If these charges were included, the returns would be lower. The performance of any index referenced above has not been adjusted for ongoing management, distribution and operating expenses, and sales charges applicable to mutual fund investments. Direct investment in any index is not possible. The performance of Class A shares, as set forth in the line graph above, will differ from that of other classes because of the difference in expenses paid by policyholders investing in the different share classes.
This information represents past performance and is not indicative of future results. Investment return and principal value may fluctuate so that shares, upon redemption, may be worth more or less than the original cost.
PORTFOLIO COMPOSITION AS OF DECEMBER 31, 2013
Top Holdings
| | | | |
| | |
% of
Net Assets | |
| Dealertrack Technologies, Inc. | | | 1.7 | |
| Grand Canyon Education, Inc. | | | 1.6 | |
| HomeAway, Inc. | | | 1.5 | |
| Corporate Executive Board Co. (The) | | | 1.3 | |
| Genesee & Wyoming, Inc.—Class A | | | 1.3 | |
| Guidewire Software, Inc. | | | 1.3 | |
| Ultimate Software Group, Inc. | | | 1.3 | |
| Aspen Technology, Inc. | | | 1.3 | |
| Hexcel Corp. | | | 1.2 | |
| Spirit Airlines, Inc. | | | 1.2 | |
Top Sectors
| | | | |
| | | % of
Market Value of
Total Long-Term Investments | |
| Information Technology | | | 24.6 | |
| Industrials | | | 19.9 | |
| Consumer Discretionary | | | 19.5 | |
| Health Care | | | 18.6 | |
| Financials | | | 8.1 | |
| Energy | | | 6.7 | |
| Consumer Staples | | | 1.0 | |
| Materials | | | 0.8 | |
| Telecommunication Services | | | 0.8 | |
MSF-3
Metropolitan Series Fund
Loomis Sayles Small Cap Growth Portfolio
Understanding Your Portfolio’s Expenses
Shareholder Expense Example
As a shareholder of the Portfolio, you incur ongoing costs, including management fees; distribution and service (12b-1) fees; and other Portfolio expenses. This example is intended to help you understand your ongoing costs (in dollars) (referred to as “expenses”) of investing in the Portfolio and compare these costs with the ongoing costs of investing in other mutual funds. The example is based on an investment of $1,000 invested at the beginning of the period and held for the entire period, July 1, 2013 through December 31, 2013.
Actual Expenses
The first line for each share class of the Portfolio in the table below provides information about actual account values and actual expenses. You may use the information in this line, together with the amount you invested in the particular share class of the Portfolio, to estimate the expenses that you paid over the period. Simply divide your account value by $1,000 (for example, an $8,600 account value divided by $1,000 = 8.6), then multiply the result by the number in the first line under the heading entitled “Expenses Paid During Period” to estimate the expenses you paid on your account during this period.
Hypothetical Example for Comparison Purposes
The second line for each share class of the Portfolio in the table below provides information about hypothetical account values and hypothetical expenses based on the Portfolio’s actual expense ratio and an assumed rate of return of 5% per year before expenses, which is not the Portfolio’s actual return. The hypothetical account values and expenses may not be used to estimate the actual ending account balance or expenses you paid for the period. You may use this information to compare the ongoing costs of investing in the Portfolio and other funds. To do so, compare this 5% hypothetical example with the 5% hypothetical examples that appear in the shareholder reports of the other funds.
Please note that the expenses shown in the table are meant to highlight your ongoing costs only and do not reflect any fees or charges of your variable insurance product or any additional expenses that participants in certain eligible qualified plans may bear relating to the operations of their plan. Therefore, the second line for each share class in the table is useful in comparing ongoing costs only, and will not help you determine the relative total costs of owning different funds. In addition, if these other costs were included, your costs would have been higher.
| | | | | | | | | | | | | | | | | | |
Loomis Sayles Small Cap Growth Portfolio | | | | Annualized
Expense
Ratio | | | Beginning
Account Value
July 1,
2013 | | | Ending
Account Value
December 31,
2013 | | | Expenses Paid
During Period**
July 1, 2013
to
December 31,
2013 | |
Class A(a) | | Actual | | | 0.86 | % | | $ | 1,000.00 | | | $ | 1,204.50 | | | $ | 4.78 | |
| | Hypothetical* | | | 0.86 | % | | $ | 1,000.00 | | | $ | 1,020.87 | | | $ | 4.38 | |
| | | | | |
Class B(a) | | Actual | | | 1.11 | % | | $ | 1,000.00 | | | $ | 1,203.80 | | | $ | 6.17 | |
| | Hypothetical* | | | 1.11 | % | | $ | 1,000.00 | | | $ | 1,019.61 | | | $ | 5.65 | |
| | | | | |
Class E(a) | | Actual | | | 1.01 | % | | $ | 1,000.00 | | | $ | 1,203.70 | | | $ | 5.61 | |
| | Hypothetical* | | | 1.01 | % | | $ | 1,000.00 | | | $ | 1,020.11 | | | $ | 5.14 | |
* Hypothetical assumes a rate of return of 5% per year before expenses.
** Expenses paid are equal to the Portfolio’s annualized expense ratio for the most recent six month period, as shown above, multiplied by the average account value over the period, multiplied by the number of days (184 days) in the most recent fiscal half-year, divided by 365 (to reflect the one-half year period).
(a) The annualized expense ratio shown reflects the impact of the management fee waiver as described in Note 5 of the Notes to Financial Statements.
MSF-4
Metropolitan Series Fund
Loomis Sayles Small Cap Growth Portfolio
Schedule of Investments as of December 31, 2013
Common Stocks—97.3% of Net Assets
| | | | | | | | |
| Security Description | | Shares | | | Value | |
|
Aerospace & Defense—1.2% | |
Hexcel Corp. (a) | | | 136,813 | | | $ | 6,114,173 | |
| | | | | | | | |
|
Air Freight & Logistics—1.1% | |
XPO Logistics, Inc. (a) (b) | | | 207,937 | | | | 5,466,664 | |
| | | | | | | | |
|
Airlines—1.2% | |
Spirit Airlines, Inc. (a) | | | 132,857 | | | | 6,033,036 | |
| | | | | | | | |
|
Auto Components—2.0% | |
Dorman Products, Inc. (a) (b) | | | 98,444 | | | | 5,519,755 | |
Drew Industries, Inc. | | | 82,512 | | | | 4,224,614 | |
| | | | | | | | |
| | | | | | | 9,744,369 | |
| | | | | | | | |
|
Biotechnology—4.7% | |
Alkermes plc (a) | | | 120,961 | | | | 4,918,274 | |
Cubist Pharmaceuticals, Inc. (a) (b) | | | 53,525 | | | | 3,686,267 | |
Emergent Biosolutions, Inc. (a) | | | 179,535 | | | | 4,127,509 | |
Exact Sciences Corp. (a) (b) | | | 276,723 | | | | 3,234,892 | |
InterMune, Inc. (a) (b) | | | 217,601 | | | | 3,205,263 | |
NPS Pharmaceuticals, Inc. (a) | | | 136,441 | | | | 4,142,349 | |
| | | | | | | | |
| | | | | | | 23,314,554 | |
| | | | | | | | |
|
Building Products—0.9% | |
Apogee Enterprises, Inc. | | | 119,300 | | | | 4,284,063 | |
| | | | | | | | |
|
Capital Markets—2.2% | |
Artisan Partners Asset Management, Inc. - Class A | | | 88,577 | | | | 5,774,335 | |
Financial Engines, Inc. | | | 73,082 | | | | 5,077,737 | |
| | | | | | | | |
| | | | | | | 10,852,072 | |
| | | | | | | | |
|
Chemicals—0.8% | |
Flotek Industries, Inc. (a) (b) | | | 191,917 | | | | 3,851,774 | |
| | | | | | | | |
|
Commercial Banks—3.6% | |
Bank of the Ozarks, Inc. (b) | | | 96,281 | | | | 5,448,542 | |
Boston Private Financial Holdings, Inc. | | | 289,263 | | | | 3,650,499 | |
PrivateBancorp, Inc. | | | 126,337 | | | | 3,654,929 | |
SVB Financial Group (a) | | | 47,653 | | | | 4,996,894 | |
| | | | | | | | |
| | | | | | | 17,750,864 | |
| | | | | | | | |
|
Commercial Services & Supplies—1.0% | |
Interface, Inc. | | | 232,991 | | | | 5,116,482 | |
| | | | | | | | |
|
Communications Equipment—0.9% | |
Ciena Corp. (a) (b) | | | 194,375 | | | | 4,651,394 | |
| | | | | | | | |
|
Construction & Engineering—0.8% | |
MasTec, Inc. (a) (b) | | | 125,194 | | | | 4,096,348 | |
| | | | | | | | |
|
Consumer Finance—1.1% | |
Encore Capital Group, Inc. (a) (b) | | | 103,806 | | | | 5,217,290 | |
| | | | | | | | |
|
Distributors—1.0% | |
Pool Corp. (b) | | | 87,857 | | | | 5,108,006 | |
| | | | | | | | |
|
Diversified Consumer Services—3.7% | |
Bright Horizons Family Solutions, Inc. (a) | | | 119,584 | | | | 4,393,516 | |
Grand Canyon Education, Inc. (a) | | | 180,751 | | | | 7,880,744 | |
LifeLock, Inc. (a) (b) | | | 344,906 | | | | 5,659,907 | |
| | | | | | | | |
| | | | | | | 17,934,167 | |
| | | | | | | | |
|
Diversified Financial Services—1.0% | |
MarketAxess Holdings, Inc. | | | 71,456 | | | | 4,778,263 | |
| | | | | | | | |
|
Diversified Telecommunication Services—0.8% | |
8x8, Inc. (a) | | | 369,686 | | | | 3,756,010 | |
| | | | | | | | |
|
Electrical Equipment—1.6% | |
Polypore International, Inc. (a) (b) | | | 97,652 | | | | 3,798,663 | |
Thermon Group Holdings, Inc. (a) | | | 146,536 | | | | 4,004,829 | |
| | | | | | | | |
| | | | | | | 7,803,492 | |
| | | | | | | | |
|
Electronic Equipment, Instruments & Components—3.2% | |
FEI Co. | | | 57,801 | | | | 5,165,097 | |
IPG Photonics Corp. (a) (b) | | | 61,819 | | | | 4,797,773 | |
Measurement Specialties, Inc. (a) (b) | | | 95,139 | | | | 5,773,986 | |
| | | | | | | | |
| | | | | | | 15,736,856 | |
| | | | | | | | |
|
Energy Equipment & Services—2.8% | |
Dril-Quip, Inc. (a) | | | 43,937 | | | | 4,829,994 | |
Forum Energy Technologies, Inc. (a) | | | 160,917 | | | | 4,547,514 | |
Helix Energy Solutions Group, Inc. (a) | | | 191,286 | | | | 4,434,010 | |
| | | | | | | | |
| | | | | | | 13,811,518 | |
| | | | | | | | |
|
Food & Staples Retailing—1.0% | |
Susser Holdings Corp. (a) (b) | | | 74,742 | | | | 4,894,854 | |
| | | | | | | | |
|
Health Care Equipment & Supplies—6.8% | |
Analogic Corp. | | | 38,675 | | | | 3,425,058 | |
Cardiovascular Systems, Inc. (a) | | | 76,901 | | | | 2,636,935 | |
Endologix, Inc. (a)(b) | | | 242,615 | | | | 4,231,206 | |
Globus Medical, Inc. - Class A (a) | | | 186,188 | | | | 3,757,274 | |
Insulet Corp. (a) | | | 128,234 | | | | 4,757,482 | |
Novadaq Technologies, Inc. (a) | | | 275,821 | | | | 4,548,288 | |
Quidel Corp. (a) | | | 145,325 | | | | 4,489,089 | |
Spectranetics Corp. (a) | | | 231,229 | | | | 5,780,725 | |
| | | | | | | | |
| | | | | | | 33,626,057 | |
| | | | | | | | |
|
Health Care Providers & Services—3.1% | |
Acadia Healthcare Co., Inc. (a) (b) | | | 118,854 | | | | 5,625,360 | |
IPC The Hospitalist Co., Inc. (a) (b) | | | 39,760 | | | | 2,361,347 | |
MWI Veterinary Supply, Inc. (a) | | | 14,070 | | | | 2,400,201 | |
Team Health Holdings, Inc. (a) | | | 108,473 | | | | 4,940,945 | |
| | | | | | | | |
| | | | | | | 15,327,853 | |
| | | | | | | | |
|
Health Care Technology—0.9% | |
Medidata Solutions, Inc. (a) | | | 76,588 | | | | 4,638,935 | |
| | | | | | | | |
|
Hotels, Restaurants & Leisure—3.6% | |
AFC Enterprises, Inc. (a) | | | 112,531 | | | | 4,332,443 | |
See accompanying notes to financial statements.
MSF-5
Metropolitan Series Fund
Loomis Sayles Small Cap Growth Portfolio
Schedule of Investments as of December 31, 2013
Common Stocks—(Continued)
| | | | | | | | |
| Security Description | | Shares | | | Value | |
|
Hotels, Restaurants & Leisure—(Continued) | |
Noodles & Co. (a) (b) | | | 79,529 | | | $ | 2,856,682 | |
Texas Roadhouse, Inc. | | | 174,373 | | | | 4,847,569 | |
Vail Resorts, Inc. (b) | | | 76,217 | | | | 5,733,805 | |
| | | | | | | | |
| | | | | | | 17,770,499 | |
| | | | | | | | |
|
Internet & Catalog Retail—1.5% | |
HomeAway, Inc. (a) (b) | | | 181,702 | | | | 7,427,978 | |
| | | | | | | | |
|
Internet Software & Services—6.6% | |
Cornerstone OnDemand, Inc. (a) (b) | | | 94,402 | | | | 5,035,403 | |
CoStar Group, Inc. (a) | | | 29,382 | | | | 5,423,329 | |
Dealertrack Technologies, Inc. (a) (b) | | | 173,242 | | | | 8,329,475 | |
Envestnet, Inc. (a) | | | 108,381 | | | | 4,367,754 | |
OpenTable, Inc. (a) (b) | | | 58,753 | | | | 4,663,226 | |
Shutterstock, Inc. (a) | | | 52,293 | | | | 4,373,264 | |
| | | | | | | | |
| | | | | | | 32,192,451 | |
| | | | | | | | |
|
IT Services—2.6% | |
Cardtronics, Inc. (a) | | | 72,410 | | | | 3,146,215 | |
EPAM Systems, Inc. (a) | | | 148,460 | | | | 5,187,192 | |
InterXion Holding NV (a) | | | 187,617 | | | | 4,429,637 | |
| | | | | | | | |
| | | | | | | 12,763,044 | |
| | | | | | | | |
|
Life Sciences Tools & Services—0.8% | |
Fluidigm Corp. (a) | | | 98,817 | | | | 3,786,667 | |
| | | | | | | | |
|
Machinery—4.2% | |
Manitowoc Co., Inc. (The) (b) | | | 242,064 | | | | 5,644,932 | |
Middleby Corp. (The) (a) | | | 21,504 | | | | 5,160,315 | |
Proto Labs, Inc. (a) (b) | | | 61,354 | | | | 4,367,178 | |
RBC Bearings, Inc. (a) (b) | | | 74,963 | | | | 5,303,632 | |
| | | | | | | | |
| | | | | | | 20,476,057 | |
| | | | | | | | |
|
Oil, Gas & Consumable Fuels—3.7% | |
Diamondback Energy, Inc. (a) | | | 80,188 | | | | 4,238,738 | |
Gulfport Energy Corp. (a) | | | 81,999 | | | | 5,178,237 | |
Oasis Petroleum, Inc. (a) | | | 101,168 | | | | 4,751,861 | |
Rosetta Resources, Inc. (a) | | | 83,300 | | | | 4,001,732 | |
| | | | | | | | |
| | | | | | | 18,170,568 | |
| | | | | | | | |
|
Pharmaceuticals—1.7% | |
Medicines Co. (The) (a) | | | 64,593 | | | | 2,494,582 | |
Pacira Pharmaceuticals, Inc. (a) | | | 56,454 | | | | 3,245,540 | |
Sagent Pharmaceuticals, Inc. (a) (b) | | | 104,931 | | | | 2,663,149 | |
| | | | | | | | |
| | | | | | | 8,403,271 | |
| | | | | | | | |
|
Professional Services—5.3% | |
Advisory Board Co. (The) (a) (b) | | | 69,019 | | | | 4,394,440 | |
Corporate Executive Board Co. (The) | | | 85,719 | | | | 6,637,222 | |
Huron Consulting Group, Inc. (a) | | | 79,835 | | | | 5,007,251 | |
On Assignment, Inc. (a) | | | 138,965 | | | | 4,852,658 | |
WageWorks, Inc. (a) | | | 87,100 | | | | 5,177,224 | |
| | | | | | | | |
| | | | | | | 26,068,795 | |
| | | | | | | | |
|
Road & Rail—1.4% | |
Genesee & Wyoming, Inc. - Class A (a) | | | 69,087 | | | | 6,635,806 | |
| | | | | | | | |
|
Semiconductors & Semiconductor Equipment—4.2% | |
Cavium, Inc. (a) (b) | | | 112,964 | | | | 3,898,387 | |
Hittite Microwave Corp. (a) | | | 70,852 | | | | 4,373,694 | |
Monolithic Power Systems, Inc. (a) | | | 125,627 | | | | 4,354,232 | |
Semtech Corp. (a) | | | 145,043 | | | | 3,666,687 | |
Silicon Laboratories, Inc. (a) | | | 95,190 | | | | 4,122,679 | |
| | | | | | | | |
| | | | | | | 20,415,679 | |
| | | | | | | | |
|
Software—6.5% | |
Aspen Technology, Inc. (a) | | | 156,730 | | | | 6,551,314 | |
CommVault Systems, Inc. (a) (b) | | | 62,348 | | | | 4,668,618 | |
FleetMatics Group plc (a) (b) | | | 64,715 | | | | 2,798,924 | |
Guidewire Software, Inc. (a) | | | 135,133 | | | | 6,630,976 | |
Imperva, Inc. (a) | | | 98,650 | | | | 4,748,024 | |
Ultimate Software Group, Inc. (a) | | | 42,939 | | | | 6,579,114 | |
| | | | | | | | |
| | | | | | | 31,976,970 | |
| | | | | | | | |
|
Specialty Retail—4.2% | |
Asbury Automotive Group, Inc. (a) | | | 87,364 | | | | 4,694,941 | |
Cabela’s, Inc. (a) (b) | | | 56,919 | | | | 3,794,221 | |
Chico’s FAS, Inc. | | | 195,791 | | | | 3,688,702 | |
Hibbett Sports, Inc. (a) (b) | | | 76,867 | | | | 5,166,231 | |
Restoration Hardware Holdings, Inc. (a) | | | 49,813 | | | | 3,352,415 | |
| | | | | | | | |
| | | | | | | 20,696,510 | |
| | | | | | | | |
|
Textiles, Apparel & Luxury Goods—3.0% | |
Deckers Outdoor Corp. (a) (b) | | | 57,284 | | | | 4,838,207 | |
Oxford Industries, Inc. | | | 72,524 | | | | 5,850,511 | |
Tumi Holdings, Inc. (a) (b) | | | 181,951 | | | | 4,102,995 | |
| | | | | | | | |
| | | | | | | 14,791,713 | |
| | | | | | | | |
|
Transportation Infrastructure—0.6% | |
Wesco Aircraft Holdings, Inc. (a) | | | 135,177 | | | | 2,963,080 | |
| | | | | | | | |
Total Common Stocks
(Cost $333,946,739) | | | | | | | 478,448,182 | |
| | | | | | | | |
|
| Short-Term Investments—23.1% | |
| |
Mutual Fund—20.1% | | | | | |
State Street Navigator Securities Lending MET Portfolio (c) | | | 98,824,930 | | | | 98,824,930 | |
| | | | | | | | |
See accompanying notes to financial statements.
MSF-6
Metropolitan Series Fund
Loomis Sayles Small Cap Growth Portfolio
Schedule of Investments as of December 31, 2013
Short-Term Investments—(Continued)
| | | | | | | | |
| Security Description | | Principal
Amount* | | | Value | |
|
Repurchase Agreement—3.0% | |
Fixed Income Clearing Corp.
Repurchase Agreement dated 12/31/13 at 0.000% to be repurchased at $14,521,000 on 01/02/14, collateralized by $14,830,000 U.S. Treasury Note at 0.250% due 10/31/15 with a value of $14,811,463. | | | 14,521,000 | | | $ | 14,521,000 | |
| | | | | | | | |
Total Short-Term Investments
(Cost $113,345,930) | | | | | | | 113,345,930 | |
| | | | | | | | |
Total Investments—120.4%
(Cost $447,292,669) (d) | | | | | | | 591,794,112 | |
Other assets and liabilities (net)—(20.4)% | | | | | | | (100,075,060 | ) |
| | | | | | | | |
| Net Assets—100.0% | | | | | | $ | 491,719,052 | |
| | | | | | | | |
| * | Principal amount stated in U.S. dollars unless otherwise noted. |
| (a) | Non-income producing security. |
| (b) | All or a portion of the security was held on loan. As of December 31, 2013, the market value of securities loaned was $96,642,784 and the collateral received consisted of cash in the amount of $98,824,930. The cash collateral is invested in a money market fund managed by an affiliate of the custodian. |
| (c) | Represents investment of cash collateral received from securities lending transactions. |
| (d) | As of December 31, 2013, the aggregate cost of investments for federal income tax purposes was $447,589,285. The aggregate unrealized appreciation and depreciation of investments were $145,926,915 and $(1,722,088), respectively, resulting in net unrealized appreciation of $144,204,827 for federal income tax purposes. |
Fair Value Hierarchy
Accounting principles generally accepted in the United States of America (“GAAP”) define fair market value as the price that the Portfolio would receive to sell an asset or pay to transfer a liability in an orderly transaction between market participants at the measurement date. It establishes a fair value hierarchy that prioritizes inputs to valuation methods and requires disclosure of the fair value hierarchy that segregates fair value measurements into three levels. Levels 1, 2 and 3 of the fair value hierarchy are defined as follows:
Level 1 - unadjusted quoted prices in active markets for identical investments
Level 2 - other significant observable inputs (including, but not limited to, unadjusted quoted prices for similar investments in markets that are either active or inactive; inputs other than quoted prices that are observable such as interest rates, yield curves, volatilities, prepayment speeds, loss severities, credit risks, default rates, etc.)
Level 3 - significant unobservable inputs based on the best information available in the circumstances, to the extent observable inputs are unavailable (including the Portfolio’s own assumptions in determining the fair value of investments)
The inputs or methodologies used for valuing investments are not necessarily an indication of the risk associated with investing in them. Changes to the inputs or methodologies used may result in transfers between levels, which will be recognized as of the beginning of the reporting period. Information on transfers between Level 1 and Level 2, if any, will be disclosed following the fair value hierarchy table below. A reconciliation of Level 3 securities, if any, will also be disclosed following the fair value hierarchy table. For more information about the Portfolio’s policy regarding the valuation of investments, please refer to the Notes to Financial Statements.
The following table summarizes the fair value hierarchy of the Portfolio’s investments as of December 31, 2013:
| | | | | | | | | | | | | | | | |
| Description | | Level 1 | | | Level 2 | | | Level 3 | | | Total | |
Total Common Stocks* | | $ | 478,448,182 | | | $ | — | | | $ | — | | | $ | 478,448,182 | |
| Short-Term Investments | | | | | | | | | | | | | | | | |
Mutual Fund | | | 98,824,930 | | | | — | | | | — | | | | 98,824,930 | |
Repurchase Agreement | | | — | | | | 14,521,000 | | | | — | | | | 14,521,000 | |
Total Short-Term Investments | | | 98,824,930 | | | | 14,521,000 | | | | — | | | | 113,345,930 | |
Total Investments | | $ | 577,273,112 | | | $ | 14,521,000 | | | $ | — | | | $ | 591,794,112 | |
| | | | | | | | | | | | | | | | | |
Collateral for Securities Loaned (Liability) | | $ | — | | | $ | (98,824,930 | ) | | $ | — | | | $ | (98,824,930 | ) |
| * | See Schedule of Investments for additional detailed categorizations. |
See accompanying notes to financial statements.
MSF-7
Metropolitan Series Fund
Loomis Sayles Small Cap Growth Portfolio
Statement of Assets and Liabilities
December 31, 2013
| | | | |
Assets | | | | |
Investments at value (a) (b) | | $ | 591,794,112 | |
Cash | | | 221 | |
Receivable for: | | | | |
Fund shares sold | | | 149,592 | |
Dividends | | | 185,221 | |
Prepaid expenses | | | 1,189 | |
| | | | |
Total Assets | | | 592,130,335 | |
Liabilities | | | | |
Collateral for securities loaned | | | 98,824,930 | |
Payables for: | | | | |
Investments purchased | | | 710,174 | |
Fund shares redeemed | | | 431,168 | |
Accrued expenses: | | | | |
Management fees | | | 330,818 | |
Distribution and service fees | | | 17,890 | |
Deferred trustees’ fees | | | 48,554 | |
Other expenses | | | 47,749 | |
| | | | |
Total Liabilities | | | 100,411,283 | |
| | | | |
Net Assets | | $ | 491,719,052 | |
| | | | |
Net assets consist of: | | | | |
Paid in surplus | | $ | 292,996,582 | |
Accumulated net investment loss | | | (48,554 | ) |
Accumulated net realized gain | | | 54,269,581 | |
Unrealized appreciation on investments | | | 144,501,443 | |
| | | | |
Net Assets | | $ | 491,719,052 | |
| | | | |
Net Assets | | | | |
Class A | | $ | 402,353,138 | |
Class B | | | 80,688,395 | |
Class E | | | 8,677,519 | |
Capital Shares Outstanding* | | | | |
Class A | | | 24,308,687 | |
Class B | | | 5,041,186 | |
Class E | | | 534,042 | |
Net Asset Value, Offering Price and Redemption Price Per Share | | | | |
Class A | | $ | 16.55 | |
Class B | | | 16.01 | |
Class E | | | 16.25 | |
| * | The Portfolio is authorized to issue an unlimited number of shares. |
| (a) | Identified cost of investments was $447,292,669. |
| (b) | Includes securities loaned at value of $96,642,784. |
Statement of Operations
Year Ended December 31, 2013
| | | | |
Investment Income | | | | |
Dividends | | $ | 982,145 | |
Interest | | | 580 | |
Securities lending income | | | 465,176 | |
| | | | |
Total investment income | | | 1,447,901 | |
Expenses | | | | |
Management fees | | | 4,013,705 | |
Administration fees | | | 6,589 | |
Custodian and accounting fees | | | 47,404 | |
Distribution and service fees—Class B | | | 178,653 | |
Distribution and service fees—Class E | | | 11,274 | |
Audit and tax services | | | 37,723 | |
Legal | | | 27,754 | |
Trustees’ fees and expenses | | | 35,356 | |
Shareholder reporting | | | 36,543 | |
Insurance | | | 2,827 | |
Miscellaneous | | | 9,346 | |
| | | | |
Total expenses | | | 4,407,174 | |
Less management fee waiver | | | (395,968 | ) |
Less broker commission recapture | | | (30,631 | ) |
| | | | |
Net expenses | | | 3,980,575 | |
| | | | |
Net Investment Loss | | | (2,532,674 | ) |
| | | | |
Net Realized and Unrealized Gain | | | | |
Net realized gain on investments | | | 76,656,573 | |
| | | | |
Net change in unrealized appreciation on investments | | | 101,257,760 | |
| | | | |
Net realized and unrealized gain | | | 177,914,333 | |
| | | | |
Net Increase in Net Assets From Operations | | $ | 175,381,659 | |
| | | | |
See accompanying notes to financial statements.
MSF-8
Metropolitan Series Fund
Loomis Sayles Small Cap Growth Portfolio
Statements of Changes in Net Assets
| | | | | | | | |
| | | Year Ended
December 31,
2013 | | | Year Ended
December 31,
2012 | |
Increase (Decrease) in Net Assets: | | | | | | | | |
From Operations | | | | | | | | |
Net investment loss | | $ | (2,532,674 | ) | | $ | (1,213,443 | ) |
Net realized gain | | | 76,656,573 | | | | 18,612,940 | |
Net change in unrealized appreciation | | | 101,257,760 | | | | 29,657,798 | |
| | | | | | | | |
Increase in net assets from operations | | | 175,381,659 | | | | 47,057,295 | |
| | | | | | | | |
Decrease in net assets from capital share transactions | | | (61,215,845 | ) | | | (93,039,271 | ) |
| | | | | | | | |
Total increase (decrease) in net assets | | | 114,165,814 | | | | (45,981,976 | ) |
| | |
Net Assets | | | | | | | | |
Beginning of period | | | 377,553,238 | | | | 423,535,214 | |
| | | | | | | | |
End of period | | $ | 491,719,052 | | | $ | 377,553,238 | |
| | | | | | | | |
Accumulated net investment loss | | | | | | | | |
End of period | | $ | (48,554 | ) | | $ | (39,418 | ) |
| | | | | | | | |
Other Information:
Capital Shares
Transactions in capital shares were as follows:
| | | | | | | | | | | | | | | | |
| | | Year Ended
December 31, 2013 | | | Year Ended
December 31, 2012 | |
| | | Shares | | | Value | | | Shares | | | Value | |
Class A | | | | | | | | | | | | | | | | |
Sales | | | 3,511,756 | | | $ | 45,338,268 | | | | 2,124,521 | | | $ | 22,910,912 | |
Redemptions | | | (7,138,154 | ) | | | (98,802,398 | ) | | | (9,638,662 | ) | | | (106,552,103 | ) |
| | | | | | | | | | | | | | | | |
Net decrease | | | (3,626,398 | ) | | $ | (53,464,130 | ) | | | (7,514,141 | ) | | $ | (83,641,191 | ) |
| | | | | | | | | | | | | | | | |
Class B | | | | | | | | | | | | | | | | |
Sales | | | 753,522 | | | $ | 10,565,408 | | | | 496,842 | | | $ | 5,203,334 | |
Redemptions | | | (1,305,262 | ) | | | (17,855,303 | ) | | | (1,260,604 | ) | | | (13,239,525 | ) |
| | | | | | | | | | | | | | | | |
Net decrease | | | (551,740 | ) | | $ | (7,289,895 | ) | | | (763,762 | ) | | $ | (8,036,191 | ) |
| | | | | | | | | | | | | | | | |
Class E | | | | | | | | | | | | | | | | |
Sales | | | 112,870 | | | $ | 1,623,975 | | | | 19,728 | | | $ | 210,060 | |
Redemptions | | | (149,978 | ) | | | (2,085,795 | ) | | | (147,889 | ) | | | (1,571,949 | ) |
| | | | | | | | | | | | | | | | |
Net decrease | | | (37,108 | ) | | $ | (461,820 | ) | | | (128,161 | ) | | $ | (1,361,889 | ) |
| | | | | | | | | | | | | | | | |
Decrease derived from capital shares transactions | | | | | | $ | (61,215,845 | ) | | | | | | $ | (93,039,271 | ) |
| | | | | | | | | | | | | | | | |
See accompanying notes to financial statements.
MSF-9
Metropolitan Series Fund
Loomis Sayles Small Cap Growth Portfolio
Financial Highlights
| | | | | | | | | | | | | | | | | | | | |
| Selected per share data | | | | | | | | | | | | | | | |
| | | Class A | |
| | | Year Ended December 31, | |
| | | 2013 | | | 2012 | | | 2011 | | | 2010 | | | 2009 | |
Net Asset Value, Beginning of Period | | $ | 11.13 | | | $ | 10.01 | | | $ | 9.72 | | | $ | 7.38 | | | $ | 5.68 | |
| | | | | | | | | | | | | | | | | | | | |
Income (Loss) from Investment Operations | | | | | | | | | | | | | | | | | | | | |
Net investment loss (a) | | | (0.07 | ) | | | (0.03 | ) | | | (0.06 | ) | | | (0.06 | ) | | | (0.06 | ) |
Net realized and unrealized gain on investments | | | 5.49 | | | | 1.15 | | | | 0.35 | | | | 2.40 | | | | 1.76 | |
| | | | | | | | | | | | | | | | | | | | |
Total from investment operations | | | 5.42 | | | | 1.12 | | | | 0.29 | | | | 2.34 | | | | 1.70 | |
| | | | | | | | | | | | | | | | | | | | |
Net Asset Value, End of Period | | $ | 16.55 | | | $ | 11.13 | | | $ | 10.01 | | | $ | 9.72 | | | $ | 7.38 | |
| | | | | | | | | | | | | | | | | | | | |
Total Return (%) (b) | | | 48.70 | | | | 11.19 | | | | 2.98 | | | | 31.71 | | | | 29.93 | |
| | | | | |
Ratios/Supplemental Data | | | | | | | | | | | | | | | | | | | | |
Gross ratio of expenses to average net assets (%) | | | 0.95 | | | | 0.96 | | | | 0.96 | | | | 1.07 | | | | 1.33 | |
Net ratio of expenses to average net assets (%) (c) | | | 0.86 | | | | 0.87 | | | | 0.88 | | | | 1.02 | | | | 1.30 | |
Ratio of net investment loss to average net assets (%) | | | (0.53 | ) | | | (0.26 | ) | | | (0.58 | ) | | | (0.75 | ) | | | (1.07 | ) |
Portfolio turnover rate (%) | | | 58 | | | | 74 | | | | 74 | | | | 73 | | | | 170 | |
Net assets, end of period (in millions) | | $ | 402.4 | | | $ | 311.0 | | | $ | 354.8 | | | $ | 28.4 | | | $ | 22.3 | |
| | | | | | | | | | | | | | | | | | | | |
| | | Class B | |
| | | Year Ended December 31, | |
| | | 2013 | | | 2012 | | | 2011 | | | 2010 | | | 2009 | |
Net Asset Value, Beginning of Period | | $ | 10.79 | | | $ | 9.73 | | | $ | 9.47 | | | $ | 7.21 | | | $ | 5.56 | |
| | | | | | | | | | | | | | | | | | | | |
Income (Loss) from Investment Operations | | | | | | | | | | | | | | | | | | | | |
Net investment loss (a) | | | (0.10 | ) | | | (0.05 | ) | | | (0.09 | ) | | | (0.08 | ) | | | (0.08 | ) |
Net realized and unrealized gain on investments | | | 5.32 | | | | 1.11 | | | | 0.35 | | | | 2.34 | | | | 1.73 | |
| | | | | | | | | | | | | | | | | | | | |
Total from investment operations | | | 5.22 | | | | 1.06 | | | | 0.26 | | | | 2.26 | | | | 1.65 | |
| | | | | | | | | | | | | | | | | | | | |
Net Asset Value, End of Period | | $ | 16.01 | | | $ | 10.79 | | | $ | 9.73 | | | $ | 9.47 | | | $ | 7.21 | |
| | | | | | | | | | | | | | | | | | | | |
Total Return (%) (b) | | | 48.38 | | | | 10.89 | | | | 2.75 | | | | 31.35 | | | | 29.68 | |
| | | | | |
Ratios/Supplemental Data | | | | | | | | | | | | | | | | | | | | |
Gross ratio of expenses to average net assets (%) | | | 1.20 | | | | 1.21 | | | | 1.21 | | | | 1.32 | | | | 1.58 | |
Net ratio of expenses to average net assets (%) (c) | | | 1.11 | | | | 1.12 | | | | 1.13 | | | | 1.27 | | | | 1.55 | |
Ratio of net investment loss to average net assets (%) | | | (0.77 | ) | | | (0.51 | ) | | | (0.86 | ) | | | (1.00 | ) | | | (1.32 | ) |
Portfolio turnover rate (%) | | | 58 | | | | 74 | | | | 74 | | | | 73 | | | | 170 | |
Net assets, end of period (in millions) | | $ | 80.7 | | | $ | 60.4 | | | $ | 61.8 | | | $ | 66.4 | | | $ | 56.6 | |
Please see following page for Financial Highlights footnote legend.
See accompanying notes to financial statements.
MSF-10
Metropolitan Series Fund
Loomis Sayles Small Cap Growth Portfolio
Financial Highlights
| | | | | | | | | | | | | | | | | | | | |
| Selected per share data | | | | | | | | | | | | | | | |
| | | Class E | |
| | | Year Ended December 31, | |
| | | 2013 | | | 2012 | | | 2011 | | | 2010 | | | 2009 | |
Net Asset Value, Beginning of Period | | $ | 10.94 | | | $ | 9.86 | | | $ | 9.58 | | | $ | 7.29 | | | $ | 5.61 | |
| | | | | | | | | | | | | | | | | | | | |
Income (Loss) from Investment Operations | | | | | | | | | | | | | | | | | | | | |
Net investment loss (a) | | | (0.09 | ) | | | (0.04 | ) | | | (0.08 | ) | | | (0.07 | ) | | | (0.07 | ) |
Net realized and unrealized gain on investments | | | 5.40 | | | | 1.12 | | | | 0.36 | | | | 2.36 | | | | 1.75 | |
| | | | | | | | | | | | | | | | | | | | |
Total from investment operations | | | 5.31 | | | | 1.08 | | | | 0.28 | | | | 2.29 | | | | 1.68 | |
| | | | | | | | | | | | | | | | | | | | |
Net Asset Value, End of Period | | $ | 16.25 | | | $ | 10.94 | | | $ | 9.86 | | | $ | 9.58 | | | $ | 7.29 | |
| | | | | | | | | | | | | | | | | | | | |
Total Return (%) (b) | | | 48.54 | | | | 10.95 | | | | 2.92 | | | | 31.41 | | | | 29.95 | |
| | | | | |
Ratios/Supplemental Data | | | | | | | | | | | | | | | | | | | | |
Gross ratio of expenses to average net assets (%) | | | 1.10 | | | | 1.11 | | | | 1.11 | | | | 1.22 | | | | 1.48 | |
Net ratio of expenses to average net assets (%) (c) | | | 1.01 | | | | 1.02 | | | | 1.03 | | | | 1.17 | | | | 1.45 | |
Ratio of net investment loss to average net assets (%) | | | (0.67 | ) | | | (0.41 | ) | | | (0.76 | ) | | | (0.90 | ) | | | (1.22 | ) |
Portfolio turnover rate (%) | | | 58 | | | | 74 | | | | 74 | | | | 73 | | | | 170 | |
Net assets, end of period (in millions) | | $ | 8.7 | | | $ | 6.3 | | | $ | 6.9 | | | $ | 7.8 | | | $ | 7.0 | |
| (a) | Per share amounts based on average shares outstanding during the period. |
| (b) | Total return does not reflect any insurance, sales, separate account or administrative charges of variable annuity or life insurance contracts or any additional expenses that contract owners may bear under their variable contracts. If these charges were included, the returns would be lower. |
| (c) | Net ratio of expenses to average net assets includes the effect of management fee waivers as detailed in Note 5 of the Notes to Financial Statements. |
See accompanying notes to financial statements.
MSF-11
Metropolitan Series Fund
Loomis Sayles Small Cap Growth Portfolio
Notes to Financial Statements—December 31, 2013
1. Organization
Metropolitan Series Fund (the “Trust”) is organized as a Delaware statutory trust and registered under the Investment Company Act of 1940, as amended (the “1940 Act”), as an open-end management investment company. The Trust is currently comprised of thirty series, each of which operates as a distinct investment vehicle of the Trust. The portfolio included in this report is Loomis Sayles Small Cap Growth Portfolio (the “Portfolio”), which is diversified. Shares in the Portfolio are not offered directly to the general public and are currently available only to separate accounts established by Metropolitan Life Insurance Company (“MetLife”) and other affiliated life insurance companies.
The Portfolio has registered and offers three classes of shares: Class A, B, and E shares. Shares of each Class of the Portfolio represent an equal pro rata interest in the Portfolio and generally give the shareholder the same voting, dividend, liquidation, and other rights. Investment income, realized and unrealized capital gains and losses, the common expenses of the Portfolio, and certain Portfolio-level expense reductions, if any, are allocated on a pro rata basis to each Class based on the relative net assets of each Class to the net assets of the Portfolio. Each Class of shares differs in its respective distribution plan and such distribution expenses are allocated to that Class.
2. Significant Accounting Policies
The preparation of financial statements in conformity with accounting principles generally accepted in the United States of America (“GAAP”) requires management to make estimates and assumptions that affect the reported amounts of assets and liabilities and disclosure of contingent assets and liabilities as of the date of the financial statements and the reported amounts of income and expenses during the reporting period. Actual results could differ from those estimates. In the preparation of these financial statements, management has evaluated events and transactions subsequent to December 31, 2013 through the date the financial statements were issued.
The following is a summary of significant accounting policies consistently followed by the Portfolio in the preparation of its financial statements.
Investment Valuation and Fair Value Measurements - Debt securities (other than short term obligations with a remaining maturity of sixty days or less), including corporate, convertible and municipal bonds and notes; obligations of the U.S. treasury and U.S. government agencies; sovereign issues; floating rate loans; and non-U.S. bonds, are generally valued on the basis of evaluated or composite bid quotations obtained from independent pricing services and/or brokers and dealers selected by MetLife Advisers, LLC (“MetLife Advisers” or the “Adviser”), an affiliate of MetLife, Inc., pursuant to authorization of the Board of Trustees of the Trust (the “Board” or “Trustees”). Such quotations utilize matrix pricing, which considers observable inputs including, among other things, issuer details, maturity dates, interest rates, yield curves, rates of prepayment, credit risks/spreads, default rates, reported trades, broker dealer quotes and quoted prices for similar securities. Securities that use similar valuation techniques and inputs as described above are generally categorized as Level 2 within the fair value hierarchy.
Mortgage and asset-backed securities are usually issued as separate tranches, or classes, of securities within each deal. These securities are also generally valued on the basis of evaluated or composite bid quotations obtained from independent pricing services and/or brokers and dealers selected by the Adviser pursuant to authorization of the Board. The pricing models for these securities usually consider tranche-level attributes, estimated cash flows and market-based yield spreads for each tranche and current market data, and incorporate deal collateral performance, as available. Mortgage and asset-backed securities that use similar valuation techniques and inputs as described above are generally categorized as Level 2 within the fair value hierarchy.
Short term obligations with a remaining maturity of sixty days or less are generally valued at amortized cost, which approximates fair market value, and are generally categorized as Level 2 within the fair value hierarchy.
Domestic and foreign equity securities, such as common stock, exchange-traded funds, rights, warrants, and preferred stock, that are traded on a securities exchange, are generally valued at their last sale price on the exchange or market in which they are principally traded on the valuation date, or, if no sales occurred on that day, at the last reported bid price. Equity securities traded over-the-counter are generally valued at the last reported sale price. Valuation adjustments may be applied to certain foreign equity securities that are traded solely on foreign exchanges that close before the close of the U.S. market to account for the market movement between the close of the foreign exchanges and the close of the U.S. market. The Portfolio may use a systematic fair valuation model provided by an independent third party to value securities principally traded in these foreign markets in order to adjust for possible stale pricing that may occur between the close of the foreign exchanges and the time of the Portfolio valuation. Foreign equity securities using these valuation adjustments are generally categorized as Level 2 within the fair value hierarchy. Equity securities that are actively traded, and have no valuation adjustments applied, are categorized as Level 1 within the fair value hierarchy. Other equity securities traded on inactive markets, or valued in reference to similar instruments traded on active markets, are generally categorized as Level 2 within the fair value hierarchy.
MSF-12
Metropolitan Series Fund
Loomis Sayles Small Cap Growth Portfolio
Notes to Financial Statements—December 31, 2013—(Continued)
Investments in registered open-end management investment companies are valued at reported net asset value per share on the valuation date and are categorized as Level 1 within the fair value hierarchy.
Forward foreign currency exchange contracts are valued through an independent pricing service based on the mean between closing bid and ask prices of the forward currency rates in the London foreign exchange markets on a daily basis as provided by a reliable bank or dealer. These contracts are generally categorized as Level 2 within the fair value hierarchy.
Options, whether on securities, indices, futures contracts, or otherwise, traded on exchanges are valued at the last sale price available as of the close of business on the valuation date or, if there is no such price available, at the mean between the last reported bid and ask prices. These types of options are categorized as Level 1 within the fair value hierarchy. Futures contracts, which are traded on commodity exchanges, are valued at their closing prices as of the close of such exchanges and are categorized as Level 1 within the fair value hierarchy.
Options and futures contracts that are traded over-the-counter are generally valued on the basis of quotations provided by broker-dealers or prices provided by pricing service providers who use a series of techniques, including simulation pricing models, to determine the value of the contracts. The pricing models use inputs that are observed from actively quoted markets such as issuer details, indices, spreads, interest rates, yield curves, credit curves, measures of volatility and exchange rates. These contracts are generally categorized as Level 2 within the fair value hierarchy.
If no current market value quotation or other observable inputs are readily available or market value quotations are deemed to be unreliable for a security, the fair value of the security will be determined in accordance with procedures approved by and under the general supervision of the Board. In such a circumstance, the Board has delegated the determination of the fair value of a security to a Valuation Committee (“Committee”) of MetLife Advisers. The Committee provides general pricing oversight and fair value pricing determinations related to portfolio securities and meets on a regular basis to review reports relating to the valuation of the securities in the Portfolio. The Board has delegated to State Street Bank and Trust Company, the Trust’s custodian (“custodian”), the responsibility for calculating the net asset values (“NAVs”) of the Trust’s Portfolios. The Committee is responsible for overseeing the calculation of the NAVs of the Portfolios by the custodian. The Committee also periodically reviews pricing vendors, including the vendor providing fair value pricing for the Portfolio’s foreign securities, and is responsible for overseeing the correction of pricing errors and addressing other pricing issues that arise in the ordinary course of business, such as making real-time fair value determinations, as necessary.
No single standard for determining the fair value of a security can be set forth because fair value depends upon the facts and circumstances with respect to each security. Information relating to any relevant factors may be obtained by the Committee from any appropriate source, including the subadviser of the Portfolio, the custodian, a pricing service, market maker and/or broker for such security or the issuer. Appropriate methodologies for determining fair value under particular circumstances may include: matrix pricing, comparisons of securities with comparable characteristics, value based on multiples of earnings, discount from market price of similar marketable securities or a combination of these and other methods. The Committee maintains a detailed report tracking each fair-valued security that compares the fair value price to the next available trade, vendor or broker price, and provides information on how close the fair value price was to the next quoted price. The Committee reviews a summary of such report monthly. On a quarterly basis, the Board is provided with the following for consideration and ratification or adjustment: (1) a memorandum summarizing the actions taken by the Committee in the prior quarter; and (2) a list of the Portfolio’s securities as of the most recent quarter-end for which market quotations were not readily available.
Investment Transactions and Related Investment Income - Portfolio security transactions are recorded on the trade date. Dividend income is recorded on the ex-dividend date or, for certain foreign securities, when notified. Interest income, which includes amortization of premium and accretion of discount on debt securities, is recorded on the accrual basis. Realized gains and losses on investments are determined on the identified cost basis, which is the same basis used for federal income tax purposes. Foreign income and foreign capital gains on some foreign securities may be subject to foreign taxes, which are accrued as applicable. These foreign taxes have been provided for in accordance with the Portfolio’s understanding of the applicable countries’ tax rules and rates.
Income Taxes - It is the Portfolio’s policy to comply with the requirements of the Internal Revenue Code of 1986, as amended, and regulations thereunder, applicable to regulated investment companies and to distribute, with respect to each taxable year, all of its taxable income to shareholders. Therefore, no federal income tax provision is required. The Portfolio files U.S. federal tax returns. No income tax returns are currently under examination. The Portfolio’s federal tax returns for the prior three fiscal years remain subject to examination by the Internal Revenue Service. As of December 31, 2013, the Portfolio had no uncertain tax positions that would require financial statement recognition, or de-recognition or disclosure.
Dividends and Distributions to Shareholders - The Portfolio records dividends and distributions on the ex-dividend date. Net realized gains from security transactions (if any) are generally distributed annually to shareholders. The timing and characterization of certain income and capital gains distributions are determined in accordance with federal tax regulations that may differ from GAAP. Permanent book and tax basis differences relating to shareholder distributions will result in reclassification between under/over
MSF-13
Metropolitan Series Fund
Loomis Sayles Small Cap Growth Portfolio
Notes to Financial Statements—December 31, 2013—(Continued)
distributed net investment income, accumulated net realized gains/losses, and paid-in surplus. Book-tax differences are primarily due to net operating losses and broker recapture reclasses. These adjustments have no impact on net assets or the results of operations.
Securities Lending - The Portfolio may lend its portfolio securities to certain qualified brokers who borrow securities in order to complete certain securities transactions. By lending its portfolio securities, the Portfolio attempts to increase its net investment income through the receipt of income on collateral held from securities on loan. Any gain or loss in the market price of the loaned securities that might occur and any interest earned or dividends declared during the term of the loan would accrue to the account of the Portfolio.
The Trust has entered into a securities lending arrangement with the custodian. Under this arrangement, the custodian is authorized to loan portfolio securities on the Portfolio’s behalf. In exchange, the Portfolio receives either cash or securities as collateral against the loaned securities. The Portfolio receives collateral at least equal to 102% of the market value of the loaned securities (105% for foreign equity securities), at each loan’s inception. Collateral representing at least 100% of the market value of the loaned securities must be maintained for the duration of the loan. A liability for cash collateral is reflected on the Statement of Assets and Liabilities, and is categorized as Level 2 within the fair value hierarchy. Cash collateral is generally invested in the State Street Navigator Securities Lending MET Portfolio (the “Navigator Portfolio”), a series of the State Street Navigator Securities Lending Trust that is managed by an affiliate of the custodian. The Navigator Portfolio is a registered money market fund that invests in a variety of high-quality, U.S. dollar-denominated instruments. If the market value of the collateral at the close of trading on a business day is less than 100% of the market value of the loaned securities at the close of trading on that day, the borrower shall be required to deliver, by the close of business on the following business day, an additional amount of collateral, so that the total amount of posted collateral is equal to at least 100% of the market value of all the loaned securities as of such preceding day. A portion of net income (income after the deduction of expenses and fees of the Navigator Portfolio) on the collateral is rebated to the borrower of the securities and the remainder is split between the custodian and the Portfolio. On loans collateralized by U.S. Treasuries, a fee is received from the borrower and is allocated between the Portfolio and the custodian. The risks associated with lending portfolio securities include, but are not limited to, possible delays in receiving additional collateral or in the recovery of the loaned securities, possible loss of rights in the collateral should the borrower fail financially, as well as risk of loss in the value of the collateral or the value of the investments made with the collateral. The lending agent has agreed to indemnify the Portfolio in the case of default of any securities borrower. Income received by the Portfolio in securities lending transactions during the year ended December 31, 2013 is reflected as Securities lending income on the Statement of Operations. Any outstanding loans by the Portfolio at December 31, 2013 are disclosed in the footnotes to the Schedule of Investments.
Repurchase Agreements - The Portfolio may enter into repurchase agreements, under the terms of a Master Repurchase Agreement, with selected commercial banks and broker-dealers, under which the Portfolio acquires securities as collateral and agrees to resell the securities at an agreed upon time and at an agreed-upon price. The Portfolio, through the custodian or a subcustodian, receives delivery of the underlying securities collateralizing any repurchase agreements. The Portfolio requires the custodian to take possession, to have legally segregated in the Federal Reserve Book Entry System, or to have segregated within the custodian’s vault, all securities held as collateral for repurchase agreements. It is the Portfolio’s policy that the market value of the collateral be at least equal to 100% of the repurchase price in the case of a repurchase agreement of one-day duration and at least equal to 102% of the repurchase price in the case of all other repurchase agreements. In the event of default or failure by a party to perform an obligation in connection with any repurchase transaction, the Master Repurchase Agreement gives the non-defaulting party the right to set-off claims and to apply property held by it in connection with any repurchase transaction against obligations owed to it.
At December 31, 2013, the Portfolio had investments in repurchase agreements with a gross value of $14,521,000, which is included as part of investments at value on the Statement of Assets and Liabilities. The value of the related collateral exceeded the value of the repurchase agreements at December 31, 2013.
Directed Brokerage Agreement - The Trust has entered into a directed brokerage arrangement with State Street Global Markets (“SSGM”). Under this arrangement, the Portfolio directs certain trades to SSGM in return for a recapture credit. SSGM issues a cash rebate to the Portfolio. Amounts paid to the Portfolio are shown separately as broker commission recapture on the Statement of Operations of the Portfolio. Additionally, these amounts have been excluded from the calculation of the net ratio of expenses to average net assets presented in the Financial Highlights for each share class.
3. Certain Risks
Market Risk: In the normal course of business, the Portfolio invests in securities and enters into transactions where risks exist due to fluctuations in the market (market risk) or failure of the other party to a transaction to perform (credit and counterparty risk). The value of securities held by the Portfolio may decline in response to certain events, including those directly involving the companies whose securities are owned by the Portfolio; conditions affecting the general economy; overall market changes; local, regional or global political, social or economic instability; currency, interest rate, and price fluctuations.
Credit and Counterparty Risk: The Portfolio may be exposed to counterparty risk, or the risk that an entity with which the Portfolio has unsettled or open transactions may default. The potential loss could exceed the value of the financial assets and liabilities
MSF-14
Metropolitan Series Fund
Loomis Sayles Small Cap Growth Portfolio
Notes to Financial Statements—December 31, 2013—(Continued)
recorded in the financial statements. Financial assets that potentially expose the Portfolio to credit and counterparty risk consist principally of cash due from counterparties and investments. The Portfolio manages counterparty risk by entering into agreements only with counterparties that it believes have the financial resources to honor their obligations and by monitoring the financial stability of those counterparties. The Portfolio’s investment adviser attempts to mitigate counterparty risk by (i) periodically assessing the creditworthiness of its trading partners, (ii) monitoring and/or limiting the amount of its net exposure to each individual counterparty based on its assessment, and (iii) requiring collateral from the counterparty for certain transactions. In order to preserve certain safeguards for non-standard settlement trades, the Portfolio restricts its exposure to credit and counterparty losses by entering into master netting agreements with counterparties (approved brokers) with whom it undertakes a significant volume of transactions. Master Agreements govern the terms of certain transactions, and reduce the counterparty risk associated with relevant transactions by specifying credit protection mechanisms and providing standardization that improves legal certainty. Master Agreements can also help limit counterparty risk by specifying collateral posting arrangements at pre-arranged exposure levels.
Repurchase agreements are primarily executed under Global Master Repurchase Agreements (“GMRAs”) or Master Repurchase Agreements (“MRAs”), which provide the rights to set-off. Each repurchase agreement is initially collateralized at the transaction level. In the event of default, the total market value exposure will be offset against collateral exchanged to date, which would result in a net receivable/(payable) that would be due from/to the counterparty. Securities pledged as collateral are noted in the Schedule of Investments.
Additional risks associated with each type of investment are described above within the respective security type notes. The Portfolio’s prospectus includes a discussion of the principal risks of investing in the Portfolio.
4. Investment Transactions
Aggregate cost of purchases and proceeds of sales of investment securities, excluding short-term securities, for the year ended December 31, 2013 were as follows:
| | | | | | | | | | | | |
Purchases | | | Sales | |
U.S. Government | | Non U.S. Government | | | U.S. Government | | | Non U.S. Government | |
| $0 | | $ | 248,669,480 | | | $ | 0 | | | $ | 319,332,161 | |
During the year ended December 31, 2013, the Portfolio engaged in security transactions with other affiliated portfolios. These amounted to $4,893,065 in purchases of investments, which are included above.
5. Investment Management Fees and Other Transactions with Affiliates
Investment Management Agreement - MetLife Advisers is the investment adviser to the Portfolio. The Trust has entered into an investment management agreement with MetLife Advisers with respect to the Portfolio. For providing investment management services to the Portfolio, MetLife Advisers receives monthly compensation at the annual rates:
| | | | | | |
Management
Fees earned by
MetLife Advisers
for the year ended
December 31, 2013 | | % per annum | | | Average Daily Net Assets |
| $4,013,705 | | | 0.900 | % | | Of the first $500 million |
| | | 0.850 | % | | On amounts in excess of $500 million |
Certain officers and trustees of the Trust may also be officers of MetLife Advisers; however, such officers and trustees receive no compensation from the Trust.
MetLife Advisers has entered into an investment subadvisory agreement with respect to the Portfolio. Loomis, Sayles & Company, L.P. is compensated by MetLife Advisers to provide subadvisory services for the Portfolio.
Management Fee Waivers - Pursuant to an expense agreement, MetLife Advisers has agreed, for the period April 29, 2013 through April 27, 2014, to reduce its advisory fees set out above under “Investment Management Agreement” for each class of the Portfolio as follows:
| | |
% per annum | | Average Daily Net Assets |
| 0.050% | | On the first $100 million |
| 0.100% | | On the next $400 million |
| 0.050% | | On amounts in excess of $500 million |
An identical expense agreement was in place for the period May 1, 2012 through April 28, 2013. Amounts waived for the year ended December 31, 2013 are shown as management fee waivers in the Statement of Operations.
MSF-15
Metropolitan Series Fund
Loomis Sayles Small Cap Growth Portfolio
Notes to Financial Statements—December 31, 2013—(Continued)
Transfer Agency Agreement - MetLife serves as the transfer agent for the Trust. MetLife receives no fees for its services to the Trust under the transfer agency agreement.
Distribution and Service Fees - The Trust has a distribution agreement with MetLife Investors Distribution Company (“MIDC” or the “Distributor”) in which MIDC serves as the distributor for the Portfolio’s Class A, B and E Shares. MIDC is a wholly-owned subsidiary of MetLife Investors Group, Inc., an affiliate of the Adviser. The Trust has also adopted a Distribution and Service Plan under Rule 12b-1 of the 1940 Act for the Portfolio’s Class B and E Shares. Under the Distribution and Service Plan, the Class B and E Shares of the Portfolio pay a fee to compensate the Insurance Companies (or their affiliates) and other broker-dealers and financial intermediaries involved in the offer and sale of Portfolio shares for promoting or selling and servicing the Class B and E Shares. The fees under the Distribution and Service Plan for each class of the Portfolio’s shares are calculated as a percentage of the Portfolio’s average daily net assets that are attributable to that Class. Currently, the fee is 0.25% per year for Class B Shares and 0.15% per year for Class E Shares. Amounts incurred by the Portfolio for the year ended December 31, 2013 are shown as Distribution and service fees in the Statement of Operations.
Deferred Trustee Compensation - Each Trustee who is not currently an employee of the Adviser or any of its affiliates receives compensation from the Trust for his or her service to the Trust. A deferred compensation plan (the “Plan”) is available to the Trustees on a voluntary basis. Deferred amounts remain in the Trust until distributed in accordance with the provisions of the Plan. The value of a participating Trustee’s deferral account is based on theoretical investments of deferred amounts, on the normal payment dates in certain portfolios of the Trust or Met Investors Series Trust, an affiliate of the Trust, as designated by the participating Trustee. Changes in the value of participants’ deferral accounts are reflected as Trustees’ fees and expenses in the Statement of Operations. The portion of the accrued obligations allocated to the Portfolio under the Plan is reflected as Deferred trustees’ fees in the Statement of Assets and Liabilities.
6. Contractual Obligations
Under the Trust’s organizational documents, its officers and Trustees may be indemnified against certain liabilities and expenses arising out of the performance of their duties to the Trust. Additionally, the Trust has a variety of indemnification obligations under contracts with its service providers. The Trust’s maximum exposure under these arrangements is unknown, as this would involve future claims that may be made against the Trust that have not yet occurred.
7. Income Tax Information
There were no distributions paid for the years ending December 31, 2013 and 2012.
As of December 31, 2013, the components of distributable earnings (accumulated losses) on a federal income tax basis were as follows:
| | | | | | | | | | | | | | | | |
Undistributed
Ordinary
Income | | Undistributed
Long-Term
Capital Gain | | | Net
Unrealized
Appreciation | | | Loss Carryforwards | | | Total | |
| $— | | $ | 54,566,197 | | | $ | 144,204,827 | | | $ | — | | | $ | 198,771,024 | |
The Portfolio utilizes the provisions of the federal income tax laws that provide for the carryforward of capital losses for prior years, offsetting such losses against any future realized capital gains. Under the Regulated Investment Company Modernization Act of 2010 (the “Act”), net capital losses recognized after December 22, 2010 may be carried forward indefinitely and their character is retained as short-term and/or long-term losses. Previously, net capital losses were carried forward for up to eight years and treated as short-term losses. As a transition rule, the Act requires that post-enactment net capital losses be used before pre-enactment net capital losses.
During the year ended December 31, 2013, the Portfolio utilized capital loss carryforwards of $21,864,516.
As of December 31, 2013, there were no post-enactment accumulated capital losses and no pre-enactment accumulated capital loss carryforwards.
MSF-16
Metropolitan Series Fund
Loomis Sayles Small Cap Growth Portfolio
Report of Independent Registered Public Accounting Firm
To the Shareholders of Loomis Sayles Small Cap Growth Portfolio and the Board of Trustees of Metropolitan Series Fund:
We have audited the accompanying statement of assets and liabilities, including the schedule of investments, of Loomis Sayles Small Cap Growth Portfolio, one of the portfolios constituting Metropolitan Series Fund (the “Trust”) as of December 31, 2013, and the related statement of operations for the year then ended, the statements of changes in net assets for each of the two years in the period then ended, and the financial highlights for each of the five years in the period then ended. These financial statements and financial highlights are the responsibility of the Trust’s management. Our responsibility is to express an opinion on these financial statements and financial highlights based on our audits.
We conducted our audits in accordance with the standards of the Public Company Accounting Oversight Board (United States). Those standards require that we plan and perform the audit to obtain reasonable assurance about whether the financial statements and financial highlights are free of material misstatement. The Trust is not required to have, nor were we engaged to perform, an audit of its internal control over financial reporting. Our audits included consideration of internal control over financial reporting as a basis for designing audit procedures that are appropriate in the circumstances, but not for the purpose of expressing an opinion on the effectiveness of the Trust’s internal control over financial reporting. Accordingly, we express no such opinion. An audit also includes examining, on a test basis, evidence supporting the amounts and disclosures in the financial statements, assessing the accounting principles used and significant estimates made by management, as well as evaluating the overall financial statement presentation. Our procedures included confirmation of securities owned as of December 31, 2013, by correspondence with the custodian and brokers; where replies were not received from brokers, we performed other auditing procedures. We believe that our audits provide a reasonable basis for our opinion.
In our opinion, the financial statements and financial highlights referred to above present fairly, in all material respects, the financial position of Loomis Sayles Small Cap Growth Portfolio of Metropolitan Series Fund as of December 31, 2013, the results of its operations for the year then ended, the changes in its net assets for each of the two years in the period then ended, and the financial highlights for each of the five years in the period then ended, in conformity with accounting principles generally accepted in the United States of America.
Deloitte & Touche LLP
Boston, Massachusetts
February 26, 2014
MSF-17
Metropolitan Series Fund
Trustees and Officers of Metropolitan Series Fund
The Trustees and executive officers of the Trust, their ages and their principal occupations during the past five years are set forth below. Unless otherwise indicated, the business address of each is One Financial Center, Boston, MA 02111. Each Trustee who is deemed an “interested person,” as such term is defined in the 1940 Act, is indicated by an asterisk. Those Trustees who are not “interested persons” as defined in the 1940 Act are referred to as “Independent Trustees.” Additional information about the Trustees is available in the Statement of Additional Information, which is available without charge, upon request, by calling (800) 848-3854.
Trustees of the Trust
| | | | | | | | | | |
Name and Age | | Position(s)
Held with
Registrant | | Term of Office
and Length of
Time Served | | Principal Occupation(s) During the Past 5
Years(1) | | Number of
Portfolios
in Fund
Complex(2)
overseen | | Other Directorships Held
by Trustee During the
Past 5 Years(1) |
| Interested Trustee | | | | | | | | | | |
| Elizabeth M. Forget* (47) | | Trustee, Chairman of the Board, President and Chief Executive Officer | | Indefinite;
From
May
2006
(President
and Chief
Executive
Officer)/
August
2006
(Trustee
and
Chairman
of the
Board) to
present | | Senior Vice President, MetLife Inc.; President, MetLife Advisers, LLC and a predecessor company. | | 79 | | Trustee, Met Investors Series Trust (the “MIST Trust”);** various MetLife-affiliated boards. |
| | | | | |
| Independent Trustees | | | | | | | | | | |
| Stephen M. Alderman (54) | | Trustee | | Indefinite;
From
April
2012 to
present | | Shareholder in the law firm of Garfield & Merel, Ltd. | | 79 | | Trustee, MIST Trust;** Director, International Truck Leasing Corp. |
| | | | | |
| Robert J. Boulware (57) | | Trustee | | Indefinite;
From
April
2012 to
present | | Managing Director, Pilgrim Funds, LLC (private equity fund). | | 79 | | Trustee, MIST Trust;** Trustee, Vertical Capital Income Fund (closed-end fund); Director, Gainsco, Inc. (auto insurance). |
| | | | | |
| Susan C. Gause (61) | | Trustee | | Indefinite;
From
April
2012 to
present | | Private Investor. | | 79 | | Trustee, MIST Trust;** Trustee, HSBC Funds. |
| | | | | |
| Nancy Hawthorne (62) | | Trustee | | Indefinite;
From
May
2003 to
present | | Chief Executive Officer, Clerestory LLC (corporate advisor). | | 79 | | MIST Trust;** Director, THL Credit, Inc.**; Director, Avid Technology, Inc.** |
| | | | | |
| Barbara A. Nugent (57) | | Trustee | | Indefinite;
From
January
2014 to
present | | President, True North Board Governance, LLC (consulting); until 2014, partner in the law firm of Stradley Ronon Stevens & Young, LLP. | | 79 | | Trustee, MIST Trust**; Director, Episcopal Healthcare Foundation; until 2014, member, Mutual Fund Directors Forum Advisory Board. |
MSF-18
Metropolitan Series Fund
Trustees and Officers of Metropolitan Series Fund—(Continued)
| | | | | | | | | | |
Name and Age | | Position(s)
Held with
Registrant | | Term of Office
and Length of
Time Served | | Principal Occupation(s) During the Past 5
Years(1) | | Number of
Portfolios
in Fund
Complex(2)
overseen | | Other Directorships Held
by Trustee During the
Past 5 Years(1) |
| Keith M. Schappert (62) | | Trustee | | Indefinite;
From
August
2009 to
present | | Principal, Schappert Consulting LLC (asset management consulting). | | 79 | | Trustee, MIST Trust;** Director, The Commonfund for Nonprofit Organizations; until 2011, Director, Trilogy Global Advisors; Director, Mirae Asset Discovery Funds,** Director, Calamos Investments. |
| | | | | |
| Linda B. Strumpf (66) | | Trustee | | Indefinite;
From
May
2000 to
present | | Chair of the Investment Committee, Leona M. and Harry B. Helmsley Charitable Trust; until 2011, Chief Investment Officer, Leona M. and Harry B. Helmsley Charitable Trust. | | 79 | | Since 2012, Trustee, MIST Trust,** Trustee and Member of Investment Committee, The Pennsylvania State University. |
| | | | | |
| Dawn M. Vroegop (47) | | Trustee | | Indefinite;
From
May
2009 to
present | | Private Investor. | | 79 | | Trustee, MIST Trust,** Trustee, Driehaus Mutual Funds; Director and Investment Committee Chair, City College of San Francisco Foundation. |
Executive Officers of the Trust
| | | | | | |
Name and Age | | Position(s) Held with
Registrant | | Term of Office
and Length of
Time Served | | Principal Occupation(s) During Past 5 Years(1) |
| Elizabeth M. Forget (47) | | President, Chief Executive Officer, Trustee and Chairman of the Board | | From May
2006 (President
and Chief
Executive
Officer)/
August 2006
(Trustee and
Chairman of
the Board) to
present | | See principal occupation information in the table above. |
| | | |
| Jeffrey L. Bernier (42) | | Vice President | | From February
2008 to present | | Vice President, MetLife, Inc.; Senior Vice President, MetLife Advisers, LLC and a predecessor company. |
| | | |
| Peter H. Duffy (58) | | Chief Financial Officer and Treasurer | | From November
2000 to present | | Senior Vice President, MetLife Advisers, LLC; Vice President, MetLife, Inc. |
| | | |
| Andrew L. Gangolf (59) | | Secretary | | From May
2011to present | | Senior Vice President, MetLife Advisers, LLC; Senior Vice President & Assistant General Counsel, AllianceBerstein Investments, Inc. |
| | | |
| Jeffrey P. Halperin (46) | | Chief Compliance Officer | | From November
2005 to present | | Vice President, MetLife, Inc.; Chief Compliance Officer, MIST; Chief Compliance Officer, MSF Trust; Chief Compliance Officer, MetLife Advisers, LLC and a predecessor company; Chief Compliance Officer, MetLife Investment Management, LLC (formerly MetLife Investment Advisors Company, LLC). |
| | | |
| Alan C. Leland, Jr. (61) | | Vice President | | From February
2005 to present | | Treasurer and Chief Financial Officer, MetLife Advisers, LLC; Vice President, MetLife Group Inc.; Vice President, MetLife, Inc. |
| * | Ms. Forget is an “interested person” of the Trust because of her positions with MetLife Advisers, LLC and her ownership of securities issued by MetLife, Inc., the ultimate parent company of MetLife Advisers, LLC. |
| ** | Indicates a directorship with a registered investment company or a company subject to the reporting requirements of the Securities Exchange Act of 1934, as amended. |
| (1) | Previous positions during the past five years with the Trust, MetLife, Inc. or the Adviser are omitted if not materially different. |
| (2) | The Fund Complex includes 49 Portfolios of the MIST Trust and 30 Portfolios of the Trust. |
MSF-19
Metropolitan Series Fund
Loomis Sayles Small Cap Growth Portfolio
Board of Trustees’ Consideration of Advisory and Sub-Advisory Agreements
At an in-person meeting of the Boards of Trustees (the “Board”) of Met Investors Series Trust and Metropolitan Series Fund (“MIST” and “MSF,” respectively, and collectively, the “Trusts”) held on November 19-20, 2013, the Board, including a majority of the Trustees who are not considered to be “interested persons” of the Trusts (the “Independent Trustees”) under the Investment Company Act of 1940, as amended (the “1940 Act”), approved for an annual period the continuation of each Trust’s advisory agreement (the “Advisory Agreement”) with MetLife Advisers, LLC (the “Adviser”) and the applicable sub-advisory agreements (each a “Sub-Advisory Agreement,” and collectively with the Advisory Agreement, the “Agreements”) between the Adviser and the investment sub-advisers (each a “Sub-Adviser,” and collectively, the “Sub-Advisers”) for each of the series of the Trusts, including the Loomis Sayles Small Cap Growth Portfolio (each a “Portfolio,” and collectively, the “Portfolios”).1
In considering the Agreements, the Board reviewed a variety of materials provided by the Adviser and the Sub-Advisers relating to the Portfolios, including comparative performance, fee and expense information for an appropriate peer group of similar mutual funds, performance information for relevant benchmark indices and other information regarding the nature, extent and quality of services provided by the Adviser and the Sub-Advisers under their respective Agreements. The Board also took into account its experience with the Adviser and the Sub-Advisers and information provided to the Board in its meetings throughout the year with respect to the services provided by the Adviser and the Sub-Advisers, including quarterly performance reports prepared by management containing reviews of investment results, and periodic presentations from certain of the Sub-Advisers with respect to the Portfolios they manage. The Independent Trustees also assessed reports provided by the Board’s independent consultant, who reviewed and provided analyses regarding investment performance, fees and expenses, and other information provided by, or at the direction of, the Adviser and the Sub-Advisers, as more fully discussed below.
The Independent Trustees were separately advised by independent legal counsel throughout the process, and met with independent legal counsel in periodic executive sessions. Prior to voting to continue the Agreements at the November meeting, the Independent Trustees also received a memorandum from their independent counsel discussing the legal standards for their consideration of the proposed continuation of the Agreements. The Board also met in person with personnel of the Adviser on September 17, 2013 for the specific purpose of giving preliminary consideration to the proposed continuation of the Agreements and to request additional information they considered reasonably necessary to their deliberations. The Independent Trustees also discussed the proposed continuation of the Agreements in private sessions with their independent legal counsel at which no representatives of management were present.
In considering whether to approve the renewal of the Advisory Agreement with the Adviser and any applicable Sub-Advisory Agreements with respect to a Portfolio, the Board reviewed and analyzed the factors it deemed relevant, including: (1) the nature, extent and quality of the services to be provided to the Portfolios by the Adviser and the Sub-Advisers; (2) the performance of the Portfolios as compared to a peer group and an appropriate index; (3) the Adviser’s and each of the Sub-Adviser’s personnel and operations; (4) the financial condition of the Adviser and of the Sub-Advisers; (5) the level and method of computing each Portfolio’s advisory and sub-advisory fees; (6) the profitability of the Adviser under the Advisory Agreement and of certain of the Sub-Advisers under the Sub-Advisory Agreements; (7) any “fall-out” benefits to the Adviser, the Sub-Advisers and their affiliates (i.e., ancillary benefits realized by the Adviser, the Sub-Advisers or their affiliates from the Adviser’s or Sub-Advisers’ relationship with the Trusts); (8) the anticipated effect of growth in size on Portfolio expenses; (9) fees paid to certain of the Sub-Advisers by comparable institutional and retail accounts; and (10) possible conflicts of interest.
Nature, extent and quality of services. The Board evaluated the nature, extent and quality of the services that the Adviser, and the Sub-Advisers as relevant, have provided to the Portfolios. The Board considered the Adviser’s services as investment manager to the Portfolios, including services relating to the selection and oversight of the Sub-Advisers for the applicable Portfolios. The Board considered, among other things, the Adviser’s oversight of the provision of services to the Portfolios by the Sub-Advisers, including with respect to investment activities and trading practices, and the Sub-Adviser’s compliance with fund policies, objectives and Board directives, compliance policies and procedures and applicable law. The Adviser’s services in coordinating and overseeing the activities of the Trusts’ other service providers were also considered. The Board also evaluated the expertise and performance of the personnel of the Adviser who performed services for the Portfolios throughout the year.
The Board considered information received from the Trust’s Chief Compliance Officer (“CCO”) regarding the Portfolios’ compliance policies and procedures established pursuant to Rule 38a-l under the 1940 Act. The Board also evaluated the CCO’s ongoing reports concerning the CCO’s oversight of the risk assessment processes of the Sub-Advisers.
1 The Pyramis Managed Risk Portfolio recently commenced operations and, therefore, the Agreement with respect to this Portfolio was not up for renewal.
MSF-20
Metropolitan Series Fund
Loomis Sayles Small Cap Growth Portfolio
Board of Trustees’ Consideration of Advisory and Sub-Advisory Agreements—(Continued)
With respect to the services provided by each of the Sub-Advisers, the Board considered, among other things, information provided to the Board by each Sub-Adviser. The Board considered the Sub-Adviser’s current level of staffing and its overall resources, as well as its compensation program. The Board reviewed each Sub-Adviser’s history and investment experience, as well as information regarding the qualifications, background and responsibilities of the Sub-Adviser’s investment and compliance personnel who provide services to the Portfolios. The Board also considered, among other things, the Sub-Adviser’s compliance program and any disciplinary history. The Board also took into account the Sub-Adviser’s risk assessment and monitoring process. The Board noted each Sub-Adviser’s regulatory history, including whether it was currently involved in any regulatory actions or investigations as well as material litigation, and any settlements and amelioratory actions undertaken, as appropriate. The Board also noted that the CCO and his staff conduct regular, periodic compliance reviews with each of the Sub-Advisers and present reports to the Independent Trustees regarding the same, which includes evaluating the regulatory compliance systems of the Sub-Advisers and procedures reasonably designed by them to help assure compliance with the federal securities laws, including issues related to late trading and market timing, best execution, fair value pricing, and proxy voting procedures, among others. The Board also took into account the financial condition of each Sub-Adviser. In its review, the Board also received and took into account information regarding any services and/or payments provided to the Adviser by the Sub-Advisers in connection with marketing activities.
The Board considered each Sub-Adviser’s investment process and philosophy. The Board took into account that each Sub-Adviser’s responsibilities include the development and maintenance of an investment program for the applicable Portfolio which is consistent with the Portfolio’s investment objectives, the selection of investment securities and the placement of orders for the purchase and sale of such securities, as well as the implementation of compliance controls related to performance of these services. The Board also reviewed each Sub-Adviser’s brokerage policies and practices.
Performance. The Board considered the performance of the Portfolios as described in the quarterly reports prepared by management, and as also analyzed in reports prepared by the Independent Trustees’ independent consultant. The Board noted that the Adviser reviews with the Board on a quarterly basis detailed information about the Portfolios’ performance results, portfolio composition and investment strategies. The Board also reviewed and considered a separate report prepared by Lipper Inc. (“Lipper”), an independent third party, which provided a statistical analysis comparing the Portfolios’ investment performance, expenses, and fees to comparable funds underlying variable insurance products (the “Performance Universe”). In addition, the Independent Trustees met separately with a representative of Bobroff Consulting, Inc., an independent consultant (“Bobroff), at a special board meeting in September 2013, to review the separate reports prepared by such consultant (“Bobroff Report”), which analyzed the report prepared by Lipper. The Board also considered each Portfolio’s more recent performance subsequent to the performance period covered by the Lipper reports, and management’s discussion of the same, including the effect of current market conditions on each Portfolio’s more recent performance.
The Board reviewed the Portfolios’ performance records and the Adviser’s and Sub-Advisers’ management styles and long-term performance records with the Portfolios and comparable funds. The Board focused particular attention on Portfolios with less favorable performance records. The Board was mindful of the Adviser’s focus on each Sub-Adviser’s performance and noted that the Adviser has been active in monitoring and responding to any performance issues with respect to the Portfolios. The Board also took into account its discussions with management regarding factors that contributed to the performance of the Portfolios.
Among other data relating specifically to the Loomis Sayles Small Cap Growth Portfolio’s performance, the Board considered that the Portfolio outperformed the median of its Performance Universe and its Lipper Index for the one-, three- and five-year periods ended June 30, 2013. The Board further considered that the Portfolio outperformed its benchmark, the Russell 2000 Growth Index, for the one-, three- and five-year periods ended October 31, 2013.
Fees and Expenses. The Board gave consideration to the advisory fees payable under the Advisory Agreement and the sub-advisory fees payable under each of the Sub-Advisory Agreements. In this regard, the Board reviewed the advisory fees payable on a Portfolio-by- Portfolio basis based on information provided by the Adviser. The Independent Trustees, with the assistance of Bobroff, also examined the fees paid by a Portfolio in light of fees paid to other investment managers by comparable funds, as well as considered the fees charged by the Adviser to manage other comparable funds, as applicable. The Lipper report included comparisons of the Adviser’s fee schedule with that of its peers based on an asset-based analysis of relative fee structures according to the size of the Portfolio. In addition, the Board considered the Portfolios’ advisory and sub-advisory fees and total expenses as compared to similarly situated investment companies underlying variable insurance products deemed to be comparable to the Portfolios as determined by Lipper. The Board considered a Portfolio’s ranking within a smaller group of peer funds chosen by Lipper (the “Expense Group”), as well as the Portfolio’s ranking within broader groups of funds (the “Expense Universe” and the “Sub-advised Expense Universe”). The Board also considered a Portfolio’s contractual sub-advisory fees, as applicable, as compared to the Sub-advised Expense Universe as well as a
MSF-21
Metropolitan Series Fund
Loomis Sayles Small Cap Growth Portfolio
Board of Trustees’ Consideration of Advisory and Sub-Advisory Agreements—(Continued)
smaller group of funds (the “Sub-advised Expense Group”). In comparing a Portfolio’s actual and contractual management fee to that of comparable funds, the Board noted that such fee includes both advisory and administrative fees.
The Board noted that the sub-advisory fees for the Portfolios are paid by the Adviser, not the Portfolios, out of the advisory fee. It was further noted that the Adviser negotiates such fees at arm’s length. The Board also considered that the Adviser had entered into expense limitation agreements with certain of the Portfolios, pursuant to which the Adviser has agreed to waive a portion of its advisory fee and/or reimburse certain expenses as a means of limiting a Portfolio’s total annual operating expenses. The Board further considered the amount of sub-advisory fees paid out by the Adviser and the amount of the management fees that it retained in light of the services performed by Sub-Advisers and Adviser, respectively.
With respect to the Loomis Sayles Small Cap Growth Portfolio, the Board noted that the Portfolio’s actual management fees and total expenses (exclusive of 12b-1 fees) were below the Expense Group median, the Expense Universe median, and the Sub-advised Expense Universe median. The Board further noted that the Portfolio’s contractual management fees were above the asset-weighted average of the Expense Group at the Portfolio’s current size. The Board also took into account that the Portfolio’s contractual sub-advisory fees were above the average of the Sub-advised Expense Group and below the average of the Sub-advised Expense Universe at the Portfolio’s current size. The Board also noted that the Adviser had waived fees and/or reimbursed expenses during the past year.
Profitability. The Board examined the profitability of the Adviser on a Portfolio-by-Portfolio basis. The Board also considered that the Distributor, MetLife Investors Distribution Company, receives Rule 12b-1 payments to support the distribution of the products. The Board considered the profitability to the Sub-Advisers and their affiliates as a result of their relationships with the Portfolios, and the Board considered the ability of the Adviser to negotiate the Sub-Advisory Agreements and the fees thereunder at arm’s length. The Board also reviewed Portfolio specific data with regard to the profitability of the Portfolios to each Sub-Adviser, as available.
Economies of scale. The Board also considered the effect of the Portfolios’ growth in size on their fees. The Board noted that the fee schedules for most of the Portfolios contain breakpoints that reduce the fee rate above specified asset levels. The Board noted those Portfolios that did not contain breakpoints in the advisory fee and took into account management’s discussion of the same. The Board noted that those Portfolios with advisory fee schedules containing breakpoints generally reflect the inclusion of breakpoints in the sub-advisory fee schedule for such Portfolios. The Board considered the effective fees under the Advisory Agreement for a Portfolio as a percentage of assets at different asset levels and possible economies of scale that may be realized if the assets of the Portfolio grow. Among other data, the Board examined the effect of a Portfolio’s growth in size on various fee schedules and reviewed the Lipper and Bobroff Reports, which compared fees among peers. The Board also generally noted that if a Portfolio’s assets increase over time, the Portfolio may realize other economies of scale if assets increase proportionally more than certain other fixed expenses. In addition, the Board noted that the Adviser had taken a number of steps to date intended to share the benefits of economies of scale with contractholders.
With respect to the Loomis Sayles Small Cap Growth Portfolio, the Board considered that the Portfolio’s advisory fee and sub-advisory fee each contains breakpoints that reduce the advisory fee rate on assets above certain specified asset levels. The Board also noted the fact that the Portfolio’s fee levels decline as portfolio assets increase.
Other factors. As part of its evaluation of the Adviser’s compensation, the Board considered other benefits that may be realized by the Adviser and its affiliates from their relationship with the Trusts. Among them, the Board recognized that an affiliate of the Adviser, MetLife Investors Distribution Company, serves as the Distributor for the Trusts, and, as such, receives payments pursuant to Rule 12b-1 from the Portfolios to compensate it for providing shareholder services and selling activities, which could lead to growth in the Trusts’ assets and corresponding benefits from such growth, including economies of scale. The Board also considered that affiliates of the Adviser may benefit from certain indirect tax benefits relating to dividend received deductions and foreign tax credits. In conjunction with these considerations, the Board noted the costs of providing investment management and other services to the Portfolios and the ongoing commitment of the Adviser to the Portfolios.
The Board considered other benefits that may be realized by each Sub-Adviser and its affiliates from their relationship with the Trusts, including the opportunity to provide advisory services to additional portfolios of the Trusts and reputational benefits. In conjunction with these considerations, the Board noted the costs of providing investment advisory services to the Portfolios and the ongoing commitment of the Sub-Advisers to the Portfolios.
The Board considered possible conflicts of interest in the form of material benefits or detriments to the Trusts resulting from the nature of the Trusts’ and the Adviser’s or the Sub-Advisers’ affiliations and the services that are provided to the Trusts, and the manner in which such conflicts were mitigated.
MSF-22
Metropolitan Series Fund
Loomis Sayles Small Cap Growth Portfolio
Board of Trustees’ Consideration of Advisory and Sub-Advisory Agreements—(Continued)
Conclusions. After full consideration of the factors discussed above, the Board, including a majority of the Independent Trustees, approved the Advisory Agreement and the Sub-Advisory Agreement, as applicable, with respect to each Portfolio, unless otherwise noted. In making its approvals, the Board concluded that the nature, extent and quality of services provided by the Adviser and each Sub-Adviser supported the renewal of the Agreements. The Board also concluded that the investment performance of each Fund was such that each Agreement should continue. In addition, the Board concluded that fees paid by a Portfolio to the Adviser and, if applicable, the Sub-Adviser appeared to be acceptable in light of nature, extent and quality of the services provided by the Adviser and Sub-Adviser. Further, the Board concluded that the Adviser’s profitability in providing services under the Advisory Agreements did not appear unreasonably high in light of the nature, extent and quality of the services provided by the Adviser. Finally, the Board concluded that the Advisory and Sub-Advisory fees in some measure share economies of scale with contractholders. In approving the renewal of each of the Agreements, the Board, including the Independent Trustees, did not identify any single factor as controlling, and generally attributed different weights to various factors for the various Portfolios. The Board evaluated all information available to them on a Portfolio-by-Portfolio basis, and their decisions were made separately with respect to each Portfolio.
MSF-23
Metropolitan Series Fund
Met/Artisan Mid Cap Value Portfolio
Managed By Artisan Partners Limited Partnership
Portfolio Manager Commentary*
PERFORMANCE
For the one year period ended December 31, 2013, the Class A, B, and E shares of the Met/Artisan Mid Cap Value Portfolio returned 36.85%, 36.51%, and 36.65%, respectively. The Portfolio’s benchmark, the Russell Midcap Value Index1, returned 33.46%.
MARKET ENVIRONMENT / CONDITIONS
Most broad-based indices were up more than 30% on the year, setting new highs along the way. Virtually every area of the market netted solid gains. Ample supply of central bank liquidity has aided in the market’s momentum. Easy monetary policy has not only reduced borrowing costs for businesses and consumers, but has lowered the bar for equities, which have had very little competition from low-yielding cash and bonds. Even so, as of 2012, U.S. equity funds had experienced net outflows in each year since the 2008 financial crisis. That string finally came to an end in 2013 in what some have referred to as the playing out of a “great rotation” into equities. With corporate earnings growth ranging in the low to mid-single digits, most of the year’s gains have come from an expansion in the price multiple rather than from growth in economic values. Notably, the ratio of market value to gross domestic product (“GDP”) is now higher than at the prior market peak in 2007.
PORTFOLIO REVIEW / PERIOD END POSITIONING
The Portfolio participated in the market’s gains and outperformed the Russell Midcap Value Index. Relative returns benefited from sector positioning, driven by our outsized position in the Technology sector and low weighting in the Utilities sector. Additionally, stock
selection was positive with relative strength largely in the Industrials, Energy, and Financials sectors. Towers Watson & Co. and Manpowergroup, Inc. led our gains in the Industrials sector. Our underweight exposure to Real Estate Investment Trusts helped us in the Financials sector. In the Energy sector, Cimarex Energy Co. was our top contributor to return. The Materials sector was an area of weakness due to our sole holding in the sector: Kinross Gold Corp. (Canada).
Our biggest sector-level changes during the period were a reduction in our exposure to the Industrials sector and an increase in weighting in the Consumer Discretionary sector. In the Industrials sector, we sold The Dun & Bradstreet Corp., Spirit AeroSystems Holdings, Inc., and Flowserve Corp. In the Consumer Discretionary sector, we purchased Coach, Inc. and Nordstrom, Inc. Other meaningful new purchases included KLA-Tencor Corp. and Edison International.
As of December 31, 2013 the Portfolio was notably overweight the Technology and Energy sectors, and underweight the Financials, Health Care, Materials, and Utilities sectors.
James C. Kieffer
Scott C. Satterwhite
George O. Sertl
Daniel L. Kane
Portfolio Managers
Artisan Partners Limited Partnership
* This commentary may include statements that constitute “forward-looking statements” under the U.S. securities laws. Forward-looking statements include, among other things, projections, estimates, and information about possible or future results related to the Portfolio, market or regulatory developments. The views expressed above are not guarantees of future performance or economic results and involve certain risks, uncertainties and assumptions that could cause actual outcomes and results to differ materially from the views expressed herein. The views expressed above are subject to change at any time based upon economic, market, or other conditions and the subadvisory firm undertakes no obligation to update the views expressed herein. Any discussions of specific securities should not be considered a recommendation to buy or sell those securities. The views expressed above (including any forward-looking statement) may not be relied upon as investment advice or as an indication of the Portfolio’s trading intent. Information about the Portfolio’s holdings, asset allocation or country diversification is historical and is not an indication of future Portfolio composition, which may vary. Direct investment in any index is not possible. The performance of any index mentioned in this commentary has not been adjusted for ongoing management, distribution and operating expenses, and sales charges applicable to mutual fund investments. In addition, the returns do not reflect additional fees charged by separate accounts or variable insurance contracts that an investor in the Portfolio may pay. If these additional fees were reflected, performance would have been lower.
MSF-1
Metropolitan Series Fund
Met/Artisan Mid Cap Value Portfolio
A $10,000 INVESTMENT COMPARED TO THE RUSSELL MIDCAP VALUE INDEX

AVERAGE ANNUAL RETURNS (%) (FOR THE YEAR ENDED DECEMBER 31, 2013)
| | | | | | | | | | | | |
| | | 1 Year | | | 5 Year | | | 10 Year | |
| Met/Artisan Mid Cap Value Portfolio | | | | | | | | | | | | |
Class A | | | 36.85 | | | | 21.63 | | | | 6.17 | |
Class B | | | 36.51 | | | | 21.32 | | | | 5.91 | |
Class E | | | 36.65 | | | | 21.44 | | | | 6.01 | |
| Russell Midcap Value Index | | | 33.46 | | | | 21.16 | | | | 10.25 | |
1 The Russell Midcap Value Index is an unmanaged measure of performance of those Russell Midcap companies (the 800 smallest companies in the Russell 1000 Index) with lower price-to-book ratios and forecasted growth values.
Portfolio performance is calculated including reinvestment of all income and capital gain distributions. Performance numbers are net of all Portfolio expenses but do not include any insurance, sales, separate account or administrative charges of variable annuity or life insurance contracts or any additional expenses that participants may bear relating to the operations of their plans. If these charges were included, the returns would be lower. The performance of any index referenced above has not been adjusted for ongoing management, distribution and operating expenses, and sales charges applicable to mutual fund investments. Direct investment in any index is not possible. The performance of Class A shares, as set forth in the line graph above, will differ from that of other classes because of the difference in expenses paid by policyholders investing in the different share classes.
This information represents past performance and is not indicative of future results. Investment return and principal value may fluctuate so that shares, upon redemption, may be worth more or less than the original cost.
PORTFOLIO COMPOSITION AS OF DECEMBER 31, 2013
Top Holdings
| | | | |
| | |
% of
Net Assets | |
| Cigna Corp. | | | 3.1 | |
| Avnet, Inc. | | | 2.8 | |
| Arrow Electronics, Inc. | | | 2.6 | |
| Analog Devices, Inc. | | | 2.5 | |
| Cimarex Energy Co. | | | 2.5 | |
| Lam Research Corp. | | | 2.5 | |
| Kroger Co. (The) | | | 2.5 | |
| Allstate Corp. (The) | | | 2.4 | |
| Alleghany Corp. | | | 2.3 | |
| IntercontinentalExchange Group, Inc. | | | 2.2 | |
Top Sectors
| | | | |
| | | % of
Market Value of
Total Long-Term Investments | |
| Information Technology | | | 26.4 | |
| Financials | | | 22.6 | |
| Energy | | | 13.8 | |
| Industrials | | | 13.2 | |
| Consumer Discretionary | | | 13.1 | |
| Health Care | | | 4.4 | |
| Utilities | | | 2.7 | |
| Consumer Staples | | | 2.7 | |
| Materials | | | 1.1 | |
MSF-2
Metropolitan Series Fund
Met/Artisan Mid Cap Value Portfolio
Understanding Your Portfolio’s Expenses
Shareholder Expense Example
As a shareholder of the Portfolio, you incur ongoing costs, including management fees; distribution and service (12b-1) fees; and other Portfolio expenses. This example is intended to help you understand your ongoing costs (in dollars) (referred to as “expenses”) of investing in the Portfolio and compare these costs with the ongoing costs of investing in other mutual funds. The example is based on an investment of $1,000 invested at the beginning of the period and held for the entire period, July 1, 2013 through December 31, 2013.
Actual Expenses
The first line for each share class of the Portfolio in the table below provides information about actual account values and actual expenses. You may use the information in this line, together with the amount you invested in the particular share class of the Portfolio, to estimate the expenses that you paid over the period. Simply divide your account value by $1,000 (for example, an $8,600 account value divided by $1,000 = 8.6), then multiply the result by the number in the first line under the heading entitled “Expenses Paid During Period” to estimate the expenses you paid on your account during this period.
Hypothetical Example for Comparison Purposes
The second line for each share class of the Portfolio in the table below provides information about hypothetical account values and hypothetical expenses based on the Portfolio’s actual expense ratio and an assumed rate of return of 5% per year before expenses, which is not the Portfolio’s actual return. The hypothetical account values and expenses may not be used to estimate the actual ending account balance or expenses you paid for the period. You may use this information to compare the ongoing costs of investing in the Portfolio and other funds. To do so, compare this 5% hypothetical example with the 5% hypothetical examples that appear in the shareholder reports of the other funds.
Please note that the expenses shown in the table are meant to highlight your ongoing costs only and do not reflect any fees or charges of your variable insurance product or any additional expenses that participants in certain eligible qualified plans may bear relating to the operations of their plan. Therefore, the second line for each share class in the table is useful in comparing ongoing costs only, and will not help you determine the relative total costs of owning different funds. In addition, if these other costs were included, your costs would have been higher.
| | | | | | | | | | | | | | | | | | |
Met/Artisan Mid Cap Value Portfolio | | | | Annualized
Expense
Ratio | | | Beginning
Account Value
July 1,
2013 | | | Ending
Account Value
December 31,
2013 | | | Expenses Paid
During Period**
July 1, 2013
to
December 31,
2013 | |
Class A | | Actual | | | 0.83 | % | | $ | 1,000.00 | | | $ | 1,162.30 | | | $ | 4.52 | |
| | Hypothetical* | | | 0.83 | % | | $ | 1,000.00 | | | $ | 1,021.02 | | | $ | 4.23 | |
| | | | | |
Class B | | Actual | | | 1.08 | % | | $ | 1,000.00 | | | $ | 1,160.80 | | | $ | 5.88 | |
| | Hypothetical* | | | 1.08 | % | | $ | 1,000.00 | | | $ | 1,019.76 | | | $ | 5.50 | |
| | | | | |
Class E | | Actual | | | 0.98 | % | | $ | 1,000.00 | | | $ | 1,161.40 | | | $ | 5.34 | |
| | Hypothetical* | | | 0.98 | % | | $ | 1,000.00 | | | $ | 1,020.27 | | | $ | 4.99 | |
* Hypothetical assumes a rate of return of 5% per year before expenses.
** Expenses paid are equal to the Portfolio’s annualized expense ratio for the most recent six month period, as shown above, multiplied by the average account value over the period, multiplied by the number of days (184 days) in the most recent fiscal half-year, divided by 365 (to reflect the one-half year period).
MSF-3
Metropolitan Series Fund
Met/Artisan Mid Cap Value Portfolio
Schedule of Investments as of December 31, 2013
Common Stocks—92.2% of Net Assets
| | | | | | | | |
| Security Description | | Shares | | | Value | |
| | |
Aerospace & Defense—2.6% | | | | | | | | |
L-3 Communications Holdings, Inc. | | | 153,944 | | | $ | 16,450,456 | |
Rockwell Collins, Inc. | | | 330,300 | | | | 24,415,776 | |
| | | | | | | | |
| | | | | | | 40,866,232 | |
| | | | | | | | |
| | |
Capital Markets—0.9% | | | | | | | | |
Northern Trust Corp. | | | 237,400 | | | | 14,692,686 | |
| | | | | | | | |
| | |
Commercial Banks—1.0% | | | | | | | | |
M&T Bank Corp. (a) | | | 135,542 | | | | 15,779,800 | |
| | | | | | | | |
|
Commercial Services & Supplies—1.0% | |
Republic Services, Inc. | | | 478,200 | | | | 15,876,240 | |
| | | | | | | | |
| | |
Computers & Peripherals—1.0% | | | | | | | | |
Lexmark International, Inc. - Class A (a) | | | 466,500 | | | | 16,570,080 | |
| | | | | | | | |
| | |
Construction & Engineering—1.4% | | | | | | | | |
Jacobs Engineering Group, Inc. (b) | | | 364,309 | | | | 22,947,824 | |
| | | | | | | | |
|
Diversified Consumer Services—1.9% | |
H&R Block, Inc. | | | 1,019,704 | | | | 29,612,204 | |
| | | | | | | | |
| | |
Diversified Financial Services—2.2% | | | | | | | | |
IntercontinentalExchange Group, Inc. | | | 154,896 | | | | 34,839,208 | |
| | | | | | | | |
| | |
Electric Utilities—2.0% | | | | | | | | |
Edison International | | | 678,049 | | | | 31,393,669 | |
| | | | | | | | |
| | |
Electrical Equipment—1.5% | | | | | | | | |
Hubbell, Inc. - Class B | | | 213,251 | | | | 23,223,034 | |
| | | | | | | | |
|
Electronic Equipment, Instruments & Components—9.4% | |
Arrow Electronics, Inc. (b) | | | 767,136 | | | | 41,617,128 | |
Avnet, Inc. | | | 1,008,000 | | | | 44,462,880 | |
FLIR Systems, Inc. | | | 1,150,700 | | | | 34,636,070 | |
Ingram Micro, Inc. - Class A (b) | | | 1,184,262 | | | | 27,782,786 | |
| | | | | | | | |
| | | | | | | 148,498,864 | |
| | | | | | | | |
| | |
Energy Equipment & Services—4.7% | | | | | | | | |
Ensco plc - Class A | | | 456,054 | | | | 26,077,168 | |
McDermott International, Inc. (a) (b) | | | 1,935,100 | | | | 17,725,516 | |
Patterson-UTI Energy, Inc. | | | 1,205,800 | | | | 30,530,856 | |
| | | | | | | | |
| | | | | | | 74,333,540 | |
| | | | | | | | |
| | |
Food & Staples Retailing—2.5% | | | | | | | | |
Kroger Co. (The) | | | 994,200 | | | | 39,300,726 | |
| | | | | | | | |
| |
Health Care Equipment & Supplies—1.0% | | | | | |
Becton Dickinson & Co. | | | 144,500 | | | | 15,965,805 | |
| | | | | | | | |
| |
Health Care Providers & Services—3.1% | | | | | |
Cigna Corp. | | | 557,490 | | | | 48,769,225 | |
| | | | | | | | |
|
Insurance—15.1% | |
Alleghany Corp. (b) | | | 90,855 | | | | 36,338,366 | |
Allied World Assurance Co. Holdings AG | | | 177,277 | | | | 19,998,618 | |
|
Insurance—(Continued) | |
Allstate Corp. (The) | | | 684,600 | | | | 37,338,084 | |
Aon plc | | | 356,288 | | | | 29,889,000 | |
Arch Capital Group, Ltd. (a) (b) | | | 554,500 | | | | 33,098,105 | |
Loews Corp. | | | 543,300 | | | | 26,208,792 | |
Progressive Corp. (The) | | | 1,081,900 | | | | 29,503,413 | |
Torchmark Corp. | | | 339,800 | | | | 26,555,370 | |
| | | | | | | | |
| | | | | | | 238,929,748 | |
| | | | | | | | |
|
Internet & Catalog Retail—1.3% | |
Liberty Interactive Corp. - Class A (b) | | | 722,048 | | | | 21,192,109 | |
| | | | | | | | |
|
IT Services—5.1% | |
Broadridge Financial Solutions, Inc. | | | 264,031 | | | | 10,434,505 | |
NeuStar, Inc. - Class A (b) | | | 396,678 | | | | 19,778,365 | |
Teradata Corp. (b) | | | 437,522 | | | | 19,902,876 | |
Western Union Co. (The) (a) | | | 1,813,525 | | | | 31,283,306 | |
| | | | | | | | |
| | | | | | | 81,399,052 | |
| | | | | | | | |
|
Leisure Equipment & Products—1.9% | |
Mattel, Inc. | | | 627,600 | | | | 29,861,208 | |
| | | | | | | | |
|
Machinery—1.4% | |
Joy Global, Inc. (a) | | | 389,900 | | | | 22,805,251 | |
| | | | | | | | |
|
Media—1.9% | |
Omnicom Group, Inc. | | | 407,700 | | | | 30,320,649 | |
| | | | | | | | |
|
Metals & Mining—1.1% | |
Kinross Gold Corp. | | | 3,857,831 | | | | 16,897,300 | |
| | | | | | | | |
|
Multi-Utilities—0.5% | |
SCANA Corp. | | | 185,887 | | | | 8,723,677 | |
| | | | | | | | |
|
Multiline Retail—1.5% | |
Nordstrom, Inc. (a) | | | 377,039 | | | | 23,301,010 | |
| | | | | | | | |
|
Oil, Gas & Consumable Fuels—8.0% | |
Cimarex Energy Co. | | | 380,535 | | | | 39,921,927 | |
Hess Corp. | | | 378,400 | | | | 31,407,200 | |
SM Energy Co. | | | 318,200 | | | | 26,445,602 | |
Southwestern Energy Co. (b) | | | 745,723 | | | | 29,329,285 | |
| | | | | | | | |
| | | | | | | 127,104,014 | |
| | | | | | | | |
|
Professional Services—3.1% | |
Manpowergroup, Inc. | | | 286,806 | | | | 24,625,163 | |
Towers Watson & Co. - Class A | | | 191,150 | | | | 24,392,652 | |
| | | | | | | | |
| | | | | | | 49,017,815 | |
| | | | | | | | |
|
Real Estate Investment Trusts—1.6% | |
Annaly Capital Management, Inc. (a) | | | 880,400 | | | | 8,777,588 | |
Hatteras Financial Corp. | | | 1,047,700 | | | | 17,119,418 | |
| | | | | | | | |
| | | | | | | 25,897,006 | |
| | | | | | | | |
|
Road & Rail—1.1% | |
Ryder System, Inc. | | | 247,700 | | | | 18,275,306 | |
| | | | | | | | |
See accompanying notes to financial statements.
MSF-4
Metropolitan Series Fund
Met/Artisan Mid Cap Value Portfolio
Schedule of Investments as of December 31, 2013
Common Stocks—(Continued)
| | | | | | | | |
| Security Description | |
Shares | | | Value | |
|
Semiconductors & Semiconductor Equipment—6.8% | |
Analog Devices, Inc. | | | 785,440 | | | $ | 40,002,459 | |
KLA-Tencor Corp. | | | 430,000 | | | | 27,717,800 | |
Lam Research Corp. (b) | | | 724,100 | | | | 39,427,245 | |
| | | | | | | | |
| | | | | | | 107,147,504 | |
| | | | | | | | |
|
Software—2.0% | |
Autodesk, Inc. (b) | | | 34,406 | | | | 1,731,654 | |
Open Text Corp. | | | 161,886 | | | | 14,887,037 | |
Synopsys, Inc. (b) | | | 376,700 | | | | 15,282,719 | |
| | | | | | | | |
| | | | | | | 31,901,410 | |
| | | | | | | | |
|
Specialty Retail—1.9% | |
Bed Bath & Beyond, Inc. (b) | | | 381,900 | | | | 30,666,570 | |
| | | | | | | | |
|
Textiles, Apparel & Luxury Goods—1.7% | |
Coach, Inc. | | | 471,300 | | | | 26,454,069 | |
| | | | | | | | |
Total Common Stocks
(Cost $1,001,107,631) | | | | | | | 1,462,562,835 | |
| | | | | | | | |
|
| Short-Term Investments—15.2% | |
| | |
Mutual Fund—7.5% | | | | | | | | |
State Street Navigator Securities Lending MET Portfolio (c) | | | 117,800,543 | | | | 117,800,543 | |
| | | | | | | | |
|
Repurchase Agreement—7.7% | |
Fixed Income Clearing Corp. Repurchase Agreement dated 12/31/13 at 0.000% to be repurchased at $122,056,000 on 01/02/14, collateralized by $123,880,000 U.S. Treasury Note at 0.875% due 01/31/17 with a value of $124,499,400. | | | 122,056,000 | | | | 122,056,000 | |
| | | | | | | | |
Total Short-Term Investments
(Cost $239,856,543) | | | | | | | 239,856,543 | |
| | | | | | | | |
Total Investments—107.4%
(Cost $1,240,964,174) (d) | | | | | | | 1,702,419,378 | |
Other assets and liabilities (net)—(7.4)% | | | | | | | (116,567,625 | ) |
| | | | | | | | |
| Net Assets—100.0% | | | | | | $ | 1,585,851,753 | |
| | | | | | | | |
| * | Principal amount stated in U.S. dollars unless otherwise noted. |
| (a) | All or a portion of the security was held on loan. As of December 31, 2013, the market value of securities loaned was $115,208,638 and the collateral received consisted of cash in the amount of $117,800,543. The cash collateral is invested in a money market fund managed by an affiliate of the custodian. |
| (b) | Non-income producing security. |
| (c) | Represents investment of cash collateral received from securities lending transactions. |
| (d) | As of December 31, 2013, the aggregate cost of investments for federal income tax purposes was $1,241,707,117. The aggregate unrealized appreciation and depreciation of investments were $490,369,039 and $(29,656,778), respectively, resulting in net unrealized appreciation of $460,712,261 for federal income tax purposes. |
See accompanying notes to financial statements.
MSF-5
Metropolitan Series Fund
Met/Artisan Mid Cap Value Portfolio
Schedule of Investments as of December 31, 2013
Fair Value Hierarchy
Accounting principles generally accepted in the United States of America (“GAAP”) define fair market value as the price that the Portfolio would receive to sell an asset or pay to transfer a liability in an orderly transaction between market participants at the measurement date. It establishes a fair value hierarchy that prioritizes inputs to valuation methods and requires disclosure of the fair value hierarchy that segregates fair value measurements into three levels. Levels 1, 2 and 3 of the fair value hierarchy are defined as follows:
Level 1 - unadjusted quoted prices in active markets for identical investments
Level 2 - other significant observable inputs (including, but not limited to, unadjusted quoted prices for similar investments in markets that are either active or inactive; inputs other than quoted prices that are observable such as interest rates, yield curves, volatilities, prepayment speeds, loss severities, credit risks, default rates, etc.)
Level 3 - significant unobservable inputs based on the best information available in the circumstances, to the extent observable inputs are unavailable (including the Portfolio’s own assumptions in determining the fair value of investments)
The inputs or methodologies used for valuing investments are not necessarily an indication of the risk associated with investing in them. Changes to the inputs or methodologies used may result in transfers between levels, which will be recognized as of the beginning of the reporting period. Information on transfers between Level 1 and Level 2, if any, will be disclosed following the fair value hierarchy table below. A reconciliation of Level 3 securities, if any, will also be disclosed following the fair value hierarchy table. For more information about the Portfolio’s policy regarding the valuation of investments, please refer to the Notes to Financial Statements.
The following table summarizes the fair value hierarchy of the Portfolio’s investments as of December 31, 2013:
| | | | | | | | | | | | | | | | |
| Description | | Level 1 | | | Level 2 | | | Level 3 | | | Total | |
Total Common Stocks* | | $ | 1,462,562,835 | | | $ | — | | | $ | — | | | $ | 1,462,562,835 | |
| Short-Term Investments | | | | | | | | | | | | | | | | |
Mutual Fund | | | 117,800,543 | | | | — | | | | — | | | | 117,800,543 | |
Repurchase Agreement | | | — | | | | 122,056,000 | | | | — | | | | 122,056,000 | |
Total Short-Term Investments | | | 117,800,543 | | | | 122,056,000 | | | | — | | | | 239,856,543 | |
Total Investments | | $ | 1,580,363,378 | | | $ | 122,056,000 | | | $ | — | | | $ | 1,702,419,378 | |
| | | | | | | | | | | | | | | | | |
Collateral for Securities Loaned (Liability) | | $ | — | | | $ | (117,800,543 | ) | | $ | — | | | $ | (117,800,543 | ) |
| * | See Schedule of Investments for additional detailed categorizations. |
See accompanying notes to financial statements.
MSF-6
Metropolitan Series Fund
Met/Artisan Mid Cap Value Portfolio
Statement of Assets and Liabilities
December 31, 2013
| | | | |
Assets | | | | |
Investments at value (a) (b) | | $ | 1,702,419,378 | |
Cash | | | 224,941 | |
Receivable for: | | | | |
Investments sold | | | 4,341,188 | |
Fund shares sold | | | 120,945 | |
Dividends | | | 2,224,600 | |
Prepaid expenses | | | 3,790 | |
| | | | |
Total Assets | | | 1,709,334,842 | |
Liabilities | | | | |
Collateral for securities loaned | | | 117,800,543 | |
Payables for: | | | | |
Investments purchased | | | 2,480,482 | |
Fund shares redeemed | | | 1,871,321 | |
Accrued expenses: | | | | |
Management fees | | | 1,065,605 | |
Distribution and service fees | | | 119,239 | |
Deferred trustees’ fees | | | 53,230 | |
Other expenses | | | 92,669 | |
| | | | |
Total Liabilities | | | 123,483,089 | |
| | | | |
Net Assets | | $ | 1,585,851,753 | |
| | | | |
Net assets consist of: | | | | |
Paid in surplus | | $ | 1,140,020,283 | |
Undistributed net investment income | | | 10,517,876 | |
Accumulated net realized loss | | | (26,141,610 | ) |
Unrealized appreciation on investments | | | 461,455,204 | |
| | | | |
Net Assets | | $ | 1,585,851,753 | |
| | | | |
Net Assets | | | | |
Class A | | $ | 969,994,978 | |
Class B | | | 505,007,648 | |
Class E | | | 110,849,127 | |
Capital Shares Outstanding* | | | | |
Class A | | | 3,611,346 | |
Class B | | | 1,931,162 | |
Class E | | | 418,519 | |
Net Asset Value, Offering Price and Redemption Price Per Share | | | | |
Class A | | $ | 268.60 | |
Class B | | | 261.50 | |
Class E | | | 264.86 | |
| * | The Portfolio is authorized to issue an unlimited number of shares. |
| (a) | Identified cost of investments was $1,240,964,174. |
| (b) | Includes securities loaned at value of $115,208,638. |
Statement of Operations
Year Ended December 31, 2013
| | | | |
Investment Income | | | | |
Dividends (a) | | $ | 23,805,640 | |
Interest | | | 3,767 | |
Securities lending income | | | 264,412 | |
| | | | |
Total investment income | | | 24,073,819 | |
Expenses | | | | |
Management fees | | | 11,692,397 | |
Administration fees | | | 20,322 | |
Custodian and accounting fees | | | 110,013 | |
Distribution and service fees—Class B | | | 1,120,667 | |
Distribution and service fees—Class E | | | 162,112 | |
Audit and tax services | | | 37,723 | |
Legal | | | 27,754 | |
Trustees’ fees and expenses | | | 31,941 | |
Shareholder reporting | | | 80,188 | |
Insurance | | | 7,254 | |
Miscellaneous | | | 14,580 | |
| | | | |
Total expenses | | | 13,304,951 | |
Less broker commission recapture | | | (41,987 | ) |
| | | | |
Net expenses | | | 13,262,964 | |
| | | | |
Net Investment Income | | | 10,810,855 | |
| | | | |
Net Realized and Unrealized Gain | | | | |
Net realized gain on investments | | | 147,105,680 | |
| | | | |
Net change in unrealized appreciation on investments | | | 286,341,957 | |
| | | | |
Net realized and unrealized gain | | | 433,447,637 | |
| | | | |
Net Increase in Net Assets From Operations | | $ | 444,258,492 | |
| | | | |
| (a) | Net of foreign withholding taxes of $84,837. |
See accompanying notes to financial statements.
MSF-7
Metropolitan Series Fund
Met/Artisan Mid Cap Value Portfolio
Statements of Changes in Net Assets
| | | | | | | | |
| | | Year Ended
December 31,
2013 | | | Year Ended
December 31,
2012 | |
Increase (Decrease) in Net Assets: | | | | | | | | |
From Operations | | | | | | | | |
Net investment income | | $ | 10,810,855 | | | $ | 13,555,827 | |
Net realized gain | | | 147,105,680 | | | | 96,350,321 | |
Net change in unrealized appreciation | | | 286,341,957 | | | | 29,291,151 | |
| | | | | | | | |
Increase in net assets from operations | | | 444,258,492 | | | | 139,197,299 | |
| | | | | | | | |
From Distributions to Shareholders | | | | | | | | |
Net investment income | | | | | | | | |
Class A | | | (8,743,922 | ) | | | (7,479,743 | ) |
Class B | | | (3,398,401 | ) | | | (3,099,091 | ) |
Class E | | | (927,132 | ) | | | (896,810 | ) |
| | | | | | | | |
Total distributions | | | (13,069,455 | ) | | | (11,475,644 | ) |
| | | | | | | | |
Decrease in net assets from capital share transactions | | | (102,632,947 | ) | | | (90,434,681 | ) |
| | | | | | | | |
Total increase in net assets | | | 328,556,090 | | | | 37,286,974 | |
| | |
Net Assets | | | | | | | | |
Beginning of period | | | 1,257,295,663 | | | | 1,220,008,689 | |
| | | | | | | | |
End of period | | $ | 1,585,851,753 | | | $ | 1,257,295,663 | |
| | | | | | | | |
Undistributed Net Investment Income | | | | | | | | |
End of period | | $ | 10,517,876 | | | $ | 13,356,828 | |
| | | | | | | | |
Other Information:
Capital Shares
Transactions in capital shares were as follows:
| | | | | | | | | | | | | | | | |
| | | Year Ended
December 31, 2013 | | | Year Ended
December 31, 2012 | |
| | | Shares | | | Value | | | Shares | | | Value | |
Class A | | | | | | | | | | | | | | | | |
Sales | | | 337,861 | | | $ | 77,321,034 | | | | 177,476 | | | $ | 33,377,136 | |
Reinvestments | | | 39,940 | | | | 8,743,922 | | | | 39,483 | | | | 7,479,743 | |
Redemptions | | | (646,198 | ) | | | (150,839,338 | ) | | | (425,058 | ) | | | (80,810,734 | ) |
| | | | | | | | | | | | | | | | |
Net decrease | | | (268,397 | ) | | $ | (64,774,382 | ) | | | (208,099 | ) | | $ | (39,953,855 | ) |
| | | | | | | | | | | | | | | | |
Class B | | | | | | | | | | | | | | | | |
Sales | | | 253,823 | | | $ | 60,347,875 | | | | 153,457 | | | $ | 28,054,806 | |
Reinvestments | | | 15,917 | | | | 3,398,401 | | | | 16,767 | | | | 3,099,091 | |
Redemptions | | | (353,573 | ) | | | (81,268,989 | ) | | | (355,155 | ) | | | (65,568,302 | ) |
| | | | | | | | | | | | | | | | |
Net decrease | | | (83,833 | ) | | $ | (17,522,713 | ) | | | (184,931 | ) | | $ | (34,414,405 | ) |
| | | | | | | | | | | | | | | | |
Class E | | | | | | | | | | | | | | | | |
Sales | | | 18,197 | | | $ | 4,151,731 | | | | 24,464 | | | $ | 4,534,345 | |
Reinvestments | | | 4,290 | | | | 927,132 | | | | 4,795 | | | | 896,810 | |
Redemptions | | | (108,957 | ) | | | (25,414,715 | ) | | | (115,606 | ) | | | (21,497,576 | ) |
| | | | | | | | | | | | | | | | |
Net decrease | | | (86,470 | ) | | $ | (20,335,852 | ) | | | (86,347 | ) | | $ | (16,066,421 | ) |
| | | | | | | | | | | | | | | | |
Decrease derived from capital shares transactions | | | | | | $ | (102,632,947 | ) | | | | | | $ | (90,434,681 | ) |
| | | | | | | | | | | | | | | | |
See accompanying notes to financial statements.
MSF-8
Metropolitan Series Fund
Met/Artisan Mid Cap Value Portfolio
Financial Highlights
| | | | | | | | | | | | | | | | | | | | |
| Selected per share data | | | | | | | | | | | | | | | |
| | | Class A | |
| | | Year Ended December 31, | |
| | | 2013 | | | 2012 | | | 2011 | | | 2010 | | | 2009 | |
Net Asset Value, Beginning of Period | | $ | 198.30 | | | $ | 179.02 | | | $ | 169.21 | | | $ | 148.14 | | | $ | 105.95 | |
| | | | | | | | | | | | | | | | | | | | |
Income (Loss) from Investment Operations | | | | | | | | | | | | | | | | | | | | |
Net investment income (a) | | | 1.98 | | | | 2.22 | | | | 1.73 | | | | 1.67 | | | | 1.19 | |
Net realized and unrealized gain on investments | | | 70.60 | | | | 18.92 | | | | 9.78 | | | | 20.55 | | | | 42.37 | |
| | | | | | | | | | | | | | | | | | | | |
Total from investment operations | | | 72.58 | | | | 21.14 | | | | 11.51 | | | | 22.22 | | | | 43.56 | |
| | | | | | | | | | | | | | | | | | | | |
Less Distributions | | | | | | | | | | | | | | | | | | | | |
Distributions from net investment income | | | (2.28 | ) | | | (1.86 | ) | | | (1.70 | ) | | | (1.15 | ) | | | (1.37 | ) |
| | | | | | | | | | | | | | | | | | | | |
Total distributions | | | (2.28 | ) | | | (1.86 | ) | | | (1.70 | ) | | | (1.15 | ) | | | (1.37 | ) |
| | | | | | | | | | | | | | | | | | | | |
Net Asset Value, End of Period | | $ | 268.60 | | | $ | 198.30 | | | $ | 179.02 | | | $ | 169.21 | | | $ | 148.14 | |
| | | | | | | | | | | | | | | | | | | | |
Total Return (%) (b) | | | 36.85 | | | | 11.86 | | | | 6.76 | | | | 15.04 | | | | 41.56 | |
| | | | | |
Ratios/Supplemental Data | | | | | | | | | | | | | | | | | | | | |
Ratio of expenses to average net assets (%) | | | 0.83 | | | | 0.85 | | | | 0.84 | | | | 0.84 | | | | 0.85 | |
Ratio of net investment income to average net assets (%) | | | 0.84 | | | | 1.17 | | | | 0.97 | | | | 1.09 | | | | 0.97 | |
Portfolio turnover rate (%) | | | 22 | | | | 23 | | | | 30 | | | | 39 | | | | 143 | |
Net assets, end of period (in millions) | | $ | 970.0 | | | $ | 769.4 | | | $ | 731.8 | | | $ | 876.7 | | | $ | 857.0 | |
| | | | | | | | | | | | | | | | | | | | |
| | | Class B | |
| | | Year Ended December 31, | |
| | | 2013 | | | 2012 | | | 2011 | | | 2010 | | | 2009 | |
Net Asset Value, Beginning of Period | | $ | 193.14 | | | $ | 174.44 | | | $ | 164.99 | | | $ | 144.56 | | | $ | 103.30 | |
| | | | | | | | | | | | | | | | | | | | |
Income (Loss) from Investment Operations | | | | | | | | | | | | | | | | | | | | |
Net investment income (a) | | | 1.36 | | | | 1.69 | | | | 1.30 | | | | 1.27 | | | | 0.84 | |
Net realized and unrealized gain on investments | | | 68.77 | | | | 18.44 | | | | 9.47 | | | | 20.01 | | | | 41.39 | |
| | | | | | | | | | | | | | | | | | | | |
Total from investment operations | | | 70.13 | | | | 20.13 | | | | 10.77 | | | | 21.28 | | | | 42.23 | |
| | | | | | | | | | | | | | | | | | | | |
Less Distributions | | | | | | | | | | | | | | | | | | | | |
Distributions from net investment income | | | (1.77 | ) | | | (1.43 | ) | | | (1.32 | ) | | | (0.85 | ) | | | (0.97 | ) |
| | | | | | | | | | | | | | | | | | | | |
Total distributions | | | (1.77 | ) | | | (1.43 | ) | | | (1.32 | ) | | | (0.85 | ) | | | (0.97 | ) |
| | | | | | | | | | | | | | | | | | | | |
Net Asset Value, End of Period | | $ | 261.50 | | | $ | 193.14 | | | $ | 174.44 | | | $ | 164.99 | | | $ | 144.56 | |
| | | | | | | | | | | | | | | | | | | | |
Total Return (%) (b) | | | 36.51 | | | | 11.58 | | | | 6.49 | | | | 14.76 | | | | 41.20 | |
| | | | | |
Ratios/Supplemental Data | | | | | | | | | | | | | | | | | | | | |
Ratio of expenses to average net assets (%) | | | 1.08 | | | | 1.10 | | | | 1.09 | | | | 1.09 | | | | 1.10 | |
Ratio of net investment income to average net assets (%) | | | 0.59 | | | | 0.92 | | | | 0.75 | | | | 0.85 | | | | 0.71 | |
Portfolio turnover rate (%) | | | 22 | | | | 23 | | | | 30 | | | | 39 | | | | 143 | |
Net assets, end of period (in millions) | | $ | 505.0 | | | $ | 389.2 | | | $ | 383.8 | | | $ | 384.0 | | | $ | 353.7 | |
Please see following page for Financial Highlights footnote legend.
See accompanying notes to financial statements.
MSF-9
Metropolitan Series Fund
Met/Artisan Mid Cap Value Portfolio
Financial Highlights
| | | | | | | | | | | | | | | | | | | | |
| Selected per share data | | | |
| | | Class E | |
| | | Year Ended December 31, | |
| | | 2013 | | | 2012 | | | 2011 | | | 2010 | | | 2009 | |
Net Asset Value, Beginning of Period | | $ | 195.57 | | | $ | 176.60 | | | $ | 166.99 | | | $ | 146.26 | | | $ | 104.55 | |
| | | | | | | | | | | | | | | | | | | | |
Income (Loss) from Investment Operations | | | | | | | | | | | | | | | | | | | | |
Net investment income (a) | | | 1.60 | | | | 1.89 | | | | 1.46 | | | | 1.41 | | | | 0.97 | |
Net realized and unrealized gain on investments | | | 69.65 | | | | 18.68 | | | | 9.62 | | | | 20.29 | | | | 41.87 | |
| | | | | | | | | | | | | | | | | | | | |
Total from investment operations | | | 71.25 | | | | 20.57 | | | | 11.08 | | | | 21.70 | | | | 42.84 | |
| | | | | | | | | | | | | | | | | | | | |
Less Distributions | | | | | | | | | | | | | | | | | | | | |
Distributions from net investment income | | | (1.96 | ) | | | (1.60 | ) | | | (1.47 | ) | | | (0.97 | ) | | | (1.13 | ) |
| | | | | | | | | | | | | | | | | | | | |
Total distributions | | | (1.96 | ) | | | (1.60 | ) | | | (1.47 | ) | | | (0.97 | ) | | | (1.13 | ) |
| | | | | | | | | | | | | | | | | | | | |
Net Asset Value, End of Period | | $ | 264.86 | | | $ | 195.57 | | | $ | 176.60 | | | $ | 166.99 | | | $ | 146.26 | |
| | | | | | | | | | | | | | | | | | | | |
Total Return (%) (b) | | | 36.65 | | | | 11.69 | | | | 6.60 | | | | 14.87 | | | | 41.34 | |
| | | | | |
Ratios/Supplemental Data | | | | | | | | | | | | | | | | | | | | |
Ratio of expenses to average net assets (%) | | | 0.98 | | | | 1.00 | | | | 0.99 | | | | 0.99 | | | | 1.00 | |
Ratio of net investment income to average net assets (%) | | | 0.68 | | | | 1.01 | | | | 0.83 | | | | 0.94 | | | | 0.81 | |
Portfolio turnover rate (%) | | | 22 | | | | 23 | | | | 30 | | | | 39 | | | | 143 | |
Net assets, end of period (in millions) | | $ | 110.8 | | | $ | 98.8 | | | $ | 104.4 | | | $ | 118.6 | | | $ | 121.3 | |
| (a) | Per share amounts based on average shares outstanding during the period. |
| (b) | Total return does not reflect any insurance, sales, separate account or administrative charges of variable annuity or life insurance contracts or any additional expenses that contract owners may bear under their variable contracts. If these charges were included, the returns would be lower. |
See accompanying notes to financial statements.
MSF-10
Metropolitan Series Fund
Met/Artisan Mid Cap Value Portfolio
Notes to Financial Statements—December 31, 2013
1. Organization
Metropolitan Series Fund (the “Trust”) is organized as a Delaware statutory trust and registered under the Investment Company Act of 1940, as amended (the “1940 Act”), as an open-end management investment company. The Trust is currently comprised of thirty series, each of which operates as a distinct investment vehicle of the Trust. The portfolio included in this report is Met/Artisan Mid Cap Value Portfolio (the “Portfolio”), which is diversified. Shares in the Portfolio are not offered directly to the general public and are currently available only to separate accounts established by Metropolitan Life Insurance Company (“MetLife”) and other affiliated life insurance companies.
The Portfolio has registered and offers three classes of shares: Class A, B, and E shares. Shares of each Class of the Portfolio represent an equal pro rata interest in the Portfolio and generally give the shareholder the same voting, dividend, liquidation, and other rights. Investment income, realized and unrealized capital gains and losses, the common expenses of the Portfolio, and certain Portfolio-level expense reductions, if any, are allocated on a pro rata basis to each Class based on the relative net assets of each Class to the net assets of the Portfolio. Each Class of shares differs in its respective distribution plan and such distribution expenses are allocated to that Class.
2. Significant Accounting Policies
The preparation of financial statements in conformity with accounting principles generally accepted in the United States of America (“GAAP”) requires management to make estimates and assumptions that affect the reported amounts of assets and liabilities and disclosure of contingent assets and liabilities as of the date of the financial statements and the reported amounts of income and expenses during the reporting period. Actual results could differ from those estimates. In the preparation of these financial statements, management has evaluated events and transactions subsequent to December 31, 2013 through the date the financial statements were issued.
The following is a summary of significant accounting policies consistently followed by the Portfolio in the preparation of its financial statements.
Investment Valuation and Fair Value Measurements - Debt securities (other than short term obligations with a remaining maturity of sixty days or less), including corporate, convertible and municipal bonds and notes; obligations of the U.S. treasury and U.S. government agencies; sovereign issues; floating rate loans; and non-U.S. bonds, are generally valued on the basis of evaluated or composite bid quotations obtained from independent pricing services and/or brokers and dealers selected by MetLife Advisers, LLC (“MetLife Advisers” or the “Adviser”), an affiliate of MetLife, Inc., pursuant to authorization of the Board of Trustees of the Trust (the “Board” or “Trustees”). Such quotations utilize matrix pricing, which considers observable inputs including, among other things, issuer details, maturity dates, interest rates, yield curves, rates of prepayment, credit risks/spreads, default rates, reported trades, broker dealer quotes and quoted prices for similar securities. Securities that use similar valuation techniques and inputs as described above are generally categorized as Level 2 within the fair value hierarchy.
Mortgage and asset-backed securities are usually issued as separate tranches, or classes, of securities within each deal. These securities are also generally valued on the basis of evaluated or composite bid quotations obtained from independent pricing services and/or brokers and dealers selected by the Adviser pursuant to authorization of the Board. The pricing models for these securities usually consider tranche-level attributes, estimated cash flows and market-based yield spreads for each tranche and current market data, and incorporate deal collateral performance, as available. Mortgage and asset-backed securities that use similar valuation techniques and inputs as described above are generally categorized as Level 2 within the fair value hierarchy.
Short term obligations with a remaining maturity of sixty days or less are generally valued at amortized cost, which approximates fair market value, and are generally categorized as Level 2 within the fair value hierarchy.
Domestic and foreign equity securities, such as common stock, exchange-traded funds, rights, warrants, and preferred stock, that are traded on a securities exchange, are generally valued at their last sale price on the exchange or market in which they are principally traded on the valuation date, or, if no sales occurred on that day, at the last reported bid price. Equity securities traded over-the-counter are generally valued at the last reported sale price. Valuation adjustments may be applied to certain foreign equity securities that are traded solely on foreign exchanges that close before the close of the U.S. market to account for the market movement between the close of the foreign exchanges and the close of the U.S. market. The Portfolio may use a systematic fair valuation model provided by an independent third party to value securities principally traded in these foreign markets in order to adjust for possible stale pricing that may occur between the close of the foreign exchanges and the time of the Portfolio valuation. Foreign equity securities using these valuation adjustments are generally categorized as Level 2 within the fair value hierarchy. Equity securities that are actively traded, and have no valuation adjustments applied, are categorized as Level 1 within the fair value hierarchy. Other equity securities traded on inactive markets, or valued in reference to similar instruments traded on active markets, are generally categorized as Level 2 within the fair value hierarchy.
MSF-11
Metropolitan Series Fund
Met/Artisan Mid Cap Value Portfolio
Notes to Financial Statements—December 31, 2013—(Continued)
Investments in registered open-end management investment companies are valued at reported net asset value per share on the valuation date and are categorized as Level 1 within the fair value hierarchy.
Forward foreign currency exchange contracts are valued through an independent pricing service based on the mean between closing bid and ask prices of the forward currency rates in the London foreign exchange markets on a daily basis as provided by a reliable bank or dealer. These contracts are generally categorized as Level 2 within the fair value hierarchy.
Options, whether on securities, indices, futures contracts, or otherwise, traded on exchanges are valued at the last sale price available as of the close of business on the valuation date or, if there is no such price available, at the mean between the last reported bid and ask prices. These types of options are categorized as Level 1 within the fair value hierarchy. Futures contracts, which are traded on commodity exchanges, are valued at their closing prices as of the close of such exchanges and are categorized as Level 1 within the fair value hierarchy.
Options and futures contracts that are traded over-the-counter are generally valued on the basis of quotations provided by broker-dealers or prices provided by pricing service providers who use a series of techniques, including simulation pricing models, to determine the value of the contracts. The pricing models use inputs that are observed from actively quoted markets such as issuer details, indices, spreads, interest rates, yield curves, credit curves, measures of volatility and exchange rates. These contracts are generally categorized as Level 2 within the fair value hierarchy.
If no current market value quotation or other observable inputs are readily available or market value quotations are deemed to be unreliable for a security, the fair value of the security will be determined in accordance with procedures approved by and under the general supervision of the Board. In such a circumstance, the Board has delegated the determination of the fair value of a security to a Valuation Committee (“Committee”) of MetLife Advisers. The Committee provides general pricing oversight and fair value pricing determinations related to portfolio securities and meets on a regular basis to review reports relating to the valuation of the securities in the Portfolio. The Board has delegated to State Street Bank and Trust Company, the Trust’s custodian (“custodian”), the responsibility for calculating the net asset values (“NAVs”) of the Trust’s Portfolios. The Committee is responsible for overseeing the calculation of the NAVs of the Portfolios by the custodian. The Committee also periodically reviews pricing vendors, including the vendor providing fair value pricing for the Portfolio’s foreign securities, and is responsible for overseeing the correction of pricing errors and addressing other pricing issues that arise in the ordinary course of business, such as making real-time fair value determinations, as necessary.
No single standard for determining the fair value of a security can be set forth because fair value depends upon the facts and circumstances with respect to each security. Information relating to any relevant factors may be obtained by the Committee from any appropriate source, including the subadviser of the Portfolio, the custodian, a pricing service, market maker and/or broker for such security or the issuer. Appropriate methodologies for determining fair value under particular circumstances may include: matrix pricing, comparisons of securities with comparable characteristics, value based on multiples of earnings, discount from market price of similar marketable securities or a combination of these and other methods. The Committee maintains a detailed report tracking each fair-valued security that compares the fair value price to the next available trade, vendor or broker price, and provides information on how close the fair value price was to the next quoted price. The Committee reviews a summary of such report monthly. On a quarterly basis, the Board is provided with the following for consideration and ratification or adjustment: (1) a memorandum summarizing the actions taken by the Committee in the prior quarter; and (2) a list of the Portfolio’s securities as of the most recent quarter-end for which market quotations were not readily available.
Investment Transactions and Related Investment Income - Portfolio security transactions are recorded on the trade date. Dividend income is recorded on the ex-dividend date or, for certain foreign securities, when notified. Interest income, which includes amortization of premium and accretion of discount on debt securities, is recorded on the accrual basis. Realized gains and losses on investments are determined on the identified cost basis, which is the same basis used for federal income tax purposes. Foreign income and foreign capital gains on some foreign securities may be subject to foreign taxes, which are accrued as applicable. These foreign taxes have been provided for in accordance with the Portfolio’s understanding of the applicable countries’ tax rules and rates.
Foreign Currency Translation - The books and records of the Portfolio are maintained in U.S. dollars. The values of securities, currencies, and other assets and liabilities denominated in currencies other than the U.S. dollar are translated into U.S. dollars based upon foreign exchange rates prevailing at the end of the period. Purchases and sales of investment securities, income, and expenses are translated on the respective dates of such transactions. Because the values of investment securities are translated at the foreign exchange rates prevailing at the end of the period, that portion of the results of operations arising from changes in exchange rates and that portion of the results of operations reflecting fluctuations arising from changes in market prices of the investment securities are not separated. Such fluctuations are included in the net realized and unrealized gain or loss on investments.
Net realized foreign exchange gains or losses arise from activity in forward foreign currency exchange contracts, sales of foreign currency, currency gains or losses realized between the trade and settlement dates on securities transactions, and the difference between the amounts of dividends, interest, and foreign withholding taxes recorded by the Portfolio and the U.S. dollar equivalent of
MSF-12
Metropolitan Series Fund
Met/Artisan Mid Cap Value Portfolio
Notes to Financial Statements—December 31, 2013—(Continued)
the amounts actually received or paid by the Portfolio. Net unrealized foreign exchange gains and losses arise from changes in the value of assets and liabilities, other than investment securities, resulting from changes in foreign exchange rates.
Income Taxes - It is the Portfolio’s policy to comply with the requirements of the Internal Revenue Code of 1986, as amended, and regulations thereunder, applicable to regulated investment companies and to distribute, with respect to each taxable year, all of its taxable income to shareholders. Therefore, no federal income tax provision is required. The Portfolio files U.S. federal tax returns. No income tax returns are currently under examination. The Portfolio’s federal tax returns for the prior three fiscal years remain subject to examination by the Internal Revenue Service. As of December 31, 2013, the Portfolio had no uncertain tax positions that would require financial statement recognition, or de-recognition or disclosure.
Dividends and Distributions to Shareholders - The Portfolio records dividends and distributions on the ex-dividend date. Net realized gains from security transactions (if any) are generally distributed annually to shareholders. The timing and characterization of certain income and capital gains distributions are determined in accordance with federal tax regulations that may differ from GAAP. Permanent book and tax basis differences relating to shareholder distributions will result in reclassification between under/over distributed net investment income, accumulated net realized gains/losses, and paid-in surplus. Book-tax differences are primarily due to broker commission recapture reclasses and real estate investment trust (REIT) adjustments. These adjustments have no impact on net assets or the results of operations.
Securities Lending - The Portfolio may lend its portfolio securities to certain qualified brokers who borrow securities in order to complete certain securities transactions. By lending its portfolio securities, the Portfolio attempts to increase its net investment income through the receipt of income on collateral held from securities on loan. Any gain or loss in the market price of the loaned securities that might occur and any interest earned or dividends declared during the term of the loan would accrue to the account of the Portfolio.
The Trust has entered into a securities lending arrangement with the custodian. Under this arrangement, the custodian is authorized to loan portfolio securities on the Portfolio’s behalf. In exchange, the Portfolio receives either cash or securities as collateral against the loaned securities. The Portfolio receives collateral at least equal to 102% of the market value of the loaned securities (105% for foreign equity securities), at each loan’s inception. Collateral representing at least 100% of the market value of the loaned securities must be maintained for the duration of the loan. A liability for cash collateral is reflected on the Statement of Assets and Liabilities, and is categorized as Level 2 within the fair value hierarchy. Cash collateral is generally invested in the State Street Navigator Securities Lending MET Portfolio (the “Navigator Portfolio”), a series of the State Street Navigator Securities Lending Trust that is managed by an affiliate of the custodian. The Navigator Portfolio is a registered money market fund that invests in a variety of high-quality, U.S. dollar-denominated instruments. If the market value of the collateral at the close of trading on a business day is less than 100% of the market value of the loaned securities at the close of trading on that day, the borrower shall be required to deliver, by the close of business on the following business day, an additional amount of collateral, so that the total amount of posted collateral is equal to at least 100% of the market value of all the loaned securities as of such preceding day. A portion of net income (income after the deduction of expenses and fees of the Navigator Portfolio) on the collateral is rebated to the borrower of the securities and the remainder is split between the custodian and the Portfolio. On loans collateralized by U.S. Treasuries, a fee is received from the borrower and is allocated between the Portfolio and the custodian. The risks associated with lending portfolio securities include, but are not limited to, possible delays in receiving additional collateral or in the recovery of the loaned securities, possible loss of rights in the collateral should the borrower fail financially, as well as risk of loss in the value of the collateral or the value of the investments made with the collateral. The lending agent has agreed to indemnify the Portfolio in the case of default of any securities borrower. Income received by the Portfolio in securities lending transactions during the year ended December 31, 2013 is reflected as Securities lending income on the Statement of Operations. Any outstanding loans by the Portfolio at December 31, 2013 are disclosed in the footnotes to the Schedule of Investments.
Repurchase Agreements - The Portfolio may enter into repurchase agreements, under the terms of a Master Repurchase Agreement, with selected commercial banks and broker-dealers, under which the Portfolio acquires securities as collateral and agrees to resell the securities at an agreed upon time and at an agreed-upon price. The Portfolio, through the custodian or a subcustodian, receives delivery of the underlying securities collateralizing any repurchase agreements. The Portfolio requires the custodian to take possession, to have legally segregated in the Federal Reserve Book Entry System, or to have segregated within the custodian’s vault, all securities held as collateral for repurchase agreements. It is the Portfolio’s policy that the market value of the collateral be at least equal to 100% of the repurchase price in the case of a repurchase agreement of one-day duration and at least equal to 102% of the repurchase price in the case of all other repurchase agreements. In the event of default or failure by a party to perform an obligation in connection with any repurchase transaction, the Master Repurchase Agreement gives the non-defaulting party the right to set-off claims and to apply property held by it in connection with any repurchase transaction against obligations owed to it.
At December 31, 2013, the Portfolio had investments in repurchase agreements with a gross value of $122,056,000, which is included as part of investments at value on the Statement of Assets and Liabilities. The value of the related collateral exceeded the value of the repurchase agreements at December 31, 2013.
MSF-13
Metropolitan Series Fund
Met/Artisan Mid Cap Value Portfolio
Notes to Financial Statements—December 31, 2013—(Continued)
Directed Brokerage Agreement - The Trust has entered into a directed brokerage arrangement with State Street Global Markets (“SSGM”). Under this arrangement, the Portfolio directs certain trades to SSGM in return for a recapture credit. SSGM issues a cash rebate to the Portfolio. Amounts paid to the Portfolio are shown separately as broker commission recapture on the Statement of Operations of the Portfolio. Additionally, these amounts have been excluded from the calculation of the net ratio of expenses to average net assets presented in the Financial Highlights for each share class.
3. Certain Risks
Market Risk: In the normal course of business, the Portfolio invests in securities and enters into transactions where risks exist due to fluctuations in the market (market risk) or failure of the other party to a transaction to perform (credit and counterparty risk). The value of securities held by the Portfolio may decline in response to certain events, including those directly involving the companies whose securities are owned by the Portfolio; conditions affecting the general economy; overall market changes; local, regional or global political, social or economic instability; currency, interest rate, and price fluctuations.
Credit and Counterparty Risk: The Portfolio may be exposed to counterparty risk, or the risk that an entity with which the Portfolio has unsettled or open transactions may default. The potential loss could exceed the value of the financial assets and liabilities recorded in the financial statements. Financial assets that potentially expose the Portfolio to credit and counterparty risk consist principally of cash due from counterparties and investments. The Portfolio manages counterparty risk by entering into agreements only with counterparties that it believes have the financial resources to honor their obligations and by monitoring the financial stability of those counterparties. The Portfolio’s investment adviser attempts to mitigate counterparty risk by (i) periodically assessing the creditworthiness of its trading partners, (ii) monitoring and/or limiting the amount of its net exposure to each individual counterparty based on its assessment, and (iii) requiring collateral from the counterparty for certain transactions. In order to preserve certain safeguards for non-standard settlement trades, the Portfolio restricts its exposure to credit and counterparty losses by entering into master netting agreements with counterparties (approved brokers) with whom it undertakes a significant volume of transactions. Master Agreements govern the terms of certain transactions, and reduce the counterparty risk associated with relevant transactions by specifying credit protection mechanisms and providing standardization that improves legal certainty. Master Agreements can also help limit counterparty risk by specifying collateral posting arrangements at prearranged exposure levels.
Repurchase and reverse repurchase agreements are primarily executed under Global Master Repurchase Agreements (“GMRAs”) or Master Repurchase Agreements (“MRAs”), which provide the rights to set-off. Each repurchase and reverse repurchase agreement is initially collateralized at the transaction level. In the event of default, the total market value exposure will be offset against collateral exchanged to date, which would result in a net receivable/(payable) that would be due from/to the counterparty.
Additional risks associated with each type of investment are described above within the respective security type notes. The Portfolio’s prospectus includes a discussion of the principal risks of investing in the Portfolio.
4. Investment Transactions
Aggregate cost of purchases and proceeds of sales of investment securities, excluding short-term securities, for the year ended December 31, 2013 were as follows:
| | | | | | | | | | | | |
Purchases | | | Sales | |
U.S. Government | | Non U.S. Government | | | U.S. Government | | | Non U.S. Government | |
| $0 | | $ | 297,479,675 | | | $ | 0 | | | $ | 465,422,953 | |
During the year ended December 31, 2013, the Portfolio engaged in security transactions with other affiliated portfolios. These amounted to $7,792,959 in purchases of investments, which are included above.
5. Investment Management Fees and Other Transactions with Affiliates
Investment Management Agreement - MetLife Advisers is the investment adviser to the Portfolio. The Trust has entered into an investment management agreement with MetLife Advisers with respect to the Portfolio. For providing investment management services to the Portfolio, MetLife Advisers receives monthly compensation at the annual rates:
| | | | | | |
Management
Fees earned by
MetLife Advisers
for the year ended
December 31, 2013 | | % per annum | | | Average Daily Net Assets |
| $11,692,397 | | | 0.820 | % | | Of the first $1 billion |
| | | 0.780 | % | | On amounts in excess of $1 billion |
MSF-14
Metropolitan Series Fund
Met/Artisan Mid Cap Value Portfolio
Notes to Financial Statements—December 31, 2013—(Continued)
Certain officers and trustees of the Trust may also be officers of MetLife Advisers; however, such officers and trustees receive no compensation from the Trust.
MetLife Advisers has entered into an investment subadvisory agreement with respect to the Portfolio. Artisan Partners Limited Partnership is compensated by MetLife Advisers to provide subadvisory services for the Portfolio.
Transfer Agency Agreement - MetLife serves as the transfer agent for the Trust. MetLife receives no fees for its services to the Trust under the transfer agency agreement.
Distribution and Service Fees - The Trust has a distribution agreement with MetLife Investors Distribution Company (“MIDC” or the “Distributor”) in which MIDC serves as the distributor for the Portfolio’s Class A, B and E Shares. MIDC is a wholly-owned subsidiary of MetLife Investors Group, Inc., an affiliate of the Adviser. The Trust has also adopted a Distribution and Service Plan under Rule 12b-1 of the 1940 Act for the Portfolio’s Class B and E Shares. Under the Distribution and Service Plan, the Class B and E Shares of the Portfolio pay a fee to compensate the Insurance Companies (or their affiliates) and other broker-dealers and financial intermediaries involved in the offer and sale of Portfolio shares for promoting or selling and servicing the Class B and E Shares. The fees under the Distribution and Service Plan for each class of the Portfolio’s shares are calculated as a percentage of the Portfolio’s average daily net assets that are attributable to that Class. Currently, the fee is 0.25% per year for Class B Shares and 0.15% per year for Class E Shares. Amounts incurred by the Portfolio for the year ended December 31, 2013 are shown as Distribution and service fees in the Statement of Operations.
Deferred Trustee Compensation - Each Trustee who is not currently an employee of the Adviser or any of its affiliates receives compensation from the Trust for his or her service to the Trust. A deferred compensation plan (the “Plan”) is available to the Trustees on a voluntary basis. Deferred amounts remain in the Trust until distributed in accordance with the provisions of the Plan. The value of a participating Trustee’s deferral account is based on theoretical investments of deferred amounts, on the normal payment dates in certain portfolios of the Trust or Met Investors Series Trust, an affiliate of the Trust, as designated by the participating Trustee. Changes in the value of participants’ deferral accounts are reflected as Trustees’ fees and expenses in the Statement of Operations. The portion of the accrued obligations allocated to the Portfolio under the Plan is reflected as Deferred trustees’ fees in the Statement of Assets and Liabilities.
6. Contractual Obligations
Under the Trust’s organizational documents, its officers and Trustees may be indemnified against certain liabilities and expenses arising out of the performance of their duties to the Trust. Additionally, the Trust has a variety of indemnification obligations under contracts with its service providers. The Trust’s maximum exposure under these arrangements is unknown, as this would involve future claims that may be made against the Trust that have not yet occurred.
7. Income Tax Information
The tax character of distributions paid for the periods ended December 31, 2013 and 2012 was as follows:
| | | | | | | | | | | | | | | | | | | | |
Ordinary Income | | | Long-Term Capital Gain | | | Total | |
2013 | | 2012 | | | 2013 | | | 2012 | | | 2013 | | | 2012 | |
| $13,069,455 | | $ | 11,475,644 | | | $ | — | | | $ | — | | | $ | 13,069,455 | | | $ | 11,475,644 | |
As of December 31, 2013, the components of distributable earnings (accumulated losses) on a federal income tax basis were as follows:
| | | | | | | | | | | | | | | | |
Undistributed
Ordinary
Income | | Undistributed
Long-Term
Capital Gain | | | Net
Unrealized
Appreciation | | | Loss Carryforwards | | | Total | |
| $10,571,106 | | $ | — | | | $ | 460,712,261 | | | $ | (25,398,668 | ) | | $ | 445,884,699 | |
The Portfolio utilizes the provisions of the federal income tax laws that provide for the carryforward of capital losses for prior years, offsetting such losses against any future realized capital gains. Under the Regulated Investment Company Modernization Act of 2010 (the “Act”), net capital losses recognized after December 22, 2010 may be carried forward indefinitely and their character is retained as short-term and/or long-term losses. Previously, net capital losses were carried forward for up to eight years and treated as shortterm losses. As a transition rule, the Act requires that post-enactment net capital losses be used before pre-enactment net capital losses.
During the year ended December 31, 2013, the Portfolio utilized capital loss carryforwards of $148,007,471.
As of December 31, 2013, the Portfolio had no post-enactment accumulated capital losses and the pre-enactment accumulated capital loss carryforwards expiring on December 31, 2017 were $25,398,668.
MSF-15
Metropolitan Series Fund
Met/Artisan Mid Cap Value Portfolio
Report of Independent Registered Public Accounting Firm
To the Shareholders of Met/Artisan Mid Cap Value Portfolio and the Board of Trustees of Metropolitan Series Fund:
We have audited the accompanying statement of assets and liabilities, including the schedule of investments, of Met/Artisan Mid Cap Value Portfolio, one of the portfolios constituting Metropolitan Series Fund, (the “Trust”) as of December 31, 2013, and the related statement of operations for the year then ended, the statements of changes in net assets for each of the two years in the period then ended, and the financial highlights for each of the five years in the period then ended. These financial statements and financial highlights are the responsibility of the Trust’s management. Our responsibility is to express an opinion on these financial statements and financial highlights based on our audits.
We conducted our audits in accordance with the standards of the Public Company Accounting Oversight Board (United States). Those standards require that we plan and perform the audit to obtain reasonable assurance about whether the financial statements and financial highlights are free of material misstatement. The Trust is not required to have, nor were we engaged to perform, an audit of its internal control over financial reporting. Our audits included consideration of internal control over financial reporting as a basis for designing audit procedures that are appropriate in the circumstances, but not for the purpose of expressing an opinion on the effectiveness of the Trust’s internal control over financial reporting. Accordingly, we express no such opinion. An audit also includes examining, on a test basis, evidence supporting the amounts and disclosures in the financial statements, assessing the accounting principles used and significant estimates made by management, as well as evaluating the overall financial statement presentation. Our procedures included confirmation of securities owned as of December 31, 2013, by correspondence with the custodian and brokers; where replies were not received from brokers, we performed other auditing procedures. We believe that our audits provide a reasonable basis for our opinion.
In our opinion, the financial statements and financial highlights referred to above present fairly, in all material respects, the financial position of the Met/Artisan Mid Cap Value Portfolio of Metropolitan Series Fund, as of December 31, 2013, the results of its operations for the year then ended, the changes in its net assets for each of the two years in the period then ended, and the financial highlights for each of the five years in the period then ended, in conformity with accounting principles generally accepted in the United States of America.
Deloitte & Touche LLP
Boston, Massachusetts
February 26, 2014
MSF-16
Metropolitan Series Fund
Trustees and Officers of Metropolitan Series Fund
The Trustees and executive officers of the Trust, their ages and their principal occupations during the past five years are set forth below. Unless otherwise indicated, the business address of each is One Financial Center, Boston, MA 02111. Each Trustee who is deemed an “interested person,” as such term is defined in the 1940 Act, is indicated by an asterisk. Those Trustees who are not “interested persons” as defined in the 1940 Act are referred to as “Independent Trustees.” Additional information about the Trustees is available in the Statement of Additional Information, which is available without charge, upon request, by calling (800) 848-3854.
Trustees of the Trust
| | | | | | | | | | |
Name and Age | | Position(s)
Held with
Registrant | | Term of Office
and Length of
Time Served | | Principal Occupation(s) During the Past 5
Years(1) | | Number of
Portfolios
in Fund
Complex(2)
overseen | | Other Directorships Held
by Trustee During the
Past 5 Years(1) |
| Interested Trustee | | | | | | | | | | |
| Elizabeth M. Forget* (47) | | Trustee, Chairman of the Board, President and Chief Executive Officer | | Indefinite;
From
May
2006
(President
and Chief
Executive
Officer)/
August
2006
(Trustee
and
Chairman
of the
Board) to
present | | Senior Vice President, MetLife Inc.; President, MetLife Advisers, LLC and a predecessor company. | | 79 | | Trustee, Met Investors Series Trust (the “MIST Trust”);** various MetLife-affiliated boards. |
| | | | | |
| Independent Trustees | | | | | | | | | | |
| Stephen M. Alderman (54) | | Trustee | | Indefinite;
From
April
2012 to
present | | Shareholder in the law firm of Garfield & Merel, Ltd. | | 79 | | Trustee, MIST Trust;** Director, International Truck Leasing Corp. |
| | | | | |
| Robert J. Boulware (57) | | Trustee | | Indefinite;
From
April
2012 to
present | | Managing Director, Pilgrim Funds, LLC (private equity fund). | | 79 | | Trustee, MIST Trust;** Trustee, Vertical Capital Income Fund (closed-end fund); Director, Gainsco, Inc. (auto insurance). |
| | | | | |
| Susan C. Gause (61) | | Trustee | | Indefinite;
From
April
2012 to
present | | Private Investor. | | 79 | | Trustee, MIST Trust;** Trustee, HSBC Funds. |
| | | | | |
| Nancy Hawthorne (62) | | Trustee | | Indefinite;
From
May
2003 to
present | | Chief Executive Officer, Clerestory LLC (corporate advisor). | | 79 | | MIST Trust;** Director, THL Credit, Inc.**; Director, Avid Technology, Inc.** |
| | | | | |
| Barbara A. Nugent (57) | | Trustee | | Indefinite;
From
January
2014 to
present | | President, True North Board Governance, LLC (consulting); until 2014, partner in the law firm of Stradley Ronon Stevens & Young, LLP. | | 79 | | Trustee, MIST Trust**; Director, Episcopal Healthcare Foundation; until 2014, member, Mutual Fund Directors Forum Advisory Board. |
MSF-17
Metropolitan Series Fund
Trustees and Officers of Metropolitan Series Fund—(Continued)
| | | | | | | | | | |
Name and Age | | Position(s)
Held with
Registrant | | Term of Office
and Length of
Time Served | | Principal Occupation(s) During the Past 5
Years(1) | | Number of
Portfolios
in Fund
Complex(2)
overseen | | Other Directorships Held
by Trustee During the
Past 5 Years(1) |
| Keith M. Schappert (62) | | Trustee | | Indefinite;
From
August
2009 to
present | | Principal, Schappert Consulting LLC (asset management consulting). | | 79 | | Trustee, MIST Trust;** Director, The Commonfund for Nonprofit Organizations; until 2011, Director, Trilogy Global Advisors; Director, Mirae Asset Discovery Funds,** Director, Calamos Investments. |
| | | | | |
| Linda B. Strumpf (66) | | Trustee | | Indefinite;
From
May
2000 to
present | | Chair of the Investment Committee, Leona M. and Harry B. Helmsley Charitable Trust; until 2011, Chief Investment Officer, Leona M. and Harry B. Helmsley Charitable Trust. | | 79 | | Since 2012, Trustee, MIST Trust,** Trustee and Member of Investment Committee, The Pennsylvania State University. |
| | | | | |
| Dawn M. Vroegop (47) | | Trustee | | Indefinite;
From
May
2009 to
present | | Private Investor. | | 79 | | Trustee, MIST Trust,** Trustee, Driehaus Mutual Funds; Director and Investment Committee Chair, City College of San Francisco Foundation. |
Executive Officers of the Trust
| | | | | | |
Name and Age | | Position(s) Held with
Registrant | | Term of Office
and Length of
Time Served | | Principal Occupation(s) During Past 5 Years(1) |
| Elizabeth M. Forget (47) | | President, Chief Executive Officer, Trustee and Chairman of the Board | | From May
2006 (President
and Chief
Executive
Officer)/
August 2006
(Trustee and
Chairman of
the Board) to
present | | See principal occupation information in the table above. |
| | | |
| Jeffrey L. Bernier (42) | | Vice President | | From February
2008 to present | | Vice President, MetLife, Inc.; Senior Vice President, MetLife Advisers, LLC and a predecessor company. |
| | | |
| Peter H. Duffy (58) | | Chief Financial Officer and Treasurer | | From November
2000 to present | | Senior Vice President, MetLife Advisers, LLC; Vice President, MetLife, Inc. |
| | | |
| Andrew L. Gangolf (59) | | Secretary | | From May
2011to present | | Senior Vice President, MetLife Advisers, LLC; Senior Vice President & Assistant General Counsel, AllianceBerstein Investments, Inc. |
| | | |
| Jeffrey P. Halperin (46) | | Chief Compliance Officer | | From November
2005 to present | | Vice President, MetLife, Inc.; Chief Compliance Officer, MIST; Chief Compliance Officer, MSF Trust; Chief Compliance Officer, MetLife Advisers, LLC and a predecessor company; Chief Compliance Officer, MetLife Investment Management, LLC (formerly MetLife Investment Advisors Company, LLC). |
| | | |
| Alan C. Leland, Jr. (61) | | Vice President | | From February
2005 to present | | Treasurer and Chief Financial Officer, MetLife Advisers, LLC; Vice President, MetLife Group Inc.; Vice President, MetLife, Inc. |
| * | Ms. Forget is an “interested person” of the Trust because of her positions with MetLife Advisers, LLC and her ownership of securities issued by MetLife, Inc., the ultimate parent company of MetLife Advisers, LLC. |
| ** | Indicates a directorship with a registered investment company or a company subject to the reporting requirements of the Securities Exchange Act of 1934, as amended. |
| (1) | Previous positions during the past five years with the Trust, MetLife, Inc. or the Adviser are omitted if not materially different. |
| (2) | The Fund Complex includes 49 Portfolios of the MIST Trust and 30 Portfolios of the Trust. |
MSF-18
Metropolitan Series Fund
Met/Artisan Mid Cap Value Portfolio
Board of Trustees’ Consideration of Advisory and Sub-Advisory Agreements
At an in-person meeting of the Boards of Trustees (the “Board”) of Met Investors Series Trust and Metropolitan Series Fund (“MIST” and “MSF,” respectively, and collectively, the “Trusts”) held on November 19-20, 2013, the Board, including a majority of the Trustees who are not considered to be “interested persons” of the Trusts (the “Independent Trustees”) under the Investment Company Act of 1940, as amended (the “1940 Act”), approved for an annual period the continuation of each Trust’s advisory agreement (the “Advisory Agreement”) with MetLife Advisers, LLC (the “Adviser”) and the applicable sub-advisory agreements (each a “Sub-Advisory Agreement,” and collectively with the Advisory Agreement, the “Agreements”) between the Adviser and the investment sub-advisers (each a “Sub-Adviser,” and collectively, the “Sub-Advisers”) for each of the series of the Trusts, including the Met/Artisan Mid Cap Value Portfolio (each a “Portfolio,” and collectively, the “Portfolios”).1 In addition to approving the existing Sub-Advisory Agreement, the Board also approved a new Sub-Advisory Agreement with the Sub-Adviser in light of an anticipated Sub-Adviser change of control, which is expected to occur in March 2014. The new Sub-Advisory Agreement is substantially identical to the existing Sub-Advisory Agreement and will replace the existing Sub-Advisory Agreement when the change of control occurs.
In considering the Agreements, the Board reviewed a variety of materials provided by the Adviser and the Sub-Advisers relating to the Portfolios, including comparative performance, fee and expense information for an appropriate peer group of similar mutual funds, performance information for relevant benchmark indices and other information regarding the nature, extent and quality of services provided by the Adviser and the Sub-Advisers under their respective Agreements. The Board also took into account its experience with the Adviser and the Sub-Advisers and information provided to the Board in its meetings throughout the year with respect to the services provided by the Adviser and the Sub-Advisers, including quarterly performance reports prepared by management containing reviews of investment results, and periodic presentations from certain of the Sub-Advisers with respect to the Portfolios they manage. The Independent Trustees also assessed reports provided by the Board’s independent consultant, who reviewed and provided analyses regarding investment performance, fees and expenses, and other information provided by, or at the direction of, the Adviser and the Sub-Advisers, as more fully discussed below.
The Independent Trustees were separately advised by independent legal counsel throughout the process, and met with independent legal counsel in periodic executive sessions. Prior to voting to continue the Agreements at the November meeting, the Independent Trustees also received a memorandum from their independent counsel discussing the legal standards for their consideration of the proposed continuation of the Agreements. The Board also met in person with personnel of the Adviser on September 17, 2013 for the specific purpose of giving preliminary consideration to the proposed continuation of the Agreements and to request additional information they considered reasonably necessary to their deliberations. The Independent Trustees also discussed the proposed continuation of the Agreements in private sessions with their independent legal counsel at which no representatives of management were present.
In considering whether to approve the renewal of the Advisory Agreement with the Adviser and any applicable Sub-Advisory Agreements with respect to a Portfolio, the Board reviewed and analyzed the factors it deemed relevant, including: (1) the nature, extent and quality of the services to be provided to the Portfolios by the Adviser and the Sub-Advisers; (2) the performance of the Portfolios as compared to a peer group and an appropriate index; (3) the Adviser’s and each of the Sub-Adviser’s personnel and operations; (4) the financial condition of the Adviser and of the Sub-Advisers; (5) the level and method of computing each Portfolio’s advisory and sub-advisory fees; (6) the profitability of the Adviser under the Advisory Agreement and of certain of the Sub-Advisers under the Sub-Advisory Agreements; (7) any “fall-out” benefits to the Adviser, the Sub-Advisers and their affiliates (i.e., ancillary benefits realized by the Adviser, the Sub-Advisers or their affiliates from the Adviser’s or Sub-Advisers’ relationship with the Trusts); (8) the anticipated effect of growth in size on Portfolio expenses; (9) fees paid to certain of the Sub-Advisers by comparable institutional and retail accounts; and (10) possible conflicts of interest.
Nature, extent and quality of services. The Board evaluated the nature, extent and quality of the services that the Adviser, and the Sub-Advisers as relevant, have provided to the Portfolios. The Board considered the Adviser’s services as investment manager to the Portfolios, including services relating to the selection and oversight of the Sub-Advisers for the applicable Portfolios. The Board considered, among other things, the Adviser’s oversight of the provision of services to the Portfolios by the Sub-Advisers, including with respect to investment activities and trading practices, and the Sub-Adviser’s compliance with fund policies, objectives and Board directives, compliance policies and procedures and applicable law. The Adviser’s services in coordinating and overseeing the activities of the Trusts’ other service providers were also considered. The Board also evaluated the expertise and performance of the personnel of the Adviser who performed services for the Portfolios throughout the year.
1 The Pyramis Managed Risk Portfolio recently commenced operations and, therefore, the Agreement with respect to this Portfolio was not up for renewal.
MSF-19
Metropolitan Series Fund
Met/Artisan Mid Cap Value Portfolio
Board of Trustees’ Consideration of Advisory and Sub-Advisory Agreements—(Continued)
The Board considered information received from the Trust’s Chief Compliance Officer (“CCO”) regarding the Portfolios’ compliance policies and procedures established pursuant to Rule 38a-l under the 1940 Act. The Board also evaluated the CCO’s ongoing reports concerning the CCO’s oversight of the risk assessment processes of the Sub-Advisers.
With respect to the services provided by each of the Sub-Advisers, the Board considered, among other things, information provided to the Board by each Sub-Adviser. The Board considered the Sub-Adviser’s current level of staffing and its overall resources, as well as its compensation program. The Board reviewed each Sub-Adviser’s history and investment experience, as well as information regarding the qualifications, background and responsibilities of the Sub-Adviser’s investment and compliance personnel who provide services to the Portfolios. The Board also considered, among other things, the Sub-Adviser’s compliance program and any disciplinary history. The Board also took into account the Sub-Adviser’s risk assessment and monitoring process. The Board noted each Sub-Adviser’s regulatory history, including whether it was currently involved in any regulatory actions or investigations as well as material litigation, and any settlements and amelioratory actions undertaken, as appropriate. The Board also noted that the CCO and his staff conduct regular, periodic compliance reviews with each of the Sub-Advisers and present reports to the Independent Trustees regarding the same, which includes evaluating the regulatory compliance systems of the Sub-Advisers and procedures reasonably designed by them to help assure compliance with the federal securities laws, including issues related to late trading and market timing, best execution, fair value pricing, and proxy voting procedures, among others. The Board also took into account the financial condition of each Sub-Adviser. In its review, the Board also received and took into account information regarding any services and/or payments provided to the Adviser by the Sub-Advisers in connection with marketing activities.
The Board considered each Sub-Adviser’s investment process and philosophy. The Board took into account that each Sub-Adviser’s responsibilities include the development and maintenance of an investment program for the applicable Portfolio which is consistent with the Portfolio’s investment objectives, the selection of investment securities and the placement of orders for the purchase and sale of such securities, as well as the implementation of compliance controls related to performance of these services. The Board also reviewed each Sub-Adviser’s brokerage policies and practices.
Performance. The Board considered the performance of the Portfolios as described in the quarterly reports prepared by management, and as also analyzed in reports prepared by the Independent Trustees’ independent consultant. The Board noted that the Adviser reviews with the Board on a quarterly basis detailed information about the Portfolios’ performance results, portfolio composition and investment strategies. The Board also reviewed and considered a separate report prepared by Lipper Inc. (“Lipper”), an independent third party, which provided a statistical analysis comparing the Portfolios’ investment performance, expenses, and fees to comparable funds underlying variable insurance products (the “Performance Universe”). In addition, the Independent Trustees met separately with a representative of Bobroff Consulting, Inc., an independent consultant (“Bobroff), at a special board meeting in September 2013, to review the separate reports prepared by such consultant (“Bobroff Report”), which analyzed the report prepared by Lipper. The Board also considered each Portfolio’s more recent performance subsequent to the performance period covered by the Lipper reports, and management’s discussion of the same, including the effect of current market conditions on each Portfolio’s more recent performance.
The Board reviewed the Portfolios’ performance records and the Adviser’s and Sub-Advisers’ management styles and long-term performance records with the Portfolios and comparable funds. The Board focused particular attention on Portfolios with less favorable performance records. The Board was mindful of the Adviser’s focus on each Sub-Adviser’s performance and noted that the Adviser has been active in monitoring and responding to any performance issues with respect to the Portfolios. The Board also took into account its discussions with management regarding factors that contributed to the performance of the Portfolios.
Among other data relating specifically to the Met/Artisan Mid Cap Value Portfolio’s performance, the Board considered that the Portfolio outperformed the median of its Performance Universe and its Lipper Index for the one-, three- and five-year periods ended June 30, 2013. The Board also considered that the Portfolio outperformed its benchmark, the Russell Midcap Value Index, for the one- and three-year periods ended October 31, 2013, and underperformed its benchmark for the five-year period ended October 31, 2013.
Fees and Expenses. The Board gave consideration to the advisory fees payable under the Advisory Agreement and the sub-advisory fees payable under each of the Sub-Advisory Agreements. In this regard, the Board reviewed the advisory fees payable on a Portfolio-by-Portfolio basis based on information provided by the Adviser. The Independent Trustees, with the assistance of Bobroff, also examined the fees paid by a Portfolio in light of fees paid to other investment managers by comparable funds, as well as considered the fees charged by the Adviser to manage other comparable funds, as applicable. The Lipper report included comparisons of the Adviser’s fee schedule with that of its peers based on an asset-based analysis of relative fee structures according to the size of the Portfolio. In addition, the Board considered the Portfolios’ advisory and sub-advisory fees and total expenses as compared to similarly situated investment companies underlying variable insurance products deemed to be comparable to the Portfolios as determined by Lipper.
MSF-20
Metropolitan Series Fund
Met/Artisan Mid Cap Value Portfolio
Board of Trustees’ Consideration of Advisory and Sub-Advisory Agreements—(Continued)
The Board considered a Portfolio’s ranking within a smaller group of peer funds chosen by Lipper (the “Expense Group”), as well as the Portfolio’s ranking within broader groups of funds (the “Expense Universe” and the “Sub-advised Expense Universe”). The Board also considered a Portfolio’s contractual sub-advisory fees, as applicable, as compared to the Sub-advised Expense Universe as well as a smaller group of funds (the “Sub-advised Expense Group”). In comparing a Portfolio’s actual and contractual management fee to that of comparable funds, the Board noted that such fee includes both advisory and administrative fees.
The Board noted that the sub-advisory fees for the Portfolios are paid by the Adviser, not the Portfolios, out of the advisory fee. It was further noted that the Adviser negotiates such fees at arm’s length. The Board also considered that the Adviser had entered into expense limitation agreements with certain of the Portfolios, pursuant to which the Adviser has agreed to waive a portion of its advisory fee and/or reimburse certain expenses as a means of limiting a Portfolio’s total annual operating expenses. The Board further considered the amount of sub-advisory fees paid out by the Adviser and the amount of the management fees that it retained in light of the services performed by Sub-Advisers and Adviser, respectively.
With respect to the Met/Artisan Mid Cap Value Portfolio, the Board considered that the Portfolio’s actual management fees and total expenses (exclusive of 12b-1 fees) were below the Expense Group median, the Expense Universe median and the Sub-advised Expense Universe median. The Board further noted that the Portfolio’s contractual management fees were above the asset-weighted average of the Expense Group at the Portfolio’s current size. The Board also considered that the Portfolio’s contractual sub-advisory fees were above the average of the Sub-advised Expense Group and the Sub-advised Expense Universe at the Portfolio’s current size. The Board took into account management’s discussion of the Portfolio’s expenses.
Profitability. The Board examined the profitability of the Adviser on a Portfolio-by-Portfolio basis. The Board also considered that the Distributor, MetLife Investors Distribution Company, receives Rule 12b-1 payments to support the distribution of the products. The Board considered the profitability to the Sub-Advisers and their affiliates as a result of their relationships with the Portfolios, and the Board considered the ability of the Adviser to negotiate the Sub-Advisory Agreements and the fees thereunder at arm’s length. The Board also reviewed Portfolio specific data with regard to the profitability of the Portfolios to each Sub-Adviser, as available.
Economies of scale. The Board also considered the effect of the Portfolios’ growth in size on their fees. The Board noted that the fee schedules for most of the Portfolios contain breakpoints that reduce the fee rate above specified asset levels. The Board noted those Portfolios that did not contain breakpoints in the advisory fee and took into account management’s discussion of the same. The Board noted that those Portfolios with advisory fee schedules containing breakpoints generally reflect the inclusion of breakpoints in the sub-advisory fee schedule for such Portfolios. The Board considered the effective fees under the Advisory Agreement for a Portfolio as a percentage of assets at different asset levels and possible economies of scale that may be realized if the assets of the Portfolio grow. Among other data, the Board examined the effect of a Portfolio’s growth in size on various fee schedules and reviewed the Lipper and Bobroff Reports, which compared fees among peers. The Board also generally noted that if a Portfolio’s assets increase over time, the Portfolio may realize other economies of scale if assets increase proportionally more than certain other fixed expenses. In addition, the Board noted that the Adviser had taken a number of steps to date intended to share the benefits of economies of scale with contractholders.
With respect to the Met/Artisan Mid Cap Value Portfolio, the Board noted that the Portfolio’s advisory fee and sub-advisory fee each contains breakpoints that reduce the advisory fee rate on assets above certain specified asset levels. The Board considered the fact that the Portfolio’s fee levels decline as portfolio assets increase.
Other factors. As part of its evaluation of the Adviser’s compensation, the Board considered other benefits that may be realized by the Adviser and its affiliates from their relationship with the Trusts. Among them, the Board recognized that an affiliate of the Adviser, MetLife Investors Distribution Company, serves as the Distributor for the Trusts, and, as such, receives payments pursuant to Rule 12b-1 from the Portfolios to compensate it for providing shareholder services and selling activities, which could lead to growth in the Trusts’ assets and corresponding benefits from such growth, including economies of scale. The Board also considered that affiliates of the Adviser may benefit from certain indirect tax benefits relating to dividend received deductions and foreign tax credits. In conjunction with these considerations, the Board noted the costs of providing investment management and other services to the Portfolios and the ongoing commitment of the Adviser to the Portfolios.
The Board considered other benefits that may be realized by each Sub-Adviser and its affiliates from their relationship with the Trusts, including the opportunity to provide advisory services to additional portfolios of the Trusts and reputational benefits. In conjunction with these considerations, the Board noted the costs of providing investment advisory services to the Portfolios and the ongoing commitment of the Sub-Advisers to the Portfolios.
MSF-21
Metropolitan Series Fund
Met/Artisan Mid Cap Value Portfolio
Board of Trustees’ Consideration of Advisory and Sub-Advisory Agreements—(Continued)
The Board considered possible conflicts of interest in the form of material benefits or detriments to the Trusts resulting from the nature of the Trusts’ and the Adviser’s or the Sub-Advisers’ affiliations and the services that are provided to the Trusts, and the manner in which such conflicts were mitigated.
Conclusions. After full consideration of the factors discussed above, the Board, including a majority of the Independent Trustees, approved the Advisory Agreement and the Sub-Advisory Agreement, as applicable, with respect to each Portfolio, unless otherwise noted. In making its approvals, the Board concluded that the nature, extent and quality of services provided by the Adviser and each Sub-Adviser supported the renewal of the Agreements. The Board also concluded that the investment performance of each Fund was such that each Agreement should continue. In addition, the Board concluded that fees paid by a Portfolio to the Adviser and, if applicable, the Sub-Adviser appeared to be acceptable in light of nature, extent and quality of the services provided by the Adviser and Sub-Adviser. Further, the Board concluded that the Adviser’s profitability in providing services under the Advisory Agreements did not appear unreasonably high in light of the nature, extent and quality of the services provided by the Adviser. Finally, the Board concluded that the Advisory and Sub-Advisory fees in some measure share economies of scale with contractholders. In approving the renewal of each of the Agreements, the Board, including the Independent Trustees, did not identify any single factor as controlling, and generally attributed different weights to various factors for the various Portfolios. The Board evaluated all information available to them on a Portfolio-by-Portfolio basis, and their decisions were made separately with respect to each Portfolio.
MSF-22
Metropolitan Series Fund
Met/Dimensional International Small Company Portfolio
Managed by Dimensional Fund Advisors LP
Portfolio Manager Commentary*
PERFORMANCE
For the one year period ended December 31, 2013, the Class A and B shares of the Met/Dimensional International Small Company Portfolio returned 27.94% and 27.60%, respectively. The Portfolio’s benchmark, the MSCI World ex-U.S. Small Cap Index1, returned 25.55%.
MARKET ENVIRONMENT / CONDITIONS
In U.S. dollar terms, developed ex-U.S. markets had excellent aggregate returns in 2013, but still trailed the broad U.S. market by 12% (broad U.S. market as measured by the Russell 3000 Index). Returns, as measured by the MSCI World ex-USA Investable Market Index (net dividends), were 21.6%.
Dispersion at the individual country level remained substantial. For instance, the difference between the best-performing developed market, Ireland (+47.4%), and the worst-performing one, Singapore (+0.3%), was more than 47%. The U.S. dollar appreciated against the Japanese yen, the Australian dollar, and the Canadian dollar, and depreciated against the euro, the British pound, and the Swiss franc. As a result, currency fluctuations had a negative impact on the dollar-denominated returns of developed ex-U.S. equities. Across all regions, Telecommunication Services and Consumer Discretionary tended to be among the stronger sectors, while Real Estate Investment Trusts (“REITs”) and Materials were among the weaker.
Along the market capitalization dimension, conventional indices indicated a positive size premium as the MSCI World ex-U.S. Small Cap Index outperformed its large cap peer. At the regional level, Australia/New Zealand and Canada were exceptions to overall market trends with small caps underperforming large caps.
PORTFOLIO REVIEW / PERIOD END POSITIONING
For the year ended December 31, 2013, the Portfolio outperformed its benchmark index by 2.39%. Dimensional Fund Advisers LP defines the small cap universe differently than MSCI and as a result, the Portfolio had a lower allocation to Canada and a higher allocation to the United Kingdom, both of which contributed positively to the Portfolio’s relative performance as Canada underperformed and the United Kingdom outperformed relative to other developed markets. With REITs underperforming during the year, the Portfolio’s exclusion of REITs was a contributor to outperformance relative to the benchmark index. Within sectors, the Portfolio’s holdings of Industrials outperformed those in the benchmark, particularly among larger small cap stocks.
Relative to the index, the Portfolio’s holdings in Information Technology underperformed due to a few securities that appreciated rapidly and moved out of the Portfolio buy range but were held by the index until the next rebalance.
The Portfolio held approximately 3,700 securities as of December 31, 2013 and is well diversified across countries and sectors. As a reminder, the Portfolio’s allocations to countries and sectors are a result of our portfolio construction process and should not be interpreted as tactical allocation decisions.
Joseph Chi
Jed Fogdall
Henry Gray
Karen Umland
Portfolio Managers
Dimensional Fund Advisors LP
* This commentary may include statements that constitute “forward-looking statements” under the U.S. securities laws. Forward-looking statements include, among other things, projections, estimates, and information about possible or future results related to the Portfolio, market or regulatory developments. The views expressed above are not guarantees of future performance or economic results and involve certain risks, uncertainties and assumptions that could cause actual outcomes and results to differ materially from the views expressed herein. The views expressed above are subject to change at any time based upon economic, market, or other conditions and the subadvisory firm undertakes no obligation to update the views expressed herein. Any discussions of specific securities should not be considered a recommendation to buy or sell those securities. The views expressed above (including any forward-looking statement) may not be relied upon as investment advice or as an indication of the Portfolio’s trading intent. Information about the Portfolio’s holdings, asset allocation or country diversification is historical and is not an indication of future Portfolio composition, which may vary. Direct investment in any index is not possible. The performance of any index mentioned in this commentary has not been adjusted for ongoing management, distribution and operating expenses, and sales charges applicable to mutual fund investments. In addition, the returns do not reflect additional fees charged by separate accounts or variable insurance contracts that an investor in the Portfolio may pay. If these additional fees were reflected, performance would have been lower.
MSF-1
Metropolitan Series Fund
Met/Dimensional International Small Company Portfolio
A $10,000 INVESTMENT COMPARED TO THE MSCI WORLD EX-U.S. SMALL CAP INDEX

AVERAGE ANNUAL RETURNS (%) (FOR THE YEAR ENDED DECEMBER 31, 2013)
| | | | | | | | | | | | |
| | | 1 Year | | | 5 Year | | | Since Inception2 | |
| Met/Dimensional International Small Company Portfolio | | | | | | | | | | | | |
Class A | | | 27.94 | | | | 17.44 | | | | 17.18 | |
Class B | | | 27.60 | | | | 17.13 | | | | 16.88 | |
| MSCI World ex-U.S. Small Cap Index | | | 25.55 | | | | 18.45 | | | | 18.18 | |
1 The MSCI World ex-U.S. Small Cap Index is an unmanaged index that measures the performance of stocks with market capitalizations between US $200 million and $800 million across 23 developed markets, excluding the United States. The index returns shown above were calculated with net dividends: they reflect the reinvestment of dividends after the deduction of the maximum possible withholding taxes.
2 Inception date of the Class A and Class B shares is 10/31/08. Index since inception return is based on the Portfolio’s inception date.
Portfolio performance is calculated including reinvestment of all income and capital gain distributions. Performance numbers are net of all Portfolio expenses but do not include any insurance, sales, separate account or administrative charges of variable annuity or life insurance contracts or any additional expenses that participants may bear relating to the operations of their plans. If these charges were included, the returns would be lower. The performance of any index referenced above has not been adjusted for ongoing management, distribution and operating expenses, and sales charges applicable to mutual fund investments. Direct investment in any index is not possible. The performance of Class A shares, as set forth in the line graph above, will differ from that of other classes because of the difference in expenses paid by policyholders investing in the different share classes.
This information represents past performance and is not indicative of future results. Investment return and principal value may fluctuate so that shares, upon redemption, may be worth more or less than the original cost.
PORTFOLIO COMPOSITION AS OF DECEMBER 31, 2013
Top Holdings
| | | | |
| | |
% of
Net Assets | |
Alcatel-Lucent | | | 0.7 | |
Persimmon plc | | | 0.4 | |
Ashtead Group plc | | | 0.4 | |
GN Store Nord A/S | | | 0.4 | |
Spectris plc | | | 0.3 | |
Barratt Developments plc | | | 0.3 | |
Berkeley Group Holdings plc | | | 0.3 | |
Taylor Wimpey plc | | | 0.3 | |
Cobham plc | | | 0.3 | |
Deutsche Wohnen AG | | | 0.3 | |
Top Countries
| | | | |
| | | % of
Market Value of
Total Investments | |
United Kingdom | | | 22.2 | |
Japan | | | 21.7 | |
Canada | | | 8.5 | |
Germany | | | 5.3 | |
Australia | | | 5.0 | |
Switzerland | | | 4.8 | |
France | | | 4.7 | |
Sweden | | | 3.7 | |
Italy | | | 3.3 | |
Hong Kong | | | 2.8 | |
MSF-2
Metropolitan Series Fund
Met/Dimensional International Small Company Portfolio
Understanding Your Portfolio’s Expenses
Shareholder Expense Example
As a shareholder of the Portfolio, you incur ongoing costs, including management fees; distribution and service (12b-1) fees; and other Portfolio expenses. This example is intended to help you understand your ongoing costs (in dollars) (referred to as “expenses”) of investing in the Portfolio and compare these costs with the ongoing costs of investing in other mutual funds. The example is based on an investment of $1,000 invested at the beginning of the period and held for the entire period, July 1, 2013 through December 31, 2013.
Actual Expenses
The first line for each share class of the Portfolio in the table below provides information about actual account values and actual expenses. You may use the information in this line, together with the amount you invested in the particular share class of the Portfolio, to estimate the expenses that you paid over the period. Simply divide your account value by $1,000 (for example, an $8,600 account value divided by $1,000 = 8.6), then multiply the result by the number in the first line under the heading entitled “Expenses Paid During Period” to estimate the expenses you paid on your account during this period.
Hypothetical Example for Comparison Purposes
The second line for each share class of the Portfolio in the table below provides information about hypothetical account values and hypothetical expenses based on the Portfolio’s actual expense ratio and an assumed rate of return of 5% per year before expenses, which is not the Portfolio’s actual return. The hypothetical account values and expenses may not be used to estimate the actual ending account balance or expenses you paid for the period. You may use this information to compare the ongoing costs of investing in the Portfolio and other funds. To do so, compare this 5% hypothetical example with the 5% hypothetical examples that appear in the shareholder reports of the other funds.
Please note that the expenses shown in the table are meant to highlight your ongoing costs only and do not reflect any fees or charges of your variable insurance product or any additional expenses that participants in certain eligible qualified plans may bear relating to the operations of their plan. Therefore, the second line for each share class in the table is useful in comparing ongoing costs only, and will not help you determine the relative total costs of owning different funds. In addition, if these other costs were included, your costs would have been higher.
| | | | | | | | | | | | | | | | | | |
Met/Dimensional International Small Company Portfolio | | | | Annualized
Expense
Ratio | | | Beginning
Account Value
July 1,
2013 | | | Ending
Account Value
December 31,
2013 | | | Expenses Paid
During Period**
July 1, 2013
to
December 31,
2013
| |
Class A(a) | | Actual | | | 0.90 | % | | $ | 1,000.00 | | | $ | 1,229.40 | | | $ | 5.06 | |
| | Hypothetical* | | | 0.90 | % | | $ | 1,000.00 | | | $ | 1,020.67 | | | $ | 4.58 | |
| | | | | |
Class B(a) | | Actual | | | 1.15 | % | | $ | 1,000.00 | | | $ | 1,227.10 | | | $ | 6.46 | |
| | Hypothetical* | | | 1.15 | % | | $ | 1,000.00 | | | $ | 1,019.41 | | | $ | 5.85 | |
* Hypothetical assumes a rate of return of 5% per year before expenses.
** Expenses paid are equal to the Portfolio’s annualized expense ratio for the most recent six month period, as shown above, multiplied by the average account value over the period, multiplied by the number of days (184 days) in the most recent fiscal half-year, divided by 365 (to reflect the one-half year period).
(a) The annualized expense ratio shown reflects the impact of the management fee waiver as described in Note 6 of the Notes to Financial Statements.
MSF-3
Metropolitan Series Fund
Met/Dimensional International Small Company Portfolio
Schedule of Investments as of December 31, 2013
Common Stocks—99.4% of Net Assets
| | | | | | | | |
| Security Description | | Shares | | | Value | |
| | |
Australia—5.0% | | | | | | | | |
ABM Resources NL (a) | | | 145,014 | | | $ | 2,849 | |
Adelaide Brighton, Ltd. | | | 230,220 | | | | 756,693 | |
Aditya Birla Minerals, Ltd. (a) | | | 49,372 | | | | 14,989 | |
AED Oil, Ltd. (a) (b) (c) | | | 93,946 | | | | 0 | |
Ainsworth Game Technology, Ltd. | | | 39,892 | | | | 156,718 | |
AJ Lucas Group, Ltd. (a) | | | 34,363 | | | | 33,753 | |
Alcyone Resources, Ltd. (a) | | | 101,457 | | | | 182 | |
Alkane Resources, Ltd. (a) | | | 120,355 | | | | 36,754 | |
Alliance Resources, Ltd. (a) | | | 81,385 | | | | 9,484 | |
Altium, Ltd. | | | 6,736 | | | | 13,991 | |
Altona Mining, Ltd. (a) | | | 67,875 | | | | 10,033 | |
AMA Group, Ltd. | | | 90,664 | | | | 27,576 | |
Amalgamated Holdings, Ltd. | | | 32,994 | | | | 241,386 | |
Amcom Telecommunications, Ltd. | | | 122,691 | | | | 238,842 | |
Ansell, Ltd. | | | 75,709 | | | | 1,398,696 | |
Antares Energy, Ltd. (a) | | | 111,036 | | | | 54,607 | |
AP Eagers, Ltd. | | | 223 | | | | 988 | |
APN News & Media, Ltd. (a) (d) | | | 240,460 | | | | 96,623 | |
Aquarius Platinum, Ltd. (a) | | | 39,840 | | | | 27,038 | |
Aquila Resources, Ltd. (a) | | | 54,538 | | | | 112,029 | |
Arafura Resources, Ltd. (a) | | | 91,975 | | | | 6,409 | |
ARB Corp., Ltd. | | | 25,332 | | | | 265,117 | |
Aristocrat Leisure, Ltd. (d) | | | 202,271 | | | | 847,393 | |
Arrium, Ltd. | | | 779,809 | | | | 1,219,228 | |
ASG Group, Ltd. (a) | | | 59,850 | | | | 21,974 | |
Atlantic, Ltd. (a) | | | 22,059 | | | | 3,547 | |
Atlas Iron, Ltd. | | | 440,611 | | | | 455,605 | |
Aurora Oil & Gas, Ltd. (a) | | | 197,317 | | | | 533,563 | |
Ausdrill, Ltd. | | | 152,607 | | | | 141,163 | |
Ausenco, Ltd. | | | 72,770 | | | | 40,978 | |
Austal, Ltd. (a) | | | 66,437 | | | | 51,739 | |
Austbrokers Holdings, Ltd. | | | 20,900 | | | | 224,034 | |
Austin Engineering, Ltd. | | | 26,257 | | | | 86,827 | |
Australian Agricultural Co., Ltd. (a) | | | 211,378 | | | | 235,957 | |
Australian Infrastructure Fund, Ltd. | | | 269,584 | | | | 1,204 | |
Australian Pharmaceutical Industries, Ltd. | | | 174,311 | | | | 93,761 | |
Automotive Holdings Group, Ltd. | | | 102,926 | | | | 347,566 | |
Aveo Group | | | 72,034 | | | | 132,604 | |
AVJennings, Ltd. (a) | | | 10,332 | | | | 5,631 | |
AWE, Ltd. (a) | | | 335,940 | | | | 402,129 | |
Azonto Petroleum, Ltd. (a) | | | 162,011 | | | | 3,625 | |
Bandanna Energy, Ltd. (a) (d) | | | 179,193 | | | | 27,296 | |
BC Iron, Ltd. | | | 62,731 | | | | 290,829 | |
Beach Energy, Ltd. | | | 676,773 | | | | 864,611 | |
Beadell Resources, Ltd. (a) | | | 102,327 | | | | 72,172 | |
Bentham IMF, Ltd. | | | 28,777 | | | | 44,988 | |
Berkeley Resources, Ltd. (a) | | | 25,720 | | | | 5,390 | |
Billabong International, Ltd. (a) | | | 204,074 | | | | 92,002 | |
Blackmores, Ltd. | | | 5,962 | | | | 111,000 | |
Blackthorn Resources, Ltd. (a) | | | 28,882 | | | | 6,745 | |
Boart Longyear, Ltd. (d) | | | 232,690 | | | | 80,388 | |
Boom Logistics, Ltd. (a) | | | 73,674 | | | | 8,943 | |
Bradken, Ltd. (d) | | | 90,619 | | | | 488,080 | |
Breville Group, Ltd. | | | 42,911 | | | | 342,287 | |
Brickworks, Ltd. | | | 4,295 | | | | 54,838 | |
BT Investment Management, Ltd. | | | 11,643 | | | | 59,918 | |
Buccaneer Energy, Ltd. (a) (b) | | | 246,364 | | | | 5,074 | |
| | |
Australia—(Continued) | | | | | | | | |
Buru Energy, Ltd. (a) (d) | | | 23,457 | | | | 36,714 | |
Cabcharge Australia, Ltd. (d) | | | 55,813 | | | | 198,934 | |
Cape Lambert Resources, Ltd. (a) | | | 97,229 | | | | 11,290 | |
Capral, Ltd. (a) | | | 136,176 | | | | 18,961 | |
Cardno, Ltd. (d) | | | 46,504 | | | | 287,219 | |
Carnarvon Petroleum, Ltd. (a) | | | 251,902 | | | | 14,434 | |
carsales.com, Ltd. | | | 94,922 | | | | 863,783 | |
Cash Converters International, Ltd. | | | 139,149 | | | | 120,518 | |
Cedar Woods Properties, Ltd. | | | 26,836 | | | | 183,346 | |
Ceramic Fuel Cells, Ltd. (a) | | | 142,981 | | | | 4,871 | |
Chalice Gold Mines, Ltd. (a) | | | 25,904 | | | | 3,125 | |
Chandler Macleod Group, Ltd. | | | 16,111 | | | | 6,476 | |
Citigold Corp., Ltd. (a) | | | 104,691 | | | | 4,327 | |
Clinuvel Pharmaceuticals, Ltd. (a) | | | 8,760 | | | | 7,430 | |
Coal of Africa, Ltd. (a) | | | 133,534 | | | | 12,519 | |
Coalspur Mines, Ltd. (a) (d) | | | 94,441 | | | | 19,418 | |
Cockatoo Coal, Ltd. (a) | | | 674,454 | | | | 24,106 | |
Codan, Ltd. | | | 48,344 | | | | 48,483 | |
Coffey International, Ltd. (a) | | | 63,637 | | | | 13,952 | |
Collection House, Ltd. | | | 19,217 | | | | 32,274 | |
Collins Foods, Ltd. | | | 4,975 | | | | 8,134 | |
Comet Ridge, Ltd. (a) | | | 6,288 | | | | 932 | |
Cooper Energy, Ltd. (a) | | | 123,859 | | | | 50,497 | |
Coventry Group, Ltd. | | | 2,905 | | | | 7,551 | |
Credit Corp. Group, Ltd. | | | 13,415 | | | | 115,768 | |
Crowe Horwath Australasia, Ltd. | | | 93,561 | | | | 28,843 | |
CSG, Ltd. (a) | | | 35,179 | | | | 28,885 | |
CSR, Ltd. | | | 282,278 | | | | 670,148 | |
Cudeco, Ltd. (a) | | | 51,210 | | | | 82,722 | |
Cue Energy Resources, Ltd. (a) | | | 171,183 | | | | 20,026 | |
Data #3, Ltd. | | | 55,471 | | | | 46,635 | |
David Jones, Ltd. (d) | | | 263,552 | | | | 712,970 | |
Decmil Group, Ltd. (d) | | | 82,140 | | | | 181,924 | |
Deep Yellow, Ltd. (a) | | | 271,919 | | | | 4,394 | |
Devine, Ltd. (a) | | | 46,180 | | | | 33,299 | |
Discovery Metals, Ltd. (a) | | | 117,087 | | | | 5,573 | |
Domino’s Pizza Enterprises, Ltd. | | | 21,779 | | | | 314,971 | |
Downer EDI, Ltd. | | | 238,347 | | | | 1,040,114 | |
Drillsearch Energy, Ltd. (a) | | | 218,929 | | | | 265,080 | |
DuluxGroup, Ltd. | | | 190,998 | | | | 917,312 | |
DWS, Ltd. | | | 36,847 | | | | 40,523 | |
Echo Entertainment Group, Ltd. | | | 45,092 | | | | 99,076 | |
Elders, Ltd. (a) (d) | | | 150,466 | | | | 15,487 | |
Elemental Minerals, Ltd. (a) | | | 26,469 | | | | 7,785 | |
Emeco Holdings, Ltd. | | | 314,914 | | | | 63,635 | |
Empire Oil & Gas NL (a) | | | 591,457 | | | | 5,808 | |
Energy Resources of Australia, Ltd. (a) | | | 40,323 | | | | 45,387 | |
Energy World Corp., Ltd. (a) | | | 389,239 | | | | 132,127 | |
Envestra, Ltd. | | | 514,190 | | | | 524,206 | |
Equatorial Resources, Ltd. (a) | | | 18,658 | | | | 10,998 | |
Equity Trustees, Ltd. | | | 452 | | | | 8,081 | |
ERM Power, Ltd. | | | 6,161 | | | | 13,204 | |
eServGlobal, Ltd. (a) | | | 43,068 | | | | 30,396 | |
Ethane Pipeline Income Fund | | | 3,869 | | | | 6,080 | |
Euroz, Ltd. | | | 21,953 | | | | 23,149 | |
Evolution Mining, Ltd. | | | 113,688 | | | | 62,950 | |
Fairfax Media, Ltd. (d) | | | 944,011 | | | | 539,614 | |
See accompanying notes to financial statements.
MSF-4
Metropolitan Series Fund
Met/Dimensional International Small Company Portfolio
Schedule of Investments as of December 31, 2013
Common Stocks—(Continued)
| | | | | | | | |
| Security Description | | Shares | | | Value | |
| | |
Australia—(Continued) | | | | | | | | |
Fantastic Holdings, Ltd. | | | 1,151 | | | $ | 2,104 | |
FAR, Ltd. (a) | | | 882,955 | | | | 31,548 | |
Finbar Group, Ltd. | | | 6,909 | | | | 9,854 | |
Fleetwood Corp., Ltd. (d) | | | 30,946 | | | | 88,150 | |
FlexiGroup, Ltd. | | | 50,884 | | | | 203,215 | |
Flinders Mines, Ltd. (a) | | | 606,380 | | | | 17,381 | |
Focus Minerals, Ltd. (a) | | | 1,919,942 | | | | 20,572 | |
Forge Group, Ltd. | | | 34,499 | | | | 53,667 | |
Funtastic, Ltd. | | | 88,662 | | | | 13,836 | |
G8 Education, Ltd. | | | 59,161 | | | | 167,534 | |
Galaxy Resources, Ltd. (a) | | | 75,661 | | | | 3,175 | |
Geodynamics, Ltd. (a) | | | 82,317 | | | | 5,806 | |
Gindalbie Metals, Ltd. (a) | | | 346,087 | | | | 30,911 | |
Global Construction Services, Ltd. | | | 9,380 | | | | 4,032 | |
Goodman Fielder, Ltd. | | | 1,046,927 | | | | 641,726 | |
GrainCorp, Ltd. - Class A | | | 92,744 | | | | 704,002 | |
Grange Resources, Ltd. | | | 120,000 | | | | 27,335 | |
Greencross, Ltd. | | | 653 | | | | 4,974 | |
Greenland Minerals & Energy, Ltd. (a) | | | 69,811 | | | | 12,781 | |
Gryphon Minerals, Ltd. (a) (d) | | | 118,469 | | | | 18,173 | |
GUD Holdings, Ltd. (d) | | | 44,683 | | | | 229,866 | |
Gunns, Ltd. (a) (b) (c) (d) | | | 309,759 | | | | 0 | |
GWA Group, Ltd. | | | 136,751 | | | | 371,373 | |
Hansen Technologies, Ltd. | | | 17,614 | | | | 19,174 | |
HFA Holdings, Ltd. | | | 45,623 | | | | 29,762 | |
Highlands Pacific, Ltd. (a) | | | 173,904 | | | | 9,251 | |
Hillgrove Resources, Ltd. (a) | | | 207,073 | | | | 16,672 | |
Hills, Ltd. | | | 80,453 | | | | 125,305 | |
Horizon Oil, Ltd. (a) (d) | | | 652,736 | | | | 178,204 | |
Icon Energy, Ltd. (a) | | | 157,110 | | | | 22,480 | |
IDM International, Ltd. (a) (b) | | | 49,237 | | | | 1,715 | |
iiNET, Ltd. | | | 65,072 | | | | 379,569 | |
Imdex, Ltd. | | | 98,650 | | | | 54,636 | |
Independence Group NL | | | 108,194 | | | | 302,726 | |
Indophil Resources NL (a) | | | 149,398 | | | | 21,995 | |
Infigen Energy, Ltd. (a) (d) | | | 282,132 | | | | 65,503 | |
Infomedia, Ltd. | | | 67,545 | | | | 35,705 | |
Integrated Research, Ltd. | | | 28,972 | | | | 26,717 | |
International Ferro Metals, Ltd. (a) | | | 82,765 | | | | 13,420 | |
Intrepid Mines, Ltd. (a) | | | 177,715 | | | | 49,977 | |
Invocare, Ltd. | | | 52,100 | | | | 513,872 | |
IOOF Holdings, Ltd. | | | 114,401 | | | | 916,817 | |
Iress, Ltd. | | | 67,088 | | | | 566,628 | |
Iron Ore Holdings, Ltd. (a) | | | 17,526 | | | | 14,084 | |
JB Hi-Fi, Ltd. (d) | | | 50,520 | | | | 972,818 | |
Jumbo Interactive, Ltd. | | | 17,427 | | | | 34,449 | |
Jupiter Mines, Ltd. (a) | | | 63,164 | | | | 4,504 | |
K&S Corp., Ltd. | | | 1,802 | | | | 2,958 | |
Kagara, Ltd. (a) (b) (c) (d) | | | 131,297 | | | | 14,068 | |
Kangaroo Resources, Ltd. (a) | | | 305,630 | | | | 3,821 | |
Karoon Gas Australia, Ltd. (a) | | | 75,600 | | | | 293,376 | |
Kingsgate Consolidated, Ltd. | | | 54,831 | | | | 45,915 | |
Kingsrose Mining, Ltd. (a) | | | 83,494 | | | | 25,014 | |
Linc Energy, Ltd. (a) | | | 152,753 | | | | 183,989 | |
Liquefied Natural Gas, Ltd. (a) | | | 11,253 | | | | 2,967 | |
Lycopodium, Ltd. | | | 6,953 | | | | 25,949 | |
M2 Telecommunications Group, Ltd. | | | 70,760 | | | | 396,238 | |
| | |
Australia—(Continued) | | | | | | | | |
MACA, Ltd. | | | 65,585 | | | | 154,060 | |
Macmahon Holdings, Ltd. (a) | | | 557,730 | | | | 72,734 | |
Macquarie Atlas Roads Group | | | 97,706 | | | | 240,042 | |
Macquarie Telecom Group, Ltd. | | | 3,983 | | | | 29,494 | |
Mastermyne Group, Ltd. | | | 5,402 | | | | 3,714 | |
Matrix Composites & Engineering, Ltd. (a) | | | 14,874 | | | | 10,163 | |
Maverick Drilling & Exploration, Ltd. (a) | | | 35,970 | | | | 14,227 | |
MaxiTRANS Industries, Ltd. (d) | | | 59,013 | | | | 62,825 | |
Mayne Pharma Group, Ltd. (a) | | | 64,238 | | | | 42,440 | |
McPherson’s, Ltd. | | | 34,460 | | | | 47,760 | |
Medusa Mining, Ltd. (a) | | | 60,972 | | | | 111,764 | |
Melbourne IT, Ltd. | | | 36,135 | | | | 57,085 | |
MEO Australia, Ltd. (a) | | | 220,030 | | | | 8,447 | |
Mermaid Marine Australia, Ltd. | | | 116,821 | | | | 354,742 | |
Metals X, Ltd. (a) | | | 199,551 | | | | 30,395 | |
Metgasco, Ltd. (a) | | | 117,719 | | | | 8,587 | |
Metminco, Ltd. (a) | | | 116,326 | | | | 3,239 | |
Mincor Resources NL | | | 105,687 | | | | 56,144 | |
Mineral Deposits, Ltd. (a) | | | 44,307 | | | | 110,856 | |
Mineral Resources, Ltd. | | | 61,208 | | | | 648,971 | |
Molopo Energy, Ltd. (a) | | | 70,758 | | | | 11,419 | |
Monadelphous Group, Ltd. (d) | | | 42,455 | | | | 707,444 | |
Morning Star Gold NL (a) (b) (c) | | | 33,455 | | | | 3,286 | |
Mortgage Choice, Ltd. | | | 48,689 | | | | 124,924 | |
Mount Gibson Iron, Ltd. | | | 439,215 | | | | 399,726 | |
Myer Holdings, Ltd. (d) | | | 297,624 | | | | 731,939 | |
MyState, Ltd. | | | 2,711 | | | | 11,789 | |
Nanosonics, Ltd. (a) | | | 44,660 | | | | 33,611 | |
Navitas, Ltd. | | | 96,272 | | | | 554,642 | |
Neon Energy, Ltd. (a) (d) | | | 259,085 | | | | 62,484 | |
Newsat, Ltd. (a) | | | 113,333 | | | | 45,552 | |
Nexus Energy, Ltd. (a) | | | 625,142 | | | | 39,233 | |
NIB Holdings, Ltd. | | | 238,467 | | | | 581,418 | |
Nick Scali, Ltd. | | | 16,348 | | | | 38,610 | |
Nido Petroleum, Ltd. (a) | | | 522,236 | | | | 16,843 | |
Noble Mineral Resources, Ltd. (a) (b) (c) | | | 83,737 | | | | 673 | |
Northern Iron, Ltd. (a) | | | 90,404 | | | | 17,762 | |
Northern Star Resources, Ltd. | | | 163,091 | | | | 114,932 | |
NRW Holdings, Ltd. | | | 162,933 | | | | 200,323 | |
Nufarm, Ltd. (d) | | | 92,426 | | | | 362,760 | |
Oakton, Ltd. | | | 44,988 | | | | 64,250 | |
Orocobre, Ltd. (a) | | | 38,552 | | | | 85,716 | |
OrotonGroup, Ltd. | | | 11,425 | | | | 45,055 | |
Otto Energy, Ltd. (a) | | | 308,140 | | | | 27,668 | |
OZ Minerals, Ltd. (d) | | | 103,887 | | | | 292,378 | |
Pacific Brands, Ltd. | | | 621,651 | | | | 356,051 | |
Paladin Energy, Ltd. (a) (d) | | | 473,815 | | | | 197,720 | |
Pan Pacific Petroleum NL (a) | | | 55,564 | | | | 5,211 | |
PanAust, Ltd. | | | 258,090 | | | | 418,407 | |
Panoramic Resources, Ltd. | | | 146,618 | | | | 32,736 | |
PaperlinX, Ltd. (a) | | | 340,846 | | | | 14,299 | |
Patties Foods, Ltd. | | | 33,186 | | | | 41,211 | |
Peak Resources, Ltd. (a) | | | 34,546 | | | | 2,067 | |
Peet, Ltd. (a) | | | 110,439 | | | | 133,008 | |
Peninsula Energy, Ltd. (a) | | | 454,116 | | | | 8,473 | |
Perpetual, Ltd. | | | 18,730 | | | | 809,489 | |
Perseus Mining, Ltd. (a) | | | 160,823 | | | | 35,558 | |
See accompanying notes to financial statements.
MSF-5
Metropolitan Series Fund
Met/Dimensional International Small Company Portfolio
Schedule of Investments as of December 31, 2013
Common Stocks—(Continued)
| | | | | | | | |
| Security Description | | Shares | | | Value | |
| | |
Australia—(Continued) | | | | | | | | |
Pharmaxis, Ltd. (a) (d) | | | 132,843 | | | $ | 12,462 | |
Phosphagenics, Ltd. (a) | | | 345,965 | | | | 35,539 | |
Platinum Australia, Ltd. (a) (c) | | | 116,796 | | | | 1,047 | |
Pluton Resources, Ltd. (a) | | | 48,332 | | | | 7,347 | |
PMP, Ltd. (a) | | | 158,703 | | | | 57,339 | |
Premier Investments, Ltd. | | | 44,992 | | | | 329,736 | |
Primary Health Care, Ltd. (d) | | | 239,765 | | | | 1,060,009 | |
Prime Media Group, Ltd. | | | 32,717 | | | | 30,679 | |
Programmed Maintenance Services, Ltd. | | | 67,178 | | | | 209,971 | |
Quickstep Holdings, Ltd. (a) | | | 31,204 | | | | 6,132 | |
Ramelius Resources, Ltd. (a) | | | 155,944 | | | | 13,574 | |
RCG Corp., Ltd. (d) | | | 51,116 | | | | 34,095 | |
RCR Tomlinson, Ltd. | | | 68,177 | | | | 223,508 | |
REA Group, Ltd. | | | 15,908 | | | | 536,538 | |
Reckon, Ltd. | | | 46,318 | | | | 89,754 | |
Red Fork Energy, Ltd. (a) (d) | | | 237,685 | | | | 80,644 | |
Redflex Holdings, Ltd. | | | 19,984 | | | | 20,268 | |
Regional Express Holdings, Ltd. (a) | | | 9,952 | | | | 8,216 | |
Regis Resources, Ltd. | | | 164,684 | | | | 431,004 | |
Reject Shop, Ltd. (The) (d) | | | 17,811 | | | | 275,860 | |
Resolute Mining, Ltd. (a) | | | 248,330 | | | | 124,062 | |
Resource Generation, Ltd. (a) | | | 58,515 | | | | 9,387 | |
Retail Food Group, Ltd. | | | 60,352 | | | | 248,038 | |
Rex Minerals, Ltd. (a) | | | 42,465 | | | | 18,200 | |
Ridley Corp., Ltd. (a) | | | 123,003 | | | | 95,219 | |
Roc Oil Co., Ltd. (a) | | | 416,062 | | | | 182,215 | |
RungePincockMinarco, Ltd. (a) | | | 4,190 | | | | 2,628 | |
Ruralco Holdings, Ltd. | | | 5,756 | | | | 16,717 | |
SAI Global, Ltd. (d) | | | 106,126 | | | | 368,241 | |
Salmat, Ltd. | | | 45,807 | | | | 87,222 | |
Samson Oil & Gas, Ltd. (a) | | | 581,639 | | | | 11,897 | |
Sandfire Resources NL (a) (d) | | | 47,114 | | | | 271,841 | |
Santana Minerals, Ltd. (a) | | | 8,860 | | | | 831 | |
Saracen Mineral Holdings, Ltd. (a) | | | 238,931 | | | | 39,824 | |
Sedgman, Ltd. | | | 48,829 | | | | 29,662 | |
Select Harvests, Ltd. | | | 15,247 | | | | 74,905 | |
Senex Energy, Ltd. (a) | | | 409,015 | | | | 270,445 | |
Servcorp, Ltd. | | | 18,320 | | | | 65,109 | |
Service Stream, Ltd. | | | 56,942 | | | | 9,423 | |
Sigma Pharmaceuticals, Ltd. | | | 621,692 | | | | 361,837 | |
Sihayo Gold, Ltd. (a) | | | 181,026 | | | | 4,849 | |
Silex Systems, Ltd. (a) | | | 28,112 | | | | 57,723 | |
Silver Chef, Ltd. | | | 6,956 | | | | 32,497 | |
Silver Lake Resources, Ltd. (a) (d) | | | 112,092 | | | | 53,932 | |
Sims Metal Management, Ltd. (a) | | | 81,094 | | | | 788,927 | |
Sirtex Medical, Ltd. | | | 20,982 | | | | 220,469 | |
Skilled Group, Ltd. | | | 87,824 | | | | 267,686 | |
Slater & Gordon, Ltd. | | | 29,921 | | | | 129,335 | |
SMS Management & Technology, Ltd. (d) | | | 42,700 | | | | 152,183 | |
Southern Cross Electrical Engineering, Ltd. | | | 22,440 | | | | 15,226 | |
Southern Cross Media Group, Ltd. | | | 328,410 | | | | 495,815 | |
Spark Infrastructure Group | | | 248,530 | | | | 360,718 | |
Specialty Fashion Group, Ltd. | | | 57,983 | | | | 47,401 | |
St. Barbara, Ltd. (a) | | | 192,892 | | | | 45,220 | |
Starpharma Holdings, Ltd. (a) (d) | | | 81,789 | | | | 63,175 | |
Straits Resources, Ltd. (a) (d) | | | 39,613 | | | | 286 | |
Strike Energy, Ltd. (a) | | | 163,211 | | | | 13,114 | |
| | |
Australia—(Continued) | | | | | | | | |
STW Communications Group, Ltd. | | | 187,396 | | | | 251,172 | |
Sundance Energy Australia, Ltd. (a) | | | 78,828 | | | | 70,138 | |
Sundance Resources, Ltd. (a) (d) | | | 819,104 | | | | 69,483 | |
Sunland Group, Ltd. | | | 73,931 | | | | 90,808 | |
Super Retail Group, Ltd. | | | 59,825 | | | | 710,131 | |
Swick Mining Services, Ltd. | | | 56,563 | | | | 15,237 | |
TABCORP Holdings, Ltd. | | | 14,646 | | | | 47,489 | |
Tanami Gold NL (a) | | | 108,623 | | | | 2,145 | |
Tap Oil, Ltd. (a) | | | 148,197 | | | | 67,068 | |
Tassal Group, Ltd. | | | 66,700 | | | | 196,562 | |
Technology One, Ltd. | | | 85,252 | | | | 174,304 | |
Ten Network Holdings, Ltd. (a) (d) | | | 750,180 | | | | 187,701 | |
TFS Corp., Ltd. | | | 78,407 | | | | 71,307 | |
Thorn Group, Ltd. | | | 71,456 | | | | 138,540 | |
Tiger Resources, Ltd. (a) | | | 430,981 | | | | 132,799 | |
Toro Energy, Ltd. (a) | | | 75,052 | | | | 5,168 | |
Tox Free Solutions, Ltd. | | | 76,909 | | | | 239,729 | |
TPG Telecom, Ltd. | | | 129,752 | | | | 618,013 | |
Transfield Services, Ltd. | | | 248,514 | | | | 199,671 | |
Transpacific Industries Group, Ltd. (a) | | | 525,544 | | | | 549,321 | |
Treasury Group, Ltd. | | | 3,740 | | | | 29,756 | |
Troy Resources, Ltd. (a) (d) | | | 41,952 | | | | 29,393 | |
UGL, Ltd. (d) | | | 29,320 | | | | 192,115 | |
Unity Mining, Ltd. (a) | | | 173,949 | | | | 6,371 | |
UXC, Ltd. | | | 144,893 | | | | 129,699 | |
Village Roadshow, Ltd. | | | 32,709 | | | | 220,812 | |
Virgin Australia Holdings, Ltd. (a) | | | 1,314,763 | | | | 446,284 | |
Virgin Australia International Holding, Ltd. (b) (c) | | | 968,773 | | | | 1 | |
Vision Eye Institute, Ltd. (a) | | | 37,056 | | | | 23,201 | |
Vocus Communications, Ltd. | | | 24,723 | | | | 77,280 | |
Warrnambool Cheese & Butter Factory Co. Holding, Ltd. | | | 16,058 | | | | 132,881 | |
Watpac, Ltd. (a) | | | 37,999 | | | | 32,722 | |
WDS, Ltd. | | | 55,558 | | | | 42,224 | |
Webjet, Ltd. (d) | | | 22,295 | | | | 63,134 | |
Western Areas, Ltd. (d) | | | 90,581 | | | | 192,227 | |
Western Desert Resources, Ltd. (a) | | | 64,456 | | | | 42,297 | |
White Energy Co., Ltd. (a) (d) | | | 78,162 | | | | 12,932 | |
Wide Bay Australia, Ltd. | | | 9,275 | | | | 46,569 | |
Wotif.com Holdings, Ltd. | | | 57,535 | | | | 142,326 | |
| | | | | | | | |
| | | | | | | 49,911,950 | |
| | | | | | | | |
| | |
Austria—0.9% | | | | | | | | |
A-TEC Industries AG (a) (b) (c) (d) | | | 1,749 | | | | 0 | |
Agrana Beteiligungs AG (d) | | | 1,694 | | | | 200,988 | |
AMS AG | | | 5,826 | | | | 706,806 | |
Austria Technologie & Systemtechnik AG | | | 8,022 | | | | 78,906 | |
CA Immobilien Anlagen AG (a) (d) | | | 22,098 | | | | 391,852 | |
CAT Oil AG | | | 9,471 | | | | 263,176 | |
DO & Co. AG | | | 638 | | | | 32,617 | |
EVN AG (d) | | | 20,562 | | | | 326,489 | |
Flughafen Wien AG | | | 6,864 | | | | 575,993 | |
Frauenthal Holding AG | | | 270 | | | | 3,345 | |
Kapsch TrafficCom AG (d) | | | 3,069 | | | | 171,621 | |
Lenzing AG (d) | | | 5,322 | | | | 304,709 | |
See accompanying notes to financial statements.
MSF-6
Metropolitan Series Fund
Met/Dimensional International Small Company Portfolio
Schedule of Investments as of December 31, 2013
Common Stocks—(Continued)
| | | | | | | | |
| Security Description | | Shares | | | Value | |
| | |
Austria—(Continued) | | | | | | | | |
Mayr Melnhof Karton AG | | | 4,652 | | | $ | 577,902 | |
Oberbank AG | | | 174 | | | | 11,610 | |
Oesterreichische Post AG | | | 18,004 | | | | 862,697 | |
Palfinger AG | | | 7,563 | | | | 300,167 | |
POLYTEC Holding AG | | | 10,783 | | | | 100,832 | |
RHI AG (d) | | | 14,831 | | | | 460,179 | |
Rosenbauer International AG | | | 1,972 | | | | 160,778 | |
S IMMO AG (a) | | | 35,979 | | | | 261,888 | |
Schoeller-Bleckmann Oilfield Equipment AG | | | 5,616 | | | | 623,210 | |
Semperit AG Holding | | | 6,630 | | | | 329,639 | |
Strabag SE | | | 10,968 | | | | 323,612 | |
Telekom Austria AG | | | 7,113 | | | | 53,859 | |
Uniqa Insurance Group AG | | | 11,945 | | | | 152,830 | |
Wienerberger AG (d) | | | 71,414 | | | | 1,140,024 | |
Wolford AG (a) | | | 1,065 | | | | 26,702 | |
Zumtobel AG | | | 19,568 | | | | 305,631 | |
| | | | | | | | |
| | | | | | | 8,748,062 | |
| | | | | | | | |
| | |
Belgium—1.2% | | | | | | | | |
Ablynx NV (a) | | | 16,588 | | | | 159,756 | |
Ackermans & van Haaren NV (d) | | | 14,601 | | | | 1,710,748 | |
AGFA-Gevaert NV (a) (c) | | | 125,762 | | | | 304,687 | |
Arseus NV | | | 13,446 | | | | 511,298 | |
Atenor Group | | | 1,048 | | | | 49,398 | |
Banque Nationale de Belgique | | | 124 | | | | 507,190 | |
Barco NV | | | 8,211 | | | | 640,831 | |
Cie d’Entreprises CFE | | | 5,563 | | | | 495,707 | |
Cie Immobiliere de Belgique S.A. | | | 1,054 | | | | 52,188 | |
Cie Maritime Belge S.A. | | | 8,912 | | | | 277,382 | |
D’ieteren S.A. | | | 13,290 | | | | 662,290 | |
Deceuninck NV (a) (c) | | | 49,164 | | | | 115,732 | |
Econocom Group | | | 37,316 | | | | 426,186 | |
Elia System Operator S.A. | | | 16,162 | | | | 749,716 | |
Euronav NV (a) (b) | | | 11,523 | | | | 137,117 | |
EVS Broadcast Equipment S.A. | | | 8,288 | | | | 536,193 | |
Exmar NV | | | 17,359 | | | | 265,773 | |
Galapagos NV (a) | | | 16,401 | | | | 346,144 | |
Gimv NV | | | 250 | | | | 13,065 | |
Hamon & CIE S.A. (a) | | | 300 | | | | 6,224 | |
Ion Beam Applications (a) | | | 11,487 | | | | 123,389 | |
Jensen-Group NV | | | 738 | | | | 13,372 | |
Kinepolis Group NV | | | 2,580 | | | | 409,090 | |
Lotus Bakeries | | | 161 | | | | 158,113 | |
Melexis NV | | | 13,858 | | | | 441,883 | |
Mobistar S.A. | | | 1,689 | | | | 32,070 | |
NV Bekaert S.A. (d) | | | 18,666 | | | | 660,366 | |
Nyrstar (a) (c) (d) | | | 85,533 | | | | 272,941 | |
Picanol (a) | | | 1,699 | | | | 57,368 | |
RealDolmen NV (a) | | | 1,200 | | | | 32,524 | |
Recticel S.A. | | | 13,561 | | | | 105,173 | |
Rentabiliweb Group (a) | | | 440 | | | | 4,807 | |
Resilux | | | 55 | | | | 7,056 | |
RHJ International (a) | | | 2,453 | | | | 12,450 | |
Roularta Media Group NV (a) | | | 1,629 | | | | 24,146 | |
Sioen Industries NV | | | 5,558 | | | | 64,841 | |
Sipef S.A. | | | 3,850 | | | | 305,666 | |
| | |
Belgium—(Continued) | | | | | | | | |
Tessenderlo Chemie NV (c) (d) | | | 16,495 | | | | 432,071 | |
ThromboGenics NV (a) (d) | | | 18,561 | | | | 515,593 | |
Van de Velde NV | | | 5,079 | | | | 254,663 | |
Viohalco S.A. (a) | | | 45,397 | | | | 231,699 | |
| | | | | | | | |
| | | | | | | 12,126,906 | |
| | | | | | | | |
| | |
Canada—8.4% | | | | | | | | |
5N Plus, Inc. (a) (d) | | | 33,732 | | | | 75,577 | |
Aastra Technologies, Ltd. | | | 4,512 | | | | 187,743 | |
Aberdeen International, Inc. (a) | | | 9,500 | | | | 1,028 | |
Absolute Software Corp. | | | 26,054 | | | | 169,973 | |
Acadian Timber Corp. | | | 3,800 | | | | 43,822 | |
Advantage Oil & Gas, Ltd. (a) | | | 117,131 | | | | 508,330 | |
Aecon Group, Inc. | | | 40,222 | | | | 609,246 | |
AG Growth International, Inc. (d) | | | 7,238 | | | | 304,238 | |
AGF Management, Ltd. - Class B (d) | | | 66,450 | | | | 830,117 | |
AgJunction, Inc. (a) | | | 12,375 | | | | 13,281 | |
Ainsworth Lumber Co., Ltd. (a) | | | 57,353 | | | | 225,147 | |
Air Canada - Class A (a) | | | 15,459 | | | | 107,838 | |
Akita Drilling, Ltd. - Class A | | | 2,003 | | | | 29,774 | |
Alacer Gold Corp. | | | 38,050 | | | | 77,730 | |
Alamos Gold, Inc. (d) | | | 69,532 | | | | 842,435 | |
Alaris Royalty Corp. (d) | | | 6,854 | | | | 192,731 | |
Alexco Resource Corp. (a) (d) | | | 29,109 | | | | 36,720 | |
Algoma Central Corp. | | | 4,410 | | | | 68,916 | |
Algonquin Power & Utilities Corp. (d) | | | 93,226 | | | | 644,179 | |
Alliance Grain Traders, Inc. | | | 7,901 | | | | 122,578 | |
Alterra Power Corp. (a) | | | 168,776 | | | | 46,871 | |
Altius Minerals Corp. (a) (d) | | | 9,660 | | | | 111,400 | |
Altus Group, Ltd. | | | 14,488 | | | | 229,135 | |
Alvopetro Energy, Ltd. (a) | | | 52,442 | | | | 60,724 | |
Amerigo Resources, Ltd. (a) | | | 44,359 | | | | 16,704 | |
Amica Mature Lifestyles, Inc. | | | 11,291 | | | | 85,991 | |
Anderson Energy, Ltd. (a) | | | 46,999 | | | | 6,416 | |
Andrew Peller, Ltd. - Class A | | | 1,139 | | | | 14,915 | |
Antrim Energy, Inc. (a) | | | 58,587 | | | | 3,309 | |
Argonaut Gold, Inc. (a) | | | 37,825 | | | | 189,437 | |
Arsenal Energy, Inc. | | | 8,955 | | | | 42,994 | |
Asanko Gold, Inc. (a) | | | 23,027 | | | | 37,069 | |
Atrium Innovations, Inc. (a) (d) | | | 14,800 | | | | 338,564 | |
ATS Automation Tooling Systems, Inc. (a) | | | 47,088 | | | | 602,868 | |
Augusta Resource Corp. (a) (d) | | | 16,090 | | | | 22,872 | |
AuRico Gold, Inc. | | | 126,230 | | | | 463,447 | |
AutoCanada, Inc. (d) | | | 10,728 | | | | 463,458 | |
Avalon Rare Metals, Inc. (a) | | | 28,205 | | | | 15,400 | |
Avigilon Corp. (a) | | | 419 | | | | 12,129 | |
Axia NetMedia Corp. (a) | | | 32,333 | | | | 76,096 | |
B2Gold Corp. (a) | | | 148,473 | | | | 304,703 | |
Badger Daylighting, Ltd. | | | 6,254 | | | | 501,910 | |
Ballard Power Systems, Inc. (a) (d) | | | 58,407 | | | | 88,525 | |
Bankers Petroleum, Ltd. (a) (d) | | | 167,493 | | | | 689,051 | |
Bauer Performance Sports, Ltd. (a) | | | 12,635 | | | | 168,546 | |
Bellatrix Exploration, Ltd. (a) (d) | | | 79,980 | | | | 588,035 | |
Bengal Energy, Ltd. (a) | | | 9,533 | | | | 5,385 | |
Birchcliff Energy, Ltd. (a) (d) | | | 58,552 | | | | 400,728 | |
Bird Construction, Inc. (d) | | | 9,212 | | | | 112,738 | |
See accompanying notes to financial statements.
MSF-7
Metropolitan Series Fund
Met/Dimensional International Small Company Portfolio
Schedule of Investments as of December 31, 2013
Common Stocks—(Continued)
| | | | | | | | |
| Security Description | | Shares | | | Value | |
| | |
Canada—(Continued) | | | | | | | | |
Black Diamond Group, Ltd. (d) | | | 19,812 | | | $ | 559,529 | |
BlackPearl Resources, Inc. (a) (d) | | | 117,817 | | | | 251,772 | |
BMTC Group, Inc. - Class A | | | 5,387 | | | | 67,956 | |
BNK Petroleum, Inc. (a) | | | 16,642 | | | | 26,633 | |
Bonterra Energy Corp. (d) | | | 6,612 | | | | 337,058 | |
Boralex, Inc. - Class A (a) (d) | | | 13,002 | | | | 132,437 | |
Brigus Gold Corp. (a) (d) | | | 90,920 | | | | 71,897 | |
Brookfield Real Estate Services, Inc. | | | 800 | | | | 10,054 | |
Brookfield Residential Properties, Inc. (a) (d) | | | 8,385 | | | | 203,024 | |
Calfrac Well Services, Ltd. | | | 20,244 | | | | 590,787 | |
Calian Technologies, Ltd. | | | 4,196 | | | | 79,871 | |
Calvalley Petroleums, Inc. - Class A (a) | | | 19,422 | | | | 32,911 | |
Canaccord Financial, Inc. (d) | | | 54,653 | | | | 357,579 | |
Canacol Energy, Ltd. (a) | | | 32,061 | | | | 215,199 | |
Canada Bread Co., Ltd. | | | 139 | | | | 9,029 | |
Canada Lithium Corp. (a) | | | 230,227 | | | | 79,108 | |
Canadian Energy Services & Technology Corp. (d) | | | 23,479 | | | | 511,023 | |
Canadian Western Bank (d) | | | 28,887 | | | | 1,051,326 | |
Canam Group, Inc. | | | 22,324 | | | | 286,025 | |
CanElson Drilling, Inc. | | | 27,317 | | | | 172,298 | |
Canexus Corp. (d) | | | 42,160 | | | | 284,176 | |
Canfor Corp. (a) | | | 38,159 | | | | 957,702 | |
Canfor Pulp Products, Inc. (d) | | | 21,696 | | | | 209,760 | |
Cangene Corp. (a) | | | 11,169 | | | | 35,960 | |
CanWel Building Materials Group, Ltd. | | | 28,809 | | | | 79,464 | |
Canyon Services Group, Inc. | | | 31,600 | | | | 357,573 | |
Capital Power Corp. (d) | | | 43,408 | | | | 870,408 | |
Capstone Infrastructure Corp. (d) | | | 49,417 | | | | 165,615 | |
Capstone Mining Corp. (a) | | | 178,046 | | | | 502,836 | |
Carpathian Gold, Inc. (a) | | | 84,878 | | | | 7,191 | |
Cascades, Inc. | | | 46,236 | | | | 299,462 | |
Cash Store Financial Services, Inc. (The) (a) | | | 3,705 | | | | 5,755 | |
Cathedral Energy Services, Ltd. (d) | | | 19,242 | | | | 92,564 | |
CCL Industries, Inc. - Class B | | | 13,368 | | | | 996,953 | |
Celestica, Inc. (a) | | | 100,007 | | | | 1,039,397 | |
Centerra Gold, Inc. | | | 19,963 | | | | 81,186 | |
Cequence Energy, Ltd. (a) (d) | | | 86,636 | | | | 145,991 | |
Cervus Equipment Corp. | | | 1,370 | | | | 30,837 | |
Chaparral Gold Corp. (a) | | | 15,698 | | | | 4,729 | |
China Gold International Resources Corp., Ltd. (a) | | | 88,813 | | | | 225,743 | |
Chinook Energy, Inc. (a) | | | 15,717 | | | | 17,163 | |
Churchill Corp. - Class A | | | 11,157 | | | | 99,150 | |
Cineplex, Inc. (d) | | | 27,567 | | | | 1,143,424 | |
Clairvest Group, Inc. | | | 200 | | | | 4,332 | |
Clarke, Inc. | | | 1,730 | | | | 13,013 | |
Claude Resources, Inc. (a) | | | 78,467 | | | | 10,342 | |
Clearwater Seafoods, Inc. | | | 1,500 | | | | 11,607 | |
Cogeco Cable, Inc. | | | 9,471 | | | | 427,789 | |
Cogeco, Inc. | | | 2,004 | | | | 92,404 | |
Colabor Group, Inc. | | | 9,830 | | | | 43,586 | |
COM DEV International, Ltd. (a) | | | 44,065 | | | | 155,145 | |
Computer Modelling Group, Ltd. | | | 14,460 | | | | 362,232 | |
Connacher Oil and Gas, Ltd. (a) | | | 280,466 | | | | 46,205 | |
Contrans Group, Inc. - Class A | | | 15,374 | | | | 192,202 | |
Copper Mountain Mining Corp. (a) (d) | | | 57,011 | | | | 90,166 | |
Corby Spirit and Wine, Ltd. (d) | | | 11,141 | | | | 212,909 | |
| | |
Canada—(Continued) | | | | | | | | |
Corridor Resources, Inc. (a) | | | 21,385 | | | | 25,970 | |
Corus Entertainment, Inc. - B Shares (d) | | | 42,940 | | | | 1,039,696 | |
Cott Corp. | | | 56,748 | | | | 456,762 | |
Crew Energy, Inc. (a) | | | 69,029 | | | | 414,596 | |
Crocotta Energy, Inc. (a) | | | 41,143 | | | | 115,421 | |
Davis & Henderson Corp. (d) | | | 34,607 | | | | 970,527 | |
DeeThree Exploration, Ltd. (a) | | | 46,204 | | | | 416,260 | |
Delphi Energy Corp. (a) | | | 95,850 | | | | 175,052 | |
Denison Mines Corp. (a) | | | 247,548 | | | | 300,623 | |
Descartes Systems Group, Inc. (The) (a) | | | 34,536 | | | | 461,984 | |
DHX Media, Ltd. (d) | | | 35,825 | | | | 188,863 | |
DirectCash Payments, Inc. (d) | | | 5,874 | | | | 100,697 | |
Dominion Diamond Corp. (a) | | | 43,482 | | | | 623,264 | |
Dorel Industries, Inc. - Class B | | | 13,456 | | | | 512,525 | |
DragonWave, Inc. (a) | | | 18,544 | | | | 25,662 | |
Duluth Metals, Ltd. (a) | | | 31,662 | | | | 23,249 | |
Dundee Precious Metals, Inc. (a) | | | 59,580 | | | | 172,192 | |
Dynasty Metals & Mining, Inc. (a) | | | 8,618 | | | | 7,221 | |
E-L Financial Corp., Ltd. | | | 151 | | | | 100,927 | |
Eastern Platinum, Ltd. (a) | | | 420,034 | | | | 29,656 | |
easyhome, Ltd. | | | 2,000 | | | | 32,572 | |
Eco Oro Minerals Corp. (a) | | | 16,900 | | | | 7,637 | |
EcoSynthetix, Inc. (a) | | | 800 | | | | 2,071 | |
EGI Financial Holdings, Inc. | | | 900 | | | | 11,641 | |
Enbridge Income Fund Holdings, Inc. (d) | | | 25,948 | | | | 577,708 | |
Endeavour Mining Corp. (a) | | | 114,590 | | | | 51,780 | |
Endeavour Silver Corp. (a) | | | 38,900 | | | | 140,622 | |
Enerflex, Ltd. | | | 10,930 | | | | 154,342 | |
Energy Fuels, Inc. (a) (d) | | | 4,125 | | | | 23,649 | |
Enghouse Systems, Ltd. | | | 8,877 | | | | 274,938 | |
Entree Gold, Inc. (a) | | | 15,350 | | | | 4,480 | |
Epsilon Energy, Ltd. (a) | | | 27,905 | | | | 88,792 | |
Equal Energy, Ltd. | | | 10,687 | | | | 56,944 | |
Equitable Group, Inc. | | | 5,801 | | | | 277,203 | |
Equity Financial Holdings, Inc. (a) | | | 1,100 | | | | 12,789 | |
Essential Energy Services Trust (a) (d) | | | 68,226 | | | | 187,545 | |
Evertz Technologies, Ltd. | | | 14,549 | | | | 210,651 | |
Excellon Resources, Inc. (a) | | | 21,284 | | | | 21,840 | |
Exchange Income Corp. (d) | | | 9,565 | | | | 203,501 | |
Exco Technologies, Ltd. | | | 13,332 | | | | 105,426 | |
Exeter Resource Corp. (a) | | | 11,335 | | | | 6,189 | |
EXFO, Inc. (a) (d) | | | 15,843 | | | | 75,468 | |
Extendicare Inc. (d) | | | 45,167 | | | | 289,987 | |
Fiera Capital Corp. | | | 1,403 | | | | 18,742 | |
Firm Capital Mortgage Investment Corp. | | | 2,307 | | | | 26,496 | |
First Majestic Silver Corp. (a) | | | 40,360 | | | | 396,286 | |
First National Financial Corp. | | | 5,807 | | | | 123,547 | |
FirstService Corp. (d) | | | 12,580 | | | | 541,807 | |
Forsys Metals Corp. (a) | | | 25,356 | | | | 10,025 | |
Fortress Paper, Ltd. - Class A (a) (d) | | | 7,338 | | | | 29,152 | |
Fortuna Silver Mines, Inc. (a) (d) | | | 78,401 | | | | 225,110 | |
Fortune Minerals, Ltd. (a) | | | 11,100 | | | | 2,821 | |
Gamehost, Inc. | | | 7,859 | | | | 110,163 | |
Gasfrac Energy Services, Inc. (a) | | | 6,993 | | | | 11,850 | |
Genesis Land Development Corp. (a) | | | 17,608 | | | | 56,525 | |
Genivar, Inc. (d) | | | 18,898 | | | | 561,114 | |
Glacier Media, Inc. | | | 9,600 | | | | 12,201 | |
See accompanying notes to financial statements.
MSF-8
Metropolitan Series Fund
Met/Dimensional International Small Company Portfolio
Schedule of Investments as of December 31, 2013
Common Stocks—(Continued)
| | | | | | | | |
| Security Description | | Shares | | | Value | |
| | |
Canada—(Continued) | | | | | | | | |
Glentel, Inc. (d) | | | 7,499 | | | $ | 100,246 | |
GLG Life Tech Corp. (a) | | | 3,198 | | | | 1,505 | |
Gluskin Sheff + Associates, Inc. | | | 10,833 | | | | 262,093 | |
GLV, Inc. - Class A (a) | | | 12,735 | | | | 52,870 | |
GMP Capital, Inc. | | | 40,036 | | | | 264,582 | |
Golden Star Resources, Ltd. (a) (d) | | | 142,170 | | | | 66,919 | |
Gran Tierra Energy, Inc. (a) | | | 157,209 | | | | 1,146,971 | |
Great Canadian Gaming Corp. (a) | | | 32,000 | | | | 441,026 | |
Great Panther Silver, Ltd. (a) | | | 67,206 | | | | 48,716 | |
Guyana Goldfields, Inc. (a) (d) | | | 41,155 | | | | 63,539 | |
Hanfeng Evergreen, Inc. (a) | | | 12,100 | | | | 4,556 | |
Heroux-Devtek, Inc. (a) | | | 15,800 | | | | 164,210 | |
High Liner Foods, Inc. | | | 2,800 | | | | 126,102 | |
HNZ Group, Inc. (d) | | | 5,368 | | | | 108,699 | |
Home Capital Group, Inc. | | | 13,384 | | | | 1,019,691 | |
Horizon North Logistics, Inc. (d) | | | 56,814 | | | | 532,172 | |
HudBay Minerals, Inc. | | | 106,334 | | | | 874,897 | |
Imax Corp. (a) | | | 20,939 | | | | 615,837 | |
Imperial Metals Corp. (a) | | | 23,826 | | | | 358,652 | |
Imris, Inc. (a) | | | 14,626 | | | | 22,856 | |
Indigo Books & Music, Inc. | | | 1,986 | | | | 15,593 | |
Innergex Renewable Energy, Inc. (d) | | | 40,252 | | | | 401,667 | |
International Forest Products, Ltd. - Class A (a) | | | 35,592 | | | | 450,324 | |
International Tower Hill Mines, Ltd. (a) | | | 21,604 | | | | 8,440 | |
Intertape Polymer Group, Inc. | | | 30,446 | | | | 402,125 | |
Ithaca Energy, Inc. (a) | | | 146,116 | | | | 367,267 | |
Ivanhoe Energy, Inc. (a) (d) | | | 44,568 | | | | 26,852 | |
Ivernia, Inc. (a) | | | 71,989 | | | | 9,488 | |
Jaguar Mining, Inc. (a) (d) | | | 44,308 | | | | 1,668 | |
Just Energy Group, Inc. (d) | | | 71,905 | | | | 514,453 | |
K-Bro Linen, Inc. | | | 4,038 | | | | 150,534 | |
Katanga Mining, Ltd. (a) | | | 26,500 | | | | 11,351 | |
Kelt Exploration, Ltd. (a) | | | 16,500 | | | | 146,011 | |
Killam Properties, Inc. (d) | | | 31,951 | | | | 315,224 | |
Kingsway Financial Services, Inc. (a) | | | 8,765 | | | | 34,243 | |
Kirkland Lake Gold, Inc. (a) (d) | | | 26,382 | | | | 63,828 | |
Lake Shore Gold Corp. (a) | | | 187,975 | | | | 85,825 | |
Laramide Resources, Ltd. (a) | | | 6,531 | | | | 2,490 | |
Laurentian Bank of Canada | | | 21,718 | | | | 959,293 | |
Le Chateau, Inc. - Class A (a) | | | 2,899 | | | | 9,170 | |
Legacy Oil + Gas, Inc. (a) | | | 78,837 | | | | 454,950 | |
Leisureworld Senior Care Corp. (d) | | | 19,276 | | | | 207,232 | |
Leon’s Furniture, Ltd. | | | 13,469 | | | | 177,896 | |
Lightstream Resources, Ltd. (d) | | | 108,373 | | | | 599,890 | |
Linamar Corp. | | | 27,000 | | | | 1,123,210 | |
Liquor Stores N.A., Ltd. | | | 13,560 | | | | 179,609 | |
Long Run Exploration, Ltd. (a) | | | 56,849 | | | | 287,389 | |
Lucara Diamond Corp. (a) | | | 53,900 | | | | 87,783 | |
Mainstreet Equity Corp. (a) | | | 3,700 | | | | 127,066 | |
Major Drilling Group International, Inc. (d) | | | 54,870 | | | | 397,223 | |
Manitoba Telecom Services, Inc. (d) | | | 12,054 | | | | 336,911 | |
Maple Leaf Foods, Inc. (d) | | | 55,470 | | | | 876,763 | |
Martinrea International, Inc. (d) | | | 53,037 | | | | 389,446 | |
Maxim Power Corp. (a) | | | 2,800 | | | | 8,409 | |
MBAC Fertilizer Corp. (a) (d) | | | 37,132 | | | | 54,182 | |
McCoy Corp. | | | 6,943 | | | | 44,642 | |
| | |
Canada—(Continued) | | | | | | | | |
McEwen Mining - Minera Andes Andes Acquisition Corp. (a) (d) | | | 29,122 | | | | 55,653 | |
Mediagrif Interactive Technologies, Inc. | | | 4,916 | | | | 87,005 | |
Medical Facilities Corp. (d) | | | 9,958 | | | | 168,177 | |
MEGA Brands, Inc. (a) (d) | | | 8,058 | | | | 115,380 | |
Mega Uranium, Ltd. (a) | | | 53,800 | | | | 4,558 | |
Melcor Developments, Ltd. | | | 2,181 | | | | 41,166 | |
Mercator Minerals, Ltd. (a) | | | 15,910 | | | | 1,423 | |
MGM Energy Corp. (a) | | | 6,492 | | | | 978 | |
Migao Corp. (a) (d) | | | 20,785 | | | | 19,958 | |
Minco Silver Corp. (a) | | | 10,913 | | | | 7,191 | |
Mood Media Corp. (a) | | | 57,391 | | | | 44,843 | |
Morneau Shepell, Inc. (d) | | | 27,362 | | | | 397,197 | |
MTY Food Group, Inc. | | | 1,365 | | | | 44,050 | |
Mullen Group, Ltd. (d) | | | 49,781 | | | | 1,330,461 | |
Nautilus Minerals, Inc. (a) | | | 52,914 | | | | 11,955 | |
Nevada Copper Corp. (a) | | | 10,550 | | | | 13,408 | |
Nevsun Resources, Ltd. (d) | | | 116,926 | | | | 388,561 | |
New Flyer Industries, Inc. (d) | | | 9,332 | | | | 93,034 | |
Newalta Corp. (d) | | | 23,114 | | | | 379,050 | |
NGEx Resources, Inc. (a) | | | 4,800 | | | | 6,462 | |
Niko Resources, Ltd. (a) (d) | | | 15,963 | | | | 38,170 | |
Norbord, Inc. (d) | | | 13,816 | | | | 440,395 | |
Nordion, Inc. (a) | | | 51,425 | | | | 436,671 | |
North American Energy Partners, Inc. (a) | | | 14,743 | | | | 86,050 | |
North American Palladium, Ltd. (a) (d) | | | 108,692 | | | | 73,672 | |
North West Co., Inc. (The) | | | 23,848 | | | | 577,875 | |
Northern Dynasty Minerals, Ltd. (a) (d) | | | 27,464 | | | | 36,196 | |
Northland Power, Inc. | | | 3,214 | | | | 46,837 | |
NuVista Energy, Ltd. (a) | | | 49,017 | | | | 329,472 | |
OceanaGold Corp. (a) | | | 150,911 | | | | 232,990 | |
Orvana Minerals Corp. (a) | | | 35,962 | | | | 18,281 | |
Paladin Labs, Inc. (a) | | | 4,998 | | | | 557,414 | |
Parex Resources, Inc. (a) | | | 55,359 | | | | 342,916 | |
Parkland Fuel Corp. (d) | | | 37,163 | | | | 646,176 | |
Pason Systems, Inc. (d) | | | 35,716 | | | | 772,656 | |
Patheon, Inc. (a) | | | 10,068 | | | | 92,979 | |
Perpetual Energy, Inc. (a) | | | 50,316 | | | | 52,578 | |
Petaquilla Minerals, Ltd. (a) | | | 51,667 | | | | 11,917 | |
Petrobank Energy & Resources, Ltd. (a) (d) | | | 52,473 | | | | 17,289 | |
Phoscan Chemical Corp. (a) | | | 51,767 | | | | 15,107 | |
PHX Energy Services Corp. | | | 14,550 | | | | 171,765 | |
Pilot Gold, Inc. (a) | | | 11,266 | | | | 9,121 | |
Platino Energy Corp. (a) | | | 4,848 | | | | 2,328 | |
Platinum Group Metals, Ltd. (a) (d) | | | 32,084 | | | | 38,359 | |
Points International, Ltd. (a) | | | 6,320 | | | | 160,581 | |
Polymet Mining Corp. (a) (d) | | | 38,355 | | | | 34,663 | |
Poseidon Concepts Corp. (a) | | | 17,540 | | | | 54 | |
Premium Brands Holdings Corp. | | | 11,279 | | | | 240,711 | |
Primero Mining Corp. (a) (d) | | | 54,342 | | | | 239,417 | |
Pulse Seismic, Inc. | | | 35,720 | | | | 161,072 | |
Pure Technologies, Ltd. (a) | | | 12,806 | | | | 80,049 | |
QLT, Inc. (a) | | | 25,500 | | | | 143,554 | |
Questerre Energy Corp. - Class A (a) (d) | | | 83,569 | | | | 103,060 | |
Ram Power Corp. (a) | | | 71,058 | | | | 5,686 | |
Redknee Solutions, Inc. (a) (d) | | | 18,190 | | | | 109,936 | |
Reitmans Canada, Ltd. | | | 36,366 | | | | 232,609 | |
See accompanying notes to financial statements.
MSF-9
Metropolitan Series Fund
Met/Dimensional International Small Company Portfolio
Schedule of Investments as of December 31, 2013
Common Stocks—(Continued)
| | | | | | | | |
| Security Description | | Shares | | | Value | |
| | |
Canada—(Continued) | | | | | | | | |
Richelieu Hardware, Ltd. | | | 6,930 | | | $ | 285,877 | |
Richmont Mines, Inc. (a) | | | 12,038 | | | | 12,126 | |
Ritchie Bros Auctioneers, Inc. (d) | | | 47,401 | | | | 1,087,021 | |
RMP Energy, Inc. (a) | | | 72,808 | | | | 385,202 | |
Rock Energy, Inc. (a) | | | 6,887 | | | | 22,433 | |
Rocky Mountain Dealerships, Inc. | | | 9,738 | | | | 117,250 | |
Rogers Sugar, Inc. (d) | | | 52,425 | | | | 266,012 | |
RONA, Inc. | | | 75,889 | | | | 943,746 | |
Rubicon Minerals Corp. (a) (d) | | | 49,480 | | | | 45,649 | |
Russel Metals, Inc. (d) | | | 34,722 | | | | 1,026,052 | |
Sabina Gold & Silver Corp. (a) (d) | | | 45,006 | | | | 30,929 | |
San Gold Corp. (a) | | | 84,387 | | | | 8,739 | |
Sandstorm Gold, Ltd. (a) | | | 21,500 | | | | 92,902 | |
Sandvine Corp. (a) (d) | | | 90,000 | | | | 250,788 | |
Santonia Energy, Inc. (a) | | | 62,059 | | | | 71,859 | |
Savanna Energy Services Corp. (d) | | | 55,506 | | | | 444,153 | |
Scorpio Mining Corp. (a) | | | 88,421 | | | | 18,729 | |
Sears Canada, Inc. | | | 4,468 | | | | 54,680 | |
Secure Energy Services, Inc. (d) | | | 55,376 | | | | 921,152 | |
SEMAFO, Inc. (d) | | | 123,983 | | | | 325,641 | |
Serinus Energy, Inc. (a) | | | 1,398 | | | | 5,238 | |
ShawCor, Ltd. | | | 13,091 | | | | 523,517 | |
Sherritt International Corp. (d) | | | 184,210 | | | | 641,635 | |
Shore Gold, Inc. (a) | | | 82,170 | | | | 10,056 | |
Sierra Wireless, Inc. (a) (d) | | | 19,913 | | | | 481,566 | |
Silver Standard Resources, Inc. (a) | | | 37,551 | | | | 260,533 | |
Sonde Resources Corp. (a) | | | 18,161 | | | | 12,481 | |
Southern Pacific Resource Corp. (a) | | | 198,574 | | | | 34,583 | |
SouthGobi Resources, Ltd. (a) | | | 65,809 | | | | 52,040 | |
Sprott Resource Corp. (d) | | | 60,105 | | | | 131,272 | |
Sprott, Inc. | | | 56,427 | | | | 139,175 | |
Spyglass Resources Corp. (d) | | | 50,541 | | | | 86,594 | |
St Andrew Goldfields, Ltd. (a) | | | 87,850 | | | | 23,157 | |
Stantec, Inc. (d) | | | 20,624 | | | | 1,278,697 | |
Stella-Jones, Inc. | | | 14,032 | | | | 359,964 | |
Stornoway Diamond Corp. (a) (d) | | | 33,687 | | | | 24,736 | |
Strad Energy Services, Ltd. | | | 10,641 | | | | 37,565 | |
Strateco Resources, Inc. (a) | | | 26,150 | | | | 1,600 | |
Student Transportation, Inc. (d) | | | 33,613 | | | | 208,212 | |
Sulliden Gold Corp., Ltd. (a) | | | 68,700 | | | | 46,565 | |
SunOpta, Inc. (a) | | | 35,292 | | | | 352,837 | |
Superior Plus Corp. (d) | | | 67,466 | | | | 784,378 | |
Surge Energy, Inc. (d) | | | 52,044 | | | | 330,710 | |
TAG Oil, Ltd. (a) (d) | | | 22,471 | | | | 69,597 | |
Taseko Mines, Ltd. (a) | | | 131,286 | | | | 279,319 | |
Tekmira Pharmaceuticals Corp. (a) | | | 1,900 | | | | 15,114 | |
Tembec, Inc. (a) (d) | | | 50,711 | | | | 138,444 | |
Teranga Gold Corp. (a) (d) | | | 91,593 | | | | 45,614 | |
Tethys Petroleum, Ltd. (a) | | | 99,200 | | | | 42,024 | |
Thompson Creek Metals Co., Inc. (a) (d) | | | 119,418 | | | | 260,814 | |
Timminco, Ltd. (a) (c) | | | 16,700 | | | | 35 | |
Timmins Gold Corp. (a) | | | 87,398 | | | | 92,972 | |
TORC Oil & Gas, Ltd. | | | 7,367 | | | | 73,237 | |
Toromont Industries, Ltd. | | | 28,436 | | | | 713,410 | |
Torstar Corp. - Class B | | | 37,353 | | | | 205,710 | |
Total Energy Services, Inc. (d) | | | 18,098 | | | | 351,312 | |
Transcontinental, Inc. - Class A (d) | | | 37,360 | | | | 514,195 | |
| | |
Canada—(Continued) | | | | | | | | |
TransForce, Inc. (d) | | | 40,293 | | | | 958,156 | |
TransGlobe Energy Corp. (a) | | | 36,372 | | | | 304,056 | |
Transition Therapeutics, Inc. (a) | | | 800 | | | | 4,541 | |
Trican Well Service, Ltd. (d) | | | 88,161 | | | | 1,077,270 | |
Trinidad Drilling, Ltd. | | | 72,358 | | | | 670,959 | |
TSO3, Inc. (a) | | | 17,113 | | | | 11,438 | |
Twin Butte Energy, Ltd. | | | 153,792 | | | | 327,202 | |
Uex Corp. (a) | | | 89,800 | | | | 33,392 | |
Uni-Select, Inc. | | | 8,978 | | | | 242,822 | |
Ur-Energy, Inc. (a) | | | 19,846 | | | | 26,904 | |
Valener, Inc. | | | 7,586 | | | | 108,764 | |
Vecima Networks, Inc. | | | 2,500 | | | | 12,121 | |
Veresen, Inc. (d) | | | 19,607 | | | | 263,396 | |
Veris Gold Corp. (a) | | | 18,003 | | | | 5,339 | |
Vicwest, Inc. | | | 10,300 | | | | 127,023 | |
Virginia Mines, Inc. (a) (d) | | | 8,108 | | | | 87,396 | |
Wajax Corp. (d) | | | 11,027 | | | | 378,691 | |
WaterFurnace Renewable Energy, Inc. | | | 4,069 | | | | 91,895 | |
Wesdome Gold Mines, Ltd. (a) | | | 38,107 | | | | 20,807 | |
West Fraser Timber Co., Ltd. | | | 2,983 | | | | 290,928 | |
Western Energy Services Corp. (d) | | | 13,520 | | | | 94,185 | |
Western Forest Products, Inc. (d) | | | 100,600 | | | | 181,833 | |
Westshore Terminals Investment Corp. | | | 2,200 | | | | 71,680 | |
Whistler Blackcomb Holdings, Inc. | | | 9,267 | | | | 145,079 | |
Whitecap Resources, Inc. (d) | | | 72,761 | | | | 865,803 | |
Wi-Lan, Inc. (d) | | | 82,419 | | | | 275,441 | |
Winpak, Ltd. | | | 6,902 | | | | 145,934 | |
Xtreme Drilling and Coil Services Corp. (a) | | | 11,600 | | | | 39,531 | |
Zargon Oil & Gas, Ltd. (d) | | | 13,621 | | | | 108,096 | |
ZCL Composites, Inc. (d) | | | 11,681 | | | | 79,724 | |
Zenith Epigenetics Corp. (a) (c) | | | 12,830 | | | | 5,194 | |
| | | | | | | | |
| | | | | | | 83,725,221 | |
| | | | | | | | |
|
China—0.0% | |
China WindPower Group, Ltd. (a) | | | 560,000 | | | | 45,071 | |
| | | | | | | | |
|
Denmark—1.9% | |
ALK-Abello A/S | | | 3,402 | | | | 385,570 | |
Alm Brand A/S (a) | | | 47,930 | | | | 213,087 | |
Ambu A/S | | | 2,661 | | | | 145,206 | |
Auriga Industries (a) | | | 9,580 | | | | 328,388 | |
Bakkafrost P/F | | | 8,908 | | | | 140,074 | |
Bang & Olufsen A/S (a) (d) | | | 17,941 | | | | 151,590 | |
Bavarian Nordic A/S (a) | | | 14,671 | | | | 240,817 | |
BoConcept Holding A/S - Class B (a) | | | 228 | | | | 4,101 | |
Brodrene Hartmann A/S | | | 52 | | | | 1,597 | |
D/S Norden A/S | | | 13,959 | | | | 735,732 | |
DFDS A/S | | | 2,274 | | | | 183,824 | |
East Asiatic Co., Ltd. A/S (a) | | | 6,828 | | | | 100,232 | |
Genmab A/S (a) | | | 21,485 | | | | 844,420 | |
GN Store Nord A/S | | | 144,283 | | | | 3,556,309 | |
Greentech Energy Systems A/S (a) | | | 1,142 | | | | 2,464 | |
Gronlandsbanken AB | | | 17 | | | | 2,074 | |
Harboes Bryggeri A/S - Class B | | | 1,454 | | | | 23,063 | |
IC Companys A/S | | | 5,141 | | | | 148,760 | |
Jeudan A/S | | | 201 | | | | 23,004 | |
See accompanying notes to financial statements.
MSF-10
Metropolitan Series Fund
Met/Dimensional International Small Company Portfolio
Schedule of Investments as of December 31, 2013
Common Stocks—(Continued)
| | | | | | | | |
| Security Description | | Shares | | | Value | |
| | |
Denmark—(Continued) | | | | | | | | |
Jyske Bank A/S (a) | | | 28,997 | | | $ | 1,565,592 | |
NKT Holding A/S | | | 13,143 | | | | 649,655 | |
Nordjyske Bank A/S | | | 185 | | | | 3,718 | |
Parken Sport & Entertainment A/S (a) | | | 2,351 | | | | 33,318 | |
PER Aarsleff A/S - Class B | | | 962 | | | | 156,157 | |
Ringkjoebing Landbobank A/S | | | 2,249 | | | | 455,896 | |
Rockwool International A/S - B Shares | | | 3,675 | | | | 650,726 | |
Royal UNIBREW A/S | | | 4,703 | | | | 638,636 | |
Schouw & Co. | | | 8,773 | | | | 359,855 | |
SimCorp A/S | | | 22,290 | | | | 880,321 | |
Solar A/S - B Shares | | | 3,176 | | | | 197,677 | |
Spar Nord Bank A/S (a) | | | 32,428 | | | | 295,020 | |
Sydbank A/S (a) | | | 44,611 | | | | 1,187,738 | |
TK Development A/S (a) | | | 41,237 | | | | 48,737 | |
Topdanmark A/S (a) | | | 69,020 | | | | 1,820,792 | |
TopoTarget A/S (a) | | | 49,340 | | | | 27,128 | |
Torm A/S (a) | | | 9,596 | | | | 2,401 | |
United International Enterprises | | | 1,276 | | | | 263,458 | |
Vestas Wind Systems A/S (a) | | | 91,348 | | | | 2,737,295 | |
Vestjysk Bank A/S (a) | | | 3,300 | | | | 5,476 | |
Zealand Pharma A/S (a) (d) | | | 4,907 | | | | 53,415 | |
| | | | | | | | |
| | | | | | | 19,263,323 | |
| | | | | | | | |
|
Finland—2.5% | |
Afarak Group Oyj (a) | | | 95,130 | | | | 41,848 | |
Ahlstrom Oyj (d) | | | 11,406 | | | | 130,242 | |
Aktia Bank Oyj | | | 3,139 | | | | 35,074 | |
Alma Media Oyj | | | 32,099 | | | | 132,096 | |
Amer Sports Oyj | | | 63,555 | | | | 1,326,759 | |
Apetit Oyj | | | 1,205 | | | | 32,336 | |
Aspo Oyj | | | 11,042 | | | | 91,717 | |
Atria plc | | | 5,250 | | | | 55,829 | |
BasWare Oyj | | | 3,525 | | | | 121,475 | |
Biotie Therapies Oyj (a) | | | 118,993 | | | | 45,835 | |
Cargotec Oyj - B Shares (d) | | | 19,031 | | | | 709,711 | |
Caverion Corp. (a) | | | 58,474 | | | | 719,356 | |
Citycon Oyj | | | 163,905 | | | | 578,211 | |
Comptel Oyj (a) | | | 30,187 | | | | 19,937 | |
Cramo Oyj | | | 9,503 | | | | 201,324 | |
Elektrobit Oyj | | | 43,163 | | | | 159,573 | |
Elisa Oyj (d) | | | 64,534 | | | | 1,711,447 | |
F-Secure Oyj | | | 54,590 | | | | 140,475 | |
Finnair Oyj | | | 47,520 | | | | 181,028 | |
Finnlines Oyj (a) | | | 9,624 | | | | 99,261 | |
Fiskars Oyj Abp | | | 21,766 | | | | 585,842 | |
HKScan Oyj - A Shares | | | 13,925 | | | | 72,167 | |
Huhtamaki Oyj | | | 51,530 | | | | 1,324,333 | |
Ilkka-Yhtyma Oyj | | | 2,976 | | | | 11,834 | |
Kemira Oyj (d) | | | 57,407 | | | | 962,683 | |
Kesko Oyj - A Shares | | | 139 | | | | 5,128 | |
Kesko Oyj - B Shares (d) | | | 35,959 | | | | 1,326,308 | |
Konecranes Oyj (d) | | | 26,787 | | | | 953,868 | |
Lassila & Tikanoja Oyj | | | 17,709 | | | | 372,074 | |
Lemminkainen Oyj | | | 4,314 | | | | 90,104 | |
Metsa Board Oyj (d) | | | 135,387 | | | | 587,028 | |
Munksjo Oyj (a) (d) | | | 5,874 | | | | 43,553 | |
|
Finland—(Continued) | |
Neste Oil Oyj (d) | | | 76,825 | | | | 1,527,855 | |
Okmetic Oyj | | | 6,360 | | | | 42,309 | |
Olvi Oyj - A Shares | | | 8,023 | | | | 316,259 | |
Oriola-KD Oyj - B Shares | | | 67,230 | | | | 235,948 | |
Orion Oyj - Class A | | | 19,816 | | | | 556,244 | |
Orion Oyj - Class B (d) | | | 43,350 | | | | 1,220,493 | |
Outokumpu Oyj (a) (d) | | | 511,386 | | | | 289,000 | |
Outotec Oyj (d) | | | 95,223 | | | | 1,000,711 | |
PKC Group Oyj | | | 12,102 | | | | 404,131 | |
Ponsse Oy | | | 3,208 | | | | 43,332 | |
Poyry Oyj (a) | | | 21,383 | | | | 119,903 | |
Raisio plc - V Shares | | | 73,120 | | | | 440,233 | |
Ramirent Oyj | | | 63,927 | | | | 806,240 | |
Rapala VMC Oyj | | | 8,902 | | | | 63,679 | |
Rautaruukki Oyj (d) | | | 58,187 | | | | 541,272 | |
Saga Furs Oyj | | | 836 | | | | 37,215 | |
Sanoma Oyj (d) | | | 49,815 | | | | 438,387 | |
Sievi Capital plc (a) | | | 10,528 | | | | 15,973 | |
SRV Group plc | | | 30 | | | | 167 | |
Stockmann Oyj Abp - B Shares (d) | | | 16,769 | | | | 254,665 | |
Talvivaara Mining Co. plc (a) | | | 286,881 | | | | 30,249 | |
Technopolis plc (d) | | | 45,493 | | | | 272,409 | |
Teleste Oyj | | | 772 | | | | 4,514 | |
Tieto Oyj | | | 35,284 | | | | 798,228 | |
Tikkurila Oyj | | | 22,439 | | | | 614,526 | |
Uponor Oyj (d) | | | 31,280 | | | | 611,910 | |
Vacon plc (d) | | | 5,175 | | | | 416,533 | |
Vaisala Oyj - A Shares | | | 4,116 | | | | 131,541 | |
YIT Oyj (d) | | | 63,300 | | | | 886,658 | |
| | | | | | | | |
| | | | | | | 24,989,040 | |
| | | | | | | | |
|
France—4.7% | |
ABC Arbitrage | | | 4,710 | | | | 30,588 | |
Air France-KLM (a) (d) | | | 88,070 | | | | 923,835 | |
Akka Technologies S.A. | | | 930 | | | | 29,897 | |
ALBIOMA | | | 12,430 | | | | 288,635 | |
Alcatel-Lucent (a) | | | 1,443,534 | | | | 6,475,769 | |
Altamir Amboise | | | 14,407 | | | | 204,630 | |
Alten S.A. | | | 14,440 | | | | 656,564 | |
Altran Technologies S.A. (a) | | | 70,704 | | | | 620,745 | |
April | | | 10,645 | | | | 215,015 | |
Archos (a) | | | 5,288 | | | | 25,579 | |
Assystem | | | 8,352 | | | | 231,232 | |
Atari S.A. (a) (b) (c) | | | 11,742 | | | | 0 | |
Audika Groupe (a) | | | 2,159 | | | | 31,702 | |
Aurea S.A. | | | 1,221 | | | | 7,006 | |
Axway Software S.A. | | | 2,927 | | | | 87,989 | |
Beneteau S.A. (a) (d) | | | 24,266 | | | | 453,098 | |
Bigben Interactive (a) | | | 2,504 | | | | 28,595 | |
BioMerieux (d) | | | 428 | | | | 44,914 | |
Boiron S.A. | | | 3,511 | | | | 247,627 | |
Bonduelle S.C.A. | | | 10,633 | | | | 281,769 | |
Bongrain S.A. | | | 3,472 | | | | 268,884 | |
Bourbon S.A. (d) | | | 28,193 | | | | 776,542 | |
Boursorama (a) | | | 10,971 | | | | 123,012 | |
Bull (a) (d) | | | 40,990 | | | | 174,059 | |
See accompanying notes to financial statements.
MSF-11
Metropolitan Series Fund
Met/Dimensional International Small Company Portfolio
Schedule of Investments as of December 31, 2013
Common Stocks—(Continued)
| | | | | | | | |
| Security Description | | Shares | | | Value | |
|
France—(Continued) | |
Burelle S.A. | | | 184 | | | $ | 143,440 | |
Cegedim S.A. (a) | | | 2,929 | | | | 92,433 | |
Cegid Group | | | 3,132 | | | | 110,897 | |
Cie des Alpes | | | 3,241 | | | | 71,326 | |
Ciments Francais S.A. | | | 2,486 | | | | 189,274 | |
Club Mediterranee S.A. (a) | | | 18,244 | | | | 436,654 | |
Derichebourg S.A. (a) | | | 62,135 | | | | 207,428 | |
Devoteam S.A. | | | 4,902 | | | | 89,037 | |
DNXCorp. | | | 277 | | | | 6,611 | |
Eiffage S.A. | | | 13,644 | | | | 786,549 | |
Electricite de Strasbourg | | | 88 | | | | 12,262 | |
Eramet | | | 935 | | | | 90,459 | |
Esso S.A. Francaise | | | 1,261 | | | | 71,121 | |
Etablissements Maurel et Prom | | | 48,019 | | | | 803,058 | |
Euler Hermes S.A. | | | 4,329 | | | | 596,223 | |
Euro Disney SCA (a) | | | 11,454 | | | | 66,193 | |
Eurofins Scientific (d) | | | 2,648 | | | | 717,101 | |
Exel Industries - A Shares | | | 618 | | | | 46,391 | |
Faiveley Transport S.A. | | | 4,347 | | | | 313,969 | |
Faurecia (a) (d) | | | 31,389 | | | | 1,198,310 | |
Fimalac | | | 3,854 | | | | 245,984 | |
Fleury Michon S.A. | | | 141 | | | | 10,082 | |
GameLoft SE (a) (d) | | | 28,377 | | | | 320,203 | |
GEA | | | 400 | | | | 42,678 | |
GECI International (a) (b) (c) | | | 9,793 | | | | 0 | |
GL Events | | | 6,578 | | | | 158,017 | |
Groupe Crit | | | 1,538 | | | | 65,641 | |
Groupe Flo | | | 5,857 | | | | 24,172 | |
Groupe Steria SCA (d) | | | 17,694 | | | | 348,829 | |
Guerbet | | | 663 | | | | 99,031 | |
Haulotte Group S.A. (a) | | | 9,947 | | | | 149,880 | |
Havas S.A. | | | 149,144 | | | | 1,228,090 | |
Hi-Media S.A. (a) | | | 20,464 | | | | 52,640 | |
Ingenico (d) | | | 9,890 | | | | 792,913 | |
Interparfums S.A. | | | 4,774 | | | | 206,074 | |
Ipsen S.A. | | | 8,509 | | | | 402,584 | |
IPSOS | | | 21,840 | | | | 935,351 | |
Jacquet Metal Service | | | 9,036 | | | | 162,201 | |
Korian S.A. | | | 2,822 | | | | 80,032 | |
L.D.C. S.A. | | | 10 | | | | 1,536 | |
Lagardere SCA | | | 7,753 | | | | 288,245 | |
Lanson-BCC | | | 14 | | | | 645 | |
Laurent-Perrier | | | 1,493 | | | | 132,463 | |
Lectra | | | 9,479 | | | | 108,327 | |
LISI | | | 2,482 | | | | 368,643 | |
Maisons France Confort | | | 1,754 | | | | 69,181 | |
Manitou BF S.A. | | | 5,576 | | | | 105,888 | |
Manutan International | | | 589 | | | | 37,152 | |
Medica S.A. | | | 24,420 | | | | 637,940 | |
Mersen | | | 11,165 | | | | 387,014 | |
METabolic EXplorer S.A. (a) | | | 2,657 | | | | 12,227 | |
Metropole Television S.A. | | | 30,423 | | | | 698,261 | |
Montupet | | | 4,620 | | | | 204,420 | |
Mr. Bricolage (a) | | | 601 | | | | 8,252 | |
Naturex | | | 2,702 | | | | 216,890 | |
Neopost S.A. (d) | | | 19,254 | | | | 1,486,044 | |
Nexans S.A. | | | 15,968 | | | | 811,372 | |
Nexity S.A. | | | 16,880 | | | | 637,645 | |
|
France—(Continued) | |
NextRadioTV | | | 2,643 | | | | 77,178 | |
NicOx S.A. (a) (d) | | | 6,186 | | | | 20,462 | |
Norbert Dentressangle S.A. | | | 2,772 | | | | 357,357 | |
NRJ Group (a) | | | 13,425 | | | | 130,231 | |
Orco Property Group (a) | | | 4,469 | | | | 10,298 | |
Orpea | | | 16,527 | | | | 961,775 | |
Parrot S.A. (a) | | | 4,759 | | | | 129,629 | |
Peugeot S.A. (a) (d) | | | 149,258 | | | | 1,945,740 | |
Pierre & Vacances S.A. (a) | | | 3,103 | | | | 131,569 | |
Plastic Omnium S.A. | | | 38,571 | | | | 1,079,737 | |
Rallye S.A. | | | 13,808 | | | | 580,941 | |
Recylex S.A. (a) | | | 8,543 | | | | 43,775 | |
Robertet S.A. | | | 14 | | | | 3,464 | |
Rubis SCA | | | 20,204 | | | | 1,281,483 | |
S.A. des Ciments Vicat (d) | | | 6,569 | | | | 488,523 | |
Saft Groupe S.A. | | | 20,232 | | | | 695,911 | |
Samse S.A. | | | 107 | | | | 11,776 | |
Sartorius Stedim Biotech | | | 1,387 | | | | 232,537 | |
SEB S.A. | | | 4,929 | | | | 446,453 | |
Seche Environnement S.A. | | | 1,555 | | | | 60,085 | |
Sequana S.A. (a) (d) | | | 5,112 | | | | 40,090 | |
Soc Mar Tunnel Prado Car | | | 293 | | | | 11,773 | |
Societe d’Edition de Canal Plus | | | 35,730 | | | | 304,887 | |
Societe des Bains de Mer et du Cercle des Etrangers a Monaco | | | 16 | | | | 880 | |
Societe Internationale de Plantations d’Heveas S.A. | | | 853 | | | | 59,957 | |
Societe Television Francaise 1 | | | 71,332 | | | | 1,378,604 | |
SOITEC (a) (d) | | | 113,224 | | | | 222,621 | |
Solocal Group (a) (d) | | | 80,591 | | | | 122,171 | |
Somfy S.A. | | | 183 | | | | 46,569 | |
Sopra Group S.A. | | | 2,515 | | | | 254,361 | |
Spir Communication S.A. (a) | | | 848 | | | | 15,472 | |
Ste Industrielle d’Aviation Latecoere S.A. (a) | | | 4,144 | | | | 76,224 | |
STEF S.A. | | | 1,857 | | | | 136,345 | |
Store Electronic (a) | | | 715 | | | | 14,717 | |
Sword Group | | | 3,919 | | | | 83,568 | |
Synergie S.A. | | | 5,633 | | | | 113,096 | |
Technicolor S.A. (a) | | | 37,128 | | | | 196,832 | |
Teleperformance | | | 32,917 | | | | 2,010,981 | |
Tessi S.A. | | | 895 | | | | 111,507 | |
TFF Group | | | 308 | | | | 26,844 | |
Theolia S.A. (a) | | | 38,488 | | | | 63,498 | |
Thermador Groupe | | | 1,082 | | | | 101,204 | |
Total Gabon | | | 421 | | | | 270,001 | |
Touax S.A. | | | 1,668 | | | | 43,462 | |
Trigano S.A. (a) | | | 5,078 | | | | 110,704 | |
UBISOFT Entertainment (a) | | | 63,478 | | | | 900,060 | |
Union Financiere de France BQE S.A. | | | 2,306 | | | | 55,431 | |
Valneva SE (a) (d) | | | 10,872 | | | | 62,275 | |
Vetoquinol S.A. | | | 469 | | | | 19,810 | |
Viel et Co. | | | 3,978 | | | | 12,310 | |
Vilmorin & Cie S.A. (d) | | | 2,888 | | | | 386,269 | |
Virbac S.A. | | | 1,982 | | | | 423,773 | |
VM Materiaux S.A. (a) | | | 235 | | | | 8,049 | |
Vranken-Pommery Monopole S.A. | | | 1,317 | | | | 44,584 | |
| | | | | | | | |
| | | | | | | 46,230,822 | |
| | | | | | | | |
See accompanying notes to financial statements.
MSF-12
Metropolitan Series Fund
Met/Dimensional International Small Company Portfolio
Schedule of Investments as of December 31, 2013
Common Stocks—(Continued)
| | | | | | | | |
| Security Description | | Shares | | | Value | |
|
Germany—5.3% | |
Aareal Bank AG (a) | | | 32,420 | | | $ | 1,287,622 | |
Adler Modemaerkte AG | | | 4,862 | | | | 66,899 | |
ADVA Optical Networking SE (a) | | | 20,269 | | | | 104,291 | |
Air Berlin plc (a) (d) | | | 23,494 | | | | 53,520 | |
Aixtron SE (a) (d) | | | 47,389 | | | | 687,109 | |
Allgeier SE | | | 2,942 | | | | 63,325 | |
Amadeus Fire AG | | | 2,610 | | | | 196,402 | |
Analytik Jena AG | | | 501 | | | | 9,303 | |
AS Creation Tapeten (a) | | | 800 | | | | 39,768 | |
Aurubis AG | | | 20,108 | | | | 1,227,797 | |
Balda AG (a) (d) | | | 19,993 | | | | 134,083 | |
Bauer AG | | | 6,926 | | | | 180,817 | |
BayWa AG | | | 7,596 | | | | 396,601 | |
Bechtle AG | | | 9,570 | | | | 651,998 | |
Bertrandt AG | | | 2,980 | | | | 455,136 | |
Bijou Brigitte AG | | | 2,105 | | | | 213,424 | |
Biotest AG | | | 1,823 | | | | 196,178 | |
Borussia Dortmund GmbH & Co. KGaA | | | 36,335 | | | | 182,032 | |
CANCOM SE (d) | | | 7,824 | | | | 331,578 | |
Carl Zeiss Meditec AG | | | 9,499 | | | | 316,824 | |
Celesio AG (d) | | | 49,773 | | | | 1,575,009 | |
CENIT AG | | | 5,981 | | | | 85,630 | |
CENTROTEC Sustainable AG | | | 5,202 | | | | 133,116 | |
Cewe Color Holding AG | | | 3,145 | | | | 184,978 | |
Colonia Real Estate AG (a) | | | 5,281 | | | | 32,696 | |
Comdirect Bank AG | | | 18,315 | | | | 209,434 | |
CompuGroup Medical AG | | | 13,628 | | | | 346,900 | |
Constantin Medien AG (a) | | | 23,577 | | | | 54,754 | |
CropEnergies AG | | | 13,948 | | | | 114,992 | |
CTS Eventim AG | | | 9,997 | | | | 506,387 | |
DAB Bank AG | | | 12,773 | | | | 65,365 | |
Data Modul AG | | | 138 | | | | 3,185 | |
Delticom AG | | | 2,140 | | | | 94,328 | |
Deutsche Beteiligungs AG | | | 2,815 | | | | 80,489 | |
Deutsche Wohnen AG | | | 153,589 | | | | 2,928,906 | |
Deutz AG (a) | | | 62,092 | | | | 554,241 | |
Dialog Semiconductor plc (a) (d) | | | 27,192 | | | | 585,113 | |
Dr. Hoenle AG | | | 2,084 | | | | 34,602 | |
Draegerwerk AG & Co. KGaA | | | 1,630 | | | | 173,247 | |
Drillisch AG | | | 30,810 | | | | 892,337 | |
Duerr AG | | | 11,256 | | | | 1,003,831 | |
Eckert & Ziegler AG | | | 2,469 | | | | 97,344 | |
Elmos Semiconductor AG | | | 7,336 | | | | 108,561 | |
ElringKlinger AG (d) | | | 16,988 | | | | 691,408 | |
Euromicron AG | | | 3,803 | | | | 75,083 | |
Evotec AG (a) (d) | | | 59,728 | | | | 301,148 | |
First Sensor AG (a) | | | 3,155 | | | | 35,932 | |
Francotyp-Postalia Holding AG (a) | | | 3,300 | | | | 18,979 | |
Freenet AG (a) | | | 56,906 | | | | 1,719,064 | |
GAGFAH S.A. (a) | | | 36,892 | | | | 543,388 | |
Gerresheimer AG | | | 16,223 | | | | 1,135,203 | |
Gerry Weber International AG (d) | | | 9,842 | | | | 418,699 | |
Gesco AG | | | 2,077 | | | | 200,435 | |
GFK SE | | | 8,794 | | | | 487,330 | |
GFT Technologies AG | | | 9,142 | | | | 81,606 | |
Gildemeister AG (d) | | | 39,050 | | | | 1,246,411 | |
Grammer AG | | | 7,596 | | | | 363,326 | |
|
Germany—(Continued) | |
Grenkeleasing AG | | | 2,371 | | | | 221,799 | |
H&R AG (a) | | | 7,029 | | | | 84,171 | |
Hamburger Hafen und Logistik AG (d) | | | 8,767 | | | | 215,090 | |
Hansa Group AG (a) | | | 5,987 | | | | 11,328 | |
Hawesko Holding AG | | | 1,663 | | | | 87,611 | |
Heidelberger Druckmaschinen AG (a) (d) | | | 153,682 | | | | 544,587 | |
Homag Group AG | | | 2,798 | | | | 73,617 | |
Indus Holding AG | | | 13,812 | | | | 554,814 | |
Init Innovation In Traffic Systems AG | | | 2,361 | | | | 75,677 | |
Intershop Communications AG (a) | | | 7,747 | | | | 15,840 | |
Isra Vision AG | | | 2,083 | | | | 115,594 | |
Jenoptik AG | | | 28,871 | | | | 494,597 | |
Joyou AG (a) | | | 688 | | | | 12,066 | |
Kloeckner & Co. SE (a) (d) | | | 68,249 | | | | 936,872 | |
Koenig & Bauer AG | | | 6,051 | | | | 107,366 | |
Kontron AG | | | 32,374 | | | | 232,200 | |
Krones AG | | | 6,921 | | | | 594,531 | |
KSB AG | | | 111 | | | | 73,325 | |
KUKA AG (d) | | | 14,184 | | | | 666,634 | |
KWS Saat AG | | | 1,120 | | | | 385,659 | |
Leifheit AG | | | 945 | | | | 40,274 | |
Leoni AG | | | 22,210 | | | | 1,660,286 | |
LPKF Laser & Electronics AG | | | 12,759 | | | | 327,014 | |
Manz AG (a) | | | 1,272 | | | | 108,680 | |
MasterFlex SE (a) | | | 280 | | | | 2,696 | |
Medigene AG (a) | | | 3,423 | | | | 16,301 | |
MLP AG | | | 33,383 | | | | 239,343 | |
Mobotix AG | | | 2,035 | | | | 40,960 | |
Morphosys AG (a) | | | 10,279 | | | | 791,194 | |
Muehlbauer Holding AG & Co. KGaA | | | 1,575 | | | | 42,461 | |
MVV Energie AG (d) | | | 6,393 | | | | 196,507 | |
Nemetschek AG | | | 3,207 | | | | 223,566 | |
Nexus AG | | | 2,080 | | | | 31,328 | |
Nordex SE (a) | | | 38,948 | | | | 514,690 | |
NORMA Group | | | 17,872 | | | | 887,448 | |
OHB AG | | | 3,264 | | | | 78,893 | |
Patrizia Immobilien AG (a) | | | 23,153 | | | | 244,915 | |
Pfeiffer Vacuum Technology AG | | | 5,733 | | | | 781,228 | |
PNE Wind AG (d) | | | 33,344 | | | | 128,285 | |
Progress-Werk Oberkirch AG | | | 822 | | | | 49,637 | |
PSI AG Gesellschaft Fuer Produkte und Systeme der Informationstechnologie | | | 2,118 | | | | 39,581 | |
Pulsion Medical Systems SE (d) | | | 464 | | | | 10,783 | |
PVA TePla AG | | | 3,358 | | | | 11,750 | |
QSC AG | | | 59,062 | | | | 352,151 | |
R Stahl AG (d) | | | 1,594 | | | | 82,353 | |
Rational AG | | | 941 | | | | 313,742 | |
Rheinmetall AG | | | 24,744 | | | | 1,526,852 | |
Rhoen Klinikum AG | | | 61,526 | | | | 1,811,273 | |
RIB Software AG | | | 1,026 | | | | 10,165 | |
SAF-Holland S.A. (a) | | | 31,896 | | | | 474,159 | |
Salzgitter AG (d) | | | 23,207 | | | | 989,880 | |
Schaltbau Holding AG | | | 2,601 | | | | 164,913 | |
SGL Carbon SE (d) | | | 28,680 | | | | 1,135,623 | |
SHW AG | | | 1,051 | | | | 67,177 | |
Singulus Technologies AG (a) (d) | | | 35,179 | | | | 102,130 | |
Sixt SE | | | 9,652 | | | | 310,987 | |
SKW Stahl-Metallurgie Holding AG | | | 3,578 | | | | 61,324 | |
See accompanying notes to financial statements.
MSF-13
Metropolitan Series Fund
Met/Dimensional International Small Company Portfolio
Schedule of Investments as of December 31, 2013
Common Stocks—(Continued)
| | | | | | | | |
| Security Description | | Shares | | | Value | |
|
Germany—(Continued) | |
SMA Solar Technology AG | | | 3,340 | | | $ | 105,548 | |
SMT Scharf AG | | | 2,145 | | | | 57,669 | |
Softing AG | | | 528 | | | | 10,489 | |
Software AG (d) | | | 21,874 | | | | 766,039 | |
Solarworld AG (a) (d) | | | 52,337 | | | | 33,136 | |
Stada Arzneimittel AG | | | 33,026 | | | | 1,636,205 | |
Stroeer Media AG (a) | | | 12,029 | | | | 213,543 | |
Surteco SE | | | 140 | | | | 4,443 | |
Suss Microtec AG (a) | | | 12,728 | | | | 113,406 | |
Symrise AG | | | 17,337 | | | | 799,110 | |
TAG Immobilien AG (d) | | | 77,264 | | | | 937,245 | |
Takkt AG | | | 12,691 | | | | 235,551 | |
Technotrans | | | 2,013 | | | | 21,351 | |
Telegate AG | | | 2,507 | | | | 21,709 | |
Tipp24 SE (a) | | | 3,214 | | | | 214,953 | |
Tom Tailor Holding AG (a) | | | 11,440 | | | | 259,731 | |
Tomorrow Focus AG | | | 8,355 | | | | 49,955 | |
TUI AG (a) (d) | | | 85,669 | | | | 1,411,771 | |
Vossloh AG | | | 4,207 | | | | 420,293 | |
VTG AG | | | 6,281 | | | | 129,528 | |
Wacker Neuson SE | | | 14,840 | | | | 234,927 | |
Washtec AG | | | 3,397 | | | | 49,996 | |
Wincor Nixdorf AG | | | 16,507 | | | | 1,151,912 | |
XING AG | | | 1,747 | | | | 178,833 | |
| | | | | | | | |
| | | | | | | 52,409,434 | |
| | | | | | | | |
| | |
Greece—0.1% | | | | | | | | |
Bank of Cyprus plc (a) (c) | | | 596,049 | | | | 168,097 | |
Bank of Greece | | | 4,148 | | | | 85,491 | |
Hellenic Petroleum S.A. | | | 16,711 | | | | 174,365 | |
Marfin Investment Group Holdings S.A. (a) | | | 382,614 | | | | 201,287 | |
Proton Bank S.A. (a) (c) | | | 14,856 | | | | 3,679 | |
Titan Cement Co. S.A. (a) | | | 6,285 | | | | 171,302 | |
TT Hellenic Postbank S.A. (a) (b) (c) | | | 71,180 | | | | 0 | |
| | | | | | | | |
| | | | | | | 804,221 | |
| | | | | | | | |
| | |
Hong Kong—2.8% | | | | | | | | |
Alco Holdings, Ltd. | | | 136,000 | | | | 23,976 | |
Allan International Holdings | | | 70,000 | | | | 20,582 | |
Allied Group, Ltd. | | | 22,000 | | | | 87,668 | |
Allied Properties HK, Ltd. | | | 1,774,024 | | | | 309,484 | |
Anxian Yuan China Holdings, Ltd. (a) | | | 420,000 | | | | 13,037 | |
Apac Resources, Ltd. (a) | | | 2,300,000 | | | | 43,609 | |
APT Satellite Holdings, Ltd. | | | 158,000 | | | | 188,298 | |
Arts Optical International Holdings, Ltd. | | | 16,000 | | | | 3,611 | |
Asia Financial Holdings, Ltd. | | | 300,000 | | | | 122,255 | |
Asia Satellite Telecommunications Holdings, Ltd. | | | 66,000 | | | | 247,364 | |
Asia Standard International Group, Ltd. | | | 370,000 | | | | 91,150 | |
Associated International Hotels, Ltd. | | | 14,000 | | | | 39,359 | |
Aupu Group Holding Co., Ltd. | | | 246,000 | | | | 28,868 | |
Bel Global Resources Holdings, Ltd. (a) (b) (c) | | | 520,000 | | | | 0 | |
Birmingham International Holdings, Ltd. (a) (b) (c) | | | 1,110,000 | | | | 0 | |
Bonjour Holdings, Ltd. | | | 810,000 | | | | 176,825 | |
Bossini International Holdings | | | 438,000 | | | | 33,444 | |
Brightoil Petroleum Holdings, Ltd. (a) (d) | | | 1,156,000 | | | | 320,689 | |
| | |
Hong Kong—(Continued) | | | | | | | | |
Brockman Mining, Ltd. (a) (d) | | | 2,516,770 | | | | 168,648 | |
Burwill Holdings, Ltd. (a) | | | 1,294,000 | | | | 88,815 | |
Cafe de Coral Holdings, Ltd. | | | 144,000 | | | | 464,761 | |
Century City International Holdings, Ltd. | | | 616,000 | | | | 47,686 | |
Champion Technology Holdings, Ltd. | | | 2,394,274 | | | | 44,138 | |
Chen Hsong Holdings | | | 150,000 | | | | 46,853 | |
Cheuk Nang Holdings, Ltd. | | | 85,823 | | | | 78,153 | |
Chevalier International Holdings, Ltd. | | | 70,000 | | | | 122,299 | |
China Billion Resources, Ltd. (a) (b) (c) | | | 476,000 | | | | 0 | |
China Daye Non-Ferrous Metals Mining, Ltd. (a) (d) | | | 2,682,000 | | | | 69,133 | |
China Electronics Corp. Holdings Co., Ltd. | | | 352,000 | | | | 63,196 | |
China Energy Development Holdings, Ltd. (a) | | | 3,046,000 | | | | 30,651 | |
China Environmental Investment Holdings, Ltd. (a) | | | 1,215,000 | | | | 33,952 | |
China Financial Services Holdings, Ltd. | | | 288,000 | | | | 22,652 | |
China Flavors & Fragrances Co., Ltd. (a) | | | 70,147 | | | | 9,679 | |
China Infrastructure Investment, Ltd. (a) | | | 626,000 | | | | 14,140 | |
China Metal International Holdings, Inc. | | | 300,000 | | | | 107,943 | |
China Nuclear Industry 23 International Corp., Ltd. (a) | | | 106,000 | | | | 16,834 | |
China Renji Medical Group, Ltd. (a) | | | 2,356,000 | | | | 11,229 | |
China Solar Energy Holdings, Ltd. (a) (b) (c) | | | 162,000 | | | | 3,761 | |
China Strategic Holdings, Ltd. (a) | | | 770,000 | | | | 13,901 | |
China Ting Group Holdings, Ltd. | | | 318,550 | | | | 24,290 | |
China-Hongkong Photo Products Holdings, Ltd. | | | 284,000 | | | | 22,737 | |
Chinney Investment, Ltd. | | | 8,000 | | | | 1,238 | |
Chong Hing Bank, Ltd. (d) | | | 76,000 | | | | 340,280 | |
Chow Sang Sang Holdings International, Ltd. (d) | | | 155,000 | | | | 441,959 | |
Chu Kong Shipping Enterprise Group Co., Ltd. | | | 252,000 | | | | 67,898 | |
Chuang’s China Investments, Ltd. | | | 341,000 | | | | 22,920 | |
Chuang’s Consortium International, Ltd. | | | 546,357 | | | | 74,045 | |
CITIC Telecom International Holdings, Ltd. | | | 716,000 | | | | 231,001 | |
CK Life Sciences International Holdings, Inc. | | | 1,874,000 | | | | 174,052 | |
CNT Group, Ltd. | | | 246,000 | | | | 10,786 | |
Cosmos Machinery Enterprises, Ltd. (a) | | | 126,000 | | | | 9,254 | |
CP Lotus Corp. (a) | | | 1,750,000 | | | | 45,627 | |
Cross-Harbour Holdings, Ltd. (The) | | | 119,000 | | | | 97,317 | |
CSI Properties, Ltd. | | | 3,554,023 | | | | 151,242 | |
CST Mining Group, Ltd. (a) | | | 8,984,000 | | | | 77,610 | |
Culture Landmark Investment, Ltd. (a) | | | 86,400 | | | | 6,288 | |
Culturecom Holdings, Ltd. (a) (d) | | | 215,000 | | | | 33,024 | |
Dah Sing Banking Group, Ltd. | | | 195,600 | | | | 343,674 | |
Dah Sing Financial Holdings, Ltd. | | | 82,000 | | | | 471,832 | |
Dan Form Holdings Co., Ltd. | | | 568,000 | | | | 62,284 | |
Dickson Concepts International, Ltd. | | | 131,000 | | | | 79,756 | |
Dingyi Group Investment, Ltd. (a) (b) (c) | | | 455,000 | | | | 33,446 | |
Dorsett Hospitality International, Ltd. | | | 415,000 | | | | 86,874 | |
Eagle Nice International Holdings, Ltd. | | | 120,000 | | | | 20,012 | |
EcoGreen Fine Chemicals Group, Ltd. | | | 90,000 | | | | 19,164 | |
Emperor Capital Group, Ltd. | | | 84,000 | | | | 4,282 | |
Emperor Entertainment Hotel, Ltd. | | | 325,000 | | | | 168,116 | |
Emperor International Holdings | | | 691,250 | | | | 187,551 | |
Emperor Watch & Jewellery, Ltd. (d) | | | 2,380,000 | | | | 181,701 | |
ENM Holdings, Ltd. (a) | | | 556,000 | | | | 37,379 | |
EPI Holdings, Ltd. (a) | | | 1,842,000 | | | | 49,033 | |
See accompanying notes to financial statements.
MSF-14
Metropolitan Series Fund
Met/Dimensional International Small Company Portfolio
Schedule of Investments as of December 31, 2013
Common Stocks—(Continued)
| | | | | | | | |
| Security Description | | Shares | | | Value | |
| | |
Hong Kong—(Continued) | | | | | | | | |
Esprit Holdings, Ltd. (a) (d) | | | 1,156,450 | | | $ | 2,240,318 | |
eSun Holdings, Ltd. (a) | | | 400,000 | | | | 50,043 | |
Fairwood Holdings, Ltd. | | | 48,500 | | | | 99,381 | |
Far East Consortium International, Ltd. | | | 711,010 | | | | 267,933 | |
Fountain SET Holdings, Ltd. (a) | | | 422,000 | | | | 61,141 | |
Fujikon Industrial Holdings, Ltd. | | | 100,000 | | | | 26,449 | |
G-Resources Group, Ltd. (a) | | | 14,821,800 | | | | 359,358 | |
Genting Hong Kong, Ltd. (a) | | | 101,229 | | | | 40,651 | |
Get Nice Holdings, Ltd. | | | 2,326,000 | | | | 105,266 | |
Giordano International, Ltd. (d) | | | 798,000 | | | | 713,801 | |
Glorious Sun Enterprises, Ltd. | | | 262,000 | | | | 61,854 | |
Gold Peak Industries Holding, Ltd. | | | 277,714 | | | | 29,072 | |
Golden Resources Development International, Ltd. | | | 370,000 | | | | 20,306 | |
Goldin Financial Holdings, Ltd. (a) | | | 200,000 | | | | 80,023 | |
Goldin Properties Holdings, Ltd. (a) | | | 286,000 | | | | 120,994 | |
Good Fellow Resources Holdings, Ltd. (a) | | | 120,000 | | | | 4,824 | |
Guangnan Holdings, Ltd. | | | 264,000 | | | | 33,367 | |
Guotai Junan International Holdings, Ltd. | | | 288,000 | | | | 146,913 | |
Haitong International Securities Group, Ltd. (d) | | | 242,365 | | | | 124,368 | |
Hao Tian Development Group, Ltd. (a) | | | 1,140,000 | | | | 47,066 | |
Harbour Centre Development, Ltd. | | | 88,000 | | | | 158,664 | |
HKR International, Ltd. | | | 449,600 | | | | 211,939 | |
Hon Kwok Land Investment Co., Ltd. | | | 140,000 | | | | 48,789 | |
Hong Kong Aircraft Engineering Co., Ltd. (d) | | | 5,200 | | | | 69,108 | |
Hong Kong Ferry Holdings Co., Ltd. | | | 10,000 | | | | 10,475 | |
Hong Kong Television Network, Ltd. | | | 270,000 | | | | 123,281 | |
Hongkong Chinese, Ltd. | | | 920,000 | | | | 218,827 | |
Hsin Chong Construction Group, Ltd. | | | 348,000 | | | | 54,076 | |
Hung Hing Printing Group, Ltd. | | | 252,000 | | | | 37,423 | |
Hutchison Telecommunications Hong Kong Holdings, Ltd. (d) | | | 860,000 | | | | 325,343 | |
Hybrid Kinetic Group, Ltd. (a) | | | 1,740,000 | | | | 27,082 | |
Imagi International Holdings, Ltd. (a) | | | 4,131,000 | | | | 48,124 | |
International Standard Resources Holdings, Ltd. (a) | | | 935,000 | | | | 15,035 | |
IPE Group, Ltd. | | | 285,000 | | | | 20,633 | |
IRC, Ltd. (a) | | | 600,000 | | | | 61,322 | |
IT, Ltd. | | | 330,000 | | | | 85,174 | |
ITC Properties Group, Ltd. | | | 81,000 | | | | 30,950 | |
Jinhui Holdings, Ltd. (a) | | | 70,000 | | | | 18,887 | |
Johnson Electric Holdings, Ltd. | | | 488,500 | | | | 474,017 | |
K Wah International Holdings, Ltd. | | | 820,967 | | | | 498,576 | |
Kam Hing International Holdings, Ltd. | | | 196,000 | | | | 15,934 | |
Kantone Holdings, Ltd. | | | 930,000 | | | | 11,170 | |
Keck Seng Investments | | | 94,000 | | | | 58,877 | |
King Stone Energy Group, Ltd. (a) | | | 792,000 | | | | 32,652 | |
Kingmaker Footwear Holdings, Ltd. | | | 102,000 | | | | 20,175 | |
Kingston Financial Group, Ltd. | | | 2,171,000 | | | | 210,303 | |
Ko Yo Chemical Group, Ltd. (a) | | | 2,680,000 | | | | 31,811 | |
Kowloon Development Co., Ltd. | | | 173,000 | | | | 213,449 | |
Lai Sun Development (a) | | | 7,569,666 | | | | 205,554 | |
Lai Sun Garment International, Ltd. (a) | | | 430,000 | | | | 67,289 | |
Lam Soon Hong Kong, Ltd. | | | 15,000 | | | | 12,864 | |
Landsea Green Properties Co., Ltd. (a) | | | 120,000 | | | | 11,325 | |
Lee’s Pharmaceutical Holdings, Ltd. | | | 110,000 | | | | 104,482 | |
Lerado Group Holdings Co., Ltd. | | | 202,000 | | | | 29,950 | |
| | |
Hong Kong—(Continued) | | | | | | | | |
Lifestyle International Holdings, Ltd. | | | 30,500 | | | | 56,517 | |
Lippo China Resources, Ltd. | | | 2,106,000 | | | | 98,989 | |
Lippo, Ltd. | | | 122,000 | | | | 66,826 | |
Liu Chong Hing Investment, Ltd. | | | 90,000 | | | | 172,631 | |
Luen Thai Holdings, Ltd. | | | 156,000 | | | | 54,798 | |
Luk Fook Holdings International, Ltd. | | | 166,000 | | | | 637,089 | |
Luks Group Vietnam Holdings Co., Ltd. | | | 68,000 | | | | 20,200 | |
Lung Kee Bermuda Holdings | | | 116,000 | | | | 41,561 | |
Magnificent Estates | | | 1,560,000 | | | | 73,509 | |
Man Wah Holdings, Ltd. | | | 216,800 | | | | 339,977 | |
Man Yue Technology Holdings, Ltd. | | | 88,000 | | | | 10,437 | |
Matrix Holdings, Ltd. (c) | | | 36,000 | | | | 8,357 | |
Mei Ah Entertainment Group, Ltd. (a) | | | 800,000 | | | | 13,119 | |
Midland Holdings, Ltd. | | | 460,000 | | | | 222,239 | |
Ming Fai International Holdings, Ltd. | | | 145,000 | | | | 15,909 | |
Ming Fung Jewellery Group, Ltd. (a) | | | 1,440,000 | | | | 29,751 | |
Miramar Hotel & Investment | | | 4,000 | | | | 5,116 | |
Mongolia Energy Corp., Ltd. (a) | | | 1,688,000 | | | | 53,174 | |
Mongolian Mining Corp. (a) (d) | | | 941,500 | | | | 125,236 | |
National Electronic Holdings, Ltd. | | | 166,000 | | | | 19,473 | |
Natural Beauty Bio-Technology, Ltd. | | | 290,000 | | | | 16,485 | |
Neo-Neon Holdings, Ltd. (a) | | | 420,500 | | | | 95,411 | |
Neptune Group, Ltd. (a) | | | 1,060,000 | | | | 46,598 | |
New Century Group Hong Kong, Ltd. | | | 912,000 | | | | 18,241 | |
New Times Energy Corp., Ltd. (a) | | | 204,200 | | | | 16,338 | |
Newocean Energy Holdings, Ltd. (d) | | | 616,000 | | | | 503,591 | |
Next Media, Ltd. (a) | | | 414,000 | | | | 53,456 | |
Norstar Founders Group, Ltd. (a) (b) (c) | | | 24,000 | | | | 0 | |
North Asia Resources Holdings, Ltd. (a) | | | 335,000 | | | | 7,886 | |
Orange Sky Golden Harvest Entertainment Holdings, Ltd. (a) | | | 555,882 | | | | 34,380 | |
Orient Overseas International, Ltd. | | | 2,500 | | | | 12,588 | |
Oriental Watch Holdings | | | 271,600 | | | | 71,894 | |
Pacific Andes International Holdings, Ltd. | | | 1,213,323 | | | | 48,619 | |
Pacific Basin Shipping, Ltd. | | | 1,010,000 | | | | 725,765 | |
Pacific Textile Holdings, Ltd. | | | 270,000 | | | | 412,902 | |
Paliburg Holdings, Ltd. | | | 362,000 | | | | 117,750 | |
Pan Asia Environmental Protection Group, Ltd. (a) | | | 38,000 | | | | 8,388 | |
PCCW, Ltd. | | | 521,000 | | | | 233,216 | |
Pearl Oriental Oil, Ltd. (a) | | | 1,170,000 | | | | 39,347 | |
Pico Far East Holdings, Ltd. | | | 468,000 | | | | 163,574 | |
Ping Shan Tea Group, Ltd. (a) | | | 460,000 | | | | 12,801 | |
Playmates Holdings, Ltd. | | | 64,000 | | | | 85,239 | |
PNG Resources Holdings, Ltd. | | | 1,944,000 | | | | 21,375 | |
Polytec Asset Holdings, Ltd. | | | 965,000 | | | | 123,271 | |
Public Financial Holdings, Ltd. | | | 166,000 | | | | 85,648 | |
PYI Corp., Ltd. | | | 2,714,366 | | | | 64,486 | |
Regal Hotels International Holdings, Ltd. | | | 454,000 | | | | 283,238 | |
Richfield Group Holdings, Ltd. (a) | | | 944,000 | | | | 29,218 | |
Rising Development Holdings, Ltd. (a) | | | 272,000 | | | | 24,765 | |
Rivera Holdings, Ltd. | | | 20,000 | | | | 802 | |
SA SA International Holdings, Ltd. | | | 548,000 | | | | 643,586 | |
Sandmartin International Holdings, Ltd. (a) | | | 104,000 | | | | 5,968 | |
SEA Holdings, Ltd. | | | 94,000 | | | | 52,490 | |
Shenyin Wanguo HK, Ltd. | | | 155,000 | | | | 59,354 | |
Shougang Concord Technology Holdings (a) | | | 634,000 | | | | 40,587 | |
See accompanying notes to financial statements.
MSF-15
Metropolitan Series Fund
Met/Dimensional International Small Company Portfolio
Schedule of Investments as of December 31, 2013
Common Stocks—(Continued)
| | | | | | | | |
| Security Description | | Shares | | | Value | |
| | |
Hong Kong—(Continued) | | | | | | | | |
Shun Tak Holdings, Ltd. | | | 979,500 | | | $ | 578,934 | |
Silver base Group Holdings, Ltd. (a) (d) | | | 422,000 | | | | 61,064 | |
Sing Tao News Corp., Ltd. | | | 276,000 | | | | 40,216 | |
Singamas Container Holdings, Ltd. (d) | | | 942,000 | | | | 221,636 | |
Sinocop Resources Holdings, Ltd. (a) | | | 70,000 | | | | 5,409 | |
SIS International Holdings | | | 16,000 | | | | 6,190 | |
Sitoy Group Holdings, Ltd. | | | 110,000 | | | | 63,300 | |
SmarTone Telecommunications Holdings, Ltd. (d) | | | 206,500 | | | | 234,788 | |
SOCAM Development, Ltd. | | | 179,876 | | | | 208,425 | |
Solomon Systech International, Ltd. (a) | | | 920,000 | | | | 42,838 | |
Soundwill Holdings, Ltd. | | | 50,000 | | | | 94,871 | |
South China China, Ltd. (a) | | | 496,000 | | | | 46,054 | |
Stella International Holdings, Ltd. | | | 60,000 | | | | 152,999 | |
Stelux Holdings International, Ltd. | | | 260,500 | | | | 91,251 | |
Success Universe Group, Ltd. (a) | | | 240,000 | | | | 14,574 | |
Sun Hing Vision Group Holdings, Ltd. | | | 42,000 | | | | 13,053 | |
Sun Hung Kai & Co., Ltd. | | | 400,440 | | | | 223,474 | |
Superb Summit International Group, Ltd. (a) | | | 2,630,000 | | | | 111,970 | |
TAI Cheung Holdings (d) | | | 250,000 | | | | 189,185 | |
Talent Property Group, Ltd. (a) | | | 420,000 | | | | 7,528 | |
Tan Chong International, Ltd. (c) | | | 63,000 | | | | 24,049 | |
Tao Heung Holdings, Ltd. | | | 204,000 | | | | 151,412 | |
Taung Gold International, Ltd. (a) (b) (c) (d) | | | 700,000 | | | | 14,353 | |
Television Broadcasts, Ltd. (d) | | | 17,700 | | | | 118,246 | |
Texwinca Holdings, Ltd. | | | 298,000 | | | | 313,597 | |
Titan Petrochemicals Group, Ltd. (a) (c) | | | 1,000,000 | | | | 322 | |
Tongda Group Holdings, Ltd. | | | 1,350,000 | | | | 90,719 | |
Town Health International Investments, Ltd. (a) | | | 176,000 | | | | 67,390 | |
Tradelink Electronic Commerce, Ltd. | | | 356,000 | | | | 77,709 | |
Transport International Holdings, Ltd. | | | 109,600 | | | | 233,933 | |
Trinity, Ltd. (d) | | | 632,000 | | | | 210,780 | |
TSC Group Holdings, Ltd. (a) | | | 267,000 | | | | 99,988 | |
Tse Sui Luen Jewellery International, Ltd. | | | 40,000 | | | | 17,057 | |
Tysan Holdings, Ltd. | | | 146,000 | | | | 53,865 | |
United Laboratories International Holdings, Ltd. (The) (a) (d) | | | 355,000 | | | | 144,706 | |
Universal Technologies Holdings, Ltd. (a) | | | 710,000 | | | | 40,963 | |
Up Energy Development Group, Ltd. (a) | | | 92,000 | | | | 5,278 | |
Upbest Group, Ltd. | | | 8,000 | | | | 856 | |
Value Convergence Holdings, Ltd. (a) | | | 104,000 | | | | 15,430 | |
Value Partners Group, Ltd. | | | 380,000 | | | | 295,100 | |
Varitronix International, Ltd. | | | 182,000 | | | | 194,767 | |
Vedan International Holdings, Ltd. | | | 296,000 | | | | 17,315 | |
Victory City International Holdings, Ltd. | | | 680,868 | | | | 102,828 | |
Vitasoy International Holdings, Ltd. | | | 380,000 | | | | 589,002 | |
VST Holdings, Ltd. | | | 487,200 | | | | 123,942 | |
Wai Kee Holdings, Ltd. | | | 54,000 | | | | 13,719 | |
Wang On Group, Ltd. | | | 3,040,000 | | | | 52,561 | |
Win Hanverky Holdings, Ltd. | | | 332,000 | | | | 40,277 | |
Wing On Co. International, Ltd. | | | 46,000 | | | | 127,609 | |
Wing Tai Properties, Ltd. | | | 280,000 | | | | 172,389 | |
Xinyi Glass Holdings, Ltd. (d) | | | 930,000 | | | | 825,270 | |
Xinyi Solar Holdings, Ltd. (a) (d) | | | 930,000 | | | | 190,694 | |
Xpress Group, Ltd. (a) | | | 600,000 | | | | 31,620 | |
Yeebo International Holdings, Ltd. (c) | | | 158,000 | | | | 23,228 | |
YGM Trading, Ltd. | | | 48,000 | | | | 106,705 | |
| | |
Hong Kong—(Continued) | | | | | | | | |
Yugang International, Ltd. (a) | | | 1,466,000 | | | | 9,659 | |
Zhuhai Holdings Investment Group, Ltd. (a) | | | 218,000 | | | | 40,498 | |
| | | | | | | | |
| | | | | | | 28,251,763 | |
| | | | | | | | |
| | |
Ireland—1.4% | | | | | | | | |
Aer Lingus Group plc | | | 42,387 | | | | 74,775 | |
C&C Group plc | | | 204,054 | | | | 1,193,617 | |
DCC plc | | | 50,148 | | | | 2,469,402 | |
FBD Holdings plc | | | 15,309 | | | | 366,423 | |
Glanbia plc | | | 57,037 | | | | 884,244 | |
Grafton Group plc | | | 111,227 | | | | 1,191,174 | |
Greencore Group plc | | | 238,369 | | | | 883,514 | |
IFG Group plc | | | 44,002 | | | | 106,561 | |
Irish Continental Group plc | | | 1,706 | | | | 62,397 | |
Kenmare Resources plc (a) | | | 145,693 | | | | 49,691 | |
Kingspan Group plc | | | 67,194 | | | | 1,201,890 | |
Paddy Power plc | | | 27,063 | | | | 2,313,015 | |
Smurfit Kappa Group plc | | | 81,172 | | | | 1,999,060 | |
UDG Healthcare plc | | | 117,031 | | | | 627,781 | |
| | | | | | | | |
| | | | | | | 13,423,544 | |
| | | | | | | | |
| | |
Israel—1.0% | | | | | | | | |
Africa Israel Investments, Ltd. (a) | | | 50,826 | | | | 101,399 | |
Africa Israel Properties, Ltd. (a) | | | 7,501 | | | | 118,178 | |
Africa Israel Residences, Ltd. | | | 880 | | | | 14,714 | |
Airport City, Ltd. (a) | | | 18,842 | | | | 173,636 | |
AL-ROV Israel, Ltd. (a) | | | 2,628 | | | | 102,707 | |
Allot Communications, Ltd. (a) | | | 6,459 | | | | 97,666 | |
Alon Holdings Blue Square Israel, Ltd. (a) | | | 8,063 | | | | 34,243 | |
Alrov Properties and Lodgings, Ltd. (a) | | | 1,923 | | | | 59,616 | |
Amot Investments, Ltd. | | | 28,877 | | | | 88,259 | |
AudioCodes, Ltd. (a) | | | 17,523 | | | | 124,955 | |
Avgol Industries 1953, Ltd. | | | 46,857 | | | | 47,178 | |
Azorim-Investment Development & Construction Co., Ltd. (a) | | | 23,712 | | | | 24,945 | |
Babylon, Ltd. | | | 13,198 | | | | 30,844 | |
Bayside Land Corp. | | | 413 | | | | 113,755 | |
Big Shopping Centers 2004, Ltd. | | | 716 | | | | 28,453 | |
Bio-cell, Ltd. (a) | | | 2,190 | | | | 13,846 | |
BioLine RX, Ltd. (a) | | | 25,645 | | | | 7,287 | |
Blue Square Real Estate, Ltd. | | | 374 | | | | 14,137 | |
Cellcom Israel, Ltd. | | | 11,368 | | | | 156,511 | |
Ceragon Networks, Ltd. (a) | | | 14,799 | | | | 43,478 | |
Clal Biotechnology Industries, Ltd. (a) | | | 17,580 | | | | 39,866 | |
Clal Insurance Enterprises Holdings, Ltd. | | | 10,363 | | | | 201,514 | |
Compugen, Ltd. (a) | | | 13,456 | | | | 118,331 | |
Delek Automotive Systems, Ltd. | | | 16,947 | | | | 183,432 | |
Delta-Galil Industries, Ltd. | | | 5,417 | | | | 141,423 | |
Direct Insurance Financial Investments, Ltd. | | | 5,783 | | | | 38,955 | |
Elbit Systems, Ltd. | | | 8,342 | | | | 504,507 | |
Electra, Ltd. | | | 895 | | | | 132,877 | |
Elron Electronic Industries, Ltd. (a) | | | 7,585 | | | | 66,309 | |
Equital, Ltd. (a) | | | 550 | | | | 8,604 | |
Evogene, Ltd. (a) | | | 8,162 | | | | 160,369 | |
EZchip Semiconductor, Ltd. (a) | | | 9,853 | | | | 245,205 | |
First International Bank of Israel, Ltd. | | | 10,887 | | | | 180,270 | |
See accompanying notes to financial statements.
MSF-16
Metropolitan Series Fund
Met/Dimensional International Small Company Portfolio
Schedule of Investments as of December 31, 2013
Common Stocks—(Continued)
| | | | | | | | |
| Security Description | | Shares | | | Value | |
| | |
Israel—(Continued) | | | | | | | | |
FMS Enterprises Migun, Ltd. | | | 910 | | | $ | 9,331 | |
Formula Systems 1985, Ltd. | | | 4,463 | | | | 113,951 | |
Frutarom Industries, Ltd. | | | 19,140 | | | | 402,757 | |
Gilat Satellite Networks, Ltd. (a) | | | 12,836 | | | | 60,343 | |
Given Imaging, Ltd. (a) | | | 8,717 | | | | 262,200 | |
Golf & Co., Ltd. | | | 6,101 | | | | 20,565 | |
Hadera Paper, Ltd. (a) | | | 1,386 | | | | 63,387 | |
Harel Insurance Investments & Financial Services, Ltd. | | | 57,410 | | | | 335,097 | |
Industrial Buildings Corp. | | | 43,794 | | | | 80,723 | |
Israel Discount Bank, Ltd. - Class A (a) | | | 336,890 | | | | 644,118 | |
Israel Land Development Co., Ltd. (The) | | | 3,950 | | | | 16,489 | |
Ituran Location and Control, Ltd. | | | 9,589 | | | | 209,262 | |
Jerusalem Oil Exploration (a) | | | 5,621 | | | | 218,818 | |
Kamada, Ltd. (a) | | | 11,968 | | | | 174,984 | |
Kerur Holdings, Ltd. | | | 931 | | | | 19,225 | |
Maabarot Products, Ltd. | | | 4,183 | | | | 48,411 | |
Magic Software Enterprises, Ltd. | | | 9,462 | | | | 67,436 | |
Matrix IT, Ltd. | | | 19,777 | | | | 101,283 | |
Mazor Robotics, Ltd. (a) | | | 13,274 | | | | 130,136 | |
Meitav DS Investments, Ltd. | | | 5,193 | | | | 17,997 | |
Melisron, Ltd. | | | 6,384 | | | | 173,706 | |
Menorah Mivtachim Holdings, Ltd. | | | 13,207 | | | | 164,456 | |
Migdal Insurance & Financial Holding, Ltd. | | | 133,078 | | | | 234,646 | |
Mivtach Shamir Holdings, Ltd. | | | 294 | | | | 10,171 | |
Naphtha Israel Petroleum Corp., Ltd. (a) | | | 18,925 | | | | 130,985 | |
Neto ME Holdings, Ltd. (a) | | | 1,150 | | | | 66,802 | |
Nitsba Holdings 1995, Ltd. (a) | | | 16,809 | | | | 246,606 | |
Nova Measuring Instruments, Ltd. (a) | | | 10,093 | | | | 99,348 | |
Oil Refineries, Ltd. (a) | | | 568,229 | | | | 183,005 | |
Ormat Industries | | | 29,986 | | | | 205,615 | |
Osem Investments, Ltd. | | | 11,392 | | | | 278,488 | |
Partner Communications Co., Ltd. (a) | | | 39,592 | | | | 365,291 | |
Paz Oil Co., Ltd. (a) | | | 2,330 | | | | 380,881 | |
Perion Network, Ltd. (a) | | | 3,246 | | | | 39,984 | |
Phoenix Holdings, Ltd. (The) | | | 30,251 | | | | 112,418 | |
Plasson Industries, Ltd. | | | 1,729 | | | | 59,578 | |
Rami Levi Chain Stores Hashikma Marketing 2006, Ltd. | | | 2,926 | | | | 159,975 | |
Shikun & Binui, Ltd. | | | 94,127 | | | | 230,582 | |
Shufersal, Ltd. | | | 37,713 | | | | 145,375 | |
Space Communication, Ltd. (a) | | | 2,951 | | | | 48,275 | |
Strauss Group, Ltd. | | | 17,669 | | | | 338,227 | |
Tower Semiconductor, Ltd. (a) | | | 10,537 | | | | 60,184 | |
Union Bank of Israel (a) | | | 11,952 | | | | 55,475 | |
| | | | | | | | |
| | | | | | | 10,204,055 | |
| | | | | | | | |
| | |
Italy—3.3% | | | | | | | | |
A2A S.p.A. (d) | | | 450,367 | | | | 528,834 | |
ACEA S.p.A. | | | 33,065 | | | | 376,493 | |
Acotel Group S.p.A. (a) | | | 81 | | | | 2,193 | |
Alerion Cleanpower S.p.A. | | | 10,865 | | | | 49,228 | |
Amplifon S.p.A. | | | 48,850 | | | | 272,403 | |
Ansaldo STS S.p.A. | | | 47,467 | | | | 513,045 | |
Arnoldo Mondadori Editore S.p.A. (a) (d) | | | 62,817 | | | | 121,425 | |
Ascopiave S.p.A. | | | 22,740 | | | | 56,188 | |
| | |
Italy—(Continued) | | | | | | | | |
Astaldi S.p.A. (d) | | | 32,469 | | | | 342,275 | |
Atlantia S.p.A. | | | 45,015 | | | | 1,017,612 | |
Autogrill S.p.A. (a) (d) | | | 54,430 | | | | 461,410 | |
Azimut Holding S.p.A. | | | 51,142 | | | | 1,410,345 | |
Banca Carige S.p.A. (a) (d) | | | 414,328 | | | | 254,672 | |
Banca Finnat Euramerica S.p.A. | | | 50,851 | | | | 22,186 | |
Banca Generali S.p.A. | | | 17,730 | | | | 553,147 | |
Banca IFIS S.p.A. | | | 6,177 | | | | 110,104 | |
Banca Piccolo Credito Valtellinese Scarl (a) (d) | | | 117,998 | | | | 223,214 | |
Banca Popolare dell’Emilia Romagna S.c.r.l. (a) | | | 171,912 | | | | 1,648,656 | |
Banca Popolare dell’Etruria e del Lazio (a) | | | 7,755 | | | | 5,490 | |
Banca Popolare di Milano Scarl (a) | | | 1,773,934 | | | | 1,115,848 | |
Banca Popolare di Sondrio SCARL | | | 154,558 | | | | 891,160 | |
Banca Profilo S.p.A. | | | 117,883 | | | | 32,360 | |
Banco di Desio e della Brianza S.p.A. | | | 20,306 | | | | 61,532 | |
Banco Popolare SC (a) (d) | | | 839,831 | | | | 1,620,653 | |
BasicNet S.p.A. (a) | | | 9,826 | | | | 31,373 | |
Biesse S.p.A. (a) | | | 6,021 | | | | 43,725 | |
Brembo S.p.A. | | | 17,718 | | | | 477,528 | |
Brioschi Sviluppo Immobiliare S.p.A. (a) | | | 34,077 | | | | 3,555 | |
Brunello Cucinelli S.p.A. (d) | | | 4,018 | | | | 143,244 | |
Buzzi Unicem S.p.A. (d) | | | 39,838 | | | | 721,148 | |
Cairo Communication S.p.A. | | | 11,446 | | | | 93,816 | |
Caltagirone Editore S.p.A. (a) | | | 6,273 | | | | 9,308 | |
Carraro S.p.A. (a) | | | 5,504 | | | | 22,997 | |
Cementir Holding S.p.A. | | | 31,117 | | | | 180,260 | |
CIR-Compagnie Industriali Riunite S.p.A. (a) | | | 256,784 | | | | 404,871 | |
Cosmo Pharmaceuticals S.p.A. (a) | | | 632 | | | | 60,136 | |
Credito Bergamasco S.p.A. | | | 2,162 | | | | 48,417 | |
Credito Emiliano S.p.A. | | | 44,882 | | | | 359,283 | |
d’Amico International Shipping S.A. (a) | | | 58,934 | | | | 52,479 | |
Danieli & C Officine Meccaniche S.p.A. | | | 7,018 | | | | 241,357 | |
Datalogic S.p.A. | | | 8,267 | | | | 94,178 | |
Davide Campari-Milano S.p.A. (d) | | | 1,504 | | | | 12,666 | |
De’Longhi S.p.A. | | | 17,527 | | | | 286,434 | |
DeA Capital S.p.A. (a) | | | 18,071 | | | | 31,661 | |
DiaSorin S.p.A. (d) | | | 10,148 | | | | 476,346 | |
Ei Towers S.p.A. | | | 3,833 | | | | 176,807 | |
Engineering S.p.A. | | | 2,641 | | | | 158,172 | |
ERG S.p.A. | | | 32,977 | | | | 442,484 | |
Esprinet S.p.A. | | | 18,719 | | | | 138,360 | |
Eurotech S.p.A. (a) | | | 13,076 | | | | 32,989 | |
Falck Renewables S.p.A. (a) (d) | | | 64,793 | | | | 115,560 | |
Finmeccanica S.p.A. (a) | | | 224,698 | | | | 1,723,364 | |
Fondiaria-Sai S.p.A. (a) (d) | | | 37,296 | | | | 122,197 | |
Gas Plus SpA | | | 3,786 | | | | 24,757 | |
Geox S.p.A. (d) | | | 52,589 | | | | 191,070 | |
Gruppo Editoriale L’Espresso S.p.A. (a) | | | 80,856 | | | | 151,663 | |
Gruppo MutuiOnline S.p.A. | | | 5,404 | | | | 30,630 | |
Gtech S.p.A. | | | 23,515 | | | | 717,279 | |
Hera S.p.A. | | | 365,807 | | | | 830,171 | |
IMMSI S.p.A. (a) | | | 100,436 | | | | 64,662 | |
Indesit Co. S.p.A. (d) | | | 25,444 | | | | 338,734 | |
Industria Macchine Automatiche S.p.A. | | | 5,461 | | | | 210,808 | |
Intek Group S.p.A. (a) | | | 80,757 | | | | 35,559 | |
Interpump Group S.p.A. | | | 45,493 | | | | 546,894 | |
Iren S.p.A. | | | 273,860 | | | | 422,595 | |
See accompanying notes to financial statements.
MSF-17
Metropolitan Series Fund
Met/Dimensional International Small Company Portfolio
Schedule of Investments as of December 31, 2013
Common Stocks—(Continued)
| | | | | | | | |
| Security Description | | Shares | | | Value | |
| | |
Italy—(Continued) | | | | | | | | |
Italcementi S.p.A. | | | 42,131 | | | $ | 360,793 | |
Italmobiliare S.p.A. (a) | | | 4,262 | | | | 143,946 | |
Juventus Football Club S.p.A. (a) | | | 147,435 | | | | 45,521 | |
Landi Renzo S.p.A. (a) | | | 31,132 | | | | 51,336 | |
MARR S.p.A. | | | 16,293 | | | | 271,234 | |
Mediaset S.p.A. (a) | | | 348,643 | | | | 1,683,971 | |
Mediolanum S.p.A. | | | 34,288 | | | | 298,453 | |
Milano Assicurazioni S.p.A. (a) | | | 484,485 | | | | 535,527 | |
Nice S.p.A. | | | 9,890 | | | | 37,501 | |
Piaggio & C S.p.A. (d) | | | 85,698 | | | | 284,914 | |
Poltrona Frau S.p.A. (a) | | | 22,268 | | | | 72,415 | |
Prelios S.p.A. (a) | | | 38,015 | | | | 30,188 | |
Prima Industrie S.p.A. (a) | | | 243 | | | | 3,101 | |
Recordati S.p.A. | | | 44,330 | | | | 639,273 | |
Reply S.p.A. | | | 2,196 | | | | 171,999 | |
Retelit S.p.A. (a) | | | 36,769 | | | | 28,327 | |
Sabaf S.p.A. | | | 1,021 | | | | 18,104 | |
SAES Getters S.p.A. | | | 1,416 | | | | 13,634 | |
Safilo Group S.p.A. (a) | | | 22,504 | | | | 529,135 | |
Saras S.p.A. (a) (d) | | | 134,526 | | | | 154,435 | |
SAVE S.p.A. | | | 7,778 | | | | 132,870 | |
Snai S.p.A. (a) | | | 21,135 | | | �� | 40,210 | |
Societa Cattolica di Assicurazioni S.c.r.l. | | | 24,997 | | | | 678,647 | |
Societa Iniziative Autostradali e Servizi S.p.A. (d) | | | 30,419 | | | | 303,431 | |
Societa per la Bonifica dei Terreni Ferraresi e Imprese Agricole S.p.A. | | | 1,095 | | | | 52,534 | |
Sogefi S.p.A. | | | 25,543 | | | | 154,036 | |
SOL S.p.A. | | | 15,778 | | | | 123,273 | |
Sorin S.p.A. (a) | | | 157,025 | | | | 448,119 | |
Tiscali S.p.A. (a) | | | 802,477 | | | | 47,578 | |
Trevi Finanziaria Industriale S.p.A. | | | 22,305 | | | | 194,275 | |
Uni Land S.p.A. (a) (b) (c) | | | 4,937 | | | | 0 | |
Unione di Banche Italiane SCPA | | | 54,789 | | | | 374,151 | |
Unipol Gruppo Finanziario S.p.A. | | | 133,203 | | | | 799,516 | |
Vianini Lavori S.p.A. | | | 2,113 | | | | 15,028 | |
Vittoria Assicurazioni S.p.A. | | | 16,042 | | | | 189,655 | |
World Duty Free S.p.A. (a) (d) | | | 54,430 | | | | 685,542 | |
Yoox S.p.A. (a) | | | 22,641 | | | | 1,016,132 | |
Zignago Vetro S.p.A. | | | 14,414 | | | | 97,973 | |
| | | | | | | | |
| | | | | | | 32,686,787 | |
| | | | | | | | |
| | |
Japan—21.6% | | | | | | | | |
77 Bank, Ltd. (The) | | | 125,000 | | | | 606,327 | |
A&A Material Corp. (a) | | | 12,000 | | | | 16,823 | |
A&D Co., Ltd. | | | 11,600 | | | | 69,708 | |
A/S One Corp. | | | 8,100 | | | | 190,762 | |
Accordia Golf Co., Ltd. | | | 55,200 | | | | 696,244 | |
Achilles Corp. | | | 94,000 | | | | 132,613 | |
Adastria Holdings Co., Ltd. | | | 8,320 | | | | 301,233 | |
ADEKA Corp. | | | 50,300 | | | | 554,643 | |
Aderans Co., Ltd. | | | 6,400 | | | | 70,784 | |
Advan Co., Ltd. | | | 6,500 | | | | 75,092 | |
Aeon Delight Co., Ltd. | | | 1,300 | | | | 24,937 | |
Aeon Fantasy Co., Ltd. | | | 4,000 | | | | 61,239 | |
Agrex, Inc. | | | 900 | | | | 8,669 | |
Ahresty Corp. | | | 12,800 | | | | 103,112 | |
| | |
Japan—(Continued) | | | | | | | | |
Ai Holdings Corp. | | | 24,600 | | | | 307,120 | |
Aica Kogyo Co., Ltd. | | | 24,400 | | | | 482,819 | |
Aichi Bank, Ltd. (The) | | | 5,300 | | | | 253,464 | |
Aichi Corp. | | | 19,600 | | | | 89,665 | |
Aichi Steel Corp. | | | 62,000 | | | | 256,879 | |
Aichi Tokei Denki Co., Ltd. | | | 19,000 | | | | 54,057 | |
Aida Engineering, Ltd. | | | 33,400 | | | | 362,377 | |
Aigan Co., Ltd. (a) | | | 8,200 | | | | 21,662 | |
Ain Pharmaciez, Inc. | | | 5,000 | | | | 245,649 | |
Aiphone Co., Ltd. | | | 9,200 | | | | 155,995 | |
Airport Facilities Co., Ltd. (d) | | | 15,000 | | | | 124,374 | |
Aisan Industry Co., Ltd. | | | 16,600 | | | | 159,838 | |
Aizawa Securities Co., Ltd. | | | 22,300 | | | | 194,128 | |
Akebono Brake Industry Co., Ltd. (d) | | | 11,100 | | | | 49,500 | |
Akita Bank, Ltd. (The) (d) | | | 126,000 | | | | 342,157 | |
Alconix Corp. | | | 3,100 | | | | 69,072 | |
Alinco, Inc. | | | 5,800 | | | | 58,431 | |
Allied Telesis Holdings KK | | | 44,500 | | | | 38,112 | |
Alpen Co., Ltd. (d) | | | 9,600 | | | | 172,556 | |
Alpha Corp. | | | 2,200 | | | | 21,931 | |
Alpha Systems, Inc. | | | 3,940 | | | | 55,989 | |
Alpine Electronics, Inc. | | | 25,000 | | | | 350,922 | |
Alps Electric Co., Ltd. (a) | | | 92,500 | | | | 1,053,514 | |
Alps Logistics Co., Ltd. | | | 4,100 | | | | 41,684 | |
Altech Corp. | | | 4,700 | | | | 46,593 | |
Amano Corp. | | | 32,200 | | | | 295,781 | |
Amiyaki Tei Co., Ltd. | | | 2,100 | | | | 74,590 | |
Amuse, Inc. | | | 3,000 | | | | 57,933 | |
Anest Iwata Corp. | | | 18,000 | | | | 111,897 | |
Aohata Corp. | | | 100 | | | | 1,426 | |
AOI Electronic Co., Ltd. | | | 2,800 | | | | 36,865 | |
AOI Pro, Inc. | | | 4,700 | | | | 30,564 | |
AOKI Holdings, Inc. | | | 22,400 | | | | 389,035 | |
Aomori Bank, Ltd. (The) | | | 118,000 | | | | 306,201 | |
Aoyama Trading Co., Ltd. | | | 29,900 | | | | 808,855 | |
Arakawa Chemical Industries, Ltd. | | | 10,900 | | | | 96,837 | |
Arata Corp. (d) | | | 23,000 | | | | 70,299 | |
Araya Industrial Co., Ltd. | | | 26,000 | | | | 40,861 | |
Arcland Sakamoto Co., Ltd. | | | 8,400 | | | | 146,107 | |
Arcs Co., Ltd. | | | 17,664 | | | | 338,576 | |
Argo Graphics, Inc. | | | 3,700 | | | | 62,379 | |
Ariake Japan Co., Ltd. | | | 7,100 | | | | 174,909 | |
Arisawa Manufacturing Co., Ltd. | | | 20,700 | | | | 118,144 | |
Artnature, Inc. | | | 3,500 | | | | 79,002 | |
Asahi Broadcasting Corp. | | | 6,600 | | | | 42,965 | |
Asahi Co., Ltd. (d) | | | 7,600 | | | | 106,083 | |
Asahi Diamond Industrial Co., Ltd. | | | 32,500 | | | | 334,454 | |
Asahi Holdings, Inc. | | | 14,100 | | | | 239,938 | |
Asahi Kogyosha Co., Ltd. | | | 16,000 | | | | 58,226 | |
Asahi Net, Inc. | | | 5,000 | | | | 25,544 | |
Asahi Organic Chemicals Industry Co., Ltd. | | | 44,000 | | | | 91,691 | |
Asahi Printing Co., Ltd. | | | 200 | | | | 4,035 | |
Asahipen Corp. | | | 4,000 | | | | 5,928 | |
Asanuma Corp. (a) | | | 29,000 | | | | 48,261 | |
Asatsu-DK, Inc. (d) | | | 16,400 | | | | 385,052 | |
Asax Co., Ltd. | | | 1,800 | | | | 24,030 | |
Ashimori Industry Co., Ltd. (a) | | | 33,000 | | | | 42,739 | |
See accompanying notes to financial statements.
MSF-18
Metropolitan Series Fund
Met/Dimensional International Small Company Portfolio
Schedule of Investments as of December 31, 2013
Common Stocks—(Continued)
| | | | | | | | |
| Security Description | | Shares | | | Value | |
| | |
Japan—(Continued) | | | | | | | | |
ASKA Pharmaceutical Co., Ltd. | | | 15,000 | | | $ | 110,343 | |
ASKUL Corp. | | | 9,100 | | | | 266,691 | |
Asunaro Aoki Construction Co., Ltd. | | | 8,000 | | | | 45,494 | |
Atsugi Co., Ltd. | | | 104,000 | | | | 119,782 | |
Autobacs Seven Co., Ltd. | | | 38,700 | | | | 603,434 | |
Avex Group Holdings, Inc. (d) | | | 17,000 | | | | 365,600 | |
Awa Bank, Ltd. (The) | | | 111,000 | | | | 556,036 | |
Axell Corp. (d) | | | 3,800 | | | | 64,442 | |
Axial Retailing, Inc. | | | 7,100 | | | | 103,150 | |
Azbil Corp. | | | 11,300 | | | | 263,480 | |
Bando Chemical Industries, Ltd. | | | 51,000 | | | | 200,782 | |
Bank of Iwate, Ltd. (The) | | | 9,100 | | | | 456,869 | |
Bank of Kochi, Ltd. (The) (d) | | | 16,000 | | | | 25,489 | |
Bank of Nagoya, Ltd. (The) | | | 94,000 | | | | 318,155 | |
Bank of Okinawa, Ltd. (The) | | | 10,800 | | | | 428,425 | |
Bank of Saga, Ltd. (The) (d) | | | 82,000 | | | | 176,120 | |
Bank of the Ryukyus, Ltd. (d) | | | 23,800 | | | | 311,308 | |
Belc Co., Ltd. | | | 6,200 | | | | 108,446 | |
Belluna Co., Ltd. | | | 31,100 | | | | 150,779 | |
Benefit One, Inc. | | | 10,200 | | | | 92,226 | |
Best Bridal, Inc. (d) | | | 10,600 | | | | 66,949 | |
Best Denki Co., Ltd. (a) | | | 50,400 | | | | 73,754 | |
Bic Camera, Inc. (d) | | | 469 | | | | 263,468 | |
Bit-isle, Inc. (d) | | | 6,600 | | | | 52,207 | |
BML, Inc. | | | 6,600 | | | | 223,476 | |
Bookoff Corp. (d) | | | 4,700 | | | | 30,981 | |
Bull-Dog Sauce Co., Ltd. | | | 6,000 | | | | 10,375 | |
Bunka Shutter Co., Ltd. | | | 29,000 | | | | 176,432 | |
C Uyemura & Co., Ltd. | | | 3,400 | | | | 148,671 | |
CAC Corp. | | | 8,800 | | | | 76,904 | |
Calsonic Kansei Corp. | | | 83,000 | | | | 428,754 | |
Can Do Co., Ltd. (d) | | | 9,200 | | | | 133,230 | |
Canon Electronics, Inc. (d) | | | 12,000 | | | | 221,190 | |
Carlit Holdings Co., Ltd. (a) | | | 7,300 | | | | 34,833 | |
Cawachi, Ltd. | | | 9,700 | | | | 182,637 | |
Central Glass Co., Ltd. | | | 114,000 | | | | 379,280 | |
Central Security Patrols Co., Ltd. | | | 3,300 | | | | 30,089 | |
Central Sports Co., Ltd. (d) | | | 3,200 | | | | 46,569 | |
CFS Corp. | | | 4,400 | | | | 17,066 | |
Chiba Kogyo Bank, Ltd. (The) (a) | | | 25,500 | | | | 188,875 | |
Chino Corp. | | | 20,000 | | | | 42,658 | |
Chiyoda Co., Ltd. | | | 12,000 | | | | 231,220 | |
Chiyoda Integre Co., Ltd. | | | 7,800 | | | | 129,301 | |
Chofu Seisakusho Co., Ltd. (d) | | | 8,200 | | | | 194,232 | |
Chori Co., Ltd. | | | 7,000 | | | | 78,635 | |
Chubu Shiryo Co., Ltd. | | | 14,400 | | | | 79,570 | |
Chudenko Corp. | | | 12,400 | | | | 225,205 | |
Chuetsu Pulp & Paper Co., Ltd. | | | 55,000 | | | | 104,702 | |
Chugai Mining Co., Ltd. (a) | | | 68,200 | | | | 19,425 | |
Chugai Ro Co., Ltd. | | | 42,000 | | | | 103,836 | |
Chugoku Marine Paints, Ltd. | | | 37,000 | | | | 196,308 | |
Chukyo Bank, Ltd. (The) | | | 64,000 | | | | 110,749 | |
Chuo Denki Kogyo Co., Ltd. (a) | | | 11,100 | | | | 37,868 | |
Chuo Gyorui Co., Ltd. | | | 2,000 | | | | 4,792 | |
Chuo Spring Co., Ltd. | | | 19,000 | | | | 55,621 | |
CKD Corp. | | | 32,300 | | | | 350,837 | |
Clarion Co., Ltd. (a) (d) | | | 38,000 | | | | 57,157 | |
| | |
Japan—(Continued) | | | | | | | | |
Cleanup Corp. | | | 14,500 | | | | 131,369 | |
CMIC Holdings Co., Ltd. (d) | | | 5,800 | | | | 75,099 | |
CMK Corp. (d) | | | 26,400 | | | | 74,863 | |
Coca-Cola Central Japan Co., Ltd. | | | 26,471 | | | | 549,822 | |
Cocokara fine, Inc. | | | 7,500 | | | | 197,601 | |
Computer Engineering & Consulting, Ltd. | | | 7,000 | | | | 44,619 | |
Computer Institute of Japan, Ltd. | | | 2,000 | | | | 7,891 | |
CONEXIO Corp. (d) | | | 8,400 | | | | 66,697 | |
Core Corp. | | | 3,000 | | | | 21,443 | |
Corona Corp. | | | 8,500 | | | | 91,609 | |
Cosel Co., Ltd. (d) | | | 13,100 | | | | 152,202 | |
Cosmo Oil Co., Ltd. (a) | | | 157,000 | | | | 300,142 | |
Create Medic Co., Ltd. | | | 1,800 | | | | 16,592 | |
CREATE SD HOLDINGS Co., Ltd. | | | 5,400 | | | | 186,870 | |
Cross Plus, Inc. | | | 1,100 | | | | 9,271 | |
CTI Engineering Co., Ltd. | | | 6,100 | | | | 61,310 | |
Cybernet Systems Co., Ltd. | | | 3,900 | | | | 13,272 | |
Cybozu, Inc. | | | 11,900 | | | | 47,606 | |
Dai Nippon Toryo Co., Ltd. (d) | | | 70,000 | | | | 114,724 | |
Dai-Dan Co., Ltd. | | | 17,000 | | | | 94,248 | |
Dai-Ichi Kogyo Seiyaku Co., Ltd. | | | 24,000 | | | | 57,028 | |
Dai-ichi Seiko Co., Ltd. (d) | | | 6,300 | | | | 76,029 | |
Daibiru Corp. | | | 24,500 | | | | 300,442 | |
Daido Kogyo Co., Ltd. | | | 19,000 | | | | 60,262 | |
Daido Metal Co., Ltd. | | | 21,000 | | | | 209,993 | |
Daidoh, Ltd. (d) | | | 13,700 | | | | 87,122 | |
Daiei, Inc. (The) (a) | | | 64,700 | | | | 214,193 | |
Daifuku Co., Ltd. | | | 49,000 | | | | 626,986 | |
Daihatsu Diesel Manufacturing Co., Ltd. | | | 7,000 | | | | 45,090 | |
Daihen Corp. | | | 63,000 | | | | 292,656 | |
Daiho Corp. | | | 43,000 | | | | 191,219 | |
Daiichi Jitsugyo Co., Ltd. | | | 26,000 | | | | 116,555 | |
Daiichi Kigenso Kagaku-Kogyo Co., Ltd. | | | 1,000 | | | | 25,878 | |
Daiichikosho Co., Ltd. | | | 5,000 | | | | 141,377 | |
Daiken Corp. | | | 40,000 | | | | 107,351 | |
Daiki Aluminium Industry Co., Ltd. | | | 16,000 | | | | 41,535 | |
Daiki Ataka Engineering Co., Ltd. | | | 10,000 | | | | 49,712 | |
Daiko Clearing Services Corp. | | | 5,300 | | | | 50,769 | |
Daikoku Denki Co., Ltd. | | | 4,400 | | | | 90,112 | |
Daikokutenbussan Co., Ltd. | | | 2,900 | | | | 76,423 | |
Daikyo, Inc. (d) | | | 151,000 | | | | 410,766 | |
Dainichi Co., Ltd. (d) | | | 4,100 | | | | 31,280 | |
Dainichiseika Color & Chemicals Manufacturing Co., Ltd. | | | 42,000 | | | | 191,658 | |
Daio Paper Corp. | | | 50,000 | | | | 501,582 | |
Daisan Bank, Ltd. (The) | | | 102,000 | | | | 172,611 | |
Daiseki Co., Ltd. | | | 17,700 | | | | 346,881 | |
Daiseki Eco. Solution Co., Ltd. | | | 1,000 | | | | 18,966 | |
Daishi Bank, Ltd. (The) | | | 182,000 | | | | 629,752 | |
Daishinku Corp. (d) | | | 21,000 | | | | 78,498 | |
Daiso Co., Ltd. | | | 46,000 | | | | 154,965 | |
Daisyo Corp. (d) | | | 5,300 | | | | 66,644 | |
Daito Bank, Ltd. (The) | | | 88,000 | | | | 96,188 | |
Daito Electron Co., Ltd. | | | 800 | | | | 2,957 | |
Daito Pharmaceutical Co., Ltd. | | | 4,600 | | | | 64,204 | |
Daiwa Industries, Ltd. | | | 15,000 | | | | 101,520 | |
Daiwabo Holdings Co., Ltd. (d) | | | 134,000 | | | | 262,695 | |
See accompanying notes to financial statements.
MSF-19
Metropolitan Series Fund
Met/Dimensional International Small Company Portfolio
Schedule of Investments as of December 31, 2013
Common Stocks—(Continued)
| | | | | | | | |
| Security Description | | Shares | | | Value | |
| | |
Japan—(Continued) | | | | | | | | |
DC Co., Ltd. | | | 11,500 | | | $ | 76,283 | |
DCM Holdings Co., Ltd. | | | 46,300 | | | | 321,299 | |
Denki Kogyo Co., Ltd. | | | 36,000 | | | | 249,609 | |
Denyo Co., Ltd. | | | 9,800 | | | | 139,347 | |
Descente, Ltd. | | | 26,000 | | | | 176,466 | |
DKK-Toa Corp. | | | 2,200 | | | | 10,679 | |
DMG Mori Seiki Co., Ltd. | | | 49,700 | | | | 896,132 | |
DMW Corp. | | | 700 | | | | 10,690 | |
Doshisha Co., Ltd. | | | 12,400 | | | | 174,760 | |
Doutor Nichires Holdings Co., Ltd. | | | 18,600 | | | | 310,545 | |
Dr Ci:Labo Co., Ltd. (d) | | | 62 | | | | 189,582 | |
DTS Corp. | | | 12,000 | | | | 210,647 | |
Dunlop Sports Co., Ltd. | | | 8,300 | | | | 99,355 | |
Duskin Co., Ltd. | | | 26,800 | | | | 508,142 | |
Dydo Drinco, Inc. | | | 4,300 | | | | 180,544 | |
Dynic Corp. | | | 16,000 | | | | 27,990 | |
Eagle Industry Co., Ltd. | | | 14,000 | | | | 232,959 | |
Ebara Jitsugyo Co., Ltd. | | | 4,600 | | | | 59,622 | |
EDION Corp. (d) | | | 53,200 | | | | 311,215 | |
Ehime Bank, Ltd. (The) | | | 94,000 | | | | 197,471 | |
Eidai Co., Ltd. | | | 15,000 | | | | 74,416 | |
Eighteenth Bank, Ltd. (The) | | | 101,000 | | | | 229,368 | |
Eiken Chemical Co., Ltd. | | | 8,200 | | | | 155,024 | |
Eizo Corp. | | | 11,100 | | | | 283,795 | |
Elecom Co., Ltd. | | | 4,500 | | | | 56,114 | |
Elematec Corp. | | | 5,000 | | | | 77,857 | |
EM Systems Co., Ltd. | | | 1,900 | | | | 35,771 | |
Emori & Co., Ltd. | | | 2,500 | | | | 53,271 | |
en-japan, Inc. (d) | | | 4,600 | | | | 98,265 | |
Enplas Corp. | | | 1,100 | | | | 75,636 | |
Enshu, Ltd. (a) | | | 23,000 | | | | 33,772 | |
EPS Corp. (d) | | | 140 | | | | 183,879 | |
ESPEC Corp. | | | 13,000 | | | | 101,426 | |
Excel Co., Ltd. | | | 5,000 | | | | 57,325 | |
Exedy Corp. | | | 16,800 | | | | 492,217 | |
Ezaki Glico Co., Ltd. | | | 24,000 | | | | 271,477 | |
F-Tech, Inc. | | | 3,600 | | | | 55,688 | |
F@N Communications, Inc. | | | 500 | | | | 14,900 | |
Faith, Inc. | | | 4,580 | | | | 49,552 | |
FALCO SD HOLDINGS Co., Ltd. | | | 4,300 | | | | 50,600 | |
Fancl Corp. (d) | | | 23,200 | | | | 250,699 | |
FCC Co., Ltd. | | | 16,600 | | | | 331,313 | |
Ferrotec Corp. | | | 19,900 | | | | 112,847 | |
FIDEA Holdings Co., Ltd. | | | 83,610 | | | | 158,968 | |
Fields Corp. | | | 8,800 | | | | 169,971 | |
First Juken Co., Ltd. | | | 3,400 | | | | 47,729 | |
Foster Electric Co., Ltd. | | | 13,800 | | | | 254,742 | |
FP Corp. (d) | | | 6,600 | | | | 470,832 | |
France Bed Holdings Co., Ltd. | | | 65,000 | | | | 126,238 | |
Fudo Tetra Corp. (a) | | | 73,700 | | | | 128,356 | |
Fuji Co., Ltd. (d) | | | 8,800 | | | | 150,091 | |
Fuji Corp., Ltd. | | | 13,400 | | | | 89,972 | |
Fuji Electronics Co., Ltd. | | | 5,600 | | | | 74,209 | |
Fuji Kiko Co., Ltd. | | | 13,000 | | | | 41,945 | |
Fuji Kosan Co., Ltd. | | | 4,600 | | | | 29,750 | |
Fuji Oil Co. Ltd. | | | 26,700 | | | | 85,223 | |
Fuji Oil Co., Ltd. | | | 31,400 | | | | 467,895 | |
| | |
Japan—(Continued) | | | | | | | | |
Fuji Pharma Co., Ltd. | | | 3,300 | | | | 58,662 | |
Fuji Seal International, Inc. | | | 10,600 | | | | 328,752 | |
Fuji Soft, Inc. | | | 10,400 | | | | 239,947 | |
Fujibo Holdings, Inc. | | | 63,000 | | | | 136,102 | |
Fujicco Co., Ltd. | | | 11,000 | | | | 124,639 | |
Fujikura Kasei Co., Ltd. | | | 14,000 | | | | 78,540 | |
Fujikura, Ltd. | | | 213,000 | | | | 1,000,637 | |
Fujimi, Inc. | | | 10,400 | | | | 134,968 | |
Fujimori Kogyo Co., Ltd. | | | 7,200 | | | | 179,400 | |
Fujisash Co., Ltd. (a) (d) | | | 24,500 | | | | 51,727 | |
Fujitec Co., Ltd. | | | 35,000 | | | | 455,014 | |
Fujitsu Frontech, Ltd. (d) | | | 10,500 | | | | 122,998 | |
Fujitsu General, Ltd. | | | 29,000 | | | | 309,495 | |
Fujiya Co., Ltd. (d) | | | 57,000 | | | | 107,840 | |
FuKoKu Co., Ltd. | | | 5,100 | | | | 48,820 | |
Fukuda Corp. | | | 14,000 | | | | 65,682 | |
Fukui Bank, Ltd. (The) | | | 144,000 | | | | 333,925 | |
Fukushima Bank, Ltd. (The) (d) | | | 143,000 | | | | 118,419 | |
Fukushima Industries Corp. | | | 7,400 | | | | 111,896 | |
Fukuyama Transporting Co., Ltd. (d) | | | 81,000 | | | | 445,191 | |
Fumakilla, Ltd. | | | 8,000 | | | | 23,898 | |
Funai Consulting, Inc. | | | 11,700 | | | | 93,481 | |
Funai Electric Co., Ltd. (d) | | | 7,900 | | | | 102,855 | |
Furukawa Battery Co., Ltd. | | | 10,000 | | | | 57,358 | |
Furukawa Co., Ltd. | | | 176,000 | | | | 349,001 | |
Furukawa Electric Co., Ltd. | | | 199,000 | | | | 500,153 | |
Furuno Electric Co., Ltd. (d) | | | 11,400 | | | | 79,949 | |
Furusato Industries, Ltd. | | | 4,600 | | | | 58,309 | |
Furuya Metal Co., Ltd. | | | 1,700 | | | | 33,849 | |
Fuso Chemical Co., Ltd. | | | 800 | | | | 20,001 | |
Fuso Pharmaceutical Industries, Ltd. | | | 41,000 | | | | 133,287 | |
Futaba Corp. | | | 15,900 | | | | 207,688 | |
Futaba Industrial Co., Ltd. (a) (d) | | | 31,700 | | | | 122,123 | |
Future Architect, Inc. | | | 9,800 | | | | 51,912 | |
Fuyo General Lease Co., Ltd. | | | 8,000 | | | | 313,369 | |
G-Tekt Corp. | | | 4,700 | | | | 160,474 | |
Gakken Holdings Co., Ltd. | | | 28,000 | | | | 82,004 | |
Gecoss Corp. | | | 7,700 | | | | 59,988 | |
Genki Sushi Co., Ltd. | | | 2,300 | | | | 30,441 | |
Geo Holdings Corp. (d) | | | 19,600 | | | | 175,718 | |
GLOBERIDE, Inc. | | | 45,000 | | | | 66,736 | |
GLORY, Ltd. | | | 26,900 | | | | 698,287 | |
GMO internet, Inc. | | | 3,200 | | | | 42,054 | |
GMO Payment Gateway, Inc. (d) | | | 3,500 | | | | 139,085 | |
Godo Steel, Ltd. | | | 90,000 | | | | 167,242 | |
Goldcrest Co., Ltd. | | | 8,830 | | | | 230,160 | |
Goldwin, Inc. | | | 18,000 | | | | 81,434 | |
Gourmet Kineya Co., Ltd. | | | 8,000 | | | | 53,842 | |
GSI Creos Corp. | | | 28,000 | | | | 43,685 | |
Gulliver International Co., Ltd. | | | 33,600 | | | | 187,765 | |
Gun-Ei Chemical Industry Co., Ltd. | | | 24,000 | | | | 108,935 | |
Gunze, Ltd. | | | 118,000 | | | | 296,356 | |
Gurunavi, Inc. | | | 7,500 | | | | 223,126 | |
H-One Co., Ltd. (d) | | | 7,700 | | | | 73,300 | |
Hagihara Industries, Inc. | | | 1,800 | | | | 24,809 | |
Hakudo Co., Ltd. | | | 500 | | | | 4,247 | |
Hakuto Co., Ltd. | | | 8,500 | | | | 84,900 | |
See accompanying notes to financial statements.
MSF-20
Metropolitan Series Fund
Met/Dimensional International Small Company Portfolio
Schedule of Investments as of December 31, 2013
Common Stocks—(Continued)
| | | | | | | | |
| Security Description | | Shares | | | Value | |
| | |
Japan—(Continued) | | | | | | | | |
Hakuyosha Co., Ltd. | | | 8,000 | | | $ | 18,568 | |
Hamakyorex Co., Ltd. | | | 4,400 | | | | 121,244 | |
Hanwa Co., Ltd. | | | 111,000 | | | | 595,356 | |
Happinet Corp. | | | 7,800 | | | | 68,842 | |
Hard Off Corp. Co., Ltd. | | | 4,900 | | | | 41,884 | |
Harima Chemicals Group, Inc. | | | 7,100 | | | | 31,877 | |
Harmonic Drive Systems, Inc. | | | 600 | | | | 13,702 | |
Haruyama Trading Co., Ltd. | | | 5,400 | | | | 38,059 | |
Hazama Ando Corp. | | | 78,790 | | | | 281,731 | |
Heiwa Corp. | | | 6,600 | | | | 106,902 | |
Heiwa Real Estate Co., Ltd. | | | 22,200 | | | | 385,743 | |
Heiwado Co., Ltd. | | | 17,200 | | | | 246,356 | |
HI-LEX Corp. | | | 8,800 | | | | 206,260 | |
Hibiya Engineering, Ltd. | | | 14,600 | | | | 179,229 | |
Hiday Hidaka Corp. | | | 4,560 | | | | 94,594 | |
Higashi Nihon House Co., Ltd. | | | 20,000 | | | | 100,494 | |
Higashi-Nippon Bank, Ltd. (The) | | | 86,000 | | | | 201,404 | |
Higo Bank, Ltd. (The) | | | 97,000 | | | | 533,498 | |
Himaraya Co., Ltd. | | | 3,100 | | | | 36,430 | |
Hioki EE Corp. | | | 4,900 | | | | 64,727 | |
Hiramatsu, Inc. (d) | | | 12,900 | | | | 80,532 | |
Hirano Tecseed Co., Ltd. | | | 500 | | | | 5,152 | |
HIS Co., Ltd. | | | 9,900 | | | | 494,588 | |
Hisaka Works, Ltd. | | | 12,000 | | | | 113,195 | |
Hitachi Koki Co., Ltd. | | | 26,800 | | | | 196,707 | |
Hitachi Kokusai Electric, Inc. | | | 2,000 | | | | 28,171 | |
Hitachi Metals Techno, Ltd. | | | 2,000 | | | | 19,134 | |
Hitachi Zosen Corp. | | | 80,000 | | | | 613,196 | |
Hochiki Corp. | | | 10,000 | | | | 54,280 | |
Hodogaya Chemical Co., Ltd. | | | 28,000 | | | | 58,305 | |
Hogy Medical Co., Ltd. | | | 6,000 | | | | 316,056 | |
Hokkaido Gas Co., Ltd. | | | 27,000 | | | | 69,773 | |
Hokkan Holdings, Ltd. | | | 31,000 | | | | 100,193 | |
Hokko Chemical Industry Co., Ltd. | | | 8,000 | | | | 22,143 | |
Hokkoku Bank, Ltd. (The) (d) | | | 149,000 | | | | 534,082 | |
Hokuetsu Bank, Ltd. (The) | | | 127,000 | | | | 257,119 | |
Hokuetsu Industries Co., Ltd. | | | 4,000 | | | | 12,359 | |
Hokuetsu Kishu Paper Co., Ltd. | | | 65,500 | | | | 308,779 | |
Hokuriku Electric Industry Co., Ltd. | | | 37,000 | | | | 59,147 | |
Hokuriku Electrical Construction Co., Ltd. | | | 9,000 | | | | 34,418 | |
Hokuriku Gas Co., Ltd. | | | 10,000 | | | | 24,989 | |
Hokuto Corp. (d) | | | 13,400 | | | | 251,503 | |
Honeys Co., Ltd. (d) | | | 10,130 | | | | 98,639 | |
Hoosiers Holdings Co., Ltd. (d) | | | 13,500 | | | | 97,130 | |
Horiba, Ltd. | | | 19,400 | | | | 663,810 | |
Hosiden Corp. (d) | | | 39,400 | | | | 212,922 | |
Hosokawa Micron Corp. | | | 16,000 | | | | 105,550 | |
House Foods Group, Inc. | | | 4,000 | | | | 60,423 | |
Howa Machinery, Ltd. | | | 7,400 | | | | 62,752 | |
Hurxley Corp. | | | 800 | | | | 5,842 | |
Hyakugo Bank, Ltd. (The) | | | 130,000 | | | | 520,397 | |
Hyakujushi Bank, Ltd. (The) | | | 136,000 | | | | 473,134 | |
I-Net Corp. | | | 3,200 | | | | 25,572 | |
IBJ Leasing Co., Ltd. | | | 7,200 | | | | 209,031 | |
Ichibanya Co., Ltd. | | | 3,500 | | | | 128,384 | |
Ichikoh Industries, Ltd. (a) | | | 26,000 | | | | 41,027 | |
ICHINEN HOLDINGS Co., Ltd. | | | 9,300 | | | | 71,505 | |
| | |
Japan—(Continued) | | | | | | | | |
Ichiyoshi Securities Co., Ltd. | | | 1,600 | | | | 26,799 | |
Icom, Inc. | | | 4,400 | | | | 106,366 | |
Idec Corp. | | | 15,400 | | | | 135,902 | |
Ihara Chemical Industry Co., Ltd. (d) | | | 24,000 | | | | 181,206 | |
Iida Group Holdings Co., Ltd. (a) | | | 51,843 | | | | 1,034,788 | |
Iino Kaiun Kaisha, Ltd. | | | 45,000 | | | | 278,820 | |
IJT Technology Holdings Co., Ltd. (a) | | | 9,000 | | | | 42,788 | |
Ikegami Tsushinki Co., Ltd. (a) | | | 30,000 | | | | 31,163 | |
Imasen Electric Industrial (d) | | | 8,300 | | | | 119,192 | |
Imperial Hotel, Ltd. (d) | | | 1,300 | | | | 27,951 | |
Inaba Denki Sangyo Co., Ltd. | | | 11,300 | | | | 352,396 | |
Inaba Seisakusho Co., Ltd. | | | 6,900 | | | | 84,720 | |
Inabata & Co., Ltd. | | | 29,800 | | | | 326,908 | |
Inageya Co., Ltd. | | | 12,200 | | | | 115,786 | |
Ines Corp. (d) | | | 20,000 | | | | 131,299 | |
Infocom Corp. | | | 8,600 | | | | 77,676 | |
Information Services International-Dentsu, Ltd. | | | 7,300 | | | | 79,452 | |
Innotech Corp. | | | 10,300 | | | | 47,842 | |
Intage Holdings, Inc. | | | 8,000 | | | | 99,184 | |
Internet Initiative Japan, Inc. | | | 10,800 | | | | 289,789 | |
Inui Steamship Co., Ltd. (a) | | | 13,300 | | | | 50,636 | |
Inui Warehouse Co., Ltd. | | | 700 | | | | 6,896 | |
Iriso Electronics Co., Ltd. | | | 5,200 | | | | 239,316 | |
Ise Chemical Corp. | | | 8,000 | | | | 64,266 | |
Iseki & Co., Ltd. (d) | | | 105,000 | | | | 313,775 | |
Ishihara Sangyo Kaisha, Ltd. (a) | | | 218,000 | | | | 238,554 | |
Ishii Iron Works Co., Ltd. | | | 16,000 | | | | 47,444 | |
Ishizuka Glass Co., Ltd. | | | 5,000 | | | | 17,160 | |
IT Holdings Corp. | | | 44,500 | | | | 702,691 | |
Itfor, Inc. | | | 10,300 | | | | 45,747 | |
Itochu Enex Co., Ltd. | | | 32,300 | | | | 177,841 | |
Itochu-Shokuhin Co., Ltd. | | | 2,600 | | | | 84,745 | |
Itoham Foods, Inc. (d) | | | 80,000 | | | | 348,168 | |
Itoki Corp. (d) | | | 22,700 | | | | 129,565 | |
IwaiCosmo Holdings, Inc. | | | 9,800 | | | | 138,687 | |
Iwaki & Co., Ltd. | | | 14,000 | | | | 28,473 | |
Iwasaki Electric Co., Ltd. (a) | | | 38,000 | | | | 78,039 | |
Iwatani Corp. | | | 91,000 | | | | 462,132 | |
Iwatsu Electric Co., Ltd. | | | 62,000 | | | | 59,627 | |
Iwatsuka Confectionery Co., Ltd. | | | 500 | | | | 25,190 | |
Izumiya Co., Ltd. | | | 41,000 | | | | 180,917 | |
Izutsuya Co., Ltd. (a) | | | 47,000 | | | | 39,404 | |
J-Oil Mills, Inc. (d) | | | 61,000 | | | | 164,068 | |
Jalux, Inc. | | | 4,000 | | | | 44,283 | |
Jamco Corp. | | | 5,900 | | | | 84,269 | |
Janome Sewing Machine Co., Ltd. (a) (d) | | | 97,000 | | | | 79,612 | |
Japan Airport Terminal Co., Ltd. (d) | | | 21,700 | | | | 492,140 | |
Japan Aviation Electronics Industry, Ltd. | | | 29,000 | | | | 373,303 | |
Japan Communications, Inc. (a) | | | 109 | | | | 10,470 | |
Japan Digital Laboratory Co., Ltd. | | | 12,600 | | | | 176,671 | |
Japan Foundation Engineering Co., Ltd. | | | 14,100 | | | | 51,351 | |
Japan Medical Dynamic Marketing, Inc. | | | 3,000 | | | | 9,077 | |
Japan Oil Transportation Co., Ltd. | | | 1,000 | | | | 2,225 | |
Japan Pulp & Paper Co., Ltd. | | | 51,000 | | | | 159,956 | |
Japan Radio Co., Ltd. (a) (d) | | | 32,000 | | | | 113,544 | |
Japan Transcity Corp. | | | 29,000 | | | | 93,465 | |
Japan Vilene Co., Ltd. | | | 16,000 | | | | 90,218 | |
See accompanying notes to financial statements.
MSF-21
Metropolitan Series Fund
Met/Dimensional International Small Company Portfolio
Schedule of Investments as of December 31, 2013
Common Stocks—(Continued)
| | | | | | | | |
| Security Description | | Shares | | | Value | |
| | |
Japan—(Continued) | | | | | | | | |
Japan Wool Textile Co., Ltd. (The) | | | 27,000 | | | $ | 196,275 | |
Jastec Co., Ltd. (d) | | | 5,100 | | | | 36,946 | |
JBCC Holdings, Inc. | | | 9,100 | | | | 69,584 | |
JCU Corp. | | | 1,200 | | | | 60,963 | |
Jimoto Holdings, Inc. | | | 49,500 | | | | 100,731 | |
JK Holdings Co., Ltd. (d) | | | 5,600 | | | | 31,295 | |
JMS Co., Ltd. | | | 15,000 | | | | 42,647 | |
Joban Kosan Co., Ltd. (a) (d) | | | 8,000 | | | | 12,331 | |
Joshin Denki Co., Ltd. | | | 23,000 | | | | 176,689 | |
Jowa Holdings Co., Ltd. | | | 3,000 | | | | 93,432 | |
JSP Corp. | | | 10,700 | | | | 162,967 | |
Juroku Bank, Ltd. (The) | | | 164,000 | | | | 602,170 | |
Justsystems Corp. (a) | | | 13,800 | | | | 142,216 | |
JVC Kenwood Corp. (d) | | | 94,400 | | | | 186,734 | |
K’s Holdings Corp. (d) | | | 4,400 | | | | 127,123 | |
Kadokawa Corp. (d) | | | 10,600 | | | | 360,045 | |
Kaga Electronics Co., Ltd. | | | 11,800 | | | | 133,805 | |
Kagome Co., Ltd. (d) | | | 4,300 | | | | 70,308 | |
Kagoshima Bank, Ltd. (The) | | | 85,000 | | | | 541,026 | |
Kaken Pharmaceutical Co., Ltd. | | | 39,000 | | | | 585,434 | |
Kakiyasu Honten Co., Ltd. | | | 4,600 | | | | 65,129 | |
Kameda Seika Co., Ltd. | | | 8,000 | | | | 211,749 | |
Kamei Corp. | | | 16,300 | | | | 128,408 | |
Kanaden Corp. | | | 11,000 | | | | 74,641 | |
Kanagawa Chuo Kotsu Co., Ltd. (d) | | | 20,000 | | | | 97,863 | |
Kanamoto Co., Ltd. | | | 15,000 | | | | 381,510 | |
Kandenko Co., Ltd. | | | 58,000 | | | | 327,011 | |
Kanematsu Corp. | | | 245,000 | | | | 403,774 | |
Kanematsu Electronics, Ltd. | | | 7,500 | | | | 94,633 | |
Kanematsu-NNK Corp. (a) | | | 18,000 | | | | 28,302 | |
Kanemi Co., Ltd. | | | 100 | | | | 2,877 | |
Kansai Urban Banking Corp. | | | 140,000 | | | | 162,472 | |
Kanto Natural Gas Development, Ltd. (a) (b) | | | 16,000 | | | | 107,568 | |
Kasai Kogyo Co., Ltd. | | | 12,000 | | | | 81,285 | |
Kasumi Co., Ltd. | | | 22,300 | | | | 137,789 | |
Katakura Chikkarin Co., Ltd. | | | 8,000 | | | | 20,456 | |
Katakura Industries Co., Ltd. | | | 13,200 | | | | 150,099 | |
Kato Sangyo Co., Ltd. | | | 10,500 | | | | 191,614 | |
Kato Works Co., Ltd. | | | 34,000 | | | | 218,909 | |
KAWADA TECHNOLOGIES, Inc. (d) | | | 2,400 | | | | 62,805 | |
Kawai Musical Instruments Manufacturing Co., Ltd. | | | 44,000 | | | | 78,217 | |
Kawasaki Kinkai Kisen Kaisha, Ltd. | | | 7,000 | | | | 20,763 | |
Kawasumi Laboratories, Inc. | | | 8,500 | | | | 49,565 | |
Keihanshin Building Co., Ltd. | | | 14,500 | | | | 77,598 | |
Keihin Co. Ltd/Minato-Ku Tokyo Japan | | | 31,000 | | | | 54,374 | |
Keihin Corp. | | | 23,400 | | | | 363,312 | |
Keiyo Bank, Ltd. (The) | | | 125,000 | | | | 602,385 | |
Keiyo Co., Ltd. (d) | | | 17,200 | | | | 76,640 | |
Kenko Mayonnaise Co., Ltd. | | | 5,900 | | | | 50,393 | |
Kentucky Fried Chicken Japan, Ltd. | | | 4,000 | | | | 80,339 | |
KEY Coffee, Inc. | | | 10,000 | | | | 150,319 | |
Kimoto Co., Ltd. | | | 10,200 | | | | 94,755 | |
King Jim Co., Ltd. | | | 5,800 | | | | 37,423 | |
Kinki Sharyo Co., Ltd. | | | 21,000 | | | | 65,545 | |
Kintetsu World Express, Inc. | | | 7,400 | | | | 297,926 | |
Kinugawa Rubber Industrial Co., Ltd. | | | 28,000 | | | | 138,998 | |
| | |
Japan—(Continued) | | | | | | | | |
Kisoji Co., Ltd. (d) | | | 7,300 | | | | 129,042 | |
Kissei Pharmaceutical Co., Ltd. | | | 14,600 | | | | 359,822 | |
Kita-Nippon Bank, Ltd. (The) (d) | | | 4,900 | | | | 123,730 | |
Kitagawa Iron Works Co., Ltd. | | | 50,000 | | | | 96,126 | |
Kitamura Co., Ltd. | | | 3,700 | | | | 21,400 | |
Kitano Construction Corp. | | | 22,000 | | | | 51,141 | |
Kito Corp. | | | 4,900 | | | | 97,567 | |
Kitz Corp. (d) | | | 59,100 | | | | 296,961 | |
Kiyo Bank, Ltd. (The) (a) | | | 35,300 | | | | 471,306 | |
KLab, Inc. (a) (d) | | | 14,800 | | | | 113,055 | |
Koa Corp. | | | 18,900 | | | | 194,306 | |
Koatsu Gas Kogyo Co., Ltd. | | | 16,000 | | | | 92,946 | |
Kohnan Shoji Co., Ltd. (d) | | | 17,900 | | | | 184,576 | |
Kohsoku Corp. | | | 5,400 | | | | 47,288 | |
Koike Sanso Kogyo Co., Ltd. | | | 7,000 | | | | 14,045 | |
Kojima Co., Ltd. (a) (d) | | | 12,000 | | | | 32,618 | |
Kokusai Co., Ltd. | | | 3,400 | | | | 41,229 | |
Kokuyo Co., Ltd. (d) | | | 48,400 | | | | 354,798 | |
KOMAIHALTEC, Inc. | | | 24,000 | | | | 76,150 | |
Komatsu Seiren Co., Ltd. | | | 19,000 | | | | 101,304 | |
Komatsu Wall Industry Co., Ltd. | | | 3,800 | | | | 74,798 | |
Komeri Co., Ltd. (d) | | | 16,100 | | | | 412,011 | |
Komori Corp. | | | 41,600 | | | | 708,839 | |
Konaka Co., Ltd. | | | 10,700 | | | | 95,416 | |
Kondotec, Inc. | | | 11,200 | | | | 79,281 | |
Konishi Co., Ltd. | | | 9,200 | | | | 172,558 | |
Kosaido Co., Ltd. (a) | | | 3,700 | | | | 20,456 | |
Kose Corp. | | | 15,700 | | | | 498,735 | |
Koshidaka Holdings Co., Ltd. | | | 2,000 | | | | 55,958 | |
Kotobuki Spirits Co., Ltd. | | | 2,600 | | | | 44,384 | |
Krosaki Harima Corp. | | | 24,000 | | | | 57,306 | |
KRS Corp. | | | 3,700 | | | | 36,619 | |
KU Holdings Co., Ltd. | | | 4,000 | | | | 54,431 | |
Kumiai Chemical Industry Co., Ltd. | | | 28,000 | | | | 190,434 | |
Kura Corp. | | | 6,200 | | | | 93,610 | |
Kurabo Industries, Ltd. (d) | | | 132,000 | | | | 233,717 | |
Kureha Corp. (d) | | | 82,000 | | | | 419,629 | |
Kurimoto, Ltd. | | | 63,000 | | | | 149,373 | |
Kuroda Electric Co., Ltd. (d) | | | 19,200 | | | | 288,235 | |
Kusuri No. Aoki Co., Ltd. | | | 1,700 | | | | 94,981 | |
KYB Co., Ltd. | | | 80,000 | | | | 421,164 | |
Kyodo Printing Co., Ltd. | | | 51,000 | | | | 140,711 | |
Kyodo Shiryo Co., Ltd. | | | 41,000 | | | | 43,649 | |
Kyoei Steel, Ltd. (d) | | | 10,000 | | | | 188,756 | |
Kyoei Tanker Co., Ltd. (a) | | | 9,000 | | | | 21,865 | |
Kyokuto Boeki Kaisha, Ltd. (a) | | | 9,000 | | | | 19,344 | |
Kyokuto Kaihatsu Kogyo Co., Ltd. | | | 20,200 | | | | 260,791 | |
Kyokuto Securities Co., Ltd. | | | 2,000 | | | | 40,640 | |
Kyokuyo Co., Ltd. | | | 45,000 | | | | 113,876 | |
KYORIN Holdings, Inc. | | | 25,000 | | | | 535,327 | |
Kyoritsu Maintenance Co., Ltd. (d) | | | 6,000 | | | | 215,578 | |
Kyoritsu Printing Co., Ltd. | | | 6,800 | | | | 18,158 | |
Kyosan Electric Manufacturing Co., Ltd. | | | 31,000 | | | | 102,395 | |
Kyoto Kimono Yuzen Co., Ltd. | | | 7,300 | | | | 75,312 | |
Kyowa Electronics Instruments Co., Ltd. | | | 8,000 | | | | 30,440 | |
Kyowa Exeo Corp. | | | 45,100 | | | | 596,803 | |
Kyowa Leather Cloth Co., Ltd. | | | 3,300 | | | | 14,724 | |
See accompanying notes to financial statements.
MSF-22
Metropolitan Series Fund
Met/Dimensional International Small Company Portfolio
Schedule of Investments as of December 31, 2013
Common Stocks—(Continued)
| | | | | | | | |
| Security Description | | Shares | | | Value | |
| | |
Japan—(Continued) | | | | | | | | |
Kyudenko Corp. | | | 26,000 | | | $ | 176,892 | |
LAC Co., Ltd. | | | 5,900 | | | | 38,070 | |
Land Business Co., Ltd. | | | 7,100 | | | | 31,934 | |
Lasertec Corp. (d) | | | 9,600 | | | | 93,123 | |
LEC, Inc. | | | 4,400 | | | | 50,650 | |
Life Corp. | | | 15,500 | | | | 246,852 | |
Lintec Corp. | | | 24,200 | | | | 448,602 | |
Lion Corp. (d) | | | 77,000 | | | | 429,906 | |
Look, Inc. | | | 21,000 | | | | 55,949 | |
Macnica, Inc. | | | 6,300 | | | | 168,440 | |
Macromill, Inc. (d) | | | 22,800 | | | | 169,207 | |
Maeda Corp. | | | 74,000 | | | | 490,975 | |
Maeda Road Construction Co., Ltd. | | | 36,000 | | | | 591,964 | |
Maezawa Kasei Industries Co., Ltd. | | | 6,800 | | | | 69,479 | |
Maezawa Kyuso Industries Co., Ltd. | | | 5,600 | | | | 69,755 | |
Makino Milling Machine Co., Ltd. | | | 64,000 | | | | 552,613 | |
Mamiya-Op Co., Ltd. | | | 28,000 | | | | 65,383 | |
Mandom Corp. | | | 9,500 | | | | 300,810 | |
Mani, Inc. (d) | | | 2,500 | | | | 85,198 | |
Mars Engineering Corp. (d) | | | 5,300 | | | | 98,068 | |
Marubun Corp. | | | 8,200 | | | | 44,403 | |
Marudai Food Co., Ltd. | | | 60,000 | | | | 175,640 | |
Maruei Department Store Co., Ltd. (a) (d) | | | 8,000 | | | | 18,265 | |
Maruetsu, Inc. (The) | | | 24,000 | | | | 79,182 | |
Marufuji Sheet Piling Co., Ltd. | | | 13,000 | | | | 34,236 | |
Maruha Nichiro Holdings, Inc. | | | 212,000 | | | | 368,964 | |
Maruka Machinery Co., Ltd. | | | 2,900 | | | | 37,668 | |
Marukyu Co., Ltd. | | | 1,300 | | | | 12,193 | |
Marusan Securities Co., Ltd. (d) | | | 40,600 | | | | 379,143 | |
Maruwa Co., Ltd. (d) | | | 5,400 | | | | 182,010 | |
Maruyama Manufacturing Co., Inc. | | | 24,000 | | | | 62,201 | |
Maruzen CHI Holdings Co., Ltd. (a) | | | 18,800 | | | | 55,075 | |
Maruzen Showa Unyu Co., Ltd. | | | 35,000 | | | | 121,142 | |
Marvelous AQL, Inc. (d) | | | 17,000 | | | | 126,142 | |
Matsuda Sangyo Co., Ltd. | | | 9,000 | | | | 120,469 | |
Matsui Construction Co., Ltd. | | | 9,000 | | | | 36,221 | |
Matsumotokiyoshi Holdings Co., Ltd. (d) | | | 16,200 | | | | 565,997 | |
Matsuya Foods Co., Ltd. (d) | | | 4,800 | | | | 78,932 | |
Max Co., Ltd. | | | 22,000 | | | | 241,947 | |
Maxvalu Nishinihon Co., Ltd. | | | 2,400 | | | | 32,989 | |
Maxvalu Tokai Co., Ltd. | | | 5,000 | | | | 73,159 | |
MEC Co., Ltd. | | | 9,400 | | | | 61,103 | |
Medical System Network Co., Ltd. | | | 7,900 | | | | 35,814 | |
Megachips Corp. | | | 11,000 | | | | 168,155 | |
Megmilk Snow Brand Co., Ltd. (d) | | | 24,000 | | | | 302,482 | |
Meidensha Corp. | | | 91,000 | | | | 340,150 | |
Meiji Shipping Co., Ltd. | | | 8,500 | | | | 38,627 | |
Meiko Electronics Co., Ltd. (d) | | | 7,500 | | | | 56,988 | |
Meiko Network Japan Co., Ltd. | | | 7,200 | | | | 77,053 | |
Meisei Industrial Co., Ltd. | | | 23,000 | | | | 93,820 | |
Meitec Corp. | | | 14,900 | | | | 404,064 | |
Meito Sangyo Co., Ltd. | | | 4,500 | | | | 44,660 | |
Meito Transportation Co., Ltd. | | | 2,800 | | | | 17,663 | |
Meiwa Corp. | | | 10,900 | | | | 39,814 | |
Meiwa Estate Co., Ltd. (a) | | | 8,300 | | | | 40,440 | |
Melco Holdings, Inc. (d) | | | 7,800 | | | | 100,721 | |
Message Co., Ltd. | | | 8,000 | | | | 246,656 | |
| | |
Japan—(Continued) | | | | | | | | |
Michinoku Bank, Ltd. (The) (d) | | | 82,000 | | | | 160,519 | |
Micronics Japan Co., Ltd. | | | 7,700 | | | | 386,917 | |
Mie Bank, Ltd. (The) | | | 54,000 | | | | 116,600 | |
Mikuni Corp. | | | 3,000 | | | | 11,461 | |
Milbon Co., Ltd. (d) | | | 6,960 | | | | 272,447 | |
Mimasu Semiconductor Industry Co., Ltd. | | | 10,500 | | | | 89,732 | |
Minato Bank, Ltd. (The) | | | 86,000 | | | | 142,965 | |
Ministop Co., Ltd. | | | 9,100 | | | | 142,143 | |
Miraial Co., Ltd. | | | 2,900 | | | | 43,367 | |
Mirait Holdings Corp. | | | 34,700 | | | | 308,371 | |
Miroku Jyoho Service Co., Ltd. | | | 7,000 | | | | 26,361 | |
Misawa Homes Co., Ltd. | | | 15,900 | | | | 245,076 | |
Mitani Corp. | | | 9,700 | | | | 200,733 | |
Mitani Sekisan Co., Ltd. | | | 5,000 | | | | 62,874 | |
Mito Securities Co., Ltd. | | | 32,000 | | | | 156,998 | |
Mitsuba Corp. | | | 21,000 | | | | 341,744 | |
Mitsubishi Kakoki Kaisha, Ltd. (a) | | | 43,000 | | | | 72,424 | |
Mitsubishi Nichiyu Forklift Co., Ltd. (d) | | | 16,000 | | | | 115,635 | |
Mitsubishi Paper Mills, Ltd. (a) | | | 198,000 | | | | 173,327 | |
Mitsubishi Pencil Co., Ltd. | | | 10,800 | | | | 240,289 | |
Mitsubishi Research Institute, Inc. | | | 3,300 | | | | 66,867 | |
Mitsubishi Shokuhin Co., Ltd. (d) | | | 5,500 | | | | 133,705 | |
Mitsubishi Steel Manufacturing Co., Ltd. | | | 91,000 | | | | 231,474 | |
Mitsuboshi Belting Co., Ltd. | | | 31,000 | | | | 177,550 | |
Mitsui Engineering & Shipbuilding Co., Ltd. | | | 414,000 | | | | 855,049 | |
Mitsui High-Tec, Inc. | | | 17,500 | | | | 129,682 | |
Mitsui Home Co., Ltd. | | | 17,000 | | | | 83,383 | |
Mitsui Knowledge Industry Co., Ltd. (d) | | | 33,800 | | | | 49,135 | |
Mitsui Matsushima Co., Ltd. | | | 82,000 | | | | 127,939 | |
Mitsui Mining & Smelting Co., Ltd. | | | 320,000 | | | | 984,408 | |
Mitsui Sugar Co., Ltd. | | | 54,000 | | | | 207,617 | |
Mitsui-Soko Co., Ltd. | | | 17,000 | | | | 79,155 | |
Mitsumi Electric Co., Ltd. (a) | | | 60,000 | | | | 501,528 | |
Mitsumura Printing Co., Ltd. | | | 5,000 | | | | 13,109 | |
Mitsuuroko Holdings Co., Ltd. | | | 19,900 | | | | 107,245 | |
Miura Co., Ltd. (d) | | | 15,500 | | | | 387,554 | |
Miyaji Engineering Group, Inc. (a) | | | 36,000 | | | | 98,234 | |
Miyazaki Bank, Ltd. (The) | | | 98,000 | | | | 274,246 | |
Miyoshi Oil & Fat Co., Ltd. | | | 40,000 | | | | 59,771 | |
Mizuno Corp. (d) | | | 46,000 | | | | 233,420 | |
Mochida Pharmaceutical Co., Ltd. | | | 6,600 | | | | 392,221 | |
Modec, Inc. | | | 7,000 | | | | 201,227 | |
Monex Group, Inc. | | | 3,000 | | | | 13,486 | |
Money Partners Group Co., Ltd. | | | 11,900 | | | | 31,817 | |
Monogatari Corp. (The) | | | 1,900 | | | | 57,366 | |
MORESCO Corp. | | | 3,000 | | | | 54,108 | |
Morinaga & Co., Ltd. | | | 114,000 | | | | 234,142 | |
Morinaga Milk Industry Co., Ltd. | | | 104,000 | | | | 308,445 | |
Morita Holdings Corp. | | | 25,000 | | | | 210,224 | |
Morozoff, Ltd. | | | 13,000 | | | | 39,040 | |
Mory Industries, Inc. | | | 18,000 | | | | 71,059 | |
MOS Food Services, Inc. | | | 12,700 | | | | 240,922 | |
Moshi Moshi Hotline, Inc. | | | 22,400 | | | | 240,031 | |
Mr Max Corp. | | | 10,500 | | | | 32,838 | |
MTI, Ltd. (d) | | | 4,300 | | | | 68,392 | |
Murakami Corp. | | | 3,000 | | | | 40,598 | |
Musashi Seimitsu Industry Co., Ltd. (d) | | | 11,200 | | | | 242,810 | |
See accompanying notes to financial statements.
MSF-23
Metropolitan Series Fund
Met/Dimensional International Small Company Portfolio
Schedule of Investments as of December 31, 2013
Common Stocks—(Continued)
| | | | | | | | |
| Security Description | | Shares | | | Value | |
| | |
Japan—(Continued) | | | | | | | | |
Musashino Bank, Ltd. (The) | | | 18,100 | | | $ | 608,354 | |
Mutoh Holdings Co., Ltd. | | | 7,000 | | | | 35,247 | |
NAC Co., Ltd. | | | 5,300 | | | | 83,704 | |
Nachi-Fujikoshi Corp. | | | 77,000 | | | | 435,238 | |
Nafco Co., Ltd. | | | 1,400 | | | | 21,157 | |
Nagaileben Co., Ltd. | | | 7,200 | | | | 108,740 | |
Nagano Bank, Ltd. (The) | | | 49,000 | | | | 84,818 | |
Nagano Keiki Co., Ltd. | | | 4,200 | | | | 27,859 | |
Nagatanien Co., Ltd. | | | 14,000 | | | | 121,873 | |
Nagawa Co., Ltd. | | | 3,400 | | | | 66,920 | |
Nakabayashi Co., Ltd. | | | 24,000 | | | | 48,114 | |
Nakamuraya Co., Ltd. | | | 26,000 | | | | 97,875 | |
Nakanishi, Inc. | | | 200 | | | | 28,619 | |
Nakano Corp. | | | 4,000 | | | | 9,521 | |
Nakayama Steel Works, Ltd. (a) (d) | | | 63,000 | | | | 56,917 | |
Nakayamafuku Co., Ltd. | | | 2,000 | | | | 15,823 | |
Namura Shipbuilding Co., Ltd. | | | 16,100 | | | | 217,940 | |
Nanto Bank, Ltd. (The) | | | 115,000 | | | | 429,656 | |
Natori Co., Ltd. | | | 4,000 | | | | 38,334 | |
NDS Co., Ltd. | | | 27,000 | | | | 74,641 | |
NEC Capital Solutions, Ltd. | | | 5,500 | | | | 150,841 | |
NEC Fielding, Ltd. | | | 9,800 | | | | 109,179 | |
NEC Networks & System Integration Corp. | | | 12,200 | | | | 294,993 | |
NET One Systems Co., Ltd. (d) | | | 47,900 | | | | 314,061 | |
Neturen Co., Ltd. | | | 18,300 | | | | 150,575 | |
New Japan Chemical Co., Ltd. (a) (d) | | | 20,100 | | | | 53,745 | |
Nice Holdings, Inc. | | | 40,000 | | | | 94,932 | |
Nichi-iko Pharmaceutical Co., Ltd. (d) | | | 8,800 | | | | 135,825 | |
Nichia Steel Works, Ltd. | | | 13,000 | | | | 50,663 | |
Nichias Corp. | | | 54,000 | | | | 370,319 | |
Nichiban Co., Ltd. | | | 14,000 | | | | 48,830 | |
Nichicon Corp. | | | 33,700 | | | | 327,119 | |
Nichiden Corp. | | | 4,000 | | | | 84,570 | |
Nichiha Corp. | | | 12,900 | | | | 177,189 | |
Nichii Gakkan Co. | | | 24,700 | | | | 198,105 | |
Nichimo Co., Ltd. | | | 16,000 | | | | 30,435 | |
Nichirei Corp. | | | 129,000 | | | | 658,819 | |
Nichireki Co., Ltd. | | | 16,000 | | | | 159,783 | |
Nidec Copal Electronics Corp. | | | 11,200 | | | | 65,809 | |
Nifco, Inc. | | | 24,000 | | | | 636,331 | |
NIFTY Corp. | | | 4,500 | | | | 51,749 | |
Nihon Chouzai Co., Ltd. | | | 80 | | | | 2,130 | |
Nihon Dempa Kogyo Co., Ltd. | | | 11,000 | | | | 94,313 | |
Nihon Eslead Corp. | | | 2,700 | | | | 29,081 | |
Nihon Kagaku Sangyo Co., Ltd. | | | 3,000 | | | | 21,162 | |
Nihon Kohden Corp. | | | 18,700 | | | | 653,403 | |
Nihon M&A Center, Inc. | | | 5,000 | | | | 337,904 | |
Nihon Nohyaku Co., Ltd. | | | 26,000 | | | | 372,520 | |
Nihon Parkerizing Co., Ltd. | | | 24,000 | | | | 500,997 | |
Nihon Plast Co., Ltd. | | | 2,500 | | | | 17,158 | |
Nihon Shokuhin Kako Co., Ltd. | | | 3,000 | | | | 10,199 | |
Nihon Tokushu Toryo Co., Ltd. | | | 2,200 | | | | 12,892 | |
Nihon Unisys, Ltd. | | | 9,900 | | | | 86,985 | |
Nihon Yamamura Glass Co., Ltd. | | | 54,000 | | | | 95,442 | |
Nikkato Corp. | | | 300 | | | | 1,173 | |
Nikkiso Co., Ltd. | | | 31,000 | | | | 390,351 | |
Nikko Co., Ltd. (d) | | | 17,000 | | | | 118,508 | |
| | |
Japan—(Continued) | | | | | | | | |
Nippon Beet Sugar Manufacturing Co., Ltd. | | | 71,000 | | | | 125,597 | |
Nippon Carbon Co., Ltd. (d) | | | 71,000 | | | | 133,867 | |
Nippon Ceramic Co., Ltd. (d) | | | 8,500 | | | | 133,033 | |
Nippon Chemi-Con Corp. (a) (d) | | | 89,000 | | | | 342,777 | |
Nippon Chemical Industrial Co., Ltd. (a) | | | 55,000 | | | | 74,900 | |
Nippon Chemiphar Co., Ltd. | | | 14,000 | | | | 62,407 | |
Nippon Chutetsukan KK | | | 2,000 | | | | 4,477 | |
Nippon Coke & Engineering Co., Ltd. | | | 148,000 | | | | 190,092 | |
Nippon Columbia Co., Ltd. (a) | | | 4,100 | | | | 23,705 | |
Nippon Concrete Industries Co., Ltd. (d) | | | 14,000 | | | | 64,268 | |
Nippon Conveyor Co., Ltd. (a) (d) | | | 24,000 | | | | 32,421 | |
Nippon Denko Co., Ltd. | | | 60,000 | | | | 180,937 | |
Nippon Densetsu Kogyo Co., Ltd. | | | 21,000 | | | | 285,882 | |
Nippon Felt Co., Ltd. | | | 8,600 | | | | 37,742 | |
Nippon Filcon Co., Ltd. | | | 5,200 | | | | 22,017 | |
Nippon Fine Chemical Co., Ltd. | | | 5,800 | | | | 36,261 | |
Nippon Flour Mills Co., Ltd. (d) | | | 64,000 | | | | 315,490 | |
Nippon Formula Feed Manufacturing Co., Ltd. | | | 43,000 | | | | 49,908 | |
Nippon Gas Co., Ltd. | | | 15,400 | | | | 163,866 | |
Nippon Hume Corp. | | | 11,000 | | | | 96,679 | |
Nippon Jogesuido Sekkei Co., Ltd. (d) | | | 3,300 | | | | 40,192 | |
Nippon Kanzai Co., Ltd. | | | 3,300 | | | | 61,749 | |
Nippon Kasei Chemical Co., Ltd. | | | 18,000 | | | | 24,830 | |
Nippon Kinzoku Co., Ltd. (a) | | | 29,000 | | | | 39,160 | |
Nippon Kodoshi Corp. | | | 700 | | | | 8,827 | |
Nippon Koei Co., Ltd. | | | 42,000 | | | | 176,883 | |
Nippon Konpo Unyu Soko Co., Ltd. | | | 31,000 | | | | 558,844 | |
Nippon Koshuha Steel Co., Ltd. (a) | | | 47,000 | | | | 47,439 | |
Nippon Kucho Service Co., Ltd. | | | 3,000 | | | | 32,509 | |
Nippon Light Metal Holdings Co., Ltd. (d) | | | 301,800 | | | | 408,341 | |
Nippon Paper Industries Co., Ltd. (d) | | | 20,100 | | | | 373,759 | |
Nippon Parking Development Co., Ltd. | | | 803 | | | | 62,151 | |
Nippon Pillar Packing Co., Ltd. | | | 13,000 | | | | 89,586 | |
Nippon Piston Ring Co., Ltd. | | | 50,000 | | | | 95,753 | |
Nippon Rietec Co., Ltd. | | | 7,000 | | | | 48,280 | |
Nippon Road Co., Ltd. (The) | | | 43,000 | | | | 242,917 | |
Nippon Seiki Co., Ltd. | | | 24,000 | | | | 464,432 | |
Nippon Seiro Co., Ltd. | | | 2,000 | | | | 4,867 | |
Nippon Seisen Co., Ltd. | | | 10,000 | | | | 44,017 | |
Nippon Sharyo, Ltd. (d) | | | 37,000 | | | | 183,964 | |
Nippon Sheet Glass Co., Ltd. (a) | | | 527,000 | | | | 687,436 | |
Nippon Shinyaku Co., Ltd. | | | 27,000 | | | | 525,631 | |
Nippon Signal Co., Ltd. (d) | | | 32,400 | | | | 273,922 | |
Nippon Soda Co., Ltd. | | | 79,000 | | | | 504,388 | |
Nippon Steel & Sumikin Bussan (d) | | | 96,960 | | | | 363,194 | |
Nippon Steel & Sumikin Texeng | | | 29,000 | | | | 120,654 | |
Nippon Suisan Kaisha, Ltd. (a) | | | 142,400 | | | | 323,657 | |
Nippon Synthetic Chemical Industry Co., Ltd. (The) | | | 33,000 | | | | 296,166 | |
Nippon Thompson Co., Ltd. | | | 48,000 | | | | 266,755 | |
Nippon Valqua Industries, Ltd. | | | 47,000 | | | | 126,544 | |
Nipro Corp. (d) | | | 55,400 | | | | 501,406 | |
Nishi-Nippon Railroad Co., Ltd. | | | 21,000 | | | | 77,629 | |
Nishikawa Rubber Co., Ltd. | | | 1,200 | | | | 20,677 | |
Nishimatsu Construction Co., Ltd. | | | 191,000 | | | | 608,553 | |
Nishimatsuya Chain Co., Ltd. | | | 28,600 | | | | 224,688 | |
Nishio Rent All Co., Ltd. | | | 8,900 | | | | 225,380 | |
See accompanying notes to financial statements.
MSF-24
Metropolitan Series Fund
Met/Dimensional International Small Company Portfolio
Schedule of Investments as of December 31, 2013
Common Stocks—(Continued)
| | | | | | | | |
| Security Description | | Shares | | | Value | |
| | |
Japan—(Continued) | | | | | | | | |
Nissan Shatai Co., Ltd. | | | 2,000 | | | $ | 29,075 | |
Nissan Tokyo Sales Holdings Co., Ltd. | | | 11,000 | | | | 47,840 | |
Nissei ASB Machine Co., Ltd. | | | 2,100 | | | | 51,951 | |
Nissei Corp. | | | 3,700 | | | | 31,704 | |
Nissei Plastic Industrial Co., Ltd. | | | 7,100 | | | | 42,151 | |
Nissen Holdings Co., Ltd. (d) | | | 17,900 | | | | 68,713 | |
Nisshin Fudosan Co. | | | 18,400 | | | | 76,751 | |
Nisshin Oillio Group, Ltd. (The) (d) | | | 65,000 | | | | 211,253 | |
Nisshin Steel Holdings Co., Ltd. | | | 35,896 | | | | 430,434 | |
Nisshinbo Holdings, Inc. | | | 82,000 | | | | 789,607 | |
Nissin Corp. | | | 44,000 | | | | 123,984 | |
Nissin Electric Co., Ltd. | | | 30,000 | | | | 183,509 | |
Nissin Kogyo Co., Ltd. | | | 20,000 | | | | 424,146 | |
Nissin Sugar Co., Ltd. | | | 2,400 | | | | 48,527 | |
Nissui Pharmaceutical Co., Ltd. | | | 6,000 | | | | 62,536 | |
Nitta Corp. | | | 12,800 | | | | 282,412 | |
Nittan Valve Co., Ltd. | | | 6,300 | | | | 19,218 | |
Nittetsu Mining Co., Ltd. | | | 38,000 | | | | 187,458 | |
Nitto Boseki Co., Ltd. (d) | | | 88,000 | | | | 465,176 | |
Nitto FC Co., Ltd. | | | 4,500 | | | | 26,242 | |
Nitto Fuji Flour Milling Co., Ltd. | | | 4,000 | | | | 11,898 | |
Nitto Kogyo Corp. | | | 15,100 | | | | 255,923 | |
Nitto Kohki Co., Ltd. | | | 7,300 | | | | 131,049 | |
Nitto Seiko Co., Ltd. | | | 15,000 | | | | 49,379 | |
Nittoc Construction Co., Ltd. | | | 13,550 | | | | 51,309 | |
Nittoku Engineering Co., Ltd. (d) | | | 8,700 | | | | 79,271 | |
Noevir Holdings Co., Ltd. | | | 9,900 | | | | 179,248 | |
NOF Corp. | | | 83,000 | | | | 590,975 | |
Nohmi Bosai, Ltd. | | | 13,000 | | | | 128,569 | |
Nomura Co., Ltd. | | | 21,000 | | | | 175,188 | |
Noritake Co., Ltd. | | | 75,000 | | | | 183,962 | |
Noritsu Koki Co., Ltd. | | | 8,000 | | | | 50,490 | |
Noritz Corp. | | | 15,800 | | | | 338,555 | |
North Pacific Bank, Ltd. | | | 132,800 | | | | 540,799 | |
NS Solutions Corp. | | | 9,000 | | | | 199,147 | |
NS United Kaiun Kaisha, Ltd. (a) | | | 67,000 | | | | 197,385 | |
NSD Co., Ltd. | | | 20,900 | | | | 247,637 | |
Nuflare Technology, Inc. | | | 1,300 | | | | 161,656 | |
Obara Group, Inc. | | | 6,400 | | | | 200,329 | |
Obayashi Road Corp. | | | 16,000 | | | | 88,368 | |
OBIC Business Consultants, Ltd. | | | 5,500 | | | | 179,427 | |
Oenon Holdings, Inc. | | | 34,000 | | | | 78,890 | |
Ogaki Kyoritsu Bank, Ltd. (The) | | | 177,000 | | | | 487,070 | |
Ohara, Inc. | | | 4,700 | | | | 28,767 | |
Ohashi Technica, Inc. | | | 4,600 | | | | 41,996 | |
Ohsho Food Service Corp. (d) | | | 5,400 | | | | 165,251 | |
Oiles Corp. | | | 14,000 | | | | 283,445 | |
Oita Bank, Ltd. (The) | | | 104,000 | | | | 385,788 | |
Okabe Co., Ltd. | | | 25,700 | | | | 303,390 | |
Okamoto Industries, Inc. | | | 44,000 | | | | 137,218 | |
Okamoto Machine Tool Works, Ltd. (a) | | | 27,000 | | | | 30,818 | |
Okamura Corp. | | | 32,000 | | | | 272,150 | |
Okaya Electric Industries Co., Ltd. | | | 8,900 | | | | 31,642 | |
OKI Electric Cable Co., Ltd. (a) | | | 6,000 | | | | 11,414 | |
Okinawa Cellular Telephone Co. | | | 5,800 | | | | 151,968 | |
Okinawa Electric Power Co., Inc. (The) | | | 9,300 | | | | 313,060 | |
OKK Corp. (d) | | | 41,000 | | | | 55,477 | |
| | |
Japan—(Continued) | | | | | | | | |
OKUMA Corp. (d) | | | 70,000 | | | | 772,666 | |
Okumura Corp. | | | 94,000 | | | | 435,547 | |
Okura Industrial Co., Ltd. | | | 30,000 | | | | 103,574 | |
Okuwa Co., Ltd. | | | 11,000 | | | | 95,565 | |
Olympic Corp. | | | 7,800 | | | | 55,988 | |
ONO Sokki Co., Ltd. | | | 11,000 | | | | 46,936 | |
Onoken Co., Ltd. | | | 9,400 | | | | 118,627 | |
Onward Holdings Co., Ltd. | | | 64,000 | | | | 485,304 | |
OPT, Inc. | | | 4,700 | | | | 44,690 | |
Optex Co., Ltd. (d) | | | 6,500 | | | | 105,826 | |
Organo Corp. | | | 24,000 | | | | 107,644 | |
Origin Electric Co., Ltd. | | | 19,000 | | | | 57,951 | |
Osaka Organic Chemical Industry, Ltd. | | | 8,500 | | | | 38,638 | |
Osaka Steel Co., Ltd. (d) | | | 8,300 | | | | 144,073 | |
OSAKA Titanium Technologies Co., Ltd. (d) | | | 6,900 | | | | 120,352 | |
Osaki Electric Co., Ltd. (d) | | | 17,000 | | | | 88,661 | |
OSG Corp. | | | 35,400 | | | | 602,041 | |
Otsuka Kagu, Ltd. | | | 5,500 | | | | 53,619 | |
OUG Holdings, Inc. | | | 7,000 | | | | 12,836 | |
Oyo Corp. | | | 11,800 | | | | 180,742 | |
Pacific Industrial Co., Ltd. | | | 24,000 | | | | 167,273 | |
Pacific Metals Co., Ltd. (d) | | | 81,000 | | | | 296,862 | |
Pack Corp. (The) | | | 7,800 | | | | 138,570 | |
Pal Co., Ltd. | | | 5,300 | | | | 129,677 | |
Paltac Corp. | | | 18,450 | | | | 239,125 | |
PanaHome Corp. | | | 45,000 | | | | 331,750 | |
Panasonic Industrial Devices SUNX Co., Ltd. | | | 11,200 | | | | 52,336 | |
Panasonic Information Systems | | | 1,700 | | | | 48,977 | |
Paramount Bed Holdings Co., Ltd. | | | 8,000 | | | | 268,163 | |
Parco Co., Ltd. | | | 11,200 | | | | 105,628 | |
Paris Miki Holdings, Inc. | | | 17,000 | | | | 78,037 | |
Pasco Corp. | | | 11,000 | | | | 51,178 | |
Pasona Group, Inc. | | | 3,700 | | | | 26,049 | |
Penta-Ocean Construction Co., Ltd. | | | 140,000 | | | | 492,064 | |
Pilot Corp. | | | 7,300 | | | | 251,236 | |
Piolax, Inc. | | | 5,900 | | | | 232,796 | |
Pioneer Corp. (a) (d) | | | 153,800 | | | | 322,462 | |
Plenus Co., Ltd. | | | 10,400 | | | | 232,464 | |
Press Kogyo Co., Ltd. (d) | | | 60,000 | | | | 249,044 | |
Pressance Corp. | | | 2,600 | | | | 76,271 | |
Prestige International, Inc. | | | 10,400 | | | | 97,870 | |
Prima Meat Packers, Ltd. | | | 78,000 | | | | 143,847 | |
Pronexus, Inc. | | | 12,300 | | | | 78,976 | |
Proto Corp. | | | 6,400 | | | | 89,450 | |
Qol Co., Ltd. | | | 4,700 | | | | 27,212 | |
Raito Kogyo Co., Ltd. | | | 29,800 | | | | 219,122 | |
Relo Holdings, Inc. | | | 5,400 | | | | 276,729 | |
Renaissance, Inc. | | | 5,100 | | | | 38,058 | |
Rengo Co., Ltd. | | | 120,000 | | | | 723,680 | |
Renown, Inc. (a) | | | 29,200 | | | | 38,053 | |
Resort Solution Co., Ltd. | | | 4,000 | | | | 9,249 | |
Resorttrust, Inc. | | | 32,800 | | | | 599,335 | |
Rheon Automatic Machinery Co., Ltd. | | | 5,000 | | | | 29,216 | |
Rhythm Watch Co., Ltd. | | | 64,000 | | | | 85,896 | |
Riberesute Corp. (d) | | | 4,300 | | | | 27,154 | |
Ricoh Leasing Co., Ltd. | | | 9,300 | | | | 275,809 | |
Right On Co., Ltd. | | | 7,900 | | | | 55,885 | |
See accompanying notes to financial statements.
MSF-25
Metropolitan Series Fund
Met/Dimensional International Small Company Portfolio
Schedule of Investments as of December 31, 2013
Common Stocks—(Continued)
| | | | | | | | |
| Security Description | | Shares | | | Value | |
| | |
Japan—(Continued) | | | | | | | | |
Riken Corp. | | | 55,000 | | | $ | 239,656 | |
Riken Keiki Co., Ltd. | | | 8,400 | | | | 68,812 | |
Riken Technos Corp. | | | 23,000 | | | | 129,433 | |
Riken Vitamin Co., Ltd. | | | 4,800 | | | | 102,488 | |
Riso Kagaku Corp. | | | 10,179 | | | | 209,382 | |
Riso Kyoiku Co., Ltd. (d) | | | 11,590 | | | | 57,116 | |
Rock Field Co., Ltd. | | | 5,500 | | | | 98,366 | |
Rohto Pharmaceutical Co., Ltd. | | | 37,000 | | | | 564,651 | |
Rokko Butter Co., Ltd. (d) | | | 5,500 | | | | 44,080 | |
Roland Corp. | | | 8,300 | | | | 112,789 | |
Round One Corp. | | | 43,800 | | | | 351,829 | |
Royal Holdings Co., Ltd. (d) | | | 15,800 | | | | 236,719 | |
Ryobi, Ltd. | | | 88,000 | | | | 355,135 | |
Ryoden Trading Co., Ltd. (d) | | | 18,000 | | | | 122,759 | |
Ryosan Co., Ltd. | | | 20,500 | | | | 436,841 | |
Ryoyo Electro Corp. (d) | | | 8,600 | | | | 88,567 | |
S Foods, Inc. | | | 7,500 | | | | 76,261 | |
S&B Foods, Inc. | | | 600 | | | | 20,971 | |
Sagami Chain Co., Ltd. | | | 6,000 | | | | 51,358 | |
Saibu Gas Co., Ltd. | | | 161,000 | | | | 377,824 | |
Saizeriya Co., Ltd. (d) | | | 16,200 | | | | 198,356 | |
Sakai Chemical Industry Co., Ltd. | | | 64,000 | | | | 197,988 | |
Sakai Heavy Industries, Ltd. | | | 21,000 | | | | 81,250 | |
Sakai Moving Service Co., Ltd. | | | 2,100 | | | | 67,338 | |
Sakai Ovex Co., Ltd. | | | 32,000 | | | | 66,958 | |
Sakata INX Corp. | | | 26,000 | | | | 247,772 | |
Sakata Seed Corp. | | | 17,300 | | | | 219,440 | |
Sala Corp. | | | 12,900 | | | | 61,786 | |
San Holdings, Inc. | | | 2,700 | | | | 36,267 | |
San-A Co., Ltd. | | | 8,800 | | | | 240,657 | |
San-Ai Oil Co., Ltd. | | | 34,000 | | | | 160,077 | |
San-In Godo Bank, Ltd. (The) | | | 92,000 | | | | 660,949 | |
Sanden Corp. (d) | | | 71,000 | | | | 338,258 | |
Sanei Architecture Planning Co., Ltd. | | | 4,300 | | | | 34,211 | |
Sangetsu Co., Ltd. (d) | | | 15,400 | | | | 384,040 | |
Sanken Electric Co., Ltd. | | | 61,000 | | | | 450,299 | |
Sanki Engineering Co., Ltd. | | | 35,000 | | | | 220,380 | |
Sanko Marketing Foods Co., Ltd. | | | 3,100 | | �� | | 27,320 | |
Sanko Metal Industrial Co., Ltd. | | | 10,000 | | | | 24,843 | |
Sankyo Seiko Co., Ltd. | | | 22,100 | | | | 74,631 | |
Sankyo Tateyama, Inc. | | | 14,200 | | | | 282,505 | |
Sankyu, Inc. | | | 149,000 | | | | 581,293 | |
Sanoh Industrial Co., Ltd. | | | 13,800 | | | | 96,277 | |
Sanshin Electronics Co., Ltd. | | | 16,800 | | | | 116,288 | |
Sanwa Holdings Corp. | | | 106,000 | | | | 719,777 | |
Sanyo Chemical Industries, Ltd. | | | 32,000 | | | | 219,472 | |
Sanyo Denki Co., Ltd. | | | 23,000 | | | | 143,330 | |
Sanyo Electric Railway Co., Ltd. | | | 5,000 | | | | 20,002 | |
Sanyo Housing Nagoya Co., Ltd. | | | 5,100 | | | | 56,693 | |
Sanyo Industries, Ltd. | | | 13,000 | | | | 23,385 | |
Sanyo Shokai, Ltd. (d) | | | 73,000 | | | | 197,839 | |
Sanyo Special Steel Co., Ltd. | | | 67,000 | | | | 328,101 | |
Sapporo Holdings, Ltd. (d) | | | 173,000 | | | | 727,703 | |
Sasebo Heavy Industries Co., Ltd. (a) | | | 74,000 | | | | 83,158 | |
Sata Construction Co., Ltd. | | | 42,000 | | | | 57,192 | |
Sato Holdings Corp. (d) | | | 11,900 | | | | 270,178 | |
Sato Shoji Corp. | | | 6,500 | | | | 41,794 | |
| | |
Japan—(Continued) | | | | | | | | |
Satori Electric Co., Ltd. | | | 7,100 | | | | 42,157 | |
Sawada Holdings Co., Ltd. (d) | | | 12,700 | | | | 155,319 | |
Sawai Pharmaceutical Co., Ltd. | | | 6,800 | | | | 438,997 | |
Saxa Holdings, Inc. | | | 33,000 | | | | 50,552 | |
SBS Holdings, Inc. | | | 2,300 | | | | 34,333 | |
Scroll Corp. | | | 15,700 | | | | 50,884 | |
SEC Carbon, Ltd. | | | 7,000 | | | | 21,953 | |
Secom Joshinetsu Co., Ltd. | | | 900 | | | | 21,620 | |
Seibu Electric Industry Co., Ltd. | | | 12,000 | | | | 52,117 | |
Seika Corp. | | | 34,000 | | | | 80,510 | |
Seikagaku Corp. | | | 13,400 | | | | 163,964 | |
Seikitokyu Kogyo Co., Ltd. (a) | | | 64,000 | | | | 87,450 | |
Seiko Holdings Corp. | | | 44,000 | | | | 217,334 | |
Seiko PMC Corp. (d) | | | 6,300 | | | | 28,606 | |
Seino Holdings Co., Ltd. | | | 56,000 | | | | 590,339 | |
Seiren Co., Ltd. | | | 29,600 | | | | 235,480 | |
Sekisui Jushi Corp. | | | 18,000 | | | | 255,796 | |
Sekisui Plastics Co., Ltd. | | | 24,000 | | | | 64,332 | |
Senko Co., Ltd. (d) | | | 52,000 | | | | 269,780 | |
Senshu Electric Co., Ltd. | | | 3,200 | | | | 36,811 | |
Senshu Ikeda Holdings, Inc. | | | 102,900 | | | | 479,016 | |
Senshukai Co., Ltd. (d) | | | 18,700 | | | | 156,599 | |
Septeni Holdings Co., Ltd. | | | 8,000 | | | | 99,357 | |
Seria Co., Ltd. | | | 4,700 | | | | 189,181 | |
Shibaura Electronics Co., Ltd. | | | 2,800 | | | | 45,995 | |
Shibaura Mechatronics Corp. (a) (d) | | | 18,000 | | | | 41,611 | |
Shibusawa Warehouse Co., Ltd. (The) | | | 29,000 | | | | 114,956 | |
Shibuya Kogyo Co., Ltd. | | | 11,600 | | | | 197,050 | |
Shidax Corp. | | | 9,600 | | | | 47,884 | |
Shiga Bank, Ltd. (The) | | | 96,000 | | | | 505,006 | |
Shikibo, Ltd. | | | 83,000 | | | | 106,621 | |
Shikoku Bank, Ltd. (The) | | | 108,000 | | | | 242,550 | |
Shikoku Chemicals Corp. | | | 21,000 | | | | 159,033 | |
Shima Seiki Manufacturing, Ltd. | | | 16,300 | | | | 306,681 | |
Shimachu Co., Ltd. | | | 27,300 | | | | 646,752 | |
SHIMANE BANK, Ltd. (The) (d) | | | 2,500 | | | | 31,226 | |
Shimizu Bank, Ltd. (The) | | | 5,400 | | | | 144,917 | |
Shimojima Co., Ltd. | | | 6,300 | | | | 58,623 | |
Shin Nippon Air Technologies Co., Ltd. | | | 7,300 | | | | 44,017 | |
Shin-Etsu Polymer Co., Ltd. | | | 28,500 | | | | 102,713 | |
Shin-Keisei Electric Railway Co., Ltd. | | | 23,000 | | | | 81,261 | |
Shinagawa Refractories Co., Ltd. | | | 27,000 | | | | 57,520 | |
Shindengen Electric Manufacturing Co., Ltd. | | | 45,000 | | | | 273,771 | |
Shinkawa, Ltd. | | | 5,300 | | | | 34,626 | |
Shinko Electric Industries Co., Ltd. (d) | | | 40,300 | | | | 334,679 | |
Shinko Plantech Co., Ltd. | | | 23,800 | | | | 185,061 | |
Shinko Shoji Co., Ltd. (d) | | | 13,500 | | | | 112,641 | |
Shinko Wire Co., Ltd. | | | 12,000 | | | | 21,851 | |
Shinmaywa Industries, Ltd. | | | 54,000 | | | | 469,026 | |
Shinnihon Corp. | | | 19,000 | | | | 60,109 | |
Shinsho Corp. | | | 30,000 | | | | 67,968 | |
Shinwa Co., Ltd. | | | 3,900 | | | | 43,802 | |
Ship Healthcare Holdings, Inc. | | | 16,600 | | | | 644,648 | |
Shiroki Corp. | | | 31,000 | | | | 66,121 | |
Shizuki Electric Co., Inc. | | | 8,000 | | | | 34,837 | |
Shizuoka Gas Co., Ltd. | | | 31,500 | | | | 187,391 | |
Shobunsha Publications, Inc. | | | 6,700 | | | | 41,447 | |
See accompanying notes to financial statements.
MSF-26
Metropolitan Series Fund
Met/Dimensional International Small Company Portfolio
Schedule of Investments as of December 31, 2013
Common Stocks—(Continued)
| | | | | | | | |
| Security Description | | Shares | | | Value | |
| | |
Japan—(Continued) | | | | | | | | |
Shoei Foods Corp. | | | 4,300 | | | $ | 32,027 | |
Shofu, Inc. | | | 3,900 | | | | 32,443 | |
Shoko Co., Ltd. (d) | | | 39,000 | | | | 61,185 | |
Showa Aircraft Industry Co., Ltd. (d) | | | 5,000 | | | | 58,999 | |
Showa Corp. | | | 29,300 | | | | 472,775 | |
Showa Sangyo Co., Ltd. | | | 46,000 | | | | 139,932 | |
Siix Corp. (d) | | | 8,900 | | | | 108,167 | |
Sinanen Co., Ltd. | | | 27,000 | | | | 105,460 | |
Sinfonia Technology Co., Ltd. | | | 58,000 | | | | 93,319 | |
Sinko Industries, Ltd. | | | 7,600 | | | | 61,211 | |
Sintokogio, Ltd. | | | 29,200 | | | | 219,285 | |
SKY Perfect JSAT Holdings, Inc. | | | 87,000 | | | | 471,368 | |
SMK Corp. | | | 40,000 | | | | 265,223 | |
SNT Corp. | | | 10,900 | | | | 42,452 | |
Soda Nikka Co., Ltd. | | | 7,000 | | | | 29,401 | |
Sodick Co., Ltd. | | | 28,100 | | | | 124,811 | |
Soft99 Corp. | | | 5,100 | | | | 33,299 | |
Softbank Technology Corp. (d) | | | 1,600 | | | | 26,288 | |
Software Service, Inc. | | | 1,500 | | | | 49,577 | |
Sogo Medical Co., Ltd. | | | 2,800 | | | | 106,688 | |
Soshin Electric Co., Ltd. | | | 1,500 | | | | 5,446 | |
Sotetsu Holdings, Inc. | | | 6,000 | | | | 20,537 | |
Sotoh Co., Ltd. | | | 4,300 | | | | 37,094 | |
Space Co., Ltd. | | | 5,800 | | | | 50,776 | |
SPK Corp. (d) | | | 2,500 | | | | 43,717 | |
Square Enix Holdings Co., Ltd. (d) | | | 36,000 | | | | 630,216 | |
SRA Holdings | | | 5,600 | | | | 68,914 | |
Srg Takamiya Co., Ltd. | | | 2,600 | | | | 28,891 | |
ST Corp. | | | 6,900 | | | | 65,195 | |
St. Marc Holdings Co., Ltd. | | | 4,400 | | | | 210,262 | |
Star Micronics Co., Ltd. (d) | | | 23,400 | | | | 272,832 | |
Starbucks Coffee Japan, Ltd. (d) | | | 4,300 | | | | 47,642 | |
Starts Corp., Inc. | | | 4,500 | | | | 64,531 | |
Starzen Co., Ltd. | | | 38,000 | | | | 98,559 | |
Stella Chemifa Corp. | | | 5,600 | | | | 84,404 | |
Step Co., Ltd. | | | 4,100 | | | | 31,856 | |
Studio Alice Co., Ltd. | | | 4,900 | | | | 64,505 | |
Subaru Enterprise Co., Ltd. | | | 1,000 | | | | 3,755 | |
Sugimoto & Co., Ltd. | | | 3,800 | | | | 35,566 | |
Sumida Corp. | | | 8,500 | | | | 41,766 | |
Suminoe Textile Co., Ltd. | | | 31,000 | | | | 85,500 | |
Sumitomo Bakelite Co., Ltd. | | | 109,000 | | | | 392,097 | |
Sumitomo Densetsu Co., Ltd. | | | 10,500 | | | | 151,246 | |
Sumitomo Forestry Co., Ltd. | | | 400 | | | | 4,663 | |
Sumitomo Mitsui Construction Co., Ltd. (a) (d) | | | 119,000 | | | | 145,166 | |
Sumitomo Osaka Cement Co., Ltd. | | | 230,000 | | | | 884,101 | |
Sumitomo Precision Products Co., Ltd. | | | 21,000 | | | | 90,482 | |
Sumitomo Real Estate Sales Co., Ltd. | | | 8,760 | | | | 268,533 | |
Sumitomo Seika Chemicals Co., Ltd. | | | 30,000 | | | | 246,148 | |
Sumitomo Warehouse Co., Ltd. (The) | | | 73,000 | | | | 422,717 | |
Sun-Wa Technos Corp. | | | 3,900 | | | | 32,770 | |
Suncall Corp. | | | 11,000 | | | | 71,957 | |
SWCC Showa Holdings Co., Ltd. (a) (d) | | | 163,000 | | | | 165,824 | |
Systena Corp. | | | 12,600 | | | | 89,329 | |
T Hasegawa Co., Ltd. | | | 11,800 | | | | 162,516 | |
T RAD Co., Ltd. | | | 41,000 | | | | 111,454 | |
T&K Toka Co., Ltd. | | | 5,600 | | | | 122,537 | |
| | |
Japan—(Continued) | | | | | | | | |
Tachi-S Co., Ltd. (d) | | | 15,100 | | | | 209,051 | |
Tachibana Eletech Co., Ltd. | | | 5,900 | | | | 77,969 | |
Tadano, Ltd. | | | 46,000 | | | | 618,443 | |
Taihei Dengyo Kaisha, Ltd. | | | 20,000 | | | | 124,880 | |
Taiheiyo Kouhatsu, Inc. (d) | | | 46,000 | | | | 48,641 | |
Taiho Kogyo Co., Ltd. | | | 9,800 | | | | 114,297 | |
Taikisha, Ltd. | | | 15,800 | | | | 351,022 | |
Taiko Bank, Ltd. (The) | | | 41,000 | | | | 90,465 | |
Taiko Pharmaceutical Co., Ltd. | | | 4,300 | | | | 97,980 | |
Taisei Lamick Co., Ltd. (d) | | | 2,700 | | | | 65,700 | |
Taiyo Holdings Co., Ltd. | | | 7,500 | | | | 236,074 | |
Taiyo Yuden Co., Ltd. (d) | | | 22,500 | | | | 294,031 | |
Taka-Q, Ltd. | | | 6,000 | | | | 17,337 | |
Takachiho Koheki Co., Ltd. | | | 400 | | | | 3,847 | |
Takagi Securities Co., Ltd. | | | 18,000 | | | | 70,126 | |
Takamatsu Construction Group Co., Ltd. (d) | | | 8,100 | | | | 145,772 | |
Takano Co., Ltd. | | | 6,000 | | | | 32,507 | |
Takaoka Toko Holdings Co., Ltd. (d) | | | 5,365 | | | | 99,938 | |
Takara Leben Co., Ltd. (d) | | | 15,600 | | | | 53,194 | |
Takara Printing Co., Ltd. | | | 3,100 | | | | 20,979 | |
Takara Standard Co., Ltd. | | | 52,000 | | | | 392,233 | |
Takasago International Corp. | | | 48,000 | | | | 270,104 | |
Takasago Thermal Engineering Co., Ltd. | | | 33,300 | | | | 281,965 | |
Takashima & Co., Ltd. | | | 25,000 | | | | 61,353 | |
Take And Give Needs Co., Ltd. | | | 4,710 | | | | 102,591 | |
Takeei Corp. (d) | | | 8,700 | | | | 105,987 | |
Takeuchi Manufacturing Co., Ltd. | | | 7,000 | | | | 157,430 | |
Takihyo Co., Ltd. | | | 13,000 | | | | 51,019 | |
Takiron Co., Ltd. | | | 27,000 | | | | 111,373 | |
Takisawa Machine Tool Co., Ltd. | | | 35,000 | | | | 49,339 | |
Takuma Co., Ltd. | | | 41,000 | | | | 359,682 | |
Tamron Co., Ltd. (d) | | | 9,600 | | | | 232,907 | |
Tamura Corp. | | | 47,000 | | | | 129,292 | |
Tanseisha Co., Ltd. (d) | | | 11,000 | | | | 75,048 | |
Tatsuta Electric Wire and Cable Co., Ltd. (d) | | | 24,100 | | | | 145,733 | |
Tayca Corp. | | | 17,000 | | | | 49,142 | |
TBK Co., Ltd. | | | 14,000 | | | | 76,087 | |
TECHNO ASSOCIE Co., Ltd. | | | 300 | | | | 3,124 | |
Techno Medica Co., Ltd. | | | 2,400 | | | | 48,293 | |
Techno Ryowa, Ltd. | | | 4,800 | | | | 22,144 | |
Tecmo Koei Holdings Co., Ltd. (d) | | | 12,200 | | | | 144,195 | |
Teikoku Electric Manufacturing Co., Ltd. | | | 4,700 | | | | 118,330 | |
Teikoku Sen-I Co., Ltd. | | | 13,000 | | | | 150,407 | |
Teikoku Tsushin Kogyo Co., Ltd. | | | 24,000 | | | | 40,637 | |
Tekken Corp. (a) (d) | | | 82,000 | | | | 253,487 | |
Temp Holdings Co., Ltd. (d) | | | 7,400 | | | | 196,781 | |
Ten Allied Co., Ltd. (a) | | | 2,600 | | | | 7,608 | |
Tenma Corp. | | | 6,200 | | | | 97,080 | |
Teraoka Seisakusho Co., Ltd. | | | 200 | | | | 797 | |
Tigers Polymer Corp. | | | 2,200 | | | | 9,564 | |
TKC Corp. | | | 12,400 | | | | 210,805 | |
Toa Corp. (a) | | | 127,000 | | | | 400,528 | |
Toa Oil Co., Ltd. (d) | | | 37,000 | | | | 73,252 | |
TOA ROAD Corp. | | | 26,000 | | | | 130,638 | |
Toabo Corp. | | | 56,000 | | | | 42,596 | |
Toagosei Co., Ltd. | | | 109,000 | | | | 467,035 | |
Tobishima Corp. (a) | | | 69,900 | | | | 121,953 | |
See accompanying notes to financial statements.
MSF-27
Metropolitan Series Fund
Met/Dimensional International Small Company Portfolio
Schedule of Investments as of December 31, 2013
Common Stocks—(Continued)
| | | | | | | | |
| Security Description | | Shares | | | Value | |
| | |
Japan—(Continued) | | | | | | | | |
Tobu Store Co., Ltd. | | | 11,000 | | | $ | 27,181 | |
TOC Co., Ltd. | | | 34,100 | | | | 272,486 | |
Tocalo Co., Ltd. | | | 8,800 | | | | 136,918 | |
Tochigi Bank, Ltd. (The) | | | 67,000 | | | | 259,610 | |
Toda Corp. | | | 120,000 | | | | 417,585 | |
Toda Kogyo Corp. | | | 22,000 | | | | 60,719 | |
Toei Animation Co., Ltd. | | | 2,500 | | | | 61,286 | |
Toei Co., Ltd. | | | 37,000 | | | | 209,321 | |
Toenec Corp. | | | 20,000 | | | | 119,902 | |
Toho Bank, Ltd. (The) | | | 115,000 | | | | 358,560 | |
Toho Co., Ltd. | | | 20,000 | | | | 72,063 | |
Toho Holdings Co., Ltd. | | | 25,000 | | | | 401,274 | |
Toho Titanium Co., Ltd. (d) | | | 18,600 | | | | 129,910 | |
Toho Zinc Co., Ltd. | | | 85,000 | | | | 284,781 | |
Tohoku Bank, Ltd. (The) | | | 56,000 | | | | 79,903 | |
Tohokushinsha Film Corp. | | | 4,800 | | | | 39,775 | |
Tohto Suisan Co., Ltd. | | | 22,000 | | | | 44,258 | |
Tokai Carbon Co., Ltd. | | | 112,000 | | | | 391,074 | |
Tokai Corp. | | | 5,500 | | | | 160,732 | |
TOKAI Holdings Corp. | | | 52,700 | | | | 177,428 | |
Tokai Lease Co., Ltd. | | | 16,000 | | | | 28,590 | |
Tokai Rubber Industries, Ltd. | | | 21,500 | | | | 210,235 | |
Token Corp. | | | 4,160 | | | | 199,877 | |
Tokushu Tokai Paper Co., Ltd. | | | 60,000 | | | | 122,544 | |
Tokuyama Corp. (d) | | | 196,000 | | | | 744,407 | |
Tokyo Derica Co., Ltd. | | | 3,900 | | | | 56,249 | |
Tokyo Dome Corp. | | | 94,000 | | | | 622,821 | |
Tokyo Electron Device, Ltd. | | | 2,400 | | | | 35,591 | |
Tokyo Energy & Systems, Inc. | | | 15,000 | | | | 77,635 | |
Tokyo Keiki, Inc. (d) | | | 32,000 | | | | 95,317 | |
Tokyo Ohka Kogyo Co., Ltd. | | | 21,000 | | | | 449,554 | |
Tokyo Rakutenchi Co., Ltd. | | | 17,000 | | | | 79,597 | |
Tokyo Rope Manufacturing Co., Ltd. (a) (d) | | | 55,000 | | | | 86,467 | |
Tokyo Sangyo Co., Ltd. | | | 12,000 | | | | 43,480 | |
Tokyo Seimitsu Co., Ltd. | | | 19,900 | | | | 419,226 | |
Tokyo Steel Manufacturing Co., Ltd. (a) (d) | | | 72,200 | | | | 375,910 | |
Tokyo Tekko Co., Ltd. | | | 29,000 | | | | 112,898 | |
Tokyo Theatres Co., Inc. | | | 42,000 | | | | 63,131 | |
Tokyo Tomin Bank, Ltd. (The) | | | 21,500 | | | | 223,601 | |
Tokyu Construction Co., Ltd. (a) (d) | | | 22,480 | | | | 113,954 | |
Tokyu Recreation Co., Ltd. | | | 6,000 | | | | 32,879 | |
Toli Corp. | | | 30,000 | | | | 62,247 | |
Tomato Bank, Ltd. | | | 62,000 | | | | 104,381 | |
Tomen Devices Corp. | | | 1,500 | | | | 25,014 | |
Tomen Electronics Corp. | | | 6,500 | | | | 71,590 | |
Tomoe Corp. | | | 16,000 | | | | 76,921 | |
Tomoe Engineering Co., Ltd. | | | 3,600 | | | | 57,619 | |
Tomoegawa Co., Ltd. | | | 12,000 | | | | 22,733 | |
Tomoku Co., Ltd. | | | 37,000 | | | | 127,497 | |
TOMONY Holdings, Inc. | | | 83,600 | | | | 338,764 | |
Tomy Co., Ltd. | | | 38,000 | | | | 169,414 | |
Tonami Holdings Co., Ltd. | | | 32,000 | | | | 65,700 | |
Toppan Forms Co., Ltd. | | | 28,300 | | | | 259,579 | |
Topre Corp. | | | 23,700 | | | | 351,440 | |
Topy Industries, Ltd. | | | 122,000 | | | | 226,511 | |
Toridoll.corp (d) | | | 9,000 | | | | 80,668 | |
Torigoe Co., Ltd. (The) | | | 9,200 | | | | 58,431 | |
| | |
Japan—(Continued) | | | | | | | | |
Torii Pharmaceutical Co., Ltd. | | | 5,600 | | | | 164,609 | |
Torishima Pump Manufacturing Co., Ltd. | | | 11,600 | | | | 116,185 | |
Tosei Corp. | | | 13,200 | | | | 108,312 | |
Toshiba Machine Co., Ltd. | | | 62,000 | | | | 359,016 | |
Toshiba Plant Systems & Services Corp. | | | 21,000 | | | | 313,477 | |
Toshiba TEC Corp. | | | 69,000 | | | | 479,121 | |
Tosho Co., Ltd. | | | 3,500 | | | | 60,350 | |
Tosho Printing Co., Ltd. | | | 26,000 | | | | 87,559 | |
Totetsu Kogyo Co., Ltd. | | | 16,000 | | | | 301,052 | |
Tottori Bank, Ltd. (The) | | | 37,000 | | | | 68,661 | |
Toukei Computer Co., Ltd. | | | 2,200 | | | | 31,261 | |
Towa Bank, Ltd. (The) | | | 178,000 | | | | 159,167 | |
Towa Corp. | | | 11,100 | | | | 50,682 | |
Towa Pharmaceutical Co., Ltd. (d) | | | 5,200 | | | | 218,240 | |
Toyo Construction Co., Ltd. | | | 41,099 | | | | 145,607 | |
Toyo Corp. | | | 15,800 | | | | 162,965 | |
Toyo Denki Seizo - Toyo Electric Manufacturing Co., Ltd. (d) | | | 23,000 | | | | 70,908 | |
Toyo Engineering Corp. | | | 62,000 | | | | 252,740 | |
Toyo Ink SC Holdings Co., Ltd. | | | 107,000 | | | | 528,923 | |
Toyo Kanetsu KK | | | 68,000 | | | | 191,095 | |
Toyo Kohan Co., Ltd. | | | 35,000 | | | | 164,087 | |
Toyo Securities Co., Ltd. | | | 43,000 | | | | 156,335 | |
Toyo Sugar Refining Co., Ltd. | | | 9,000 | | | | 8,902 | |
Toyo Tanso Co., Ltd. (d) | | | 7,200 | | | | 136,966 | |
Toyo Tire & Rubber Co., Ltd. | | | 99,000 | | | | 565,275 | |
Toyo Wharf & Warehouse Co., Ltd. | | | 30,000 | | | | 78,119 | |
Toyobo Co., Ltd. | | | 464,000 | | | | 856,728 | |
TPR Co., Ltd. | | | 12,200 | | | | 207,501 | |
Trancom Co., Ltd. | | | 3,900 | | | | 125,455 | |
Transcosmos, Inc. | | | 13,100 | | | | 251,206 | |
Trusco Nakayama Corp. | | | 10,700 | | | | 251,900 | |
TS Tech Co., Ltd. | | | 7,300 | | | | 246,485 | |
TSI Holdings Co., Ltd. | | | 47,805 | | | | 320,208 | |
Tsubakimoto Chain Co. | | | 77,000 | | | | 587,783 | |
Tsubakimoto Kogyo Co., Ltd. | | | 8,000 | | | | 22,668 | |
Tsudakoma Corp. (a) | | | 31,000 | | | | 50,209 | |
Tsugami Corp. | | | 38,000 | | | | 227,914 | |
Tsukamoto Corp. Co., Ltd. | | | 21,000 | | | | 32,423 | |
Tsukishima Kikai Co., Ltd. | | | 13,000 | | | | 134,070 | |
Tsukuba Bank, Ltd. (The) | | | 47,200 | | | | 165,156 | |
Tsukui Corp. | | | 13,900 | | | | 132,218 | |
Tsurumi Manufacturing Co., Ltd. | | | 10,000 | | | | 98,001 | |
Tsutsumi Jewelry Co., Ltd. | | | 3,800 | | | | 88,287 | |
TTK Co., Ltd. | | | 4,000 | | | | 16,951 | |
TV Tokyo Holdings Corp. | | | 3,700 | | | | 58,963 | |
TYK Corp. | | | 6,000 | | | | 13,695 | |
U-Shin, Ltd. (d) | | | 16,000 | | | | 116,910 | |
UACJ Corp. | | | 127,850 | | | | 484,585 | |
Uchida Yoko Co., Ltd. | | | 32,000 | | | | 86,582 | |
Ueki Corp. | | | 11,000 | | | | 22,721 | |
UKC Holdings Corp. | | | 6,200 | | | | 102,125 | |
Ulvac, Inc. (a) | | | 27,300 | | | | 361,060 | |
Uniden Corp. (a) | | | 25,000 | | | | 88,319 | |
Union Tool Co. | | | 7,000 | | | | 160,626 | |
Unipres Corp. (d) | | | 19,400 | | | | 363,827 | |
United Arrows, Ltd. | | | 9,300 | | | | 348,344 | |
See accompanying notes to financial statements.
MSF-28
Metropolitan Series Fund
Met/Dimensional International Small Company Portfolio
Schedule of Investments as of December 31, 2013
Common Stocks—(Continued)
| | | | | | | | |
| Security Description | | Shares | | | Value | |
| | |
Japan—(Continued) | | | | | | | | |
Universal Entertainment Corp. (d) | | | 8,500 | | | $ | 156,953 | |
UNY Group Holdings Co., Ltd. | | | 55,400 | | | | 339,366 | |
Uoriki Co., Ltd. | | | 2,100 | | | | 26,961 | |
Usen Corp. (a) (d) | | | 64,530 | | | | 258,823 | |
Ushio, Inc. | | | 52,700 | | | | 700,884 | |
UT Holdings Co., Ltd. (d) | | | 14,200 | | | | 77,712 | |
Utoc Corp. | | | 5,100 | | | | 18,299 | |
Valor Co., Ltd. | | | 16,900 | | | | 223,488 | |
Village Vanguard Co., Ltd. (d) | | | 3,400 | | | | 44,286 | |
Vital KSK Holdings, Inc. | | | 20,300 | | | | 141,024 | |
VT Holdings Co., Ltd. (d) | | | 15,900 | | | | 262,215 | |
Wacoal Holdings Corp. (d) | | | 26,000 | | | | 264,927 | |
Wacom Co., Ltd. | | | 13,700 | | | | 96,145 | |
Wakachiku Construction Co., Ltd. (a) | | | 69,000 | | | | 89,541 | |
Wakamoto Pharmaceutical Co., Ltd. (a) | | | 9,000 | | | | 23,207 | |
Wakita & Co., Ltd. | | | 20,000 | | | | 235,676 | |
Warabeya Nichiyo Co., Ltd. | | | 8,400 | | | | 152,103 | |
Watabe Wedding Corp. | | | 4,400 | | | | 27,341 | |
WATAMI Co., Ltd. (d) | | | 11,200 | | | | 147,033 | |
Weathernews, Inc. (d) | | | 3,600 | | | | 82,189 | |
Welcia Holdings Co., Ltd. | | | 3,900 | | | | 203,960 | |
Wellnet Corp. | | | 2,700 | | | | 44,526 | |
West Holdings Corp. | | | 7,200 | | | | 92,579 | |
Wood One Co., Ltd. | | | 19,000 | | | | 56,596 | |
Wowow, Inc. | | | 2,700 | | | | 91,692 | |
Xebio Co., Ltd. | | | 14,100 | | | | 271,044 | |
Y. A. C. Co., Ltd. | | | 4,900 | | | | 25,944 | |
Yachiyo Bank, Ltd. (The) | | | 8,500 | | | | 221,354 | |
Yachiyo Industry Co., Ltd. | | | 5,600 | | | | 39,137 | |
Yahagi Construction Co., Ltd. | | | 17,100 | | | | 148,743 | |
Yaizu Suisankagaku Industry Co., Ltd. | | | 4,400 | | | | 37,317 | |
YAMABIKO Corp. | | | 4,100 | | | | 125,417 | |
Yamagata Bank, Ltd. (The) | | | 80,000 | | | | 329,420 | |
Yamaichi Electronics Co., Ltd. (a) | | | 8,200 | | | | 18,779 | |
Yamanashi Chuo Bank, Ltd. (The) | | | 91,000 | | | | 396,403 | |
Yamatane Corp. (d) | | | 53,000 | | | | 91,403 | |
Yamato Corp. | | | 9,000 | | | | 30,342 | |
Yamato International, Inc. | | | 6,700 | | | | 28,201 | |
Yamaya Corp. | | | 2,650 | | | | 52,370 | |
Yamazawa Co., Ltd. | | | 1,000 | | | | 14,613 | |
Yamazen Corp. | | | 32,100 | | | | 197,158 | |
Yaoko Co., Ltd. | | | 3,600 | | | | 141,568 | |
Yashima Denki Co., Ltd. | | | 7,500 | | | | 31,007 | |
Yasuda Warehouse Co., Ltd. (The) | | | 7,400 | | | | 81,807 | |
Yellow Hat, Ltd. | | | 10,700 | | | | 190,950 | |
Yodogawa Steel Works, Ltd. | | | 70,000 | | | | 302,085 | |
Yokogawa Bridge Holdings Corp. | | | 18,000 | | | | 264,529 | |
Yokohama Reito Co., Ltd. | | | 26,500 | | | | 201,133 | |
Yokowo Co., Ltd. | | | 7,900 | | | | 40,232 | |
Yomeishu Seizo Co., Ltd. | | | 6,000 | | | | 46,437 | |
Yondenko Corp. | | | 12,000 | | | | 41,307 | |
Yondoshi Holding, Inc. | | | 11,700 | | | | 177,249 | |
Yonekyu Corp. | | | 800 | | | | 6,312 | |
Yonex Co., Ltd. | | | 5,900 | | | | 33,295 | |
Yorozu Corp. (d) | | | 9,600 | | | | 175,694 | |
Yoshinoya Holdings Co., Ltd. | | | 1,200 | | | | 14,691 | |
Yuasa Funashoku Co., Ltd. | | | 8,000 | | | | 19,099 | |
| | |
Japan—(Continued) | | | | | | | | |
Yuasa Trading Co., Ltd. | | | 100,000 | | | | 204,624 | |
Yuken Kogyo Co., Ltd. | | | 22,000 | | | | 49,484 | |
Yuki Gosei Kogyo Co., Ltd. | | | 6,000 | | | | 16,161 | |
Yurtec Corp. | | | 26,000 | | | | 84,083 | |
Yusen Logistics Co., Ltd. (d) | | | 11,700 | | | | 147,919 | |
Yushin Precision Equipment Co., Ltd. | | | 4,900 | | | | 106,587 | |
Yushiro Chemical Industry Co., Ltd. | | | 7,300 | | | | 69,865 | |
Zappallas, Inc. | | | 4,900 | | | | 35,738 | |
Zenrin Co., Ltd. | | | 15,700 | | | | 152,797 | |
Zensho Holdings Co., Ltd. (d) | | | 31,200 | | | | 334,809 | |
ZERIA Pharmaceutical Co., Ltd. | | | 8,800 | | | | 214,600 | |
Zojirushi Corp. | | | 10,000 | | | | 35,541 | |
Zuken, Inc. (d) | | | 7,200 | | | | 58,314 | |
| | | | | | | | |
| | | | | | | 214,441,507 | |
| | | | | | | | |
| | |
Luxembourg—0.0% | | | | | | | | |
L’Occitane International S.A. | | | 56,250 | | | | 120,735 | |
| | | | | | | | |
| | |
Netherlands—2.1% | | | | | | | | |
Aalberts Industries NV | | | 53,139 | | | | 1,701,291 | |
Accell Group | | | 13,869 | | | | 256,276 | |
AMG Advanced Metallurgical Group NV (a) | | | 17,624 | | | | 188,343 | |
Amsterdam Commodities NV | | | 10,026 | | | | 228,314 | |
APERAM (a) (d) | | | 33,328 | | | | 618,099 | |
Arcadis NV | | | 32,441 | | | | 1,143,746 | |
ASM International NV | | | 26,751 | | | | 883,993 | |
Ballast Nedam (a) | | | 1,358 | | | | 19,663 | |
BE Semiconductor Industries NV | | | 23,461 | | | | 265,795 | |
Beter Bed Holding NV | | | 10,318 | | | | 249,879 | |
BinckBank NV | | | 39,299 | | | | 417,594 | |
Brunel International NV (d) | | | 6,300 | | | | 386,842 | |
Corbion NV (d) | | | 19,773 | | | | 419,832 | |
Delta Lloyd NV | | | 91,549 | | | | 2,277,608 | |
DOCdata NV | | | 1,934 | | | | 43,239 | |
Exact Holding NV (d) | | | 7,888 | | | | 255,133 | |
Grontmij (a) | | | 40,836 | | | | 202,534 | |
Heijmans NV | | | 14,562 | | | | 210,710 | |
Hunter Douglas NV | | | 2,423 | | | | 109,757 | |
KAS Bank NV | | | 7,278 | | | | 97,598 | |
Kendrion NV | | | 4,261 | | | | 139,779 | |
Koninklijke BAM Groep NV (d) | | | 183,068 | | | | 958,217 | |
Koninklijke Wessanen NV | | | 54,622 | | | | 213,853 | |
Macintosh Retail Group NV | | | 7,046 | | | | 84,682 | |
Nederland Apparatenfabriek | | | 2,742 | | | | 113,157 | |
Nutreco NV | | | 38,964 | | | | 1,940,243 | |
Ordina NV (a) | | | 57,689 | | | | 151,217 | |
PostNL NV (a) | | | 219,352 | | | | 1,255,132 | |
Royal Imtech NV (a) (d) | | | 38,313 | | | | 112,887 | |
SBM Offshore NV (a) | | | 103,661 | | | | 2,118,339 | |
Sligro Food Group NV | | | 13,645 | | | | 529,317 | |
SNS REAAL NV (a) (b) (c) (d) | | | 105,329 | | | | 0 | |
Telegraaf Media Groep NV | | | 13,542 | | | | 169,671 | |
Ten Cate NV | | | 20,330 | | | | 641,822 | |
TKH Group NV | | | 23,125 | | | | 810,835 | |
TNT Express NV | | | 6,296 | | | | 58,561 | |
TomTom NV (a) | | | 76,476 | | | | 543,464 | |
See accompanying notes to financial statements.
MSF-29
Metropolitan Series Fund
Met/Dimensional International Small Company Portfolio
Schedule of Investments as of December 31, 2013
Common Stocks—(Continued)
| | | | | | | | |
| Security Description | | Shares | | | Value | |
| | |
Netherlands—(Continued) | | | | | | | | |
Unit4 NV | | | 16,955 | | | $ | 895,692 | |
USG People NV | | | 43,376 | | | | 578,977 | |
Van Lanschot NV (a) | | | 45 | | | | 1,108 | |
| | | | | | | | |
| | | | | | | 21,293,199 | |
| | | | | | | | |
| | |
New Zealand—0.8% | | | | | | | | |
A2 Corp., Ltd. (a) (d) | | | 134,580 | | | | 88,649 | |
Abano Healthcare Group, Ltd. | | | 880 | | | | 4,606 | |
Air New Zealand, Ltd. (d) | | | 170,907 | | | | 230,679 | |
Bathurst Resources New Zealand, Ltd. (a) (d) | | | 206,414 | | | | 34,431 | |
Briscoe Group, Ltd. | | | 13,123 | | | | 25,362 | |
Cavalier Corp., Ltd. | | | 7,259 | | | | 10,272 | |
Chorus, Ltd. | | | 106,254 | | | | 125,906 | |
Diligent Board Member Services, Inc. (a) (d) | | | 19,249 | | | | 60,186 | |
Ebos Group, Ltd. | | | 40,868 | | | | 324,994 | |
Fisher & Paykel Healthcare Corp., Ltd. (d) | | | 259,685 | | | | 820,108 | |
Freightways, Ltd. | | | 81,878 | | | | 318,250 | |
Hallenstein Glasson Holdings, Ltd. | | | 19,012 | | | | 60,524 | |
Heartland New Zealand, Ltd. | | | 72,313 | | | | 50,574 | |
Infratil, Ltd. | | | 399,354 | | | | 745,692 | |
Kathmandu Holdings, Ltd. | | �� | 23,984 | | | | 68,852 | |
Mainfreight, Ltd. | | | 40,292 | | | | 397,064 | |
Methven, Ltd. | | | 19,898 | | | | 23,087 | |
Michael Hill International, Ltd. | | | 82,929 | | | | 94,846 | |
Millennium & Copthorne Hotels New Zealand, Ltd. | | | 26,384 | | | | 15,406 | |
New Zealand Oil & Gas, Ltd. | | | 178,730 | | | | 117,732 | |
New Zealand Refining Co., Ltd. (The) | | | 27,432 | | | | 46,424 | |
Nuplex Industries, Ltd. (d) | | | 105,582 | | | | 294,650 | |
NZX, Ltd. | | | 130,860 | | | | 132,849 | |
Opus International Consultants, Ltd. | | | 4,000 | | | | 6,850 | |
Pacific Edge, Ltd. (a) | | | 17,353 | | | | 19,019 | |
PGG Wrightson, Ltd. | | | 58,545 | | | | 19,235 | |
Pike River Coal Co., Ltd. (a) (b) (c) | | | 82,575 | | | | 0 | |
Port of Tauranga, Ltd. | | | 38,167 | | | | 430,182 | |
Pumpkin Patch, Ltd. (a) | | | 31,660 | | | | 23,178 | |
Restaurant Brands New Zealand, Ltd. | | | 55,682 | | | | 128,778 | |
Rubicon, Ltd. (a) | | | 9,922 | | | | 3,101 | |
Ryman Healthcare, Ltd. | | | 152,639 | | | | 984,637 | |
Sanford, Ltd. | | | 314 | | | | 1,204 | |
Skellerup Holdings, Ltd. | | | 29,759 | | | | 42,360 | |
Sky City Entertainment Group, Ltd. | | | 295,453 | | | | 906,539 | |
Sky Network Television, Ltd. | | | 107,194 | | | | 512,952 | |
Tower, Ltd. (d) | | | 74,795 | | | | 107,756 | |
Trade Me Group, Ltd. | | | 20,069 | | | | 67,032 | |
TrustPower, Ltd. | | | 13,980 | | | | 74,852 | |
Vector, Ltd. (d) | | | 163,940 | | | | 346,283 | |
Warehouse Group, Ltd. (The) | | | 53,562 | | | | 164,785 | |
Xero, Ltd. (a) (d) | | | 18,201 | | | | 484,677 | |
| | | | | | | | |
| | | | | | | 8,414,563 | |
| | | | | | | | |
| | |
Norway—1.2% | | | | | | | | |
ABG Sundal Collier Holding ASA | | | 167,319 | | | | 148,106 | |
Algeta ASA (a) | | | 14,218 | | | | 842,302 | |
American Shipping ASA (a) | | | 2,259 | | | | 15,323 | |
Archer, Ltd. (a) | | | 40,112 | | | | 32,982 | |
| | |
Norway—(Continued) | | | | | | | | |
Atea ASA | | | 37,179 | | | | 366,340 | |
Austevoll Seafood ASA | | | 48,445 | | | | 285,293 | |
Bionor Pharma ASA (a) | | | 16,875 | | | | 7,487 | |
Bonheur ASA | | | 4,316 | | | | 91,945 | |
BW Offshore, Ltd. | | | 176,208 | | | | 210,676 | |
BWG Homes ASA (a) | | | 39,260 | | | | 74,491 | |
Cermaq ASA (d) | | | 32,403 | | | | 576,942 | |
Deep Sea Supply plc (a) | | | 53,588 | | | | 101,575 | |
Det Norske Oljeselskap ASA (a) (d) | | | 25,513 | | | | 280,578 | |
DNO International ASA (a) | | | 256,355 | | | | 1,027,822 | |
DOF ASA (a) | | | 26,204 | | | | 137,276 | |
Ekornes ASA | | | 13,813 | | | | 186,953 | |
Electromagnetic GeoServices (a) (d) | | | 82,083 | | | | 106,528 | |
Eltek ASA | | | 122,435 | | | | 143,599 | |
Evry ASA | | | 25,788 | | | | 42,307 | |
Farstad Shipping ASA | | | 6,040 | | | | 133,027 | |
Frontline, Ltd. (a) (d) | | | 36,608 | | | | 143,519 | |
Ganger Rolf ASA | | | 7,335 | | | | 154,196 | |
Golden Ocean Group, Ltd. | | | 173,259 | | | | 417,334 | |
Grieg Seafood ASA (a) | | | 11,731 | | | | 47,442 | |
Hexagon Composites ASA | | | 3,758 | | | | 20,065 | |
Hoegh LNG Holdings, Ltd. (a) | | | 15,525 | | | | 122,629 | |
Hurtigruten ASA (a) | | | 79,346 | | | | 45,508 | |
Kongsberg Automotive Holding ASA (a) | | | 236,674 | | | | 226,440 | |
Kvaerner ASA | | | 92,750 | | | | 176,542 | |
Leroy Seafood Group ASA | | | 9,723 | | | | 284,690 | |
Nordic Semiconductor ASA (a) (d) | | | 76,341 | | | | 348,816 | |
Norske Skogindustrier ASA (a) (d) | | | 101,549 | | | | 79,376 | |
Northern Offshore, Ltd. | | | 47,579 | | | | 74,025 | |
Norwegian Air Shuttle A/S (a) (d) | | | 12,510 | | | | 389,890 | |
Norwegian Energy Co. ASA (a) (d) | | | 159,559 | | | | 5,267 | |
Odfjell SE - A Shares (a) | | | 1,949 | | | | 13,173 | |
Olav Thon Eiendomsselskap ASA | | | 97 | | | | 17,133 | |
Opera Software ASA | | | 35,363 | | | | 484,803 | |
Panoro Energy ASA (a) | | | 64,409 | | | | 32,385 | |
PhotoCure ASA (a) | | | 5,477 | | | | 23,207 | |
ProSafe SE (d) | | | 46,555 | | | | 359,236 | |
Q-Free ASA (a) | | | 24,256 | | | | 55,933 | |
REC Solar ASA (a) | | | 10,877 | | | | 151,463 | |
Renewable Energy Corp. ASA (a) (d) | | | 630,934 | | | | 255,683 | |
Salmar ASA (a) | | | 8,438 | | | | 103,066 | |
Sevan Marine ASA (a) | | | 19,916 | | | | 82,397 | |
Siem Offshore, Inc. (a) | | | 86,433 | | | | 137,515 | |
Solstad Offshore ASA | | | 6,576 | | | | 130,982 | |
Songa Offshore SE (a) (d) | | | 82,163 | | | | 42,109 | |
SpareBank 1 SMN | | | 51,820 | | | | 470,322 | |
SpareBank 1 SR Bank ASA | | | 7,181 | | | | 71,399 | |
Stolt-Nielsen, Ltd. | | | 9,173 | | | | 253,370 | |
Tomra Systems ASA | | | 67,216 | | | | 626,487 | |
TTS Group ASA | | | 18,359 | | | | 18,748 | |
Veidekke ASA | | | 57,200 | | | | 460,263 | |
Veripos, Inc. | | | 1,820 | | | | 11,158 | |
Wilh Wilhelmsen ASA | | | 22,562 | | | | 211,142 | |
Wilh Wilhelmsen Holding ASA | | | 5,524 | | | | 184,397 | |
| | | | | | | | |
| | | | | | | 11,543,662 | |
| | | | | | | | |
See accompanying notes to financial statements.
MSF-30
Metropolitan Series Fund
Met/Dimensional International Small Company Portfolio
Schedule of Investments as of December 31, 2013
Common Stocks—(Continued)
| | | | | | | | |
| Security Description | | Shares | | | Value | |
| | |
Portugal—0.6% | | | | | | | | |
Altri SGPS S.A. | | | 79,420 | | | $ | 244,864 | |
Banco BPI S.A. (a) (d) | | | 241,547 | | | | 404,174 | |
Banco Comercial Portugues S.A. (a) | | | 5,819,037 | | | | 1,333,033 | |
Banco Espirito Santo S.A. (a) (d) | | | 286,689 | | | | 410,141 | |
Mota-Engil SGPS S.A. | | | 40,942 | | | | 243,584 | |
Novabase SGPS S.A. | | | 7,827 | | | | 28,107 | |
Portucel Empresa Produtora de Pasta e Papel S.A. | | | 135,397 | | | | 542,182 | |
REN - Redes Energeticas Nacionais SGPS S.A. | | | 133,701 | | | | 411,655 | |
Semapa-Sociedade de Investimento e Gestao | | | 48,412 | | | | 542,414 | |
Sonae (d) | | | 597,292 | | | | 862,287 | |
Sonae Industria SGPS S.A. (a) | | | 24,230 | | | | 18,831 | |
Sonaecom - SGPS S.A. | | | 78,934 | | | | 279,479 | |
Teixeira Duarte S.A. | | | 103,277 | | | | 126,381 | |
ZON OPTIMUS SGPS S.A. (d) | | | 93,729 | | | | 696,596 | |
| | | | | | | | |
| | | | | | | 6,143,728 | |
| | | | | | | | |
| | |
Singapore—1.6% | | | | | | | | |
Abterra, Ltd. (a) | | | 51,720 | | | | 26,640 | |
Amara Holdings, Ltd. | | | 105,000 | | | | 46,679 | |
Amtek Engineering, Ltd. (d) | | | 132,000 | | | | 49,798 | |
ASL Marine Holdings, Ltd. | | | 105,000 | | | | 57,438 | |
Ausgroup, Ltd. (a) (d) | | | 267,000 | | | | 40,031 | |
Baker Technology, Ltd. | | | 166,000 | | | | 35,603 | |
Banyan Tree Holdings, Ltd. (d) | | | 155,000 | | | | 81,130 | |
Biosensors International Group, Ltd. (d) | | | 473,000 | | | | 313,735 | |
Bonvests Holdings, Ltd. | | | 18,000 | | | | 16,411 | |
Boustead Singapore, Ltd. | | | 160,000 | | | | 214,631 | |
Breadtalk Group, Ltd. | | | 82,000 | | | | 58,586 | |
Broadway Industrial Group, Ltd. (a) | | | 138,000 | | | | 24,770 | |
Bukit Sembawang Estates, Ltd. | | | 72,000 | | | | 348,149 | |
Bund Center Investment, Ltd. | | | 552,000 | | | | 94,233 | |
CH Offshore, Ltd. | | | 157,000 | | | | 52,163 | |
China Aviation Oil Singapore Corp., Ltd. | | | 128,000 | | | | 106,017 | |
China Merchants Holdings Pacific, Ltd. | | | 53,000 | | | | 38,888 | |
Chip Eng Seng Corp., Ltd. | | | 327,000 | | | | 186,870 | |
Chuan Hup Holdings, Ltd. | | | 125,000 | | | | 25,752 | |
Cityspring Infrastructure Trust | | | 186,000 | | | | 69,282 | |
Cosco Corp. Singapore, Ltd. (d) | | | 560,000 | | | | 336,119 | |
Creative Technology, Ltd. | | | 22,600 | | | | 38,330 | |
CSC Holdings, Ltd. | | | 284,000 | | | | 22,293 | |
CSE Global, Ltd. | | | 301,000 | | | | 182,570 | |
CWT, Ltd. | | | 119,000 | | | | 127,950 | |
Datapulse Technology, Ltd. | | | 106,000 | | | | 16,721 | |
Delong Holdings, Ltd. (a) | | | 91,000 | | | | 30,376 | |
DMX Technologies Group, Ltd. | | | 186,000 | | | | 30,997 | |
Dyna-Mac Holdings, Ltd. | | | 20,000 | | | | 6,348 | |
Elec & Eltek International Co., Ltd. | | | 23,000 | | | | 38,809 | |
Eu Yan Sang International, Ltd. | | | 90,000 | | | | 62,019 | |
Ezion Holdings, Ltd. (d) | | | 406,800 | | | | 717,897 | |
Ezra Holdings, Ltd. (a) (d) | | | 483,799 | | | | 528,734 | |
Falcon Energy Group, Ltd. | | | 151,000 | | | | 44,357 | |
Far East Orchard, Ltd. | | | 95,044 | | | | 140,657 | |
FJ Benjamin Holdings, Ltd. | | | 106,000 | | | | 18,084 | |
Food Empire Holdings, Ltd. | | | 118,000 | | | | 50,426 | |
Fragrance Group, Ltd. (d) | | | 1,352,000 | | | | 257,179 | |
| | |
Singapore—(Continued) | | | | | | | | |
Gallant Venture, Ltd. (a) (d) | | | 479,000 | | | | 102,587 | |
GK Goh Holdings, Ltd. | | | 12,000 | | | | 7,939 | |
GMG Global, Ltd. | | | 2,022,000 | | | | 161,939 | |
Goodpack, Ltd. | | | 156,000 | | | | 241,427 | |
GP Batteries International, Ltd. | | | 21,000 | | | | 10,900 | |
GuocoLand, Ltd. | | | 58,000 | | | | 101,563 | |
GuocoLeisure, Ltd. (d) | | | 306,000 | | | | 208,661 | |
HanKore Environment Tech Group, Ltd. (a) | | | 157,000 | | | | 13,466 | |
Hanwell Holdings, Ltd. (a) | | | 19,000 | | | | 3,680 | |
Healthway Medical Corp., Ltd. (a) | | | 701,750 | | | | 38,435 | |
HG Metal Manufacturing, Ltd. | | | 460,000 | | | | 28,093 | |
Hi-P International, Ltd. | | | 125,000 | | | | 57,925 | |
Hiap Hoe, Ltd. | | | 58,000 | | | | 37,989 | |
Hiap Seng Engineering, Ltd. | | | 61,500 | | | | 10,998 | |
HLH Group, Ltd. (a) | | | 1,066,000 | | | | 17,775 | |
Ho Bee Investment, Ltd. (d) | | | 153,000 | | | | 257,435 | |
Hong Fok Corp., Ltd. | | | 223,400 | | | | 123,308 | |
Hong Leong Asia, Ltd. | | | 74,000 | | | | 78,429 | |
Hotel Grand Central, Ltd. | | | 1,000 | | | | 848 | |
Hotel Properties, Ltd. | | | 125,000 | | | | 308,214 | |
Hour Glass, Ltd. (The) | | | 43,000 | | | | 57,030 | |
HTL International Holdings, Ltd. | | | 69,000 | | | | 16,682 | |
HupSteel, Ltd. | | | 111,000 | | | | 19,325 | |
Hwa Hong Corp., Ltd. | | | 138,000 | | | | 32,802 | |
Hyflux, Ltd. (d) | | | 243,500 | | | | 225,924 | |
Indofood Agri Resources, Ltd. (d) | | | 301,000 | | | | 211,557 | |
InnoTek, Ltd. | | | 88,000 | | | | 23,072 | |
IPC Corp., Ltd. | | | 296,000 | | | | 36,135 | |
Jaya Holdings, Ltd. | | | 244,000 | | | | 139,344 | |
Jiutian Chemical Group, Ltd. (a) | | | 649,000 | | | | 44,210 | |
K-Green Trust | | | 177,000 | | | | 146,629 | |
K1 Ventures, Ltd. | | | 483,000 | | | | 73,870 | |
Keppel Telecommunications & Transportation, Ltd. | | | 67,000 | | | | 81,870 | |
Koh Brothers Group, Ltd. | | | 97,000 | | | | 24,225 | |
LCD Global Investment, Ltd. | | | 385,200 | | | | 44,258 | |
Li Heng Chemical Fibre Technologies, Ltd. (a) | | | 309,000 | | | | 28,252 | |
Lian Beng Group, Ltd. | | | 237,000 | | | | 101,511 | |
Low Keng Huat Singapore, Ltd. | | | 153,000 | | | | 83,056 | |
Lum Chang Holdings, Ltd. | | | 115,000 | | | | 30,976 | |
M1, Ltd. (d) | | | 99,000 | | | | 256,885 | |
Manhattan Resources, Ltd. (a) | | | 83,000 | | | | 21,047 | |
Marco Polo Marine, Ltd. | | | 51,000 | | | | 15,774 | |
Mercator Lines Singapore, Ltd. (a) | | | 70,000 | | | | 5,880 | |
Mermaid Maritime plc | | | 29,000 | | | | 11,420 | |
Metro Holdings, Ltd. | | | 199,600 | | | | 133,094 | |
Mewah International, Inc. (d) | | | 205,000 | | | | 76,627 | |
Midas Holdings, Ltd. (d) | | | 675,000 | | | | 273,699 | |
Nam Cheong, Ltd. (d) | | | 659,000 | | | | 164,733 | |
Neptune Orient Lines, Ltd. (a) | | | 76,000 | | | | 67,851 | |
NSL, Ltd. | | | 15,000 | | | | 19,223 | |
Oceanus Group, Ltd. (a) | | | 901,000 | | | | 17,178 | |
OKP Holdings, Ltd. | | | 17,000 | | | | 4,648 | |
OSIM International, Ltd. (d) | | | 109,000 | | | | 198,914 | |
Otto Marine, Ltd. (a) | | | 522,000 | | | | 39,494 | |
Overseas Union Enterprise, Ltd. (d) | | | 174,000 | | | | 345,099 | |
Pan-United Corp., Ltd. (d) | | | 130,000 | | | | 98,981 | |
See accompanying notes to financial statements.
MSF-31
Metropolitan Series Fund
Met/Dimensional International Small Company Portfolio
Schedule of Investments as of December 31, 2013
Common Stocks—(Continued)
| | | | | | | | |
| Security Description | | Shares | | | Value | |
| | |
Singapore—(Continued) | | | | | | | | |
Petra Foods, Ltd. | | | 111,000 | | | $ | 283,835 | |
Popular Holdings, Ltd. | | | 192,000 | | | | 37,292 | |
QAF, Ltd. | | | 123,811 | | | | 80,872 | |
Raffles Education Corp., Ltd. (a) | | | 470,374 | | | | 108,169 | |
Raffles Medical Group, Ltd. | | | 36,628 | | | | 90,349 | |
Rickmers Maritime | | | 110,000 | | | | 24,822 | |
Riverstone Holdings, Ltd. | | | 20,000 | | | | 11,508 | |
Rotary Engineering, Ltd. | | | 128,000 | | | | 67,089 | |
Roxy-Pacific Holdings, Ltd. | | | 128,750 | | | | 57,650 | |
S I2I, Ltd. (a) | | | 1,741,000 | | | | 19,366 | |
Sapphire Corp., Ltd. (a) | | | 26,000 | | | | 2,514 | |
SBS Transit, Ltd. | | | 40,500 | | | | 42,014 | |
See Hup Seng, Ltd. | | | 163,000 | | | | 40,122 | |
Sheng Siong Group, Ltd. | | | 231,000 | | | | 111,798 | |
Sim Lian Group, Ltd. | | | 121,500 | | | | 75,557 | |
Sinarmas Land, Ltd. | | | 814,000 | | | | 310,087 | |
Sing Holdings, Ltd. | | | 82,000 | | | | 25,001 | |
Singapore Post, Ltd. (d) | | | 773,544 | | | | 812,939 | |
Singapore Reinsurance Corp., Ltd. | | | 1,000 | | | | 202 | |
Sino Grandness Food Industry Group, Ltd. (a) (d) | | | 154,000 | | | | 88,556 | |
SMRT Corp., Ltd. (d) | | | 226,000 | | | | 207,823 | |
Stamford Land Corp., Ltd. | | | 304,000 | | | | 139,754 | |
Sunningdale Tech, Ltd. | | | 303,000 | | | | 33,876 | |
SunVic Chemical Holdings, Ltd. (a) | | | 143,000 | | | | 48,284 | |
Super Group, Ltd. | | | 100,000 | | | | 301,595 | |
Swiber Holdings, Ltd. | | | 319,000 | | | | 168,232 | |
Swissco Holdings, Ltd. | | | 80,000 | | | | 23,517 | |
Tat Hong Holdings, Ltd. | | | 187,000 | | | | 133,449 | |
Thakral Corp., Ltd. | | | 197,000 | | | | 4,532 | |
Tiong Woon Corp. Holding, Ltd. | | | 218,250 | | | | 60,705 | |
Triyards holdings, Ltd. (a) | | | 39,979 | | | | 21,140 | |
Tuan Sing Holdings, Ltd. | | | 390,705 | | | | 92,858 | |
UMS Holdings, Ltd. | | | 116,000 | | | | 54,259 | |
United Engineers, Ltd. | | | 256,000 | | | | 364,480 | |
United Envirotech, Ltd. | | | 214,000 | | | | 153,682 | |
United Fiber System, Ltd. (a) | | | 426,950 | | | | 6,777 | |
United Overseas Insurance, Ltd. (c) | | | 4,000 | | | | 13,598 | |
UOB-Kay Hian Holdings, Ltd. | | | 178,000 | | | | 233,466 | |
UPP Holdings, Ltd. | | | 218,000 | | | | 44,104 | |
Vard Holdings, Ltd. (a) (d) | | | 289,000 | | | | 186,862 | |
Venture Corp., Ltd. | | | 149,000 | | | | 907,110 | |
Vibrant Group, Ltd. | | | 773,071 | | | | 69,294 | |
Vicom, Ltd. | | | 2,000 | | | | 7,775 | |
Wee Hur Holdings, Ltd. | | | 234,000 | | | | 63,987 | |
Wheelock Properties Singapore, Ltd. | | | 104,000 | | | | 139,795 | |
Wing Tai Holdings, Ltd. (d) | | | 267,621 | | | | 417,202 | |
Yeo Hiap Seng, Ltd. | | | 19,712 | | | | 38,275 | |
YHI International, Ltd. | | | 78,000 | | | | 15,761 | |
Yongnam Holdings, Ltd. | | | 750,000 | | | | 146,208 | |
| | | | | | | | |
| | | | | | | 15,907,700 | |
| | | | | | | | |
|
Spain—2.3% | |
Abengoa S.A. (d) | | | 20,451 | | | | 68,656 | |
Abengoa S.A. - B Shares | | | 81,804 | | | | 245,100 | |
Acciona S.A. (d) | | | 2,173 | | | | 125,780 | |
|
Spain—(Continued) | |
Acerinox S.A. (d) | | | 64,877 | | | | 827,535 | |
Adveo Group International S.A. | | | 5,993 | | | | 123,762 | |
Almirall S.A. (d) | | | 34,815 | | | | 568,229 | |
Atresmedia Corp. de Medios de Comunicaion S.A. (d) | | | 35,378 | | | | 585,404 | |
Azkoyen S.A. (a) | | | 1,608 | | | | 4,653 | |
Bankinter S.A. | | | 299,017 | | | | 2,053,029 | |
Baron de Ley (a) | | | 1,446 | | | | 117,173 | |
Bolsas y Mercados Espanoles S.A. (d) | | | 36,110 | | | | 1,374,402 | |
Caja de Ahorros del Mediterraneo (a) (b)��(c) (d) | | | 14,621 | | | | 0 | |
Campofrio Food Group S.A. (a) | | | 12,609 | | | | 119,747 | |
Cementos Portland Valderrivas S.A. (a) | | | 7,045 | | | | 53,921 | |
Cie Automotive S.A. | | | 19,638 | | | | 216,229 | |
Codere S.A. (a) (d) | | | 11,050 | | | | 10,506 | |
Construcciones y Auxiliar de Ferrocarriles S.A. | | | 858 | | | | 454,365 | |
Deoleo S.A. (a) | | | 241,759 | | | | 156,375 | |
Dinamia Capital Privado Sociedad de Capital Riesgo S.A. | | | 3,678 | | | | 35,408 | |
Duro Felguera S.A. (d) | | | 33,927 | | | | 228,932 | |
Ebro Foods S.A. | | | 42,775 | | | | 1,003,028 | |
Elecnor S.A. | | | 13,487 | | | | 207,469 | |
Ence Energia y Celulosa S.A (d) | | | 104,517 | | | | 392,679 | |
Ercros S.A. (a) | | | 60,314 | | | | 39,616 | |
Faes Farma S.A. | | | 146,536 | | | | 535,362 | |
Fluidra S.A. | | | 9,730 | | | | 36,545 | |
Fomento de Construcciones y Contratas S.A. (a) (d) | | | 17,778 | | | | 396,338 | |
Gamesa Corp. Tecnologica S.A. (a) | | | 133,307 | | | | 1,391,966 | |
Grupo Catalana Occidente S.A. | | | 26,168 | | | | 939,184 | |
Grupo Ezentis S.A. (a) | | | 50,354 | | | | 107,092 | |
Iberpapel Gestion S.A. | | | 185 | | | | 3,844 | |
Indra Sistemas S.A. (d) | | | 51,661 | | | | 865,741 | |
Inmobiliaria Colonial S.A. (a) (d) | | | 10,263 | | | | 14,841 | |
Jazztel plc (a) (d) | | | 120,507 | | | | 1,292,337 | |
Laboratorios Farmaceuticos Rovi S.A. | | | 7,964 | | | | 109,343 | |
Mediaset Espana Comunicacion S.A. (a) | | | 83,216 | | | | 962,880 | |
Melia Hotels International S.A. | | | 33,769 | | | | 435,106 | |
Miquel y Costas & Miquel S.A. | | | 5,284 | | | | 221,836 | |
Natra S.A. (a) | | | 7,533 | | | | 23,031 | |
NH Hoteles S.A. (a) (d) | | | 74,813 | | | | 441,285 | |
Obrascon Huarte Lain S.A. | | | 24,970 | | | | 1,017,600 | |
Papeles y Cartones de Europa S.A. | | | 24,499 | | | | 129,620 | |
Pescanova S.A. (a) (b) (c) | | | 7,446 | | | | 0 | |
Prim S.A. | | | 3,013 | | | | 23,760 | |
Promotora de Informaciones S.A. (a) (d) | | | 160,309 | | | | 88,847 | |
Prosegur Cia de Seguridad S.A. (d) | | | 89,130 | | | | 612,419 | |
Realia Business S.A. (a) (d) | | | 74,911 | | | | 85,618 | |
Sacyr Vallehermoso S.A. (a) | | | 177,060 | | | | 926,675 | |
Solaria Energia y Medio Ambiente S.A. (a) | | | 19,439 | | | | 20,552 | |
Tecnicas Reunidas S.A. (d) | | | 14,817 | | | | 808,447 | |
Telecomunicaciones y Energia (a) | | | 13,592 | | | | 22,612 | |
Tubacex S.A. | | | 74,065 | | | | 295,006 | |
Tubos Reunidos S.A. | | | 63,692 | | | | 155,767 | |
Vidrala S.A. | | | 9,644 | | | | 496,081 | |
Viscofan S.A. (d) | | | 23,625 | | | | 1,346,687 | |
Vocento S.A. (a) | | | 5,362 | | | | 11,132 | |
Zeltia S.A. (a) | | | 112,364 | | | | 358,305 | |
| | | | | | | | |
| | | | | | | 23,187,857 | |
| | | | | | | | |
See accompanying notes to financial statements.
MSF-32
Metropolitan Series Fund
Met/Dimensional International Small Company Portfolio
Schedule of Investments as of December 31, 2013
Common Stocks—(Continued)
| | | | | | | | |
| Security Description | | Shares | | | Value | |
|
Sweden—3.7% | |
AarhusKarlshamn AB | | | 14,131 | | | $ | 905,620 | |
Acando AB | | | 32,257 | | | | 66,751 | |
Active Biotech AB (a) (d) | | | 6,153 | | | | 66,679 | |
AddNode Group AB | | | 1,849 | | | | 11,158 | |
AddTech AB - B Shares | | | 32,544 | | | | 534,681 | |
AF AB - B Shares | | | 19,509 | | | | 685,159 | |
Arise AB (a) | | | 4,852 | | | | 16,070 | |
Atrium Ljungberg AB - B Shares | | | 3,824 | | | | 52,383 | |
Avanza Bank Holding AB | | | 5,548 | | | | 181,455 | |
Axfood AB (d) | | | 11,896 | | | | 596,961 | |
Axis Communications AB (d) | | | 20,453 | | | | 712,497 | |
B&B Tools AB - B Shares | | | 12,796 | | | | 234,745 | |
BE Group AB (a) | | | 31,085 | | | | 57,136 | |
Beijer AB G&L - B Shares | | | 6,405 | | | | 139,488 | |
Beijer Alma AB | | | 10,939 | | | | 301,091 | |
Beijer Electronics AB | | | 5,229 | | | | 54,859 | |
Betsson AB (a) | | | 15,053 | | | | 478,126 | |
Bilia AB - A Shares | | | 10,743 | | | | 275,037 | |
Billerud AB | | | 89,835 | | | | 1,135,898 | |
BioGaia AB - B Shares | | | 7,656 | | | | 301,692 | |
Biotage AB | | | 15,339 | | | | 23,855 | |
Bjoern Borg AB (a) | | | 9,936 | | | | 46,964 | |
Bure Equity AB (d) | | | 37,705 | | | | 152,463 | |
Byggmax Group AB | | | 19,874 | | | | 149,645 | |
Castellum A.B. | | | 88,397 | | | | 1,377,748 | |
Cision AB | | | 3,202 | | | | 17,136 | |
Clas Ohlson AB - B Shares | | | 19,724 | | | | 371,799 | |
Cloetta AB - B Shares (a) | | | 15,301 | | | | 46,342 | |
Concentric AB | | | 32,613 | | | | 369,107 | |
Concordia Maritime AB - B Shares | | | 4,217 | | | | 7,669 | |
Connecta AB | | | 4,752 | | | | 28,004 | |
Dios Fastigheter AB | | | 25,743 | | | | 182,827 | |
Doro AB | | | 8,437 | | | | 57,760 | |
Duni AB (d) | | | 21,125 | | | | 274,687 | |
East Capital Explorer AB (a) | | | 7,088 | | | | 68,690 | |
Enea AB (a) | | | 6,525 | | | | 55,325 | |
Eniro AB (a) | | | 55,843 | | | | 432,493 | |
Fabege AB | | | 79,503 | | | | 951,284 | |
Fagerhult AB | | | 2,130 | | | | 74,411 | |
Fastighets AB Balder - B Shares (a) (d) | | | 36,044 | | | | 370,001 | |
Fenix Outdoor AB | | | 384 | | | | 17,067 | |
Gunnebo AB | | | 23,589 | | | | 146,991 | |
Haldex AB | | | 33,062 | | | | 309,809 | |
Hexpol AB (d) | | | 11,619 | | | | 871,411 | |
HIQ International AB (a) (d) | | | 34,294 | | | | 211,129 | |
HMS Networks AB | | | 709 | | | | 15,056 | |
Holmen AB - B Shares | | | 32,135 | | | | 1,170,980 | |
Hufvudstaden AB - A Shares | | | 15,492 | | | | 207,819 | |
Husqvarna AB - A Shares | | | 9,289 | | | | 55,759 | |
Husqvarna AB - B Shares (d) | | | 210,669 | | | | 1,272,211 | |
ICA Gruppen AB (a) | | | 15,200 | | | | 475,902 | |
Industrial & Financial Systems | | | 11,624 | | | | 279,165 | |
Indutrade AB | | | 8,220 | | | | 344,285 | |
Intrum Justitia AB | | | 33,868 | | | | 950,821 | |
JM AB | | | 47,411 | | | | 1,345,268 | |
KappAhl AB (a) | | | 29,980 | | | | 176,236 | |
Karolinska Development AB (a) (d) | | | 7,514 | | | | 36,153 | |
|
Sweden—(Continued) | |
Klovern AB | | | 22,837 | | | | 101,204 | |
KNOW IT AB | | | 10,654 | | | | 95,162 | |
Kungsleden AB | | | 74,623 | | | | 501,801 | |
Lagercrantz AB - B Shares | | | 9,342 | | | | 170,000 | |
Lindab International AB (a) | | | 46,206 | | | | 456,979 | |
Loomis AB | | | 39,066 | | | | 930,326 | |
Meda AB - A Shares | | | 104,406 | | | | 1,327,493 | |
Medivir AB - B Shares (a) (d) | | | 16,404 | | | | 216,032 | |
Mekonomen AB (d) | | | 9,563 | | | | 294,901 | |
Micronic Mydata AB (a) (d) | | | 46,878 | | | | 90,363 | |
Modern Times Group AB - B Shares | | | 9,830 | | | | 510,744 | |
MQ Holding AB | | | 9,112 | | | | 32,651 | |
NCC AB - A Shares (d) | | | 3,116 | | | | 101,983 | |
NCC AB - B Shares (d) | | | 45,222 | | | | 1,479,218 | |
Nederman Holding AB | | | 932 | | | | 27,534 | |
Net Entertainment NE AB - B Shares (a) | | | 16,258 | | | | 342,704 | |
Net Insight AB (a) | | | 143,837 | | | | 32,222 | |
New Wave Group AB - B Shares | | | 27,702 | | | | 141,671 | |
Nibe Industrier AB - B Shares (d) | | | 40,031 | | | | 903,828 | |
Nobia AB | | | 90,272 | | | | 766,495 | |
Nolato AB - B Shares | | | 12,091 | | | | 276,531 | |
Nordnet AB - B Shares | | | 50,893 | | | | 205,769 | |
OEM International AB - B Shares | | | 498 | | | | 6,888 | |
Orexo AB (a) | | | 5,087 | | | | 129,845 | |
PA Resources AB (a) | | | 3,844 | | | | 5,374 | |
Peab AB | | | 89,685 | | | | 549,624 | |
Pricer AB - B Shares | | | 57,101 | | | | 58,477 | |
Proact IT Group AB | | | 4,203 | | | | 53,069 | |
Probi AB | | | 2,989 | | | | 18,418 | |
Proffice AB - B Shares | | | 32,500 | | | | 133,026 | |
Ratos AB - B Shares (d) | | | 15,038 | | | | 136,206 | |
RaySearch Laboratories AB (a) | | | 6,806 | | | | 28,996 | |
ReadSoft AB - B Shares | | | 7,499 | | | | 23,100 | |
Rezidor Hotel Group AB (a) | | | 41,212 | | | | 256,422 | |
rnb Retail and Brands AB (a) | | | 5,888 | | | | 12,147 | |
Saab AB - Class B | | | 27,146 | | | | 728,063 | |
Sagax AB | | | 14,540 | | | | 54,741 | |
SAS AB (a) | | | 78,024 | | | | 200,363 | |
Sectra AB - B Shares (a) | | | 2,976 | | | | 35,521 | |
Semcon AB | | | 8,454 | | | | 79,590 | |
SkiStar AB | | | 12,482 | | | | 153,780 | |
SSAB AB - A Shares (d) | | | 87,230 | | | | 670,880 | |
SSAB AB - B Shares | | | 46,497 | | | | 300,705 | |
Sweco AB - B Shares | | | 18,222 | | | | 300,142 | |
Swedish Orphan Biovitrum AB (a) | | | 74,978 | | | | 778,112 | |
Systemair AB | | | 6,265 | | | | 130,188 | |
TradeDoubler AB (a) | | | 21,483 | | | | 62,715 | |
Transcom WorldWide S.A. (a) | | | 22,591 | | | | 4,376 | |
Transmode Holding AB | | | 2,253 | | | | 40,144 | |
Trelleborg AB - B Shares | | | 43,767 | | | | 872,482 | |
Unibet Group plc | | | 16,402 | | | | 791,669 | |
Vitrolife AB | | | 7,246 | | | | 106,521 | |
Wallenstam AB - B Shares (d) | | | 46,001 | | | | 697,317 | |
Wihlborgs Fastigheter AB | | | 34,720 | | | | 623,886 | |
| | | | | | | | |
| | | | | | | 36,800,156 | |
| | | | | | | | |
See accompanying notes to financial statements.
MSF-33
Metropolitan Series Fund
Met/Dimensional International Small Company Portfolio
Schedule of Investments as of December 31, 2013
Common Stocks—(Continued)
| | | | | | | | |
| Security Description | | Shares | | | Value | |
|
Switzerland—4.8% | |
Advanced Digital Broadcast Holdings S.A. (a) | | | 557 | | | $ | 9,745 | |
AFG Arbonia-Forster Holding AG (a) | | | 9,594 | | | | 338,581 | |
Allreal Holding AG (a) | | | 6,898 | | | | 955,675 | |
Alpiq Holding AG (a) | | | 28 | | | | 3,847 | |
APG SGA S.A. | | | 818 | | | | 228,227 | |
Ascom Holding AG (a) | | | 17,215 | | | | 290,053 | |
Autoneum Holding AG (a) | | | 2,052 | | | | 315,398 | |
Bachem Holding AG (a) | | | 1,972 | | | | 107,656 | |
Bank Coop AG | | | 3,124 | | | | 157,889 | |
Banque Cantonale de Geneve | | | 435 | | | | 109,907 | |
Banque Privee Edmond de Rothschild S.A. | | | 3 | | | | 48,368 | |
Basilea Pharmaceutica (a) | | | 2,000 | | | | 236,918 | |
Basler Kantonalbank | | | 130 | | | | 10,612 | |
Belimo Holding AG | | | 239 | | | | 659,296 | |
Bell AG | | | 74 | | | | 192,635 | |
Bellevue Group AG | | | 2,584 | | | | 39,311 | |
Berner Kantonalbank AG (d) | | | 2,359 | | | | 544,812 | |
BKW AG | | | 6,162 | | | | 198,646 | |
Bobst Group AG (a) | | | 6,231 | | | | 210,366 | |
Bossard Holding AG | | | 1,729 | | | | 400,970 | |
Bucher Industries AG | | | 3,522 | | | | 1,025,369 | |
Burckhardt Compression Holding AG | | | 1,451 | | | | 637,194 | |
Burkhalter Holding AG (a) | | | 1,340 | | | | 114,936 | |
Carlo Gavazzi Holding AG | | | 191 | | | | 44,950 | |
Cham Paper Holding AG (a) | | | 169 | | | | 42,198 | |
Charles Voegele Holding AG (a) | | | 4,263 | | | | 52,061 | |
Cicor Technologies (a) | | | 644 | | | | 24,959 | |
Cie Financiere Tradition S.A. (a) | | | 863 | | | | 46,899 | |
Clariant AG (a) | | | 75,270 | | | | 1,377,185 | |
Coltene Holding AG (a) | | | 1,860 | | | | 95,574 | |
Conzzeta AG | | | 47 | | | | 109,416 | |
Daetwyler Holding AG (d) | | | 3,203 | | | | 445,927 | |
Dufry AG (a) | | | 9,253 | | | | 1,628,878 | |
EFG International AG (a) (d) | | | 27,485 | | | | 392,817 | |
Emmi AG (a) | | | 1,190 | | | | 365,240 | |
Energiedienst Holding AG (a) | | | 3,017 | | | | 99,751 | |
Flughafen Zuerich AG | | | 2,209 | | | | 1,291,710 | |
Forbo Holding AG (a) | | | 1,023 | | | | 874,069 | |
Galenica AG | | | 2,405 | | | | 2,422,346 | |
GAM Holding AG (a) | | | 115,271 | | | | 2,243,618 | |
Gategroup Holding AG (a) | | | 14,867 | | | | 403,538 | |
Georg Fischer AG (a) | | | 2,362 | | | | 1,662,561 | |
Gurit Holding AG (a) | | | 292 | | | | 147,614 | |
Helvetia Holding AG | | | 3,360 | | | | 1,686,286 | |
Highlight Communications AG (a) | | | 13,077 | | | | 71,497 | |
Huber & Suhner AG | | | 6,932 | | | | 364,480 | |
Implenia AG (a) | | | 8,148 | | | | 594,405 | |
Inficon Holding AG (a) (d) | | | 996 | | | | 384,210 | |
Interroll Holding AG (a) | | | 265 | | | | 145,900 | |
Intershop Holdings AG | | | 753 | | | | 282,695 | |
Jungfraubahn Holding AG | | | 85 | | | | 6,212 | |
Kaba Holding AG (a) | | | 1,471 | | | | 714,943 | |
Kardex AG (a) | | | 3,370 | | | | 148,288 | |
Komax Holding AG (a) | | | 2,284 | | | | 346,421 | |
Kudelski S.A. | | | 28,311 | | | | 432,376 | |
Kuoni Reisen Holding AG (a) | | | 2,197 | | | | 995,466 | |
LEM Holding S.A. | | | 349 | | | | 273,058 | |
|
Switzerland—(Continued) | |
Liechtensteinische Landesbank AG | | | 2,973 | | | | 123,292 | |
LifeWatch AG (a) | | | 4,907 | | | | 41,685 | |
Logitech International S.A. (d) | | | 84,871 | | | | 1,169,274 | |
Lonza Group AG (a) | | | 30,595 | | | | 2,912,334 | |
Luzerner Kantonalbank AG | | | 1,836 | | | | 705,673 | |
MCH Group AG | | | 1,044 | | | | 69,795 | |
Metall Zug AG | | | 79 | | | | 210,476 | |
Meyer Burger Technology AG (a) | | | 51,039 | | | | 608,860 | |
Micronas Semiconductor Holding AG (a) (d) | | | 16,260 | | | | 128,586 | |
Mikron Holding AG (a) | | | 474 | | | | 3,285 | |
Mobilezone Holding AG | | | 17,624 | | | | 185,802 | |
Mobimo Holding AG (a) | | | 3,387 | | | | 707,984 | |
Nobel Biocare Holding AG (a) (d) | | | 57,298 | | | | 895,744 | |
OC Oerlikon Corp. AG (a) | | | 101,100 | | | | 1,513,770 | |
Orascom Development Holding AG (a) | | | 2,069 | | | | 33,841 | |
Orell Fuessli Holding AG (a) | | | 428 | | | | 42,957 | |
Orior AG (a) | | | 3,084 | | | | 179,806 | |
Panalpina Welttransport Holding AG (d) | | | 4,140 | | | | 695,509 | |
Phoenix Mecano AG | | | 384 | | | | 234,561 | |
PSP Swiss Property AG (a) | | | 2,635 | | | | 223,738 | |
PubliGroupe AG | | | 910 | | | | 91,222 | |
Rieter Holding AG (a) (d) | | | 1,987 | | | | 469,597 | |
Romande Energie Holding S.A. | | | 125 | | | | 149,137 | |
Schaffner Holding AG (a) | | | 238 | | | | 70,530 | |
Schmolz & Bickenbach AG (a) (d) | | | 291,720 | | | | 360,931 | |
Schweiter Technologies AG | | | 567 | | | | 430,216 | |
Schweizerische National-Versicherungs-Gesellschaft AG (d) | | | 8,748 | | | | 634,436 | |
Siegfried Holding AG (a) | | | 1,948 | | | | 352,797 | |
St. Galler Kantonalbank AG | | | 1,433 | | | | 559,062 | |
Straumann Holding AG (d) | | | 153 | | | | 28,840 | |
Swiss Life Holding AG (a) | | | 3,715 | | | | 773,202 | |
Swisslog Holding AG (a) | | | 139,223 | | | | 178,087 | |
Swissquote Group Holding S.A. | | | 5,895 | | | | 260,370 | |
Tamedia AG | | | 904 | | | | 109,354 | |
Tecan Group AG (d) | | | 3,723 | | | | 440,939 | |
Temenos Group AG (a) (d) | | | 24,817 | | | | 703,062 | |
Tornos Holding AG (a) | | | 3,719 | | | | 19,370 | |
U-Blox AG (a) | | | 3,324 | | | | 362,192 | |
Valiant Holding | | | 7,115 | | | | 636,758 | |
Valora Holding AG (d) | | | 1,951 | | | | 544,248 | |
Vaudoise Assurances Holding S.A. | | | 618 | | | | 266,118 | |
Verwaltungs- und Privat-Bank AG | | | 2,526 | | | | 275,940 | |
Vetropack Holding AG | | | 131 | | | | 267,447 | |
Von Roll Holding AG (a) | | | 27,242 | | | | 42,523 | |
Vontobel Holding AG | | | 13,645 | | | | 565,512 | |
Walliser Kantonalbank | | | 137 | | | | 115,593 | |
Walter Meier AG | | | 1,540 | | | | 99,702 | |
Ypsomed Holding AG (a) | | | 2,012 | | | | 146,910 | |
Zehnder Group AG (d) | | | 6,564 | | | | 301,788 | |
Zueblin Immobilien Holding AG (a) | | | 20,587 | | | | 43,378 | |
Zug Estates Holding AG (a) | | | 73 | | | | 95,230 | |
Zuger Kantonalbank AG | | | 70 | | | | 346,755 | |
| | | | | | | | |
| | | | | | | 47,482,177 | |
| | | | | | | | |
See accompanying notes to financial statements.
MSF-34
Metropolitan Series Fund
Met/Dimensional International Small Company Portfolio
Schedule of Investments as of December 31, 2013
Common Stocks—(Continued)
| | | | | | | | |
| Security Description | | Shares | | | Value | |
|
United Kingdom—22.2% | |
4imprint Group plc | | | 6,953 | | | $ | 77,062 | |
888 Holdings plc (d) | | | 66,302 | | | | 189,825 | |
A.G.BARR plc | | | 49,005 | | | | 459,355 | |
Acal plc | | | 9,528 | | | | 51,928 | |
Afren plc (a) | | | 557,996 | | | | 1,563,943 | |
African Barrick Gold plc | | | 30,782 | | | | 94,940 | |
Aga Rangemaster Group plc (a) | | | 25,439 | | | | 71,243 | |
Air Partner plc | | | 992 | | | | 9,220 | |
Alent plc | | | 145,875 | | | | 857,041 | |
AMEC plc | | | 7,659 | | | | 138,312 | |
Amlin plc | | | 302,061 | | | | 2,303,878 | |
Anglo Pacific Group plc | | | 29,836 | | | | 91,250 | |
Anglo-Eastern Plantations | | | 4,252 | | | | 47,507 | |
Anite plc | | | 150,636 | | | | 247,014 | |
Ashmore Group plc (d) | | | 158,060 | | | | 1,056,717 | |
Ashtead Group plc | | | 288,080 | | | | 3,644,954 | |
Atrium European Real Estate, Ltd. (a) | | | 114,274 | | | | 657,303 | |
Avon Rubber plc | | | 13,389 | | | | 129,782 | |
AZ Electronic Materials S.A. | | | 60,863 | | | | 398,794 | |
Balfour Beatty plc (d) | | | 331,723 | | | | 1,579,641 | |
Bank of Georgia Holdings plc | | | 3,494 | | | | 138,879 | |
Barratt Developments plc | | | 542,674 | | | | 3,139,067 | |
BBA Aviation plc | | | 288,870 | | | | 1,537,674 | |
Beazley plc | | | 386,682 | | | | 1,745,611 | |
Bellway plc | | | 82,065 | | | | 2,141,808 | |
Berendsen plc | | | 106,561 | | | | 1,658,729 | |
Berkeley Group Holdings plc | | | 70,062 | | | | 3,098,815 | |
Betfair Group plc | | | 16,616 | | | | 297,252 | |
Bioquell plc | | | 5,000 | | | | 11,508 | |
Bloomsbury Publishing plc | | | 30,485 | | | | 89,123 | |
Bodycote plc | | | 122,371 | | | | 1,359,551 | |
Booker Group plc | | | 568,154 | | | | 1,534,600 | |
BOOT HENRY plc | | | 1,476 | | | | 4,893 | |
Bovis Homes Group plc | | | 92,138 | | | | 1,215,871 | |
Braemar Shipping Services plc | | | 6,245 | | | | 57,902 | |
Brammer plc | | | 44,820 | | | | 333,963 | |
Brewin Dolphin Holdings plc | | | 143,539 | | | | 725,511 | |
British Polythene Industries plc | | | 12,178 | | | | 130,080 | |
Britvic plc | | | 142,790 | | | | 1,641,015 | |
BTG plc (a) | | | 150,041 | | | | 1,433,120 | |
Bwin.Party Digital Entertainment plc (d) | | | 374,077 | | | | 763,005 | |
Cable & Wireless Communications plc | | | 732,967 | | | | 682,904 | |
Cairn Energy plc (a) | | | 351,764 | | | | 1,572,773 | |
Camellia plc | | | 24 | | | | 3,439 | |
Cape plc | | | 61,478 | | | | 283,284 | |
Capital & Counties Properties plc | | | 107,134 | | | | 585,916 | |
Capital & Regional plc | | | 97,482 | | | | 71,254 | |
Carclo plc | | | 16,990 | | | | 80,586 | |
Carillion plc (d) | | | 238,276 | | | | 1,307,757 | |
Carr’s Milling Industries plc | | | 1,554 | | | | 43,439 | |
Castings plc | | | 1,484 | | | | 10,481 | |
Catlin Group, Ltd. | | | 266,277 | | | | 2,569,565 | |
Centamin plc (a) | | | 239,434 | | | | 176,715 | |
Centaur Media plc | | | 92,526 | | | | 89,620 | |
Charles Stanley Group plc | | | 989 | | | | 8,271 | |
Charles Taylor plc | | | 428 | | | | 1,809 | |
Chemring Group plc (d) | | | 102,201 | | | | 379,269 | |
|
United Kingdom—(Continued) | |
Chesnara plc | | | 55,231 | | | | 294,056 | |
Chime Communications plc | | | 23,457 | | | | 130,818 | |
Cineworld Group plc | | | 64,468 | | | | 405,736 | |
Clarkson plc | | | 6,362 | | | | 210,932 | |
Close Brothers Group plc | | | 98,159 | | | | 2,237,768 | |
Cobham plc | | | 661,214 | | | | 3,006,985 | |
Colt Group S.A. (a) | | | 208,005 | | | | 442,454 | |
Communisis plc | | | 74,463 | | | | 69,679 | |
Computacenter plc | | | 49,003 | | | | 519,107 | |
Consort Medical plc | | | 18,608 | | | | 294,917 | |
Costain Group plc (d) | | | 15,864 | | | | 72,768 | |
Cranswick plc | | | 30,441 | | | | 600,432 | |
Creston plc | | | 5,272 | | | | 8,162 | |
CSR plc | | | 122,475 | | | | 1,285,797 | |
Daily Mail & General Trust plc (d) | | | 156,527 | | | | 2,494,989 | |
Dairy Crest Group plc (d) | | | 85,916 | | | | 768,466 | |
Darty plc | | | 129,758 | | | | 253,387 | |
De La Rue plc | | | 36,783 | | | | 531,024 | |
Debenhams plc | | | 788,181 | | | | 953,264 | |
Dechra Pharmaceuticals plc | | | 41,847 | | | | 487,346 | |
Development Securities plc | | | 64,608 | | | | 285,467 | |
Devro plc | | | 101,974 | | | | 486,406 | |
Dignity plc | | | 31,299 | | | | 747,068 | |
Diploma plc | | | 67,126 | | | | 752,327 | |
Dixons Retail plc (a) | | | 2,176,730 | | | | 1,749,651 | |
Domino Printing Sciences plc | | | 70,471 | | | | 894,465 | |
Domino’s Pizza Group plc | | | 62,875 | | | | 534,303 | |
Drax Group plc | | | 193,155 | | | | 2,565,857 | |
DS Smith plc | | | 529,602 | | | | 2,920,487 | |
Dunelm Group plc | | | 11,505 | | | | 171,832 | |
E2V Technologies plc | | | 61,165 | | | | 152,204 | |
easyJet plc (d) | | | 93,444 | | | | 2,379,061 | |
Electrocomponents plc | | | 261,440 | | | | 1,213,469 | |
Elementis plc | | | 255,861 | | | | 1,142,637 | |
EnQuest plc (a) (d) | | | 429,925 | | | | 960,651 | |
Enterprise Inns plc (a) | | | 348,057 | | | | 887,755 | |
Essar Energy plc (a) (d) | | | 157,334 | | | | 189,827 | |
Essentra plc | | | 129,023 | | | | 1,840,932 | |
Euromoney Institutional Investor plc | | | 20,461 | | | | 457,709 | |
Exillon Energy plc (a) (d) | | | 19,973 | | | | 56,912 | |
F&C Asset Management plc | | | 295,113 | | | | 449,832 | |
Fenner plc | | | 118,143 | | | | 949,720 | |
Ferrexpo plc | | | 107,348 | | | | 341,318 | |
Fidessa Group plc | | | 20,495 | | | | 765,146 | |
Findel plc (a) | | | 17,439 | | | | 78,778 | |
Firstgroup plc | | | 771,434 | | | | 1,579,652 | |
Fortune Oil plc | | | 575,627 | | | | 90,070 | |
Fuller Smith & Turner | | | 7,667 | | | | 117,140 | |
Galliford Try plc | | | 41,886 | | | | 814,303 | |
Gem Diamonds, Ltd. (a) | | | 61,908 | | | | 149,046 | |
Genus plc | | | 36,981 | | | | 797,336 | |
Go-Ahead Group plc | | | 22,995 | | | | 670,942 | |
Greene King plc | | | 120,037 | | | | 1,755,220 | |
Greggs plc (d) | | | 54,722 | | | | 391,199 | |
Halfords Group plc | | | 119,495 | | | | 883,128 | |
Halma plc | | | 198,998 | | | | 1,990,673 | |
Hansard Global plc | | | 6,197 | | | | 9,868 | |
See accompanying notes to financial statements.
MSF-35
Metropolitan Series Fund
Met/Dimensional International Small Company Portfolio
Schedule of Investments as of December 31, 2013
Common Stocks—(Continued)
| | | | | | | | |
| Security Description | | Shares | | | Value | |
|
United Kingdom—(Continued) | |
Hardy Oil & Gas plc (a) | | | 14,946 | | | $ | 18,557 | |
Hays plc | | | 644,027 | | | | 1,385,878 | |
Headlam Group plc | | | 56,842 | | | | 382,398 | |
Helical Bar plc | | | 65,404 | | | | 353,755 | |
Henderson Group plc | | | 548,846 | | | | 2,079,810 | |
Heritage Oil plc (a) | | | 105,352 | | | | 260,417 | |
Hikma Pharmaceuticals plc (d) | | | 82,141 | | | | 1,633,966 | |
Hill & Smith Holdings plc | | | 48,903 | | | | 417,915 | |
Hilton Food Group plc | | | 1,888 | | | | 13,350 | |
Hiscox, Ltd. | | | 206,205 | | | | 2,374,887 | |
Hochschild Mining plc | | | 69,571 | | | | 163,606 | |
Hogg Robinson Group plc | | | 81,837 | | | | 106,842 | |
Home Retail Group plc | | | 448,340 | | | | 1,425,712 | |
Homeserve plc | | | 170,640 | | | | 778,759 | |
Hornby plc | | | 1,884 | | | | 2,573 | |
Howden Joinery Group plc | | | 345,962 | | | | 1,980,766 | |
Hunting plc (d) | | | 69,198 | | | | 896,326 | |
Huntsworth plc | | | 31,310 | | | | 35,789 | |
Hyder Consulting plc | | | 16,799 | | | | 176,673 | |
ICAP plc | | | 151,421 | | | | 1,134,505 | |
IG Group Holdings plc | | | 136,967 | | | | 1,401,062 | |
Imagination Technologies Group plc (a) (d) | | | 17,170 | | | | 50,898 | |
Inchcape plc | | | 245,182 | | | | 2,496,672 | |
Informa plc | | | 293,165 | | | | 2,785,710 | |
Inmarsat plc | | | 194,647 | | | | 2,438,461 | |
Innovation Group plc (a) | | | 520,476 | | | | 299,947 | |
Intermediate Capital Group plc | | | 56,516 | | | | 393,339 | |
International Personal Finance plc | | | 167,310 | | | | 1,385,140 | |
Interserve plc | | | 82,100 | | | | 847,331 | |
Invensys plc | | | 205,768 | | | | 1,736,276 | |
IP Group plc (a) | | | 134,473 | | | | 377,998 | |
ITE Group plc | | | 128,734 | | | | 655,613 | |
James Fisher & Sons plc | | | 20,889 | | | | 432,448 | |
Jardine Lloyd Thompson Group plc | | | 80,781 | | | | 1,365,157 | |
JD Sports Fashion plc | | | 9,241 | | | | 222,975 | |
JD Wetherspoon plc | | | 61,195 | | | | 771,875 | |
JKX Oil & Gas plc (a) | | | 48,421 | | | | 57,325 | |
John Menzies plc | | | 19,888 | | | | 233,315 | |
John Wood Group plc | | | 167,033 | | | | 1,905,434 | |
Johnston Press plc (a) | | | 221,296 | | | | 58,723 | |
Jupiter Fund Management plc | | | 141,577 | | | | 903,189 | |
Kcom Group plc | | | 394,746 | | | | 643,550 | |
Keller Group plc | | | 36,149 | | | | 688,204 | |
Kier Group plc | | | 16,359 | | | | 497,648 | |
Ladbrokes plc (d) | | | 533,684 | | | | 1,582,137 | |
Laird plc | | | 156,521 | | | | 719,811 | |
Lamprell plc (a) | | | 113,934 | | | | 264,827 | |
Lancashire Holdings, Ltd. | | | 82,826 | | | | 1,112,583 | |
Latchways plc | | | 918 | | | | 19,162 | |
Laura Ashley Holdings plc | | | 25,157 | | | | 10,790 | |
Lavendon Group plc | | | 44,306 | | | | 127,086 | |
London Stock Exchange Group plc | | | 21,205 | | | | 608,748 | |
Lonmin plc (a) | | | 229,666 | | | | 1,179,752 | |
Lookers plc | | | 122,220 | | | | 245,019 | |
Low & Bonar plc | | | 37,972 | | | | 45,224 | |
LSL Property Services plc | | | 2,076 | | | | 15,148 | |
Man Group plc | | | 757,211 | | | | 1,066,694 | |
|
United Kingdom—(Continued) | |
Management Consulting Group plc | | | 9,097 | | | | 3,891 | |
Marshalls plc | | | 73,011 | | | | 213,812 | |
Marston’s plc | | | 388,928 | | | | 924,885 | |
McBride plc (a) | | | 112,043 | | | | 185,253 | |
Mears Group plc | | | 51,685 | | | | 406,959 | |
Mecom Group plc | | | 42,085 | | | | 60,703 | |
Meggitt plc | | | 240,740 | | | | 2,108,724 | |
Melrose Industries plc | | | 190,842 | | | | 966,719 | |
Michael Page International plc | | | 126,237 | | | | 1,023,648 | |
Micro Focus International plc | | | 74,994 | | | | 955,186 | |
Millennium & Copthorne Hotels plc | | | 89,395 | | | | 888,973 | |
Mitchells & Butlers plc (a) | | | 113,439 | | | | 793,154 | |
Mitie Group plc (d) | | | 176,827 | | | | 931,413 | |
MJ Gleeson Group plc | | | 1,023 | | | | 5,473 | |
Mondi plc | | | 64,354 | | | | 1,119,136 | |
Moneysupermarket.com Group plc | | | 121,798 | | | | 364,372 | |
Morgan Advanced Materials plc | | | 182,381 | | | | 960,917 | |
Morgan Sindall Group plc | | | 15,921 | | | | 199,119 | |
Mothercare plc (a) (d) | | | 41,074 | | | | 267,360 | |
N Brown Group plc | | | 92,789 | | | | 820,397 | |
National Express Group plc | | | 318,383 | | | | 1,451,835 | |
NCC Group plc | | | 68,996 | | | | 211,561 | |
New World Resources plc - A Shares (a) (d) | | | 11,898 | | | | 14,394 | |
Northgate plc | | | 71,837 | | | | 612,688 | |
Novae Group plc | | | 24,669 | | | | 256,783 | |
Ocado Group plc (a) | | | 168,218 | | | | 1,234,581 | |
Optos plc (a) | | | 26,295 | | | | 88,212 | |
Oxford Biomedica plc (a) (d) | | | 67,707 | | | | 2,607 | |
Oxford Instruments plc | | | 17,521 | | | | 513,468 | |
Pace plc | | | 170,988 | | | | 903,954 | |
PayPoint plc | | | 30,239 | | | | 507,980 | |
Pendragon plc | | | 294,775 | | | | 167,235 | |
Pennon Group plc | | | 183,169 | | | | 2,000,797 | |
Persimmon plc (a) | | | 199,016 | | | | 4,088,522 | |
Petra Diamonds, Ltd. (a) | | | 147,321 | | | | 289,295 | |
Petropavlovsk plc (d) | | | 85,219 | | | | 102,807 | |
Phoenix Group Holdings | | | 44,630 | | | | 537,572 | |
Phoenix IT Group, Ltd. | | | 21,830 | | | | 48,446 | |
Photo-Me International plc | | | 27,274 | | | | 59,691 | |
Premier Farnell plc | | | 206,598 | | | | 761,642 | |
Premier Foods plc (a) | | | 126,593 | | | | 262,940 | |
Premier Oil plc | | | 272,250 | | | | 1,415,392 | |
Punch Taverns plc (a) | | | 322,649 | | | | 64,190 | |
PV Crystalox Solar plc (a) (d) | | | 36,217 | | | | 8,678 | |
PZ Cussons plc | | | 133,219 | | | | 831,333 | |
QinetiQ Group plc | | | 338,186 | | | | 1,216,168 | |
Quintain Estates & Development plc (a) | | | 278,012 | | | | 435,120 | |
Rank Group plc | | | 27,081 | | | | 60,587 | |
Rathbone Brothers plc | | | 24,973 | | | | 668,059 | |
Raven Russia, Ltd. (a) | | | 58,157 | | | | 76,564 | |
REA Holdings plc | | | 1,120 | | | | 8,343 | |
Redrow plc | | | 183,456 | | | | 951,596 | |
Regus plc | | | 350,864 | | | | 1,266,048 | |
Renishaw plc | | | 21,312 | | | | 687,887 | |
Renold plc (a) | | | 64,766 | | | | 53,983 | |
Renovo Group plc (a) | | | 13,825 | | | | 4,382 | |
Rentokil Initial plc | | | 493,754 | | | | 947,892 | |
See accompanying notes to financial statements.
MSF-36
Metropolitan Series Fund
Met/Dimensional International Small Company Portfolio
Schedule of Investments as of December 31, 2013
Common Stocks—(Continued)
| | | | | | | | |
| Security Description | | Shares | | | Value | |
|
United Kingdom—(Continued) | |
Restaurant Group plc | | | 119,275 | | | $ | 1,172,959 | |
Ricardo plc | | | 10,889 | | | | 121,026 | |
Rightmove plc | | | 42,268 | | | | 1,924,747 | |
RM plc | | | 49,467 | | | | 94,149 | |
Robert Walters plc | | | 16,972 | | | | 87,708 | |
Rotork plc | | | 43,384 | | | | 2,070,969 | |
RPC Group plc | | | 92,930 | | | | 909,853 | |
RPS Group plc | | | 139,248 | | | | 775,784 | |
Salamander Energy plc (a) | | | 143,094 | | | | 265,736 | |
Savills plc | | | 84,393 | | | | 902,405 | |
SDL plc | | | 52,526 | | | | 313,335 | |
Senior plc | | | 227,772 | | | | 1,159,486 | |
Sepura plc | | | 11,245 | | | | 26,104 | |
Serco Group plc | | | 45,096 | | | | 372,681 | |
Severfield-Rowen plc (a) | | | 125,960 | | | | 125,860 | |
Shanks Group plc | | | 246,393 | | | | 444,052 | |
SIG plc | | | 351,400 | | | | 1,232,514 | |
Smiths News plc | | | 105,529 | | | | 412,411 | |
Soco International plc (a) | | | 119,335 | | | | 782,688 | |
Spectris plc | | | 75,025 | | | | 3,183,944 | |
Speedy Hire plc | | | 231,047 | | | | 245,092 | |
Spirax-Sarco Engineering plc | | | 41,098 | | | | 2,040,573 | |
Spirent Communications plc | | | 344,790 | | | | 591,409 | |
Spirit Pub Co. plc (d) | | | 327,364 | | | | 416,961 | |
Sportech plc (a) | | | 20,264 | | | | 27,372 | |
Sports Direct International plc (a) | | | 48,604 | | | | 577,200 | |
St. Ives plc | | | 36,663 | | | | 104,969 | |
St. James’s Place plc | | | 91,335 | | | | 1,101,232 | |
St. Modwen Properties plc | | | 110,240 | | | | 670,666 | |
Stagecoach Group plc | | | 233,416 | | | | 1,465,273 | |
Sthree plc | | | 46,658 | | | | 279,561 | |
SuperGroup plc (a) | | | 17,932 | | | | 420,546 | |
Synergy Health plc | | | 30,931 | | | | 616,910 | |
Synthomer plc | | | 163,534 | | | | 691,931 | |
TalkTalk Telecom Group plc (d) | | | 188,301 | | | | 956,788 | |
Taylor Wimpey plc | | | 1,648,812 | | | | 3,056,725 | |
Ted Baker plc | | | 6,525 | | | | 247,563 | |
Telecity Group plc | | | 22,852 | | | | 275,245 | |
Telecom Plus plc | | | 21,749 | | | | 638,725 | |
Thomas Cook Group plc (a) | | | 821,921 | | | | 2,276,930 | |
Thorntons plc (a) | | | 25,294 | | | | 55,744 | |
Topps Tiles plc | | | 106,295 | | | | 205,552 | |
Torotrak plc (a) | | | 15,625 | | | | 5,609 | |
Travis Perkins plc | | | 27,016 | | | | 840,881 | |
Tribal Group plc | | | 25,502 | | | | 71,995 | |
Trifast plc | | | 6,100 | | | | 8,106 | |
Trinity Mirror plc (a) | | | 174,518 | | | | 590,704 | |
TT electronics plc | | | 99,086 | | | | 323,203 | |
TUI Travel plc | | | 208,335 | | | | 1,426,316 | |
Tullett Prebon plc | | | 133,791 | | | | 834,660 | |
UBM plc | | | 29,120 | | | | 316,411 | |
UK Mail Group plc | | | 1,868 | | | | 19,161 | |
Ultra Electronics Holdings plc | | | 18,981 | | | | 608,127 | |
Unite Group plc | | | 128,010 | | | | 855,485 | |
UTV Media plc | | | 54,341 | | | | 193,432 | |
Vectura Group plc (a) | | | 199,135 | | | | 461,725 | |
Vesuvius plc (d) | | | 153,649 | | | | 1,298,598 | |
|
United Kingdom—(Continued) | |
Victrex plc | | | 43,917 | | | | 1,341,834 | |
Vislink plc | | | 37,188 | | | | 27,709 | |
Vitec Group plc (The) | | | 11,459 | | | | 121,351 | |
Volex plc (d) | | | 14,989 | | | | 29,092 | |
Vp plc | | | 1,199 | | | | 13,250 | |
WH Smith plc | | | 85,603 | | | | 1,423,028 | |
Wincanton plc (a) | | | 58,903 | | | | 123,178 | |
Wolfson Microelectronics plc (a) | | | 84,440 | | | | 205,383 | |
WS Atkins plc | | | 76,087 | | | | 1,791,431 | |
Xaar plc | | | 21,952 | | | | 407,446 | |
Xchanging plc | | | 144,207 | | | | 366,779 | |
XP Power, Ltd. (d) | | | 3,554 | | | | 93,506 | |
| | | | | | | | |
| | | | | | | 220,306,105 | |
| | | | | | | | |
|
United States—0.0% | |
Kofax, Ltd. (a) | | | 34,020 | | | | 229,708 | |
| | | | | | | | |
Total Common Stocks
(Cost $715,389,152) | | | | | | | 988,691,296 | |
| | | | | | | | |
| |
| Rights—0.0% | | | | | |
| |
Australia—0.0% | | | | | |
Peak Resources, Ltd., Expires 01/13/14 (a) (c) | | | 6,909 | | | | 43 | |
| | | | | | | | |
|
Austria—0.0% | |
Intercell AG (a) (b) (c) | | | 24,163 | | | | 0 | |
| | | | | | | | |
|
Hong Kong—0.0% | |
Hon Kwok Land Investment Co., Ltd., Expires 01/14/14 (a) | | | 70,000 | | | | 0 | |
Lai Sun Garment International, Ltd., Expires 01/27/14 (a) (c) | | | 68,800 | | | | 3,336 | |
| | | | | | | | |
| | | | | | | 3,336 | |
| | | | | | | | |
|
Japan—0.0% | |
Nichi-iko Pharmaceutical Co., Ltd., Expires 01/24/14 (a) (d) | | | 8,800 | | | | 39,274 | |
| | | | | | | | |
|
Norway—0.0% | |
Norwegian Energy Co., Expires 01/13/14 (a) | | | 957,083 | | | | 15,780 | |
| | | | | | | | |
|
Singapore—0.0% | |
Falcon Energy Group, Ltd., Expires 06/16/18 (a) | | | 15,100 | | | | 491 | |
| | | | | | | | |
|
Spain—0.0% | |
Faes Farma S.A., Expires 01/10/14 (a) | | | 146,536 | | | | 8,467 | |
| | | | | | | | |
|
United Kingdom—0.0% | |
Torotrak plc, Expires 01/09/14 (a) (c) | | | 1,953 | | | | 117 | |
| | | | | | | | |
Total Rights
(Cost $50,890) | | | | | | | 67,508 | |
| | | | | | | | |
See accompanying notes to financial statements.
MSF-37
Metropolitan Series Fund
Met/Dimensional International Small Company Portfolio
Schedule of Investments as of December 31, 2013
Preferred Stock—0.0%
| | | | | | | | |
| Security Description | | Shares/
Principal
Amount* | | | Value | |
|
France—0.0% | |
Valneva SE (a) (d)
(Cost $8,927) | | | 7,852 | | | $ | 3,775 | |
| | | | | | | | |
|
| Warrant—0.0% | |
|
Italy—0.0% | |
Seat Pagine Gialle,
Expires 08/31/14 (a) (c) (d)
(Cost $0) | | | 402,113 | | | | 0 | |
| | | | | | | | |
|
| Short-Term Investments—15.6% | |
|
Mutual Fund—15.4% | |
State Street Navigator Securities Lending MET Portfolio (e) | | | 152,961,476 | | | | 152,961,476 | |
| | | | | | | | |
|
Repurchase Agreement—0.2% | |
Fixed Income Clearing Corp. Repurchase Agreement dated 12/31/13 at 0.000% to be repurchased at $1,987,000 on 01/02/14, collateralized by $2,020,000 U.S. Treasury Note at 0.625% due 07/15/16 with a value of $2,028,131. | | | 1,987,000 | | | | 1,987,000 | |
| | | | | | | | |
Total Short-Term Investments
(Cost $154,948,476) | | | | | | | 154,948,476 | |
| | | | | | | | |
Total Investments—115.0%
(Cost $870,397,445) (f) | | | | | | | 1,143,711,055 | |
Other assets and liabilities (net)—(15.0)% | | | | | | | (149,252,829 | ) |
| | | | | | | | |
| Net Assets—100.0% | | | | | | $ | 994,458,226 | |
| | | | | | | | |
| * | Principal amount stated in U.S. dollars unless otherwise noted. |
| (a) | Non-income producing security. |
| (b) | Security was valued in good faith under procedures approved by the Board of Trustees. As of December 31, 2013, these securities represent 0.03% of net assets. |
| (c) | Illiquid security. As of December 31, 2013, these securities represent 0.1% of net assets. |
| (d) | All or a portion of the security was held on loan. As of December 31, 2013, the market value of securities loaned was $146,590,257 and the collateral received consisted of cash in the amount of $152,961,476 and non-cash collateral with a value of $1,725,248. The cash collateral is invested in a money market fund managed by an affiliate of the custodian. The non-cash collateral received consists primarily of government securities and bank letters of credit, and is held for the benefit of the Portfolio at the Portfolio’s custodian. The Portfolio cannot repledge or resell this collateral. As such, this collateral is excluded from the Statement of Assets and Liabilities. |
| (e) | Represents investment of cash collateral received from securities lending transactions. |
| (f) | As of December 31, 2013, the aggregate cost of investments for federal income tax purposes was $881,458,586. The aggregate unrealized appreciation and depreciation of investments were $340,282,247 and $(78,029,778), respectively, resulting in net unrealized appreciation of $262,252,469 for federal income tax purposes. |
| | | | |
Ten Largest Industries as of December 31, 2013 (Unaudited) | | % of
Net Assets | |
Machinery | | | 6.3 | |
Commercial Banks | | | 4.2 | |
Construction & Engineering | | | 3.9 | |
Hotels, Restaurants & Leisure | | | 3.8 | |
Metals & Mining | | | 3.7 | |
Oil, Gas & Consumable Fuels | | | 3.5 | |
Media | | | 3.5 | |
Household Durables | | | 3.4 | |
Specialty Retail | | | 3.4 | |
Real Estate Management & Development | | | 3.1 | |
See accompanying notes to financial statements.
MSF-38
Metropolitan Series Fund
Met/Dimensional International Small Company Portfolio
Schedule of Investments as of December 31, 2013
Fair Value Hierarchy
Accounting principles generally accepted in the United States of America (“GAAP”) define fair market value as the price that the Portfolio would receive to sell an asset or pay to transfer a liability in an orderly transaction between market participants at the measurement date. It establishes a fair value hierarchy that prioritizes inputs to valuation methods and requires disclosure of the fair value hierarchy that segregates fair value measurements into three levels. Levels 1, 2 and 3 of the fair value hierarchy are defined as follows:
Level 1 - unadjusted quoted prices in active markets for identical investments
Level 2 - other significant observable inputs (including, but not limited to, unadjusted quoted prices for similar investments in markets that are either active or inactive; inputs other than quoted prices that are observable such as interest rates, yield curves, volatilities, prepayment speeds, loss severities, credit risks, default rates, etc.)
Level 3 - significant unobservable inputs based on the best information available in the circumstances, to the extent observable inputs are unavailable (including the Portfolio’s own assumptions in determining the fair value of investments)
The inputs or methodologies used for valuing investments are not necessarily an indication of the risk associated with investing in them. Changes to the inputs or methodologies used may result in transfers between levels, which will be recognized as of the beginning of the reporting period. Information on transfers between Level 1 and Level 2, if any, will be disclosed following the fair value hierarchy table below. A reconciliation of Level 3 securities, if any, will also be disclosed following the fair value hierarchy table. For more information about the Portfolio’s policy regarding the valuation of investments, please refer to the Notes to Financial Statements.
The following table summarizes the fair value hierarchy of the Portfolio’s investments as of December 31, 2013:
| | | | | | | | | | | | | | | | |
| Description | | Level 1 | | | Level 2 | | | Level 3 | | | Total | |
| Common Stocks | | | | | | | | | | | | | | | | |
Australia | | $ | 206,225 | | | $ | 49,680,908 | | | $ | 24,817 | | | $ | 49,911,950 | |
Austria | | | 3,345 | | | | 8,744,717 | | | | 0 | | | | 8,748,062 | |
Belgium | | | 231,699 | | | | 11,758,090 | | | | 137,117 | | | | 12,126,906 | |
Canada | | | 83,711,894 | | | | 13,327 | | | | — | | | | 83,725,221 | |
China | | | — | | | | 45,071 | | | | — | | | | 45,071 | |
Denmark | | | — | | | | 19,263,323 | | | | — | | | | 19,263,323 | |
Finland | | | — | | | | 24,989,040 | | | | — | | | | 24,989,040 | |
France | | | — | | | | 46,230,822 | | | | 0 | | | | 46,230,822 | |
Germany | | | 1,142,336 | | | | 51,267,098 | | | | — | | | | 52,409,434 | |
Greece | | | 171,776 | | | | 632,445 | | | | 0 | | | | 804,221 | |
Hong Kong | | | 693,022 | | | | 27,507,181 | | | | 51,560 | | | | 28,251,763 | |
Ireland | | | — | | | | 13,423,544 | | | | — | | | | 13,423,544 | |
Israel | | | — | | | | 10,204,055 | | | | — | | | | 10,204,055 | |
Italy | | | — | | | | 32,686,787 | | | | 0 | | | | 32,686,787 | |
Japan | | | 1,034,788 | | | | 213,299,151 | | | | 107,568 | | | | 214,441,507 | |
Luxembourg | | | — | | | | 120,735 | | | | — | | | | 120,735 | |
Netherlands | | | — | | | | 21,293,199 | | | | 0 | | | | 21,293,199 | |
New Zealand | | | 15,406 | | | | 8,399,157 | | | | 0 | | | | 8,414,563 | |
Norway | | | — | | | | 11,543,662 | | | | — | | | | 11,543,662 | |
Portugal | | | — | | | | 6,143,728 | | | | — | | | | 6,143,728 | |
Singapore | | | 98,676 | | | | 15,809,024 | | | | — | | | | 15,907,700 | |
Spain | | | — | | | | 23,187,857 | | | | 0 | | | | 23,187,857 | |
Sweden | | | — | | | | 36,800,156 | | | | — | | | | 36,800,156 | |
Switzerland | | | — | | | | 47,482,177 | | | | — | | | | 47,482,177 | |
United Kingdom | | | — | | | | 220,306,105 | | | | — | | | | 220,306,105 | |
United States | | | — | | | | 229,708 | | | | — | | | | 229,708 | |
Total Common Stocks | | | 87,309,167 | | | | 901,061,067 | | | | 321,062 | | | | 988,691,296 | |
| Rights | | | | | | | | | | | | | | | | |
Australia | | | 43 | | | | — | | | | — | | | | 43 | |
Austria | | | — | | | | — | | | | 0 | | | | 0 | |
Hong Kong | | | 3,336 | | | | — | | | | — | | | | 3,336 | |
Japan | | | 39,274 | | | | — | | | | — | | | | 39,274 | |
Norway | | | — | | | | 15,780 | | | | — | | | | 15,780 | |
Singapore | | | 491 | | | | — | | | | — | | | | 491 | |
Spain | | | 8,467 | | | | — | | | | — | | | | 8,467 | |
United Kingdom | | | — | | | | 117 | | | | — | | | | 117 | |
Total Rights | | | 51,611 | | | | 15,897 | | | | 0 | | | | 67,508 | |
Total Preferred Stock* | | | — | | | | 3,775 | | | | — | | | | 3,775 | |
Total Warrant* | | | 0 | | | | — | | | | — | | | | 0 | |
See accompanying notes to financial statements.
MSF-39
Metropolitan Series Fund
Met/Dimensional International Small Company Portfolio
Schedule of Investments as of December 31, 2013
Fair Value Hierarchy—(Continued)
| | | | | | | | | | | | | | | | |
| Description | | Level 1 | | | Level 2 | | | Level 3 | | | Total | |
| Short-Term Investments | | | | | | | | | | | | | | | | |
Mutual Fund | | $ | 152,961,476 | | | $ | — | | | $ | — | | | $ | 152,961,476 | |
Repurchase Agreement | | | — | | | | 1,987,000 | | | | — | | | | 1,987,000 | |
Total Short-Term Investments | | | 152,961,476 | | | | 1,987,000 | | | | — | | | | 154,948,476 | |
Total Investments | | $ | 240,322,254 | | | $ | 903,067,739 | | | $ | 321,062 | | | $ | 1,143,711,055 | |
| | | | | | | | | | | | | | | | | |
Collateral for securities loaned (Liability) | | $ | — | | | $ | (152,961,476 | ) | | $ | — | | | $ | (152,961,476 | ) |
| * | See Schedule of Investments for additional detailed categorizations. |
Transfers from Level 1 to Level 2 in the amount of $1,296,765 were due to the application of a systematic fair valuation model factor. Transfers from Level 2 to Level 1 in the amount of $456,737 were due to the discontinuation of a systematic fair valuation model factor.
Following is a reconciliation of Level 3 assets for which significant unobservable inputs were used to determine fair value:
| | | | | | | | | | | | | | | | | | | | | | | | | | | | | | | | | | | | |
Investments in Securities | | Balance as of
December 31,
2012 | | | Realized
Gain/
(Loss) | | | Change in
Unrealized
Appreciation/
(Depreciation) | | | Purchases | | | Sales | | | Transfers
in to
Level 3 | | | Transfers
out of
Level 3 | | | Balance
as of
December 31,
2013 | | | Change in
Unrealized
Appreciation/
(Depreciation)
from investments
still held at
December 31,
2013 | |
| Common Stocks | | | | | | | | | | | | | | | | | | | | | | | | | | | | | | | | | | | | |
Australia | | $ | 271,903 | | | $ | (80,968 | ) | | $ | 7,116 | | | $ | — | | | $ | (152,453 | ) | | $ | 28,577 | | | $ | (49,358 | ) | | $ | 24,817 | | | $ | (25,937 | ) |
Austria | | | 0 | | | | — | | | | 0 | | | | — | | | | — | | | | — | | | | — | | | | 0 | | | | 0 | |
Belgium | | | 66 | | | | — | | | | 67,731 | | | | — | | | | — | | | | 69,320 | | | | — | | | | 137,117 | | | | 67,796 | |
Canada | | | 17,069 | | | | — | | | | 283,055 | | | | — | | | | (298,002 | ) | | | — | | | | (2,122 | ) | | | — | | | | — | |
Denmark | | | 0 | | | | (233,105 | ) | | | 233,105 | | | | — | | | | — | | | | — | | | | — | | | | — | | | | 0 | |
France | | | 0 | | | | (2,520 | ) | | | (27,841 | ) | | | — | | | | (405 | ) | | | 30,766 | | | | — | | | | 0 | | | | 0 | |
Greece | | | 15,784 | | | | — | | | | (15,784 | ) | | | — | | | | — | | | | — | | | | — | | | | 0 | | | | — | |
Hong Kong | | | 95,600 | | | | (169,942 | ) | | | 137,937 | | | | 38,408 | | | | (65,667 | ) | | | 15,224 | | | | — | | | | 51,560 | | | | (16,432 | ) |
Italy | | | 0 | | | | (81,803 | ) | | | 81,803 | | | | — | | | | — | | | | — | | | | — | | | | 0 | | | | 0 | |
Japan | | | 0 | | | | (19,294 | ) | | | 39,581 | | | | — | | | | — | | | | 87,281 | | | | — | | | | 107,568 | | | | 20,287 | |
Netherlands | | | 0 | | | | — | | | | (146,020 | ) | | | — | | | | — | | | | 146,020 | | | | — | | | | 0 | | | | 0 | |
New Zealand | | | 0 | | | | — | | | | 0 | | | | — | | | | — | | | | — | | | | — | | | | 0 | | | | 0 | |
Spain | | | 0 | | | | — | | | | (137,926 | ) | | | — | | | | — | | | | 137,926 | | | | — | | | | 0 | | | | 0 | |
| | | | | | | | | | | | | | | | | | | | | | | | | | | | | | | | | | | | |
Total | | $ | 400,422 | | | $ | (587,632 | ) | | $ | 522,757 | | | $ | 38,408 | | | $ | (516,527 | ) | | $ | 515,114 | | | $ | (51,480 | ) | | $ | 321,062 | | | $ | 45,714 | |
| | | | | | | | | | | | | | | | | | | | | | | | | | | | | | | | | | | | |
Common stock transfers into level 3 were due to trading halts on the securities’ respective exchanges which resulted in the lack of observable inputs.
Common stock transfers out of level 3 were due to the resumption of trading activity which resulted in the availability of significant observable inputs.
See accompanying notes to financial statements.
MSF-40
Metropolitan Series Fund
Met/Dimensional International Small Company Portfolio
Statement of Assets and Liabilities
December 31, 2013
| | | | |
Assets | | | | |
Investments at value (a) (b) | | $ | 1,143,711,055 | |
Cash | | | 840 | |
Cash denominated in foreign currencies (c) | | | 3,074,579 | |
Receivable for: | | | | |
Investments sold | | | 881,515 | |
Fund shares sold | | | 89,843 | |
Dividends | | | 1,224,413 | |
Prepaid expenses | | | 2,321 | |
| | | | |
Total Assets | | | 1,148,984,566 | |
Liabilities | | | | |
Collateral for securities loaned | | | 152,961,476 | |
Payables for: | | | | |
Investments purchased | | | 304,506 | |
Fund shares redeemed | | | 388,914 | |
Accrued Expenses: | | | | |
Management fees | | | 656,288 | |
Distribution and service fees | | | 16,681 | |
Deferred trustees’ fees | | | 48,554 | |
Other expenses | | | 149,921 | |
| | | | |
Total Liabilities | | | 154,526,340 | |
| | | | |
Net Assets | | $ | 994,458,226 | |
| | | | |
Net assets consist of: | | | | |
Paid in surplus | | $ | 678,018,978 | |
Undistributed net investment income | | | 10,016,566 | |
Accumulated net realized gain | | | 33,082,778 | |
Unrealized appreciation on investments and foreign currency transactions | | | 273,339,904 | |
| | | | |
Net Assets | | $ | 994,458,226 | |
| | | | |
Net Assets | | | | |
Class A | | $ | 913,348,848 | |
Class B | | | 81,109,378 | |
Capital Shares Outstanding* | | | | |
Class A | | | 54,277,768 | |
Class B | | | 4,841,237 | |
Net Asset Value, Offering Price and Redemption Price Per Share | | | | |
Class A | | $ | 16.83 | |
Class B | | | 16.75 | |
| * | The Portfolio is authorized to issue an unlimited number of shares. |
| (a) | Identified cost of investments was $870,397,445. |
| (b) | Includes securities loaned at value of $146,590,257. |
| (c) | Identified cost of cash denominated in foreign currencies was $3,058,424. |
Statement of Operations
Year Ended December 31, 2013
| | | | |
Investment Income | | | | |
Dividends (a) | | $ | 23,481,660 | |
Interest | | | 328 | |
Securities lending income | | | 1,595,250 | |
| | | | |
Total investment income | | | 25,077,238 | |
Expenses | | | | |
Management fees | | | 7,199,546 | |
Administration fees | | | 16,535 | |
Custodian and accounting fees | | | 1,026,585 | |
Distribution and service fees—Class B | | | 177,298 | |
Audit and tax services | | | 60,111 | |
Legal | | | 27,754 | |
Trustees’ fees and expenses | | | 35,358 | |
Shareholder reporting | | | 31,564 | |
Insurance | | | 4,756 | |
Miscellaneous | | | 82,630 | |
| | | | |
Total expenses | | | 8,662,137 | |
Less management fee waiver | | | (50,000 | ) |
| | | | |
Net expenses | | | 8,612,137 | |
| | | | |
Net Investment Income | | | 16,465,101 | |
| | | | |
Net Realized and Unrealized Gain | | | | |
| Net realized gain (loss) on: | | | | |
Investments | | | 35,108,353 | |
Futures contracts | | | 666,509 | |
Foreign currency transactions | | | (198,191 | ) |
| | | | |
Net realized gain | | | 35,576,671 | |
| | | | |
| Net change in unrealized appreciation on: | | | | |
Investments | | | 171,300,173 | |
Foreign currency transactions | | | 35,467 | |
| | | | |
Net change in unrealized appreciation | | | 171,335,640 | |
| | | | |
Net realized and unrealized gain | | | 206,912,311 | |
| | | | |
Net Increase in Net Assets From Operations | | $ | 223,377,412 | |
| | | | |
| (a) | Net of foreign withholding taxes of $1,762,801. |
See accompanying notes to financial statements.
MSF-41
Metropolitan Series Fund
Met/Dimensional International Small Company Portfolio
Statements of Changes in Net Assets
| | | | | | | | |
| | | Year Ended
December 31,
2013 | | | Year Ended
December 31,
2012 | |
Increase (Decrease) in Net Assets: | | | | | | | | |
From Operations | | | | | | | | |
Net investment income | | $ | 16,465,101 | | | $ | 14,673,149 | |
Net realized gain | | | 35,576,671 | | | | 26,314,687 | |
Net change in unrealized appreciation | | | 171,335,640 | | | | 79,471,383 | |
| | | | | | | | |
Increase in net assets from operations | | | 223,377,412 | | | | 120,459,219 | |
| | | | | | | | |
From Distributions to Shareholders | | | | | | | | |
Net investment income | | | | | | | | |
Class A | | | (16,583,025 | ) | | | (16,076,028 | ) |
Class B | | | (1,219,147 | ) | | | (1,337,619 | ) |
Net realized capital gains | | | | | | | | |
Class A | | | (23,007,574 | ) | | | (60,998,339 | ) |
Class B | | | (1,906,054 | ) | | | (5,683,825 | ) |
| | | | | | | | |
Total distributions | | | (42,715,800 | ) | | | (84,095,811 | ) |
| | | | | | | | |
Increase in net assets from capital share transactions | | | 36,860,137 | | | | 104,946,293 | |
| | | | | | | | |
Total increase in net assets | | | 217,521,749 | | | | 141,309,701 | |
| | |
Net Assets | | | | | | | | |
Beginning of period | | | 776,936,477 | | | | 635,626,776 | |
| | | | | | | | |
End of period | | $ | 994,458,226 | | | $ | 776,936,477 | |
| | | | | | | | |
| | |
Undistributed net investment income | | | | | | | | |
End of period | | $ | 10,016,566 | | | $ | 9,027,249 | |
| | | | | | | | |
Other Information:
Capital Shares
Transactions in capital shares were as follows:
| | | | | | | | | | | | | | | | |
| | | Year Ended
December 31, 2013 | | | Year Ended
December 31, 2012 | |
| | | Shares | | | Value | | | Shares | | | Value | |
Class A | | | | | | | | | | | | | | | | |
Sales | | | 4,884,609 | | | $ | 71,182,005 | | | | 4,255,013 | | | $ | 56,127,004 | |
Reinvestments | | | 2,902,536 | | | | 39,590,599 | | | | 5,942,511 | | | | 77,074,367 | |
Redemptions | | | (5,021,741 | ) | | | (76,955,031 | ) | | | (2,372,141 | ) | | | (31,841,367 | ) |
| | | | | | | | | | | | | | | | |
Net increase | | | 2,765,404 | | | $ | 33,817,573 | | | | 7,825,383 | | | $ | 101,360,004 | |
| | | | | | | | | | | | | | | | |
Class B | | | | | | | | | | | | | | | | |
Sales | | | 1,118,126 | | | $ | 16,478,798 | | | | 867,722 | | | $ | 11,073,815 | |
Reinvestments | | | 229,794 | | | | 3,125,201 | | | | 542,615 | | | | 7,021,444 | |
Redemptions | | | (1,110,043 | ) | | | (16,561,435 | ) | | | (1,102,554 | ) | | | (14,508,970 | ) |
| | | | | | | | | | | | | | | | |
Net increase | | | 237,877 | | | $ | 3,042,564 | | | | 307,783 | | | $ | 3,586,289 | |
| | | | | | | | | | | | | | | | |
Increase derived from capital shares transactions | | | | | | $ | 36,860,137 | | | | | | | $ | 104,946,293 | |
| | | | | | | | | | | | | | | | |
See accompanying notes to financial statements.
MSF-42
Metropolitan Series Fund
Met/Dimensional International Small Company Portfolio
Financial Highlights
| | | | | | | | | | | | | | | | | | | | |
| Selected per share data | | | | | | | | | | | | | | | |
| | | Class A | |
| | | Year Ended December 31, | |
| | | 2013 | | | 2012 | | | 2011 | | | 2010 | | | 2009 | |
Net Asset Value, Beginning of Period | | $ | 13.85 | | | $ | 13.25 | | | $ | 16.68 | | | $ | 14.54 | | | $ | 10.16 | |
| | | | | | | | | | | | | | | | | | | | |
Income (Loss) from Investment Operations | | | | | | | | | | | | | | | | | | | | |
Net investment income (a) | | | 0.28 | | | | 0.27 | | | | 0.29 | | | | 0.20 | | | | 0.20 | |
Net realized and unrealized gain (loss) on investments | | | 3.42 | | | | 2.04 | | | | (2.77 | ) | | | 3.00 | | | | 4.18 | |
| | | | | | | | | | | | | | | | | | | | |
Total from investment operations | | | 3.70 | | | | 2.31 | | | | (2.48 | ) | | | 3.20 | | | | 4.38 | |
| | | | | | | | | | | | | | | | | | | | |
Less Distributions | | | | | | | | | | | | | | | | | | | | |
Distributions from net investment income | | | (0.30 | ) | | | (0.36 | ) | | | (0.35 | ) | | | (0.25 | ) | | | 0.00 | |
Distributions from net realized capital gains | | | (0.42 | ) | | | (1.35 | ) | | | (0.60 | ) | | | (0.81 | ) | | | 0.00 | |
| | | | | | | | | | | | | | | | | | | | |
Total distributions | | | (0.72 | ) | | | (1.71 | ) | | | (0.95 | ) | | | (1.06 | ) | | | 0.00 | |
| | | | | | | | | | | | | | | | | | | | |
Net Asset Value, End of Period | | $ | 16.83 | | | $ | 13.85 | | | $ | 13.25 | | | $ | 16.68 | | | $ | 14.54 | |
| | | | | | | | | | | | | | | | | | | | |
Total Return (%) (b) | | | 27.94 | | | | 18.25 | | | | (16.08 | ) | | | 22.93 | | | | 43.11 | |
| | | | | |
Ratios/Supplemental Data | | | | | | | | | | | | | | | | | | | | |
Gross ratio of expenses to average net assets (%) | | | 0.95 | | | | 0.98 | | | | 1.02 | | | | 1.01 | | | | 1.00 | |
Net ratio of expenses to average net assets (%) (c) | | | 0.94 | | | | 0.98 | | | | 1.02 | | | | 1.01 | | | | 1.00 | |
Ratio of net investment income to average net assets (%) | | | 1.86 | | | | 2.06 | | | | 1.86 | | | | 1.38 | | | | 1.65 | |
Portfolio turnover rate (%) | | | 12 | | | | 12 | | | | 25 | | | | 13 | | | | 26 | |
Net assets, end of period (in millions) | | $ | 913.3 | | | $ | 713.4 | | | $ | 578.9 | | | $ | 697.0 | | | $ | 448.7 | |
| | | | | | | | | | | | | | | | | | | | |
| | | Class B | |
| | | Year Ended December 31, | |
| | | 2013 | | | 2012 | | | 2011 | | | 2010 | | | 2009 | |
Net Asset Value, Beginning of Period | | $ | 13.79 | | | $ | 13.20 | | | $ | 16.62 | | | $ | 14.50 | | | $ | 10.16 | |
| | | | | | | | | | | | | | | | | | | | |
Income (Loss) from Investment Operations | | | | | | | | | | | | | | | | | | | | |
Net investment income (a) | | | 0.24 | | | | 0.24 | | | | 0.26 | | | | 0.16 | | | | 0.11 | |
Net realized and unrealized gain (loss) on investments | | | 3.41 | | | | 2.02 | | | | (2.77 | ) | | | 2.98 | | | | 4.23 | |
| | | | | | | | | | | | | | | | | | | | |
Total from investment operations | | | 3.65 | | | | 2.26 | | | | (2.51 | ) | | | 3.14 | | | | 4.34 | |
| | | | | | | | | | | | | | | | | | | | |
Less Distributions | | | | | | | | | | | | | | | | | | | | |
Distributions from net investment income | | | (0.27 | ) | | | (0.32 | ) | | | (0.31 | ) | | | (0.21 | ) | | | 0.00 | |
Distributions from net realized capital gains | | | (0.42 | ) | | | (1.35 | ) | | | (0.60 | ) | | | (0.81 | ) | | | 0.00 | |
| | | | | | | | | | | | | | | | | | | | |
Total distributions | | | (0.69 | ) | | | (1.67 | ) | | | (0.91 | ) | | | (1.02 | ) | | | 0.00 | |
| | | | | | | | | | | | | | | | | | | | |
Net Asset Value, End of Period | | $ | 16.75 | | | $ | 13.79 | | | $ | 13.20 | | | $ | 16.62 | | | $ | 14.50 | |
| | | | | | | | | | | | | | | | | | | | |
Total Return (%) (b) | | | 27.60 | | | | 17.90 | | | | (16.25 | ) | | | 22.59 | | | | 42.72 | |
| | | | | |
Ratios/Supplemental Data | | | | | | | | | | | | | | | | | | | | |
Gross ratio of expenses to average net assets (%) | | | 1.20 | | | | 1.23 | | | | 1.27 | | | | 1.26 | | | | 1.25 | |
Net ratio of expenses to average net assets (%) (c) | | | 1.19 | | | | 1.23 | | | | 1.27 | | | | 1.26 | | | | 1.25 | |
Ratio of net investment income to average net assets (%) | | | 1.58 | | | | 1.81 | | | | 1.69 | | | | 1.12 | | | | 0.81 | |
Portfolio turnover rate (%) | | | 12 | | | | 12 | | | | 25 | | | | 13 | | | | 26 | |
Net assets, end of period (in millions) | | $ | 81.1 | | | $ | 63.5 | | | $ | 56.7 | | | $ | 43.6 | | | $ | 20.8 | |
| (a) | Per share amounts based on average shares outstanding during the period. |
| (b) | Total return does not reflect any insurance, sales, separate account or administrative charges of variable annuity or life insurance contracts or any additional expenses that contract owners may bear under their variable contracts. If these charges were included, the returns would be lower. |
| (c) | Net ratio of expenses to average net assets includes the effect of management fee waivers as detailed in Note 6 of the Notes to Financial Statements. |
See accompanying notes to financial statements.
MSF-43
Metropolitan Series Fund
Met/Dimensional International Small Company Portfolio
Notes to Financial Statements—December 31, 2013
1. Organization
Metropolitan Series Fund (the “Trust”) is organized as a Delaware statutory trust and registered under the Investment Company Act of 1940, as amended (the “1940 Act”), as an open-end management investment company. The Trust is currently comprised of thirty series, each of which operates as a distinct investment vehicle of the Trust. The portfolio included in this report is Met/Dimensional International Small Company Portfolio (the “Portfolio”), which is diversified. Shares in the Portfolio are not offered directly to the general public and are currently available only to separate accounts established by Metropolitan Life Insurance Company (“MetLife”) and other affiliated life insurance companies.
The Portfolio has registered and offers two classes of shares: Class A and B shares. Shares of each Class of the Portfolio represent an equal pro rata interest in the Portfolio and generally give the shareholder the same voting, dividend, liquidation, and other rights. Investment income, realized and unrealized capital gains and losses, the common expenses of the Portfolio, and certain Portfolio-level expense reductions, if any, are allocated on a pro rata basis to each Class based on the relative net assets of each Class to the net assets of the Portfolio. Each Class of shares differs in its respective distribution plan and such distribution expenses are allocated to that Class.
2. Significant Accounting Policies
The preparation of financial statements in conformity with accounting principles generally accepted in the United States of America (“GAAP”) requires management to make estimates and assumptions that affect the reported amounts of assets and liabilities and disclosure of contingent assets and liabilities as of the date of the financial statements and the reported amounts of income and expenses during the reporting period. Actual results could differ from those estimates. In the preparation of these financial statements, management has evaluated events and transactions subsequent to December 31, 2013 through the date the financial statements were issued.
The following is a summary of significant accounting policies consistently followed by the Portfolio in the preparation of its financial statements.
Investment Valuation and Fair Value Measurements - Debt securities (other than short term obligations with a remaining maturity of sixty days or less), including corporate, convertible and municipal bonds and notes; obligations of the U.S. treasury and U.S. government agencies; sovereign issues; floating rate loans; and non-U.S. bonds, are generally valued on the basis of evaluated or composite bid quotations obtained from independent pricing services and/or brokers and dealers selected by MetLife Advisers, LLC (“MetLife Advisers” or the “Adviser”), an affiliate of MetLife, Inc., pursuant to authorization of the Board of Trustees of the Trust (the “Board” or “Trustees”). Such quotations utilize matrix pricing, which considers observable inputs including, among other things, issuer details, maturity dates, interest rates, yield curves, rates of prepayment, credit risks/spreads, default rates, reported trades, broker dealer quotes and quoted prices for similar securities. Securities that use similar valuation techniques and inputs as described above are generally categorized as Level 2 within the fair value hierarchy.
Mortgage and asset-backed securities are usually issued as separate tranches, or classes, of securities within each deal. These securities are also generally valued on the basis of evaluated or composite bid quotations obtained from independent pricing services and/or brokers and dealers selected by the Adviser pursuant to authorization of the Board. The pricing models for these securities usually consider tranche-level attributes, estimated cash flows and market-based yield spreads for each tranche and current market data, and incorporate deal collateral performance, as available. Mortgage and asset-backed securities that use similar valuation techniques and inputs as described above are generally categorized as Level 2 within the fair value hierarchy.
Short term obligations with a remaining maturity of sixty days or less are generally valued at amortized cost, which approximates fair market value, and are generally categorized as Level 2 within the fair value hierarchy.
Domestic and foreign equity securities, such as common stock, exchange-traded funds, rights, warrants, and preferred stock, that are traded on a securities exchange, are generally valued at their last sale price on the exchange or market in which they are principally traded on the valuation date, or, if no sales occurred on that day, at the last reported bid price. Equity securities traded over-the-counter are generally valued at the last reported sale price. Valuation adjustments may be applied to certain foreign equity securities that are traded solely on foreign exchanges that close before the close of the U.S. market to account for the market movement between the close of the foreign exchanges and the close of the U.S. market. The Portfolio may use a systematic fair valuation model provided by an independent third party to value securities principally traded in these foreign markets in order to adjust for possible stale pricing that may occur between the close of the foreign exchanges and the time of the Portfolio valuation. Foreign equity securities using these valuation adjustments are generally categorized as Level 2 within the fair value hierarchy. Equity securities that are actively traded, and have no valuation adjustments applied, are categorized as Level 1 within the fair value hierarchy. Other equity securities traded on inactive markets, or valued in reference to similar instruments traded on active markets, are generally categorized as Level 2 within the fair value hierarchy.
MSF-44
Metropolitan Series Fund
Met/Dimensional International Small Company Portfolio
Notes to Financial Statements—December 31, 2013—(Continued)
Investments in registered open-end management investment companies are valued at reported net asset value per share on the valuation date and are categorized as Level 1 within the fair value hierarchy.
Forward foreign currency exchange contracts are valued through an independent pricing service based on the mean between closing bid and ask prices of the forward currency rates in the London foreign exchange markets on a daily basis as provided by a reliable bank or dealer. These contracts are generally categorized as Level 2 within the fair value hierarchy.
Options, whether on securities, indices, futures contracts, or otherwise, traded on exchanges are valued at the last sale price available as of the close of business on the valuation date or, if there is no such price available, at the mean between the last reported bid and ask prices. These types of options are categorized as Level 1 within the fair value hierarchy. Futures contracts, which are traded on commodity exchanges, are valued at their closing prices as of the close of such exchanges and are categorized as Level 1 within the fair value hierarchy.
Options and futures contracts that are traded over-the-counter are generally valued on the basis of quotations provided by broker-dealers or prices provided by pricing service providers who use a series of techniques, including simulation pricing models, to determine the value of the contracts. The pricing models use inputs that are observed from actively quoted markets such as issuer details, indices, spreads, interest rates, yield curves, credit curves, measures of volatility and exchange rates. These contracts are generally categorized as Level 2 within the fair value hierarchy.
If no current market value quotation or other observable inputs are readily available or market value quotations are deemed to be unreliable for a security, the fair value of the security will be determined in accordance with procedures approved by and under the general supervision of the Board. In such a circumstance, the Board has delegated the determination of the fair value of a security to a Valuation Committee (“Committee”) of MetLife Advisers. The Committee provides general pricing oversight and fair value pricing determinations related to portfolio securities and meets on a regular basis to review reports relating to the valuation of the securities in the Portfolio. The Board has delegated to State Street Bank and Trust Company, the Trust’s custodian (“custodian”), the responsibility for calculating the net asset values (“NAVs”) of the Trust’s Portfolios. The Committee is responsible for overseeing the calculation of the NAVs of the Portfolios by the custodian. The Committee also periodically reviews pricing vendors, including the vendor providing fair value pricing for the Portfolio’s foreign securities, and is responsible for overseeing the correction of pricing errors and addressing other pricing issues that arise in the ordinary course of business, such as making real-time fair value determinations, as necessary.
No single standard for determining the fair value of a security can be set forth because fair value depends upon the facts and circumstances with respect to each security. Information relating to any relevant factors may be obtained by the Committee from any appropriate source, including the subadviser of the Portfolio, the custodian, a pricing service, market maker and/or broker for such security or the issuer. Appropriate methodologies for determining fair value under particular circumstances may include: matrix pricing, comparisons of securities with comparable characteristics, value based on multiples of earnings, discount from market price of similar marketable securities or a combination of these and other methods. The Committee maintains a detailed report tracking each fair-valued security that compares the fair value price to the next available trade, vendor or broker price, and provides information on how close the fair value price was to the next quoted price. The Committee reviews a summary of such report monthly. On a quarterly basis, the Board is provided with the following for consideration and ratification or adjustment: (1) a memorandum summarizing the actions taken by the Committee in the prior quarter; and (2) a list of the Portfolio’s securities as of the most recent quarter-end for which market quotations were not readily available.
Investment Transactions and Related Investment Income - Portfolio security transactions are recorded on the trade date. Dividend income is recorded on the ex-dividend date or, for certain foreign securities, when notified. Interest income, which includes amortization of premium and accretion of discount on debt securities, is recorded on the accrual basis. Realized gains and losses on investments are determined on the identified cost basis, which is the same basis used for federal income tax purposes. Foreign income and foreign capital gains on some foreign securities may be subject to foreign taxes, which are accrued as applicable. These foreign taxes have been provided for in accordance with the Portfolio’s understanding of the applicable countries’ tax rules and rates.
Foreign Currency Translation - The books and records of the Portfolio are maintained in U.S. dollars. The values of securities, currencies, and other assets and liabilities denominated in currencies other than the U.S. dollar are translated into U.S. dollars based upon foreign exchange rates prevailing at the end of the period. Purchases and sales of investment securities, income, and expenses are translated on the respective dates of such transactions. Because the values of investment securities are translated at the foreign exchange rates prevailing at the end of the period, that portion of the results of operations arising from changes in exchange rates and that portion of the results of operations reflecting fluctuations arising from changes in market prices of the investment securities are not separated. Such fluctuations are included in the net realized and unrealized gain or loss on investments.
Net realized foreign exchange gains or losses arise from activity in forward foreign currency exchange contracts, sales of foreign currency, currency gains or losses realized between the trade and settlement dates on securities transactions, and the difference between the amounts of dividends, interest, and foreign withholding taxes recorded by the Portfolio and the U.S. dollar equivalent of
MSF-45
Metropolitan Series Fund
Met/Dimensional International Small Company Portfolio
Notes to Financial Statements—December 31, 2013—(Continued)
the amounts actually received or paid by the Portfolio. Net unrealized foreign exchange gains and losses arise from changes in the value of assets and liabilities, other than investment securities, resulting from changes in foreign exchange rates.
Income Taxes - It is the Portfolio’s policy to comply with the requirements of the Internal Revenue Code of 1986, as amended, and regulations thereunder, applicable to regulated investment companies and to distribute, with respect to each taxable year, all of its taxable income to shareholders. Therefore, no federal income tax provision is required. The Portfolio files U.S. federal tax returns. No income tax returns are currently under examination. The Portfolio’s federal tax returns for the prior three fiscal years remain subject to examination by the Internal Revenue Service. As of December 31, 2013, the Portfolio had no uncertain tax positions that would require financial statement recognition, or de-recognition or disclosure.
Dividends and Distributions to Shareholders - The Portfolio records dividends and distributions on the ex-dividend date. Net realized gains from security transactions (if any) are generally distributed annually to shareholders. The timing and characterization of certain income and capital gains distributions are determined in accordance with federal tax regulations that may differ from GAAP. Permanent book and tax basis differences relating to shareholder distributions will result in reclassification between under/over distributed net investment income, accumulated net realized gains/losses, and paid-in surplus. Book-tax differences are primarily due to foreign currency transactions, and passive foreign investment companies (PFICs). These adjustments have no impact on net assets or the results of operations.
Securities Lending - The Portfolio may lend its portfolio securities to certain qualified brokers who borrow securities in order to complete certain securities transactions. By lending its portfolio securities, the Portfolio attempts to increase its net investment income through the receipt of income on collateral held from securities on loan. Any gain or loss in the market price of the loaned securities that might occur and any interest earned or dividends declared during the term of the loan would accrue to the account of the Portfolio.
The Trust has entered into a securities lending arrangement with the custodian. Under this arrangement, the custodian is authorized to loan portfolio securities on the Portfolio’s behalf. In exchange, the Portfolio receives either cash or securities as collateral against the loaned securities. The Portfolio receives collateral at least equal to 102% of the market value of the loaned securities (105% for foreign equity securities), at each loan’s inception. Collateral representing at least 100% of the market value of the loaned securities must be maintained for the duration of the loan. A liability for cash collateral is reflected on the Statement of Assets and Liabilities, and is categorized as Level 2 within the fair value hierarchy. Cash collateral is generally invested in the State Street Navigator Securities Lending MET Portfolio (the “Navigator Portfolio”), a series of the State Street Navigator Securities Lending Trust that is managed by an affiliate of the custodian. The Navigator Portfolio is a registered money market fund that invests in a variety of high-quality, U.S. dollar-denominated instruments. If the market value of the collateral at the close of trading on a business day is less than 100% of the market value of the loaned securities at the close of trading on that day, the borrower shall be required to deliver, by the close of business on the following business day, an additional amount of collateral, so that the total amount of posted collateral is equal to at least 100% of the market value of all the loaned securities as of such preceding day. A portion of net income (income after the deduction of expenses and fees of the Navigator Portfolio) on the collateral is rebated to the borrower of the securities and the remainder is split between the custodian and the Portfolio. On loans collateralized by U.S. Treasuries, a fee is received from the borrower and is allocated between the Portfolio and the custodian. The risks associated with lending portfolio securities include, but are not limited to, possible delays in receiving additional collateral or in the recovery of the loaned securities, possible loss of rights in the collateral should the borrower fail financially, as well as risk of loss in the value of the collateral or the value of the investments made with the collateral. The lending agent has agreed to indemnify the Portfolio in the case of default of any securities borrower. Income received by the Portfolio in securities lending transactions during the year ended December 31, 2013 is reflected as Securities lending income on the Statement of Operations. Any outstanding loans by the Portfolio at December 31, 2013 are disclosed in the footnotes to the Schedule of Investments.
Repurchase Agreements - The Portfolio may enter into repurchase agreements, under the terms of a Master Repurchase Agreement, with selected commercial banks and broker-dealers, under which the Portfolio acquires securities as collateral and agrees to resell the securities at an agreed upon time and at an agreed-upon price. The Portfolio, through the custodian or a subcustodian, receives delivery of the underlying securities collateralizing any repurchase agreements. The Portfolio requires the custodian to take possession, to have legally segregated in the Federal Reserve Book Entry System, or to have segregated within the custodian’s vault, all securities held as collateral for repurchase agreements. It is the Portfolio’s policy that the market value of the collateral be at least equal to 100% of the repurchase price in the case of a repurchase agreement of one-day duration and at least equal to 102% of the repurchase price in the case of all other repurchase agreements. In the event of default or failure by a party to perform an obligation in connection with any repurchase transaction, the Master Repurchase Agreement gives the non-defaulting party the right to set-off claims and to apply property held by it in connection with any repurchase transaction against obligations owed to it.
At December 31, 2013, the Portfolio had investments in repurchase agreements with a gross value of $1,987,000, which is included as part of investments at value on the Statement of Assets and Liabilities. The value of the related collateral exceeded the value of the repurchase agreements at December 31, 2013.
MSF-46
Metropolitan Series Fund
Met/Dimensional International Small Company Portfolio
Notes to Financial Statements—December 31, 2013—(Continued)
3. Investments in Derivative Instruments
Futures Contracts - The Portfolio may buy and sell futures contracts as a hedge, to maintain investment exposure to a target asset class or to enhance return. The Portfolio may be subject to fluctuations in equity prices, interest rates, commodity prices, and foreign currency exchange rates in the normal course of pursuing its investment objective. Futures contracts are standardized agreements to buy or sell a security, or deliver a final cash settlement price in connection with an index, interest rate, currency, or other asset. The Portfolio must deposit an amount (“initial margin”) equal to a certain percentage of the face value of the futures contract. The initial margin may be in the form of cash or securities, which is returned when the Portfolio’s obligations under the contract have been satisfied. If cash is deposited as the initial margin, it is shown as cash collateral on the Statement of Assets and Liabilities. Futures contracts are marked-to-market daily, and subsequent payments (“variation margin”) are made or received by the Portfolio depending on whether unrealized gains or losses are incurred. These amounts are reflected as receivables or payables on the Statement of Assets and Liabilities and as a component of net change in unrealized appreciation/depreciation on the Statement of Operations. When the contract is closed or expires, the Portfolio records a realized gain or loss equal to the difference between the value of the contract at the time it was opened and the value at the time it was closed. Risks of entering into futures contracts (and related options) include the possibility that the market for these instruments may be illiquid and that a change in the value of the contract or option may not correlate perfectly with changes in the value of the underlying instrument. Futures contracts are exchange-traded and the exchange’s clearinghouse, as counterparty to all exchange-traded futures, guarantees the futures contracts against default. For over-the-counter futures the Portfolio’s ability to terminate the positions may be more limited than in the case of exchange-traded positions and may also involve the risk that securities dealers participating in such transactions would fail to meet their obligations to the Portfolio.
During the year ended December 31, 2013, the Portfolio entered into equity index futures contracts which were subject to equity price risk. During the period April 17, 2013 through May 9, 2013, the Portfolio had bought and sold $47,104,453 in equity index futures contracts. At December 31, 2013, the Portfolio did not have any open futures contracts. For the year ended December 31, 2013, the Portfolio had realized gains in the amount of $666,509 which are shown under net realized gain on futures contracts in the Statement of Operations.
4. Certain Risks
Market Risk: In the normal course of business, the Portfolio invests in securities and enters into transactions where risks exist due to fluctuations in the market (market risk) or failure of the other party to a transaction to perform (credit and counterparty risk). The value of securities held by the Portfolio may decline in response to certain events, including those directly involving the companies whose securities are owned by the Portfolio; conditions affecting the general economy; overall market changes; local, regional or global political, social or economic instability; currency, interest rate, and price fluctuations.
Credit and Counterparty Risk: The Portfolio may be exposed to counterparty risk, or the risk that an entity with which the Portfolio has unsettled or open transactions may default. The potential loss could exceed the value of the financial assets and liabilities recorded in the financial statements. Financial assets that potentially expose the Portfolio to credit and counterparty risk consist principally of cash due from counterparties and investments. The Portfolio manages counterparty risk by entering into agreements only with counterparties that it believes have the financial resources to honor their obligations and by monitoring the financial stability of those counterparties. The Portfolio’s investment adviser attempts to mitigate counterparty risk by (i) periodically assessing the creditworthiness of its trading partners, (ii) monitoring and/or limiting the amount of its net exposure to each individual counterparty based on its assessment, and (iii) requiring collateral from the counterparty for certain transactions. In order to preserve certain safeguards for non-standard settlement trades, the Portfolio restricts its exposure to credit and counterparty losses by entering into master netting agreements with counterparties (approved brokers) with whom it undertakes a significant volume of transactions. Master Agreements govern the terms of certain transactions, and reduce the counterparty risk associated with relevant transactions by specifying credit protection mechanisms and providing standardization that improves legal certainty. Master Agreements can also help limit counterparty risk by specifying collateral posting arrangements at pre-arranged exposure levels.
Repurchase and reverse repurchase agreements are primarily executed under Global Master Repurchase Agreements (“GMRAs”) or Master Repurchase Agreements (“MRAs”), which provide the rights to set-off. Each repurchase and reverse repurchase agreement is initially collateralized at the transaction level. In the event of default, the total market value exposure will be offset against collateral exchanged to date, which would result in a net receivable/(payable) that would be due from/to the counterparty.
Foreign Investment Risk: The investments by the Portfolio in foreign securities may involve risks not present in domestic investments. Because securities may be denominated in foreign currencies, may require settlement in foreign currencies and may pay interest or dividends in foreign currencies, changes in the relationship of these foreign currencies to the U.S. dollar can significantly affect the value of the investments and earnings of the Portfolio. Foreign investments may also subject the Portfolio to foreign government exchange restrictions, expropriation, taxation or other political, social or economic developments, all of which could affect the market and/or credit risk of the investments. In addition to the risks described above, risks may arise from forward foreign currency contracts with respect to the potential inability of counterparties to meet the terms of their contracts.
MSF-47
Metropolitan Series Fund
Met/Dimensional International Small Company Portfolio
Notes to Financial Statements—December 31, 2013—(Continued)
Additional risks associated with each type of investment are described above within the respective security type notes. The Portfolio’s prospectus includes a discussion of the principal risks of investing in the Portfolio.
5. Investment Transactions
Aggregate cost of purchases and proceeds of sales of investment securities, excluding short-term securities, for the year ended December 31, 2013 were as follows:
| | | | | | | | | | | | |
Purchases | | | Sales | |
U.S. Government | | Non U.S. Government | | | U.S. Government | | | Non U.S. Government | |
| $0 | | $ | 118,260,585 | | | $ | 0 | | | $ | 112,743,719 | |
6. Investment Management Fees and Other Transactions with Affiliates
Investment Management Agreement - MetLife Advisers is the investment adviser to the Portfolio. The Trust has entered into an investment management agreement with MetLife Advisers with respect to the Portfolio. For providing investment management services to the Portfolio, MetLife Advisers receives monthly compensation at the following annual rates:
| | | | | | |
Management
Fees earned by
MetLife Advisers
for the year ended
December 31, 2013 | | % per annum | | | Average daily net assets |
| $7,199,546 | | | 0.850 | % | | Of the first $100 million |
| | | 0.800 | % | | On amounts in excess of $100 million |
MetLife Advisers has entered into an investment subadvisory agreement with respect to the Portfolio. Dimensional Fund Advisors LP is compensated by MetLife Advisers to provide subadvisory services for the Portfolio.
Management Fee Waivers - Pursuant to an expense agreement, MetLife Advisers has agreed, for the period April 29, 2013 through April 27, 2014, to reduce its advisory fees set out above under “Investment Management Agreement” for each class of the Portfolio as follows:
| | |
% per annum | | Average daily net assets |
| 0.050% | | Of the first $100 million |
An identical agreement was in place for the period April 30, 2012 through April 28, 2013. Amounts waived for the year ended December 31, 2013 are shown as management fee waiver in the Statement of Operations.
Certain officers and trustees of the Trust may also be officers of MetLife Advisers; however, such officers and trustees receive no compensation from the Trust.
Transfer Agency Agreement - MetLife serves as the transfer agent for the Trust. MetLife receives no fees for its services to the Trust under the transfer agency agreement.
Distribution and Service Fees - The Trust has a distribution agreement with MetLife Investors Distribution Company (“MIDC” or the “Distributor”) in which MIDC serves as the distributor for the Portfolio’s Class A and B Shares. MIDC is a wholly-owned subsidiary of MetLife Investors Group, Inc., an affiliate of the Adviser. The Trust has also adopted a Distribution and Service Plan under Rule 12b-1 of the 1940 Act for the Portfolio’s Class B Shares. Under the Distribution and Service Plan, the Class B Shares of the Portfolio pay a fee to compensate the Insurance Companies (or their affiliates) and other broker-dealers and financial intermediaries involved in the offer and sale of Portfolio shares for promoting or selling and servicing the Class B Shares. The fees under the Distribution and Service Plan for each class of the Portfolio’s shares are calculated as a percentage of the Portfolio’s average daily net assets that are attributable to that Class. Currently, the fee is 0.25% per year for Class B Shares. Amounts incurred by the Portfolio for the year ended December 31, 2013 are shown as Distribution and service fees in the Statement of Operations.
Deferred Trustee Compensation - Each Trustee who is not currently an employee of the Adviser or any of its affiliates receives compensation from the Trust for his or her service to the Trust. A deferred compensation plan (the “Plan”) is available to the Trustees on a voluntary basis. Deferred amounts remain in the Trust until distributed in accordance with the provisions of the Plan. The value of a participating Trustee’s deferral account is based on theoretical investments of deferred amounts, on the normal payment dates in certain portfolios of the Trust or Met Investors Series Trust, an affiliate of the Trust, as designated by the participating Trustee. Changes in the value of participants’ deferral accounts are reflected as Trustees’ fees and expenses in the Statement of Operations. The portion of the accrued obligations allocated to the Portfolio under the Plan is reflected as Deferred trustees’ fees in the Statement of Assets and Liabilities.
MSF-48
Metropolitan Series Fund
Met/Dimensional International Small Company Portfolio
Notes to Financial Statements—December 31, 2013—(Continued)
7. Contractual Obligations
Under the Trust’s organizational documents, its officers and Trustees may be indemnified against certain liabilities and expenses arising out of the performance of their duties to the Trust. Additionally, the Trust has a variety of indemnification obligations under contracts with its service providers. The Trust’s maximum exposure under these arrangements is unknown, as this would involve future claims that may be made against the Trust that have not yet occurred.
8. Income Tax Information
The tax character of distributions paid for the periods ended December 31, 2013 and 2012 was as follows:
| | | | | | | | | | | | | | | | | | | | |
Ordinary Income | | | Long-Term Capital Gain | | | Total | |
2013 | | 2012 | | | 2013 | | | 2012 | | | 2013 | | | 2012 | |
| $17,802,172 | | $ | 24,740,269 | | | $ | 24,913,628 | | | $ | 59,355,542 | | | $ | 42,715,800 | | | $ | 84,095,811 | |
As of December 31, 2013, the components of distributable earnings (accumulated losses) on a federal income tax basis were as follows:
| | | | | | | | | | | | | | | | |
Undistributed
Ordinary
Income | | Undistributed
Long-Term
Capital Gain | | | Net
Unrealized
Appreciation | | | Loss Carryforwards | | | Total | |
| $25,466,895 | | $ | 28,743,116 | | | $ | 262,277,791 | | | $ | — | | | $ | 316,487,802 | |
The Portfolio utilizes the provisions of the federal income tax laws that provide for the carryforward of capital losses for prior years, offsetting such losses against any future realized capital gains. Under the Regulated Investment Company Modernization Act of 2010 (the “Act”), net capital losses recognized after December 22, 2010 may be carried forward indefinitely and their character is retained as short-term and/or long-term losses. Previously, net capital losses were carried forward for up to eight years and treated as short-term losses. As a transition rule, the Act requires that post-enactment net capital losses be used before pre-enactment net capital losses.
As of December 31, 2013, the Portfolio had no post-enactment accumulated capital losses and no pre-enactment accumulated capital loss carryforwards.
MSF-49
Metropolitan Series Fund
Met/Dimensional International Small Company Portfolio
Report of Independent Registered Public Accounting Firm
To the Shareholders of Met/Dimensional International Small Company Portfolio and the Board of Trustees of Metropolitan Series Fund:
We have audited the accompanying statement of assets and liabilities, including the schedule of investments, of Met/Dimensional International Small Company Portfolio, one of the portfolios constituting Metropolitan Series Fund (the “Fund”) as of December 31, 2013, and the related statement of operations for the year then ended, the statements of changes in net assets for each of the two years in the period then ended, and the financial highlights for each of the five years in the period then ended. These financial statements and financial highlights are the responsibility of the Fund’s management. Our responsibility is to express an opinion on these financial statements and financial highlights based on our audits.
We conducted our audits in accordance with the standards of the Public Company Accounting Oversight Board (United States). Those standards require that we plan and perform the audit to obtain reasonable assurance about whether the financial statements and financial highlights are free of material misstatement. The Fund is not required to have, nor were we engaged to perform, an audit of its internal control over financial reporting. Our audits included consideration of internal control over financial reporting as a basis for designing audit procedures that are appropriate in the circumstances, but not for the purpose of expressing an opinion on the effectiveness of the Fund’s internal control over financial reporting. Accordingly, we express no such opinion. An audit also includes examining, on a test basis, evidence supporting the amounts and disclosures in the financial statements, assessing the accounting principles used and significant estimates made by management, as well as evaluating the overall financial statement presentation. Our procedures included confirmation of securities owned as of December 31, 2013, by correspondence with the custodian and brokers; where replies were not received from brokers, we performed other auditing procedures. We believe that our audits provide a reasonable basis for our opinion.
In our opinion, the financial statements and financial highlights referred to above present fairly, in all material respects, the financial position of Met/Dimensional International Small Company Portfolio of Metropolitan Series Fund, as of December 31, 2013, the results of its operations for the year then ended, the changes in its net assets for each of the two years in the period then ended, and the financial highlights for each of the five years in the period then ended, in conformity with accounting principles generally accepted in the United States of America.
Deloitte & Touche LLP
Boston, Massachusetts
February 27, 2014
MSF-50
Metropolitan Series Fund
Trustees and Officers of Metropolitan Series Fund
The Trustees and executive officers of the Trust, their ages and their principal occupations during the past five years are set forth below. Unless otherwise indicated, the business address of each is One Financial Center, Boston, MA 02111. Each Trustee who is deemed an “interested person,” as such term is defined in the 1940 Act, is indicated by an asterisk. Those Trustees who are not “interested persons” as defined in the 1940 Act are referred to as “Independent Trustees.” Additional information about the Trustees is available in the Statement of Additional Information, which is available without charge, upon request, by calling (800) 848-3854.
Trustees of the Trust
| | | | | | | | | | |
Name and Age | | Position(s)
Held with
Registrant | | Term of Office and
Length of Time
Served | | Principal Occupation(s) During the
Past 5 Years(1) | | Number of
Portfolios
in Fund
Complex(2)
overseen | | Other Directorships Held
by Trustee During the
Past 5 Years(1) |
| Interested Trustee | | | | | | | | | | |
| Elizabeth M. Forget* (47) | | Trustee, Chairman of the Board, President and Chief Executive Officer | | Indefinite; From May 2006 (President and Chief Executive Officer)/ August 2006 (Trustee and Chairman of the Board) to present | | Senior Vice President, MetLife Inc.; President, MetLife Advisers, LLC and a predecessor company. | | 79 | | Trustee, Met Investors Series Trust (the “MIST Trust”);** various MetLife-affiliated boards. |
| | | | | |
| Independent Trustees | | | | | | | | | | |
| Stephen M. Alderman (54) | | Trustee | | Indefinite; From April 2012 to present | | Shareholder in the law firm of Garfield & Merel, Ltd. | | 79 | | Trustee, MIST Trust;** Director, International Truck Leasing Corp. |
| | | | | |
| Robert J. Boulware (57) | | Trustee | | Indefinite; From April 2012 to present | | Managing Director, Pilgrim Funds, LLC (private equity fund). | | 79 | | Trustee, MIST Trust;** Trustee, Vertical Capital Income Fund (closed-end fund); Director, Gainsco, Inc. (auto insurance). |
| | | | | |
| Susan C. Gause (61) | | Trustee | | Indefinite; From April 2012 to present | | Private Investor. | | 79 | | Trustee, MIST Trust;** Trustee, HSBC Funds. |
| | | | | |
| Nancy Hawthorne (62) | | Trustee | | Indefinite; From May 2003 to present | | Chief Executive Officer, Clerestory LLC (corporate advisor). | | 79 | | MIST Trust;** Director, THL Credit, Inc.**; Director, Avid Technology, Inc.** |
| | | | | |
| Barbara A. Nugent (57) | | Trustee | | Indefinite; From January 2014 to present | | President, True North Board Governance, LLC (consulting); until 2014, partner in the law firm of Stradley Ronon Stevens & Young, LLP. | | 79 | | Trustee, MIST Trust**; Director, Episcopal Healthcare Foundation; until 2014, member, Mutual Fund Directors Forum Advisory Board. |
| | | | | |
| Keith M. Schappert (62) | | Trustee | | Indefinite; From August 2009 to present | | Principal, Schappert Consulting LLC (asset management consulting). | | 79 | | Trustee, MIST Trust;** Director, The Commonfund for Nonprofit Organizations; until 2011, Director, Trilogy Global Advisors; Director, Mirae Asset Discovery Funds,** Director, Calamos Investments. |
| | | | | |
| Linda B. Strumpf (66) | | Trustee | | Indefinite; From May 2000 to present | | Chair of the Investment Committee, Leona M. and Harry B. Helmsley Charitable Trust; until 2011, Chief Investment Officer, Leona M. and Harry B. Helmsley Charitable Trust. | | 79 | | Since 2012, Trustee, MIST Trust,** Trustee and Member of Investment Committee, The Pennsylvania State University. |
| | | | | |
| Dawn M. Vroegop (47) | | Trustee | | Indefinite; From May 2009 to present | | Private Investor. | | 79 | | Trustee, MIST Trust,** Trustee, Driehaus Mutual Funds; Director and Investment Committee Chair, City College of San Francisco Foundation. |
MSF-51
Metropolitan Series Fund
Trustees and Officers of Metropolitan Series Fund—(Continued)
Executive Officers of the Trust
| | | | | | |
Name and Age | | Position(s) Held with
Registrant | | Term of Office
and Length of
Time Served | | Principal Occupation(s) During Past 5 Years(1) |
| Elizabeth M. Forget (47) | | President, Chief Executive Officer, Trustee and Chairman of the Board | | From May
2006 (President
and Chief
Executive
Officer)/
August 2006
(Trustee and
Chairman of
the Board) to
present | | See principal occupation information in the table above. |
| | | |
| Jeffrey L. Bernier (42) | | Vice President | | From February
2008 to present | | Vice President, MetLife, Inc.; Senior Vice President, MetLife Advisers, LLC and a predecessor company. |
| | | |
| Peter H. Duffy (58) | | Chief Financial Officer and Treasurer | | From November
2000 to present | | Senior Vice President, MetLife Advisers, LLC; Vice President, MetLife, Inc. |
| | | |
| Andrew L. Gangolf (59) | | Secretary | | From May
2011to present | | Senior Vice President, MetLife Advisers, LLC; Senior Vice President & Assistant General Counsel, AllianceBerstein Investments, Inc. |
| | | |
| Jeffrey P. Halperin (46) | | Chief Compliance Officer | | From November
2005 to present | | Vice President, MetLife, Inc.; Chief Compliance Officer, MIST; Chief Compliance Officer, MSF Trust; Chief Compliance Officer, MetLife Advisers, LLC and a predecessor company; Chief Compliance Officer, MetLife Investment Management, LLC (formerly MetLife Investment Advisors Company, LLC). |
| | | |
| Alan C. Leland, Jr. (61) | | Vice President | | From February
2005 to present | | Treasurer and Chief Financial Officer, MetLife Advisers, LLC; Vice President, MetLife Group Inc.; Vice President, MetLife, Inc. |
| * | Ms. Forget is an “interested person” of the Trust because of her positions with MetLife Advisers, LLC and her ownership of securities issued by MetLife, Inc., the ultimate parent company of MetLife Advisers, LLC. |
| ** | Indicates a directorship with a registered investment company or a company subject to the reporting requirements of the Securities Exchange Act of 1934, as amended. |
| (1) | Previous positions during the past five years with the Trust, MetLife, Inc. or the Adviser are omitted if not materially different. |
| (2) | The Fund Complex includes 49 Portfolios of the MIST Trust and 30 Portfolios of the Trust. |
MSF-52
Metropolitan Series Fund
Met/Dimensional International Small Company Portfolio
Board of Trustees’ Consideration of Advisory and Sub-Advisory Agreements
At an in-person meeting of the Boards of Trustees (the “Board”) of Met Investors Series Trust and Metropolitan Series Fund (“MIST” and “MSF,” respectively, and collectively, the “Trusts”) held on November 19-20, 2013, the Board, including a majority of the Trustees who are not considered to be “interested persons” of the Trusts (the “Independent Trustees”) under the Investment Company Act of 1940, as amended (the “1940 Act”), approved for an annual period the continuation of each Trust’s advisory agreement (the “Advisory Agreement”) with MetLife Advisers, LLC (the “Adviser”) and the applicable sub-advisory agreements (each a “Sub-Advisory Agreement,” and collectively with the Advisory Agreement, the “Agreements”) between the Adviser and the investment sub-advisers (each a “Sub-Adviser,” and collectively, the “Sub-Advisers”) for each of the series of the Trusts, including the Met/Dimensional International Small Company Portfolio (each a “Portfolio,” and collectively, the “Portfolios”).1
In considering the Agreements, the Board reviewed a variety of materials provided by the Adviser and the Sub-Advisers relating to the Portfolios, including comparative performance, fee and expense information for an appropriate peer group of similar mutual funds, performance information for relevant benchmark indices and other information regarding the nature, extent and quality of services provided by the Adviser and the Sub-Advisers under their respective Agreements. The Board also took into account its experience with the Adviser and the Sub-Advisers and information provided to the Board in its meetings throughout the year with respect to the services provided by the Adviser and the Sub-Advisers, including quarterly performance reports prepared by management containing reviews of investment results, and periodic presentations from certain of the Sub-Advisers with respect to the Portfolios they manage. The Independent Trustees also assessed reports provided by the Board’s independent consultant, who reviewed and provided analyses regarding investment performance, fees and expenses, and other information provided by, or at the direction of, the Adviser and the Sub-Advisers, as more fully discussed below.
The Independent Trustees were separately advised by independent legal counsel throughout the process, and met with independent legal counsel in periodic executive sessions. Prior to voting to continue the Agreements at the November meeting, the Independent Trustees also received a memorandum from their independent counsel discussing the legal standards for their consideration of the proposed continuation of the Agreements. The Board also met in person with personnel of the Adviser on September 17, 2013 for the specific purpose of giving preliminary consideration to the proposed continuation of the Agreements and to request additional information they considered reasonably necessary to their deliberations. The Independent Trustees also discussed the proposed continuation of the Agreements in private sessions with their independent legal counsel at which no representatives of management were present.
In considering whether to approve the renewal of the Advisory Agreement with the Adviser and any applicable Sub-Advisory Agreements with respect to a Portfolio, the Board reviewed and analyzed the factors it deemed relevant, including: (1) the nature, extent and quality of the services to be provided to the Portfolios by the Adviser and the Sub-Advisers; (2) the performance of the Portfolios as compared to a peer group and an appropriate index; (3) the Adviser’s and each of the Sub-Adviser’s personnel and operations; (4) the financial condition of the Adviser and of the Sub-Advisers; (5) the level and method of computing each Portfolio’s advisory and sub-advisory fees; (6) the profitability of the Adviser under the Advisory Agreement and of certain of the Sub-Advisers under the Sub-Advisory Agreements; (7) any “fall-out” benefits to the Adviser, the Sub-Advisers and their affiliates (i.e., ancillary benefits realized by the Adviser, the Sub-Advisers or their affiliates from the Adviser’s or Sub-Advisers’ relationship with the Trusts); (8) the anticipated effect of growth in size on Portfolio expenses; (9) fees paid to certain of the Sub-Advisers by comparable institutional and retail accounts; and (10) possible conflicts of interest.
Nature, extent and quality of services. The Board evaluated the nature, extent and quality of the services that the Adviser, and the Sub-Advisers as relevant, have provided to the Portfolios. The Board considered the Adviser’s services as investment manager to the Portfolios, including services relating to the selection and oversight of the Sub-Advisers for the applicable Portfolios. The Board considered, among other things, the Adviser’s oversight of the provision of services to the Portfolios by the Sub-Advisers, including with respect to investment activities and trading practices, and the Sub-Adviser’s compliance with fund policies, objectives and Board directives, compliance policies and procedures and applicable law. The Adviser’s services in coordinating and overseeing the activities of the Trusts’ other service providers were also considered. The Board also evaluated the expertise and performance of the personnel of the Adviser who performed services for the Portfolios throughout the year.
The Board considered information received from the Trust’s Chief Compliance Officer (“CCO”) regarding the Portfolios’ compliance policies and procedures established pursuant to Rule 38a-l under the 1940 Act. The Board also evaluated the CCO’s ongoing reports concerning the CCO’s oversight of the risk assessment processes of the Sub-Advisers.
1 The Pyramis Managed Risk Portfolio recently commenced operations and, therefore, the Agreement with respect to this Portfolio was not up for renewal.
MSF-53
Metropolitan Series Fund
Met/Dimensional International Small Company Portfolio
Board of Trustees’ Consideration of Advisory and Sub-Advisory Agreements—(Continued)
With respect to the services provided by each of the Sub-Advisers, the Board considered, among other things, information provided to the Board by each Sub-Adviser. The Board considered the Sub-Adviser’s current level of staffing and its overall resources, as well as its compensation program. The Board reviewed each Sub-Adviser’s history and investment experience, as well as information regarding the qualifications, background and responsibilities of the Sub-Adviser’s investment and compliance personnel who provide services to the Portfolios. The Board also considered, among other things, the Sub-Adviser’s compliance program and any disciplinary history. The Board also took into account the Sub-Adviser’s risk assessment and monitoring process. The Board noted each Sub-Adviser’s regulatory history, including whether it was currently involved in any regulatory actions or investigations as well as material litigation, and any settlements and amelioratory actions undertaken, as appropriate. The Board also noted that the CCO and his staff conduct regular, periodic compliance reviews with each of the Sub-Advisers and present reports to the Independent Trustees regarding the same, which includes evaluating the regulatory compliance systems of the Sub-Advisers and procedures reasonably designed by them to help assure compliance with the federal securities laws, including issues related to late trading and market timing, best execution, fair value pricing, and proxy voting procedures, among others. The Board also took into account the financial condition of each Sub-Adviser. In its review, the Board also received and took into account information regarding any services and/or payments provided to the Adviser by the Sub-Advisers in connection with marketing activities.
The Board considered each Sub-Adviser’s investment process and philosophy. The Board took into account that each Sub-Adviser’s responsibilities include the development and maintenance of an investment program for the applicable Portfolio which is consistent with the Portfolio’s investment objectives, the selection of investment securities and the placement of orders for the purchase and sale of such securities, as well as the implementation of compliance controls related to performance of these services. The Board also reviewed each Sub-Adviser’s brokerage policies and practices.
Performance. The Board considered the performance of the Portfolios as described in the quarterly reports prepared by management, and as also analyzed in reports prepared by the Independent Trustees’ independent consultant. The Board noted that the Adviser reviews with the Board on a quarterly basis detailed information about the Portfolios’ performance results, portfolio composition and investment strategies. The Board also reviewed and considered a separate report prepared by Lipper Inc. (“Lipper”), an independent third party, which provided a statistical analysis comparing the Portfolios’ investment performance, expenses, and fees to comparable funds underlying variable insurance products (the “Performance Universe”). In addition, the Independent Trustees met separately with a representative of Bobroff Consulting, Inc., an independent consultant (“Bobroff), at a special board meeting in September 2013, to review the separate reports prepared by such consultant (“Bobroff Report”), which analyzed the report prepared by Lipper. The Board also considered each Portfolio’s more recent performance subsequent to the performance period covered by the Lipper reports, and management’s discussion of the same, including the effect of current market conditions on each Portfolio’s more recent performance.
The Board reviewed the Portfolios’ performance records and the Adviser’s and Sub-Advisers’ management styles and long-term performance records with the Portfolios and comparable funds. The Board focused particular attention on Portfolios with less favorable performance records. The Board was mindful of the Adviser’s focus on each Sub-Adviser’s performance and noted that the Adviser has been active in monitoring and responding to any performance issues with respect to the Portfolios. The Board also took into account its discussions with management regarding factors that contributed to the performance of the Portfolios.
Among other data relating specifically to the Met/Dimensional International Small Company Portfolio’s performance, the Board considered that the Portfolio outperformed the median of its Performance Universe and its Lipper Index for the one- and three-year periods ended June 30, 2013. The Board also took into account that the Portfolio outperformed its benchmark, the MSCI World Ex USA Small Cap Index, for the one- and three-year periods ended October 31, 2013, and underperformed its benchmark for the five-year period ended October 31, 2013.
Fees and Expenses. The Board gave consideration to the advisory fees payable under the Advisory Agreement and the sub-advisory fees payable under each of the Sub-Advisory Agreements. In this regard, the Board reviewed the advisory fees payable on a Portfolio-by-Portfolio basis based on information provided by the Adviser. The Independent Trustees, with the assistance of Bobroff, also examined the fees paid by a Portfolio in light of fees paid to other investment managers by comparable funds, as well as considered the fees charged by the Adviser to manage other comparable funds, as applicable. The Lipper report included comparisons of the Adviser’s fee schedule with that of its peers based on an asset-based analysis of relative fee structures according to the size of the Portfolio. In addition, the Board considered the Portfolios’ advisory and sub-advisory fees and total expenses as compared to similarly situated investment companies underlying variable insurance products deemed to be comparable to the Portfolios as determined by Lipper. The Board considered a Portfolio’s ranking within a smaller group of peer funds chosen by Lipper (the “Expense Group”), as well as the Portfolio’s ranking within broader groups of funds (the “Expense Universe” and the “Sub-advised Expense Universe”). The Board
MSF-54
Metropolitan Series Fund
Met/Dimensional International Small Company Portfolio
Board of Trustees’ Consideration of Advisory and Sub-Advisory Agreements—(Continued)
also considered a Portfolio’s contractual sub-advisory fees, as applicable, as compared to the Sub-advised Expense Universe as well as a smaller group of funds (the “Sub-advised Expense Group”). In comparing a Portfolio’s actual and contractual management fee to that of comparable funds, the Board noted that such fee includes both advisory and administrative fees.
The Board noted that the sub-advisory fees for the Portfolios are paid by the Adviser, not the Portfolios, out of the advisory fee. It was further noted that the Adviser negotiates such fees at arm’s length. The Board also considered that the Adviser had entered into expense limitation agreements with certain of the Portfolios, pursuant to which the Adviser has agreed to waive a portion of its advisory fee and/or reimburse certain expenses as a means of limiting a Portfolio’s total annual operating expenses. The Board further considered the amount of sub-advisory fees paid out by the Adviser and the amount of the management fees that it retained in light of the services performed by Sub-Advisers and Adviser, respectively.
With respect to the Met/Dimensional International Small Company Portfolio, the Board considered that the Portfolio’s actual management fees and total expenses (exclusive of 12b-1 fees) were below the Expense Group median, the Expense Universe median and the Sub-advised Expense Universe median. The Board also noted that the Portfolio’s contractual management fees were below the asset-weighted average of the Expense Group at the Portfolio’s current size. The Board further noted that the Portfolio’s contractual sub-advisory fees were below the average of the Sub-advised Expense Group and above the average of the Sub-advised Expense Universe at the Portfolio’s current size. The Board also considered that the Adviser had waived fees and/or reimbursed expenses during the past year.
Profitability. The Board examined the profitability of the Adviser on a Portfolio-by-Portfolio basis. The Board also considered that the Distributor, MetLife Investors Distribution Company, receives Rule 12b-1 payments to support the distribution of the products. The Board considered the profitability to the Sub-Advisers and their affiliates as a result of their relationships with the Portfolios, and the Board considered the ability of the Adviser to negotiate the Sub-Advisory Agreements and the fees thereunder at arm’s length. The Board also reviewed Portfolio specific data with regard to the profitability of the Portfolios to each Sub-Adviser, as available.
Economies of scale. The Board also considered the effect of the Portfolios’ growth in size on their fees. The Board noted that the fee schedules for most of the Portfolios contain breakpoints that reduce the fee rate above specified asset levels. The Board noted those Portfolios that did not contain breakpoints in the advisory fee and took into account management’s discussion of the same. The Board noted that those Portfolios with advisory fee schedules containing breakpoints generally reflect the inclusion of breakpoints in the sub-advisory fee schedule for such Portfolios. The Board considered the effective fees under the Advisory Agreement for a Portfolio as a percentage of assets at different asset levels and possible economies of scale that may be realized if the assets of the Portfolio grow. Among other data, the Board examined the effect of a Portfolio’s growth in size on various fee schedules and reviewed the Lipper and Bobroff Reports, which compared fees among peers. The Board also generally noted that if a Portfolio’s assets increase over time, the Portfolio may realize other economies of scale if assets increase proportionally more than certain other fixed expenses. In addition, the Board noted that the Adviser had taken a number of steps to date intended to share the benefits of economies of scale with contractholders.
With respect to the Met/Dimensional International Small Company Portfolio, the Board noted that the Portfolio’s advisory fee contains breakpoints that reduce the advisory fee rate on assets above certain specified asset levels. The Board considered the fact that the Portfolio’s fee levels decline as portfolio assets increase.
Other factors. As part of its evaluation of the Adviser’s compensation, the Board considered other benefits that may be realized by the Adviser and its affiliates from their relationship with the Trusts. Among them, the Board recognized that an affiliate of the Adviser, MetLife Investors Distribution Company, serves as the Distributor for the Trusts, and, as such, receives payments pursuant to Rule 12b-1 from the Portfolios to compensate it for providing shareholder services and selling activities, which could lead to growth in the Trusts’ assets and corresponding benefits from such growth, including economies of scale. The Board also considered that affiliates of the Adviser may benefit from certain indirect tax benefits relating to dividend received deductions and foreign tax credits. In conjunction with these considerations, the Board noted the costs of providing investment management and other services to the Portfolios and the ongoing commitment of the Adviser to the Portfolios.
The Board considered other benefits that may be realized by each Sub-Adviser and its affiliates from their relationship with the Trusts, including the opportunity to provide advisory services to additional portfolios of the Trusts and reputational benefits. In conjunction with these considerations, the Board noted the costs of providing investment advisory services to the Portfolios and the ongoing commitment of the Sub-Advisers to the Portfolios.
MSF-55
Metropolitan Series Fund
Met/Dimensional International Small Company Portfolio
Board of Trustees’ Consideration of Advisory and Sub-Advisory Agreements—(Continued)
The Board considered possible conflicts of interest in the form of material benefits or detriments to the Trusts resulting from the nature of the Trusts’ and the Adviser’s or the Sub-Advisers’ affiliations and the services that are provided to the Trusts, and the manner in which such conflicts were mitigated.
Conclusions. After full consideration of the factors discussed above, the Board, including a majority of the Independent Trustees, approved the Advisory Agreement and the Sub-Advisory Agreement, as applicable, with respect to each Portfolio, unless otherwise noted. In making its approvals, the Board concluded that the nature, extent and quality of services provided by the Adviser and each Sub-Adviser supported the renewal of the Agreements. The Board also concluded that the investment performance of each Fund was such that each Agreement should continue. In addition, the Board concluded that fees paid by a Portfolio to the Adviser and, if applicable, the Sub-Adviser appeared to be acceptable in light of nature, extent and quality of the services provided by the Adviser and Sub-Adviser. Further, the Board concluded that the Adviser’s profitability in providing services under the Advisory Agreements did not appear unreasonably high in light of the nature, extent and quality of the services provided by the Adviser. Finally, the Board concluded that the Advisory and Sub-Advisory fees in some measure share economies of scale with contractholders. In approving the renewal of each of the Agreements, the Board, including the Independent Trustees, did not identify any single factor as controlling, and generally attributed different weights to various factors for the various Portfolios. The Board evaluated all information available to them on a Portfolio-by-Portfolio basis, and their decisions were made separately with respect to each Portfolio.
MSF-56
Metropolitan Series Fund
MetLife Conservative Allocation Portfolio
Managed by MetLife Advisers, LLC
Portfolio Manager Commentary*
PERFORMANCE
For the one year period ended December 31, 2013, the Class A and B shares of the MetLife Conservative Allocation Portfolio returned 4.50% and 4.29%, respectively. The Portfolio’s benchmark, the Dow Jones Conservative Index1, returned 1.41%.
MARKET ENVIRONMENT / CONDITIONS
Global economic expansion was in low gear through much of 2013, becoming more bifurcated in the second half of the year. Developed economies continued to strengthen whereas emerging markets faced the dual challenges of slowing growth and tighter global financial conditions. In the U.S., equity markets rallied in the first quarter but experienced a sharp decline in May and June when the Federal Reserve (the “Fed”) hinted at the possibility of reducing its unprecedented bond-buying program. This announcement subsequently sent global markets into a plunge. Domestically, Treasury yields rose while credit spreads widened. The dollar rallied and Treasury Inflation Protected Securities (“TIPS”) posted a substantial loss on reduced inflation expectations. Emerging markets sold off while their currencies tumbled against the U.S. dollar. Volatility spiked in bond and currency markets. The Fed’s accommodative language and policy stance boosted risk appetite in the third quarter and sent investors back into risk assets. Equity performance was strong both domestically and outside of the U.S. Credit spreads tightened, resulting in solid excess returns in both investment grade and high yield bond sectors. Volatility came down significantly in both equity and rate markets following the late September Federal Open Market Committee decision not to pare back the Fed’s asset-purchasing program. Economic reports that came out in the fourth quarter indicated robust domestic growth which in turn boosted investor confidence and made the looming taper even more likely. In December, reduced fiscal drag, falling unemployment and stronger economic growth prompted the Fed to announce a $10 billion reduction in the level of its asset-buying program starting in January 2014, causing stock markets to rally sharply on the news.
The vast majority of global equity markets concluded the year in record territories, supported by accommodative monetary policies around the world. The U.S. equity market outperformed the rest of the world with the S&P 500 Index up 32.4%, trailed by Japan (27.2%), Europe (25.2%), and Asia-Pacific ex-Japan (5.5%), as reported by MSCI. Within U.S. equity markets, smaller cap names generally delivered a better performance than their large cap counterparts. Growth stocks modestly outpaced value stocks over the trailing one year period, most prominently in the small cap space. In terms of sectors, Consumer Discretionary, Health Care, and Industrials proved to be the best performing sectors, while Telecom and Utility stocks trailed. Emerging market equities, however, produced a moderately negative return in 2013 after an impressive 2012. Growing signs of strength in the U.S. economy raised speculation that the Fed would start reducing its stimulus sooner than anticipated. Disappointing economic data across the developing world also reduced investors’ risk appetite as the year progressed.
Within fixed income, interest rate risk drove the majority of domestic bond sectors into negative territory, especially in longer dated securities as the yield curve steepened. High Yield Credit was the only bright spot with a positive 7.4% return for the year. Investors’ demand for additional yield provided steady support for high yield issues throughout 2013, and resulted in meaningful spread narrowing. Internationally, peripheral European debt enjoyed double digit returns for U.S. investors stemming from the combination of positive local returns and the euro strengthening against the dollar. On the other extreme, the Barclays Global Japan Index fell 16.0%, driven entirely by a large currency depreciation induced by Japan’s Prime Minister Shinzo Abe. With Japan being the largest component of the Barclays Global Aggregate ex-U.S. Index, the Index as a whole was down 3.1% for the year. Similar to the equity side, emerging market debt struggled and produced a negative return in 2013, due largely to weak emerging market currencies vis-à-vis the dollar.
PORTFOLIO REVIEW / PERIOD-END POSITIONING
The MetLife Conservative Allocation Portfolio invested in underlying portfolios of the Met Investors Series Trust and the Metropolitan Series Fund to maintain a broad asset allocation of approximately 20% to equities and 80% to fixed income. The Portfolio’s large fixed income position (80%) restrained absolute performance during the full twelve month period when stocks significantly outperformed bonds. However, on a relative basis, performance was comfortably ahead of its benchmark index, the Dow Jones Conservative Index. Outperformance was attributable to a combination of asset class exposures and favorable security selection in the underlying portfolios. From an asset class exposure perspective, a moderate overweight to high yield bonds due to the opportunistic positioning of the core bond managers along with a slight overweight to equity compared to the benchmark contributed positively to relative performance.
The fixed income portion of the Portfolio produced a slightly negative impact on relative performance. Not surprisingly, the PIMCO Inflation Protected Bond Portfolio was the largest performance detractor given that TIPS was the worst performing fixed income segment during the year. That negative contribution was partially offset by positive contributions from several other underlying bond portfolios, including Western Asset Management U.S. Government Portfolio and Met/Templeton International Bond Portfolio. While the PIMCO Inflation Protected Bond Portfolio was largely an asset class story, the portfolios on the positive side were a successful security selection story in the sense that they generated a positive excess return relative to their respective asset class indices. The Western Asset Management U.S. Government Portfolio performed particularly well in the Mortgage-Backed Securities sector, an area in which it has been consistently adding value. The Met/Templeton International Bond Portfolio generated a large outperformance against its benchmark, driven primarily by the portfolio’s currency positioning. More specifically, a sizable underweight in Japanese yen proved to be the right decision as the yen tumbled against the dollar.
MSF-1
Metropolitan Series Fund
MetLife Conservative Allocation Portfolio
Managed by MetLife Advisers, LLC
Portfolio Manager Commentary*—(Continued)
Domestic equity was the big winner in 2013. Not only did our U.S. equity portfolios generate the best absolute return relative to international equity and fixed income underlying portfolios, they also produced the best asset class specific excess return derived from solid stock selection. Outperformance was most pronounced in the large cap space across value and growth spectrum. The T. Rowe Price Large Cap Growth Portfolio was the leading contributor in the domestic equity space. The portfolio’s holdings in the Consumer Discretionary sector added substantially to the performance. Overweight positions in Priceline, Amazon, and Netflix all proved to be beneficial during 2013. Furthermore, a handful of Technology stocks, such as MasterCard and Google, also had a positive contribution. Other domestic equity portfolios that provided a strong contribution on the positive side included MFS Value Portfolio, Invesco Comstock Portfolio and Jennison Growth Portfolio. The MFS Value Portfolio’s sector positioning, namely an underweight in the bottom performing Utilities sector combined with an overweight in the better performing Industrials sector benefited the portfolio. Additionally, its stock selection within the Financials sector was effective across a large number of names. Both the Invesco Comstock Portfolio’s and Jennison Growth Portfolio’s strong performance was driven by favorable stock selection. While the Jennison Growth Portfolio’s stock selection contribution was more concentrated in the Technology sector, the Invesco Comstock Portfolio’s was more in the Financials sector. In contrast, several mid cap and small cap equity portfolios detracted from relative performance, however, to a lesser degree.
The results from the underlying international equity portfolios were mixed. The two portfolios that provide exposure to emerging markets and real estate investment trusts (“REITs”) generally have lower correlations with the rest of the equity market and therefore add diversification benefits to the Portfolio. Unfortunately, these two asset classes had a difficult year in 2013. As a result, MFS Emerging Markets Equity Portfolio and Clarion Global Real Estate Portfolio significantly hindered the overall performance. On a relative basis, while the Harris Oakmark International Portfolio produced the largest positive contribution among all equity portfolios, that positive effect was more than offset by the underperformance generated from the other international portfolios, especially the Clarion Global Real Estate Portfolio.
Investment Committee
MetLife Advisers, LLC
* This commentary may include statements that constitute “forward-looking statements” under the U.S. securities laws. Forward-looking statements include, among other things, projections, estimates, and information about possible or future results related to the Portfolio, market or regulatory developments. The views expressed above are not guarantees of future performance or economic results and involve certain risks, uncertainties and assumptions that could cause actual outcomes and results to differ materially from the views expressed herein. The views expressed above are subject to change at any time based upon economic, market, or other conditions and the advisory firm undertakes no obligation to update the views expressed herein. Any discussions of specific securities should not be considered a recommendation to buy or sell those securities. The views expressed above (including any forward-looking statement) may not be relied upon as investment advice or as an indication of the Portfolio’s trading intent. Information about the Portfolio’s holdings, asset allocation or country diversification is historical and is not an indication of future Portfolio composition, which may vary. Direct investment in any index is not possible. The performance of any index mentioned in this commentary has not been adjusted for ongoing management, distribution and operating expenses, and sales charges applicable to mutual fund investments. In addition, the returns do not reflect additional fees charged by separate accounts or variable insurance contracts that an investor in the Portfolio may pay. If these additional fees were reflected, performance would have been lower.
MSF-2
Metropolitan Series Fund
MetLife Conservative Allocation Portfolio
A $10,000 INVESTMENT COMPARED TO THE DOW JONES CONSERVATIVE INDEX

AVERAGE ANNUAL RETURNS (%) (FOR THE YEAR ENDED DECEMBER 31, 2013)
| | | | | | | | | | | | |
| | | 1 Year | | | 5 Year | | | Since Inception2 | |
| MetLife Conservative Allocation Portfolio | | | | | | | | | | | | |
Class A | | | 4.50 | | | | 9.54 | | | | 5.57 | |
Class B | | | 4.29 | | | | 9.29 | | | | 5.31 | |
| Dow Jones Conservative Index | | | 1.41 | | | | 6.25 | | | | 5.05 | |
1 The Dow Jones Conservative Index is a total returns index designed to provide asset allocation strategists with a target risk benchmark. Each month, the Index adjusts its weighting of stocks, bonds, and cash indices (both domestic and foreign) from Barclays and Dow Jones such that the risk combination will have 20% of the risk of an all equity portfolio.
2 Inception date of the Class A and Class B shares is 5/2/05. Index since inception return is based on the Portfolio’s inception date.
Portfolio performance is calculated including reinvestment of all income and capital gain distributions. Performance numbers are net of all Portfolio expenses but do not include any insurance, sales, separate account or administrative charges of variable annuity or life insurance contracts or any additional expenses that participants may bear relating to the operations of their plans. If these charges were included, the returns would be lower. The performance of any index referenced above has not been adjusted for ongoing management, distribution and operating expenses, and sales charges applicable to mutual fund investments. Direct investment in any index is not possible. The performance of Class A shares, as set forth in the line graph above, will differ from that of other classes because of the difference in expenses paid by policyholders investing in the different share classes.
This information represents past performance and is not indicative of future results. Investment return and principal value may fluctuate so that shares, upon redemption, may be worth more or less than the original cost.
PORTFOLIO COMPOSITION AS OF DECEMBER 31, 2013
Top Holdings
| | | | |
| | | % of
Net Assets | |
| PIMCO Total Return Portfolio(Class A) | | | 18.9 | |
| Western Asset Management U.S. Government Portfolio(Class A) | | | 15.0 | |
| BlackRock Bond Income Portfolio(Class A) | | | 12.5 | |
| PIMCO Inflation Protected Bond Portfolio(Class A) | | | 9.9 | |
| JPMorgan Core Bond Portfolio(Class A) | | | 8.5 | |
| Met/Franklin Low Duration Total Return Portfolio(Class A) | | | 6.0 | |
| Western Asset Management Strategic Bond Opportunities Portfolio(Class A) | | | 2.6 | |
| WMC Core Equity Opportunities Portfolio (formerly Davis Venture Value Portfolio)(Class A) | | | 2.3 | |
| T. Rowe Price Large Cap Value Portfolio(Class A) | | | 2.3 | |
| MFS Value Portfolio(Class A) | | | 2.0 | |
MSF-3
Metropolitan Series Fund
MetLife Conservative Allocation Portfolio
Understanding Your Portfolio’s Expenses
Shareholder Expense Example
As a shareholder of the Portfolio, you incur ongoing costs, including management fees; distribution and service (12b-1) fees; and other Portfolio expenses. This example is intended to help you understand your ongoing costs (in dollars) (referred to as “expenses”) of investing in the Portfolio and compare these costs with the ongoing costs of investing in other mutual funds. The example is based on an investment of $1,000 invested at the beginning of the period and held for the entire period, July 1, 2013 through December 31, 2013.
Actual Expenses
The first line for each share class of the Portfolio in the table below provides information about actual account values and actual expenses. You may use the information in this line, together with the amount you invested in the particular share class of the Portfolio, to estimate the expenses that you paid over the period. Simply divide your account value by $1,000 (for example, an $8,600 account value divided by $1,000 = 8.6), then multiply the result by the number in the first line under the heading entitled “Expenses Paid During Period” to estimate the expenses you paid on your account during this period.
Hypothetical Example for Comparison Purposes
The second line for each share class of the Portfolio in the table below provides information about hypothetical account values and hypothetical expenses based on the Portfolio’s actual expense ratio and an assumed rate of return of 5% per year before expenses, which is not the Portfolio’s actual return. The hypothetical account values and expenses may not be used to estimate the actual ending account balance or expenses you paid for the period. You may use this information to compare the ongoing costs of investing in the Portfolio and other funds. To do so, compare this 5% hypothetical example with the 5% hypothetical examples that appear in the shareholder reports of the other funds.
Please note that the expenses shown in the table are meant to highlight your ongoing costs only and do not reflect any fees or charges of your variable insurance product or any additional expenses that participants in certain eligible qualified plans may bear relating to the operations of their plan. Therefore, the second line for each share class in the table is useful in comparing ongoing costs only, and will not help you determine the relative total costs of owning different funds. In addition, if these other costs were included, your costs would have been higher.
| | | | | | | | | | | | | | | | | | |
MetLife Conservative Allocation Portfolio | | | | Annualized
Expense
Ratio | | | Beginning
Account Value
July 1,
2013 | | | Ending
Account Value
December 31,
2013 | | | Expenses Paid
During Period**
July 1, 2013
to
December 31,
2013 | |
Class A(a)(b) | | Actual | | | 0.62 | % | | $ | 1,000.00 | | | $ | 1,040.60 | | | $ | 3.19 | |
| | Hypothetical* | | | 0.62 | % | | $ | 1,000.00 | | | $ | 1,022.08 | | | $ | 3.16 | |
| | | | | |
Class B(a)(b) | | Actual | | | 0.87 | % | | $ | 1,000.00 | | | $ | 1,039.10 | | | $ | 4.47 | |
| | Hypothetical* | | | 0.87 | % | | $ | 1,000.00 | | | $ | 1,020.82 | | | $ | 4.43 | |
* Hypothetical assumes a rate of return of 5% per year before expenses.
** Expenses paid are equal to the Portfolio’s annualized expense ratio for the most recent six month period, as shown above, multiplied by the average account value over the period, multiplied by the number of days (184 days) in the most recent fiscal half-year, divided by 365 (to reflect the one-half year period).
(a) The annualized expense ratio shown reflects an expense limitation agreement between MetLife Advisers, LLC and the Portfolio as described in Note 5 of the Notes to Financial Statements.
(b) The annualized expense ratio reflects the expenses of both the Portfolio and the Underlying Portfolios in which it invests.
MSF-4
Metropolitan Series Fund
MetLife Conservative Allocation Portfolio
Schedule of Investments as of December 31, 2013
Mutual Funds—100.0% of Net Assets
| | | | | | | | |
| Security Description | | Shares | | | Value | |
|
Affiliated Investment Companies—100.0% | |
Baillie Gifford International Stock Portfolio
(Class A) (a) | | | 674,662 | | | $ | 7,110,933 | |
BlackRock Bond Income Portfolio
(Class A) (a) | | | 819,606 | | | | 87,968,317 | |
BlackRock Capital Appreciation Portfolio
(Class A) (a) | | | 187,852 | | | | 7,110,215 | |
BlackRock High Yield Portfolio (Class A) (b) | | | 558,310 | | | | 4,952,207 | |
BlackRock Large Cap Value Portfolio
(Class A) (a) | | | 591,358 | | | | 7,108,123 | |
Clarion Global Real Estate Portfolio
(Class A) (b) | | | 636,517 | | | | 7,090,795 | |
Goldman Sachs Mid Cap Value Portfolio
(Class A) (b) | | | 200,123 | | | | 3,554,184 | |
Harris Oakmark International Portfolio
(Class A) (b) | | | 371,169 | | | | 7,100,466 | |
Invesco Comstock Portfolio (Class A) (b) | | | 975,148 | | | | 14,217,664 | |
Jennison Growth Portfolio (Class A) (a) | | | 539,041 | | | | 8,527,623 | |
JPMorgan Core Bond Portfolio (Class A) (b) | | | 5,870,256 | | | | 59,700,506 | |
JPMorgan Small Cap Value Portfolio
(Class A) (b) | | | 177,607 | | | | 3,539,714 | |
Lord Abbett Bond Debenture Portfolio
(Class A) (b) | | | 365,350 | | | | 4,950,489 | |
Met/Artisan Mid Cap Value Portfolio
(Class A) (a) | | | 13,233 | | | | 3,554,259 | |
Met/Eaton Vance Floating Rate Portfolio
(Class A) (b) | | | 1,327,385 | | | | 14,110,106 | |
Met/Franklin Low Duration Total Return Portfolio (Class A) (b) | | | 4,198,867 | | | | 42,282,590 | |
Met/Templeton International Bond Portfolio (Class A) (b) | | | 1,206,952 | | | | 14,145,481 | |
MFS Emerging Markets Equity Portfolio
(Class A) (b) | | | 170,443 | | | | 1,767,495 | |
MFS Research International Portfolio
(Class A) (b) | | | 443,928 | | | | 5,331,579 | |
MFS Value Portfolio (Class A) (a) | | | 801,107 | | | | 14,219,643 | |
Neuberger Berman Genesis Portfolio
(Class A) (a) | | | 391,139 | | | | 7,095,262 | |
|
Affiliated Investment Companies—(Continued) | |
PIMCO Inflation Protected Bond Portfolio
(Class A) (b) | | | 7,032,253 | | | $ | 69,970,921 | |
PIMCO Total Return Portfolio (Class A) (b) | | | 11,231,865 | | | | 133,322,240 | |
T. Rowe Price Large Cap Growth Portfolio (Class A) (a) | | | 347,982 | | | | 8,529,032 | |
T. Rowe Price Large Cap Value Portfolio
(Class A) (b) | | | 508,477 | | | | 16,347,532 | |
Third Avenue Small Cap Value Portfolio
(Class A) (b) | | | 506,729 | | | | 10,661,578 | |
Western Asset Management Strategic Bond Opportunities Portfolio (Class A) (a) | | | 1,364,300 | | | | 18,349,841 | |
Western Asset Management U.S. Government Portfolio (Class A) (a) | | | 8,784,176 | | | | 105,497,954 | |
WMC Core Equity Opportunities Portfolio (formerly Davis Venture Value Portfolio) (Class A) (a) | | | 380,528 | | | | 16,351,273 | |
| | | | | | | | |
Total Mutual Funds
(Cost $675,930,028) | | | | | | | 704,468,022 | |
| | | | | | | | |
Total Investments—100.0%
(Cost $675,930,028) (c) | | | | | | | 704,468,022 | |
Other assets and liabilities (net)—0.0% | | | | | | | (210,388 | ) |
| | | | | | | | |
| Net Assets—100.0% | | | | | | $ | 704,257,634 | |
| | | | | | | | |
| (a) | A Portfolio of Metropolitan Series Fund. (See Note 6 of the Notes to Financial Statements for a summary of transactions in the securities of affiliated issuers.) |
| (b) | A Portfolio of Met Investors Series Trust. (See Note 6 of the Notes to Financial Statements for a summary of transactions in the securities of affiliated issuers.) |
| (c) | As of December 31, 2013, the aggregate cost of investments for federal income tax purposes was $679,469,810. The aggregate unrealized appreciation and depreciation of investments were $37,648,327 and $(12,650,115), respectively, resulting in net unrealized appreciation of $24,998,212 for federal income tax purposes. |
See accompanying notes to financial statements.
MSF-5
Metropolitan Series Fund
MetLife Conservative Allocation Portfolio
Schedule of Investments as of December 31, 2013
Fair Value Hierarchy
Accounting principles generally accepted in the United States of America (“GAAP”) define fair market value as the price that the Portfolio would receive to sell an asset or pay to transfer a liability in an orderly transaction between market participants at the measurement date. It establishes a fair value hierarchy that prioritizes inputs to valuation methods and requires disclosure of the fair value hierarchy that segregates fair value measurements into three levels. Levels 1, 2 and 3 of the fair value hierarchy are defined as follows:
Level 1 - unadjusted quoted prices in active markets for identical investments
Level 2 - other significant observable inputs (including, but not limited to, unadjusted quoted prices for similar investments in markets that are either active or inactive; inputs other than quoted prices that are observable such as interest rates, yield curves, volatilities, prepayment speeds, loss severities, credit risks, default rates, etc.)
Level 3 - significant unobservable inputs based on the best information available in the circumstances, to the extent observable inputs are unavailable (including the Portfolio’s own assumptions in determining the fair value of investments)
The inputs or methodologies used for valuing investments are not necessarily an indication of the risk associated with investing in them. Changes to the inputs or methodologies used may result in transfers between levels, which will be recognized as of the beginning of the reporting period. Information on transfers between Level 1 and Level 2, if any, will be disclosed following the fair value hierarchy table below. A reconciliation of Level 3 securities, if any, will also be disclosed following the fair value hierarchy table. For more information about the Portfolio’s policy regarding the valuation of investments, please refer to the Notes to Financial Statements.
The following table summarizes the fair value hierarchy of the Portfolio’s investments as of December 31, 2013:
| | | | | | | | | | | | | | | | |
| Description | | Level 1 | | | Level 2 | | | Level 3 | | | Total | |
| Mutual Funds | | | | | | | | | | | | | | | | |
Affiliated Investment Companies | | $ | 704,468,022 | | | $ | — | | | $ | — | | | $ | 704,468,022 | |
Total Investments | | $ | 704,468,022 | | | $ | — | | | $ | — | | | $ | 704,468,022 | |
| | | | | | | | | | | | | | | | | |
See accompanying notes to financial statements.
MSF-6
Metropolitan Series Fund
MetLife Conservative Allocation Portfolio
Statement of Assets and Liabilities
December 31, 2013
| | | | |
Assets | | | | |
Affiliated investments at value (a) | | $ | 704,468,022 | |
Cash | | | 1 | |
Receivable for: | | | | |
Investments sold | | | 387,971 | |
Fund shares sold | | | 238,266 | |
Due from investment adviser | | | 61,885 | |
| | | | |
Total Assets | | | 705,156,145 | |
Liabilities | | | | |
Payables for: | | | | |
Investments purchased | | | 81,814 | |
Fund shares redeemed | | | 544,423 | |
Accrued expenses: | | | | |
Management fees | | | 55,624 | |
Distribution and service fees | | | 139,331 | |
Deferred trustees’ fees | | | 48,554 | |
Other expenses | | | 28,765 | |
| | | | |
Total Liabilities | | | 898,511 | |
| | | | |
Net Assets | | $ | 704,257,634 | |
| | | | |
Net assets consist of: | | | | |
Paid in surplus | | $ | 624,693,581 | |
Undistributed net investment income | | | 26,235,354 | |
Accumulated net realized gain | | | 24,790,705 | |
Unrealized appreciation on affiliated investments | | | 28,537,994 | |
| | | | |
Net Assets | | $ | 704,257,634 | |
| | | | |
Net Assets | | | | |
Class A | | $ | 50,502,598 | |
Class B | | | 653,755,036 | |
Capital Shares Outstanding* | | | | |
Class A | | | 4,190,206 | |
Class B | | | 54,629,189 | |
Net Asset Value, Offering Price and Redemption Price Per Share | | | | |
Class A | | $ | 12.05 | |
Class B | | | 11.97 | |
| * | The Portfolio is authorized to issue an unlimited number of shares. |
| (a) | Identified cost of affiliated investments was $675,930,028. |
Statement of Operations
Year Ended December 31, 2013
| | | | |
Investment Income | | | | |
Dividends from Affiliated Underlying Portfolios | | $ | 21,398,630 | |
| | | | |
Total investment income | | | 21,398,630 | |
Expenses | | | | |
Management fees | | | 690,431 | |
Administration fees | | | 12,520 | |
Custodian and accounting fees | | | 25,120 | |
Distribution and service fees—Class B | | | 1,750,598 | |
Audit and tax services | | | 27,722 | |
Legal | | | 27,754 | |
Trustees’ fees and expenses | | | 35,359 | |
Miscellaneous | | | 6,263 | |
| | | | |
Total expenses | | | 2,575,767 | |
Less expenses reimbursed by the Adviser | | | (61,885 | ) |
| | | | |
Net expenses | | | 2,513,882 | |
| | | | |
Net Investment Income | | | 18,884,748 | |
| | | | |
Net Realized and Unrealized Gain | | | | |
| Net realized gain on: | | | | |
Affiliated investments | | | 27,529,699 | |
Capital gain distributions from Affiliated Underlying Portfolios | | | 11,490,217 | |
| | | | |
Net realized gain | | | 39,019,916 | |
| | | | |
Net change in unrealized depreciation on affiliated investments | | | (26,985,702 | ) |
| | | | |
Net realized and unrealized gain | | | 12,034,214 | |
| | | | |
Net Increase in Net Assets from Operations | | $ | 30,918,962 | |
| | | | |
See accompanying notes to financial statements.
MSF-7
Metropolitan Series Fund
MetLife Conservative Allocation Portfolio
Statements of Changes in Net Assets
| | | | | | | | |
| | | Year Ended
December 31,
2013 | | | Year Ended
December 31,
2012 | |
Increase (Decrease) in Net Assets: | | | | | | | | |
From Operations | | | | | | | | |
Net investment income | | $ | 18,884,748 | | | $ | 17,323,643 | |
Net realized gain | | | 39,019,916 | | | | 8,606,344 | |
Net change in unrealized appreciation (depreciation) | | | (26,985,702 | ) | | | 38,179,561 | |
| | | | | | | | |
Increase in net assets from operations | | | 30,918,962 | | | | 64,109,548 | |
| | | | | | | | |
From Distributions to Shareholders | | | | | | | | |
Net investment income | | | | | | | | |
Class A | | | (1,669,825 | ) | | | (1,675,020 | ) |
Class B | | | (20,320,447 | ) | | | (21,223,316 | ) |
Net realized capital gains | | | | | | | | |
Class A | | | (252,309 | ) | | | (1,293,214 | ) |
Class B | | | (3,326,264 | ) | | | (17,639,431 | ) |
| | | | | | | | |
Total distributions | | | (25,568,845 | ) | | | (41,830,981 | ) |
| | | | | | | | |
Increase (decrease) in net assets from capital share transactions | | | (78,957,486 | ) | | | 72,616,439 | |
| | | | | | | | |
Total Increase (Decrease) in Net Assets | | | (73,607,369 | ) | | | 94,895,006 | |
| | |
Net Assets | | | | | | | | |
Beginning of period | | | 777,865,003 | | | | 682,969,997 | |
| | | | | | | | |
End of period | | $ | 704,257,634 | | | $ | 777,865,003 | |
| | | | | | | | |
| | |
Undistributed net investment income | | | | | | | | |
End of period | | $ | 26,235,354 | | | $ | 21,818,331 | |
| | | | | | | | |
Other Information:
Capital Shares
Transactions in capital shares were as follows:
| | | | | | | | | | | | | | | | |
| | | Year Ended
December 31, 2013 | | | Year Ended
December 31, 2012 | |
| | | Shares | | | Value | | | Shares | | | Value | |
Class A | | | | | | | | | | | | | | | | |
Sales | | | 1,010,238 | | | $ | 12,089,640 | | | | 1,088,531 | | | $ | 12,718,526 | |
Reinvestments | | | 162,755 | | | | 1,922,134 | | | | 261,519 | | | | 2,968,234 | |
Redemptions | | | (1,579,390 | ) | | | (18,842,708 | ) | | | (950,918 | ) | | | (11,109,262 | ) |
| | | | | | | | | | | | | | | | |
Net increase (decrease) | | | (406,397 | ) | | $ | (4,830,934 | ) | | | 399,132 | | | $ | 4,577,498 | |
| | | | | | | | | | | | | | | | |
Class B | | | | | | | | | | | | | | | | |
Sales | | | 5,676,456 | | | $ | 67,480,408 | | | | 10,029,567 | | | $ | 116,934,083 | |
Reinvestments | | | 2,012,486 | | | | 23,646,711 | | | | 3,439,181 | | | | 38,862,747 | |
Redemptions | | | (14,002,275 | ) | | | (165,253,671 | ) | | | (7,544,007 | ) | | | (87,757,889 | ) |
| | | | | | | | | | | | | | | | |
Net increase (decrease) | | | (6,313,333 | ) | | $ | (74,126,552 | ) | | | 5,924,741 | | | $ | 68,038,941 | |
| | | | | | | | | | | | | | | | |
Increase (decrease) derived from capital shares transactions | | | | | | $ | (78,957,486 | ) | | | | | | $ | 72,616,439 | |
| | | | | | | | | | | | | | | | |
See accompanying notes to financial statements.
MSF-8
Metropolitan Series Fund
MetLife Conservative Allocation Portfolio
Financial Highlights
| | | | | | | | | | | | | | | | | | | | |
| Selected per share data | | | |
| | | Class A | |
| | | Year Ended December 31, | |
| | | 2013 | | | 2012 | | | 2011 | | | 2010 | | | 2009 | |
Net Asset Value, Beginning of Period | | $ | 11.94 | | | $ | 11.60 | | | $ | 11.51 | | | $ | 10.87 | | | $ | 9.42 | |
| | | | | | | | | | | | | | | | | | | | |
Income (Loss) from Investment Operations | | | | | | | | | | | | | | | | | | | | |
Net investment income (a) | | | 0.33 | | | | 0.30 | | | | 0.33 | | | | 0.33 | | | | 0.53 | |
Net realized and unrealized gain on investments | | | 0.20 | | | | 0.77 | | | | 0.07 | | | | 0.77 | | | | 1.35 | |
| | | | | | | | | | | | | | | | | | | | |
Total from investment operations | | | 0.53 | | | | 1.07 | | | | 0.40 | | | | 1.10 | | | | 1.88 | |
| | | | | | | | | | | | | | | | | | | | |
Less Distributions | | | | | | | | | | | | | | | | | | | | |
Distributions from net investment income | | | (0.36 | ) | | | (0.41 | ) | | | (0.31 | ) | | | (0.46 | ) | | | (0.36 | ) |
Distributions from net realized capital gains | | | (0.06 | ) | | | (0.32 | ) | | | 0.00 | | | | 0.00 | | | | (0.07 | ) |
| | | | | | | | | | | | | | | | | | | | |
Total distributions | | | (0.42 | ) | | | (0.73 | ) | | | (0.31 | ) | | | (0.46 | ) | | | (0.43 | ) |
| | | | | | | | | | | | | | | | | | | | |
Net Asset Value, End of Period | | $ | 12.05 | | | $ | 11.94 | | | $ | 11.60 | | | $ | 11.51 | | | $ | 10.87 | |
| | | | | | | | | | | | | | | | | | | | |
Total Return (%) (b) | | | 4.50 | | | | 9.49 | | | | 3.48 | | | | 10.34 | | | | 20.73 | |
| | | | | |
Ratios/Supplemental Data | | | | | | | | | | | | | | | | | | | | |
Gross ratio of expenses to average net assets (%) (c) | | | 0.11 | | | | 0.11 | | | | 0.11 | | | | 0.11 | | | | 0.12 | |
Net ratio of expenses to average net assets (%) (c) (d) | | | 0.10 | | | | 0.10 | | | | 0.10 | | | | 0.10 | | | | 0.10 | |
Ratio of net investment income to average net assets (%) (e) | | | 2.73 | | | | 2.58 | | | | 2.84 | | | | 2.97 | | | | 5.36 | |
Portfolio turnover rate (%) | | | 18 | | | | 9 | | | | 33 | | | | 21 | | | | 22 | |
Net assets, end of period (in millions) | | $ | 50.5 | | | $ | 54.9 | | | $ | 48.7 | | | $ | 45.7 | | | $ | 31.1 | |
| | | | | | | | | | | | | | | | | | | | |
| | | Class B | |
| | | Year Ended December 31, | |
| | | 2013 | | | 2012 | | | 2011 | | | 2010 | | | 2009 | |
Net Asset Value, Beginning of Period | | $ | 11.86 | | | $ | 11.53 | | | $ | 11.44 | | | $ | 10.81 | | | $ | 9.36 | |
| | | | | | | | | | | | | | | | | | | | |
Income (Loss) from Investment Operations | | | | | | | | | | | | | | | | | | | | |
Net investment income (a) | | | 0.29 | | | | 0.27 | | | | 0.29 | | | | 0.30 | | | | 0.47 | |
Net realized and unrealized gain on investments | | | 0.22 | | | | 0.76 | | | | 0.08 | | | | 0.77 | | | | 1.38 | |
| | | | | | | | | | | | | | | | | | | | |
Total from investment operations | | | 0.51 | | | | 1.03 | | | | 0.37 | | | | 1.07 | | | | 1.85 | |
| | | | | | | | | | | | | | | | | | | | |
Less Distributions | | | | | | | | | | | | | | | | | | | | |
Distributions from net investment income | | | (0.34 | ) | | | (0.38 | ) | | | (0.28 | ) | | | (0.44 | ) | | | (0.33 | ) |
Distributions from net realized capital gains | | | (0.06 | ) | | | (0.32 | ) | | | 0.00 | | | | 0.00 | | | | (0.07 | ) |
| | | | | | | | | | | | | | | | | | | | |
Total distributions | | | (0.40 | ) | | | (0.70 | ) | | | (0.28 | ) | | | (0.44 | ) | | | (0.40 | ) |
| | | | | | | | | | | | | | | | | | | | |
Net Asset Value, End of Period | | $ | 11.97 | | | $ | 11.86 | | | $ | 11.53 | | | $ | 11.44 | | | $ | 10.81 | |
| | | | | | | | | | | | | | | | | | | | |
Total Return (%) (b) | | | 4.29 | | | | 9.18 | | | | 3.25 | | | | 10.05 | | | | 20.52 | |
| | | | | |
Ratios/Supplemental Data | | | | | | | | | | | | | | | | | | | | |
Gross ratio of expenses to average net assets (%) (c) | | | 0.36 | | | | 0.36 | | | | 0.36 | | | | 0.36 | | | | 0.37 | |
Net ratio of expenses to average net assets (%) (c) (d) | | | 0.35 | | | | 0.35 | | | | 0.35 | | | | 0.35 | | | | 0.35 | |
Ratio of net investment income to average net assets (%) (e) | | | 2.49 | | | | 2.35 | | | | 2.49 | | | | 2.68 | | | | 4.73 | |
Portfolio turnover rate (%) | | | 18 | | | | 9 | | | | 33 | | | | 21 | | | | 22 | |
Net assets, end of period (in millions) | | $ | 653.8 | | | $ | 723.0 | | | $ | 634.3 | | | $ | 562.4 | | | $ | 404.3 | |
| (a) | Per share amounts based on average shares outstanding during the period. |
| (b) | Total return does not reflect any insurance, sales, separate account or administrative charges of variable annuity or life insurance contracts or any additional expenses that contract owners may bear under their variable contracts. If these charges were included, the returns would be lower. |
| (c) | The ratio of operating expenses to average net assets does not include expenses of the Underlying Portfolios in which the Portfolio invests. |
| (d) | Net ratio of expenses to average net assets includes the effect of the expense limitation agreement as detailed in Note 5 of the Notes to Financial Statements. |
| (e) | Recognition of net investment income by the Asset Allocation Portfolio is affected by the timing of the declaration of dividends by the Underlying Portfolios in which it invests. |
See accompanying notes to financial statements.
MSF-9
Metropolitan Series Fund
MetLife Conservative Allocation Portfolio
Notes to Financial Statements—December 31, 2013
1. Organization
Metropolitan Series Fund (the “Trust”) is organized as a Delaware statutory trust and registered under the Investment Company Act of 1940, as amended (the “1940 Act”), as an open-end management investment company. The Trust is currently comprised of thirty series, each of which operates as a distinct investment vehicle of the Trust. The portfolio included in this report is MetLife Conservative Allocation Portfolio (the “Asset Allocation Portfolio”), which is diversified. The Asset Allocation Portfolio operates under a “fund of funds” structure, investing substantially all of its assets in other Portfolios advised by MetLife Advisers, LLC (“MetLife Advisers”), an affiliate of MetLife, Inc., or its affiliates (each, an “Underlying Portfolio,” and, collectively, the “Underlying Portfolios”). Shares in the Asset Allocation Portfolio are not offered directly to the general public and are currently available only to separate accounts established by Metropolitan Life Insurance Company (“MetLife”) and other affiliated life insurance companies.
The Asset Allocation Portfolio has registered and offers two classes of shares: Class A and B shares. Shares of each Class of the Asset Allocation Portfolio represent an equal pro rata interest in the Asset Allocation Portfolio and generally give the shareholder the same voting, dividend, liquidation, and other rights. Investment income, realized and unrealized capital gains and losses, the common expenses of the Asset Allocation Portfolio, and certain Asset Allocation Portfolio-level expense reductions, if any, are allocated on a pro rata basis to each Class based on the relative net assets of each Class to the net assets of the Asset Allocation Portfolio. Each Class of shares differs in its respective distribution plan and such distribution expenses are allocated to that Class.
2. Significant Accounting Policies
The preparation of financial statements in conformity with accounting principles generally accepted in the United States of America (“GAAP”) requires management to make estimates and assumptions that affect the reported amounts of assets and liabilities and disclosure of contingent assets and liabilities as of the date of the financial statements and the reported amounts of income and expenses during the reporting period. Actual results could differ from those estimates. In the preparation of these financial statements, management has evaluated events and transactions subsequent to December 31, 2013 through the date the financial statements were issued.
The following is a summary of significant accounting policies consistently followed by the Asset Allocation Portfolio in the preparation of its financial statements.
Investment Valuation and Fair Value Measurements - Investments in the Underlying Portfolios are valued at their closing daily net asset value on the valuation date. Investments in the Underlying Portfolios are categorized as Level 1 within the fair value hierarchy. For information about the use of fair value pricing by the Underlying Portfolios, please refer to the prospectuses of the Underlying Portfolios.
Investment Transactions and Related Investment Income - Asset Allocation Portfolio security transactions are recorded on the trade date. Dividend income is recorded on the ex-dividend date. Realized gains and losses on investments are determined on the identified cost basis, which is the same basis used for federal income tax purposes. Capital gains distributions received from the Underlying Portfolios are recorded as net realized gain in the Statement of Operations.
Income Taxes - It is the Asset Allocation Portfolio’s policy to comply with the requirements of the Internal Revenue Code of 1986, as amended, and regulations thereunder, applicable to regulated investment companies and to distribute, with respect to each taxable year, all of its taxable income to shareholders. Therefore, no federal income tax provision is required. The Asset Allocation Portfolio files U.S. federal tax returns. No income tax returns are currently under examination. The Asset Allocation Portfolio’s federal tax returns for the prior three fiscal years remain subject to examination by the Internal Revenue Service. As of December 31, 2013, the Portfolio had no uncertain tax positions that would require financial statement recognition, or de-recognition or disclosure.
Dividends and Distributions to Shareholders - The Asset Allocation Portfolio records dividends and distributions on the ex-dividend date. Net realized gains from security transactions (if any) are generally distributed annually to shareholders. The timing and characterization of certain income and capital gains distributions are determined in accordance with federal tax regulations that may differ from GAAP. Permanent book and tax basis differences relating to shareholder distributions will result in reclassification between under/over distributed net investment income, accumulated net realized gains/losses, and paid-in surplus. Book-tax differences are primarily due to distributions from Underlying Portfolios. These adjustments have no impact on net assets or the results of operations.
3. Certain Risks
Market Risk: In the normal course of business, the Underlying Portfolios invest in securities and enter into transactions where risks exist due to fluctuations in the market (market risk) or failure of the other party to a transaction to perform (credit and counterparty risk). The value of securities held by the Underlying Portfolios may decline in response to certain events, including those directly involving the companies whose securities are owned by the Underlying Portfolios; conditions affecting the general economy; overall market changes; local, regional or global political, social or economic instability; currency, interest rate, and price fluctuations.
MSF-10
Metropolitan Series Fund
MetLife Conservative Allocation Portfolio
Notes to Financial Statements—December 31, 2013—(Continued)
Credit and Counterparty Risk: The Underlying Portfolios may be exposed to counterparty risk, or the risk that an entity with which the Underlying Portfolios have unsettled or open transactions may default. The potential loss could exceed the value of the financial assets and liabilities recorded in the financial statements. Financial assets that potentially expose the Underlying Portfolios to credit and counterparty risk consist principally of cash due from counterparties and investments. The Underlying Portfolios manage counterparty risk by entering into agreements only with counterparties that they believe have the financial resources to honor their obligations and by monitoring the financial stability of those counterparties. The Underlying Portfolios’ investment adviser attempts to mitigate counterparty risk by (i) periodically assessing the creditworthiness of their trading partners, (ii) monitoring and/or limiting the amount of their net exposure to each individual counterparty based on the adviser’s assessment, and (iii) requiring collateral from the counterparty for certain transactions. In order to preserve certain safeguards for non-standard settlement trades, the Underlying Portfolios restrict their exposure to credit and counterparty losses by entering into master netting agreements with counterparties (approved brokers) with whom the Underlying Portfolios undertake a significant volume of transactions. Master Agreements govern the terms of certain transactions, and reduce the counterparty risk associated with relevant transactions by specifying credit protection mechanisms and providing standardization that improves legal certainty. Master Agreements can also help limit counterparty risk by specifying collateral posting arrangements at pre-arranged exposure levels.
Additional risks associated with each type of investment are described within the respective security type notes. The Asset Allocation Portfolio’s prospectus includes a discussion of the principal risks of investing in the Asset Allocation Portfolio and Underlying Portfolios in which it invests.
4. Investment Transactions
Aggregate cost of purchases and proceeds of sales of shares of the Underlying Portfolios by the Asset Allocation Portfolio, for the year ended December 31, 2013 were as follows:
| | | | | | | | | | | | |
Purchases | | | Sales | |
U.S. Government | | Non U.S. Government | | | U.S. Government | | | Non U.S. Government | |
| $0 | | $ | 137,889,378 | | | $ | 0 | | | $ | 212,053,219 | |
5. Investment Management Fees and Other Transactions with Affiliates
Investment Management Agreement - MetLife Advisers is the investment adviser to the Asset Allocation Portfolio. The Trust has entered into an investment management agreement with MetLife Advisers with respect to the Asset Allocation Portfolio. For providing investment management services to the Asset Allocation Portfolio, MetLife Advisers receives monthly compensation at the following annual rates:
| | | | | | |
Management
Fees earned by
MetLife Advisers
for the year ended
December 31, 2013 | | % per annum | | | Average Daily Net Assets |
| $690,431 | | | 0.100 | % | | Of the first $500 million |
| | | 0.075 | % | | Of the next $500 million |
| | | 0.050 | % | | On amounts in excess of $1 billion |
In addition to the above management fee paid to MetLife Advisers, the Asset Allocation Portfolio indirectly pays MetLife Advisers an investment advisory fee through its investments in the Underlying Portfolios.
Certain officers and trustees of the Trust may also be officers of MetLife Advisers; however, such officers and trustees receive no compensation from the Trust.
Expense Limitation Agreement - Pursuant to an expense agreement relating to each class of the Asset Allocation Portfolio, MetLife Advisers has contractually agreed, from April 29, 2013 to April 27, 2014, to waive a portion of its advisory fees or pay a portion of the other operating expenses (not including acquired fund fees and expenses, brokerage costs, interest, taxes, or extraordinary expenses) to the extent total operating expenses exceed stated annual expense limits (based on the Asset Allocation Portfolio’s then-current fiscal year). For the Asset Allocation Portfolio, this subsidy, and identical subsidies in effect in earlier periods, are subject to the obligation of each class of the Asset Allocation Portfolio to repay MetLife Advisers in future years, if any, when a class’ expenses fall below the stated expense limit pertaining to that class that was in effect at the time of the subsidy in question. Such deferred expenses may be charged to a class in a subsequent year to the extent that the charge does not cause the total expenses in such subsequent year to exceed the class’ stated expense limit that was in effect at the time of the subsidy in question; provided, however, that no class of the Asset Allocation Portfolio is obligated to repay any expense paid by MetLife Advisers more than five years after the end of the fiscal year in which such expense was incurred. The expense limits (annual rates as a percentage of each class of the Asset Allocation Portfolio’s net average daily net assets) in effect from April 29, 2013 to April 27, 2014 are 0.10% and 0.35% for Class A and B, respectively.
MSF-11
Metropolitan Series Fund
MetLife Conservative Allocation Portfolio
Notes to Financial Statements—December 31, 2013—(Continued)
As of December 31, 2013, the amount of expenses deferred in 2008 subject to repayment until December 31, 2013 was $57,938. The amount of expenses deferred in 2009 subject to repayment until December 31, 2014 was $70,498. The amount of expenses deferred in 2010 subject to repayment until December 31, 2015 was $71,127. The amount of expenses deferred in 2011 subject to repayment until December 31, 2016 was $38,237. The amount of expenses deferred in 2012 subject to repayment until December 31, 2017 was $74,663. The amount of expenses deferred in 2013 subject to repayment until December 31, 2018 was $61,885.
Transfer Agency Agreement - MetLife serves as the transfer agent for the Trust. MetLife receives no fees for its services to the Trust under the transfer agency agreement.
Distribution and Service Fees - The Trust has a distribution agreement with MetLife Investors Distribution Company (“MIDC” or the “Distributor”) in which MIDC serves as the distributor for the Asset Allocation Portfolio’s Class A and B Shares. MIDC is a wholly-owned subsidiary of MetLife Investors Group, Inc., an affiliate of the Adviser. The Trust has also adopted a Distribution and Service Plan under Rule 12b-1 of the 1940 Act for the Asset Allocation Portfolio’s Class B shares. Under the Distribution and Services Plan, the Class B shares of the Asset Allocation Portfolio pay a fee to compensate the Insurance Companies (or their affiliates) and other broker-dealers and financial intermediaries involved in the offer and sale of Asset Allocation Portfolio shares for promoting or selling and servicing the Class B shares of the Asset Allocation Portfolio. The fees under the Distribution and Services Plan for each class of the Asset Allocation Portfolio’s shares are calculated as a percentage of the Asset Allocation Portfolio’s average daily net assets that are attributable to that Class. Currently, the fee is 0.25% per year for Class B shares. Amount incurred by the Asset Allocation Portfolio for the year ended December 31, 2013 is shown as Distribution and service fees in the Statement of Operations.
Deferred Trustee Compensation - Each Trustee who is not currently an active employee of MetLife or its affiliates receives compensation from the Trust for his or her service to the Trust. A deferred compensation plan (the “Plan”) is available to the Trustees on a voluntary basis. Deferred amounts remain in the Trust until distributed in accordance with the provisions of the Plan. The value of a participating Trustee’s deferral account is based on theoretical investments of deferred amounts, on the normal payment dates in certain portfolios of the Trust or Met Investors Series Trust, an affiliate of the Trust, as designated by the participating Trustee. Changes in the value of participants’ deferral accounts are reflected as Trustees’ fees and expenses in the Statement of Operations. The portion of the accrued obligations allocated to the Asset Allocation Portfolio under the Plan is reflected as Deferred trustees’ fees in the Statement of Assets and Liabilities.
6. Transactions in Securities of Underlying Portfolios
The Portfolio does not invest in the Underlying Portfolios for the purpose of exercising control; however, investments by the Portfolio within its principal investment strategies may represent a significant portion of the Underlying Portfolios net assets. Transactions in the Underlying Portfolios for the year ended December 31, 2013 were as follows:
| | | | | | | | | | | | | | | | |
Underlying Portfolio | | Number of
shares held at
December 31, 2012 | | | Shares
purchased | | | Shares
sold | | | Number of
shares held at
December 31, 2013 | |
Baillie Gifford International Equity | | | 846,959 | | | | 67,321 | | | | (239,618 | ) | | | 674,662 | |
BlackRock Bond Income | | | 1,146,396 | | | | 67,230 | | | | (394,020 | ) | | | 819,606 | |
BlackRock Capital Appreciation | | | 273,865 | | | | 12,166 | | | | (98,179 | ) | | | 187,852 | |
BlackRock High Yield | | | 872,775 | | | | 71,747 | | | | (386,212 | ) | | | 558,310 | |
BlackRock Large Cap Value | | | 795,391 | | | | 83,818 | | | | (287,851 | ) | | | 591,358 | |
Clarion Global Real Estate | | | 683,679 | | | | 132,724 | | | | (179,886 | ) | | | 636,517 | |
Goldman Sachs Mid Cap Value | | | — | | | | 260,647 | | | | (60,524 | ) | | | 200,123 | |
Harris Oakmark International | | | 521,734 | | | | 45,227 | | | | (195,792 | ) | | | 371,169 | |
Invesco Comstock | | | 715,871 | | | | 627,816 | | | | (368,539 | ) | | | 975,148 | |
Jennison Growth | | | 666,475 | | | | 123,978 | | | | (251,412 | ) | | | 539,041 | |
JPMorgan Core Bond | | | — | | | | 6,297,359 | | | | (427,103 | ) | | | 5,870,256 | |
JPMorgan Small Cap Value | | | — | | | | 239,128 | | | | (61,521 | ) | | | 177,607 | |
Lord Abbett Bond Debenture | | | 579,509 | | | | 33,758 | | | | (247,917 | ) | | | 365,350 | |
Met/Artisan Mid Cap Value | | | 39,468 | | | | 1,616 | | | | (27,851 | ) | | | 13,233 | |
Met/Eaton Vance Floating Rate | | | 1,454,133 | | | | 96,359 | | | | (223,107 | ) | | | 1,327,385 | |
Met/Franklin Low Duration Total Return | | | 4,608,698 | | | | 182,390 | | | | (592,221 | ) | | | 4,198,867 | |
Met/Templeton International Bond | | | 1,315,985 | | | | 66,027 | | | | (175,060 | ) | | | 1,206,952 | |
MFS Emerging Markets | | | — | | | | 203,594 | | | | (33,151 | ) | | | 170,443 | |
MFS Research International | | | 757,763 | | | | 47,164 | | | | (360,999 | ) | | | 443,928 | |
MFS Value | | | 1,126,366 | | | | 83,555 | | | | (408,814 | ) | | | 801,107 | |
Neuberger Berman Genesis | | | 591,216 | | | | 16,934 | | | | (217,011 | ) | | | 391,139 | |
PIMCO Inflation Protected Bond | | | 6,545,154 | | | | 922,196 | | | | (435,097 | ) | | | 7,032,253 | |
PIMCO Total Return | | | 12,702,254 | | | | 904,761 | | | | (2,375,150 | ) | | | 11,231,865 | |
Pioneer Fund | | | 1,072,190 | | | | 6,960 | | | | (1,079,150 | ) | | | — | |
MSF-12
Metropolitan Series Fund
MetLife Conservative Allocation Portfolio
Notes to Financial Statements—December 31, 2013—(Continued)
| | | | | | | | | | | | | | | | |
Underlying Portfolio | | Number of
shares held at
December 31, 2012 | | | Shares
purchased | | | Shares
sold | | | Number of
shares held at
December 31, 2013 | |
T. Rowe Price Large Cap Growth | | | 442,961 | | | | 74,397 | | | | (169,376 | ) | | | 347,982 | |
T. Rowe Price Large Cap Value | | | 638,282 | | | | 76,449 | | | | (206,254 | ) | | | 508,477 | |
Third Avenue Small Cap Value | | | 980,671 | | | | 29,754 | | | | (503,696 | ) | | | 506,729 | |
Western Asset Management Strategic Bond Opportunities | | | 1,668,765 | | | | 94,665 | | | | (399,130 | ) | | | 1,364,300 | |
Western Asset Management U.S. Government | | | 10,056,639 | | | | 347,870 | | | | (1,620,333 | ) | | | 8,784,176 | |
WMC Core Equity Opportunities Portfolio (formerly Davis Venture Value Portfolio) | | | 469,422 | | | | 70,879 | | | | (159,773 | ) | | | 380,528 | |
| | | | | | | | | | | | | | | | |
Underlying Portfolio | | Net Realized
Gain/(Loss) on sales
of Underlying
Portfolios | | | Capital Gain
Distributions
from Underlying
Portfolios | | | Dividend Income
from Underlying
Portfolios | | | Ending Value
as of
December 31, 2013 | |
Baillie Gifford International Equity | | $ | 305,711 | | | $ | — | | | $ | 129,155 | | | $ | 7,110,933 | |
BlackRock Bond Income | | | 4,827,990 | | | | 2,383,127 | | | | 3,909,793 | | | | 87,968,317 | |
BlackRock Capital Appreciation | | | 346,323 | | | | — | | | | 68,964 | | | | 7,110,215 | |
BlackRock High Yield | | | 424,859 | | | | 143,825 | | | | 366,312 | | | | 4,952,207 | |
BlackRock Large Cap Value | | | 405,385 | | | | 444,060 | | | | 114,855 | | | | 7,108,123 | |
Clarion Global Real Estate | | | 162,273 | | | | — | | | | 546,108 | | | | 7,090,795 | |
Goldman Sachs Mid Cap Value | | | 46,664 | | | | 138,106 | | | | 42,918 | | | | 3,554,184 | |
Harris Oakmark International | | | 1,093,551 | | | | — | | | | 223,649 | | | | 7,100,466 | |
Invesco Comstock | | | 1,023,712 | | | | — | | | | 204,858 | | | | 14,217,664 | |
Jennison Growth | | | 546,845 | | | | 98,424 | | | | 40,098 | | | | 8,527,623 | |
JPMorgan Core Bond | | | (149,041 | ) | | | 267,270 | | | | 334,087 | | | | 59,700,506 | |
JPMorgan Small Cap Value | | | 114,761 | | | | — | | | | 27,467 | | | | 3,539,714 | |
Lord Abbett Bond Debenture | | | 400,766 | | | | — | | | | 365,824 | | | | 4,950,489 | |
Met/Artisan Mid Cap Value | | | 1,978,467 | | | | — | | | | 34,873 | | | | 3,554,259 | |
Met/Eaton Vance Floating Rate | | | 115,136 | | | | 71,994 | | | | 636,422 | | | | 14,110,106 | |
Met/Franklin Low Duration Total Return | | | (5,668 | ) | | | — | | | | 841,563 | | | | 42,282,590 | |
Met/Templeton International Bond | | | 137,204 | | | | 68,291 | | | | 340,164 | | | | 14,145,481 | |
MFS Emerging Markets | | | (9,415 | ) | | | — | | | | 24,735 | | | | 1,767,495 | |
MFS Research International | | | 577,526 | | | | — | | | | 169,755 | | | | 5,331,579 | |
MFS Value | | | 2,142,529 | | | | 525,900 | | | | 309,719 | | | | 14,219,643 | |
Neuberger Berman Genesis | | | 588,178 | | | | — | | | | 66,944 | | | | 7,095,262 | |
PIMCO Inflation Protected Bond | | | 19,447 | | | | 4,187,483 | | | | 1,759,670 | | | | 69,970,921 | |
PIMCO Total Return | | | 1,527,629 | | | | 2,862,196 | | | | 6,520,109 | | | | 133,322,240 | |
Pioneer Fund | | | 3,230,348 | | | | — | | | | 6,343 | | | | — | |
T. Rowe Price Large Cap Growth | | | 1,751,161 | | | | — | | | | 28,863 | | | | 8,529,032 | |
T. Rowe Price Large Cap Value | | | 1,120,521 | | | | — | | | | 311,307 | | | | 16,347,532 | |
Third Avenue Small Cap Value | | | 892,455 | | | | — | | | | 148,903 | | | | 10,661,578 | |
Western Asset Management Strategic Bond Opportunities | | | 663,745 | | | | — | | | | 1,018,728 | | | | 18,349,841 | |
Western Asset Management U.S. Government | | | 568,114 | | | | — | | | | 2,555,643 | | | | 105,497,954 | |
WMC Core Equity Opportunities Portfolio (formerly Davis Venture Value Portfolio) | | | 2,682,523 | | | | 299,541 | | | | 250,801 | | | | 16,351,273 | |
| | | | | | | | | | | | | | | | |
| | $ | 27,529,699 | | | $ | 11,490,217 | | | $ | 21,398,630 | | | $ | 704,468,022 | |
| | | | | | | | | | | | | | | | |
7. Contractual Obligations
Under the Trust’s organizational documents, its officers and Trustees may be indemnified against certain liabilities and expenses arising out of the performance of their duties to the Trust. Additionally, the Trust has a variety of indemnification obligations under contracts with its service providers. The Trust’s maximum exposure under these arrangements is unknown, as this would involve future claims that may be made against the Trust that have not yet occurred.
8. Income Tax Information
The tax character of distributions paid for the years ended December 31, 2013 and 2012 were as follows:
| | | | | | | | | | | | | | | | | | | | |
Ordinary Income | | | Long-Term Capital Gain | | | Total | |
2013 | | 2012 | | | 2013 | | | 2012 | | | 2013 | | | 2012 | |
| $21,990,272 | | $ | 24,369,513 | | | $ | 3,578,573 | | | $ | 17,461,468 | | | $ | 25,568,845 | | | $ | 41,830,981 | |
MSF-13
Metropolitan Series Fund
MetLife Conservative Allocation Portfolio
Notes to Financial Statements—December 31, 2013—(Continued)
As of December 31, 2013, the components of distributable earnings (accumulated losses) on a federal income tax basis were as follows:
| | | | | | | | | | | | | | | | |
Undistributed
Ordinary
Income | | Undistributed
Long-Term
Capital Gain | | | Net
Unrealized
Appreciation | | | Loss Carryforwards | | | Total | |
| $27,137,222 | | $ | 27,477,173 | | | $ | 24,998,212 | | | $ | — | | | $ | 79,612,607 | |
The Asset Allocation Portfolio utilizes the provisions of the federal income tax laws that provide for the carryforward of capital losses for prior years, offsetting such losses against any future realized capital gains. Under the Regulated Investment Company Modernization Act of 2010 (the “Act”), net capital losses recognized after December 22, 2010 may be carried forward indefinitely and their character is retained as short-term and/or long-term losses. Previously, net capital losses were carried forward for up to eight years and treated as short-term losses. As a transition rule, the Act requires that post-enactment net capital losses be used before pre-enactment net capital losses.
As of December 31, 2013, the Asset Allocation Portfolio had no post-enactment accumulated capital losses and no pre-enactment accumulated capital loss carryforwards.
9. Subsequent Events
At a meeting held on November 20, 2013, the Board approved for the Portfolio to be renamed the MetLife Asset Allocation 20 Portfolio. This change becomes effective on April 28, 2014.
MSF-14
Metropolitan Series Fund
MetLife Conservative Allocation Portfolio
Report of Independent Registered Public Accounting Firm
To the Shareholders of MetLife Conservative Allocation Portfolio and the Board of Trustees of Metropolitan Series Fund:
We have audited the accompanying statement of assets and liabilities, including the schedule of investments, of MetLife Conservative Allocation Portfolio, one of the portfolios constituting Metropolitan Series Fund, (the “Trust”) as of December 31, 2013, and the related statement of operations for the year then ended, the statements of changes in net assets for each of the two years in the period then ended, and the financial highlights for each of the five years in the period then ended. These financial statements and financial highlights are the responsibility of the Trust’s management. Our responsibility is to express an opinion on these financial statements and financial highlights based on our audits.
We conducted our audits in accordance with the standards of the Public Company Accounting Oversight Board (United States). Those standards require that we plan and perform the audit to obtain reasonable assurance about whether the financial statements and financial highlights are free of material misstatement. The Trust is not required to have, nor were we engaged to perform, an audit of its internal control over financial reporting. Our audits included consideration of internal control over financial reporting as a basis for designing audit procedures that are appropriate in the circumstances, but not for the purpose of expressing an opinion on the effectiveness of the Trust’s internal control over financial reporting. Accordingly, we express no such opinion. An audit also includes examining, on a test basis, evidence supporting the amounts and disclosures in the financial statements, assessing the accounting principles used and significant estimates made by management, as well as evaluating the overall financial statement presentation. Our procedures included confirmation of securities owned as of December 31, 2013, by correspondence with the transfer agent. We believe that our audits provide a reasonable basis for our opinion.
In our opinion, the financial statements and financial highlights referred to above present fairly, in all material respects, the financial position of MetLife Conservative Allocation Portfolio of Metropolitan Series Fund, as of December 31, 2013, the results of its operations for the year then ended, the changes in its net assets for each of the two years in the period then ended, and the financial highlights for each of the five years in the period then ended, in conformity with accounting principles generally accepted in the United States of America.
Deloitte & Touche LLP
Boston, Massachusetts
February 27, 2014
MSF-15
Metropolitan Series Fund
Trustees and Officers of Metropolitan Series Fund
The Trustees and executive officers of the Trust, their ages and their principal occupations during the past five years are set forth below. Unless otherwise indicated, the business address of each is One Financial Center, Boston, MA 02111. Each Trustee who is deemed an “interested person,” as such term is defined in the 1940 Act, is indicated by an asterisk. Those Trustees who are not “interested persons” as defined in the 1940 Act are referred to as “Independent Trustees.” Additional information about the Trustees is available in the Statement of Additional Information, which is available without charge, upon request, by calling (800) 848-3854.
Trustees of the Trust
| | | | | | | | | | |
Name and Age | | Position(s)
Held with
Registrant | | Term of Office and
Length of Time
Served | | Principal Occupation(s) During the
Past 5 Years(1) | | Number of
Portfolios
in Fund
Complex(2)
overseen | | Other Directorships Held
by Trustee During the
Past 5 Years(1) |
| Interested Trustee | | | | | | | | | | |
| Elizabeth M. Forget* (47) | | Trustee, Chairman of the Board, President and Chief Executive Officer | | Indefinite; From May 2006 (President and Chief Executive Officer)/ August 2006 (Trustee and Chairman of the Board) to present | | Senior Vice President, MetLife Inc.; President, MetLife Advisers, LLC and a predecessor company. | | 79 | | Trustee, Met Investors Series Trust (the “MIST Trust”);** various MetLife-affiliated boards. |
| | | | | |
| Independent Trustees | | | | | | | | | | |
| Stephen M. Alderman (54) | | Trustee | | Indefinite; From April 2012 to present | | Shareholder in the law firm of Garfield & Merel, Ltd. | | 79 | | Trustee, MIST Trust;** Director, International Truck Leasing Corp. |
| | | | | |
| Robert J. Boulware (57) | | Trustee | | Indefinite; From April 2012 to present | | Managing Director, Pilgrim Funds, LLC (private equity fund). | | 79 | | Trustee, MIST Trust;** Trustee, Vertical Capital Income Fund (closed-end fund); Director, Gainsco, Inc. (auto insurance). |
| | | | | |
| Susan C. Gause (61) | | Trustee | | Indefinite; From April 2012 to present | | Private Investor. | | 79 | | Trustee, MIST Trust;** Trustee, HSBC Funds. |
| | | | | |
| Nancy Hawthorne (62) | | Trustee | | Indefinite; From May 2003 to present | | Chief Executive Officer, Clerestory LLC (corporate advisor). | | 79 | | MIST Trust;** Director, THL Credit, Inc.**; Director, Avid Technology, Inc.** |
| | | | | |
| Barbara A. Nugent (57) | | Trustee | | Indefinite; From January 2014 to present | | President, True North Board Governance, LLC (consulting); until 2014, partner in the law firm of Stradley Ronon Stevens & Young, LLP. | | 79 | | Trustee, MIST Trust**; Director, Episcopal Healthcare Foundation; until 2014, member, Mutual Fund Directors Forum Advisory Board. |
| | | | | |
| Keith M. Schappert (62) | | Trustee | | Indefinite; From August 2009 to present | | Principal, Schappert Consulting LLC (asset management consulting). | | 79 | | Trustee, MIST Trust;** Director, The Commonfund for Nonprofit Organizations; until 2011, Director, Trilogy Global Advisors; Director, Mirae Asset Discovery Funds,** Director, Calamos Investments. |
| | | | | |
| Linda B. Strumpf (66) | | Trustee | | Indefinite; From May 2000 to present | | Chair of the Investment Committee, Leona M. and Harry B. Helmsley Charitable Trust; until 2011, Chief Investment Officer, Leona M. and Harry B. Helmsley Charitable Trust. | | 79 | | Since 2012, Trustee, MIST Trust,** Trustee and Member of Investment Committee, The Pennsylvania State University. |
| | | | | |
| Dawn M. Vroegop (47) | | Trustee | | Indefinite; From May 2009 to present | | Private Investor. | | 79 | | Trustee, MIST Trust,** Trustee, Driehaus Mutual Funds; Director and Investment Committee Chair, City College of San Francisco Foundation. |
MSF-16
Metropolitan Series Fund
Trustees and Officers of Metropolitan Series Fund—(Continued)
Executive Officers of the Trust
| | | | | | |
Name and Age | | Position(s) Held with
Registrant | | Term of Office
and Length of
Time Served | | Principal Occupation(s) During Past 5 Years(1) |
| Elizabeth M. Forget (47) | | President, Chief Executive Officer, Trustee and Chairman of the Board | | From May
2006 (President
and Chief
Executive
Officer)/
August 2006
(Trustee and
Chairman of
the Board) to
present | | See principal occupation information in the table above. |
| | | |
| Jeffrey L. Bernier (42) | | Vice President | | From February
2008 to present | | Vice President, MetLife, Inc.; Senior Vice President, MetLife Advisers, LLC and a predecessor company. |
| | | |
| Peter H. Duffy (58) | | Chief Financial Officer and Treasurer | | From November
2000 to present | | Senior Vice President, MetLife Advisers, LLC; Vice President, MetLife, Inc. |
| | | |
| Andrew L. Gangolf (59) | | Secretary | | From May
2011to present | | Senior Vice President, MetLife Advisers, LLC; Senior Vice President & Assistant General Counsel, AllianceBerstein Investments, Inc. |
| | | |
| Jeffrey P. Halperin (46) | | Chief Compliance Officer | | From November
2005 to present | | Vice President, MetLife, Inc.; Chief Compliance Officer, MIST; Chief Compliance Officer, MSF Trust; Chief Compliance Officer, MetLife Advisers, LLC and a predecessor company; Chief Compliance Officer, MetLife Investment Management, LLC (formerly MetLife Investment Advisors Company, LLC). |
| | | |
| Alan C. Leland, Jr. (61) | | Vice President | | From February
2005 to present | | Treasurer and Chief Financial Officer, MetLife Advisers, LLC; Vice President, MetLife Group Inc.; Vice President, MetLife, Inc. |
| * | Ms. Forget is an “interested person” of the Trust because of her positions with MetLife Advisers, LLC and her ownership of securities issued by MetLife, Inc., the ultimate parent company of MetLife Advisers, LLC. |
| ** | Indicates a directorship with a registered investment company or a company subject to the reporting requirements of the Securities Exchange Act of 1934, as amended. |
| (1) | Previous positions during the past five years with the Trust, MetLife, Inc. or the Adviser are omitted if not materially different. |
| (2) | The Fund Complex includes 49 Portfolios of the MIST Trust and 30 Portfolios of the Trust. |
MSF-17
Metropolitan Series Fund
MetLife Conservative Allocation Portfolio
Board of Trustees’ Consideration of Advisory Agreement
At an in-person meeting of the Boards of Trustees (the “Board”) of Met Investors Series Trust and Metropolitan Series Fund (“MIST” and “MSF,” respectively, and collectively, the “Trusts”) held on November 19-20, 2013, the Board, including a majority of the Trustees who are not considered to be “interested persons” of the Trusts (the “Independent Trustees”) under the Investment Company Act of 1940, as amended (the “1940 Act”), approved for an annual period the continuation of each Trust’s advisory agreement (the “Advisory Agreement”) with MetLife Advisers, LLC (the “Adviser”) and the applicable sub-advisory agreements (each a “Sub-Advisory Agreement,” and collectively with the Advisory Agreement, the “Agreements”) between the Adviser and the investment sub-advisers (each a “Sub-Adviser,” and collectively, the “Sub-Advisers”) for each of the series of the Trusts, including the MetLife Conservative Allocation Portfolio (each a “Portfolio,” and collectively, the “Portfolios”).1 As the Adviser has the day-to-day responsibility for managing the MetLife Conservative Allocation Portfolio’s investments, the Board only approved an Advisory Agreement with respect to the MetLife Conservative Allocation Portfolio.
In considering the Agreement, the Board reviewed a variety of materials provided by the Adviser relating to the Portfolios, including comparative performance, fee and expense information for an appropriate peer group of similar mutual funds, performance information for relevant benchmark indices and other information regarding the nature, extent and quality of services provided by the Adviser under the Agreement. The Board also took into account its experience with the Adviser and information provided to the Board in its meetings throughout the year with respect to the services provided by the Adviser, including quarterly performance reports prepared by management containing reviews of investment results. The Independent Trustees also assessed reports provided by the Board’s independent consultant, who reviewed and provided analyses regarding investment performance, fees and expenses, and other information provided by, or at the direction of, the Adviser, as more fully discussed below.
The Independent Trustees were separately advised by independent legal counsel throughout the process, and met with independent legal counsel in periodic executive sessions. Prior to voting to continue the Agreements at the November meeting, the Independent Trustees also received a memorandum from their independent counsel discussing the legal standards for their consideration of the proposed continuation of the Agreements. The Board also met in person with personnel of the Adviser on September 17, 2013 for the specific purpose of giving preliminary consideration to the proposed continuation of the Agreements and to request additional information they considered reasonably necessary to their deliberations. The Independent Trustees also discussed the proposed continuation of the Agreements in private sessions with their independent legal counsel at which no representatives of management were present.
In considering whether to approve the renewal of the Advisory Agreement with the Adviser with respect to a Portfolio, the Board reviewed and analyzed the factors it deemed relevant, including: (1) the nature, extent and quality of the services to be provided to the Portfolio by the Adviser; (2) the performance of the Portfolio as compared to a peer group and an appropriate index; (3) the Adviser’s personnel and operations; (4) the financial condition of the Adviser; (5) the level and method of computing each Portfolio’s advisory fees; (6) the profitability of the Adviser under the Advisory Agreement; (7) any “fall-out” benefits to the Adviser and its affiliates (i.e., ancillary benefits realized by the Adviser or its affiliates from the Adviser’s relationship with the Trusts); (8) the anticipated effect of growth in size on Portfolio expenses; and (9) possible conflicts of interest.
Nature, extent and quality of services. The Board evaluated the nature, extent and quality of the services that the Adviser has provided to the Portfolios. The Board considered the Adviser’s services as investment manager to the Portfolios. The Adviser’s services in coordinating and overseeing the activities of the Trusts’ service providers were also considered. The Board also evaluated the expertise and performance of the personnel of the Adviser who performed services for the Portfolios throughout the year.
The Board considered information received from the Trust’s Chief Compliance Officer (“CCO”) regarding the Portfolios’ compliance policies and procedures established pursuant to Rule 38a-l under the 1940 Act.
The Board considered the provision of investment advisory services by the Adviser to the Asset Allocation Portfolios (i.e., MetLife Aggressive Strategy Portfolio, MetLife Balanced Strategy Portfolio, MetLife Conservative Allocation Portfolio, MetLife Conservative to Moderate Allocation Portfolio, MetLife Defensive Strategy Portfolio, MetLife Growth Strategy Portfolio, MetLife Moderate Allocation Portfolio, MetLife Moderate to Aggressive Allocation Portfolio and MetLife Moderate Strategy Portfolio), the American Funds of Funds (i.e., American Funds Balanced Allocation Portfolio, American Funds Growth Allocation Portfolio and American Funds Moderate Allocation Portfolio), the MetLife Balanced Plus Portfolio and the MetLife Multi-Index Targeted Risk Portfolio. With respect to the Asset Allocation Portfolios, the Board noted that the Adviser has hired, at its own cost, an independent consultant to provide research and consulting services with respect to the periodic asset allocation targets for each of the Asset Allocation Portfolios and to investments in other Portfolios of the Trusts (the “Underlying Portfolios”), which may assist the Adviser with the selection of
1 The Pyramis Managed Risk Portfolio recently commenced operations and, therefore, the Agreement with respect to this Portfolio was not up for renewal.
MSF-18
Metropolitan Series Fund
MetLife Conservative Allocation Portfolio
Board of Trustees’ Consideration of Advisory Agreement—(Continued)
Underlying Portfolios for inclusion in each Asset Allocation Portfolio. Additionally, the Board considered that an Investment Committee, consisting of investment professionals from across MetLife, meets at least quarterly to review the asset allocations and discuss the performance of the Asset Allocation Portfolios and the American Funds of Funds.
Performance. The Board considered the performance of the Portfolios as described in the quarterly reports prepared by management, and as also analyzed in reports prepared by the Independent Trustees’ independent consultant. The Board noted that the Adviser reviews with the Board on a quarterly basis detailed information about the Portfolios’ performance results, portfolio composition and investment strategies. The Board also reviewed and considered a separate report prepared by Lipper Inc. (“Lipper”), an independent third party, which provided a statistical analysis comparing the Portfolios’ investment performance, expenses, and fees to comparable funds underlying variable insurance products (the “Performance Universe”). In addition, the Independent Trustees met separately with a representative of Bobroff Consulting, Inc., an independent consultant (“Bobroff), at a special board meeting in September 2013, to review the separate reports prepared by such consultant (“Bobroff Report”), which analyzed the report prepared by Lipper. The Board also considered each Portfolio’s more recent performance subsequent to the performance period covered by the Lipper reports, and management’s discussion of the same, including the effect of current market conditions on each Portfolio’s more recent performance.
The Board reviewed the Portfolios’ performance records and the Adviser’s management styles and long-term performance records with the Portfolios and comparable funds. The Board focused particular attention on Portfolios with less favorable performance records. The Board noted that the Adviser has been active in monitoring and responding to any performance issues with respect to the Portfolios. The Board also took into account its discussions with management regarding factors that contributed to the performance of the Portfolios.
Among other data relating specifically to the MetLife Conservative Allocation Portfolio’s performance, the Board considered that the Portfolio underperformed the median of its Performance Universe and its Lipper Index for the one- and three-year periods ended June 30, 2013. The Board also considered that the Portfolio outperformed the median of its Performance Universe and its Lipper Index for the five-year period ended June 30, 2013. The Board further considered that the Portfolio outperformed the Conservative AA Broad Index for the one- and five-year periods ended October 31, 2013 and underperformed its benchmark for the three-year period ended October 31, 2013.
Fees and Expenses. The Board gave consideration to the advisory fees payable under the Advisory Agreement. In this regard, the Board reviewed the advisory fees payable on a Portfolio-by-Portfolio basis based on information provided by the Adviser. The Independent Trustees, with the assistance of Bobroff, also examined the fees paid by a Portfolio in light of fees paid to other investment managers by comparable funds, as well as considered the fees charged by the Adviser to manage other comparable funds, as applicable. The Lipper report included comparisons of the Adviser’s fee schedule with that of its peers based on an asset-based analysis of relative fee structures according to the size of the Portfolio. In addition, the Board considered the Portfolios’ advisory fees and total expenses as compared to similarly situated investment companies underlying variable insurance products deemed to be comparable to the Portfolios as determined by Lipper. The Board considered a Portfolio’s ranking within a smaller group of peer funds chosen by Lipper (the “Expense Group”), as well as the Portfolio’s ranking within broader groups of funds (the “Expense Universe”). In comparing a Portfolio’s actual and contractual management fee to that of comparable funds, the Board noted that such fee includes both advisory and administrative fees. The Board also considered that the Adviser had entered into expense limitation agreements with certain of the Portfolios, pursuant to which the Adviser has agreed to waive a portion of its advisory fee and/or reimburse certain expenses as a means of limiting a Portfolio’s total annual operating expenses.
With respect to the MetLife Conservative Allocation Portfolio, the Board considered that the Portfolio’s actual management fees and total expenses (exclusive of 12b-1 fees) were below the Expense Group median and Expense Universe median. The Board further noted that the Portfolio’s contractual management fees were below the asset-weighted average of the Expense Group at the Portfolio’s current size. The Board also took into account that the Adviser had waived fees and/or reimbursed expenses during the past year.
Profitability. The Board examined the profitability of the Adviser on a Portfolio-by-Portfolio basis. With respect to the Asset Allocation Portfolios, the Board noted that the advisory fee is in addition to the fees received by the Adviser and its affiliates with regard to the Underlying Portfolios in which the Asset Allocation Portfolios may invest. In considering the profitability to the Adviser from the Asset Allocation Portfolios, the Board took into consideration the profitability to the Adviser of the funds underlying the Asset Allocation Portfolios. The Board also considered that the Distributor, MetLife Investors Distribution Company, receives Rule 12b-1 payments to support the distribution of the products.
MSF-19
Metropolitan Series Fund
MetLife Conservative Allocation Portfolio
Board of Trustees’ Consideration of Advisory Agreement—(Continued)
Economies of scale. The Board also considered the effect of the Portfolios’ growth in size on their fees. The Board noted that the fee schedules for most of the Portfolios contain breakpoints that reduce the fee rate above specified asset levels. The Board noted those Portfolios that did not contain breakpoints in the advisory fee and took into account management’s discussion of the same. The Board noted that those Portfolios with advisory fee schedules containing breakpoints generally reflect the inclusion of breakpoints in the sub-advisory fee schedule for such Portfolios. The Board considered the effective fees under the Advisory Agreement for a Portfolio as a percentage of assets at different asset levels and possible economies of scale that may be realized if the assets of the Portfolio grow. Among other data, the Board examined the effect of a Portfolio’s growth in size on various fee schedules and reviewed the Lipper and Bobroff Reports, which compared fees among peers. The Board also generally noted that if a Portfolio’s assets increase over time, the Portfolio may realize other economies of scale if assets increase proportionally more than certain other fixed expenses. In addition, the Board noted that the Adviser had taken a number of steps to date intended to share the benefits of economies of scale with contractholders.
With respect to the MetLife Conservative Allocation Portfolio, the Board noted that the Portfolio’s advisory fee contains breakpoints that reduce the advisory fee rate on assets above certain specified asset levels. The Board considered the fact that the Portfolio’s fee levels decline as portfolio assets increase.
Other factors. As part of its evaluation of the Adviser’s compensation, the Board considered other benefits that may be realized by the Adviser and its affiliates from their relationship with the Trusts. Among them, the Board recognized that an affiliate of the Adviser, MetLife Investors Distribution Company, serves as the Distributor for the Trusts, and, as such, receives payments pursuant to Rule 12b-1 from the Portfolios to compensate it for providing shareholder services and selling activities, which could lead to growth in the Trusts’ assets and corresponding benefits from such growth, including economies of scale. The Board also considered that affiliates of the Adviser may benefit from certain indirect tax benefits relating to dividend received deductions and foreign tax credits. In conjunction with these considerations, the Board noted the costs of providing investment management and other services to the Portfolios and the ongoing commitment of the Adviser to the Portfolios.
The Board considered possible conflicts of interest in the form of material benefits or detriments to the Trusts resulting from the nature of the Trusts’ and the Adviser’s affiliations and the services that are provided to the Trusts, and the manner in which such conflicts were mitigated.
Conclusions. After full consideration of the factors discussed above, the Board, including a majority of the Independent Trustees, approved the Advisory Agreement and the Sub-Advisory Agreement, as applicable, with respect to each Portfolio, unless otherwise noted. In making its approvals, the Board concluded that the nature, extent and quality of services provided by the Adviser supported the renewal of the Agreements. The Board also concluded that the investment performance of each Fund was such that each Agreement should continue. In addition, the Board concluded that fees paid by a Portfolio to the Adviser appeared to be acceptable in light of nature, extent and quality of the services provided by the Adviser. Further, the Board concluded that the Adviser’s profitability in providing services under the Advisory Agreements did not appear unreasonably high in light of the nature, extent and quality of the services provided by the Adviser. Finally, the Board concluded that the Advisory fees in some measure share economies of scale with contractholders. In approving the renewal of each of the Agreements, the Board, including the Independent Trustees, did not identify any single factor as controlling, and generally attributed different weights to various factors for the various Portfolios. The Board evaluated all information available to them on a Portfolio-by-Portfolio basis, and their decisions were made separately with respect to each Portfolio.
MSF-20
Metropolitan Series Fund
MetLife Conservative to Moderate Allocation Portfolio
Managed by MetLife Advisers, LLC
Portfolio Manager Commentary*
PERFORMANCE
For the one year period ended December 31, 2013, the Class A and B shares of the MetLife Conservative to Moderate Allocation Portfolio returned 11.20% and 10.92%, respectively. The Portfolio’s benchmark, the Dow Jones Moderately Conservative Index1, returned 8.13%.
MARKET ENVIRONMENT / CONDITIONS
Global economic expansion was in low gear through much of 2013, becoming more bifurcated in the second half of the year. Developed economies continued to strengthen whereas emerging markets faced the dual challenges of slowing growth and tighter global financial conditions. In the U.S., equity markets rallied in the first quarter but experienced a sharp decline in May and June when the Federal Reserve (the “Fed”) hinted at the possibility of reducing its unprecedented bond-buying program. This announcement subsequently sent global markets into a plunge. Domestically, Treasury yields rose while credit spreads widened. The dollar rallied and Treasury Inflation Protected Securities (“TIPS”) posted a substantial loss on reduced inflation expectations. Emerging markets sold off while their currencies tumbled against the U.S. dollar. Volatility spiked in bond and currency markets. The Fed’s accommodative language and policy stance boosted risk appetite in the third quarter and sent investors back into risk assets. Equity performance was strong both domestically and outside of the U.S. Credit spreads tightened, resulting in solid excess returns in both investment grade and high yield bond sectors. Volatility came down significantly in both equity and rate markets following the late September Federal Open Market Committee decision not to pare back the Fed’s asset-purchasing program. Economic reports that came out in the fourth quarter indicated robust domestic growth which in turn boosted investor confidence and made the looming taper even more likely. In December, reduced fiscal drag, falling unemployment and stronger economic growth prompted the Fed to announce a $10 billion reduction in the level of its asset-buying program starting in January 2014, causing stock markets to rally sharply on the news.
The vast majority of global equity markets concluded the year in record territories, supported by accommodative monetary policies around the world. The U.S. equity market outperformed the rest of the world with the S&P 500 Index up 32.4%, trailed by Japan (27.2%), Europe (25.2%), and Asia-Pacific ex-Japan (5.5%), as reported by MSCI. Within U.S. equity markets, smaller cap names generally delivered a better performance than their large cap counterparts. Growth stocks modestly outpaced value stocks over the trailing one year period, most prominently in the small cap space. In terms of sectors, Consumer Discretionary, Health Care, and Industrials proved to be the best performing sectors, while Telecom and Utility stocks trailed. Emerging market equities, however, produced a moderately negative return in 2013 after an impressive 2012. Growing signs of strength in the U.S. economy raised speculation that the Fed would start reducing its stimulus sooner than anticipated. Disappointing economic data across the developing world also reduced investors’ risk appetite as the year progressed.
Within fixed income, interest rate risk drove the majority of domestic bond sectors into negative territory, especially in longer dated securities as the yield curve steepened. High Yield Credit was the only bright spot with a positive 7.4% return for the year. Investors’ demand for additional yield provided steady support for high yield issues throughout 2013, and resulted in meaningful spread narrowing. Internationally, peripheral European debt enjoyed double digit returns for U.S. investors stemming from the combination of positive local returns and the euro strengthening against the dollar. On the other extreme, the Barclays Global Japan Index fell 16.0%, driven entirely by a large currency depreciation induced by Japan’s Prime Minister Shinzo Abe. With Japan being the largest component of the Barclays Global Aggregate ex-U.S. Index, the Index as a whole was down 3.1% for the year. Similar to the equity side, emerging market debt struggled and produced a negative return in 2013, due largely to weak emerging market currencies vis-à-vis the dollar.
PORTFOLIO REVIEW / PERIOD END POSITIONING
The MetLife Conservative to Moderate Allocation Portfolio invested in underlying portfolios of the Met Investors Series Trust and the Metropolitan Series Fund to maintain a broad asset allocation of approximately 40% to equities and 60% to fixed income. The Portfolio’s large fixed income position (60%) restrained absolute performance during the full twelve month period when stocks significantly outperformed bonds. However, on a relative basis, performance was comfortably ahead of its benchmark index, the Dow Jones Moderately Conservative Index. Outperformance was attributable to a combination of asset class exposures and favorable security selection in the underlying portfolios. From an asset class exposure perspective, a moderate overweight to high yield bonds due to the opportunistic positioning of the core bond managers along with a slight overweight to equity compared to the benchmark contributed positively to relative performance.
Within the fixed income portion of the Portfolio, not surprisingly, the PIMCO Inflation Protected Bond Portfolio was the largest performance detractor given that TIPS was the worst performing fixed income segment during the year. That negative contribution was partially offset by positive contributions from several other underlying bond portfolios, including Western Asset Management U.S. Government Portfolio and Met/Templeton International Bond Portfolio. While the PIMCO Inflation Protected Bond Portfolio was largely an asset class story, the portfolios on the positive side were a successful security selection story in the sense that they generated a positive excess return relative to their respective asset class indices. The Western Asset Management U.S. Government Portfolio performed particularly well in the Mortgage-Backed Securities sector, an area in which it has been consistently adding value. The Met/Templeton International Bond Portfolio generated a large outperformance against its benchmark, driven primarily by the portfolio’s currency positioning. More specifically, a sizable underweight in Japanese yen proved to be the right decision as the yen tumbled against the dollar.
MSF-1
Metropolitan Series Fund
MetLife Conservative to Moderate Allocation Portfolio
Managed by MetLife Advisers, LLC
Portfolio Manager Commentary*—(Continued)
Domestic equity was the big winner in 2013. Not only did our U.S. equity portfolios generate the best absolute return relative to international equity and fixed income underlying portfolios, they also produced the best asset class specific excess return derived from solid stock selection. Outperformance was most pronounced in the large cap space across value and growth spectrum. The T. Rowe Price Large Cap Growth Portfolio was the leading contributor in the domestic equity space. The portfolio’s holdings in the Consumer Discretionary sector added substantially to the performance. Overweight positions in Priceline, Amazon, and Netflix all proved to be beneficial during 2013. Furthermore, a handful of Technology stocks, such as MasterCard and Google, also had a positive contribution. Other domestic equity portfolios that provided a strong contribution on the positive side included MFS Value Portfolio, Invesco Comstock Portfolio and ClearBridge Aggressive Growth Portfolio. The MFS Value Portfolio’s sector positioning, namely an underweight in the bottom performing Utilities sector combined with an overweight in the better performing Industrials sector benefited the portfolio. Additionally, its stock selection within the Financials sector was effective across a large number of names. Both the Invesco Comstock Portfolio’s and Jennison Growth Portfolio’s strong performance was driven by favorable stock selection. In contrast, several mid cap and small cap equity portfolios detracted from relative performance, however, to a lesser degree.
The results from the underlying international equity portfolios were mixed. The two portfolios that provide exposure to emerging markets and real estate investment trusts (“REITs”) generally have lower correlations with the rest of the equity market and therefore add diversification benefits to the Portfolio. Unfortunately, these two asset classes had a difficult year in 2013. As a result, MFS Emerging Markets Equity Portfolio and Clarion Global Real Estate Portfolio significantly hindered the overall performance. On a relative basis, while the Harris Oakmark International Portfolio produced the largest positive contribution among all equity portfolios, that positive effect was more than offset by the underperformance generated from several other international portfolios, especially the Clarion Global Real Estate Portfolio.
Investment Committee
MetLife Advisers, LLC
* This commentary may include statements that constitute “forward-looking statements” under the U.S. securities laws. Forward-looking statements include, among other things, projections, estimates, and information about possible or future results related to the Portfolio, market or regulatory developments. The views expressed above are not guarantees of future performance or economic results and involve certain risks, uncertainties and assumptions that could cause actual outcomes and results to differ materially from the views expressed herein. The views expressed above are subject to change at any time based upon economic, market, or other conditions and the advisory firm undertakes no obligation to update the views expressed herein. Any discussions of specific securities should not be considered a recommendation to buy or sell those securities. The views expressed above (including any forward-looking statement) may not be relied upon as investment advice or as an indication of the Portfolio’s trading intent. Information about the Portfolio’s holdings, asset allocation or country diversification is historical and is not an indication of future Portfolio composition, which may vary. Direct investment in any index is not possible. The performance of any index mentioned in this commentary has not been adjusted for ongoing management, distribution and operating expenses, and sales charges applicable to mutual fund investments. In addition, the returns do not reflect additional fees charged by separate accounts or variable insurance contracts that an investor in the Portfolio may pay. If these additional fees were reflected, performance would have been lower.
MSF-2
Metropolitan Series Fund
MetLife Conservative to Moderate Allocation Portfolio
A $10,000 INVESTMENT COMPARED TO THE DOW JONES MODERATELY CONSERVATIVE INDEX

AVERAGE ANNUAL RETURNS (%) (FOR THE YEAR ENDED DECEMBER 31, 2013)
| | | | | | | | | | | | |
| | | 1 Year | | | 5 Year | | | Since Inception2 | |
| MetLife Conservative to Moderate Allocation Portfolio | | | | | | | | | | | | |
Class A | | | 11.20 | | | | 11.77 | | | | 6.18 | |
Class B | | | 10.92 | | | | 11.50 | | | | 5.91 | |
| Dow Jones Moderately Conservative Index | | | 8.13 | | | | 9.45 | | | | 5.85 | |
1 The Dow Jones Moderately Conservative Index is a total returns index designed to provide asset allocation strategists with a target risk benchmark. Each month, the Index adjusts its weighting of stocks, bonds, and cash indices (both domestic and foreign) from Barclays and Dow Jones such that the risk combination will have 40% of the risk of an all equity portfolio.
2 Inception date of the Class A and Class B shares is 5/2/05. Index since inception return is based on the Portfolio’s inception date.
Portfolio performance is calculated including reinvestment of all income and capital gain distributions. Performance numbers are net of all Portfolio expenses but do not include any insurance, sales, separate account or administrative charges of variable annuity or life insurance contracts or any additional expenses that participants may bear relating to the operations of their plans. If these charges were included, the returns would be lower. The performance of any index referenced above has not been adjusted for ongoing management, distribution and operating expenses, and sales charges applicable to mutual fund investments. Direct investment in any index is not possible. The performance of Class A shares, as set forth in the line graph above, will differ from that of other classes because of the difference in expenses paid by policyholders investing in the different share classes.
This information represents past performance and is not indicative of future results. Investment return and principal value may fluctuate so that shares, upon redemption, may be worth more or less than the original cost.
PORTFOLIO COMPOSITION AS OF DECEMBER 31, 2013
Top Holdings
| | | | |
| | | % of
Net Assets | |
| PIMCO Total Return Portfolio (Class A) | | | 14.8 | |
| BlackRock Bond Income Portfolio (Class A) | | | 9.4 | |
| Western Asset Management U.S. Government Portfolio (Class A) | | | 8.8 | |
| PIMCO Inflation Protected Bond Portfolio (Class A) | | | 6.7 | |
| JPMorgan Core Bond Portfolio (Class A) | | | 6.3 | |
| MFS Value Portfolio (Class A) | | | 4.7 | |
| T. Rowe Price Large Cap Value Portfolio (Class A) | | | 4.6 | |
| Met/Franklin Low Duration Total Return Portfolio (Class A) | | | 4.0 | |
| WMC Core Equity Opportunities Portfolio (formerly Davis Venture Value Portfolio) (Class A) | | | 3.1 | |
| Invesco Comstock Portfolio (Class A) | | | 3.1 | |
MSF-3
Metropolitan Series Fund
MetLife Conservative to Moderate Allocation Portfolio
Understanding Your Portfolio’s Expenses
Shareholder Expense Example
As a shareholder of the Portfolio, you incur ongoing costs, including management fees; distribution and service (12b-1) fees; and other Portfolio expenses. This example is intended to help you understand your ongoing costs (in dollars) (referred to as “expenses”) of investing in the Portfolio and compare these costs with the ongoing costs of investing in other mutual funds. The example is based on an investment of $1,000 invested at the beginning of the period and held for the entire period, July 1, 2013 through December 31, 2013.
Actual Expenses
The first line for each share class of the Portfolio in the table below provides information about actual account values and actual expenses. You may use the information in this line, together with the amount you invested in the particular share class of the Portfolio, to estimate the expenses that you paid over the period. Simply divide your account value by $1,000 (for example, an $8,600 account value divided by $1,000 = 8.6), then multiply the result by the number in the first line under the heading entitled “Expenses Paid During Period” to estimate the expenses you paid on your account during this period.
Hypothetical Example for Comparison Purposes
The second line for each share class of the Portfolio in the table below provides information about hypothetical account values and hypothetical expenses based on the Portfolio’s actual expense ratio and an assumed rate of return of 5% per year before expenses, which is not the Portfolio’s actual return. The hypothetical account values and expenses may not be used to estimate the actual ending account balance or expenses you paid for the period. You may use this information to compare the ongoing costs of investing in the Portfolio and other funds. To do so, compare this 5% hypothetical example with the 5% hypothetical examples that appear in the shareholder reports of the other funds.
Please note that the expenses shown in the table are meant to highlight your ongoing costs only and do not reflect any fees or charges of your variable insurance product or any additional expenses that participants in certain eligible qualified plans may bear relating to the operations of their plan. Therefore, the second line for each share class in the table is useful in comparing ongoing costs only, and will not help you determine the relative total costs of owning different funds. In addition, if these other costs were included, your costs would have been higher.
| | | | | | | | | | | | | | | | | | |
MetLife Conservative to Moderate Allocation Portfolio | | | | Annualized
Expense
Ratio | | | Beginning
Account Value
July 1,
2013 | | | Ending
Account Value
December 31,
2013 | | | Expenses Paid
During Period**
July 1, 2013
to
December 31,
2013 | |
Class A(a) | | Actual | | | 0.66 | % | | $ | 1,000.00 | | | $ | 1,075.30 | | | $ | 3.45 | |
| | Hypothetical* | | | 0.66 | % | | $ | 1,000.00 | | | $ | 1,021.88 | | | $ | 3.36 | |
| | | | | |
Class B(a) | | Actual | | | 0.91 | % | | $ | 1,000.00 | | | $ | 1,074.20 | | | $ | 4.76 | |
| | Hypothetical* | | | 0.91 | % | | $ | 1,000.00 | | | $ | 1,020.62 | | | $ | 4.63 | |
* Hypothetical assumes a rate of return of 5% per year before expenses.
** Expenses paid are equal to the Portfolio’s annualized expense ratio for the most recent six month period, as shown above, multiplied by the average account value over the period, multiplied by the number of days (184 days) in the most recent fiscal half-year, divided by 365 (to reflect the one-half year period).
(a) The annualized expense ratio reflects the expenses of both the Portfolio and the Underlying Portfolios in which it invests.
MSF-4
Metropolitan Series Fund
MetLife Conservative to Moderate Allocation Portfolio
Schedule of Investments as of December 31, 2013
Mutual Funds—100.0% of Net Assets
| | | | | | | | |
| Security Description | | Shares | | | Value | |
|
Affiliated Investment Companies—100.0% | |
Baillie Gifford International Stock Portfolio (Class A) (a) | | | 3,499,409 | | | $ | 36,883,771 | |
BlackRock Bond Income Portfolio (Class A) (a) | | | 1,557,182 | | | | 167,132,330 | |
BlackRock Capital Appreciation Portfolio (Class A) (a) | | | 990,300 | | | | 37,482,857 | |
BlackRock High Yield Portfolio
(Class A) (b) | | | 1,422,298 | | | | 12,615,781 | |
BlackRock Large Cap Value Portfolio (Class A) (a) | | | 3,065,295 | | | | 36,844,845 | |
Clarion Global Real Estate Portfolio (Class A) (b) | | | 1,568,400 | | | | 17,471,980 | |
ClearBridge Aggressive Growth Portfolio (Class A) (b) | | | 1,380,024 | | | | 18,561,317 | |
Goldman Sachs Mid Cap Value Portfolio (Class A) (b) | | | 1,039,162 | | | | 18,455,509 | |
Harris Oakmark International Portfolio (Class A) (b) | | | 2,389,106 | | | | 45,703,589 | |
Invesco Comstock Portfolio
(Class A) (b) | | | 3,805,416 | | | | 55,482,962 | |
Invesco Small Cap Growth Portfolio (Class A) (b) | | | 1,807,941 | | | | 37,117,019 | |
Jennison Growth Portfolio (Class A) (a) | | | 1,762,477 | | | | 27,882,386 | |
JPMorgan Core Bond Portfolio
(Class A) (b) | | | 11,007,462 | | | | 111,945,889 | |
JPMorgan Small Cap Value Portfolio (Class A) (b) | | | 461,918 | | | | 9,206,019 | |
Lord Abbett Bond Debenture Portfolio (Class A) (b) | | | 930,138 | | | | 12,603,374 | |
Met/Artisan Mid Cap Value Portfolio (Class A) (a) | | | 68,472 | | | | 18,391,665 | |
Met/Eaton Vance Floating Rate Portfolio (Class A) (b) | | | 3,342,055 | | | | 35,526,047 | |
Met/Franklin Low Duration Total Return Portfolio (Class A) (b) | | | 7,018,649 | | | | 70,677,797 | |
Met/Templeton International Bond Portfolio (Class A) (b) | | | 4,520,341 | | | | 52,978,400 | |
MFS Emerging Markets Equity Portfolio (Class A) (b) | | | 1,687,237 | | | | 17,496,644 | |
MFS Research International Portfolio (Class A) (b) | | | 2,284,354 | | | | 27,435,088 | |
MFS Value Portfolio (Class A) (a) | | | 4,694,365 | | | | 83,324,985 | |
Neuberger Berman Genesis Portfolio (Class A) (a) | | | 1,015,597 | | | | 18,422,927 | |
|
Affiliated Investment Companies—(Continued) | |
PIMCO Inflation Protected Bond Portfolio (Class A) (b) | | | 11,939,482 | | | | 118,797,846 | |
PIMCO Total Return Portfolio
(Class A) (b) | | | 22,207,312 | | | | 263,600,798 | |
T. Rowe Price Large Cap Growth Portfolio (Class A) (a) | | | 1,893,047 | | | | 46,398,571 | |
T. Rowe Price Large Cap Value Portfolio (Class A) (b) | | | 2,576,002 | | | | 82,818,477 | |
T. Rowe Price Mid Cap Growth Portfolio (Class A) (b) | | | 1,503,974 | | | | 18,483,841 | |
Third Avenue Small Cap Value Portfolio (Class A) (b) | | | 1,315,291 | | | | 27,673,729 | |
Van Eck Global Natural Resources Portfolio (Class A) (a) | | | 1,263,823 | | | | 17,958,924 | |
Western Asset Management Strategic Bond Opportunities Portfolio
(Class A) (a) | | | 2,116,592 | | | | 28,468,168 | |
Western Asset Management U.S. Government Portfolio (Class A) (a) | | | 13,089,672 | | | | 157,206,956 | |
WMC Core Equity Opportunities Portfolio (formerly Davis Venture Value Portfolio) (Class A) (a) | | | 1,293,728 | | | | 55,591,504 | |
| | | | | | | | |
Total Mutual Funds
(Cost $1,572,215,168) | | | | | | | 1,786,641,995 | |
| | | | | | | | |
Total Investments—100.0% (Cost $1,572,215,168) (c) | | | | | | | 1,786,641,995 | |
Other assets and liabilities (net)—0.0% | | | | | | | (533,883 | ) |
| | | | | | | | |
| Net Assets—100.0% | | | | | | $ | 1,786,108,112 | |
| | | | | | | | |
| (a) | A Portfolio of Metropolitan Series Fund. (See Note 6 of the Notes to Financial Statements for a summary of transactions in the securities of affiliated issuers.) |
| (b) | A Portfolio of Met Investors Series Trust. (See Note 6 of the Notes to Financial Statements for a summary of transactions in the securities of affiliated issuers.) |
| (c) | As of December 31, 2013, the aggregate cost of investments for federal income tax purposes was $1,586,962,259. The aggregate unrealized appreciation and depreciation of investments were $217,594,163 and $(17,914,427), respectively, resulting in net unrealized appreciation of $199,679,736 for federal income tax purposes. |
See accompanying notes to financial statements.
MSF-5
Metropolitan Series Fund
MetLife Conservative to Moderate Allocation Portfolio
Schedule of Investments as of December 31, 2013
Fair Value Hierarchy
Accounting principles generally accepted in the United States of America (“GAAP”) define fair market value as the price that the Portfolio would receive to sell an asset or pay to transfer a liability in an orderly transaction between market participants at the measurement date. It establishes a fair value hierarchy that prioritizes inputs to valuation methods and requires disclosure of the fair value hierarchy that segregates fair value measurements into three levels. Levels 1, 2 and 3 of the fair value hierarchy are defined as follows:
Level 1- unadjusted quoted prices in active markets for identical investments
Level 2 - other significant observable inputs (including, but not limited to, unadjusted quoted prices for similar investments in markets that are either active or inactive; inputs other than quoted prices that are observable such as interest rates, yield curves, volatilities, prepayment speeds, loss severities, credit risks, default rates, etc.)
Level 3 - significant unobservable inputs based on the best information available in the circumstances, to the extent observable inputs are unavailable (including the Portfolio’s own assumptions in determining the fair value of investments)
The inputs or methodologies used for valuing investments are not necessarily an indication of the risk associated with investing in them. Changes to the inputs or methodologies used may result in transfers between levels, which will be recognized as of the beginning of the reporting period. Information on transfers between Level 1 and Level 2, if any, will be disclosed following the fair value hierarchy table below. A reconciliation of Level 3 securities, if any, will also be disclosed following the fair value hierarchy table. For more information about the Portfolio’s policy regarding the valuation of investments, please refer to the Notes to Financial Statements.
The following table summarizes the fair value hierarchy of the Portfolio’s investments as of December 31, 2013:
| | | | | | | | | | | | | | | | |
| Description | | Level 1 | | | Level 2 | | | Level 3 | | | Total | |
| Mutual Funds | | | | | | | | | | | | | | | | |
Affiliated Investment Companies | | $ | 1,786,641,995 | | | $ | — | | | $ | — | | | $ | 1,786,641,995 | |
Total Investments | | $ | 1,786,641,995 | | | $ | — | | | $ | — | | | $ | 1,786,641,995 | |
| | | | | | | | | | | | | | | | | |
See accompanying notes to financial statements.
MSF-6
Metropolitan Series Fund
MetLife Conservative to Moderate Allocation Portfolio
Statement of Assets and Liabilities
December 31, 2013
| | | | |
Assets | | | | |
Affiliated investments at value (a) | | $ | 1,786,641,995 | |
Receivable for: | | | | |
Investments sold | | | 166,263 | |
Fund shares sold | | | 573,834 | |
| | | | |
Total Assets | | | 1,787,382,092 | |
Liabilities | | | | |
Payables for: | | | | |
Investments purchased | | | 97,794 | |
Fund shares redeemed | | | 642,303 | |
Accrued expenses: | | | | |
Management fees | | | 107,160 | |
Distribution and service fees | | | 354,036 | |
Deferred trustees’ fees | | | 48,554 | |
Other expenses | | | 24,133 | |
| | | | |
Total Liabilities | | | 1,273,980 | |
| | | | |
Net Assets | | $ | 1,786,108,112 | |
| | | | |
Net assets consist of: | | | | |
Paid in surplus | | $ | 1,471,889,567 | |
Undistributed net investment income | | | 50,366,350 | |
Accumulated net realized gain | | | 49,425,368 | |
Unrealized appreciation on affiliated investments | | | 214,426,827 | |
| | | | |
Net Assets | | $ | 1,786,108,112 | |
| | | | |
Net Assets | | | | |
Class A | | $ | 107,738,919 | |
Class B | | | 1,678,369,193 | |
Capital Shares Outstanding* | | | | |
Class A | | | 8,292,669 | |
Class B | | | 130,214,189 | |
Net Asset Value, Offering Price and Redemption Price Per Share | | | | |
Class A | | $ | 12.99 | |
Class B | | | 12.89 | |
| * | The Portfolio is authorized to issue an unlimited number of shares. |
| (a) | Identified cost of affiliated investments was $1,572,215,168. |
Statement of Operations
Year Ended December 31, 2013
| | | | |
Investment Income | | | | |
Dividends from Affiliated Underlying Portfolios | | $ | 42,801,691 | |
| | | | |
Total investment income | | | 42,801,691 | |
Expenses | | | | |
Management fees | | | 1,257,589 | |
Administration fees | | | 12,520 | |
Custodian and accounting fees | | | 25,120 | |
Distribution and service fees—Class B | | | 4,153,917 | |
Audit and tax services | | | 27,722 | |
Legal | | | 56,954 | |
Trustees’ fees and expenses | | | 35,359 | |
Miscellaneous | | | 8,654 | |
| | | | |
Total expenses | | | 5,577,835 | |
| | | | |
Net Investment Income | | | 37,223,856 | |
| | | | |
Net Realized and Unrealized Gain | | | | |
| Net realized gain on: | | | | |
Affiliated investments | | | 59,294,685 | |
Capital gain distributions from Affiliated Underlying Portfolios | | | 26,401,775 | |
| | | | |
Net realized gain | | | 85,696,460 | |
| | | | |
Net change in unrealized appreciation on affiliated investments | | | 59,784,094 | |
| | | | |
Net realized and unrealized gain | | | 145,480,554 | |
| | | | |
Net Increase in Net Assets From Operations | | $ | 182,704,410 | |
| | | | |
See accompanying notes to financial statements.
MSF-7
Metropolitan Series Fund
MetLife Conservative to Moderate Allocation Portfolio
Statements of Changes in Net Assets
| | | | | | | | |
| | | Year Ended
December 31,
2013 | | | Year Ended
December 31,
2012 | |
Increase (Decrease) in Net Assets: | | | | | | | | |
From Operations | | | | | | | | |
Net investment income | | $ | 37,223,856 | | | $ | 36,425,965 | |
Net realized gain | | | 85,696,460 | | | | 30,416,972 | |
Net change in unrealized appreciation | | | 59,784,094 | | | | 113,534,991 | |
| | | | | | | | |
Increase in net assets from operations | | | 182,704,410 | | | | 180,377,928 | |
| | | | | | | | |
From Distributions to Shareholders | | | | | | | | |
Net investment income | | | | | | | | |
Class A | | | (2,796,845 | ) | | | (2,776,843 | ) |
Class B | | | (41,855,943 | ) | | | (45,718,404 | ) |
Net realized capital gains | | | | | | | | |
Class A | | | (1,053,884 | ) | | | (277,684 | ) |
Class B | | | (17,273,881 | ) | | | (4,946,143 | ) |
| | | | | | | | |
Total distributions | | | (62,980,553 | ) | | | (53,719,074 | ) |
| | | | | | | | |
Increase (decrease) in net assets from capital share transactions | | | (48,986,259 | ) | | | 5,332,912 | |
| | | | | | | | |
Total increase in net assets | | | 70,737,598 | | | | 131,991,766 | |
| | |
Net Assets | | | | | | | | |
Beginning of period | | | 1,715,370,514 | | | | 1,583,378,748 | |
| | | | | | | | |
End of period | | $ | 1,786,108,112 | | | $ | 1,715,370,514 | |
| | | | | | | | |
| | |
Undistributed Net Investment Income | | | | | | | | |
End of period | | $ | 50,366,350 | | | $ | 44,421,842 | |
| | | | | | | | |
Other Information:
Capital Shares
Transactions in capital shares were as follows:
| | | | | | | | | | | | | | | | |
| | | Year Ended
December 31, 2013 | | | Year Ended
December 31, 2012 | |
| | | Shares | | | Value | | | Shares | | | Value | |
Class A | | | | | | | | | | | | | | | | |
Sales | | | 1,772,088 | | | $ | 22,163,090 | | | | 1,526,616 | | | $ | 17,878,512 | |
Reinvestments | | | 317,717 | | | | 3,850,729 | | | | 266,074 | | | | 3,054,527 | |
Redemptions | | | (1,815,178 | ) | | | (22,693,095 | ) | | | (1,311,723 | ) | | | (15,356,898 | ) |
| | | | | | | | | | | | | | | | |
Net increase | | | 274,627 | | | $ | 3,320,724 | | | | 480,967 | | | $ | 5,576,141 | |
| | | | | | | | | | | | | | | | |
Class B | | | | | | | | | | | | | | | | |
Sales | | | 8,148,498 | | | $ | 101,089,311 | | | | 10,785,396 | | | $ | 124,647,869 | |
Reinvestments | | | 4,911,115 | | | | 59,129,824 | | | | 4,440,364 | | | | 50,664,547 | |
Redemptions | | | (17,141,715 | ) | | | (212,526,118 | ) | | | (15,056,933 | ) | | | (175,555,645 | ) |
| | | | | | | | | | | | | | | | |
Net increase (decrease) | | | (4,082,102 | ) | | $ | (52,306,983 | ) | | | 168,827 | | | $ | (243,229 | ) |
| | | | | | | | | | | | | | | | |
Increase (decrease) derived from capital shares transactions | | | | | | $ | (48,986,259 | ) | | | | | | $ | 5,332,912 | |
| | | | | | | | | | | | | | | | |
See accompanying notes to financial statements.
MSF-8
Metropolitan Series Fund
MetLife Conservative to Moderate Allocation Portfolio
Financial Highlights
| | | | | | | | | | | | | | | | | | | | |
| Selected per share data | | | | | | | | | | | | | | | |
| | | Class A | |
| | | Year Ended December 31, | |
| | | 2013 | | | 2012 | | | 2011 | | | 2010 | | | 2009 | |
Net Asset Value, Beginning of Period | | $ | 12.14 | | | $ | 11.25 | | | $ | 11.36 | | | $ | 10.54 | | | $ | 8.91 | |
| | | | | | | | | | | | | | | | | | | | |
Income (Loss) from Investment Operations | | | | | | | | | | | | | | | | | | | | |
Net investment income (a) | | | 0.29 | | | | 0.28 | | | | 0.29 | | | | 0.28 | | | | 0.41 | |
Net realized and unrealized gain (loss) on investments | | | 1.04 | | | | 1.02 | | | | (0.14 | ) | | | 0.94 | | | | 1.63 | |
| | | | | | | | | | | | | | | | | | | | |
Total from investment operations | | | 1.33 | | | | 1.30 | | | | 0.15 | | | | 1.22 | | | | 2.04 | |
| | | | | | | | | | | | | | | | | | | | |
Less Distributions | | | | | | | | | | | | | | | | | | | | |
Distributions from net investment income | | | (0.35 | ) | | | (0.37 | ) | | | (0.26 | ) | | | (0.40 | ) | | | (0.34 | ) |
Distributions from net realized capital gains | | | (0.13 | ) | | | (0.04 | ) | | | 0.00 | | | | 0.00 | | | | (0.07 | ) |
| | | | | | | | | | | | | | | | | | | | |
Total distributions | | | (0.48 | ) | | | (0.41 | ) | | | (0.26 | ) | | | (0.40 | ) | | | (0.41 | ) |
| | | | | | | | | | | | | | | | | | | | |
Net Asset Value, End of Period | | $ | 12.99 | | | $ | 12.14 | | | $ | 11.25 | | | $ | 11.36 | | | $ | 10.54 | |
| | | | | | | | | | | | | | | | | | | | |
Total Return (%) (b) | | | 11.20 | | | | 11.74 | | | | 1.27 | | | | 11.78 | | | | 24.00 | |
| | | | | |
Ratios/Supplemental Data | | | | | | | | | | | | | | | | | | | | |
Gross ratio of expenses to average net assets (%) (c) | | | 0.08 | | | | 0.08 | | | | 0.08 | | | | 0.10 | | | | 0.10 | |
Net ratio of expenses to average net assets (%) (c) (d) | | | 0.08 | | | | 0.08 | | | | 0.08 | | | | 0.10 | | | | 0.10 | |
Ratio of net investment income to average net assets (%) (e) | | | 2.31 | | | | 2.37 | | | | 2.50 | | | | 2.64 | | | | 4.30 | |
Portfolio turnover rate (%) | | | 15 | | | | 10 | | | | 32 | | | | 16 | | | | 26 | |
Net assets, end of period (in millions) | | $ | 107.7 | | | $ | 97.3 | | | $ | 84.8 | | | $ | 86.2 | | | $ | 70.3 | |
| |
| | | Class B | |
| | | Year Ended December 31, | |
| | | 2013 | | | 2012 | | | 2011 | | | 2010 | | | 2009 | |
Net Asset Value, Beginning of Period | | $ | 12.05 | | | $ | 11.17 | | | $ | 11.28 | | | $ | 10.47 | | | $ | 8.85 | |
| | | | | | | | | | | | | | | | | | | | |
Income (Loss) from Investment Operations | | | | | | | | | | | | | | | | | | | | |
Net investment income (a) | | | 0.26 | | | | 0.25 | | | | 0.24 | | | | 0.25 | | | | 0.38 | |
Net realized and unrealized gain (loss) on investments | | | 1.03 | | | | 1.01 | | | | (0.11 | ) | | | 0.94 | | | | 1.62 | |
| | | | | | | | | | | | | | | | | | | | |
Total from investment operations | | | 1.29 | | | | 1.26 | | | | 0.13 | | | | 1.19 | | | | 2.00 | |
| | | | | | | | | | | | | | | | | | | | |
Less Distributions | | | | | | | | | | | | | | | | | | | | |
Distributions from net investment income | | | (0.32 | ) | | | (0.34 | ) | | | (0.24 | ) | | | (0.38 | ) | | | (0.31 | ) |
Distributions from net realized capital gains | | | (0.13 | ) | | | (0.04 | ) | | | 0.00 | | | | 0.00 | | | | (0.07 | ) |
| | | | | | | | | | | | | | | | | | | | |
Total distributions | | | (0.45 | ) | | | (0.38 | ) | | | (0.24 | ) | | | (0.38 | ) | | | (0.38 | ) |
| | | | | | | | | | | | | | | | | | | | |
Net Asset Value, End of Period | | $ | 12.89 | | | $ | 12.05 | | | $ | 11.17 | | | $ | 11.28 | | | $ | 10.47 | |
| | | | | | | | | | | | | | | | | | | | |
Total Return (%) (b) | | | 10.92 | | | | 11.46 | | | | 1.05 | | | | 11.53 | | | | 23.68 | |
| | | | | |
Ratios/Supplemental Data | | | | | | | | | | | | | | | | | | | | |
Gross ratio of expenses to average net assets (%) (c) | | | 0.33 | | | | 0.33 | | | | 0.33 | | | | 0.35 | | | | 0.35 | |
Net ratio of expenses to average net assets (%) (c) (d) | | | 0.33 | | | | 0.33 | | | | 0.33 | | | | 0.35 | | | | 0.35 | |
Ratio of net investment income to average net assets (%) (e) | | | 2.10 | | | | 2.16 | | | | 2.16 | | | | 2.31 | | | | 4.08 | |
Portfolio turnover rate (%) | | | 15 | | | | 10 | | | | 32 | | | | 16 | | | | 26 | |
Net assets, end of period (in millions) | | $ | 1,678.4 | | | $ | 1,618.0 | | | $ | 1,498.6 | | | $ | 1,364.2 | | | $ | 1,022.4 | |
| (a) | Per share amounts based on average shares outstanding during the period. |
| (b) | Total return does not reflect any insurance, sales, separate account or administrative charges of variable annuity or life insurance contracts or any additional expenses that contract owners may bear under their variable contracts. If these charges were included, the returns would be lower. |
| (c) | The ratio of operating expenses to average net assets does not include expenses of the Underlying Portfolios in which the Portfolio invests. |
| (d) | Net ratio of expenses to average net assets includes the effect of the expense limitation agreement as detailed in Note 5 of the Notes to Financial Statements. |
| (e) | Recognition of net investment income by the Asset Allocation Portfolio is affected by the timing of the declaration of dividends by the Underlying Portfolios in which it invests. |
See accompanying notes to financial statements.
MSF-9
Metropolitan Series Fund
MetLife Conservative to Moderate Allocation Portfolio
Notes to Financial Statements—December 31, 2013
1. Organization
Metropolitan Series Fund (the “Trust”) is organized as a Delaware statutory trust and registered under the Investment Company Act of 1940, as amended (the “1940 Act”), as an open-end management investment company. The Trust is currently comprised of thirty series, each of which operates as a distinct investment vehicle of the Trust. The portfolio included in this report is MetLife Conservative to Moderate Allocation Portfolio (the “Asset Allocation Portfolio”), which is diversified. The Asset Allocation Portfolio operates under a “fund of funds” structure, investing substantially all of its assets in other Portfolios advised by MetLife Advisers, LLC (“MetLife Advisers”), an affiliate of MetLife, Inc., or its affiliates (each, an “Underlying Portfolio,” and, collectively, the “Underlying Portfolios”).
Shares in the Asset Allocation Portfolio are not offered directly to the general public and are currently available only to separate accounts established by Metropolitan Life Insurance Company (“MetLife”) and other affiliated life insurance companies.
The Asset Allocation Portfolio has registered and offers two classes of shares: Class A and B shares. Shares of each Class of the Asset Allocation Portfolio represent an equal pro rata interest in the Asset Allocation Portfolio and generally give the shareholder the same voting, dividend, liquidation, and other rights. Investment income, realized and unrealized capital gains and losses, the common expenses of the Asset Allocation Portfolio, and certain Asset Allocation Portfolio-level expense reductions, if any, are allocated on a pro rata basis to each Class based on the relative net assets of each Class to the net assets of the Asset Allocation Portfolio. Each Class of shares differs in its respective distribution plan and such distribution expenses are allocated to that Class.
2. Significant Accounting Policies
The preparation of financial statements in conformity with accounting principles generally accepted in the United States of America (“GAAP”) requires management to make estimates and assumptions that affect the reported amounts of assets and liabilities and disclosure of contingent assets and liabilities as of the date of the financial statements and the reported amounts of income and expenses during the reporting period. Actual results could differ from those estimates. In the preparation of these financial statements, management has evaluated events and transactions subsequent to December 31, 2013 through the date the financial statements were issued.
The following is a summary of significant accounting policies consistently followed by the Asset Allocation Portfolio in the preparation of its financial statements.
Investment Valuation and Fair Value Measurements - Investments in the Underlying Portfolios are valued at their closing daily net asset value on the valuation date. Investments in the Underlying Portfolios are categorized as Level 1 within the fair value hierarchy. For information about the use of fair value pricing by the Underlying Portfolios, please refer to the prospectuses of the Underlying Portfolios.
Investment Transactions and Related Investment Income - Asset Allocation Portfolio security transactions are recorded on the trade date. Dividend income is recorded on the ex-dividend date. Realized gains and losses on investments are determined on the identified cost basis, which is the same basis used for federal income tax purposes. Capital gains distributions received from the Underlying Portfolios are recorded as net realized gain in the Statement of Operations.
Income Taxes - It is the Asset Allocation Portfolio’s policy to comply with the requirements of the Internal Revenue Code of 1986, as amended, and regulations thereunder, applicable to regulated investment companies and to distribute, with respect to each taxable year, all of its taxable income to shareholders. Therefore, no federal income tax provision is required. The Asset Allocation Portfolio files U.S. federal tax returns. No income tax returns are currently under examination. The Asset Allocation Portfolio’s federal tax returns for the prior three fiscal years remain subject to examination by the Internal Revenue Service. As of December 31, 2013, the Portfolio had no uncertain tax positions that would require financial statement recognition, or de-recognition or disclosure.
Dividends and Distributions to Shareholders - The Asset Allocation Portfolio records dividends and distributions on the ex-dividend date. Net realized gains from security transactions (if any) are generally distributed annually to shareholders. The timing and characterization of certain income and capital gains distributions are determined in accordance with federal tax regulations that may differ from GAAP. Permanent book and tax basis differences relating to shareholder distributions will result in reclassification between under/over distributed net investment income, accumulated net realized gains/losses, and paid-in surplus. Book-tax differences are primarily due to distributions from Underlying Portfolios. These adjustments have no impact on net assets or the results of operations.
3. Certain Risks
Market Risk: In the normal course of business, the Underlying Portfolios invest in securities and enter into transactions where risks exist due to fluctuations in the market (market risk) or failure of the other party to a transaction to perform (credit and counterparty risk). The value of securities held by the Underlying Portfolios may decline in response to certain events, including those directly
MSF-10
Metropolitan Series Fund
MetLife Conservative to Moderate Allocation Portfolio
Notes to Financial Statements—December 31, 2013—(Continued)
involving the companies whose securities are owned by the Underlying Portfolios; conditions affecting the general economy; overall market changes; local, regional or global political, social or economic instability; currency, interest rate, and price fluctuations.
Credit and Counterparty Risk: The Underlying Portfolios may be exposed to counterparty risk, or the risk that an entity with which the Underlying Portfolios have unsettled or open transactions may default. The potential loss could exceed the value of the financial assets and liabilities recorded in the financial statements. Financial assets that potentially expose the Underlying Portfolios to credit and counterparty risk consist principally of cash due from counterparties and investments. The Underlying Portfolios manage counterparty risk by entering into agreements only with counterparties that they believe have the financial resources to honor their obligations and by monitoring the financial stability of those counterparties. The Underlying Portfolios’ investment adviser attempts to mitigate counterparty risk by (i) periodically assessing the creditworthiness of their trading partners, (ii) monitoring and/or limiting the amount of their net exposure to each individual counterparty based on the adviser’s assessment, and (iii) requiring collateral from the counterparty for certain transactions. In order to preserve certain safeguards for non-standard settlement trades, the Underlying Portfolios restrict their exposure to credit and counterparty losses by entering into master netting agreements with counterparties (approved brokers) with whom the Underlying Portfolios undertake a significant volume of transactions. Master Agreements govern the terms of certain transactions, and reduce the counterparty risk associated with relevant transactions by specifying credit protection mechanisms and providing standardization that improves legal certainty. Master Agreements can also help limit counterparty risk by specifying collateral posting arrangements at pre-arranged exposure levels.
Additional risks associated with each type of investment are described within the respective security type notes. The Asset Allocation Portfolio’s prospectus includes a discussion of the principal risks of investing in the Asset Allocation Portfolio and Underlying Portfolios in which it invests.
4. Investment Transactions
Aggregate cost of purchases and proceeds of sales of shares of the Underlying Portfolios by the Asset Allocation Portfolio, for the year ended December 31, 2013 were as follows:
| | | | | | | | | | | | |
Purchases | | | Sales | |
U.S. Government | | Non U.S. Government | | | U.S. Government | | | Non U.S. Government | |
| $0 | | $ | 260,056,044 | | | $ | 0 | | | $ | 308,373,823 | |
5. Investment Management Fees and Other Transactions with Affiliates
Investment Management Agreement - MetLife Advisers is the investment adviser to the Asset Allocation Portfolio. The Trust has entered into an investment management agreement with MetLife Advisers with respect to the Asset Allocation Portfolio. For providing investment management services to the Asset Allocation Portfolio, MetLife Advisers receives monthly compensation at the following annual rates:
| | | | | | |
Management
Fees earned by
MetLife Advisers
for the year ended
December 31, 2013 | | % per annum | | | Average Daily Net Assets |
| $1,257,589 | | | 0.100 | % | | Of the first $500 million |
| | | 0.075 | % | | Of the next $500 million |
| | | 0.050 | % | | On amounts in excess of $1 billion |
In addition to the above management fee paid to MetLife Advisers, the Asset Allocation Portfolio indirectly pays MetLife Advisers an investment advisory fee through its investments in the Underlying Portfolios.
Certain officers and trustees of the Trust may also be officers of MetLife Advisers; however, such officers and trustees receive no compensation from the Trust.
Expense Limitation Agreement - Pursuant to an expense agreement relating to each class of the Asset Allocation Portfolio, MetLife Advisers has contractually agreed, from April 29, 2013 to April 27, 2014, to waive a portion of its advisory fees or pay a portion of the other operating expenses (not including acquired fund fees and expenses, brokerage costs, interest, taxes, or extraordinary expenses) to the extent total operating expenses exceed stated annual expense limits (based on the Asset Allocation Portfolio’s then-current fiscal year). For the Asset Allocation Portfolio, this subsidy, and identical subsidies in effect in earlier periods, are subject to the obligation of each class of the Asset Allocation Portfolio to repay MetLife Advisers in future years, if any, when a class’ expenses fall below the stated expense limit pertaining to that class that was in effect at the time of the subsidy in question. Such deferred expenses may be charged to a class in a subsequent year to the extent that the charge does not cause the total expenses in such subsequent year to exceed the class’ stated expense limit that was in effect at the time of the subsidy in question; provided, however, that no class of
MSF-11
Metropolitan Series Fund
MetLife Conservative to Moderate Allocation Portfolio
Notes to Financial Statements—December 31, 2013—(Continued)
the Asset Allocation Portfolio is obligated to repay any expense paid by MetLife Advisers more than five years after the end of the fiscal year in which such expense was incurred. The expense limits (annual rates as a percentage of each class of the Asset Allocation Portfolio’s net average daily net assets) in effect from April 29, 2013 to April 27, 2014 are 0.10% and 0.35% for Class A and B, respectively. As of December 31, 2013, there were no expenses deferred in prior periods subject to repayment.
Transfer Agency Agreement - MetLife serves as the transfer agent for the Trust. MetLife receives no fees for its services to the Trust under the transfer agency agreement.
Distribution and Service Fees - The Trust has a distribution agreement with MetLife Investors Distribution Company (“MIDC” or the “Distributor”) in which MIDC serves as the distributor for the Asset Allocation Portfolio’s Class A and B Shares. MIDC is a wholly-owned subsidiary of MetLife Investors Group, Inc., an affiliate of the Adviser. The Trust has also adopted a Distribution and Service Plan under Rule 12b-1 of the 1940 Act for the Asset Allocation Portfolio’s Class B shares. Under the Distribution and Services Plan, the Class B shares of the Asset Allocation Portfolio pay a fee to compensate the Insurance Companies (or their affiliates) and other broker-dealers and financial intermediaries involved in the offer and sale of Asset Allocation Portfolio shares for promoting or selling and servicing the Class B shares of the Asset Allocation Portfolio. The fees under the Distribution and Services Plan for each class of the Asset Allocation Portfolio’s shares are calculated as a percentage of the Asset Allocation Portfolio’s average daily net assets that are attributable to that Class. Currently, the fee is 0.25% per year for Class B shares. Amount incurred by the Asset Allocation Portfolio for the year ended December 31, 2013 is shown as Distribution and service fees in the Statement of Operations.
Deferred Trustee Compensation - Each Trustee who is not currently an active employee of MetLife or its affiliates receives compensation from the Trust for his or her service to the Trust. A deferred compensation plan (the “Plan”) is available to the Trustees on a voluntary basis. Deferred amounts remain in the Trust until distributed in accordance with the provisions of the Plan. The value of a participating Trustee’s deferral account is based on theoretical investments of deferred amounts, on the normal payment dates in certain portfolios of the Trust or Met Investors Series Trust, an affiliate of the Trust, as designated by the participating Trustee. Changes in the value of participants’ deferral accounts are reflected as Trustees’ fees and expenses in the Statement of Operations. The portion of the accrued obligations allocated to the Asset Allocation Portfolio under the Plan is reflected as Deferred trustees’ fees in the Statement of Assets and Liabilities.
6. Transactions in Securities of Underlying Portfolios
The Portfolio does not invest in the Underlying Portfolios for the purpose of exercising control; however, investments by the Portfolio within its principal investment strategies may represent a significant portion of the Underlying Portfolios net assets. Transactions in the Underlying Portfolios for the year ended December 31, 2013 were as follows:
| | | | | | | | | | | | | | | | |
Underlying Portfolio | | Number of
shares held at
December 31, 2012 | | | Shares
purchased | | | Shares
sold | | | Number of
shares held at
December 31, 2013 | |
Baillie Gifford International Stock | | | 3,748,738 | | | | 75,546 | | | | (324,875 | ) | | | 3,499,409 | |
BlackRock Bond Income | | | 1,777,846 | | | | 131,558 | | | | (352,222 | ) | | | 1,557,182 | |
BlackRock Capital Appreciation | | | 1,209,011 | | | | 11,657 | | | | (230,368 | ) | | | 990,300 | |
BlackRock High Yield | | | 1,937,239 | | | | 144,207 | | | | (659,148 | ) | | | 1,422,298 | |
BlackRock Large Cap Value | | | 3,514,436 | | | | 258,874 | | | | (708,015 | ) | | | 3,065,295 | |
Clarion Global Real Estate | | | 1,515,989 | | | | 136,235 | | | | (83,824 | ) | | | 1,568,400 | |
ClearBridge Aggressive Growth | | | 1,853,344 | | | | 8,576 | | | | (481,896 | ) | | | 1,380,024 | |
Goldman Sachs Mid Cap Value | | | 1,233,638 | | | | 61,739 | | | | (256,215 | ) | | | 1,039,162 | |
Harris Oakmark International | | | 3,477,710 | | | | 89,361 | | | | (1,177,965 | ) | | | 2,389,106 | |
Invesco Comstock | | | 4,750,258 | | | | 65,031 | | | | (1,009,873 | ) | | | 3,805,416 | |
Invesco Small Cap Growth | | | 2,218,940 | | | | 155,341 | | | | (566,340 | ) | | | 1,807,941 | |
Jennison Growth | | | 1,468,699 | | | | 618,517 | | | | (324,739 | ) | | | 1,762,477 | |
JPMorgan Core Bond | | | — | | | | 11,023,551 | | | | (16,089 | ) | | | 11,007,462 | |
JPMorgan Small Cap Value | | | — | | | | 517,024 | | | | (55,106 | ) | | | 461,918 | |
Lord Abbett Bond Debenture | | | 1,283,657 | | | | 67,121 | | | | (420,640 | ) | | | 930,138 | |
Met/Artisan Mid Cap Value | | | 87,415 | | | | 946 | | | | (19,889 | ) | | | 68,472 | |
Met/Eaton Vance Floating Rate | | | 3,197,980 | | | | 208,629 | | | | (64,554 | ) | | | 3,342,055 | |
Met/Franklin Low Duration Total Return | | | 6,742,749 | | | | 312,386 | | | | (36,486 | ) | | | 7,018,649 | |
Met/Templeton International Bond | | | 4,369,775 | | | | 173,729 | | | | (23,163 | ) | | | 4,520,341 | |
MFS® Emerging Markets Equity | | | — | | | | 1,705,074 | | | | (17,837 | ) | | | 1,687,237 | |
MFS® Research International | | | 3,360,325 | | | | 78,216 | | | | (1,154,187 | ) | | | 2,284,354 | |
MFS® Value | | | 4,977,566 | | | | 392,851 | | | | (676,052 | ) | | | 4,694,365 | |
Neuberger Berman Genesis | | | 1,304,687 | | | | 11,339 | | | | (300,429 | ) | | | 1,015,597 | |
PIMCO Inflation Protected Bond | | | 10,029,146 | | | | 1,959,149 | | | | (48,813 | ) | | | 11,939,482 | |
PIMCO Total Return | | | 23,905,775 | | | | 1,823,547 | | | | (3,522,010 | ) | | | 22,207,312 | |
MSF-12
Metropolitan Series Fund
MetLife Conservative to Moderate Allocation Portfolio
Notes to Financial Statements—December 31, 2013—(Continued)
| | | | | | | | | | | | | | | | |
Underlying Portfolio | | Number of
shares held at
December 31, 2012 | | | Shares
purchased | | | Shares
sold | | | Number of
shares held at
December 31, 2013 | |
Pioneer Fund | | | 2,360,711 | | | | 826 | | | | (2,361,537 | ) | | | — | |
T. Rowe Price Large Cap Growth | | | 1,947,638 | | | | 330,060 | | | | (384,651 | ) | | | 1,893,047 | |
T. Rowe Price Large Cap Value | | | 2,823,207 | | | | 115,675 | | | | (362,880 | ) | | | 2,576,002 | |
T. Rowe Price Mid Cap Growth | | | 1,818,960 | | | | 108,977 | | | | (423,963 | ) | | | 1,503,974 | |
Third Avenue Small Cap | | | 2,168,343 | | | | 21,575 | | | | (874,627 | ) | | | 1,315,291 | |
Van Eck Global Natural Resources | | | 1,343,212 | | | | 38,839 | | | | (118,228 | ) | | | 1,263,823 | |
Western Asset Management Strategic Bond Opportunities | | | 2,453,698 | | | | 125,468 | | | | (462,574 | ) | | | 2,116,592 | |
Western Asset Management U.S. Government | | | 12,389,309 | | | | 752,609 | | | | (52,246 | ) | | | 13,089,672 | |
WMC Core Equity Opportunities (formerly Davis Venture Value) | | | 1,556,243 | | | | 50,444 | | | | (312,959 | ) | | | 1,293,728 | |
| | | | | | | | | | | | | | | | |
Underlying Portfolio | | Net Realized
Gain/(Loss) on sales
of Underlying
Portfolios | | | Capital Gain
Distributions
from Underlying
Portfolios | | | Dividend Income
from Underlying
Portfolios | | | Ending Value
as of
December 31, 2013 | |
Baillie Gifford International Stock | | $ | 369,096 | | | $ | — | | | $ | 584,083 | | | $ | 36,883,771 | |
BlackRock Bond Income | | | 2,027,331 | | | | 3,982,118 | | | | 6,533,118 | | | | 167,132,330 | |
BlackRock Capital Appreciation | | | 893,131 | | | | — | | | | 311,590 | | | | 37,482,857 | |
BlackRock High Yield | | | 1,191,363 | | | | 334,991 | | | | 853,201 | | | | 12,615,781 | |
BlackRock Large Cap Value | | | 987,285 | | | | 2,037,803 | | | | 527,076 | | | | 36,844,845 | |
Clarion Global Real Estate | | | 64,025 | | | | — | | | | 1,233,323 | | | | 17,471,980 | |
ClearBridge Aggressive Growth | | | 1,121,411 | | | | — | | | | 81,154 | | | | 18,561,317 | |
Goldman Sachs Mid Cap Value | | | 539,622 | | | | 675,579 | | | | 209,945 | | | | 18,455,509 | |
Harris Oakmark International | | | 8,075,062 | | | | — | | | | 1,335,074 | | | | 45,703,589 | |
Invesco Comstock | | | 2,575,690 | | | | — | | | | 755,286 | | | | 55,482,962 | |
Invesco Small Cap Growth | | | 4,480,870 | | | | 2,228,647 | | | | 163,994 | | | | 37,117,019 | |
Jennison Growth | | | 840,510 | | | | 274,332 | | | | 111,765 | | | | 27,882,386 | |
JPMorgan Core Bond | | | (5,166 | ) | | | 453,075 | | | | 566,344 | | | | 111,945,889 | |
JPMorgan Small Cap Value | | | 122,233 | | | | — | | | | 61,409 | | | | 9,206,019 | |
Lord Abbett Bond Debenture | | | 1,098,107 | | | | — | | | | 852,003 | | | | 12,603,374 | |
Met/Artisan Mid Cap Value | | | 2,364,388 | | | | — | | | | 185,946 | | | | 18,391,665 | |
Met/Eaton Vance Floating Rate | | | 33,779 | | | | 160,725 | | | | 1,420,808 | | | | 35,526,047 | |
Met/Franklin Low Duration Total Return | | | 2,755 | | | | — | | | | 1,248,233 | | | | 70,677,797 | |
Met/Templeton International Bond | | | 44,395 | | | | 231,072 | | | | 1,151,000 | | | | 52,978,400 | |
MFS® Emerging Markets Equity | | | (2,886 | ) | | | — | | | | 221,300 | | | | 17,496,644 | |
MFS® Research International | | | 1,051,818 | | | | — | | | | 781,291 | | | | 27,435,088 | |
MFS® Value | | | 4,890,377 | | | | 2,477,756 | | | | 1,459,231 | | | | 83,324,985 | |
Neuberger Berman Genesis | | | 1,608,502 | | | | — | | | | 153,364 | | | | 18,422,927 | |
PIMCO Inflation Protected Bond | | | 1,313 | | | | 6,501,798 | | | | 2,732,195 | | | | 118,797,846 | |
PIMCO Total Return | | | 1,891,441 | | | | 5,130,017 | | | | 11,686,220 | | | | 263,600,798 | |
Pioneer Fund | | | 7,401,956 | | | | — | | | | 10,956 | | | | — | |
T. Rowe Price Large Cap Growth | | | 4,014,586 | | | | — | | | | 134,339 | | | | 46,398,571 | |
T. Rowe Price Large Cap Value | | | 2,098,455 | | | | — | | | | 1,358,974 | | | | 82,818,477 | |
T. Rowe Price Mid Cap Growth | | | 2,086,077 | | | | 968,741 | | | | 78,405 | | | | 18,483,841 | |
Third Avenue Small Cap | | | 1,471,093 | | | | — | | | | 341,862 | | | | 27,673,729 | |
Van Eck Global Natural Resources | | | 434,249 | | | | — | | | | 155,066 | | | | 17,958,924 | |
Western Asset Management Strategic Bond Opportunities | | | 878,262 | | | | — | | | | 1,415,146 | | | | 28,468,168 | |
Western Asset Management U.S. Government | | | (26,439 | ) | | | — | | | | 3,296,656 | | | | 157,206,956 | |
WMC Core Equity Opportunities (formerly Davis Venture Value) | | | 4,669,994 | | | | 945,121 | | | | 791,334 | | | | 55,591,504 | |
| | | | | | | | | | | | | | | | |
| | $ | 59,294,685 | | | $ | 26,401,775 | | | $ | 42,801,691 | | | $ | 1,786,641,995 | |
| | | | | | | | | | | | | | | | |
7. Contractual Obligations
Under the Trust’s organizational documents, its officers and Trustees may be indemnified against certain liabilities and expenses arising out of the performance of their duties to the Trust. Additionally, the Trust has a variety of indemnification obligations under contracts with its service providers. The Trust’s maximum exposure under these arrangements is unknown, as this would involve future claims that may be made against the Trust that have not yet occurred.
MSF-13
Metropolitan Series Fund
MetLife Conservative to Moderate Allocation Portfolio
Notes to Financial Statements—December 31, 2013—(Continued)
8. Income Tax Information
The tax character of distributions paid for the years ended December 31, 2013 and 2012 were as follows:
| | | | | | | | | | | | | | | | | | | | |
Ordinary Income | | | Long-Term Capital Gain | | | Total | |
2013 | | 2012 | | | 2013 | | | 2012 | | | 2013 | | | 2012 | |
| $44,793,771 | | $ | 48,495,247 | | | $ | 18,186,782 | | | $ | 5,223,827 | | | $ | 62,980,553 | | | $ | 53,719,074 | |
As of December 31, 2013, the components of distributable earnings (accumulated losses) on a federal income tax basis were as follows:
| | | | | | | | | | | | | | | | |
Undistributed
Ordinary
Income | | Undistributed
Long-Term
Capital Gain | | | Net
Unrealized
Appreciation | | | Loss Carryforwards | | | Total | |
| $52,131,749 | | $ | 62,455,615 | | | $ | 199,679,736 | | | $ | — | | | $ | 314,267,100 | |
The Asset Allocation Portfolio utilizes the provisions of the federal income tax laws that provide for the carryforward of capital losses for prior years, offsetting such losses against any future realized capital gains. Under the Regulated Investment Company Modernization Act of 2010 (the “Act”), net capital losses recognized after December 22, 2010 may be carried forward indefinitely and their character is retained as short-term and/or long-term losses. Previously, net capital losses were carried forward for up to eight years and treated as short-term losses. As a transition rule, the Act requires that post-enactment net capital losses be used before pre-enactment net capital losses.
As of December 31, 2013, the Asset Allocation Portfolio had no post-enactment accumulated capital losses and no pre-enactment accumulated capital loss carryforwards.
9. Subsequent Events
At a meeting held on November 20, 2013, the Board, subject to shareholder approval, approved an Agreement and Plan of Reorganization providing for the acquisition of all the assets and assumption of all liabilities of MetLife Defensive Strategy Portfolio (“Defensive Strategy Portfolio”) and MetLife Moderate Strategy Portfolio (“Moderate Strategy Portfolio”), both a series of Met Investors Series Trust, by the Portfolio in exchange for shares of the Portfolio. On February 21, 2014, the shareholders of Defensive Strategy Portfolio and shareholders of Moderate Strategy Portfolio approved the proposed Agreement and Plan of Reorganization. It is anticipated that the reorganization will close on or about April 28, 2014 and the Portfolio would be renamed MetLife Asset Allocation 40 Portfolio.
MSF-14
Metropolitan Series Fund
MetLife Conservative to Moderate Allocation Portfolio
Report of Independent Registered Public Accounting Firm
To the Shareholders of MetLife Conservative to Moderate Allocation Portfolio and the Board of Trustees of Metropolitan Series Fund:
We have audited the accompanying statement of assets and liabilities, including the schedule of investments, of MetLife Conservative to Moderate Allocation Portfolio, one of the portfolios constituting Metropolitan Series Fund, (the “Trust”) as of December 31, 2013, and the related statement of operations for the year then ended, the statements of changes in net assets for each of the two years in the period then ended, and the financial highlights for each of the five years in the period then ended. These financial statements and financial highlights are the responsibility of the Trust’s management. Our responsibility is to express an opinion on these financial statements and financial highlights based on our audits.
We conducted our audits in accordance with the standards of the Public Company Accounting Oversight Board (United States). Those standards require that we plan and perform the audit to obtain reasonable assurance about whether the financial statements and financial highlights are free of material misstatement. The Trust is not required to have, nor were we engaged to perform, an audit of its internal control over financial reporting. Our audits included consideration of internal control over financial reporting as a basis for designing audit procedures that are appropriate in the circumstances, but not for the purpose of expressing an opinion on the effectiveness of the Trust’s internal control over financial reporting. Accordingly, we express no such opinion. An audit also includes examining, on a test basis, evidence supporting the amounts and disclosures in the financial statements, assessing the accounting principles used and significant estimates made by management, as well as evaluating the overall financial statement presentation. Our procedures included confirmation of securities owned as of December 31, 2013, by correspondence with the transfer agent. We believe that our audits provide a reasonable basis for our opinion.
In our opinion, the financial statements and financial highlights referred to above present fairly, in all material respects, the financial position of MetLife Conservative to Moderate Allocation Portfolio of Metropolitan Series Fund, as of December 31, 2013, the results of its operations for the year then ended, the changes in its net assets for each of the two years in the period then ended, and the financial highlights for each of the five years in the period then ended, in conformity with accounting principles generally accepted in the United States of America.
Deloitte & Touche LLP
Boston, Massachusetts
February 27, 2014
MSF-15
Metropolitan Series Fund
Trustees and Officers of Metropolitan Series Fund
The Trustees and executive officers of the Trust, their ages and their principal occupations during the past five years are set forth below. Unless otherwise indicated, the business address of each is One Financial Center, Boston, MA 02111. Each Trustee who is deemed an “interested person,” as such term is defined in the 1940 Act, is indicated by an asterisk. Those Trustees who are not “interested persons” as defined in the 1940 Act are referred to as “Independent Trustees.” Additional information about the Trustees is available in the Statement of Additional Information, which is available without charge, upon request, by calling (800) 848-3854.
Trustees of the Trust
| | | | | | | | | | |
Name and Age | | Position(s)
Held with
Registrant | | Term of Office and
Length of Time
Served | | Principal Occupation(s) During the
Past 5 Years(1) | | Number of
Portfolios
in Fund
Complex(2)
overseen | | Other Directorships Held
by Trustee During the
Past 5 Years(1) |
| Interested Trustee | | | | | | | | | | |
| Elizabeth M. Forget* (47) | | Trustee, Chairman of the Board, President and Chief Executive Officer | | Indefinite; From May 2006 (President and Chief Executive Officer)/ August 2006 (Trustee and Chairman of the Board) to present | | Senior Vice President, MetLife Inc.; President, MetLife Advisers, LLC and a predecessor company. | | 79 | | Trustee, Met Investors Series Trust (the “MIST Trust”);** various MetLife-affiliated boards. |
| | | | | |
| Independent Trustees | | | | | | | | | | |
| Stephen M. Alderman (54) | | Trustee | | Indefinite; From April 2012 to present | | Shareholder in the law firm of Garfield & Merel, Ltd. | | 79 | | Trustee, MIST Trust;** Director, International Truck Leasing Corp. |
| | | | | |
| Robert J. Boulware (57) | | Trustee | | Indefinite; From April 2012 to present | | Managing Director, Pilgrim Funds, LLC (private equity fund). | | 79 | | Trustee, MIST Trust;** Trustee, Vertical Capital Income Fund (closed-end fund); Director, Gainsco, Inc. (auto insurance). |
| | | | | |
| Susan C. Gause (61) | | Trustee | | Indefinite; From April 2012 to present | | Private Investor. | | 79 | | Trustee, MIST Trust;** Trustee, HSBC Funds. |
| | | | | |
| Nancy Hawthorne (62) | | Trustee | | Indefinite; From May 2003 to present | | Chief Executive Officer, Clerestory LLC (corporate advisor). | | 79 | | MIST Trust;** Director, THL Credit, Inc.**; Director, Avid Technology, Inc.** |
| | | | | |
| Barbara A. Nugent (57) | | Trustee | | Indefinite; From January 2014 to present | | President, True North Board Governance, LLC (consulting); until 2014, partner in the law firm of Stradley Ronon Stevens & Young, LLP. | | 79 | | Trustee, MIST Trust**; Director, Episcopal Healthcare Foundation; until 2014, member, Mutual Fund Directors Forum Advisory Board. |
| | | | | |
| Keith M. Schappert (62) | | Trustee | | Indefinite; From August 2009 to present | | Principal, Schappert Consulting LLC (asset management consulting). | | 79 | | Trustee, MIST Trust;** Director, The Commonfund for Nonprofit Organizations; until 2011, Director, Trilogy Global Advisors; Director, Mirae Asset Discovery Funds,** Director, Calamos Investments. |
| | | | | |
| Linda B. Strumpf (66) | | Trustee | | Indefinite; From May 2000 to present | | Chair of the Investment Committee, Leona M. and Harry B. Helmsley Charitable Trust; until 2011, Chief Investment Officer, Leona M. and Harry B. Helmsley Charitable Trust. | | 79 | | Since 2012, Trustee, MIST Trust,** Trustee and Member of Investment Committee, The Pennsylvania State University. |
| | | | | |
| Dawn M. Vroegop (47) | | Trustee | | Indefinite; From May 2009 to present | | Private Investor. | | 79 | | Trustee, MIST Trust,** Trustee, Driehaus Mutual Funds; Director and Investment Committee Chair, City College of San Francisco Foundation. |
MSF-16
Metropolitan Series Fund
Trustees and Officers of Metropolitan Series Fund—(Continued)
Executive Officers of the Trust
| | | | | | |
Name and Age | | Position(s) Held with
Registrant | | Term of Office
and Length of
Time Served | | Principal Occupation(s) During Past 5 Years(1) |
| Elizabeth M. Forget (47) | | President, Chief Executive Officer, Trustee and Chairman of the Board | | From May
2006 (President
and Chief
Executive
Officer)/
August 2006
(Trustee and
Chairman of
the Board) to
present | | See principal occupation information in the table above. |
| | | |
| Jeffrey L. Bernier (42) | | Vice President | | From February
2008 to present | | Vice President, MetLife, Inc.; Senior Vice President, MetLife Advisers, LLC and a predecessor company. |
| | | |
| Peter H. Duffy (58) | | Chief Financial Officer and Treasurer | | From November
2000 to present | | Senior Vice President, MetLife Advisers, LLC; Vice President, MetLife, Inc. |
| | | |
| Andrew L. Gangolf (59) | | Secretary | | From May
2011to present | | Senior Vice President, MetLife Advisers, LLC; Senior Vice President & Assistant General Counsel, AllianceBerstein Investments, Inc. |
| | | |
| Jeffrey P. Halperin (46) | | Chief Compliance Officer | | From November
2005 to present | | Vice President, MetLife, Inc.; Chief Compliance Officer, MIST; Chief Compliance Officer, MSF Trust; Chief Compliance Officer, MetLife Advisers, LLC and a predecessor company; Chief Compliance Officer, MetLife Investment Management, LLC (formerly MetLife Investment Advisors Company, LLC). |
| | | |
| Alan C. Leland, Jr. (61) | | Vice President | | From February
2005 to present | | Treasurer and Chief Financial Officer, MetLife Advisers, LLC; Vice President, MetLife Group Inc.; Vice President, MetLife, Inc. |
| * | Ms. Forget is an “interested person” of the Trust because of her positions with MetLife Advisers, LLC and her ownership of securities issued by MetLife, Inc., the ultimate parent company of MetLife Advisers, LLC. |
| ** | Indicates a directorship with a registered investment company or a company subject to the reporting requirements of the Securities Exchange Act of 1934, as amended. |
| (1) | Previous positions during the past five years with the Trust, MetLife, Inc. or the Adviser are omitted if not materially different. |
| (2) | The Fund Complex includes 49 Portfolios of the MIST Trust and 30 Portfolios of the Trust. |
MSF-17
Metropolitan Series Fund
MetLife Conservative to Moderate Allocation Portfolio
Board of Trustees’ Consideration of Advisory Agreement
At an in-person meeting of the Boards of Trustees (the “Board”) of Met Investors Series Trust and Metropolitan Series Fund (“MIST” and “MSF,” respectively, and collectively, the “Trusts”) held on November 19-20, 2013, the Board, including a majority of the Trustees who are not considered to be “interested persons” of the Trusts (the “Independent Trustees”) under the Investment Company Act of 1940, as amended (the “1940 Act”), approved for an annual period the continuation of each Trust’s advisory agreement (the “Advisory Agreement”) with MetLife Advisers, LLC (the “Adviser”) and the applicable sub-advisory agreements (each a “Sub-Advisory Agreement,” and collectively with the Advisory Agreement, the “Agreements”) between the Adviser and the investment sub-advisers (each a “Sub-Adviser,” and collectively, the “Sub-Advisers”) for each of the series of the Trusts, including the MetLife Conservative to Moderate Allocation Portfolio (each a “Portfolio,” and collectively, the “Portfolios”).1 As the Adviser has the day-to-day responsibility for managing the MetLife Conservative to Moderate Allocation Portfolio’s investments, the Board only approved an Advisory Agreement with respect to the MetLife Conservative to Moderate Allocation Portfolio.
In considering the Agreement, the Board reviewed a variety of materials provided by the Adviser relating to the Portfolios, including comparative performance, fee and expense information for an appropriate peer group of similar mutual funds, performance information for relevant benchmark indices and other information regarding the nature, extent and quality of services provided by the Adviser under the Agreement. The Board also took into account its experience with the Adviser and information provided to the Board in its meetings throughout the year with respect to the services provided by the Adviser, including quarterly performance reports prepared by management containing reviews of investment results. The Independent Trustees also assessed reports provided by the Board’s independent consultant, who reviewed and provided analyses regarding investment performance, fees and expenses, and other information provided by, or at the direction of, the Adviser, as more fully discussed below.
The Independent Trustees were separately advised by independent legal counsel throughout the process, and met with independent legal counsel in periodic executive sessions. Prior to voting to continue the Agreements at the November meeting, the Independent Trustees also received a memorandum from their independent counsel discussing the legal standards for their consideration of the proposed continuation of the Agreements. The Board also met in person with personnel of the Adviser on September 17, 2013 for the specific purpose of giving preliminary consideration to the proposed continuation of the Agreements and to request additional information they considered reasonably necessary to their deliberations. The Independent Trustees also discussed the proposed continuation of the Agreements in private sessions with their independent legal counsel at which no representatives of management were present.
In considering whether to approve the renewal of the Advisory Agreement with the Adviser with respect to a Portfolio, the Board reviewed and analyzed the factors it deemed relevant, including: (1) the nature, extent and quality of the services to be provided to the Portfolio by the Adviser; (2) the performance of the Portfolio as compared to a peer group and an appropriate index; (3) the Adviser’s personnel and operations; (4) the financial condition of the Adviser; (5) the level and method of computing each Portfolio’s advisory fees; (6) the profitability of the Adviser under the Advisory Agreement; (7) any “fall-out” benefits to the Adviser and its affiliates (i.e., ancillary benefits realized by the Adviser or its affiliates from the Adviser’s relationship with the Trusts); (8) the anticipated effect of growth in size on Portfolio expenses; and (9) possible conflicts of interest.
Nature, extent and quality of services. The Board evaluated the nature, extent and quality of the services that the Adviser has provided to the Portfolios. The Board considered the Adviser’s services as investment manager to the Portfolios. The Adviser’s services in coordinating and overseeing the activities of the Trusts’ service providers were also considered. The Board also evaluated the expertise and performance of the personnel of the Adviser who performed services for the Portfolios throughout the year.
The Board considered information received from the Trust’s Chief Compliance Officer (“CCO”) regarding the Portfolios’ compliance policies and procedures established pursuant to Rule 38a-l under the 1940 Act.
The Board considered the provision of investment advisory services by the Adviser to the Asset Allocation Portfolios (i.e., MetLife Aggressive Strategy Portfolio, MetLife Balanced Strategy Portfolio, MetLife Conservative Allocation Portfolio, MetLife Conservative to Moderate Allocation Portfolio, MetLife Defensive Strategy Portfolio, MetLife Growth Strategy Portfolio, MetLife Moderate Allocation Portfolio, MetLife Moderate to Aggressive Allocation Portfolio and MetLife Moderate Strategy Portfolio), the American Funds of Funds (i.e., American Funds Balanced Allocation Portfolio, American Funds Growth Allocation Portfolio and American Funds Moderate Allocation Portfolio), the MetLife Balanced Plus Portfolio and the MetLife Multi-Index Targeted Risk Portfolio. With respect to the Asset Allocation Portfolios, the Board noted that the Adviser has hired, at its own cost, an independent consultant to provide research and consulting services with respect to the periodic asset allocation targets for each of the Asset Allocation Portfolios and to investments in other Portfolios of the Trusts (the “Underlying Portfolios”), which may assist the Adviser with the selection of
1 The Pyramis Managed Risk Portfolio recently commenced operations and, therefore, the Agreement with respect to this Portfolio was not up for renewal.
MSF-18
Metropolitan Series Fund
MetLife Conservative to Moderate Allocation Portfolio
Board of Trustees’ Consideration of Advisory Agreement—(Continued)
Underlying Portfolios for inclusion in each Asset Allocation Portfolio. Additionally, the Board considered that an Investment Committee, consisting of investment professionals from across MetLife, meets at least quarterly to review the asset allocations and discuss the performance of the Asset Allocation Portfolios and the American Funds of Funds.
Performance. The Board considered the performance of the Portfolios as described in the quarterly reports prepared by management, and as also analyzed in reports prepared by the Independent Trustees’ independent consultant. The Board noted that the Adviser reviews with the Board on a quarterly basis detailed information about the Portfolios’ performance results, portfolio composition and investment strategies. The Board also reviewed and considered a separate report prepared by Lipper Inc. (“Lipper”), an independent third party, which provided a statistical analysis comparing the Portfolios’ investment performance, expenses, and fees to comparable funds underlying variable insurance products (the “Performance Universe”). In addition, the Independent Trustees met separately with a representative of Bobroff Consulting, Inc., an independent consultant (“Bobroff), at a special board meeting in September 2013, to review the separate reports prepared by such consultant (“Bobroff Report”), which analyzed the report prepared by Lipper. The Board also considered each Portfolio’s more recent performance subsequent to the performance period covered by the Lipper reports, and management’s discussion of the same, including the effect of current market conditions on each Portfolio’s more recent performance.
The Board reviewed the Portfolios’ performance records and the Adviser’s management styles and long-term performance records with the Portfolios and comparable funds. The Board focused particular attention on Portfolios with less favorable performance records. The Board noted that the Adviser has been active in monitoring and responding to any performance issues with respect to the Portfolios. The Board also took into account its discussions with management regarding factors that contributed to the performance of the Portfolios.
Among other data relating specifically to the MetLife Conservative to Moderate Allocation Portfolio’s performance, the Board considered that the Portfolio outperformed the median of its Performance Universe and its Lipper Index for the one-, three- and five-year periods ended June 30, 2013. The Board further considered that the Portfolio outperformed the Conservative to Moderate AA Broad Index for the one-, three- and five-year periods ended October 31, 2013.
Fees and Expenses. The Board gave consideration to the advisory fees payable under the Advisory Agreement. In this regard, the Board reviewed the advisory fees payable on a Portfolio-by-Portfolio basis based on information provided by the Adviser. The Independent Trustees, with the assistance of Bobroff, also examined the fees paid by a Portfolio in light of fees paid to other investment managers by comparable funds, as well as considered the fees charged by the Adviser to manage other comparable funds, as applicable. The Lipper report included comparisons of the Adviser’s fee schedule with that of its peers based on an asset-based analysis of relative fee structures according to the size of the Portfolio. In addition, the Board considered the Portfolios’ advisory fees and total expenses as compared to similarly situated investment companies underlying variable insurance products deemed to be comparable to the Portfolios as determined by Lipper. The Board considered a Portfolio’s ranking within a smaller group of peer funds chosen by Lipper (the “Expense Group”), as well as the Portfolio’s ranking within broader groups of funds (the “Expense Universe”). In comparing a Portfolio’s actual and contractual management fee to that of comparable funds, the Board noted that such fee includes both advisory and administrative fees. The Board also considered that the Adviser had entered into expense limitation agreements with certain of the Portfolios, pursuant to which the Adviser has agreed to waive a portion of its advisory fee and/or reimburse certain expenses as a means of limiting a Portfolio’s total annual operating expenses.
With respect to the MetLife Conservative to Moderate Allocation Portfolio, the Board considered that the Portfolio’s actual management fees and total expenses (exclusive of 12b-l fees) were below the Expense Group median and the Expense Universe median. The Board noted that the Portfolio’s contractual management fees were below the asset-weighted average of the Expense Group at the Portfolio’s current size.
The Board further noted the proposed acquisition by the MetLife Conservative to Moderate Allocation Portfolio of both the MetLife Defensive Strategy Portfolio and the MetLife Moderate Strategy Portfolio on or about April 28, 2014, pending approval by each of the acquired Portfolio’s contractholders. The Board considered that the Portfolio may benefit from the proposed acquisition because, following the acquisition, the Portfolio’s total annual operating expenses are expected to be lower than the total operating expenses of the Portfolio prior to the acquisitions.
Profitability. The Board examined the profitability of the Adviser on a Portfolio-by-Portfolio basis. With respect to the Asset Allocation Portfolios, the Board noted that the advisory fee is in addition to the fees received by the Adviser and its affiliates with regard to the Underlying Portfolios in which the Asset Allocation Portfolios may invest. In considering the profitability to the Adviser from the Asset
MSF-19
Metropolitan Series Fund
MetLife Conservative to Moderate Allocation Portfolio
Board of Trustees’ Consideration of Advisory Agreement—(Continued)
Allocation Portfolios, the Board took into consideration the profitability to the Adviser of the funds underlying the Asset Allocation Portfolios. The Board also considered that the Distributor, MetLife Investors Distribution Company, receives Rule 12b-1 payments to support the distribution of the products.
Economies of scale. The Board also considered the effect of the Portfolios’ growth in size on their fees. The Board noted that the fee schedules for most of the Portfolios contain breakpoints that reduce the fee rate above specified asset levels. The Board noted those Portfolios that did not contain breakpoints in the advisory fee and took into account management’s discussion of the same. The Board noted that those Portfolios with advisory fee schedules containing breakpoints generally reflect the inclusion of breakpoints in the sub-advisory fee schedule for such Portfolios. The Board considered the effective fees under the Advisory Agreement for a Portfolio as a percentage of assets at different asset levels and possible economies of scale that may be realized if the assets of the Portfolio grow. Among other data, the Board examined the effect of a Portfolio’s growth in size on various fee schedules and reviewed the Lipper and Bobroff Reports, which compared fees among peers. The Board also generally noted that if a Portfolio’s assets increase over time, the Portfolio may realize other economies of scale if assets increase proportionally more than certain other fixed expenses. In addition, the Board noted that the Adviser had taken a number of steps to date intended to share the benefits of economies of scale with contractholders.
With respect to the MetLife Conservative to Moderate Allocation Portfolio, the Board took into account that the Portfolio’s advisory fee contains breakpoints that reduce the advisory fee rate on assets above certain specified asset levels. The Board considered the fact that the Portfolio’s fee levels decline as portfolio assets increase.
Other factors. As part of its evaluation of the Adviser’s compensation, the Board considered other benefits that may be realized by the Adviser and its affiliates from their relationship with the Trusts. Among them, the Board recognized that an affiliate of the Adviser, MetLife Investors Distribution Company, serves as the Distributor for the Trusts, and, as such, receives payments pursuant to Rule 12b-1 from the Portfolios to compensate it for providing shareholder services and selling activities, which could lead to growth in the Trusts’ assets and corresponding benefits from such growth, including economies of scale. The Board also considered that affiliates of the Adviser may benefit from certain indirect tax benefits relating to dividend received deductions and foreign tax credits. In conjunction with these considerations, the Board noted the costs of providing investment management and other services to the Portfolios and the ongoing commitment of the Adviser to the Portfolios.
The Board considered possible conflicts of interest in the form of material benefits or detriments to the Trusts resulting from the nature of the Trusts’ and the Adviser’s affiliations and the services that are provided to the Trusts, and the manner in which such conflicts were mitigated.
Conclusions. After full consideration of the factors discussed above, the Board, including a majority of the Independent Trustees, approved the Advisory Agreement and the Sub-Advisory Agreement, as applicable, with respect to each Portfolio, unless otherwise noted. In making its approvals, the Board concluded that the nature, extent and quality of services provided by the Adviser supported the renewal of the Agreements. The Board also concluded that the investment performance of each Fund was such that each Agreement should continue. In addition, the Board concluded that fees paid by a Portfolio to the Adviser appeared to be acceptable in light of nature, extent and quality of the services provided by the Adviser. Further, the Board concluded that the Adviser’s profitability in providing services under the Advisory Agreements did not appear unreasonably high in light of the nature, extent and quality of the services provided by the Adviser. Finally, the Board concluded that the Advisory fees in some measure share economies of scale with contractholders. In approving the renewal of each of the Agreements, the Board, including the Independent Trustees, did not identify any single factor as controlling, and generally attributed different weights to various factors for the various Portfolios. The Board evaluated all information available to them on a Portfolio-by-Portfolio basis, and their decisions were made separately with respect to each Portfolio.
MSF-20
Metropolitan Series Fund
MetLife Moderate Allocation Portfolio
Managed by MetLife Advisers, LLC
Portfolio Manager Commentary*
PERFORMANCE
For the one year period ended December 31, 2013, the Class A and B shares of the MetLife Moderate Allocation Portfolio returned 18.29% and 17.98%, respectively. The Portfolio’s benchmark, the Dow Jones Moderate Index1, returned 14.46%.
MARKET ENVIRONMENT / CONDITIONS
Global economic expansion was in low gear through much of 2013, becoming more bifurcated in the second half of the year. Developed economies continued to strengthen whereas emerging markets faced the dual challenges of slowing growth and tighter global financial conditions. In the U.S., equity markets rallied in the first quarter but experienced a sharp decline in May and June when the Federal Reserve (the “Fed”) hinted at the possibility of reducing its unprecedented bond-buying program. This announcement subsequently sent global markets into a plunge. Domestically, Treasury yields rose while credit spreads widened. The dollar rallied and Treasury Inflation Protected Securities (“TIPS”) posted a substantial loss on reduced inflation expectations. Emerging markets sold off while their currencies tumbled against the U.S. dollar. Volatility spiked in bond and currency markets. The Fed’s accommodative language and policy stance boosted risk appetite in the third quarter and sent investors back into risk assets. Equity performance was strong both domestically and outside of the U.S. Credit spreads tightened, resulting in solid excess returns in both investment grade and high yield bond sectors. Volatility came down significantly in both equity and rate markets following the late September Federal Open Market Committee decision not to pare back the Fed’s asset-purchasing program. Economic reports that came out in the fourth quarter indicated robust domestic growth which in turn boosted investor confidence and made the looming taper even more likely. In December, reduced fiscal drag, falling unemployment and stronger economic growth prompted the Fed to announce a $10 billion reduction in the level of its asset-buying program starting in January 2014, causing stock markets to rally sharply on the news.
The vast majority of global equity markets concluded the year in record territories, supported by accommodative monetary policies around the world. The U.S. equity market outperformed the rest of the world with the S&P 500 Index up 32.4%, trailed by Japan (27.2%), Europe (25.2%), and Asia-Pacific ex-Japan (5.5%), as reported by MSCI. Within U.S. equity markets, smaller cap names generally delivered a better performance than their large cap counterparts. Growth stocks modestly outpaced value stocks over the trailing one year period, most prominently in the small cap space. In terms of sectors, Consumer Discretionary, Health Care, and Industrials proved to be the best performing sectors, while Telecom and Utility stocks trailed. Emerging market equities, however, produced a moderately negative return in 2013 after an impressive 2012. Growing signs of strength in the U.S. economy raised speculation that the Fed would start reducing its stimulus sooner than anticipated. Disappointing economic data across the developing world also reduced investors’ risk appetite as the year progressed.
Within fixed income, interest rate risk drove the majority of domestic bond sectors into negative territory, especially in longer dated securities as the yield curve steepened. High Yield Credit was the only bright spot with a positive 7.4% return for the year. Investors’ demand for additional yield provided steady support for high yield issues throughout 2013, and resulted in meaningful spread narrowing. Internationally, peripheral European debt enjoyed double digit returns for U.S. investors stemming from the combination of positive local returns and the euro strengthening against the dollar. On the other extreme, the Barclays Global Japan Index fell 16.0%, driven entirely by a large currency depreciation induced by Japan’s Prime Minister Shinzo Abe. With Japan being the largest component of the Barclays Global Aggregate ex-U.S. Index, the Index as a whole was down 3.1% for the year. Similar to the equity side, emerging market debt struggled and produced a negative return in 2013, due largely to weak emerging market currencies vis-à-vis the dollar.
PORTFOLIO REVIEW / PERIOD END POSITIONING
The MetLife Moderate Allocation Portfolio invested in underlying portfolios of the Met Investors Series Trust and the Metropolitan Series Fund to maintain a broad asset allocation of approximately 60% to equities and 40% to fixed income. The Portfolio delivered a strong double digit return during the twelve month period. Relative to the Dow Jones Moderate Index, the Portfolio outperformed due to a combination of asset class exposures and favorable security selection in the underlying portfolios. From an asset class exposure perspective, a moderate overweight to high yield bonds due to the opportunistic positioning of the core bond managers along with a slight overweight to equity compared to the benchmark contributed positively to relative performance.
Domestic equity was the big winner in 2013. Not only did our U.S. equity portfolios generate the best absolute return relative to international equity and fixed income underlying portfolios, they also produced the best asset class specific excess return derived from solid stock selection. Outperformance was most pronounced in the large cap space across value and growth spectrum. The ClearBridge Aggressive Growth Portfolio was the leading contributor in the domestic equity space. Both stock selection and sector allocation made positive contributions to the portfolio’s relative performance. In particular, stock selection in the Health Care and Information Technology (“IT”) sectors were most effective. Additionally, an overweight in the Health Care sector and underweights in the IT, Consumer Staples, Telecom, Financials, and Materials sectors also aided results for the period. Other domestic equity portfolios that provided a strong contribution on the positive side included MFS Value Portfolio, Invesco Comstock Portfolio, and T. Rowe Price Large Cap Growth Portfolio. The MFS Value Portfolio’s sector positioning, namely an underweight in the bottom performing Utilities sector combined with an overweight in the better performing Industrials sector, benefited the portfolio. Additionally, its stock selection within the Financials sector was effective across a large number of names. Both the Invesco Comstock Portfolio’s and T. Rowe Price Large Cap Growth
MSF-1
Metropolitan Series Fund
MetLife Moderate Allocation Portfolio
Managed by MetLife Advisers, LLC
Portfolio Manager Commentary*—(Continued)
Portfolio’s strong performance was driven by favorable stock selection. In contrast, several mid cap and small cap equity portfolios detracted from relative performance, however, to a lesser degree.
The results from the underlying international equity portfolios were mixed. The two portfolios that provide exposure to emerging markets and real estate investment trusts (“REITs”) generally have lower correlations with the rest of the equity market and therefore add diversification benefits to the Portfolio. Unfortunately, these two asset classes had a difficult year in 2013. As a result, MFS Emerging Markets Equity Portfolio and Clarion Global Real Estate Portfolio significantly hindered the overall performance. On a relative basis, while the Harris Oakmark International Portfolio produced the largest positive contribution among all equity portfolios, that positive effect was more than offset by the underperformance generated from several other international portfolios, especially the Clarion Global Real Estate Portfolio.
The fixed income portion of the Portfolio produced a slightly positive impact on relative performance. Not surprisingly, the PIMCO Inflation Protected Bond Portfolio was the largest performance detractor given that TIPS was the worst performing fixed income segment during the year. That negative contribution was more than offset by positive contributions from several other underlying bond portfolios, including the Met/Templeton International Bond Portfolio and the Western Asset Management U.S. Government Portfolio. While the PIMCO Inflation Protected Bond Portfolio was largely an asset class story, the portfolios on the positive side were a successful security selection story in the sense that they generated a positive excess return relative to their respective asset class indices. The Met/Templeton International Bond Portfolio generated a large outperformance against its benchmark, driven primarily by the portfolio’s currency positioning. More specifically, a sizable underweight in Japanese yen proved to be the right decision as the yen tumbled against the dollar. The Western Asset Management U.S. Government Portfolio performed particularly well in the Mortgage-Backed Securities sector, an area in which it has been consistently adding value.
Investment Committee
MetLife Advisers, LLC
* This commentary may include statements that constitute “forward-looking statements” under the U.S. securities laws. Forward-looking statements include, among other things, projections, estimates, and information about possible or future results related to the Portfolio, market or regulatory developments. The views expressed above are not guarantees of future performance or economic results and involve certain risks, uncertainties and assumptions that could cause actual outcomes and results to differ materially from the views expressed herein. The views expressed above are subject to change at any time based upon economic, market, or other conditions and the advisory firm undertakes no obligation to update the views expressed herein. Any discussions of specific securities should not be considered a recommendation to buy or sell those securities. The views expressed above (including any forward-looking statement) may not be relied upon as investment advice or as an indication of the Portfolio’s trading intent. Information about the Portfolio’s holdings, asset allocation or country diversification is historical and is not an indication of future Portfolio composition, which may vary. Direct investment in any index is not possible. The performance of any index mentioned in this commentary has not been adjusted for ongoing management, distribution and operating expenses, and sales charges applicable to mutual fund investments. In addition, the returns do not reflect additional fees charged by separate accounts or variable insurance contracts that an investor in the Portfolio may pay. If these additional fees were reflected, performance would have been lower.
MSF-2
Metropolitan Series Fund
MetLife Moderate Allocation Portfolio
A $10,000 INVESTMENT COMPARED TO THE DOW JONES MODERATE INDEX

AVERAGE ANNUAL RETURNS (%) (FOR THE YEAR ENDED DECEMBER 31, 2013)
| | | | | | | | | | | | |
| | | 1 Year | | | 5 Year | | | Since Inception2 | |
| MetLife Moderate Allocation Portfolio | | | | | | | | | | | | |
Class A | | | 18.29 | | | | 13.81 | | | | 6.61 | |
Class B | | | 17.98 | | | | 13.54 | | | | 6.35 | |
| Dow Jones Moderate Index | | | 14.46 | | | | 12.49 | | | | 7.04 | |
1 The Dow Jones Moderate Index is a total returns index designed to provide asset allocation strategists with a target risk benchmark. Each month, the Index adjusts its weighting of stocks, bonds, and cash indices (both domestic and foreign) from Barclays and Dow Jones such that the risk combination will have 60% of the risk of an all equity portfolio.
2 Inception date of the Class A and Class B shares is 5/2/05. Index since inception return is based on the Portfolio’s inception date.
Portfolio performance is calculated including reinvestment of all income and capital gain distributions. Performance numbers are net of all Portfolio expenses but do not include any insurance, sales, separate account or administrative charges of variable annuity or life insurance contracts or any additional expenses that participants may bear relating to the operations of their plans. If these charges were included, the returns would be lower. The performance of any index referenced above has not been adjusted for ongoing management, distribution and operating expenses, and sales charges applicable to mutual fund investments. Direct investment in any index is not possible. The performance of Class A shares, as set forth in the line graph above, will differ from that of other classes because of the difference in expenses paid by policyholders investing in the different share classes.
This information represents past performance and is not indicative of future results. Investment return and principal value may fluctuate so that shares, upon redemption, may be worth more or less than the original cost.
PORTFOLIO COMPOSITION AS OF DECEMBER 31, 2013
Top Holdings
| | | | |
| | | % of
Net Assets | |
| PIMCO Total Return Portfolio (Class A) | | | 8.5 | |
| BlackRock Bond Income Portfolio (Class A) | | | 6.1 | |
| MFS Value Portfolio (Class A) | | | 5.3 | |
| WMC Core Equity Opportunities Portfolio (formerly Davis Venture Value Portfolio) (Class A) | | | 5.2 | |
| Western Asset Management U.S. Government Portfolio (Class A) | | | 4.7 | |
| Invesco Comstock Portfolio (Class A) | | | 4.4 | |
| T. Rowe Price Large Cap Value Portfolio (Class A) | | | 4.4 | |
| JPMorgan Core Bond Portfolio (Class A) | | | 4.2 | |
| BlackRock Large Cap Value Portfolio (Class A) | | | 4.2 | |
| Jennison Growth Portfolio (Class A) | | | 3.9 | |
MSF-3
Metropolitan Series Fund
MetLife Moderate Allocation Portfolio
Understanding Your Portfolio’s Expenses
Shareholder Expense Example
As a shareholder of the Portfolio, you incur ongoing costs, including management fees; distribution and service (12b-1) fees; and other Portfolio expenses. This example is intended to help you understand your ongoing costs (in dollars) (referred to as “expenses”) of investing in the Portfolio and compare these costs with the ongoing costs of investing in other mutual funds. The example is based on an investment of $1,000 invested at the beginning of the period and held for the entire period, July 1, 2013 through December 31, 2013.
Actual Expenses
The first line for each share class of the Portfolio in the table below provides information about actual account values and actual expenses. You may use the information in this line, together with the amount you invested in the particular share class of the Portfolio, to estimate the expenses that you paid over the period. Simply divide your account value by $1,000 (for example, an $8,600 account value divided by $1,000 = 8.6), then multiply the result by the number in the first line under the heading entitled “Expenses Paid During Period” to estimate the expenses you paid on your account during this period.
Hypothetical Example for Comparison Purposes
The second line for each share class of the Portfolio in the table below provides information about hypothetical account values and hypothetical expenses based on the Portfolio’s actual expense ratio and an assumed rate of return of 5% per year before expenses, which is not the Portfolio’s actual return. The hypothetical account values and expenses may not be used to estimate the actual ending account balance or expenses you paid for the period. You may use this information to compare the ongoing costs of investing in the Portfolio and other funds. To do so, compare this 5% hypothetical example with the 5% hypothetical examples that appear in the shareholder reports of the other funds.
Please note that the expenses shown in the table are meant to highlight your ongoing costs only and do not reflect any fees or charges of your variable insurance product or any additional expenses that participants in certain eligible qualified plans may bear relating to the operations of their plan. Therefore, the second line for each share class in the table is useful in comparing ongoing costs only, and will not help you determine the relative total costs of owning different funds. In addition, if these other costs were included, your costs would have been higher.
| | | | | | | | | | | | | | | | | | |
MetLife Moderate Allocation Portfolio | | | | Annualized
Expense
Ratio | | | Beginning
Account Value
July 1,
2013 | | | Ending
Account Value
December 31,
2013 | | | Expenses Paid
During Period**
July 1, 2013
to
December 31,
2013 | |
Class A(a) | | Actual | | | 0.67 | % | | $ | 1,000.00 | | | $ | 1,113.50 | | | $ | 3.57 | |
| | Hypothetical* | | | 0.67 | % | | $ | 1,000.00 | | | $ | 1,021.83 | | | $ | 3.41 | |
| | | | | |
Class B(a) | | Actual | | | 0.92 | % | | $ | 1,000.00 | | | $ | 1,113.00 | | | $ | 4.90 | |
| | Hypothetical* | | | 0.92 | % | | $ | 1,000.00 | | | $ | 1,020.57 | | | $ | 4.69 | |
* Hypothetical assumes a rate of return of 5% per year before expenses.
** Expenses paid are equal to the Portfolio’s annualized expense ratio for the most recent six month period, as shown above, multiplied by the average account value over the period, multiplied by the number of days (184 days) in the most recent fiscal half-year, divided by 365 (to reflect the one-half year period).
(a) The annualized expense ratio reflects the expenses of both the Portfolio and the Underlying Portfolios in which it invests.
MSF-4
Metropolitan Series Fund
MetLife Moderate Allocation Portfolio
Schedule of Investments as of December 31, 2013
Mutual Funds—100.0% of Net Assets
| | | | | | | | |
| Security Description | | Shares | | | Value | |
|
Affiliated Investment Companies—100.0% | |
Baillie Gifford International Stock Portfolio (Class A) (a) | | | 16,757,595 | | | $ | 176,625,049 | |
BlackRock Bond Income Portfolio (Class A) (a) | | | 3,281,051 | | | | 352,155,204 | |
BlackRock Capital Appreciation Portfolio (Class A) (a) | | | 3,995,975 | | | | 151,247,656 | |
BlackRock High Yield Portfolio (Class A) (b) | | | 3,831,483 | | | | 33,985,251 | |
BlackRock Large Cap Value Portfolio (Class A) (a) | | | 19,948,238 | | | | 239,777,820 | |
Clarion Global Real Estate Portfolio (Class A) (b) | | | 9,567,506 | | | | 106,582,015 | |
ClearBridge Aggressive Growth Portfolio (Class A) (b) | | | 11,521,236 | | | | 154,960,620 | |
Goldman Sachs Mid Cap Value Portfolio (Class A) (b) | | | 3,368,370 | | | | 59,822,247 | |
Harris Oakmark International Portfolio (Class A) (b) | | | 9,251,039 | | | | 176,972,368 | |
Invesco Comstock Portfolio (Class A) (b) | | | 17,359,089 | | | | 253,095,515 | |
Invesco Small Cap Growth Portfolio (Class A) (b) | | | 7,437,714 | | | | 152,696,268 | |
Jennison Growth Portfolio (Class A) (a) | | | 14,108,871 | | | | 223,202,335 | |
JPMorgan Core Bond Portfolio (Class A) (b) | | | 23,892,401 | | | | 242,985,721 | |
JPMorgan Small Cap Value Portfolio (Class A) (b) | | | 2,998,775 | | | | 59,765,584 | |
Loomis Sayles Small Cap Growth Portfolio (Class A) (a) (c) | | | 3,632,397 | | | | 60,116,167 | |
Lord Abbett Bond Debenture Portfolio (Class A) (b) | | | 2,924,363 | | | | 39,625,121 | |
Met/Artisan Mid Cap Value Portfolio (Class A) (a) | | | 222,153 | | | | 59,670,283 | |
Met/Dimensional International Small Company Portfolio (Class A) (a) | | | 3,557,396 | | | | 59,870,966 | |
Met/Eaton Vance Floating Rate Portfolio (Class A) (b) | | | 10,367,598 | | | | 110,207,567 | |
Met/Franklin Low Duration Total Return Portfolio (Class A) (b) | | | 16,341,675 | | | | 164,560,671 | |
Met/Templeton International Bond Portfolio (Class A) (b) | | | 14,024,109 | | | | 164,362,559 | |
MFS Emerging Markets Equity Portfolio (Class A) (b) | | | 9,200,408 | | | | 95,408,227 | |
MFS Research International Portfolio (Class A) (b) | | | 11,054,527 | | | | 132,764,871 | |
MFS Value Portfolio (Class A) (a) | | | 17,028,061 | | | | 302,248,089 | |
Neuberger Berman Genesis Portfolio (Class A) (a) | | | 5,028,181 | | | | 91,211,201 | |
|
Affiliated Investment Companies—(Continued) | |
PIMCO Inflation Protected Bond Portfolio (Class A) (b) | | | 16,046,401 | | | | 159,661,694 | |
PIMCO Total Return Portfolio (Class A) (b) | | | 41,095,101 | | | | 487,798,851 | |
T. Rowe Price Large Cap Growth Portfolio (Class A) (a) | | | 9,094,824 | | | | 222,914,146 | |
T. Rowe Price Large Cap Value Portfolio (Class A) (b) | | | 7,839,091 | | | | 252,026,792 | |
T. Rowe Price Mid Cap Growth Portfolio (Class A) (b) | | | 4,918,420 | | | | 60,447,383 | |
T. Rowe Price Small Cap Growth Portfolio (Class A) (a) | | | 1,283,538 | | | | 30,509,694 | |
Third Avenue Small Cap Value Portfolio (Class A) (b) | | | 7,180,783 | | | | 151,083,685 | |
Van Eck Global Natural Resources Portfolio (Class A) (a) | | | 8,009,776 | | | | 113,818,920 | |
Western Asset Management Strategic Bond Opportunities Portfolio (Class A) (a) | | | 2,833,312 | | | | 38,108,047 | |
Western Asset Management U.S. Government Portfolio (Class A) (a) | | | 22,624,854 | | | | 271,724,494 | |
WMC Core Equity Opportunities Portfolio (formerly Davis Venture Value Portfolio) (Class A) (a) | | | 7,023,969 | | | | 301,819,938 | |
| | | | | | | | |
Total Mutual Funds
(Cost $4,788,509,272) | | | | | | | 5,753,833,019 | |
| | | | | | | | |
Total Investments—100.0%
(Cost $4,788,509,272) (d) | | | | | | | 5,753,833,019 | |
Other assets and liabilities (net)—0.0% | | | | | | | (1,485,915 | ) |
| | | | | | | | |
| Net Assets—100.0% | | | | | | $ | 5,752,347,104 | |
| | | | | | | | |
| (a) | A Portfolio of Metropolitan Series Fund. (See Note 6 of the Notes to Financial Statements for a summary of transactions in the securities of affiliated issuers.) |
| (b) | A Portfolio of Met Investors Series Trust. (See Note 6 of the Notes to Financial Statements for a summary of transactions in the securities of affiliated issuers.) |
| (c) | Non-income producing security. |
| (d) | As of December 31, 2013, the aggregate cost of investments for federal income tax purposes was $4,834,849,547. The aggregate unrealized appreciation and depreciation of investments were $956,275,173 and $(37,291,701), respectively, resulting in net unrealized appreciation of $918,983,472 for federal income tax purposes. |
See accompanying notes to financial statements.
MSF-5
Metropolitan Series Fund
MetLife Moderate Allocation Portfolio
Schedule of Investments as of December 31, 2013
Fair Value Hierarchy
Accounting principles generally accepted in the United States of America (“GAAP”) define fair market value as the price that the Portfolio would receive to sell an asset or pay to transfer a liability in an orderly transaction between market participants at the measurement date. It establishes a fair value hierarchy that prioritizes inputs to valuation methods and requires disclosure of the fair value hierarchy that segregates fair value measurements into three levels. Levels 1, 2 and 3 of the fair value hierarchy are defined as follows:
Level 1 - unadjusted quoted prices in active markets for identical investments
Level 2 - other significant observable inputs (including, but not limited to, unadjusted quoted prices for similar investments in markets that are either active or inactive; inputs other than quoted prices that are observable such as interest rates, yield curves, volatilities, prepayment speeds, loss severities, credit risks, default rates, etc.)
Level 3 - significant unobservable inputs based on the best information available in the circumstances, to the extent observable inputs are unavailable (including the Portfolio’s own assumptions in determining the fair value of investments)
The inputs or methodologies used for valuing investments are not necessarily an indication of the risk associated with investing in them. Changes to the inputs or methodologies used may result in transfers between levels, which will be recognized as of the beginning of the reporting period. Information on transfers between Level 1 and Level 2, if any, will be disclosed following the fair value hierarchy table below. A reconciliation of Level 3 securities, if any, will also be disclosed following the fair value hierarchy table. For more information about the Portfolio’s policy regarding the valuation of investments, please refer to the Notes to Financial Statements.
The following table summarizes the fair value hierarchy of the Portfolio’s investments as of December 31, 2013:
| | | | | | | | | | | | | | | | |
| Description | | Level 1 | | | Level 2 | | | Level 3 | | | Total | |
| Mutual Funds | | | | | | | | | | | | | | | | |
Affiliated Investment Companies | | $ | 5,753,833,019 | | | $ | — | | | $ | — | | | $ | 5,753,833,019 | |
Total Investments | | $ | 5,753,833,019 | | | $ | — | | | $ | — | | | $ | 5,753,833,019 | |
| | | | | | | | | | | | | | | | | |
See accompanying notes to financial statements.
MSF-6
Metropolitan Series Fund
MetLife Moderate Allocation Portfolio
Statement of Assets and Liabilities
December 31, 2013
| | | | |
Assets | | | | |
Affiliated investments at value (a) | | $ | 5,753,833,019 | |
Receivable for: | | | | |
Investments sold | | | 1,251,510 | |
Fund shares sold | | | 994,117 | |
| | | | |
Total Assets | | | 5,756,078,646 | |
Liabilities | | | | |
Payables for: | | | | |
Fund shares redeemed | | | 2,245,628 | |
Accrued expenses: | | | | |
Management fees | | | 272,885 | |
Distribution and service fees | | | 1,135,665 | |
Deferred trustees’ fees | | | 48,554 | |
Other expenses | | | 28,810 | |
| | | | |
Total Liabilities | | | 3,731,542 | |
| | | | |
Net Assets | | $ | 5,752,347,104 | |
| | | | |
Net assets consist of: | | | | |
Paid in surplus | | $ | 4,494,471,902 | |
Undistributed net investment income | | | 118,231,029 | |
Accumulated net realized gain | | | 174,320,426 | |
Unrealized appreciation on affiliated investments | | | 965,323,747 | |
| | | | |
Net Assets | | $ | 5,752,347,104 | |
| | | | |
Net Assets | | | | |
Class A | | $ | 331,583,184 | |
Class B | | | 5,420,763,920 | |
Capital Shares Outstanding* | | | | |
Class A | | | 24,130,430 | |
Class B | | | 396,048,435 | |
Net Asset Value, Offering Price and Redemption Price Per Share | | | | |
Class A | | $ | 13.74 | |
Class B | | | 13.69 | |
| * | The Portfolio is authorized to issue an unlimited number of shares. |
| (a) | Identified cost of affiliated investments was $4,788,509,272. |
Statement of Operations
Year Ended December 31, 2013
| | | | |
Investment Income | | | | |
Dividends from Affiliated Underlying Portfolios | | $ | 109,444,329 | |
| | | | |
Total investment income | | | 109,444,329 | |
Expenses | | | | |
Management fees | | | 3,083,139 | |
Administration fees | | | 11,548 | |
Custodian and accounting fees | | | 25,120 | |
Distribution and service fees—Class B | | | 12,775,297 | |
Audit and tax services | | | 27,722 | |
Legal | | | 36,954 | |
Trustees’ fees and expenses | | | 35,359 | |
Miscellaneous | | | 14,088 | |
| | | | |
Total expenses | | | 16,009,227 | |
| | | | |
Net Investment Income | | | 93,435,102 | |
| | | | |
Net Realized and Unrealized Gain | | | | |
| Net realized gain on: | | | | |
Affiliated investments | | | 186,853,514 | |
Capital gain distributions from Affiliated Underlying Portfolios | | | 71,793,579 | |
| | | | |
Net realized gain | | | 258,647,093 | |
| | | | |
Net change in unrealized appreciation on affiliated investments | | | 542,145,252 | |
| | | | |
Net realized and unrealized gain | | | 800,792,345 | |
| | | | |
Net Increase in Net Assets From Operations | | $ | 894,227,447 | |
| | | | |
See accompanying notes to financial statements.
MSF-7
Metropolitan Series Fund
MetLife Moderate Allocation Portfolio
Statements of Changes in Net Assets
| | | | | | | | |
| | | Year Ended
December 31,
2013 | | | Year Ended
December 31,
2012 | |
Increase (Decrease) in Net Assets: | | | | | | | | |
From Operations | | | | | | | | |
Net investment income | | $ | 93,435,102 | | | $ | 90,622,912 | |
Net realized gain | | | 258,647,093 | | | | 118,023,043 | |
Net change in unrealized appreciation | | | 542,145,252 | | | | 403,300,249 | |
| | | | | | | | |
Increase in net assets from operations | | | 894,227,447 | | | | 611,946,204 | |
| | | | | | | | |
From Distributions to Shareholders | | | | | | | | |
Net investment income | | | | | | | | |
Class A | | | (6,579,578 | ) | | | (6,514,397 | ) |
Class B | | | (98,876,180 | ) | | | (108,951,696 | ) |
Net realized capital gains | | | | | | | | |
Class A | | | (2,396,846 | ) | | | 0 | |
Class B | | | (40,341,482 | ) | | | 0 | |
| | | | | | | | |
Total distributions | | | (148,194,086 | ) | | | (115,466,093 | ) |
| | | | | | | | |
Decrease in net assets from capital share transactions | | | (68,950,282 | ) | | | (121,583,518 | ) |
| | | | | | | | |
Total increase in net assets | | | 677,083,079 | | | | 374,896,593 | |
| | |
Net Assets | | | | | | | | |
Beginning of period | | | 5,075,264,025 | | | | 4,700,367,432 | |
| | | | | | | | |
End of period | | $ | 5,752,347,104 | | | $ | 5,075,264,025 | |
| | | | | | | | |
Undistributed Net Investment Income | | | | | | | | |
End of period | | $ | 118,231,029 | | | $ | 105,057,367 | |
| | | | | | | | |
Other Information:
Capital Shares
Transactions in capital shares were as follows:
| | | | | | | | | | | | | | | | |
| | | Year Ended
December 31, 2013 | | | Year Ended
December 31, 2012 | |
| | | Shares | | | Value | | | Shares | | | Value | |
Class A | | | | | | | | | | | | | | | | |
Sales | | | 3,759,163 | | | $ | 47,811,309 | | | | 3,124,210 | | | $ | 35,869,291 | |
Reinvestments | | | 738,193 | | | | 8,976,424 | | | | 574,461 | | | | 6,514,397 | |
Redemptions | | | (3,300,963 | ) | | | (42,156,876 | ) | | | (2,836,871 | ) | | | (32,497,132 | ) |
| | | | | | | | | | | | | | | | |
Net increase | | | 1,196,393 | | | $ | 14,630,857 | | | | 861,800 | | | $ | 9,886,556 | |
| | | | | | | | | | | | | | | | |
Class B | | | | | | | | | | | | | | | | |
Sales | | | 14,696,439 | | | $ | 187,617,520 | | | | 13,308,058 | | | $ | 151,996,374 | |
Reinvestments | | | 11,477,136 | | | | 139,217,662 | | | | 9,633,218 | | | | 108,951,696 | |
Redemptions | | | (32,218,569 | ) | | | (410,416,321 | ) | | | (34,347,352 | ) | | | (392,418,144 | ) |
| | | | | | | | | | | | | | | | |
Net decrease | | | (6,044,994 | ) | | $ | (83,581,139 | ) | | | (11,406,076 | ) | | $ | (131,470,074 | ) |
| | | | | | | | | | | | | | | | |
Decrease derived from capital shares transactions | | | | | | $ | (68,950,282 | ) | | | | | | $ | (121,583,518 | ) |
| | | | | | | | | | | | | | | | |
See accompanying notes to financial statements.
MSF-8
Metropolitan Series Fund
MetLife Moderate Allocation Portfolio
Financial Highlights
| | | | | | | | | | | | | | | | | | | | |
| Selected per share data | | | | | | | | | | | | | | | |
| | | Class A | |
| | | Year Ended December 31, | |
| | | 2013 | | | 2012 | | | 2011 | | | 2010 | | | 2009 | |
Net Asset Value, Beginning of Period | | $ | 11.98 | | | $ | 10.83 | | | $ | 11.14 | | | $ | 10.09 | | | $ | 8.40 | |
| | | | | | | | | | | | | | | | | | | | |
Income (Loss) from Investment Operations | | | | | | | | | | | | | | | | | | | | |
Net investment income (a) | | | 0.25 | | | | 0.23 | | | | 0.22 | | | | 0.20 | | | | 0.30 | |
Net realized and unrealized gain (loss) on investments | | | 1.89 | | | | 1.21 | | | | (0.34 | ) | | | 1.14 | | | | 1.83 | |
| | | | | | | | | | | | | | | | | | | | |
Total from investment operations | | | 2.14 | | | | 1.44 | | | | (0.12 | ) | | | 1.34 | | | | 2.13 | |
| | | | | | | | | | | | | | | | | | | | |
Less Distributions | | | | | | | | | | | | | | | | | | | | |
Distributions from net investment income | | | (0.28 | ) | | | (0.29 | ) | | | (0.19 | ) | | | (0.29 | ) | | | (0.30 | ) |
Distributions from net realized capital gains | | | (0.10 | ) | | | 0.00 | | | | 0.00 | | | | 0.00 | | | | (0.14 | ) |
| | | | | | | | | | | | | | | | | | | | |
Total distributions | | | (0.38 | ) | | | (0.29 | ) | | | (0.19 | ) | | | (0.29 | ) | | | (0.44 | ) |
| | | | | | | | | | | | | | | | | | | | |
Net Asset Value, End of Period | | $ | 13.74 | | | $ | 11.98 | | | $ | 10.83 | | | $ | 11.14 | | | $ | 10.09 | |
| | | | | | | | | | | | | | | | | | | | |
Total Return (%) (b) | | | 18.29 | | | | 13.47 | | | | (1.14 | ) | | | 13.47 | | | | 26.84 | |
| | | | | |
Ratios/Supplemental Data | | | | | | | | | | | | | | | | | | | | |
Gross ratio of expenses to average net assets (%) (c) | | | 0.06 | | | | 0.06 | | | | 0.06 | | | | 0.06 | | | | 0.07 | |
Net ratio of expenses to average net assets (%) (c) (d) | | | 0.06 | | | | 0.06 | | | | 0.06 | | | | 0.06 | | | | 0.07 | |
Ratio of net investment income to average net assets (%) (e) | | | 1.95 | | | | 2.03 | | | | 1.99 | | | | 1.95 | | | | 3.44 | |
Portfolio turnover rate (%) | | | 15 | | | | 11 | | | | 41 | | | | 14 | | | | 32 | |
Net assets, end of period (in millions) | | $ | 331.6 | | | $ | 274.8 | | | $ | 239.0 | | | $ | 233.4 | | | $ | 188.8 | |
| |
| | | Class B | |
| | | Year Ended December 31, | |
| | | 2013 | | | 2012 | | | 2011 | | | 2010 | | | 2009 | |
Net Asset Value, Beginning of Period | | $ | 11.94 | | | $ | 10.79 | | | $ | 11.10 | | | $ | 10.06 | | | $ | 8.37 | |
| | | | | | | | | | | | | | | | | | | | |
Income (Loss) from Investment Operations | | | | | | | | | | | | | | | | | | | | |
Net investment income (a) | | | 0.22 | | | | 0.21 | | | | 0.19 | | | | 0.17 | | | | 0.27 | |
Net realized and unrealized gain (loss) on investments | | | 1.88 | | | | 1.20 | | | | (0.33 | ) | | | 1.14 | | | | 1.83 | |
| | | | | | | | | | | | | | | | | | | | |
Total from investment operations | | | 2.10 | | | | 1.41 | | | | (0.14 | ) | | | 1.31 | | | | 2.10 | |
| | | | | | | | | | | | | | | | | | | | |
Less Distributions | | | | | | | | | | | | | | | | | | | | |
Distributions from net investment income | | | (0.25 | ) | | | (0.26 | ) | | | (0.17 | ) | | | (0.27 | ) | | | (0.27 | ) |
Distributions from net realized capital gains | | | (0.10 | ) | | | 0.00 | | | | 0.00 | | | | 0.00 | | | | (0.14 | ) |
| | | | | | | | | | | | | | | | | | | | |
Total distributions | | | (0.35 | ) | | | (0.26 | ) | | | (0.17 | ) | | | (0.27 | ) | | | (0.41 | ) |
| | | | | | | | | | | | | | | | | | | | |
Net Asset Value, End of Period | | $ | 13.69 | | | $ | 11.94 | | | $ | 10.79 | | | $ | 11.10 | | | $ | 10.06 | |
| | | | | | | | | | | | | | | | | | | | |
Total Return (%) (b) | | | 17.98 | | | | 13.24 | | | | (1.37 | ) | | | 13.17 | | | | 26.53 | |
| | | | | |
Ratios/Supplemental Data | | | | | | | | | | | | | | | | | | | | |
Gross ratio of expenses to average net assets (%) (c) | | | 0.31 | | | | 0.31 | | | | 0.31 | | | | 0.31 | | | | 0.32 | |
Net ratio of expenses to average net assets (%) (c) (d) | | | 0.31 | | | | 0.31 | | | | 0.31 | | | | 0.31 | | | | 0.32 | |
Ratio of net investment income to average net assets (%) (e) | | | 1.71 | | | | 1.81 | | | | 1.74 | | | | 1.64 | | | | 3.11 | |
Portfolio turnover rate (%) | | | 15 | | | | 11 | | | | 41 | | | | 14 | | | | 32 | |
Net assets, end of period (in millions) | | $ | 5,420.8 | | | $ | 4,800.4 | | | $ | 4,461.4 | | | $ | 4,219.7 | | | $ | 3,030.5 | |
| (a) | Per share amounts based on average shares outstanding during the period. |
| (b) | Total return does not reflect any insurance, sales, separate account or administrative charges of variable annuity or life insurance contracts or any additional expenses that contract owners may bear under their variable contracts. If these charges were included, the returns would be lower. |
| (c) | The ratio of operating expenses to average net assets does not include expenses of the Underlying Portfolios in which the Portfolio invests. |
| (d) | Net ratio of expenses to average net assets includes the effect of the expense limitation agreement as detailed in Note 5 of the Notes to Financial Statements. |
| (e) | Recognition of net investment income by the Asset Allocation Portfolio is affected by the timing of the declaration of dividends by the Underlying Portfolios in which it invests. |
See accompanying notes to financial statements.
MSF-9
Metropolitan Series Fund
MetLife Moderate Allocation Portfolio
Notes to Financial Statements—December 31, 2013
1. Organization
Metropolitan Series Fund (the “Trust”) is organized as a Delaware statutory trust and registered under the Investment Company Act of 1940, as amended (the “1940 Act”), as an open-end management investment company. The Trust is currently comprised of thirty series, each of which operates as a distinct investment vehicle of the Trust. The portfolio included in this report is MetLife Moderate Allocation Portfolio (the “Asset Allocation Portfolio”), which is diversified. The Asset Allocation Portfolio operates under a “fund of funds” structure, investing substantially all of its assets in other Portfolios advised by MetLife Advisers, LLC (“MetLife Advisers”), an affiliate of MetLife, Inc., or its affiliates (each, an “Underlying Portfolio,” and, collectively, the “Underlying Portfolios”).
Shares in the Asset Allocation Portfolio are not offered directly to the general public and are currently available only to separate accounts established by Metropolitan Life Insurance Company (“MetLife”) and other affiliated life insurance companies.
The Asset Allocation Portfolio has registered and offers two classes of shares: Class A and B shares. Shares of each Class of the Asset Allocation Portfolio represent an equal pro rata interest in the Asset Allocation Portfolio and generally give the shareholder the same voting, dividend, liquidation, and other rights. Investment income, realized and unrealized capital gains and losses, the common expenses of the Asset Allocation Portfolio, and certain Asset Allocation Portfolio-level expense reductions, if any, are allocated on a pro rata basis to each Class based on the relative net assets of each Class to the net assets of the Asset Allocation Portfolio. Each Class of shares differs in its respective distribution plan and such distribution expenses are allocated to that Class.
2. Significant Accounting Policies
The preparation of financial statements in conformity with accounting principles generally accepted in the United States of America (“GAAP”) requires management to make estimates and assumptions that affect the reported amounts of assets and liabilities and disclosure of contingent assets and liabilities as of the date of the financial statements and the reported amounts of income and expenses during the reporting period. Actual results could differ from those estimates. In the preparation of these financial statements, management has evaluated events and transactions subsequent to December 31, 2013 through the date the financial statements were issued.
The following is a summary of significant accounting policies consistently followed by the Asset Allocation Portfolio in the preparation of its financial statements.
Investment Valuation and Fair Value Measurements - Investments in the Underlying Portfolios are valued at their closing daily net asset value on the valuation date. Investments in the Underlying Portfolios are categorized as Level 1 within the fair value hierarchy. For information about the use of fair value pricing by the Underlying Portfolios, please refer to the prospectuses of the Underlying Portfolios.
Investment Transactions and Related Investment Income - Asset Allocation Portfolio security transactions are recorded on the trade date. Dividend income is recorded on the ex-dividend date. Realized gains and losses on investments are determined on the identified cost basis, which is the same basis used for federal income tax purposes. Capital gains distributions received from the Underlying Portfolios are recorded as net realized gain in the Statement of Operations.
Income Taxes - It is the Asset Allocation Portfolio’s policy to comply with the requirements of the Internal Revenue Code of 1986, as amended, and regulations thereunder, applicable to regulated investment companies and to distribute, with respect to each taxable year, all of its taxable income to shareholders. Therefore, no federal income tax provision is required. The Asset Allocation Portfolio files U.S. federal tax returns. No income tax returns are currently under examination. The Asset Allocation Portfolio’s federal tax returns for the prior three fiscal years remain subject to examination by the Internal Revenue Service. As of December 31, 2013, the Portfolio had no uncertain tax positions that would require financial statement recognition, or de-recognition or disclosure.
Dividends and Distributions to Shareholders - The Asset Allocation Portfolio records dividends and distributions on the ex-dividend date. Net realized gains from security transactions (if any) are generally distributed annually to shareholders. The timing and characterization of certain income and capital gains distributions are determined in accordance with federal tax regulations that may differ from GAAP. Permanent book and tax basis differences relating to shareholder distributions will result in reclassification between under/over distributed net investment income, accumulated net realized gains/losses, and paid-in surplus. Book-tax differences are primarily due to distributions from Underlying Portfolios. These adjustments have no impact on net assets or the results of operations.
3. Certain Risks
Market Risk: In the normal course of business, the Underlying Portfolios invest in securities and enter into transactions where risks exist due to fluctuations in the market (market risk) or failure of the other party to a transaction to perform (credit and counterparty risk). The value of securities held by the Underlying Portfolios may decline in response to certain events, including those directly
MSF-10
Metropolitan Series Fund
MetLife Moderate Allocation Portfolio
Notes to Financial Statements—December 31, 2013—(Continued)
involving the companies whose securities are owned by the Underlying Portfolios; conditions affecting the general economy; overall market changes; local, regional or global political, social or economic instability; currency, interest rate, and price fluctuations.
Credit and Counterparty Risk: The Underlying Portfolios may be exposed to counterparty risk, or the risk that an entity with which the Underlying Portfolios have unsettled or open transactions may default. The potential loss could exceed the value of the financial assets and liabilities recorded in the financial statements. Financial assets that potentially expose the Underlying Portfolios to credit and counterparty risk consist principally of cash due from counterparties and investments. The Underlying Portfolios manage counterparty risk by entering into agreements only with counterparties that they believe have the financial resources to honor their obligations and by monitoring the financial stability of those counterparties. The Underlying Portfolios’ investment adviser attempts to mitigate counterparty risk by (i) periodically assessing the creditworthiness of their trading partners, (ii) monitoring and/or limiting the amount of their net exposure to each individual counterparty based on the adviser’s assessment, and (iii) requiring collateral from the counterparty for certain transactions. In order to preserve certain safeguards for non-standard settlement trades, the Underlying Portfolios restrict their exposure to credit and counterparty losses by entering into master netting agreements with counterparties (approved brokers) with whom the Underlying Portfolios undertake a significant volume of transactions. Master Agreements govern the terms of certain transactions, and reduce the counterparty risk associated with relevant transactions by specifying credit protection mechanisms and providing standardization that improves legal certainty. Master Agreements can also help limit counterparty risk by specifying collateral posting arrangements at pre-arranged exposure levels.
Additional risks associated with each type of investment are described within the respective security type notes. The Asset Allocation Portfolio’s prospectus includes a discussion of the principal risks of investing in the Asset Allocation Portfolio and Underlying Portfolios in which it invests.
4. Investment Transactions
Aggregate cost of purchases and proceeds of sales of shares of the Underlying Portfolios by the Asset Allocation Portfolio, for the year ended December 31, 2013 were as follows:
| | | | | | | | | | | | |
Purchases | | | Sales | |
U.S. Government | | Non U.S. Government | | | U.S. Government | | | Non U.S. Government | |
| $0 | | $ | 814,582,346 | | | $ | 0 | | | $ | 866,333,487 | |
5. Investment Management Fees and Other Transactions with Affiliates
Investment Management Agreement - MetLife Advisers is the investment adviser to the Asset Allocation Portfolio. The Trust has entered into an investment management agreement with MetLife Advisers with respect to the Asset Allocation Portfolio. For providing investment management services to the Asset Allocation Portfolio, MetLife Advisers receives monthly compensation at the following annual rates:
| | | | | | |
Management
Fees earned by
MetLife Advisers
for the year ended
December 31, 2013 | | % per annum | | | Average Daily Net Assets |
| $3,083,139 | | | 0.100 | % | | Of the first $500 million |
| | | 0.075 | % | | Of the next $500 million |
| | | 0.050 | % | | On amounts in excess of $1 billion |
In addition to the above management fee paid to MetLife Advisers, the Asset Allocation Portfolio indirectly pays MetLife Advisers an investment advisory fee through its investments in the Underlying Portfolios.
Certain officers and trustees of the Trust may also be officers of MetLife Advisers; however, such officers and trustees receive no compensation from the Trust.
Expense Limitation Agreement - Pursuant to an expense agreement relating to each class of the Asset Allocation Portfolio, MetLife Advisers has contractually agreed, from April 29, 2013 to April 27, 2014, to waive a portion of its advisory fees or pay a portion of the other operating expenses (not including acquired fund fees and expenses, brokerage costs, interest, taxes, or extraordinary expenses) to the extent total operating expenses exceed stated annual expense limits (based on the Asset Allocation Portfolio’s then-current fiscal year). For the Asset Allocation Portfolio, this subsidy, and identical subsidies in effect in earlier periods, are subject to the obligation of each class of the Asset Allocation Portfolio to repay MetLife Advisers in future years, if any, when a class’ expenses fall below the stated expense limit pertaining to that class that was in effect at the time of the subsidy in question. Such deferred expenses may be charged to a class in a subsequent year to the extent that the charge does not cause the total expenses in such subsequent year to exceed the class’ stated expense limit that was in effect at the time of the subsidy in question; provided, however, that no class of
MSF-11
Metropolitan Series Fund
MetLife Moderate Allocation Portfolio
Notes to Financial Statements—December 31, 2013—(Continued)
the Asset Allocation Portfolio is obligated to repay any expense paid by MetLife Advisers more than five years after the end of the fiscal year in which such expense was incurred. The expense limits (annual rates as a percentage of each class of the Asset Allocation Portfolio’s net average daily net assets) in effect from April 29, 2013 to April 27, 2014 are 0.10% and 0.35% for Class A and B, respectively. As of December 31, 2013, there were no expenses deferred in prior periods subject to repayment.
Transfer Agency Agreement - MetLife serves as the transfer agent for the Trust. MetLife receives no fees for its services to the Trust under the transfer agency agreement.
Distribution and Service Fees - The Trust has a distribution agreement with MetLife Investors Distribution Company (“MIDC” or the “Distributor”) in which MIDC serves as the distributor for the Asset Allocation Portfolio’s Class A and B Shares. MIDC is a wholly-owned subsidiary of MetLife Investors Group, Inc., an affiliate of the Adviser. The Trust has also adopted a Distribution and Service Plan under Rule 12b-1 of the 1940 Act for the Asset Allocation Portfolio’s Class B shares. Under the Distribution and Services Plan, the Class B shares of the Asset Allocation Portfolio pay a fee to compensate the Insurance Companies (or their affiliates) and other broker-dealers and financial intermediaries involved in the offer and sale of Asset Allocation Portfolio shares for promoting or selling and servicing the Class B shares of the Asset Allocation Portfolio. The fees under the Distribution and Services Plan for each class of the Asset Allocation Portfolio’s shares are calculated as a percentage of the Asset Allocation Portfolio’s average daily net assets that are attributable to that Class. Currently, the fee is 0.25% per year for Class B shares. Amount incurred by the Asset Allocation Portfolio for the year ended December 31, 2013 is shown as Distribution and service fees in the Statement of Operations.
Deferred Trustee Compensation - Each Trustee who is not currently an active employee of MetLife or its affiliates receives compensation from the Trust for his or her service to the Trust. A deferred compensation plan (the “Plan”) is available to the Trustees on a voluntary basis. Deferred amounts remain in the Trust until distributed in accordance with the provisions of the Plan. The value of a participating Trustee’s deferral account is based on theoretical investments of deferred amounts, on the normal payment dates in certain portfolios of the Trust or Met Investors Series Trust, an affiliate of the Trust, as designated by the participating Trustee. Changes in the value of participants’ deferral accounts are reflected as Trustees’ fees and expenses in the Statement of Operations. The portion of the accrued obligations allocated to the Asset Allocation Portfolio under the Plan is reflected as Deferred trustees’ fees in the Statement of Assets and Liabilities.
6. Transactions in Securities of Underlying Portfolios
The Portfolio does not invest in the Underlying Portfolios for the purpose of exercising control; however, investments by the Portfolio within its principal investment strategies may represent a significant portion of the Underlying Portfolios net assets. Transactions in the Underlying Portfolios for the year ended December 31, 2013 were as follows:
| | | | | | | | | | | | | | | | |
Underlying Portfolio | | Number of
shares held at
December 31, 2012 | | | Shares
purchased | | | Shares
sold | | | Number of
shares held at
December 31, 2013 | |
Baillie Gifford International Stock | | | 16,618,294 | | | | 317,314 | | | | (178,013 | ) | | | 16,757,595 | |
BlackRock Bond Income | | | 3,496,586 | | | | 444,702 | | | | (660,237 | ) | | | 3,281,051 | |
BlackRock Capital Appreciation | | | 3,560,218 | | | | 656,682 | | | | (220,925 | ) | | | 3,995,975 | |
BlackRock High Yield | | | 5,712,500 | | | | 396,866 | | | | (2,277,883 | ) | | | 3,831,483 | |
BlackRock Large Cap Value | | | 20,712,416 | | | | 1,534,189 | | | | (2,298,367 | ) | | | 19,948,238 | |
Clarion Global Real Estate | | | 8,934,584 | | | | 889,790 | | | | (256,868 | ) | | | 9,567,506 | |
ClearBridge Aggressive Growth | | | 10,912,136 | | | | 2,412,197 | | | | (1,803,097 | ) | | | 11,521,236 | |
ClearBridge Aggressive Growth II (formerly Janus Forty) | | | 1,302,096 | | | | 344,079 | | | | (1,646,175 | ) | | | — | |
Goldman Sachs Mid Cap Value | | | 3,648,557 | | | | 181,282 | | | | (461,469 | ) | | | 3,368,370 | |
Harris Oakmark International | | | 10,237,841 | | | | 296,290 | | | | (1,283,092 | ) | | | 9,251,039 | |
Invesco Comstock | | | 18,770,093 | | | | 254,163 | | | | (1,665,167 | ) | | | 17,359,089 | |
Invesco Small Cap Growth | | | 9,846,142 | | | | 576,686 | | | | (2,985,114 | ) | | | 7,437,714 | |
Jennison Growth | | | 12,942,274 | | | | 2,148,088 | | | | (981,491 | ) | | | 14,108,871 | |
JPMorgan Core Bond | | | — | | | | 23,892,401 | | | | — | | | | 23,892,401 | |
JPMorgan Small Cap Value | | | — | | | | 3,081,313 | | | | (82,538 | ) | | | 2,998,775 | |
Loomis Sayles Small Cap Growth | | | 4,543,325 | | | | — | | | | (910,928 | ) | | | 3,632,397 | |
Lord Abbett Bond Debenture | | | 3,794,653 | | | | 217,404 | | | | (1,087,694 | ) | | | 2,924,363 | |
Met/Artisan Mid Cap Value | | | 257,563 | | | | 2,531 | | | | (37,941 | ) | | | 222,153 | |
Met/Dimensional International Small Company | | | 3,708,215 | | | | 193,238 | | | | (344,057 | ) | | | 3,557,396 | |
Met/Eaton Vance Floating Rate | | | 9,440,512 | | | | 950,053 | | | | (22,967 | ) | | | 10,367,598 | |
Met/Franklin Low Duration Total Return | | | 14,878,966 | | | | 1,496,907 | | | | (34,198 | ) | | | 16,341,675 | |
Met/Templeton International Bond | | | 12,891,592 | | | | 1,162,546 | | | | (30,029 | ) | | | 14,024,109 | |
MFS Emerging Markets Equity | | | 4,669,149 | | | | 4,545,782 | | | | (14,523 | ) | | | 9,200,408 | |
MFS Research International | | | 14,884,215 | | | | 336,962 | | | | (4,166,650 | ) | | | 11,054,527 | |
MFS Value | | | 18,431,074 | | | | 981,727 | | | | (2,384,740 | ) | | | 17,028,061 | |
MSF-12
Metropolitan Series Fund
MetLife Moderate Allocation Portfolio
Notes to Financial Statements—December 31, 2013—(Continued)
| | | | | | | | | | | | | | | | |
Underlying Portfolio | | Number of
shares held at
December 31, 2012 | | | Shares
purchased | | | Shares sold | | | Number of
shares held at
December 31, 2013 | |
Neuberger Berman Genesis | | | 7,720,802 | | | | 49,158 | | | | (2,741,779 | ) | | | 5,028,181 | |
PIMCO Inflation Protected Bond | | | 12,674,671 | | | | 3,401,106 | | | | (29,376 | ) | | | 16,046,401 | |
PIMCO Total Return | | | 43,144,204 | | | | 3,614,465 | | | | (5,663,568 | ) | | | 41,095,101 | |
Pioneer Fund | | | 3,500,927 | | | | 1,152 | | | | (3,502,079 | ) | | | — | |
T. Rowe Price Large Cap Growth | | | 8,549,302 | | | | 1,263,767 | | | | (718,245 | ) | | | 9,094,824 | |
T. Rowe Price Large Cap Value | | | 8,363,548 | | | | 149,903 | | | | (674,360 | ) | | | 7,839,091 | |
T. Rowe Price Mid Cap Growth | | | 5,369,143 | | | | 322,310 | | | | (773,033 | ) | | | 4,918,420 | |
T. Rowe Price Small Cap Growth | | | — | | | | 1,387,938 | | | | (104,400 | ) | | | 1,283,538 | |
Third Avenue Small Cap Value | | | 9,615,593 | | | | 102,603 | | | | (2,537,413 | ) | | | 7,180,783 | |
Van Eck Global Natural Resources | | | 7,771,341 | | | | 275,522 | | | | (37,087 | ) | | | 8,009,776 | |
Western Asset Management Strategic Bond Opportunities | | | 3,625,244 | | | | 225,679 | | | | (1,017,611 | ) | | | 2,833,312 | |
Western Asset Management U.S. Government | | | 20,184,552 | | | | 2,486,968 | | | | (46,666 | ) | | | 22,624,854 | |
WMC Core Equity Opportunities (formerly Davis Venture Value) | | | 7,687,496 | | | | 247,325 | | | | (910,852 | ) | | | 7,023,969 | |
| | | | |
Underlying Portfolio | | Net Realized
Gain/(Loss) on sales
of Underlying
Portfolios | | | Capital Gain
Distributions
from Underlying
Portfolios | | | Dividend Income
from Underlying
Portfolios | | | Ending Value
as of
December 31, 2013 | |
Baillie Gifford International Stock | | $ | 112,645 | | | $ | — | | | $ | 2,600,919 | | | $ | 176,625,049 | |
BlackRock Bond Income | | | 8,286,667 | | | | 7,808,328 | | | | 12,810,449 | | | | 352,155,204 | |
BlackRock Capital Appreciation | | | 848,424 | | | | — | | | | 925,481 | | | | 151,247,656 | |
BlackRock High Yield | | | 3,807,997 | | | | 842,802 | | | | 2,146,565 | | | | 33,985,251 | |
BlackRock Large Cap Value | | | 6,514,347 | | | | 12,152,605 | | | | 3,143,260 | | | | 239,777,820 | |
Clarion Global Real Estate | | | 726,798 | | | | — | | | | 7,338,680 | | | | 106,582,015 | |
ClearBridge Aggressive Growth | | | 5,191,260 | | | | — | | | | 484,239 | | | | 154,960,620 | |
ClearBridge Aggressive Growth II (formerly Janus Forty) | | | 32,327,325 | | | | — | | | | 1,071,005 | | | | — | |
Goldman Sachs Mid Cap Value | | | 960,783 | | | | 2,016,453 | | | | 626,641 | | | | 59,822,247 | |
Harris Oakmark International | | | 12,184,003 | | | | — | | | | 4,573,720 | | | | 176,972,368 | |
Invesco Comstock | | | 4,152,464 | | | | — | | | | 3,011,832 | | | | 253,095,515 | |
Invesco Small Cap Growth | | | 15,370,569 | | | | 8,411,918 | | | | 618,990 | | | | 152,696,268 | |
Jennison Growth | | | 5,280,109 | | | | 1,739,926 | | | | 708,859 | | | | 223,202,335 | |
JPMorgan Core Bond | | | — | | | | 933,088 | | | | 1,166,360 | | | | 242,985,721 | |
JPMorgan Small Cap Value | | | 212,187 | | | | — | | | | 365,931 | | | | 59,765,584 | |
Loomis Sayles Small Cap Growth | | | 2,748,826 | | | | — | | | | — | | | | 60,116,167 | |
Lord Abbett Bond Debenture | | | 2,337,549 | | | | — | | | | 2,540,588 | | | | 39,625,121 | |
Met/Artisan Mid Cap Value | | | 4,050,697 | | | | — | | | | 554,190 | | | | 59,670,283 | |
Met/Dimensional International Small Company | | | 1,199,646 | | | | 1,530,823 | | | | 1,103,362 | | | | 59,870,966 | |
Met/Eaton Vance Floating Rate | | | 19,643 | | | | 472,955 | | | | 4,180,925 | | | | 110,207,567 | |
Met/Franklin Low Duration Total Return | | | 5,834 | | | | — | | | | 2,734,342 | | | | 164,560,671 | |
Met/Templeton International Bond | | | 65,693 | | | | 682,730 | | | | 3,400,770 | | | | 164,362,559 | |
MFS Emerging Markets Equity | | | 18,135 | | | | — | | | | 1,155,624 | | | | 95,408,227 | |
MFS Research International | | | 7,742,510 | | | | — | | | | 3,493,502 | | | | 132,764,871 | |
MFS Value | | | 16,520,580 | | | | 8,989,765 | | | | 5,294,367 | | | | 302,248,089 | |
Neuberger Berman Genesis | | | 12,038,250 | | | | — | | | | 685,258 | | | | 91,211,201 | |
PIMCO Inflation Protected Bond | | | 40,687 | | | | 8,074,392 | | | | 3,393,030 | | | | 159,661,694 | |
PIMCO Total Return | | | 11,680,797 | | | | 9,124,048 | | | | 20,784,658 | | | | 487,798,851 | |
Pioneer Fund | | | 9,596,627 | | | | — | | | | 17,671 | | | | — | |
T. Rowe Price Large Cap Growth | | | 7,040,537 | | | | — | | | | 510,634 | | | | 222,914,146 | |
T. Rowe Price Large Cap Value | | | 3,575,745 | | | | — | | | | 3,963,435 | | | | 252,026,792 | |
T. Rowe Price Mid Cap Growth | | | 3,809,780 | | | | 2,889,333 | | | | 233,849 | | | | 60,447,383 | |
T. Rowe Price Small Cap Growth | | | 272,443 | | | | 1,425,014 | | | | 92,230 | | | | 30,509,694 | |
Third Avenue Small Cap Value | | | 4,281,443 | | | | — | | | | 1,718,592 | | | | 151,083,685 | |
Van Eck Global Natural Resources | | | 146,370 | | | | — | | | | 917,729 | | | | 113,818,920 | |
Western Asset Management Strategic Bond Opportunities | | | 1,968,325 | | | | — | | | | 1,823,300 | | | | 38,108,047 | |
Western Asset Management U.S. Government | | | 29,025 | | | | — | | | | 5,318,616 | | | | 271,724,494 | |
WMC Core Equity Opportunities (formerly Davis Venture Value) | | | 1,688,794 | | | | 4,699,399 | | | | 3,934,726 | | | | 301,819,938 | |
| | | | | | | | | | | | | | | | |
| | $ | 186,853,514 | | | $ | 71,793,579 | | | $ | 109,444,329 | | | $ | 5,753,833,019 | |
| | | | | | | | | | | | | | | | |
MSF-13
Metropolitan Series Fund
MetLife Moderate Allocation Portfolio
Notes to Financial Statements—December 31, 2013—(Continued)
7. Contractual Obligations
Under the Trust’s organizational documents, its officers and Trustees may be indemnified against certain liabilities and expenses arising out of the performance of their duties to the Trust. Additionally, the Trust has a variety of indemnification obligations under contracts with its service providers. The Trust’s maximum exposure under these arrangements is unknown, as this would involve future claims that may be made against the Trust that have not yet occurred.
8. Income Tax Information
The tax character of distributions paid for the years ended December 31, 2013 and 2012 were as follows:
| | | | | | | | | | | | | | | | | | | | |
Ordinary Income | | | Long-Term Capital Gain | | | Total | |
2013 | | 2012 | | | 2013 | | | 2012 | | | 2013 | | | 2012 | |
| $105,455,758 | | $ | 115,466,093 | | | $ | 42,738,328 | | | $ | — | | | $ | 148,194,086 | | | $ | 115,466,093 | |
As of December 31, 2013, the components of distributable earnings (accumulated losses) on a federal income tax basis were as follows:
| | | | | | | | | | | | | | | | |
Undistributed
Ordinary
Income | | Undistributed
Long-Term
Capital Gain | | | Net
Unrealized
Appreciation | | | Loss Carryforwards | | | Total | |
| $122,832,371 | | $ | 216,107,913 | | | $ | 918,983,472 | | | $ | — | | | $ | 1,257,923,756 | |
The Asset Allocation Portfolio utilizes the provisions of the federal income tax laws that provide for the carryforward of capital losses for prior years, offsetting such losses against any future realized capital gains. Under the Regulated Investment Company Modernization Act of 2010 (the “Act”), net capital losses recognized after December 22, 2010 may be carried forward indefinitely and their character is retained as short-term and/or long-term losses. Previously, net capital losses were carried forward for up to eight years and treated as short-term losses. As a transition rule, the Act requires that post-enactment net capital losses be used before pre-enactment net capital losses.
As of December 31, 2013, the Asset Allocation Portfolio had no post-enactment accumulated capital losses and no pre-enactment accumulated capital loss carryforwards.
9. Subsequent Events
At a meeting held on November 20, 2013, the Board, subject to shareholder approval, approved an Agreement and Plan of Reorganization providing for the acquisition of all the assets and assumption of all liabilities of MetLife Balanced Strategy Portfolio (“Balanced Strategy Portfolio”), a series of Met Investors Series Trust, by the Portfolio in exchange for shares of the Portfolio. On February 21, 2014, the shareholders of Balanced Strategy Portfolio approved the proposed Agreement and Plan of Reorganization. It is anticipated that the reorganization will close on or about April 28, 2014 and the Portfolio would be renamed MetLife Asset Allocation 60 Portfolio.
MSF-14
Metropolitan Series Fund
MetLife Moderate Allocation Portfolio
Report of Independent Registered Public Accounting Firm
To the Shareholders of MetLife Moderate Allocation Portfolio and the Board of Trustees of Metropolitan Series Fund:
We have audited the accompanying statement of assets and liabilities, including the schedule of investments, of MetLife Moderate Allocation Portfolio, one of the portfolios constituting Metropolitan Series Fund, (the “Trust”) as of December 31, 2013, and the related statement of operations for the year then ended, the statements of changes in net assets for each of the two years in the period then ended, and the financial highlights for each of the five years in the period then ended. These financial statements and financial highlights are the responsibility of the Trust’s management. Our responsibility is to express an opinion on these financial statements and financial highlights based on our audits.
We conducted our audits in accordance with the standards of the Public Company Accounting Oversight Board (United States). Those standards require that we plan and perform the audit to obtain reasonable assurance about whether the financial statements and financial highlights are free of material misstatement. The Trust is not required to have, nor were we engaged to perform, an audit of its internal control over financial reporting. Our audits included consideration of internal control over financial reporting as a basis for designing audit procedures that are appropriate in the circumstances, but not for the purpose of expressing an opinion on the effectiveness of the Trust’s internal control over financial reporting. Accordingly, we express no such opinion. An audit also includes examining, on a test basis, evidence supporting the amounts and disclosures in the financial statements, assessing the accounting principles used and significant estimates made by management, as well as evaluating the overall financial statement presentation. Our procedures included confirmation of securities owned as of December 31, 2013, by correspondence with the transfer agent. We believe that our audits provide a reasonable basis for our opinion.
In our opinion, the financial statements and financial highlights referred to above present fairly, in all material respects, the financial position of MetLife Moderate Allocation Portfolio of Metropolitan Series Fund, as of December 31, 2013, the results of its operations for the year then ended, the changes in its net assets for each of the two years in the period then ended, and the financial highlights for each of the five years in the period then ended, in conformity with accounting principles generally accepted in the United States of America.
Deloitte & Touche LLP
Boston, Massachusetts
February 27, 2014
MSF-15
Metropolitan Series Fund
Trustees and Officers of Metropolitan Series Fund
The Trustees and executive officers of the Trust, their ages and their principal occupations during the past five years are set forth below. Unless otherwise indicated, the business address of each is One Financial Center, Boston, MA 02111. Each Trustee who is deemed an “interested person,” as such term is defined in the 1940 Act, is indicated by an asterisk. Those Trustees who are not “interested persons” as defined in the 1940 Act are referred to as “Independent Trustees.” Additional information about the Trustees is available in the Statement of Additional Information, which is available without charge, upon request, by calling (800) 848-3854.
Trustees of the Trust
| | | | | | | | | | |
Name and Age | | Position(s)
Held with
Registrant | | Term of Office and
Length of Time
Served | | Principal Occupation(s) During the
Past 5 Years(1) | | Number of
Portfolios
in Fund
Complex(2)
overseen | | Other Directorships Held
by Trustee During the
Past 5 Years(1) |
| Interested Trustee | | | | | | | | | | |
| Elizabeth M. Forget* (47) | | Trustee, Chairman of the Board, President and Chief Executive Officer | | Indefinite; From May 2006 (President and Chief Executive Officer)/ August 2006 (Trustee and Chairman of the Board) to present | | Senior Vice President, MetLife Inc.; President, MetLife Advisers, LLC and a predecessor company. | | 79 | | Trustee, Met Investors Series Trust (the “MIST Trust”);** various MetLife-affiliated boards. |
| | | | | |
| Independent Trustees | | | | | | | | | | |
| Stephen M. Alderman (54) | | Trustee | | Indefinite; From April 2012 to present | | Shareholder in the law firm of Garfield & Merel, Ltd. | | 79 | | Trustee, MIST Trust;** Director, International Truck Leasing Corp. |
| | | | | |
| Robert J. Boulware (57) | | Trustee | | Indefinite; From April 2012 to present | | Managing Director, Pilgrim Funds, LLC (private equity fund). | | 79 | | Trustee, MIST Trust;** Trustee, Vertical Capital Income Fund (closed-end fund); Director, Gainsco, Inc. (auto insurance). |
| | | | | |
| Susan C. Gause (61) | | Trustee | | Indefinite; From April 2012 to present | | Private Investor. | | 79 | | Trustee, MIST Trust;** Trustee, HSBC Funds. |
| | | | | |
| Nancy Hawthorne (62) | | Trustee | | Indefinite; From May 2003 to present | | Chief Executive Officer, Clerestory LLC (corporate advisor). | | 79 | | MIST Trust;** Director, THL Credit, Inc.**; Director, Avid Technology, Inc.** |
| | | | | |
| Barbara A. Nugent (57) | | Trustee | | Indefinite; From January 2014 to present | | President, True North Board Governance, LLC (consulting); until 2014, partner in the law firm of Stradley Ronon Stevens & Young, LLP. | | 79 | | Trustee, MIST Trust**; Director, Episcopal Healthcare Foundation; until 2014, member, Mutual Fund Directors Forum Advisory Board. |
| | | | | |
| Keith M. Schappert (62) | | Trustee | | Indefinite; From August 2009 to present | | Principal, Schappert Consulting LLC (asset management consulting). | | 79 | | Trustee, MIST Trust;** Director, The Commonfund for Nonprofit Organizations; until 2011, Director, Trilogy Global Advisors; Director, Mirae Asset Discovery Funds,** Director, Calamos Investments. |
| | | | | |
| Linda B. Strumpf (66) | | Trustee | | Indefinite; From May 2000 to present | | Chair of the Investment Committee, Leona M. and Harry B. Helmsley Charitable Trust; until 2011, Chief Investment Officer, Leona M. and Harry B. Helmsley Charitable Trust. | | 79 | | Since 2012, Trustee, MIST Trust,** Trustee and Member of Investment Committee, The Pennsylvania State University. |
| | | | | |
| Dawn M. Vroegop (47) | | Trustee | | Indefinite; From May 2009 to present | | Private Investor. | | 79 | | Trustee, MIST Trust,** Trustee, Driehaus Mutual Funds; Director and Investment Committee Chair, City College of San Francisco Foundation. |
MSF-16
Metropolitan Series Fund
Trustees and Officers of Metropolitan Series Fund—(Continued)
Executive Officers of the Trust
| | | | | | |
Name and Age | | Position(s) Held with
Registrant | | Term of Office
and Length of
Time Served | | Principal Occupation(s) During Past 5 Years(1) |
| Elizabeth M. Forget (47) | | President, Chief Executive Officer, Trustee and Chairman of the Board | | From May
2006 (President
and Chief
Executive
Officer)/
August 2006
(Trustee and
Chairman of
the Board) to
present | | See principal occupation information in the table above. |
| | | |
| Jeffrey L. Bernier (42) | | Vice President | | From February
2008 to present | | Vice President, MetLife, Inc.; Senior Vice President, MetLife Advisers, LLC and a predecessor company. |
| | | |
| Peter H. Duffy (58) | | Chief Financial Officer and Treasurer | | From November
2000 to present | | Senior Vice President, MetLife Advisers, LLC; Vice President, MetLife, Inc. |
| | | |
| Andrew L. Gangolf (59) | | Secretary | | From May
2011to present | | Senior Vice President, MetLife Advisers, LLC; Senior Vice President & Assistant General Counsel, AllianceBerstein Investments, Inc. |
| | | |
| Jeffrey P. Halperin (46) | | Chief Compliance Officer | | From November
2005 to present | | Vice President, MetLife, Inc.; Chief Compliance Officer, MIST; Chief Compliance Officer, MSF Trust; Chief Compliance Officer, MetLife Advisers, LLC and a predecessor company; Chief Compliance Officer, MetLife Investment Management, LLC (formerly MetLife Investment Advisors Company, LLC). |
| | | |
| Alan C. Leland, Jr. (61) | | Vice President | | From February
2005 to present | | Treasurer and Chief Financial Officer, MetLife Advisers, LLC; Vice President, MetLife Group Inc.; Vice President, MetLife, Inc. |
| * | Ms. Forget is an “interested person” of the Trust because of her positions with MetLife Advisers, LLC and her ownership of securities issued by MetLife, Inc., the ultimate parent company of MetLife Advisers, LLC. |
| ** | Indicates a directorship with a registered investment company or a company subject to the reporting requirements of the Securities Exchange Act of 1934, as amended. |
| (1) | Previous positions during the past five years with the Trust, MetLife, Inc. or the Adviser are omitted if not materially different. |
| (2) | The Fund Complex includes 49 Portfolios of the MIST Trust and 30 Portfolios of the Trust. |
MSF-17
Metropolitan Series Fund
MetLife Moderate Allocation Portfolio
Board of Trustees’ Consideration of Advisory Agreement
At an in-person meeting of the Boards of Trustees (the “Board”) of Met Investors Series Trust and Metropolitan Series Fund (“MIST” and “MSF,” respectively, and collectively, the “Trusts”) held on November 19-20, 2013, the Board, including a majority of the Trustees who are not considered to be “interested persons” of the Trusts (the “Independent Trustees”) under the Investment Company Act of 1940, as amended (the “1940 Act”), approved for an annual period the continuation of each Trust’s advisory agreement (the “Advisory Agreement”) with MetLife Advisers, LLC (the “Adviser”) and the applicable sub-advisory agreements (each a “Sub-Advisory Agreement,” and collectively with the Advisory Agreement, the “Agreements”) between the Adviser and the investment sub-advisers (each a “Sub-Adviser,” and collectively, the “Sub-Advisers”) for each of the series of the Trusts, including the MetLife Moderate Allocation Portfolio (each a “Portfolio,” and collectively, the “Portfolios”).1 As the Adviser has the day-to-day responsibility for managing the MetLife Moderate Allocation Portfolio’s investments, the Board only approved an Advisory Agreement with respect to the MetLife Moderate Allocation Portfolio.
In considering the Agreement, the Board reviewed a variety of materials provided by the Adviser relating to the Portfolios, including comparative performance, fee and expense information for an appropriate peer group of similar mutual funds, performance information for relevant benchmark indices and other information regarding the nature, extent and quality of services provided by the Adviser under the Agreement. The Board also took into account its experience with the Adviser and information provided to the Board in its meetings throughout the year with respect to the services provided by the Adviser, including quarterly performance reports prepared by management containing reviews of investment results. The Independent Trustees also assessed reports provided by the Board’s independent consultant, who reviewed and provided analyses regarding investment performance, fees and expenses, and other information provided by, or at the direction of, the Adviser, as more fully discussed below.
The Independent Trustees were separately advised by independent legal counsel throughout the process, and met with independent legal counsel in periodic executive sessions. Prior to voting to continue the Agreements at the November meeting, the Independent Trustees also received a memorandum from their independent counsel discussing the legal standards for their consideration of the proposed continuation of the Agreements. The Board also met in person with personnel of the Adviser on September 17, 2013 for the specific purpose of giving preliminary consideration to the proposed continuation of the Agreements and to request additional information they considered reasonably necessary to their deliberations. The Independent Trustees also discussed the proposed continuation of the Agreements in private sessions with their independent legal counsel at which no representatives of management were present.
In considering whether to approve the renewal of the Advisory Agreement with the Adviser with respect to a Portfolio, the Board reviewed and analyzed the factors it deemed relevant, including: (1) the nature, extent and quality of the services to be provided to the Portfolio by the Adviser; (2) the performance of the Portfolio as compared to a peer group and an appropriate index; (3) the Adviser’s personnel and operations; (4) the financial condition of the Adviser; (5) the level and method of computing each Portfolio’s advisory fees; (6) the profitability of the Adviser under the Advisory Agreement; (7) any “fall-out” benefits to the Adviser and its affiliates (i.e., ancillary benefits realized by the Adviser or its affiliates from the Adviser’s relationship with the Trusts); (8) the anticipated effect of growth in size on Portfolio expenses; and (9) possible conflicts of interest.
Nature, extent and quality of services. The Board evaluated the nature, extent and quality of the services that the Adviser has provided to the Portfolios. The Board considered the Adviser’s services as investment manager to the Portfolios. The Adviser’s services in coordinating and overseeing the activities of the Trusts’ service providers were also considered. The Board also evaluated the expertise and performance of the personnel of the Adviser who performed services for the Portfolios throughout the year.
The Board considered information received from the Trust’s Chief Compliance Officer (“CCO”) regarding the Portfolios’ compliance policies and procedures established pursuant to Rule 38a-l under the 1940 Act.
The Board considered the provision of investment advisory services by the Adviser to the Asset Allocation Portfolios (i.e., MetLife Aggressive Strategy Portfolio, MetLife Balanced Strategy Portfolio, MetLife Conservative Allocation Portfolio, MetLife Conservative to Moderate Allocation Portfolio, MetLife Defensive Strategy Portfolio, MetLife Growth Strategy Portfolio, MetLife Moderate Allocation Portfolio, MetLife Moderate to Aggressive Allocation Portfolio and MetLife Moderate Strategy Portfolio), the American Funds of Funds (i.e., American Funds Balanced Allocation Portfolio, American Funds Growth Allocation Portfolio and American Funds Moderate Allocation Portfolio), the MetLife Balanced Plus Portfolio and the MetLife Multi-Index Targeted Risk Portfolio. With respect to the Asset Allocation Portfolios, the Board noted that the Adviser has hired, at its own cost, an independent consultant to provide research and consulting services with respect to the periodic asset allocation targets for each of the Asset Allocation Portfolios and to investments in other Portfolios of the Trusts (the “Underlying Portfolios”), which may assist the Adviser with the selection of
1 The Pyramis Managed Risk Portfolio recently commenced operations and, therefore, the Agreement with respect to this Portfolio was not up for renewal.
MSF-18
Metropolitan Series Fund
MetLife Moderate Allocation Portfolio
Board of Trustees’ Consideration of Advisory Agreement—(Continued)
Underlying Portfolios for inclusion in each Asset Allocation Portfolio. Additionally, the Board considered that an Investment Committee, consisting of investment professionals from across MetLife, meets at least quarterly to review the asset allocations and discuss the performance of the Asset Allocation Portfolios and the American Funds of Funds.
Performance. The Board considered the performance of the Portfolios as described in the quarterly reports prepared by management, and as also analyzed in reports prepared by the Independent Trustees’ independent consultant. The Board noted that the Adviser reviews with the Board on a quarterly basis detailed information about the Portfolios’ performance results, portfolio composition and investment strategies. The Board also reviewed and considered a separate report prepared by Lipper Inc. (“Lipper”), an independent third party, which provided a statistical analysis comparing the Portfolios’ investment performance, expenses, and fees to comparable funds underlying variable insurance products (the “Performance Universe”). In addition, the Independent Trustees met separately with a representative of Bobroff Consulting, Inc., an independent consultant (“Bobroff), at a special board meeting in September 2013, to review the separate reports prepared by such consultant (“Bobroff Report”), which analyzed the report prepared by Lipper. The Board also considered each Portfolio’s more recent performance subsequent to the performance period covered by the Lipper reports, and management’s discussion of the same, including the effect of current market conditions on each Portfolio’s more recent performance.
The Board reviewed the Portfolios’ performance records and the Adviser’s management styles and long-term performance records with the Portfolios and comparable funds. The Board focused particular attention on Portfolios with less favorable performance records. The Board noted that the Adviser has been active in monitoring and responding to any performance issues with respect to the Portfolios. The Board also took into account its discussions with management regarding factors that contributed to the performance of the Portfolios.
Among other data relating specifically to the MetLife Moderate Allocation Portfolio’s performance, the Board considered that the Portfolio outperformed the median of its Performance Universe and its Lipper Index for the one-, three- and five-year periods ended June 30, 2013. The Board further considered that the Portfolio outperformed the Moderate AA Broad Index for the one- and five-year periods ended October 31, 2013 and slightly underperformed its benchmark for the three-year period ended October 31, 2013.
Fees and Expenses. The Board gave consideration to the advisory fees payable under the Advisory Agreement. In this regard, the Board reviewed the advisory fees payable on a Portfolio-by-Portfolio basis based on information provided by the Adviser. The Independent Trustees, with the assistance of Bobroff, also examined the fees paid by a Portfolio in light of fees paid to other investment managers by comparable funds, as well as considered the fees charged by the Adviser to manage other comparable funds, as applicable. The Lipper report included comparisons of the Adviser’s fee schedule with that of its peers based on an asset-based analysis of relative fee structures according to the size of the Portfolio. In addition, the Board considered the Portfolios’ advisory fees and total expenses as compared to similarly situated investment companies underlying variable insurance products deemed to be comparable to the Portfolios as determined by Lipper. The Board considered a Portfolio’s ranking within a smaller group of peer funds chosen by Lipper (the “Expense Group”), as well as the Portfolio’s ranking within broader groups of funds (the “Expense Universe”). In comparing a Portfolio’s actual and contractual management fee to that of comparable funds, the Board noted that such fee includes both advisory and administrative fees. The Board also considered that the Adviser had entered into expense limitation agreements with certain of the Portfolios, pursuant to which the Adviser has agreed to waive a portion of its advisory fee and/or reimburse certain expenses as a means of limiting a Portfolio’s total annual operating expenses.
With respect to the MetLife Moderate Allocation Portfolio, the Board considered that the Portfolio’s actual management fees and total expenses (exclusive of 12b-1 fees) were below the Expense Group median and Expense Universe median. The Board also considered that the Portfolio’s contractual management fees were below the asset-weighted average of the Expense Group at the Portfolio’s current size.
Profitability. The Board examined the profitability of the Adviser on a Portfolio-by-Portfolio basis. With respect to the Asset Allocation Portfolios, the Board noted that the advisory fee is in addition to the fees received by the Adviser and its affiliates with regard to the Underlying Portfolios in which the Asset Allocation Portfolios may invest. In considering the profitability to the Adviser from the Asset Allocation Portfolios, the Board took into consideration the profitability to the Adviser of the funds underlying the Asset Allocation Portfolios. The Board also considered that the Distributor, MetLife Investors Distribution Company, receives Rule 12b-1 payments to support the distribution of the products.
Economies of scale. The Board also considered the effect of the Portfolios’ growth in size on their fees. The Board noted that the fee schedules for most of the Portfolios contain breakpoints that reduce the fee rate above specified asset levels. The Board noted those Portfolios that did not contain breakpoints in the advisory fee and took into account management’s discussion of the same. The Board
MSF-19
Metropolitan Series Fund
MetLife Moderate Allocation Portfolio
Board of Trustees’ Consideration of Advisory Agreement—(Continued)
noted that those Portfolios with advisory fee schedules containing breakpoints generally reflect the inclusion of breakpoints in the sub-advisory fee schedule for such Portfolios. The Board considered the effective fees under the Advisory Agreement for a Portfolio as a percentage of assets at different asset levels and possible economies of scale that may be realized if the assets of the Portfolio grow. Among other data, the Board examined the effect of a Portfolio’s growth in size on various fee schedules and reviewed the Lipper and Bobroff Reports, which compared fees among peers. The Board also generally noted that if a Portfolio’s assets increase over time, the Portfolio may realize other economies of scale if assets increase proportionally more than certain other fixed expenses. In addition, the Board noted that the Adviser had taken a number of steps to date intended to share the benefits of economies of scale with contractholders.
With respect to the MetLife Moderate Allocation Portfolio, the Board noted that the Portfolio’s advisory fee contains breakpoints that reduce the advisory fee rate on assets above certain specified asset levels. The Board considered the fact that the Portfolio’s fee levels decline as portfolio assets increase.
Other factors. As part of its evaluation of the Adviser’s compensation, the Board considered other benefits that may be realized by the Adviser and its affiliates from their relationship with the Trusts. Among them, the Board recognized that an affiliate of the Adviser, MetLife Investors Distribution Company, serves as the Distributor for the Trusts, and, as such, receives payments pursuant to Rule 12b-1 from the Portfolios to compensate it for providing shareholder services and selling activities, which could lead to growth in the Trusts’ assets and corresponding benefits from such growth, including economies of scale. The Board also considered that affiliates of the Adviser may benefit from certain indirect tax benefits relating to dividend received deductions and foreign tax credits. In conjunction with these considerations, the Board noted the costs of providing investment management and other services to the Portfolios and the ongoing commitment of the Adviser to the Portfolios.
The Board considered possible conflicts of interest in the form of material benefits or detriments to the Trusts resulting from the nature of the Trusts’ and the Adviser’s affiliations and the services that are provided to the Trusts, and the manner in which such conflicts were mitigated.
Conclusions. After full consideration of the factors discussed above, the Board, including a majority of the Independent Trustees, approved the Advisory Agreement and the Sub-Advisory Agreement, as applicable, with respect to each Portfolio, unless otherwise noted. In making its approvals, the Board concluded that the nature, extent and quality of services provided by the Adviser supported the renewal of the Agreements. The Board also concluded that the investment performance of each Fund was such that each Agreement should continue. In addition, the Board concluded that fees paid by a Portfolio to the Adviser appeared to be acceptable in light of nature, extent and quality of the services provided by the Adviser. Further, the Board concluded that the Adviser’s profitability in providing services under the Advisory Agreements did not appear unreasonably high in light of the nature, extent and quality of the services provided by the Adviser. Finally, the Board concluded that the Advisory fees in some measure share economies of scale with contractholders. In approving the renewal of each of the Agreements, the Board, including the Independent Trustees, did not identify any single factor as controlling, and generally attributed different weights to various factors for the various Portfolios. The Board evaluated all information available to them on a Portfolio-by-Portfolio basis, and their decisions were made separately with respect to each Portfolio.
MSF-20
Metropolitan Series Fund
MetLife Moderate to Aggressive Allocation Portfolio
Managed by MetLife Advisers, LLC
Portfolio Manager Commentary*
PERFORMANCE
For the one year period ended December 31, 2013, the Class A and B shares of the MetLife Moderate to Aggressive Allocation Portfolio returned 24.51% and 24.31%, respectively. The Portfolio’s benchmark, the Dow Jones Moderately Aggressive Index1, returned 20.73%.
MARKET ENVIRONMENT / CONDITIONS
Global economic expansion was in low gear through much of 2013, becoming more bifurcated in the second half of the year. Developed economies continued to strengthen whereas emerging markets faced the dual challenges of slowing growth and tighter global financial conditions. In the U.S., equity markets rallied in the first quarter but experienced a sharp decline in May and June when the Federal Reserve (the “Fed”) hinted at the possibility of reducing its unprecedented bond-buying program. This announcement subsequently sent global markets into a plunge. Domestically, Treasury yields rose while credit spreads widened. The dollar rallied and Treasury Inflation Protected Securities (“TIPS”) posted a substantial loss on reduced inflation expectations. Emerging markets sold off while their currencies tumbled against the U.S. dollar. Volatility spiked in bond and currency markets. The Fed’s accommodative language and policy stance boosted risk appetite in the third quarter and sent investors back into risk assets. Equity performance was strong both domestically and outside of the U.S. Credit spreads tightened, resulting in solid excess returns in both investment grade and high yield bond sectors. Volatility came down significantly in both equity and rate markets following the late September Federal Open Market Committee decision not to pare back the Fed’s asset-purchasing program. Economic reports that came out in the fourth quarter indicated robust domestic growth which in turn boosted investor confidence and made the looming taper even more likely. In December, reduced fiscal drag, falling unemployment and stronger economic growth prompted the Fed to announce a $10 billion reduction in the level of its asset-buying program starting in January 2014, causing stock markets to rally sharply on the news.
The vast majority of global equity markets concluded the year in record territories, supported by accommodative monetary policies around the world. The U.S. equity market outperformed the rest of the world with the S&P 500 Index up 32.4%, trailed by Japan (27.2%), Europe (25.2%), and Asia-Pacific ex-Japan (5.5%), as reported by MSCI. Within U.S. equity markets, smaller cap names generally delivered a better performance than their large cap counterparts. Growth stocks modestly outpaced value stocks over the trailing one year period, most prominently in the small cap space. In terms of sectors, Consumer Discretionary, Health Care, and Industrials proved to be the best performing sectors, while Telecom and Utility stocks trailed. Emerging market equities, however, produced a moderately negative return in 2013 after an impressive 2012. Growing signs of strength in the U.S. economy raised speculation that the Fed would start reducing its stimulus sooner than anticipated. Disappointing economic data across the developing world also reduced investors’ risk appetite as the year progressed.
Within fixed income, interest rate risk drove the majority of domestic bond sectors into negative territory, especially in longer dated securities as the yield curve steepened. High Yield Credit was the only bright spot with a positive 7.4% return for the year. Investors’ demand for additional yield provided steady support for high yield issues throughout 2013, and resulted in meaningful spread narrowing. Internationally, peripheral European debt enjoyed double digit returns for U.S. investors stemming from the combination of positive local returns and the euro strengthening against the dollar. On the other extreme, the Barclays Global Japan Index fell 16.0%, driven entirely by a large currency depreciation induced by Japan’s Prime Minister Shinzo Abe. With Japan being the largest component of the Barclays Global Aggregate ex-U.S. Index, the Index as a whole was down 3.1% for the year. Similar to the equity side, emerging market debt struggled and produced a negative return in 2013, due largely to weak emerging market currencies vis-à-vis the dollar.
PORTFOLIO REVIEW / PERIOD END POSITIONING
The MetLife Moderate to Aggressive Allocation Portfolio invested in underlying portfolios of the Met Investors Series Trust and the Metropolitan Series Fund to maintain a broad asset allocation of approximately 80% to equities and 20% to fixed income. The Portfolio delivered a strong double digit return during the twelve month period. Relative to the Dow Jones Moderately Aggressive Index, the Portfolio outperformed due to a combination of asset class exposures and favorable security selection in the underlying portfolios. From an asset class exposure perspective, a moderate overweight to high yield bonds due to the opportunistic positioning of the core bond managers contributed positively to relative performance.
Domestic equity was the big winner in 2013. Not only did our U.S. equity portfolios generate the best absolute return relative to international and fixed income underlying portfolios, they also produced the best asset class specific excess return derived from solid stock selection. Outperformance was most pronounced in the large cap space across value and growth spectrum. The ClearBridge Aggressive Growth Portfolio was the leading contributor in the domestic equity space. Both stock selection and sector allocation made positive contributions to the portfolio’s relative performance. In particular, stock selection in the Health Care and Information Technology (“IT”) sectors were most effective. Additionally, an overweight in the Health Care sector and underweights in the IT, Consumer Staples, Telecom, Financials, and Materials sectors also aided results for the period. Other domestic equity portfolios that provided a strong contribution on the positive side included T. Rowe Price Large Cap Growth Portfolio, Jennison Growth Portfolio, and Invesco Comstock Portfolio. For T. Rowe Price Large Cap Growth Portfolio, holdings in the Consumer Discretionary sector added substantially to the performance. Overweight positions in Priceline, Amazon, and Netflix all proved to be beneficial during 2013. Both the Jennison Growth Portfolio’s and Invesco Comstock Portfolio’s strong performance was driven by favorable stock selection. In contrast, several mid cap and small cap equity portfolios detracted from relative performance, however, to a lesser degree.
MSF-1
Metropolitan Series Fund
MetLife Moderate to Aggressive Allocation Portfolio
Managed by MetLife Advisers, LLC
Portfolio Manager Commentary*—(Continued)
The results from the underlying international equity portfolios were mixed. The two portfolios that provide exposure to emerging markets and real estate investment trusts (“REITs”) generally have lower correlations with the rest of the equity market and therefore add diversification benefits to the Portfolio. Unfortunately, these two asset classes had a difficult year in 2013. As a result, MFS Emerging Markets Equity Portfolio and Clarion Global Real Estate Portfolio significantly hindered the overall performance. On a relative basis, while the Harris Oakmark International Portfolio produced a sizable positive contribution, that positive effect was more than offset by the underperformance generated from several other international portfolios, especially the Clarion Global Real Estate Portfolio.
Within the fixed income portion of the Portfolio, not surprisingly, the PIMCO Inflation Protected Bond Portfolio was the largest performance detractor given that TIPS was the worst performing fixed income segment during the year. That negative contribution was more than offset by positive contributions from several other underlying bond portfolios, including the Met/Templeton International Bond Portfolio. While the PIMCO Inflation Protected Bond Portfolio was largely an asset class story, the portfolios on the positive side were a successful security selection story in the sense that they generated a positive excess return relative to their respective asset class indices. The Met/Templeton International Bond Portfolio generated a large outperformance against its benchmark, driven primarily by the portfolio’s currency positioning. More specifically, a sizable underweight in Japanese yen proved to be the right decision as the yen tumbled against the dollar.
Investment Committee
MetLife Advisers, LLC
* This commentary may include statements that constitute “forward-looking statements” under the U.S. securities laws. Forward-looking statements include, among other things, projections, estimates, and information about possible or future results related to the Portfolio, market or regulatory developments. The views expressed above are not guarantees of future performance or economic results and involve certain risks, uncertainties and assumptions that could cause actual outcomes and results to differ materially from the views expressed herein. The views expressed above are subject to change at any time based upon economic, market, or other conditions and the advisory firm undertakes no obligation to update the views expressed herein. Any discussions of specific securities should not be considered a recommendation to buy or sell those securities. The views expressed above (including any forward-looking statement) may not be relied upon as investment advice or as an indication of the Portfolio’s trading intent. Information about the Portfolio’s holdings, asset allocation or country diversification is historical and is not an indication of future Portfolio composition, which may vary. Direct investment in any index is not possible. The performance of any index mentioned in this commentary has not been adjusted for ongoing management, distribution and operating expenses, and sales charges applicable to mutual fund investments. In addition, the returns do not reflect additional fees charged by separate accounts or variable insurance contracts that an investor in the Portfolio may pay. If these additional fees were reflected, performance would have been lower.
MSF-2
Metropolitan Series Fund
MetLife Moderate to Aggressive Allocation Portfolio
A $10,000 INVESTMENT COMPARED TO THE DOW JONES MODERATELY AGGRESSIVE INDEX
AVERAGE ANNUAL RETURNS (%) (FOR THE YEAR ENDED DECEMBER 31, 2013)
| | | | | | | | | | | | |
| | | 1 Year | | | 5 Year | | | Since Inception2 | |
| MetLife Moderate to Aggressive Allocation Portfolio | | | | | | | | | | | | |
Class A | | | 24.51 | | | | 15.64 | | | | 6.88 | |
Class B | | | 24.31 | | | | 15.37 | | | | 6.62 | |
| Dow Jones Moderately Aggressive Index | | | 20.73 | | | | 15.46 | | | | 8.02 | |
1 The Dow Jones Moderately Aggressive Index is a total returns index designed to provide asset allocation strategists with a target risk benchmark. Each month, the Index adjusts its weighting of stocks, bonds, and cash indices (both domestic and foreign) from Barclays and Dow Jones such that the risk combination will have 80% of the risk of an all equity portfolio.
2 Inception date of the Class A and Class B shares is 5/2/05. Index since inception return is based on the Portfolio’s inception date.
Portfolio performance is calculated including reinvestment of all income and capital gain distributions. Performance numbers are net of all Portfolio expenses but do not include any insurance, sales, separate account or administrative charges of variable annuity or life insurance contracts or any additional expenses that participants may bear relating to the operations of their plans. If these charges were included, the returns would be lower. The performance of any index referenced above has not been adjusted for ongoing management, distribution and operating expenses, and sales charges applicable to mutual fund investments. Direct investment in any index is not possible. The performance of Class A shares, as set forth in the line graph above, will differ from that of other classes because of the difference in expenses paid by policyholders investing in the different share classes.
This information represents past performance and is not indicative of future results. Investment return and principal value may fluctuate so that shares, upon redemption, may be worth more or less than the original cost.
PORTFOLIO COMPOSITION AS OF DECEMBER 31, 2013
Top Holdings
| | | | |
| | | % of
Net Assets | |
| MFS Value Portfolio (Class A) | | | 6.2 | |
| Jennison Growth Portfolio (Class A) | | | 5.9 | |
| Invesco Comstock Portfolio (Class A) | | | 5.1 | |
| T. Rowe Price Large Cap Value Portfolio (Class A) | | | 5.1 | |
| T. Rowe Price Large Cap Growth Portfolio (Class A) | | | 4.9 | |
| ClearBridge Aggressive Growth Portfolio (Class A) | | | 4.8 | |
| PIMCO Total Return Portfolio (Class A) | | | 4.7 | |
| WMC Core Equity Opportunities Portfolio (formerly Davis Venture Value Portfolio) (Class A) | | | 4.6 | |
| BlackRock Large Cap Value Portfolio (Class A) | | | 4.1 | |
| Harris Oakmark International Portfolio (Class A) | | | 4.0 | |
MSF-3
Metropolitan Series Fund
MetLife Moderate to Aggressive Allocation Portfolio
Understanding Your Portfolio’s Expenses
Shareholder Expense Example
As a shareholder of the Portfolio, you incur ongoing costs, including management fees; distribution and service (12b-1) fees; and other Portfolio expenses. This example is intended to help you understand your ongoing costs (in dollars) (referred to as “expenses”) of investing in the Portfolio and compare these costs with the ongoing costs of investing in other mutual funds. The example is based on an investment of $1,000 invested at the beginning of the period and held for the entire period, July 1, 2013 through December 31, 2013.
Actual Expenses
The first line for each share class of the Portfolio in the table below provides information about actual account values and actual expenses. You may use the information in this line, together with the amount you invested in the particular share class of the Portfolio, to estimate the expenses that you paid over the period. Simply divide your account value by $1,000 (for example, an $8,600 account value divided by $1,000 = 8.6), then multiply the result by the number in the first line under the heading entitled “Expenses Paid During Period” to estimate the expenses you paid on your account during this period.
Hypothetical Example for Comparison Purposes
The second line for each share class of the Portfolio in the table below provides information about hypothetical account values and hypothetical expenses based on the Portfolio’s actual expense ratio and an assumed rate of return of 5% per year before expenses, which is not the Portfolio’s actual return. The hypothetical account values and expenses may not be used to estimate the actual ending account balance or expenses you paid for the period. You may use this information to compare the ongoing costs of investing in the Portfolio and other funds. To do so, compare this 5% hypothetical example with the 5% hypothetical examples that appear in the shareholder reports of the other funds.
Please note that the expenses shown in the table are meant to highlight your ongoing costs only and do not reflect any fees or charges of your variable insurance product or any additional expenses that participants in certain eligible qualified plans may bear relating to the operations of their plan. Therefore, the second line for each share class in the table is useful in comparing ongoing costs only, and will not help you determine the relative total costs of owning different funds. In addition, if these other costs were included, your costs would have been higher.
| | | | | | | | | | | | | | | | | | |
MetLife Moderate to Aggressive Allocation Portfolio | | Annualized
Expense
Ratio | | | Beginning
Account Value
July 1,
2013 | | | Ending
Account Value
December 31,
2013 | | | Expenses Paid
During Period**
July 1, 2013
to
December 31,
2013 | |
Class A(a) | | Actual | | | 0.72 | % | | $ | 1,000.00 | | | $ | 1,148.20 | | | $ | 3.90 | |
| | Hypothetical* | | | 0.72 | % | | $ | 1,000.00 | | | $ | 1,021.58 | | | $ | 3.67 | |
| | | | | |
Class B(a) | | Actual | | | 0.97 | % | | $ | 1,000.00 | | | $ | 1,147.00 | | | $ | 5.25 | |
| | Hypothetical* | | | 0.97 | % | | $ | 1,000.00 | | | $ | 1,020.32 | | | $ | 4.94 | |
* Hypothetical assumes a rate of return of 5% per year before expenses.
** Expenses paid are equal to the Portfolio’s annualized expense ratio for the most recent six month period, as shown above, multiplied by the average account value over the period, multiplied by the number of days (184 days) in the most recent fiscal half-year, divided by 365 (to reflect the one-half year period).
(a) The annualized expense ratio reflects the expenses of both the Portfolio and the Underlying Portfolios in which it invests.
MSF-4
Metropolitan Series Fund
MetLife Moderate to Aggressive Allocation Portfolio
Schedule of Investments as of December 31, 2013
Mutual Funds—100.0% of Net Assets
| | | | | | | | |
| Security Description | | Shares | | | Value | |
|
Affiliated Investment Companies—100.0% | |
Baillie Gifford International Stock Portfolio (Class A) (a) | | | 12,923,741 | | | $ | 136,216,228 | |
BlackRock Bond Income Portfolio (Class A) (a) | | | 898,209 | | | | 96,404,740 | |
BlackRock Capital Appreciation Portfolio (Class A) (a) | | | 3,521,400 | | | | 133,284,975 | |
BlackRock Large Cap Value Portfolio (Class A) (a) | | | 11,547,550 | | | | 138,801,548 | |
Clarion Global Real Estate Portfolio (Class A) (b) | | | 8,438,371 | | | | 94,003,447 | |
ClearBridge Aggressive Growth Portfolio (Class A) (b) | | | 12,286,084 | | | | 165,247,834 | |
Frontier Mid Cap Growth Portfolio (Class A) (a) | | | 470,741 | | | | 17,370,350 | |
Goldman Sachs Mid Cap Value Portfolio (Class A) (b) | | | 3,918,397 | | | | 69,590,725 | |
Harris Oakmark International Portfolio (Class A) (b) | | | 7,167,163 | | | | 137,107,835 | |
Invesco Comstock Portfolio (Class A) (b) | | | 11,968,179 | | | | 174,496,045 | |
Invesco Small Cap Growth Portfolio (Class A) (b) | | | 5,994,116 | | | | 123,059,194 | |
Jennison Growth Portfolio (Class A) (a) | | | 12,629,748 | | | | 199,802,615 | |
JPMorgan Core Bond Portfolio (Class A) (b) | | | 6,301,186 | | | | 64,083,064 | |
JPMorgan Small Cap Value Portfolio (Class A) (b) | | | 3,490,337 | | | | 69,562,412 | |
Loomis Sayles Small Cap Growth Portfolio (Class A) (a) (c) | | | 4,204,826 | | | | 69,589,868 | |
Lord Abbett Bond Debenture Portfolio (Class A) (b) | | | 3,624,559 | | | | 49,112,770 | |
Met/Artisan Mid Cap Value Portfolio (Class A) (a) | | | 128,930 | | | | 34,630,514 | |
Met/Dimensional International Small Company Portfolio (Class A) (a) | | | 4,142,796 | | | | 69,723,253 | |
Met/Eaton Vance Floating Rate Portfolio (Class A) (b) | | | 3,074,938 | | | | 32,686,591 | |
Met/Templeton International Bond Portfolio (Class A) (b) | | | 8,315,794 | | | | 97,461,100 | |
MFS Emerging Markets Equity Portfolio (Class A) (b) | | | 9,282,284 | | | | 96,257,289 | |
MFS Research International Portfolio (Class A) (b) | | | 8,499,056 | | | | 102,073,668 | |
MFS Value Portfolio (Class A) (a) | | | 11,812,387 | | | | 209,669,871 | |
Morgan Stanley Mid Cap Growth Portfolio (Class A) (b) | | | 2,157,051 | | | | 35,181,510 | |
|
Affiliated Investment Companies—(Continued) | |
Neuberger Berman Genesis Portfolio (Class A) (a) | | | 1,925,410 | | | | 34,926,944 | |
PIMCO Inflation Protected Bond Portfolio (Class A) (b) | | | 6,356,628 | | | | 63,248,451 | |
PIMCO Total Return Portfolio (Class A) (b) | | | 13,516,409 | | | | 160,439,777 | |
T. Rowe Price Large Cap Growth Portfolio (Class A) (a) | | | 6,756,272 | | | | 165,596,229 | |
T. Rowe Price Large Cap Value Portfolio (Class A) (b) | | | 5,400,228 | | | | 173,617,342 | |
T. Rowe Price Mid Cap Growth Portfolio (Class A) (b) | | | 2,842,587 | | | | 34,935,399 | |
T. Rowe Price Small Cap Growth Portfolio (Class A) (a) | | | 736,803 | | | | 17,513,805 | |
Third Avenue Small Cap Value Portfolio (Class A) (b) | | | 3,315,249 | | | | 69,752,834 | |
Van Eck Global Natural Resources Portfolio (Class A) (a) | | | 7,037,435 | | | | 100,001,944 | |
Western Asset Management Strategic Bond Opportunities Portfolio (Class A) (a) | | | 1,202,527 | | | | 16,173,987 | |
WMC Core Equity Opportunities Portfolio (formerly Davis Venture Value Portfolio) (Class A) (a) | | | 3,661,122 | | | | 157,318,393 | |
| | | | | | | | |
Total Mutual Funds
(Cost $2,576,470,418) | | | | | | | 3,408,942,551 | |
| | | | | | | | |
Total Investments—100.0%
(Cost $2,576,470,418) (d) | | | | | | | 3,408,942,551 | |
Other assets and liabilities (net)—0.0% | | | | | | | (885,407 | ) |
| | | | | | | | |
| Net Assets—100.0% | | | | | | $ | 3,408,057,144 | |
| | | | | | | | |
| (a) | A Portfolio of Metropolitan Series Fund. (See Note 6 of the Notes to Financial Statements for a summary of transactions in the securities of affiliated issuers.) |
| (b) | A Portfolio of Met Investors Series Trust. (See Note 6 of the Notes to Financial Statements for a summary of transactions in the securities of affiliated issuers.) |
| (c) | Non-income producing security. |
| (d) | As of December 31, 2013, the aggregate cost of investments for federal income tax purposes was $2,651,529,632. The aggregate unrealized appreciation and depreciation of investments were $768,590,317 and $(11,177,398), respectively, resulting in net unrealized appreciation of $757,412,919 for federal income tax purposes. |
See accompanying notes to financial statements.
MSF-5
Metropolitan Series Fund
MetLife Moderate to Aggressive Allocation Portfolio
Schedule of Investments as of December 31, 2013
Fair Value Hierarchy
Accounting principles generally accepted in the United States of America (“GAAP”) define fair market value as the price that the Portfolio would receive to sell an asset or pay to transfer a liability in an orderly transaction between market participants at the measurement date. It establishes a fair value hierarchy that prioritizes inputs to valuation methods and requires disclosure of the fair value hierarchy that segregates fair value measurements into three levels. Levels 1, 2 and 3 of the fair value hierarchy are defined as follows:
Level 1 - unadjusted quoted prices in active markets for identical investments
Level 2 - other significant observable inputs (including, but not limited to, unadjusted quoted prices for similar investments in markets that are either active or inactive; inputs other than quoted prices that are observable such as interest rates, yield curves, volatilities, prepayment speeds, loss severities, credit risks, default rates, etc.)
Level 3 - significant unobservable inputs based on the best information available in the circumstances, to the extent observable inputs are unavailable (including the Portfolio’s own assumptions in determining the fair value of investments)
The inputs or methodologies used for valuing investments are not necessarily an indication of the risk associated with investing in them. Changes to the inputs or methodologies used may result in transfers between levels, which will be recognized as of the beginning of the reporting period. Information on transfers between Level 1 and Level 2, if any, will be disclosed following the fair value hierarchy table below. A reconciliation of Level 3 securities, if any, will also be disclosed following the fair value hierarchy table. For more information about the Portfolio’s policy regarding the valuation of investments, please refer to the Notes to Financial Statements.
The following table summarizes the fair value hierarchy of the Portfolio’s investments as of December 31, 2013:
| | | | | | | | | | | | | | | | |
| Description | | Level 1 | | | Level 2 | | | Level 3 | | | Total | |
| Mutual Funds | | | | | | | | | | | | | | | | |
Affiliated Investment Companies | | $ | 3,408,942,551 | | | $ | — | | | $ | — | | | $ | 3,408,942,551 | |
Total Investments | | $ | 3,408,942,551 | | | $ | — | | | $ | — | | | $ | 3,408,942,551 | |
| | | | | | | | | | | | | | | | | |
See accompanying notes to financial statements.
MSF-6
Metropolitan Series Fund
MetLife Moderate to Aggressive Allocation Portfolio
Statement of Assets and Liabilities
December 31, 2013
| | | | |
Assets | | | | |
Affiliated investments at value (a) | | $ | 3,408,942,551 | |
Receivable for: | | | | |
Investments sold | | | 1,483,379 | |
Fund shares sold | | | 806,757 | |
| | | | |
Total Assets | | | 3,411,232,687 | |
Liabilities | | | | |
Payables for: | | | | |
Fund shares redeemed | | | 2,290,136 | |
Accrued expenses: | | | | |
Management fees | | | 173,862 | |
Distribution and service fees | | | 634,200 | |
Deferred trustees’ fees | | | 48,554 | |
Other expenses | | | 28,791 | |
| | | | |
Total Liabilities | | | 3,175,543 | |
| | | | |
Net Assets | | $ | 3,408,057,144 | |
| | | | |
Net assets consist of: | | | | |
Paid in surplus | | $ | 2,680,092,123 | |
Undistributed net investment income | | | 55,929,014 | |
Accumulated net realized loss | | | (160,436,126 | ) |
Unrealized appreciation on affiliated investments | | | 832,472,133 | |
| | | | |
Net Assets | | $ | 3,408,057,144 | |
| | | | |
Net Assets | | | | |
Class A | | $ | 365,222,772 | |
Class B | | | 3,042,834,372 | |
Capital Shares Outstanding* | | | | |
Class A | | | 25,340,679 | |
Class B | | | 211,929,389 | |
Net Asset Value, Offering Price and Redemption Price Per Share | | | | |
Class A | | $ | 14.41 | |
Class B | | | 14.36 | |
| * | The Portfolio is authorized to issue an unlimited number of shares. |
| (a) | Identified cost of affiliated investments was $2,576,470,418. |
Statement of Operations
Year Ended December 31, 2013
| | | | |
Investment Income | | | | |
Dividends from Affiliated Underlying Portfolios | | $ | 54,771,397 | |
| | | | |
Total investment income | | | 54,771,397 | |
Expenses | | | | |
Management fees | | | 1,950,204 | |
Administration fees | | | 11,548 | |
Custodian and accounting fees | | | 25,120 | |
Distribution and service fees—Class B | | | 7,057,463 | |
Audit and tax services | | | 27,722 | |
Legal | | | 36,254 | |
Trustees’ fees and expenses | | | 35,359 | |
Miscellaneous | | | 8,836 | |
| | | | |
Total expenses | | | 9,152,506 | |
| | | | |
Net Investment Income | | | 45,618,891 | |
| | | | |
Net Realized and Unrealized Gain | | | | |
| Net realized gain on: | | | | |
Affiliated investments | | | 110,571,528 | |
Capital gain distributions from Affiliated Underlying Portfolios | | | 39,365,419 | |
| | | | |
Net realized gain | | | 149,936,947 | |
| | | | |
Net change in unrealized appreciation on affiliated investments | | | 488,271,654 | |
| | | | |
Net realized and unrealized gain | | | 638,208,601 | |
| | | | |
Net Increase in Net Assets From Operations | | $ | 683,827,492 | |
| | | | |
See accompanying notes to financial statements.
MSF-7
Metropolitan Series Fund
MetLife Moderate to Aggressive Allocation Portfolio
Statements of Changes in Net Assets
| | | | | | | | |
| | | Year Ended
December 31,
2013 | | | Year Ended
December 31,
2012 | |
Increase (Decrease) in Net Assets: | | | | | | | | |
From Operations | | | | | | | | |
Net investment income | | $ | 45,618,891 | | | $ | 39,737,804 | |
Net realized gain | | | 149,936,947 | | | | 53,711,838 | |
Net change in unrealized appreciation | | | 488,271,654 | | | | 310,890,285 | |
| | | | | | | | |
Increase in net assets from operations | | | 683,827,492 | | | | 404,339,927 | |
| | | | | | | | |
From Distributions to Shareholders | | | | | | | | |
Net investment income | | | | | | | | |
Class A | | | (5,386,470 | ) | | | (5,740,906 | ) |
Class B | | | (40,897,027 | ) | | | (49,009,131 | ) |
| | | | | | | | |
Total distributions | | | (46,283,497 | ) | | | (54,750,037 | ) |
| | | | | | | | |
Decrease in net assets from capital share transactions | | | (128,652,792 | ) | | | (128,608,132 | ) |
| | | | | | | | |
Total increase in net assets | | | 508,891,203 | | | | 220,981,758 | |
| | |
Net Assets | | | | | | | | |
Beginning of period | | | 2,899,165,941 | | | | 2,678,184,183 | |
| | | | | | | | |
End of period | | $ | 3,408,057,144 | | | $ | 2,899,165,941 | |
| | | | | | | | |
| | |
Undistributed Net Investment Income | | | | | | | | |
End of period | | $ | 55,929,014 | | | $ | 46,148,965 | |
| | | | | | | | |
Other Information:
Capital Shares
Transactions in capital shares were as follows:
| | | | | | | | | | | | | | | | |
| | | Year Ended
December 31, 2013 | | | Year Ended
December 31, 2012 | |
| | | Shares | | | Value | | | Shares | | | Value | |
Class A | | | | | | | | | | | | | | | | |
Sales | | | 3,356,293 | | | $ | 43,401,052 | | | | 3,070,968 | | | $ | 34,350,810 | |
Reinvestments | | | 441,152 | | | | 5,386,470 | | | | 516,269 | | | | 5,740,906 | |
Redemptions | | | (3,119,781 | ) | | | (40,320,464 | ) | | | (2,606,910 | ) | | | (29,143,753 | ) |
| | | | | | | | | | | | | | | | |
Net increase | | | 677,664 | | | $ | 8,467,058 | | | | 980,327 | | | $ | 10,947,963 | |
| | | | | | | | | | | | | | | | |
Class B | | | | | | | | | | | | | | | | |
Sales | | | 7,237,868 | | | $ | 94,690,186 | | | | 8,064,080 | | | $ | 89,804,798 | |
Reinvestments | | | 3,357,720 | | | | 40,897,027 | | | | 4,415,237 | | | | 49,009,131 | |
Redemptions | | | (21,031,859 | ) | | | (272,707,063 | ) | | | (26,963,781 | ) | | | (278,370,024 | ) |
| | | | | | | | | | | | | | | | |
Net decrease | | | (10,436,271 | ) | | $ | (137,119,850 | ) | | | (14,484,464 | ) | | $ | (139,556,095 | ) |
| | | | | | | | | | | | | | | | |
Decrease derived from capital shares transactions | | | | | | $ | (128,652,792 | ) | | | | | | $ | (128,608,132 | ) |
| | | | | | | | | | | | | | | | |
See accompanying notes to financial statements.
MSF-8
Metropolitan Series Fund
MetLife Moderate to Aggressive Allocation Portfolio
Financial Highlights
| | | | | | | | | | | | | | | | | | | | |
| Selected per share data | | | |
| | | Class A | |
| | | Year Ended December 31, | |
| | | 2013 | | | 2012 | | | 2011 | | | 2010 | | | 2009 | |
Net Asset Value, Beginning of Period | | $ | 11.78 | | | $ | 10.39 | | | $ | 10.94 | | | $ | 9.74 | | | $ | 7.90 | |
| | | | | | | | | | | | | | | | | | | | |
Income (Loss) from Investment Operations | | | | | | | | | | | | | | | | | | | | |
Net investment income (a) | | | 0.21 | | | | 0.18 | | | | 0.18 | | | | 0.14 | | | | 0.21 | |
Net realized and unrealized gain (loss) on investments | | | 2.64 | | | | 1.45 | | | | (0.55 | ) | | | 1.29 | | | | 2.00 | |
| | | | | | | | | | | | | | | | | | | | |
Total from investment operations | | | 2.85 | | | | 1.63 | | | | (0.37 | ) | | | 1.43 | | | | 2.21 | |
| | | | | | | | | | | | | | | | | | | | |
Less Distributions | | | | | | | | | | | | | | | | | | | | |
Distributions from net investment income | | | (0.22 | ) | | | (0.24 | ) | | | (0.18 | ) | | | (0.23 | ) | | | (0.25 | ) |
Distributions from net realized capital gains | | | 0.00 | | | | 0.00 | | | | 0.00 | | | | 0.00 | | | | (0.12 | ) |
| | | | | | | | | | | | | | | | | | | | |
Total distributions | | | (0.22 | ) | | | (0.24 | ) | | | (0.18 | ) | | | (0.23 | ) | | | (0.37 | ) |
| | | | | | | | | | | | | | | | | | | | |
Net Asset Value, End of Period | | $ | 14.41 | | | $ | 11.78 | | | $ | 10.39 | | | $ | 10.94 | | | $ | 9.74 | |
| | | | | | | | | | | | | | | | | | | | |
Total Return (%) (b) | | | 24.51 | | | | 15.82 | | | | (3.55 | ) | | | 14.89 | | | | 29.43 | |
| | | | | |
Ratios/Supplemental Data | | | | | | | | | | | | | | | | | | | | |
Gross ratio of expenses to average net assets (%) (c) | | | 0.07 | | | | 0.07 | | | | 0.07 | | | | 0.07 | | | | 0.07 | |
Net ratio of expenses to average net assets (%) (c) (d) | | | 0.07 | | | | 0.07 | | | | 0.07 | | | | 0.07 | | | | 0.07 | |
Ratio of net investment income to average net assets (%) (e) | | | 1.65 | | | | 1.60 | | | | 1.66 | | | | 1.45 | | | | 2.49 | |
Portfolio turnover rate (%) | | | 13 | | | | 13 | | | | 46 | | | | 17 | | | | 37 | |
Net assets, end of period (in millions) | | $ | 365.2 | | | $ | 290.4 | | | $ | 246.1 | | | $ | 246.0 | | | $ | 201.9 | |
| |
| | | Class B | |
| | | Year Ended December 31, | |
| | | 2013 | | | 2012 | | | 2011 | | | 2010 | | | 2009 | |
Net Asset Value, Beginning of Period | | $ | 11.73 | | | $ | 10.36 | | | $ | 10.91 | | | $ | 9.71 | | | $ | 7.87 | |
| | | | | | | | | | | | | | | | | | | | |
Income (Loss) from Investment Operations | | | | | | | | | | | | | | | | | | | | |
Net investment income (a) | | | 0.19 | | | | 0.15 | | | | 0.16 | | | | 0.12 | | | | 0.19 | |
Net realized and unrealized gain (loss) on investments | | | 2.63 | | | | 1.43 | | | | (0.56 | ) | | | 1.29 | | | | 1.99 | |
| | | | | | | | | | | | | | | | | | | | |
Total from investment operations | | | 2.82 | | | | 1.58 | | | | (0.40 | ) | | | 1.41 | | | | 2.18 | |
| | | | | | | | | | | | | | | | | | | | |
Less Distributions | | | | | | | | | | | | | | | | | | | | |
Distributions from net investment income | | | (0.19 | ) | | | (0.21 | ) | | | (0.15 | ) | | | (0.21 | ) | | | (0.22 | ) |
Distributions from net realized capital gains | | | 0.00 | | | | 0.00 | | | | 0.00 | | | | 0.00 | | | | (0.12 | ) |
| | | | | | | | | | | | | | | | | | | | |
Total distributions | | | (0.19 | ) | | | (0.21 | ) | | | (0.15 | ) | | | (0.21 | ) | | | (0.34 | ) |
| | | | | | | | | | | | | | | | | | | | |
Net Asset Value, End of Period | | $ | 14.36 | | | $ | 11.73 | | | $ | 10.36 | | | $ | 10.91 | | | $ | 9.71 | |
| | | | | | | | | | | | | | | | | | | | |
Total Return (%) (b) | | | 24.31 | | | | 15.39 | | | | (3.77 | ) | | | 14.70 | | | | 29.09 | |
| | | | | |
Ratios/Supplemental Data | | | | | | | | | | | | | | | | | | | | |
Gross ratio of expenses to average net assets (%) (c) | | | 0.32 | | | | 0.32 | | | | 0.32 | | | | 0.32 | | | | 0.32 | |
Net ratio of expenses to average net assets (%) (c) (d) | | | 0.32 | | | | 0.32 | | | | 0.32 | | | | 0.32 | | | | 0.32 | |
Ratio of net investment income to average net assets (%) (e) | | | 1.43 | | | | 1.38 | | | | 1.44 | | | | 1.24 | | | | 2.32 | |
Portfolio turnover rate (%) | | | 13 | | | | 13 | | | | 46 | | | | 17 | | | | 37 | |
Net assets, end of period (in millions) | | $ | 3,042.8 | | | $ | 2,608.8 | | | $ | 2,432.1 | | | $ | 2,678.3 | | | $ | 2,469.3 | |
| (a) | Per share amounts based on average shares outstanding during the period. |
| (b) | Total return does not reflect any insurance, sales, separate account or administrative charges of variable annuity or life insurance contracts or any additional expenses that contract owners may bear under their variable contracts. If these charges were included, the returns would be lower. |
| (c) | The ratio of operating expenses to average net assets does not include expenses of the Underlying Portfolios in which the Portfolio invests. |
| (d) | Net ratio of expenses to average net assets includes the effect of the expense limitation agreement as detailed in Note 5 of the Notes to Financial Statements. |
| (e) | Recognition of net investment income by the Asset Allocation Portfolio is affected by the timing of the declaration of dividends by the Underlying Portfolios in which it invests. |
See accompanying notes to financial statements.
MSF-9
Metropolitan Series Fund
MetLife Moderate to Aggressive Allocation Portfolio
Notes to Financial Statements—December 31, 2013
1. Organization
Metropolitan Series Fund (the “Trust”) is organized as a Delaware statutory trust and registered under the Investment Company Act of 1940, as amended (the “1940 Act”), as an open-end management investment company. The Trust is currently comprised of thirty series, each of which operates as a distinct investment vehicle of the Trust. The portfolio included in this report is MetLife Moderate to Aggressive Allocation Portfolio (the “Asset Allocation Portfolio”), which is diversified. The Asset Allocation Portfolio operates under a “fund of funds” structure, investing substantially all of its assets in other Portfolios advised by MetLife Advisers, LLC (“MetLife Advisers”), an affiliate of MetLife, Inc., or its affiliates (each, an “Underlying Portfolio,” and, collectively, the “Underlying Portfolios”).
Shares in the Asset Allocation Portfolio are not offered directly to the general public and are currently available only to separate accounts established by Metropolitan Life Insurance Company (“MetLife”) and other affiliated life insurance companies.
The Asset Allocation Portfolio has registered and offers two classes of shares: Class A and B shares. Shares of each Class of the Asset Allocation Portfolio represent an equal pro rata interest in the Asset Allocation Portfolio and generally give the shareholder the same voting, dividend, liquidation, and other rights. Investment income, realized and unrealized capital gains and losses, the common expenses of the Asset Allocation Portfolio, and certain Asset Allocation Portfolio-level expense reductions, if any, are allocated on a pro rata basis to each Class based on the relative net assets of each Class to the net assets of the Asset Allocation Portfolio. Each Class of shares differs in its respective distribution plan and such distribution expenses are allocated to that Class.
2. Significant Accounting Policies
The preparation of financial statements in conformity with accounting principles generally accepted in the United States of America (“GAAP”) requires management to make estimates and assumptions that affect the reported amounts of assets and liabilities and disclosure of contingent assets and liabilities as of the date of the financial statements and the reported amounts of income and expenses during the reporting period. Actual results could differ from those estimates. In the preparation of these financial statements, management has evaluated events and transactions subsequent to December 31, 2013 through the date the financial statements were issued.
The following is a summary of significant accounting policies consistently followed by the Asset Allocation Portfolio in the preparation of its financial statements.
Investment Valuation and Fair Value Measurements - Investments in the Underlying Portfolios are valued at their closing daily net asset value on the valuation date. Investments in the Underlying Portfolios are categorized as Level 1 within the fair value hierarchy. For information about the use of fair value pricing by the Underlying Portfolios, please refer to the prospectuses of the Underlying Portfolios.
Investment Transactions and Related Investment Income - Asset Allocation Portfolio security transactions are recorded on the trade date. Dividend income is recorded on the ex-dividend date. Realized gains and losses on investments are determined on the identified cost basis, which is the same basis used for federal income tax purposes. Capital gains distributions received from the Underlying Portfolios are recorded as net realized gain in the Statement of Operations.
Income Taxes - It is the Asset Allocation Portfolio’s policy to comply with the requirements of the Internal Revenue Code of 1986, as amended, and regulations thereunder, applicable to regulated investment companies and to distribute, with respect to each taxable year, all of its taxable income to shareholders. Therefore, no federal income tax provision is required. The Asset Allocation Portfolio files U.S. federal tax returns. No income tax returns are currently under examination. The Asset Allocation Portfolio’s federal tax returns for the prior three fiscal years remain subject to examination by the Internal Revenue Service. As of December 31, 2013, the Portfolio had no uncertain tax positions that would require financial statement recognition, or de-recognition or disclosure.
Dividends and Distributions to Shareholders - The Asset Allocation Portfolio records dividends and distributions on the ex-dividend date. Net realized gains from security transactions (if any) are generally distributed annually to shareholders. The timing and characterization of certain income and capital gains distributions are determined in accordance with federal tax regulations that may differ from GAAP. Permanent book and tax basis differences relating to shareholder distributions will result in reclassification between under/over distributed net investment income, accumulated net realized gains/losses, and paid-in surplus. Book-tax differences are primarily due to distributions from Underlying Portfolios. These adjustments have no impact on net assets or the results of operations.
3. Certain Risks
Market Risk: In the normal course of business, the Underlying Portfolios invest in securities and enter into transactions where risks exist due to fluctuations in the market (market risk) or failure of the other party to a transaction to perform (credit and counterparty risk). The value of securities held by the Underlying Portfolios may decline in response to certain events, including those directly
MSF-10
Metropolitan Series Fund
MetLife Moderate to Aggressive Allocation Portfolio
Notes to Financial Statements—December 31, 2013—(Continued)
involving the companies whose securities are owned by the Underlying Portfolios; conditions affecting the general economy; overall market changes; local, regional or global political, social or economic instability; currency, interest rate, and price fluctuations.
Credit and Counterparty Risk: The Underlying Portfolios may be exposed to counterparty risk, or the risk that an entity with which the Underlying Portfolios have unsettled or open transactions may default. The potential loss could exceed the value of the financial assets and liabilities recorded in the financial statements. Financial assets that potentially expose the Underlying Portfolios to credit and counterparty risk consist principally of cash due from counterparties and investments. The Underlying Portfolios manage counterparty risk by entering into agreements only with counterparties that they believe have the financial resources to honor their obligations and by monitoring the financial stability of those counterparties. The Underlying Portfolios’ investment adviser attempts to mitigate counterparty risk by (i) periodically assessing the creditworthiness of their trading partners, (ii) monitoring and/or limiting the amount of their net exposure to each individual counterparty based on the adviser’s assessment, and (iii) requiring collateral from the counterparty for certain transactions. In order to preserve certain safeguards for non-standard settlement trades, the Underlying Portfolios restrict their exposure to credit and counterparty losses by entering into master netting agreements with counterparties (approved brokers) with whom the Underlying Portfolios undertake a significant volume of transactions. Master Agreements govern the terms of certain transactions, and reduce the counterparty risk associated with relevant transactions by specifying credit protection mechanisms and providing standardization that improves legal certainty. Master Agreements can also help limit counterparty risk by specifying collateral posting arrangements at pre-arranged exposure levels.
Additional risks associated with each type of investment are described within the respective security type notes. The Asset Allocation Portfolio’s prospectus includes a discussion of the principal risks of investing in the Asset Allocation Portfolio and Underlying Portfolios in which it invests.
4. Investment Transactions
Aggregate cost of purchases and proceeds of sales of shares of the Underlying Portfolios by the Asset Allocation Portfolio, for the year ended December 31, 2013 were as follows:
| | | | | | | | | | | | |
Purchases | | | Sales | |
U.S. Government | | Non U.S. Government | | | U.S. Government | | | Non U.S. Government | |
| $0 | | $ | 402,932,595 | | | $ | 0 | | | $ | 492,768,910 | |
5. Investment Management Fees and Other Transactions with Affiliates
Investment Management Agreement - MetLife Advisers is the investment adviser to the Asset Allocation Portfolio. The Trust has entered into an investment management agreement with MetLife Advisers with respect to the Asset Allocation Portfolio. For providing investment management services to the Asset Allocation Portfolio, MetLife Advisers receives monthly compensation at the following annual rates:
| | | | | | |
Management
Fees earned by
MetLife Advisers
for the year ended
December 31, 2013 | | % per annum | | | Average Daily Net Assets |
| $1,950,204 | | | 0.100 | % | | Of the first $500 million |
| | | 0.075 | % | | Of the next $500 million |
| | | 0.050 | % | | On amounts in excess of $1 billion |
In addition to the above management fee paid to MetLife Advisers, the Asset Allocation Portfolio indirectly pays MetLife Advisers an investment advisory fee through its investments in the Underlying Portfolios.
Certain officers and trustees of the Trust may also be officers of MetLife Advisers; however, such officers and trustees receive no compensation from the Trust.
Expense Limitation Agreement - Pursuant to an expense agreement relating to each class of the Asset Allocation Portfolio, MetLife Advisers has contractually agreed, from April 29, 2013 to April 27, 2014, to waive a portion of its advisory fees or pay a portion of the other operating expenses (not including acquired fund fees and expenses, brokerage costs, interest, taxes, or extraordinary expenses) to the extent total operating expenses exceed stated annual expense limits (based on the Asset Allocation Portfolio’s then-current fiscal year). For the Asset Allocation Portfolio, this subsidy, and identical subsidies in effect in earlier periods, are subject to the obligation of each class of the Asset Allocation Portfolio to repay MetLife Advisers in future years, if any, when a class’ expenses fall below the stated expense limit pertaining to that class that was in effect at the time of the subsidy in question. Such deferred expenses may be charged to a class in a subsequent year to the extent that the charge does not cause the total expenses in such subsequent year to exceed the class’ stated expense limit that was in effect at the time of the subsidy in question; provided, however, that no class of
MSF-11
Metropolitan Series Fund
MetLife Moderate to Aggressive Allocation Portfolio
Notes to Financial Statements—December 31, 2013—(Continued)
the Asset Allocation Portfolio is obligated to repay any expense paid by MetLife Advisers more than five years after the end of the fiscal year in which such expense was incurred. The expense limits (annual rates as a percentage of each class of the Asset Allocation Portfolio’s net average daily net assets) in effect from April 29, 2013 to April 27, 2014 are 0.10% and 0.35% for Class A and B, respectively. As of December 31, 2013, there were no expenses deferred in prior periods subject to repayment.
Transfer Agency Agreement - MetLife serves as the transfer agent for the Trust. MetLife receives no fees for its services to the Trust under the transfer agency agreement.
Distribution and Service Fees - The Trust has a distribution agreement with MetLife Investors Distribution Company (“MIDC” or the “Distributor”) in which MIDC serves as the distributor for the Asset Allocation Portfolio’s Class A and B Shares. MIDC is a wholly-owned subsidiary of MetLife Investors Group, Inc., an affiliate of the Adviser. The Trust has also adopted a Distribution and Service Plan under Rule 12b-1 of the 1940 Act for the Asset Allocation Portfolio’s Class B shares. Under the Distribution and Services Plan, the Class B shares of the Asset Allocation Portfolio pay a fee to compensate the Insurance Companies (or their affiliates) and other broker-dealers and financial intermediaries involved in the offer and sale of Asset Allocation Portfolio shares for promoting or selling and servicing the Class B shares of the Asset Allocation Portfolio. The fees under the Distribution and Services Plan for each class of the Asset Allocation Portfolio’s shares are calculated as a percentage of the Asset Allocation Portfolio’s average daily net assets that are attributable to that Class. Currently, the fee is 0.25% per year for Class B shares. Amount incurred by the Asset Allocation Portfolio for the year ended December 31, 2013 is shown as Distribution and service fees in the Statement of Operations.
Deferred Trustee Compensation - Each Trustee who is not currently an active employee of MetLife or its affiliates receives compensation from the Trust for his or her service to the Trust. A deferred compensation plan (the “Plan”) is available to the Trustees on a voluntary basis. Deferred amounts remain in the Trust until distributed in accordance with the provisions of the Plan. The value of a participating Trustee’s deferral account is based on theoretical investments of deferred amounts, on the normal payment dates in certain portfolios of the Trust or Met Investors Series Trust, an affiliate of the Trust, as designated by the participating Trustee. Changes in the value of participants’ deferral accounts are reflected as Trustees’ fees and expenses in the Statement of Operations. The portion of the accrued obligations allocated to the Asset Allocation Portfolio under the Plan is reflected as Deferred trustees’ fees in the Statement of Assets and Liabilities.
6. Transactions in Securities of Underlying Portfolios
The Portfolio does not invest in the Underlying Portfolios for the purpose of exercising control; however, investments by the Portfolio within its principal investment strategies may represent a significant portion of the Underlying Portfolios net assets. Transactions in the Underlying Portfolios for the year ended December 31, 2013 were as follows:
| | | | | | | | | | | | | | | | |
Underlying Portfolio | | Number of
shares held at
December 31, 2012 | | | Shares
purchased | | | Shares
sold | | | Number of
shares held at
December 31, 2013 | |
Baillie Gifford International Stock | | | 12,632,605 | | | | 320,833 | | | | (29,697 | ) | | | 12,923,741 | |
BlackRock Bond Income | | | 985,971 | | | | 120,983 | | | | (208,745 | ) | | | 898,209 | |
BlackRock Capital Appreciation | | | 3,045,908 | | | | 700,932 | | | | (225,440 | ) | | | 3,521,400 | |
BlackRock Large Cap Value | | | 11,836,500 | | | | 871,157 | | | | (1,160,107 | ) | | | 11,547,550 | |
Clarion Global Real Estate | | | 7,646,359 | | | | 1,077,088 | | | | (285,076 | ) | | | 8,438,371 | |
ClearBridge Aggressive Growth | | | 12,427,536 | | | | 1,750,132 | | | | (1,891,584 | ) | | | 12,286,084 | |
ClearBridge Aggressive Growth II (formerly Janus Forty) | | | 1,114,196 | | | | 25,537 | | | | (1,139,733 | ) | | | — | |
Frontier Mid Cap Growth | | | — | | | | 478,260 | | | | (7,519 | ) | | | 470,741 | |
Goldman Sachs Mid Cap Value | | | 4,166,355 | | | | 205,061 | | | | (453,019 | ) | | | 3,918,397 | |
Harris Oakmark International | | | 7,791,262 | | | | 228,849 | | | | (852,948 | ) | | | 7,167,163 | |
Invesco Comstock | | | 13,410,738 | | | | 179,238 | | | | (1,621,797 | ) | | | 11,968,179 | |
Invesco Small Cap Growth | | | 7,472,791 | | | | 455,486 | | | | (1,934,161 | ) | | | 5,994,116 | |
Jennison Growth | | | 12,272,631 | | | | 1,220,975 | | | | (863,858 | ) | | | 12,629,748 | |
JPMorgan Core Bond | | | — | | | | 6,303,618 | | | | (2,432 | ) | | | 6,301,186 | |
JPMorgan Small Cap Value | | | 3,886,644 | | | | 28,128 | | | | (424,435 | ) | | | 3,490,337 | |
Loomis Sayles Small Cap Growth | | | 5,189,908 | | | | — | | | | (985,082 | ) | | | 4,204,826 | |
Lord Abbett Bond Debenture | | | 4,305,232 | | | | 433,989 | | | | (1,114,662 | ) | | | 3,624,559 | |
Met/Artisan Mid Cap Value | | | 147,016 | | | | 1,427 | | | | (19,513 | ) | | | 128,930 | |
Met/Dimensional International Small Company | | | 4,233,128 | | | | 225,305 | | | | (315,637 | ) | | | 4,142,796 | |
Met/Eaton Vance Floating Rate | | | 2,662,369 | | | | 416,533 | | | | (3,964 | ) | | | 3,074,938 | |
Met/Templeton International Bond | | | 4,883,098 | | | | 3,438,431 | | | | (5,735 | ) | | | 8,315,794 | |
MFS Emerging Markets Equity | | | 5,317,007 | | | | 3,975,820 | | | | (10,543 | ) | | | 9,282,284 | |
MFS Research International | | | 11,329,964 | | | | 277,108 | | | | (3,108,016 | ) | | | 8,499,056 | |
MFS Value | | | 12,633,319 | | | | 665,786 | | | | (1,486,718 | ) | | | 11,812,387 | |
Morgan Stanley Mid Cap Growth | | | 2,423,591 | | | | 21,155 | | | | (287,695 | ) | | | 2,157,051 | |
MSF-12
Metropolitan Series Fund
MetLife Moderate to Aggressive Allocation Portfolio
Notes to Financial Statements—December 31, 2013—(Continued)
| | | | | | | | | | | | | | | | |
Underlying Portfolio | | Number of
shares held at
December 31, 2012 | | | Shares
purchased | | | Shares
sold | | | Number of
shares held at
December 31, 2013 | |
Neuberger Berman Genesis | | | 2,200,088 | | | | 18,679 | | | | (293,357 | ) | | | 1,925,410 | |
PIMCO Inflation Protected Bond | | | 4,769,195 | | | | 1,591,658 | | | | (4,225 | ) | | | 6,356,628 | |
PIMCO Total Return | | | 13,274,368 | | | | 1,867,307 | | | | (1,625,266 | ) | | | 13,516,409 | |
T. Rowe Price Large Cap Growth | | | 6,554,263 | | | | 800,008 | | | | (597,999 | ) | | | 6,756,272 | |
T. Rowe Price Large Cap Value | | | 5,973,587 | | | | 105,484 | | | | (678,843 | ) | | | 5,400,228 | |
T. Rowe Price Mid Cap Growth | | | 3,068,100 | | | | 183,051 | | | | (408,564 | ) | | | 2,842,587 | |
T. Rowe Price Small Cap Growth | | | — | | | | 798,258 | | | | (61,455 | ) | | | 736,803 | |
Third Avenue Small Cap Value | | | 3,651,232 | | | | 46,251 | | | | (382,234 | ) | | | 3,315,249 | |
Van Eck Global Natural Resources | | | 6,662,349 | | | | 400,494 | | | | (25,408 | ) | | | 7,037,435 | |
Western Asset Management Strategic Bond Opportunities | | | 2,048,013 | | | | 352,719 | | | | (1,198,205 | ) | | | 1,202,527 | |
WMC Core Equity Opportunities Portfolio (formerly Davis Venture Value) | | | 4,392,498 | | | | 126,289 | | | | (857,665 | ) | | | 3,661,122 | |
| | | | | | | | | | | | | | | | |
Underlying Portfolio | | Net Realized
Gain/(Loss) on sales
of Underlying
Portfolios | | | Capital Gain
Distributions
from Underlying
Portfolios | | | Dividend Income
from Underlying
Portfolios | | | Ending Value
as of
December 31, 2013 | |
Baillie Gifford International Stock | | $ | (100,666 | ) | | $ | — | | | $ | 1,981,978 | | | $ | 136,216,228 | |
BlackRock Bond Income | | | 2,009,425 | | | | 2,157,241 | | | | 3,539,198 | | | | 96,404,740 | |
BlackRock Capital Appreciation | | | 1,058,560 | | | | — | | | | 794,141 | | | | 133,284,975 | |
BlackRock Large Cap Value | | | 3,762,940 | | | | 6,881,526 | | | | 1,779,901 | | | | 138,801,548 | |
Clarion Global Real Estate | | | (344,988 | ) | | | — | | | | 6,228,524 | | | | 94,003,447 | |
ClearBridge Aggressive Growth | | | 5,257,551 | | | | — | | | | 549,921 | | | | 165,247,834 | |
ClearBridge Aggressive Growth II (formerly Janus Forty) | | | 37,899,626 | | | | — | | | | 742,640 | | | | — | |
Frontier Mid Cap Growth | | | 31,862 | | | | 358,899 | | | | 190,436 | | | | 17,370,350 | |
Goldman Sachs Mid Cap Value | | | 886,840 | | | | 2,280,947 | | | | 708,836 | | | | 69,590,725 | |
Harris Oakmark International | | | 3,287,085 | | | | — | | | | 3,489,906 | | | | 137,107,835 | |
Invesco Comstock | | | 3,794,211 | | | | — | | | | 2,120,909 | | | | 174,496,045 | |
Invesco Small Cap Growth | | | 5,637,477 | | | | 6,644,012 | | | | 488,899 | | | | 123,059,194 | |
Jennison Growth | | | 3,407,782 | | | | 1,655,274 | | | | 674,371 | | | | 199,802,615 | |
JPMorgan Core Bond | | | 2 | | | | 240,369 | | | | 300,462 | | | | 64,083,064 | |
JPMorgan Small Cap Value | | | 1,662,396 | | | | — | | | | 445,693 | | | | 69,562,412 | |
Loomis Sayles Small Cap Growth | | | 2,786,975 | | | | — | | | | — | | | | 69,589,868 | |
Lord Abbett Bond Debenture | | | 4,103,758 | | | | — | �� | | | 2,995,818 | | | | 49,112,770 | |
Met/Artisan Mid Cap Value | | | 1,435,135 | | | | — | | | | 312,495 | | | | 34,630,514 | |
Met/Dimensional International Small Company | | | 1,684,172 | | | | 1,755,734 | | | | 1,265,469 | | | | 69,723,253 | |
Met/Eaton Vance Floating Rate | | | 2,056 | | | | 134,389 | | | | 1,187,997 | | | | 32,686,591 | |
Met/Templeton International Bond | | | 11,690 | | | | 374,076 | | | | 1,863,320 | | | | 97,461,100 | |
MFS Emerging Markets Equity | | | 50,343 | | | | — | | | | 1,140,523 | | | | 96,257,289 | |
MFS Research International | | | 8,391,365 | | | | — | | | | 2,539,826 | | | | 102,073,668 | |
MFS Value | | | 3,556,866 | | | | 6,096,665 | | | | 3,590,526 | | | | 209,669,871 | |
Morgan Stanley Mid Cap Growth | | | 556,242 | | | | — | | | | 262,356 | | | | 35,181,510 | |
Neuberger Berman Genesis | | | 1,602,223 | | | | — | | | | 260,385 | | | | 34,926,944 | |
PIMCO Inflation Protected Bond | | | 2,946 | | | | 3,084,001 | | | | 1,295,963 | | | | 63,248,451 | |
PIMCO Total Return | | | 1,403,299 | | | | 2,842,288 | | | | 6,474,755 | | | | 160,439,777 | |
T. Rowe Price Large Cap Growth | | | 6,805,193 | | | | — | | | | 390,964 | | | | 165,596,229 | |
T. Rowe Price Large Cap Value | | | 3,378,208 | | | | — | | | | 2,788,997 | | | | 173,617,342 | |
T. Rowe Price Mid Cap Growth | | | 784,664 | | | | 1,640,953 | | | | 132,811 | | | | 34,935,399 | |
T. Rowe Price Small Cap Growth | | | 153,847 | | | | 819,436 | | | | 53,036 | | | | 17,513,805 | |
Third Avenue Small Cap Value | | | 928,564 | | | | — | | | | 774,516 | | | | 69,752,834 | |
Van Eck Global Natural Resources | | | 101,830 | | | | — | | | | 793,234 | | | | 100,001,944 | |
Western Asset Management Strategic Bond Opportunities | | | 2,073,822 | | | | — | | | | 603,439 | | | | 16,173,987 | |
WMC Core Equity Opportunities Portfolio (formerly Davis Venture Value) | | | 2,508,227 | | | | 2,399,609 | | | | 2,009,152 | | | | 157,318,393 | |
| | | | | | | | | | | | | | | | |
| | $ | 110,571,528 | | | $ | 39,365,419 | | | $ | 54,771,397 | | | $ | 3,408,942,551 | |
| | | | | | | | | | | | | | | | |
MSF-13
Metropolitan Series Fund
MetLife Moderate to Aggressive Allocation Portfolio
Notes to Financial Statements—December 31, 2013—(Continued)
7. Contractual Obligations
Under the Trust’s organizational documents, its officers and Trustees may be indemnified against certain liabilities and expenses arising out of the performance of their duties to the Trust. Additionally, the Trust has a variety of indemnification obligations under contracts with its service providers. The Trust’s maximum exposure under these arrangements is unknown, as this would involve future claims that may be made against the Trust that have not yet occurred.
8. Income Tax Information
The tax character of distributions paid for the years ended December 31, 2013 and 2012 were as follows:
| | | | | | | | | | | | | | | | | | | | |
Ordinary Income | | | Long-Term Capital Gain | | | Total | |
2013 | | 2012 | | | 2013 | | | 2012 | | | 2013 | | | 2012 | |
| $46,283,497 | | $ | 54,750,037 | | | $ | — | | | $ | — | | | $ | 46,283,497 | | | $ | 54,750,037 | |
As of December 31, 2013, the components of distributable earnings (accumulated losses) on a federal income tax basis were as follows:
| | | | | | | | | | | | | | | | |
Undistributed
Ordinary
Income | | Undistributed
Long-Term
Capital Gain | | | Net
Unrealized
Appreciation | | | Loss Carryforwards | | | Total | |
| $55,977,568 | | $ | — | | | $ | 757,412,919 | | | $ | (85,376,912 | ) | | $ | 728,013,575 | |
The Asset Allocation Portfolio utilizes the provisions of the federal income tax laws that provide for the carryforward of capital losses for prior years, offsetting such losses against any future realized capital gains. Under the Regulated Investment Company Modernization Act of 2010 (the “Act”), net capital losses recognized after December 22, 2010 may be carried forward indefinitely and their character is retained as short-term and/or long-term losses. Previously, net capital losses were carried forward for up to eight years and treated as short-term losses. As a transition rule, the Act requires that post-enactment net capital losses be used before pre-enactment net capital losses.
During the year ended December 31, 2013, the Portfolio utilized capital loss carryforwards of $128,122,707.
As of December 31, 2013, the Asset Allocation Portfolio had no post-enactment accumulated capital losses and pre-enactment accumulated capital loss carryforwards and expiration dates were as follows:
| | | | | | | | |
Expiring
12/31/18 | | Expiring
12/31/17 | | | Total | |
| $4,303,324 | | $ | 81,073,588 | | | $ | 85,376,912 | |
9. Subsequent Events
At a meeting held on November 20, 2013, the Board, subject to shareholder approval, approved an Agreement and Plan of Reorganization providing for the acquisition of all the assets and assumption of all liabilities of MetLife Growth Strategy Portfolio (“Growth Strategy Portfolio”), a series of Met Investors Series Trust, by the Portfolio in exchange for shares of the Portfolio. On February 21, 2014, the shareholders of Growth Strategy Portfolio approved the proposed Agreement and Plan of Reorganization. It is anticipated that the reorganization will close on or about April 28, 2014 and the Portfolio would be renamed MetLife Asset Allocation 80 Portfolio.
MSF-14
Metropolitan Series Fund
MetLife Moderate to Aggressive Allocation Portfolio
Report of Independent Registered Public Accounting Firm
To the Shareholders of MetLife Moderate to Aggressive Allocation Portfolio and the Board of Trustees of Metropolitan Series Fund:
We have audited the accompanying statement of assets and liabilities, including the schedule of investments, of MetLife Moderate to Aggressive Allocation Portfolio, one of the portfolios constituting Metropolitan Series Fund, (the “Trust”) as of December 31, 2013, and the related statement of operations for the year then ended, the statements of changes in net assets for each of the two years in the period then ended, and the financial highlights for each of the five years in the period then ended. These financial statements and financial highlights are the responsibility of the Trust’s management. Our responsibility is to express an opinion on these financial statements and financial highlights based on our audits.
We conducted our audits in accordance with the standards of the Public Company Accounting Oversight Board (United States). Those standards require that we plan and perform the audit to obtain reasonable assurance about whether the financial statements and financial highlights are free of material misstatement. The Trust is not required to have, nor were we engaged to perform, an audit of its internal control over financial reporting. Our audits included consideration of internal control over financial reporting as a basis for designing audit procedures that are appropriate in the circumstances, but not for the purpose of expressing an opinion on the effectiveness of the Trust’s internal control over financial reporting. Accordingly, we express no such opinion. An audit also includes examining, on a test basis, evidence supporting the amounts and disclosures in the financial statements, assessing the accounting principles used and significant estimates made by management, as well as evaluating the overall financial statement presentation. Our procedures included confirmation of securities owned as of December 31, 2013, by correspondence with the transfer agent. We believe that our audits provide a reasonable basis for our opinion.
In our opinion, the financial statements and financial highlights referred to above present fairly, in all material respects, the financial position of MetLife Moderate to Aggressive Allocation Portfolio of Metropolitan Series Fund, as of December 31, 2013, the results of its operations for the year then ended, the changes in its net assets for each of the two years in the period then ended, and the financial highlights for each of the five years in the period then ended, in conformity with accounting principles generally accepted in the United States of America.
Deloitte & Touche LLP
Boston, Massachusetts
February 27, 2014
MSF-15
Metropolitan Series Fund
Trustees and Officers of Metropolitan Series Fund
The Trustees and executive officers of the Trust, their ages and their principal occupations during the past five years are set forth below. Unless otherwise indicated, the business address of each is One Financial Center, Boston, MA 02111. Each Trustee who is deemed an “interested person,” as such term is defined in the 1940 Act, is indicated by an asterisk. Those Trustees who are not “interested persons” as defined in the 1940 Act are referred to as “Independent Trustees.” Additional information about the Trustees is available in the Statement of Additional Information, which is available without charge, upon request, by calling (800) 848-3854.
Trustees of the Trust
| | | | | | | | | | |
Name and Age | | Position(s)
Held with
Registrant | | Term of Office and
Length of Time
Served | | Principal Occupation(s) During the
Past 5 Years(1) | | Number of
Portfolios
in Fund
Complex(2)
overseen | | Other Directorships Held
by Trustee During the
Past 5 Years(1) |
| Interested Trustee | | | | | | | | | | |
| Elizabeth M. Forget* (47) | | Trustee, Chairman of the Board, President and Chief Executive Officer | | Indefinite; From May 2006 (President and Chief Executive Officer)/ August 2006 (Trustee and Chairman of the Board) to present | | Senior Vice President, MetLife Inc.; President, MetLife Advisers, LLC and a predecessor company. | | 79 | | Trustee, Met Investors Series Trust (the “MIST Trust”);** various MetLife-affiliated boards. |
| | | | | |
| Independent Trustees | | | | | | | | | | |
| Stephen M. Alderman (54) | | Trustee | | Indefinite; From April 2012 to present | | Shareholder in the law firm of Garfield & Merel, Ltd. | | 79 | | Trustee, MIST Trust;** Director, International Truck Leasing Corp. |
| | | | | |
| Robert J. Boulware (57) | | Trustee | | Indefinite; From April 2012 to present | | Managing Director, Pilgrim Funds, LLC (private equity fund). | | 79 | | Trustee, MIST Trust;** Trustee, Vertical Capital Income Fund (closed-end fund); Director, Gainsco, Inc. (auto insurance). |
| | | | | |
| Susan C. Gause (61) | | Trustee | | Indefinite; From April 2012 to present | | Private Investor. | | 79 | | Trustee, MIST Trust;** Trustee, HSBC Funds. |
| | | | | |
| Nancy Hawthorne (62) | | Trustee | | Indefinite; From May 2003 to present | | Chief Executive Officer, Clerestory LLC (corporate advisor). | | 79 | | MIST Trust;** Director, THL Credit, Inc.**; Director, Avid Technology, Inc.** |
| | | | | |
| Barbara A. Nugent (57) | | Trustee | | Indefinite; From January 2014 to present | | President, True North Board Governance, LLC (consulting); until 2014, partner in the law firm of Stradley Ronon Stevens & Young, LLP. | | 79 | | Trustee, MIST Trust**; Director, Episcopal Healthcare Foundation; until 2014, member, Mutual Fund Directors Forum Advisory Board. |
| | | | | |
| Keith M. Schappert (62) | | Trustee | | Indefinite; From August 2009 to present | | Principal, Schappert Consulting LLC (asset management consulting). | | 79 | | Trustee, MIST Trust;** Director, The Commonfund for Nonprofit Organizations; until 2011, Director, Trilogy Global Advisors; Director, Mirae Asset Discovery Funds,** Director, Calamos Investments. |
| | | | | |
| Linda B. Strumpf (66) | | Trustee | | Indefinite; From May 2000 to present | | Chair of the Investment Committee, Leona M. and Harry B. Helmsley Charitable Trust; until 2011, Chief Investment Officer, Leona M. and Harry B. Helmsley Charitable Trust. | | 79 | | Since 2012, Trustee, MIST Trust,** Trustee and Member of Investment Committee, The Pennsylvania State University. |
| | | | | |
| Dawn M. Vroegop (47) | | Trustee | | Indefinite; From May 2009 to present | | Private Investor. | | 79 | | Trustee, MIST Trust,** Trustee, Driehaus Mutual Funds; Director and Investment Committee Chair, City College of San Francisco Foundation. |
MSF-16
Metropolitan Series Fund
Trustees and Officers of Metropolitan Series Fund—(Continued)
Executive Officers of the Trust
| | | | | | |
Name and Age | | Position(s) Held with
Registrant | | Term of Office
and Length of
Time Served | | Principal Occupation(s) During Past 5 Years(1) |
| Elizabeth M. Forget (47) | | President, Chief Executive Officer, Trustee and Chairman of the Board | | From May
2006 (President
and Chief
Executive
Officer)/
August 2006
(Trustee and
Chairman of
the Board) to
present | | See principal occupation information in the table above. |
| | | |
| Jeffrey L. Bernier (42) | | Vice President | | From February
2008 to present | | Vice President, MetLife, Inc.; Senior Vice President, MetLife Advisers, LLC and a predecessor company. |
| | | |
| Peter H. Duffy (58) | | Chief Financial Officer and Treasurer | | From November
2000 to present | | Senior Vice President, MetLife Advisers, LLC; Vice President, MetLife, Inc. |
| | | |
| Andrew L. Gangolf (59) | | Secretary | | From May
2011to present | | Senior Vice President, MetLife Advisers, LLC; Senior Vice President & Assistant General Counsel, AllianceBerstein Investments, Inc. |
| | | |
| Jeffrey P. Halperin (46) | | Chief Compliance Officer | | From November
2005 to present | | Vice President, MetLife, Inc.; Chief Compliance Officer, MIST; Chief Compliance Officer, MSF Trust; Chief Compliance Officer, MetLife Advisers, LLC and a predecessor company; Chief Compliance Officer, MetLife Investment Management, LLC (formerly MetLife Investment Advisors Company, LLC). |
| | | |
| Alan C. Leland, Jr. (61) | | Vice President | | From February
2005 to present | | Treasurer and Chief Financial Officer, MetLife Advisers, LLC; Vice President, MetLife Group Inc.; Vice President, MetLife, Inc. |
| * | Ms. Forget is an “interested person” of the Trust because of her positions with MetLife Advisers, LLC and her ownership of securities issued by MetLife, Inc., the ultimate parent company of MetLife Advisers, LLC. |
| ** | Indicates a directorship with a registered investment company or a company subject to the reporting requirements of the Securities Exchange Act of 1934, as amended. |
| (1) | Previous positions during the past five years with the Trust, MetLife, Inc. or the Adviser are omitted if not materially different. |
| (2) | The Fund Complex includes 49 Portfolios of the MIST Trust and 30 Portfolios of the Trust. |
MSF-17
Metropolitan Series Fund
MetLife Moderate to Aggressive Allocation Portfolio
Board of Trustees’ Consideration of Advisory Agreement
At an in-person meeting of the Boards of Trustees (the “Board”) of Met Investors Series Trust and Metropolitan Series Fund (“MIST” and “MSF,” respectively, and collectively, the “Trusts”) held on November 19-20, 2013, the Board, including a majority of the Trustees who are not considered to be “interested persons” of the Trusts (the “Independent Trustees”) under the Investment Company Act of 1940, as amended (the “1940 Act”), approved for an annual period the continuation of each Trust’s advisory agreement (the “Advisory Agreement”) with MetLife Advisers, LLC (the “Adviser”) and the applicable sub-advisory agreements (each a “Sub-Advisory Agreement,” and collectively with the Advisory Agreement, the “Agreements”) between the Adviser and the investment sub-advisers (each a “Sub-Adviser,” and collectively, the “Sub-Advisers”) for each of the series of the Trusts, including the MetLife Moderate to Aggressive Allocation Portfolio (each a “Portfolio,” and collectively, the “Portfolios”).1 As the Adviser has the day-to-day responsibility for managing the MetLife Moderate to Aggressive Allocation Portfolio’s investments, the Board only approved an Advisory Agreement with respect to the MetLife Moderate to Aggressive Allocation Portfolio.
In considering the Agreement, the Board reviewed a variety of materials provided by the Adviser relating to the Portfolios, including comparative performance, fee and expense information for an appropriate peer group of similar mutual funds, performance information for relevant benchmark indices and other information regarding the nature, extent and quality of services provided by the Adviser under the Agreement. The Board also took into account its experience with the Adviser and information provided to the Board in its meetings throughout the year with respect to the services provided by the Adviser, including quarterly performance reports prepared by management containing reviews of investment results. The Independent Trustees also assessed reports provided by the Board’s independent consultant, who reviewed and provided analyses regarding investment performance, fees and expenses, and other information provided by, or at the direction of, the Adviser, as more fully discussed below.
The Independent Trustees were separately advised by independent legal counsel throughout the process, and met with independent legal counsel in periodic executive sessions. Prior to voting to continue the Agreements at the November meeting, the Independent Trustees also received a memorandum from their independent counsel discussing the legal standards for their consideration of the proposed continuation of the Agreements. The Board also met in person with personnel of the Adviser on September 17, 2013 for the specific purpose of giving preliminary consideration to the proposed continuation of the Agreements and to request additional information they considered reasonably necessary to their deliberations. The Independent Trustees also discussed the proposed continuation of the Agreements in private sessions with their independent legal counsel at which no representatives of management were present.
In considering whether to approve the renewal of the Advisory Agreement with the Adviser with respect to a Portfolio, the Board reviewed and analyzed the factors it deemed relevant, including: (1) the nature, extent and quality of the services to be provided to the Portfolio by the Adviser; (2) the performance of the Portfolio as compared to a peer group and an appropriate index; (3) the Adviser’s personnel and operations; (4) the financial condition of the Adviser; (5) the level and method of computing each Portfolio’s advisory fees; (6) the profitability of the Adviser under the Advisory Agreement; (7) any “fall-out” benefits to the Adviser and its affiliates (i.e., ancillary benefits realized by the Adviser or its affiliates from the Adviser’s relationship with the Trusts); (8) the anticipated effect of growth in size on Portfolio expenses; and (9) possible conflicts of interest.
Nature, extent and quality of services. The Board evaluated the nature, extent and quality of the services that the Adviser has provided to the Portfolios. The Board considered the Adviser’s services as investment manager to the Portfolios. The Adviser’s services in coordinating and overseeing the activities of the Trusts’ service providers were also considered. The Board also evaluated the expertise and performance of the personnel of the Adviser who performed services for the Portfolios throughout the year.
The Board considered information received from the Trust’s Chief Compliance Officer (“CCO”) regarding the Portfolios’ compliance policies and procedures established pursuant to Rule 38a-l under the 1940 Act.
The Board considered the provision of investment advisory services by the Adviser to the Asset Allocation Portfolios (i.e., MetLife Aggressive Strategy Portfolio, MetLife Balanced Strategy Portfolio, MetLife Conservative Allocation Portfolio, MetLife Conservative to Moderate Allocation Portfolio, MetLife Defensive Strategy Portfolio, MetLife Growth Strategy Portfolio, MetLife Moderate Allocation Portfolio, MetLife Moderate to Aggressive Allocation Portfolio and MetLife Moderate Strategy Portfolio), the American Funds of Funds (i.e., American Funds Balanced Allocation Portfolio, American Funds Growth Allocation Portfolio and American Funds Moderate Allocation Portfolio), the MetLife Balanced Plus Portfolio and the MetLife Multi-Index Targeted Risk Portfolio. With respect to the Asset Allocation Portfolios, the Board noted that the Adviser has hired, at its own cost, an independent consultant to provide research and consulting services with respect to the periodic asset allocation targets for each of the Asset Allocation Portfolios and to investments in other Portfolios of the Trusts (the “Underlying Portfolios”), which may assist the Adviser with the selection of
1 The Pyramis Managed Risk Portfolio recently commenced operations and, therefore, the Agreement with respect to this Portfolio was not up for renewal.
MSF-18
Metropolitan Series Fund
MetLife Moderate to Aggressive Allocation Portfolio
Board of Trustees’ Consideration of Advisory Agreement—(Continued)
Underlying Portfolios for inclusion in each Asset Allocation Portfolio. Additionally, the Board considered that an Investment Committee, consisting of investment professionals from across MetLife, meets at least quarterly to review the asset allocations and discuss the performance of the Asset Allocation Portfolios and the American Funds of Funds.
Performance. The Board considered the performance of the Portfolios as described in the quarterly reports prepared by management, and as also analyzed in reports prepared by the Independent Trustees’ independent consultant. The Board noted that the Adviser reviews with the Board on a quarterly basis detailed information about the Portfolios’ performance results, portfolio composition and investment strategies. The Board also reviewed and considered a separate report prepared by Lipper Inc. (“Lipper”), an independent third party, which provided a statistical analysis comparing the Portfolios’ investment performance, expenses, and fees to comparable funds underlying variable insurance products (the “Performance Universe”). In addition, the Independent Trustees met separately with a representative of Bobroff Consulting, Inc., an independent consultant (“Bobroff), at a special board meeting in September 2013, to review the separate reports prepared by such consultant (“Bobroff Report”), which analyzed the report prepared by Lipper. The Board also considered each Portfolio’s more recent performance subsequent to the performance period covered by the Lipper reports, and management’s discussion of the same, including the effect of current market conditions on each Portfolio’s more recent performance.
The Board reviewed the Portfolios’ performance records and the Adviser’s management styles and long-term performance records with the Portfolios and comparable funds. The Board focused particular attention on Portfolios with less favorable performance records. The Board noted that the Adviser has been active in monitoring and responding to any performance issues with respect to the Portfolios. The Board also took into account its discussions with management regarding factors that contributed to the performance of the Portfolios.
Among other data relating specifically to the MetLife Moderate to Aggressive Allocation Portfolio’s performance, the Board considered that the Portfolio outperformed the median of its Performance Universe and its Lipper Index for the one-, three- and five-year periods ended June 30, 2013. The Board further considered that the Portfolio outperformed the Moderate to Aggressive AA Broad Index for the one- and five-year periods ended October 31, 2013 and underperformed this index for the three-year period ended October 31, 2013.
Fees and Expenses. The Board gave consideration to the advisory fees payable under the Advisory Agreement. In this regard, the Board reviewed the advisory fees payable on a Portfolio-by-Portfolio basis based on information provided by the Adviser. The Independent Trustees, with the assistance of Bobroff, also examined the fees paid by a Portfolio in light of fees paid to other investment managers by comparable funds, as well as considered the fees charged by the Adviser to manage other comparable funds, as applicable. The Lipper report included comparisons of the Adviser’s fee schedule with that of its peers based on an asset-based analysis of relative fee structures according to the size of the Portfolio. In addition, the Board considered the Portfolios’ advisory fees and total expenses as compared to similarly situated investment companies underlying variable insurance products deemed to be comparable to the Portfolios as determined by Lipper. The Board considered a Portfolio’s ranking within a smaller group of peer funds chosen by Lipper (the “Expense Group”), as well as the Portfolio’s ranking within broader groups of funds (the “Expense Universe”). In comparing a Portfolio’s actual and contractual management fee to that of comparable funds, the Board noted that such fee includes both advisory and administrative fees. The Board also considered that the Adviser had entered into expense limitation agreements with certain of the Portfolios, pursuant to which the Adviser has agreed to waive a portion of its advisory fee and/or reimburse certain expenses as a means of limiting a Portfolio’s total annual operating expenses.
With respect to the MetLife Moderate to Aggressive Allocation Portfolio, the Board considered that the Portfolio’s actual management fees and total expenses (exclusive of 12b-l fees) were below the Expense Group median. The Board also took into account that the Portfolio’s actual management fees were above the Expense Universe median and that the Portfolio’s total expenses (exclusive of 12b-1 fees) were equal to the Expense Universe median. The Board considered that the Portfolio’s contractual management fees were below the asset-weighted average of the Expense Group at the Portfolio’s current size.
Profitability. The Board examined the profitability of the Adviser on a Portfolio-by-Portfolio basis. With respect to the Asset Allocation Portfolios, the Board noted that the advisory fee is in addition to the fees received by the Adviser and its affiliates with regard to the Underlying Portfolios in which the Asset Allocation Portfolios may invest. In considering the profitability to the Adviser from the Asset Allocation Portfolios, the Board took into consideration the profitability to the Adviser of the funds underlying the Asset Allocation Portfolios. The Board also considered that the Distributor, MetLife Investors Distribution Company, receives Rule 12b-1 payments to support the distribution of the products.
Economies of scale. The Board also considered the effect of the Portfolios’ growth in size on their fees. The Board noted that the fee schedules for most of the Portfolios contain breakpoints that reduce the fee rate above specified asset levels. The Board noted those
MSF-19
Metropolitan Series Fund
MetLife Moderate to Aggressive Allocation Portfolio
Board of Trustees’ Consideration of Advisory Agreement—(Continued)
Portfolios that did not contain breakpoints in the advisory fee and took into account management’s discussion of the same. The Board noted that those Portfolios with advisory fee schedules containing breakpoints generally reflect the inclusion of breakpoints in the sub-advisory fee schedule for such Portfolios. The Board considered the effective fees under the Advisory Agreement for a Portfolio as a percentage of assets at different asset levels and possible economies of scale that may be realized if the assets of the Portfolio grow. Among other data, the Board examined the effect of a Portfolio’s growth in size on various fee schedules and reviewed the Lipper and Bobroff Reports, which compared fees among peers. The Board also generally noted that if a Portfolio’s assets increase over time, the Portfolio may realize other economies of scale if assets increase proportionally more than certain other fixed expenses. In addition, the Board noted that the Adviser had taken a number of steps to date intended to share the benefits of economies of scale with contractholders.
With respect to the MetLife Moderate to Aggressive Allocation Portfolio, the Board noted that the Portfolio’s advisory fee contains breakpoints that reduce the advisory fee rate on assets above certain specified asset levels. The Board considered the fact that the Portfolio’s fee levels decline as portfolio assets increase.
Other factors. As part of its evaluation of the Adviser’s compensation, the Board considered other benefits that may be realized by the Adviser and its affiliates from their relationship with the Trusts. Among them, the Board recognized that an affiliate of the Adviser, MetLife Investors Distribution Company, serves as the Distributor for the Trusts, and, as such, receives payments pursuant to Rule 12b-1 from the Portfolios to compensate it for providing shareholder services and selling activities, which could lead to growth in the Trusts’ assets and corresponding benefits from such growth, including economies of scale. The Board also considered that affiliates of the Adviser may benefit from certain indirect tax benefits relating to dividend received deductions and foreign tax credits. In conjunction with these considerations, the Board noted the costs of providing investment management and other services to the Portfolios and the ongoing commitment of the Adviser to the Portfolios.
The Board considered possible conflicts of interest in the form of material benefits or detriments to the Trusts resulting from the nature of the Trusts’ and the Adviser’s affiliations and the services that are provided to the Trusts, and the manner in which such conflicts were mitigated.
Conclusions. After full consideration of the factors discussed above, the Board, including a majority of the Independent Trustees, approved the Advisory Agreement and the Sub-Advisory Agreement, as applicable, with respect to each Portfolio, unless otherwise noted. In making its approvals, the Board concluded that the nature, extent and quality of services provided by the Adviser supported the renewal of the Agreements. The Board also concluded that the investment performance of each Fund was such that each Agreement should continue. In addition, the Board concluded that fees paid by a Portfolio to the Adviser appeared to be acceptable in light of nature, extent and quality of the services provided by the Adviser. Further, the Board concluded that the Adviser’s profitability in providing services under the Advisory Agreements did not appear unreasonably high in light of the nature, extent and quality of the services provided by the Adviser. Finally, the Board concluded that the Advisory fees in some measure share economies of scale with contractholders. In approving the renewal of each of the Agreements, the Board, including the Independent Trustees, did not identify any single factor as controlling, and generally attributed different weights to various factors for the various Portfolios. The Board evaluated all information available to them on a Portfolio-by-Portfolio basis, and their decisions were made separately with respect to each Portfolio.
MSF-20
Metropolitan Series Fund
MetLife Mid Cap Stock Index Portfolio
Managed By MetLife Investment Management, LLC
Portfolio Manager Commentary*
PERFORMANCE
For the one year period ended December 31, 2013, the Class A, B, E, and G shares of the MetLife Mid Cap Stock Index Portfolio returned 33.15%, 32.83%, 32.95%, and 32.75%, respectively. The Portfolio’s benchmark, the Standard & Poor’s (“S&P”) MidCap 400 Index1, returned 33.50%.
MARKET ENVIRONMENT / CONDITIONS
Equity indexes reached record highs in 2013, driven by central bank intervention and an improving economy. The year started on a positive note as U.S. lawmakers reached agreements on the fiscal cliff and debt ceiling, and earnings data was generally positive. The markets were further supported by rate cuts by the European Central Bank (the “ECB”), the Reserve Bank of Australia, the Bank of Korea, and the Bank of Israel. Despite fears that the Federal Reserve (the “Fed”) would begin tapering asset purchases and end quantitative easing, the markets continued to climb higher on better than expected macroeconomic data, including U.S. jobless claims, payrolls, and factory orders. Headwinds during the year included increased tensions in Syria and Egypt and a U.S. government shutdown following the failure of U.S. lawmakers to reach an agreement in budget negotiations. However, equity markets ended the year at their highs, as the ECB announced an unexpected rate cut, a tentative nuclear deal with Iran was negotiated, and investors continued to be optimistic that central banks would continue their easy monetary policy after Fed Chairman nominee Janet Yellen’s testimony in front of Congress was more dovish than expected.
During the year, the Federal Open Market Committee (the “Committee”) met eight times and maintained the target range for the Federal Funds Rate at zero to 0.25%. The Committee stated that economic activity was expanding at a moderate pace, labor market conditions have continued to improve, and the unemployment rate had declined but remained elevated. The Committee noted that the risks to the outlook for the economy and the labor market have become more nearly balanced. Subsequently, the Committee decided to modestly reduce the pace of its asset purchases from $85 billion per month to $75 billion per month.
All ten sectors comprising the S&P MidCap 400 Index experienced positive returns for the year. Health Care (9.4% beginning weight in the benchmark), up 45.9%, and Industrials (17.3% beginning weight), up 43.7%, were the best-performing sectors. The worst relative-performing sectors were Telecom Services (0.5% beginning weight), up 19.4% and Materials (7.2% beginning weight), up 24.6%.
The stocks with the largest positive impact on the benchmark return for the year were Vertex Pharmaceuticals, up 81.6%, Tractor Supply, up 77.1%, and Alliance Data Systems up 73.0%. The stocks with the largest negative impact were Rackspace Hosting, down 47.3%, Royal Gold, down 42.3%, and Equinix, down 13.9%.
PORTFOLIO REVIEW / PERIOD END POSITIONING
The Portfolio is managed utilizing a full replication strategy versus the S&P MidCap 400 Index. This strategy seeks to track the performance of the Index by owning all of the components of the Index at their respective Index capitalization weights. The Portfolio is periodically rebalanced for compositional changes in the S&P MidCap 400 Index. Factors that impact tracking error include transaction costs, cash drag, securities lending, NAV rounding, contributions and withdrawals.
Stacey Lituchy
Norman Hu
Mirsad Usejnoski
Portfolio Managers
MetLife Investment Management, LLC
* This commentary may include statements that constitute “forward-looking statements” under the U.S. securities laws. Forward-looking statements include, among other things, projections, estimates, and information about possible or future results related to the Portfolio, market or regulatory developments. The views expressed above are not guarantees of future performance or economic results and involve certain risks, uncertainties and assumptions that could cause actual outcomes and results to differ materially from the views expressed herein. The views expressed above are subject to change at any time based upon economic, market, or other conditions and the subadvisory firm undertakes no obligation to update the views expressed herein. Any discussions of specific securities should not be considered a recommendation to buy or sell those securities. The views expressed above (including any forward-looking statement) may not be relied upon as investment advice or as an indication of the Portfolio’s trading intent. Information about the Portfolio’s holdings, asset allocation or country diversification is historical and is not an indication of future Portfolio composition, which may vary. Direct investment in any index is not possible. The performance of any index mentioned in this commentary has not been adjusted for ongoing management, distribution and operating expenses, and sales charges applicable to mutual fund investments. In addition, the returns do not reflect additional fees charged by separate accounts or variable insurance contracts that an investor in the Portfolio may pay. If these additional fees were reflected, performance would have been lower.
MSF-1
Metropolitan Series Fund
MetLife Mid Cap Stock Index Portfolio
A $10,000 INVESTMENT COMPARED TO THE S&P MIDCAP 400 INDEX
AVERAGE ANNUAL RETURNS (%) (FOR THE YEAR ENDED DECEMBER 31, 2013)
| | | | | | | | | | | | | | | | |
| | | 1 Year | | | 5 Year | | | 10 Year | | | Since Inception2 | |
| MetLife Mid Cap Stock Index Portfolio | | | | | | | | | | | | | | | | |
Class A | | | 33.15 | | | | 21.59 | | | | 10.12 | | | | — | |
Class B | | | 32.83 | | | | 21.31 | | | | 9.85 | | | | — | |
Class E | | | 32.95 | | | | 21.42 | | | | 9.96 | | | | — | |
Class G | | | 32.75 | | | | — | | | | — | | | | 22.32 | |
| S&P MidCap 400 Index | | | 33.50 | | | | 21.89 | | | | 10.36 | | | | — | |
1 The Standard & Poor’s MidCap 400 Index is an unmanaged index measuring the performance of the mid-size company segment of the U.S. market. The Index consists of 400 domestic stocks chosen for market size, liquidity, and industry group representation.
2 Inception dates of the Class A, Class B, Class E, and Class G shares are 7/5/00, 1/2/01, 5/1/01, and 4/28/09, respectively.
Portfolio performance is calculated including reinvestment of all income and capital gain distributions. Performance numbers are net of all Portfolio expenses but do not include any insurance, sales, separate account or administrative charges of variable annuity or life insurance contracts or any additional expenses that participants may bear relating to the operations of their plans. If these charges were included, the returns would be lower. The performance of any index referenced above has not been adjusted for ongoing management, distribution and operating expenses, and sales charges applicable to mutual fund investments. Direct investment in any index is not possible. The performance of Class A shares, as set forth in the line graph above, will differ from that of other classes because of the difference in expenses paid by policyholders investing in the different share classes.
This information represents past performance and is not indicative of future results. Investment return and principal value may fluctuate so that shares, upon redemption, may be worth more or less than the original cost.
PORTFOLIO COMPOSITION AS OF DECEMBER 31, 2013
Top Holdings
| | | | |
| | |
% of
Net Assets | |
SPDR S&P MidCap 400 ETF Trust | | | 2.7 | |
Affiliated Managers Group, Inc. | | | 0.7 | |
Tractor Supply Co. | | | 0.7 | |
Green Mountain Coffee Roasters, Inc. | | | 0.6 | |
LKQ Corp. | | | 0.6 | |
HollyFrontier Corp. | | | 0.6 | |
Henry Schein, Inc. | | | 0.6 | |
Polaris Industries, Inc. | | | 0.6 | |
Church & Dwight Co., Inc. | | | 0.6 | |
Cimarex Energy Co. | | | 0.6 | |
Top Sectors
| | | | |
| | | % of
Market Value of
Total Long-Term Investments | |
Financials | | | 24.6 | |
Industrials | | | 16.6 | |
Information Technology | | | 15.4 | |
Consumer Discretionary | | | 13.7 | |
Health Care | | | 8.7 | |
Materials | | | 6.9 | |
Energy | | | 5.6 | |
Utilities | | | 4.2 | |
Consumer Staples | | | 3.9 | |
Telecommunication Services | | | 0.4 | |
MSF-2
Metropolitan Series Fund
MetLife Mid Cap Stock Index Portfolio
Understanding Your Portfolio’s Expenses
Shareholder Expense Example
As a shareholder of the Portfolio, you incur ongoing costs, including management fees; distribution and service (12b-1) fees; and other Portfolio expenses. This example is intended to help you understand your ongoing costs (in dollars) (referred to as “expenses”) of investing in the Portfolio and compare these costs with the ongoing costs of investing in other mutual funds. The example is based on an investment of $1,000 invested at the beginning of the period and held for the entire period, July 1, 2013 through December 31, 2013.
Actual Expenses
The first line for each share class of the Portfolio in the table below provides information about actual account values and actual expenses. You may use the information in this line, together with the amount you invested in the particular share class of the Portfolio, to estimate the expenses that you paid over the period. Simply divide your account value by $1,000 (for example, an $8,600 account value divided by $1,000 = 8.6), then multiply the result by the number in the first line under the heading entitled “Expenses Paid During Period” to estimate the expenses you paid on your account during this period.
Hypothetical Example for Comparison Purposes
The second line for each share class of the Portfolio in the table below provides information about hypothetical account values and hypothetical expenses based on the Portfolio’s actual expense ratio and an assumed rate of return of 5% per year before expenses, which is not the Portfolio’s actual return. The hypothetical account values and expenses may not be used to estimate the actual ending account balance or expenses you paid for the period. You may use this information to compare the ongoing costs of investing in the Portfolio and other funds. To do so, compare this 5% hypothetical example with the 5% hypothetical examples that appear in the shareholder reports of the other funds.
Please note that the expenses shown in the table are meant to highlight your ongoing costs only and do not reflect any fees or charges of your variable insurance product or any additional expenses that participants in certain eligible qualified plans may bear relating to the operations of their plan. Therefore, the second line for each share class in the table is useful in comparing ongoing costs only, and will not help you determine the relative total costs of owning different funds. In addition, if these other costs were included, your costs would have been higher.
| | | | | | | | | | | | | | | | | | |
MetLife Mid Cap Stock Index Portfolio | | | | Annualized
Expense
Ratio | | | Beginning
Account Value
July 1,
2013 | | | Ending
Account Value
December 31,
2013 | | | Expenses Paid
During Period**
July 1, 2013
to
December 31,
2013 | |
Class A(a) | | Actual | | | 0.29 | % | | $ | 1,000.00 | | | $ | 1,164.00 | | | $ | 1.58 | |
| | Hypothetical* | | | 0.29 | % | | $ | 1,000.00 | | | $ | 1,023.74 | | | $ | 1.48 | |
| | | | | |
Class B(a) | | Actual | | | 0.54 | % | | $ | 1,000.00 | | | $ | 1,162.40 | | | $ | 2.94 | |
| | Hypothetical* | | | 0.54 | % | | $ | 1,000.00 | | | $ | 1,022.48 | | | $ | 2.75 | |
| | | | | |
Class E(a) | | Actual | | | 0.44 | % | | $ | 1,000.00 | | | $ | 1,163.10 | | | $ | 2.40 | |
| | Hypothetical* | | | 0.44 | % | | $ | 1,000.00 | | | $ | 1,022.99 | | | $ | 2.24 | |
| | | | | |
Class G(a) | | Actual | | | 0.59 | % | | $ | 1,000.00 | | | $ | 1,161.90 | | | $ | 3.22 | |
| | Hypothetical* | | | 0.59 | % | | $ | 1,000.00 | | | $ | 1,022.23 | | | $ | 3.01 | |
* Hypothetical assumes a rate of return of 5% per year before expenses.
** Expenses paid are equal to the Portfolio’s annualized expense ratio for the most recent six month period, as shown above, multiplied by the average account value over the period, multiplied by the number of days (184 days) in the most recent fiscal half-year, divided by 365 (to reflect the one-half year period).
(a) The annualized expense ratio shown reflects the impact of the management fee waiver as described in Note 6 of the Notes to Financial Statements.
MSF-3
Metropolitan Series Fund
MetLife Mid Cap Stock Index Portfolio
Schedule of Investments as of December 31, 2013
Common Stocks—94.7% of Net Assets
| | | | | | | | |
| Security Description | | Shares | | | Value | |
|
Aerospace & Defense—1.7% | |
Alliant Techsystems, Inc. | | | 17,818 | | | $ | 2,168,094 | |
BE Aerospace, Inc. (a) | | | 55,099 | | | | 4,795,266 | |
Esterline Technologies Corp. (a) | | | 17,554 | | | | 1,789,806 | |
Exelis, Inc. | | | 105,358 | | | | 2,008,123 | |
Huntington Ingalls Industries, Inc. | | | 27,624 | | | | 2,486,436 | |
Triumph Group, Inc. | | | 29,123 | | | | 2,215,387 | |
| | | | | | | | |
| | | | | | | 15,463,112 | |
| | | | | | | | |
|
Air Freight & Logistics—0.1% | |
UTi Worldwide, Inc. | | | 50,988 | | | | 895,349 | |
| | | | | | | | |
|
Airlines—0.4% | |
Alaska Air Group, Inc. | | | 38,881 | | | | 2,852,699 | |
JetBlue Airways Corp. (a) (b) | | | 121,633 | | | | 1,039,962 | |
| | | | | | | | |
| | | | | | | 3,892,661 | |
| | | | | | | | |
|
Auto Components—0.3% | |
Gentex Corp. | | | 80,975 | | | | 2,671,365 | |
| | | | | | | | |
|
Automobiles—0.2% | |
Thor Industries, Inc. | | | 25,048 | | | | 1,383,401 | |
| | | | | | | | |
|
Biotechnology—0.6% | |
Cubist Pharmaceuticals, Inc. (a) (b) | | | 41,436 | | | | 2,853,697 | |
United Therapeutics Corp. (a) (b) | | | 25,854 | | | | 2,923,571 | |
| | | | | | | | |
| | | | | | | 5,777,268 | |
| | | | | | | | |
|
Building Products—1.0% | |
AO Smith Corp. | | | 42,873 | | | | 2,312,570 | |
Fortune Brands Home & Security, Inc. | | | 92,995 | | | | 4,249,871 | |
Lennox International, Inc. | | | 25,483 | | | | 2,167,584 | |
| | | | | | | | |
| | | | | | | 8,730,025 | |
| | | | | | | | |
|
Capital Markets—2.6% | |
Affiliated Managers Group, Inc. (a) | | | 29,642 | | | | 6,428,757 | |
Apollo Investment Corp. | | | 125,740 | | | | 1,066,275 | |
Eaton Vance Corp. (b) | | | 67,893 | | | | 2,905,142 | |
Federated Investors, Inc. - Class B (b) | | | 52,699 | | | | 1,517,731 | |
Greenhill & Co., Inc. (b) | | | 14,604 | | | | 846,156 | |
Janus Capital Group, Inc. (b) | | | 83,586 | | | | 1,033,959 | |
Raymond James Financial, Inc. | | | 68,959 | | | | 3,598,970 | |
SEI Investments Co. | | | 80,180 | | | | 2,784,651 | |
Waddell & Reed Financial, Inc. - Class A | | | 47,789 | | | | 3,112,020 | |
| | | | | | | | |
| | | | | | | 23,293,661 | |
| | | | | | | | |
|
Chemicals—2.7% | |
Albemarle Corp. | | | 45,542 | | | | 2,886,907 | |
Ashland, Inc. | | | 40,331 | | | | 3,913,720 | |
Cabot Corp. | | | 33,349 | | | | 1,714,139 | |
Cytec Industries, Inc. | | | 19,841 | | | | 1,848,388 | |
Intrepid Potash, Inc. (a) (b) | | | 30,944 | | | | 490,153 | |
Minerals Technologies, Inc. | | | 19,264 | | | | 1,157,189 | |
NewMarket Corp. (b) | | | 6,382 | | | | 2,132,545 | |
Olin Corp. (b) | | | 44,518 | | | | 1,284,344 | |
RPM International, Inc. | | | 74,381 | | | | 3,087,555 | |
|
Chemicals—(Continued) | |
Scotts Miracle-Gro Co. (The) - Class A | | | 24,581 | | | | 1,529,430 | |
Sensient Technologies Corp. | | | 28,006 | | | | 1,358,851 | |
Valspar Corp. (The) | | | 45,101 | | | | 3,215,250 | |
| | | | | | | | |
| | | | | | | 24,618,471 | |
| | | | | | | | |
|
Commercial Banks—4.4% | |
Associated Banc-Corp. | | | 90,933 | | | | 1,582,234 | |
BancorpSouth, Inc. (b) | | | 46,878 | | | | 1,191,639 | |
Bank of Hawaii Corp. (b) | | | 24,910 | | | | 1,473,177 | |
Cathay General Bancorp | | | 41,136 | | | | 1,099,565 | |
City National Corp. | | | 26,482 | | | | 2,097,904 | |
Commerce Bancshares, Inc. | | | 45,588 | | | | 2,047,337 | |
Cullen/Frost Bankers, Inc. (b) | | | 29,448 | | | | 2,191,815 | |
East West Bancorp, Inc. | | | 77,063 | | | | 2,694,893 | |
First Horizon National Corp. (b) | | | 132,223 | | | | 1,540,398 | |
First Niagara Financial Group, Inc. | | | 198,041 | | | | 2,103,195 | |
FirstMerit Corp. | | | 92,344 | | | | 2,052,807 | |
Fulton Financial Corp. | | | 107,673 | | | | 1,408,363 | |
Hancock Holding Co. | | | 45,939 | | | | 1,685,042 | |
International Bancshares Corp. | | | 31,960 | | | | 843,424 | |
Prosperity Bancshares, Inc. (b) | | | 31,735 | | | | 2,011,682 | |
Signature Bank (a) | | | 26,458 | | | | 2,842,118 | |
SVB Financial Group (a) | | | 25,550 | | | | 2,679,173 | |
Synovus Financial Corp. | | | 543,966 | | | | 1,958,278 | |
TCF Financial Corp. (b) | | | 92,240 | | | | 1,498,900 | |
Trustmark Corp. | | | 37,590 | | | | 1,008,916 | |
Valley National Bancorp (b) | | | 111,689 | | | | 1,130,293 | |
Webster Financial Corp. | | | 50,545 | | | | 1,575,993 | |
Westamerica Bancorp (b) | | | 14,899 | | | | 841,198 | |
| | | | | | | | |
| | | | | | | 39,558,344 | |
| | | | | | | | |
|
Commercial Services & Supplies—1.7% | |
Brink’s Co. (The) | | | 27,005 | | | | 921,951 | |
Clean Harbors, Inc. (a) (b) | | | 30,884 | | | | 1,851,805 | |
Copart, Inc. (a) | | | 62,515 | | | | 2,291,175 | |
Deluxe Corp. | | | 28,254 | | | | 1,474,576 | |
Herman Miller, Inc. | | | 32,999 | | | | 974,130 | |
HNI Corp. | | | 25,318 | | | | 983,098 | |
Mine Safety Appliances Co. | | | 17,687 | | | | 905,751 | |
Rollins, Inc. | | | 35,911 | | | | 1,087,744 | |
RR Donnelley & Sons Co. | | | 101,659 | | | | 2,061,645 | |
Waste Connections, Inc. (b) | | | 69,123 | | | | 3,015,836 | |
| | | | | | | | |
| | | | | | | 15,567,711 | |
| | | | | | | | |
|
Communications Equipment—0.9% | |
ADTRAN, Inc. (b) | | | 32,276 | | | | 871,775 | |
Ciena Corp. (a) (b) | | | 57,706 | | | | 1,380,905 | |
InterDigital, Inc. | | | 23,046 | | | | 679,626 | |
JDS Uniphase Corp. (a) | | | 130,269 | | | | 1,690,892 | |
Plantronics, Inc. | | | 24,491 | | | | 1,137,607 | |
Polycom, Inc. (a) (b) | | | 79,970 | | | | 898,063 | |
Riverbed Technology, Inc. (a) | | | 90,591 | | | | 1,637,885 | |
| | | | | | | | |
| | | | | | | 8,296,753 | |
| | | | | | | | |
See accompanying notes to financial statements.
MSF-4
Metropolitan Series Fund
MetLife Mid Cap Stock Index Portfolio
Schedule of Investments as of December 31, 2013
Common Stocks—(Continued)
| | | | | | | | |
| Security Description | | Shares | | | Value | |
|
Computers & Peripherals—1.2% | |
3D Systems Corp. (a) (b) | | | 53,480 | | | $ | 4,969,897 | |
Diebold, Inc. (b) | | | 35,716 | | | | 1,178,985 | |
Lexmark International, Inc. - Class A | | | 34,743 | | | | 1,234,071 | |
NCR Corp. (a) | | | 93,099 | | | | 3,170,952 | |
| | | | | | | | |
| | | | | | | 10,553,905 | |
| | | | | | | | |
|
Construction & Engineering—0.8% | |
AECOM Technology Corp. (a) | | | 54,934 | | | | 1,616,708 | |
Granite Construction, Inc. | | | 20,229 | | | | 707,610 | |
KBR, Inc. | | | 82,877 | | | | 2,642,948 | |
URS Corp. | | | 41,897 | | | | 2,220,122 | |
| | | | | | | | |
| | | | | | | 7,187,388 | |
| | | | | | | | |
|
Construction Materials—0.5% | |
Eagle Materials, Inc. | | | 27,936 | | | | 2,163,085 | |
Martin Marietta Materials, Inc. | | | 25,876 | | | | 2,586,047 | |
| | | | | | | | |
| | | | | | | 4,749,132 | |
| | | | | | | | |
|
Containers & Packaging—1.6% | |
Aptargroup, Inc. | | | 36,844 | | | | 2,498,392 | |
Greif, Inc. - Class A | | | 17,036 | | | | 892,686 | |
Packaging Corp. of America | | | 54,873 | | | | 3,472,363 | |
Rock-Tenn Co. - Class A | | | 40,305 | | | | 4,232,428 | |
Silgan Holdings, Inc. | | | 24,481 | | | | 1,175,578 | |
Sonoco Products Co. | | | 57,041 | | | | 2,379,751 | |
| | | | | | | | |
| | | | | | | 14,651,198 | |
| | | | | | | | |
|
Distributors—0.6% | |
LKQ Corp. (a) | | | 168,193 | | | | 5,533,550 | |
| | | | | | | | |
|
Diversified Consumer Services—0.8% | |
Apollo Group, Inc. - Class A (a) | | | 55,846 | | | | 1,525,713 | |
DeVry, Inc. (b) | | | 31,853 | | | | 1,130,781 | |
Matthews International Corp. - Class A (b) | | | 15,264 | | | | 650,399 | |
Service Corp. International | | | 118,589 | | | | 2,150,019 | |
Sotheby’s | | | 38,442 | | | | 2,045,114 | |
| | | | | | | | |
| | | | | | | 7,502,026 | |
| | | | | | | | |
|
Diversified Financial Services—0.6% | |
CBOE Holdings, Inc. | | | 48,786 | | | | 2,534,921 | |
MSCI, Inc. (a) | | | 66,246 | | | | 2,896,275 | |
| | | | | | | | |
| | | | | | | 5,431,196 | |
| | | | | | | | |
| |
Diversified Telecommunication Services—0.3% | | | | | |
tw telecom, Inc. (a) | | | 80,603 | | | | 2,455,973 | |
| | | | | | | | |
|
Electric Utilities—1.5% | |
Cleco Corp. | | | 33,822 | | | | 1,576,781 | |
Great Plains Energy, Inc. | | | 85,897 | | | | 2,082,143 | |
Hawaiian Electric Industries, Inc. (b) | | | 55,728 | | | | 1,452,272 | |
IDACORP, Inc. | | | 28,105 | | | | 1,456,963 | |
OGE Energy Corp. | | | 111,032 | | | | 3,763,985 | |
PNM Resources, Inc. | | | 44,565 | | | | 1,074,908 | |
Westar Energy, Inc. (b) | | | 71,141 | | | | 2,288,606 | |
| | | | | | | | |
| | | | | | | 13,695,658 | |
| | | | | | | | |
|
Electrical Equipment—0.9% | |
Acuity Brands, Inc. | | | 24,020 | | | | 2,625,866 | |
General Cable Corp. (b) | | | 27,839 | | | | 818,745 | |
Hubbell, Inc. - Class B | | | 30,095 | | | | 3,277,346 | |
Regal-Beloit Corp. | | | 25,215 | | | | 1,858,850 | |
| | | | | | | | |
| | | | | | | 8,580,807 | |
| | | | | | | | |
|
Electronic Equipment, Instruments & Components—2.0% | |
Arrow Electronics, Inc. (a) | | | 56,364 | | | | 3,057,747 | |
Avnet, Inc. | | | 76,970 | | | | 3,395,147 | |
Ingram Micro, Inc. - Class A (a) | | | 86,242 | | | | 2,023,237 | |
Itron, Inc. (a) (b) | | | 21,903 | | | | 907,441 | |
National Instruments Corp. | | | 54,619 | | | | 1,748,901 | |
Tech Data Corp. (a) | | | 21,127 | | | | 1,090,153 | |
Trimble Navigation, Ltd. (a) | | | 144,259 | | | | 5,005,787 | |
Vishay Intertechnology, Inc. (a) (b) | | | 75,805 | | | | 1,005,174 | |
| | | | | | | | |
| | | | | | | 18,233,587 | |
| | | | | | | | |
|
Energy Equipment & Services—2.7% | |
Atwood Oceanics, Inc. (a) | | | 32,258 | | | | 1,722,255 | |
CARBO Ceramics, Inc. (b) | | | 11,104 | | | | 1,293,949 | |
Dresser-Rand Group, Inc. (a) | | | 42,683 | | | | 2,545,187 | |
Dril-Quip, Inc. (a) | | | 22,768 | | | | 2,502,886 | |
Helix Energy Solutions Group, Inc. (a) | | | 55,050 | | | | 1,276,059 | |
Oceaneering International, Inc. | | | 60,535 | | | | 4,775,001 | |
Oil States International, Inc. (a) | | | 30,858 | | | | 3,138,876 | |
Patterson-UTI Energy, Inc. | | | 80,694 | | | | 2,043,172 | |
Superior Energy Services, Inc. (a) | | | 89,228 | | | | 2,374,357 | |
Tidewater, Inc. | | | 27,742 | | | | 1,644,269 | |
Unit Corp. (a) | | | 24,452 | | | | 1,262,212 | |
| | | | | | | | |
| | | | | | | 24,578,223 | |
| | | | | | | | |
|
Food & Staples Retailing—0.5% | |
Harris Teeter Supermarkets, Inc. | | | 27,669 | | | | 1,365,465 | |
SUPERVALU, Inc. (a) (b) | | | 110,332 | | | | 804,320 | |
United Natural Foods, Inc. (a) | | | 27,679 | | | | 2,086,720 | |
| | | | | | | | |
| | | | | | | 4,256,505 | |
| | | | | | | | |
|
Food Products—2.3% | |
Dean Foods Co. (a) | | | 52,818 | | | | 907,941 | |
Flowers Foods, Inc. | | | 98,001 | | | | 2,104,082 | |
Green Mountain Coffee Roasters,
Inc. (a) (b) | | | 73,373 | | | | 5,545,531 | |
Hain Celestial Group, Inc. (The) (a) | | | 26,737 | | | | 2,427,185 | |
Hillshire Brands Co. | | | 68,824 | | | | 2,301,475 | |
Ingredion, Inc. | | | 42,901 | | | | 2,937,002 | |
Lancaster Colony Corp. (b) | | | 10,838 | | | | 955,370 | |
Post Holdings, Inc. (a) | | | 18,289 | | | | 901,099 | |
Tootsie Roll Industries, Inc. (b) | | | 11,329 | | | | 368,646 | |
WhiteWave Foods Co. - Class A (a) | | | 97,030 | | | | 2,225,868 | |
| | | | | | | | |
| | | | | | | 20,674,199 | |
| | | | | | | | |
|
Gas Utilities—1.3% | |
Atmos Energy Corp. | | | 50,864 | | | | 2,310,243 | |
National Fuel Gas Co. (b) | | | 46,825 | | | | 3,343,305 | |
Questar Corp. | | | 97,949 | | | | 2,251,847 | |
UGI Corp. | | | 63,836 | | | | 2,646,641 | |
See accompanying notes to financial statements.
MSF-5
Metropolitan Series Fund
MetLife Mid Cap Stock Index Portfolio
Schedule of Investments as of December 31, 2013
Common Stocks—(Continued)
| | | | | | | | |
| Security Description | | Shares | | | Value | |
|
Gas Utilities—(Continued) | |
WGL Holdings, Inc. | | | 28,948 | | | $ | 1,159,657 | |
| | | | | | | | |
| | | | | | | 11,711,693 | |
| | | | | | | | |
|
Health Care Equipment & Supplies—2.3% | |
Cooper Cos., Inc. (The) | | | 27,386 | | | | 3,391,482 | |
Hill-Rom Holdings, Inc. | | | 32,824 | | | | 1,356,944 | |
Hologic, Inc. (a) (b) | | | 152,812 | | | | 3,415,348 | |
IDEXX Laboratories, Inc. (a) (b) | | | 29,034 | | | | 3,088,347 | |
Masimo Corp. (a) (b) | | | 28,782 | | | | 841,298 | |
ResMed, Inc. (b) | | | 79,493 | | | | 3,742,531 | |
STERIS Corp. | | | 32,939 | | | | 1,582,719 | |
Teleflex, Inc. (b) | | | 23,021 | | | | 2,160,751 | |
Thoratec Corp. (a) | | | 31,874 | | | | 1,166,588 | |
| | | | | | | | |
| | | | | | | 20,746,008 | |
| | | | | | | | |
|
Health Care Providers & Services—3.0% | |
Community Health Systems, Inc. (a) | | | 53,136 | | | | 2,086,651 | |
Health Management Associates,
Inc. - Class A (a) | | | 147,982 | | | | 1,938,564 | |
Health Net, Inc. (a) | | | 44,484 | | | | 1,319,840 | |
Henry Schein, Inc. (a) (b) (c) | | | 48,035 | | | | 5,488,479 | |
LifePoint Hospitals, Inc. (a) | | | 26,305 | | | | 1,389,956 | |
MEDNAX, Inc. (a) | | | 56,278 | | | | 3,004,120 | |
Omnicare, Inc. | | | 57,616 | | | | 3,477,702 | |
Owens & Minor, Inc. (b) | | | 35,315 | | | | 1,291,116 | |
Universal Health Services, Inc. - Class B | | | 50,033 | | | | 4,065,682 | |
VCA Antech, Inc. (a) | | | 49,654 | | | | 1,557,149 | |
WellCare Health Plans, Inc. (a) | | | 24,452 | | | | 1,721,910 | |
| | | | | | | | |
| | | | | | | 27,341,169 | |
| | | | | | | | |
|
Health Care Technology—0.3% | |
Allscripts Healthcare Solutions, Inc. (a) | | | 88,861 | | | | 1,373,791 | |
HMS Holdings Corp. (a) (b) | | | 49,388 | | | | 1,122,589 | |
| | | | | | | | |
| | | | | | | 2,496,380 | |
| | | | | | | | |
|
Hotels, Restaurants & Leisure—1.5% | |
Bally Technologies, Inc. (a) (b) | | | 21,804 | | | | 1,710,524 | |
Bob Evans Farms, Inc. | | | 15,261 | | | | 772,054 | |
Brinker International, Inc. (b) | | | 37,500 | | | | 1,737,750 | |
Cheesecake Factory, Inc. (The) | | | 26,921 | | | | 1,299,477 | |
Domino’s Pizza, Inc. | | | 31,174 | | | | 2,171,269 | |
International Speedway Corp. - Class A | | | 15,611 | | | | 554,034 | |
Life Time Fitness, Inc. (a) (b) | | | 21,947 | | | | 1,031,509 | |
Panera Bread Co. - Class A (a) (b) | | | 14,971 | | | | 2,645,226 | |
Scientific Games Corp. - Class A (a) | | | 27,171 | | | | 460,005 | |
Wendy’s Co. (The) (b) | | | 157,779 | | | | 1,375,833 | |
| | | | | | | | |
| | | | | | | 13,757,681 | |
| | | | | | | | |
|
Household Durables—1.7% | |
Jarden Corp. (a) | | | 66,927 | | | | 4,105,972 | |
KB Home (b) | | | 46,416 | | | | 848,485 | |
MDC Holdings, Inc. (b) | | | 21,875 | | | | 705,250 | |
NVR, Inc. (a) | | | 2,341 | | | | 2,401,889 | |
Tempur Sealy International, Inc. (a) (b) | | | 33,841 | | | | 1,826,060 | |
Toll Brothers, Inc. (a) | | | 88,922 | | | | 3,290,114 | |
|
Household Durables—(Continued) | |
Tupperware Brands Corp. (b) | | | 28,346 | | | | 2,679,547 | |
| | | | | | | | |
| | | | | | | 15,857,317 | |
| | | | | | | | |
|
Household Products—1.0% | |
Church & Dwight Co., Inc. | | | 77,684 | | | | 5,148,895 | |
Energizer Holdings, Inc. | | | 34,841 | | | | 3,771,190 | |
| | | | | | | | |
| | | | | | | 8,920,085 | |
| | | | | | | | |
|
Industrial Conglomerates—0.3% | |
Carlisle Cos., Inc. | | | 35,585 | | | | 2,825,449 | |
| | | | | | | | |
|
Insurance—4.7% | |
Alleghany Corp. (a) | | | 9,381 | | | | 3,752,025 | |
American Financial Group, Inc. | | | 39,999 | | | | 2,308,742 | |
Arthur J. Gallagher & Co. | | | 73,594 | | | | 3,453,766 | |
Aspen Insurance Holdings, Ltd. | | | 36,716 | | | | 1,516,738 | |
Brown & Brown, Inc. | | | 66,720 | | | | 2,094,341 | |
Everest Re Group, Ltd. | | | 26,801 | | | | 4,177,472 | |
Fidelity National Financial, Inc. - Class A | | | 139,716 | | | | 4,533,784 | |
First American Financial Corp. (b) | | | 59,139 | | | | 1,667,720 | |
Hanover Insurance Group, Inc. (The) | | | 24,539 | | | | 1,465,224 | |
HCC Insurance Holdings, Inc. | | | 56,061 | | | | 2,586,655 | |
Kemper Corp. | | | 28,661 | | | | 1,171,662 | |
Mercury General Corp. | | | 20,295 | | | | 1,008,864 | |
Old Republic International Corp. | | | 135,283 | | | | 2,336,337 | |
Primerica, Inc. | | | 30,676 | | | | 1,316,307 | |
Protective Life Corp. | | | 43,958 | | | | 2,226,912 | |
Reinsurance Group of America, Inc. | | | 39,492 | | | | 3,057,076 | |
StanCorp Financial Group, Inc. | | | 24,614 | | | | 1,630,678 | |
W.R. Berkley Corp. | | | 61,206 | | | | 2,655,728 | |
| | | | | | | | |
| | | | | | | 42,960,031 | |
| | | | | | | | |
|
Internet & Catalog Retail—0.1% | |
HSN, Inc. | | | 18,639 | | | | 1,161,210 | |
| | | | | | | | |
|
Internet Software & Services—1.1% | |
AOL, Inc. (a) | | | 43,904 | | | | 2,046,804 | |
Equinix, Inc. (a) (b) | | | 27,850 | | | | 4,941,983 | |
Rackspace Hosting, Inc. (a) (b) | | | 64,144 | | | | 2,509,955 | |
ValueClick, Inc. (a) (b) | | | 35,108 | | | | 820,474 | |
| | | | | | | | |
| | | | | | | 10,319,216 | |
| | | | | | | | |
|
IT Services—3.1% | |
Acxiom Corp. (a) | | | 42,027 | | | | 1,554,158 | |
Broadridge Financial Solutions, Inc. | | | 66,681 | | | | 2,635,233 | |
Convergys Corp. | | | 56,908 | | | | 1,197,913 | |
CoreLogic, Inc. (a) | | | 52,435 | | | | 1,863,016 | |
DST Systems, Inc. | | | 16,516 | | | | 1,498,662 | |
Gartner, Inc. (a) | | | 51,573 | | | | 3,664,262 | |
Global Payments, Inc. | | | 40,781 | | | | 2,650,357 | |
Jack Henry & Associates, Inc. | | | 47,883 | | | | 2,835,152 | |
Leidos Holdings, Inc. (b) | | | 40,747 | | | | 1,894,328 | |
Lender Processing Services, Inc. | | | 47,791 | | | | 1,786,428 | |
ManTech International Corp. - Class A (b) | | | 13,309 | | | | 398,338 | |
NeuStar, Inc. - Class A (a) | | | 35,035 | | | | 1,746,845 | |
See accompanying notes to financial statements.
MSF-6
Metropolitan Series Fund
MetLife Mid Cap Stock Index Portfolio
Schedule of Investments as of December 31, 2013
Common Stocks—(Continued)
| | | | | | | | |
| Security Description | | Shares | | | Value | |
|
IT Services—(Continued) | |
Science Applications International
Corp. (b) | | | 23,311 | | | $ | 770,895 | |
VeriFone Systems, Inc. (a) | | | 61,116 | | | | 1,639,131 | |
WEX, Inc. (a) | | | 21,751 | | | | 2,154,002 | |
| | | | | | | | |
| | | | | | | 28,288,720 | |
| | | | | | | | |
|
Leisure Equipment & Products—0.8% | |
Brunswick Corp. | | | 50,884 | | | | 2,343,717 | |
Polaris Industries, Inc. (b) | | | 36,042 | | | | 5,249,157 | |
| | | | | | | | |
| | | | | | | 7,592,874 | |
| | | | | | | | |
|
Life Sciences Tools & Services—1.3% | |
Bio-Rad Laboratories, Inc. - Class A (a) | | | 11,238 | | | | 1,389,129 | |
Charles River Laboratories International, Inc. (a) | | | 26,921 | | | | 1,427,890 | |
Covance, Inc. (a) (c) | | | 31,426 | | | | 2,767,374 | |
Mettler-Toledo International, Inc. (a) | | | 16,609 | | | | 4,029,177 | |
Techne Corp. | | | 18,564 | | | | 1,757,454 | |
| | | | | | | | |
| | | | | | | 11,371,024 | |
| | | | | | | | |
|
Machinery—5.3% | |
AGCO Corp. | | | 50,658 | | | | 2,998,447 | |
CLARCOR, Inc. | | | 28,018 | | | | 1,802,958 | |
Crane Co. | | | 27,329 | | | | 1,837,875 | |
Donaldson Co., Inc. | | | 75,270 | | | | 3,271,234 | |
Graco, Inc. | | | 34,259 | | | | 2,676,313 | |
Harsco Corp. | | | 45,132 | | | | 1,265,050 | |
IDEX Corp. | | | 45,385 | | | | 3,351,682 | |
ITT Corp. | | | 50,745 | | | | 2,203,348 | |
Kennametal, Inc. | | | 43,875 | | | | 2,284,571 | |
Lincoln Electric Holdings, Inc. | | | 45,663 | | | | 3,257,599 | |
Nordson Corp. | | | 33,777 | | | | 2,509,631 | |
Oshkosh Corp. | | | 48,336 | | | | 2,435,168 | |
SPX Corp. | | | 25,375 | | | | 2,527,604 | |
Terex Corp. | | | 62,327 | | | | 2,617,111 | |
Timken Co. | | | 44,477 | | | | 2,449,348 | |
Trinity Industries, Inc. | | | 43,691 | | | | 2,382,033 | |
Valmont Industries, Inc. (b) | | | 14,987 | | | | 2,234,862 | |
Wabtec Corp. | | | 53,882 | | | | 4,001,816 | |
Woodward, Inc. | | | 33,905 | | | | 1,546,407 | |
| | | | | | | | |
| | | | | | | 47,653,057 | |
| | | | | | | | |
|
Marine—0.4% | |
Kirby Corp. (a) (b) | | | 31,761 | | | | 3,152,279 | |
Matson, Inc. | | | 23,967 | | | | 625,779 | |
| | | | | | | | |
| | | | | | | 3,778,058 | |
| | | | | | | | |
|
Media—1.3% | |
AMC Networks, Inc. - Class A (a) | | | 33,161 | | | | 2,258,596 | |
Cinemark Holdings,
Inc. | | | 58,074 | | | | 1,935,606 | |
DreamWorks Animation SKG,
Inc. - Class A (a) (b) | | | 39,849 | | | | 1,414,639 | |
John Wiley & Sons, Inc. - Class A (b) | | | 25,918 | | | | 1,430,674 | |
Lamar Advertising Co. - Class A (a) | | | 36,535 | | | | 1,908,954 | |
Meredith Corp. | | | 20,759 | | | | 1,075,316 | |
New York Times Co. (The) - Class A (b) | | | 70,383 | | | | 1,116,978 | |
|
Media—(Continued) | |
Valassis Communications, Inc. (b) | | | 21,534 | | | | 737,540 | |
| | | | | | | | |
| | | | | | | 11,878,303 | |
| | | | | | | | |
|
Metals & Mining—1.5% | |
Carpenter Technology Corp. | | | 29,637 | | | | 1,843,422 | |
Commercial Metals Co. | | | 65,473 | | | | 1,331,066 | |
Compass Minerals International, Inc. | | | 18,730 | | | | 1,499,337 | |
Reliance Steel & Aluminum Co. | | | 43,273 | | | | 3,281,824 | |
Royal Gold, Inc. (b) | | | 36,429 | | | | 1,678,284 | |
Steel Dynamics, Inc. | | | 124,197 | | | | 2,426,809 | |
Worthington Industries, Inc. | | | 29,638 | | | | 1,247,167 | |
| | | | | | | | |
| | | | | | | 13,307,909 | |
| | | | | | | | |
|
Multi-Utilities—1.0% | |
Alliant Energy Corp. | | | 62,072 | | | | 3,202,915 | |
Black Hills Corp. | | | 24,889 | | | | 1,306,921 | |
MDU Resources Group, Inc. | | | 105,648 | | | | 3,227,547 | |
Vectren Corp. | | | 46,080 | | | | 1,635,840 | |
| | | | | | | | |
| | | | | | | 9,373,223 | |
| | | | | | | | |
|
Multiline Retail—0.3% | |
Big Lots, Inc. (a) | | | 32,612 | | | | 1,053,041 | |
J.C. Penney Co., Inc. (a) (b) | | | 170,433 | | | | 1,559,462 | |
| | | | | | | | |
| | | | | | | 2,612,503 | |
| | | | | | | | |
|
Office Electronics—0.2% | |
Zebra Technologies Corp. - Class A (a) | | | 28,124 | | | | 1,520,946 | |
| | | | | | | | |
|
Oil, Gas & Consumable Fuels—2.7% | |
Alpha Natural Resources, Inc. (a) (b) | | | 123,622 | | | | 882,661 | |
Bill Barrett Corp. (a) (b) | | | 27,407 | | | | 733,959 | |
Cimarex Energy Co. | | | 48,590 | | | | 5,097,577 | |
Energen Corp. | | | 40,667 | | | | 2,877,190 | |
Gulfport Energy Corp. (a) | | | 47,044 | | | | 2,970,829 | |
HollyFrontier Corp. | | | 111,176 | | | | 5,524,335 | |
Rosetta Resources, Inc. (a) | | | 34,279 | | | | 1,646,763 | |
SM Energy Co. | | | 37,479 | | | | 3,114,880 | |
World Fuel Services Corp. (b) | | | 40,429 | | | | 1,744,916 | |
| | | | | | | | |
| | | | | | | 24,593,110 | |
| | | | | | | | |
|
Paper & Forest Products—0.3% | |
Domtar Corp. | | | 18,127 | | | | 1,710,101 | |
Louisiana-Pacific Corp. (a) | | | 78,955 | | | | 1,461,457 | |
| | | | | | | | |
| | | | | | | 3,171,558 | |
| | | | | | | | |
|
Pharmaceuticals—1.0% | |
Endo Health Solutions, Inc. (a) | | | 64,251 | | | | 4,334,372 | |
Mallinckrodt plc (a) (b) | | | 32,281 | | | | 1,687,005 | |
Salix Pharmaceuticals, Ltd. (a) | | | 35,191 | | | | 3,165,079 | |
| | | | | | | | |
| | | | | | | 9,186,456 | |
| | | | | | | | |
|
Professional Services—1.2% | |
Corporate Executive Board Co. (The) | | | 18,805 | | | | 1,456,071 | |
FTI Consulting, Inc. (a) | | | 22,501 | | | | 925,691 | |
Manpowergroup, Inc. | | | 44,196 | | | | 3,794,669 | |
See accompanying notes to financial statements.
MSF-7
Metropolitan Series Fund
MetLife Mid Cap Stock Index Portfolio
Schedule of Investments as of December 31, 2013
Common Stocks—(Continued)
| | | | | | | | |
| Security Description | | Shares | | | Value | |
|
Professional Services—(Continued) | |
Towers Watson & Co. - Class A | | | 36,116 | | | $ | 4,608,763 | |
| | | | | | | | |
| | | | | | | 10,785,194 | |
| | | | | | | | |
|
Real Estate Investment Trusts—7.9% | |
Alexandria Real Estate Equities, Inc. | | | 40,075 | | | | 2,549,571 | |
American Campus Communities, Inc. | | | 58,625 | | | | 1,888,311 | |
BioMed Realty Trust, Inc. | | | 107,484 | | | | 1,947,610 | |
BRE Properties, Inc. | | | 43,186 | | | | 2,362,706 | |
Camden Property Trust | | | 47,729 | | | | 2,714,825 | |
Corporate Office Properties Trust | | | 48,888 | | | | 1,158,157 | |
Corrections Corp. of America | | | 64,815 | | | | 2,078,617 | |
Duke Realty Corp. | | | 182,276 | | | | 2,741,431 | |
Equity One, Inc. | | | 35,404 | | | | 794,466 | |
Essex Property Trust, Inc. | | | 21,282 | | | | 3,054,180 | |
Extra Space Storage, Inc. | | | 61,524 | | | | 2,592,006 | |
Federal Realty Investment Trust | | | 36,390 | | | | 3,690,310 | |
Highwoods Properties, Inc. | | | 50,304 | | | | 1,819,496 | |
Home Properties, Inc. | | | 31,829 | | | | 1,706,671 | |
Hospitality Properties Trust | | | 82,990 | | | | 2,243,220 | |
Kilroy Realty Corp. (b) | | | 45,915 | | | | 2,304,015 | |
Liberty Property Trust | | | 82,015 | | | | 2,777,848 | |
Mack-Cali Realty Corp. | | | 49,247 | | | | 1,057,825 | |
Mid-America Apartment Communities, Inc. | | | 41,836 | | | | 2,541,119 | |
National Retail Properties, Inc. (b) | | | 68,178 | | | | 2,067,839 | |
Omega Healthcare Investors, Inc. | | | 68,550 | | | | 2,042,790 | |
Potlatch Corp. | | | 22,676 | | | | 946,496 | |
Rayonier, Inc. | | | 70,639 | | | | 2,973,902 | |
Realty Income Corp. (b) | | | 115,323 | | | | 4,305,007 | |
Regency Centers Corp. | | | 51,656 | | | | 2,391,673 | |
Senior Housing Properties Trust | | | 105,278 | | | | 2,340,330 | |
SL Green Realty Corp. | | | 53,073 | | | | 4,902,884 | �� |
Taubman Centers, Inc. | | | 35,558 | | | | 2,272,867 | |
UDR, Inc. | | | 140,285 | | | | 3,275,655 | |
Weingarten Realty Investors (b) | | | 62,766 | | | | 1,721,044 | |
| | | | | | | | |
| | | | | | | 71,262,871 | |
| | | | | | | | |
|
Real Estate Management & Development—0.4% | |
Alexander & Baldwin, Inc. | | | 23,881 | | | | 996,554 | |
Jones Lang LaSalle, Inc. | | | 24,862 | | | | 2,545,620 | |
| | | | | | | | |
| | | | | | | 3,542,174 | |
| | | | | | | | |
|
Road & Rail—1.3% | |
Con-way, Inc. | | | 31,830 | | | | 1,263,969 | |
Genesee & Wyoming, Inc. - Class A (a) | | | 28,428 | | | | 2,730,509 | |
J.B. Hunt Transport Services, Inc. | | | 51,433 | | | | 3,975,771 | |
Landstar System, Inc. | | | 25,578 | | | | 1,469,456 | |
Old Dominion Freight Line, Inc. (a) | | | 39,049 | | | | 2,070,378 | |
Werner Enterprises, Inc. (b) | | | 25,561 | | | | 632,124 | |
| | | | | | | | |
| | | | | | | 12,142,207 | |
| | | | | | | | |
|
Semiconductors & Semiconductor Equipment—2.3% | |
Advanced Micro Devices, Inc. (a) (b) | | | 344,161 | | | | 1,331,903 | |
Atmel Corp. (a) (c) | | | 238,268 | | | | 1,865,638 | |
Cree, Inc. (a) (b) | | | 67,532 | | | | 4,225,477 | |
Cypress Semiconductor Corp. (a) (b) | | | 77,776 | | | | 816,648 | |
|
Semiconductors & Semiconductor Equipment—(Continued) | |
Fairchild Semiconductor International, Inc. (a) | | | 71,059 | | | | 948,638 | |
Integrated Device Technology, Inc. (a) | | | 77,150 | | | | 786,159 | |
International Rectifier Corp. (a) | | | 39,781 | | | | 1,037,091 | |
Intersil Corp. - Class A | | | 71,437 | | | | 819,382 | |
RF Micro Devices, Inc. (a) | | | 157,969 | | | | 815,120 | |
Semtech Corp. (a) | | | 38,403 | | | | 970,828 | |
Silicon Laboratories, Inc. (a) | | | 22,196 | | | | 961,309 | |
Skyworks Solutions, Inc. (a) | | | 105,037 | | | | 2,999,857 | |
SunEdison, Inc. (a) (b) | | | 137,229 | | | | 1,790,838 | |
Teradyne, Inc. (a) (b) | | | 107,204 | | | | 1,888,934 | |
| | | | | | | | |
| | | | | | | 21,257,822 | |
| | | | | | | | |
|
Software—4.2% | |
ACI Worldwide, Inc. (a) | | | 21,567 | | | | 1,401,855 | |
Advent Software, Inc. (b) | | | 22,556 | | | | 789,234 | |
ANSYS, Inc. (a) | | | 51,842 | | | | 4,520,622 | |
Cadence Design Systems, Inc. (a) | | | 160,989 | | | | 2,257,066 | |
CommVault Systems, Inc. (a) | | | 24,867 | | | | 1,862,041 | |
Compuware Corp. | | | 121,177 | | | | 1,358,394 | |
Concur Technologies, Inc. (a) (b) | | | 26,343 | | | | 2,718,071 | |
FactSet Research Systems, Inc. (b) | | | 22,429 | | | | 2,435,341 | |
Fair Isaac Corp. | | | 19,340 | | | | 1,215,326 | |
Informatica Corp. (a) | | | 60,712 | | | | 2,519,548 | |
Mentor Graphics Corp. | | | 54,504 | | | | 1,311,911 | |
MICROS Systems, Inc. (a) (b) | | | 42,120 | | | | 2,416,424 | |
PTC, Inc. (a) | | | 66,856 | | | | 2,366,034 | |
Rovi Corp. (a) | | | 57,174 | | | | 1,125,756 | |
SolarWinds, Inc. (a) | | | 36,580 | | | | 1,383,821 | |
Solera Holdings, Inc. | | | 38,526 | | | | 2,726,100 | |
Synopsys, Inc. (a) | | | 86,389 | | | | 3,504,802 | |
TIBCO Software, Inc. (a) | | | 85,751 | | | | 1,927,683 | |
| | | | | | | | |
| | | | | | | 37,840,029 | |
| | | | | | | | |
|
Specialty Retail—4.4% | |
Aaron’s, Inc. | | | 42,672 | | | | 1,254,557 | |
Abercrombie & Fitch Co. - Class A | | | 42,741 | | | | 1,406,606 | |
Advance Auto Parts, Inc. | | | 40,749 | | | | 4,510,099 | |
American Eagle Outfitters, Inc. (b) | | | 94,920 | | | | 1,366,848 | |
ANN, Inc. (a) | | | 25,692 | | | | 939,300 | |
Ascena Retail Group, Inc. (a) | | | 72,034 | | | | 1,524,239 | |
Cabela’s, Inc. (a) (b) | | | 26,069 | | | | 1,737,760 | |
Chico’s FAS, Inc. | | | 88,843 | | | | 1,673,802 | |
CST Brands, Inc. (b) | | | 42,297 | | | | 1,553,146 | |
Dick’s Sporting Goods, Inc. | | | 57,005 | | | | 3,311,990 | |
Foot Locker, Inc. | | | 83,081 | | | | 3,442,877 | |
Guess?, Inc. (b) | | | 33,243 | | | | 1,032,860 | |
Murphy USA, Inc. (a) | | | 24,844 | | | | 1,032,517 | |
Office Depot, Inc. (a) | | | 267,031 | | | | 1,412,594 | |
Rent-A-Center, Inc. | | | 29,945 | | | | 998,366 | |
Signet Jewelers, Ltd. | | | 44,880 | | | | 3,532,056 | |
Tractor Supply Co. | | | 78,098 | | | | 6,058,843 | |
Williams-Sonoma, Inc. | | | 49,797 | | | | 2,902,169 | |
| | | | | | | | |
| | | | | | | 39,690,629 | |
| | | | | | | | |
See accompanying notes to financial statements.
MSF-8
Metropolitan Series Fund
MetLife Mid Cap Stock Index Portfolio
Schedule of Investments as of December 31, 2013
Common Stocks—(Continued)
| | | | | | | | |
| Security Description | | Shares/
Principal
Amount* | | | Value | |
|
Textiles, Apparel & Luxury Goods—1.3% | |
Carter’s, Inc. | | | 30,507 | | | $ | 2,190,097 | |
Deckers Outdoor Corp. (a) (b) | | | 19,323 | | | | 1,632,021 | |
Hanesbrands, Inc. | | | 55,451 | | | | 3,896,542 | |
Under Armour, Inc. -
Class A (a) (b) | | | 44,917 | | | | 3,921,254 | |
| | | | | | | | |
| | | | | | | 11,639,914 | |
| | | | | | | | |
|
Thrifts & Mortgage Finance—0.7% | |
Astoria Financial Corp. | | | 47,016 | | | | 650,231 | |
New York Community Bancorp, Inc. (b) | | | 246,661 | | | | 4,156,238 | |
Washington Federal, Inc. | | | 56,947 | | | | 1,326,296 | |
| | | | | | | | |
| | | | | | | 6,132,765 | |
| | | | | | | | |
|
Tobacco—0.1% | |
Universal Corp. (b) | | | 12,989 | | | | 709,199 | |
| | | | | | | | |
|
Trading Companies & Distributors—1.0% | |
GATX Corp. | | | 25,848 | | | | 1,348,490 | |
MSC Industrial Direct Co.,
Inc. - Class A | | | 26,964 | | | | 2,180,579 | |
United Rentals, Inc. (a) (b) | | | 52,164 | | | | 4,066,184 | |
Watsco, Inc. | | | 15,153 | | | | 1,455,597 | |
| | | | | | | | |
| | | | | | | 9,050,850 | |
| | | | | | | | |
|
Water Utilities—0.3% | |
Aqua America, Inc. (b) | | | 98,867 | | | | 2,332,273 | |
| | | | | | | | |
|
Wireless Telecommunication Services—0.2% | |
Telephone & Data Systems, Inc. | | | 55,236 | | | | 1,423,984 | |
| | | | | | | | |
Total Common Stocks
(Cost $575,785,037) | | | | | | | 858,465,359 | |
| | | | | | | | |
|
| Investment Company Security—2.7% | |
SPDR S&P MidCap 400 ETF Trust (Cost $22,527,389) | | | 101,500 | | | | 24,786,300 | |
| | | | | | | | |
|
| Short-Term Investments—18.1% | |
|
Discount Notes—1.4% | |
Federal Home Loan Bank | | | | | | | | |
0.010%, 01/03/14 (d) | | | 525,000 | | | | 525,000 | |
0.030%, 02/26/14 (d) | | | 475,000 | | | | 474,978 | |
0.051%, 02/26/14 (d) | | | 500,000 | | | | 499,961 | |
0.061%, 01/22/14 (d) | | | 600,000 | | | | 599,979 | |
0.076%, 02/26/14 (d) | | | 200,000 | | | | 199,977 | |
0.081%, 03/12/14 (d) | | | 325,000 | | | | 324,949 | |
0.091%, 03/12/14 (d) | | | 1,925,000 | | | | 1,924,663 | |
0.096%, 03/12/14 (d) | | | 150,000 | | | | 149,972 | |
0.122%, 01/22/14 (d) | | | 500,000 | | | | 499,965 | |
0.132%, 01/22/14 (d) | | | 150,000 | | | | 149,989 | |
0.142%, 01/22/14 (d) | | | 425,000 | | | | 424,965 | |
Federal Home Loan Mortgage Corp. | | | | | | | | |
0.041%, 01/22/14 (d) | | | 1,100,000 | | | | 1,099,974 | |
0.051%, 01/15/14 (d) | | | 1,025,000 | | | | 1,024,980 | |
0.051%, 01/22/14 (d) | | | 2,350,000 | | | | 2,349,932 | |
0.061%, 01/22/14 (d) | | | 275,000 | | | | 274,990 | |
|
Discount Notes—(Continued) | |
0.066%, 02/24/14 (d) | | | 750,000 | | | $ | 749,927 | |
0.086%, 01/15/14 (d) | | | 125,000 | | | | 124,996 | |
0.091%, 01/15/14 (d) | | | 725,000 | | | | 724,975 | |
0.132%, 02/24/14 (d) | | | 375,000 | | | | 374,927 | |
| | | | | | | | |
| | | | | | | 12,499,099 | |
| | | | | | | | |
|
Mutual Fund—15.4% | |
State Street Navigator Securities Lending MET Portfolio (e) | | | 140,209,100 | | | | 140,209,100 | |
| | | | | | | | |
|
U.S. Treasury—1.3% | |
U.S. Treasury Bills | | | | | | | | |
0.046%, 05/15/14 (d) | | | 1,375,000 | | | | 1,374,770 | |
0.051%, 05/15/14 (d) | | | 175,000 | | | | 174,967 | |
0.063%, 05/15/14 (d) | | | 2,250,000 | | | | 2,249,481 | |
0.077%, 05/15/14 (d) | | | 150,000 | | | | 149,958 | |
0.077%, 05/15/14 (d) | | | 1,550,000 | | | | 1,549,561 | |
0.078%, 05/15/14 (d) | | | 325,000 | | | | 324,907 | |
0.084%, 05/15/14 (d) | | | 4,500,000 | | | | 4,498,618 | |
0.086%, 05/15/14 (d) | | | 1,175,000 | | | | 1,174,628 | |
| | | | | | | | |
| | | | | | | 11,496,890 | |
| | | | | | | | |
Total Short-Term Investments
(Cost $164,205,089) | | | | | | | 164,205,089 | |
| | | | | | | | |
Total Investments—115.5%
(Cost $762,517,515) (f) | | | | | | | 1,047,456,748 | |
Other assets and liabilities (net)—(15.5)% | | | | | | | (140,675,718 | ) |
| | | | | | | | |
| Net Assets—100.0% | | | | | | $ | 906,781,030 | |
| | | | | | | | |
| * | Principal amount stated in U.S. dollars unless otherwise noted. |
| (a) | Non-income producing security. |
| (b) | All or a portion of the security was held on loan. As of December 31, 2013, the market value of securities loaned was $138,225,637 and the collateral received consisted of cash in the amount of $140,209,100 and non-cash collateral with a value of $757,895. The cash collateral is invested in a money market fund managed by an affiliate of the custodian. The non-cash collateral received consists primarily of government securities and bank letters of credit, and is held for the benefit of the Portfolio at the Portfolio’s custodian. The Portfolio cannot repledge or resell this collateral. As such, this collateral is excluded from the Statement of Assets and Liabilities. |
| (c) | All or a portion of the security was pledged as collateral against open futures contracts. As of December 31, 2013, the market value of securities pledged was $4,872,340. |
| (d) | The rate shown represents the discount rate at the time of purchase by the Portfolio. |
| (e) | Represents investment of cash collateral received from securities lending transactions. |
| (f) | As of December 31, 2013, the aggregate cost of investments for federal income tax purposes was $767,457,368. The aggregate unrealized appreciation and depreciation of investments were $302,115,747 and $(22,116,367), respectively, resulting in net unrealized appreciation of $279,999,380 for federal income tax purposes. |
| (ETF)— | Exchange-Traded Fund |
See accompanying notes to financial statements.
MSF-9
Metropolitan Series Fund
MetLife Mid Cap Stock Index Portfolio
Schedule of Investments as of December 31, 2013
Futures Contracts
| | | | | | | | | | | | | | | | | | | | |
Futures Contracts—Long | | Expiration
Date | | | Number of
Contracts | | | Notional
Amount | | | Unrealized
Appreciation | |
S&P Midcap 400 E-Mini Index Futures | | | 03/21/14 | | | | 170 | | | | USD | | | | 22,340,786 | | | $ | 429,014 | |
| | | | | | | | | | | | | | | | | | | | |
| (USD)— | United States Dollar |
Fair Value Hierarchy
Accounting principles generally accepted in the United States of America (“GAAP”) define fair market value as the price that the Portfolio would receive to sell an asset or pay to transfer a liability in an orderly transaction between market participants at the measurement date. It establishes a fair value hierarchy that prioritizes inputs to valuation methods and requires disclosure of the fair value hierarchy that segregates fair value measurements into three levels. Levels 1, 2 and 3 of the fair value hierarchy are defined as follows:
Level 1 - unadjusted quoted prices in active markets for identical investments
Level 2 - other significant observable inputs (including, but not limited to, unadjusted quoted prices for similar investments in markets that are either active or inactive; inputs other than quoted prices that are observable such as interest rates, yield curves, volatilities, prepayment speeds, loss severities, credit risks, default rates, etc.)
Level 3 - significant unobservable inputs based on the best information available in the circumstances, to the extent observable inputs are unavailable (including the Portfolio’s own assumptions in determining the fair value of investments)
The inputs or methodologies used for valuing investments are not necessarily an indication of the risk associated with investing in them. Changes to the inputs or methodologies used may result in transfers between levels, which will be recognized as of the beginning of the reporting period. Information on transfers between Level 1 and Level 2, if any, will be disclosed following the fair value hierarchy table below. A reconciliation of Level 3 securities, if any, will also be disclosed following the fair value hierarchy table. For more information about the Portfolio’s policy regarding the valuation of investments, please refer to the Notes to Financial Statements.
The following table summarizes the fair value hierarchy of the Portfolio’s investments as of December 31, 2013:
| | | | | | | | | | | | | | | | |
| Description | | Level 1 | | | Level 2 | | | Level 3 | | | Total | |
Total Common Stocks* | | $ | 858,465,359 | | | $ | — | | | $ | — | | | $ | 858,465,359 | |
Total Investment Company Security | | | 24,786,300 | | | | — | | | | — | | | | 24,786,300 | |
| Short-Term Investments | | | | | | | | | | | | | | | | |
Discount Notes | | | — | | | | 12,499,099 | | | | — | | | | 12,499,099 | |
Mutual Fund | | | 140,209,100 | | | | — | | | | — | | | | 140,209,100 | |
U.S. Treasury | | | — | | | | 11,496,890 | | | | — | | | | 11,496,890 | |
Total Short-Term Investments | | | 140,209,100 | | | | 23,995,989 | | | | — | | | | 164,205,089 | |
Total Investments | | $ | 1,023,460,759 | | | $ | 23,995,989 | | | $ | — | | | $ | 1,047,456,748 | |
| | | | | | | | | | | | | | | | | |
Collateral for Securities Loaned (Liability) | | $ | — | | | $ | (140,209,100 | ) | | $ | — | | | $ | (140,209,100 | ) |
| Futures Contracts | | | | | | | | | | | | | | | | |
Futures Contracts (Unrealized Appreciation) | | $ | 429,014 | | | $ | — | | | $ | — | | | $ | 429,014 | |
| * | See Schedule of Investments for additional detailed categorizations. |
See accompanying notes to financial statements.
MSF-10
Metropolitan Series Fund
MetLife Mid Cap Stock Index Portfolio
Statement of Assets and Liabilities
December 31, 2013
| | | | |
Assets | | | | |
Investments at value (a)(b) | | $ | 1,047,456,748 | |
Cash | | | 6,878 | |
Receivable for: | | | | |
Investments sold | | | 971,863 | |
Fund shares sold | | | 212,458 | |
Dividends | | | 870,268 | |
Variation margin on futures contracts | | | 59,500 | |
Prepaid expenses | | | 412 | |
| | | | |
Total Assets | | | 1,049,578,127 | |
Liabilities | | | | |
Collateral for securities loaned | | | 140,209,100 | |
Payables for: | | | | |
Investments purchased | | | 1,462,860 | |
Fund shares redeemed | | | 676,257 | |
Accrued Expenses: | | | | |
Management fees | | | 186,413 | |
Distribution and service fees | | | 111,940 | |
Deferred trustees’ fees | | | 48,554 | |
Other expenses | | | 101,973 | |
| | | | |
Total Liabilities | | | 142,797,097 | |
| | | | |
Net Assets | | $ | 906,781,030 | |
| | | | |
Net assets consist of: | | | | |
Paid in surplus | | $ | 575,701,507 | |
Undistributed net investment income | | | 8,012,162 | |
Accumulated net realized gain | | | 37,699,114 | |
Unrealized appreciation on investments and futures contracts | | | 285,368,247 | |
| | | | |
Net Assets | | $ | 906,781,030 | |
| | | | |
Net Assets | | | | |
Class A | | $ | 370,049,735 | |
Class B | | | 388,420,994 | |
Class E | | | 44,974,310 | |
Class G | | | 103,335,991 | |
Capital Shares Outstanding* | | | | |
Class A | | | 20,056,659 | |
Class B | | | 21,288,213 | |
Class E | | | 2,453,258 | |
Class G | | | 5,689,730 | |
Net Asset Value, Offering Price and Redemption Price Per Share | | | | |
Class A | | $ | 18.45 | |
Class B | | | 18.25 | |
Class E | | | 18.33 | |
Class G | | | 18.16 | |
| * | The Portfolio is authorized to issue an unlimited number of shares. |
| (a) | Identified cost of investments was $762,517,515. |
| (b) | Includes securities loaned at value of $138,225,637. |
Statement of Operations
Year Ended December 31, 2013
| | | | |
Investment Income | | | | |
Dividends | | $ | 10,598,996 | |
Interest | | | 18,103 | |
Securities lending income | | | 514,457 | |
| | | | |
Total investment income | | | 11,131,556 | |
Expenses | | | | |
Management fees | | | 2,016,734 | |
Administration fees | | | 14,945 | |
Custodian and accounting fees | | | 82,696 | |
Distribution and service fees—Class B | | | 880,100 | |
Distribution and service fees—Class E | | | 63,046 | |
Distribution and service fees—Class G | | | 282,377 | |
Audit and tax services | | | 37,723 | |
Legal | | | 27,755 | |
Trustees’ fees and expenses | | | 35,359 | |
Shareholder reporting | | | 148,030 | |
Insurance | | | 1,556 | |
Miscellaneous | | | 32,567 | |
| | | | |
Total expenses | | | 3,622,888 | |
Less management fee waiver | | | (15,335 | ) |
| | | | |
Net expenses | | | 3,607,553 | |
| | | | |
Net Investment Income | | | 7,524,003 | |
| | | | |
Net Realized and Unrealized Gain | | | | |
| Net realized gain on: | | | | |
Investments | | | 39,169,764 | |
Futures contracts | | | 5,358,470 | |
| | | | |
Net realized gain | | | 44,528,234 | |
| | | | |
| Net change in unrealized appreciation on: | | | | |
Investments | | | 173,450,433 | |
Futures contracts | | | 274,806 | |
| | | | |
Net change in unrealized appreciation | | | 173,725,239 | |
| | | | |
Net realized and unrealized gain | | | 218,253,473 | |
| | | | |
Net Increase in Net Assets From Operations | | $ | 225,777,476 | |
| | | | |
See accompanying notes to financial statements.
MSF-11
Metropolitan Series Fund
MetLife Mid Cap Stock Index Portfolio
Statements of Changes in Net Assets
| | | | | | | | |
| | | Year Ended
December 31,
2013 | | | Year Ended
December 31,
2012 | |
Increase (Decrease) in Net Assets: | | | | | | | | |
From Operations | | | | | | | | |
Net investment income | | $ | 7,524,003 | | | $ | 8,201,616 | |
Net realized gain | | | 44,528,234 | | | | 24,550,841 | |
Net change in unrealized appreciation | | | 173,725,239 | | | | 71,970,894 | |
| | | | | | | | |
Increase in net assets from operations | | | 225,777,476 | | | | 104,723,351 | |
| | | | | | | | |
From Distributions to Shareholders | | | | | | | | |
Net investment income | | | | | | | | |
Class A | | | (3,571,780 | ) | | | (2,531,522 | ) |
Class B | | | (3,295,981 | ) | | | (2,261,039 | ) |
Class E | | | (433,931 | ) | | | (332,335 | ) |
Class G | | | (892,583 | ) | | | (507,803 | ) |
Net realized capital gains | | | | | | | | |
Class A | | | (8,753,637 | ) | | | (10,643,088 | ) |
Class B | | | (9,929,931 | ) | | | (12,498,522 | ) |
Class E | | | (1,200,289 | ) | | | (1,626,262 | ) |
Class G | | | (2,689,121 | ) | | | (2,972,143 | ) |
| | | | | | | | |
Total distributions | | | (30,767,253 | ) | | | (33,372,714 | ) |
| | | | | | | | |
Increase (decrease) in net assets from capital share transactions | | | 30,910,895 | | | | (2,401,699 | ) |
| | | | | | | | |
Total increase in net assets | | | 225,921,118 | | | | 68,948,938 | |
| | |
Net Assets | | | | | | | | |
Beginning of period | | | 680,859,912 | | | | 611,910,974 | |
| | | | | | | | |
End of period | | $ | 906,781,030 | | | $ | 680,859,912 | |
| | | | | | | | |
| | |
Undistributed Net Investment Income | | | | | | | | |
End of period | | $ | 8,012,162 | | | $ | 8,078,085 | |
| | | | | | | | |
Other Information:
Capital Shares
Transactions in capital shares were as follows:
| | | | | | | | | | | | | | | | |
| | | Year Ended
December 31, 2013 | | | Year Ended
December 31, 2012 | |
| | | Shares | | | Value | | | Shares | | | Value | |
Class A | | | | | | | | | | | | | | | | |
Sales | | | 4,834,598 | | | $ | 79,130,076 | | | | 1,931,578 | | | $ | 26,719,092 | |
Reinvestments | | | 818,964 | | | | 12,325,417 | | | | 963,761 | | | | 13,174,610 | |
Redemptions | | | (3,580,846 | ) | | | (58,551,359 | ) | | | (3,156,268 | ) | | | (43,673,085 | ) |
| | | | | | | | | | | | | | | | |
Net increase (decrease) | | | 2,072,716 | | | $ | 32,904,134 | | | | (260,929 | ) | | $ | (3,779,383 | ) |
| | | | | | | | | | | | | | | | |
Class B | | | | | | | | | | | | | | | | |
Sales | | | 1,892,315 | | | $ | 30,939,584 | | | | 1,745,590 | | | $ | 23,656,383 | |
Reinvestments | | | 887,050 | | | | 13,225,912 | | | | 1,089,266 | | | | 14,759,561 | |
Redemptions | | | (3,253,801 | ) | | | (52,967,918 | ) | | | (2,536,702 | ) | | | (35,040,000 | ) |
| | | | | | | | | | | | | | | | |
Net increase (decrease) | | | (474,436 | ) | | $ | (8,802,422 | ) | | | 298,154 | | | $ | 3,375,944 | |
| | | | | | | | | | | | | | | | |
Class E | | | | | | | | | | | | | | | | |
Sales | | | 189,870 | | | $ | 3,072,272 | | | | 82,330 | | | $ | 1,130,053 | |
Reinvestments | | | 109,166 | | | | 1,634,220 | | | | 144,015 | | | | 1,958,597 | |
Redemptions | | | (459,847 | ) | | | (7,545,262 | ) | | | (492,859 | ) | | | (6,785,386 | ) |
| | | | | | | | | | | | | | | | |
Net decrease | | | (160,811 | ) | | $ | (2,838,770 | ) | | | (266,514 | ) | | $ | (3,696,736 | ) |
| | | | | | | | | | | | | | | | |
Class G | | | | | | | | | | | | | | | | |
Sales | | | 2,144,831 | | | $ | 33,901,061 | | | | 1,248,776 | | | $ | 17,126,225 | |
Reinvestments | | | 241,192 | | | | 3,581,704 | | | | 257,774 | | | | 3,479,946 | |
Redemptions | | | (1,701,787 | ) | | | (27,834,812 | ) | | | (1,402,335 | ) | | | (18,907,695 | ) |
| | | | | | | | | | | | | | | | |
Net increase | | | 684,236 | | | $ | 9,647,953 | | | | 104,215 | | | $ | 1,698,476 | |
| | | | | | | | | | | | | | | | |
Increase (decrease) derived from capital shares transactions | | | | | | $ | 30,910,895 | | | | | | | $ | (2,401,699 | ) |
| | | | | | | | | | | | | | | | |
See accompanying notes to financial statements.
MSF-12
Metropolitan Series Fund
MetLife Mid Cap Stock Index Portfolio
Financial Highlights
| | | | | | | | | | | | | | | | | | | | |
| Selected per share data | | | | | | | | | | | | | | | |
| | | Class A | |
| | | Year Ended December 31, | |
| | | 2013 | | | 2012 | | | 2011 | | | 2010 | | | 2009 | |
Net Asset Value, Beginning of Period | | $ | 14.47 | | | $ | 12.97 | | | $ | 13.88 | | | $ | 11.10 | | | $ | 8.66 | |
| | | | | | | | | | | | | | | | | | | | |
Income (Loss) from Investment Operations | | | | | | | | | | | | | | | | | | | | |
Net investment income (a) | | | 0.18 | | | | 0.19 | | | | 0.14 | | | | 0.13 | | | | 0.15 | |
Net realized and unrealized gain (loss) on investments | | | 4.46 | | | | 2.05 | | | | (0.34 | ) | | | 2.79 | | | | 2.85 | |
| | | | | | | | | | | | | | | | | | | | |
Total from investment operations | | | 4.64 | | | | 2.24 | | | | (0.20 | ) | | | 2.92 | | | | 3.00 | |
| | | | | | | | | | | | | | | | | | | | |
Less Distributions | | | | | | | | | | | | | | | | | | | | |
Distributions from net investment income | | | (0.19 | ) | | | (0.14 | ) | | | (0.13 | ) | | | (0.12 | ) | | | (0.17 | ) |
Distributions from net realized capital gains | | | (0.47 | ) | | | (0.60 | ) | | | (0.58 | ) | | | (0.02 | ) | | | (0.39 | ) |
| | | | | | | | | | | | | | | | | | | | |
Total distributions | | | (0.66 | ) | | | (0.74 | ) | | | (0.71 | ) | | | (0.14 | ) | | | (0.56 | ) |
| | | | | | | | | | | | | | | | | | | | |
Net Asset Value, End of Period | | $ | 18.45 | | | $ | 14.47 | | | $ | 12.97 | | | $ | 13.88 | | | $ | 11.10 | |
| | | | | | | | | | | | | | | | | | | | |
Total Return (%) (b) | | | 33.15 | | | | 17.60 | | | | (1.89 | ) | | | 26.28 | | | | 36.99 | |
| | | | | |
Ratios/Supplemental Data | | | | | | | | | | | | | | | | | | | | |
Gross ratio of expenses to average net assets (%) | | | 0.30 | | | | 0.32 | | | | 0.30 | | | | 0.31 | | | | 0.34 | |
Net ratio of expenses to average net assets (%) (c) | | | 0.30 | | | | 0.31 | | | | 0.30 | | | | 0.30 | | | | 0.34 | |
Ratio of net investment income to average net assets (%) | | | 1.09 | | | | 1.40 | | | | 1.03 | | | | 1.07 | | | | 1.59 | |
Portfolio turnover rate (%) | | | 16 | | | | 11 | | | | 24 | | | | 22 | | | | 21 | |
Net assets, end of period (in millions) | | $ | 370.0 | | | $ | 260.2 | | | $ | 236.6 | | | $ | 257.4 | | | $ | 215.0 | |
| | | | | | | | | | | | | | | | | | | | |
| | | Class B | |
| | | Year Ended December 31, | |
| | | 2013 | | | 2012 | | | 2011 | | | 2010 | | | 2009 | |
Net Asset Value, Beginning of Period | | $ | 14.32 | | | $ | 12.84 | | | $ | 13.75 | | | $ | 11.01 | | | $ | 8.58 | |
| | | | | | | | | | | | | | | | | | | | |
Income (Loss) from Investment Operations | | | | | | | | | | | | | | | | | | | | |
Net investment income (a) | | | 0.14 | | | | 0.16 | | | | 0.11 | | | | 0.10 | | | | 0.12 | |
Net realized and unrealized gain (loss) on investments | | | 4.42 | | | | 2.03 | | | | (0.34 | ) | | | 2.76 | | | | 2.85 | |
| | | | | | | | | | | | | | | | | | | | |
Total from investment operations | | | 4.56 | | | | 2.19 | | | | (0.23 | ) | | | 2.86 | | | | 2.97 | |
| | | | | | | | | | | | | | | | | | | | |
Less Distributions | | | | | | | | | | | | | | | | | | | | |
Distributions from net investment income | | | (0.16 | ) | | | (0.11 | ) | | | (0.10 | ) | | | (0.10 | ) | | | (0.15 | ) |
Distributions from net realized capital gains | | | (0.47 | ) | | | (0.60 | ) | | | (0.58 | ) | | | (0.02 | ) | | | (0.39 | ) |
| | | | | | | | | | | | | | | | | | | | |
Total distributions | | | (0.63 | ) | | | (0.71 | ) | | | (0.68 | ) | | | (0.12 | ) | | | (0.54 | ) |
| | | | | | | | | | | | | | | | | | | | |
Net Asset Value, End of Period | | $ | 18.25 | | | $ | 14.32 | | | $ | 12.84 | | | $ | 13.75 | | | $ | 11.01 | |
| | | | | | | | | | | | | | | | | | | | |
Total Return (%) (b) | | | 32.83 | | | | 17.33 | | | | (2.19 | ) | | | 25.99 | | | | 36.78 | |
| | | | | |
Ratios/Supplemental Data | | | | | | | | | | | | | | | | | | | | |
Gross ratio of expenses to average net assets (%) | | | 0.55 | | | | 0.57 | | | | 0.55 | | | | 0.56 | | | | 0.59 | |
Net ratio of expenses to average net assets (%) (c) | | | 0.55 | | | | 0.56 | | | | 0.55 | | | | 0.55 | | | | 0.59 | |
Ratio of net investment income to average net assets (%) | | | 0.83 | | | | 1.16 | | | | 0.79 | | | | 0.83 | | | | 1.34 | |
Portfolio turnover rate (%) | | | 16 | | | | 11 | | | | 24 | | | | 22 | | | | 21 | |
Net assets, end of period (in millions) | | $ | 388.4 | | | $ | 311.6 | | | $ | 275.5 | | | $ | 267.9 | | | $ | 205.4 | |
Please see following page for Financial Highlights footnote legend.
See accompanying notes to financial statements.
MSF-13
Metropolitan Series Fund
MetLife Mid Cap Stock Index Portfolio
Financial Highlights
| | | | | | | | | | | | | | | | | | | | |
| Selected per share data | | | | | | | | | | | | | | | |
| | | Class E | |
| | | Year Ended December 31, | |
| | | 2013 | | | 2012 | | | 2011 | | | 2010 | | | 2009 | |
Net Asset Value, Beginning of Period | | $ | 14.38 | | | $ | 12.89 | | | $ | 13.80 | | | $ | 11.05 | | | $ | 8.61 | |
| | | | | | | | | | | | | | | | | | | | |
Income (Loss) from Investment Operations | | | | | | | | | | | | | | | | | | | | |
Net investment income (a) | | | 0.15 | | | | 0.17 | | | | 0.12 | | | | 0.11 | | | | 0.13 | |
Net realized and unrealized gain (loss) on investments | | | 4.44 | | | | 2.04 | | | | (0.34 | ) | | | 2.76 | | | | 2.86 | |
| | | | | | | | | | | | | | | | | | | | |
Total from investment operations | | | 4.59 | | | | 2.21 | | | | (0.22 | ) | | | 2.87 | | | | 2.99 | |
| | | | | | | | | | | | | | | | | | | | |
Less Distributions | | | | | | | | | | | | | | | | | | | | |
Distributions from net investment income | | | (0.17 | ) | | | (0.12 | ) | | | (0.11 | ) | | | (0.10 | ) | | | (0.16 | ) |
Distributions from net realized capital gains | | | (0.47 | ) | | | (0.60 | ) | | | (0.58 | ) | | | (0.02 | ) | | | (0.39 | ) |
| | | | | | | | | | | | | | | | | | | | |
Total distributions | | | (0.64 | ) | | | (0.72 | ) | | | (0.69 | ) | | | (0.12 | ) | | | (0.55 | ) |
| | | | | | | | | | | | | | | | | | | | |
Net Asset Value, End of Period | | $ | 18.33 | | | $ | 14.38 | | | $ | 12.89 | | | $ | 13.80 | | | $ | 11.05 | |
| | | | | | | | | | | | | | | | | | | | |
Total Return (%) (b) | | | 32.95 | | | | 17.46 | | | | (2.10 | ) | | | 26.08 | | | | 36.93 | |
| | | | | |
Ratios/Supplemental Data | | | | | | | | | | | | | | | | | | | | |
Gross ratio of expenses to average net assets (%) | | | 0.45 | | | | 0.47 | | | | 0.45 | | | | 0.46 | | | | 0.49 | |
Net ratio of expenses to average net assets (%) (c) | | | 0.45 | | | | 0.46 | | | | 0.45 | | | | 0.45 | | | | 0.49 | |
Ratio of net investment income to average net assets (%) | | | 0.93 | | | | 1.24 | | | | 0.87 | | | | 0.92 | | | | 1.45 | |
Portfolio turnover rate (%) | | | 16 | | | | 11 | | | | 24 | | | | 22 | | | | 21 | |
Net assets, end of period (in millions) | | $ | 45.0 | | | $ | 37.6 | | | $ | 37.1 | | | $ | 46.9 | | | $ | 44.8 | |
| | | | | | | | | | | | | | | | | | | | |
| | | Class G | |
| | | Year Ended December 31, | |
| | | 2013 | | | 2012 | | | 2011 | | | 2010 | | | 2009(d) | |
Net Asset Value, Beginning of Period | | $ | 14.26 | | | $ | 12.79 | | | $ | 13.70 | | | $ | 10.97 | | | $ | 8.19 | |
| | | | | | | | | | | | | | | | | | | | |
Income (Loss) from Investment Operations | | | | | | | | | | | | | | | | | | | | |
Net investment income (a) | | | 0.13 | | | | 0.15 | | | | 0.10 | | | | 0.10 | | | | 0.09 | |
Net realized and unrealized gain (loss) on investments | | | 4.40 | | | | 2.02 | | | | (0.33 | ) | | | 2.74 | | | | 2.69 | |
| | | | | | | | | | | | | | | | | | | | |
Total from investment operations | | | 4.53 | | | | 2.17 | | | | (0.23 | ) | | | 2.84 | | | | 2.78 | |
| | | | | | | | | | | | | | | | | | | | |
Less Distributions | | | | | | | | | | | | | | | | | | | | |
Distributions from net investment income | | | (0.16 | ) | | | (0.10 | ) | | | (0.10 | ) | | | (0.09 | ) | | | 0.00 | |
Distributions from net realized capital gains | | | (0.47 | ) | | | (0.60 | ) | | | (0.58 | ) | | | (0.02 | ) | | | 0.00 | |
| | | | | | | | | | | | | | | | | | | | |
Total distributions | | | (0.63 | ) | | | (0.70 | ) | | | (0.68 | ) | | | (0.11 | ) | | | 0.00 | |
| | | | | | | | | | | | | | | | | | | | |
Net Asset Value, End of Period | | $ | 18.16 | | | $ | 14.26 | | | $ | 12.79 | | | $ | 13.70 | | | $ | 10.97 | |
| | | | | | | | | | | | | | | | | | | | |
Total Return (%) (b) | | | 32.75 | | | | 17.27 | | | | (2.24 | ) | | | 25.92 | | | | 33.94 | (e) |
| | | | | |
Ratios/Supplemental Data | | | | | | | | | | | | | | | | | | | | |
Gross ratio of expenses to average net assets (%) | | | 0.60 | | | | 0.62 | | | | 0.60 | | | | 0.61 | | | | 0.64 | (f) |
Net ratio of expenses to average net assets (%) (c) | | | 0.60 | | | | 0.61 | | | | 0.60 | | | | 0.60 | | | | 0.64 | (f) |
Ratio of net investment income to average net assets (%) | | | 0.79 | | | | 1.10 | | | | 0.76 | | | | 0.82 | | | | 1.35 | (f) |
Portfolio turnover rate (%) | | | 16 | | | | 11 | | | | 24 | | | | 22 | | | | 21 | |
Net assets, end of period (in millions) | | $ | 103.3 | | | $ | 71.4 | | | $ | 62.7 | | | $ | 41.3 | | | $ | 8.4 | |
| (a) | Per share amounts based on average shares outstanding during the period. |
| (b) | Total return does not reflect any insurance, sales, separate account or administrative charges of variable annuity or life insurance contracts or any additional expenses that contract owners may bear under their variable contracts. If these charges were included, the returns would be lower. |
| (c) | Net ratio of expenses to average net assets includes the effect of management fee waivers as detailed in Note 6 of the Notes to Financial Statements. |
| (d) | Commencement of operations was April 28, 2009. |
| (e) | Periods less than one year are not computed on an annualized basis. |
| (f) | Computed on an annualized basis. |
See accompanying notes to financial statements.
MSF-14
Metropolitan Series Fund
MetLife Mid Cap Stock Index Portfolio
Notes to Financial Statements—December 31, 2013
1. Organization
Metropolitan Series Fund (the “Trust”) is organized as a Delaware statutory trust and registered under the Investment Company Act of 1940, as amended (the “1940 Act”), as an open-end management investment company. The Trust is currently comprised of thirty series, each of which operates as a distinct investment vehicle of the Trust. The portfolio included in this report is MetLife Mid Cap Stock Index Portfolio (the “Portfolio”), which is diversified. Shares in the Portfolio are not offered directly to the general public and are currently available only to separate accounts established by Metropolitan Life Insurance Company (“MetLife”) and other affiliated life insurance companies.
The Portfolio has registered and offers four classes of shares: Class A, B, E, and G shares. Shares of each Class of the Portfolio represent an equal pro rata interest in the Portfolio and generally give the shareholder the same voting, dividend, liquidation, and other rights. Investment income, realized and unrealized capital gains and losses, the common expenses of the Portfolio, and certain Portfolio-level expense reductions, if any, are allocated on a pro rata basis to each Class based on the relative net assets of each Class to the net assets of the Portfolio. Each Class of shares differs in its respective distribution plan and such distribution expenses are allocated to that Class.
2. Significant Accounting Policies
The preparation of financial statements in conformity with accounting principles generally accepted in the United States of America (“GAAP”) requires management to make estimates and assumptions that affect the reported amounts of assets and liabilities and disclosure of contingent assets and liabilities as of the date of the financial statements and the reported amounts of income and expenses during the reporting period. Actual results could differ from those estimates. In the preparation of these financial statements, management has evaluated events and transactions subsequent to December 31, 2013 through the date the financial statements were issued.
The following is a summary of significant accounting policies consistently followed by the Portfolio in the preparation of its financial statements.
Investment Valuation and Fair Value Measurements - Debt securities (other than short term obligations with a remaining maturity of sixty days or less), including corporate, convertible and municipal bonds and notes; obligations of the U.S. treasury and U.S. government agencies; sovereign issues; floating rate loans; and non-U.S. bonds, are generally valued on the basis of evaluated or composite bid quotations obtained from independent pricing services and/or brokers and dealers selected by MetLife Advisers, LLC (“MetLife Advisers” or the “Adviser”), an affiliate of MetLife, Inc., pursuant to authorization of the Board of Trustees of the Trust (the “Board” or “Trustees”). Such quotations utilize matrix pricing, which considers observable inputs including, among other things, issuer details, maturity dates, interest rates, yield curves, rates of prepayment, credit risks/spreads, default rates, reported trades, broker dealer quotes and quoted prices for similar securities. Securities that use similar valuation techniques and inputs as described above are generally categorized as Level 2 within the fair value hierarchy.
Mortgage and asset-backed securities are usually issued as separate tranches, or classes, of securities within each deal. These securities are also generally valued on the basis of evaluated or composite bid quotations obtained from independent pricing services and/or brokers and dealers selected by the Adviser pursuant to authorization of the Board. The pricing models for these securities usually consider tranche-level attributes, estimated cash flows and market-based yield spreads for each tranche and current market data, and incorporate deal collateral performance, as available. Mortgage and asset-backed securities that use similar valuation techniques and inputs as described above are generally categorized as Level 2 within the fair value hierarchy.
Short term obligations with a remaining maturity of sixty days or less are generally valued at amortized cost, which approximates fair market value, and are generally categorized as Level 2 within the fair value hierarchy.
Domestic and foreign equity securities, such as common stock, exchange-traded funds, rights, warrants, and preferred stock, that are traded on a securities exchange, are generally valued at their last sale price on the exchange or market in which they are principally traded on the valuation date, or, if no sales occurred on that day, at the last reported bid price. Equity securities traded over-the-counter are generally valued at the last reported sale price. Valuation adjustments may be applied to certain foreign equity securities that are traded solely on foreign exchanges that close before the close of the U.S. market to account for the market movement between the close of the foreign exchanges and the close of the U.S. market. The Portfolio may use a systematic fair valuation model provided by an independent third party to value securities principally traded in these foreign markets in order to adjust for possible stale pricing that may occur between the close of the foreign exchanges and the time of the Portfolio valuation. Foreign equity securities using these valuation adjustments are generally categorized as Level 2 within the fair value hierarchy. Equity securities that are actively traded, and have no valuation adjustments applied, are categorized as Level 1 within the fair value hierarchy. Other equity securities traded on inactive markets, or valued in reference to similar instruments traded on active markets, are generally categorized as Level 2 within the fair value hierarchy.
MSF-15
Metropolitan Series Fund
MetLife Mid Cap Stock Index Portfolio
Notes to Financial Statements—December 31, 2013—(Continued)
Investments in registered open-end management investment companies are valued at reported net asset value per share on the valuation date and are categorized as Level 1 within the fair value hierarchy.
Forward foreign currency exchange contracts are valued through an independent pricing service based on the mean between closing bid and ask prices of the forward currency rates in the London foreign exchange markets on a daily basis as provided by a reliable bank or dealer. These contracts are generally categorized as Level 2 within the fair value hierarchy.
Options, whether on securities, indices, futures contracts, or otherwise, traded on exchanges are valued at the last sale price available as of the close of business on the valuation date or, if there is no such price available, at the mean between the last reported bid and ask prices. These types of options are categorized as Level 1 within the fair value hierarchy. Futures contracts, which are traded on commodity exchanges, are valued at their closing prices as of the close of such exchanges and are categorized as Level 1 within the fair value hierarchy.
Options and futures contracts that are traded over-the-counter are generally valued on the basis of quotations provided by broker-dealers or prices provided by pricing service providers who use a series of techniques, including simulation pricing models, to determine the value of the contracts. The pricing models use inputs that are observed from actively quoted markets such as issuer details, indices, spreads, interest rates, yield curves, credit curves, measures of volatility and exchange rates. These contracts are generally categorized as Level 2 within the fair value hierarchy.
If no current market value quotation or other observable inputs are readily available or market value quotations are deemed to be unreliable for a security, the fair value of the security will be determined in accordance with procedures approved by and under the general supervision of the Board. In such a circumstance, the Board has delegated the determination of the fair value of a security to a Valuation Committee (“Committee”) of MetLife Advisers. The Committee provides general pricing oversight and fair value pricing determinations related to portfolio securities and meets on a regular basis to review reports relating to the valuation of the securities in the Portfolio. The Board has delegated to State Street Bank and Trust Company, the Trust’s custodian (“custodian”), the responsibility for calculating the net asset values (“NAVs”) of the Trust’s Portfolios. The Committee is responsible for overseeing the calculation of the NAVs of the Portfolios by the custodian. The Committee also periodically reviews pricing vendors, including the vendor providing fair value pricing for the Portfolio’s foreign securities, and is responsible for overseeing the correction of pricing errors and addressing other pricing issues that arise in the ordinary course of business, such as making real-time fair value determinations, as necessary.
No single standard for determining the fair value of a security can be set forth because fair value depends upon the facts and circumstances with respect to each security. Information relating to any relevant factors may be obtained by the Committee from any appropriate source, including the subadviser of the Portfolio, the custodian, a pricing service, market maker and/or broker for such security or the issuer. Appropriate methodologies for determining fair value under particular circumstances may include: matrix pricing, comparisons of securities with comparable characteristics, value based on multiples of earnings, discount from market price of similar marketable securities or a combination of these and other methods. The Committee maintains a detailed report tracking each fair-valued security that compares the fair value price to the next available trade, vendor or broker price, and provides information on how close the fair value price was to the next quoted price. The Committee reviews a summary of such report monthly. On a quarterly basis, the Board is provided with the following for consideration and ratification or adjustment: (1) a memorandum summarizing the actions taken by the Committee in the prior quarter; and (2) a list of the Portfolio’s securities as of the most recent quarter-end for which market quotations were not readily available.
Investment Transactions and Related Investment Income - Portfolio security transactions are recorded on the trade date. Dividend income is recorded on the ex-dividend date or, for certain foreign securities, when notified. Interest income, which includes amortization of premium and accretion of discount on debt securities, is recorded on the accrual basis. Realized gains and losses on investments are determined on the identified cost basis, which is the same basis used for federal income tax purposes. Foreign income and foreign capital gains on some foreign securities may be subject to foreign taxes, which are accrued as applicable. These foreign taxes have been provided for in accordance with the Portfolio’s understanding of the applicable countries’ tax rules and rates.
Foreign Currency Translation - The books and records of the Portfolio are maintained in U.S. dollars. The values of securities, currencies, and other assets and liabilities denominated in currencies other than the U.S. dollar are translated into U.S. dollars based upon foreign exchange rates prevailing at the end of the period. Purchases and sales of investment securities, income, and expenses are translated on the respective dates of such transactions. Because the values of investment securities are translated at the foreign exchange rates prevailing at the end of the period, that portion of the results of operations arising from changes in exchange rates and that portion of the results of operations reflecting fluctuations arising from changes in market prices of the investment securities are not separated. Such fluctuations are included in the net realized and unrealized gain or loss on investments.
Net realized foreign exchange gains or losses arise from activity in forward foreign currency exchange contracts, sales of foreign currency, currency gains or losses realized between the trade and settlement dates on securities transactions, and the difference between the amounts of dividends, interest, and foreign withholding taxes recorded by the Portfolio and the U.S. dollar equivalent of
MSF-16
Metropolitan Series Fund
MetLife Mid Cap Stock Index Portfolio
Notes to Financial Statements—December 31, 2013—(Continued)
the amounts actually received or paid by the Portfolio. Net unrealized foreign exchange gains and losses arise from changes in the value of assets and liabilities, other than investment securities, resulting from changes in foreign exchange rates.
Income Taxes - It is the Portfolio’s policy to comply with the requirements of the Internal Revenue Code of 1986, as amended, and regulations thereunder, applicable to regulated investment companies and to distribute, with respect to each taxable year, all of its taxable income to shareholders. Therefore, no federal income tax provision is required. The Portfolio files U.S. federal tax returns. No income tax returns are currently under examination. The Portfolio’s federal tax returns for the prior three fiscal years remain subject to examination by the Internal Revenue Service. As of December 31, 2013, the Portfolio had no uncertain tax positions that would require financial statement recognition, or de-recognition or disclosure.
Dividends and Distributions to Shareholders - The Portfolio records dividends and distributions on the ex-dividend date. Net realized gains from security transactions (if any) are generally distributed annually to shareholders. The timing and characterization of certain income and capital gains distributions are determined in accordance with federal tax regulations that may differ from GAAP. Permanent book and tax basis differences relating to shareholder distributions will result in reclassification between under/over distributed net investment income, accumulated net realized gains/losses, and paid-in surplus. Book-tax differences are primarily due to real estate investment trust (REIT) adjustments. These adjustments have no impact on net assets or the results of operations.
Securities Lending - The Portfolio may lend its portfolio securities to certain qualified brokers who borrow securities in order to complete certain securities transactions. By lending its portfolio securities, the Portfolio attempts to increase its net investment income through the receipt of income on collateral held from securities on loan. Any gain or loss in the market price of the loaned securities that might occur and any interest earned or dividends declared during the term of the loan would accrue to the account of the Portfolio.
The Trust has entered into a securities lending arrangement with the custodian. Under this arrangement, the custodian is authorized to loan portfolio securities on the Portfolio’s behalf. In exchange, the Portfolio receives either cash or securities as collateral against the loaned securities. The Portfolio receives collateral at least equal to 102% of the market value of the loaned securities (105% for foreign equity securities), at each loan’s inception. Collateral representing at least 100% of the market value of the loaned securities must be maintained for the duration of the loan. A liability for cash collateral is reflected on the Statement of Assets and Liabilities, and is categorized as Level 2 within the fair value hierarchy. Cash collateral is generally invested in the State Street Navigator Securities Lending MET Portfolio (the “Navigator Portfolio”), a series of the State Street Navigator Securities Lending Trust that is managed by an affiliate of the custodian. The Navigator Portfolio is a registered money market fund that invests in a variety of high-quality, U.S. dollar-denominated instruments. If the market value of the collateral at the close of trading on a business day is less than 100% of the market value of the loaned securities at the close of trading on that day, the borrower shall be required to deliver, by the close of business on the following business day, an additional amount of collateral, so that the total amount of posted collateral is equal to at least 100% of the market value of all the loaned securities as of such preceding day. A portion of net income (income after the deduction of expenses and fees of the Navigator Portfolio) on the collateral is rebated to the borrower of the securities and the remainder is split between the custodian and the Portfolio. On loans collateralized by U.S. Treasuries, a fee is received from the borrower and is allocated between the Portfolio and the custodian. The risks associated with lending portfolio securities include, but are not limited to, possible delays in receiving additional collateral or in the recovery of the loaned securities, possible loss of rights in the collateral should the borrower fail financially, as well as risk of loss in the value of the collateral or the value of the investments made with the collateral. The lending agent has agreed to indemnify the Portfolio in the case of default of any securities borrower. Income received by the Portfolio in securities lending transactions during the year ended December 31, 2013 is reflected as Securities lending income on the Statement of Operations. Any outstanding loans by the Portfolio at December 31, 2013 are disclosed in the footnotes to the Schedule of Investments.
Repurchase Agreements - The Portfolio may enter into repurchase agreements, under the terms of a Master Repurchase Agreement, with selected commercial banks and broker-dealers, under which the Portfolio acquires securities as collateral and agrees to resell the securities at an agreed upon time and at an agreed-upon price. The Portfolio, through the custodian or a subcustodian, receives delivery of the underlying securities collateralizing any repurchase agreements. The Portfolio requires the custodian to take possession, to have legally segregated in the Federal Reserve Book Entry System, or to have segregated within the custodian’s vault, all securities held as collateral for repurchase agreements. It is the Portfolio’s policy that the market value of the collateral be at least equal to 100% of the repurchase price in the case of a repurchase agreement of one-day duration and at least equal to 102% of the repurchase price in the case of all other repurchase agreements. In the event of default or failure by a party to perform an obligation in connection with any repurchase transaction, the Master Repurchase Agreement gives the non-defaulting party the right to set-off claims and to apply property held by it in connection with any repurchase transaction against obligations owed to it.
3. Investments in Derivative Instruments
Futures Contracts - The Portfolio may buy and sell futures contracts as a hedge, to maintain investment exposure to a target asset class or to enhance return. The Portfolio may be subject to fluctuations in equity prices, interest rates, commodity prices, and foreign
MSF-17
Metropolitan Series Fund
MetLife Mid Cap Stock Index Portfolio
Notes to Financial Statements—December 31, 2013—(Continued)
currency exchange rates in the normal course of pursuing its investment objective. Futures contracts are standardized agreements to buy or sell a security, or deliver a final cash settlement price in connection with an index, interest rate, currency, or other asset. The Portfolio must deposit an amount (“initial margin”) equal to a certain percentage of the face value of the futures contract. The initial margin may be in the form of cash or securities, which is returned when the Portfolio’s obligations under the contract have been satisfied. If cash is deposited as the initial margin, it is shown as cash collateral on the Statement of Assets and Liabilities. Futures contracts are marked-to-market daily, and subsequent payments (“variation margin”) are made or received by the Portfolio depending on whether unrealized gains or losses are incurred. These amounts are reflected as receivables or payables on the Statement of Assets and Liabilities and as a component of net change in unrealized appreciation/depreciation on the Statement of Operations. When the contract is closed or expires, the Portfolio records a realized gain or loss equal to the difference between the value of the contract at the time it was opened and the value at the time it was closed. Risks of entering into futures contracts (and related options) include the possibility that the market for these instruments may be illiquid and that a change in the value of the contract or option may not correlate perfectly with changes in the value of the underlying instrument. Futures contracts are exchange-traded and the exchange’s clearinghouse, as counterparty to all exchange-traded futures, guarantees the futures contracts against default. For over-the-counter futures the Portfolio’s ability to terminate the positions may be more limited than in the case of exchange-traded positions and may also involve the risk that securities dealers participating in such transactions would fail to meet their obligations to the Portfolio.
At December 31, 2013, the Portfolio had the following derivatives, categorized by risk exposure:
| | | | | | |
| | | Asset Derivatives | |
Risk Exposure | | Statement of Assets &
Liabilities Location | | Fair Value | |
| Equity | | Unrealized appreciation on futures contracts* | | $ | 429,014 | |
| | | | | | |
| | * | Includes cumulative appreciation/depreciation of futures contracts as reported in the Schedule of Investments. Only the current day’s variation margin is reported within the Statement of Assets and Liabilities. |
Transactions in derivative instruments during the year ended December 31, 2013 were as follows:
| | | | |
Statement of Operations Location—Net Realized Gain (Loss) | | Equity | |
Futures contracts | | $ | 5,358,470 | |
| | | | |
| | | | |
| |
Statement of Operations Location—Net Change in Unrealized Appreciation (Depreciation) | | Equity | |
Futures contracts | | $ | 274,806 | |
| | | | |
For the year ended December 31, 2013, the average amount or number per contract outstanding for each derivative type was as follows:
| | | | |
Derivative Description | | Average
Notional Par or
Face Amount‡ | |
Futures contracts long | | $ | 17,000 | |
| | ‡ | Averages are based on activity levels during 2013. |
4. Certain Risks
Market Risk: In the normal course of business, the Portfolio invests in securities and enters into transactions where risks exist due to fluctuations in the market (market risk) or failure of the other party to a transaction to perform (credit and counterparty risk). The value of securities held by the Portfolio may decline in response to certain events, including those directly involving the companies whose securities are owned by the Portfolio; conditions affecting the general economy; overall market changes; local, regional or global political, social or economic instability; currency, interest rate, and price fluctuations.
Credit and Counterparty Risk: The Portfolio may be exposed to counterparty risk, or the risk that an entity with which the Portfolio has unsettled or open transactions may default. The potential loss could exceed the value of the financial assets and liabilities recorded in the financial statements. Financial assets that potentially expose the Portfolio to credit and counterparty risk consist principally of cash due from counterparties and investments. The Portfolio manages counterparty risk by entering into agreements
MSF-18
Metropolitan Series Fund
MetLife Mid Cap Stock Index Portfolio
Notes to Financial Statements—December 31, 2013—(Continued)
only with counterparties that it believes have the financial resources to honor their obligations and by monitoring the financial stability of those counterparties. The Portfolio’s investment adviser attempts to mitigate counterparty risk by (i) periodically assessing the creditworthiness of its trading partners, (ii) monitoring and/or limiting the amount of its net exposure to each individual counterparty based on its assessment, and (iii) requiring collateral from the counterparty for certain transactions. In order to preserve certain safeguards for non-standard settlement trades, the Portfolio restricts its exposure to credit and counterparty losses by entering into master netting agreements with counterparties (approved brokers) with whom it undertakes a significant volume of transactions. Master Agreements govern the terms of certain transactions, and reduce the counterparty risk associated with relevant transactions by specifying credit protection mechanisms and providing standardization that improves legal certainty. Master Agreements can also help limit counterparty risk by specifying collateral posting arrangements at pre-arranged exposure levels. Collateral requirements may differ by type of derivative or investment, as applicable. Collateral or margin requirements are set by the broker or exchange clearing house for exchange traded derivatives (e.g., futures contracts and exchange traded options) while collateral terms are contract specific for over-the-counter traded derivatives (e.g., forward foreign currency exchange contracts, swap agreements and over-the-counter options).
Repurchase and reverse repurchase agreements are primarily executed under Global Master Repurchase Agreements (“GMRAs”) or Master Repurchase Agreements (“MRAs”), which provide the rights to set-off. Each repurchase and reverse repurchase agreement is initially collateralized at the transaction level. In the event of default, the total market value exposure will be offset against collateral exchanged to date, which would result in a net receivable/(payable) that would be due from/to the counterparty.
Customer Account Agreements and related addendums govern cleared derivatives transactions such as futures, options on futures, and cleared OTC derivatives. Cleared derivative transactions require posting of initial margin as determined by each relevant clearing agency which is segregated at a broker account registered with the Commodities Futures Trading Commission (CFTC), or the applicable regulator. In the U.S., counterparty risk is significantly reduced as creditors of the futures broker do not have claim to Portfolio assets in the segregated account. Additionally, portability of exposure in the event of default further reduces risk to the Portfolio. Variation margin, or changes in market value, are exchanged daily, but may not be netted between futures and cleared OTC derivatives.
Additional risks associated with each type of investment are described above within the respective security type notes. The Portfolio’s prospectus includes a discussion of the principal risks of investing in the Portfolio.
5. Investment Transactions
Aggregate cost of purchases and proceeds of sales of investment securities, excluding short-term securities, for the year ended December 31, 2013 were as follows:
| | | | | | | | | | | | |
Purchases | | | Sales | |
U.S. Government | | Non U.S. Government | | | U.S. Government | | | Non U.S. Government | |
| $0 | | $ | 136,976,300 | | | $ | 0 | | | $ | 128,684,721 | |
6. Investment Management Fees and Other Transactions with Affiliates
Investment Management Agreement - MetLife Advisers is the investment adviser to the Portfolio. The Trust has entered into an investment management agreement with MetLife Advisers with respect to the Portfolio. For providing investment management services to the Portfolio, MetLife Advisers receives monthly compensation at the annual rate of 0.250% of average daily net assets. Fees earned by MetLife Advisers with respect to the Portfolio for the year ended December 31, 2013 were $2,016,734.
MetLife Advisers has entered into an investment subadvisory agreement with MetLife Investment Management, LLC (“MIM”) with respect to the Portfolio. For providing subadvisory services to the Portfolio, MetLife Advisers has agreed to pay MIM an investment subadvisory fee for each class of the Portfolio as follows:
| | | | |
| % per annum | | | Average Daily Net Assets |
| | 0.030 | % | | On the first $500 million |
| | 0.020 | % | | On the next $500 million |
| | 0.010 | % | | On amounts over $1 billion |
Fees earned by MIM with respect to the Portfolio for the year ended December 31, 2013 were $211,339.
MSF-19
Metropolitan Series Fund
MetLife Mid Cap Stock Index Portfolio
Notes to Financial Statements—December 31, 2013—(Continued)
Management Fee Waivers - Pursuant to an expense agreement, MetLife Advisers has agreed, for the period April 29, 2013 through April 27, 2014, to reduce its advisory fees set out above under “Investment Management Agreement” for each class of the Portfolio as follows:
| | | | |
| % per annum reduction | | | Average Daily Net Assets |
| | 0.005 | % | | Over $500 million and under $1 billion |
| | 0.010 | % | | Of the next $1 billion |
| | 0.015 | % | | On amounts over $2 billion |
An identical expense agreement was in place for the period April 30, 2012 through April 28, 2013. Amounts waived for the year ended December 31, 2013 are shown as management fee waivers in the Statement of Operations.
Certain officers and trustees of the Trust may also be officers of MetLife Advisers; however, such officers and trustees receive no compensation from the Trust.
Transfer Agency Agreement - MetLife serves as the transfer agent for the Trust. MetLife receives no fees for its services to the Trust under the transfer agency agreement.
Distribution and Service Fees - The Trust has a distribution agreement with MetLife Investors Distribution Company (“MIDC” or the “Distributor”) in which MIDC serves as the distributor for the Portfolio’s Class A, B, E, and G Shares. MIDC is a wholly-owned subsidiary of MetLife Investors Group, Inc., an affiliate of the Adviser. The Trust has also adopted a Distribution and Service Plan under Rule 12b-1 of the 1940 Act for the Portfolio’s Class B, E, and G Shares. Under the Distribution and Service Plan, the Class B, E, and G Shares of the Portfolio pay a fee to compensate the Insurance Companies (or their affiliates) and other broker-dealers and financial intermediaries involved in the offer and sale of Portfolio shares for promoting or selling and servicing the Class B, E, and G Shares of the Portfolio. The fees under the Distribution and Service Plan for each class of the Portfolio’s shares are calculated as a percentage of the Portfolio’s average daily net assets that are attributable to that Class. Currently, the fee is 0.25% per year for Class B Shares, 0.15% per year for Class E Shares, and 0.30% per year for Class G Shares. Amounts incurred by the Portfolio for the year ended December 31, 2013 are shown as Distribution and service fees in the Statement of Operations.
Deferred Trustee Compensation - Each Trustee who is not currently an employee of the Adviser or any of its affiliates receives compensation from the Trust for his or her service to the Trust. A deferred compensation plan (the “Plan”) is available to the Trustees on a voluntary basis. Deferred amounts remain in the Trust until distributed in accordance with the provisions of the Plan. The value of a participating Trustee’s deferral account is based on theoretical investments of deferred amounts, on the normal payment dates in certain portfolios of the Trust or Met Investors Series Trust, an affiliate of the Trust, as designated by the participating Trustee. Changes in the value of participants’ deferral accounts are reflected as Trustees’ fees and expenses in the Statement of Operations. The portion of the accrued obligations allocated to the Portfolio under the Plan is reflected as Deferred trustees’ fees in the Statement of Assets and Liabilities.
7. Contractual Obligations
Under the Trust’s organizational documents, its officers and Trustees may be indemnified against certain liabilities and expenses arising out of the performance of their duties to the Trust. Additionally, the Trust has a variety of indemnification obligations under contracts with its service providers. The Trust’s maximum exposure under these arrangements is unknown, as this would involve future claims that may be made against the Trust that have not yet occurred.
8. Income Tax Information
The tax character of distributions paid for the periods ended December 31, 2013 and 2012 was as follows:
| | | | | | | | | | | | | | | | | | | | |
Ordinary Income | | | Long-Term Capital Gain | | | Total | |
2013 | | 2012 | | | 2013 | | | 2012 | | | 2013 | | | 2012 | |
| $11,678,054 | | | 7,770,120 | | | $ | 19,089,199 | | | $ | 25,602,594 | | | $ | 30,767,253 | | | $ | 33,372,714 | |
As of December 31, 2013, the components of distributable earnings (accumulated losses) on a federal income tax basis were as follows:
| | | | | | | | | | | | | | | | |
Undistributed
Ordinary
Income | | Undistributed
Long-Term
Capital Gain | | | Net
Unrealized
Appreciation | | | Loss
Carryforwards | | | Total | |
$13,489,113 | | $ | 37,639,583 | | | $ | 279,999,381 | | | $ | — | | | $ | 331,128,077 | |
MSF-20
Metropolitan Series Fund
MetLife Mid Cap Stock Index Portfolio
Notes to Financial Statements—December 31, 2013—(Continued)
The Portfolio utilizes the provisions of the federal income tax laws that provide for the carryforward of capital losses for prior years, offsetting such losses against any future realized capital gains. Under the Regulated Investment Company Modernization Act of 2010 (the “Act”), net capital losses recognized after December 22, 2010 may be carried forward indefinitely and their character is retained as short-term and/or long-term losses. Previously, net capital losses were carried forward for up to eight years and treated as short-term losses. As a transition rule, the Act requires that post-enactment net capital losses be used before pre-enactment net capital losses.
As of December 31, 2013, the Portfolio had no post-enactment accumulated capital losses and no pre-enactment accumulated capital loss carryforwards.
MSF-21
Metropolitan Series Fund
MetLife Mid Cap Stock Index Portfolio
Report of Independent Registered Public Accounting Firm
To the Shareholders of the MetLife Mid Cap Stock Index Portfolio and Board of Trustees of Metropolitan Series Fund:
We have audited the accompanying statement of assets and liabilities, including the schedule of investments, of MetLife Mid Cap Stock Index Portfolio, one of the portfolios constituting Metropolitan Series Fund, (the “Trust”) as of December 31, 2013, and the related statement of operations for the year then ended, the statements of changes in net assets for each of the two years in the period then ended, and the financial highlights for each of the five years in the period then ended. These financial statements and financial highlights are the responsibility of the Trust’s management. Our responsibility is to express an opinion on these financial statements and financial highlights based on our audits.
We conducted our audits in accordance with the standards of the Public Company Accounting Oversight Board (United States). Those standards require that we plan and perform the audit to obtain reasonable assurance about whether the financial statements and financial highlights are free of material misstatement. The Trust is not required to have, nor were we engaged to perform, an audit of its internal control over financial reporting. Our audits included consideration of internal control over financial reporting as a basis for designing audit procedures that are appropriate in the circumstances, but not for the purpose of expressing an opinion on the effectiveness of the Trust’s internal control over financial reporting. Accordingly, we express no such opinion. An audit also includes examining, on a test basis, evidence supporting the amounts and disclosures in the financial statements, assessing the accounting principles used and significant estimates made by management, as well as evaluating the overall financial statement presentation. Our procedures included confirmation of securities owned as of December 31, 2013, by correspondence with the custodian and brokers; where replies were not received from brokers, we performed other auditing procedures. We believe that our audits provide a reasonable basis for our opinion.
In our opinion, the financial statements and financial highlights referred to above present fairly, in all material respects, the financial position of the MetLife Mid Cap Stock Index Portfolio of Metropolitan Series Fund, as of December 31, 2013, the results of its operations for the year then ended, the changes in its net assets for each of the two years in the period then ended, and the financial highlights for each of the five years in the period then ended, in conformity with accounting principles generally accepted in the United States of America.
Deloitte & Touche LLP
Boston, Massachusetts
February 26, 2014
MSF-22
Metropolitan Series Fund
Trustees and Officers of Metropolitan Series Fund
The Trustees and executive officers of the Trust, their ages and their principal occupations during the past five years are set forth below. Unless otherwise indicated, the business address of each is One Financial Center, Boston, MA 02111. Each Trustee who is deemed an “interested person,” as such term is defined in the 1940 Act, is indicated by an asterisk. Those Trustees who are not “interested persons” as defined in the 1940 Act are referred to as “Independent Trustees.” Additional information about the Trustees is available in the Statement of Additional Information, which is available without charge, upon request, by calling (800) 848-3854.
Trustees of the Trust
| | | | | | | | | | |
Name and Age | | Position(s)
Held with
Registrant | | Term of Office
and Length of
Time Served | | Principal Occupation(s) During the Past 5
Years(1) | | Number of
Portfolios
in Fund
Complex(2)
overseen | | Other Directorships Held
by Trustee During the
Past 5 Years(1) |
| Interested Trustee | | | | | | | | | | |
| Elizabeth M. Forget* (47) | | Trustee, Chairman of the Board, President and Chief Executive Officer | | Indefinite;
From
May
2006
(President
and Chief
Executive
Officer)/
August
2006
(Trustee
and
Chairman
of the
Board) to
present | | Senior Vice President, MetLife Inc.; President, MetLife Advisers, LLC and a predecessor company. | | 79 | | Trustee, Met Investors Series Trust (the “MIST Trust”);** various MetLife-affiliated boards. |
| | | | | |
| Independent Trustees | | | | | | | | | | |
| Stephen M. Alderman (54) | | Trustee | | Indefinite;
From
April
2012 to
present | | Shareholder in the law firm of Garfield & Merel, Ltd. | | 79 | | Trustee, MIST Trust;** Director, International Truck Leasing Corp. |
| | | | | |
| Robert J. Boulware (57) | | Trustee | | Indefinite;
From
April
2012 to
present | | Managing Director, Pilgrim Funds, LLC (private equity fund). | | 79 | | Trustee, MIST Trust;** Trustee, Vertical Capital Income Fund (closed-end fund); Director, Gainsco, Inc. (auto insurance). |
| | | | | |
| Susan C. Gause (61) | | Trustee | | Indefinite;
From
April
2012 to
present | | Private Investor. | | 79 | | Trustee, MIST Trust;** Trustee, HSBC Funds. |
| | | | | |
| Nancy Hawthorne (62) | | Trustee | | Indefinite;
From
May
2003 to
present | | Chief Executive Officer, Clerestory LLC (corporate advisor). | | 79 | | MIST Trust;** Director, THL Credit, Inc.**; Director, Avid Technology, Inc.** |
| | | | | |
| Barbara A. Nugent (57) | | Trustee | | Indefinite;
From
January
2014 to
present | | President, True North Board Governance, LLC (consulting); until 2014, partner in the law firm of Stradley Ronon Stevens & Young, LLP. | | 79 | | Trustee, MIST Trust**; Director, Episcopal Healthcare Foundation; until 2014, member, Mutual Fund Directors Forum Advisory Board. |
MSF-23
Metropolitan Series Fund
Trustees and Officers of Metropolitan Series Fund—(Continued)
| | | | | | | | | | |
Name and Age | | Position(s)
Held with
Registrant | | Term of Office
and Length of
Time Served | | Principal Occupation(s) During the Past 5
Years(1) | | Number of
Portfolios
in Fund
Complex(2)
overseen | | Other Directorships Held
by Trustee During the
Past 5 Years(1) |
| Keith M. Schappert (62) | | Trustee | | Indefinite;
From
August
2009 to
present | | Principal, Schappert Consulting LLC (asset management consulting). | | 79 | | Trustee, MIST Trust;** Director, The Commonfund for Nonprofit Organizations; until 2011, Director, Trilogy Global Advisors; Director, Mirae Asset Discovery Funds,** Director, Calamos Investments. |
| | | | | |
| Linda B. Strumpf (66) | | Trustee | | Indefinite;
From
May
2000 to
present | | Chair of the Investment Committee, Leona M. and Harry B. Helmsley Charitable Trust; until 2011, Chief Investment Officer, Leona M. and Harry B. Helmsley Charitable Trust. | | 79 | | Since 2012, Trustee, MIST Trust,** Trustee and Member of Investment Committee, The Pennsylvania State University. |
| | | | | |
| Dawn M. Vroegop (47) | | Trustee | | Indefinite;
From
May
2009 to
present | | Private Investor. | | 79 | | Trustee, MIST Trust,** Trustee, Driehaus Mutual Funds; Director and Investment Committee Chair, City College of San Francisco Foundation. |
Executive Officers of the Trust
| | | | | | |
Name and Age | | Position(s) Held with
Registrant | | Term of Office
and Length of
Time Served | | Principal Occupation(s) During Past 5 Years(1) |
| Elizabeth M. Forget (47) | | President, Chief Executive Officer, Trustee and Chairman of the Board | | From May
2006 (President
and Chief
Executive
Officer)/
August 2006
(Trustee and
Chairman of
the Board) to
present | | See principal occupation information in the table above. |
| | | |
| Jeffrey L. Bernier (42) | | Vice President | | From February
2008 to present | | Vice President, MetLife, Inc.; Senior Vice President, MetLife Advisers, LLC and a predecessor company. |
| | | |
| Peter H. Duffy (58) | | Chief Financial Officer and Treasurer | | From November
2000 to present | | Senior Vice President, MetLife Advisers, LLC; Vice President, MetLife, Inc. |
| | | |
| Andrew L. Gangolf (59) | | Secretary | | From May
2011to present | | Senior Vice President, MetLife Advisers, LLC; Senior Vice President & Assistant General Counsel, AllianceBerstein Investments, Inc. |
| | | |
| Jeffrey P. Halperin (46) | | Chief Compliance Officer | | From November
2005 to present | | Vice President, MetLife, Inc.; Chief Compliance Officer, MIST; Chief Compliance Officer, MSF Trust; Chief Compliance Officer, MetLife Advisers, LLC and a predecessor company; Chief Compliance Officer, MetLife Investment Management, LLC (formerly MetLife Investment Advisors Company, LLC). |
| | | |
| Alan C. Leland, Jr. (61) | | Vice President | | From February
2005 to present | | Treasurer and Chief Financial Officer, MetLife Advisers, LLC; Vice President, MetLife Group Inc.; Vice President, MetLife, Inc. |
| * | Ms. Forget is an “interested person” of the Trust because of her positions with MetLife Advisers, LLC and her ownership of securities issued by MetLife, Inc., the ultimate parent company of MetLife Advisers, LLC. |
| ** | Indicates a directorship with a registered investment company or a company subject to the reporting requirements of the Securities Exchange Act of 1934, as amended. |
| (1) | Previous positions during the past five years with the Trust, MetLife, Inc. or the Adviser are omitted if not materially different. |
| (2) | The Fund Complex includes 49 Portfolios of the MIST Trust and 30 Portfolios of the Trust. |
MSF-24
Metropolitan Series Fund
MetLife Mid Cap Stock Index Portfolio
Board of Trustees’ Consideration of Advisory and Sub-Advisory Agreements
At an in-person meeting of the Boards of Trustees (the “Board”) of Met Investors Series Trust and Metropolitan Series Fund (“MIST” and “MSF,” respectively, and collectively, the “Trusts”) held on November 19-20, 2013, the Board, including a majority of the Trustees who are not considered to be “interested persons” of the Trusts (the “Independent Trustees”) under the Investment Company Act of 1940, as amended (the “1940 Act”), approved for an annual period the continuation of each Trust’s advisory agreement (the “Advisory Agreement”) with MetLife Advisers, LLC (the “Adviser”) and the applicable sub-advisory agreements (each a “Sub-Advisory Agreement,” and collectively with the Advisory Agreement, the “Agreements”) between the Adviser and the investment sub-advisers (each a “Sub-Adviser,” and collectively, the “Sub-Advisers”) for each of the series of the Trusts, including the MetLife Mid Cap Stock Index Portfolio (each a “Portfolio,” and collectively, the “Portfolios”).1
In considering the Agreements, the Board reviewed a variety of materials provided by the Adviser and the Sub-Advisers relating to the Portfolios, including comparative performance, fee and expense information for an appropriate peer group of similar mutual funds, performance information for relevant benchmark indices and other information regarding the nature, extent and quality of services provided by the Adviser and the Sub-Advisers under their respective Agreements. The Board also took into account its experience with the Adviser and the Sub-Advisers and information provided to the Board in its meetings throughout the year with respect to the services provided by the Adviser and the Sub-Advisers, including quarterly performance reports prepared by management containing reviews of investment results, and periodic presentations from certain of the Sub-Advisers with respect to the Portfolios they manage. The Independent Trustees also assessed reports provided by the Board’s independent consultant, who reviewed and provided analyses regarding investment performance, fees and expenses, and other information provided by, or at the direction of, the Adviser and the Sub-Advisers, as more fully discussed below.
The Independent Trustees were separately advised by independent legal counsel throughout the process, and met with independent legal counsel in periodic executive sessions. Prior to voting to continue the Agreements at the November meeting, the Independent Trustees also received a memorandum from their independent counsel discussing the legal standards for their consideration of the proposed continuation of the Agreements. The Board also met in person with personnel of the Adviser on September 17, 2013 for the specific purpose of giving preliminary consideration to the proposed continuation of the Agreements and to request additional information they considered reasonably necessary to their deliberations. The Independent Trustees also discussed the proposed continuation of the Agreements in private sessions with their independent legal counsel at which no representatives of management were present.
In considering whether to approve the renewal of the Advisory Agreement with the Adviser and any applicable Sub-Advisory Agreements with respect to a Portfolio, the Board reviewed and analyzed the factors it deemed relevant, including: (1) the nature, extent and quality of the services to be provided to the Portfolios by the Adviser and the Sub-Advisers; (2) the performance of the Portfolios as compared to a peer group and an appropriate index; (3) the Adviser’s and each of the Sub-Adviser’s personnel and operations; (4) the financial condition of the Adviser and of the Sub-Advisers; (5) the level and method of computing each Portfolio’s advisory and sub-advisory fees; (6) the profitability of the Adviser under the Advisory Agreement and of certain of the Sub-Advisers under the Sub-Advisory Agreements; (7) any “fall-out” benefits to the Adviser, the Sub-Advisers and their affiliates (i.e., ancillary benefits realized by the Adviser, the Sub-Advisers or their affiliates from the Adviser’s or Sub-Advisers’ relationship with the Trusts); (8) the anticipated effect of growth in size on Portfolio expenses; (9) fees paid to certain of the Sub-Advisers by comparable institutional and retail accounts; and (10) possible conflicts of interest.
Nature, extent and quality of services. The Board evaluated the nature, extent and quality of the services that the Adviser, and the Sub-Advisers as relevant, have provided to the Portfolios. The Board considered the Adviser’s services as investment manager to the Portfolios, including services relating to the selection and oversight of the Sub-Advisers for the applicable Portfolios. The Board considered, among other things, the Adviser’s oversight of the provision of services to the Portfolios by the Sub-Advisers, including with respect to investment activities and trading practices, and the Sub-Adviser’s compliance with fund policies, objectives and Board directives, compliance policies and procedures and applicable law. The Adviser’s services in coordinating and overseeing the activities of the Trusts’ other service providers were also considered. The Board also evaluated the expertise and performance of the personnel of the Adviser who performed services for the Portfolios throughout the year.
The Board considered information received from the Trust’s Chief Compliance Officer (“CCO”) regarding the Portfolios’ compliance policies and procedures established pursuant to Rule 38a-l under the 1940 Act. The Board also evaluated the CCO’s ongoing reports concerning the CCO’s oversight of the risk assessment processes of the Sub-Advisers.
1 The Pyramis Managed Risk Portfolio recently commenced operations and, therefore, the Agreement with respect to this Portfolio was not up for renewal.
MSF-25
Metropolitan Series Fund
MetLife Mid Cap Stock Index Portfolio
Board of Trustees’ Consideration of Advisory and Sub-Advisory Agreements—(Continued)
With respect to the services provided by each of the Sub-Advisers, the Board considered, among other things, information provided to the Board by each Sub-Adviser. The Board considered the Sub-Adviser’s current level of staffing and its overall resources, as well as its compensation program. The Board reviewed each Sub-Adviser’s history and investment experience, as well as information regarding the qualifications, background and responsibilities of the Sub-Adviser’s investment and compliance personnel who provide services to the Portfolios. The Board also considered, among other things, the Sub-Adviser’s compliance program and any disciplinary history. The Board also took into account the Sub-Adviser’s risk assessment and monitoring process. The Board noted each Sub-Adviser’s regulatory history, including whether it was currently involved in any regulatory actions or investigations as well as material litigation, and any settlements and amelioratory actions undertaken, as appropriate. The Board also noted that the CCO and his staff conduct regular, periodic compliance reviews with each of the Sub-Advisers and present reports to the Independent Trustees regarding the same, which includes evaluating the regulatory compliance systems of the Sub-Advisers and procedures reasonably designed by them to help assure compliance with the federal securities laws, including issues related to late trading and market timing, best execution, fair value pricing, and proxy voting procedures, among others. The Board also took into account the financial condition of each Sub-Adviser. In its review, the Board also received and took into account information regarding any services and/or payments provided to the Adviser by the Sub-Advisers in connection with marketing activities.
The Board considered each Sub-Adviser’s investment process and philosophy. The Board took into account that each Sub-Adviser’s responsibilities include the development and maintenance of an investment program for the applicable Portfolio which is consistent with the Portfolio’s investment objectives, the selection of investment securities and the placement of orders for the purchase and sale of such securities, as well as the implementation of compliance controls related to performance of these services. The Board also reviewed each Sub-Adviser’s brokerage policies and practices.
Performance. The Board considered the performance of the Portfolios as described in the quarterly reports prepared by management, and as also analyzed in reports prepared by the Independent Trustees’ independent consultant. The Board noted that the Adviser reviews with the Board on a quarterly basis detailed information about the Portfolios’ performance results, portfolio composition and investment strategies. The Board also reviewed and considered a separate report prepared by Lipper Inc. (“Lipper”), an independent third party, which provided a statistical analysis comparing the Portfolios’ investment performance, expenses, and fees to comparable funds underlying variable insurance products (the “Performance Universe”). In addition, the Independent Trustees met separately with a representative of Bobroff Consulting, Inc., an independent consultant (“Bobroff), at a special board meeting in September 2013, to review the separate reports prepared by such consultant (“Bobroff Report”), which analyzed the report prepared by Lipper. The Board also considered each Portfolio’s more recent performance subsequent to the performance period covered by the Lipper reports, and management’s discussion of the same, including the effect of current market conditions on each Portfolio’s more recent performance.
The Board reviewed the Portfolios’ performance records and the Adviser’s and Sub-Advisers’ management styles and long-term performance records with the Portfolios and comparable funds. The Board focused particular attention on Portfolios with less favorable performance records. The Board was mindful of the Adviser’s focus on each Sub-Adviser’s performance and noted that the Adviser has been active in monitoring and responding to any performance issues with respect to the Portfolios. The Board also took into account its discussions with management regarding factors that contributed to the performance of the Portfolios.
Among other data relating specifically to the MetLife Mid Cap Stock Index Portfolio’s performance, the Board considered that the Portfolio outperformed the median of its Performance Universe and its Lipper Index for the one-, three- and five-year periods ended June 30, 2013. The Board further considered that the Portfolio underperformed its benchmark, the S&P 400 Index, for the one-, three- and five-year periods ended October 31, 2013.
Fees and Expenses. The Board gave consideration to the advisory fees payable under the Advisory Agreement and the sub-advisory fees payable under each of the Sub-Advisory Agreements. In this regard, the Board reviewed the advisory fees payable on a Portfolio-by- Portfolio basis based on information provided by the Adviser. The Independent Trustees, with the assistance of Bobroff, also examined the fees paid by a Portfolio in light of fees paid to other investment managers by comparable funds, as well as considered the fees charged by the Adviser to manage other comparable funds, as applicable. The Lipper report included comparisons of the Adviser’s fee schedule with that of its peers based on an asset-based analysis of relative fee structures according to the size of the Portfolio. In addition, the Board considered the Portfolios’ advisory and sub-advisory fees and total expenses as compared to similarly situated investment companies underlying variable insurance products deemed to be comparable to the Portfolios as determined by Lipper. The Board considered a Portfolio’s ranking within a smaller group of peer funds chosen by Lipper (the “Expense Group”), as well as the Portfolio’s ranking within broader groups of funds (the “Expense Universe” and the “Sub-advised Expense Universe”). The Board also considered a Portfolio’s contractual sub-advisory fees, as applicable, as compared to the Sub-advised Expense Universe as well as a
MSF-26
Metropolitan Series Fund
MetLife Mid Cap Stock Index Portfolio
Board of Trustees’ Consideration of Advisory and Sub-Advisory Agreements—(Continued)
smaller group of funds (the “Sub-advised Expense Group”). In comparing a Portfolio’s actual and contractual management fee to that of comparable funds, the Board noted that such fee includes both advisory and administrative fees.
The Board noted that the sub-advisory fees for the Portfolios are paid by the Adviser, not the Portfolios, out of the advisory fee. It was further noted that the Adviser negotiates such fees at arm’s length. The Board also considered that the Adviser had entered into expense limitation agreements with certain of the Portfolios, pursuant to which the Adviser has agreed to waive a portion of its advisory fee and/or reimburse certain expenses as a means of limiting a Portfolio’s total annual operating expenses. The Board further considered the amount of sub-advisory fees paid out by the Adviser and the amount of the management fees that it retained in light of the services performed by Sub-Advisers and Adviser, respectively.
With respect to the MetLife Mid Cap Stock Index Portfolio, the Board considered that the Portfolio’s actual management fees and total expenses (exclusive of 12b-1 fees) were below the Expense Group median, Expense Universe median and Sub-advised Expense Universe median. The Board further noted that the Portfolio’s contractual management fees were below the asset-weighted average of the Expense Group at the Portfolio’s current size. The Board also took into account that the Portfolio’s contractual sub-advisory fees were below the average of the Sub-advised Expense Group and the Sub-advised Expense Universe at the Portfolio’s current size. The Board further considered that the Adviser had waived fees and/or reimbursed expenses during the past year.
Profitability. The Board examined the profitability of the Adviser on a Portfolio-by-Portfolio basis. The Board also considered that the Distributor, MetLife Investors Distribution Company, receives Rule 12b-1 payments to support the distribution of the products. The Board considered the profitability to the Sub-Advisers and their affiliates as a result of their relationships with the Portfolios, and the Board considered the ability of the Adviser to negotiate the Sub-Advisory Agreements and the fees thereunder at arm’s length. The Board also reviewed Portfolio specific data with regard to the profitability of the Portfolios to each Sub-Adviser, as available.
Economies of scale. The Board also considered the effect of the Portfolios’ growth in size on their fees. The Board noted that the fee schedules for most of the Portfolios contain breakpoints that reduce the fee rate above specified asset levels. The Board noted those Portfolios that did not contain breakpoints in the advisory fee and took into account management’s discussion of the same. The Board noted that those Portfolios with advisory fee schedules containing breakpoints generally reflect the inclusion of breakpoints in the sub-advisory fee schedule for such Portfolios. The Board considered the effective fees under the Advisory Agreement for a Portfolio as a percentage of assets at different asset levels and possible economies of scale that may be realized if the assets of the Portfolio grow. Among other data, the Board examined the effect of a Portfolio’s growth in size on various fee schedules and reviewed the Lipper and Bobroff Reports, which compared fees among peers. The Board also generally noted that if a Portfolio’s assets increase over time, the Portfolio may realize other economies of scale if assets increase proportionally more than certain other fixed expenses. In addition, the Board noted that the Adviser had taken a number of steps to date intended to share the benefits of economies of scale with contractholders.
With respect to the MetLife Mid Cap Stock Index Portfolio, the Board noted that the Portfolio’s advisory fee does not contain breakpoints. The Board noted that the Portfolio’s contractual management fees were below the asset-weighted average of comparable funds at all asset levels. The Board considered the effect of the Portfolio’s current size and potential growth on its performance and fees. The Board noted management’s discussion of the Portfolio’s advisory fee structure. The Board also noted that if the Portfolio’s assets increased over time, the Portfolio might realize other economies of scale if assets increased proportionally more than certain other fixed expenses.
Other factors. As part of its evaluation of the Adviser’s compensation, the Board considered other benefits that may be realized by the Adviser and its affiliates from their relationship with the Trusts. Among them, the Board recognized that an affiliate of the Adviser, MetLife Investors Distribution Company, serves as the Distributor for the Trusts, and, as such, receives payments pursuant to Rule 12b-1 from the Portfolios to compensate it for providing shareholder services and selling activities, which could lead to growth in the Trusts’ assets and corresponding benefits from such growth, including economies of scale. The Board also considered that affiliates of the Adviser may benefit from certain indirect tax benefits relating to dividend received deductions and foreign tax credits. In conjunction with these considerations, the Board noted the costs of providing investment management and other services to the Portfolios and the ongoing commitment of the Adviser to the Portfolios.
The Board considered other benefits that may be realized by each Sub-Adviser and its affiliates from their relationship with the Trusts, including the opportunity to provide advisory services to additional portfolios of the Trusts and reputational benefits. In conjunction with these considerations, the Board noted the costs of providing investment advisory services to the Portfolios and the ongoing commitment of the Sub-Advisers to the Portfolios.
MSF-27
Metropolitan Series Fund
MetLife Mid Cap Stock Index Portfolio
Board of Trustees’ Consideration of Advisory and Sub-Advisory Agreements—(Continued)
The Board considered possible conflicts of interest in the form of material benefits or detriments to the Trusts resulting from the nature of the Trusts’ and the Adviser’s or the Sub-Advisers’ affiliations and the services that are provided to the Trusts, and the manner in which such conflicts were mitigated.
Conclusions. After full consideration of the factors discussed above, the Board, including a majority of the Independent Trustees, approved the Advisory Agreement and the Sub-Advisory Agreement, as applicable, with respect to each Portfolio, unless otherwise noted. In making its approvals, the Board concluded that the nature, extent and quality of services provided by the Adviser and each Sub-Adviser supported the renewal of the Agreements. The Board also concluded that the investment performance of each Fund was such that each Agreement should continue. In addition, the Board concluded that fees paid by a Portfolio to the Adviser and, if applicable, the Sub-Adviser appeared to be acceptable in light of nature, extent and quality of the services provided by the Adviser and Sub-Adviser. Further, the Board concluded that the Adviser’s profitability in providing services under the Advisory Agreements did not appear unreasonably high in light of the nature, extent and quality of the services provided by the Adviser. Finally, the Board concluded that the Advisory and Sub-Advisory fees in some measure share economies of scale with contractholders. In approving the renewal of each of the Agreements, the Board, including the Independent Trustees, did not identify any single factor as controlling, and generally attributed different weights to various factors for the various Portfolios. The Board evaluated all information available to them on a Portfolio-by-Portfolio basis, and their decisions were made separately with respect to each Portfolio.
MSF-28
Metropolitan Series Fund
MetLife Stock Index Portfolio
Managed by MetLife Investment Management, LLC
Portfolio Manager Commentary*
PERFORMANCE
For the one year period ended December 31, 2013, the Class A, B, D, and E shares of the MetLife Stock Index Portfolio returned 32.02%, 31.70%, 31.91%, and 31.83%, respectively. The Portfolio’s benchmark, the Standard & Poor’s (“S&P”) 500 Index1, returned 32.39%.
MARKET ENVIRONMENT / CONDITIONS
Equity indexes reached record highs in 2013, driven by central bank intervention and an improving economy. The year started on a positive note as U.S. lawmakers reached agreements on the fiscal cliff and debt ceiling, and earnings data was generally positive. The markets were further supported by rate cuts by the European Central Bank (the “ECB”), the Reserve Bank of Australia, the Bank of Korea, and the Bank of Israel. Despite fears that the Federal Reserve (the “Fed”) would begin tapering asset purchases and end quantitative easing, the markets continued to climb higher on better than expected macroeconomic data, including U.S. jobless claims, payrolls, and factory orders. Headwinds during the year included increased tensions in Syria and Egypt and a U.S. government shutdown following the failure of U.S. lawmakers to reach an agreement in budget negotiations. However, equity markets ended the year at their highs, as the ECB announced an unexpected rate cut, a tentative nuclear deal with Iran was negotiated, and investors continued to be optimistic that central banks would continue their easy monetary policy after Fed Chairman nominee Janet Yellen’s testimony in front of Congress was more dovish than expected.
During the year, the Federal Open Market Committee (the “Committee”) met eight times and maintained the target range for the Federal Funds Rate at zero to 0.25%. The Committee stated that economic activity was expanding at a moderate pace, labor market conditions have continued to improve, and the unemployment rate had declined but remained elevated. The Committee noted that the risks to the outlook for the economy and the labor market have become more balanced. Subsequently, the Committee decided to modestly reduce the pace of its asset purchases from $85 billion per month to $75 billion per month.
All ten sectors comprising the S&P 500 Index experienced positive returns for the year. Consumer Discretionary (11.5% beginning weight in the benchmark), up 43.0%, and Health Care (12.0% beginning weight), up 41.4%, were the best-performing sectors. The worst relative-performing sectors were Telecom Services (3.1% beginning weight), up 11.5%, and Utilities (3.4% beginning weight), up 13.2%.
The stocks with the largest positive impact on the benchmark return for the year were Google, up 58.0%, Microsoft, up 44.3%, and General Electric, up 37.9%. The stocks with the largest negative impact were Newmont Mining, down 48.5%, Intuitive Surgical, down 21.7%, and CenturyLink, down 13.2%.
PORTFOLIO REVIEW / PERIOD END POSITIONING
The Portfolio is managed utilizing a full replication strategy versus the S&P 500 Index. This strategy seeks to track the performance of the Index by owning all of the components of the Index at their respective Index capitalization weights. The Portfolio is periodically rebalanced for compositional changes in the S&P 500 Index. Factors that impact tracking error include transaction costs, cash drag, securities lending, NAV rounding, and sales and redemptions of Portfolio shares.
Stacey Lituchy
Norman Hu
Mirsad Usejnoski
Portfolio Managers
MetLife Investment Management, LLC
* This commentary may include statements that constitute “forward-looking statements” under the U.S. securities laws. Forward-looking statements include, among other things, projections, estimates, and information about possible or future results related to the Portfolio, market or regulatory developments. The views expressed above are not guarantees of future performance or economic results and involve certain risks, uncertainties and assumptions that could cause actual outcomes and results to differ materially from the views expressed herein. The views expressed above are subject to change at any time based upon economic, market, or other conditions and the subadvisory firm undertakes no obligation to update the views expressed herein. Any discussions of specific securities should not be considered a recommendation to buy or sell those securities. The views expressed above (including any forward-looking statement) may not be relied upon as investment advice or as an indication of the Portfolio’s trading intent. Information about the Portfolio’s holdings, asset allocation or country diversification is historical and is not an indication of future Portfolio composition, which may vary. Direct investment in any index is not possible. The performance of any index mentioned in this commentary has not been adjusted for ongoing management, distribution and operating expenses, and sales charges applicable to mutual fund investments. In addition, the returns do not reflect additional fees charged by separate accounts or variable insurance contracts that an investor in the Portfolio may pay. If these additional fees were reflected, performance would have been lower.
MSF-1
Metropolitan Series Fund
MetLife Stock Index Portfolio
A $10,000 INVESTMENT COMPARED TO THE S&P 500 INDEX
AVERAGE ANNUAL RETURNS (%) (FOR THE YEAR ENDED DECEMBER 31, 2013)
| | | | | | | | | | | | | | | | |
| | | 1 Year | | | 5 Year | | | 10 Year | | | Since Inception2 | |
| MetLife Stock Index Portfolio | | | | | | | | | | | | | | | | |
Class A | | | 32.02 | | | | 17.67 | | | | 7.15 | | | | — | |
Class B | | | 31.70 | | | | 17.37 | | | | 6.88 | | | | — | |
Class D | | | 31.91 | | | | — | | | | — | | | | 20.03 | |
Class E | | | 31.83 | | | | 17.48 | | | | 6.98 | | | | — | |
| S&P 500 Index | | | 32.39 | | | | 17.94 | | | | 7.41 | | | | — | |
1 The Standard & Poor’s 500 Index is an unmanaged index representing the performance of 500 major companies, most of which are listed on the New York Stock Exchange.
2 Inception dates of the Class A, Class B, Class D, and Class E shares are 5/1/90, 1/2/01, 4/28/09, and 5/1/01, respectively.
Portfolio performance is calculated including reinvestment of all income and capital gain distributions. Performance numbers are net of all Portfolio expenses but do not include any insurance, sales, separate account or administrative charges of variable annuity or life insurance contracts or any additional expenses that participants may bear relating to the operations of their plans. If these charges were included, the returns would be lower. The performance of any index referenced above has not been adjusted for ongoing management, distribution and operating expenses, and sales charges applicable to mutual fund investments. Direct investment in any index is not possible. The performance of Class A shares, as set forth in the line graph above, will differ from that of other classes because of the difference in expenses paid by policyholders investing in the different share classes.
This information represents past performance and is not indicative of future results. Investment return and principal value may fluctuate so that shares, upon redemption, may be worth more or less than the original cost.
PORTFOLIO COMPOSITION AS OF DECEMBER 31, 2013
Top Holdings
| | | | |
| | | % of
Net Assets | |
| Apple, Inc. | | | 3.0 | |
| Exxon Mobil Corp. | | | 2.7 | |
| Google, Inc.—Class A | | | 1.9 | |
| Microsoft Corp. | | | 1.7 | |
| General Electric Co. | | | 1.7 | |
| Johnson & Johnson | | | 1.6 | |
| Chevron Corp. | | | 1.4 | |
| Procter & Gamble Co. (The) | | | 1.3 | |
| JPMorgan Chase & Co. | | | 1.3 | |
| Wells Fargo & Co. | | | 1.3 | |
Top Sectors
| | | | |
| | | % of
Market Value of
Total Investments | |
| Information Technology | | | 18.6 | |
| Financials | | | 16.5 | |
| Health Care | | | 12.9 | |
| Consumer Discretionary | | | 12.5 | |
| Industrials | | | 10.9 | |
| Energy | | | 10.2 | |
| Consumer Staples | | | 9.7 | |
| Materials | | | 3.5 | |
| Utilities | | | 2.9 | |
| Telecommunication Services | | | 2.3 | |
MSF-2
Metropolitan Series Fund
MetLife Stock Index Portfolio
Understanding Your Portfolio’s Expenses
Shareholder Expense Example
As a shareholder of the Portfolio, you incur ongoing costs, including management fees; distribution and service (12b-1) fees; and other Portfolio expenses. This example is intended to help you understand your ongoing costs (in dollars) (referred to as “expenses”) of investing in the Portfolio and compare these costs with the ongoing costs of investing in other mutual funds. The example is based on an investment of $1,000 invested at the beginning of the period and held for the entire period, July 1, 2013 through December 31, 2013.
Actual Expenses
The first line for each share class of the Portfolio in the table below provides information about actual account values and actual expenses. You may use the information in this line, together with the amount you invested in the particular share class of the Portfolio, to estimate the expenses that you paid over the period. Simply divide your account value by $1,000 (for example, an $8,600 account value divided by $1,000 = 8.6), then multiply the result by the number in the first line under the heading entitled “Expenses Paid During Period” to estimate the expenses you paid on your account during this period.
Hypothetical Example for Comparison Purposes
The second line for each share class of the Portfolio in the table below provides information about hypothetical account values and hypothetical expenses based on the Portfolio’s actual expense ratio and an assumed rate of return of 5% per year before expenses, which is not the Portfolio’s actual return. The hypothetical account values and expenses may not be used to estimate the actual ending account balance or expenses you paid for the period. You may use this information to compare the ongoing costs of investing in the Portfolio and other funds. To do so, compare this 5% hypothetical example with the 5% hypothetical examples that appear in the shareholder reports of the other funds.
Please note that the expenses shown in the table are meant to highlight your ongoing costs only and do not reflect any fees or charges of your variable insurance product or any additional expenses that participants in certain eligible qualified plans may bear relating to the operations of their plan. Therefore, the second line for each share class in the table is useful in comparing ongoing costs only, and will not help you determine the relative total costs of owning different funds. In addition, if these other costs were included, your costs would have been higher.
| | | | | | | | | | | | | | | | | | |
MetLife Stock Index Portfolio | | | | Annualized
Expense
Ratio | | | Beginning
Account Value
July 1,
2013 | | | Ending
Account Value
December 31,
2013 | | | Expenses Paid
During Period**
July 1, 2013
to
December 31,
2013 | |
Class A(a) | | Actual | | | 0.26 | % | | $ | 1,000.00 | | | $ | 1,161.50 | | | $ | 1.42 | |
| | Hypothetical* | | | 0.26 | % | | $ | 1,000.00 | | | $ | 1,023.90 | | | $ | 1.33 | |
| | | | | |
Class B(a) | | Actual | | | 0.51 | % | | $ | 1,000.00 | | | $ | 1,159.90 | | | $ | 2.78 | |
| | Hypothetical* | | | 0.51 | % | | $ | 1,000.00 | | | $ | 1,022.64 | | | $ | 2.60 | |
| | | | | |
Class D(a) | | Actual | | | 0.36 | % | | $ | 1,000.00 | | | $ | 1,161.10 | | | $ | 1.96 | |
| | Hypothetical* | | | 0.36 | % | | $ | 1,000.00 | | | $ | 1,023.39 | | | $ | 1.84 | |
| | | | | |
Class E(a) | | Actual | | | 0.41 | % | | $ | 1,000.00 | | | $ | 1,160.40 | | | $ | 2.23 | |
| | Hypothetical* | | | 0.41 | % | | $ | 1,000.00 | | | $ | 1,023.14 | | | $ | 2.09 | |
* Hypothetical assumes a rate of return of 5% per year before expenses.
** Expenses paid are equal to the Portfolio’s annualized expense ratio for the most recent six month period, as shown above, multiplied by the average account value over the period, multiplied by the number of days (184 days) in the most recent fiscal half-year, divided by 365 (to reflect the one-half year period).
(a) The annualized expense ratio shown reflects the impact of the management fee waiver as described in Note 6 of the Notes to Financial Statements.
MSF-3
Metropolitan Series Fund
MetLife Stock Index Portfolio
Schedule of Investments as of December 31, 2013
Common Stocks—99.0% of Net Assets
| | | | | | | | |
| Security Description | | Shares | | | Value | |
|
Aerospace & Defense—2.7% | |
Boeing Co. (The) | | | 265,166 | | | $ | 36,192,507 | |
General Dynamics Corp. | | | 128,333 | | | | 12,262,218 | |
Honeywell International, Inc. | | | 300,966 | | | | 27,499,264 | |
L-3 Communications Holdings, Inc. | | | 33,993 | | | | 3,632,492 | |
Lockheed Martin Corp. | | | 103,199 | | | | 15,341,563 | |
Northrop Grumman Corp. | | | 85,146 | | | | 9,758,583 | |
Precision Castparts Corp. | | | 55,714 | | | | 15,003,780 | |
Raytheon Co. | | | 122,535 | | | | 11,113,925 | |
Rockwell Collins, Inc. | | | 51,825 | | | | 3,830,904 | |
Textron, Inc. | | | 107,836 | | | | 3,964,051 | |
United Technologies Corp. | | | 323,788 | | | | 36,847,075 | |
| | | | | | | | |
| | | | | | | 175,446,362 | |
| | | | | | | | |
|
Air Freight & Logistics—0.8% | |
C.H. Robinson Worldwide, Inc. (a) | | | 58,160 | | | | 3,393,054 | |
Expeditors International of Washington, Inc. | | | 78,851 | | | | 3,489,157 | |
FedEx Corp. | | | 114,163 | | | | 16,413,215 | |
United Parcel Service, Inc. - Class B | | | 274,177 | | | | 28,810,519 | |
| | | | | | | | |
| | | | | | | 52,105,945 | |
| | | | | | | | |
|
Airlines—0.2% | |
Delta Air Lines, Inc. | | | 328,149 | | | | 9,014,253 | |
Southwest Airlines Co. | | | 267,231 | | | | 5,034,632 | |
| | | | | | | | |
| | | | | | | 14,048,885 | |
| | | | | | | | |
|
Auto Components—0.4% | |
BorgWarner, Inc. | | | 87,280 | | | | 4,879,825 | |
Delphi Automotive plc | | | 107,404 | | | | 6,458,203 | |
Goodyear Tire & Rubber Co. (The) | | | 94,698 | | | | 2,258,547 | |
Johnson Controls, Inc. | | | 262,735 | | | | 13,478,305 | |
| | | | | | | | |
| | | | | | | 27,074,880 | |
| | | | | | | | |
|
Automobiles—0.7% | |
Ford Motor Co. | | | 1,512,909 | | | | 23,344,186 | |
General Motors Co. (b) | | | 436,853 | | | | 17,854,182 | |
Harley-Davidson, Inc. | | | 84,807 | | | | 5,872,037 | |
| | | | | | | | |
| | | | | | | 47,070,405 | |
| | | | | | | | |
|
Beverages—2.1% | |
Beam, Inc. | | | 62,546 | | | | 4,256,881 | |
Brown-Forman Corp. - Class B | | | 62,148 | | | | 4,696,524 | |
Coca-Cola Co. (The) | | | 1,456,625 | | | | 60,173,179 | |
Coca-Cola Enterprises, Inc. | | | 92,616 | | | | 4,087,144 | |
Constellation Brands, Inc. - Class A (b) | | | 63,906 | | | | 4,497,704 | |
Dr. Pepper Snapple Group, Inc. | | | 76,957 | | | | 3,749,345 | |
Molson Coors Brewing Co. - Class B | | | 60,646 | | | | 3,405,273 | |
Monster Beverage Corp. (b) | | | 52,092 | | | | 3,530,275 | |
PepsiCo, Inc. | | | 588,220 | | | | 48,786,967 | |
| | | | | | | | |
| | | | | | | 137,183,292 | |
| | | | | | | | |
|
Biotechnology—2.4% | |
Alexion Pharmaceuticals, Inc. (b) | | | 75,205 | | | | 10,006,777 | |
Amgen, Inc. | | | 289,249 | | | | 33,020,666 | |
Biogen Idec, Inc. (b) | | | 90,601 | | | | 25,345,630 | |
Celgene Corp. (b) | | | 158,052 | | | | 26,704,466 | |
|
Biotechnology—(Continued) | |
Gilead Sciences, Inc. (b) | | | 588,124 | | | | 44,197,518 | |
Regeneron Pharmaceuticals, Inc. (b) | | | 30,125 | | | | 8,291,605 | |
Vertex Pharmaceuticals, Inc. (b) | | | 89,659 | | | | 6,661,664 | |
| | | | | | | | |
| | | | | | | 154,228,326 | |
| | | | | | | | |
|
Building Products—0.1% | |
Allegion plc (b) | | | 34,255 | | | | 1,513,714 | |
Masco Corp. | | | 136,924 | | | | 3,117,759 | |
| | | | | | | | |
| | | | | | | 4,631,473 | |
| | | | | | | | |
|
Capital Markets—2.2% | |
Ameriprise Financial, Inc. | | | 74,617 | | | | 8,584,686 | |
Bank of New York Mellon Corp. (The) | | | 440,521 | | | | 15,391,804 | |
BlackRock, Inc. | | | 48,735 | | | | 15,423,165 | |
Charles Schwab Corp. (The) | | | 445,037 | | | | 11,570,962 | |
E*Trade Financial Corp. (b) | | | 110,156 | | | | 2,163,464 | |
Franklin Resources, Inc. | | | 154,854 | | | | 8,939,721 | |
Goldman Sachs Group, Inc. (The) | | | 161,671 | | | | 28,657,801 | |
Invesco, Ltd. | | | 170,022 | | | | 6,188,801 | |
Legg Mason, Inc. | | | 40,717 | | | | 1,770,375 | |
Morgan Stanley | | | 531,397 | | | | 16,664,610 | |
Northern Trust Corp. | | | 86,164 | | | | 5,332,690 | |
State Street Corp. | | | 168,381 | | | | 12,357,482 | |
T. Rowe Price Group, Inc. | | | 100,073 | | | | 8,383,115 | |
| | | | | | | | |
| | | | | | | 141,428,676 | |
| | | | | | | | |
|
Chemicals—2.5% | |
Air Products & Chemicals, Inc. | | | 81,036 | | | | 9,058,204 | |
Airgas, Inc. | | | 25,458 | | | | 2,847,477 | |
CF Industries Holdings, Inc. | | | 21,983 | | | | 5,122,918 | |
Dow Chemical Co. (The) | | | 465,201 | | | | 20,654,924 | |
E.I. du Pont de Nemours & Co. | | | 355,212 | | | | 23,078,124 | |
Eastman Chemical Co. | | | 59,037 | | | | 4,764,286 | |
Ecolab, Inc. | | | 104,008 | | | | 10,844,914 | |
FMC Corp. | | | 51,118 | | | | 3,857,364 | |
International Flavors & Fragrances, Inc. | | | 31,265 | | | | 2,688,165 | |
LyondellBasell Industries NV - Class A | | | 167,555 | | | | 13,451,315 | |
Monsanto Co. | | | 201,688 | | | | 23,506,736 | |
Mosaic Co. (The) | | | 130,709 | | | | 6,178,615 | |
PPG Industries, Inc. | | | 54,474 | | | | 10,331,539 | |
Praxair, Inc. | | | 112,905 | | | | 14,681,037 | |
Sherwin-Williams Co. (The) | | | 33,037 | | | | 6,062,290 | |
Sigma-Aldrich Corp. | | | 45,899 | | | | 4,314,965 | |
| | | | | | | | |
| | | | | | | 161,442,873 | |
| | | | | | | | |
|
Commercial Banks—2.8% | |
BB&T Corp. | | | 270,377 | | | | 10,090,470 | |
Comerica, Inc. | | | 70,156 | | | | 3,335,216 | |
Fifth Third Bancorp | | | 338,616 | | | | 7,121,094 | |
Huntington Bancshares, Inc. | | | 318,549 | | | | 3,073,998 | |
KeyCorp | | | 343,923 | | | | 4,615,447 | |
M&T Bank Corp. (a) | | | 49,950 | | | | 5,815,179 | |
PNC Financial Services Group, Inc. (The) | | | 204,093 | | | | 15,833,535 | |
Regions Financial Corp. | | | 528,367 | | | | 5,225,550 | |
SunTrust Banks, Inc. | | | 205,306 | | | | 7,557,314 | |
See accompanying notes to financial statements.
MSF-4
Metropolitan Series Fund
MetLife Stock Index Portfolio
Schedule of Investments as of December 31, 2013
Common Stocks—(Continued)
| | | | | | | | |
| Security Description | | Shares | | | Value | |
|
Commercial Banks—(Continued) | |
U.S. Bancorp | | | 700,489 | | | $ | 28,299,755 | |
Wells Fargo & Co. | | | 1,838,578 | | | | 83,471,441 | |
Zions Bancorporation | | | 70,810 | | | | 2,121,468 | |
| | | | | | | | |
| | | | | | | 176,560,467 | |
| | | | | | | | |
|
Commercial Services & Supplies—0.5% | |
ADT Corp. (The) (a) | | | 76,708 | | | | 3,104,373 | |
Cintas Corp. (a) | | | 38,626 | | | | 2,301,723 | |
Iron Mountain, Inc. (a) | | | 65,274 | | | | 1,981,066 | |
Pitney Bowes, Inc. (a) | | | 77,475 | | | | 1,805,167 | |
Republic Services, Inc. | | | 103,586 | | | | 3,439,055 | |
Stericycle, Inc. (b) | | | 32,875 | | | | 3,819,089 | |
Tyco International, Ltd. | | | 178,469 | | | | 7,324,368 | |
Waste Management, Inc. | | | 167,361 | | | | 7,509,488 | |
| | | | | | | | |
| | | | | | | 31,284,329 | |
| | | | | | | | |
|
Communications Equipment—1.7% | |
Cisco Systems, Inc. | | | 2,050,723 | | | | 46,038,731 | |
F5 Networks, Inc. (b) | | | 29,767 | | | | 2,704,630 | |
Harris Corp. | | | 40,992 | | | | 2,861,652 | |
Juniper Networks, Inc. (b) | | | 193,696 | | | | 4,371,719 | |
Motorola Solutions, Inc. | | | 88,315 | | | | 5,961,262 | |
QUALCOMM, Inc. | | | 647,992 | | | | 48,113,406 | |
| | | | | | | | |
| | | | | | | 110,051,400 | |
| | | | | | | | |
|
Computers & Peripherals—4.1% | |
Apple, Inc. | | | 345,100 | | | | 193,639,061 | |
EMC Corp. | | | 789,298 | | | | 19,850,845 | |
Hewlett-Packard Co. | | | 737,125 | | | | 20,624,757 | |
NetApp, Inc. | | | 130,722 | | | | 5,377,903 | |
SanDisk Corp. | | | 86,642 | | | | 6,111,727 | |
Seagate Technology plc | | | 125,093 | | | | 7,025,223 | |
Western Digital Corp. | | | 80,742 | | | | 6,774,254 | |
| | | | | | | | |
| | | | | | | 259,403,770 | |
| | | | | | | | |
|
Construction & Engineering—0.2% | |
Fluor Corp. | | | 62,655 | | | | 5,030,570 | |
Jacobs Engineering Group, Inc. (b) | | | 50,519 | | | | 3,182,192 | |
Quanta Services, Inc. (b) | | | 82,794 | | | | 2,612,978 | |
| | | | | | | | |
| | | | | | | 10,825,740 | |
| | | | | | | | |
|
Construction Materials—0.0% | |
Vulcan Materials Co. | | | 49,858 | | | | 2,962,562 | |
| | | | | | | | |
|
Consumer Finance—1.0% | |
American Express Co. | | | 353,367 | | | | 32,060,988 | |
Capital One Financial Corp. | | | 221,141 | | | | 16,941,612 | |
Discover Financial Services | | | 183,723 | | | | 10,279,302 | |
SLM Corp. | | | 167,331 | | | | 4,397,458 | |
| | | | | | | | |
| | | | | | | 63,679,360 | |
| | | | | | | | |
|
Containers & Packaging—0.2% | |
Avery Dennison Corp. | | | 37,057 | | | | 1,859,891 | |
Ball Corp. | | | 55,474 | | | | 2,865,787 | |
|
Containers & Packaging—(Continued) | |
Bemis Co., Inc. | | | 39,483 | | | | 1,617,224 | |
MeadWestvaco Corp. | | | 68,226 | | | | 2,519,586 | |
Owens-Illinois, Inc. (b) | | | 63,284 | | | | 2,264,301 | |
Sealed Air Corp. | | | 75,242 | | | | 2,561,990 | |
| | | | | | | | |
| | | | | | | 13,688,779 | |
| | | | | | | | |
|
Distributors—0.1% | |
Genuine Parts Co. | | | 59,204 | | | | 4,925,181 | |
| | | | | | | | |
|
Diversified Consumer Services—0.1% | |
Graham Holdings Co. - Class B | | | 1,671 | | | | 1,108,408 | |
H&R Block, Inc. | | | 104,811 | | | | 3,043,711 | |
| | | | | | | | |
| | | | | | | 4,152,119 | |
| | | | | | | | |
|
Diversified Financial Services—5.1% | |
Bank of America Corp. | | | 4,091,052 | | | | 63,697,680 | |
Berkshire Hathaway, Inc. - Class B (b) | | | 690,411 | | | | 81,855,128 | |
Citigroup, Inc. | | | 1,163,323 | | | | 60,620,762 | |
CME Group, Inc. | | | 120,910 | | | | 9,486,599 | |
IntercontinentalExchange Group, Inc. | | | 44,123 | | | | 9,924,145 | |
JPMorgan Chase & Co. | | | 1,441,857 | | | | 84,319,797 | |
Leucadia National Corp. | | | 120,245 | | | | 3,407,743 | |
McGraw Hill Financial, Inc. | | | 103,867 | | | | 8,122,399 | |
Moody’s Corp. | | | 72,602 | | | | 5,697,079 | |
NASDAQ OMX Group, Inc. (The) | | | 44,349 | | | | 1,765,090 | |
| | | | | | | | |
| | | | | | | 328,896,422 | |
| | | | | | | | |
|
Diversified Telecommunication Services—2.1% | |
AT&T, Inc. | | | 2,020,569 | | | | 71,043,206 | |
CenturyLink, Inc. | | | 226,708 | | | | 7,220,650 | |
Frontier Communications Corp. (a) | | | 383,381 | | | | 1,782,722 | |
Verizon Communications, Inc. | | | 1,097,639 | | | | 53,937,980 | |
Windstream Holdings, Inc. (a) | | | 228,626 | | | | 1,824,435 | |
| | | | | | | | |
| | | | | | | 135,808,993 | |
| | | | | | | | |
|
Electric Utilities—1.6% | |
American Electric Power Co., Inc. | | | 186,902 | | | | 8,735,799 | |
Duke Energy Corp. | | | 270,787 | | | | 18,687,011 | |
Edison International | | | 124,966 | | | | 5,785,926 | |
Entergy Corp. | | | 68,395 | | | | 4,327,352 | |
Exelon Corp. | | | 328,670 | | | | 9,002,271 | |
FirstEnergy Corp. | | | 160,414 | | | | 5,290,454 | |
NextEra Energy, Inc. | | | 165,190 | | | | 14,143,568 | |
Northeast Utilities | | | 120,855 | | | | 5,123,043 | |
Pepco Holdings, Inc. (a) | | | 95,795 | | | | 1,832,558 | |
Pinnacle West Capital Corp. | | | 42,208 | | | | 2,233,647 | |
PPL Corp. | | | 241,735 | | | | 7,273,806 | |
Southern Co. (The) | | | 338,196 | | | | 13,903,238 | |
Xcel Energy, Inc. | | | 190,872 | | | | 5,332,964 | |
| | | | | | | | |
| | | | | | | 101,671,637 | |
| | | | | | | | |
|
Electrical Equipment—0.8% | |
AMETEK, Inc. | | | 93,876 | | | | 4,944,449 | |
Eaton Corp. plc | | | 181,997 | | | | 13,853,612 | |
Emerson Electric Co. | | | 270,009 | | | | 18,949,231 | |
See accompanying notes to financial statements.
MSF-5
Metropolitan Series Fund
MetLife Stock Index Portfolio
Schedule of Investments as of December 31, 2013
Common Stocks—(Continued)
| | | | | | | | |
| Security Description | | Shares | | | Value | |
|
Electrical Equipment—(Continued) | |
Rockwell Automation, Inc. | | | 53,187 | | | $ | 6,284,576 | |
Roper Industries, Inc. | | | 38,091 | | | | 5,282,460 | |
| | | | | | | | |
| | | | | | | 49,314,328 | |
| | | | | | | | |
|
Electronic Equipment, Instruments & Components—0.4% | |
Amphenol Corp. - Class A | | | 60,710 | | | | 5,414,118 | |
Corning, Inc. | | | 555,082 | | | | 9,891,561 | |
FLIR Systems, Inc. | | | 54,332 | | | | 1,635,393 | |
Jabil Circuit, Inc. | | | 70,911 | | | | 1,236,688 | |
TE Connectivity, Ltd. | | | 157,401 | | | | 8,674,369 | |
| | | | | | | | |
| | | | | | | 26,852,129 | |
| | | | | | | | |
|
Energy Equipment & Services—1.9% | |
Baker Hughes, Inc. | | | 170,001 | | | | 9,394,255 | |
Cameron International Corp. (b) | | | 91,236 | | | | 5,431,279 | |
Diamond Offshore Drilling, Inc. (a) | | | 26,664 | | | | 1,517,715 | |
Ensco plc - Class A | | | 89,594 | | | | 5,122,985 | |
FMC Technologies, Inc. (b) | | | 90,745 | | | | 4,737,796 | |
Halliburton Co. | | | 325,341 | | | | 16,511,056 | |
Helmerich & Payne, Inc. | | | 41,095 | | | | 3,455,268 | |
Nabors Industries, Ltd. | | | 99,626 | | | | 1,692,646 | |
National Oilwell Varco, Inc. | | | 164,200 | | | | 13,058,826 | |
Noble Corp. plc | | | 97,195 | | | | 3,641,897 | |
Rowan Cos. plc - Class A (b) | | | 47,651 | | | | 1,684,939 | |
Schlumberger, Ltd. | | | 505,125 | | | | 45,516,814 | |
Transocean, Ltd. (a) | | | 130,008 | | | | 6,424,995 | |
| | | | | | | | |
| | | | | | | 118,190,471 | |
| | | | | | | | |
|
Food & Staples Retailing—2.3% | |
Costco Wholesale Corp. | | | 167,584 | | | | 19,944,172 | |
CVS Caremark Corp. | | | 456,528 | | | | 32,673,709 | |
Kroger Co. (The) | | | 199,608 | | | | 7,890,504 | |
Safeway, Inc. | | | 94,661 | | | | 3,083,109 | |
Sysco Corp. (a) | | | 223,067 | | | | 8,052,719 | |
Wal-Mart Stores, Inc. | | | 620,549 | | | | 48,831,001 | |
Walgreen Co. | | | 334,026 | | | | 19,186,453 | |
Whole Foods Market, Inc. | | | 142,735 | | | | 8,254,365 | |
| | | | | | | | |
| | | | | | | 147,916,032 | |
| | | | | | | | |
|
Food Products—1.6% | |
Archer-Daniels-Midland Co. | | | 252,367 | | | | 10,952,728 | |
Campbell Soup Co. (a) | | | 68,870 | | | | 2,980,694 | |
ConAgra Foods, Inc. | | | 161,814 | | | | 5,453,132 | |
General Mills, Inc. | | | 243,275 | | | | 12,141,855 | |
Hershey Co. (The) | | | 57,460 | | | | 5,586,836 | |
Hormel Foods Corp. | | | 51,628 | | | | 2,332,037 | |
J.M. Smucker Co. (The) | | | 40,326 | | | | 4,178,580 | |
Kellogg Co. | | | 98,635 | | | | 6,023,639 | |
Kraft Foods Group, Inc. | | | 228,550 | | | | 12,323,416 | |
McCormick & Co., Inc. | | | 50,649 | | | | 3,490,729 | |
Mead Johnson Nutrition Co. | | | 77,472 | | | | 6,489,055 | |
Mondelez International, Inc. - Class A | | | 672,674 | | | | 23,745,392 | |
Tyson Foods, Inc. - Class A (a) | | | 104,179 | | | | 3,485,829 | |
| | | | | | | | |
| | | | | | | 99,183,922 | |
| | | | | | | | |
|
Gas Utilities—0.1% | |
AGL Resources, Inc. | | | 45,562 | | | | 2,151,893 | |
ONEOK, Inc. | | | 79,122 | | | | 4,919,806 | |
| | | | | | | | |
| | | | | | | 7,071,699 | |
| | | | | | | | |
|
Health Care Equipment & Supplies—2.0% | |
Abbott Laboratories | | | 593,047 | | | | 22,731,492 | |
Baxter International, Inc. | | | 208,155 | | | | 14,477,180 | |
Becton Dickinson & Co. | | | 74,446 | | | | 8,225,539 | |
Boston Scientific Corp. (b) | | | 512,131 | | | | 6,155,815 | |
C.R. Bard, Inc. | | | 29,875 | | | | 4,001,457 | |
CareFusion Corp. (b) | | | 81,060 | | | | 3,227,809 | |
Covidien plc | | | 176,435 | | | | 12,015,223 | |
DENTSPLY International, Inc. | | | 54,715 | | | | 2,652,583 | |
Edwards Lifesciences Corp. (a) (b) | | | 41,963 | | | | 2,759,487 | |
Intuitive Surgical, Inc. (b) | | | 14,600 | | | | 5,607,568 | |
Medtronic, Inc. | | | 382,922 | | | | 21,975,894 | |
St. Jude Medical, Inc. | | | 111,926 | | | | 6,933,816 | |
Stryker Corp. | | | 113,213 | | | | 8,506,825 | |
Varian Medical Systems, Inc. (b) | | | 40,549 | | | | 3,150,252 | |
Zimmer Holdings, Inc. | | | 65,581 | | | | 6,111,493 | |
| | | | | | | | |
| | | | | | | 128,532,433 | |
| | | | | | | | |
|
Health Care Providers & Services—2.0% | |
Aetna, Inc. | | | 140,956 | | | | 9,668,172 | |
AmerisourceBergen Corp. | | | 88,230 | | | | 6,203,451 | |
Cardinal Health, Inc. | | | 130,975 | | | | 8,750,440 | |
Cigna Corp. | | | 106,019 | | | | 9,274,542 | |
DaVita HealthCare Partners, Inc. (b) | | | 67,713 | | | | 4,290,973 | |
Express Scripts Holding Co. (b) | | | 309,069 | | | | 21,709,007 | |
Humana, Inc. | | | 59,801 | | | | 6,172,659 | |
Laboratory Corp. of America Holdings (a) (b) | | | 33,523 | | | | 3,062,997 | |
McKesson Corp. | | | 88,107 | | | | 14,220,470 | |
Patterson Cos., Inc. | | | 31,977 | | | | 1,317,452 | |
Quest Diagnostics, Inc. (a) | | | 55,779 | | | | 2,986,408 | |
Tenet Healthcare Corp. (b) | | | 38,059 | | | | 1,603,045 | |
UnitedHealth Group, Inc. | | | 386,147 | | | | 29,076,869 | |
WellPoint, Inc. | | | 113,309 | | | | 10,468,618 | |
| | | | | | | | |
| | | | | | | 128,805,103 | |
| | | | | | | | |
|
Health Care Technology—0.1% | |
Cerner Corp. (b) | | | 113,228 | | | | 6,311,329 | |
| | | | | | | | |
|
Hotels, Restaurants & Leisure—1.7% | |
Carnival Corp. | | | 168,006 | | | | 6,748,801 | |
Chipotle Mexican Grill, Inc. (b) | | | 11,869 | | | | 6,323,566 | |
Darden Restaurants, Inc. (a) | | | 50,080 | | | | 2,722,850 | |
International Game Technology | | | 95,466 | | | | 1,733,663 | |
Marriott International, Inc. - Class A | | | 86,167 | | | | 4,253,203 | |
McDonald’s Corp. | | | 381,649 | | | | 37,031,402 | |
Starbucks Corp. | | | 289,047 | | | | 22,658,394 | |
Starwood Hotels & Resorts Worldwide, Inc. | | | 73,455 | | | | 5,836,000 | |
Wyndham Worldwide Corp. | | | 49,980 | | | | 3,683,026 | |
Wynn Resorts, Ltd. | | | 30,981 | | | | 6,016,820 | |
Yum! Brands, Inc. | | | 170,809 | | | | 12,914,868 | |
| | | | | | | | |
| | | | | | | 109,922,593 | |
| | | | | | | | |
See accompanying notes to financial statements.
MSF-6
Metropolitan Series Fund
MetLife Stock Index Portfolio
Schedule of Investments as of December 31, 2013
Common Stocks—(Continued)
| | | | | | | | |
| Security Description | | Shares | | | Value | |
|
Household Durables—0.4% | |
DR Horton, Inc. (a) | | | 109,002 | | | $ | 2,432,925 | |
Garmin, Ltd. (a) | | | 47,173 | | | | 2,180,336 | |
Harman International Industries, Inc. | | | 25,910 | | | | 2,120,734 | |
Leggett & Platt, Inc. (a) | | | 54,162 | | | | 1,675,772 | |
Lennar Corp. - Class A (a) | | | 64,129 | | | | 2,536,943 | |
Mohawk Industries, Inc. (b) | | | 23,399 | | | | 3,484,111 | |
Newell Rubbermaid, Inc. | | | 110,157 | | | | 3,570,188 | |
PulteGroup, Inc. (a) | | | 132,231 | | | | 2,693,546 | |
Whirlpool Corp. | | | 30,107 | | | | 4,722,584 | |
| | | | | | | | |
| | | | | | | 25,417,139 | |
| | | | | | | | |
|
Household Products—2.0% | |
Clorox Co. (The) (a) | | | 49,496 | | | | 4,591,249 | |
Colgate-Palmolive Co. | | | 337,125 | | | | 21,983,921 | |
Kimberly-Clark Corp. | | | 146,380 | | | | 15,290,855 | |
Procter & Gamble Co. (The) | | | 1,042,592 | | | | 84,877,415 | |
| | | | | | | | |
| | | | | | | 126,743,440 | |
| | | | | | | | |
|
Independent Power Producers & Energy Traders—0.1% | |
AES Corp. (The) | | | 251,856 | | | | 3,654,430 | |
NRG Energy, Inc. | | | 124,047 | | | | 3,562,630 | |
| | | | | | | | |
| | | | | | | 7,217,060 | |
| | | | | | | | |
|
Industrial Conglomerates—2.5% | |
3M Co. | | | 245,325 | | | | 34,406,831 | |
Danaher Corp. | | | 229,977 | | | | 17,754,225 | |
General Electric Co. | | | 3,880,570 | | | | 108,772,377 | |
| | | | | | | | |
| | | | | | | 160,933,433 | |
| | | | | | | | |
|
Insurance—3.0% | |
ACE, Ltd. | | | 130,434 | | | | 13,503,832 | |
Aflac, Inc. | | | 178,771 | | | | 11,941,903 | |
Allstate Corp. (The) | | | 174,459 | | | | 9,514,994 | |
American International Group, Inc. | | | 564,726 | | | | 28,829,262 | |
Aon plc | | | 115,469 | | | | 9,686,694 | |
Assurant, Inc. | | | 27,891 | | | | 1,851,126 | |
Chubb Corp. (The) | | | 96,564 | | | | 9,330,979 | |
Cincinnati Financial Corp. | | | 56,554 | | | | 2,961,733 | |
Genworth Financial, Inc. - Class A (b) | | | 189,576 | | | | 2,944,115 | |
Hartford Financial Services Group, Inc. | | | 171,481 | | | | 6,212,757 | |
Lincoln National Corp. | | | 100,624 | | | | 5,194,211 | |
Loews Corp. | | | 117,313 | | | | 5,659,179 | |
Marsh & McLennan Cos., Inc. | | | 210,486 | | | | 10,179,103 | |
MetLife, Inc. (c) | | | 429,987 | | | | 23,184,899 | |
Principal Financial Group, Inc. | | | 105,003 | | | | 5,177,698 | |
Progressive Corp. (The) | | | 211,721 | | | | 5,773,632 | |
Prudential Financial, Inc. | | | 177,586 | | | | 16,376,981 | |
Torchmark Corp. | | | 34,681 | | | | 2,710,320 | |
Travelers Cos., Inc. (The) | | | 139,640 | | | | 12,643,005 | |
Unum Group | | | 100,170 | | | | 3,513,964 | |
XL Group plc | | | 108,473 | | | | 3,453,780 | |
| | | | | | | | |
| | | | | | | 190,644,167 | |
| | | | | | | | |
|
Internet & Catalog Retail—1.5% | |
Amazon.com, Inc. (b) | | | 142,209 | | | | 56,711,527 | |
|
Internet & Catalog Retail—(Continued) | |
Expedia, Inc. | | | 39,498 | | | | 2,751,431 | |
Netflix, Inc. (b) | | | 22,729 | | | | 8,368,136 | |
priceline.com, Inc. (b) | | | 19,726 | | | | 22,929,502 | |
TripAdvisor, Inc. (b) | | | 42,501 | | | | 3,520,358 | |
| | | | | | | | |
| | | | | | | 94,280,954 | |
| | | | | | | | |
|
Internet Software & Services—3.1% | |
Akamai Technologies, Inc. (b) | | | 68,647 | | | | 3,238,765 | |
eBay, Inc. (b) | | | 446,895 | | | | 24,530,067 | |
Facebook, Inc. - Class A (b) | | | 630,846 | | | | 34,482,042 | |
Google, Inc. - Class A (b) (d) | | | 107,639 | | | | 120,632,104 | |
VeriSign, Inc. (a) (b) | | | 49,413 | | | | 2,953,909 | |
Yahoo!, Inc. (b) | | | 361,858 | | | | 14,633,538 | |
| | | | | | | | |
| | | | | | | 200,470,425 | |
| | | | | | | | |
|
IT Services—3.6% | |
Accenture plc - Class A | | | 243,839 | | | | 20,048,443 | |
Alliance Data Systems Corp. (a) (b) | | | 18,684 | | | | 4,912,584 | |
Automatic Data Processing, Inc. | | | 184,653 | | | | 14,921,809 | |
Cognizant Technology Solutions Corp. - Class A (b) | | | 116,024 | | | | 11,716,103 | |
Computer Sciences Corp. | | | 56,463 | | | | 3,155,152 | |
Fidelity National Information Services, Inc. | | | 111,665 | | | | 5,994,177 | |
Fiserv, Inc. (b) | | | 98,933 | | | | 5,841,994 | |
International Business Machines Corp. | | | 391,496 | | | | 73,432,905 | |
MasterCard, Inc. - Class A | | | 39,708 | | | | 33,174,446 | |
Paychex, Inc. | | | 124,664 | | | | 5,675,952 | |
Teradata Corp. (b) | | | 62,672 | | | | 2,850,949 | |
Total System Services, Inc. | | | 64,056 | | | | 2,131,784 | |
Visa, Inc. - Class A | | | 195,322 | | | | 43,494,303 | |
Western Union Co. (The) (a) | | | 211,818 | | | | 3,653,860 | |
| | | | | | | | |
| | | | | | | 231,004,461 | |
| | | | | | | | |
|
Leisure Equipment & Products—0.1% | |
Hasbro, Inc. (a) | | | 44,293 | | | | 2,436,558 | |
Mattel, Inc. | | | 129,808 | | | | 6,176,265 | |
| | | | | | | | |
| | | | | | | 8,612,823 | |
| | | | | | | | |
|
Life Sciences Tools & Services—0.5% | |
Agilent Technologies, Inc. | | | 126,877 | | | | 7,256,096 | |
Life Technologies Corp. (b) | | | 66,225 | | | | 5,019,855 | |
PerkinElmer, Inc. | | | 43,108 | | | | 1,777,343 | |
Thermo Fisher Scientific, Inc. | | | 138,604 | | | | 15,433,555 | |
Waters Corp. (b) | | | 32,652 | | | | 3,265,200 | |
| | | | | | | | |
| | | | | | | 32,752,049 | |
| | | | | | | | |
|
Machinery—1.8% | |
Caterpillar, Inc. | | | 244,078 | | | | 22,164,723 | |
Cummins, Inc. | | | 66,834 | | | | 9,421,589 | |
Deere & Co. (a) | | | 146,843 | | | | 13,411,171 | |
Dover Corp. | | | 65,345 | | | | 6,308,406 | |
Flowserve Corp. | | | 53,494 | | | | 4,216,932 | |
Illinois Tool Works, Inc. | | | 156,617 | | | | 13,168,357 | |
Ingersoll-Rand plc | | | 102,762 | | | | 6,330,139 | |
Joy Global, Inc. (a) | | | 40,763 | | | | 2,384,228 | |
See accompanying notes to financial statements.
MSF-7
Metropolitan Series Fund
MetLife Stock Index Portfolio
Schedule of Investments as of December 31, 2013
Common Stocks—(Continued)
| | | | | | | | |
| Security Description | | Shares | | | Value | |
|
Machinery—(Continued) | |
PACCAR, Inc. | | | 135,814 | | | $ | 8,036,114 | |
Pall Corp. | | | 42,494 | | | | 3,626,863 | |
Parker Hannifin Corp. | | | 57,240 | | | | 7,363,354 | |
Pentair, Ltd. | | | 76,456 | | | | 5,938,338 | |
Snap-on, Inc. | | | 22,304 | | | | 2,442,734 | |
Stanley Black & Decker, Inc. | | | 59,534 | | | | 4,803,799 | |
Xylem, Inc. | | | 70,761 | | | | 2,448,331 | |
| | | | | | | | |
| | | | | | | 112,065,078 | |
| | | | | | | | |
|
Media—3.7% | |
Cablevision Systems Corp. - Class A (a) | | | 82,112 | | | | 1,472,268 | |
CBS Corp. - Class B | | | 214,054 | | | | 13,643,802 | |
Comcast Corp. - Class A | | | 999,538 | | | | 51,940,992 | |
DIRECTV (b) | | | 187,428 | | | | 12,949,401 | |
Discovery Communications, Inc. - Class A (a) (b) | | | 86,558 | | | | 7,826,574 | |
Gannett Co., Inc. | | | 87,409 | | | | 2,585,558 | |
Interpublic Group of Cos., Inc. (The) | | | 159,651 | | | | 2,825,823 | |
News Corp. - Class A (b) | | | 190,938 | | | | 3,440,703 | |
Omnicom Group, Inc. | | | 98,712 | | | | 7,341,211 | |
Scripps Networks Interactive, Inc. - Class A | | | 42,021 | | | | 3,631,035 | |
Time Warner Cable, Inc. | | | 108,121 | | | | 14,650,396 | |
Time Warner, Inc. | | | 347,011 | | | | 24,193,607 | |
Twenty-First Century Fox, Inc. - Class A | | | 752,671 | | | | 26,478,966 | |
Viacom, Inc. - Class B | | | 155,663 | | | | 13,595,606 | |
Walt Disney Co. (The) | | | 626,833 | | | | 47,890,041 | |
| | | | | | | | |
| | | | | | | 234,465,983 | |
| | | | | | | | |
|
Metals & Mining—0.6% | |
Alcoa, Inc. (a) | | | 410,251 | | | | 4,360,968 | |
Allegheny Technologies, Inc. (a) | | | 41,417 | | | | 1,475,688 | |
Cliffs Natural Resources, Inc. (a) | | | 58,731 | | | | 1,539,340 | |
Freeport-McMoRan Copper & Gold, Inc. | | | 398,189 | | | | 15,027,653 | |
Newmont Mining Corp. | | | 190,961 | | | | 4,397,832 | |
Nucor Corp. | | | 122,051 | | | | 6,515,082 | |
United States Steel Corp. (a) | | | 55,487 | | | | 1,636,866 | |
| | | | | | | | |
| | | | | | | 34,953,429 | |
| | | | | | | | |
|
Multi-Utilities—1.1% | |
Ameren Corp. | | | 93,063 | | | | 3,365,158 | |
CenterPoint Energy, Inc. | | | 164,407 | | | | 3,810,954 | |
CMS Energy Corp. | | | 102,025 | | | | 2,731,209 | |
Consolidated Edison, Inc. (a) | | | 112,338 | | | | 6,210,045 | |
Dominion Resources, Inc. | | | 222,629 | | | | 14,401,870 | |
DTE Energy Co. | | | 67,811 | | | | 4,501,972 | |
Integrys Energy Group, Inc. | | | 30,610 | | | | 1,665,490 | |
NiSource, Inc. | | | 120,165 | | | | 3,951,025 | |
PG&E Corp. | | | 172,329 | | | | 6,941,412 | |
Public Service Enterprise Group, Inc. | | | 194,025 | | | | 6,216,561 | |
SCANA Corp. (a) | | | 53,908 | | | | 2,529,903 | |
Sempra Energy | | | 87,179 | | | | 7,825,187 | |
TECO Energy, Inc. (a) | | | 78,346 | | | | 1,350,685 | |
Wisconsin Energy Corp. (a) | | | 86,882 | | | | 3,591,702 | |
| | | | | | | | |
| | | | | | | 69,093,173 | |
| | | | | | | | |
|
Multiline Retail—0.7% | |
Dollar General Corp. (b) | | | 113,008 | | | | 6,816,643 | |
Dollar Tree, Inc. (b) | | | 79,815 | | | | 4,503,162 | |
Family Dollar Stores, Inc. | | | 37,084 | | | | 2,409,347 | |
Kohl’s Corp. (a) | | | 77,206 | | | | 4,381,441 | |
Macy’s, Inc. | | | 141,333 | | | | 7,547,182 | |
Nordstrom, Inc. (a) | | | 54,880 | | | | 3,391,584 | |
Target Corp. | | | 242,441 | | | | 15,339,242 | |
| | | | | | | | |
| | | | | | | 44,388,601 | |
| | | | | | | | |
|
Office Electronics—0.1% | |
Xerox Corp. | | | 443,868 | | | | 5,401,874 | |
| | | | | | | | |
|
Oil, Gas & Consumable Fuels—8.3% | |
Anadarko Petroleum Corp. | | | 193,031 | | | | 15,311,219 | |
Apache Corp. | | | 153,129 | | | | 13,159,906 | |
Cabot Oil & Gas Corp. | | | 161,534 | | | | 6,261,058 | |
Chesapeake Energy Corp. (a) | | | 193,877 | | | | 5,261,822 | |
Chevron Corp. | | | 737,643 | | | | 92,138,987 | |
ConocoPhillips | | | 469,893 | | | | 33,197,941 | |
CONSOL Energy, Inc. | | | 87,811 | | | | 3,340,331 | |
Denbury Resources, Inc. (b) | | | 140,645 | | | | 2,310,797 | |
Devon Energy Corp. | | | 146,380 | | | | 9,056,531 | |
EOG Resources, Inc. | | | 104,701 | | | | 17,573,016 | |
EQT Corp. | | | 57,808 | | | | 5,190,002 | |
Exxon Mobil Corp. | | | 1,675,567 | | | | 169,567,380 | |
Hess Corp. | | | 109,100 | | | | 9,055,300 | |
Kinder Morgan, Inc. | | | 258,248 | | | | 9,296,928 | |
Marathon Oil Corp. | | | 267,197 | | | | 9,432,054 | |
Marathon Petroleum Corp. | | | 115,461 | | | | 10,591,238 | |
Murphy Oil Corp. | | | 67,415 | | | | 4,373,885 | |
Newfield Exploration Co. (b) | | | 52,210 | | | | 1,285,932 | |
Noble Energy, Inc. | | | 137,802 | | | | 9,385,694 | |
Occidental Petroleum Corp. | | | 309,169 | | | | 29,401,972 | |
Peabody Energy Corp. | | | 103,495 | | | | 2,021,257 | |
Phillips 66 | | | 229,955 | | | | 17,736,429 | |
Pioneer Natural Resources Co. | | | 54,703 | | | | 10,069,181 | |
QEP Resources, Inc. | | | 68,764 | | | | 2,107,617 | |
Range Resources Corp. | | | 62,681 | | | | 5,284,635 | |
Southwestern Energy Co. (b) | | | 134,510 | | | | 5,290,278 | |
Spectra Energy Corp. | | | 256,997 | | | | 9,154,233 | |
Tesoro Corp. | | | 50,949 | | | | 2,980,517 | |
Valero Energy Corp. | | | 206,951 | | | | 10,430,330 | |
Williams Cos., Inc. (The) | | | 262,132 | | | | 10,110,431 | |
WPX Energy, Inc. (b) | | | 77,021 | | | | 1,569,688 | |
| | | | | | | | |
| | | | | | | 531,946,589 | |
| | | | | | | | |
|
Paper & Forest Products—0.1% | |
International Paper Co. | | | 170,154 | | | | 8,342,651 | |
| | | | | | | | |
|
Personal Products—0.2% | |
Avon Products, Inc. | | | 166,374 | | | | 2,864,960 | |
Estee Lauder Cos., Inc. (The) - Class A | | | 98,209 | | | | 7,397,102 | |
| | | | | | | | |
| | | | | | | 10,262,062 | |
| | | | | | | | |
See accompanying notes to financial statements.
MSF-8
Metropolitan Series Fund
MetLife Stock Index Portfolio
Schedule of Investments as of December 31, 2013
Common Stocks—(Continued)
| | | | | | | | |
| Security Description | | Shares | | | Value | |
|
Pharmaceuticals—5.8% | |
AbbVie, Inc. | | | 610,183 | | | $ | 32,223,764 | |
Actavis plc (b) | | | 66,757 | | | | 11,215,176 | |
Allergan, Inc. | | | 113,978 | | | | 12,660,676 | |
Bristol-Myers Squibb Co. | | | 631,540 | | | | 33,566,351 | |
Eli Lilly & Co. | | | 380,276 | | | | 19,394,076 | |
Forest Laboratories, Inc. (b) | | | 90,933 | | | | 5,458,708 | |
Hospira, Inc. (b) | | | 63,622 | | | | 2,626,316 | |
Johnson & Johnson | | | 1,082,178 | | | | 99,116,683 | |
Merck & Co., Inc. | | | 1,120,721 | | | | 56,092,086 | |
Mylan, Inc. (b) | | | 146,846 | | | | 6,373,117 | |
Perrigo Co. plc | | | 51,033 | | | | 7,831,524 | |
Pfizer, Inc. | | | 2,485,849 | | | | 76,141,555 | |
Zoetis, Inc. | | | 191,780 | | | | 6,269,288 | |
| | | | | | | | |
| | | | | | | 368,969,320 | |
| | | | | | | | |
|
Professional Services—0.2% | |
Dun & Bradstreet Corp. (The) (a) | | | 14,637 | | | | 1,796,692 | |
Equifax, Inc. | | | 46,673 | | | | 3,224,637 | |
Nielsen Holdings NV | | | 97,058 | | | | 4,453,992 | |
Robert Half International, Inc. | | | 53,159 | | | | 2,232,146 | |
| | | | | | | | |
| | | | | | | 11,707,467 | |
| | | | | | | | |
|
Real Estate Investment Trusts—1.8% | |
American Tower Corp. | | | 151,366 | | | | 12,082,034 | |
Apartment Investment & Management Co. - Class A | | | 55,966 | | | | 1,450,079 | |
AvalonBay Communities, Inc. | | | 46,659 | | | | 5,516,494 | |
Boston Properties, Inc. | | | 58,638 | | | | 5,885,496 | |
Equity Residential | | | 128,561 | | | | 6,668,459 | |
General Growth Properties, Inc. | | | 206,197 | | | | 4,138,374 | |
HCP, Inc. | | | 175,005 | | | | 6,356,182 | |
Health Care REIT, Inc. | | | 110,721 | | | | 5,931,324 | |
Host Hotels & Resorts, Inc. | | | 290,076 | | | | 5,639,077 | |
Kimco Realty Corp. | | | 157,138 | | | | 3,103,475 | |
Macerich Co. (The) | | | 53,905 | | | | 3,174,465 | |
Plum Creek Timber Co., Inc. (a) | | | 67,854 | | | | 3,155,889 | |
Prologis, Inc. | | | 191,288 | | | | 7,068,092 | |
Public Storage | | | 55,438 | | | | 8,344,528 | |
Simon Property Group, Inc. | | | 119,027 | | | | 18,111,148 | |
Ventas, Inc. | | | 112,796 | | | | 6,460,955 | |
Vornado Realty Trust | | | 66,721 | | | | 5,924,158 | |
Weyerhaeuser Co. | | | 223,519 | | | | 7,056,495 | |
| | | | | | | | |
| | | | | | | 116,066,724 | |
| | | | | | | | |
|
Real Estate Management & Development—0.0% | |
CBRE Group, Inc. - Class A (b) | | | 106,770 | | | | 2,808,051 | |
| | | | | | | | |
|
Road & Rail—0.9% | |
CSX Corp. | | | 388,800 | | | | 11,185,776 | |
Kansas City Southern | | | 42,271 | | | | 5,234,418 | |
Norfolk Southern Corp. | | | 118,484 | | | | 10,998,870 | |
Ryder System, Inc. | | | 20,172 | | | | 1,488,290 | |
Union Pacific Corp. | | | 176,654 | | | | 29,677,872 | |
| | | | | | | | |
| | | | | | | 58,585,226 | |
| | | | | | | | |
|
Semiconductors & Semiconductor Equipment—2.0% | |
Altera Corp. | | | 123,170 | | | | 4,006,720 | |
Analog Devices, Inc. | | | 119,303 | | | | 6,076,102 | |
Applied Materials, Inc. | | | 461,870 | | | | 8,170,480 | |
Broadcom Corp. - Class A | | | 206,966 | | | | 6,136,542 | |
First Solar, Inc. (a) (b) | | | 27,079 | | | | 1,479,596 | |
Intel Corp. | | | 1,906,653 | | | | 49,496,712 | |
KLA-Tencor Corp. | | | 63,919 | | | | 4,120,219 | |
Lam Research Corp. (b) | | | 62,286 | | | | 3,391,473 | |
Linear Technology Corp. (a) | | | 89,814 | | | | 4,091,028 | |
LSI Corp. | | | 209,013 | | | | 2,303,323 | |
Microchip Technology, Inc. (a) | | | 76,085 | | | | 3,404,804 | |
Micron Technology, Inc. (b) | | | 403,444 | | | | 8,778,941 | |
NVIDIA Corp. | | | 221,924 | | | | 3,555,222 | |
Texas Instruments, Inc. | | | 419,825 | | | | 18,434,516 | |
Xilinx, Inc. | | | 102,913 | | | | 4,725,765 | |
| | | | | | | | |
| | | | | | | 128,171,443 | |
| | | | | | | | |
|
Software—3.4% | |
Adobe Systems, Inc. (b) | | | 178,313 | | | | 10,677,383 | |
Autodesk, Inc. (b) | | | 86,530 | | | | 4,355,055 | |
CA, Inc. | | | 124,623 | | | | 4,193,564 | |
Citrix Systems, Inc. (b) | | | 71,493 | | | | 4,521,932 | |
Electronic Arts, Inc. (a) (b) | | | 118,565 | | | | 2,719,881 | |
Intuit, Inc. | | | 109,257 | | | | 8,338,494 | |
Microsoft Corp. | | | 2,913,736 | | | | 109,061,139 | |
Oracle Corp. | | | 1,345,989 | | | | 51,497,539 | |
Red Hat, Inc. (b) | | | 72,683 | | | | 4,073,155 | |
Salesforce.com, Inc. (a) (b) | | | 212,781 | | | | 11,743,384 | |
Symantec Corp. | | | 266,966 | | | | 6,295,058 | |
| | | | | | | | |
| | | | | | | 217,476,584 | |
| | | | | | | | |
|
Specialty Retail—2.2% | |
AutoNation, Inc. (b) | | | 24,762 | | | | 1,230,424 | |
AutoZone, Inc. (b) | | | 13,054 | | | | 6,239,029 | |
Bed Bath & Beyond, Inc. (b) | | | 82,367 | | | | 6,614,070 | |
Best Buy Co., Inc. | | | 104,843 | | | | 4,181,139 | |
CarMax, Inc. (b) | | | 85,665 | | | | 4,027,968 | |
GameStop Corp. - Class A (a) | | | 44,836 | | | | 2,208,622 | |
Gap, Inc. (The) | | | 101,601 | | | | 3,970,567 | |
Home Depot, Inc. (The) | | | 540,133 | | | | 44,474,551 | |
L Brands, Inc. | | | 93,525 | | | | 5,784,521 | |
Lowe’s Cos., Inc. | | | 401,133 | | | | 19,876,140 | |
O’Reilly Automotive, Inc. (b) | | | 41,165 | | | | 5,298,347 | |
PetSmart, Inc. (a) | | | 39,786 | | | | 2,894,432 | |
Ross Stores, Inc. | | | 83,110 | | | | 6,227,432 | |
Staples, Inc. (a) | | | 253,336 | | | | 4,025,509 | |
Tiffany & Co. | | | 42,238 | | | | 3,918,842 | |
TJX Cos., Inc. | | | 272,784 | | | | 17,384,524 | |
Urban Outfitters, Inc. (b) | | | 41,828 | | | | 1,551,819 | |
| | | | | | | | |
| | | | | | | 139,907,936 | |
| | | | | | | | |
| |
Textiles, Apparel & Luxury Goods—0.8% | | | | | |
Coach, Inc. | | | 107,573 | | | | 6,038,072 | |
Fossil Group, Inc. (b) | | | 18,845 | | | | 2,260,269 | |
Michael Kors Holdings, Ltd. (b) | | | 68,806 | | | | 5,586,359 | |
See accompanying notes to financial statements.
MSF-9
Metropolitan Series Fund
MetLife Stock Index Portfolio
Schedule of Investments as of December 31, 2013
Common Stocks—(Continued)
| | | | | | | | |
| Security Description | | Shares/
Principal
Amount* | | | Value | |
| |
Textiles, Apparel & Luxury Goods—(Continued) | | | | | |
NIKE, Inc. - Class B | | | 286,603 | | | $ | 22,538,460 | |
PVH Corp. | | | 31,288 | | | | 4,255,794 | |
Ralph Lauren Corp. | | | 22,870 | | | | 4,038,156 | |
VF Corp. | | | 135,105 | | | | 8,422,446 | |
| | | | | | | | |
| | | | | | | 53,139,556 | |
| | | | | | | | |
| | |
Thrifts & Mortgage Finance—0.1% | | | | | | | | |
Hudson City Bancorp, Inc. | | | 182,410 | | | | 1,720,127 | |
People’s United Financial, Inc. (a) | | | 121,894 | | | | 1,843,037 | |
| | | | | | | | |
| | | | | | | 3,563,164 | |
| | | | | | | | |
| | |
Tobacco—1.5% | | | | | | | | |
Altria Group, Inc. | | | 767,116 | | | | 29,449,583 | |
Lorillard, Inc. (a) | | | 141,288 | | | | 7,160,476 | |
Philip Morris International, Inc. | | | 614,519 | | | | 53,543,040 | |
Reynolds American, Inc. | | | 120,230 | | | | 6,010,298 | |
| | | | | | | | |
| | | | | | | 96,163,397 | |
| | | | | | | | |
| |
Trading Companies & Distributors—0.2% | | | | | |
Fastenal Co. (a) | | | 104,711 | | | | 4,974,820 | |
WW Grainger, Inc. | | | 23,695 | | | | 6,052,177 | |
| | | | | | | | |
| | | | | | | 11,026,997 | |
| | | | | | | | |
| |
Wireless Telecommunication Services—0.2% | | | | | |
Crown Castle International Corp. (b) | | | 128,134 | | | | 9,408,880 | |
| | | | | | | | |
Total Common Stocks
(Cost $3,888,190,230) | | | | | | | 6,326,662,051 | |
| | | | | | | | |
|
| Investment Company Security—0.4% | |
SPDR S&P 500 ETF Trust
(Cost $27,105,788) | | | 152,000 | | | | 28,069,840 | |
| | | | | | | | |
|
| Short-Term Investments—2.7% | |
| | |
Discount Notes—0.3% | | | | | | | | |
Federal Home Loan Bank
0.030%, 02/26/14 (e) | | | 8,050,000 | | | | 8,049,624 | |
0.086%, 02/21/14 (e) | | | 1,350,000 | | | | 1,349,837 | |
0.086%, 03/12/14 (e) | | | 2,750,000 | | | | 2,749,545 | |
0.091%, 03/12/14 (e) | | | 500,000 | | | | 499,913 | |
0.096%, 03/12/14 (e) | | | 500,000 | | | | 499,908 | |
Federal National Mortgage Association 0.061%, 02/25/14 (e) | | | 3,550,000 | | | | 3,549,675 | |
| | | | | | | | |
| | | | | | | 16,698,502 | |
| | | | | | | | |
|
Mutual Fund—2.3% | |
State Street Navigator Securities Lending MET Portfolio (f) | | | 149,596,254 | | | | 149,596,254 | |
| | | | | | | | |
|
U.S. Treasury—0.1% | |
U.S. Treasury Bills
0.050%, 05/15/14 (e) | | | 1,225,000 | | | | 1,224,777 | |
0.051%, 05/15/14 (e) | | | 425,000 | | | | 424,921 | |
0.078%, 05/15/14 (e) | | | 1,300,000 | | | | 1,299,627 | |
0.084%, 05/15/14 (e) | | | 25,000 | | | | 24,992 | |
0.086%, 05/15/14 (e) | | | 1,725,000 | | | | 1,724,454 | |
0.093%, 05/15/14 (e) | | | 450,000 | | | | 449,846 | |
| | | | | | | | |
| | | | | | | 5,148,617 | |
| | | | | | | | |
Total Short-Term Investments
(Cost $171,443,373) | | | | | | | 171,443,373 | |
| | | | | | | | |
Total Investments—102.1%
(Cost $4,086,739,391)(g) | | | | | | | 6,526,175,264 | |
Other assets and liabilities (net)—(2.1)% | | | | | | | (135,791,686 | ) |
| | | | | | | | |
| Net Assets—100.0% | | | | | | $ | 6,390,383,578 | |
| | | | | | | | |
| * | Principal amount stated in U.S. dollars unless otherwise noted. |
| (a) | All or a portion of the security was held on loan. As of December 31, 2013, the market value of securities loaned was $159,853,300 and the collateral received consisted of cash in the amount of $149,596,254 and non-cash collateral with a value of $13,947,671. The cash collateral is invested in a money market fund managed by an affiliate of the custodian. The non-cash collateral received consists primarily of government securities and bank letters of credit, and is held for the benefit of the Portfolio at the Portfolio’s custodian. The Portfolio cannot repledge or resell this collateral. As such, this collateral is excluded from the Statement of Assets and Liabilities. |
| (b) | Non-income producing security. |
| (c) | Affiliated Issuer. (See Note 7 of the Notes to Financial Statements for a summary of transactions in securities of affiliated Underlying Portfolios.) |
| (d) | All or a portion of the security was pledged as collateral against open futures contracts. As of December 31, 2013, the market value of securities pledged was $22,414,200. |
| (e) | The rate shown represents the discount rate at the time of purchase by the Portfolio. |
| (f) | Represents investment of cash collateral received from securities lending transactions. |
| (g) | As of December 31, 2013, the aggregate cost of investments for federal income tax purposes was $4,219,772,483. The aggregate unrealized appreciation and depreciation of investments were $2,396,677,306 and $(90,274,525), respectively, resulting in net unrealized appreciation of $2,306,402,781 for federal income tax purposes. |
| (ETF)— | Exchange-Traded Fund |
Futures Contracts
| | | | | | | | | | | | | | | | | | |
Futures Contracts—Long | | Expiration
Date | | Number of
Contracts | | | Notional
Amount | | | Unrealized
Appreciation | |
S&P 500 Index Futures | | 03/20/14 | | | 80 | | | | USD | | | | 35,489,214 | | | $ | 1,332,786 | |
| | | | | | | | | | | | | | | | | | |
| (USD)— | United States Dollar |
See accompanying notes to financial statements.
MSF-10
Metropolitan Series Fund
MetLife Stock Index Portfolio
Schedule of Investments as of December 31, 2013
Fair Value Hierarchy
Accounting principles generally accepted in the United States of America (“GAAP”) define fair market value as the price that the Portfolio would receive to sell an asset or pay to transfer a liability in an orderly transaction between market participants at the measurement date. It establishes a fair value hierarchy that prioritizes inputs to valuation methods and requires disclosure of the fair value hierarchy that segregates fair value measurements into three levels. Levels 1, 2 and 3 of the fair value hierarchy are defined as follows:
Level 1 - unadjusted quoted prices in active markets for identical investments
Level 2 - other significant observable inputs (including, but not limited to, unadjusted quoted prices for similar investments in markets that are either active or inactive; inputs other than quoted prices that are observable such as interest rates, yield curves, volatilities, prepayment speeds, loss severities, credit risks, default rates, etc.)
Level 3 - significant unobservable inputs based on the best information available in the circumstances, to the extent observable inputs are unavailable (including the Portfolio’s own assumptions in determining the fair value of investments)
The inputs or methodologies used for valuing investments are not necessarily an indication of the risk associated with investing in them. Changes to the inputs or methodologies used may result in transfers between levels, which will be recognized as of the beginning of the reporting period. Information on transfers between Level 1 and Level 2, if any, will be disclosed following the fair value hierarchy table below. A reconciliation of Level 3 securities, if any, will also be disclosed following the fair value hierarchy table. For more information about the Portfolio’s policy regarding the valuation of investments, please refer to the Notes to Financial Statements.
The following table summarizes the fair value hierarchy of the Portfolio’s investments as of December 31, 2013:
| | | | | | | | | | | | | | | | |
| Description | | Level 1 | | | Level 2 | | | Level 3 | | | Total | |
Total Common Stocks* | | $ | 6,326,662,051 | | | $ | — | | | $ | — | | | $ | 6,326,662,051 | |
Total Investment Company Security | | | 28,069,840 | | | | — | | | | — | | | | 28,069,840 | |
| Short-Term Investments | | | | | | | | | | | | | | | | |
Discount Notes | | | — | | | | 16,698,502 | | | | — | | | | 16,698,502 | |
Mutual Fund | | | 149,596,254 | | | | — | | | | — | | | | 149,596,254 | |
U.S. Treasury | | | — | | | | 5,148,617 | | | | — | | | | 5,148,617 | |
Total Short-Term Investments | | | 149,596,254 | | | | 21,847,119 | | | | — | | | | 171,443,373 | |
Total Investments | | $ | 6,504,328,145 | | | $ | 21,847,119 | | | $ | — | | | $ | 6,526,175,264 | |
| | | | | | | | | | | | | | | | | |
Collateral for securities loaned (Liability) | | $ | — | | | $ | (149,596,254 | ) | | $ | — | | | $ | (149,596,254 | ) |
| Futures Contracts | | | | | | | | | | | | | | | | |
Futures Contracts (Unrealized Appreciation) | | $ | 1,332,786 | | | $ | — | | | $ | — | | | $ | 1,332,786 | |
| * | See Schedule of Investments for additional detailed categorizations. |
See accompanying notes to financial statements.
MSF-11
Metropolitan Series Fund
MetLife Stock Index Portfolio
Statement of Assets and Liabilities
December 31, 2013
| | | | |
Assets | | | | |
Investments at value (a) (b) | | $ | 6,502,990,365 | |
Affiliated investments at value (c) | | | 23,184,899 | |
Cash | | | 103,571 | |
Receivable for: | | | | |
Investments sold | | | 35,724,824 | |
Fund shares sold | | | 663,272 | |
Dividends | | | 8,674,846 | |
Variation margin on futures contracts | | | 128,000 | |
Prepaid expenses | | | 15,746 | |
| | | | |
Total Assets | | | 6,571,485,523 | |
Liabilities | | | | |
Collateral for securities loaned | | | 149,596,254 | |
Payables for: | | | | |
Investments purchased | | | 20,724,686 | |
Fund shares redeemed | | | 8,658,142 | |
Accrued Expenses: | �� | | | |
Management fees | | | 1,269,507 | |
Distribution and service fees | | | 443,505 | |
Deferred trustees’ fees | | | 78,440 | |
Other expenses | | | 331,411 | |
| | | | |
Total Liabilities | | | 181,101,945 | |
| | | | |
Net Assets | | $ | 6,390,383,578 | |
| | | | |
Net assets consist of: | | | | |
Paid in surplus | | $ | 3,819,812,754 | |
Undistributed net investment income | | | 104,492,735 | |
Accumulated net realized gain | | | 25,309,430 | |
Unrealized appreciation on investments, affiliated investments and futures contracts | | | 2,440,768,659 | |
| | | | |
Net Assets | | $ | 6,390,383,578 | |
| | | | |
Net Assets | | | | |
Class A | | $ | 4,059,930,232 | |
Class B | | | 1,928,048,986 | |
Class D | | | 237,466,262 | |
Class E | | | 164,938,098 | |
Capital Shares Outstanding* | | | | |
Class A | | | 95,358,567 | |
Class B | | | 46,718,444 | |
Class D | | | 5,593,309 | |
Class E | | | 3,897,332 | |
Net Asset Value, Offering Price and Redemption Price Per Share | | | | |
Class A | | $ | 42.58 | |
Class B | | | 41.27 | |
Class D | | | 42.46 | |
Class E | | | 42.32 | |
| * | The Portfolio is authorized to issue an unlimited number of shares. |
| (a) | Identified cost of investments, excluding affiliated investments, was $4,069,706,227. |
| (b) | Includes securities loaned at value of $159,853,300. |
| (c) | Identified cost of affiliated investments was $17,033,164. |
Statement of Operations
Year Ended December 31, 2013
| | | | |
Investment Income | | | | |
Dividends (a) | | $ | 125,144,810 | |
Dividends from affiliated investments | | | 442,562 | |
Interest | | | 19,758 | |
Securities lending income | | | 545,348 | |
| | | | |
Total investment income | | | 126,152,478 | |
Expenses | | | | |
Management fees | | | 14,779,363 | |
Administration fees | | | 105,887 | |
Custodian and accounting fees | | | 407,842 | |
Distribution and service fees—Class B | | | 4,459,535 | |
Distribution and service fees—Class D | | | 275,134 | |
Distribution and service fees—Class E | | | 236,518 | |
Audit and tax services | | | 46,033 | |
Legal | | | 27,754 | |
Trustees’ fees and expenses | | | 44,481 | |
Shareholder reporting | | | 549,902 | |
Insurance | | | 27,617 | |
Miscellaneous | | | 174,254 | |
| | | | |
Total expenses | | | 21,134,320 | |
Less management fee waiver | | | (711,762 | ) |
| | | | |
Net expenses | | | 20,422,558 | |
| | | | |
Net Investment Income | | | 105,729,920 | |
| | | | |
Net Realized and Unrealized Gain | | | | |
| Net realized gain on: | | | | |
Investments | | | 158,513,699 | |
Affiliated investments | | | 441,701 | |
Futures contracts | | | 7,456,882 | |
| | | | |
Net realized gain | | | 166,412,282 | |
| | | | |
| Net change in unrealized appreciation on: | | | | |
Investments | | | 1,346,449,766 | |
Affiliated investments | | | 8,772,319 | |
Futures contracts | | | 1,437,186 | |
| | | | |
Net change in unrealized appreciation | | | 1,356,659,271 | |
| | | | |
Net realized and unrealized gain | | | 1,523,071,553 | |
| | | | |
Net Increase in Net Assets From Operations | | $ | 1,628,801,473 | |
| | | | |
| (a) | Net of foreign withholding taxes of $25,746. |
See accompanying notes to financial statements.
MSF-12
Metropolitan Series Fund
MetLife Stock Index Portfolio
Statements of Changes in Net Assets
| | | | | | | | |
| | | Year Ended
December 31,
2013 | | | Year Ended
December 31,
2012 | |
Increase (Decrease) in Net Assets: | | | | | | | | |
From Operations | | | | | | | | |
Net investment income | | $ | 105,729,920 | | | $ | 105,213,122 | |
Net realized gain | | | 166,412,282 | | | | 86,901,378 | |
Net change in unrealized appreciation | | | 1,356,659,271 | | | | 554,879,514 | |
| | | | | | | | |
Increase in net assets from operations | | | 1,628,801,473 | | | | 746,994,014 | |
| | | | | | | | |
From Distributions to Shareholders | | | | | | | | |
Net investment income | | | | | | | | |
Class A | | | (67,550,031 | ) | | | (54,702,143 | ) |
Class B | | | (29,917,484 | ) | | | (24,755,083 | ) |
Class D | | | (5,247,947 | ) | | | (5,457,405 | ) |
Class E | | | (2,750,945 | ) | | | (2,505,239 | ) |
Net realized capital gains | | | | | | | | |
Class A | | | (54,812,025 | ) | | | (21,957,230 | ) |
Class B | | | (27,452,554 | ) | | | (11,364,609 | ) |
Class D | | | (4,516,415 | ) | | | (2,311,608 | ) |
Class E | | | (2,415,049 | ) | | | (1,091,297 | ) |
| | | | | | | | |
Total distributions | | | (194,662,450 | ) | | | (124,144,614 | ) |
| | | | | | | | |
Decrease in net assets from capital share transactions | | | (407,289,730 | ) | | | (95,442,142 | ) |
| | | | | | | | |
Total increase in net assets | | | 1,026,849,293 | | | | 527,407,258 | |
| | |
Net Assets | | | | | | | | |
Beginning of period | | | 5,363,534,285 | | | | 4,836,127,027 | |
| | | | | | | | |
End of period | | $ | 6,390,383,578 | | | $ | 5,363,534,285 | |
| | | | | | | | |
| | |
Undistributed Net Investment Income | | | | | | | | |
End of period | | $ | 104,492,735 | | | $ | 104,551,879 | |
| | | | | | | | |
Other Information:
Capital Shares
Transactions in capital shares were as follows:
| | | | | | | | | | | | | | | | |
| | | Year Ended
December 31, 2013 | | | Year Ended
December 31, 2012 | |
| | | Shares | | | Value | | | Shares | | | Value | |
Class A | | | | | | | | | | | | | | | | |
Sales | | | 8,108,154 | | | $ | 305,146,699 | | | | 4,316,668 | | | $ | 138,834,349 | |
Shares issued through acquisition | | | 0 | | | | 0 | | | | 7,973,702 | | | | 258,347,960 | |
Reinvestments | | | 3,491,072 | | | | 122,362,056 | | | | 2,412,189 | | | | 76,659,373 | |
Redemptions | | | (15,091,737 | ) | | | (568,836,283 | ) | | | (14,683,429 | ) | | | (472,702,126 | ) |
| | | | | | | | | | | | | | | | |
Net increase (decrease) | | | (3,492,511 | ) | | $ | (141,327,528 | ) | | | 19,130 | | | $ | 1,139,556 | |
| | | | | | | | | | | | | | | | |
Class B | | | | | | | | | | | | | | | | |
Sales | | | 3,428,042 | | | $ | 125,164,623 | | | | 7,726,978 | | | $ | 238,376,499 | |
Reinvestments | | | 1,685,867 | | | | 57,370,038 | | | | 1,168,922 | | | | 36,119,692 | |
Redemptions | | | (8,190,042 | ) | | | (300,578,645 | ) | | | (9,685,877 | ) | | | (304,221,826 | ) |
| | | | | | | | | | | | | | | | |
Net decrease | | | (3,076,133 | ) | | $ | (118,043,984 | ) | | | (789,977 | ) | | $ | (29,725,635 | ) |
| | | | | | | | | | | | | | | | |
Class D | | | | | | | | | | | | | | | | |
Sales | | | 245,811 | | | $ | 9,330,189 | | | | 68,870 | | | $ | 2,214,437 | |
Reinvestments | | | 279,221 | | | | 9,764,362 | | | | 244,925 | | | | 7,769,013 | |
Redemptions | | | (3,854,105 | ) | | | (145,744,023 | ) | | | (1,844,226 | ) | | | (59,403,796 | ) |
| | | | | | | | | | | | | | | | |
Net decrease | | | (3,329,073 | ) | | $ | (126,649,472 | ) | | | (1,530,431 | ) | | $ | (49,420,346 | ) |
| | | | | | | | | | | | | | | | |
Class E | | | | | | | | | | | | | | | | |
Sales | | | 88,994 | | | $ | 3,322,649 | | | | 113,872 | | | $ | 3,623,244 | |
Reinvestments | | | 148,150 | | | | 5,165,994 | | | | 113,707 | | | | 3,596,536 | |
Redemptions | | | (792,562 | ) | | | (29,757,389 | ) | | | (769,263 | ) | | | (24,655,497 | ) |
| | | | | | | | | | | | | | | | |
Net decrease | | | (555,418 | ) | | $ | (21,268,746 | ) | | | (541,684 | ) | | $ | (17,435,717 | ) |
| | | | | | | | | | | | | | | | |
Decrease derived from capital shares transactions | | | | | | $ | (407,289,730 | ) | | | | | | $ | (95,442,142 | ) |
| | | | | | | | | | | | | | | | |
See accompanying notes to financial statements.
MSF-13
Metropolitan Series Fund
MetLife Stock Index Portfolio
Financial Highlights
| | | | | | | | | | | | | | | | | | | | |
| Selected per share data | | | | | | | | | | | | | | | |
| | | Class A | |
| | | Year Ended December 31, | |
| | | 2013 | | | 2012 | | | 2011 | | | 2010 | | | 2009 | |
Net Asset Value, Beginning of Period | | $ | 33.42 | | | $ | 29.60 | | | $ | 29.71 | | | $ | 26.31 | | | $ | 22.01 | |
| | | | | | | | | | | | | | | | | | | | |
Income (Loss) From Investment Operations | | | | | | | | | | | | | | | | | | | | |
Net investment income (a) | | | 0.71 | | | | 0.67 | | | | 0.55 | | | | 0.49 | | | | 0.48 | |
Net realized and unrealized gain on investments | | | 9.72 | | | | 3.95 | | | | 0.02 | | | | 3.38 | | | | 4.92 | |
| | | | | | | | | | | | | | | | | | | | |
Total from investment operations | | | 10.43 | | | | 4.62 | | | | 0.57 | | | | 3.87 | | | | 5.40 | |
| | | | | | | | | | | | | | | | | | | | |
Less Distributions | | | | | | | | | | | | | | | | | | | | |
Distributions from net investment income | | | (0.70 | ) | | | (0.57 | ) | | | (0.50 | ) | | | (0.47 | ) | | | (0.63 | ) |
Distributions from net realized capital gains | | | (0.57 | ) | | | (0.23 | ) | | | (0.18 | ) | | | 0.00 | | | | (0.47 | ) |
| | | | | | | | | | | | | | | | | | | | |
Total distributions | | | (1.27 | ) | | | (0.80 | ) | | | (0.68 | ) | | | (0.47 | ) | | | (1.10 | ) |
| | | | | | | | | | | | | | | | | | | | |
Net Asset Value, End of Period | | $ | 42.58 | | | $ | 33.42 | | | $ | 29.60 | | | $ | 29.71 | | | $ | 26.31 | |
| | | | | | | | | | | | | | | | | | | | |
Total Return (%) (b) | | | 32.02 | | | | 15.76 | | | | 1.84 | | | | 14.82 | | | | 26.24 | |
| | | | | |
Ratios/Supplemental Data | | | | | | | | | | | | | | | | | | | | |
Gross ratio of expenses to average net assets (%) | | | 0.27 | | | | 0.28 | | | | 0.27 | | | | 0.27 | | | | 0.28 | |
Net ratio of expenses to average net assets (%) (c) | | | 0.26 | | | | 0.27 | | | | 0.26 | | | | 0.27 | | | | 0.27 | |
Ratio of net investment income to average net assets (%) | | | 1.87 | | | | 2.08 | | | | 1.85 | | | | 1.82 | | | | 2.13 | |
Portfolio turnover rate (%) | | | 12 | | | | 12 | | | | 11 | | | | 12 | | | | 23 | |
Net assets, end of period (in millions) | | $ | 4,059.9 | | | $ | 3,303.3 | | | $ | 2,925.8 | | | $ | 3,158.4 | | | $ | 2,976.5 | |
| | | | | | | | | | | | | | | | | | | | |
| | | Class B | |
| | | Year Ended December 31, | |
| | | 2013 | | | 2012 | | | 2011 | | | 2010 | | | 2009 | |
Net Asset Value, Beginning of Period | | $ | 32.43 | | | $ | 28.76 | | | $ | 28.89 | | | $ | 25.61 | | | $ | 21.43 | |
| | | | | | | | | | | | | | | | | | | | |
Income (Loss) From Investment Operations | | | | | | | | | | | | | | | | | | | | |
Net investment income (a) | | | 0.60 | | | | 0.57 | | | | 0.47 | | | | 0.41 | | | | 0.41 | |
Net realized and unrealized gain on investments | | | 9.43 | | | | 3.83 | | | | 0.02 | | | | 3.29 | | | | 4.80 | |
| | | | | | | | | | | | | | | | | | | | |
Total from investment operations | | | 10.03 | | | | 4.40 | | | | 0.49 | | | | 3.70 | | | | 5.21 | |
| | | | | | | | | | | | | | | | | | | | |
Less Distributions | | | | | | | | | �� | | | | | | | | | | | |
Distributions from net investment income | | | (0.62 | ) | | | (0.50 | ) | | | (0.44 | ) | | | (0.42 | ) | | | (0.56 | ) |
Distributions from net realized capital gains | | | (0.57 | ) | | | (0.23 | ) | | | (0.18 | ) | | | 0.00 | | | | (0.47 | ) |
| | | | | | | | | | | | | | | | | | | | |
Total distributions | | | (1.19 | ) | | | (0.73 | ) | | | (0.62 | ) | | | (0.42 | ) | | | (1.03 | ) |
| | | | | | | | | | | | | | | | | | | | |
Net Asset Value, End of Period | | $ | 41.27 | | | $ | 32.43 | | | $ | 28.76 | | | $ | 28.89 | | | $ | 25.61 | |
| | | | | | | | | | | | | | | | | | | | |
Total Return (%) (b) | | | 31.70 | | | | 15.43 | | | | 1.64 | | | | 14.49 | | | | 25.92 | |
| | | | | |
Ratios/Supplemental Data | | | | | | | | | | | | | | | | | | | | |
Gross ratio of expenses to average net assets (%) | | | 0.52 | | | | 0.53 | | | | 0.52 | | | | 0.52 | | | | 0.53 | |
Net ratio of expenses to average net assets (%) (c) | | | 0.51 | | | | 0.52 | | | | 0.51 | | | | 0.52 | | | | 0.52 | |
Ratio of net investment income to average net assets (%) | | | 1.62 | | | | 1.83 | | | | 1.61 | | | | 1.57 | | | | 1.85 | |
Portfolio turnover rate (%) | | | 12 | | | | 12 | | | | 11 | | | | 12 | | | | 23 | |
Net assets, end of period (in millions) | | $ | 1,928.0 | | | $ | 1,615.0 | | | $ | 1,454.7 | | | $ | 1,402.7 | | | $ | 1,130.9 | |
Please see following page for Financial Highlights footnote legend.
See accompanying notes to financial statements.
MSF-14
Metropolitan Series Fund
MetLife Stock Index Portfolio
Financial Highlights
| | | | | | | | | | | | | | | | | | | | |
| Selected per share data | | | | | | | | | | | | | | | |
| | | Class D | |
| | | Year Ended December 31, | |
| | | 2013 | | | 2012 | | | 2011 | | | 2010 | | | 2009(d) | |
Net Asset Value, Beginning of Period | | $ | 33.32 | | | $ | 29.52 | | | $ | 29.63 | | | $ | 26.25 | | | $ | 19.88 | |
| | | | | | | | | | | | | | | | | | | | |
Income (Loss) From Investment Operations | | | | | | | | | | | | | | | | | | | | |
Net investment income (a) | | | 0.66 | | | | 0.63 | | | | 0.52 | | | | 0.46 | | | | 0.31 | |
Net realized and unrealized gain on investments | | | 9.71 | | | | 3.94 | | | | 0.02 | | | | 3.37 | | | | 6.06 | |
| | | | | | | | | | | | | | | | | | | | |
Total from investment operations | | | 10.37 | | | | 4.57 | | | | 0.54 | | | | 3.83 | | | | 6.37 | |
| | | | | | | | | | | | | | | | | | | | |
Less Distributions | | | | | | | | | | | | | | | | | | | | |
Distributions from net investment income | | | (0.66 | ) | | | (0.54 | ) | | | (0.47 | ) | | | (0.45 | ) | | | 0.00 | |
Distributions from net realized capital gains | | | (0.57 | ) | | | (0.23 | ) | | | (0.18 | ) | | | 0.00 | | | | 0.00 | |
| | | | | | | | | | | | | | | | | | | | |
Total distributions | | | (1.23 | ) | | | (0.77 | ) | | | (0.65 | ) | | | (0.45 | ) | | | 0.00 | |
| | | | | | | | | | | | | | | | | | | | |
Net Asset Value, End of Period | | $ | 42.46 | | | $ | 33.32 | | | $ | 29.52 | | | $ | 29.63 | | | $ | 26.25 | |
| | | | | | | | | | | | | | | | | | | | |
Total Return (%) (b) | | | 31.91 | | | | 15.62 | | | | 1.76 | | | | 14.68 | | | | 32.04 | (e) |
| | | | | |
Ratios/Supplemental Data | | | | | | | | | | | | | | | | | | | | |
Gross ratio of expenses to average net assets (%) | | | 0.37 | | | | 0.38 | | | | 0.37 | | | | 0.37 | | | | 0.38 | (f) |
Net ratio of expenses to average net assets (%) (c) | | | 0.36 | | | | 0.37 | | | | 0.36 | | | | 0.37 | | | | 0.37 | (f) |
Ratio of net investment income to average net assets (%) | | | 1.77 | | | | 1.97 | | | | 1.75 | | | | 1.71 | | | | 1.93 | (f) |
Portfolio turnover rate (%) | | | 12 | | | | 12 | | | | 11 | | | | 12 | | | | 23 | |
Net assets, end of period (in millions) | | $ | 237.5 | | | $ | 297.3 | | | $ | 308.6 | | | $ | 360.5 | | | $ | 443.0 | |
| | | | | | | | | | | | | | | | | | | | |
| | | Class E | |
| | | Year Ended December 31, | |
| | | 2013 | | | 2012 | | | 2011 | | | 2010 | | | 2009 | |
Net Asset Value, Beginning of Period | | $ | 33.22 | | | $ | 29.44 | | | $ | 29.55 | | | $ | 26.19 | | | $ | 21.90 | |
| | | | | | | | | | | | | | | | | | | | |
Income (Loss) From Investment Operations | | | | | | | | | | | | | | | | | | | | |
Net investment income (a) | | | 0.65 | | | | 0.62 | | | | 0.50 | | | | 0.44 | | | | 0.44 | |
Net realized and unrealized gain on investments | | | 9.67 | | | | 3.92 | | | | 0.03 | | | | 3.36 | | | | 4.91 | |
| | | | | | | | | | | | | | | | | | | | |
Total from investment operations | | | 10.32 | | | | 4.54 | | | | 0.53 | | | | 3.80 | | | | 5.35 | |
| | | | | | | | | | | | | | | | | | | | |
Less Distributions | | | | | | | | | | | | | | | | | | | | |
Distributions from net investment income | | | (0.65 | ) | | | (0.53 | ) | | | (0.46 | ) | | | (0.44 | ) | | | (0.59 | ) |
Distributions from net realized capital gains | | | (0.57 | ) | | | (0.23 | ) | | | (0.18 | ) | | | 0.00 | | | | (0.47 | ) |
| | | | | | | | | | | | | | | | | | | | |
Total distributions | | | (1.22 | ) | | | (0.76 | ) | | | (0.64 | ) | | | (0.44 | ) | | | (1.06 | ) |
| | | | | | | | | | | | | | | | | | | | |
Net Asset Value, End of Period | | $ | 42.32 | | | $ | 33.22 | | | $ | 29.44 | | | $ | 29.55 | | | $ | 26.19 | |
| | | | | | | | | | | | | | | | | | | | |
Total Return (%) (b) | | | 31.83 | | | | 15.54 | | | | 1.71 | | | | 14.60 | | | | 26.06 | |
| | | | | |
Ratios/Supplemental Data | | | | | | | | | | | | | | | | | | | | |
Gross ratio of expenses to average net assets (%) | | | 0.42 | | | | 0.43 | | | | 0.42 | | | | 0.42 | | | | 0.43 | |
Net ratio of expenses to average net assets (%) (c) | | | 0.41 | | | | 0.42 | | | | 0.41 | | | | 0.42 | | | | 0.42 | |
Ratio of net investment income to average net assets (%) | | | 1.72 | | | | 1.92 | | | | 1.69 | | | | 1.67 | | | | 1.98 | |
Portfolio turnover rate (%) | | | 12 | | | | 12 | | | | 11 | | | | 12 | | | | 23 | |
Net assets, end of period (in millions) | | $ | 164.9 | | | $ | 147.9 | | | $ | 147.0 | | | $ | 180.9 | | | $ | 186.2 | |
| (a) | Per share amounts based on average shares outstanding during the period. |
| (b) | Total return does not reflect any insurance, sales, separate account or administrative charges of variable annuity or life insurance contracts or any additional expenses that contract owners may bear under their variable contracts. If these charges were included, the returns would be lower. |
| (c) | Net ratio of expenses to average net assets includes the effect of management fee waivers as detailed in Note 6 of the Notes to Financial Statements. |
| (d) | Commencement of operations was April 28, 2009. |
| (e) | Periods less than one year are not computed on an annualized basis. |
| (f) | Computed on an annualized basis. |
See accompanying notes to financial statements.
MSF-15
Metropolitan Series Fund
MetLife Stock Index Portfolio
Notes to Financial Statements—December 31, 2013
1. Organization
Metropolitan Series Fund (the “Trust”) is organized as a Delaware statutory trust and registered under the Investment Company Act of 1940, as amended (the “1940 Act”), as an open-end management investment company. The Trust is currently comprised of thirty series, each of which operates as a distinct investment vehicle of the Trust. The portfolio included in this report is MetLife Stock Index Portfolio (the “Portfolio”), which is diversified. Shares in the Portfolio are not offered directly to the general public and are currently available only to separate accounts established by Metropolitan Life Insurance Company (“MetLife”) and other affiliated life insurance companies.
The Portfolio has registered and offers four classes of shares: Class A, B, D, and E shares. Shares of each Class of the Portfolio represent an equal pro rata interest in the Portfolio and generally give the shareholder the same voting, dividend, liquidation, and other rights. Investment income, realized and unrealized capital gains and losses, the common expenses of the Portfolio, and certain Portfolio-level expense reductions, if any, are allocated on a pro rata basis to each Class based on the relative net assets of each Class to the net assets of the Portfolio. Each Class of shares differs in its respective distribution plan and such distribution expenses are allocated to that Class.
2. Significant Accounting Policies
The preparation of financial statements in conformity with accounting principles generally accepted in the United States of America (“GAAP”) requires management to make estimates and assumptions that affect the reported amounts of assets and liabilities and disclosure of contingent assets and liabilities as of the date of the financial statements and the reported amounts of income and expenses during the reporting period. Actual results could differ from those estimates. In the preparation of these financial statements, management has evaluated events and transactions subsequent to December 31, 2013 through the date the financial statements were issued.
The following is a summary of significant accounting policies consistently followed by the Portfolio in the preparation of its financial statements.
Investment Valuation and Fair Value Measurements - Debt securities (other than short term obligations with a remaining maturity of sixty days or less), including corporate, convertible and municipal bonds and notes; obligations of the U.S. treasury and U.S. government agencies; sovereign issues; floating rate loans; and non-U.S. bonds, are generally valued on the basis of evaluated or composite bid quotations obtained from independent pricing services and/or brokers and dealers selected by MetLife Advisers, LLC (“MetLife Advisers” or the “Adviser”), an affiliate of MetLife, Inc., pursuant to authorization of the Board of Trustees of the Trust (the “Board” or “Trustees”). Such quotations utilize matrix pricing, which considers observable inputs including, among other things, issuer details, maturity dates, interest rates, yield curves, rates of prepayment, credit risks/spreads, default rates, reported trades, broker dealer quotes and quoted prices for similar securities. Securities that use similar valuation techniques and inputs as described above are generally categorized as Level 2 within the fair value hierarchy.
Mortgage and asset-backed securities are usually issued as separate tranches, or classes, of securities within each deal. These securities are also generally valued on the basis of evaluated or composite bid quotations obtained from independent pricing services and/or brokers and dealers selected by the Adviser pursuant to authorization of the Board. The pricing models for these securities usually consider tranche-level attributes, estimated cash flows and market-based yield spreads for each tranche and current market data, and incorporate deal collateral performance, as available. Mortgage and asset-backed securities that use similar valuation techniques and inputs as described above are generally categorized as Level 2 within the fair value hierarchy.
Short term obligations with a remaining maturity of sixty days or less are generally valued at amortized cost, which approximates fair market value, and are generally categorized as Level 2 within the fair value hierarchy.
Domestic and foreign equity securities, such as common stock, exchange-traded funds, rights, warrants, and preferred stock, that are traded on a securities exchange, are generally valued at their last sale price on the exchange or market in which they are principally traded on the valuation date, or, if no sales occurred on that day, at the last reported bid price. Equity securities traded over-the-counter are generally valued at the last reported sale price. Valuation adjustments may be applied to certain foreign equity securities that are traded solely on foreign exchanges that close before the close of the U.S. market to account for the market movement between the close of the foreign exchanges and the close of the U.S. market. The Portfolio may use a systematic fair valuation model provided by an independent third party to value securities principally traded in these foreign markets in order to adjust for possible stale pricing that may occur between the close of the foreign exchanges and the time of the Portfolio valuation. Foreign equity securities using these valuation adjustments are generally categorized as Level 2 within the fair value hierarchy. Equity securities that are actively traded, and have no valuation adjustments applied, are categorized as Level 1 within the fair value hierarchy. Other equity securities traded on inactive markets, or valued in reference to similar instruments traded on active markets, are generally categorized as Level 2 within the fair value hierarchy.
MSF-16
Metropolitan Series Fund
MetLife Stock Index Portfolio
Notes to Financial Statements—December 31, 2013—(Continued)
Investments in registered open-end management investment companies are valued at reported net asset value per share on the valuation date and are categorized as Level 1 within the fair value hierarchy.
Forward foreign currency exchange contracts are valued through an independent pricing service based on the mean between closing bid and ask prices of the forward currency rates in the London foreign exchange markets on a daily basis as provided by a reliable bank or dealer. These contracts are generally categorized as Level 2 within the fair value hierarchy.
Options, whether on securities, indices, futures contracts, or otherwise, traded on exchanges are valued at the last sale price available as of the close of business on the valuation date or, if there is no such price available, at the mean between the last reported bid and ask prices. These types of options are categorized as Level 1 within the fair value hierarchy. Futures contracts, which are traded on commodity exchanges, are valued at their closing prices as of the close of such exchanges and are categorized as Level 1 within the fair value hierarchy.
Options and futures contracts that are traded over-the-counter are generally valued on the basis of quotations provided by broker-dealers or prices provided by pricing service providers who use a series of techniques, including simulation pricing models, to determine the value of the contracts. The pricing models use inputs that are observed from actively quoted markets such as issuer details, indices, spreads, interest rates, yield curves, credit curves, measures of volatility and exchange rates. These contracts are generally categorized as Level 2 within the fair value hierarchy.
If no current market value quotation or other observable inputs are readily available or market value quotations are deemed to be unreliable for a security, the fair value of the security will be determined in accordance with procedures approved by and under the general supervision of the Board. In such a circumstance, the Board has delegated the determination of the fair value of a security to a Valuation Committee (“Committee”) of MetLife Advisers. The Committee provides general pricing oversight and fair value pricing determinations related to portfolio securities and meets on a regular basis to review reports relating to the valuation of the securities in the Portfolio. The Board has delegated to State Street Bank and Trust Company, the Trust’s custodian (“custodian”), the responsibility for calculating the net asset values (“NAVs”) of the Trust’s Portfolios. The Committee is responsible for overseeing the calculation of the NAVs of the Portfolios by the custodian. The Committee also periodically reviews pricing vendors, including the vendor providing fair value pricing for the Portfolio’s foreign securities, and is responsible for overseeing the correction of pricing errors and addressing other pricing issues that arise in the ordinary course of business, such as making real-time fair value determinations, as necessary.
No single standard for determining the fair value of a security can be set forth because fair value depends upon the facts and circumstances with respect to each security. Information relating to any relevant factors may be obtained by the Committee from any appropriate source, including the subadviser of the Portfolio, the custodian, a pricing service, market maker and/or broker for such security or the issuer. Appropriate methodologies for determining fair value under particular circumstances may include: matrix pricing, comparisons of securities with comparable characteristics, value based on multiples of earnings, discount from market price of similar marketable securities or a combination of these and other methods. The Committee maintains a detailed report tracking each fair-valued security that compares the fair value price to the next available trade, vendor or broker price, and provides information on how close the fair value price was to the next quoted price. The Committee reviews a summary of such report monthly. On a quarterly basis, the Board is provided with the following for consideration and ratification or adjustment: (1) a memorandum summarizing the actions taken by the Committee in the prior quarter; and (2) a list of the Portfolio’s securities as of the most recent quarter-end for which market quotations were not readily available.
Investment Transactions and Related Investment Income - Portfolio security transactions are recorded on the trade date. Dividend income is recorded on the ex-dividend date or, for certain foreign securities, when notified. Interest income, which includes amortization of premium and accretion of discount on debt securities, is recorded on the accrual basis. Realized gains and losses on investments are determined on the identified cost basis, which is the same basis used for federal income tax purposes. Foreign income and foreign capital gains on some foreign securities may be subject to foreign taxes, which are accrued as applicable. These foreign taxes have been provided for in accordance with the Portfolio’s understanding of the applicable countries’ tax rules and rates.
Foreign Currency Translation - The books and records of the Portfolio are maintained in U.S. dollars. The values of securities, currencies, and other assets and liabilities denominated in currencies other than the U.S. dollar are translated into U.S. dollars based upon foreign exchange rates prevailing at the end of the period. Purchases and sales of investment securities, income, and expenses are translated on the respective dates of such transactions. Because the values of investment securities are translated at the foreign exchange rates prevailing at the end of the period, that portion of the results of operations arising from changes in exchange rates and that portion of the results of operations reflecting fluctuations arising from changes in market prices of the investment securities are not separated. Such fluctuations are included in the net realized and unrealized gain or loss on investments.
Net realized foreign exchange gains or losses arise from activity in forward foreign currency exchange contracts, sales of foreign currency, currency gains or losses realized between the trade and settlement dates on securities transactions, and the difference between the amounts of dividends, interest, and foreign withholding taxes recorded by the Portfolio and the U.S. dollar equivalent of
MSF-17
Metropolitan Series Fund
MetLife Stock Index Portfolio
Notes to Financial Statements—December 31, 2013—(Continued)
the amounts actually received or paid by the Portfolio. Net unrealized foreign exchange gains and losses arise from changes in the value of assets and liabilities, other than investment securities, resulting from changes in foreign exchange rates.
Income Taxes - It is the Portfolio’s policy to comply with the requirements of the Internal Revenue Code of 1986, as amended, and regulations thereunder, applicable to regulated investment companies and to distribute, with respect to each taxable year, all of its taxable income to shareholders. Therefore, no federal income tax provision is required. The Portfolio files U.S. federal tax returns. No income tax returns are currently under examination. The Portfolio’s federal tax returns for the prior three fiscal years remain subject to examination by the Internal Revenue Service. As of December 31, 2013, the Portfolio had no uncertain tax positions that would require financial statement recognition, or de-recognition or disclosure.
Dividends and Distributions to Shareholders - The Portfolio records dividends and distributions on the ex-dividend date. Net realized gains from security transactions (if any) are generally distributed annually to shareholders. The timing and characterization of certain income and capital gains distributions are determined in accordance with federal tax regulations that may differ from GAAP. Permanent book and tax basis differences relating to shareholder distributions will result in reclassification between under/over distributed net investment income, accumulated net realized gains/losses, and paid-in surplus. Book-tax differences are primarily due to real estate investment trust (REIT) adjustments. These adjustments have no impact on net assets or the results of operations.
Securities Lending - The Portfolio may lend its portfolio securities to certain qualified brokers who borrow securities in order to complete certain securities transactions. By lending its portfolio securities, the Portfolio attempts to increase its net investment income through the receipt of income on collateral held from securities on loan. Any gain or loss in the market price of the loaned securities that might occur and any interest earned or dividends declared during the term of the loan would accrue to the account of the Portfolio.
The Trust has entered into a securities lending arrangement with the custodian. Under this arrangement, the custodian is authorized to loan portfolio securities on the Portfolio’s behalf. In exchange, the Portfolio receives either cash or securities as collateral against the loaned securities. The Portfolio receives collateral at least equal to 102% of the market value of the loaned securities (105% for foreign equity securities), at each loan’s inception. Collateral representing at least 100% of the market value of the loaned securities must be maintained for the duration of the loan. A liability for cash collateral is reflected on the Statement of Assets and Liabilities, and is categorized as Level 2 within the fair value hierarchy. Cash collateral is generally invested in the State Street Navigator Securities Lending MET Portfolio (the “Navigator Portfolio”), a series of the State Street Navigator Securities Lending Trust that is managed by an affiliate of the custodian. The Navigator Portfolio is a registered money market fund that invests in a variety of high-quality, U.S. dollar-denominated instruments. If the market value of the collateral at the close of trading on a business day is less than 100% of the market value of the loaned securities at the close of trading on that day, the borrower shall be required to deliver, by the close of business on the following business day, an additional amount of collateral, so that the total amount of posted collateral is equal to at least 100% of the market value of all the loaned securities as of such preceding day. A portion of net income (income after the deduction of expenses and fees of the Navigator Portfolio) on the collateral is rebated to the borrower of the securities and the remainder is split between the custodian and the Portfolio. On loans collateralized by U.S. Treasuries, a fee is received from the borrower and is allocated between the Portfolio and the custodian. The risks associated with lending portfolio securities include, but are not limited to, possible delays in receiving additional collateral or in the recovery of the loaned securities, possible loss of rights in the collateral should the borrower fail financially, as well as risk of loss in the value of the collateral or the value of the investments made with the collateral. The lending agent has agreed to indemnify the Portfolio in the case of default of any securities borrower. Income received by the Portfolio in securities lending transactions during the year ended December 31, 2013 is reflected as Securities lending income on the Statement of Operations. Any outstanding loans by the Portfolio at December 31, 2013 are disclosed in the footnotes to the Schedule of Investments.
3. Investments in Derivative Instruments
Futures Contracts - The Portfolio may buy and sell futures contracts as a hedge, to maintain investment exposure to a target asset class or to enhance return. The Portfolio may be subject to fluctuations in equity prices, interest rates, commodity prices, and foreign currency exchange rates in the normal course of pursuing its investment objective. Futures contracts are standardized agreements to buy or sell a security, or deliver a final cash settlement price in connection with an index, interest rate, currency, or other asset. The Portfolio must deposit an amount (“initial margin”) equal to a certain percentage of the face value of the futures contract. The initial margin may be in the form of cash or securities, which is returned when the Portfolio’s obligations under the contract have been satisfied. If cash is deposited as the initial margin, it is shown as cash collateral on the Statement of Assets and Liabilities. Futures contracts are marked-to-market daily, and subsequent payments (“variation margin”) are made or received by the Portfolio depending on whether unrealized gains or losses are incurred. These amounts are reflected as receivables or payables on the Statement of Assets and Liabilities and as a component of net change in unrealized appreciation/depreciation on the Statement of Operations. When the contract is closed or expires, the Portfolio records a realized gain or loss equal to the difference between the value of the contract at the time it was opened and the value at the time it was closed. Risks of entering into futures contracts (and related options) include the possibility that the market for these instruments may be illiquid and that a change in the value of the contract or option may not
MSF-18
Metropolitan Series Fund
MetLife Stock Index Portfolio
Notes to Financial Statements—December 31, 2013—(Continued)
correlate perfectly with changes in the value of the underlying instrument. Futures contracts are exchange-traded and the exchange’s clearinghouse, as counterparty to all exchange-traded futures, guarantees the futures contracts against default. For over-the-counter futures the Portfolio’s ability to terminate the positions may be more limited than in the case of exchange-traded positions and may also involve the risk that securities dealers participating in such transactions would fail to meet their obligations to the Portfolio.
At December 31, 2013, the Portfolio had the following derivatives, categorized by risk exposure:
| | | | | | |
| | | Asset Derivatives | |
Risk Exposure | | Statement of Assets &
Liabilities Location | | Fair Value | |
Equity | | Unrealized appreciation on futures contracts* | | $ | 1,332,786 | |
| | | | | | |
| | * | Includes cumulative appreciation/depreciation of futures contracts as reported in the Schedule of Investments. Only the current day’s variation margin is reported within the Statement of Assets and Liabilities. |
Transactions in derivative instruments during the year ended December 31, 2013 were as follows:
| | | | |
Statement of Operations Location—Net Realized Gain (Loss) | | Equity | |
Futures contracts | | $ | 7,456,882 | |
| | | | |
| |
Statement of Operations Location—Net Change in Unrealized Appreciation (Depreciation) | | Equity | |
Futures contracts | | $ | 1,437,186 | |
| | | | |
For the year ended December 31, 2013, the average amount or number per contract outstanding for each derivative type was as follows:
| | | | |
Derivative Description | | Average
Notional Par or
Face Amount‡ | |
Futures contracts long | | $ | 20,000 | |
| | ‡ | Averages are based on activity levels during 2013. |
4. Certain Risks
Market Risk: In the normal course of business, the Portfolio invests in securities and enters into transactions where risks exist due to fluctuations in the market (market risk) or failure of the other party to a transaction to perform (credit and counterparty risk). The value of securities held by the Portfolio may decline in response to certain events, including those directly involving the companies whose securities are owned by the Portfolio; conditions affecting the general economy; overall market changes; local, regional or global political, social or economic instability; currency, interest rate, and price fluctuations.
Credit and Counterparty Risk: The Portfolio may be exposed to counterparty risk, or the risk that an entity with which the Portfolio has unsettled or open transactions may default. The potential loss could exceed the value of the financial assets and liabilities recorded in the financial statements. Financial assets that potentially expose the Portfolio to credit and counterparty risk consist principally of cash due from counterparties and investments. The Portfolio manages counterparty risk by entering into agreements only with counterparties that it believes have the financial resources to honor their obligations and by monitoring the financial stability of those counterparties. The Portfolio’s investment adviser attempts to mitigate counterparty risk by (i) periodically assessing the creditworthiness of its trading partners, (ii) monitoring and/or limiting the amount of its net exposure to each individual counterparty based on its assessment, and (iii) requiring collateral from the counterparty for certain transactions. In order to preserve certain safeguards for non-standard settlement trades, the Portfolio restricts its exposure to credit and counterparty losses by entering into master netting agreements with counterparties (approved brokers) with whom it undertakes a significant volume of transactions.
Customer Account Agreements and related addendums govern cleared derivatives transactions such as futures, options on futures, and cleared OTC derivatives. Cleared derivative transactions require posting of initial margin as determined by each relevant clearing agency which is segregated at a broker account registered with the Commodities Futures Trading Commission (CFTC), or the applicable regulator. In the U.S., counterparty risk is significantly reduced as creditors of the futures broker do not have claim to Portfolio assets in the segregated account. Additionally, portability of exposure in the event of default further reduces risk to the Portfolio. Variation margin, or changes in market value, are exchanged daily, but may not be netted between futures and cleared OTC derivatives.
MSF-19
Metropolitan Series Fund
MetLife Stock Index Portfolio
Notes to Financial Statements—December 31, 2013—(Continued)
Additional risks associated with each type of investment are described above within the respective security type notes. The Portfolio’s prospectus includes a discussion of the principal risks of investing in the Portfolio.
5. Investment Transactions
Aggregate cost of purchases and proceeds of sales of investment securities, excluding short-term securities, for the year ended December 31, 2013 were as follows:
| | | | | | | | | | | | |
Purchases | | | Sales | |
U.S. Government | | Non U.S. Government | | | U.S. Government | | | Non U.S. Government | |
| $0 | | $ | 675,896,499 | | | $ | 0 | | | $ | 1,158,296,433 | |
6. Investment Management Fees and Other Transactions with Affiliates
Investment Management Agreement - MetLife Advisers is the investment adviser to the Portfolio. The Trust has entered into an investment management agreement with MetLife Advisers with respect to the Portfolio. For providing investment management services to the Portfolio, MetLife Advisers receives monthly compensation at the annual rate of 0.250% of average daily net assets. Fees earned by MetLife Advisers with respect to the Portfolio for the year ended December 31, 2013 were $14,779,363.
MetLife Advisers has entered into an investment subadvisory agreement with MetLife Investment Management, LLC (“MIM”) with respect to the Portfolio. For providing subadvisory services to the Portfolio, MetLife Advisers has agreed to pay MIM an investment subadvisory fee for each class of the Portfolio as follows:
| | |
% per annum | | Average Daily Net Assets |
| 0.020% | | On the first $500 million |
| 0.015% | | Of the next $500 million |
| 0.010% | | Of the next $1 billion |
| 0.005% | | On amounts over $2 billion |
Fees earned by MIM with respect to the Portfolio for the year ended December 31, 2013 were $470,587.
Management Fee Waivers - Pursuant to an expense agreement, MetLife Advisers has agreed, for the period April 29, 2013 through April 27, 2014, to reduce its advisory fees set out above under “Investment Management Agreement” for each class of the Portfolio as follows:
| | |
% per annum | | Average Daily Net Assets |
| 0.005% | | Over $500 million and under $1 billion |
| 0.010% | | Of the next $1 billion |
| 0.015% | | On amounts over $2 billion |
An identical expense agreement was in place for the period April 30, 2012 through April 28, 2013. Amounts waived for the year ended December 31, 2013 are shown as management fee waivers in the Statement of Operations.
Certain officers and trustees of the Trust may also be officers of MetLife Advisers; however, such officers and trustees receive no compensation from the Trust.
Transfer Agency Agreement - MetLife serves as the transfer agent for the Trust. MetLife receives no fees for its services to the Trust under the transfer agency agreement.
Distribution and Service Fees - The Trust has a distribution agreement with MetLife Investors Distribution Company (“MIDC” or the “Distributor”) in which MIDC serves as the distributor for the Portfolio’s Class A, B, D, and E Shares. MIDC is a wholly-owned subsidiary of MetLife Investors Group, Inc., an affiliate of the Adviser. The Trust has also adopted a Distribution and Service Plan under Rule 12b-1 of the 1940 Act for the Portfolio’s Class B, D, and E Shares. Under the Distribution and Service Plan, the Class B, D, and E Shares of the Portfolio pay a fee to compensate the Insurance Companies (or their affiliates) and other broker-dealers and financial intermediaries involved in the offer and sale of Portfolio shares for promoting or selling and servicing the Class B, D, and E Shares. The fees under the Distribution and Service Plan for each class of the Portfolio’s shares are calculated as a percentage of the Portfolio’s average daily net assets that are attributable to that Class. Currently, the fee is 0.25% per year for Class B Shares, 0.10% per year for Class D Shares, and 0.15% per year for Class E Shares. Amounts incurred by the Portfolio for the year ended December 31, 2013 are shown as Distribution and service fees in the Statement of Operations.
Deferred Trustee Compensation - Each Trustee who is not currently an employee of the Adviser or any of its affiliates receives compensation from the Trust for his or her service to the Trust. A deferred compensation plan (the “Plan”) is available to the Trustees
MSF-20
Metropolitan Series Fund
MetLife Stock Index Portfolio
Notes to Financial Statements—December 31, 2013—(Continued)
on a voluntary basis. Deferred amounts remain in the Trust until distributed in accordance with the provisions of the Plan. The value of a participating Trustee’s deferral account is based on theoretical investments of deferred amounts, on the normal payment dates in certain portfolios of the Trust or Met Investors Series Trust, an affiliate of the Trust, as designated by the participating Trustee. Changes in the value of participants’ deferral accounts are reflected as Trustees’ fees and expenses in the Statement of Operations. The portion of the accrued obligations allocated to the Portfolio under the Plan is reflected as Deferred trustees’ fees in the Statement of Assets and Liabilities.
7. Transactions in Securities of Affiliated Issuers
A summary of the Portfolio’s transactions in the securities of affiliated issuers during the year ended December 31, 2013 is as follows:
| | | | | | | | | | | | | | | | | | | | | | | | |
Security Description | | Number of
shares held at
December 31, 2012 | | | Shares
purchased | | | Shares sold | | | Number of
shares held at
December 31, 2013 | | | Realized Gain
on shares sold | | | Income for
the year ended
December 31, 2013 | |
MetLife, Inc. | | | 452,586 | | | | 14,564 | | | | (37,163 | ) | | | 429,987 | | | $ | 441,701 | | | $ | 442,562 | |
8. Contractual Obligations
Under the Trust’s organizational documents, its officers and Trustees may be indemnified against certain liabilities and expenses arising out of the performance of their duties to the Trust. Additionally, the Trust has a variety of indemnification obligations under contracts with its service providers. The Trust’s maximum exposure under these arrangements is unknown, as this would involve future claims that may be made against the Trust that have not yet occurred.
9. Income Tax Information
The tax character of distributions paid for the periods ended December 31, 2013 and 2012 was as follows:
| | | | | | | | | | | | | | | | | | | | |
Ordinary Income | | | Long-Term Capital Gain | | | Total | |
2013 | | 2012 | | | 2013 | | | 2012 | | | 2013 | | | 2012 | |
| $105,466,407 | | $ | 87,419,870 | | | $ | 89,196,043 | | | $ | 36,724,744 | | | $ | 194,662,450 | | | $ | 124,144,614 | |
As of December 31, 2013, the components of distributable earnings (accumulated losses) on a federal income tax basis were as follows:
| | | | | | | | | | | | | | | | |
Undistributed
Ordinary
Income | | Undistributed
Long-Term
Capital Gain | | | Net
Unrealized
Appreciation | | | Loss Carryforwards | | | Total | |
| $122,743,637 | | $ | 141,502,847 | | | $ | 2,306,402,781 | | | $ | — | | | $ | 2,570,649,265 | |
The Portfolio utilizes the provisions of the federal income tax laws that provide for the carryforward of capital losses for prior years, offsetting such losses against any future realized capital gains. Under the Regulated Investment Company Modernization Act of 2010 (the “Act”), net capital losses recognized after December 22, 2010 may be carried forward indefinitely and their character is retained as short-term and/or long-term losses. Previously, net capital losses were carried forward for up to eight years and treated as short-term losses. As a transition rule, the Act requires that post-enactment net capital losses be used before pre-enactment net capital losses. At December 31, 2013, the Portfolio did not have any capital loss carryforwards.
As of December 31, 2013, the Portfolio had no post-enactment accumulated capital losses and no pre-enactment accumulated capital loss carryforwards.
10. Acquisition
At the close of business on April 27, 2012, the Portfolio, with aggregate Class A, Class B, Class D, and Class E net assets of $3,163,484,764, $1,591,300,792, $331,145,988, and $155,799,163, respectively, acquired all of the assets and liabilities of Batterymarch Growth and Income Portfolio of the Met Investors Series Trust (“Batterymarch Growth & Income”). The acquisition was accomplished by a tax-free exchange of 7,973,702 Class A shares of the Portfolio (valued at $258,347,960) for 14,335,017 Class A shares of Batterymarch Growth & Income. The transaction was part of a restructuring designed to eliminate the offering of overlapping Portfolios in the MetLife, Inc. families of funds with similar investment objectives and similar investment strategies that serve as funding vehicles for insurance contracts that are offered by affiliates of MetLife. The reorganization was proposed because Batterymarch Growth & Income had experienced a significant decline in assets, which, if it continued, would affect the Portfolio’s ability to maintain certain operational efficiencies.
MSF-21
Metropolitan Series Fund
MetLife Stock Index Portfolio
Notes to Financial Statements—December 31, 2013—(Continued)
Batterymarch Growth & Income’s net assets on April 27, 2012, were $258,347,960 for Class A, including investments valued at $258,291,796 with a cost basis of $231,750,503. For financial reporting purposes, assets received, liabilities assumed, and shares issued by the Portfolio were recorded at fair value; however, the cost basis of the investments received by the Portfolio from Batterymarch Growth & Income were carried forward to align ongoing reporting of the Portfolio’s realized and unrealized gains and losses with amounts distributable to shareholders for tax purposes. The Portfolio acquired $(27,266,415) in capital loss carry forwards from Batterymarch Growth & Income.
The aggregate net assets of the Portfolio immediately after the acquisition were $5,500,078,667, which included $26,541,293 of acquired unrealized appreciation.
Assuming the acquisition had been completed on January 1, 2012, the Portfolio’s pro-forma results of operations for the year ended December 31, 2012 would have been as follows:
| | | | |
(Unaudited) | | | |
Net Investment income | | $ | 106,567,189 | (a) |
Net realized and unrealized gain on investments | | $ | 669,519,126 | (b) |
| | | | |
Net increase in net assets from operations | | $ | 776,086,315 | |
| | | | |
Because the combined investment portfolios have been managed as a single integrated portfolio since the acquisition was completed, it is not practicable to separate the amounts of revenue and earnings of Batterymarch Growth & Income that have been included in the Portfolio’s Statement of Operations since April 27, 2012.
| (a) | $105,213,122 net investment income as reported plus $1,058,350 from Batterymarch Growth & Income Portfolio pre-merger net investment income, plus $277,510 in lower advisory fees, plus $18,207 of pro-forma eliminated other expenses. |
| (b) | $1,084,109,388 unrealized appreciation as reported December 31, 2012 minus $522,794,296 pro-forma December 31, 2011 unrealized appreciation plus $86,901,378 net realized gain as reported plus $21,302,656 in net realized gain from Batterymarch Growth & Income Portfolio pre-merger. |
MSF-22
Metropolitan Series Fund
MetLife Stock Index Portfolio
Report of Independent Registered Public Accounting Firm
To the Shareholders of MetLife Stock Index Portfolio and the Board of Trustees of Metropolitan Series Fund:
We have audited the accompanying statement of assets and liabilities, including the schedule of investments, of MetLife Stock Index Portfolio, one of the portfolios constituting Metropolitan Series Fund, (the “Trust”) as of December 31, 2013, and the related statement of operations for the year then ended, the statements of changes in net assets for each of the two years in the period then ended, and the financial highlights for each of the five years in the period then ended. These financial statements and financial highlights are the responsibility of the Trust’s management. Our responsibility is to express an opinion on these financial statements and financial highlights based on our audits.
We conducted our audits in accordance with the standards of the Public Company Accounting Oversight Board (United States). Those standards require that we plan and perform the audit to obtain reasonable assurance about whether the financial statements and financial highlights are free of material misstatement. The Trust is not required to have, nor were we engaged to perform, an audit of its internal control over financial reporting. Our audits included consideration of internal control over financial reporting as a basis for designing audit procedures that are appropriate in the circumstances, but not for the purpose of expressing an opinion on the effectiveness of the Trust’s internal control over financial reporting. Accordingly, we express no such opinion. An audit also includes examining, on a test basis, evidence supporting the amounts and disclosures in the financial statements, assessing the accounting principles used and significant estimates made by management, as well as evaluating the overall financial statement presentation. Our procedures included confirmation of securities owned as of December 31, 2013, by correspondence with the custodian and brokers; where replies were not received from brokers, we performed other auditing procedures. We believe that our audits provide a reasonable basis for our opinion.
In our opinion, the financial statements and financial highlights referred to above present fairly, in all material respects, the financial position of MetLife Stock Index Portfolio of Metropolitan Series Fund, as of December 31, 2013, the results of its operations for the year then ended, the changes in its net assets for each of the two years in the period then ended, and the financial highlights for each of the five years in the period then ended, in conformity with accounting principles generally accepted in the United States of America.
Deloitte & Touche LLP
Boston, Massachusetts
February 27, 2014
MSF-23
Metropolitan Series Fund
Trustees and Officers of Metropolitan Series Fund
The Trustees and executive officers of the Trust, their ages and their principal occupations during the past five years are set forth below. Unless otherwise indicated, the business address of each is One Financial Center, Boston, MA 02111. Each Trustee who is deemed an “interested person,” as such term is defined in the 1940 Act, is indicated by an asterisk. Those Trustees who are not “interested persons” as defined in the 1940 Act are referred to as “Independent Trustees.” Additional information about the Trustees is available in the Statement of Additional Information, which is available without charge, upon request, by calling (800) 848-3854.
Trustees of the Trust
| | | | | | | | | | |
Name and Age | | Position(s)
Held with
Registrant | | Term of Office and
Length of Time
Served | | Principal Occupation(s) During the
Past 5 Years(1) | | Number of
Portfolios
in Fund
Complex(2)
overseen | | Other Directorships Held
by Trustee During the
Past 5 Years(1) |
| Interested Trustee | | | | | | | | | | |
| Elizabeth M. Forget* (47) | | Trustee, Chairman of the Board, President and Chief Executive Officer | | Indefinite; From May 2006 (President and Chief Executive Officer)/ August 2006 (Trustee and Chairman of the Board) to present | | Senior Vice President, MetLife Inc.; President, MetLife Advisers, LLC and a predecessor company. | | 79 | | Trustee, Met Investors Series Trust (the “MIST Trust”);** various MetLife-affiliated boards. |
| | | | | |
| Independent Trustees | | | | | | | | | | |
| Stephen M. Alderman (54) | | Trustee | | Indefinite; From April 2012 to present | | Shareholder in the law firm of Garfield & Merel, Ltd. | | 79 | | Trustee, MIST Trust;** Director, International Truck Leasing Corp. |
| | | | | |
| Robert J. Boulware (57) | | Trustee | | Indefinite; From April 2012 to present | | Managing Director, Pilgrim Funds, LLC (private equity fund). | | 79 | | Trustee, MIST Trust;** Trustee, Vertical Capital Income Fund (closed-end fund); Director, Gainsco, Inc. (auto insurance). |
| | | | | |
| Susan C. Gause (61) | | Trustee | | Indefinite; From April 2012 to present | | Private Investor. | | 79 | | Trustee, MIST Trust;** Trustee, HSBC Funds. |
| | | | | |
| Nancy Hawthorne (62) | | Trustee | | Indefinite; From May 2003 to present | | Chief Executive Officer, Clerestory LLC (corporate advisor). | | 79 | | MIST Trust;** Director, THL Credit, Inc.**; Director, Avid Technology, Inc.** |
| | | | | |
| Barbara A. Nugent (57) | | Trustee | | Indefinite; From January 2014 to present | | President, True North Board Governance, LLC (consulting); until 2014, partner in the law firm of Stradley Ronon Stevens & Young, LLP. | | 79 | | Trustee, MIST Trust**; Director, Episcopal Healthcare Foundation; until 2014, member, Mutual Fund Directors Forum Advisory Board. |
| | | | | |
| Keith M. Schappert (62) | | Trustee | | Indefinite; From August 2009 to present | | Principal, Schappert Consulting LLC (asset management consulting). | | 79 | | Trustee, MIST Trust;** Director, The Commonfund for Nonprofit Organizations; until 2011, Director, Trilogy Global Advisors; Director, Mirae Asset Discovery Funds,** Director, Calamos Investments. |
| | | | | |
| Linda B. Strumpf (66) | | Trustee | | Indefinite; From May 2000 to present | | Chair of the Investment Committee, Leona M. and Harry B. Helmsley Charitable Trust; until 2011, Chief Investment Officer, Leona M. and Harry B. Helmsley Charitable Trust. | | 79 | | Since 2012, Trustee, MIST Trust,** Trustee and Member of Investment Committee, The Pennsylvania State University. |
| | | | | |
| Dawn M. Vroegop (47) | | Trustee | | Indefinite; From May 2009 to present | | Private Investor. | | 79 | | Trustee, MIST Trust,** Trustee, Driehaus Mutual Funds; Director and Investment Committee Chair, City College of San Francisco Foundation. |
MSF-24
Metropolitan Series Fund
Trustees and Officers of Metropolitan Series Fund—(Continued)
Executive Officers of the Trust
| | | | | | |
Name and Age | | Position(s) Held with
Registrant | | Term of Office
and Length of
Time Served | | Principal Occupation(s) During Past 5 Years(1) |
| Elizabeth M. Forget (47) | | President, Chief Executive Officer, Trustee and Chairman of the Board | | From May
2006 (President
and Chief
Executive
Officer)/
August 2006
(Trustee and
Chairman of
the Board) to
present | | See principal occupation information in the table above. |
| | | |
| Jeffrey L. Bernier (42) | | Vice President | | From February
2008 to present | | Vice President, MetLife, Inc.; Senior Vice President, MetLife Advisers, LLC and a predecessor company. |
| | | |
| Peter H. Duffy (58) | | Chief Financial Officer and Treasurer | | From November
2000 to present | | Senior Vice President, MetLife Advisers, LLC; Vice President, MetLife, Inc. |
| | | |
| Andrew L. Gangolf (59) | | Secretary | | From May
2011to present | | Senior Vice President, MetLife Advisers, LLC; Senior Vice President & Assistant General Counsel, AllianceBerstein Investments, Inc. |
| | | |
| Jeffrey P. Halperin (46) | | Chief Compliance Officer | | From November
2005 to present | | Vice President, MetLife, Inc.; Chief Compliance Officer, MIST; Chief Compliance Officer, MSF Trust; Chief Compliance Officer, MetLife Advisers, LLC and a predecessor company; Chief Compliance Officer, MetLife Investment Management, LLC (formerly MetLife Investment Advisors Company, LLC). |
| | | |
| Alan C. Leland, Jr. (61) | | Vice President | | From February
2005 to present | | Treasurer and Chief Financial Officer, MetLife Advisers, LLC; Vice President, MetLife Group Inc.; Vice President, MetLife, Inc. |
| * | Ms. Forget is an “interested person” of the Trust because of her positions with MetLife Advisers, LLC and her ownership of securities issued by MetLife, Inc., the ultimate parent company of MetLife Advisers, LLC. |
| ** | Indicates a directorship with a registered investment company or a company subject to the reporting requirements of the Securities Exchange Act of 1934, as amended. |
| (1) | Previous positions during the past five years with the Trust, MetLife, Inc. or the Adviser are omitted if not materially different. |
| (2) | The Fund Complex includes 49 Portfolios of the MIST Trust and 30 Portfolios of the Trust. |
MSF-25
Metropolitan Series Fund
MetLife Stock Index Portfolio
Board of Trustees’ Consideration of Advisory and Sub-Advisory Agreements
At an in-person meeting of the Boards of Trustees (the “Board”) of Met Investors Series Trust and Metropolitan Series Fund (“MIST” and “MSF,” respectively, and collectively, the “Trusts”) held on November 19-20, 2013, the Board, including a majority of the Trustees who are not considered to be “interested persons” of the Trusts (the “Independent Trustees”) under the Investment Company Act of 1940, as amended (the “1940 Act”), approved for an annual period the continuation of each Trust’s advisory agreement (the “Advisory Agreement”) with MetLife Advisers, LLC (the “Adviser”) and the applicable sub-advisory agreements (each a “Sub-Advisory Agreement,” and collectively with the Advisory Agreement, the “Agreements”) between the Adviser and the investment sub-advisers (each a “Sub-Adviser,” and collectively, the “Sub-Advisers”) for each of the series of the Trusts, including the MetLife Stock Index Portfolio (each a “Portfolio,” and collectively, the “Portfolios”).1
In considering the Agreements, the Board reviewed a variety of materials provided by the Adviser and the Sub-Advisers relating to the Portfolios, including comparative performance, fee and expense information for an appropriate peer group of similar mutual funds, performance information for relevant benchmark indices and other information regarding the nature, extent and quality of services provided by the Adviser and the Sub-Advisers under their respective Agreements. The Board also took into account its experience with the Adviser and the Sub-Advisers and information provided to the Board in its meetings throughout the year with respect to the services provided by the Adviser and the Sub-Advisers, including quarterly performance reports prepared by management containing reviews of investment results, and periodic presentations from certain of the Sub-Advisers with respect to the Portfolios they manage. The Independent Trustees also assessed reports provided by the Board’s independent consultant, who reviewed and provided analyses regarding investment performance, fees and expenses, and other information provided by, or at the direction of, the Adviser and the Sub-Advisers, as more fully discussed below.
The Independent Trustees were separately advised by independent legal counsel throughout the process, and met with independent legal counsel in periodic executive sessions. Prior to voting to continue the Agreements at the November meeting, the Independent Trustees also received a memorandum from their independent counsel discussing the legal standards for their consideration of the proposed continuation of the Agreements. The Board also met in person with personnel of the Adviser on September 17, 2013 for the specific purpose of giving preliminary consideration to the proposed continuation of the Agreements and to request additional information they considered reasonably necessary to their deliberations. The Independent Trustees also discussed the proposed continuation of the Agreements in private sessions with their independent legal counsel at which no representatives of management were present.
In considering whether to approve the renewal of the Advisory Agreement with the Adviser and any applicable Sub-Advisory Agreements with respect to a Portfolio, the Board reviewed and analyzed the factors it deemed relevant, including: (1) the nature, extent and quality of the services to be provided to the Portfolios by the Adviser and the Sub-Advisers; (2) the performance of the Portfolios as compared to a peer group and an appropriate index; (3) the Adviser’s and each of the Sub-Adviser’s personnel and operations; (4) the financial condition of the Adviser and of the Sub-Advisers; (5) the level and method of computing each Portfolio’s advisory and sub-advisory fees; (6) the profitability of the Adviser under the Advisory Agreement and of certain of the Sub-Advisers under the Sub-Advisory Agreements; (7) any “fall-out” benefits to the Adviser, the Sub-Advisers and their affiliates (i.e., ancillary benefits realized by the Adviser, the Sub-Advisers or their affiliates from the Adviser’s or Sub-Advisers’ relationship with the Trusts); (8) the anticipated effect of growth in size on Portfolio expenses; (9) fees paid to certain of the Sub-Advisers by comparable institutional and retail accounts; and (10) possible conflicts of interest.
Nature, extent and quality of services. The Board evaluated the nature, extent and quality of the services that the Adviser, and the Sub-Advisers as relevant, have provided to the Portfolios. The Board considered the Adviser’s services as investment manager to the Portfolios, including services relating to the selection and oversight of the Sub-Advisers for the applicable Portfolios. The Board considered, among other things, the Adviser’s oversight of the provision of services to the Portfolios by the Sub-Advisers, including with respect to investment activities and trading practices, and the Sub-Adviser’s compliance with fund policies, objectives and Board directives, compliance policies and procedures and applicable law. The Adviser’s services in coordinating and overseeing the activities of the Trusts’ other service providers were also considered. The Board also evaluated the expertise and performance of the personnel of the Adviser who performed services for the Portfolios throughout the year.
The Board considered information received from the Trust’s Chief Compliance Officer (“CCO”) regarding the Portfolios’ compliance policies and procedures established pursuant to Rule 38a-l under the 1940 Act. The Board also evaluated the CCO’s ongoing reports concerning the CCO’s oversight of the risk assessment processes of the Sub-Advisers.
1 The Pyramis Managed Risk Portfolio recently commenced operations and, therefore, the Agreement with respect to this Portfolio was not up for renewal.
MSF-26
Metropolitan Series Fund
MetLife Stock Index Portfolio
Board of Trustees’ Consideration of Advisory and Sub-Advisory Agreements—(Continued)
With respect to the services provided by each of the Sub-Advisers, the Board considered, among other things, information provided to the Board by each Sub-Adviser. The Board considered the Sub-Adviser’s current level of staffing and its overall resources, as well as its compensation program. The Board reviewed each Sub-Adviser’s history and investment experience, as well as information regarding the qualifications, background and responsibilities of the Sub-Adviser’s investment and compliance personnel who provide services to the Portfolios. The Board also considered, among other things, the Sub-Adviser’s compliance program and any disciplinary history. The Board also took into account the Sub-Adviser’s risk assessment and monitoring process. The Board noted each Sub-Adviser’s regulatory history, including whether it was currently involved in any regulatory actions or investigations as well as material litigation, and any settlements and amelioratory actions undertaken, as appropriate. The Board also noted that the CCO and his staff conduct regular, periodic compliance reviews with each of the Sub-Advisers and present reports to the Independent Trustees regarding the same, which includes evaluating the regulatory compliance systems of the Sub-Advisers and procedures reasonably designed by them to help assure compliance with the federal securities laws, including issues related to late trading and market timing, best execution, fair value pricing, and proxy voting procedures, among others. The Board also took into account the financial condition of each Sub-Adviser. In its review, the Board also received and took into account information regarding any services and/or payments provided to the Adviser by the Sub-Advisers in connection with marketing activities.
The Board considered each Sub-Adviser’s investment process and philosophy. The Board took into account that each Sub-Adviser’s responsibilities include the development and maintenance of an investment program for the applicable Portfolio which is consistent with the Portfolio’s investment objectives, the selection of investment securities and the placement of orders for the purchase and sale of such securities, as well as the implementation of compliance controls related to performance of these services. The Board also reviewed each Sub-Adviser’s brokerage policies and practices.
Performance. The Board considered the performance of the Portfolios as described in the quarterly reports prepared by management, and as also analyzed in reports prepared by the Independent Trustees’ independent consultant. The Board noted that the Adviser reviews with the Board on a quarterly basis detailed information about the Portfolios’ performance results, portfolio composition and investment strategies. The Board also reviewed and considered a separate report prepared by Lipper Inc. (“Lipper”), an independent third party, which provided a statistical analysis comparing the Portfolios’ investment performance, expenses, and fees to comparable funds underlying variable insurance products (the “Performance Universe”). In addition, the Independent Trustees met separately with a representative of Bobroff Consulting, Inc., an independent consultant (“Bobroff), at a special board meeting in September 2013, to review the separate reports prepared by such consultant (“Bobroff Report”), which analyzed the report prepared by Lipper. The Board also considered each Portfolio’s more recent performance subsequent to the performance period covered by the Lipper reports, and management’s discussion of the same, including the effect of current market conditions on each Portfolio’s more recent performance.
The Board reviewed the Portfolios’ performance records and the Adviser’s and Sub-Advisers’ management styles and long-term performance records with the Portfolios and comparable funds. The Board focused particular attention on Portfolios with less favorable performance records. The Board was mindful of the Adviser’s focus on each Sub-Adviser’s performance and noted that the Adviser has been active in monitoring and responding to any performance issues with respect to the Portfolios. The Board also took into account its discussions with management regarding factors that contributed to the performance of the Portfolios.
Among other data relating specifically to the MetLife Stock Index Portfolio’s performance, the Board considered that the Portfolio outperformed the median of its Performance Universe and its Lipper Index for the one-, three- and five-year periods ended June 30, 2013. The Board further considered that the Portfolio underperformed its benchmark, the S&P 500 Index, for the one-, three- and five-year periods ended October 31, 2013.
Fees and Expenses. The Board gave consideration to the advisory fees payable under the Advisory Agreement and the sub-advisory fees payable under each of the Sub-Advisory Agreements. In this regard, the Board reviewed the advisory fees payable on a Portfolio-by-Portfolio basis based on information provided by the Adviser. The Independent Trustees, with the assistance of Bobroff, also examined the fees paid by a Portfolio in light of fees paid to other investment managers by comparable funds, as well as considered the fees charged by the Adviser to manage other comparable funds, as applicable. The Lipper report included comparisons of the Adviser’s fee schedule with that of its peers based on an asset-based analysis of relative fee structures according to the size of the Portfolio. In addition, the Board considered the Portfolios’ advisory and sub-advisory fees and total expenses as compared to similarly situated investment companies underlying variable insurance products deemed to be comparable to the Portfolios as determined by Lipper. The Board considered a Portfolio’s ranking within a smaller group of peer funds chosen by Lipper (the “Expense Group”), as well as the Portfolio’s ranking within broader groups of funds (the “Expense Universe” and the “Sub-advised Expense Universe”). The Board also considered a Portfolio’s contractual sub-advisory fees, as applicable, as compared to the Sub-advised Expense Universe as well as a
MSF-27
Metropolitan Series Fund
MetLife Stock Index Portfolio
Board of Trustees’ Consideration of Advisory and Sub-Advisory Agreements—(Continued)
smaller group of funds (the “Sub-advised Expense Group”). In comparing a Portfolio’s actual and contractual management fee to that of comparable funds, the Board noted that such fee includes both advisory and administrative fees.
The Board noted that the sub-advisory fees for the Portfolios are paid by the Adviser, not the Portfolios, out of the advisory fee. It was further noted that the Adviser negotiates such fees at arm’s length. The Board also considered that the Adviser had entered into expense limitation agreements with certain of the Portfolios, pursuant to which the Adviser has agreed to waive a portion of its advisory fee and/or reimburse certain expenses as a means of limiting a Portfolio’s total annual operating expenses. The Board further considered the amount of sub-advisory fees paid out by the Adviser and the amount of the management fees that it retained in light of the services performed by Sub-Advisers and Adviser, respectively.
With respect to the MetLife Stock Index Portfolio, the Board considered that the Portfolio’s actual management fees and total expenses (exclusive of 12b-l fees) were below the Expense Group median, Expense Universe median and Sub-advised Expense Universe median. The Board further noted that the Portfolio’s contractual management fees were above the asset-weighted average of the Expense Group at the Portfolio’s current size. The Board also took into account that the Portfolio’s contractual sub-advisory fees were below the average of the Sub-advised Expense Group and Expense Universe at the Portfolio’s current size. The Board further considered that the Adviser had waived fees and/or reimbursed expenses during the past year.
Profitability. The Board examined the profitability of the Adviser on a Portfolio-by-Portfolio basis. The Board also considered that the Distributor, MetLife Investors Distribution Company, receives Rule 12b-1 payments to support the distribution of the products. The Board considered the profitability to the Sub-Advisers and their affiliates as a result of their relationships with the Portfolios, and the Board considered the ability of the Adviser to negotiate the Sub-Advisory Agreements and the fees thereunder at arm’s length. The Board also reviewed Portfolio specific data with regard to the profitability of the Portfolios to each Sub-Adviser, as available.
Economies of scale. The Board also considered the effect of the Portfolios’ growth in size on their fees. The Board noted that the fee schedules for most of the Portfolios contain breakpoints that reduce the fee rate above specified asset levels. The Board noted those Portfolios that did not contain breakpoints in the advisory fee and took into account management’s discussion of the same. The Board noted that those Portfolios with advisory fee schedules containing breakpoints generally reflect the inclusion of breakpoints in the sub-advisory fee schedule for such Portfolios. The Board considered the effective fees under the Advisory Agreement for a Portfolio as a percentage of assets at different asset levels and possible economies of scale that may be realized if the assets of the Portfolio grow. Among other data, the Board examined the effect of a Portfolio’s growth in size on various fee schedules and reviewed the Lipper and Bobroff Reports, which compared fees among peers. The Board also generally noted that if a Portfolio’s assets increase over time, the Portfolio may realize other economies of scale if assets increase proportionally more than certain other fixed expenses. In addition, the Board noted that the Adviser had taken a number of steps to date intended to share the benefits of economies of scale with contractholders.
With respect to the MetLife Stock Index Portfolio, the Board noted that the Portfolio’s advisory fee does not contain breakpoints. The Board also noted that the Portfolio’s contractual management fees were below the asset-weighted average of comparable funds at asset levels up to $3 billion and slightly above the asset-weighted average of comparable funds at asset levels up to $5 billion. The Board considered the effect of the Portfolio’s current size and potential growth on its performance and fees. The Board noted management’s discussion of the Portfolio’s advisory fee structure. The Board also noted that if the Portfolio’s assets increased over time, the Portfolio might realize other economies of scale if assets increased proportionally more than certain other fixed expenses.
Other factors. As part of its evaluation of the Adviser’s compensation, the Board considered other benefits that may be realized by the Adviser and its affiliates from their relationship with the Trusts. Among them, the Board recognized that an affiliate of the Adviser, MetLife Investors Distribution Company, serves as the Distributor for the Trusts, and, as such, receives payments pursuant to Rule 12b-1 from the Portfolios to compensate it for providing shareholder services and selling activities, which could lead to growth in the Trusts’ assets and corresponding benefits from such growth, including economies of scale. The Board also considered that affiliates of the Adviser may benefit from certain indirect tax benefits relating to dividend received deductions and foreign tax credits. In conjunction with these considerations, the Board noted the costs of providing investment management and other services to the Portfolios and the ongoing commitment of the Adviser to the Portfolios.
The Board considered other benefits that may be realized by each Sub-Adviser and its affiliates from their relationship with the Trusts, including the opportunity to provide advisory services to additional portfolios of the Trusts and reputational benefits. In conjunction with these considerations, the Board noted the costs of providing investment advisory services to the Portfolios and the ongoing commitment of the Sub-Advisers to the Portfolios.
MSF-28
Metropolitan Series Fund
MetLife Stock Index Portfolio
Board of Trustees’ Consideration of Advisory and Sub-Advisory Agreements—(Continued)
The Board considered possible conflicts of interest in the form of material benefits or detriments to the Trusts resulting from the nature of the Trusts’ and the Adviser’s or the Sub-Advisers’ affiliations and the services that are provided to the Trusts, and the manner in which such conflicts were mitigated.
Conclusions. After full consideration of the factors discussed above, the Board, including a majority of the Independent Trustees, approved the Advisory Agreement and the Sub-Advisory Agreement, as applicable, with respect to each Portfolio, unless otherwise noted. In making its approvals, the Board concluded that the nature, extent and quality of services provided by the Adviser and each Sub-Adviser supported the renewal of the Agreements. The Board also concluded that the investment performance of each Fund was such that each Agreement should continue. In addition, the Board concluded that fees paid by a Portfolio to the Adviser and, if applicable, the Sub-Adviser appeared to be acceptable in light of nature, extent and quality of the services provided by the Adviser and Sub-Adviser. Further, the Board concluded that the Adviser’s profitability in providing services under the Advisory Agreements did not appear unreasonably high in light of the nature, extent and quality of the services provided by the Adviser. Finally, the Board concluded that the Advisory and Sub-Advisory fees in some measure share economies of scale with contractholders. In approving the renewal of each of the Agreements, the Board, including the Independent Trustees, did not identify any single factor as controlling, and generally attributed different weights to various factors for the various Portfolios. The Board evaluated all information available to them on a Portfolio-by-Portfolio basis, and their decisions were made separately with respect to each Portfolio.
MSF-29
Metropolitan Series Fund
MFS Total Return Portfolio
Managed by Massachusetts Financial Services Company
Portfolio Manager Commentary*
PERFORMANCE
For the one year period ended December 31, 2013, the Class A, B, E, and F shares of the MFS Total Return Portfolio returned 18.99%, 18.70%, 18.82%, and 18.75%, respectively. The Portfolio’s benchmarks, the Standard & Poor’s (“S&P”) 500 Index1 and the Barclays U.S. Aggregate Bond Index2, returned 32.39% and -2.02%, respectively. A blend of the S&P 500 Index (60%) and the Barclays U.S. Aggregate Bond Index (40%) returned 17.56%.
MARKET ENVIRONMENT / CONDITIONS
At the beginning of the period, year-end fiscal cliff negotiations between the Republicans in the U.S. Congress and President Obama were a particular source of market attention, where uncertainty surrounding the fiscal negotiations continued right up to the end-of-year deadline. A last minute political agreement averted the worst-case scenario and markets gravitated towards risk assets again, though the implementation of the U.S. budget sequesters, combined with concerns surrounding the Italian election results, was a source of uncertainty which lingered throughout the first half of the period.
The more dominant features of the first few months of 2013 included a marked improvement in market sentiment as global macroeconomic indicators improved, monetary easing by the Bank of Japan accelerated and fears of fiscal austerity in the U.S. waned. In the middle of the period, concerns that the U.S. Federal Reserve (the “Fed”) would begin tapering its quantitative easing (“QE”) program caused sovereign bond yields to spike, credit spreads to widen, and equity valuations to fall. Equities subsequently outperformed fixed income in response to the improved economic fundamentals.
Toward the end of the period, the Fed’s decision to postpone QE tapering surprised markets. Favorable market reactions were tempered, however, by tense negotiations over U.S. fiscal policy which resulted in a 16-day partial shutdown of the federal government and a short-term extension in the debt ceiling. The volatility was short-lived, however, as an extension of budget and debt ceiling deadlines allowed the government to re-open, and subsequent economic data reflected moderate but resilient U.S. growth. Also well-received was the decision by the European Central Bank to cut its policy rate as inflation pressures waned in the region. In addition, equity investors appeared to have concluded that there would be no major change in U.S. monetary policy as a result of the nomination of Janet Yellen as the new Fed Chair for a term beginning in early 2014.
PORTFOLIO REVIEW / PERIOD END POSITIONING
Within the equity portion of the Portfolio, an underweight position and stock selection in the Information Technology (“IT”) sector benefited relative performance. The timing of the Portfolio’s ownership in shares of computer and personal electronics maker Apple positively impacted relative results. An overweight position in computer products and services provider Hewlett-Packard also helped as the stock delivered strong performance during the period. Stock selection in the Industrials sector boosted relative results. Within this sector, an overweight position in shares of defense contractor Lockheed Martin boosted relative returns as the stock performed well during the period. Stock selection and an overweight position in the Financials sector was another positive factor for relative performance, led by overweight positions in insurance company Prudential Financial and custody bank State Street. Elsewhere, overweight positions in media firm Time Warner Cable, automotive parts manufacturers Delphi Automotive and Johnson Controls, life sciences supply company Thermo Fisher Scientific, and cardiovascular medical device maker St. Jude Medical contributed to relative returns.
Despite a challenging year for fixed income, due to a rise in Treasury yields, the fixed income portion of the Portfolio outperformed the Barclays U.S. Aggregate Bond Index over the trailing 12-month period, ending December 31, 2013. This outperformance was driven by greater exposure to the Financials sector and an underweight to Mortgage-Backed Securities, which felt pressure from the rise in rates as well as concerns over the Fed’s tapering of its asset purchase program. These two factors aided in the outperformance of the Barclays U.S. Aggregate Bond Index. Additionally, because of the fixed income portion of the Portfolio’s slight overweight to Investment Grade Corporate Bonds, which helped generate a greater yield for the Portfolio, was another key contributor to relative performance. Within the fixed income portion of the Portfolio, weak security selection, particularly in the media industry, detracted from relative returns.
Within the equity portion of the Portfolio, stock selection and, to a lesser extent, an overweight position in the Consumer Staples sector was a primary detractor from performance relative to the S&P 500 Index. Within this sector, an overweight position in tobacco company Philip Morris, and holdings of alcoholic beverage producer Diageo, and global food company Nestle (Switzerland) held back relative results. Stocks in other sectors that detracted from relative performance included the timing of the Portfolio’s ownership of internet search giant Google and software giant Microsoft and not holding shares of strong-performing biotech firm Gilead Sciences, biopharmaceutical company Celgene, aerospace giant Boeing, and internet retailer Amazon.com. An overweight position in retail store Target also weakened relative results as this stock underperformed the benchmark during the period.
MSF-1
Metropolitan Series Fund
MFS Total Return Portfolio
Managed by Massachusetts Financial Services Company
Portfolio Manager Commentary*—(Continued)
Over the trailing 12 months ending December 31, 2013, the Portfolio increased its positions in IT, Consumer Discretionary, and Utilities while reducing its exposure to Industrials, Consumer Staples, and Energy. Additionally, the Portfolio was overweight to Financials, Consumer Staples, and Industrials while being underweight to IT and Health Care.
Brooks Taylor
Steven Gorham
Richard Hawkins
Nevin Chitkara
William Douglas
Joshua Marston
Jonathan Sage
Portfolio Managers
Massachusetts Financial Services Company
* This commentary may include statements that constitute “forward-looking statements” under the U.S. securities laws. Forward-looking statements include, among other things, projections, estimates, and information about possible or future results related to the Portfolio, market or regulatory developments. The views expressed above are not guarantees of future performance or economic results and involve certain risks, uncertainties and assumptions that could cause actual outcomes and results to differ materially from the views expressed herein. The views expressed above are subject to change at any time based upon economic, market, or other conditions and the subadvisory firm undertakes no obligation to update the views expressed herein. Any discussions of specific securities should not be considered a recommendation to buy or sell those securities. The views expressed above (including any forward-looking statement) may not be relied upon as investment advice or as an indication of the Portfolio’s trading intent. Information about the Portfolio’s holdings, asset allocation or country diversification is historical and is not an indication of future Portfolio composition, which may vary. Direct investment in any index is not possible. The performance of any index mentioned in this commentary has not been adjusted for ongoing management, distribution and operating expenses, and sales charges applicable to mutual fund investments. In addition, the returns do not reflect additional fees charged by separate accounts or variable insurance contracts that an investor in the Portfolio may pay. If these additional fees were reflected, performance would have been lower.
MSF-2
Metropolitan Series Fund
MFS Total Return Portfolio
A $10,000 INVESTMENT COMPARED TO THE S&P 500 INDEX & THE BARCLAYS U.S. AGGREGATE BOND INDEX

AVERAGE ANNUAL RETURNS (%) (FOR THE YEAR ENDED DECEMBER 31, 2013)
| | | | | | | | | | | | | | | | |
| | | 1 Year | | | 5 Year | | | 10 Year | | | Since Inception3 | |
| MFS Total Return Portfolio | | | | | | | | | | | | | | | | |
Class A | | | 18.99 | | | | 12.16 | | | | 6.38 | | | | — | |
Class B | | | 18.70 | | | | 11.88 | | | | 6.12 | | | | — | |
Class E | | | 18.82 | | | | 12.00 | | | | — | | | | 6.18 | |
Class F | | | 18.75 | | | | 11.94 | | | | — | | | | 5.77 | |
| S&P 500 Index | | | 32.39 | | | | 17.94 | | | | 7.41 | | | | — | |
| Barclays U.S. Aggregate Bond Index | | | -2.02 | | | | 4.44 | | | | 4.55 | | | | — | |
1 The Standard & Poor’s 500 Index is an unmanaged index representing the performance of 500 major companies, most of which are listed on the New York Stock Exchange.
2 Barclays U.S. Aggregate Bond Index is a broad based benchmark that measures the investment grade, U.S. dollar-denominated, fixed-rate taxable bond market, including Treasuries, government-related and corporate securities, mortgage-backed securities, asset-backed securities, and commercial mortgage-backed securities.
3 Inception dates of the Class A, Class B, Class E, and Class F shares are 5/1/87, 5/1/02, 4/26/04, and 5/2/06, respectively.
Portfolio performance is calculated including reinvestment of all income and capital gain distributions. Performance numbers are net of all Portfolio expenses but do not include any insurance, sales, separate account or administrative charges of variable annuity or life insurance contracts or any additional expenses that participants may bear relating to the operations of their plans. If these charges were included, the returns would be lower. The performance of any index referenced above has not been adjusted for ongoing management, distribution and operating expenses, and sales charges applicable to mutual fund investments. Direct investment in any index is not possible. The performance of Class A shares, as set forth in the line graph above, will differ from that of other classes because of the difference in expenses paid by policyholders investing in the different share classes.
This information represents past performance and is not indicative of future results. Investment return and principal value may fluctuate so that shares, upon redemption, may be worth more or less than the original cost.
PORTFOLIO COMPOSITION AS OF DECEMBER 31, 2013
Top Equity Sectors
| | | | |
| | | % of
Market Value of
Total Investments | |
| Financials | | | 13.4 | |
| Industrials | | | 8.1 | |
| Consumer Staples | | | 8.1 | |
| Consumer Discretionary | | | 7.6 | |
| Health Care | | | 7.4 | |
Top Fixed Income Sectors
| | | | |
| | | % of
Market Value of
Total Investments | |
| U.S. Treasury & Government Agencies | | | 23.7 | |
| Corporate Bonds & Notes | | | 10.6 | |
| Mortgage-Backed Securities | | | 2.0 | |
| Foreign Government | | | 0.7 | |
| Asset-Backed Securities | | | 0.4 | |
MSF-3
Metropolitan Series Fund
MFS Total Return Portfolio
Understanding Your Portfolio’s Expenses
Shareholder Expense Example
As a shareholder of the Portfolio, you incur ongoing costs, including management fees; distribution and service (12b-1) fees; and other Portfolio expenses. This example is intended to help you understand your ongoing costs (in dollars) (referred to as “expenses”) of investing in the Portfolio and compare these costs with the ongoing costs of investing in other mutual funds. The example is based on an investment of $1,000 invested at the beginning of the period and held for the entire period, July 1, 2013 through December 31, 2013.
Actual Expenses
The first line for each share class of the Portfolio in the table below provides information about actual account values and actual expenses. You may use the information in this line, together with the amount you invested in the particular share class of the Portfolio, to estimate the expenses that you paid over the period. Simply divide your account value by $1,000 (for example, an $8,600 account value divided by $1,000 = 8.6), then multiply the result by the number in the first line under the heading entitled “Expenses Paid During Period” to estimate the expenses you paid on your account during this period.
Hypothetical Example for Comparison Purposes
The second line for each share class of the Portfolio in the table below provides information about hypothetical account values and hypothetical expenses based on the Portfolio’s actual expense ratio and an assumed rate of return of 5% per year before expenses, which is not the Portfolio’s actual return. The hypothetical account values and expenses may not be used to estimate the actual ending account balance or expenses you paid for the period. You may use this information to compare the ongoing costs of investing in the Portfolio and other funds. To do so, compare this 5% hypothetical example with the 5% hypothetical examples that appear in the shareholder reports of the other funds.
Please note that the expenses shown in the table are meant to highlight your ongoing costs only and do not reflect any fees or charges of your variable insurance product or any additional expenses that participants in certain eligible qualified plans may bear relating to the operations of their plan. Therefore, the second line for each share class in the table is useful in comparing ongoing costs only, and will not help you determine the relative total costs of owning different funds. In addition, if these other costs were included, your costs would have been higher.
| | | | | | | | | | | | | | | | | | |
MFS Total Return Portfolio | | | | Annualized
Expense
Ratio | | | Beginning
Account Value
July 1,
2013 | | | Ending
Account Value
December 31,
2013 | | | Expenses Paid
During Period**
July 1, 2013
to
December 31,
2013 | |
Class A | | Actual | | | 0.59 | % | | $ | 1,000.00 | | | $ | 1,099.00 | | | $ | 3.12 | |
| | Hypothetical* | | | 0.59 | % | | $ | 1,000.00 | | | $ | 1,022.23 | | | $ | 3.01 | |
| | | | | |
Class B | | Actual | | | 0.84 | % | | $ | 1,000.00 | | | $ | 1,097.70 | | | $ | 4.44 | |
| | Hypothetical* | | | 0.84 | % | | $ | 1,000.00 | | | $ | 1,020.97 | | | $ | 4.28 | |
| | | | | |
Class E | | Actual | | | 0.74 | % | | $ | 1,000.00 | | | $ | 1,098.30 | | | $ | 3.91 | |
| | Hypothetical* | | | 0.74 | % | | $ | 1,000.00 | | | $ | 1,021.48 | | | $ | 3.77 | |
| | | | | |
Class F | | Actual | | | 0.79 | % | | $ | 1,000.00 | | | $ | 1,097.90 | | | $ | 4.18 | |
| | Hypothetical* | | | 0.79 | % | | $ | 1,000.00 | | | $ | 1,021.22 | | | $ | 4.02 | |
* Hypothetical assumes a rate of return of 5% per year before expenses.
** Expenses paid are equal to the Portfolio’s annualized expense ratio for the most recent six month period, as shown above, multiplied by the average account value over the period, multiplied by the number of days (184 days) in the most recent fiscal half-year, divided by 365 (to reflect the one-half year period).
MSF-4
Metropolitan Series Fund
MFS Total Return Portfolio
Schedule of Investments as of December 31, 2013
Common Stocks—61.3% of Net Assets
| | | | | | | | |
| Security Description | | Shares | | | Value | |
|
Aerospace & Defense—3.5% | |
General Dynamics Corp. | | | 13,353 | | | $ | 1,275,879 | |
Honeywell International, Inc. | | | 88,374 | | | | 8,074,732 | |
Lockheed Martin Corp. | | | 92,179 | | | | 13,703,330 | |
Northrop Grumman Corp. | | | 30,396 | | | | 3,483,686 | |
Precision Castparts Corp. | | | 4,162 | | | | 1,120,827 | |
United Technologies Corp. | | | 79,331 | | | | 9,027,868 | |
| | | | | | | | |
| | | | | | | 36,686,322 | |
| | | | | | | | |
|
Air Freight & Logistics—0.5% | |
United Parcel Service, Inc. - Class B | | | 51,704 | | | | 5,433,056 | |
| | | | | | | | |
|
Airlines—0.1% | |
Copa Holdings S.A. - Class A | | | 7,475 | | | | 1,196,822 | |
| | | | | | | | |
|
Auto Components—1.5% | |
Delphi Automotive plc | | | 121,150 | | | | 7,284,750 | |
Johnson Controls, Inc. | | | 104,381 | | | | 5,354,745 | |
Magna International, Inc. | | | 37,570 | | | | 3,080,581 | |
| | | | | | | | |
| | | | | | | 15,720,076 | |
| | | | | | | | |
|
Automobiles—0.6% | |
General Motors Co. (a) (b) | | | 146,720 | | | | 5,996,435 | |
| | | | | | | | |
|
Beverages—0.8% | |
Coca-Cola Co. (The) | | | 33,780 | | | | 1,395,452 | |
Coca-Cola Enterprises, Inc. | | | 18,680 | | | | 824,348 | |
Diageo plc | | | 163,606 | | | | 5,404,108 | |
Dr. Pepper Snapple Group, Inc. (b) | | | 20,203 | | | | 984,290 | |
| | | | | | | | |
| | | | | | | 8,608,198 | |
| | | | | | | | |
|
Capital Markets—2.9% | |
Bank of New York Mellon Corp. (The) | | | 223,705 | | | | 7,816,253 | |
BlackRock, Inc. | | | 11,990 | | | | 3,794,475 | |
Franklin Resources, Inc. | | | 69,741 | | | | 4,026,148 | |
Goldman Sachs Group, Inc. (The) | | | 45,670 | | | | 8,095,464 | |
Morgan Stanley | | | 59,044 | | | | 1,851,620 | |
State Street Corp. | | | 66,281 | | | | 4,864,363 | |
| | | | | | | | |
| | | | | | | 30,448,323 | |
| | | | | | | | |
|
Chemicals—1.2% | |
Air Products & Chemicals, Inc. | | | 23,816 | | | | 2,662,152 | |
Celanese Corp. - Series A | | | 24,113 | | | | 1,333,690 | |
FMC Corp. | | | 15,320 | | | | 1,156,047 | |
LyondellBasell Industries NV - Class A | | | 16,120 | | | | 1,294,114 | |
PPG Industries, Inc. | | | 32,131 | | | | 6,093,965 | |
Valspar Corp. (The) (b) | | | 2,830 | | | | 201,751 | |
| | | | | | | | |
| | | | | | | 12,741,719 | |
| | | | | | | | |
|
Commercial Banks—2.8% | |
BB&T Corp. | | | 45,860 | | | | 1,711,495 | |
BOC Hong Kong Holdings, Ltd. | | | 228,500 | | | | 734,933 | |
Fifth Third Bancorp (b) | | | 33,630 | | | | 707,239 | |
HSBC Holdings plc | | | 87,607 | | | | 960,864 | |
Mizuho Financial Group, Inc. (b) | | | 818,400 | | | | 1,772,490 | |
PNC Financial Services Group, Inc. (The) | | | 36,387 | | | | 2,822,904 | |
|
Commercial Banks—(Continued) | |
Sumitomo Mitsui Financial Group, Inc. | | | 29,200 | | | | 1,507,932 | |
SunTrust Banks, Inc. | | | 26,243 | | | | 966,005 | |
U.S. Bancorp | | | 27,920 | | | | 1,127,968 | |
Wells Fargo & Co. | | | 366,440 | | | | 16,636,376 | |
| | | | | | | | |
| | | | | | | 28,948,206 | |
| | | | | | | | |
|
Commercial Services & Supplies—0.3% | |
Tyco International, Ltd. | | | 88,594 | | | | 3,635,898 | |
| | | | | | | | |
|
Computers & Peripherals—1.1% | |
Apple, Inc. | | | 2,669 | | | | 1,497,602 | |
EMC Corp. | | | 42,020 | | | | 1,056,803 | |
Hewlett-Packard Co. | | | 276,520 | | | | 7,737,030 | |
Western Digital Corp. | | | 20,830 | | | | 1,747,637 | |
| | | | | | | | |
| | | | | | | 12,039,072 | |
| | | | | | | | |
|
Construction & Engineering—0.1% | |
Fluor Corp. | | | 13,487 | | | | 1,082,871 | |
| | | | | | | | |
|
Consumer Finance—0.2% | |
American Express Co. | | | 14,997 | | | | 1,360,678 | |
Discover Financial Services | | | 14,210 | | | | 795,049 | |
| | | | | | | | |
| | | | | | | 2,155,727 | |
| | | | | | | | |
|
Containers & Packaging—0.2% | |
Crown Holdings, Inc. (a) | | | 14,320 | | | | 638,242 | |
Packaging Corp. of America | | | 14,730 | | | | 932,115 | |
| | | | | | | | |
| | | | | | | 1,570,357 | |
| | | | | | | | |
|
Diversified Financial Services—2.8% | |
Bank of America Corp. | | | 182,594 | | | | 2,842,989 | |
JPMorgan Chase & Co. | | | 410,070 | | | | 23,980,894 | |
McGraw Hill Financial, Inc. | | | 11,617 | | | | 908,449 | |
Moody’s Corp. | | | 11,473 | | | | 900,286 | |
NASDAQ OMX Group, Inc. (The) | | | 22,469 | | | | 894,266 | |
| | | | | | | | |
| | | | | | | 29,526,884 | |
| | | | | | | | |
|
Diversified Telecommunication Services—1.9% | |
AT&T, Inc. | | | 124,900 | | | | 4,391,484 | |
Bezeq The Israeli Telecommunication Corp., Ltd. | | | 287,250 | | | | 486,871 | |
CenturyLink, Inc. (b) | | | 71,164 | | | | 2,266,573 | |
Frontier Communications Corp. (b) | | | 673,720 | | | | 3,132,798 | |
TDC A/S | | | 185,910 | | | | 1,803,683 | |
Telecom Italia S.p.A. - Risparmio Shares | | | 1,041,492 | | | | 817,871 | |
Telefonica Brasil S.A. (ADR) | | | 48,240 | | | | 927,173 | |
Verizon Communications, Inc. | | | 122,290 | | | | 6,009,331 | |
| | | | | | | | |
| | | | | | | 19,835,784 | |
| | | | | | | | |
|
Electric Utilities—0.7% | |
American Electric Power Co., Inc. | | | 54,190 | | | | 2,532,841 | |
Duke Energy Corp. | | | 23,703 | | | | 1,635,744 | |
PPL Corp. | | | 102,022 | | | | 3,069,842 | |
| | | | | | | | |
| | | | | | | 7,238,427 | |
| | | | | | | | |
See accompanying notes to financial statements.
MSF-5
Metropolitan Series Fund
MFS Total Return Portfolio
Schedule of Investments as of December 31, 2013
Common Stocks—(Continued)
| | | | | | | | |
| Security Description | | Shares | | | Value | |
|
Electrical Equipment—0.4% | |
Eaton Corp. plc | | | 50,647 | | | $ | 3,855,250 | |
| | | | | | | | |
|
Electronic Equipment, Instruments & Components—0.1% | |
Hoya Corp. | | | 36,900 | | | | 1,027,000 | |
| | | | | | | | |
|
Energy Equipment & Services—0.3% | |
Noble Corp. plc | | | 34,284 | | | | 1,284,621 | |
Schlumberger, Ltd. | | | 11,807 | | | | 1,063,929 | |
Transocean, Ltd. (b) | | | 19,190 | | | | 948,370 | |
| | | | | | | | |
| | | | | | | 3,296,920 | |
| | | | | | | | |
|
Food & Staples Retailing—1.5% | |
CVS Caremark Corp. | | | 145,193 | | | | 10,391,463 | |
Kroger Co. (The) | | | 115,260 | | | | 4,556,228 | |
Walgreen Co. | | | 16,973 | | | | 974,929 | |
| | | | | | | | |
| | | | | | | 15,922,620 | |
| | | | | | | | |
|
Food Products—1.9% | |
Danone S.A. | | | 42,891 | | | | 3,094,187 | |
General Mills, Inc. | | | 114,430 | | | | 5,711,201 | |
Ingredion, Inc. | | | 12,950 | | | | 886,557 | |
Kellogg Co. | | | 10,433 | | | | 637,143 | |
Kraft Foods Group, Inc. | | | 6,873 | | | | 370,592 | |
Mondelez International, Inc. - Class A | | | 37,114 | | | | 1,310,124 | |
Nestle S.A. | | | 94,021 | | | | 6,901,889 | |
Tyson Foods, Inc. - Class A | | | 40,370 | | | | 1,350,780 | |
| | | | | | | | |
| | | | | | | 20,262,473 | |
| | | | | | | | |
|
Health Care Equipment & Supplies—1.5% | |
Abbott Laboratories | | | 138,929 | | | | 5,325,149 | |
Covidien plc | | | 62,021 | | | | 4,223,630 | |
Medtronic, Inc. | | | 42,340 | | | | 2,429,893 | |
St. Jude Medical, Inc. | | | 63,694 | | | | 3,945,843 | |
| | | | | | | | |
| | | | | | | 15,924,515 | |
| | | | | | | | |
|
Health Care Providers & Services—0.5% | |
AmerisourceBergen Corp. | | | 17,553 | | | | 1,234,152 | |
Express Scripts Holding Co. (a) | | | 47,860 | | | | 3,361,686 | |
Quest Diagnostics, Inc. (b) | | | 13,867 | | | | 742,439 | |
| | | | | | | | |
| | | | | | | 5,338,277 | |
| | | | | | | | |
|
Hotels, Restaurants & Leisure—0.5% | |
ARAMARK Holdings Corp. (a) | | | 19,460 | | | | 510,241 | |
Hilton Worldwide Holdings, Inc. (a) (b) | | | 16,780 | | | | 373,355 | |
McDonald’s Corp. | | | 32,668 | | | | 3,169,776 | |
Wynn Resorts, Ltd. | | | 8,200 | | | | 1,592,522 | |
| | | | | | | | |
| | | | | | | 5,645,894 | |
| | | | | | | | |
|
Household Products—0.7% | |
Procter & Gamble Co. (The) | | | 74,312 | | | | 6,049,740 | |
Reckitt Benckiser Group plc | | | 15,489 | | | | 1,233,183 | |
| | | | | | | | |
| | | | | | | 7,282,923 | |
| | | | | | | | |
|
Independent Power Producers & Energy Traders—0.1% | |
NRG Energy, Inc. | | | 33,474 | | | | 961,373 | |
| | | | | | | | |
|
Industrial Conglomerates—1.8% | |
3M Co. | | | 61,437 | | | | 8,616,539 | |
Danaher Corp. | | | 109,307 | | | | 8,438,501 | |
Siemens AG | | | 14,077 | | | | 1,923,395 | |
| | | | | | | | |
| | | | | | | 18,978,435 | |
| | | | | | | | |
|
Insurance—4.0% | |
ACE, Ltd. | | | 61,831 | | | | 6,401,363 | |
American International Group, Inc. | | | 34,240 | | | | 1,747,952 | |
Aon plc | | | 45,173 | | | | 3,789,563 | |
Chubb Corp. (The) | | | 28,790 | | | | 2,781,978 | |
Delta Lloyd NV | | | 99,590 | | | | 2,477,657 | |
Everest Re Group, Ltd. | | | 10,764 | | | | 1,677,785 | |
Prudential Financial, Inc. | | | 95,340 | | | | 8,792,255 | |
Travelers Cos., Inc. (The) | | | 107,830 | | | | 9,762,928 | |
Validus Holdings, Ltd. (b) | | | 73,500 | | | | 2,961,315 | |
Zurich Insurance Group AG | | | 7,578 | | | | 2,203,662 | |
| | | | | | | | |
| | | | | | | 42,596,458 | |
| | | | | | | | |
|
Internet Software & Services—0.8% | |
Facebook, Inc. - Class A (a) | | | 30,150 | | | | 1,647,999 | |
Google, Inc. - Class A (a) | | | 2,870 | | | | 3,216,438 | |
Yahoo!, Inc. (a) | | | 86,800 | | | | 3,510,192 | |
| | | | | | | | |
| | | | | | | 8,374,629 | |
| | | | | | | | |
|
IT Services—1.6% | |
Accenture plc - Class A | | | 68,313 | | | | 5,616,695 | |
Fidelity National Information Services, Inc. | | | 11,617 | | | | 623,600 | |
Fiserv, Inc. (a) | | | 20,914 | | | | 1,234,972 | |
International Business Machines Corp. | | | 27,286 | | | | 5,118,035 | |
Visa, Inc. - Class A | | | 14,523 | | | | 3,233,982 | |
Western Union Co. (The) (b) | | | 36,840 | | | | 635,490 | |
| | | | | | | | |
| | | | | | | 16,462,774 | |
| | | | | | | | |
|
Leisure Equipment & Products—0.2% | |
Hasbro, Inc. (b) | | | 37,658 | | | | 2,071,567 | |
| | | | | | | | |
|
Life Sciences Tools & Services—0.6% | |
Thermo Fisher Scientific, Inc. | | | 59,100 | | | | 6,580,785 | |
| | | | | | | | |
|
Machinery—1.0% | |
Cummins, Inc. | | | 25,337 | | | | 3,571,757 | |
Illinois Tool Works, Inc. | | | 32,973 | | | | 2,772,370 | |
Pentair, Ltd. | | | 28,322 | | | | 2,199,770 | |
Stanley Black & Decker, Inc. | | | 29,860 | | | | 2,409,403 | |
| | | | | | | | |
| | | | | | | 10,953,300 | |
| | | | | | | | |
|
Media—3.1% | |
Comcast Corp. - Special Class A | | | 193,950 | | | | 9,674,226 | |
Omnicom Group, Inc. | | | 53,661 | | | | 3,990,769 | |
Regal Entertainment Group (b) | | | 32,600 | | | | 634,070 | |
Time Warner Cable, Inc. | | | 46,080 | | | | 6,243,840 | |
Time Warner, Inc. | | | 32,813 | | | | 2,287,722 | |
See accompanying notes to financial statements.
MSF-6
Metropolitan Series Fund
MFS Total Return Portfolio
Schedule of Investments as of December 31, 2013
Common Stocks—(Continued)
| | | | | | | | |
| Security Description | | Shares | | | Value | |
|
Media—(Continued) | |
Twenty-First Century Fox, Inc. - Class A | | | 31,293 | | | $ | 1,100,888 | |
Viacom, Inc. - Class B | | | 21,737 | | | | 1,898,510 | |
Walt Disney Co. (The) | | | 90,111 | | | | 6,884,480 | |
| | | | | | | | |
| | | | | | | 32,714,505 | |
| | | | | | | | |
|
Metals & Mining—0.4% | |
Rio Tinto plc | | | 29,450 | | | | 1,661,849 | |
Vale S.A. (ADR) (b) | | | 140,060 | | | | 2,135,915 | |
| | | | | | | | |
| | | | | | | 3,797,764 | |
| | | | | | | | |
| | |
Multi-Utilities—0.7% | | | | | | | | |
E.ON SE | | | 111,291 | | | | 2,050,927 | |
GDF Suez | | | 98,731 | | | | 2,329,839 | |
PG&E Corp. | | | 44,930 | | | | 1,809,781 | |
Public Service Enterprise Group, Inc. | | | 43,660 | | | | 1,398,866 | |
| | | | | | | | |
| | | | | | | 7,589,413 | |
| | | | | | | | |
| | |
Multiline Retail—1.1% | | | | | | | | |
Kohl’s Corp. | | | 41,480 | | | | 2,353,990 | |
Macy’s, Inc. | | | 63,340 | | | | 3,382,356 | |
Target Corp. | | | 95,020 | | | | 6,011,915 | |
| | | | | | | | |
| | | | | | | 11,748,261 | |
| | | | | | | | |
| | |
Office Electronics—0.1% | | | | | | | | |
Canon, Inc. (b) | | | 25,200 | | | | 802,126 | |
| | | | | | | | |
| | |
Oil, Gas & Consumable Fuels—5.7% | | | | | | | | |
Anadarko Petroleum Corp. | | | 31,604 | | | | 2,506,829 | |
Antero Resources Corp. (a) | | | 1,420 | | | | 90,085 | |
Apache Corp. | | | 40,314 | | | | 3,464,585 | |
Canadian Natural Resources, Ltd. | | | 29,497 | | | | 998,179 | |
Chevron Corp. | | | 85,969 | | | | 10,738,388 | |
EOG Resources, Inc. | | | 4,582 | | | | 769,043 | |
EQT Corp. | | | 18,373 | | | | 1,649,528 | |
Exxon Mobil Corp. | | | 189,234 | | | | 19,150,481 | |
Marathon Petroleum Corp. | | | 20,430 | | | | 1,874,044 | |
Noble Energy, Inc. | | | 50,584 | | | | 3,445,276 | |
Occidental Petroleum Corp. | | | 52,234 | | | | 4,967,453 | |
Petroleo Brasileiro S.A. (ADR) | | | 105,280 | | | | 1,546,563 | |
Royal Dutch Shell plc - A Shares | | | 89,014 | | | | 3,196,878 | |
Valero Energy Corp. | | | 72,600 | | | | 3,659,040 | |
Williams Cos., Inc. (The) | | | 54,840 | | | | 2,115,179 | |
| | | | | | | | |
| | | | | | | 60,171,551 | |
| | | | | | | | |
| | |
Pharmaceuticals—4.7% | | | | | | | | |
AbbVie, Inc. | | | 20,049 | | | | 1,058,788 | |
Bayer AG | | | 10,753 | | | | 1,508,574 | |
Bristol-Myers Squibb Co. | | | 88,500 | | | | 4,703,775 | |
Eli Lilly & Co. | | | 58,890 | | | | 3,003,390 | |
Johnson & Johnson | | | 168,618 | | | | 15,443,722 | |
Merck & Co., Inc. | | | 92,773 | | | | 4,643,289 | |
Pfizer, Inc. | | | 558,113 | | | | 17,095,001 | |
Roche Holding AG | | | 4,493 | | | | 1,259,464 | |
Valeant Pharmaceuticals International, Inc. (a) | | | 9,530 | | | | 1,118,822 | |
| | |
Pharmaceuticals—(Continued) | | | | | | | | |
Zoetis, Inc. | | | 4,714 | | | | 154,101 | |
| | | | | | | | |
| | | | | | | 49,988,926 | |
| | | | | | | | |
| | |
Real Estate Investment Trusts—0.6% | | | | | | | | |
American Capital Agency Corp. | | | 18,830 | | | | 363,231 | |
Annaly Capital Management, Inc. (b) | | | 118,650 | | | | 1,182,940 | |
Corio NV | | | 24,238 | | | | 1,088,096 | |
Digital Realty Trust, Inc. (b) | | | 46,710 | | | | 2,294,395 | |
EPR Properties (b) | | | 16,770 | | | | 824,413 | |
| | | | | | | | |
| | | | | | | 5,753,075 | |
| | | | | | | | |
|
Road & Rail—0.2% | |
Canadian National Railway Co. | | | 24,256 | | | | 1,383,077 | |
Union Pacific Corp. | | | 6,060 | | | | 1,018,080 | |
| | | | | | | | |
| | | | | | | 2,401,157 | |
| | | | | | | | |
|
Semiconductors & Semiconductor Equipment—0.9% | |
Intel Corp. | | | 97,840 | | | | 2,539,927 | |
Microchip Technology, Inc. (b) | | | 115,140 | | | | 5,152,515 | |
Taiwan Semiconductor Manufacturing Co., Ltd. (ADR) | | | 77,560 | | | | 1,352,646 | |
| | | | | | | | |
| | | | | | | 9,045,088 | |
| | | | | | | | |
|
Software—1.2% | |
CA, Inc. | | | 45,580 | | | | 1,533,767 | |
Microsoft Corp. | | | 79,240 | | | | 2,965,953 | |
Oracle Corp. | | | 142,657 | | | | 5,458,057 | |
Symantec Corp. | | | 122,130 | | | | 2,879,825 | |
| | | | | | | | |
| | | | | | | 12,837,602 | |
| | | | | | | | |
|
Specialty Retail—0.4% | |
Advance Auto Parts, Inc. | | | 12,700 | | | | 1,405,636 | |
Best Buy Co., Inc. | | | 36,850 | | | | 1,469,578 | |
Staples, Inc. (b) | | | 105,344 | | | | 1,673,916 | |
| | | | | | | | |
| | | | | | | 4,549,130 | |
| | | | | | | | |
|
Textiles, Apparel & Luxury Goods—0.1% | |
Hanesbrands, Inc. | | | 16,770 | | | | 1,178,428 | |
| | | | | | | | |
|
Tobacco—3.1% | |
Altria Group, Inc. (b) | | | 107,216 | | | | 4,116,022 | |
Imperial Tobacco Group plc | | | 10,874 | | | | 422,010 | |
Japan Tobacco, Inc. | | | 46,100 | | | | 1,499,960 | |
Lorillard, Inc. (b) | | | 162,450 | | | | 8,232,966 | |
Philip Morris International, Inc. | | | 207,855 | | | | 18,110,406 | |
| | | | | | | | |
| | | | | | | 32,381,364 | |
| | | | | | | | |
|
Wireless Telecommunication Services—0.3% | |
Tele2 AB - B Shares | | | 68,247 | | | | 774,213 | |
Vodafone Group plc | | | 710,422 | | | | 2,792,723 | |
| | | | | | | | |
| | | | | | | 3,566,936 | |
| | | | | | | | |
Total Common Stocks
(Cost $457,151,375) | | | | | | | 646,924,696 | |
| | | | | | | | |
See accompanying notes to financial statements.
MSF-7
Metropolitan Series Fund
MFS Total Return Portfolio
Schedule of Investments as of December 31, 2013
U.S. Treasury & Government Agencies—23.4%
| | | | | | | | |
| Security Description | | Principal
Amount* | | | Value | |
|
Agency Sponsored Mortgage - Backed—11.4% | |
Fannie Mae 15 Yr. Pool
2.500%, 02/01/28 | | | 464,283 | | | $ | 460,063 | |
2.500%, 05/01/28 | | | 284,437 | | | | 281,852 | |
3.000%, 03/01/27 | | | 210,127 | | | | 214,671 | |
3.000%, 04/01/27 | | | 619,361 | | | | 632,784 | |
3.000%, TBA (c) | | | 4,000,000 | | | | 4,061,406 | |
4.500%, 04/01/18 | | | 46,337 | | | | 49,319 | |
4.500%, 06/01/18 | | | 115,884 | | | | 123,299 | |
4.500%, 07/01/18 | | | 101,199 | | | | 107,700 | |
4.500%, 03/01/19 | | | 148,002 | | | | 157,514 | |
4.500%, 06/01/19 | | | 98,476 | | | | 104,830 | |
4.500%, 04/01/20 | | | 95,755 | | | | 101,963 | |
4.500%, 07/01/20 | | | 50,712 | | | | 53,994 | |
5.000%, 11/01/17 | | | 99,986 | | | | 106,375 | |
5.000%, 02/01/18 | | | 287,912 | | | | 306,765 | |
5.000%, 07/01/19 | | | 207,898 | | | | 223,039 | |
5.000%, 07/01/20 | | | 151,765 | | | | 163,310 | |
5.000%, 12/01/20 | | | 239,192 | | | | 257,290 | |
5.500%, 11/01/17 | | | 160,937 | | | | 171,976 | |
5.500%, 12/01/17 | | | 22,881 | | | | 24,458 | |
5.500%, 01/01/18 | | | 127,149 | | | | 135,106 | |
5.500%, 02/01/18 | | | 91,673 | | | | 97,400 | |
5.500%, 06/01/19 | | | 207,630 | | | | 224,821 | |
5.500%, 07/01/19 | | | 173,128 | | | | 187,308 | |
5.500%, 08/01/19 | | | 52,250 | | | | 56,503 | |
5.500%, 09/01/19 | | | 179,930 | | | | 194,351 | |
5.500%, 01/01/21 | | | 80,510 | | | | 87,961 | |
5.500%, 03/01/21 | | | 26,380 | | | | 28,823 | |
6.000%, 07/01/16 | | | 36,957 | | | | 38,228 | |
6.000%, 01/01/17 | | | 25,135 | | | | 26,172 | |
6.000%, 02/01/17 | | | 67,039 | | | | 70,387 | |
6.000%, 08/01/17 | | | 10,989 | | | | 11,563 | |
6.000%, 09/01/17 | | | 92,913 | | | | 97,515 | |
6.000%, 03/01/18 | | | 10,751 | | | | 11,385 | |
6.000%, 11/01/18 | | | 60,683 | | | | 64,187 | |
6.000%, 01/01/21 | | | 99,418 | | | | 107,143 | |
6.000%, 05/01/21 | | | 42,597 | | | | 45,701 | |
Fannie Mae 20 Yr. Pool
6.000%, 11/01/25 | | | 46,484 | | | | 51,915 | |
Fannie Mae 30 Yr. Pool
3.500%, 11/01/41 | | | 140,725 | | | | 140,027 | |
3.500%, 01/01/42 | | | 1,158,885 | | | | 1,153,364 | |
3.500%, 04/01/43 | | | 1,318,205 | | | | 1,310,817 | |
3.500%, 05/01/43 | | | 2,708,878 | | | | 2,693,706 | |
3.500%, 06/01/43 | | | 850,285 | | | | 845,558 | |
3.500%, 07/01/43 | | | 2,124,599 | | | | 2,112,742 | |
3.500%, 09/01/43 | | | 3,287,478 | | | | 3,269,141 | |
4.000%, 02/01/41 | | | 272,566 | | | | 280,739 | |
4.000%, TBA (c) | | | 9,786,000 | | | | 10,010,772 | |
4.500%, 08/01/33 | | | 418,925 | | | | 445,520 | |
4.500%, 03/01/34 | | | 1,267,640 | | | | 1,347,902 | |
4.500%, 08/01/40 | | | 105,977 | | | | 112,568 | |
4.500%, 02/01/41 | | | 569,874 | | | | 605,521 | |
4.500%, 04/01/41 | | | 594,430 | | | | 631,388 | |
4.500%, TBA (c) | | | 3,378,000 | | | | 3,556,533 | |
5.000%, 11/01/33 | | | 238,287 | | | | 259,378 | |
|
Agency Sponsored Mortgage - Backed—(Continued) | |
Fannie Mae 30 Yr. Pool
5.000%, 03/01/34 | | | 199,567 | | | | 217,257 | |
5.000%, 05/01/34 | | | 87,213 | | | | 94,860 | |
5.000%, 08/01/34 | | | 88,097 | | | | 95,780 | |
5.000%, 09/01/34 | | | 320,891 | | | | 348,688 | |
5.000%, 06/01/35 | | | 248,287 | | | | 269,254 | |
5.000%, 07/01/35 | | | 703,149 | | | | 763,045 | |
5.000%, 08/01/35 | | | 222,212 | | | | 241,150 | |
5.000%, 09/01/35 | | | 151,793 | | | | 164,779 | |
5.000%, 10/01/35 | | | 636,771 | | | | 691,247 | |
5.000%, 07/01/39 | | | 730,362 | | | | 798,425 | |
5.000%, 10/01/39 | | | 435,339 | | | | 476,759 | |
5.000%, 11/01/39 | | | 162,604 | | | | 177,869 | |
5.000%, 11/01/40 | | | 230,890 | | | | 251,980 | |
5.000%, 01/01/41 | | | 100,754 | | | | 109,913 | |
5.000%, 03/01/41 | | | 137,649 | | | | 150,234 | |
5.500%, 02/01/33 | | | 118,957 | | | | 131,024 | |
5.500%, 05/01/33 | | | 18,631 | | | | 20,645 | |
5.500%, 06/01/33 | | | 382,236 | | | | 422,525 | |
5.500%, 11/01/33 | | | 244,229 | | | | 269,206 | |
5.500%, 12/01/33 | | | 48,544 | | | | 53,707 | |
5.500%, 01/01/34 | | | 180,788 | | | | 200,621 | |
5.500%, 02/01/34 | | | 371,023 | | | | 410,492 | |
5.500%, 03/01/34 | | | 92,134 | | | | 103,105 | |
5.500%, 04/01/34 | | | 104,622 | | | | 116,548 | |
5.500%, 05/01/34 | | | 691,662 | | | | 770,592 | |
5.500%, 06/01/34 | | | 742,911 | | | | 818,817 | |
5.500%, 07/01/34 | | | 291,512 | | | | 322,371 | |
5.500%, 09/01/34 | | | 1,000,658 | | | | 1,105,976 | |
5.500%, 10/01/34 | | | 1,271,368 | | | | 1,406,097 | |
5.500%, 11/01/34 | | | 1,442,076 | | | | 1,588,889 | |
5.500%, 12/01/34 | | | 753,849 | | | | 831,565 | |
5.500%, 01/01/35 | | | 707,614 | | | | 784,245 | |
5.500%, 02/01/35 | | | 62,527 | | | | 68,738 | |
5.500%, 04/01/35 | | | 127,103 | | | | 140,728 | |
5.500%, 07/01/35 | | | 86,802 | | | | 95,360 | |
5.500%, 08/01/35 | | | 47,030 | | | | 51,684 | |
5.500%, 09/01/35 (d) | | | 412,011 | | | | 459,546 | |
6.000%, 02/01/32 | | | 265,602 | | | | 297,810 | |
6.000%, 03/01/34 | | | 45,898 | | | | 51,621 | |
6.000%, 04/01/34 | | | 454,899 | | | | 510,972 | |
6.000%, 06/01/34 | | | 591,459 | | | | 664,079 | |
6.000%, 07/01/34 | | | 508,285 | | | | 567,835 | |
6.000%, 08/01/34 | | | 866,358 | | | | 966,027 | |
6.000%, 10/01/34 | | | 417,249 | | | | 464,317 | |
6.000%, 11/01/34 | | | 54,166 | | | | 60,278 | |
6.000%, 12/01/34 | | | 44,391 | | | | 49,655 | |
6.000%, 08/01/35 | | | 106,707 | | | | 118,458 | |
6.000%, 09/01/35 (d) | | | 141,836 | | | | 158,533 | |
6.000%, 10/01/35 | | | 229,130 | | | | 257,020 | |
6.000%, 11/01/35 | | | 42,024 | | | | 46,742 | |
6.000%, 12/01/35 | | | 254,726 | | | | 284,531 | |
6.000%, 02/01/36 | | | 244,431 | | | | 273,265 | |
6.000%, 04/01/36 | | | 297,325 | | | | 332,354 | |
6.000%, 06/01/36 | | | 107,949 | | | | 120,291 | |
6.000%, 07/01/37 | | | 314,735 | | | | 350,456 | |
See accompanying notes to financial statements.
MSF-8
Metropolitan Series Fund
MFS Total Return Portfolio
Schedule of Investments as of December 31, 2013
U.S. Treasury & Government Agencies—(Continued)
| | | | | | | | |
| Security Description | | Principal
Amount* | | | Value | |
|
Agency Sponsored Mortgage - Backed—(Continued) | |
Fannie Mae 30 Yr. Pool
6.500%, 06/01/31 | | | 81,920 | | | $ | 92,241 | |
6.500%, 07/01/31 | | | 23,236 | | | | 25,838 | |
6.500%, 08/01/31 | | | 16,472 | | | | 18,321 | |
6.500%, 09/01/31 | | | 70,920 | | | | 78,799 | |
6.500%, 02/01/32 | | | 48,511 | | | | 53,968 | |
6.500%, 07/01/32 | | | 48,498 | | | | 56,156 | |
6.500%, 08/01/32 | | | 189,572 | | | | 210,994 | |
6.500%, 01/01/33 | | | 80,744 | | | | 91,968 | |
6.500%, 04/01/34 | | | 125,365 | | | | 140,852 | |
6.500%, 06/01/34 | | | 44,273 | | | | 49,253 | |
6.500%, 08/01/34 | | | 93,769 | | | | 104,343 | |
6.500%, 04/01/36 | | | 27,380 | | | | 30,443 | |
6.500%, 05/01/36 | | | 157,630 | | | | 177,993 | |
6.500%, 02/01/37 | | | 334,309 | | | | 372,651 | |
6.500%, 05/01/37 | | | 189,559 | | | | 210,946 | |
6.500%, 07/01/37 | | | 175,376 | | | | 196,011 | |
7.500%, 10/01/29 | | | 16,679 | | | | 18,218 | |
7.500%, 02/01/30 | | | 16,131 | | | | 18,663 | |
7.500%, 11/01/31 | | | 88,337 | | | | 102,913 | |
7.500%, 02/01/32 | | | 20,690 | | | | 24,722 | |
Fannie Mae Pool
2.410%, 05/01/23 | | | 99,045 | | | | 92,231 | |
2.550%, 05/01/23 | | | 159,417 | | | | 150,107 | |
3.800%, 02/01/18 | | | 139,293 | | | | 148,350 | |
3.849%, 07/01/18 | | | 193,793 | | | | 208,888 | |
3.910%, 02/01/18 | | | 202,008 | | | | 217,584 | |
4.521%, 05/01/14 | | | 291,622 | | | | 292,519 | |
4.600%, 09/01/19 | | | 133,926 | | | | 147,409 | |
4.821%, 02/01/14 | | | 78,877 | | | | 77,966 | |
4.825%, 08/01/14 | | | 601,635 | | | | 603,351 | |
4.880%, 03/01/20 | | | 277,432 | | | | 302,352 | |
4.940%, 08/01/15 | | | 50,000 | | | | 52,206 | |
5.000%, 12/01/18 | | | 380,145 | | | | 405,090 | |
5.000%, 08/01/20 | | | 67,477 | | | | 72,610 | |
5.370%, 05/01/18 | | | 626,034 | | | | 707,719 | |
5.464%, 11/01/15 (d) | | | 380,144 | | | | 403,387 | |
5.500%, 07/01/33 | | | 389,900 | | | | 429,835 | |
5.500%, 01/01/34 | | | 89,326 | | | | 98,435 | |
5.662%, 02/01/16 (d) | | | 210,339 | | | | 226,576 | |
5.725%, 07/01/16 (d) | | | 257,789 | | | | 283,311 | |
6.000%, 07/01/17 | | | 100,369 | | | | 105,789 | |
6.500%, 07/01/32 | | | 151,345 | | | | 169,859 | |
Fannie Mae-ACES
2.578%, 09/25/18 | | | 500,000 | | | | 511,343 | |
Freddie Mac 15 Yr. Gold Pool
4.500%, 05/01/18 | | | 46,057 | | | | 48,819 | |
4.500%, 08/01/18 | | | 99,906 | | | | 105,882 | |
4.500%, 11/01/18 | | | 112,923 | | | | 119,654 | |
4.500%, 01/01/19 | | | 221,871 | | | | 235,210 | |
4.500%, 08/01/19 | | | 11,746 | | | | 12,455 | |
4.500%, 02/01/20 | | | 81,436 | | | | 86,515 | |
4.500%, 08/01/24 | | | 662,704 | | | | 710,730 | |
5.000%, 12/01/17 | | | 3,149 | | | | 3,333 | |
5.000%, 05/01/18 | | | 42,330 | | | | 44,814 | |
5.000%, 09/01/18 | | | 121,057 | | | | 128,209 | |
|
Agency Sponsored Mortgage - Backed—(Continued) | |
Freddie Mac 15 Yr. Gold Pool
5.500%, 01/01/19 | | | 38,377 | | | | 40,436 | |
5.500%, 04/01/19 | | | 17,710 | | | | 18,658 | |
5.500%, 06/01/19 | | | 14,023 | | | | 14,778 | |
5.500%, 07/01/19 | | | 22,683 | | | | 24,050 | |
5.500%, 08/01/19 | | | 14,380 | | | | 15,573 | |
5.500%, 02/01/20 | | | 11,586 | | | | 12,579 | |
6.000%, 04/01/16 | | | 3,932 | | | | 4,065 | |
6.000%, 04/01/17 | | | 24,700 | | | | 25,921 | |
6.000%, 07/01/17 | | | 16,897 | | | | 17,600 | |
6.000%, 10/01/17 | | | 20,268 | | | | 21,143 | |
6.000%, 08/01/19 | | | 127,383 | | | | 136,321 | |
6.000%, 09/01/19 | | | 26,450 | | | | 28,102 | |
6.000%, 11/01/19 | | | 55,102 | | | | 58,480 | |
6.000%, 05/01/21 | | | 52,695 | | | | 56,752 | |
6.000%, 10/01/21 | | | 81,948 | | | | 88,307 | |
Freddie Mac 20 Yr. Gold Pool
5.500%, 10/01/24 | | | 108,984 | | | | 119,972 | |
5.500%, 06/01/25 | | | 205,808 | | | | 226,950 | |
5.500%, 07/01/25 | | | 106,429 | | | | 117,298 | |
5.500%, 08/01/25 | | | 154,380 | | | | 170,092 | |
6.000%, 02/01/23 | | | 163,965 | | | | 180,727 | |
6.000%, 12/01/25 | | | 71,444 | | | | 79,007 | |
6.000%, 02/01/26 | | | 58,662 | | | | 64,951 | |
Freddie Mac 30 Yr. Gold Pool
3.000%, 10/01/42 | | | 1,922,596 | | | | 1,823,699 | |
3.000%, 04/01/43 | | | 1,959,660 | | | | 1,858,947 | |
3.000%, 05/01/43 | | | 1,761,751 | | | | 1,671,291 | |
3.500%, 02/01/42 | | | 981,270 | | | | 975,267 | |
3.500%, 04/01/42 | | | 588,331 | | | | 585,542 | |
3.500%, 12/01/42 | | | 1,594,449 | | | | 1,585,182 | |
3.500%, 04/01/43 | | | 411,827 | | | | 409,429 | |
3.500%, 07/01/43 | | | 591,222 | | | | 587,287 | |
3.500%, 08/01/43 | | | 974,364 | | | | 967,881 | |
4.000%, 11/01/40 | | | 1,534,041 | | | | 1,576,643 | |
4.000%, 01/01/41 | | | 2,080,629 | | | | 2,138,261 | |
4.000%, 11/01/43 | | | 1,707,374 | | | | 1,755,196 | |
4.000%, TBA (c) | | | 780,000 | | | | 796,027 | |
4.500%, 04/01/35 | | | 71,202 | | | | 75,659 | |
4.500%, 07/01/39 | | | 629,850 | | | | 667,042 | |
4.500%, 09/01/39 | | | 316,890 | | | | 335,650 | |
4.500%, 10/01/39 | | | 189,453 | | | | 200,635 | |
5.000%, 09/01/33 | | | 492,666 | | | | 533,471 | |
5.000%, 03/01/34 | | | 117,487 | | | | 128,881 | |
5.000%, 04/01/34 | | | 85,374 | | | | 92,456 | |
5.000%, 08/01/35 | | | 130,411 | | | | 140,832 | |
5.000%, 10/01/35 | | | 247,441 | | | | 268,570 | |
5.000%, 11/01/35 | | | 234,739 | | | | 253,345 | |
5.000%, 12/01/36 | | | 151,360 | | | | 163,432 | |
5.000%, 07/01/39 | | | 1,125,264 | | | | 1,213,269 | |
5.500%, 12/01/33 | | | 496,087 | | | | 550,822 | |
5.500%, 01/01/34 | | | 346,156 | | | | 380,822 | |
5.500%, 04/01/34 | | | 98,339 | | | | 109,990 | |
5.500%, 11/01/34 | | | 82,379 | | | | 91,050 | |
5.500%, 12/01/34 | | | 122,343 | | | | 135,267 | |
5.500%, 05/01/35 | | | 46,505 | | | | 51,079 | |
See accompanying notes to financial statements.
MSF-9
Metropolitan Series Fund
MFS Total Return Portfolio
Schedule of Investments as of December 31, 2013
U.S. Treasury & Government Agencies—(Continued)
| | | | | | | | |
| Security Description | | Principal
Amount* | | | Value | |
|
Agency Sponsored Mortgage - Backed—(Continued) | |
Freddie Mac 30 Yr. Gold Pool
5.500%, 09/01/35 | | | 104,541 | | | $ | 115,463 | |
5.500%, 10/01/35 | | | 139,490 | | | | 152,876 | |
6.000%, 04/01/34 | | | 138,800 | | | | 155,402 | |
6.000%, 07/01/34 | | | 68,389 | | | | 75,947 | |
6.000%, 08/01/34 | | | 579,497 | | | | 647,333 | |
6.000%, 09/01/34 | | | 7,626 | | | | 8,429 | |
6.000%, 07/01/35 | | | 107,517 | | | | 120,184 | |
6.000%, 08/01/35 | | | 111,491 | | | | 124,499 | |
6.000%, 11/01/35 | | | 255,205 | | | | 285,340 | |
6.000%, 03/01/36 | | | 123,062 | | | | 137,169 | |
6.000%, 10/01/36 | | | 138,677 | | | | 155,378 | |
6.000%, 03/01/37 | | | 16,515 | | | | 18,220 | |
6.000%, 05/01/37 | | | 164,288 | | | | 182,633 | |
6.000%, 06/01/37 | | | 199,225 | | | | 221,732 | |
6.500%, 05/01/34 | | | 46,713 | | | | 52,076 | |
6.500%, 06/01/34 | | | 93,576 | | | | 104,292 | |
6.500%, 08/01/34 | | | 279,472 | | | | 311,448 | |
6.500%, 10/01/34 | | | 174,414 | | | | 196,531 | |
6.500%, 11/01/34 | | | 48,330 | | | | 53,855 | |
6.500%, 05/01/37 | | | 139,773 | | | | 156,077 | |
6.500%, 07/01/37 | | | 230,793 | | | | 259,043 | |
Freddie Mac Multifamily Structured Pass-Through Certificates
1.426%, 08/25/17 | | | 250,000 | | | | 250,785 | |
1.869%, 11/25/19 | | | 363,000 | | | | 350,912 | |
2.303%, 09/25/18 | | | 176,087 | | | | 177,978 | |
2.412%, 08/25/18 | | | 458,000 | | | | 466,709 | |
2.682%, 10/25/22 | | | 620,000 | | | | 587,133 | |
3.154%, 02/25/18 | | | 118,000 | | | | 123,791 | |
3.320%, 02/25/23 (d) | | | 186,000 | | | | 183,963 | |
3.458%, 08/25/23 (d) | | | 835,000 | | | | 829,765 | |
3.808%, 08/25/20 | | | 1,030,000 | | | | 1,085,667 | |
3.882%, 11/25/17 (d) | | | 332,556 | | | | 357,927 | |
5.085%, 03/25/19 (d) | | | 1,226,000 | | | | 1,383,188 | |
Ginnie Mae I 30 Yr. Pool
3.000%, 02/15/43 | | | 743,002 | | | | 718,959 | |
3.500%, 12/15/41 | | | 446,433 | | | | 451,787 | |
3.500%, 02/15/42 | | | 305,733 | | | | 308,668 | |
4.500%, 09/15/33 | | | 171,197 | | | | 184,250 | |
4.500%, 11/15/39 | | | 732,607 | | | | 783,504 | |
4.500%, 03/15/40 | | | 590,284 | | | | 640,256 | |
4.500%, 04/15/40 | | | 905,544 | | | | 972,815 | |
4.500%, 06/15/40 | | | 351,598 | | | | 379,059 | |
5.000%, 03/15/34 | | | 65,756 | | | | 71,952 | |
5.000%, 06/15/34 | | | 114,600 | | | | 125,400 | |
5.000%, 12/15/34 | | | 66,771 | | | | 73,065 | |
5.000%, 06/15/35 | | | 20,678 | | | | 22,437 | |
5.500%, 11/15/32 | | | 232,575 | | | | 255,710 | |
5.500%, 08/15/33 | | | 459,403 | | | | 510,294 | |
5.500%, 12/15/33 | | | 292,931 | | | | 328,577 | |
5.500%, 09/15/34 | | | 222,365 | | | | 246,681 | |
5.500%, 10/15/35 | | | 49,159 | | | | 54,603 | |
6.000%, 12/15/28 | | | 65,691 | | | | 73,199 | |
6.000%, 12/15/31 | | | 84,018 | | | | 96,619 | |
6.000%, 03/15/32 | | | 3,984 | | | | 4,433 | |
|
Agency Sponsored Mortgage - Backed—(Continued) | |
Ginnie Mae I 30 Yr. Pool
6.000%, 10/15/32 | | | 248,791 | | | | 280,355 | |
6.000%, 01/15/33 | | | 84,894 | | | | 94,468 | |
6.000%, 02/15/33 | | | 3,277 | | | | 3,666 | |
6.000%, 04/15/33 | | | 308,138 | | | | 347,188 | |
6.000%, 08/15/33 | | | 2,167 | | | | 2,417 | |
6.000%, 07/15/34 | | | 210,014 | | | | 236,377 | |
6.000%, 09/15/34 | | | 71,706 | | | | 79,761 | |
6.000%, 01/15/38 | | | 287,614 | | | | 323,526 | |
Ginnie Mae II 30 Yr. Pool
3.000%, 06/20/43 | | | 1,536,641 | | | | 1,487,317 | |
3.000%, 07/20/43 | | | 689,666 | | | | 667,517 | |
3.500%, 06/20/43 | | | 2,186,589 | | | | 2,209,280 | |
3.500%, 07/20/43 | | | 2,420,761 | | | | 2,445,923 | |
4.000%, 01/20/41 | | | 2,146,885 | | | | 2,236,324 | |
4.000%, 02/20/41 | | | 528,041 | | | | 550,048 | |
4.000%, 04/20/41 | | | 398,415 | | | | 415,007 | |
4.000%, 02/20/42 | | | 595,709 | | | | 620,199 | |
4.500%, 07/20/33 | | | 34,817 | | | | 37,564 | |
4.500%, 09/20/33 | | | 23,573 | | | | 25,426 | |
4.500%, 12/20/34 | | | 19,222 | | | | 20,737 | |
4.500%, 03/20/35 | | | 110,623 | | | | 119,345 | |
4.500%, 01/20/41 | | | 589,285 | | | | 632,618 | |
5.000%, 07/20/33 | | | 79,628 | | | | 86,967 | |
6.000%, 01/20/35 | | | 81,624 | | | | 92,811 | |
6.000%, 02/20/35 | | | 41,151 | | | | 47,625 | |
6.000%, 04/20/35 | | | 63,563 | | | | 71,030 | |
| | | | | | | | |
| | | | | | | 120,202,744 | |
| | | | | | | | |
| | |
Federal Agencies—0.1% | | | | | | | | |
Financing Corp.
9.650%, 11/02/18 | | | 430,000 | | | | 580,957 | |
| | | | | | | | |
| | |
U.S. Treasury—11.9% | | | | | | | | |
U.S. Treasury Bonds
4.500%, 02/15/36 | | | 293,000 | | | | 326,008 | |
4.500%, 08/15/39 | | | 16,876,000 | | | | 18,706,000 | |
5.000%, 05/15/37 | | | 1,509,000 | | | | 1,795,710 | |
5.250%, 02/15/29 (b) | | | 16,000 | | | | 19,260 | |
5.375%, 02/15/31 | | | 887,000 | | | | 1,086,991 | |
6.250%, 08/15/23 (b) | | | 80,000 | | | | 102,763 | |
8.500%, 02/15/20 (b) | | | 1,104,000 | | | | 1,513,602 | |
U.S. Treasury Notes | | | | | | | | |
0.500%, 08/15/14 (b) | | | 3,838,000 | | | | 3,846,996 | |
0.875%, 12/31/16 | | | 16,276,000 | | | | 16,311,612 | |
1.875%, 02/28/14 | | | 2,369,800 | | | | 2,376,464 | |
2.125%, 05/31/15 | | | 36,665,000 | | | | 37,640,362 | |
2.625%, 02/29/16 | | | 800,000 | | | | 838,000 | |
2.750%, 02/15/19 (b) | | | 2,524,100 | | | | 2,644,782 | |
3.125%, 05/15/19 | | | 6,086,000 | | | | 6,485,394 | |
3.125%, 05/15/21 | | | 18,919,000 | | | | 19,721,582 | |
3.500%, 05/15/20 | | | 7,140,000 | | | | 7,702,832 | |
3.750%, 11/15/18 | | | 2,067,000 | | | | 2,268,371 | |
4.125%, 05/15/15 | | | 125,000 | | | | 131,650 | |
See accompanying notes to financial statements.
MSF-10
Metropolitan Series Fund
MFS Total Return Portfolio
Schedule of Investments as of December 31, 2013
U.S. Treasury & Government Agencies—(Continued)
| | | | | | | | |
| Security Description | | Principal
Amount* | | | Value | |
| | |
U.S. Treasury—(Continued) | | | | | | | | |
U.S. Treasury Notes
4.750%, 08/15/17 | | | 2,444,000 | | | $ | 2,761,148 | |
| | | | | | | | |
| | | | | | | 126,279,527 | |
| | | | | | | | |
Total U.S. Treasury & Government Agencies
(Cost $246,115,223) | | | | | | | 247,063,228 | |
| | | | | | | | |
|
| Corporate Bonds & Notes—10.4% | |
| | |
Aerospace/Defense—0.1% | | | | | | | | |
BAE Systems Holdings, Inc.
5.200%, 08/15/15 (144A) | | | 756,000 | | | | 802,707 | |
United Technologies Corp.
3.100%, 06/01/22 | | | 420,000 | | | | 410,669 | |
| | | | | | | | |
| | | | | | | 1,213,376 | |
| | | | | | | | |
| | |
Agriculture—0.2% | | | | | | | | |
Altria Group, Inc.
2.850%, 08/09/22 | | | 1,020,000 | | | | 939,135 | |
BAT International Finance plc
3.250%, 06/07/22 (144A) | | | 1,026,000 | | | | 982,703 | |
| | | | | | | | |
| | | | | | | 1,921,838 | |
| | | | | | | | |
| | |
Auto Manufacturers—0.1% | | | | | | | | |
Volkswagen International Finance NV
2.375%, 03/22/17 (144A) | | | 857,000 | | | | 879,204 | |
| | | | | | | | |
| | |
Banks—2.9% | | | | | | | | |
ABN AMRO Bank NV
2.006%, 01/30/14 (144A) (d) | | | 1,040,000 | | | | 1,041,308 | |
Achmea Hypotheekbank NV
3.200%, 11/03/14 (144A) (d) | | | 541,000 | | | | 553,670 | |
Banco Bradesco S.A.
6.750%, 09/29/19 (144A) | | | 613,000 | | | | 675,526 | |
Banco de Credito del Peru
5.375%, 09/16/20 | | | 835,000 | | | | 868,400 | |
Bank of America Corp.
5.490%, 03/15/19 | | | 196,000 | | | | 216,977 | |
7.375%, 05/15/14 | | | 510,000 | | | | 522,693 | |
7.625%, 06/01/19 | | | 710,000 | | | | 880,632 | |
Bank of Tokyo-Mitsubishi UFJ, Ltd. (The)
4.100%, 09/09/23 (144A) | | | 890,000 | | | | 891,669 | |
Bank One Corp.
8.000%, 04/29/27 | | | 100,000 | | | | 127,716 | |
BBVA Bancomer S.A.
6.750%, 09/30/22 (144A) (b) | | | 810,000 | | | | 862,650 | |
BNP Paribas S.A.
7.195%, 06/25/37 (144A) (b) (d) | | | 500,000 | | | | 516,250 | |
BPCE S.A.
12.500%, 08/29/49 (144A) (b) (d) | | | 922,000 | | | | 1,203,210 | |
Capital One Financial Corp.
6.150%, 09/01/16 | | | 1,330,000 | | | | 1,487,581 | |
Citigroup, Inc.
2.500%, 09/26/18 | | | 580,000 | | | | 582,927 | |
5.000%, 09/15/14 | | | 1,105,000 | | | | 1,136,476 | |
| | |
Banks—(Continued) | | | | | | | | |
Commonwealth Bank of Australia
5.000%, 10/15/19 (144A) | | | 710,000 | | | | 791,387 | |
Credit Suisse
5.500%, 05/01/14 | | | 950,000 | | | | 965,485 | |
Credit Suisse AG
6.500%, 08/08/23 (144A) | | | 830,000 | | | | 882,913 | |
Discover Bank
4.200%, 08/08/23 | | | 510,000 | | | | 503,018 | |
Goldman Sachs Group, Inc. (The)
5.625%, 01/15/17 | | | 1,351,000 | | | | 1,488,718 | |
HSBC Holdings plc
5.100%, 04/05/21 | | | 679,000 | | | | 754,674 | |
ING Bank NV
3.750%, 03/07/17 (144A) | | | 829,000 | | | | 873,119 | |
5.800%, 09/25/23 (144A) | | | 1,076,000 | | | | 1,125,059 | |
JPMorgan Chase & Co.
3.250%, 09/23/22 | | | 262,000 | | | | 251,080 | |
6.300%, 04/23/19 | | | 1,210,000 | | | | 1,428,107 | |
KFW
4.875%, 06/17/19 | | | 1,290,000 | | | | 1,472,148 | |
Morgan Stanley
6.625%, 04/01/18 | | | 2,030,000 | | | | 2,375,291 | |
PNC Funding Corp.
5.625%, 02/01/17 | | | 1,080,000 | | | | 1,198,803 | |
Royal Bank of Scotland Group plc
2.550%, 09/18/15 | | | 247,000 | | | | 252,621 | |
Santander U.S. Debt S.A.
3.781%, 10/07/15 (144A) | | | 500,000 | | | | 515,223 | |
SunTrust Banks, Inc.
2.350%, 11/01/18 | | | 448,000 | | | | 445,627 | |
Svenska Handelsbanken AB
4.875%, 06/10/14 (144A) | | | 970,000 | | | | 989,177 | |
Swedbank AB
2.125%, 09/29/17 (144A) | | | 231,000 | | | | 231,070 | |
Wachovia Corp.
5.250%, 08/01/14 | | | 924,000 | | | | 949,121 | |
Wells Fargo & Co.
2.100%, 05/08/17 | | | 990,000 | | | | 1,008,463 | |
| | | | | | | | |
| | | | | | | 30,068,789 | |
| | | | | | | | |
| | |
Beverages—0.2% | | | | | | | | |
Anheuser-Busch InBev Worldwide, Inc.
8.000%, 11/15/39 | | | 1,020,000 | | | | 1,470,023 | |
Diageo Capital plc
2.625%, 04/29/23 | | | 1,020,000 | | | | 929,960 | |
| | | | | | | | |
| | | | | | | 2,399,983 | |
| | | | | | | | |
| | |
Commercial Services—0.1% | | | | | | | | |
ERAC USA Finance LLC
7.000%, 10/15/37 (144A) | | | 1,115,000 | | | | 1,319,517 | |
| | | | | | | | |
| | |
Computers—0.0% | | | | | | | | |
Apple, Inc.
3.850%, 05/04/43 | | | 370,000 | | | | 309,107 | |
| | | | | | | | |
See accompanying notes to financial statements.
MSF-11
Metropolitan Series Fund
MFS Total Return Portfolio
Schedule of Investments as of December 31, 2013
Corporate Bonds & Notes—(Continued)
| | | | | | | | |
| Security Description | | Principal
Amount* | | | Value | |
| | |
Diversified Financial Services—0.3% | | | | | | | | |
American Express Co.
5.500%, 09/12/16 | | | 960,000 | | | $ | 1,067,793 | |
General Electric Capital Corp.
3.100%, 01/09/23 | | | 481,000 | | | | 456,353 | |
Toyota Motor Credit Corp.
3.200%, 06/17/15 | | | 630,000 | | | | 655,164 | |
3.400%, 09/15/21 | | | 880,000 | | | | 893,357 | |
ZFS Finance USA Trust V
6.500%, 05/09/67 (144A) (d) | | | 491,000 | | | | 521,687 | |
| | | | | | | | |
| | | | | | | 3,594,354 | |
| | | | | | | | |
| | |
Electric—0.6% | | | | | | | | |
GG1C Funding Corp.
5.129%, 01/15/14 (144A) (e) | | | 132,568 | | | | 132,686 | |
Midamerican Funding, LLC
6.927%, 03/01/29 | | | 699,000 | | | | 843,009 | |
Oncor Electric Delivery Co. LLC
7.000%, 09/01/22 | | | 795,000 | | | | 948,426 | |
Pacific Gas & Electric Co.
4.600%, 06/15/43 | | | 880,000 | | | | 839,725 | |
PPL Capital Funding, Inc.
3.400%, 06/01/23 (b) | | | 880,000 | | | | 818,833 | |
Progress Energy, Inc.
3.150%, 04/01/22 | | | 1,083,000 | | | | 1,042,779 | |
PSEG Power LLC
5.320%, 09/15/16 | | | 989,000 | | | | 1,088,178 | |
W3A Funding Corp.
8.090%, 01/02/17 | | | 362,191 | | | | 360,964 | |
| | | | | | | | |
| | | | | | | 6,074,600 | |
| | | | | | | | |
| | |
Engineering & Construction—0.0% | | | | | | | | |
ABB Finance USA, Inc.
2.875%, 05/08/22 | | | 309,000 | | | | 291,984 | |
| | | | | | | | |
| | |
Food—0.1% | | | | | | | | |
ConAgra Foods, Inc.
3.200%, 01/25/23 | | | 516,000 | | | | 479,069 | |
Kraft Foods Group, Inc.
3.500%, 06/06/22 | | | 412,000 | | | | 401,533 | |
WM Wrigley Jr. Co.
2.400%, 10/21/18 (144A) | | | 248,000 | | | | 246,479 | |
| | | | | | | | |
| | | | | | | 1,127,081 | |
| | | | | | | | |
| | |
Healthcare-Products—0.3% | | | | | | | | |
Baxter International, Inc.
3.200%, 06/15/23 | | | 610,000 | | | | 582,763 | |
CareFusion Corp.
6.375%, 08/01/19 | | | 1,110,000 | | | | 1,256,213 | |
Hospira, Inc.
6.050%, 03/30/17 (d) | | | 979,000 | | | | 1,080,219 | |
| | | | | | | | |
| | | | | | | 2,919,195 | |
| | | | | | | | |
| | |
Healthcare-Services—0.2% | | | | | | | | |
Roche Holdings, Inc.
6.000%, 03/01/19 (144A) | | | 1,183,000 | | | | 1,384,388 | |
WellPoint, Inc.
3.300%, 01/15/23 | | | 600,000 | | | | 559,928 | |
| | | | | | | | |
| | | | | | | 1,944,316 | |
| | | | | | | | |
| | |
Household Products/Wares—0.1% | | | | | | | | |
Reckitt Benckiser Treasury Services plc
3.625%, 09/21/23 (144A) | | | 1,070,000 | | | | 1,050,103 | |
| | | | | | | | |
| | |
Insurance—0.6% | | | | | | | | |
ACE INA Holdings, Inc.
2.700%, 03/13/23 | | | 1,000,000 | | | | 916,322 | |
Allstate Corp. (The)
5.750%, 08/15/53 (d) | | | 318,000 | | | | 320,385 | |
American International Group, Inc.
4.875%, 06/01/22 | | | 1,770,000 | | | | 1,902,437 | |
Chubb Corp. (The)
6.375%, 03/29/67 (d) | | | 1,510,000 | | | | 1,634,575 | |
Liberty Mutual Group, Inc.
4.250%, 06/15/23 (144A) | | | 578,000 | | | | 558,077 | |
Marsh & McLennan Cos., Inc.
4.800%, 07/15/21 | | | 920,000 | | | | 980,749 | |
| | | | | | | | |
| | | | | | | 6,312,545 | |
| | | | | | | | |
| | |
Internet—0.1% | | | | | | | | |
Baidu, Inc.
3.500%, 11/28/22 | | | 1,110,000 | | | | 1,019,620 | |
eBay, Inc.
1.350%, 07/15/17 | | | 290,000 | | | | 288,348 | |
| | | | | | | | |
| | | | | | | 1,307,968 | |
| | | | | | | | |
| | |
Investment Company Security—0.2% | | | | | | | | |
Temasek Financial I, Ltd.
2.375%, 01/23/23 (144A) | | | 1,790,000 | | | | 1,610,723 | |
| | | | | | | | |
| | |
Iron/Steel—0.1% | | | | | | | | |
Vale Overseas, Ltd.
4.625%, 09/15/20 | | | 298,000 | | | | 305,212 | |
6.875%, 11/10/39 | | | 233,000 | | | | 241,020 | |
| | | | | | | | |
| | | | | | | 546,232 | |
| | | | | | | | |
|
Machinery-Construction & Mining—0.1% | |
Atlas Copco AB
5.600%, 05/22/17 (144A) | | | 910,000 | | | | 1,012,416 | |
| | | | | | | | |
| | |
Media—0.4% | | | | | | | | |
Comcast Corp.
2.850%, 01/15/23 (b) | | | 990,000 | | | | 915,361 | |
DIRECTV Financing Co., Inc.
4.600%, 02/15/21 | | | 550,000 | | | | 567,977 | |
Discovery Communications LLC
4.875%, 04/01/43 | | | 620,000 | | | | 571,944 | |
News America, Inc.
8.500%, 02/23/25 | | | 722,000 | | | | 909,829 | |
See accompanying notes to financial statements.
MSF-12
Metropolitan Series Fund
MFS Total Return Portfolio
Schedule of Investments as of December 31, 2013
Corporate Bonds & Notes—(Continued)
| | | | | | | | |
| Security Description | | Principal
Amount* | | | Value | |
| | |
Media—(Continued) | | | | | | | | |
Time Warner Entertainment Co. L.P.
8.375%, 07/15/33 | | | 1,240,000 | | | $ | 1,350,958 | |
| | | | | | | | |
| | | | | | | 4,316,069 | |
| | | | | | | | |
| | |
Mining—0.2% | | | | | | | | |
Corp. Nacional del Cobre de Chile
3.750%, 11/04/20 (144A) | | | 290,000 | | | | 289,889 | |
Freeport-McMoRan Copper & Gold, Inc.
3.875%, 03/15/23 | | | 1,010,000 | | | | 955,101 | |
Rio Tinto Finance USA plc
3.500%, 03/22/22 | | | 900,000 | | | | 883,190 | |
| | | | | | | | |
| | | | | | | 2,128,180 | |
| | | | | | | | |
|
Miscellaneous Manufacturing—0.1% | |
General Electric Co.
2.700%, 10/09/22 | | | 800,000 | | | | 748,799 | |
| | | | | | | | |
|
Multi-National—0.1% | |
Asian Development Bank
1.125%, 03/15/17 | | | 574,000 | | | | 576,698 | |
2.750%, 05/21/14 (b) | | | 970,000 | | | | 979,322 | |
| | | | | | | | |
| | | | | | | 1,556,020 | |
| | | | | | | | |
| | |
Oil & Gas—1.1% | | | | | | | | |
Apache Corp.
3.250%, 04/15/22 | | | 421,000 | | | | 414,792 | |
4.750%, 04/15/43 | | | 321,000 | | | | 311,353 | |
BP Capital Markets plc
4.500%, 10/01/20 | | | 306,000 | | | | 330,607 | |
4.742%, 03/11/21 | | | 847,000 | | | | 926,503 | |
CNOOC Finance 2012, Ltd.
3.875%, 05/02/22 (144A) | | | 1,010,000 | | | | 972,910 | |
EOG Resources, Inc.
2.625%, 03/15/23 | | | 302,000 | | | | 274,750 | |
Gazprom OAO Via Gaz Capital S.A.
3.850%, 02/06/20 (144A) | | | 286,000 | | | | 275,990 | |
Hess Corp.
8.125%, 02/15/19 | | | 300,000 | | | | 372,634 | |
Husky Energy, Inc.
5.900%, 06/15/14 | | | 771,000 | | | | 789,152 | |
7.250%, 12/15/19 | | | 787,000 | | | | 949,609 | |
Petro-Canada
6.050%, 05/15/18 | | | 1,664,000 | | | | 1,917,584 | |
Petrobras Global Finance BV
2.384%, 01/15/19 (d) | | | 625,000 | | | | 612,500 | |
Petrobras International Finance Co.
5.375%, 01/27/21 | | | 380,000 | | | | 377,107 | |
6.750%, 01/27/41 | | | 276,000 | | | | 256,800 | |
Petroleos Mexicanos
8.000%, 05/03/19 | | | 759,000 | | | | 918,390 | |
Ras Laffan Liquefied Natural Gas Co., Ltd. III
5.832%, 09/30/16 (144A) | | | 501,490 | | | | 532,833 | |
Statoil ASA
7.750%, 06/15/23 | | | 100,000 | | | | 128,575 | |
| | |
Oil & Gas—(Continued) | | | | | | | | |
Total Capital International S.A.
1.550%, 06/28/17 | | | 1,239,000 | | | | 1,239,266 | |
Transocean, Inc.
3.800%, 10/15/22 | | | 505,000 | | | | 478,652 | |
| | | | | | | | |
| | | | | | | 12,080,007 | |
| | | | | | | | |
| | |
Pharmaceuticals—0.4% | | | | | | | | |
AbbVie, Inc.
1.200%, 11/06/15 | | | 1,850,000 | | | | 1,868,804 | |
Express Scripts Holding Co.
2.650%, 02/15/17 | | | 1,280,000 | | | | 1,319,264 | |
Teva Pharmaceutical Finance IV B.V.
3.650%, 11/10/21 | | | 1,270,000 | | | | 1,245,641 | |
| | | | | | | | |
| | | | | | | 4,433,709 | |
| | | | | | | | |
| | |
Pipelines—0.5% | | | | | | | | |
Energy Transfer Partners L.P.
3.600%, 02/01/23 | | | 558,000 | | | | 516,729 | |
4.900%, 02/01/24 | | | 450,000 | | | | 456,829 | |
Enterprise Products Operating, LLC
6.500%, 01/31/19 | | | 908,000 | | | | 1,065,131 | |
Kinder Morgan Energy Partners L.P.
4.150%, 02/01/24 | | | 691,000 | | | | 668,523 | |
7.750%, 03/15/32 | | | 625,000 | | | | 759,629 | |
Spectra Energy Capital LLC
8.000%, 10/01/19 | | | 1,253,000 | | | | 1,492,527 | |
| | | | | | | | |
| | | | | | | 4,959,368 | |
| | | | | | | | |
| | |
Real Estate—0.1% | | | | | | | | |
WEA Finance, LLC
4.625%, 05/10/21 (144A) | | | 990,000 | | | | 1,044,800 | |
6.750%, 09/02/19 (144A) | | | 262,000 | | | | 311,519 | |
| | | | | | | | |
| | | | | | | 1,356,319 | |
| | | | | | | | |
| | |
Real Estate Investment Trusts—0.4% | | | | | | | | |
Boston Properties L.P.
5.000%, 06/01/15 | | | 200,000 | | | | 211,605 | |
ERP Operating L.P.
4.625%, 12/15/21 | | | 896,000 | | | | 944,615 | |
5.375%, 08/01/16 | | | 260,000 | | | | 286,670 | |
HCP, Inc.
5.375%, 02/01/21 | | | 734,000 | | | | 799,016 | |
Simon Property Group L.P.
5.875%, 03/01/17 | | | 1,328,000 | | | | 1,489,414 | |
| | | | | | | | |
| | | | | | | 3,731,320 | |
| | | | | | | | |
| | |
Retail—0.4% | | | | | | | | |
Gap, Inc. (The)
5.950%, 04/12/21 | | | 620,000 | | | | 685,083 | |
Home Depot, Inc. (The)
3.750%, 02/15/24 | | | 600,000 | | | | 597,200 | |
5.950%, 04/01/41 | | | 278,000 | | | | 322,780 | |
L Brands, Inc.
5.250%, 11/01/14 | | | 370,000 | | | | 381,563 | |
See accompanying notes to financial statements.
MSF-13
Metropolitan Series Fund
MFS Total Return Portfolio
Schedule of Investments as of December 31, 2013
Corporate Bonds & Notes—(Continued)
| | | | | | | | |
| Security Description | | Principal
Amount* | | | Value | |
| | |
Retail—(Continued) | | | | | | | | |
Wal-Mart Stores, Inc.
5.250%, 09/01/35 | | | 1,830,000 | | | $ | 1,987,989 | |
| | | | | | | | |
| | | | | | | 3,974,615 | |
| | | | | | | | |
|
Telecommunications—0.4% | |
Crown Castle Towers, LLC
4.883%, 08/15/40 (144A) | | | 370,000 | | | | 388,176 | |
6.113%, 01/15/40 (144A) | | | 711,000 | | | | 797,267 | |
Rogers Communications, Inc.
6.800%, 08/15/18 | | | 1,483,000 | | | | 1,767,491 | |
Verizon Communications, Inc.
6.400%, 09/15/33 | | | 1,271,000 | | | | 1,461,804 | |
| | | | | | | | |
| | | | | | | 4,414,738 | |
| | | | | | | | |
| | |
Transportation—0.0% | | | | | | | | |
Norfolk Southern Corp.
4.837%, 10/01/41 | | | 402,000 | | | | 383,789 | |
| | | | | | | | |
Total Corporate Bonds & Notes
(Cost $103,126,592) | | | | | | | 109,986,264 | |
| | | | | | | | |
|
| Mortgage-Backed Securities—2.0% | |
|
Collateralized Mortgage Obligations—0.1% | |
American Tower Trust I
3.070%, 03/15/48 (144A) | | | 1,000,000 | | | | 935,557 | |
BlackRock Capital Finance L.P.
7.750%, 09/25/26 (144A) | | | 57,635 | | | | 6,736 | |
| | | | | | | | |
| | | | | | | 942,293 | |
| | | | | | | | |
|
Commercial Mortgage-Backed Securities—1.9% | |
Credit Suisse Commercial Mortgage Trust
5.695%, 09/15/40 (d) | | | 1,735,738 | | | | 1,916,909 | |
General Electric Capital Assurance Co.
5.743%, 05/12/35 (144A) (d) (e) | | | 35,000 | | | | 39,798 | |
Greenwich Capital Commercial Funding Corp.
5.475%, 03/10/39 | | | 3,025,000 | | | | 3,218,912 | |
GS Mortgage Securities Trust
5.804%, 08/10/45 (d) | | | 3,539,527 | | | | 3,886,641 | |
JP Morgan Chase Commercial Mortgage Securities Corp.
5.250%, 05/15/41 (d) | | | 644,870 | | | | 647,253 | |
JP Morgan Chase Commercial Mortgage Securities Trust
5.475%, 04/15/43 (d) | | | 149,485 | | | | 161,703 | |
5.806%, 06/15/49 (d) | | | 2,207,157 | | | | 2,455,060 | |
Merrill Lynch / Countrywide Commercial Mortgage Trust
5.740%, 06/12/50 (d) | | | 3,700,015 | | | | 4,092,361 | |
Morgan Stanley Capital I, Inc.
0.935%, 11/15/30 (144A) (d) (f) | | | 1,815,450 | | | | 51,973 | |
Spirit Master Funding, LLC
5.050%, 07/20/23 (e) | | | 816,287 | | | | 838,735 | |
|
Commercial Mortgage-Backed Securities—(Continued) | |
Wachovia Bank Commercial Mortgage Trust
5.733%, 06/15/49 (d) | | | 1,131,867 | | | | 1,252,645 | |
5.925%, 02/15/51 (d) | | | 1,500,000 | | | | 1,635,940 | |
| | | | | | | | |
| | | | | | | 20,197,930 | |
| | | | | | | | |
Total Mortgage-Backed Securities
(Cost $20,662,847) | | | | | | | 21,140,223 | |
| | | | | | | | |
|
| Foreign Government—0.7% | |
| | |
Sovereign—0.7% | | | | | | | | |
Egypt Government AID Bonds
4.450%, 09/15/15 | | | 1,903,000 | | | | 2,031,523 | |
Iceland Government International Bond
4.875%, 06/16/16 (144A) | | | 970,000 | | | | 1,006,375 | |
Mexico Government International Bond
4.750%, 03/08/44 | | | 1,375,000 | | | | 1,239,219 | |
Peruvian Government International Bond
7.350%, 07/21/25 | | | 103,000 | | | | 129,780 | |
Russian Foreign Bond - Eurobond
3.625%, 04/29/15 (144A) (b) (e) | | | 2,100,000 | | | | 2,168,250 | |
Societe Financement de l’Economie Francaise
3.375%, 05/05/14 (144A) | | | 730,000 | | | | 737,446 | |
| | | | | | | | |
Total Foreign Government
(Cost $7,277,438) | | | | | | | 7,312,593 | |
| | | | | | | | |
|
| Asset-Backed Securities—0.4% | |
| | |
Asset-Backed - Home Equity—0.2% | | | | | | | | |
Bayview Financial Revolving Asset Trust 1.767%, 12/28/40 (144A) (d) (e) | | | 924,878 | | | | 489,116 | |
GMAC Home Equity Loan Trust
5.805%, 10/25/36 (d) | | | 431,038 | | | | 419,051 | |
Home Equity Loan Trust
5.320%, 12/25/35 (d) | | | 1,082,011 | | | | 893,482 | |
| | | | | | | | |
| | | | | | | 1,801,649 | |
| | | | | | | | |
| | |
Asset-Backed - Other—0.2% | | | | | | | | |
Capital Trust Re CDO, Ltd.
5.160%, 06/25/35 (144A) | | | 70,408 | | | | 72,168 | |
Race Point IV CLO, Ltd.
0.442%, 08/01/21 (144A) (d) | | | 776,079 | | | | 766,372 | |
Small Business Administration Participation Certificates
4.350%, 07/01/23 | | | 577,924 | | | | 612,786 | |
4.770%, 04/01/24 | | | 29,163 | | | | 31,041 | |
4.950%, 03/01/25 | | | 189,773 | | | | 202,466 | |
4.990%, 09/01/24 | | | 107,563 | | | | 116,567 | |
5.110%, 08/01/25 (d) | | | 291,689 | | | | 316,666 | |
5.180%, 05/01/24 (d) | | | 48,997 | | | | 53,156 | |
5.520%, 06/01/24 (d) | | | 136,902 | | | | 149,227 | |
| | | | | | | | |
| | | | | | | 2,320,449 | |
| | | | | | | | |
Total Asset-Backed Securities
(Cost $4,655,087) | | | | | | | 4,122,098 | |
| | | | | | | | |
See accompanying notes to financial statements.
MSF-14
Metropolitan Series Fund
MFS Total Return Portfolio
Schedule of Investments as of December 31, 2013
Municipals—0.2%
| | | | | | | | |
| Security Description | | Shares/
Principal
Amount* | | | Value | |
New Jersey State Turnpike Authority
7.414%, 01/01/40 | | | 1,050,000 | | | $ | 1,382,483 | |
New York City Transitional Finance Authority Future Tax Secured Revenue
5.000%, 11/01/42 | | | 1,015,000 | | | | 1,051,621 | |
| | | | | | | | |
Total Municipals
(Cost $2,148,110) | | | | | | | 2,434,104 | |
| | | | | | | | |
|
| Convertible Preferred Stocks—0.2% | |
| | |
Aerospace & Defense—0.0% | | | | | | | | |
United Technologies Corp.
7.500%, 08/01/15 (b) | | | 5,027 | | | | 329,118 | |
| | | | | | | | |
| | |
Electric Utilities—0.2% | | | | | | | | |
PPL Corp.
8.750%, 05/01/14 | | | 27,620 | | | | 1,460,545 | |
| | | | | | | | |
Total Convertible Preferred Stocks
(Cost $1,793,766) | | | | | | | 1,789,663 | |
| | | | | | | | |
|
| Preferred Stock—0.2% | |
| | |
Electric Utilities—0.2% | | | | | | | | |
Cia Energetica de Minas Gerais
(Cost $1,987,863) | | | 299,452 | | | | 1,779,048 | |
| | | | | | | | |
|
| Short-Term Investments—6.7% | |
| | |
Mutual Fund—4.3% | | | | | | | | |
State Street Navigator Securities Lending MET Portfolio (g) | | | 45,092,783 | | | | 45,092,783 | |
| | | | | | | | |
|
Repurchase Agreement—2.4% | |
Fixed Income Clearing Corp. | | | | | | | | |
Repurchase Agreement dated 12/31/13 at 0.000% to be repurchased at $24,879,000 on 01/02/14, collateralized by $25,255,000 U.S. Treasury Note at 0.875% due 01/31/17 with a value of $25,381,275 | | | 24,879,000 | | | | 24,879,000 | |
| | | | | | | | |
Total Short-Term Investments
(Cost $69,971,783) | | | | | | | 69,971,783 | |
| | | | | | | | |
Total Investments—105.5%
(Cost $914,890,084) (h) | | | | | | | 1,112,523,700 | |
Other assets and liabilities (net)—(5.5)% | | | | | | | (57,854,438 | ) |
| | | | | | | | |
| Net Assets—100.0% | | | | | | $ | 1,054,669,262 | |
| | | | | | | | |
| * | Principal amount stated in U.S. dollars unless otherwise noted. |
| (a) | Non-income producing security. |
| (b) | All or a portion of the security was held on loan. As of December 31, 2013, the market value of securities loaned was $47,392,129 and the collateral received consisted of cash in the amount of $45,092,783 and non-cash collateral with a value of $3,738,863. The cash collateral is invested in a money market fund managed by an affiliate of the custodian. The non-cash collateral received consists primarily of government securities and bank letters of credit, and is held for the benefit of the Portfolio at the Portfolio’s custodian. The Portfolio cannot repledge or resell this collateral. As such, this collateral is excluded from the Statement of Assets and Liabilities. |
| (c) | TBA (To Be Announced) Securities are purchased on a forward commitment basis with an approximate principal amount and no defined maturity date. The actual principal and maturity date will be determined upon settlement date. |
| (d) | Variable or floating rate security. The stated rate represents the rate at December 31, 2013. Maturity date shown for callable securities reflects the earliest possible call date. |
| (e) | Restricted securities are not registered under the Securities Act of 1933 and are subject to legal restrictions on resale. These securities generally may be resold in transactions exempt from registration or to the public if the securities are subsequently registered. Disposal of these securities may involve time-consuming negotiations and prompt sale at an acceptable price may be difficult. As of December 31, 2013, the market value of restricted securities was $3,668,585, which is 0.3% of net assets. See details shown in the Restricted Securities table that follows. |
| (f) | Interest only security. |
| (g) | Represents investment of cash collateral received from securities lending transactions. |
| (h) | As of December 31, 2013, the aggregate cost of investments for federal income tax purposes was $927,014,852. The aggregate unrealized appreciation and depreciation of investments were $195,541,164 and $(10,032,316), respectively, resulting in net unrealized appreciation of $185,508,848 for federal income tax purposes. |
| (144A)— | Securities exempt from registration under Rule 144A of the Securities Act of 1933. These securities may be resold in transactions exempt from registration, normally to qualified institutional buyers. As of December 31, 2013, the market value of 144A securities was $32,540,096, which is 3.1% of net assets. |
| (ACES)— | Alternative Credit Enhancement Securities. |
| (ADR)— | An American Depositary Receipt is a certificate issued by a custodian bank representing the right to receive securities of the foreign issuer described. Trading on exchanges not located in the United States or Canada significantly influences the value of ADRs. |
| (CDO)— | Collateralized Debt Obligation |
| (CLO)— | Collateralized Loan Obligation |
See accompanying notes to financial statements.
MSF-15
Metropolitan Series Fund
MFS Total Return Portfolio
Schedule of Investments as of December 31, 2013
| | | | | | | | | | | | | | |
Restricted Securities | | Acquisition
Date | | Principal
Amount | | | Cost | | | Value | |
Bayview Financial Revolving Asset Trust | | 03/01/06 | | $ | 924,878 | | | $ | 924,878 | | | $ | 489,116 | |
GG1C Funding Corp. | | 04/20/04 | | | 132,568 | | | | 133,378 | | | | 132,686 | |
General Electric Capital Assurance Co. | | 09/23/03 | | | 35,000 | | | | 35,175 | | | | 39,798 | |
Russian Foreign Bond - Eurobond | | 04/22/10 | | | 2,100,000 | | | | 2,096,881 | | | | 2,168,250 | |
Spirit Master Funding, LLC | | 10/04/05 | | | 816,287 | | | | 805,780 | | | | 838,735 | |
See accompanying notes to financial statements.
MSF-16
Metropolitan Series Fund
MFS Total Return Portfolio
Schedule of Investments as of December 31, 2013
Fair Value Hierarchy
Accounting principles generally accepted in the United States of America (“GAAP”) define fair market value as the price that the Portfolio would receive to sell an asset or pay to transfer a liability in an orderly transaction between market participants at the measurement date. It establishes a fair value hierarchy that prioritizes inputs to valuation methods and requires disclosure of the fair value hierarchy that segregates fair value measurements into three levels. Levels 1, 2 and 3 of the fair value hierarchy are defined as follows:
Level 1 - unadjusted quoted prices in active markets for identical investments
Level 2 - other significant observable inputs (including, but not limited to, unadjusted quoted prices for similar investments in markets that are either active or inactive; inputs other than quoted prices that are observable such as interest rates, yield curves, volatilities, prepayment speeds, loss severities, credit risks, default rates, etc.)
Level 3 - significant unobservable inputs based on the best information available in the circumstances, to the extent observable inputs are unavailable (including the Portfolio’s own assumptions in determining the fair value of investments)
The inputs or methodologies used for valuing investments are not necessarily an indication of the risk associated with investing in them. Changes to the inputs or methodologies used may result in transfers between levels, which will be recognized as of the beginning of the reporting period. Information on transfers between Level 1 and Level 2, if any, will be disclosed following the fair value hierarchy table below. A reconciliation of Level 3 securities, if any, will also be disclosed following the fair value hierarchy table. For more information about the Portfolio’s policy regarding the valuation of investments, please refer to the Notes to Financial Statements.
The following table summarizes the fair value hierarchy of the Portfolio’s investments as of December 31, 2013:
| | | | | | | | | | | | | | | | |
| Description | | Level 1 | | | Level 2 | | | Level 3 | | | Total | |
| Common Stocks | | | | | | | | | | | | | | | | |
Aerospace & Defense | | $ | 36,686,322 | | | $ | — | | | $ | — | | | $ | 36,686,322 | |
Air Freight & Logistics | | | 5,433,056 | | | | — | | | | — | | | | 5,433,056 | |
Airlines | | | 1,196,822 | | | | — | | | | — | | | | 1,196,822 | |
Auto Components | | | 15,720,076 | | | | — | | | | — | | | | 15,720,076 | |
Automobiles | | | 5,996,435 | | | | — | | | | — | | | | 5,996,435 | |
Beverages | | | 3,204,090 | | | | 5,404,108 | | | | — | | | | 8,608,198 | |
Capital Markets | | | 30,448,323 | | | | — | | | | — | | | | 30,448,323 | |
Chemicals | | | 12,741,719 | | | | — | | | | — | | | | 12,741,719 | |
Commercial Banks | | | 23,971,987 | | | | 4,976,219 | | | | — | | | | 28,948,206 | |
Commercial Services & Supplies | | | 3,635,898 | | | | — | | | | — | | | | 3,635,898 | |
Computers & Peripherals | | | 12,039,072 | | | | — | | | | — | | | | 12,039,072 | |
Construction & Engineering | | | 1,082,871 | | | | — | | | | — | | | | 1,082,871 | |
Consumer Finance | | | 2,155,727 | | | | — | | | | — | | | | 2,155,727 | |
Containers & Packaging | | | 1,570,357 | | | | — | | | | — | | | | 1,570,357 | |
Diversified Financial Services | | | 29,526,884 | | | | — | | | | — | | | | 29,526,884 | |
Diversified Telecommunication Services | | | 16,727,359 | | | | 3,108,425 | | | | — | | | | 19,835,784 | |
Electric Utilities | | | 7,238,427 | | | | — | | | | — | | | | 7,238,427 | |
Electrical Equipment | | | 3,855,250 | | | | — | | | | — | | | | 3,855,250 | |
Electronic Equipment, Instruments & Components | | | — | | | | 1,027,000 | | | | — | | | | 1,027,000 | |
Energy Equipment & Services | | | 3,296,920 | | | | — | | | | — | | | | 3,296,920 | |
Food & Staples Retailing | | | 15,922,620 | | | | — | | | | — | | | | 15,922,620 | |
Food Products | | | 10,266,397 | | | | 9,996,076 | | | | — | | | | 20,262,473 | |
Health Care Equipment & Supplies | | | 15,924,515 | | | | — | | | | — | | | | 15,924,515 | |
Health Care Providers & Services | | | 5,338,277 | | | | — | | | | — | | | | 5,338,277 | |
Hotels, Restaurants & Leisure | | | 5,645,894 | | | | — | | | | — | | | | 5,645,894 | |
Household Products | | | 6,049,740 | | | | 1,233,183 | | | | — | | | | 7,282,923 | |
Independent Power Producers & Energy Traders | | | 961,373 | | | | — | | | | — | | | | 961,373 | |
Industrial Conglomerates | | | 17,055,040 | | | | 1,923,395 | | | | — | | | | 18,978,435 | |
Insurance | | | 37,915,139 | | | | 4,681,319 | | | | — | | | | 42,596,458 | |
Internet Software & Services | | | 8,374,629 | | | | — | | | | — | | | | 8,374,629 | |
IT Services | | | 16,462,774 | | | | — | | | | — | | | | 16,462,774 | |
Leisure Equipment & Products | | | 2,071,567 | | | | — | | | | — | | | | 2,071,567 | |
Life Sciences Tools & Services | | | 6,580,785 | | | | — | | | | — | | | | 6,580,785 | |
Machinery | | | 10,953,300 | | | | — | | | | — | | | | 10,953,300 | |
Media | | | 32,714,505 | | | | — | | | | — | | | | 32,714,505 | |
Metals & Mining | | | 2,135,915 | | | | 1,661,849 | | | | — | | | | 3,797,764 | |
Multi-Utilities | | | 3,208,647 | | | | 4,380,766 | | | | — | | | | 7,589,413 | |
��
See accompanying notes to financial statements.
MSF-17
Metropolitan Series Fund
MFS Total Return Portfolio
Schedule of Investments as of December 31, 2013
Fair Value Hierarchy—(Continued)
| | | | | | | | | | | | | | | | |
| Description | | Level 1 | | | Level 2 | | | Level 3 | | | Total | |
Multiline Retail | | $ | 11,748,261 | | | $ | — | | | $ | — | | | $ | 11,748,261 | |
Office Electronics | | | — | | | | 802,126 | | | | — | | | | 802,126 | |
Oil, Gas & Consumable Fuels | | | 56,974,673 | | | | 3,196,878 | | | | — | | | | 60,171,551 | |
Pharmaceuticals | | | 47,220,888 | | | | 2,768,038 | | | | — | | | | 49,988,926 | |
Real Estate Investment Trusts | | | 4,664,979 | | | | 1,088,096 | | | | — | | | | 5,753,075 | |
Road & Rail | | | 2,401,157 | | | | — | | | | — | | | | 2,401,157 | |
Semiconductors & Semiconductor Equipment | | | 9,045,088 | | | | — | | | | — | | | | 9,045,088 | |
Software | | | 12,837,602 | | | | — | | | | — | | | | 12,837,602 | |
Specialty Retail | | | 4,549,130 | | | | — | | | | — | | | | 4,549,130 | |
Textiles, Apparel & Luxury Goods | | | 1,178,428 | | | | — | | | | — | | | | 1,178,428 | |
Tobacco | | | 30,459,394 | | | | 1,921,970 | | | | — | | | | 32,381,364 | |
Wireless Telecommunication Services | | | — | | | | 3,566,936 | | | | — | | | | 3,566,936 | |
Total Common Stocks | | | 595,188,312 | | | | 51,736,384 | | | | — | | | | 646,924,696 | |
Total U.S. Treasury & Government Agencies* | | | — | | | | 247,063,228 | | | | — | | | | 247,063,228 | |
Total Corporate Bonds & Notes* | | | — | | | | 109,986,264 | | | | — | | | | 109,986,264 | |
Total Mortgage-Backed Securities* | | | — | | | | 21,140,223 | | | | — | | | | 21,140,223 | |
Total Foreign Government* | | | — | | | | 7,312,593 | | | | — | | | | 7,312,593 | |
Total Asset-Backed Securities* | | | — | | | | 4,122,098 | | | | — | | | | 4,122,098 | |
Total Municipals | | | — | | | | 2,434,104 | | | | — | | | | 2,434,104 | |
Total Convertible Preferred Stocks* | | | 1,789,663 | | | | — | | | | — | | | | 1,789,663 | |
Total Preferred Stock* | | | — | | | | 1,779,048 | | | | — | | | | 1,779,048 | |
| Short-Term Investments | | | | | | | | | | | | | | | | |
Mutual Fund | | | 45,092,783 | | | | — | | | | — | | | | 45,092,783 | |
Repurchase Agreement | | | — | | | | 24,879,000 | | | | — | | | | 24,879,000 | |
Total Short-Term Investments | | | 45,092,783 | | | | 24,879,000 | | | | — | | | | 69,971,783 | |
Total Investments | | $ | 642,070,758 | | | $ | 470,452,942 | | | $ | — | | | $ | 1,112,523,700 | |
| | | | | | | | | | | | | | | | | |
Collateral for securities loaned (Liability) | | $ | — | | | $ | (45,092,783 | ) | | $ | — | | | $ | (45,092,783 | ) |
| * | See Schedule of Investments for additional detailed categorizations. |
See accompanying notes to financial statements.
MSF-18
Metropolitan Series Fund
MFS Total Return Portfolio
Statement of Assets and Liabilities
December 31, 2013
| | | | |
Assets | | | | |
Investments at value (a) (b) | | $ | 1,112,523,700 | |
Cash | | | 76,773 | |
Cash denominated in foreign currencies (c) | | | 103 | |
Receivable for: | | | | |
Investments sold | | | 3,855,915 | |
TBA securities sold | | | 16,727,740 | |
Fund shares sold | | | 126,032 | |
Dividends and interest | | | 3,707,024 | |
Prepaid expenses | | | 2,694 | |
| | | | |
Total Assets | | | 1,137,019,981 | |
Liabilities | | | | |
Collateral for securities loaned | | $ | 45,092,783 | |
Payables for: | | | | |
TBA securities purchased | | | 35,358,734 | |
Fund shares redeemed | | | 1,086,221 | |
Accrued expenses: | | | | |
Management fees | | | 486,242 | |
Distribution and service fees | | | 155,570 | |
Deferred trustees’ fees | | | 54,606 | |
Other expenses | | | 116,563 | |
| | | | |
Total Liabilities | | | 82,350,719 | |
| | | | |
Net Assets | | $ | 1,054,669,262 | |
| | | | |
Net assets consist of: | | | | |
Paid in surplus | | $ | 931,311,883 | |
Undistributed net investment income | | | 22,640,075 | |
Accumulated net realized loss | | | (96,922,307 | ) |
Unrealized appreciation on investments and foreign currency transactions | | | 197,639,611 | |
| | | | |
Net Assets | | $ | 1,054,669,262 | |
| | | | |
Net Assets | | | | |
Class A | | $ | 185,485,659 | |
Class B | | | 252,642,360 | |
Class E | | | 32,474,991 | |
Class F | | | 584,066,252 | |
Capital Shares Outstanding* | | | | |
Class A | | | 1,138,561 | |
Class B | | | 1,569,783 | |
Class E | | | 200,388 | |
Class F | | | 3,615,569 | |
Net Asset Value, Offering Price and Redemption Price Per Share | | | | |
Class A | | $ | 162.91 | |
Class B | | | 160.94 | |
Class E | | | 162.06 | |
Class F | | | 161.54 | |
| * | The Portfolio is authorized to issue an unlimited number of shares. |
| (a) | Identified cost of investments was $914,890,084. |
| (b) | Includes securities loaned at value of $47,392,129. |
| (c) | Identified cost of cash denominated in foreign currencies was $102. |
Statement of Operations
Year Ended December 31, 2013
| | | | |
Investment Income | | | | |
Dividends (a) | | $ | 15,897,007 | |
Interest | | | 12,615,036 | |
Securities lending income | | | 266,487 | |
| | | | |
Total investment income | | | 28,778,530 | |
Expenses | | | | |
Management fees | | | 5,666,848 | |
Administration fees | | | 14,608 | |
Custodian and accounting fees | | | 224,657 | |
Distribution and service fees—Class B | | | 607,345 | |
Distribution and service fees—Class E | | | 47,356 | |
Distribution and service fees—Class F | | | 1,159,881 | |
Audit and tax services | | | 56,803 | |
Legal | | | 27,754 | |
Trustees’ fees and expenses | | | 35,358 | |
Shareholder reporting | | | 92,494 | |
Insurance | | | 5,394 | |
Miscellaneous | | | 13,646 | |
| | | | |
Total expenses | | | 7,952,144 | |
Less broker commission recapture | | | (11,578 | ) |
| | | | |
Net expenses | | | 7,940,566 | |
| | | | |
Net Investment Income | | | 20,837,964 | |
| | | | |
Net Realized and Unrealized Gain | | | | |
| Net realized gain (loss) on: | | | | |
Investments | | | 114,907,641 | |
Foreign currency transactions | | | (13,078 | ) |
| | | | |
Net realized gain | | | 114,894,563 | |
| | | | |
| Net change in unrealized appreciation (depreciation) on: | | | | |
Investments | | | 41,867,898 | |
Foreign currency transactions | | | (8,124 | ) |
| | | | |
Net change in unrealized appreciation | | | 41,859,774 | |
| | | | |
Net realized and unrealized gain | | | 156,754,337 | |
| | | | |
Net Increase in Net Assets From Operations | | $ | 177,592,301 | |
| | | | |
| (a) | Net of foreign withholding taxes of $158,087. |
See accompanying notes to financial statements.
MSF-19
Metropolitan Series Fund
MFS Total Return Portfolio
Statements of Changes in Net Assets
| | | | | | | | |
| | | Year Ended
December 31,
2013 | | | Year Ended
December 31,
2012 | |
Increase (Decrease) in Net Assets: | | | | | | | | |
From Operations | | | | | | | | |
Net investment income | | $ | 20,837,964 | | | $ | 23,659,414 | |
Net realized gain | | | 114,894,563 | | | | 38,486,228 | |
Net change in unrealized appreciation | | | 41,859,774 | | | | 50,107,948 | |
| | | | | | | | |
Increase in net assets from operations | | | 177,592,301 | | | | 112,253,590 | |
| | | | | | | | |
From Distributions to Shareholders | | | | | | | | |
Net investment income | | | | | | | | |
Class A | | | (4,637,775 | ) | | | (4,961,586 | ) |
Class B | | | (5,792,063 | ) | | | (6,068,529 | ) |
Class E | | | (777,882 | ) | | | (864,804 | ) |
Class F | | | (14,079,477 | ) | | | (16,669,703 | ) |
| | | | | | | | |
Total distributions | | | (25,287,197 | ) | | | (28,564,622 | ) |
| | | | | | | | |
Decrease in net assets from capital share transactions | | | (98,784,352 | ) | | | (126,855,939 | ) |
| | | | | | | | |
Total increase (decrease) in net assets | | | 53,520,752 | | | | (43,166,971 | ) |
| | |
Net Assets | | | | | | | | |
Beginning of period | | | 1,001,148,510 | | | | 1,044,315,481 | |
| | | | | | | | |
End of period | | $ | 1,054,669,262 | | | $ | 1,001,148,510 | |
| | | | | | | | |
| | |
Undistributed net investment income | | | | | | | | |
End of period | | $ | 22,640,075 | | | $ | 25,161,744 | |
| | | | | | | | |
Other Information:
Capital Shares
Transactions in capital shares were as follows:
| | | | | | | | | | | | | | | | |
| | | Year Ended
December 31, 2013 | | | Year Ended
December 31, 2012 | |
| | | Shares | | | Value | | | Shares | | | Value | |
Class A | | | | | | | | | | | | | | | | |
Sales | | | 100,951 | | | $ | 15,245,357 | | | | 68,164 | | | $ | 9,268,422 | |
Reinvestments | | | 31,748 | | | | 4,637,775 | | | | 37,030 | | | | 4,961,586 | |
Redemptions | | | (202,855 | ) | | | (30,695,497 | ) | | | (203,433 | ) | | | (27,698,887 | ) |
| | | | | | | | | | | | | | | | |
Net decrease | | | (70,156 | ) | | $ | (10,812,365 | ) | | | (98,239 | ) | | $ | (13,468,879 | ) |
| | | | | | | | | | | | | | | | |
Class B | | | | | | | | | | | | | | | | |
Sales | | | 145,544 | | | $ | 21,825,873 | | | | 144,281 | | | $ | 19,386,413 | |
Reinvestments | | | 40,065 | | | | 5,792,063 | | | | 45,748 | | | | 6,068,529 | |
Redemptions | | | (269,311 | ) | | | (40,434,856 | ) | | | (252,517 | ) | | | (33,908,847 | ) |
| | | | | | | | | | | | | | | | |
Net decrease | | | (83,702 | ) | | $ | (12,816,920 | ) | | | (62,488 | ) | | $ | (8,453,905 | ) |
| | | | | | | | | | | | | | | | |
Class E | | | | | | | | | | | | | | | | |
Sales | | | 14,692 | | | $ | 2,222,502 | | | | 9,718 | | | $ | 1,315,933 | |
Reinvestments | | | 5,347 | | | | 777,882 | | | | 6,481 | | | | 864,804 | |
Redemptions | | | (36,541 | ) | | | (5,518,612 | ) | | | (39,540 | ) | | | (5,368,373 | ) |
| | | | | | | | | | | | | | | | |
Net decrease | | | (16,502 | ) | | $ | (2,518,228 | ) | | | (23,341 | ) | | $ | (3,187,636 | ) |
| | | | | | | | | | | | | | | | |
Class F | | | | | | | | | | | | | | | | |
Sales | | | 222,734 | | | $ | 33,498,495 | | | | 177,307 | | | $ | 23,953,681 | |
Reinvestments | | | 97,066 | | | | 14,079,477 | | | | 125,279 | | | | 16,669,703 | |
Redemptions | | | (800,363 | ) | | | (120,214,811 | ) | | | (1,055,956 | ) | | | (142,368,903 | ) |
| | | | | | | | | | | | | | | | |
Net decrease | | | (480,563 | ) | | $ | (72,636,839 | ) | | | (753,370 | ) | | $ | (101,745,519 | ) |
| | | | | | | | | | | | | | | | |
Decrease derived from capital shares transactions | | | | | | $ | (98,784,352 | ) | | | | | | $ | (126,855,939 | ) |
| | | | | | | | | | | | | | | | |
See accompanying notes to financial statements.
MSF-20
Metropolitan Series Fund
MFS Total Return Portfolio
Financial Highlights
| | | | | | | | | | | | | | | | | | | | |
| Selected per share data | | | |
| | | Class A | |
| | | Year Ended December 31, | |
| | | 2013 | | | 2012 | | | 2011 | | | 2010 | | | 2009 | |
Net Asset Value, Beginning of Period | | $ | 140.60 | | | $ | 129.68 | | | $ | 130.06 | | | $ | 121.69 | | | $ | 107.65 | |
| | | | | | | | | | | | | | | | | | | | |
Income (Loss) from Investment Operations | | | | | | | | | | | | | | | | | | | | |
Net investment income (a) | | | 3.33 | | | | 3.34 | | | | 3.34 | | | | 3.14 | | | | 3.52 | |
Net realized and unrealized gain (loss) on investments | | | 22.92 | | | | 11.49 | | | | (0.14 | ) | | | 8.95 | | | | 15.39 | |
| | | | | | | | | | | | | | | | | | | | |
Total from investment operations | | | 26.25 | | | | 14.83 | | | | 3.20 | | | | 12.09 | | | | 18.91 | |
| | | | | | | | | | | | | | | | | | | | |
Less Distributions | | | | | | | | | | | | | | | | | | | | |
Distributions from net investment income | | | (3.94 | ) | | | (3.91 | ) | | | (3.58 | ) | | | (3.72 | ) | | | (4.87 | ) |
| | | | | | | | | | | | | | | | | | | | |
Total distributions | | | (3.94 | ) | | | (3.91 | ) | | | (3.58 | ) | | | (3.72 | ) | | | (4.87 | ) |
| | | | | | | | | | | | | | | | | | | | |
Net Asset Value, End of Period | | $ | 162.91 | | | $ | 140.60 | | | $ | 129.68 | | | $ | 130.06 | | | $ | 121.69 | |
| | | | | | | | | | | | | | | | | | | | |
Total Return (%) (b) | | | 18.99 | | | | 11.58 | | | | 2.42 | | | | 10.08 | | | | 18.60 | |
| | | | | |
Ratios/Supplemental Data | | | | | | | | | | | | | | | | | | | | |
Ratio of expenses to average net assets (%) | | | 0.59 | | | | 0.60 | | | | 0.59 | | | | 0.58 | | | | 0.60 | |
Ratio of net investment income to average net assets (%) | | | 2.19 | | | | 2.46 | | | | 2.56 | | | | 2.56 | | | | 3.21 | |
Portfolio turnover rate (%) | | | 53 | (c) | | | 20 | | | | 19 | | | | 31 | | | | 43 | |
Net assets, end of period (in millions) | | $ | 185.5 | | | $ | 169.9 | | | $ | 169.5 | | | $ | 186.7 | | | $ | 188.1 | |
| | | | | | | | | | | | | | | | | | | | |
| | | Class B | |
| | | Year Ended December 31, | |
| | | 2013 | | | 2012 | | | 2011 | | | 2010 | | | 2009 | |
Net Asset Value, Beginning of Period | | $ | 138.95 | | | $ | 128.21 | | | $ | 128.66 | | | $ | 120.45 | | | $ | 106.53 | |
| | | | | | | | | | | | | | | | | | | | |
Income (Loss) from Investment Operations | | | | | | | | | | | | | | | | | | | | |
Net investment income (a) | | | 2.92 | | | | 2.97 | | | | 2.98 | | | | 2.80 | | | | 3.19 | |
Net realized and unrealized gain (loss) on investments | | | 22.66 | | | | 11.36 | | | | (0.15 | ) | | | 8.86 | | | | 15.28 | |
| | | | | | | | | | | | | | | | | | | | |
Total from investment operations | | | 25.58 | | | | 14.33 | | | | 2.83 | | | | 11.66 | | | | 18.47 | |
| | | | | | | | | | | | | | | | | | | | |
Less Distributions | | | | | | | | | | | | | | | | | | | | |
Distributions from net investment income | | | (3.59 | ) | | | (3.59 | ) | | | (3.28 | ) | | | (3.45 | ) | | | (4.55 | ) |
| | | | | | | | | | | | | | | | | | | | |
Total distributions | | | (3.59 | ) | | | (3.59 | ) | | | (3.28 | ) | | | (3.45 | ) | | | (4.55 | ) |
| | | | | | | | | | | | | | | | | | | | |
Net Asset Value, End of Period | | $ | 160.94 | | | $ | 138.95 | | | $ | 128.21 | | | $ | 128.66 | | | $ | 120.45 | |
| | | | | | | | | | | | | | | | | | | | |
Total Return (%) (b) | | | 18.70 | | | | 11.31 | | | | 2.16 | | | | 9.80 | | | | 18.30 | |
| | | | | |
Ratios/Supplemental Data | | | | | | | | | | | | | | | | | | | | |
Ratio of expenses to average net assets (%) | | | 0.84 | | | | 0.85 | | | | 0.84 | | | | 0.83 | | | | 0.85 | |
Ratio of net investment income to average net assets (%) | | | 1.94 | | | | 2.21 | | | | 2.32 | | | | 2.31 | | | | 2.93 | |
Portfolio turnover rate (%) | | | 53 | (c) | | | 20 | | | | 19 | | | | 31 | | | | 43 | |
Net assets, end of period (in millions) | | $ | 252.6 | | | $ | 229.8 | | | $ | 220.0 | | | $ | 227.0 | | | $ | 207.9 | |
Please see following page for Financial Highlights footnote legend.
See accompanying notes to financial statements.
MSF-21
Metropolitan Series Fund
MFS Total Return Portfolio
Financial Highlights
| | | | | | | | | | | | | | | | | | | | |
| Selected per share data | | | |
| | | Class E | |
| | | Year Ended December 31, | |
| | | 2013 | | | 2012 | | | 2011 | | | 2010 | | | 2009 | |
Net Asset Value, Beginning of Period | | $ | 139.88 | | | $ | 129.04 | | | $ | 129.46 | | | $ | 121.16 | | | $ | 107.16 | |
| | | | | | | | | | | | | | | | | | | | |
Income (Loss) from Investment Operations | | | | | | | | | | | | | | | | | | | | |
Net investment income (a) | | | 3.09 | | | | 3.12 | | | | 3.13 | | | | 2.95 | | | | 3.35 | |
Net realized and unrealized gain (loss) on investments | | | 22.81 | | | | 11.44 | | | | (0.15 | ) | | | 8.91 | | | | 15.33 | |
| | | | | | | | | | | | | | | | | | | | |
Total from investment operations | | | 25.90 | | | | 14.56 | | | | 2.98 | | | | 11.86 | | | | 18.68 | |
| | | | | | | | | | | | | | | | | | | | |
Less Distributions | | | | | | | | | | | | | | | | | | | | |
Distributions from net investment income | | | (3.72 | ) | | | (3.72 | ) | | | (3.40 | ) | | | (3.56 | ) | | | (4.68 | ) |
| | | | | | | | | | | | | | | | | | | | |
Total distributions | | | (3.72 | ) | | | (3.72 | ) | | | (3.40 | ) | | | (3.56 | ) | | | (4.68 | ) |
| | | | | | | | | | | | | | | | | | | | |
Net Asset Value, End of Period | | $ | 162.06 | | | $ | 139.88 | | | $ | 129.04 | | | $ | 129.46 | | | $ | 121.16 | |
| | | | | | | | | | | | | | | | | | | | |
Total Return (%) (b) | | | 18.82 | | | | 11.42 | | | | 2.25 | | | | 9.92 | | | | 18.42 | |
| | | | | |
Ratios/Supplemental Data | | | | | | | | | | | | | | | | | | | | |
Ratio of expenses to average net assets (%) | | | 0.74 | | | | 0.75 | | | | 0.74 | | | | 0.73 | | | | 0.75 | |
Ratio of net investment income to average net assets (%) | | | 2.04 | | | | 2.31 | | | | 2.41 | | | | 2.41 | | | | 3.07 | |
Portfolio turnover rate (%) | | | 53 | (c) | | | 20 | | | | 19 | | | | 31 | | | | 43 | |
Net assets, end of period (in millions) | | $ | 32.5 | | | $ | 30.3 | | | $ | 31.0 | | | $ | 36.5 | | | $ | 38.6 | |
| | | | | | | | | | | | | | | | | | | | |
| | | Class F | |
| | | Year Ended December 31, | |
| | | 2013 | | | 2012 | | | 2011 | | | 2010 | | | 2009 | |
Net Asset Value, Beginning of Period | | $ | 139.43 | | | $ | 128.64 | | | $ | 129.07 | | | $ | 120.81 | | | $ | 106.86 | |
| | | | | | | | | | | | | | | | | | | | |
Income (Loss) from Investment Operations | | | | | | | | | | | | | | | | | | | | |
Net investment income (a) | | | 3.00 | | | | 3.04 | | | | 3.05 | | | | 2.88 | | | | 3.28 | |
Net realized and unrealized gain (loss) on investments | | | 22.74 | | | | 11.40 | | | | (0.14 | ) | | | 8.89 | | | | 15.28 | |
| | | | | | | | | | | | | | | | | | | | |
Total from investment operations | | | 25.74 | | | | 14.44 | | | | 2.91 | | | | 11.77 | | | | 18.56 | |
| | | | | | | | | | | | | | | | | | | | |
Less Distributions | | | | | | | | | | | | | | | | | | | | |
Distributions from net investment income | | | (3.63 | ) | | | (3.65 | ) | | | (3.34 | ) | | | (3.51 | ) | | | (4.61 | ) |
| | | | | | | | | | | | | | | | | | | | |
Total distributions | | | (3.63 | ) | | | (3.65 | ) | | | (3.34 | ) | | | (3.51 | ) | | | (4.61 | ) |
| | | | | | | | | | | | | | | | | | | | |
Net Asset Value, End of Period | | $ | 161.54 | | | $ | 139.43 | | | $ | 128.64 | | | $ | 129.07 | | | $ | 120.81 | |
| | | | | | | | | | | | | | | | | | | | |
Total Return (%) (b) | | | 18.75 | | | | 11.36 | | | | 2.21 | | | | 9.87 | | | | 18.36 | |
| | | | | |
Ratios/Supplemental Data | | | | | | | | | | | | | | | | | | | | |
Ratio of expenses to average net assets (%) | | | 0.79 | | | | 0.80 | | | | 0.79 | | | | 0.78 | | | | 0.80 | |
Ratio of net investment income to average net assets (%) | | | 1.99 | | | | 2.26 | | | | 2.36 | | | | 2.36 | | | | 3.01 | |
Portfolio turnover rate (%) | | | 53 | (c) | | | 20 | | | | 19 | | | | 31 | | | | 43 | |
Net assets, end of period (in millions) | | $ | 584.1 | | | $ | 571.1 | | | $ | 623.8 | | | $ | 748.8 | | | $ | 796.2 | |
| (a) | Per share amounts based on average shares outstanding during the period. |
| (b) | Total return does not reflect any insurance, sales, separate account or administrative charges of variable annuity or life insurance contracts or any additional expenses that contract owners may bear under their variable contracts. If these charges were included, the returns would be lower. |
| (c) | Includes mortgage dollar roll and TBA transactions; excluding these transactions the portfolio turnover rate would have been 45% for 2013. |
See accompanying notes to financial statements.
MSF-22
Metropolitan Series Fund
MFS Total Return Portfolio
Notes to Financial Statements—December 31, 2013
1. Organization
Metropolitan Series Fund (the “Trust”) is organized as a Delaware statutory trust and registered under the Investment Company Act of 1940, as amended (the “1940 Act”), as an open-end management investment company. The Trust is currently comprised of thirty series, each of which operates as a distinct investment vehicle of the Trust. The portfolio included in this report is MFS Total Return Portfolio (the “Portfolio”), which is diversified. Shares in the Portfolio are not offered directly to the general public and are currently available only to separate accounts established by Metropolitan Life Insurance Company (“MetLife”) and other affiliated life insurance companies.
The Portfolio has registered and offers four classes of shares: Class A, B, E, and F shares. Shares of each Class of the Portfolio represent an equal pro rata interest in the Portfolio and generally give the shareholder the same voting, dividend, liquidation, and other rights. Investment income, realized and unrealized capital gains and losses, the common expenses of the Portfolio, and certain Portfolio-level expense reductions, if any, are allocated on a pro rata basis to each Class based on the relative net assets of each Class to the net assets of the Portfolio. Each Class of shares differs in its respective distribution plan and such distribution expenses are allocated to that Class.
2. Significant Accounting Policies
The preparation of financial statements in conformity with accounting principles generally accepted in the United States of America (“GAAP”) requires management to make estimates and assumptions that affect the reported amounts of assets and liabilities and disclosure of contingent assets and liabilities as of the date of the financial statements and the reported amounts of income and expenses during the reporting period. Actual results could differ from those estimates. In the preparation of these financial statements, management has evaluated events and transactions subsequent to December 31, 2013 through the date the financial statements were issued.
The following is a summary of significant accounting policies consistently followed by the Portfolio in the preparation of its financial statements.
Investment Valuation and Fair Value Measurements - Debt securities (other than short term obligations with a remaining maturity of sixty days or less), including corporate, convertible and municipal bonds and notes; obligations of the U.S. treasury and U.S. government agencies; sovereign issues; floating rate loans; and non-U.S. bonds, are generally valued on the basis of evaluated or composite bid quotations obtained from independent pricing services and/or brokers and dealers selected by MetLife Advisers, LLC (“MetLife Advisers” or the “Adviser”), an affiliate of MetLife, Inc., pursuant to authorization of the Board of Trustees of the Trust (the “Board” or “Trustees”). Such quotations utilize matrix pricing, which considers observable inputs including, among other things, issuer details, maturity dates, interest rates, yield curves, rates of prepayment, credit risks/spreads, default rates, reported trades, broker dealer quotes and quoted prices for similar securities. Securities that use similar valuation techniques and inputs as described above are generally categorized as Level 2 within the fair value hierarchy.
Mortgage and asset-backed securities are usually issued as separate tranches, or classes, of securities within each deal. These securities are also generally valued on the basis of evaluated or composite bid quotations obtained from independent pricing services and/or brokers and dealers selected by the Adviser pursuant to authorization of the Board. The pricing models for these securities usually consider tranche-level attributes, estimated cash flows and market-based yield spreads for each tranche and current market data, and incorporate deal collateral performance, as available. Mortgage and asset-backed securities that use similar valuation techniques and inputs as described above are generally categorized as Level 2 within the fair value hierarchy.
Short term obligations with a remaining maturity of sixty days or less are generally valued at amortized cost, which approximates fair market value, and are generally categorized as Level 2 within the fair value hierarchy.
Domestic and foreign equity securities, such as common stock, exchange-traded funds, rights, warrants, and preferred stock, that are traded on a securities exchange, are generally valued at their last sale price on the exchange or market in which they are principally traded on the valuation date, or, if no sales occurred on that day, at the last reported bid price. Equity securities traded over-the-counter are generally valued at the last reported sale price. Valuation adjustments may be applied to certain foreign equity securities that are traded solely on foreign exchanges that close before the close of the U.S. market to account for the market movement between the close of the foreign exchanges and the close of the U.S. market. The Portfolio may use a systematic fair valuation model provided by an independent third party to value securities principally traded in these foreign markets in order to adjust for possible stale pricing that may occur between the close of the foreign exchanges and the time of the Portfolio valuation. Foreign equity securities using these valuation adjustments are generally categorized as Level 2 within the fair value hierarchy. Equity securities that are actively traded, and have no valuation adjustments applied, are categorized as Level 1 within the fair value hierarchy. Other equity securities traded on inactive markets, or valued in reference to similar instruments traded on active markets, are generally categorized as Level 2 within the fair value hierarchy.
MSF-23
Metropolitan Series Fund
MFS Total Return Portfolio
Notes to Financial Statements—December 31, 2013—(Continued)
Investments in registered open-end management investment companies are valued at reported net asset value per share on the valuation date and are categorized as Level 1 within the fair value hierarchy.
Forward foreign currency exchange contracts are valued through an independent pricing service based on the mean between closing bid and ask prices of the forward currency rates in the London foreign exchange markets on a daily basis as provided by a reliable bank or dealer. These contracts are generally categorized as Level 2 within the fair value hierarchy.
Options, whether on securities, indices, futures contracts, or otherwise, traded on exchanges are valued at the last sale price available as of the close of business on the valuation date or, if there is no such price available, at the mean between the last reported bid and ask prices. These types of options are categorized as Level 1 within the fair value hierarchy. Futures contracts, which are traded on commodity exchanges, are valued at their closing prices as of the close of such exchanges and are categorized as Level 1 within the fair value hierarchy.
Options and futures contracts that are traded over-the-counter are generally valued on the basis of quotations provided by broker-dealers or prices provided by pricing service providers who use a series of techniques, including simulation pricing models, to determine the value of the contracts. The pricing models use inputs that are observed from actively quoted markets such as issuer details, indices, spreads, interest rates, yield curves, credit curves, measures of volatility and exchange rates. These contracts are generally categorized as Level 2 within the fair value hierarchy.
If no current market value quotation or other observable inputs are readily available or market value quotations are deemed to be unreliable for a security, the fair value of the security will be determined in accordance with procedures approved by and under the general supervision of the Board. In such a circumstance, the Board has delegated the determination of the fair value of a security to a Valuation Committee (“Committee”) of MetLife Advisers. The Committee provides general pricing oversight and fair value pricing determinations related to portfolio securities and meets on a regular basis to review reports relating to the valuation of the securities in the Portfolio. The Board has delegated to State Street Bank and Trust Company, the Trust’s custodian (“custodian”), the responsibility for calculating the net asset values (“NAVs”) of the Trust’s Portfolios. The Committee is responsible for overseeing the calculation of the NAVs of the Portfolios by the custodian. The Committee also periodically reviews pricing vendors, including the vendor providing fair value pricing for the Portfolio’s foreign securities, and is responsible for overseeing the correction of pricing errors and addressing other pricing issues that arise in the ordinary course of business, such as making real-time fair value determinations, as necessary.
No single standard for determining the fair value of a security can be set forth because fair value depends upon the facts and circumstances with respect to each security. Information relating to any relevant factors may be obtained by the Committee from any appropriate source, including the subadviser of the Portfolio, the custodian, a pricing service, market maker and/or broker for such security or the issuer. Appropriate methodologies for determining fair value under particular circumstances may include: matrix pricing, comparisons of securities with comparable characteristics, value based on multiples of earnings, discount from market price of similar marketable securities or a combination of these and other methods. The Committee maintains a detailed report tracking each fair-valued security that compares the fair value price to the next available trade, vendor or broker price, and provides information on how close the fair value price was to the next quoted price. The Committee reviews a summary of such report monthly. On a quarterly basis, the Board is provided with the following for consideration and ratification or adjustment: (1) a memorandum summarizing the actions taken by the Committee in the prior quarter; and (2) a list of the Portfolio’s securities as of the most recent quarter-end for which market quotations were not readily available.
Investment Transactions and Related Investment Income - Portfolio security transactions are recorded on the trade date. Dividend income is recorded on the ex-dividend date or, for certain foreign securities, when notified. Interest income, which includes amortization of premium and accretion of discount on debt securities, is recorded on the accrual basis. Realized gains and losses on investments are determined on the identified cost basis, which is the same basis used for federal income tax purposes. Foreign income and foreign capital gains on some foreign securities may be subject to foreign taxes, which are accrued as applicable. These foreign taxes have been provided for in accordance with the Portfolio’s understanding of the applicable countries’ tax rules and rates.
Foreign Currency Translation - The books and records of the Portfolio are maintained in U.S. dollars. The values of securities, currencies, and other assets and liabilities denominated in currencies other than the U.S. dollar are translated into U.S. dollars based upon foreign exchange rates prevailing at the end of the period. Purchases and sales of investment securities, income, and expenses are translated on the respective dates of such transactions. Because the values of investment securities are translated at the foreign exchange rates prevailing at the end of the period, that portion of the results of operations arising from changes in exchange rates and that portion of the results of operations reflecting fluctuations arising from changes in market prices of the investment securities are not separated. Such fluctuations are included in the net realized and unrealized gain or loss on investments.
Net realized foreign exchange gains or losses arise from activity in forward foreign currency exchange contracts, sales of foreign currency, currency gains or losses realized between the trade and settlement dates on securities transactions, and the difference between the amounts of dividends, interest, and foreign withholding taxes recorded by the Portfolio and the U.S. dollar equivalent of
MSF-24
Metropolitan Series Fund
MFS Total Return Portfolio
Notes to Financial Statements—December 31, 2013—(Continued)
the amounts actually received or paid by the Portfolio. Net unrealized foreign exchange gains and losses arise from changes in the value of assets and liabilities, other than investment securities, resulting from changes in foreign exchange rates.
Income Taxes - It is the Portfolio’s policy to comply with the requirements of the Internal Revenue Code of 1986, as amended, and regulations thereunder, applicable to regulated investment companies and to distribute, with respect to each taxable year, all of its taxable income to shareholders. Therefore, no federal income tax provision is required. The Portfolio files U.S. federal tax returns. No income tax returns are currently under examination. The Portfolio’s federal tax returns for the prior three fiscal years remain subject to examination by the Internal Revenue Service. As of December 31, 2013, the Portfolio had no uncertain tax positions that would require financial statement recognition, or de-recognition or disclosure.
Dividends and Distributions to Shareholders - The Portfolio records dividends and distributions on the ex-dividend date. Net realized gains from security transactions (if any) are generally distributed annually to shareholders. The timing and characterization of certain income and capital gains distributions are determined in accordance with federal tax regulations that may differ from GAAP. Permanent book and tax basis differences relating to shareholder distributions will result in reclassification between under/over distributed net investment income, accumulated net realized gains/losses, and paid-in surplus. Book-tax differences are primarily due to premium amortization, paydown gain/loss reclasses, foreign currency transactions, real estate investment trusts (REITs) adjustments, and broker commission recapture reclasses, and convertible preferred stock adjustments. These adjustments have no impact on net assets or the results of operations.
Securities Lending - The Portfolio may lend its portfolio securities to certain qualified brokers who borrow securities in order to complete certain securities transactions. By lending its portfolio securities, the Portfolio attempts to increase its net investment income through the receipt of income on collateral held from securities on loan. Any gain or loss in the market price of the loaned securities that might occur and any interest earned or dividends declared during the term of the loan would accrue to the account of the Portfolio.
The Trust has entered into a securities lending arrangement with the custodian. Under this arrangement, the custodian is authorized to loan portfolio securities on the Portfolio’s behalf. In exchange, the Portfolio receives either cash or securities as collateral against the loaned securities. The Portfolio receives collateral at least equal to 102% of the market value of the loaned securities (105% for foreign equity securities), at each loan’s inception. Collateral representing at least 100% of the market value of the loaned securities must be maintained for the duration of the loan. A liability for cash collateral is reflected on the Statement of Assets and Liabilities, and is categorized as Level 2 within the fair value hierarchy. Cash collateral is generally invested in the State Street Navigator Securities Lending MET Portfolio (the “Navigator Portfolio”), a series of the State Street Navigator Securities Lending Trust that is managed by an affiliate of the custodian. The Navigator Portfolio is a registered money market fund that invests in a variety of high-quality, U.S. dollar-denominated instruments. If the market value of the collateral at the close of trading on a business day is less than 100% of the market value of the loaned securities at the close of trading on that day, the borrower shall be required to deliver, by the close of business on the following business day, an additional amount of collateral, so that the total amount of posted collateral is equal to at least 100% of the market value of all the loaned securities as of such preceding day. A portion of net income (income after the deduction of expenses and fees of the Navigator Portfolio) on the collateral is rebated to the borrower of the securities and the remainder is split between the custodian and the Portfolio. On loans collateralized by U.S. Treasuries, a fee is received from the borrower and is allocated between the Portfolio and the custodian. The risks associated with lending portfolio securities include, but are not limited to, possible delays in receiving additional collateral or in the recovery of the loaned securities, possible loss of rights in the collateral should the borrower fail financially, as well as risk of loss in the value of the collateral or the value of the investments made with the collateral. The lending agent has agreed to indemnify the Portfolio in the case of default of any securities borrower. Income received by the Portfolio in securities lending transactions during the year ended December 31, 2013 is reflected as Securities lending income on the Statement of Operations. Any outstanding loans by the Portfolio at December 31, 2013 are disclosed in the footnotes to the Schedule of Investments.
Repurchase Agreements - The Portfolio may enter into repurchase agreements, under the terms of a Master Repurchase Agreement, with selected commercial banks and broker-dealers, under which the Portfolio acquires securities as collateral and agrees to resell the securities at an agreed upon time and at an agreed-upon price. The Portfolio, through the custodian or a subcustodian, receives delivery of the underlying securities collateralizing any repurchase agreements. The Portfolio requires the custodian to take possession, to have legally segregated in the Federal Reserve Book Entry System, or to have segregated within the custodian’s vault, all securities held as collateral for repurchase agreements. It is the Portfolio’s policy that the market value of the collateral be at least equal to 100% of the repurchase price in the case of a repurchase agreement of one-day duration and at least equal to 102% of the repurchase price in the case of all other repurchase agreements. In the event of default or failure by a party to perform an obligation in connection with any repurchase transaction, the Master Repurchase Agreement gives the non-defaulting party the right to set-off claims and to apply property held by it in connection with any repurchase transaction against obligations owed to it.
At December 31, 2013, the Portfolio had investments in repurchase agreements with a gross value of $24,879,000, which is included as part of investments at value on the Statement of Assets and Liabilities. The value of the related collateral exceeded the value of the repurchase agreements at December 31, 2013.
MSF-25
Metropolitan Series Fund
MFS Total Return Portfolio
Notes to Financial Statements—December 31, 2013—(Continued)
Mortgage Dollar Rolls - The Portfolio may enter into mortgage “dollar rolls” in which a Portfolio sells to-be-announced (“TBA”) mortgage-backed securities for delivery in the current month and simultaneously contracts to repurchase substantially similar (same type, coupon, and maturity) securities on a specified future date. For the duration of the transaction, or roll period, the Portfolio foregoes principal (including prepayments of principal) and interest paid on the securities sold. Dollar rolls are accounted for as purchase and sale transactions; gain or loss is recognized at the commencement of the term of the dollar roll and each time the mortgage-backed security is rolled.
Treasury and mortgage dollar roll transactions involve the risk that the market value of the securities that the Portfolio is required to repurchase or reacquire may be less than the agreed-upon repurchase price of those securities and that the investment performance of securities purchased with proceeds from these transactions does not exceed the income, capital appreciation, and gain or loss that would have been realized on the securities transferred or sold, as applicable, as part of the treasury or mortgage dollar roll.
Mortgage Related and Other Asset-Backed Securities - The Portfolio may invest in mortgage-related or other asset-backed securities. These securities may include mortgage pass-through securities, collateralized mortgage obligations (“CMOs”), commercial mortgage-backed securities, CMO residuals, stripped mortgage backed securities (“SMBS”), and other securities that directly or indirectly represent a participation in, or are secured by or payable from, mortgage loans on real property or other receivables. The value of some mortgage- or asset-backed securities may be particularly sensitive to changes in prevailing interest rates. Early repayment of principal on some mortgage-related securities may expose the Portfolio to a lower rate of return upon reinvestment of principal. The value of these securities may fluctuate in response to the market’s perception of the creditworthiness of the issuers. Additionally, although mortgages and mortgage-related securities are generally supported by some form of government or private guarantee and/or insurance, there is no assurance that private guarantors or insurers will meet their obligations.
In one type of SMBS, one class receives all of the interest from the mortgage assets (the interest-only or “IO” class), while the other class will receive all of the principal (the principal-only or “PO” class). Because principal will not be received at the maturity of an IO, adjustments are made to the book value of the security until maturity. These adjustments are netted against payments received for the IOs and the net amount is included in interest income on the Statement of Operations of the Portfolio. Payments received for POs are treated as reductions to the cost and par value of the securities. Details of mortgage related and other asset-backed securities held by the Portfolio are included in the Portfolio’s Schedule of Investments.
The Portfolio may invest a significant portion of its assets in securities of issuers that hold mortgage and asset-backed securities and direct investments in securities backed by commercial and residential mortgage loans and other financial assets. The value and related income of these securities are sensitive to changes in economic conditions, including delinquencies and/or defaults, and may be negatively impacted by increased volatility of market prices and periods of illiquidity.
TBA Purchase & Forward Sale Commitments - The Portfolio may enter into TBA commitments to purchase or sell securities for a fixed price at a future date. TBA commitments are considered securities in themselves, and involve a risk of loss if the value of the security to be purchased or sold declines or increases prior to settlement date, which is in addition to the risk of decline in the value of the Portfolio’s other assets. TBA forward sales commitments are valued at the current market value of the underlying securities, according to the procedures described under “Investment Valuation and Fair Value Measurements”.
When-Issued and Delayed-Delivery Securities - The Portfolio may purchase securities on a when-issued or delayed-delivery basis. Settlement of such transactions normally occurs within a month or more after the purchase commitment is made. The Portfolio may purchase securities under such conditions only with the intention of actually acquiring them, but may enter into a separate agreement to sell the securities before the settlement date. Since the value of securities purchased may fluctuate prior to settlement, the Portfolio may be required to pay more at settlement than the security is worth. In addition, the purchaser is not entitled to any of the interest earned prior to settlement.
Upon making a commitment to purchase a security on a when-issued or delayed-delivery basis, the Portfolio will hold liquid assets in a segregated account with the Portfolio’s custodian, or set aside liquid assets in the Portfolio’s records, worth at least the equivalent of the amount due. The liquid assets will be monitored on a daily basis and adjusted as necessary to maintain the necessary value.
Directed Brokerage Agreement - The Trust has entered into a directed brokerage arrangement with State Street Global Markets (“SSGM”). Under this arrangement, the Portfolio directs certain trades to SSGM in return for a recapture credit. SSGM issues a cash rebate to the Portfolio. Amounts paid to the Portfolio are shown separately as broker commission recapture on the Statement of Operations of the Portfolio. Additionally, these amounts have been excluded from the calculation of the net ratio of expenses to average net assets presented in the Financial Highlights for each share class.
3. Certain Risks
Market Risk: In the normal course of business, the Portfolio invests in securities and enters into transactions where risks exist due to fluctuations in the market (market risk) or failure of the other party to a transaction to perform (credit and counterparty risk). The
MSF-26
Metropolitan Series Fund
MFS Total Return Portfolio
Notes to Financial Statements—December 31, 2013—(Continued)
value of securities held by the Portfolio may decline in response to certain events, including those directly involving the companies whose securities are owned by the Portfolio; conditions affecting the general economy; overall market changes; local, regional or global political, social or economic instability; currency, interest rate, and price fluctuations.
Credit and Counterparty Risk: The Portfolio may be exposed to counterparty risk, or the risk that an entity with which the Portfolio has unsettled or open transactions may default. The potential loss could exceed the value of the financial assets and liabilities recorded in the financial statements. Financial assets that potentially expose the Portfolio to credit and counterparty risk consist principally of cash due from counterparties and investments. The Portfolio manages counterparty risk by entering into agreements only with counterparties that it believes have the financial resources to honor their obligations and by monitoring the financial stability of those counterparties. The Portfolio’s investment adviser attempts to mitigate counterparty risk by (i) periodically assessing the creditworthiness of its trading partners, (ii) monitoring and/or limiting the amount of its net exposure to each individual counterparty based on its assessment, and (iii) requiring collateral from the counterparty for certain transactions. In order to preserve certain safeguards for non-standard settlement trades, the Portfolio restricts its exposure to credit and counterparty losses by entering into master netting agreements with counterparties (approved brokers) with whom it undertakes a significant volume of transactions. Master Agreements govern the terms of certain transactions, and reduce the counterparty risk associated with relevant transactions by specifying credit protection mechanisms and providing standardization that improves legal certainty. Master Agreements can also help limit counterparty risk by specifying collateral posting arrangements at pre-arranged exposure levels.
Repurchase and reverse repurchase agreements are primarily executed under Global Master Repurchase Agreements (“GMRAs”) or Master Repurchase Agreements (“MRAs”), which provide the rights to set-off. Each repurchase and reverse repurchase agreement is initially collateralized at the transaction level. In the event of default, the total market value exposure will be offset against collateral exchanged to date, which would result in a net receivable/(payable) that would be due from/to the counterparty.
Master Securities Forward Transaction Agreements (“Master Forward Agreements”) govern the considerations and factors surrounding the settlement of certain forward settling transactions, such as To-Be-Announced securities, delayed-delivery or secured borrowings transactions by and between the Portfolio and select counterparties. The Master Forward Agreements maintain provisions for, among other things, initiation and confirmation, payment and transfer, events of default, termination, and maintenance of collateral.
Additional risks associated with each type of investment are described above within the respective security type notes. The Portfolio’s prospectus includes a discussion of the principal risks of investing in the Portfolio.
4. Investment Transactions
Aggregate cost of purchases and proceeds of sales of investment securities, including mortgage dollar roll and TBA transactions but excluding short-term securities, for the year ended December 31, 2013 were as follows:
| | | | | | | | | | | | |
Purchases | | | Sales | |
U.S. Government | | Non U.S. Government | | | U.S. Government | | | Non U.S. Government | |
| $255,933,934 | | $ | 287,587,275 | | | $ | 243,844,227 | | | $ | 401,391,366 | |
The Portfolio engaged in security transactions with other accounts managed by Massachusetts Financial Services Co. that amounted to $14,534 in purchases and $22,523 in sales of investments, which are included above.
Purchases and sales of mortgage dollar rolls and TBA transactions for the year ended December 31, 2013 were as follows:
| | | | |
Purchases | | Sales | |
| $96,093,038 | | $ | 91,368,829 | |
5. Investment Management Fees and Other Transactions with Affiliates
Investment Management Agreement - MetLife Advisers is the investment adviser to the Portfolio. The Trust has entered into an investment management agreement with MetLife Advisers with respect to the Portfolio. For providing investment management services to the Portfolio, MetLife Advisers receives monthly compensation at the annual rates:
| | | | | | |
Management
Fees earned by
MetLife Advisers
for the year ended
December 31, 2013 | | % per annum | | | Average daily net assets |
| $5,666,848 | | | 0.600 | % | | Of the first $250 million |
| | | 0.550 | % | | Of the next $500 million |
| | | 0.500 | % | | On amounts in excess of $750 million |
MSF-27
Metropolitan Series Fund
MFS Total Return Portfolio
Notes to Financial Statements—December 31, 2013—(Continued)
Certain officers and trustees of the Trust may also be officers of MetLife Advisers; however, such officers and trustees receive no compensation from the Trust.
MetLife Advisers has entered into an investment subadvisory agreement with respect to the Portfolio. Massachusetts Financial Services Co. is compensated by MetLife Advisers to provide subadvisory services for the Portfolio.
Transfer Agency Agreement - MetLife serves as the transfer agent for the Trust. MetLife receives no fees for its services to the Trust under the transfer agency agreement.
Distribution and Service Fees - The Trust has a distribution agreement with MetLife Investors Distribution Company (“MIDC” or the “Distributor”) in which MIDC serves as the distributor for the Portfolio’s Class A, B, E, and F Shares. MIDC is a wholly-owned subsidiary of MetLife Investors Group, Inc., an affiliate of the Adviser. The Trust has also adopted a Distribution and Service Plan under Rule 12b-1 of the 1940 Act for the Portfolio’s Class B, E, and F Shares. Under the Distribution and Service Plan, the Class B, E, and F Shares of the Portfolio pay a fee to compensate the Insurance Companies (or their affiliates) and other broker-dealers and financial intermediaries involved in the offer and sale of Portfolio shares for promoting or selling and servicing the Class B, E, and F Shares. The fees under the Distribution and Service Plan for each class of the Portfolio’s shares are calculated as a percentage of the Portfolio’s average daily net assets that are attributable to that Class. Currently, the fee is 0.25% per year for Class B Shares, 0.15% per year for Class E Shares, and 0.20% per year for Class F Shares. Amounts incurred by the Portfolio for the year ended December 31, 2013 are shown as Distribution and service fees in the Statement of Operations.
Deferred Trustee Compensation - Each Trustee who is not currently an employee of the Adviser or any of its affiliates receives compensation from the Trust for his or her service to the Trust. A deferred compensation plan (the “Plan”) is available to the Trustees on a voluntary basis. Deferred amounts remain in the Trust until distributed in accordance with the provisions of the Plan. The value of a participating Trustee’s deferral account is based on theoretical investments of deferred amounts, on the normal payment dates in certain portfolios of the Trust or Met Investors Series Trust, an affiliate of the Trust, as designated by the participating Trustee. Changes in the value of participants’ deferral accounts are reflected as Trustees’ fees and expenses in the Statement of Operations. The portion of the accrued obligations allocated to the Portfolio under the Plan is reflected as Deferred trustees’ fees in the Statement of Assets and Liabilities.
6. Contractual Obligations
Under the Trust’s organizational documents, its officers and Trustees may be indemnified against certain liabilities and expenses arising out of the performance of their duties to the Trust. Additionally, the Trust has a variety of indemnification obligations under contracts with its service providers. The Trust’s maximum exposure under these arrangements is unknown, as this would involve future claims that may be made against the Trust that have not yet occurred.
7. Income Tax Information
The tax character of distributions paid for the periods ended December 31, 2013 and 2012 was as follows:
| | | | | | | | | | | | | | | | | | | | |
Ordinary Income | | | Long-Term Capital Gain | | | Total | |
2013 | | 2012 | | | 2013 | | | 2012 | | | 2013 | | | 2012 | |
| $25,287,197 | | $ | 28,564,622 | | | $ | — | | | $ | — | | | $ | 25,287,197 | | | $ | 28,564,622 | |
As of December 31, 2013, the components of distributable earnings (accumulated losses) on a federal income tax basis were as follows:
| | | | | | | | | | | | | | | | | | | | |
Undistributed
Ordinary
Income | | Undistributed
Long-Term
Capital Gain | | | Net
Unrealized
Appreciation | | | Loss Carryforwards | | | Other
Accumulated
Capital Losses | | | Total | |
| $22,698,975 | | $ | — | | | $ | 185,514,843 | | | $ | (84,801,832 | ) | | $ | — | | | $ | 123,411,986 | |
The Portfolio utilizes the provisions of the federal income tax laws that provide for the carryforward of capital losses for prior years, offsetting such losses against any future realized capital gains. Under the Regulated Investment Company Modernization Act of 2010 (the “Act”), net capital losses recognized after December 22, 2010 may be carried forward indefinitely, and their character is retained as short-term and/or long-term losses. Previously, net capital losses were carried forward for up to eight years and treated as shortterm losses. As a transition rule, the Act requires that post-enactment net capital losses be used before pre-enactment net capital losses.
During the year ended December 31, 2013, the Portfolio utilized capital loss carry forwards of $103,019,018.
As of December 31, 2013, the Portfolio had no post-enactment accumulated capital losses and the pre-enactment accumulated capital loss carryforwards and expiration dates were as follows:
| | | | |
Expiring
12/31/2017 | | Total | |
| $84,801,832 | | $ | 84,801,832 | |
MSF-28
Metropolitan Series Fund
MFS Total Return Portfolio
Report of Independent Registered Public Accounting Firm
To the Shareholders of MFS Total Return Portfolio and the Board of Trustees of Metropolitan Series Fund:
We have audited the accompanying statement of assets and liabilities, including the schedule of investments, of MFS Total Return Portfolio, one of the portfolios constituting Metropolitan Series Fund (the “Trust”) as of December 31, 2013, and the related statement of operations for the year then ended, the statements of changes in net assets for each of the two years in the period then ended, and the financial highlights for each of the five years in the period then ended. These financial statements and financial highlights are the responsibility of the Fund’s management. Our responsibility is to express an opinion on these financial statements and financial highlights based on our audits.
We conducted our audits in accordance with the standards of the Public Company Accounting Oversight Board (United States). Those standards require that we plan and perform the audit to obtain reasonable assurance about whether the financial statements and financial highlights are free of material misstatement. The Fund is not required to have, nor were we engaged to perform, an audit of its internal control over financial reporting. Our audits included consideration of internal control over financial reporting as a basis for designing audit procedures that are appropriate in the circumstances, but not for the purpose of expressing an opinion on the effectiveness of the Fund’s internal control over financial reporting. Accordingly, we express no such opinion. An audit also includes examining, on a test basis, evidence supporting the amounts and disclosures in the financial statements, assessing the accounting principles used and significant estimates made by management, as well as evaluating the overall financial statement presentation. Our procedures included confirmation of securities owned as of December 31, 2013, by correspondence with the custodian and brokers; where replies were not received from brokers, we performed other auditing procedures. We believe that our audits provide a reasonable basis for our opinion.
In our opinion, the financial statements and financial highlights referred to above present fairly, in all material respects, the financial position of MFS Total Return Portfolio of Metropolitan Series Fund as of December 31, 2013, the results of its operations for the year then ended, the changes in its net assets for each of the two years in the period then ended, and the financial highlights for each of the five years in the period then ended, in conformity with accounting principles generally accepted in the United States of America.
Deloitte & Touche LLP
Boston, Massachusetts
February 27, 2014
MSF-29
Metropolitan Series Fund
Trustees and Officers of Metropolitan Series Fund
The Trustees and executive officers of the Trust, their ages and their principal occupations during the past five years are set forth below. Unless otherwise indicated, the business address of each is One Financial Center, Boston, MA 02111. Each Trustee who is deemed an “interested person,” as such term is defined in the 1940 Act, is indicated by an asterisk. Those Trustees who are not “interested persons” as defined in the 1940 Act are referred to as “Independent Trustees.” Additional information about the Trustees is available in the Statement of Additional Information, which is available without charge, upon request, by calling (800) 848-3854.
Trustees of the Trust
| | | | | | | | | | |
Name and Age | | Position(s)
Held with
Registrant | | Term of Office and
Length of Time
Served | | Principal Occupation(s) During the
Past 5 Years(1) | | Number of
Portfolios
in Fund
Complex(2)
overseen | | Other Directorships Held
by Trustee During the
Past 5 Years(1) |
| Interested Trustee | | | | | | | | | | |
| Elizabeth M. Forget* (47) | | Trustee, Chairman of the Board, President and Chief Executive Officer | | Indefinite; From May 2006 (President and Chief Executive Officer)/ August 2006 (Trustee and Chairman of the Board) to present | | Senior Vice President, MetLife Inc.; President, MetLife Advisers, LLC and a predecessor company. | | 79 | | Trustee, Met Investors Series Trust (the “MIST Trust”);** various MetLife-affiliated boards. |
| | | | | |
| Independent Trustees | | | | | | | | | | |
| Stephen M. Alderman (54) | | Trustee | | Indefinite; From April 2012 to present | | Shareholder in the law firm of Garfield & Merel, Ltd. | | 79 | | Trustee, MIST Trust;** Director, International Truck Leasing Corp. |
| | | | | |
| Robert J. Boulware (57) | | Trustee | | Indefinite; From April 2012 to present | | Managing Director, Pilgrim Funds, LLC (private equity fund). | | 79 | | Trustee, MIST Trust;** Trustee, Vertical Capital Income Fund (closed-end fund); Director, Gainsco, Inc. (auto insurance). |
| | | | | |
| Susan C. Gause (61) | | Trustee | | Indefinite; From April 2012 to present | | Private Investor. | | 79 | | Trustee, MIST Trust;** Trustee, HSBC Funds. |
| | | | | |
| Nancy Hawthorne (62) | | Trustee | | Indefinite; From May 2003 to present | | Chief Executive Officer, Clerestory LLC (corporate advisor). | | 79 | | MIST Trust;** Director, THL Credit, Inc.**; Director, Avid Technology, Inc.** |
| | | | | |
| Barbara A. Nugent (57) | | Trustee | | Indefinite; From January 2014 to present | | President, True North Board Governance, LLC (consulting); until 2014, partner in the law firm of Stradley Ronon Stevens & Young, LLP. | | 79 | | Trustee, MIST Trust**; Director, Episcopal Healthcare Foundation; until 2014, member, Mutual Fund Directors Forum Advisory Board. |
| | | | | |
| Keith M. Schappert (62) | | Trustee | | Indefinite; From August 2009 to present | | Principal, Schappert Consulting LLC (asset management consulting). | | 79 | | Trustee, MIST Trust;** Director, The Commonfund for Nonprofit Organizations; until 2011, Director, Trilogy Global Advisors; Director, Mirae Asset Discovery Funds,** Director, Calamos Investments. |
| | | | | |
| Linda B. Strumpf (66) | | Trustee | | Indefinite; From May 2000 to present | | Chair of the Investment Committee, Leona M. and Harry B. Helmsley Charitable Trust; until 2011, Chief Investment Officer, Leona M. and Harry B. Helmsley Charitable Trust. | | 79 | | Since 2012, Trustee, MIST Trust,** Trustee and Member of Investment Committee, The Pennsylvania State University. |
| | | | | |
| Dawn M. Vroegop (47) | | Trustee | | Indefinite; From May 2009 to present | | Private Investor. | | 79 | | Trustee, MIST Trust,** Trustee, Driehaus Mutual Funds; Director and Investment Committee Chair, City College of San Francisco Foundation. |
MSF-30
Metropolitan Series Fund
Trustees and Officers of Metropolitan Series Fund—(Continued)
Executive Officers of the Trust
| | | | | | |
Name and Age | | Position(s) Held with
Registrant | | Term of Office
and Length of
Time Served | | Principal Occupation(s) During Past 5 Years(1) |
| Elizabeth M. Forget (47) | | President, Chief Executive Officer, Trustee and Chairman of the Board | | From May
2006 (President
and Chief
Executive
Officer)/
August 2006
(Trustee and
Chairman of
the Board) to
present | | See principal occupation information in the table above. |
| | | |
| Jeffrey L. Bernier (42) | | Vice President | | From February
2008 to present | | Vice President, MetLife, Inc.; Senior Vice President, MetLife Advisers, LLC and a predecessor company. |
| | | |
| Peter H. Duffy (58) | | Chief Financial Officer and Treasurer | | From November
2000 to present | | Senior Vice President, MetLife Advisers, LLC; Vice President, MetLife, Inc. |
| | | |
| Andrew L. Gangolf (59) | | Secretary | | From May
2011to present | | Senior Vice President, MetLife Advisers, LLC; Senior Vice President & Assistant General Counsel, AllianceBerstein Investments, Inc. |
| | | |
| Jeffrey P. Halperin (46) | | Chief Compliance Officer | | From November
2005 to present | | Vice President, MetLife, Inc.; Chief Compliance Officer, MIST; Chief Compliance Officer, MSF Trust; Chief Compliance Officer, MetLife Advisers, LLC and a predecessor company; Chief Compliance Officer, MetLife Investment Management, LLC (formerly MetLife Investment Advisors Company, LLC). |
| | | |
| Alan C. Leland, Jr. (61) | | Vice President | | From February
2005 to present | | Treasurer and Chief Financial Officer, MetLife Advisers, LLC; Vice President, MetLife Group Inc.; Vice President, MetLife, Inc. |
| * | Ms. Forget is an “interested person” of the Trust because of her positions with MetLife Advisers, LLC and her ownership of securities issued by MetLife, Inc., the ultimate parent company of MetLife Advisers, LLC. |
| ** | Indicates a directorship with a registered investment company or a company subject to the reporting requirements of the Securities Exchange Act of 1934, as amended. |
| (1) | Previous positions during the past five years with the Trust, MetLife, Inc. or the Adviser are omitted if not materially different. |
| (2) | The Fund Complex includes 49 Portfolios of the MIST Trust and 30 Portfolios of the Trust. |
MSF-31
Metropolitan Series Fund
MFS Total Return Portfolio
Board of Trustees’ Consideration of Advisory and Sub-Advisory Agreements
At an in-person meeting of the Boards of Trustees (the “Board”) of Met Investors Series Trust and Metropolitan Series Fund (“MIST” and “MSF,” respectively, and collectively, the “Trusts”) held on November 19-20, 2013, the Board, including a majority of the Trustees who are not considered to be “interested persons” of the Trusts (the “Independent Trustees”) under the Investment Company Act of 1940, as amended (the “1940 Act”), approved for an annual period the continuation of each Trust’s advisory agreement (the “Advisory Agreement”) with MetLife Advisers, LLC (the “Adviser”) and the applicable sub-advisory agreements (each a “Sub-Advisory Agreement,” and collectively with the Advisory Agreement, the “Agreements”) between the Adviser and the investment sub-advisers (each a “Sub-Adviser,” and collectively, the “Sub-Advisers”) for each of the series of the Trusts, including the MFS Total Return Portfolio (each a “Portfolio,” and collectively, the “Portfolios”).1
In considering the Agreements, the Board reviewed a variety of materials provided by the Adviser and the Sub-Advisers relating to the Portfolios, including comparative performance, fee and expense information for an appropriate peer group of similar mutual funds, performance information for relevant benchmark indices and other information regarding the nature, extent and quality of services provided by the Adviser and the Sub-Advisers under their respective Agreements. The Board also took into account its experience with the Adviser and the Sub-Advisers and information provided to the Board in its meetings throughout the year with respect to the services provided by the Adviser and the Sub-Advisers, including quarterly performance reports prepared by management containing reviews of investment results, and periodic presentations from certain of the Sub-Advisers with respect to the Portfolios they manage. The Independent Trustees also assessed reports provided by the Board’s independent consultant, who reviewed and provided analyses regarding investment performance, fees and expenses, and other information provided by, or at the direction of, the Adviser and the Sub-Advisers, as more fully discussed below.
The Independent Trustees were separately advised by independent legal counsel throughout the process, and met with independent legal counsel in periodic executive sessions. Prior to voting to continue the Agreements at the November meeting, the Independent Trustees also received a memorandum from their independent counsel discussing the legal standards for their consideration of the proposed continuation of the Agreements. The Board also met in person with personnel of the Adviser on September 17, 2013 for the specific purpose of giving preliminary consideration to the proposed continuation of the Agreements and to request additional information they considered reasonably necessary to their deliberations. The Independent Trustees also discussed the proposed continuation of the Agreements in private sessions with their independent legal counsel at which no representatives of management were present.
In considering whether to approve the renewal of the Advisory Agreement with the Adviser and any applicable Sub-Advisory Agreements with respect to a Portfolio, the Board reviewed and analyzed the factors it deemed relevant, including: (1) the nature, extent and quality of the services to be provided to the Portfolios by the Adviser and the Sub-Advisers; (2) the performance of the Portfolios as compared to a peer group and an appropriate index; (3) the Adviser’s and each of the Sub-Adviser’s personnel and operations; (4) the financial condition of the Adviser and of the Sub-Advisers; (5) the level and method of computing each Portfolio’s advisory and sub-advisory fees; (6) the profitability of the Adviser under the Advisory Agreement and of certain of the Sub-Advisers under the Sub-Advisory Agreements; (7) any “fall-out” benefits to the Adviser, the Sub-Advisers and their affiliates (i.e., ancillary benefits realized by the Adviser, the Sub-Advisers or their affiliates from the Adviser’s or Sub-Advisers’ relationship with the Trusts); (8) the anticipated effect of growth in size on Portfolio expenses; (9) fees paid to certain of the Sub-Advisers by comparable institutional and retail accounts; and (10) possible conflicts of interest.
Nature, extent and quality of services. The Board evaluated the nature, extent and quality of the services that the Adviser, and the Sub-Advisers as relevant, have provided to the Portfolios. The Board considered the Adviser’s services as investment manager to the Portfolios, including services relating to the selection and oversight of the Sub-Advisers for the applicable Portfolios. The Board considered, among other things, the Adviser’s oversight of the provision of services to the Portfolios by the Sub-Advisers, including with respect to investment activities and trading practices, and the Sub-Adviser’s compliance with fund policies, objectives and Board directives, compliance policies and procedures and applicable law. The Adviser’s services in coordinating and overseeing the activities of the Trusts’ other service providers were also considered. The Board also evaluated the expertise and performance of the personnel of the Adviser who performed services for the Portfolios throughout the year.
The Board considered information received from the Trust’s Chief Compliance Officer (“CCO”) regarding the Portfolios’ compliance policies and procedures established pursuant to Rule 38a-l under the 1940 Act. The Board also evaluated the CCO’s ongoing reports concerning the CCO’s oversight of the risk assessment processes of the Sub-Advisers.
1 The Pyramis Managed Risk Portfolio recently commenced operations and, therefore, the Agreement with respect to this Portfolio was not up for renewal.
MSF-32
Metropolitan Series Fund
MFS Total Return Portfolio
Board of Trustees’ Consideration of Advisory and Sub-Advisory Agreements—(Continued)
With respect to the services provided by each of the Sub-Advisers, the Board considered, among other things, information provided to the Board by each Sub-Adviser. The Board considered the Sub-Adviser’s current level of staffing and its overall resources, as well as its compensation program. The Board reviewed each Sub-Adviser’s history and investment experience, as well as information regarding the qualifications, background and responsibilities of the Sub-Adviser’s investment and compliance personnel who provide services to the Portfolios. The Board also considered, among other things, the Sub-Adviser’s compliance program and any disciplinary history. The Board also took into account the Sub-Adviser’s risk assessment and monitoring process. The Board noted each Sub-Adviser’s regulatory history, including whether it was currently involved in any regulatory actions or investigations as well as material litigation, and any settlements and amelioratory actions undertaken, as appropriate. The Board also noted that the CCO and his staff conduct regular, periodic compliance reviews with each of the Sub-Advisers and present reports to the Independent Trustees regarding the same, which includes evaluating the regulatory compliance systems of the Sub-Advisers and procedures reasonably designed by them to help assure compliance with the federal securities laws, including issues related to late trading and market timing, best execution, fair value pricing, and proxy voting procedures, among others. The Board also took into account the financial condition of each Sub-Adviser. In its review, the Board also received and took into account information regarding any services and/or payments provided to the Adviser by the Sub-Advisers in connection with marketing activities.
The Board considered each Sub-Adviser’s investment process and philosophy. The Board took into account that each Sub-Adviser’s responsibilities include the development and maintenance of an investment program for the applicable Portfolio which is consistent with the Portfolio’s investment objectives, the selection of investment securities and the placement of orders for the purchase and sale of such securities, as well as the implementation of compliance controls related to performance of these services. The Board also reviewed each Sub-Adviser’s brokerage policies and practices.
Performance. The Board considered the performance of the Portfolios as described in the quarterly reports prepared by management, and as also analyzed in reports prepared by the Independent Trustees’ independent consultant. The Board noted that the Adviser reviews with the Board on a quarterly basis detailed information about the Portfolios’ performance results, portfolio composition and investment strategies. The Board also reviewed and considered a separate report prepared by Lipper Inc. (“Lipper”), an independent third party, which provided a statistical analysis comparing the Portfolios’ investment performance, expenses, and fees to comparable funds underlying variable insurance products (the “Performance Universe”). In addition, the Independent Trustees met separately with a representative of Bobroff Consulting, Inc., an independent consultant (“Bobroff), at a special board meeting in September 2013, to review the separate reports prepared by such consultant (“Bobroff Report”), which analyzed the report prepared by Lipper. The Board also considered each Portfolio’s more recent performance subsequent to the performance period covered by the Lipper reports, and management’s discussion of the same, including the effect of current market conditions on each Portfolio’s more recent performance.
The Board reviewed the Portfolios’ performance records and the Adviser’s and Sub-Advisers’ management styles and long-term performance records with the Portfolios and comparable funds. The Board focused particular attention on Portfolios with less favorable performance records. The Board was mindful of the Adviser’s focus on each Sub-Adviser’s performance and noted that the Adviser has been active in monitoring and responding to any performance issues with respect to the Portfolios. The Board also took into account its discussions with management regarding factors that contributed to the performance of the Portfolios.
Among other data relating specifically to the MFS Total Return Portfolio’s performance, the Board considered that the Portfolio outperformed the median of its Performance Universe and its Lipper Index for the one-, three- and five-year periods ended June 30, 2013. The Board further considered that the Portfolio outperformed its blended benchmark, S&P 500 Index (60%) and Barclays Capital U.S. Aggregate Bond Index (40%), for the one-year period ended October 31, 2013 and underperformed its blended benchmark for the three- and five-year periods ended October 31, 2013.
Fees and Expenses. The Board gave consideration to the advisory fees payable under the Advisory Agreement and the sub-advisory fees payable under each of the Sub-Advisory Agreements. In this regard, the Board reviewed the advisory fees payable on a Portfolio-by-Portfolio basis based on information provided by the Adviser. The Independent Trustees, with the assistance of Bobroff, also examined the fees paid by a Portfolio in light of fees paid to other investment managers by comparable funds, as well as considered the fees charged by the Adviser to manage other comparable funds, as applicable. The Lipper report included comparisons of the Adviser’s fee schedule with that of its peers based on an asset-based analysis of relative fee structures according to the size of the Portfolio. In addition, the Board considered the Portfolios’ advisory and sub-advisory fees and total expenses as compared to similarly situated investment companies underlying variable insurance products deemed to be comparable to the Portfolios as determined by Lipper. The Board considered a Portfolio’s ranking within a smaller group of peer funds chosen by Lipper (the “Expense Group”), as well as the Portfolio’s ranking within broader groups of funds (the “Expense Universe” and the “Sub-advised Expense Universe”). The Board
MSF-33
Metropolitan Series Fund
MFS Total Return Portfolio
Board of Trustees’ Consideration of Advisory and Sub-Advisory Agreements—(Continued)
also considered a Portfolio’s contractual sub-advisory fees, as applicable, as compared to the Sub-advised Expense Universe as well as a smaller group of funds (the “Sub-advised Expense Group”). In comparing a Portfolio’s actual and contractual management fee to that of comparable funds, the Board noted that such fee includes both advisory and administrative fees.
The Board noted that the sub-advisory fees for the Portfolios are paid by the Adviser, not the Portfolios, out of the advisory fee. It was further noted that the Adviser negotiates such fees at arm’s length. The Board also considered that the Adviser had entered into expense limitation agreements with certain of the Portfolios, pursuant to which the Adviser has agreed to waive a portion of its advisory fee and/or reimburse certain expenses as a means of limiting a Portfolio’s total annual operating expenses. The Board further considered the amount of sub-advisory fees paid out by the Adviser and the amount of the management fees that it retained in light of the services performed by Sub-Advisers and Adviser, respectively.
With respect to the MFS Total Return Portfolio, the Board considered that the Portfolio’s actual management fees were below the Expense Group median and Expense Universe median, and above the median of the Sub-advised Expense Universe. The Board noted that the Portfolio’s total expenses (exclusive of 12b-l fees) were below the Expense Group median, the Expense Universe median and the Sub-advised Expense Universe median. The Board further noted that the Portfolio’s contractual management fees were below the asset-weighted average of the Expense Group at the Portfolio’s current size. The Board also took into account that the Portfolio’s contractual sub-advisory fees were above the average of the Sub-advised Expense Group and the Sub-advised Expense Universe at the Portfolio’s current size.
Profitability. The Board examined the profitability of the Adviser on a Portfolio-by-Portfolio basis. The Board also considered that the Distributor, MetLife Investors Distribution Company, receives Rule 12b-1 payments to support the distribution of the products. The Board considered the profitability to the Sub-Advisers and their affiliates as a result of their relationships with the Portfolios, and the Board considered the ability of the Adviser to negotiate the Sub-Advisory Agreements and the fees thereunder at arm’s length. The Board also reviewed Portfolio specific data with regard to the profitability of the Portfolios to each Sub-Adviser, as available.
Economies of scale. The Board also considered the effect of the Portfolios’ growth in size on their fees. The Board noted that the fee schedules for most of the Portfolios contain breakpoints that reduce the fee rate above specified asset levels. The Board noted those Portfolios that did not contain breakpoints in the advisory fee and took into account management’s discussion of the same. The Board noted that those Portfolios with advisory fee schedules containing breakpoints generally reflect the inclusion of breakpoints in the sub-advisory fee schedule for such Portfolios. The Board considered the effective fees under the Advisory Agreement for a Portfolio as a percentage of assets at different asset levels and possible economies of scale that may be realized if the assets of the Portfolio grow. Among other data, the Board examined the effect of a Portfolio’s growth in size on various fee schedules and reviewed the Lipper and Bobroff Reports, which compared fees among peers. The Board also generally noted that if a Portfolio’s assets increase over time, the Portfolio may realize other economies of scale if assets increase proportionally more than certain other fixed expenses. In addition, the Board noted that the Adviser had taken a number of steps to date intended to share the benefits of economies of scale with contractholders.
With respect to the MFS Total Return Portfolio, the Board noted that the Portfolio’s advisory fee and sub-advisory fee each contains breakpoints that reduce the advisory fee rate on assets above certain specified asset levels. The Board considered the fact that the Portfolio’s fee levels decline as portfolio assets increase.
Other factors. As part of its evaluation of the Adviser’s compensation, the Board considered other benefits that may be realized by the Adviser and its affiliates from their relationship with the Trusts. Among them, the Board recognized that an affiliate of the Adviser, MetLife Investors Distribution Company, serves as the Distributor for the Trusts, and, as such, receives payments pursuant to Rule 12b-1 from the Portfolios to compensate it for providing shareholder services and selling activities, which could lead to growth in the Trusts’ assets and corresponding benefits from such growth, including economies of scale. The Board also considered that affiliates of the Adviser may benefit from certain indirect tax benefits relating to dividend received deductions and foreign tax credits. In conjunction with these considerations, the Board noted the costs of providing investment management and other services to the Portfolios and the ongoing commitment of the Adviser to the Portfolios.
The Board considered other benefits that may be realized by each Sub-Adviser and its affiliates from their relationship with the Trusts, including the opportunity to provide advisory services to additional portfolios of the Trusts and reputational benefits. In conjunction with these considerations, the Board noted the costs of providing investment advisory services to the Portfolios and the ongoing commitment of the Sub-Advisers to the Portfolios.
MSF-34
Metropolitan Series Fund
MFS Total Return Portfolio
Board of Trustees’ Consideration of Advisory and Sub-Advisory Agreements—(Continued)
The Board considered possible conflicts of interest in the form of material benefits or detriments to the Trusts resulting from the nature of the Trusts’ and the Adviser’s or the Sub-Advisers’ affiliations and the services that are provided to the Trusts, and the manner in which such conflicts were mitigated.
Conclusions. After full consideration of the factors discussed above, the Board, including a majority of the Independent Trustees, approved the Advisory Agreement and the Sub-Advisory Agreement, as applicable, with respect to each Portfolio, unless otherwise noted. In making its approvals, the Board concluded that the nature, extent and quality of services provided by the Adviser and each Sub-Adviser supported the renewal of the Agreements. The Board also concluded that the investment performance of each Fund was such that each Agreement should continue. In addition, the Board concluded that fees paid by a Portfolio to the Adviser and, if applicable, the Sub-Adviser appeared to be acceptable in light of nature, extent and quality of the services provided by the Adviser and Sub-Adviser. Further, the Board concluded that the Adviser’s profitability in providing services under the Advisory Agreements did not appear unreasonably high in light of the nature, extent and quality of the services provided by the Adviser. Finally, the Board concluded that the Advisory and Sub-Advisory fees in some measure share economies of scale with contractholders. In approving the renewal of each of the Agreements, the Board, including the Independent Trustees, did not identify any single factor as controlling, and generally attributed different weights to various factors for the various Portfolios. The Board evaluated all information available to them on a Portfolio-by-Portfolio basis, and their decisions were made separately with respect to each Portfolio.
MSF-35
Metropolitan Series Fund
MFS Value Portfolio
Managed By Massachusetts Financial Services Company
Portfolio Manager Commentary*
PERFORMANCE
For the one year period ended December 31, 2013, the Class A, B, and E shares of the MFS Value Portfolio returned 35.73%, 35.38%, and 35.63%, respectively. The Portfolio’s benchmark, the Russell 1000 Value Index1, returned 32.53%. Since its inception on April 26, 2013, the Class D shares returned 19.02% while the benchmark returned 17.14% over the same period.
MARKET ENVIRONMENT / CONDITIONS
At the beginning of the period, year-end fiscal cliff negotiations between the Republicans in the U.S. Congress and President Obama were a particular source of market attention, where uncertainty surrounding the fiscal negotiations continued right up to the end-of-year deadline. A last minute political agreement averted the worst-case scenario and markets gravitated towards risk assets again, though the implementation of the U.S. budget sequester, combined with concerns surrounding the Italian election results, was a source of uncertainty which lingered throughout the first half of the period.
The more dominant features of the first few months of 2013 included a marked improvement in market sentiment as global macroeconomic indicators improved, monetary easing by the Bank of Japan accelerated and fears of fiscal austerity in the U.S. waned. In the middle of the period, concerns that the U.S. Federal Reserve (the “Fed”) would begin tapering its quantitative easing (“QE”) program caused sovereign bond yields to spike, credit spreads to widen, and equity valuations to fall. Equities subsequently outperformed fixed income in response to the improved economic fundamentals.
Toward the end of the period, the Fed’s decision to postpone QE tapering surprised markets. Favorable market reactions were tempered, however, by tense negotiations over U.S. fiscal policy which resulted in a 16-day partial shutdown of the federal government and a short-term extension in the debt ceiling. The volatility was short-lived, however, as an extension of budget and debt ceiling deadlines allowed the government to re-open, and subsequent economic data reflected moderate but resilient U.S. growth. Also well-received was the decision by the European Central Bank to cut its policy rate as inflation pressures waned in the region. In addition, equity investors appeared to have concluded that there would be no major change in U.S. monetary policy as a result of the nomination of Janet Yellen as the new Fed Chair for the term beginning in early 2014.
PORTFOLIO REVIEW / PERIOD END POSITIONING
Stock selection in the Financials sector contributed to performance relative to the Russell 1000 Value Index. An overweight position in insurance company Prudential Financial boosted relative results as the stock outpaced the benchmark over the reporting period. Stock selection and an overweight position in the Industrials sector also benefited relative returns. Within this sector, overweight positions in defense contractor Lockheed Martin, diversified technology company 3M, and global security company Northrop Grumman bolstered relative results. Holdings of building and airplane controls manufacturer Honeywell International also helped. An underweight allocation to the Utilities sector aided relative performance. There were no individual securities within this sector that were among the Portfolio’s top relative contributors. Elsewhere, the Portfolio’s underweight positions in oil and gas company Exxon Mobil, and its overweight positions in cardiovascular medical device maker St. Jude Medical and life sciences supply company Thermo Fisher Scientific, and holdings of media company Viacom and voice and data communications services company Vodafone Group, benefited relative performance.
Stock selection in the Information Technology sector detracted from relative performance. Within this sector, holdings of International Business Machines (“IBM”) and enterprise software products maker Oracle detracted from relative returns. Not owning strong-performing computer and personal electronics maker Apple and online information portal Yahoo! also held back relative results. Stock selection in the Consumer Staples sector dampened relative returns. Here, an overweight position in tobacco company Philip Morris International, and holdings of alcoholic drink producer Diageo (U.K.), global food company Nestle (Switzerland) and international food producer Danone (France), weighed on relative performance. Elsewhere, an overweight position in retailing company Target detracted from relative results as the stock turned in weak performance for the reporting period. The Portfolio’s cash and/or cash equivalent position during the period was also a detractor from relative performance. Under normal market conditions, the Portfolio strives to be fully invested and generally holds cash to buy new holdings and provide liquidity. In a period when equity markets rose, as measured by the Portfolio’s benchmark, holding cash hurt performance versus the benchmark, which has no cash position.
MSF-1
Metropolitan Series Fund
MFS Value Portfolio
Managed By Massachusetts Financial Services Company
Portfolio Manager Commentary*—(Continued)
Over the trailing 12 months ending December 31, 2013, the Portfolio increased its positions in Financials, Health Care, and Industrials while reducing its exposure to Energy, Information Technology, and Materials. Additionally, the Portfolio was overweight to Consumer Staples, Industrials, and Consumer Discretionary while being underweight to Energy, Financials, and Utilities.
Steven R. Gorham
Nevin P. Chitkara
Portfolio Managers
Massachusetts Financial Services Company
* This commentary may include statements that constitute “forward-looking statements” under the U.S. securities laws. Forward-looking statements include, among other things, projections, estimates, and information about possible or future results related to the Portfolio, market or regulatory developments. The views expressed above are not guarantees of future performance or economic results and involve certain risks, uncertainties and assumptions that could cause actual outcomes and results to differ materially from the views expressed herein. The views expressed above are subject to change at any time based upon economic, market, or other conditions and the subadvisory firm undertakes no obligation to update the views expressed herein. Any discussions of specific securities should not be considered a recommendation to buy or sell those securities. The views expressed above (including any forward-looking statement) may not be relied upon as investment advice or as an indication of the Portfolio’s trading intent. Information about the Portfolio’s holdings, asset allocation or country diversification is historical and is not an indication of future Portfolio composition, which may vary. Direct investment in any index is not possible. The performance of any index mentioned in this commentary has not been adjusted for ongoing management, distribution and operating expenses, and sales charges applicable to mutual fund investments. In addition, the returns do not reflect additional fees charged by separate accounts or variable insurance contracts that an investor in the Portfolio may pay. If these additional fees were reflected, performance would have been lower.
MSF-2
Metropolitan Series Fund
MFS Value Portfolio
A $10,000 INVESTMENT COMPARED TO THE RUSSELL 1000 VALUE INDEX

AVERAGE ANNUAL RETURNS (%) (FOR THE YEAR ENDED DECEMBER 31, 2013)
| | | | | | | | | | | | | | | | |
| | | 1 Year | | | 5 Year | | | 10 Year | | | Since Inception2 | |
| MFS Value Portfolio | | | | | | | | | | | | | | | | |
Class A | | | 35.73 | | | | 16.54 | | | | 8.87 | | | | — | |
Class B | | | 35.38 | | | | 16.27 | | | | — | | | | 7.33 | |
Class D | | | — | | | | — | | | | — | | | | 19.02 | |
Class E | | | 35.63 | | | | 16.40 | | | | — | | | | 7.46 | |
| Russell 1000 Value Index | | | 32.53 | | | | 16.67 | | | | 7.58 | | | | — | |
1 The Russell 1000 Value Index is an unmanaged measure of the largest capitalized U.S. domiciled companies with a less than average growth orientation. Companies in this Index generally have a low price-to-book and price-to-earnings ratio, higher dividend yields and lower forecasted growth values.
2 Inception dates of the Class A, Class B, Class D and Class E shares are 7/20/98, 4/28/08, 4/26/13, and 4/28/08, respectively. The since inception return shown for Class D is not computed on an annualized basis.
Portfolio performance is calculated including reinvestment of all income and capital gain distributions. Performance numbers are net of all Portfolio expenses but do not include any insurance, sales, separate account or administrative charges of variable annuity or life insurance contracts or any additional expenses that participants may bear relating to the operations of their plans. If these charges were included, the returns would be lower. The performance of any index referenced above has not been adjusted for ongoing management, distribution and operating expenses, and sales charges applicable to mutual fund investments. Direct investment in any index is not possible. The performance of Class A shares, as set forth in the line graph above, will differ from that of other classes because of the difference in expenses paid by policyholders investing in the different share classes.
This information represents past performance and is not indicative of future results. Investment return and principal value may fluctuate so that shares, upon redemption, may be worth more or less than the original cost.
PORTFOLIO COMPOSITION AS OF DECEMBER 31, 2013
Top Holdings
| | | | |
| | |
% of
Net Assets | |
| JPMorgan Chase & Co. | | | 4.0 | |
| Philip Morris International, Inc. | | | 3.7 | |
| Johnson & Johnson | | | 3.4 | |
| Lockheed Martin Corp. | | | 3.1 | |
| Pfizer, Inc. | | | 3.1 | |
| Wells Fargo & Co. | | | 3.0 | |
| Exxon Mobil Corp. | | | 2.4 | |
| United Technologies Corp. | | | 2.1 | |
| Goldman Sachs Group, Inc. (The) | | | 2.1 | |
| Accenture plc - Class A | | | 2.1 | |
Top Sectors
| | | | |
| | | % of
Market Value of
Total Long-Term Investments | |
| Financials | | | 23.5 | |
| Industrials | | | 17.4 | |
| Consumer Staples | | | 14.4 | |
| Health Care | | | 14.2 | |
| Consumer Discretionary | | | 10.8 | |
| Information Technology | | | 7.4 | |
| Energy | | | 6.3 | |
| Telecommunication Services | | | 3.4 | |
| Materials | | | 1.9 | |
| Utilities | | | 0.7 | |
MSF-3
Metropolitan Series Fund
MFS Value Portfolio
Understanding Your Portfolio’s Expenses
Shareholder Expense Example
As a shareholder of the Portfolio, you incur ongoing costs, including management fees; distribution and service (12b-1) fees; and other Portfolio expenses. This example is intended to help you understand your ongoing costs (in dollars) (referred to as “expenses”) of investing in the Portfolio and compare these costs with the ongoing costs of investing in other mutual funds. The example is based on an investment of $1,000 invested at the beginning of the period and held for the entire period, July 1, 2013 through December 31, 2013.
Actual Expenses
The first line for each share class of the Portfolio in the table below provides information about actual account values and actual expenses. You may use the information in this line, together with the amount you invested in the particular share class of the Portfolio, to estimate the expenses that you paid over the period. Simply divide your account value by $1,000 (for example, an $8,600 account value divided by $1,000 = 8.6), then multiply the result by the number in the first line under the heading entitled “Expenses Paid During Period” to estimate the expenses you paid on your account during this period.
Hypothetical Example for Comparison Purposes
The second line for each share class of the Portfolio in the table below provides information about hypothetical account values and hypothetical expenses based on the Portfolio’s actual expense ratio and an assumed rate of return of 5% per year before expenses, which is not the Portfolio’s actual return. The hypothetical account values and expenses may not be used to estimate the actual ending account balance or expenses you paid for the period. You may use this information to compare the ongoing costs of investing in the Portfolio and other funds. To do so, compare this 5% hypothetical example with the 5% hypothetical examples that appear in the shareholder reports of the other funds.
Please note that the expenses shown in the table are meant to highlight your ongoing costs only and do not reflect any fees or charges of your variable insurance product or any additional expenses that participants in certain eligible qualified plans may bear relating to the operations of their plan. Therefore, the second line for each share class in the table is useful in comparing ongoing costs only, and will not help you determine the relative total costs of owning different funds. In addition, if these other costs were included, your costs would have been higher.
| | | | | | | | | | | | | | | | | | |
MFS Value Portfolio | | | | Annualized
Expense
Ratio | | | Beginning
Account Value
July 1,
2013 | | | Ending
Account Value
December 31,
2013 | | | Expenses Paid
During Period**
July 1, 2013
to
December 31,
2013 | |
Class A(a) | | Actual | | | 0.56 | % | | $ | 1,000.00 | | | $ | 1,166.20 | | | $ | 3.06 | |
| | Hypothetical* | | | 0.56 | % | | $ | 1,000.00 | | | $ | 1,022.38 | | | $ | 2.85 | |
| | | | | |
Class B(a) | | Actual | | | 0.82 | % | | $ | 1,000.00 | | | $ | 1,164.70 | | | $ | 4.47 | |
| | Hypothetical* | | | 0.82 | % | | $ | 1,000.00 | | | $ | 1,021.07 | | | $ | 4.18 | |
| | | | | |
Class D(a) | | Actual | | | 0.68 | % | | $ | 1,000.00 | | | $ | 1,165.10 | | | $ | 3.71 | |
| | Hypothetical* | | | 0.68 | % | | $ | 1,000.00 | | | $ | 1,021.78 | | | $ | 3.47 | |
| | | | | |
Class E(a) | | Actual | | | 0.71 | % | | $ | 1,000.00 | | | $ | 1,165.60 | | | $ | 3.88 | |
| | Hypothetical* | | | 0.71 | % | | $ | 1,000.00 | | | $ | 1,021.63 | | | $ | 3.62 | |
* Hypothetical assumes a rate of return of 5% per year before expenses.
** Expenses paid are equal to the Portfolio’s annualized expense ratio for the most recent six month period, as shown above, multiplied by the average account value over the period, multiplied by the number of days (184 days) in the most recent fiscal half-year, divided by 365 (to reflect the one-half year period).
(a) The annualized expense ratio shown reflects the impact of the management fee waiver as described in Note 6 of the Notes to Financial Statements.
MSF-4
Metropolitan Series Fund
MFS Value Portfolio
Schedule of Investments as of December 31, 2013
Common Stocks—99.6% of Net Assets
| | | | | | | | |
| Security Description | | Shares | | | Value | |
|
Aerospace & Defense—7.9% | |
Honeywell International, Inc. | | | 817,321 | | | $ | 74,678,620 | |
Lockheed Martin Corp. | | | 820,190 | | | | 121,929,445 | |
Northrop Grumman Corp. | | | 333,239 | | | | 38,192,522 | |
United Technologies Corp. | | | 708,814 | | | | 80,663,033 | |
| | | | | | | | |
| | | | | | | 315,463,620 | |
| | | | | | | | |
|
Air Freight & Logistics—1.7% | |
United Parcel Service, Inc. - Class B | | | 635,840 | | | | 66,814,067 | |
| | | | | | | | |
|
Auto Components—1.7% | |
Delphi Automotive plc | | | 411,540 | | | | 24,745,900 | |
Johnson Controls, Inc. | | | 858,001 | | | | 44,015,451 | |
| | | | | | | | |
| | | | | | | 68,761,351 | |
| | | | | | | | |
|
Automobiles—0.2% | |
General Motors Co. (a) | | | 225,920 | | | | 9,233,350 | |
| | | | | | | | |
|
Beverages—2.4% | |
Coca-Cola Enterprises, Inc. | | | 328,990 | | | | 14,518,329 | |
Diageo plc | | | 1,905,256 | | | | 62,932,955 | |
Dr. Pepper Snapple Group, Inc. | | | 369,170 | | | | 17,985,962 | |
| | | | | | | | |
| | | | | | | 95,437,246 | |
| | | | | | | | |
|
Capital Markets—6.5% | |
Bank of New York Mellon Corp. (The) | | | 1,686,001 | | | | 58,908,875 | |
BlackRock, Inc. | | | 118,658 | | | | 37,551,697 | |
Franklin Resources, Inc. | | | 649,227 | | | | 37,479,875 | |
Goldman Sachs Group, Inc. (The) | | | 471,973 | | | | 83,661,934 | |
State Street Corp. | | | 528,954 | | | | 38,819,934 | |
| | | | | | | | |
| | | | | | | 256,422,315 | |
| | | | | | | | |
| | |
Chemicals—1.6% | | | | | | | | |
Air Products & Chemicals, Inc. | | | 86,882 | | | | 9,711,670 | |
PPG Industries, Inc. | | | 275,433 | | | | 52,238,623 | |
Valspar Corp. (The) (b) | | | 51,410 | | | | 3,665,019 | |
| | | | | | | | |
| | | | | | | 65,615,312 | |
| | | | | | | | |
|
Commercial Banks—4.3% | |
PNC Financial Services Group, Inc. (The) | | | 406,018 | | | | 31,498,877 | |
U.S. Bancorp | | | 507,110 | | | | 20,487,244 | |
Wells Fargo & Co. | | | 2,609,798 | | | | 118,484,829 | |
| | | | | | | | |
| | | | | | | 170,470,950 | |
| | | | | | | | |
|
Commercial Services & Supplies—1.1% | |
Tyco International, Ltd. | | | 1,074,614 | | | | 44,102,159 | |
| | | | | | | | |
|
Computers & Peripherals—0.2% | |
Hewlett-Packard Co. | | | 294,321 | | | | 8,235,102 | |
| | | | | | | | |
|
Containers & Packaging—0.3% | |
Crown Holdings, Inc. (a) | | | 258,830 | | | | 11,536,053 | |
| | | | | | | | |
|
Diversified Financial Services—5.3% | |
JPMorgan Chase & Co. | | | 2,743,861 | | | | 160,460,991 | |
McGraw Hill Financial, Inc. | | | 210,690 | | | | 16,475,958 | |
|
Diversified Financial Services—(Continued) | |
Moody’s Corp. (b) | | | 207,930 | | | | 16,316,267 | |
NASDAQ OMX Group, Inc. (The) | | | 410,545 | | | | 16,339,691 | |
| | | | | | | | |
| | | | | | | 209,592,907 | |
| | | | | | | | |
|
Diversified Telecommunication Services—2.2% | |
AT&T, Inc. | | | 1,120,901 | | | | 39,410,879 | |
Verizon Communications, Inc. | | | 941,310 | | | | 46,255,973 | |
| | | | | | | | |
| | | | | | | 85,666,852 | |
| | | | | | | | |
|
Electric Utilities—0.6% | |
Duke Energy Corp. | | | 187,700 | | | | 12,953,177 | |
PPL Corp. | | | 323,807 | | | | 9,743,353 | |
| | | | | | | | |
| | | | | | | 22,696,530 | |
| | | | | | | | |
|
Electrical Equipment—0.9% | |
Eaton Corp. plc | | | 482,042 | | | | 36,693,037 | |
| | | | | | | | |
|
Food & Staples Retailing—1.8% | |
CVS Caremark Corp. | | | 989,224 | | | | 70,798,762 | |
| | | | | | | | |
|
Food Products—4.2% | |
Danone S.A. | | | 447,240 | | | | 32,264,205 | |
General Mills, Inc. (b) | | | 1,089,426 | | | | 54,373,252 | |
Kellogg Co. (b) | | | 191,617 | | | | 11,702,050 | |
Nestle S.A. | | | 949,239 | | | | 69,681,685 | |
| | | | | | | | |
| | | | | | | 168,021,192 | |
| | | | | | | | |
|
Health Care Equipment & Supplies—3.6% | |
Abbott Laboratories | | | 1,166,246 | | | | 44,702,209 | |
Covidien plc | | | 329,560 | | | | 22,443,036 | |
Medtronic, Inc. | | | 783,270 | | | | 44,951,865 | |
St. Jude Medical, Inc. (b) | | | 524,712 | | | | 32,505,909 | |
| | | | | | | | |
| | | | | | | 144,603,019 | |
| | | | | | | | |
|
Health Care Providers & Services—1.2% | |
Express Scripts Holding Co. (a) | | | 488,670 | | | | 34,324,181 | |
Quest Diagnostics, Inc. (b) | | | 258,260 | | | | 13,827,240 | |
| | | | | | | | |
| | | | | | | 48,151,421 | |
| | | | | | | | |
|
Hotels, Restaurants & Leisure—1.0% | |
McDonald’s Corp. | | | 392,493 | | | | 38,083,596 | |
| | | | | | | | |
|
Household Products—0.5% | |
Procter & Gamble Co. (The) | | | 252,152 | | | | 20,527,694 | |
| | | | | | | | |
|
Industrial Conglometes—3.4% | |
3M Co. | | | 590,209 | | | | 82,776,812 | |
Danaher Corp. | | | 654,832 | | | | 50,553,031 | |
| | | | | | | | |
| | | | | | | 133,329,843 | |
| | | | | | | | |
|
Insurance—7.3% | |
ACE, Ltd. | | | 425,913 | | | | 44,094,773 | |
Aon plc | | | 448,289 | | | | 37,606,964 | |
Chubb Corp. (The) | | | 528,634 | | | | 51,081,903 | |
Prudential Financial, Inc. | | | 832,222 | | | | 76,747,513 | |
See accompanying notes to financial statements.
MSF-5
Metropolitan Series Fund
MFS Value Portfolio
Schedule of Investments as of December 31, 2013
Common Stocks—(Continued)
| | | | | | | | |
| Security Description | |
Shares | | | Value | |
|
Insurance—(Continued) | |
Travelers Cos., Inc. (The) | | | 889,605 | | | $ | 80,544,837 | |
| | | | | | | | |
| | | | | | | 290,075,990 | |
| | | | | | | | |
|
IT Services—5.1% | |
Accenture plc - Class A | | | 1,010,499 | | | | 83,083,228 | |
Fidelity National Information Services, Inc. | | | 211,780 | | | | 11,368,350 | |
Fiserv, Inc. (a) | | | 384,000 | | | | 22,675,200 | |
International Business Machines Corp. | | | 400,274 | | | | 75,079,394 | |
Western Union Co. (The) (b) | | | 673,166 | | | | 11,612,114 | |
| | | | | | | | |
| | | | | | | 203,818,286 | |
| | | | | | | | |
|
Leisure Equipment & Products—0.5% | |
Hasbro, Inc. (b) | | | 355,941 | | | | 19,580,314 | |
| | | | | | | | |
|
Life Sciences Tools & Services—1.4% | |
Thermo Fisher Scientific, Inc. (b) | | | 483,178 | | | | 53,801,870 | |
| | | | | | | | |
|
Machinery—1.6% | |
Illinois Tool Works, Inc. (b) | | | 210,194 | | | | 17,673,112 | |
Pentair, Ltd. | | | 241,798 | | | | 18,780,451 | |
Stanley Black & Decker, Inc. | | | 354,031 | | | | 28,566,761 | |
| | | | | | | | |
| | | | | | | 65,020,324 | |
| | | | | | | | |
|
Media—4.5% | |
Comcast Corp. - Special Class A | | | 804,270 | | | | 40,116,988 | |
Omnicom Group, Inc. | | | 655,377 | | | | 48,740,387 | |
Viacom, Inc. - Class B | | | 392,040 | | | | 34,240,774 | |
Walt Disney Co. (The) | | | 728,620 | | | | 55,666,568 | |
| | | | | | | | |
| | | | | | | 178,764,717 | |
| | | | | | | | |
|
Multi-Utilities—0.1% | |
Public Service Enterprise Group, Inc. | | | 190,081 | | | | 6,090,195 | |
| | | | | | | | |
|
Multiline Retail—1.7% | |
Kohl’s Corp. (b) | | | 186,280 | | | | 10,571,390 | |
Target Corp. | | | 928,930 | | | | 58,773,401 | |
| | | | | | | | |
| | | | | | | 69,344,791 | |
| | | | | | | | |
|
Oil, Gas & Consumable Fuels—6.2% | |
Apache Corp. | | | 224,119 | | | | 19,260,787 | |
Chevron Corp. | | | 516,529 | | | | 64,519,637 | |
EOG Resources, Inc. | | | 82,781 | | | | 13,893,963 | |
Exxon Mobil Corp. | | | 936,673 | | | | 94,791,308 | |
Occidental Petroleum Corp. | | | 579,812 | | | | 55,140,121 | |
| | | | | | | | |
| | | | | | | 247,605,816 | |
| | | | | | | | |
|
Pharmaceuticals—7.9% | |
Johnson & Johnson | | | 1,454,501 | | | | 133,217,747 | |
Merck & Co., Inc. | | | 733,047 | | | | 36,689,002 | |
Pfizer, Inc. | | | 3,959,991 | | | | 121,294,524 | |
Roche Holding AG | | | 83,234 | | | | 23,331,902 | |
Zoetis, Inc. | | | 35,140 | | | | 1,148,727 | |
| | | | | | | | |
| | | | | | | 315,681,902 | |
| | | | | | | | |
|
Real Estate Management & Development—0.1% | |
Canary Wharf Group plc (c) | | | 767,618 | | | $ | 3,967,141 | |
| | | | | | | | |
|
Road & Rail—0.6% | |
Canadian National Railway Co. | | | 437,680 | | | | 24,956,514 | |
| | | | | | | | |
|
Semiconductors & Semiconductor Equipment—0.7% | |
Intel Corp. | | | 1,003,867 | | | | 26,060,387 | |
| | | | | | | | |
|
Software—1.4% | |
Oracle Corp. | | | 1,429,796 | | | | 54,703,995 | |
| | | | | | | | |
|
Specialty Retail—1.1% | |
Advance Auto Parts, Inc. | | | 235,502 | | | | 26,065,362 | |
Staples, Inc. (b) | | | 1,029,580 | | | | 16,360,026 | |
| | | | | | | | |
| | | | | | | 42,425,388 | |
| | | | | | | | |
|
Tobacco—5.5% | |
Altria Group, Inc. | | | 485,436 | | | | 18,635,888 | |
Imperial Tobacco Group plc | | | 197,268 | | | | 7,655,794 | |
Lorillard, Inc. (b) | | | 894,690 | | | | 45,342,889 | |
Philip Morris International, Inc. | | | 1,664,987 | | | | 145,070,318 | |
| | | | | | | | |
| | | | | | | 216,704,889 | |
| | | | | | | | |
|
Wireless Telecommunication Services—1.3% | |
Vodafone Group plc | | | 12,817,951 | | | | 50,388,340 | |
| | | | | | | | |
Total Common Stocks
(Cost $2,730,170,838) | | | | | | | 3,959,247,237 | |
| | | | | | | | |
|
| Convertible Preferred Stock—0.1% | |
|
Aerospace & Defense—0.1% | |
United Technologies Corp. (b)
(Cost $3,212,071) | | | 61,790 | | | | 4,045,391 | |
| | | | | | | | |
|
| Short-Term Investments—2.3% | |
|
Mutual Fund—2.1% | |
State Street Navigator Securities Lending MET Portfolio (d) | | | 82,185,144 | | | | 82,185,144 | |
| | | | | | | | |
|
Commercial Paper—0.2% | |
HSBC Americas, Inc.
0.051%, 01/02/14 (e) | | | 7,053,000 | | | | 7,052,990 | |
| | | | | | | | |
Total Short-Term Investments
(Cost $89,238,134) | | | | | | | 89,238,134 | |
| | | | | | | | |
Total Investments—102.0%
(Cost $2,822,621,043) (f) | | | | | | | 4,052,530,762 | |
Other assets and liabilities
(net)—(2.0)% | | | | | | | (79,653,930 | ) |
| | | | | | | | |
| Net Assets—100.0% | | | | | | $ | 3,972,876,832 | |
| | | | | | | | |
| * | Principal amount stated in U.S. dollars unless otherwise noted. |
| (a) | Non-income producing security. |
See accompanying notes to financial statements.
MSF-6
Metropolitan Series Fund
MFS Value Portfolio
Schedule of Investments as of December 31, 2013
| (b) | All or a portion of the security was held on loan. As of December 31, 2013, the market value of securities loaned was $97,259,950 and the collateral received consisted of cash in the amount of $82,185,144 and non-cash collateral with a value of $17,593,507. The cash collateral is invested in a money market fund managed by an affiliate of the custodian. The non-cash collateral received consists primarily of government securities and bank letters of credit, and is held for the benefit of the Portfolio at the Portfolio’s custodian. The Portfolio cannot repledge or resell this collateral. As such, this collateral is excluded from the Statement of Assets and Liabilities. |
| (c) | Security was valued in good faith under procedures approved by the Board of Trustees. As of December 31, 2013, these securities represent 0.1% of net assets. |
| (d) | Represents investment of cash collateral received from securities lending transactions. |
| (e) | The rate shown represents the discount rate at the time of purchase by the Portfolio. |
| (f) | As of December 31, 2013, the aggregate cost of investments for federal income tax purposes was $2,834,613,305. The aggregate unrealized appreciation and depreciation of investments were $1,219,028,444 and $(1,110,987), respectively, resulting in net unrealized appreciation of $1,217,917,457 for federal income tax purposes. |
See accompanying notes to financial statements.
MSF-7
Metropolitan Series Fund
MFS Value Portfolio
Schedule of Investments as of December 31, 2013
Fair Value Hierarchy
Accounting principles generally accepted in the United States of America (“GAAP”) define fair market value as the price that the Portfolio would receive to sell an asset or pay to transfer a liability in an orderly transaction between market participants at the measurement date. It establishes a fair value hierarchy that prioritizes inputs to valuation methods and requires disclosure of the fair value hierarchy that segregates fair value measurements into three levels. Levels 1, 2 and 3 of the fair value hierarchy are defined as follows:
Level 1- unadjusted quoted prices in active markets for identical investments
Level 2 - other significant observable inputs (including, but not limited to, unadjusted quoted prices for similar investments in markets that are either active or inactive; inputs other than quoted prices that are observable such as interest rates, yield curves, volatilities, prepayment speeds, loss severities, credit risks, default rates, etc.)
Level 3 - significant unobservable inputs based on the best information available in the circumstances, to the extent observable inputs are unavailable (including the Portfolio’s own assumptions in determining the fair value of investments)
The inputs or methodologies used for valuing investments are not necessarily an indication of the risk associated with investing in them. Changes to the inputs or methodologies used may result in transfers between levels, which will be recognized as of the beginning of the reporting period. Information on transfers between Level 1 and Level 2, if any, will be disclosed following the fair value hierarchy table below. A reconciliation of Level 3 securities, if any, will also be disclosed following the fair value hierarchy table. For more information about the Portfolio’s policy regarding the valuation of investments, please refer to the Notes to Financial Statements.
The following table summarizes the fair value hierarchy of the Portfolio’s investments as of December 31, 2013:
| | | | | | | | | | | | | | | | |
| Description | | Level 1 | | | Level 2 | | | Level 3 | | | Total | |
| Common Stocks | | | | | | | | | | | | | | | | |
Aerospace & Defense | | $ | 315,463,620 | | | $ | — | | | $ | — | | | $ | 315,463,620 | |
Air Freight & Logistics | | | 66,814,067 | | | | — | | | | — | | | | 66,814,067 | |
Auto Components | | | 68,761,351 | | | | — | | | | — | | | | 68,761,351 | |
Automobiles | | | 9,233,350 | | | | — | | | | — | | | | 9,233,350 | |
Beverages | | | 32,504,291 | | | | 62,932,955 | | | | — | | | | 95,437,246 | |
Capital Markets | | | 256,422,315 | | | | — | | | | — | | | | 256,422,315 | |
Chemicals | | | 65,615,312 | | | | — | | | | — | | | | 65,615,312 | |
Commercial Banks | | | 170,470,950 | | | | — | | | | — | | | | 170,470,950 | |
Commercial Services & Supplies | | | 44,102,159 | | | | — | | | | — | | | | 44,102,159 | |
Computers & Peripherals | | | 8,235,102 | | | | — | | | | — | | | | 8,235,102 | |
Containers & Packaging | | | 11,536,053 | | | | — | | | | — | | | | 11,536,053 | |
Diversified Financial Services | | | 209,592,907 | | | | — | | | | — | | | | 209,592,907 | |
Diversified Telecommunication Services | | | 85,666,852 | | | | — | | | | — | | | | 85,666,852 | |
Electric Utilities | | | 22,696,530 | | | | — | | | | — | | | | 22,696,530 | |
Electrical Equipment | | | 36,693,037 | | | | — | | | | — | | | | 36,693,037 | |
Food & Staples Retailing | | | 70,798,762 | | | | — | | | | — | | | | 70,798,762 | |
Food Products | | | 66,075,302 | | | | 101,945,890 | | | | — | | | | 168,021,192 | |
Health Care Equipment & Supplies | | | 144,603,019 | | | | — | | | | — | | | | 144,603,019 | |
Health Care Providers & Services | | | 48,151,421 | | | | — | | | | — | | | | 48,151,421 | |
Hotels, Restaurants & Leisure | | | 38,083,596 | | | | — | | | | — | | | | 38,083,596 | |
Household Products | | | 20,527,694 | | | | — | | | | — | | | | 20,527,694 | |
Industrial Conglomerates | | | 133,329,843 | | | | — | | | | — | | | | 133,329,843 | |
Insurance | | | 290,075,990 | | | | — | | | | — | | | | 290,075,990 | |
IT Services | | | 203,818,286 | | | | — | | | | — | | | | 203,818,286 | |
Leisure Equipment & Products | | | 19,580,314 | | | | — | | | | — | | | | 19,580,314 | |
Life Sciences Tools & Services | | | 53,801,870 | | | | — | | | | — | | | | 53,801,870 | |
Machinery | | | 65,020,324 | | | | — | | | | — | | | | 65,020,324 | |
Media | | | 178,764,717 | | | | — | | | | — | | | | 178,764,717 | |
Multi-Utilities | | | 6,090,195 | | | | — | | | | — | | | | 6,090,195 | |
Multiline Retail | | | 69,344,791 | | | | — | | | | — | | | | 69,344,791 | |
Oil, Gas & Consumable Fuels | | | 247,605,816 | | | | — | | | | — | | | | 247,605,816 | |
Pharmaceuticals | | | 292,350,000 | | | | 23,331,902 | | | | — | | | | 315,681,902 | |
Real Estate Management & Development | | | — | | | | — | | | | 3,967,141 | | | | 3,967,141 | |
Road & Rail | | | 24,956,514 | | | | — | | | | — | | | | 24,956,514 | |
Semiconductors & Semiconductor Equipment | | | 26,060,387 | | | | — | | | | — | | | | 26,060,387 | |
Software | | | 54,703,995 | | | | — | | | | — | | | | 54,703,995 | |
Specialty Retail | | | 42,425,388 | | | | — | | | | — | | | | 42,425,388 | |
See accompanying notes to financial statements.
MSF-8
Metropolitan Series Fund
MFS Value Portfolio
Schedule of Investments as of December 31, 2013
Fair Value Hierarchy—(Continued)
| | | | | | | | | | | | | | | | |
| Description | | Level 1 | | | Level 2 | | | Level 3 | | | Total | |
Tobacco | | $ | 209,049,095 | | | $ | 7,655,794 | | | $ | — | | | $ | 216,704,889 | |
Wireless Telecommunication Services | | | — | | | | 50,388,340 | | | | — | | | | 50,388,340 | |
Total Common Stocks | | | 3,709,025,215 | | | | 246,254,881 | | | | 3,967,141 | | | | 3,959,247,237 | |
Total Convertible Preferred Stock* | | | 4,045,391 | | | | — | | | | — | | | | 4,045,391 | |
| Short-Term Investments | | | | | | | | | | | | | | | | |
Mutual Fund | | | 82,185,144 | | | | — | | | | — | | | | 82,185,144 | |
Commercial Paper | | | — | | | | 7,052,990 | | | | — | | | | 7,052,990 | |
Total Short-Term Investments | | | 82,185,144 | | | | 7,052,990 | | | | — | | | | 89,238,134 | |
Total Investments | | $ | 3,795,255,750 | | | $ | 253,307,871 | | | $ | 3,967,141 | | | $ | 4,052,530,762 | |
| | | | | | | | | | | | | | | | | |
Collateral for securities loaned (Liability) | | $ | — | | | $ | (82,185,144 | ) | | $ | — | | | $ | (82,185,144 | ) |
| * | See Schedule of Investments for additional detailed categorizations. |
Following is a reconciliation of Level 3 assets for which significant unobservable inputs were used to determine fair value:
| | | | | | | | | | | | | | | | | | | | | | | | | | | | |
Investments in Securities | | Balance as of
December 31,
2012 | | | Realized
Gain/
(Loss) | | | Change in
Unrealized
Appreciation/
(Depreciation) | | | Purchases (a) | | | Sales | | | Balance as of
December 31,
2013 | | | Change in
Unrealized
Appreciation/
(Depreciation)
from Investments
Still Held at
December 31,
2013 | |
| Common Stocks | | | | | | | | | | | | | | | | | | | | | | | | | | | | |
Real Estate Management & Development | | $ | — | | | $ | — | | | $ | 293,965 | | | $ | 3,673,176 | | | $ | — | | | $ | 3,967,141 | | | $ | 293,965 | |
| | | | | | | | | | | | | | | | | | | | | | | | | | | | |
Total | | $ | — | | | $ | — | | | $ | 293,965 | | | $ | 3,673,176 | | | $ | — | | | $ | 3,967,141 | | | $ | 293,965 | |
| | | | | | | | | | | | | | | | | | | | | | | | | | | | |
| (a) | Security was acquired as a result of the merger with the Met Investors Series Trust Met/Franklin Mutual Shares Portfolio. Purchase amount shown above reflects the value of the security on the date of the merger. |
See accompanying notes to financial statements.
MSF-9
Metropolitan Series Fund
MFS Value Portfolio
Statement of Assets and Liabilities
December 31, 2013
| | | | |
Assets | | | | |
Investments at value (a) (b) | | $ | 4,052,530,762 | |
Cash | | | 159,509 | |
Cash denominated in foreign currencies (c) | | | 478,470 | |
Receivable for: | | | | |
Fund shares sold | | | 549,326 | |
Dividends | | | 6,562,160 | |
Prepaid expenses | | | 6,456 | |
| | | | |
Total Assets | | | 4,060,286,683 | |
Liabilities | | | | |
Collateral for securities loaned | | | 82,185,144 | |
Payables for: | | | | |
Fund shares redeemed | | | 2,895,111 | |
Accrued expenses: | | | | |
Management fees | | | 1,816,463 | |
Distribution and service fees | | | 177,442 | |
Deferred trustees’ fees | | | 129,340 | |
Other expenses | | | 206,351 | |
| | | | |
Total Liabilities | | | 87,409,851 | |
| | | | |
Net Assets | | $ | 3,972,876,832 | |
| | | | |
Net assets consist of: | | | | |
Paid in surplus | | $ | 2,505,206,190 | |
Undistributed net investment income | | | 64,684,656 | |
Accumulated net realized gain | | | 173,035,990 | |
Unrealized appreciation on investments and foreign currency transactions | | | 1,229,949,996 | |
| | | | |
Net Assets | | $ | 3,972,876,832 | |
| | | | |
Net Assets | | | | |
Class A | | $ | 3,074,829,244 | |
Class B | | | 795,939,716 | |
Class D | | | 18,561,882 | |
Class E | | | 83,545,990 | |
Capital Shares Outstanding* | | | | |
Class A | | | 173,198,202 | |
Class B | | | 45,190,976 | |
Class D | | | 1,048,029 | |
Class E | | | 4,728,442 | |
Net Asset Value, Offering Price and Redemption Price Per Share | | | | |
Class A | | $ | 17.75 | |
Class B | | | 17.61 | |
Class D | | | 17.71 | |
Class E | | | 17.67 | |
| * | The Portfolio is authorized to issue an unlimited number of shares. |
| (a) | Identified cost of investments was $2,822,621,043. |
| (b) | Includes securities loaned at value of $97,259,950. |
| (c) | Identified cost of cash denominated in foreign currencies was $473,249. |
Statement of Operations
Year Ended December 31, 2013
| | | | |
Investment Income | | | | |
Dividends (a) | | $ | 86,103,790 | |
Interest | | | 8,863 | |
Securities lending income | | | 603,521 | |
| | | | |
Total investment income | | | 86,716,174 | |
Expenses | | | | |
Management fees | | | 24,204,741 | |
Administration fees | | | 49,601 | |
Custodian and accounting fees | | | 334,885 | |
Distribution and service fees—Class B | | | 1,465,288 | |
Distribution and service fees—Class D | | | 12,721 | |
Distribution and service fees—Class E | | | 115,635 | |
Audit and tax services | | | 58,512 | |
Legal | | | 28,017 | |
Trustees’ fees and expenses | | | 41,377 | |
Shareholder reporting | | | 158,971 | |
Insurance | | | 19,523 | |
Miscellaneous | | | 27,104 | |
| | | | |
Total expenses | | | 26,516,375 | |
Less management fee waiver | | | (4,905,859 | ) |
Less broker commission recapture | | | (106,425 | ) |
| | | | |
Net expenses | | | 21,504,091 | |
| | | | |
Net Investment Income | | | 65,212,083 | |
| | | | |
Net Realized and Unrealized Gain | | | | |
| Net realized gain (loss) on: | | | | |
Investments | | | 305,534,645 | |
Futures contracts | | | (589,192 | ) |
Foreign currency transactions | | | 31,430 | |
| | | | |
Net realized gain | | | 304,976,883 | |
| | | | |
| Net change in unrealized appreciation (depreciation) on: | | | | |
Investments | | | 659,811,702 | |
Foreign currency transactions | | | (25,526 | ) |
| | | | |
Net change in unrealized appreciation | | | 659,786,176 | |
| | | | |
Net realized and unrealized gain | | | 964,763,059 | |
| | | | |
Net Increase in Net Assets From Operations | | $ | 1,029,975,142 | |
| | | | |
| (a) | Net of foreign withholding taxes of $428,028. |
See accompanying notes to financial statements.
MSF-10
Metropolitan Series Fund
MFS Value Portfolio
Statements of Changes in Net Assets
| | | | | | | | |
| | | Year Ended
December 31,
2013 | | | Year Ended
December 31,
2012 | |
Increase (Decrease) in Net Assets: | | | | | | | | |
From Operations | | | | | | | | |
Net investment income | | $ | 65,212,083 | | | $ | 56,625,039 | |
Net realized gain | | | 304,976,883 | | | | 100,116,064 | |
Net change in unrealized appreciation | | | 659,786,176 | | | | 238,472,056 | |
| | | | | | | | |
Increase in net assets from operations | | | 1,029,975,142 | | | | 395,213,159 | |
| | | | | | | | |
From Distributions to Shareholders | | | | | | | | |
Net investment income | | | | | | | | |
Class A | | | (50,660,050 | ) | | | (43,662,721 | ) |
Class B | | | (4,757,769 | ) | | | (4,135,325 | ) |
Class E | | | (1,080,244 | ) | | | (1,093,494 | ) |
Net realized capital gains | | | | | | | | |
Class A | | | (86,020,084 | ) | | | (31,090,576 | ) |
Class B | | | (9,119,057 | ) | | | (3,348,515 | ) |
Class E | | | (1,987,649 | ) | | | (837,277 | ) |
| | | | | | | | |
Total distributions | | | (153,624,853 | ) | | | (84,167,908 | ) |
| | | | | | | | |
Increase (decrease) in net assets from capital share transactions | | | 426,412,881 | | | | (57,951,669 | ) |
| | | | | | | | |
Total increase in net assets | | | 1,302,763,170 | | | | 253,093,582 | |
| | |
Net Assets | | | | | | | | |
Beginning of period | | | 2,670,113,662 | | | | 2,417,020,080 | |
| | | | | | | | |
End of period | | $ | 3,972,876,832 | | | $ | 2,670,113,662 | |
| | | | | | | | |
| | |
Undistributed Net Investment Income | | | | | | | | |
End of period | | $ | 64,684,656 | | | $ | 56,198,397 | |
| | | | | | | | |
Other Information:
Capital Shares
Transactions in capital shares were as follows:
| | | | | | | | | | | | | | | | |
| | | Year Ended
December 31, 2013 | | | Year Ended
December 31, 2012 | |
| | | Shares | | | Value | | | Shares | | | Value | |
Class A | | | | | | | | | | | | | | | | |
Sales | | | 19,058,481 | | | $ | 292,535,588 | | | | 8,475,621 | | | $ | 111,288,078 | |
Shares issued through acquisition | | | 5,422,146 | | | | 80,789,979 | | | | 0 | | | | 0 | |
Reinvestments | | | 9,393,823 | | | | 136,680,134 | | | | 5,741,421 | | | | 74,753,297 | |
Redemptions | | | (31,870,650 | ) | | | (502,615,244 | ) | | | (18,050,623 | ) | | | (239,700,284 | ) |
| | | | | | | | | | | | | | | | |
Net increase (decrease) | | | 2,003,800 | | | $ | 7,390,457 | | | | (3,833,581 | ) | | $ | (53,658,909 | ) |
| | | | | | | | | | | | | | | | |
Class B | | | | | | | | | | | | | | | | |
Sales | | | 22,275,056 | | | $ | 336,307,116 | | | | 2,218,211 | | | $ | 28,902,919 | |
Shares issued through acquisition | | | 29,307,292 | | | | 434,040,998 | | | | 0 | | | | 0 | |
Reinvestments | | | 959,670 | | | | 13,876,826 | | | | 577,903 | | | | 7,483,840 | |
Redemptions | | | (25,604,636 | ) | | | (386,159,224 | ) | | | (2,462,386 | ) | | | (32,395,908 | ) |
| | | | | | | | | | | | | | | | |
Net increase | | | 26,937,382 | | | $ | 398,065,716 | | | | 333,728 | | | $ | 3,990,851 | |
| | | | | | | | | | | | | | | | |
Class D (a) | | | | | | | | | | | | | | | | |
Sales | | | 21,906 | | | $ | 355,383 | | | | 0 | | | $ | 0 | |
Shares issued through acquisition | | | 6,526,741 | | | | 97,117,903 | | | | 0 | | | | 0 | |
Redemptions | | | (5,500,618 | ) | | | (82,134,513 | ) | | | 0 | | | | 0 | |
| | | | | | | | | | | | | | | | |
Net increase | | | 1,048,029 | | | $ | 15,338,773 | | | | 0 | | | $ | 0 | |
| | | | | | | | | | | | | | | | |
Class E | | | | | | | | | | | | | | | | |
Sales | | | 18,020,419 | | | $ | 267,724,346 | | | | 283,045 | | | $ | 3,685,717 | |
Shares issued through acquisition | | | 1,498,859 | | | | 22,243,068 | | | | 0 | | | | 0 | |
Reinvestments | | | 211,725 | | | | 3,067,893 | | | | 148,864 | | | | 1,930,771 | |
Redemptions | | | (19,151,436 | ) | | | (287,417,372 | ) | | | (1,055,811 | ) | | | (13,900,099 | ) |
| | | | | | | | | | | | | | | | |
Net increase (decrease) | | | 579,567 | | | $ | 5,617,935 | | | | (623,902 | ) | | $ | (8,283,611 | ) |
| | | | | | | | | | | | | | | | |
Increase (decrease) derived from capital shares transactions | | | | | | $ | 426,412,881 | | | | | | | $ | (57,951,669 | ) |
| | | | | | | | | | | | | | | | |
| (a) | Commencement of operations was April 26, 2013. |
See accompanying notes to financial statements.
MSF-11
Metropolitan Series Fund
MFS Value Portfolio
Financial Highlights
| | | | | | | | | | | | | | | | | | | | |
| Selected per share data | | | |
| | | Class A | |
| | | Year Ended December 31, | |
| | | 2013 | | | 2012 | | | 2011 | | | 2010 | | | 2009 | |
Net Asset Value, Beginning of Period | | $ | 13.80 | | | $ | 12.23 | | | $ | 12.31 | | | $ | 11.20 | | | $ | 9.27 | |
| | | | | | | | | | | | | | | | | | | | |
Income (Loss) from Investment Operations | | | | | | | | | | | | | | | | | | | | |
Net investment income (a) | | | 0.30 | | | | 0.29 | | | | 0.25 | | | | 0.21 | | | | 0.21 | |
Net realized and unrealized gain (loss) on investments | | | 4.46 | | | | 1.72 | | | | (0.13 | ) | | | 1.06 | | | | 1.72 | |
| | | | | | | | | | | | | | | | | | | | |
Total from investment operations | | | 4.76 | | | | 2.01 | | | | 0.12 | | | | 1.27 | | | | 1.93 | |
| | | | | | | | | | | | | | | | | | | | |
Less Distributions | | | | | | | | | | | | | | | | | | | | |
Distributions from net investment income | | | (0.30 | ) | | | (0.26 | ) | | | (0.20 | ) | | | (0.16 | ) | | | 0.00 | |
Distributions from net realized capital gains | | | (0.51 | ) | | | (0.18 | ) | | | 0.00 | | | | 0.00 | | | | 0.00 | |
| | | | | | | | | | | | | | | | | | | | |
Total distributions | | | (0.81 | ) | | | (0.44 | ) | | | (0.20 | ) | | | (0.16 | ) | | | 0.00 | |
| | | | | | | | | | | | | | | | | | | | |
Net Asset Value, End of Period | | $ | 17.75 | | | $ | 13.80 | | | $ | 12.23 | | | $ | 12.31 | | | $ | 11.20 | |
| | | | | | | | | | | | | | | | | | | | |
Total Return (%) (b) | | | 35.73 | | | | 16.65 | | | | 0.85 | | | | 11.42 | | | | 20.82 | |
| | | | | |
Ratios/Supplemental Data | | | | | | | | | | | | | | | | | | | | |
Gross ratio of expenses to average net assets (%) | | | 0.72 | | | | 0.73 | | | | 0.73 | | | | 0.73 | | | | 0.74 | |
Net ratio of expenses to average net assets (%) (c) | | | 0.58 | | | | 0.60 | | | | 0.61 | | | | 0.63 | | | | 0.66 | |
Ratio of net investment income to average net assets (%) | | | 1.92 | | | | 2.21 | | | | 2.03 | | | | 1.82 | | | | 2.17 | |
Portfolio turnover rate (%) | | | 17 | | | | 16 | | | | 16 | | | | 28 | | | | 26 | |
Net assets, end of period (in millions) | | $ | 3,074.8 | | | $ | 2,363.0 | | | $ | 2,141.2 | | | $ | 2,097.7 | | | $ | 1,876.3 | |
| | | | | | | | | | | | | | | | | | | | |
| | | Class B | |
| | | Year Ended December 31, | |
| | | 2013 | | | 2012 | | | 2011 | | | 2010 | | | 2009 | |
Net Asset Value, Beginning of Period | | $ | 13.70 | | | $ | 12.15 | | | $ | 12.23 | | | $ | 11.13 | | | $ | 9.24 | |
| | | | | | | | | | | | | | | | | | | | |
Income (Loss) from Investment Operations | | | | | | | | | | | | | | | | | | | | |
Net investment income (a) | | | 0.27 | | | | 0.26 | | | | 0.22 | | | | 0.18 | | | | 0.18 | |
Net realized and unrealized gain (loss) on investments | | | 4.41 | | | | 1.70 | | | | (0.13 | ) | | | 1.06 | | | | 1.71 | |
| | | | | | | | | | | | | | | | | | | | |
Total from investment operations | | | 4.68 | | | | 1.96 | | | | 0.09 | | | | 1.24 | | | | 1.89 | |
| | | | | | | | | | | | | | | | | | | | |
Less Distributions | | | | | | | | | | | | | | | | | | | | |
Distributions from net investment income | | | (0.26 | ) | | | (0.23 | ) | | | (0.17 | ) | | | (0.14 | ) | | | 0.00 | |
Distributions from net realized capital gains | | | (0.51 | ) | | | (0.18 | ) | | | 0.00 | | | | 0.00 | | | | 0.00 | |
| | | | | | | | | | | | | | | | | | | | |
Total distributions | | | (0.77 | ) | | | (0.41 | ) | | | (0.17 | ) | | | (0.14 | ) | | | 0.00 | |
| | | | | | | | | | | | | | | | | | | | |
Net Asset Value, End of Period | | $ | 17.61 | | | $ | 13.70 | | | $ | 12.15 | | | $ | 12.23 | | | $ | 11.13 | |
| | | | | | | | | | | | | | | | | | | | |
Total Return (%) (b) | | | 35.38 | | | | 16.32 | | | | 0.64 | | | | 11.18 | | | | 20.59 | |
| | | | | |
Ratios/Supplemental Data | | | | | | | | | | | | | | | | | | | | |
Gross ratio of expenses to average net assets (%) | | | 0.97 | | | | 0.98 | | | | 0.98 | | | | 0.98 | | | | 0.99 | |
Net ratio of expenses to average net assets (%) (c) | | | 0.83 | | | | 0.85 | | | | 0.86 | | | | 0.88 | | | | 0.91 | |
Ratio of net investment income to average net assets (%) | | | 1.68 | | | | 1.96 | | | | 1.79 | | | | 1.58 | | | | 1.92 | |
Portfolio turnover rate (%) | | | 17 | | | | 16 | | | | 16 | | | | 28 | | | | 26 | |
Net assets, end of period (in millions) | | $ | 795.9 | | | $ | 250.2 | | | $ | 217.7 | | | $ | 197.8 | | | $ | 145.6 | |
Please see following page for Financial Highlights footnote legend.
See accompanying notes to financial statements.
MSF-12
Metropolitan Series Fund
MFS Value Portfolio
Financial Highlights
| | | | |
| Selected per share data | | | |
| | | Class D | |
| | | Period Ended
December 31,
2013(d) | |
Net Asset Value, Beginning of Period | | $ | 14.88 | |
| | | | |
Income (Loss) from Investment Operations | | | | |
Net investment income (a) | | | 0.20 | |
Net realized and unrealized gain on investments | | | 2.63 | |
| | | | |
Total from investment operations | | | 2.83 | |
| | | | |
Net Asset Value, End of Period | | $ | 17.71 | |
| | | | |
Total Return (%) (b) | | | 19.02 | (e) |
| |
Ratios/Supplemental Data | | | | |
Gross ratio of expenses to average net assets (%) | | | 0.82 | (f) |
Net ratio of expenses to average net assets (%) (c) | | | 0.68 | (f) |
Ratio of net investment income to average net assets (%) | | | 1.80 | (f) |
Portfolio turnover rate (%) | | | 17 | |
Net assets, end of period (in millions) | | $ | 18.6 | |
| | | | | | | | | | | | | | | | | | | | |
| | | Class E | |
| | | Year Ended December 31, | |
| | | 2013 | | | 2012 | | | 2011 | | | 2010 | | | 2009 | |
Net Asset Value, Beginning of Period | | $ | 13.73 | | | $ | 12.18 | | | $ | 12.25 | | | $ | 11.15 | | | $ | 9.24 | |
| | | | | | | | | | | | | | | | | | | | |
Income (Loss) from Investment Operations | | | | | | | | | | | | | | | | | | | | |
Net investment income (a) | | | 0.28 | | | | 0.27 | | | | 0.23 | | | | 0.19 | | | | 0.19 | |
Net realized and unrealized gain (loss) on investments | | | 4.45 | | | | 1.70 | | | | (0.12 | ) | | | 1.06 | | | | 1.72 | |
| | | | | | | | | | | | | | | | | | | | |
Total from investment operations | | | 4.73 | | | | 1.97 | | | | 0.11 | | | | 1.25 | | | | 1.91 | |
| | | | | | | | | | | | | | | | | | | | |
Less Distributions | | | | | | | | | | | | | | | | | | | | |
Distributions from net investment income | | | (0.28 | ) | | | (0.24 | ) | | | (0.18 | ) | | | (0.15 | ) | | | 0.00 | |
Distributions from net realized capital gains | | | (0.51 | ) | | | (0.18 | ) | | | 0.00 | | | | 0.00 | | | | 0.00 | |
| | | | | | | | | | | | | | | | | | | | |
Total distributions | | | (0.79 | ) | | | (0.42 | ) | | | (0.18 | ) | | | (0.15 | ) | | | 0.00 | |
| | | | | | | | | | | | | | | | | | | | |
Net Asset Value, End of Period | | $ | 17.67 | | | $ | 13.73 | | | $ | 12.18 | | | $ | 12.25 | | | $ | 11.15 | |
| | | | | | | | | | | | | | | | | | | | |
Total Return (%) (b) | | | 35.63 | | | | 16.39 | | | | 0.81 | | | | 11.25 | | | | 20.67 | |
| | | | | |
Ratios/Supplemental Data | | | | | | | | | | | | | | | | | | | | |
Gross ratio of expenses to average net assets (%) | | | 0.87 | | | | 0.88 | | | | 0.88 | | | | 0.88 | | | | 0.89 | |
Net ratio of expenses to average net assets (%) (c) | | | 0.73 | | | | 0.75 | | | | 0.76 | | | | 0.78 | | | | 0.81 | |
Ratio of net investment income to average net assets (%) | | | 1.81 | | | | 2.05 | | | | 1.85 | | | | 1.67 | | | | 2.03 | |
Portfolio turnover rate (%) | | | 17 | | | | 16 | | | | 16 | | | | 28 | | | | 26 | |
Net assets, end of period (in millions) | | $ | 83.5 | | | $ | 57.0 | | | $ | 58.1 | | | $ | 69.9 | | | $ | 72.5 | |
| (a) | Per share amounts based on average shares outstanding during the period. |
| (b) | Total return does not reflect any insurance, sales, separate account or administrative charges of variable annuity or life insurance contracts or any additional expenses that contract owners may bear under their variable contracts. If these charges were included, the returns would be lower. |
| (c) | Net ratio of expenses to average net assets includes the effect of the management fee waivers as detailed in Note 6 of the Notes to Financial Statements. |
| (d) | Commencement of operations was April 26, 2013. |
| (e) | Periods less than one year are not computed on an annualized basis. |
| (f) | Computed on an annualized basis. |
See accompanying notes to financial statements.
MSF-13
Metropolitan Series Fund
MFS Value Portfolio
Notes to Financial Statements—December 31, 2013
1. Organization
Metropolitan Series Fund (the “Trust”) is organized as a Delaware statutory trust and registered under the Investment Company Act of 1940, as amended (the “1940 Act”), as an open-end management investment company. The Trust is currently comprised of thirty series, each of which operates as a distinct investment vehicle of the Trust. The portfolio included in this report is MFS Value Portfolio (the “Portfolio”), which is diversified. Shares in the Portfolio are not offered directly to the general public and are currently available only to separate accounts established by Metropolitan Life Insurance Company (“MetLife”) and other affiliated life insurance companies.
The Portfolio has registered and offers four classes of shares: Class A, B, D, and E shares. Shares of each Class of the Portfolio represent an equal pro rata interest in the Portfolio and generally give the shareholder the same voting, dividend, liquidation, and other rights. Investment income, realized and unrealized capital gains and losses, the common expenses of the Portfolio, and certain Portfolio-level expense reductions, if any, are allocated on a pro rata basis to each Class based on the relative net assets of each Class to the net assets of the Portfolio. Each Class of shares differs in its respective distribution plan and such distribution expenses are allocated to that Class.
2. Significant Accounting Policies
The preparation of financial statements in conformity with accounting principles generally accepted in the United States of America (“GAAP”) requires management to make estimates and assumptions that affect the reported amounts of assets and liabilities and disclosure of contingent assets and liabilities as of the date of the financial statements and the reported amounts of income and expenses during the reporting period. Actual results could differ from those estimates. In the preparation of these financial statements, management has evaluated events and transactions subsequent to December 31, 2013 through the date the financial statements were issued.
The following is a summary of significant accounting policies consistently followed by the Portfolio in the preparation of its financial statements.
Investment Valuation and Fair Value Measurements - Debt securities (other than short term obligations with a remaining maturity of sixty days or less), including corporate, convertible and municipal bonds and notes; obligations of the U.S. treasury and U.S. government agencies; sovereign issues; floating rate loans; and non-U.S. bonds, are generally valued on the basis of evaluated or composite bid quotations obtained from independent pricing services and/or brokers and dealers selected by MetLife Advisers, LLC (“MetLife Advisers” or the “Adviser”), an affiliate of MetLife, Inc., pursuant to authorization of the Board of Trustees of the Trust (the “Board” or “Trustees”). Such quotations utilize matrix pricing, which considers observable inputs including, among other things, issuer details, maturity dates, interest rates, yield curves, rates of prepayment, credit risks/spreads, default rates, reported trades, broker dealer quotes and quoted prices for similar securities. Securities that use similar valuation techniques and inputs as described above are generally categorized as Level 2 within the fair value hierarchy.
Mortgage and asset-backed securities are usually issued as separate tranches, or classes, of securities within each deal. These securities are also generally valued on the basis of evaluated or composite bid quotations obtained from independent pricing services and/or brokers and dealers selected by the Adviser pursuant to authorization of the Board. The pricing models for these securities usually consider tranche-level attributes, estimated cash flows and market-based yield spreads for each tranche and current market data, and incorporate deal collateral performance, as available. Mortgage and asset-backed securities that use similar valuation techniques and inputs as described above are generally categorized as Level 2 within the fair value hierarchy.
Short term obligations with a remaining maturity of sixty days or less are generally valued at amortized cost, which approximates fair market value, and are generally categorized as Level 2 within the fair value hierarchy.
Domestic and foreign equity securities, such as common stock, exchange-traded funds, rights, warrants, and preferred stock, that are traded on a securities exchange, are generally valued at their last sale price on the exchange or market in which they are principally traded on the valuation date, or, if no sales occurred on that day, at the last reported bid price. Equity securities traded over-the-counter are generally valued at the last reported sale price. Valuation adjustments may be applied to certain foreign equity securities that are traded solely on foreign exchanges that close before the close of the U.S. market to account for the market movement between the close of the foreign exchanges and the close of the U.S. market. The Portfolio may use a systematic fair valuation model provided by an independent third party to value securities principally traded in these foreign markets in order to adjust for possible stale pricing that may occur between the close of the foreign exchanges and the time of the Portfolio valuation. Foreign equity securities using these valuation adjustments are generally categorized as Level 2 within the fair value hierarchy. Equity securities that are actively traded, and have no valuation adjustments applied, are categorized as Level 1 within the fair value hierarchy. Other equity securities traded on inactive markets, or valued in reference to similar instruments traded on active markets, are generally categorized as Level 2 within the fair value hierarchy.
MSF-14
Metropolitan Series Fund
MFS Value Portfolio
Notes to Financial Statements—December 31, 2013—(Continued)
Investments in registered open-end management investment companies are valued at reported net asset value per share on the valuation date and are categorized as Level 1 within the fair value hierarchy.
Forward foreign currency exchange contracts are valued through an independent pricing service based on the mean between closing bid and ask prices of the forward currency rates in the London foreign exchange markets on a daily basis as provided by a reliable bank or dealer. These contracts are generally categorized as Level 2 within the fair value hierarchy.
Options, whether on securities, indices, futures contracts, or otherwise, traded on exchanges are valued at the last sale price available as of the close of business on the valuation date or, if there is no such price available, at the mean between the last reported bid and ask prices. These types of options are categorized as Level 1 within the fair value hierarchy. Futures contracts, which are traded on commodity exchanges, are valued at their closing prices as of the close of such exchanges and are categorized as Level 1 within the fair value hierarchy.
Options and futures contracts that are traded over-the-counter are generally valued on the basis of quotations provided by broker-dealers or prices provided by pricing service providers who use a series of techniques, including simulation pricing models, to determine the value of the contracts. The pricing models use inputs that are observed from actively quoted markets such as issuer details, indices, spreads, interest rates, yield curves, credit curves, measures of volatility and exchange rates. These contracts are generally categorized as Level 2 within the fair value hierarchy.
If no current market value quotation or other observable inputs are readily available or market value quotations are deemed to be unreliable for a security, the fair value of the security will be determined in accordance with procedures approved by and under the general supervision of the Board. In such a circumstance, the Board has delegated the determination of the fair value of a security to a Valuation Committee (“Committee”) of MetLife Advisers. The Committee provides general pricing oversight and fair value pricing determinations related to portfolio securities and meets on a regular basis to review reports relating to the valuation of the securities in the Portfolio. The Board has delegated to State Street Bank and Trust Company, the Trust’s custodian (“custodian”), the responsibility for calculating the net asset values (“NAVs”) of the Trust’s Portfolios. The Committee is responsible for overseeing the calculation of the NAVs of the Portfolios by the custodian. The Committee also periodically reviews pricing vendors, including the vendor providing fair value pricing for the Portfolio’s foreign securities, and is responsible for overseeing the correction of pricing errors and addressing other pricing issues that arise in the ordinary course of business, such as making real-time fair value determinations, as necessary.
No single standard for determining the fair value of a security can be set forth because fair value depends upon the facts and circumstances with respect to each security. Information relating to any relevant factors may be obtained by the Committee from any appropriate source, including the subadviser of the Portfolio, the custodian, a pricing service, market maker and/or broker for such security or the issuer. Appropriate methodologies for determining fair value under particular circumstances may include: matrix pricing, comparisons of securities with comparable characteristics, value based on multiples of earnings, discount from market price of similar marketable securities or a combination of these and other methods. The Committee maintains a detailed report tracking each fair-valued security that compares the fair value price to the next available trade, vendor or broker price, and provides information on how close the fair value price was to the next quoted price. The Committee reviews a summary of such report monthly. On a quarterly basis, the Board is provided with the following for consideration and ratification or adjustment: (1) a memorandum summarizing the actions taken by the Committee in the prior quarter; and (2) a list of the Portfolio’s securities as of the most recent quarter-end for which market quotations were not readily available.
Investment Transactions and Related Investment Income - Portfolio security transactions are recorded on the trade date. Dividend income is recorded on the ex-dividend date or, for certain foreign securities, when notified. Interest income, which includes amortization of premium and accretion of discount on debt securities, is recorded on the accrual basis. Realized gains and losses on investments are determined on the identified cost basis, which is the same basis used for federal income tax purposes. Foreign income and foreign capital gains on some foreign securities may be subject to foreign taxes, which are accrued as applicable. These foreign taxes have been provided for in accordance with the Portfolio’s understanding of the applicable countries’ tax rules and rates.
Foreign Currency Translation - The books and records of the Portfolio are maintained in U.S. dollars. The values of securities, currencies, and other assets and liabilities denominated in currencies other than the U.S. dollar are translated into U.S. dollars based upon foreign exchange rates prevailing at the end of the period. Purchases and sales of investment securities, income, and expenses are translated on the respective dates of such transactions. Because the values of investment securities are translated at the foreign exchange rates prevailing at the end of the period, that portion of the results of operations arising from changes in exchange rates and that portion of the results of operations reflecting fluctuations arising from changes in market prices of the investment securities are not separated. Such fluctuations are included in the net realized and unrealized gain or loss on investments.
Net realized foreign exchange gains or losses arise from activity in forward foreign currency exchange contracts, sales of foreign currency, currency gains or losses realized between the trade and settlement dates on securities transactions, and the difference between the amounts of dividends, interest, and foreign withholding taxes recorded by the Portfolio and the U.S. dollar equivalent of
MSF-15
Metropolitan Series Fund
MFS Value Portfolio
Notes to Financial Statements—December 31, 2013—(Continued)
the amounts actually received or paid by the Portfolio. Net unrealized foreign exchange gains and losses arise from changes in the value of assets and liabilities, other than investment securities, resulting from changes in foreign exchange rates.
Income Taxes - It is the Portfolio’s policy to comply with the requirements of the Internal Revenue Code of 1986, as amended, and regulations thereunder, applicable to regulated investment companies and to distribute, with respect to each taxable year, all of its taxable income to shareholders. Therefore, no federal income tax provision is required. The Portfolio files U.S. federal tax returns. No income tax returns are currently under examination. The Portfolio’s federal tax returns for the prior three fiscal years remain subject to examination by the Internal Revenue Service. As of December 31, 2013, the Portfolio had no uncertain tax positions that would require financial statement recognition, or de-recognition or disclosure.
Dividends and Distributions to Shareholders - The Portfolio records dividends and distributions on the ex-dividend date. Net realized gains from security transactions (if any) are generally distributed annually to shareholders. The timing and characterization of certain income and capital gains distributions are determined in accordance with federal tax regulations that may differ from GAAP. Permanent book and tax basis differences relating to shareholder distributions will result in reclassification between under/over distributed net investment income, accumulated net realized gains/losses, and paid-in surplus. Book-tax differences are primarily due to foreign currency transactions, distribution re-designations, broker commission recapture reclasses, merger related adjustments and convertible preferred stock adjustments. These adjustments have no impact on net assets or the results of operations.
Securities Lending - The Portfolio may lend its portfolio securities to certain qualified brokers who borrow securities in order to complete certain securities transactions. By lending its portfolio securities, the Portfolio attempts to increase its net investment income through the receipt of income on collateral held from securities on loan. Any gain or loss in the market price of the loaned securities that might occur and any interest earned or dividends declared during the term of the loan would accrue to the account of the Portfolio.
The Trust has entered into a securities lending arrangement with the custodian. Under this arrangement, the custodian is authorized to loan portfolio securities on the Portfolio’s behalf. In exchange, the Portfolio receives either cash or securities as collateral against the loaned securities. The Portfolio receives collateral at least equal to 102% of the market value of the loaned securities (105% for foreign equity securities), at each loan’s inception. Collateral representing at least 100% of the market value of the loaned securities must be maintained for the duration of the loan. A liability for cash collateral is reflected on the Statement of Assets and Liabilities, and is categorized as Level 2 within the fair value hierarchy. Cash collateral is generally invested in the State Street Navigator Securities Lending MET Portfolio (the “Navigator Portfolio”), a series of the State Street Navigator Securities Lending Trust that is managed by an affiliate of the custodian. The Navigator Portfolio is a registered money market fund that invests in a variety of high-quality, U.S. dollar-denominated instruments. If the market value of the collateral at the close of trading on a business day is less than 100% of the market value of the loaned securities at the close of trading on that day, the borrower shall be required to deliver, by the close of business on the following business day, an additional amount of collateral, so that the total amount of posted collateral is equal to at least 100% of the market value of all the loaned securities as of such preceding day. A portion of net income (income after the deduction of expenses and fees of the Navigator Portfolio) on the collateral is rebated to the borrower of the securities and the remainder is split between the custodian and the Portfolio. On loans collateralized by U.S. Treasuries, a fee is received from the borrower and is allocated between the Portfolio and the custodian. The risks associated with lending portfolio securities include, but are not limited to, possible delays in receiving additional collateral or in the recovery of the loaned securities, possible loss of rights in the collateral should the borrower fail financially, as well as risk of loss in the value of the collateral or the value of the investments made with the collateral. The lending agent has agreed to indemnify the Portfolio in the case of default of any securities borrower. Income received by the Portfolio in securities lending transactions during the year ended December 31, 2013 is reflected as Securities lending income on the Statement of Operations. Any outstanding loans by the Portfolio at December 31, 2013 are disclosed in the footnotes to the Schedule of Investments.
Repurchase Agreements - The Portfolio may enter into repurchase agreements, under the terms of a Master Repurchase Agreement, with selected commercial banks and broker-dealers, under which the Portfolio acquires securities as collateral and agrees to resell the securities at an agreed upon time and at an agreed-upon price. The Portfolio, through the custodian or a subcustodian, receives delivery of the underlying securities collateralizing any repurchase agreements. The Portfolio requires the custodian to take possession, to have legally segregated in the Federal Reserve Book Entry System, or to have segregated within the custodian’s vault, all securities held as collateral for repurchase agreements. It is the Portfolio’s policy that the market value of the collateral be at least equal to 100% of the repurchase price in the case of a repurchase agreement of one-day duration and at least equal to 102% of the repurchase price in the case of all other repurchase agreements. In the event of default or failure by a party to perform an obligation in connection with any repurchase transaction, the Master Repurchase Agreement gives the non-defaulting party the right to set-off claims and to apply property held by it in connection with any repurchase transaction against obligations owed to it.
Directed Brokerage Agreement - The Trust has entered into a directed brokerage arrangement with State Street Global Markets (“SSGM”). Under this arrangement, the Portfolio directs certain trades to SSGM in return for a recapture credit. SSGM issues a cash rebate to the Portfolio. Amounts paid to the Portfolio are shown separately as broker commission recapture on the Statement of Operations of the Portfolio. Additionally, these amounts have been excluded from the calculation of the net ratio of expenses to average net assets presented in the Financial Highlights for each share class.
MSF-16
Metropolitan Series Fund
MFS Value Portfolio
Notes to Financial Statements—December 31, 2013—(Continued)
3. Investments in Derivative Instruments
Futures Contracts - The Portfolio may buy and sell futures contracts as a hedge, to maintain investment exposure to a target asset class or to enhance return. The Portfolio may be subject to fluctuations in equity prices, interest rates, commodity prices, and foreign currency exchange rates in the normal course of pursuing its investment objective. Futures contracts are standardized agreements to buy or sell a security, or deliver a final cash settlement price in connection with an index, interest rate, currency, or other asset. The Portfolio must deposit an amount (“initial margin”) equal to a certain percentage of the face value of the futures contract. The initial margin may be in the form of cash or securities, which is returned when the Portfolio’s obligations under the contract have been satisfied. If cash is deposited as the initial margin, it is shown as cash collateral on the Statement of Assets and Liabilities. Futures contracts are marked-to-market daily, and subsequent payments (“variation margin”) are made or received by the Portfolio depending on whether unrealized gains or losses are incurred. These amounts are reflected as receivables or payables on the Statement of Assets and Liabilities and as a component of net change in unrealized appreciation/depreciation on the Statement of Operations. When the contract is closed or expires, the Portfolio records a realized gain or loss equal to the difference between the value of the contract at the time it was opened and the value at the time it was closed. Risks of entering into futures contracts (and related options) include the possibility that the market for these instruments may be illiquid and that a change in the value of the contract or option may not correlate perfectly with changes in the value of the underlying instrument. Futures contracts are exchange-traded and the exchange’s clearinghouse, as counterparty to all exchange-traded futures, guarantees the futures contracts against default. For over-the-counter futures the Portfolio’s ability to terminate the positions may be more limited than in the case of exchange-traded positions and may also involve the risk that securities dealers participating in such transactions would fail to meet their obligations to the Portfolio.
During the year ended December 31, 2013, the Portfolio entered into equity index futures contracts which were subject to equity price risk. During the period April 16, 2013 through April 17, 2013, the Portfolio had bought and sold $54,445,149 in equity index futures contracts. At December 31, 2013, the Portfolio did not have any open futures contracts. For the year ended December 31, 2013, the Portfolio had realized losses in the amount of $(589,192) which are shown under net realized loss on futures contracts in the Statement of Operations.
4. Certain Risks
Market Risk: In the normal course of business, the Portfolio invests in securities and enters into transactions where risks exist due to fluctuations in the market (market risk) or failure of the other party to a transaction to perform (credit and counterparty risk). The value of securities held by the Portfolio may decline in response to certain events, including those directly involving the companies whose securities are owned by the Portfolio; conditions affecting the general economy; overall market changes; local, regional or global political, social or economic instability; currency, interest rate, and price fluctuations.
Credit and Counterparty Risk: The Portfolio may be exposed to counterparty risk, or the risk that an entity with which the Portfolio has unsettled or open transactions may default. The potential loss could exceed the value of the financial assets and liabilities recorded in the financial statements. Financial assets that potentially expose the Portfolio to credit and counterparty risk consist principally of cash due from counterparties and investments. The Portfolio manages counterparty risk by entering into agreements only with counterparties that it believes have the financial resources to honor their obligations and by monitoring the financial stability of those counterparties. The Portfolio’s investment adviser attempts to mitigate counterparty risk by (i) periodically assessing the creditworthiness of its trading partners, (ii) monitoring and/or limiting the amount of its net exposure to each individual counterparty based on its assessment, and (iii) requiring collateral from the counterparty for certain transactions. In order to preserve certain safeguards for non-standard settlement trades, the Portfolio restricts its exposure to credit and counterparty losses by entering into master netting agreements with counterparties (approved brokers) with whom it undertakes a significant volume of transactions. Master Agreements govern the terms of certain transactions, and reduce the counterparty risk associated with relevant transactions by specifying credit protection mechanisms and providing standardization that improves legal certainty. Master Agreements can also help limit counterparty risk by specifying collateral posting arrangements at pre-arranged exposure levels. Repurchase agreements are primarily executed under Global Master Repurchase Agreements (“GMRAs”) or Master Repurchase Agreements (“MRAs”), which provide the rights to set-off. Each repurchase agreement is initially collateralized at the transaction level. In the event of default, the total market value exposure will be offset against collateral exchanged to date, which would result in a net receivable/(payable) that would be due from/to the counterparty. Securities pledged as collateral are noted in the Schedule of Investments.
Additional risks associated with each type of investment are described above within the respective security type notes. The Portfolio’s prospectus includes a discussion of the principal risks of investing in the Portfolio.
MSF-17
Metropolitan Series Fund
MFS Value Portfolio
Notes to Financial Statements—December 31, 2013—(Continued)
5. Investment Transactions
Aggregate cost of purchases and proceeds of sales of investment securities, excluding short-term securities, for the year ended December 31, 2013 were as follows:
| | | | | | | | | | | | |
Purchases | | | Sales | |
U.S. Government | | Non U.S. Government | | | U.S. Government | | | Non U.S. Government | |
| $0 | | $ | 600,354,339 | | | $ | 0 | | | $ | 845,513,991 | |
The Portfolio engaged in security transactions with other accounts managed by Massachusetts Financial Services Co. that amounted to $533,407 in purchases of investments and $29,857,646 in sales of investment, which is included above.
During the year ended December 31, 2013, the Portfolio engaged in security transactions with other affiliated portfolios. These amounted to $25,137,457 in purchases transactions, which are included above.
With respect to the Portfolio’s mergers with Met Investors Series Trust Met/Franklin Mutual Shares Portfolio and Metropolitan Series Fund FI Value Leaders Portfolio (see Note 9) on April 26, 2013, the Portfolio acquired long-term equity securities with a cost of $582,939,843 that are not included in the above non-U.S. Government purchases.
6. Investment Management Fees and Other Transactions with Affiliates
Investment Management Agreement - MetLife Advisers is the investment adviser to the Portfolio. The Trust has entered into an investment management agreement with MetLife Advisers with respect to the Portfolio. For providing investment management services to the Portfolio, MetLife Advisers receives monthly compensation at the annual rates:
| | | | | | |
Management
Fees earned by
MetLife Advisers
for the year ended
December 31, 2013 | | % per annum | | | Average daily net assets |
| $24,204,741 | | | 0.750 | % | | Of the first $250 million |
| | | 0.700 | % | | Of the next $2.25 billion |
| | | 0.675 | % | | Of the next $2.5 billion |
| | | 0.650 | % | | On amounts in excess of $5 billion |
Certain officers and trustees of the Trust may also be officers of MetLife Advisers; however, such officers and trustees receive no compensation from the Trust.
MetLife Advisers has entered into an investment subadvisory agreement with respect to the Portfolio. Massachusetts Financial Services Company is compensated by MetLife Advisers to provide subadvisory services for the Portfolio.
Management Fee Waivers - Pursuant to an expense agreement, MetLife Advisers has agreed, for the period April 29, 2013 through April 27, 2014, to reduce its advisory fees set out above under “Investment Management Agreement” for each class of the Portfolio as follows:
| | |
% per annum | | Average daily net assets |
| 0.100% | | On the first $200 million |
| 0.125% | | On the next $50 million |
| 0.075% | | On the next $1.25 billion |
| 0.200% | | On the next $1 billion |
| 0.175% | | On the next $2.5 billion |
| 0.150% | | On amounts in excess of $5 billion |
An identical expense agreement was in place for the period April 29, 2012 through April 28, 2013. Amounts waived for the year ended December 31, 2013 are shown as management fee waivers in the Statement of Operations.
Transfer Agency Agreement - MetLife serves as the transfer agent for the Trust. MetLife receives no fees for its services to the Trust under the transfer agency agreement.
Distribution and Service Fees - The Trust has a distribution agreement with MetLife Investors Distribution Company (“MIDC” or the “Distributor”) in which MIDC serves as the distributor for the Portfolio’s Class A, B, D, and E Shares. MIDC is a wholly-owned subsidiary of MetLife Investors Group, Inc., an affiliate of the Adviser. The Trust has also adopted a Distribution and Service Plan under Rule 12b-1 of the 1940 Act for the Portfolio’s Class B, D, and E Shares. Under the Distribution and Service Plan, the Class B, D, and E Shares of the Portfolio pay a fee to compensate the Insurance Companies (or their affiliates) and other broker-dealers and financial intermediaries involved in the offer and sale of Portfolio shares for promoting or selling and servicing the Class B, D, and E Shares. The fees under the Distribution and Service Plan for each class of the Portfolio’s shares are calculated as a percentage of the
MSF-18
Metropolitan Series Fund
MFS Value Portfolio
Notes to Financial Statements—December 31, 2013—(Continued)
Portfolio’s average daily net assets that are attributable to that Class. Currently, the fee is 0.25% per year for Class B Shares, 0.10% per year for Class D Shares, and 0.15% per year for Class E Shares. Amounts incurred by the Portfolio for the year ended December 31, 2013 are shown as Distribution and service fees in the Statement of Operations.
Deferred Trustee Compensation - Each Trustee who is not currently an employee of the Adviser or any of its affiliates receives compensation from the Trust for his or her service to the Trust. A deferred compensation plan (the “Plan”) is available to the Trustees on a voluntary basis. Deferred amounts remain in the Trust until distributed in accordance with the provisions of the Plan. The value of a participating Trustee’s deferral account is based on theoretical investments of deferred amounts, on the normal payment dates in certain portfolios of the Trust or Metropolitan Series Fund, an affiliate of the Trust, as designated by the participating Trustee. Changes in the value of participants’ deferral accounts are reflected as Trustees’ fees and expenses in the Statement of Operations. The portion of the accrued obligations allocated to the Portfolio under the Plan is reflected as Deferred trustees’ fees in the Statement of Assets and Liabilities.
7. Contractual Obligations
Under the Trust’s organizational documents, its officers and Trustees may be indemnified against certain liabilities and expenses arising out of the performance of their duties to the Trust. Additionally, the Trust has a variety of indemnification obligations under contracts with its service providers. The Trust’s maximum exposure under these arrangements is unknown, as this would involve future claims that may be made against the Trust that have not yet occurred.
8. Income Tax Information
The tax character of distributions paid for the periods ended December 31, 2013 and 2012 was as follows:
| | | | | | | | | | | | | | | | | | | | |
Ordinary Income | | | Long-Term Capital Gain | | | Total | |
2013 | | 2012 | | | 2013 | | | 2012 | | | 2013 | | | 2012 | |
| $64,176,070 | | $ | 48,891,540 | | | $ | 89,448,783 | | | $ | 35,276,368 | | | $ | 153,624,853 | | | $ | 84,167,908 | |
As of December 31, 2013, the components of distributable earnings (accumulated losses) on a federal income tax basis were as follows:
| | | | | | | | | | | | | | | | |
Undistributed
Ordinary
Income | | Undistributed
Long-Term
Capital Gain | | | Net
Unrealized
Appreciation | | | Loss Carryforwards | | | Total | |
$64,802,989 | | $ | 184,975,474 | | | $ | 1,217,957,734 | | | $ | — | | | $ | 1,467,736,197 | |
The Portfolio utilizes the provisions of the federal income tax laws that provide for the carryforward of capital losses for prior years, offsetting such losses against any future realized capital gains. Under the Regulated Investment Company Modernization Act of 2010 (the “Act”), net capital losses recognized after December 22, 2010 may be carried forward indefinitely, and their character is retained as short-term and/or long-term losses. Previously, net capital losses were carried forward for up to eight years and treated as shortterm losses. As a transition rule, the Act requires that post-enactment net capital losses be used before pre-enactment net capital losses.
During the year ended December 31, 2013, the Portfolio utilized capital loss carryforwards of $118,206,385.
As of December 31, 2013 the Portfolio had no post-enactment accumulated capital losses and no pre-enactment accumulated capital loss carryforwards.
9. Acquisition
At the close of business on April 26, 2013, the Portfolio, with aggregate Class A, Class B, Class D, and Class E net assets of $2,665,493,738, $280,252,781, $100 and $ 61,036,104, respectively, acquired all the assets and liabilities of both FI Value Leaders Portfolio of the Metropolitan Series Fund (“FI Value Leaders”) and Met/Franklin Mutual Shares Portfolio of the Met Investors Series Trust (“Met/Franklin”).
The acquisitions were accomplished by a tax-free exchange of shares of the Portfolio in the following amounts:
| | | | | | | | | | | | | | | | |
Portfolio | | Share Class | | | Shares Prior to
Acquisition | | | Net Assets Prior to
Acquisition | | | Shares Issued By
Portfolio | |
FI Value Leaders | | | Class A | | | | 480,168 | | | $ | 77,606,786 | | | | 5,208,509 | |
FI Value Leaders | | | Class B | | | | 359,540 | | | | 57,986,718 | | | | 3,915,376 | |
FI Value Leaders | | | Class D | | | | 601,549 | | | | 97,117,903 | | | | 6,526,741 | |
FI Value Leaders | | | Class E | | | | 137,895 | | | | 22,243,068 | | | | 1,498,859 | |
Met/Franklin | | | Class A | | | | 672,085 | | | | 3,183,193 | | | | 213,637 | |
Met/Franklin | | | Class B | | | | 80,321,180 | | | | 376,054,280 | | | | 25,391,916 | |
MSF-19
Metropolitan Series Fund
MFS Value Portfolio
Notes to Financial Statements—December 31, 2013—(Continued)
Each shareholder of FI Value Leaders and Met/Franklin received shares of the Portfolio with the same class designation and at the respective Class NAV, as determined at the close of business on April 26, 2013. The transaction was part of a restructuring designed to eliminate the offering of overlapping Portfolios in the MetLife, Inc. families of funds with similar investment objectives and similar investment strategies that serve as funding vehicles for insurance contracts that are offered by affiliates of MetLife. Some of the investments held by the FI Value Leaders and Met/Franklin Portfolios may have been purchased or sold prior to the acquisition for the purpose of complying with the anticipated investment policies or limitations of the Portfolio after the acquisition. If such purchases or sales occurred, the transaction costs were borne by the FI Value Leaders and Met/Franklin Portfolios. All other costs associated with the merger were not borne by the shareholders of any of the Portfolios.
FI Value Leaders’ net assets on April 26, 2013 were $77,606,786, $57,986,718, 97,117,903 and $22,243,068 for Classes A, B, D and E shares, respectively, including investments valued at $254,942,635 with a cost basis of $240,096,052. Met/Franklin’s net assets on April 26, 2013 were $3,183,193 and $376,054,280 for Class A and Class B shares, respectively, including investments valued at $377,937,821 with a cost basis of $360,776,791. For financial reporting purposes, assets received, liabilities assumed, and shares issued by the Portfolio were recorded at fair value; however, the cost basis of the investments received by the Portfolio from FI Value Leaders and Met/Franklin were carried forward to align ongoing reporting of the Portfolio’s realized and unrealized gains and losses with amounts distributable to shareholders for tax purposes. The Portfolio acquired $118,206,385 in capital loss carry forwards from FI Value Leaders.
The aggregate net assets of the Portfolio immediately after the acquisition were $3,640,974,671, which included $14,846,583 and $17,158,366 of acquired unrealized appreciation on investments and foreign currency transactions from FI Value Leaders and Met/Franklin, respectively.
Assuming the acquisition had been completed on January 1, 2013, the Portfolio’s pro-forma results of operations for the year ended December 31, 2013 are as follows:
| | | | |
| | | | |
Net investment income | | $ | 70,330,838 | (a) |
Net realized and unrealized gain on investments and foreign currency transactions | | | 1,070,173,929 | (b) |
| | | | |
Net increase in net assets from operations | | $ | 1,140,504,767 | |
| | | | |
Because the combined investment portfolios have been managed as a single integrated portfolio since the acquisition was completed, it is not practicable to separate the amounts of revenue and earnings of FI Value Leaders and Met/Franklin that have been included in the Portfolio’s Statement of Operations since April 26, 2013.
| (a) | $65,212,083 net investment income as reported plus $1,232,581 from FI Value Leaders pre-merger net investment income, plus $2,846,657 from Met/Franklin pre-merger net investment income, plus $889,131 in lower net advisory fees, plus $150,386 of pro-forma eliminated other expenses. |
| (b) | $1,229,949,996 unrealized appreciation as reported minus $638,723,826 pro-forma December 31, 2012 unrealized appreciation, plus $304,976,883 net realized gain as reported, plus $67,063,501 and $106,907,375 in net realized gain from FI Value Leaders and Met/Franklin pre-merger, respectively. |
MSF-20
Metropolitan Series Fund
MFS Value Portfolio
Report of Independent Registered Public Accounting Firm
To the Shareholders of MFS Value Portfolio and the Board of Trustees of Metropolitan Series Fund:
We have audited the accompanying statement of assets and liabilities, including the schedule of investments, of MFS Value Portfolio, one of the portfolios constituting Metropolitan Series Fund, (the “Trust”) as of December 31, 2013, and the related statement of operations for the year then ended, the statements of changes in net assets for each of the two years in the period then ended, and the financial highlights for each of the five years in the period then ended. These financial statements and financial highlights are the responsibility of the Trust’s management. Our responsibility is to express an opinion on these financial statements and financial highlights based on our audits.
We conducted our audits in accordance with the standards of the Public Company Accounting Oversight Board (United States). Those standards require that we plan and perform the audit to obtain reasonable assurance about whether the financial statements and financial highlights are free of material misstatement. The Trust is not required to have, nor were we engaged to perform, an audit of its internal control over financial reporting. Our audits included consideration of internal control over financial reporting as a basis for designing audit procedures that are appropriate in the circumstances, but not for the purpose of expressing an opinion on the effectiveness of the Trust’s internal control over financial reporting. Accordingly, we express no such opinion. An audit also includes examining, on a test basis, evidence supporting the amounts and disclosures in the financial statements, assessing the accounting principles used and significant estimates made by management, as well as evaluating the overall financial statement presentation. Our procedures included confirmation of securities owned as of December 31, 2013, by correspondence with the custodian and brokers; where replies were not received from brokers, we performed other auditing procedures. We believe that our audits provide a reasonable basis for our opinion.
In our opinion, the financial statements and financial highlights referred to above present fairly, in all material respects, the financial position of the MFS Value Portfolio of Metropolitan Series Fund, as of December 31, 2013, the results of its operations for the year then ended, the changes in its net assets for each of the two years in the period then ended, and the financial highlights for each of the five years in the period then ended, in conformity with accounting principles generally accepted in the United States of America.
Deloitte & Touche LLP
Boston, Massachusetts
February 26, 2014
MSF-21
Metropolitan Series Fund
Trustees and Officers of Metropolitan Series Fund
The Trustees and executive officers of the Trust, their ages and their principal occupations during the past five years are set forth below. Unless otherwise indicated, the business address of each is One Financial Center, Boston, MA 02111. Each Trustee who is deemed an “interested person,” as such term is defined in the 1940 Act, is indicated by an asterisk. Those Trustees who are not “interested persons” as defined in the 1940 Act are referred to as “Independent Trustees.” Additional information about the Trustees is available in the Statement of Additional Information, which is available without charge, upon request, by calling (800) 848-3854.
Trustees of the Trust
| | | | | | | | | | |
Name and Age | | Position(s)
Held with
Registrant | | Term of Office
and Length of
Time Served | | Principal Occupation(s) During the Past 5
Years(1) | | Number of
Portfolios
in Fund
Complex(2)
overseen | | Other Directorships Held
by Trustee During the
Past 5 Years(1) |
| Interested Trustee | | | | | | | | | | |
| Elizabeth M. Forget* (47) | | Trustee, Chairman of the Board, President and Chief Executive Officer | | Indefinite;
From
May
2006
(President
and Chief
Executive
Officer)/
August
2006
(Trustee
and
Chairman
of the
Board) to
present | | Senior Vice President, MetLife Inc.; President, MetLife Advisers, LLC and a predecessor company. | | 79 | | Trustee, Met Investors Series Trust (the “MIST Trust”);** various MetLife-affiliated boards. |
| | | | | |
| Independent Trustees | | | | | | | | | | |
| Stephen M. Alderman (54) | | Trustee | | Indefinite;
From
April
2012 to
present | | Shareholder in the law firm of Garfield & Merel, Ltd. | | 79 | | Trustee, MIST Trust;** Director, International Truck Leasing Corp. |
| | | | | |
| Robert J. Boulware (57) | | Trustee | | Indefinite;
From
April
2012 to
present | | Managing Director, Pilgrim Funds, LLC (private equity fund). | | 79 | | Trustee, MIST Trust;** Trustee, Vertical Capital Income Fund (closed-end fund); Director, Gainsco, Inc. (auto insurance). |
| | | | | |
| Susan C. Gause (61) | | Trustee | | Indefinite;
From
April
2012 to
present | | Private Investor. | | 79 | | Trustee, MIST Trust;** Trustee, HSBC Funds. |
| | | | | |
| Nancy Hawthorne (62) | | Trustee | | Indefinite;
From
May
2003 to
present | | Chief Executive Officer, Clerestory LLC (corporate advisor). | | 79 | | MIST Trust;** Director, THL Credit, Inc.**; Director, Avid Technology, Inc.** |
| | | | | |
| Barbara A. Nugent (57) | | Trustee | | Indefinite;
From
January
2014 to
present | | President, True North Board Governance, LLC (consulting); until 2014, partner in the law firm of Stradley Ronon Stevens & Young, LLP. | | 79 | | Trustee, MIST Trust**; Director, Episcopal Healthcare Foundation; until 2014, member, Mutual Fund Directors Forum Advisory Board. |
MSF-22
Metropolitan Series Fund
Trustees and Officers of Metropolitan Series Fund—(Continued)
| | | | | | | | | | |
Name and Age | | Position(s)
Held with
Registrant | | Term of Office
and Length of
Time Served | | Principal Occupation(s) During the Past 5
Years(1) | | Number of
Portfolios
in Fund
Complex(2)
overseen | | Other Directorships Held
by Trustee During the
Past 5 Years(1) |
| Keith M. Schappert (62) | | Trustee | | Indefinite;
From
August
2009 to
present | | Principal, Schappert Consulting LLC (asset management consulting). | | 79 | | Trustee, MIST Trust;** Director, The Commonfund for Nonprofit Organizations; until 2011, Director, Trilogy Global Advisors; Director, Mirae Asset Discovery Funds,** Director, Calamos Investments. |
| | | | | |
| Linda B. Strumpf (66) | | Trustee | | Indefinite;
From
May
2000 to
present | | Chair of the Investment Committee, Leona M. and Harry B. Helmsley Charitable Trust; until 2011, Chief Investment Officer, Leona M. and Harry B. Helmsley Charitable Trust. | | 79 | | Since 2012, Trustee, MIST Trust,** Trustee and Member of Investment Committee, The Pennsylvania State University. |
| | | | | |
| Dawn M. Vroegop (47) | | Trustee | | Indefinite;
From
May
2009 to
present | | Private Investor. | | 79 | | Trustee, MIST Trust,** Trustee, Driehaus Mutual Funds; Director and Investment Committee Chair, City College of San Francisco Foundation. |
Executive Officers of the Trust
| | | | | | |
Name and Age | | Position(s) Held with
Registrant | | Term of Office
and Length of
Time Served | | Principal Occupation(s) During Past 5 Years(1) |
| Elizabeth M. Forget (47) | | President, Chief Executive Officer, Trustee and Chairman of the Board | | From May
2006 (President
and Chief
Executive
Officer)/
August 2006
(Trustee and
Chairman of
the Board) to
present | | See principal occupation information in the table above. |
| | | |
| Jeffrey L. Bernier (42) | | Vice President | | From February
2008 to present | | Vice President, MetLife, Inc.; Senior Vice President, MetLife Advisers, LLC and a predecessor company. |
| | | |
| Peter H. Duffy (58) | | Chief Financial Officer and Treasurer | | From November
2000 to present | | Senior Vice President, MetLife Advisers, LLC; Vice President, MetLife, Inc. |
| | | |
| Andrew L. Gangolf (59) | | Secretary | | From May
2011to present | | Senior Vice President, MetLife Advisers, LLC; Senior Vice President & Assistant General Counsel, AllianceBerstein Investments, Inc. |
| | | |
| Jeffrey P. Halperin (46) | | Chief Compliance Officer | | From November
2005 to present | | Vice President, MetLife, Inc.; Chief Compliance Officer, MIST; Chief Compliance Officer, MSF Trust; Chief Compliance Officer, MetLife Advisers, LLC and a predecessor company; Chief Compliance Officer, MetLife Investment Management, LLC (formerly MetLife Investment Advisors Company, LLC). |
| | | |
| Alan C. Leland, Jr. (61) | | Vice President | | From February
2005 to present | | Treasurer and Chief Financial Officer, MetLife Advisers, LLC; Vice President, MetLife Group Inc.; Vice President, MetLife, Inc. |
| * | Ms. Forget is an “interested person” of the Trust because of her positions with MetLife Advisers, LLC and her ownership of securities issued by MetLife, Inc., the ultimate parent company of MetLife Advisers, LLC. |
| ** | Indicates a directorship with a registered investment company or a company subject to the reporting requirements of the Securities Exchange Act of 1934, as amended. |
| (1) | Previous positions during the past five years with the Trust, MetLife, Inc. or the Adviser are omitted if not materially different. |
| (2) | The Fund Complex includes 49 Portfolios of the MIST Trust and 30 Portfolios of the Trust. |
MSF-23
Metropolitan Series Fund
MFS Value Portfolio
Board of Trustees’ Consideration of Advisory and Sub-Advisory Agreements
At an in-person meeting of the Boards of Trustees (the “Board”) of Met Investors Series Trust and Metropolitan Series Fund (“MIST” and “MSF,” respectively, and collectively, the “Trusts”) held on November 19-20, 2013, the Board, including a majority of the Trustees who are not considered to be “interested persons” of the Trusts (the “Independent Trustees”) under the Investment Company Act of 1940, as amended (the “1940 Act”), approved for an annual period the continuation of each Trust’s advisory agreement (the “Advisory Agreement”) with MetLife Advisers, LLC (the “Adviser”) and the applicable sub-advisory agreements (each a “Sub-Advisory Agreement,” and collectively with the Advisory Agreement, the “Agreements”) between the Adviser and the investment sub-advisers (each a “Sub-Adviser,” and collectively, the “Sub-Advisers”) for each of the series of the Trusts, including the MFS Value Portfolio (each a “Portfolio,” and collectively, the “Portfolios”).1
In considering the Agreements, the Board reviewed a variety of materials provided by the Adviser and the Sub-Advisers relating to the Portfolios, including comparative performance, fee and expense information for an appropriate peer group of similar mutual funds, performance information for relevant benchmark indices and other information regarding the nature, extent and quality of services provided by the Adviser and the Sub-Advisers under their respective Agreements. The Board also took into account its experience with the Adviser and the Sub-Advisers and information provided to the Board in its meetings throughout the year with respect to the services provided by the Adviser and the Sub-Advisers, including quarterly performance reports prepared by management containing reviews of investment results, and periodic presentations from certain of the Sub-Advisers with respect to the Portfolios they manage. The Independent Trustees also assessed reports provided by the Board’s independent consultant, who reviewed and provided analyses regarding investment performance, fees and expenses, and other information provided by, or at the direction of, the Adviser and the Sub-Advisers, as more fully discussed below.
The Independent Trustees were separately advised by independent legal counsel throughout the process, and met with independent legal counsel in periodic executive sessions. Prior to voting to continue the Agreements at the November meeting, the Independent Trustees also received a memorandum from their independent counsel discussing the legal standards for their consideration of the proposed continuation of the Agreements. The Board also met in person with personnel of the Adviser on September 17, 2013 for the specific purpose of giving preliminary consideration to the proposed continuation of the Agreements and to request additional information they considered reasonably necessary to their deliberations. The Independent Trustees also discussed the proposed continuation of the Agreements in private sessions with their independent legal counsel at which no representatives of management were present.
In considering whether to approve the renewal of the Advisory Agreement with the Adviser and any applicable Sub-Advisory Agreements with respect to a Portfolio, the Board reviewed and analyzed the factors it deemed relevant, including: (1) the nature, extent and quality of the services to be provided to the Portfolios by the Adviser and the Sub-Advisers; (2) the performance of the Portfolios as compared to a peer group and an appropriate index; (3) the Adviser’s and each of the Sub-Adviser’s personnel and operations; (4) the financial condition of the Adviser and of the Sub-Advisers; (5) the level and method of computing each Portfolio’s advisory and sub-advisory fees; (6) the profitability of the Adviser under the Advisory Agreement and of certain of the Sub-Advisers under the Sub-Advisory Agreements; (7) any “fall-out” benefits to the Adviser, the Sub-Advisers and their affiliates (i.e., ancillary benefits realized by the Adviser, the Sub-Advisers or their affiliates from the Adviser’s or Sub-Advisers’ relationship with the Trusts); (8) the anticipated effect of growth in size on Portfolio expenses; (9) fees paid to certain of the Sub-Advisers by comparable institutional and retail accounts; and (10) possible conflicts of interest.
Nature, extent and quality of services. The Board evaluated the nature, extent and quality of the services that the Adviser, and the Sub-Advisers as relevant, have provided to the Portfolios. The Board considered the Adviser’s services as investment manager to the Portfolios, including services relating to the selection and oversight of the Sub-Advisers for the applicable Portfolios. The Board considered, among other things, the Adviser’s oversight of the provision of services to the Portfolios by the Sub-Advisers, including with respect to investment activities and trading practices, and the Sub-Adviser’s compliance with fund policies, objectives and Board directives, compliance policies and procedures and applicable law. The Adviser’s services in coordinating and overseeing the activities of the Trusts’ other service providers were also considered. The Board also evaluated the expertise and performance of the personnel of the Adviser who performed services for the Portfolios throughout the year.
The Board considered information received from the Trust’s Chief Compliance Officer (“CCO”) regarding the Portfolios’ compliance policies and procedures established pursuant to Rule 38a-l under the 1940 Act. The Board also evaluated the CCO’s ongoing reports concerning the CCO’s oversight of the risk assessment processes of the Sub-Advisers.
1 The Pyramis Managed Risk Portfolio recently commenced operations and, therefore, the Agreement with respect to this Portfolio was not up for renewal.
MSF-24
Metropolitan Series Fund
MFS Value Portfolio
Board of Trustees’ Consideration of Advisory and Sub-Advisory Agreements—(Continued)
With respect to the services provided by each of the Sub-Advisers, the Board considered, among other things, information provided to the Board by each Sub-Adviser. The Board considered the Sub-Adviser’s current level of staffing and its overall resources, as well as its compensation program. The Board reviewed each Sub-Adviser’s history and investment experience, as well as information regarding the qualifications, background and responsibilities of the Sub-Adviser’s investment and compliance personnel who provide services to the Portfolios. The Board also considered, among other things, the Sub-Adviser’s compliance program and any disciplinary history. The Board also took into account the Sub-Adviser’s risk assessment and monitoring process. The Board noted each Sub-Adviser’s regulatory history, including whether it was currently involved in any regulatory actions or investigations as well as material litigation, and any settlements and amelioratory actions undertaken, as appropriate. The Board also noted that the CCO and his staff conduct regular, periodic compliance reviews with each of the Sub-Advisers and present reports to the Independent Trustees regarding the same, which includes evaluating the regulatory compliance systems of the Sub-Advisers and procedures reasonably designed by them to help assure compliance with the federal securities laws, including issues related to late trading and market timing, best execution, fair value pricing, and proxy voting procedures, among others. The Board also took into account the financial condition of each Sub-Adviser. In its review, the Board also received and took into account information regarding any services and/or payments provided to the Adviser by the Sub-Advisers in connection with marketing activities.
The Board considered each Sub-Adviser’s investment process and philosophy. The Board took into account that each Sub-Adviser’s responsibilities include the development and maintenance of an investment program for the applicable Portfolio which is consistent with the Portfolio’s investment objectives, the selection of investment securities and the placement of orders for the purchase and sale of such securities, as well as the implementation of compliance controls related to performance of these services. The Board also reviewed each Sub-Adviser’s brokerage policies and practices.
Performance. The Board considered the performance of the Portfolios as described in the quarterly reports prepared by management, and as also analyzed in reports prepared by the Independent Trustees’ independent consultant. The Board noted that the Adviser reviews with the Board on a quarterly basis detailed information about the Portfolios’ performance results, portfolio composition and investment strategies. The Board also reviewed and considered a separate report prepared by Lipper Inc. (“Lipper”), an independent third party, which provided a statistical analysis comparing the Portfolios’ investment performance, expenses, and fees to comparable funds underlying variable insurance products (the “Performance Universe”). In addition, the Independent Trustees met separately with a representative of Bobroff Consulting, Inc., an independent consultant (“Bobroff), at a special board meeting in September 2013, to review the separate reports prepared by such consultant (“Bobroff Report”), which analyzed the report prepared by Lipper. The Board also considered each Portfolio’s more recent performance subsequent to the performance period covered by the Lipper reports, and management’s discussion of the same, including the effect of current market conditions on each Portfolio’s more recent performance.
The Board reviewed the Portfolios’ performance records and the Adviser’s and Sub-Advisers’ management styles and long-term performance records with the Portfolios and comparable funds. The Board focused particular attention on Portfolios with less favorable performance records. The Board was mindful of the Adviser’s focus on each Sub-Adviser’s performance and noted that the Adviser has been active in monitoring and responding to any performance issues with respect to the Portfolios. The Board also took into account its discussions with management regarding factors that contributed to the performance of the Portfolios.
Among other data relating specifically to the MFS Value Portfolio’s performance, the Board considered that the Portfolio outperformed the median of its Performance Universe for the one-, three- and five-year periods ended June 30, 2013. The Board noted that the Portfolio underperformed its Lipper Index for the one-year period ended June 30, 2013 and outperformed its Lipper Index for the three- and five-year periods ended June 30, 2013. The Board further considered that the Portfolio outperformed its benchmark, the Russell 1000 Value Index, for the one-, three- and five-year periods ended October 31, 2013.
Fees and Expenses. The Board gave consideration to the advisory fees payable under the Advisory Agreement and the sub-advisory fees payable under each of the Sub-Advisory Agreements. In this regard, the Board reviewed the advisory fees payable on a Portfolio-by-Portfolio basis based on information provided by the Adviser. The Independent Trustees, with the assistance of Bobroff, also examined the fees paid by a Portfolio in light of fees paid to other investment managers by comparable funds, as well as considered the fees charged by the Adviser to manage other comparable funds, as applicable. The Lipper report included comparisons of the Adviser’s fee schedule with that of its peers based on an asset-based analysis of relative fee structures according to the size of the Portfolio. In addition, the Board considered the Portfolios’ advisory and sub-advisory fees and total expenses as compared to similarly situated investment companies underlying variable insurance products deemed to be comparable to the Portfolios as determined by Lipper. The Board considered a Portfolio’s ranking within a smaller group of peer funds chosen by Lipper (the “Expense Group”), as well as the Portfolio’s ranking within broader groups of funds (the “Expense Universe” and the “Sub-advised Expense Universe”). The Board
MSF-25
Metropolitan Series Fund
MFS Value Portfolio
Board of Trustees’ Consideration of Advisory and Sub-Advisory Agreements—(Continued)
also considered a Portfolio’s contractual sub-advisory fees, as applicable, as compared to the Sub-advised Expense Universe as well as a smaller group of funds (the “Sub-advised Expense Group”). In comparing a Portfolio’s actual and contractual management fee to that of comparable funds, the Board noted that such fee includes both advisory and administrative fees.
The Board noted that the sub-advisory fees for the Portfolios are paid by the Adviser, not the Portfolios, out of the advisory fee. It was further noted that the Adviser negotiates such fees at arm’s length. The Board also considered that the Adviser had entered into expense limitation agreements with certain of the Portfolios, pursuant to which the Adviser has agreed to waive a portion of its advisory fee and/or reimburse certain expenses as a means of limiting a Portfolio’s total annual operating expenses. The Board further considered the amount of sub-advisory fees paid out by the Adviser and the amount of the management fees that it retained in light of the services performed by Sub-Advisers and Adviser, respectively.
With respect to the MFS Value Portfolio, the Board considered that the Portfolio’s actual management fees and total expenses (exclusive of 12b-l fees) were below the Expense Group median, the Expense Universe median and the Sub-advised Expense Universe median. The Board further noted that the Portfolio’s contractual management fees were above the asset-weighted average of the Expense Group at the Portfolio’s current size. The Board took into account that the Portfolio’s contractual sub-advisory fees were below the average of the Sub-advised Expense Group and the Sub-advised Expense Universe at the Portfolio’s current size. The Board also considered management’s discussion of the Portfolio’s expenses. The Board further noted that the Adviser had waived fees and/or reimbursed expenses during the past year.
Profitability. The Board examined the profitability of the Adviser on a Portfolio-by-Portfolio basis. The Board also considered that the Distributor, MetLife Investors Distribution Company, receives Rule 12b-1 payments to support the distribution of the products. The Board considered the profitability to the Sub-Advisers and their affiliates as a result of their relationships with the Portfolios, and the Board considered the ability of the Adviser to negotiate the Sub-Advisory Agreements and the fees thereunder at arm’s length. The Board also reviewed Portfolio specific data with regard to the profitability of the Portfolios to each Sub-Adviser, as available.
Economies of scale. The Board also considered the effect of the Portfolios’ growth in size on their fees. The Board noted that the fee schedules for most of the Portfolios contain breakpoints that reduce the fee rate above specified asset levels. The Board noted those Portfolios that did not contain breakpoints in the advisory fee and took into account management’s discussion of the same. The Board noted that those Portfolios with advisory fee schedules containing breakpoints generally reflect the inclusion of breakpoints in the sub-advisory fee schedule for such Portfolios. The Board considered the effective fees under the Advisory Agreement for a Portfolio as a percentage of assets at different asset levels and possible economies of scale that may be realized if the assets of the Portfolio grow. Among other data, the Board examined the effect of a Portfolio’s growth in size on various fee schedules and reviewed the Lipper and Bobroff Reports, which compared fees among peers. The Board also generally noted that if a Portfolio’s assets increase over time, the Portfolio may realize other economies of scale if assets increase proportionally more than certain other fixed expenses. In addition, the Board noted that the Adviser had taken a number of steps to date intended to share the benefits of economies of scale with contractholders.
With respect to the MFS Value Portfolio, the Board noted that the Portfolio’s advisory fee and sub-advisory fee each contains breakpoints that reduce the advisory fee rate on assets above certain specified asset levels. The Board considered the fact that the Portfolio’s fee levels decline as portfolio assets increase.
Other factors. As part of its evaluation of the Adviser’s compensation, the Board considered other benefits that may be realized by the Adviser and its affiliates from their relationship with the Trusts. Among them, the Board recognized that an affiliate of the Adviser, MetLife Investors Distribution Company, serves as the Distributor for the Trusts, and, as such, receives payments pursuant to Rule 12b-1 from the Portfolios to compensate it for providing shareholder services and selling activities, which could lead to growth in the Trusts’ assets and corresponding benefits from such growth, including economies of scale. The Board also considered that affiliates of the Adviser may benefit from certain indirect tax benefits relating to dividend received deductions and foreign tax credits. In conjunction with these considerations, the Board noted the costs of providing investment management and other services to the Portfolios and the ongoing commitment of the Adviser to the Portfolios.
The Board considered other benefits that may be realized by each Sub-Adviser and its affiliates from their relationship with the Trusts, including the opportunity to provide advisory services to additional portfolios of the Trusts and reputational benefits. In conjunction with these considerations, the Board noted the costs of providing investment advisory services to the Portfolios and the ongoing commitment of the Sub-Advisers to the Portfolios.
MSF-26
Metropolitan Series Fund
MFS Value Portfolio
Board of Trustees’ Consideration of Advisory and Sub-Advisory Agreements—(Continued)
The Board considered possible conflicts of interest in the form of material benefits or detriments to the Trusts resulting from the nature of the Trusts’ and the Adviser’s or the Sub-Advisers’ affiliations and the services that are provided to the Trusts, and the manner in which such conflicts were mitigated.
Conclusions. After full consideration of the factors discussed above, the Board, including a majority of the Independent Trustees, approved the Advisory Agreement and the Sub-Advisory Agreement, as applicable, with respect to each Portfolio, unless otherwise noted. In making its approvals, the Board concluded that the nature, extent and quality of services provided by the Adviser and each Sub-Adviser supported the renewal of the Agreements. The Board also concluded that the investment performance of each Fund was such that each Agreement should continue. In addition, the Board concluded that fees paid by a Portfolio to the Adviser and, if applicable, the Sub-Adviser appeared to be acceptable in light of nature, extent and quality of the services provided by the Adviser and Sub-Adviser. Further, the Board concluded that the Adviser’s profitability in providing services under the Advisory Agreements did not appear unreasonably high in light of the nature, extent and quality of the services provided by the Adviser. Finally, the Board concluded that the Advisory and Sub-Advisory fees in some measure share economies of scale with contractholders. In approving the renewal of each of the Agreements, the Board, including the Independent Trustees, did not identify any single factor as controlling, and generally attributed different weights to various factors for the various Portfolios. The Board evaluated all information available to them on a Portfolio-by-Portfolio basis, and their decisions were made separately with respect to each Portfolio.
MSF-27
Metropolitan Series Fund
MSCI EAFE Index Portfolio
Managed By MetLife Investment Management, LLC
Portfolio Manager Commentary*
PERFORMANCE
For the one year period ended December 31, 2013, the Class A, B, E, and G shares of the MSCI EAFE Index Portfolio returned 21.86%, 21.52%, 21.62%, and 21.44%, respectively. The Portfolio’s benchmark, the MSCI EAFE Index1, returned 22.78%.
MARKET ENVIRONMENT / CONDITIONS
The MSCI EAFE Index rallied in 2013 to its highest levels since 2007, driven by central bank intervention, better than expected macroeconomic data, and increased mergers & acquisitions activity. The year started on a positive note as U.S. lawmakers reached agreements on the fiscal cliff and debt ceiling, Japanese lawmakers agreed on a stimulus package, European banks started to repay crisis loans, and earnings data was generally positive. The markets were further supported by rate cuts by the European Central Bank (the “ECB”), the Reserve Bank of Australia, the Bank of Korea, and the Bank of Israel. Despite fears that the Federal Reserve (the “Fed”) would begin tapering asset purchases and end quantitative easing, the global markets continued to climb higher on better than expected macroeconomic data, including U.S. jobless claims, United Kingdom retail sales, Euro-zone consumer confidence, and French consumer spending. Headwinds during the year included increased tensions in Syria and Egypt and a U.S. government shutdown following the failure of U.S. lawmakers to reach an agreement in budget negotiations. However, global equity markets ended the year at their highs, as the ECB announced an unexpected rate cut, a tentative nuclear deal with Iran was negotiated, and investors continued to be optimistic that central banks would continue their easy monetary policy after Fed Chairman nominee Janet Yellen’s testimony in front of Congress was more dovish than expected. The U.S. Dollar strengthened during the one-year period, which negatively impacted the U.S. investors’ MSCI EAFE Index return versus the local currency return by approximately 4.2%.
All twenty-two countries comprising the MSCI EAFE Index experienced positive returns for the year. Greece (0.1% beginning weight in the benchmark), up 81.8%, was the best-performing country, however, MSCI moved Greece from the developed index to the emerging index during the November semi-annual review. Finland (0.8% beginning weight), up 48.7%, and Ireland (0.3% beginning weight), up 41.2%, were the next best-performing countries. The worst relative-performing countries were Singapore (1.9% beginning weight), up 1.6% and Australia (8.9% beginning weight), up 5.9%.
The stocks with the largest positive impact on the benchmark return for the year were SoftBank Corp., up 142.9%, Vodafone Group, up 65.8%, and Roche Holding, up 44.2%. The stocks with the largest negative impact were Newcrest Mining, down 69.5%, Anglo American, down 26.4%, and BHP Billiton, down 7.5%.
PORTFOLIO REVIEW / PERIOD END POSITIONING
The Portfolio is managed utilizing a stratified sampling strategy versus the MSCI EAFE Index. This strategy seeks to track the performance of the Index by owning a subset of Index constituents and neutralizing exposures across countries. The Portfolio is periodically rebalanced for compositional changes in the MSCI EAFE Index. Factors that impact tracking error include sampling, fair value pricing, transaction costs, cash drag, securities lending, NAV rounding, contributions and withdrawals.
Stacey Lituchy
Norman Hu
Mirsad Usejnoski
Portfolio Managers
MetLife Investment Management, LLC
* This commentary may include statements that constitute “forward-looking statements” under the U.S. securities laws. Forward-looking statements include, among other things, projections, estimates, and information about possible or future results related to the Portfolio, market or regulatory developments. The views expressed above are not guarantees of future performance or economic results and involve certain risks, uncertainties and assumptions that could cause actual outcomes and results to differ materially from the views expressed herein. The views expressed above are subject to change at any time based upon economic, market, or other conditions and the subadvisory firm undertakes no obligation to update the views expressed herein. Any discussions of specific securities should not be considered a recommendation to buy or sell those securities. The views expressed above (including any forward-looking statement) may not be relied upon as investment advice or as an indication of the Portfolio’s trading intent. Information about the Portfolio’s holdings, asset allocation or country diversification is historical and is not an indication of future Portfolio composition, which may vary. Direct investment in any index is not possible. The performance of any index mentioned in this commentary has not been adjusted for ongoing management, distribution and operating expenses, and sales charges applicable to mutual fund investments. In addition, the returns do not reflect additional fees charged by separate accounts or variable insurance contracts that an investor in the Portfolio may pay. If these additional fees were reflected, performance would have been lower.
MSF-1
Metropolitan Series Fund
MSCI EAFE Index Portfolio
A $10,000 INVESTMENT COMPARED TO THE MSCI EAFE INDEX
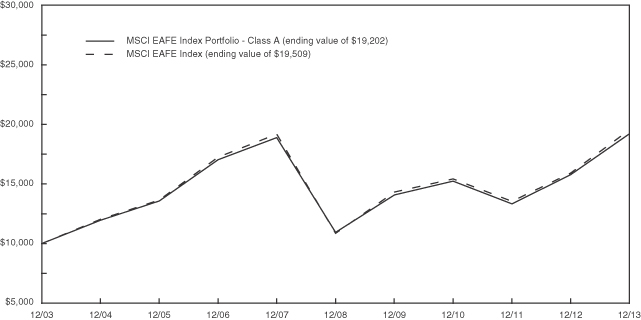
AVERAGE ANNUAL RETURNS (%) (FOR THE YEAR ENDED DECEMBER 31, 2013)
| | | | | | | | | | | | | | | | |
| | | 1 Year | | | 5 Year | | | 10 Year | | | Since Inception2 | |
| MSCI EAFE Index Portfolio | | | | | | | | | | | | | | | | |
Class A | | | 21.86 | | | | 11.93 | | | | 6.74 | | | | — | |
Class B | | | 21.52 | | | | 11.64 | | | | 6.47 | | | | — | |
Class E | | | 21.62 | | | | 11.75 | | | | 6.57 | | | | — | |
Class G | | | 21.44 | | | | — | | | | — | | | | 14.58 | |
| MSCI EAFE Index | | | 22.78 | | | | 12.44 | | | | 6.91 | | | | — | |
1 The MSCI EAFE (Europe, Australasia, Far East) Index is a free float-adjusted market capitalization index that is designed to measure the equity market performance of developed markets, excluding the U.S. & Canada.
2 Inception dates of the Class A, Class B, Class E, and Class G shares are 11/9/98, 1/2/01, 5/1/01, and 4/28/09, respectively.
Portfolio performance is calculated including reinvestment of all income and capital gain distributions. Performance numbers are net of all Portfolio expenses but do not include any insurance, sales, separate account or administrative charges of variable annuity or life insurance contracts or any additional expenses that participants may bear relating to the operations of their plans. If these charges were included, the returns would be lower. The performance of any index referenced above has not been adjusted for ongoing management, distribution and operating expenses, and sales charges applicable to mutual fund investments. Direct investment in any index is not possible. The performance of Class A shares, as set forth in the line graph above, will differ from that of other classes because of the difference in expenses paid by policyholders investing in the different share classes.
This information represents past performance and is not indicative of future results. Investment return and principal value may fluctuate so that shares, upon redemption, may be worth more or less than the original cost.
PORTFOLIO COMPOSITION AS OF DECEMBER 31, 2013
Top Holdings
| | | | |
| | |
% of
Net Assets | |
| iShares MSCI EAFE ETF | | | 3.1 | |
| Nestle S.A. | | | 1.7 | |
| HSBC Holdings plc | | | 1.5 | |
| Roche Holding AG | | | 1.4 | |
| Vodafone Group plc | | | 1.4 | |
| Novartis AG | | | 1.3 | |
| Toyota Motor Corp. | | | 1.2 | |
| BP plc | | | 1.1 | |
| Royal Dutch Shell plc—B Shares | | | 1.0 | |
| Total S.A. | | | 1.0 | |
Top Countries
| | | | |
| | | % of
Market Value of
Total Investments | |
| United Kingdom | | | 20.6 | |
| Japan | | | 20.1 | |
| France | | | 9.1 | |
| Germany | | | 9.0 | |
| Switzerland | | | 8.7 | |
| Australia | | | 7.1 | |
| United States | | | 4.0 | |
| Spain | | | 3.3 | |
| Sweden | | | 3.1 | |
| Netherlands | | | 3.1 | |
MSF-2
Metropolitan Series Fund
MSCI EAFE Index Portfolio
Understanding Your Portfolio’s Expenses
Shareholder Expense Example
As a shareholder of the Portfolio, you incur ongoing costs, including management fees; distribution and service (12b-1) fees; and other Portfolio expenses. This example is intended to help you understand your ongoing costs (in dollars) (referred to as “expenses”) of investing in the Portfolio and compare these costs with the ongoing costs of investing in other mutual funds. The example is based on an investment of $1,000 invested at the beginning of the period and held for the entire period, July 1, 2013 through December 31, 2013.
Actual Expenses
The first line for each share class of the Portfolio in the table below provides information about actual account values and actual expenses. You may use the information in this line, together with the amount you invested in the particular share class of the Portfolio, to estimate the expenses that you paid over the period. Simply divide your account value by $1,000 (for example, an $8,600 account value divided by $1,000 = 8.6), then multiply the result by the number in the first line under the heading entitled “Expenses Paid During Period” to estimate the expenses you paid on your account during this period.
Hypothetical Example for Comparison Purposes
The second line for each share class of the Portfolio in the table below provides information about hypothetical account values and hypothetical expenses based on the Portfolio’s actual expense ratio and an assumed rate of return of 5% per year before expenses, which is not the Portfolio’s actual return. The hypothetical account values and expenses may not be used to estimate the actual ending account balance or expenses you paid for the period. You may use this information to compare the ongoing costs of investing in the Portfolio and other funds. To do so, compare this 5% hypothetical example with the 5% hypothetical examples that appear in the shareholder reports of the other funds.
Please note that the expenses shown in the table are meant to highlight your ongoing costs only and do not reflect any fees or charges of your variable insurance product or any additional expenses that participants in certain eligible qualified plans may bear relating to the operations of their plan. Therefore, the second line for each share class in the table is useful in comparing ongoing costs only, and will not help you determine the relative total costs of owning different funds. In addition, if these other costs were included, your costs would have been higher.
| | | | | | | | | | | | | | | | | | |
MSCI EAFE Index Portfolio | | | | Annualized
Expense
Ratio | | | Beginning
Account Value
July 1,
2013 | | | Ending
Account Value
December 31,
2013 | | | Expenses Paid
During Period**
July 1, 2013
to
December 31,
2013 | |
Class A(a) | | Actual | | | 0.39 | % | | $ | 1,000.00 | | | $ | 1,182.10 | | | $ | 2.15 | |
| | Hypothetical* | | | 0.39 | % | | $ | 1,000.00 | | | $ | 1,023.24 | | | $ | 1.99 | |
| | | | | |
Class B(a) | | Actual | | | 0.64 | % | | $ | 1,000.00 | | | $ | 1,179.80 | | | $ | 3.52 | |
| | Hypothetical* | | | 0.64 | % | | $ | 1,000.00 | | | $ | 1,021.98 | | | $ | 3.26 | |
| | | | | |
Class E(a) | | Actual | | | 0.54 | % | | $ | 1,000.00 | | | $ | 1,180.30 | | | $ | 2.97 | |
| | Hypothetical* | | | 0.54 | % | | $ | 1,000.00 | | | $ | 1,022.48 | | | $ | 2.75 | |
| | | | | |
Class G(a) | | Actual | | | 0.69 | % | | $ | 1,000.00 | | | $ | 1,179.90 | | | $ | 3.79 | |
| | Hypothetical* | | | 0.69 | % | | $ | 1,000.00 | | | $ | 1,021.73 | | | $ | 3.52 | |
* Hypothetical assumes a rate of return of 5% per year before expenses.
** Expenses paid are equal to the Portfolio’s annualized expense ratio for the most recent six month period, as shown above, multiplied by the average account value over the period, multiplied by the number of days (184 days) in the most recent fiscal half-year, divided by 365 (to reflect the one-half year period).
(a) The annualized expense ratio shown reflects the impact of the management fee waiver as described in Note 6 of the Notes to Financial Statements.
MSF-3
Metropolitan Series Fund
MSCI EAFE Index Portfolio
Schedule of Investments as of December 31, 2013
Common Stocks—95.5% of Net Assets
| | | | | | | | |
| Security Description | | Shares | | | Value | |
| | |
Australia—7.1% | | | | | | | | |
AGL Energy, Ltd. | | | 41,243 | | | $ | 554,754 | |
ALS, Ltd. (a) | | | 24,515 | | | | 193,315 | |
Alumina, Ltd. (b) | | | 191,453 | | | | 191,021 | |
Amcor, Ltd. | | | 83,008 | | | | 786,507 | |
AMP, Ltd. | | | 206,717 | | | | 813,312 | |
APA Group | | | 59,114 | | | | 317,504 | |
Asciano, Ltd. | | | 58,414 | | | | 302,375 | |
ASX, Ltd. | | | 12,194 | | | | 401,159 | |
Aurizon Holdings, Ltd. | | | 157,842 | | | | 690,861 | |
Australia & New Zealand Banking Group, Ltd. | | | 190,466 | | | | 5,493,870 | |
Bank of Queensland, Ltd. | | | 22,340 | | | | 243,686 | |
Bendigo and Adelaide Bank, Ltd. | | | 35,779 | | | | 376,254 | |
BHP Billiton, Ltd. | | | 222,200 | | | | 7,571,401 | |
Boral, Ltd. | | | 61,162 | | | | 262,271 | |
Brambles, Ltd. | | | 111,315 | | | | 911,581 | |
Caltex Australia, Ltd. | | | 9,532 | | | | 171,537 | |
CFS Retail Property Trust | | | 151,292 | | | | 263,932 | |
Coca-Cola Amatil, Ltd. | | | 42,510 | | | | 458,459 | |
Cochlear, Ltd. (a) | | | 3,466 | | | | 182,761 | |
Commonwealth Bank of Australia | | | 111,859 | | | | 7,809,326 | |
Computershare, Ltd. | | | 29,681 | | | | 302,873 | |
Crown Resorts, Ltd. | | | 29,464 | | | | 444,327 | |
CSL, Ltd. | | | 33,667 | | | | 2,082,259 | |
Dexus Property Group (REIT) | | | 302,183 | | | | 271,795 | |
Echo Entertainment Group, Ltd. | | | 52,682 | | | | 115,980 | |
Federation Centres, Ltd. | | | 91,872 | | | | 192,396 | |
Flight Centre Travel Group, Ltd. (a) | | | 4,009 | | | | 170,594 | |
Fortescue Metals Group, Ltd. (a) | | | 100,245 | | | | 524,135 | |
Goodman Group (REIT) | | | 110,907 | | | | 470,648 | |
GPT Group (REIT) | | | 121,517 | | | | 370,622 | |
Iluka Resources, Ltd. (a) | | | 29,031 | | | | 224,223 | |
Incitec Pivot, Ltd. | | | 103,981 | | | | 249,424 | |
Insurance Australia Group, Ltd. | | | 142,016 | | | | 739,684 | |
Leighton Holdings, Ltd. (a) | | | 10,872 | | | | 157,496 | |
Lend Lease Group | | | 37,629 | | | | 375,223 | |
Macquarie Group, Ltd. | | | 19,738 | | | | 975,294 | |
Metcash, Ltd. (a) | | | 63,044 | | | | 178,238 | |
Mirvac Group (REIT) | | | 298,553 | | | | 448,901 | |
National Australia Bank, Ltd. | | | 162,650 | | | | 5,087,534 | |
Newcrest Mining, Ltd. | | | 54,807 | | | | 384,134 | |
Orica, Ltd. (a) | | | 26,176 | | | | 559,024 | |
Origin Energy, Ltd. | | | 78,717 | | | | 991,307 | |
Orora, Ltd. (b) | | | 83,008 | | | | 86,145 | |
QBE Insurance Group, Ltd. | | | 82,246 | | | | 848,544 | |
Ramsay Health Care, Ltd. | | | 8,883 | | | | 344,610 | |
REA Group, Ltd. | | | 3,716 | | | | 125,577 | |
Rio Tinto, Ltd. | | | 29,750 | | | | 1,815,148 | |
Santos, Ltd. | | | 67,710 | | | | 889,528 | |
Seek, Ltd. | | | 22,233 | | | | 267,855 | |
Sonic Healthcare, Ltd. | | | 24,290 | | | | 361,714 | |
SP AusNet | | | 106,030 | | | | 118,219 | |
Stockland (REIT) | | | 161,293 | | | | 522,494 | |
Suncorp Group, Ltd. | | | 87,148 | | | | 1,025,702 | |
Sydney Airport | | | 80,467 | | | | 274,222 | |
TABCORP Holdings, Ltd. | | | 43,902 | | | | 142,629 | |
Tatts Group, Ltd. | | | 123,533 | | | | 343,272 | |
Telstra Corp., Ltd. | | | 304,819 | | | | 1,432,007 | |
| | |
Australia—(Continued) | | | | | | | | |
Toll Holdings, Ltd. | | | 41,980 | | | | 213,401 | |
Transurban Group | | | 94,803 | | | | 580,731 | |
Treasury Wine Estates, Ltd. | | | 46,412 | | | | 200,199 | |
Wesfarmers, Ltd. | | | 68,136 | | | | 2,688,519 | |
Westfield Group (REIT) | | | 143,754 | | | | 1,298,185 | |
Westfield Retail Trust | | | 192,358 | | | | 511,282 | |
Westpac Banking Corp. | | | 215,409 | | | | 6,267,961 | |
Woodside Petroleum, Ltd. | | | 46,091 | | | | 1,604,576 | |
Woolworths, Ltd. | | | 86,535 | | | | 2,621,332 | |
WorleyParsons, Ltd. | | | 14,841 | | | | 220,495 | |
| | | | | | | | |
| | | | | | | 68,116,344 | |
| | | | | | | | |
|
Austria—0.3% | |
Andritz AG | | | 5,184 | | | | 326,153 | |
Erste Group Bank AG | | | 17,136 | | | | 600,474 | |
IMMOFINANZ AG (b) | | | 66,338 | | | | 308,347 | |
OMV AG | | | 10,147 | | | | 486,786 | |
Raiffeisen Bank International AG | | | 3,490 | | | | 123,402 | |
Telekom Austria AG | | | 15,305 | | | | 116,077 | |
Vienna Insurance Group AG Wiener Versicherung Gruppe | | | 2,911 | | | | 145,602 | |
Voestalpine AG | | | 7,466 | | | | 362,148 | |
| | | | | | | | |
| | | | | | | 2,468,989 | |
| | | | | | | | |
|
Belgium—1.1% | |
Ageas | | | 15,573 | | | | 665,928 | |
Anheuser-Busch InBev NV | | | 55,726 | | | | 5,951,447 | |
Belgacom S.A. (a) | | | 10,680 | | | | 316,492 | |
Colruyt S.A. | | | 5,430 | | | | 304,192 | |
Delhaize Group S.A. | | | 6,756 | | | | 403,196 | |
Groupe Bruxelles Lambert S.A. | | | 5,072 | | | | 467,256 | |
KBC Groep NV | | | 16,494 | | | | 940,259 | |
Solvay S.A. | | | 3,743 | | | | 593,423 | |
Telenet Group Holding NV | | | 4,184 | | | | 250,562 | |
UCB S.A. | | | 7,958 | | | | 593,895 | |
Umicore S.A. (a) | | | 8,519 | | | | 398,630 | |
| | | | | | | | |
| | | | | | | 10,885,280 | |
| | | | | | | | |
|
China—0.0% | |
Yangzijiang Shipbuilding Holdings, Ltd. | | | 137,000 | | | | 129,071 | |
| | | | | | | | |
|
Denmark—1.1% | |
AP Moeller - Maersk A/S - Class A | | | 35 | | | | 361,493 | |
AP Moeller - Maersk A/S - Class B | | | 88 | | | | 961,302 | |
Carlsberg A/S - Class B | | | 7,997 | | | | 889,820 | |
Coloplast A/S - Class B | | | 7,043 | | | | 467,927 | |
Danske Bank A/S (b) | | | 44,352 | | | | 1,022,777 | |
DSV A/S | | | 13,261 | | | | 436,499 | |
Novo Nordisk A/S - Class B | | | 27,644 | | | | 5,101,028 | |
Novozymes A/S - B Shares | | | 16,065 | | | | 680,703 | |
TDC A/S | | | 59,338 | | | | 576,612 | |
Tryg A/S | | | 1,747 | | | | 169,313 | |
William Demant Holding A/S (a) (b) | | | 1,624 | | | | 158,149 | |
| | | | | | | | |
| | | | | | | 10,825,623 | |
| | | | | | | | |
See accompanying notes to financial statements.
MSF-4
Metropolitan Series Fund
MSCI EAFE Index Portfolio
Schedule of Investments as of December 31, 2013
Common Stocks—(Continued)
| | | | | | | | |
| Security Description | | Shares | | | Value | |
|
Finland—0.9% | |
Elisa Oyj (a) | | | 9,437 | | | $ | 250,679 | |
Fortum Oyj | | | 31,487 | | | | 722,022 | |
Kone Oyj - Class B (a) | | | 21,608 | | | | 981,303 | |
Metso Oyj (a) | | | 7,511 | | | | 322,011 | |
Neste Oil Oyj | | | 9,073 | | | | 180,734 | |
Nokia Oyj (b) | | | 264,520 | | | | 2,137,652 | |
Nokian Renkaat Oyj (a) | | | 7,322 | | | | 352,850 | |
Orion Oyj - Class B | | | 6,402 | | | | 180,539 | |
Pohjola Bank plc - A Shares | | | 9,006 | | | | 181,688 | |
Sampo Oyj - A Shares | | | 27,993 | | | | 1,383,844 | |
Stora Enso Oyj - R Shares | | | 40,497 | | | | 408,777 | |
UPM-Kymmene Oyj | | | 38,111 | | | | 645,843 | |
Wartsila Oyj Abp | | | 12,482 | | | | 618,694 | |
| | | | | | | | |
| | | | | | | 8,366,636 | |
| | | | | | | | |
|
France—9.2% | |
Accor S.A. | | | 12,668 | | | | 599,903 | |
Aeroports de Paris | | | 2,209 | | | | 251,170 | |
Air Liquide S.A. | | | 21,485 | | | | 3,050,726 | |
Alcatel-Lucent (a) (b) | | | 192,359 | | | | 864,344 | |
Alstom S.A. | | | 14,355 | | | | 525,318 | |
Arkema S.A. | | | 4,440 | | | | 520,897 | |
Atos Origin S.A. | | | 4,831 | | | | 439,369 | |
AXA S.A. | | | 122,200 | | | | 3,414,123 | |
BNP Paribas S.A. | | | 68,921 | | | | 5,405,527 | |
Bouygues S.A. (a) | | | 12,810 | | | | 486,543 | |
Bureau Veritas S.A. | | | 15,060 | | | | 441,902 | |
Cap Gemini S.A. | | | 9,755 | | | | 662,567 | |
Carrefour S.A. | | | 42,840 | | | | 1,701,610 | |
Casino Guichard Perrachon S.A. | | | 4,364 | | | | 505,267 | |
CGG (b) | | | 11,374 | | | | 197,719 | |
Christian Dior S.A. | | | 3,598 | | | | 682,278 | |
Cie de St-Gobain | | | 27,625 | | | | 1,529,379 | |
Cie Generale des Etablissements Michelin | | | 12,929 | | | | 1,381,968 | |
CNP Assurances | | | 10,520 | | | | 216,057 | |
Credit Agricole S.A. (b) | | | 71,301 | | | | 917,970 | |
Danone S.A. | | | 39,651 | | | | 2,865,129 | |
Dassault Systemes S.A. | | | 4,077 | | | | 507,415 | |
Edenred | | | 13,868 | | | | 465,998 | |
Electricite de France S.A. | | | 17,389 | | | | 616,794 | |
Essilor International S.A. | | | 13,981 | | | | 1,491,978 | |
Eurazeo S.A. | | | 2,143 | | | | 168,315 | |
Eutelsat Communications S.A. (a) | | | 8,516 | | | | 266,147 | |
Fonciere Des Regions (REIT) | | | 1,625 | | | | 140,603 | |
GDF Suez | | | 92,031 | | | | 2,175,286 | |
Gecina S.A. | | | 1,319 | | | | 174,593 | |
Groupe Eurotunnel S.A. | | | 42,941 | | | | 452,142 | |
ICADE (REIT) | | | 2,071 | | | | 193,486 | |
Iliad S.A. | | | 1,838 | | | | 377,172 | |
Imerys S.A. | | | 2,253 | | | | 196,818 | |
JCDecaux S.A. | | | 4,706 | | | | 194,670 | |
Kering | | | 5,248 | | | | 1,111,676 | |
Klepierre (REIT) | | | 6,803 | | | | 315,825 | |
L’Oreal S.A. | | | 16,452 | | | | 2,901,930 | |
Lafarge S.A. | | | 13,327 | | | | 1,004,512 | |
Lagardere SCA | | | 8,303 | | | | 309,198 | |
|
France—(Continued) | |
Legrand S.A. | | | 18,368 | | | | 1,014,560 | |
LVMH Moet Hennessy Louis Vuitton S.A. | | | 17,444 | | | | 3,198,538 | |
Natixis | | | 61,277 | | | | 362,455 | |
Orange S.A. | | | 128,590 | | | | 1,600,902 | |
Pernod-Ricard S.A. | | | 14,719 | | | | 1,683,350 | |
Publicis Groupe S.A. (a) | | | 12,590 | | | | 1,157,624 | |
Remy Cointreau S.A. (a) | | | 1,600 | | | | 134,706 | |
Renault S.A. | | | 12,949 | | | | 1,047,179 | |
Rexel S.A. | | | 14,722 | | | | 388,401 | |
Safran S.A. | | | 18,407 | | | | 1,282,141 | |
Sanofi | | | 82,641 | | | | 8,811,188 | |
Schneider Electric S.A. | | | 36,592 | | | | 3,216,982 | |
SCOR SE | | | 11,686 | | | | 427,893 | |
SES S.A. | | | 20,693 | | | | 671,124 | |
Societe BIC S.A. | | | 1,753 | | | | 215,219 | |
Societe Generale S.A. | | | 48,701 | | | | 2,848,667 | |
Sodexo | | | 6,625 | | | | 673,812 | |
Suez Environnement Co. | | | 22,682 | | | | 407,130 | |
Technip S.A. | | | 6,959 | | | | 671,383 | |
Thales S.A. | | | 6,811 | | | | 439,795 | |
Total S.A. | | | 148,344 | | | | 9,108,227 | |
Unibail-Rodamco SE | | | 6,973 | | | | 1,793,606 | |
Valeo S.A. | | | 5,216 | | | | 578,853 | |
Vallourec S.A. | | | 8,091 | | | | 443,467 | |
Veolia Environnement S.A. | | | 23,240 | | | | 380,370 | |
Vinci S.A. | | | 32,357 | | | | 2,135,618 | |
Vivendi S.A. | | | 81,253 | | | | 2,152,991 | |
Wendel S.A. | | | 2,267 | | | | 331,055 | |
Zodiac Aerospace (a) | | | 2,442 | | | | 434,316 | |
| | | | | | | | |
| | | | | | | 87,335,876 | |
| | | | | | | | |
|
Germany—8.4% | |
Adidas AG | | | 14,158 | | | | 1,807,844 | |
Allianz SE | | | 31,630 | | | | 5,682,864 | |
Axel Springer SE (a) | | | 3,006 | | | | 193,495 | |
BASF SE | | | 63,713 | | | | 6,805,137 | |
Bayer AG | | | 57,362 | | | | 8,060,671 | |
Bayerische Motoren Werke (BMW) AG | | | 22,977 | | | | 2,699,005 | |
Beiersdorf AG | | | 6,805 | | | | 692,008 | |
Brenntag AG | | | 3,344 | | | | 622,238 | |
Celesio AG | | | 5,900 | | | | 187,004 | |
Commerzbank AG (b) | | | 66,178 | | | | 1,068,272 | |
Continental AG | | | 7,824 | | | | 1,719,143 | |
Daimler AG | | | 66,735 | | | | 5,786,085 | |
Deutsche Bank AG | | | 70,259 | | | | 3,357,795 | |
Deutsche Boerse AG | | | 12,868 | | | | 1,070,293 | |
Deutsche Lufthansa AG (b) | | | 17,782 | | | | 377,946 | |
Deutsche Post AG | | | 62,935 | | | | 2,298,715 | |
Deutsche Telekom AG | | | 200,660 | | | | 3,437,540 | |
Deutsche Wohnen AG | | | 20,600 | | | | 400,443 | |
E.ON SE | | | 123,175 | | | | 2,273,644 | |
Fraport AG Frankfurt Airport Services Worldwide | | | 2,305 | | | | 173,589 | |
Fresenius Medical Care AG & Co. KGaA | | | 14,375 | | | | 1,024,742 | |
Fresenius SE & Co. KGaA | | | 8,867 | | | | 1,363,864 | |
GEA Group AG | | | 12,718 | | | | 606,464 | |
Hannover Rueck SE | | | 3,778 | | | | 326,826 | |
See accompanying notes to financial statements.
MSF-5
Metropolitan Series Fund
MSCI EAFE Index Portfolio
Schedule of Investments as of December 31, 2013
Common Stocks—(Continued)
| | | | | | | | |
| Security Description | | Shares | | | Value | |
|
Germany—(Continued) | |
HeidelbergCement AG | | | 9,200 | | | $ | 699,342 | |
Henkel AG & Co. KGaA | | | 8,633 | | | | 901,522 | |
Hochtief AG (a) | | | 2,679 | | | | 229,714 | |
Hugo Boss AG | | | 2,160 | | | | 308,118 | |
Infineon Technologies AG | | | 73,323 | | | | 784,268 | |
K&S AG (a) | | | 11,843 | | | | 365,305 | |
Kabel Deutschland Holding AG | | | 1,650 | | | | 214,451 | |
Lanxess AG (a) | | | 5,523 | | | | 369,583 | |
Linde AG | | | 13,162 | | | | 2,761,121 | |
MAN SE | | | 2,002 | | | | 246,219 | |
Merck KGaA | | | 4,259 | | | | 768,601 | |
Metro AG | | | 8,734 | | | | 423,717 | |
Muenchener Rueckversicherungs AG | | | 12,534 | | | | 2,766,943 | |
OSRAM Licht AG (b) | | | 5,409 | | | | 306,210 | |
ProSiebenSat.1 Media AG | | | 12,850 | | | | 638,500 | |
RWE AG | | | 34,949 | | | | 1,280,130 | |
SAP AG | | | 63,917 | | | | 5,489,211 | |
Siemens AG | | | 55,001 | | | | 7,527,293 | |
Sky Deutschland AG (b) | | | 30,300 | | | | 335,203 | |
Suedzucker AG (a) | | | 5,881 | | | | 159,008 | |
Telefonica Deutschland Holding AG | | | 19,300 | | | | 159,829 | |
ThyssenKrupp AG (b) | | | 26,592 | | | | 649,843 | |
United Internet AG | | | 8,781 | | | | 374,695 | |
Volkswagen AG | | | 1,873 | | | | 508,373 | |
| | | | | | | | |
| | | | | | | 80,302,826 | |
| | | | | | | | |
|
Hong Kong—2.8% | |
AIA Group, Ltd. | | | 828,200 | | | | 4,175,528 | |
ASM Pacific Technology, Ltd. (a) | | | 14,200 | | | | 118,769 | |
Bank of East Asia, Ltd. (a) | | | 103,920 | | | | 440,645 | |
BOC Hong Kong Holdings, Ltd. | | | 253,965 | | | | 816,895 | |
Cathay Pacific Airways, Ltd. | | | 87,000 | | | | 184,683 | |
Cheung Kong Holdings, Ltd. | | | 97,000 | | | | 1,537,791 | |
Cheung Kong Infrastructure Holdings, Ltd. | | | 43,000 | | | | 272,580 | |
CLP Holdings, Ltd. | | | 123,877 | | | | 981,610 | |
First Pacific Co., Ltd. | | | 173,250 | | | | 197,993 | |
Galaxy Entertainment Group, Ltd. (b) | | | 149,000 | | | | 1,338,024 | |
Hang Lung Properties, Ltd. | | | 161,000 | | | | 513,604 | |
Hang Seng Bank, Ltd. | | | 53,200 | | | | 865,096 | |
Henderson Land Development Co., Ltd. | | | 73,700 | | | | 421,405 | |
HKT Trust / HKT, Ltd. | | | 161,000 | | | | 159,356 | |
Hong Kong & China Gas Co., Ltd. | | | 401,967 | | | | 925,357 | |
Hong Kong Exchanges and Clearing, Ltd. | | | 73,400 | | | | 1,229,075 | |
Hopewell Holdings, Ltd. | | | 25,000 | | | | 84,864 | |
Hutchison Whampoa, Ltd. | | | 149,000 | | | | 2,037,424 | |
Hysan Development Co., Ltd. | | | 45,000 | | | | 194,046 | |
Kerry Properties, Ltd. | | | 46,500 | | | | 161,595 | |
Li & Fung, Ltd. (a) | | | 429,600 | | | | 556,289 | |
Link REIT (The) | | | 161,141 | | | | 786,160 | |
MGM China Holdings, Ltd. | | | 71,200 | | | | 305,879 | |
MTR Corp., Ltd. | | | 95,000 | | | | 360,471 | |
New World Development Co., Ltd. | | | 261,531 | | | | 331,829 | |
Noble Group, Ltd. | | | 263,909 | | | | 224,596 | |
NWS Holdings, Ltd. | | | 93,000 | | | | 141,766 | |
Power Assets Holdings, Ltd. | | | 99,549 | | | | 793,795 | |
Sands China, Ltd. | | | 165,200 | | | | 1,357,653 | |
|
Hong Kong—(Continued) | |
Shangri-La Asia, Ltd. | | | 109,540 | | | | 214,139 | |
Sino Land Co., Ltd. | | | 193,600 | | | | 265,165 | |
SJM Holdings, Ltd. | | | 141,000 | | | | 475,598 | |
Sun Hung Kai Properties, Ltd. | | | 111,000 | | | | 1,415,080 | |
Swire Pacific, Ltd. - Class A | | | 43,317 | | | | 510,137 | |
Swire Properties, Ltd. | | | 83,600 | | | | 211,462 | |
Wharf Holdings, Ltd. | | | 104,976 | | | | 802,405 | |
Wheelock & Co., Ltd. | | | 68,000 | | | | 313,438 | |
Wynn Macau, Ltd. | | | 104,000 | | | | 476,194 | |
Yue Yuen Industrial Holdings, Ltd. | | | 50,500 | | | | 168,977 | |
| | | | | | | | |
| | | | | | | 26,367,373 | |
| | | | | | | | |
|
Ireland—0.7% | |
Bank of Ireland (a) (b) | | | 1,438,800 | | | | 501,523 | |
CRH plc | | | 51,353 | | | | 1,304,923 | |
Experian plc | | | 72,050 | | | | 1,330,010 | |
James Hardie Industries plc | | | 30,172 | | | | 351,673 | |
Kerry Group plc - Class A | | | 11,180 | | | | 778,138 | |
Perrigo Co. plc | | | 2,815 | | | | 432,039 | |
Shire plc | | | 39,190 | | | | 1,847,033 | |
| | | | | | | | |
| | | | | | | 6,545,339 | |
| | | | | | | | |
|
Israel—0.4% | |
Bank Hapoalim B.M. | | | 72,497 | | | | 406,820 | |
Bank Leumi Le-Israel B.M. (b) | | | 101,093 | | | | 413,406 | |
Bezeq The Israeli Telecommunication
Corp., Ltd. | | | 178,026 | | | | 301,830 | |
Israel Chemicals, Ltd. | | | 29,917 | | | | 249,372 | |
NICE Systems, Ltd. | | | 5,213 | | | | 213,617 | |
Teva Pharmaceutical Industries, Ltd. | | | 60,000 | | | | 2,405,825 | |
| | | | | | | | |
| | | | | | | 3,990,870 | |
| | | | | | | | |
|
Italy—2.0% | |
Assicurazioni Generali S.p.A. | | | 82,143 | | | | 1,955,393 | |
Atlantia S.p.A. (a) | | | 22,767 | | | | 515,514 | |
Banca Monte dei Paschi di Siena S.p.A. (a) (b) | | | 345,338 | | | | 83,962 | |
Enel Green Power S.p.A. | | | 152,537 | | | | 385,062 | |
Enel S.p.A. | | | 449,278 | | | | 1,971,528 | |
ENI S.p.A. | | | 176,421 | | | | 4,272,767 | |
Exor S.p.A. | | | 6,830 | | | | 272,740 | |
Fiat S.p.A. (b) | | | 59,813 | | | | 491,705 | |
Finmeccanica S.p.A. (b) | | | 28,782 | | | | 221,110 | |
Intesa Sanpaolo S.p.A. | | | 793,034 | | | | 1,971,897 | |
Luxottica Group S.p.A. | | | 11,742 | | | | 631,703 | |
Mediobanca S.p.A. (b) | | | 44,816 | | | | 394,972 | |
Pirelli & C S.p.A. | | | 17,048 | | | | 296,381 | |
Prysmian S.p.A. | | | 13,126 | | | | 338,993 | |
Saipem S.p.A. | | | 18,391 | | | | 397,678 | |
Snam S.p.A. | | | 138,413 | | | | 777,122 | |
Telecom Italia S.p.A. | | | 668,281 | | | | 666,100 | |
Telecom Italia S.p.A. - Risparmio Shares | | | 360,593 | | | | 283,632 | |
Terna Rete Elettrica Nazionale S.p.A. | | | 118,746 | | | | 597,773 | |
UniCredit S.p.A. | | | 296,069 | | | | 2,208,224 | |
Unione di Banche Italiane SCPA | | | 56,320 | | | | 385,235 | |
| | | | | | | | |
| | | | | | | 19,119,491 | |
| | | | | | | | |
See accompanying notes to financial statements.
MSF-6
Metropolitan Series Fund
MSCI EAFE Index Portfolio
Schedule of Investments as of December 31, 2013
Common Stocks—(Continued)
| | | | | | | | |
| Security Description | | Shares | | | Value | |
|
Japan—20.1% | |
Advantest Corp. (a) | | | 11,800 | | | $ | 147,211 | |
Aeon Co., Ltd. | | | 41,000 | | | | 557,105 | |
AEON Financial Service Co., Ltd. (a) | | | 5,000 | | | | 134,606 | |
Aeon Mall Co., Ltd. | | | 6,800 | | | | 191,426 | |
Air Water, Inc. | | | 10,000 | | | | 135,910 | |
Aisin Seiki Co., Ltd. | | | 13,000 | | | | 530,040 | |
Ajinomoto Co., Inc. | | | 44,000 | | | | 638,828 | |
Alfresa Holdings Corp. | | | 3,000 | | | | 149,332 | |
Amada Co., Ltd. | | | 27,000 | | | | 239,114 | |
ANA Holdings, Inc. (a) | | | 84,000 | | | | 168,115 | |
Aozora Bank, Ltd. (a) | | | 77,000 | | | | 218,609 | |
Asahi Glass Co., Ltd. (a) | | | 72,000 | | | | 448,887 | |
Asahi Group Holdings, Ltd. | | | 25,800 | | | | 729,453 | |
Asahi Kasei Corp. | | | 97,000 | | | | 761,754 | |
Asics Corp. | | | 11,000 | | | | 188,254 | |
Astellas Pharma, Inc. | | | 30,000 | | | | 1,781,039 | |
Bank of Kyoto, Ltd. (The) | | | 22,000 | | | | 184,462 | |
Bank of Yokohama, Ltd. (The) | | | 83,000 | | | | 464,336 | |
Benesse Holdings, Inc. | | | 5,000 | | | | 201,230 | |
Bridgestone Corp. (a) | | | 47,200 | | | | 1,792,862 | |
Brother Industries, Ltd. | | | 16,400 | | | | 224,976 | |
Calbee, Inc. (a) | | | 4,000 | | | | 97,510 | |
Canon, Inc. (a) | | | 78,400 | | | | 2,500,372 | |
Casio Computer Co., Ltd. | | | 16,900 | | | | 207,540 | |
Central Japan Railway Co. | | | 10,400 | | | | 1,229,022 | |
Chiba Bank, Ltd. (The) | | | 46,000 | | | | 311,477 | |
Chiyoda Corp. | | | 11,000 | | | | 160,405 | |
Chubu Electric Power Co., Inc. | | | 47,800 | | | | 619,049 | |
Chugai Pharmaceutical Co., Ltd. (a) | | | 15,100 | | | | 334,971 | |
Chugoku Bank, Ltd. (The) | | | 12,000 | | | | 152,686 | |
Chugoku Electric Power Co., Inc. (The) | | | 23,700 | | | | 369,704 | |
Citizen Holdings Co., Ltd. | | | 19,800 | | | | 167,527 | |
Credit Saison Co., Ltd. | | | 10,500 | | | | 277,476 | |
Dai Nippon Printing Co., Ltd. | | | 40,000 | | | | 425,886 | |
Dai-ichi Life Insurance Co., Ltd. (The) | | | 57,300 | | | | 962,254 | |
Daicel Corp. | | | 22,000 | | | | 179,638 | |
Daihatsu Motor Co., Ltd. | | | 14,000 | | | | 237,948 | |
Daiichi Sankyo Co., Ltd. | | | 45,200 | | | | 829,652 | |
Daikin Industries, Ltd. | | | 16,800 | | | | 1,050,424 | |
Dainippon Sumitomo Pharma Co., Ltd. | | | 12,000 | | | | 188,368 | |
Daito Trust Construction Co., Ltd. | | | 5,000 | | | | 468,350 | |
Daiwa House Industry Co., Ltd. | | | 41,000 | | | | 795,318 | |
Daiwa Securities Group, Inc. | | | 112,000 | | | | 1,123,827 | |
Dena Co., Ltd. (a) | | | 6,700 | | | | 141,352 | |
Denso Corp. | | | 33,900 | | | | 1,795,890 | |
Dentsu, Inc. | | | 15,200 | | | | 624,270 | |
Don Quijote Holdings Co., Ltd. | | | 4,100 | | | | 249,398 | |
East Japan Railway Co. | | | 23,000 | | | | 1,839,127 | |
Eisai Co., Ltd. | | | 18,200 | | | | 706,911 | |
Electric Power Development Co., Ltd. | | | 8,800 | | | | 257,140 | |
FamilyMart Co., Ltd. (a) | | | 4,300 | | | | 196,861 | |
FANUC Corp. | | | 13,100 | | | | 2,406,919 | |
Fast Retailing Co., Ltd. | | | 3,700 | | | | 1,534,404 | |
Fuji Electric Co., Ltd. | | | 43,000 | | | | 201,816 | |
Fuji Heavy Industries, Ltd. | | | 42,000 | | | | 1,208,841 | |
FUJIFILM Holdings Corp. | | | 32,600 | | | | 927,536 | |
Fujitsu, Ltd. (b) | | | 135,000 | | | | 700,298 | |
|
Japan—(Continued) | |
Fukuoka Financial Group, Inc. | | | 53,000 | | | | 233,273 | |
GungHo Online Entertainment, Inc. (a) (b) | | | 25,400 | | | | 183,649 | |
Gunma Bank, Ltd. (The) | | | 26,000 | | | | 145,720 | |
Hachijuni Bank, Ltd. (The) | | | 30,000 | | | | 175,500 | |
Hakuhodo DY Holdings, Inc. | | | 17,460 | | | | 135,781 | |
Hamamatsu Photonics KK | | | 4,800 | | | | 192,676 | |
Hankyu Hanshin Holdings, Inc. | | | 83,000 | | | | 449,911 | |
Hino Motors, Ltd. | | | 19,000 | | | | 300,026 | |
Hirose Electric Co., Ltd. | | | 2,200 | | | | 314,227 | |
Hiroshima Bank, Ltd. (The) | | | 38,000 | | | | 157,852 | |
Hisamitsu Pharmaceutical Co., Inc. | | | 4,700 | | | | 237,253 | |
Hitachi Construction Machinery Co., Ltd. (a) | | | 6,400 | | | | 137,347 | |
Hitachi Metals, Ltd. | | | 13,000 | | | | 184,285 | |
Hitachi, Ltd. | | | 337,000 | | | | 2,560,033 | |
Hokkaido Electric Power Co., Inc. (a) (b) | | | 13,000 | | | | 149,923 | |
Hokuhoku Financial Group, Inc. | | | 85,000 | | | | 170,015 | |
Hokuriku Electric Power Co. | | | 12,000 | | | | 163,303 | |
Honda Motor Co., Ltd. | | | 113,300 | | | | 4,681,924 | |
Hoya Corp. | | | 30,100 | | | | 839,376 | |
Hulic Co., Ltd. | | | 18,600 | | | | 276,565 | |
Ibiden Co., Ltd. | | | 8,300 | | | | 155,665 | |
Idemitsu Kosan Co., Ltd. | | | 6,400 | | | | 146,007 | |
IHI Corp. | | | 99,000 | | | | 428,908 | |
Iida Group Holdings Co., Ltd. (b) | | | 9,100 | | | | 181,991 | |
Inpex Corp. | | | 63,200 | | | | 811,903 | |
Isetan Mitsukoshi Holdings, Ltd. | | | 22,600 | | | | 322,877 | |
Isuzu Motors, Ltd. | | | 84,000 | | | | 524,750 | |
ITOCHU Corp. | | | 106,000 | | | | 1,314,463 | |
Iyo Bank, Ltd. (The) | | | 17,000 | | | | 167,261 | |
J Front Retailing Co., Ltd. | | | 30,000 | | | | 227,966 | |
Japan Airlines Co., Ltd. | | | 4,200 | | | | 207,621 | |
Japan Exchange Group, Inc. | | | 18,500 | | | | 527,758 | |
Japan Prime Realty Investment Corp. (a) | | | 49 | | | | 157,281 | |
Japan Real Estate Investment Corp. (REIT) | | | 80 | | | | 429,984 | |
Japan Retail Fund Investment Corp. (REIT) (a) | | | 135 | | | | 275,437 | |
Japan Tobacco, Inc. | | | 78,400 | | | | 2,555,883 | |
JFE Holdings, Inc. | | | 35,500 | | | | 848,135 | |
JGC Corp. | | | 14,000 | | | | 550,954 | |
Joyo Bank, Ltd. (The) | | | 54,000 | | | | 276,848 | |
JSR Corp. | | | 11,300 | | | | 219,537 | |
JTEKT Corp. | | | 11,600 | | | | 198,694 | |
JX Holdings, Inc. | | | 163,100 | | | | 841,392 | |
Kajima Corp. | | | 59,000 | | | | 222,489 | |
Kakaku.com, Inc. | | | 11,000 | | | | 193,816 | |
Kamigumi Co., Ltd. | | | 17,000 | | | | 156,377 | |
Kansai Electric Power Co., Inc. (The) (b) | | | 55,000 | | | | 634,293 | |
Kansai Paint Co., Ltd. | | | 15,000 | | | | 222,673 | |
Kao Corp. | | | 36,500 | | | | 1,151,811 | |
Kawasaki Heavy Industries, Ltd. | | | 96,000 | | | | 404,321 | |
KDDI Corp. | | | 36,600 | | | | 2,261,692 | |
Keikyu Corp. (a) | | | 36,000 | | | | 298,107 | |
Keio Corp. | | | 45,000 | | | | 301,277 | |
Keisei Electric Railway Co., Ltd. | | | 20,000 | | | | 184,729 | |
Keyence Corp. | | | 3,300 | | | | 1,415,990 | |
Kikkoman Corp. | | | 12,000 | | | | 227,783 | |
Kintetsu Corp. (a) | | | 121,120 | | | | 425,631 | |
Kirin Holdings Co., Ltd. (a) | | | 62,000 | | | | 894,813 | |
See accompanying notes to financial statements.
MSF-7
Metropolitan Series Fund
MSCI EAFE Index Portfolio
Schedule of Investments as of December 31, 2013
Common Stocks—(Continued)
| | | | | | | | |
| Security Description | | Shares | | | Value | |
|
Japan—(Continued) | |
Kobe Steel, Ltd. (a) (b) | | | 177,000 | | | $ | 304,028 | |
Komatsu, Ltd. | | | 63,800 | | | | 1,301,177 | |
Konami Corp. (a) | | | 8,300 | | | | 192,547 | |
Konica Minolta, Inc. | | | 37,000 | | | | 371,631 | |
Kubota Corp. | | | 74,000 | | | | 1,229,243 | |
Kuraray Co., Ltd. | | | 24,500 | | | | 292,870 | |
Kurita Water Industries, Ltd. | | | 7,100 | | | | 147,678 | |
Kyocera Corp. | | | 22,200 | | | | 1,112,604 | |
Kyowa Hakko Kirin Co., Ltd. (a) | | | 20,000 | | | | 221,003 | |
Kyushu Electric Power Co., Inc. (b) | | | 28,400 | | | | 363,594 | |
Lawson, Inc. (a) | | | 4,900 | | | | 367,492 | |
LIXIL Group Corp. | | | 18,800 | | | | 517,303 | |
M3, Inc. | | | 53 | | | | 133,220 | |
Makita Corp. | | | 7,200 | | | | 379,604 | |
Marubeni Corp. | | | 113,000 | | | | 814,752 | |
Marui Group Co., Ltd. | | | 16,000 | | | | 163,163 | |
Mazda Motor Corp. (b) | | | 180,000 | | | | 935,093 | |
MEIJI Holdings Co., Ltd. | | | 5,100 | | | | 328,926 | |
Miraca Holdings, Inc. | | | 4,000 | | | | 189,028 | |
Mitsubishi Chemical Holdings Corp. (a) | | | 95,500 | | | | 442,731 | |
Mitsubishi Corp. | | | 101,300 | | | | 1,948,022 | |
Mitsubishi Electric Corp. | | | 136,000 | | | | 1,713,709 | |
Mitsubishi Estate Co., Ltd. | | | 88,000 | | | | 2,642,224 | |
Mitsubishi Gas Chemical Co., Inc. | | | 26,000 | | | | 191,996 | |
Mitsubishi Heavy Industries, Ltd. | | | 204,000 | | | | 1,266,909 | |
Mitsubishi Logistics Corp. (a) | | | 9,000 | | | | 143,024 | |
Mitsubishi Materials Corp. | | | 79,000 | | | | 292,575 | |
Mitsubishi Motors Corp. (a) (b) | | | 31,999 | | | | 346,098 | |
Mitsubishi Tanabe Pharma Corp. | | | 15,000 | | | | 209,510 | |
Mitsubishi UFJ Financial Group, Inc. | | | 885,188 | | | | 5,864,331 | |
Mitsubishi UFJ Lease & Finance Co., Ltd. | | | 41,500 | | | | 255,699 | |
Mitsui & Co., Ltd. | | | 125,717 | | | | 1,756,459 | |
Mitsui Chemicals, Inc. | | | 57,000 | | | | 138,068 | |
Mitsui Fudosan Co., Ltd. | | | 58,000 | | | | 2,096,270 | |
Mitsui OSK Lines, Ltd. | | | 75,000 | | | | 339,148 | |
Mizuho Financial Group, Inc. | | | 1,577,400 | | | | 3,422,994 | |
MS&AD Insurance Group Holdings | | | 34,300 | | | | 924,572 | |
Murata Manufacturing Co., Ltd. | | | 14,100 | | | | 1,255,879 | |
Nabtesco Corp. | | | 7,000 | | | | 161,972 | |
Namco Bandai Holdings, Inc. | | | 12,500 | | | | 278,228 | |
NEC Corp. | | | 166,000 | | | | 375,471 | |
NGK Insulators, Ltd. | | | 17,000 | | | | 324,529 | |
NGK Spark Plug Co., Ltd. | | | 16,000 | | | | 380,178 | |
NHK Spring Co., Ltd. | | | 12,000 | | | | 135,903 | |
Nidec Corp. (a) | | | 7,200 | | | | 707,463 | |
Nikon Corp. | | | 23,100 | | | | 442,576 | |
Nintendo Co., Ltd. (a) | | | 7,500 | | | | 1,004,836 | |
Nippon Building Fund, Inc. (REIT) (a) | | | 94 | | | | 548,261 | |
Nippon Electric Glass Co., Ltd. | | | 28,000 | | | | 147,436 | |
Nippon Express Co., Ltd. | | | 59,000 | | | | 286,681 | |
Nippon Meat Packers, Inc. | | | 14,000 | | | | 241,049 | |
Nippon Paint Co., Ltd. | | | 13,000 | | | | 216,788 | |
Nippon Prologis REIT, Inc. | | | 17 | | | | 162,846 | |
Nippon Steel Sumitomo Metal Corp. | | | 530,000 | | | | 1,781,253 | |
Nippon Telegraph & Telephone Corp. | | | 26,100 | | | | 1,407,609 | |
Nippon Yusen KK | | | 101,000 | | | | 323,891 | |
Nissan Motor Co., Ltd. | | | 174,800 | | | | 1,474,405 | |
|
Japan—(Continued) | |
Nisshin Seifun Group, Inc. (a) | | | 14,300 | | | | 148,262 | |
Nissin Foods Holdings Co., Ltd. (a) | | | 4,700 | | | | 198,931 | |
Nitori Holdings Co., Ltd. | | | 2,650 | | | | 251,785 | |
Nitto Denko Corp. | | | 12,800 | | | | 542,936 | |
NKSJ Holdings, Inc. | | | 22,699 | | | | 634,387 | |
Nomura Holdings, Inc. | | | 253,100 | | | | 1,962,685 | |
Nomura Real Estate Holdings, Inc. | | | 7,000 | | | | 158,101 | |
Nomura Research Institute, Ltd. | | | 6,200 | | | | 195,905 | |
NSK, Ltd. (a) | | | 30,000 | | | | 375,137 | |
NTT Data Corp. | | | 7,600 | | | | 281,784 | |
NTT DoCoMo, Inc. | | | 106,500 | | | | 1,753,224 | |
Obayashi Corp. | | | 45,000 | | | | 257,112 | |
Odakyu Electric Railway Co., Ltd. (a) | | | 44,000 | | | | 399,607 | |
OJI Holdings Corp. | | | 68,000 | | | | 350,112 | |
Olympus Corp. (b) | | | 16,000 | | | | 508,455 | |
Omron Corp. | | | 13,600 | | | | 603,110 | |
Ono Pharmaceutical Co., Ltd. | | | 6,400 | | | | 561,576 | |
Oriental Land Co., Ltd. | | | 3,400 | | | | 491,228 | |
ORIX Corp. | | | 87,300 | | | | 1,540,809 | |
Osaka Gas Co., Ltd. | | | 127,000 | | | | 500,077 | |
Otsuka Corp. (a) | | | 1,200 | | | | 153,466 | |
Otsuka Holdings Co., Ltd. | | | 26,000 | | | | 752,351 | |
Panasonic Corp. | | | 154,900 | | | | 1,809,256 | |
Rakuten, Inc. (a) | | | 49,500 | | | | 737,921 | |
Resona Holdings, Inc. | | | 132,700 | | | | 678,165 | |
Ricoh Co., Ltd. | | | 45,000 | | | | 481,125 | |
Rinnai Corp. | | | 2,800 | | | | 218,650 | |
Rohm Co., Ltd. | | | 6,700 | | | | 327,369 | |
Sankyo Co., Ltd. | | | 3,600 | | | | 166,435 | |
Sanrio Co., Ltd. (a) | | | 3,400 | | | | 143,576 | |
Santen Pharmaceutical Co., Ltd. | | | 5,500 | | | | 257,207 | |
SBI Holdings, Inc. | | | 19,011 | | | | 289,090 | |
Secom Co., Ltd. | | | 15,800 | | | | 956,002 | |
Sega Sammy Holdings, Inc. | | | 13,300 | | | | 339,851 | |
Sekisui Chemical Co., Ltd. | | | 28,000 | | | | 344,872 | |
Sekisui House, Ltd. | | | 36,000 | | | | 505,056 | |
Seven & I Holdings Co., Ltd. | | | 53,100 | | | | 2,118,832 | |
Seven Bank, Ltd. | | | 43,000 | | | | 168,578 | |
Sharp Corp. (b) | | | 103,000 | | | | 327,945 | |
Shikoku Electric Power Co., Inc. (b) | | | 15,100 | | | | 226,924 | |
Shimadzu Corp. | | | 17,000 | | | | 148,331 | |
Shimamura Co., Ltd. | | | 1,400 | | | | 131,600 | |
Shimano, Inc. | | | 5,600 | | | | 482,662 | |
Shimizu Corp. | | | 37,000 | | | | 187,478 | |
Shin-Etsu Chemical Co., Ltd. | | | 27,800 | | | | 1,628,727 | |
Shinsei Bank, Ltd. | | | 100,000 | | | | 245,201 | |
Shionogi & Co., Ltd. | | | 19,400 | | | | 422,281 | |
Shiseido Co., Ltd. (a) | | | 29,300 | | | | 472,736 | |
Shizuoka Bank, Ltd. (The) | | | 41,000 | | | | 439,455 | |
Showa Denko KK (a) | | | 129,000 | | | | 183,273 | |
Showa Shell Sekiyu KK (a) | | | 14,000 | | | | 142,613 | |
SMC Corp. | | | 3,700 | | | | 936,436 | |
SoftBank Corp. | | | 66,800 | | | | 5,867,284 | |
Sojitz Corp. | | | 113,600 | | | | 202,692 | |
Sony Corp. (a) | | | 70,600 | | | | 1,221,775 | |
Sony Financial Holdings, Inc. | | | 12,800 | | | | 233,631 | |
Stanley Electric Co., Ltd. | | | 11,800 | | | | 270,948 | |
See accompanying notes to financial statements.
MSF-8
Metropolitan Series Fund
MSCI EAFE Index Portfolio
Schedule of Investments as of December 31, 2013
Common Stocks—(Continued)
| | | | | | | | |
| Security Description | | Shares | | | Value | |
|
Japan—(Continued) | |
Sumitomo Chemical Co., Ltd. | | | 109,000 | | | $ | 428,417 | |
Sumitomo Corp. | | | 81,000 | | | | 1,020,832 | |
Sumitomo Electric Industries, Ltd. | | | 56,334 | | | | 943,242 | |
Sumitomo Heavy Industries, Ltd. | | | 39,000 | | | | 180,064 | |
Sumitomo Metal Mining Co., Ltd. | | | 40,000 | | | | 525,508 | |
Sumitomo Mitsui Financial Group, Inc. | | | 88,500 | | | | 4,579,188 | |
Sumitomo Mitsui Trust Holdings, Inc. | | | 232,262 | | | | 1,229,408 | |
Sumitomo Realty & Development Co., Ltd. | | | 25,000 | | | | 1,248,509 | |
Sumitomo Rubber Industries, Ltd. | | | 12,500 | | | | 178,346 | |
Suntory Beverage & Food, Ltd. | | | 8,400 | | | | 268,339 | |
Suruga Bank, Ltd. | | | 13,000 | | | | 234,107 | |
Suzuken Co., Ltd. | | | 5,300 | | | | 171,990 | |
Suzuki Motor Corp. | | | 26,200 | | | | 707,085 | |
Sysmex Corp. | | | 6,200 | | | | 366,921 | |
T&D Holdings, Inc. | | | 38,800 | | | | 544,569 | |
Taiheiyo Cement Corp. | | | 82,000 | | | | 315,818 | |
Taisei Corp. (a) | | | 69,000 | | | | 314,899 | |
Taisho Pharmaceutical Holdings Co., Ltd. | | | 3,000 | | | | 206,744 | |
Takashimaya Co., Ltd. | | | 19,000 | | | | 190,054 | |
Takeda Pharmaceutical Co., Ltd. | | | 54,200 | | | | 2,492,918 | |
TDK Corp. | | | 8,400 | | | | 404,024 | |
Teijin, Ltd. | | | 66,000 | | | | 147,349 | |
Terumo Corp. | | | 10,800 | | | | 522,752 | |
THK Co., Ltd. | | | 7,700 | | | | 192,799 | |
Tobu Railway Co., Ltd. | | | 73,000 | | | | 354,955 | |
Toho Co., Ltd. | | | 8,500 | | | | 187,431 | |
Toho Gas Co., Ltd. (a) | | | 31,000 | | | | 151,330 | |
Tohoku Electric Power Co., Inc. (b) | | | 29,800 | | | | 336,153 | |
Tokio Marine Holdings, Inc. | | | 49,400 | | | | 1,657,983 | |
Tokyo Electric Power Co., Inc. (a) (b) | | | 97,600 | | | | 480,880 | |
Tokyo Electron, Ltd. | | | 12,400 | | | | 685,350 | |
Tokyo Gas Co., Ltd. | | | 170,000 | | | | 839,313 | |
Tokyo Tatemono Co., Ltd. (a) | | | 29,000 | | | | 323,684 | |
Tokyu Corp. | | | 76,000 | | | | 494,476 | |
Tokyu Fudosan Holdings Corp. (b) | | | 37,000 | | | | 349,832 | |
TonenGeneral Sekiyu KK (a) | | | 18,000 | | | | 165,516 | |
Toppan Printing Co., Ltd. | | | 41,000 | | | | 329,099 | |
Toray Industries, Inc. | | | 111,000 | | | | 770,564 | |
Toshiba Corp. | | | 283,000 | | | | 1,193,257 | |
TOTO, Ltd. (a) | | | 19,000 | | | | 302,219 | |
Toyo Seikan Group Holdings, Ltd. | | | 10,200 | | | | 220,007 | |
Toyo Suisan Kaisha, Ltd. | | | 6,000 | | | | 180,736 | |
Toyota Industries Corp. | | | 12,600 | | | | 570,597 | |
Toyota Motor Corp. | | | 191,400 | | | | 11,669,879 | |
Toyota Tsusho Corp. | | | 14,200 | | | | 353,328 | |
Trend Micro, Inc. (a) | | | 7,000 | | | | 245,803 | |
Ube Industries, Ltd. | | | 68,000 | | | | 145,859 | |
Unicharm Corp. | | | 7,600 | | | | 434,688 | |
United Urban Investment Corp. | | | 167 | | | | 240,667 | |
USS Co., Ltd. | | | 16,600 | | | | 228,503 | |
West Japan Railway Co. | | | 11,700 | | | | 508,757 | |
Yahoo Japan Corp. | | | 101,500 | | | | 566,472 | |
Yakult Honsha Co., Ltd. | | | 6,300 | | | | 319,129 | |
Yamada Denki Co., Ltd. (a) | | | 55,900 | | | | 183,267 | |
Yamaguchi Financial Group, Inc. (a) | | | 15,000 | | | | 139,377 | |
Yamaha Corp. | | | 11,000 | | | | 175,288 | |
Yamaha Motor Co., Ltd. | | | 17,800 | | | | 267,985 | |
|
Japan—(Continued) | |
Yamato Holdings Co., Ltd. | | | 27,000 | | | | 547,668 | |
Yaskawa Electric Corp. | | | 18,000 | | | | 286,022 | |
Yokogawa Electric Corp. | | | 16,300 | | | | 251,286 | |
Yokohama Rubber Co., Ltd. (The) | | | 15,000 | | | | 148,073 | |
| | | | | | | | |
| | | | | | | 192,094,353 | |
| | | | | | | | |
|
Luxembourg—0.2% | |
ArcelorMittal | | | 66,772 | | | | 1,195,765 | |
RTL Group S.A. (b) | | | 2,700 | | | | 349,514 | |
Tenaris S.A. (a) | | | 32,705 | | | | 715,945 | |
| | | | | | | | |
| | | | | | | 2,261,224 | |
| | | | | | | | |
|
Netherlands—3.1% | |
Aegon NV | | | 117,488 | | | | 1,111,005 | |
Akzo Nobel NV | | | 16,759 | | | | 1,302,429 | |
ASML Holding NV | | | 24,785 | | | | 2,331,245 | |
CNH Industrial NV (b) | | | 61,911 | | | | 708,212 | |
Corio NV | | | 4,074 | | | | 183,190 | |
Delta Lloyd NV | | | 13,121 | | | | 326,966 | |
European Aeronautic Defence and Space Co. NV | | | 40,799 | | | | 3,149,845 | |
Fugro NV | | | 4,445 | | | | 266,329 | |
Gemalto NV (a) | | | 5,659 | | | | 623,903 | |
Heineken Holding NV | | | 6,283 | | | | 399,103 | |
Heineken NV | | | 16,408 | | | | 1,112,846 | |
ING Groep NV (b) | | | 262,304 | | | | 3,673,968 | |
Koninklijke Ahold NV | | | 72,518 | | | | 1,304,219 | |
Koninklijke Boskalis Westminster NV | | | 6,001 | | | | 318,705 | |
Koninklijke DSM NV | | | 10,134 | | | | 800,001 | |
Koninklijke KPN NV (b) | | | 230,706 | | | | 747,533 | |
Koninklijke Philips NV | | | 65,768 | | | | 2,428,377 | |
Koninklijke Vopak NV | | | 4,391 | | | | 257,688 | |
OCI (b) | | | 6,200 | | | | 279,910 | |
QIAGEN NV (b) | | | 14,898 | | | | 348,133 | |
Randstad Holding NV | | | 9,402 | | | | 611,475 | |
Reed Elsevier NV | | | 48,042 | | | | 1,022,440 | |
STMicroelectronics NV (a) | | | 44,693 | | | | 360,628 | |
TNT Express NV | | | 24,146 | | | | 224,958 | |
Unilever NV | | | 112,970 | | | | 4,568,657 | |
Wolters Kluwer NV | | | 20,745 | | | | 594,670 | |
Ziggo NV | | | 11,596 | | | | 531,569 | |
| | | | | | | | |
| | | | | | | 29,588,004 | |
| | | | | | | | |
|
New Zealand—0.1% | |
Auckland International Airport, Ltd. | | | 110,236 | | | | 320,332 | |
Fletcher Building, Ltd. | | | 46,652 | | | | 325,156 | |
Ryman Healthcare, Ltd. | | | 29,900 | | | | 193,030 | |
Telecom Corp. of New Zealand, Ltd. (a) | | | 132,317 | | | | 251,144 | |
| | | | | | | | |
| | | | | | | 1,089,662 | |
| | | | | | | | |
|
Norway—0.8% | |
Aker Solutions ASA | | | 11,775 | | | | 210,471 | |
DNB ASA | | | 66,462 | | | | 1,190,777 | |
Gjensidige Forsikring ASA | | | 14,357 | | | | 274,010 | |
Norsk Hydro ASA (a) | | | 92,923 | | | | 415,291 | |
See accompanying notes to financial statements.
MSF-9
Metropolitan Series Fund
MSCI EAFE Index Portfolio
Schedule of Investments as of December 31, 2013
Common Stocks—(Continued)
| | | | | | | | |
| Security Description | | Shares | | | Value | |
|
Norway—(Continued) | |
Orkla ASA | | | 54,230 | | | $ | 423,744 | |
Seadrill, Ltd. | | | 27,606 | | | | 1,131,231 | |
Statoil ASA | | | 75,596 | | | | 1,835,749 | |
Subsea 7 S.A. | | | 18,500 | | | | 354,642 | |
Telenor ASA | | | 45,452 | | | | 1,085,107 | |
Yara International ASA (a) | | | 12,261 | | | | 529,579 | |
| | | | | | | | |
| | | | | | | 7,450,601 | |
| | | | | | | | |
|
Portugal—0.2% | |
Banco Espirito Santo S.A. (b) | | | 142,170 | | | | 203,723 | |
EDP - Energias de Portugal S.A. (a) | | | 131,492 | | | | 483,802 | |
Galp Energia SGPS S.A. | | | 24,066 | | | | 395,779 | |
Jeronimo Martins SGPS S.A. (a) | | | 16,641 | | | | 326,142 | |
Portugal Telecom SGPS S.A. (a) | | | 48,993 | | | | 213,522 | |
| | | | | | | | |
| | | | | | | 1,622,968 | |
| | | | | | | | |
|
Singapore—1.4% | |
Ascendas Real Estate Investment Trust | | | 141,000 | | | | 246,176 | |
CapitaCommercial Trust (REIT) (a) | | | 143,000 | | | | 164,463 | |
CapitaLand, Ltd. | | | 174,000 | | | | 418,706 | |
CapitaMall Trust (REIT) | | | 153,200 | | | | 231,582 | |
CapitaMalls Asia, Ltd. | | | 101,000 | | | | 157,289 | |
City Developments, Ltd. (a) | | | 34,000 | | | | 259,237 | |
ComfortDelGro Corp., Ltd. | | | 153,000 | | | | 243,743 | |
DBS Group Holdings, Ltd. | | | 115,467 | | | | 1,568,607 | |
Genting Singapore plc | | | 418,200 | | | | 496,732 | |
Global Logistic Properties, Ltd. | | | 212,000 | | | | 486,182 | |
Golden Agri-Resources, Ltd. | | | 492,569 | | | | 213,030 | |
Hutchison Port Holdings Trust - Class U | | | 350,000 | | | | 236,396 | |
Jardine Cycle & Carriage, Ltd. | | | 8,000 | | | | 228,474 | |
Keppel Corp., Ltd. | | | 102,700 | | | | 912,577 | |
Keppel Land, Ltd. | | | 54,000 | | | | 143,376 | |
Oversea-Chinese Banking Corp., Ltd. | | | 179,880 | | | | 1,455,412 | |
Sembcorp Industries, Ltd. | | | 71,000 | | | | 309,143 | |
Sembcorp Marine, Ltd. (a) | | | 63,000 | | | | 222,565 | |
Singapore Airlines, Ltd. (a) | | | 36,940 | | | | 304,964 | |
Singapore Exchange, Ltd. | | | 56,000 | | | | 322,752 | |
Singapore Press Holdings, Ltd. (a) | | | 107,250 | | | | 350,636 | |
Singapore Technologies Engineering, Ltd. | | | 130,000 | | | | 408,953 | |
Singapore Telecommunications, Ltd. | | | 557,820 | | | | 1,620,527 | |
StarHub, Ltd. | | | 44,000 | | | | 149,821 | |
United Overseas Bank, Ltd. | | | 88,392 | | | | 1,489,505 | |
UOL Group, Ltd. | | | 33,000 | | | | 161,989 | |
Wilmar International, Ltd. (a) | | | 130,000 | | | | 352,679 | |
| | | | | | | | |
| | | | | | | 13,155,516 | |
| | | | | | | | |
|
Spain—3.2% | |
Abertis Infraestructuras S.A. | | | 28,628 | | | | 638,650 | |
ACS Actividades de Construccion y Servicios S.A. | | | 10,111 | | | | 351,069 | |
Amadeus IT Holding S.A. - A Shares (a) | | | 26,116 | | | | 1,120,485 | |
Banco Bilbao Vizcaya Argentaria S.A. | | | 400,349 | | | | 4,968,592 | |
Banco de Sabadell S.A. (a) | | | 245,068 | | | | 641,577 | |
Banco Popular Espanol S.A. (b) | | | 90,004 | | | | 544,307 | |
Banco Santander S.A. | | | 791,812 | | | | 7,157,241 | |
Bankia S.A. (a) (b) | | | 281,294 | | | | 483,268 | |
|
Spain—(Continued) | |
CaixaBank | | | 121,181 | | | | 632,635 | |
Distribuidora Internacional de Alimentacion S.A. | | | 40,028 | | | | 358,679 | |
Enagas S.A. | | | 15,504 | | | | 406,539 | |
Ferrovial S.A. | | | 28,234 | | | | 549,980 | |
Gas Natural SDG S.A. | | | 24,586 | | | | 635,439 | |
Grifols S.A. | | | 9,470 | | | | 454,400 | |
Iberdrola S.A. | | | 316,189 | | | | 2,025,612 | |
Inditex S.A. | | | 15,081 | | | | 2,499,535 | |
International Consolidated Airlines Group
S.A. - Class DI (b) | | | 56,287 | | | | 375,551 | |
Mapfre S.A. (a) | | | 74,474 | | | | 320,195 | |
Red Electrica Corp. S.A. (a) | | | 6,689 | | | | 447,905 | |
Repsol S.A. | | | 57,722 | | | | 1,460,801 | |
Telefonica S.A. | | | 284,361 | | | | 4,649,671 | |
Zardoya Otis S.A. (a) | | | 9,160 | | | | 165,943 | |
| | | | | | | | |
| | | | | | | 30,888,074 | |
| | | | | | | | |
|
Sweden—3.1% | |
Alfa Laval AB | | | 20,852 | | | | 537,158 | |
Assa Abloy AB - Class B | | | 23,170 | | | | 1,230,176 | |
Atlas Copco AB - A Shares | | | 47,637 | | | | 1,330,516 | |
Atlas Copco AB - B Shares | | | 26,827 | | | | 684,112 | |
Boliden AB | | | 18,744 | | | | 288,624 | |
Electrolux AB - Series B (a) | | | 17,118 | | | | 451,302 | |
Elekta AB - B Shares (a) | | | 26,324 | | | | 404,432 | |
Getinge AB - B Shares | | | 13,484 | | | | 463,165 | |
Hennes & Mauritz AB - B Shares | | | 67,689 | | | | 3,132,450 | |
Hexagon AB - B Shares | | | 17,090 | | | | 542,796 | |
Husqvarna AB - B Shares (a) | | | 25,677 | | | | 155,284 | |
Industrivarden AB - C Shares | | | 8,655 | | | | 165,265 | |
Investment AB Kinnevik - B Shares | | | 14,418 | | | | 670,171 | |
Investor AB - B Shares | | | 31,588 | | | | 1,091,514 | |
Lundin Petroleum AB (b) | | | 16,017 | | | | 313,090 | |
Millicom International Cellular S.A. (a) | | | 5,384 | | | | 537,231 | |
Nordea Bank AB | | | 209,876 | | | | 2,846,031 | |
Sandvik AB | | | 73,011 | | | | 1,034,981 | |
Scania AB - B Shares | | | 21,772 | | | | 428,264 | |
Securitas AB - B Shares | | | 21,462 | | | | 229,021 | |
Skandinaviska Enskilda Banken AB - Class A | | | 103,979 | | | | 1,377,613 | |
Skanska AB - B Shares | | | 23,981 | | | | 493,100 | |
SKF AB - B Shares | | | 26,654 | | | | 700,498 | |
Svenska Cellulosa AB - B Shares | | | 40,587 | | | | 1,255,780 | |
Svenska Handelsbanken AB - A Shares | | | 34,300 | | | | 1,696,765 | |
Swedbank AB - A Shares | | | 61,954 | | | | 1,750,264 | |
Swedish Match AB | | | 14,499 | | | | 466,887 | |
Tele2 AB - B Shares | | | 21,032 | | | | 238,937 | |
Telefonaktiebolaget LM Ericsson - B Shares | | | 209,117 | | | | 2,564,467 | |
TeliaSonera AB | | | 162,992 | | | | 1,361,337 | |
Volvo AB - B Shares | | | 103,330 | | | | 1,364,017 | |
| | | | | | | | |
| | | | | | | 29,805,248 | |
| | | | | | | | |
|
Switzerland—8.7% | |
ABB, Ltd. (b) | | | 151,669 | | | | 4,019,167 | |
Actelion, Ltd. (b) | | | 7,563 | | | | 643,071 | |
Adecco S.A. (b) | | | 8,604 | | | | 685,408 | |
Aryzta AG (b) | | | 5,635 | | | | 434,494 | |
See accompanying notes to financial statements.
MSF-10
Metropolitan Series Fund
MSCI EAFE Index Portfolio
Schedule of Investments as of December 31, 2013
Common Stocks—(Continued)
| | | | | | | | |
| Security Description | | Shares | | | Value | |
|
Switzerland—(Continued) | |
Baloise Holding AG | | | 3,194 | | | $ | 409,307 | |
Barry Callebaut AG (a) (b) | | | 132 | | | | 166,100 | |
Cie Financiere Richemont S.A. | | | 36,003 | | | | 3,613,719 | |
Coca-Cola HBC AG (b) | | | 13,800 | | | | 403,207 | |
Credit Suisse Group AG (b) | | | 106,196 | | | | 3,270,312 | |
EMS-Chemie Holding AG | | | 579 | | | | 206,954 | |
Geberit AG | | | 2,659 | | | | 815,882 | |
Givaudan S.A. (b) | | | 558 | | | | 801,850 | |
Holcim, Ltd. (b) | | | 16,305 | | | | 1,229,585 | |
Julius Baer Group, Ltd. (b) | | | 15,588 | | | | 753,927 | |
Kuehne & Nagel International AG | | | 4,135 | | | | 545,487 | |
Lindt & Spruengli AG | | | 7 | | | | 378,627 | |
Lindt & Spruengli AG (Participation Certifcate) | | | 55 | | | | 248,663 | |
Lonza Group AG (b) | | | 3,152 | | | | 300,949 | |
Nestle S.A. | | | 223,685 | | | | 16,470,107 | |
Novartis AG | | | 159,564 | | | | 12,808,749 | |
Pargesa Holding S.A. | | | 1,694 | | | | 137,245 | |
Partners Group Holding AG | | | 1,228 | | | | 328,627 | |
Roche Holding AG | | | 48,734 | | | | 13,702,441 | |
Schindler Holding AG | | | 4,650 | | | | 688,252 | |
SGS S.A. | | | 367 | | | | 850,165 | |
Sika AG | | | 137 | | | | 488,654 | |
Sonova Holding AG (b) | | | 3,130 | | | | 423,223 | |
Sulzer AG | | | 1,649 | | | | 267,564 | |
Swatch Group AG (The) | | | 5,323 | | | | 1,768,597 | |
Swiss Life Holding AG (b) | | | 2,159 | | | | 450,717 | |
Swiss Prime Site AG (b) | | | 3,833 | | | | 298,286 | |
Swiss Re AG (b) | | | 24,745 | | | | 2,294,232 | |
Swisscom AG | | | 1,507 | | | | 799,335 | |
Syngenta AG | | | 6,383 | | | | 2,552,223 | |
Transocean, Ltd. | | | 24,746 | | | | 1,214,988 | |
UBS AG (b) | | | 252,938 | | | | 4,833,179 | |
Wolseley plc | | | 18,912 | | | | 1,074,170 | |
Zurich Insurance Group AG (b) | | | 10,297 | | | | 3,003,431 | |
| | | | | | | | |
| | | | | | | 83,380,894 | |
| | | | | | | | |
|
United Kingdom—20.6% | |
3i Group plc | | | 63,549 | | | | 405,509 | |
Aberdeen Asset Management plc (a) | | | 61,345 | | | | 510,962 | |
Admiral Group plc (a) | | | 16,009 | | | | 347,559 | |
Aggreko plc (a) | | | 18,556 | | | | 525,719 | |
AMEC plc | | | 19,387 | | | | 350,170 | |
Anglo American plc | | | 95,352 | | | | 2,095,866 | |
Antofagasta plc | | | 26,957 | | | | 369,940 | |
ARM Holdings plc | | | 94,583 | | | | 1,720,406 | |
Associated British Foods plc | | | 24,859 | | | | 1,007,251 | |
AstraZeneca plc | | | 86,000 | | | | 5,102,102 | |
Aviva plc | | | 205,068 | | | | 1,528,210 | |
Babcock International Group plc | | | 24,050 | | | | 539,912 | |
BAE Systems plc | | | 224,576 | | | | 1,623,296 | |
Barclays plc | | | 1,059,500 | | | | 4,794,672 | |
BG Group plc | | | 236,047 | | | | 5,087,792 | |
BHP Billiton plc | | | 146,472 | | | | 4,542,276 | |
BP plc | | | 1,312,137 | | | | 10,631,234 | |
British American Tobacco plc | | | 133,028 | | | | 7,138,777 | |
British Land Co. plc | | | 62,096 | | | | 647,338 | |
|
United Kingdom—(Continued) | |
British Sky Broadcasting Group plc | | | 73,819 | | | | 1,032,764 | |
BT Group plc | | | 549,280 | | | | 3,459,094 | |
Bunzl plc | | | 22,401 | | | | 538,406 | |
Burberry Group plc | | | 32,742 | | | | 822,752 | |
Capita Group plc | | | 48,717 | | | | 838,184 | |
Carnival plc | | | 12,088 | | | | 499,273 | |
Centrica plc | | | 369,393 | | | | 2,127,737 | |
Cobham plc | | | 73,272 | | | | 333,277 | |
Compass Group plc | | | 126,746 | | | | 2,032,590 | |
Croda International plc | | | 9,658 | | | | 393,346 | |
Diageo plc | | | 174,086 | | | | 5,751,313 | |
Direct Line Insurance Group plc | | | 77,733 | | | | 321,875 | |
easyJet plc (a) | | | 10,815 | | | | 275,397 | |
Fresnillo plc | | | 11,783 | | | | 146,133 | |
G4S plc | | | 106,542 | | | | 463,551 | |
GKN plc | | | 107,131 | | | | 663,317 | |
GlaxoSmithKline plc | | | 336,884 | | | | 8,986,874 | |
GlencoreXstrata plc (b) | | | 735,853 | | | | 3,826,041 | |
Hammerson plc | | | 56,484 | | | | 469,843 | |
Hargreaves Lansdown plc | | | 16,913 | | | | 380,380 | |
HSBC Holdings plc | | | 1,291,727 | | | | 14,170,081 | |
ICAP plc | | | 36,213 | | | | 271,371 | |
IMI plc | | | 22,920 | | | | 581,037 | |
Imperial Tobacco Group plc | | | 66,898 | | | | 2,596,720 | |
Inmarsat plc | | | 28,473 | | | | 356,763 | |
InterContinental Hotels Group plc | | | 20,173 | | | | 672,941 | |
Intertek Group plc | | | 10,631 | | | | 554,743 | |
Intu Properties plc (a) | | | 48,962 | | | | 251,821 | |
Invensys plc (a) | | | 53,428 | | | | 450,908 | |
Investec plc | | | 41,855 | | | | 303,573 | |
J Sainsbury plc | | | 85,611 | | | | 518,688 | |
Johnson Matthey plc | | | 13,894 | | | | 756,658 | |
Kingfisher plc | | | 164,859 | | | | 1,054,110 | |
Land Securities Group plc | | | 52,350 | | | | 835,874 | |
Legal & General Group plc | | | 410,178 | | | | 1,513,786 | |
Lloyds Banking Group plc (b) | | | 3,451,816 | | | | 4,512,589 | |
London Stock Exchange Group plc | | | 12,221 | | | | 350,901 | |
Marks & Spencer Group plc | | | 118,772 | | | | 853,902 | |
Meggitt plc | | | 55,862 | | | | 489,403 | |
Melrose Industries plc | | | 85,700 | | | | 434,196 | |
National Grid plc | | | 254,654 | | | | 3,328,014 | |
Next plc | | | 11,690 | | | | 1,055,459 | |
Old Mutual plc | | | 337,381 | | | | 1,057,397 | |
Pearson plc | | | 56,693 | | | | 1,259,467 | |
Persimmon plc (b) | | | 20,663 | | | | 424,571 | |
Petrofac, Ltd. | | | 17,337 | | | | 351,905 | |
Prudential plc | | | 177,484 | | | | 3,972,991 | |
Randgold Resources, Ltd. | | | 6,351 | | | | 398,568 | |
Reckitt Benckiser Group plc | | | 44,859 | | | | 3,572,169 | |
Reed Elsevier plc | | | 81,102 | | | | 1,209,075 | |
Resolution, Ltd. | | | 99,349 | | | | 584,433 | |
Rexam plc | | | 51,922 | | | | 456,643 | |
Rio Tinto plc | | | 88,154 | | | | 4,975,386 | |
Rolls-Royce Holdings plc (b) | | | 130,394 | | | | 2,762,185 | |
Royal Bank of Scotland Group plc (b) | | | 147,994 | | | | 833,296 | |
Royal Dutch Shell plc - A Shares | | | 263,389 | | | | 9,461,148 | |
Royal Dutch Shell plc - B Shares | | | 173,340 | | | | 6,524,408 | |
See accompanying notes to financial statements.
MSF-11
Metropolitan Series Fund
MSCI EAFE Index Portfolio
Schedule of Investments as of December 31, 2013
Common Stocks—(Continued)
| | | | | | | | |
| Security Description | |
Shares | | | Value | |
|
United Kingdom—(Continued) | |
RSA Insurance Group plc | | | 233,187 | | | $ | 353,201 | |
SABMiller plc | | | 67,875 | | | | 3,496,077 | |
Sage Group plc (The) | | | 79,455 | | | | 532,919 | |
Schroders plc | | | 6,754 | | | | 291,686 | |
Segro plc | | | 61,844 | | | | 342,290 | |
Serco Group plc | | | 34,317 | | | | 283,653 | |
Severn Trent plc | | | 16,575 | | | | 468,174 | |
Smith & Nephew plc | | | 66,221 | | | | 944,560 | |
Smiths Group plc | | | 25,680 | | | | 631,587 | |
SSE plc | | | 67,077 | | | | 1,525,643 | |
Standard Chartered plc | | | 165,795 | | | | 3,736,337 | |
Standard Life plc | | | 174,865 | | | | 1,042,161 | |
Tate & Lyle plc | | | 33,576 | | | | 450,296 | |
TESCO plc | | | 553,815 | | | | 3,067,711 | |
Travis Perkins plc | | | 16,708 | | | | 520,135 | |
TUI Travel plc | | | 32,223 | | | | 220,647 | |
Tullow Oil plc | | | 61,905 | | | | 879,218 | |
Unilever plc | | | 88,241 | | | | 3,620,146 | |
United Utilities Group plc | | | 48,207 | | | | 537,569 | |
Vodafone Group plc | | | 3,341,896 | | | | 13,139,619 | |
Weir Group plc (The) | | | 13,923 | | | | 492,088 | |
Whitbread plc | | | 12,742 | | | | 792,105 | |
William Hill plc | | | 58,853 | | | | 391,842 | |
WM Morrison Supermarkets plc | | | 166,578 | | | | 721,546 | |
WPP plc | | | 91,344 | | | | 2,096,532 | |
| | | | | | | | |
| | | | | | | 196,666,060 | |
| | | | | | | | |
Total Common Stocks
(Cost $742,544,736) | | | | | | | 912,456,322 | |
| | | | | | | | |
|
| Investment Company Security—3.1% | |
|
United States—3.1% | |
iShares MSCI EAFE ETF (c)
(Cost $28,187,904) | | | 446,100 | | | | 29,915,466 | |
| | | | | | | | |
|
| Preferred Stocks—0.6% | |
|
Germany—0.6% | |
Bayerische Motoren Werke (BMW) AG | | | 3,505 | | | | 299,936 | |
Fuchs Petrolub SE (a) | | | 2,450 | | | | 240,142 | |
Henkel AG & Co. KGaA | | | 12,771 | | | | 1,483,999 | |
Porsche Automobil Holding SE | | | 10,260 | | | | 1,072,562 | |
Volkswagen AG | | | 9,896 | | | | 2,784,839 | |
| | | | | | | | |
Total Preferred Stocks
(Cost $2,663,214) | | | | | | | 5,881,478 | |
| | | | | | | | |
|
| Rights—0.0% | |
|
Spain—0.0% | |
Repsol S.A., Expires 01/09/14 (a) (b)
(Cost $37,639) | | | 57,722 | | | | 39,451 | |
| | | | | | | | |
|
| Short-Term Investments—4.5% | |
| Security Description | | Shares/ Principal
Amount* | | | Value | |
| | |
Discount Notes—0.4% | | | | | | | | |
Federal Home Loan Bank
0.046%, 01/06/14 (d) | | | 350,000 | | | $ | 349,998 | |
0.051%, 01/22/14 (d) | | | 500,000 | | | | 499,985 | |
0.066%, 01/22/14 (d) | | | 650,000 | | | | 649,975 | |
0.076%, 03/21/14 (d) | | | 1,825,000 | | | | 1,824,700 | |
| | | | | | | | |
| | | | | | | 3,324,658 | |
| | | | | | | | |
| | |
Mutual Fund—3.6% | | | | | | | | |
State Street Navigator Securities Lending MET Portfolio (e) | | | 34,172,485 | | | | 34,172,485 | |
| | | | | | | | |
| | |
U.S. Treasury—0.5% | | | | | | | | |
U.S. Treasury Bills
0.051%, 05/15/14 (d) | | | 325,000 | | | | 324,940 | |
0.077%, 05/15/14 (d) | | | 700,000 | | | | 699,803 | |
0.077%, 05/15/14 (d) | | | 200,000 | | | | 199,943 | |
0.078%, 05/15/14 (d) | | | 200,000 | | | | 199,943 | |
0.084%, 05/15/14 (d) | | | 150,000 | | | | 149,954 | |
0.086%, 05/15/14 (d) | | | 350,000 | | | | 349,889 | |
0.088%, 05/15/14 (d) | | | 700,000 | | | | 699,773 | |
0.093%, 05/15/14 (d) | | | 2,075,000 | | | | 2,074,290 | |
| | | | | | | | |
| | | | | | | 4,698,535 | |
| | | | | | | | |
Total Short-Term Investments
(Cost $42,195,678) | | | | | | | 42,195,678 | |
| | | | | | | | |
Total Investments—103.7%
(Cost $815,629,171)(f) | | | | | | | 990,488,395 | |
Other assets and liabilities (net)—(3.7)% | | | | | | | (34,959,459 | ) |
| | | | | | | | |
| Net Assets—100.0% | | | | | | $ | 955,528,936 | |
| | | | | | | | |
| * | Principal amount stated in U.S. dollars unless otherwise noted. |
| (a) | All or a portion of the security was held on loan. As of December 31, 2013, the market value of securities loaned was $32,762,132 and the collateral received consisted of cash in the amount of $34,172,485 and non-cash collateral with a value of $527,749. The cash collateral is invested in a money market fund managed by an affiliate of the custodian. The non-cash collateral received consists primarily of government securities and bank letters of credit, and is held for the benefit of the Portfolio at the Portfolio’s custodian. The Portfolio cannot repledge or resell this collateral. As such, this collateral is excluded from the Statement of Assets and Liabilities. |
| (b) | Non-income producing security. |
| (c) | All or a portion of the security was pledged as collateral against open futures contracts. As of December 31, 2013, the market value of securities pledged was $670,900. |
| (d) | The rate shown represents the discount rate at the time of purchase by the Portfolio. |
| (e) | Represents investment of cash collateral received from securities lending transactions. |
| (f) | As of December 31, 2013, the aggregate cost of investments for federal income tax purposes was $826,109,775. The aggregate unrealized appreciation and depreciation of investments were $250,249,634 and $(85,871,014), respectively, resulting in net unrealized appreciation of $164,378,620 for federal income tax purposes. |
| (ETF)— | Exchange-Traded Fund |
| (REIT)— | A Real Estate Investment Trust is a pooled investment vehicle that invests primarily in income-producing real estate or real estate related loans or interest. |
See accompanying notes to financial statements.
MSF-12
Metropolitan Series Fund
MSCI EAFE Index Portfolio
Schedule of Investments as of December 31, 2013
Portfolio Composition as of December 31, 2013
| | | | |
Ten Largest Industries as of
December 31, 2013 (Unaudited) | | % of
Net Assets | |
Commercial Banks | | | 12.8 | |
Pharmaceuticals | | | 8.2 | |
Oil, Gas & Consumable Fuels | | | 5.9 | |
Insurance | | | 5.1 | |
Automobiles | | | 3.8 | |
Food Products | | | 3.6 | |
Metals & Mining | | | 3.6 | |
Chemicals | | | 3.2 | |
Diversified Telecommunication Services | | | 3.0 | |
Machinery | | | 2.6 | |
Futures Contracts
| | | | | | | | | | | | | | | | | | | | |
Futures Contracts—Long | | Expiration
Date | | | Number of
Contracts | | | Notional
Amount | | | Unrealized
Appreciation | |
MSCI EAFE E-Mini Index Futures | | | 03/21/14 | | | | 50 | | | | USD | | | | 4,586,252 | | | $ | 208,248 | |
| | | | | | | | | | | | | | | | | | | | |
| (USD)— | United States Dollar |
See accompanying notes to financial statements.
MSF-13
Metropolitan Series Fund
MSCI EAFE Index Portfolio
Schedule of Investments as of December 31, 2013
Fair Value Hierarchy
Accounting principles generally accepted in the United States of America (“GAAP”) define fair market value as the price that the Portfolio would receive to sell an asset or pay to transfer a liability in an orderly transaction between market participants at the measurement date. It establishes a fair value hierarchy that prioritizes inputs to valuation methods and requires disclosure of the fair value hierarchy that segregates fair value measurements into three levels. Levels 1, 2 and 3 of the fair value hierarchy are defined as follows:
Level 1- unadjusted quoted prices in active markets for identical investments
Level 2- other significant observable inputs (including, but not limited to, unadjusted quoted prices for similar investments in markets that are either active or inactive; inputs other than quoted prices that are observable such as interest rates, yield curves, volatilities, prepayment speeds, loss severities, credit risks, default rates, etc.)
Level 3- significant unobservable inputs based on the best information available in the circumstances, to the extent observable inputs are unavailable (including the Portfolio’s own assumptions in determining the fair value of investments)
The inputs or methodologies used for valuing investments are not necessarily an indication of the risk associated with investing in them. Changes to the inputs or methodologies used may result in transfers between levels, which will be recognized as of the beginning of the reporting period. Information on transfers between Level 1 and Level 2, if any, will be disclosed following the fair value hierarchy table below. A reconciliation of Level 3 securities, if any, will also be disclosed following the fair value hierarchy table. For more information about the Portfolio’s policy regarding the valuation of investments, please refer to the Notes to Financial Statements.
The following table summarizes the fair value hierarchy of the Portfolio’s investments as of December 31, 2013:
| | | | | | | | | | | | | | | | |
| Description | | Level 1 | | | Level 2 | | | Level 3 | | | Total | |
| Common Stocks | | | | | | | | | | | | | | | | |
Australia | | $ | 86,145 | | | $ | 68,030,199 | | | $ | — | | | $ | 68,116,344 | |
Austria | | | — | | | | 2,468,989 | | | | — | | | | 2,468,989 | |
Belgium | | | — | | | | 10,885,280 | | | | — | | | | 10,885,280 | |
China | | | — | | | | 129,071 | | | | — | | | | 129,071 | |
Denmark | | | — | | | | 10,825,623 | | | | — | | | | 10,825,623 | |
Finland | | | — | | | | 8,366,636 | | | | — | | | | 8,366,636 | |
France | | | — | | | | 87,335,876 | | | | — | | | | 87,335,876 | |
Germany | | | — | | | | 80,302,826 | | | | — | | | | 80,302,826 | |
Hong Kong | | | — | | | | 26,367,373 | | | | — | | | | 26,367,373 | |
Ireland | | | 432,039 | | | | 6,113,300 | | | | — | | | | 6,545,339 | |
Israel | | | — | | | | 3,990,870 | | | | — | | | | 3,990,870 | |
Italy | | | — | | | | 19,119,491 | | | | — | | | | 19,119,491 | |
Japan | | | 181,991 | | | | 191,912,362 | | | | — | | | | 192,094,353 | |
Luxembourg | | | — | | | | 2,261,224 | | | | — | | | | 2,261,224 | |
Netherlands | | | 623,903 | | | | 28,964,101 | | | | — | | | | 29,588,004 | |
New Zealand | | | — | | | | 1,089,662 | | | | — | | | | 1,089,662 | |
Norway | | | — | | | | 7,450,601 | | | | — | | | | 7,450,601 | |
Portugal | | | ��� | | | | 1,622,968 | | | | — | | | | 1,622,968 | |
Singapore | | | — | | | | 13,155,516 | | | | — | | | | 13,155,516 | |
Spain | | | — | | | | 30,888,074 | | | | — | | | | 30,888,074 | |
Sweden | | | — | | | | 29,805,248 | | | | — | | | | 29,805,248 | |
Switzerland | | | — | | | | 83,380,894 | | | | — | | | | 83,380,894 | |
United Kingdom | | | — | | | | 196,666,060 | | | | — | | | | 196,666,060 | |
Total Common Stocks | | | 1,324,078 | | | | 911,132,244 | | | | — | | | | 912,456,322 | |
Total Investment Company Security* | | | 29,915,466 | | | | — | | | | — | | | | 29,915,466 | |
Total Preferred Stocks* | | | — | | | | 5,881,478 | | | | — | | | | 5,881,478 | |
Total Rights* | | | 39,451 | | | | — | | | | — | | | | 39,451 | |
See accompanying notes to financial statements.
MSF-14
Metropolitan Series Fund
MSCI EAFE Index Portfolio
Schedule of Investments as of December 31, 2013
Fair Value Hierarchy—(Continued)
| | | | | | | | | | | | | | | | |
| Description | | Level 1 | | | Level 2 | | | Level 3 | | | Total | |
| Short-Term Investments | | | | | | | | | | | | | | | | |
Discount Notes | | $ | — | | | $ | 3,324,658 | | | $ | — | | | $ | 3,324,658 | |
Mutual Fund | | | 34,172,485 | | | | — | | | | — | | | | 34,172,485 | |
U.S. Treasury | | | — | | | | 4,698,535 | | | | — | | | | 4,698,535 | |
Total Short-Term Investments | | | 34,172,485 | | | | 8,023,193 | | | | — | | | | 42,195,678 | |
Total Investments | | $ | 65,451,480 | | | $ | 925,036,915 | | | $ | — | | | $ | 990,488,395 | |
| | | | | | | | | | | | | | | | | |
Collateral for Securities Loaned (Liability) | | $ | — | | | $ | (34,172,485 | ) | | $ | — | | | $ | (34,172,485 | ) |
| Futures Contracts | | | | | | | | | | | | | | | | |
Futures Contracts (Unrealized Appreciation) | | $ | 208,248 | | | $ | — | | | $ | — | | | $ | 208,248 | |
| * | See Schedule of Investments for additional detailed categorizations. |
Transfers from Level 2 to Level 1 in the amount of $511,742 were due to the discontinuation of a systematic fair valuation model factor.
See accompanying notes to financial statements.
MSF-15
Metropolitan Series Fund
MSCI EAFE Index Portfolio
Statement of Assets and Liabilities
December 31, 2013
| | | | |
Assets | | | | |
Investments at value (a) (b) | | $ | 990,488,395 | |
Cash | | | 31,287 | |
Cash denominated in foreign currencies (c) | | | 63,172 | |
Receivable for: | | | | |
Investments sold | | | 248,997 | |
Fund shares sold | | | 787,150 | |
Dividends | | | 1,426,161 | |
Variation margin on futures contracts | | | 13,750 | |
Prepaid expenses | | | 2,123 | |
| | | | |
Total Assets | | | 993,061,035 | |
Liabilities | | | | |
Collateral for securities loaned | | | 34,172,485 | |
Payables for: | | | | |
Investments purchased | | | 2,263,719 | |
Fund shares redeemed | | | 504,787 | |
Accrued expenses: | | | | |
Management fees | | | 233,166 | |
Distribution and service fees | | | 116,124 | |
Deferred trustees’ fees | | | 48,554 | |
Other expenses | | | 193,264 | |
| | | | |
Total Liabilities | | | 37,532,099 | |
| | | | |
Net Assets | | $ | 955,528,936 | |
| | | | |
Net assets consist of: | | | | |
Paid in surplus | | $ | 800,572,442 | |
Undistributed net investment income | | | 16,343,144 | |
Accumulated net realized loss | | | (36,411,243 | ) |
Unrealized appreciation on investments, futures contracts and foreign currency transactions | | | 175,024,593 | |
| | | | |
Net Assets | | $ | 955,528,936 | |
| | | | |
Net Assets | | | | |
Class A | | $ | 394,453,784 | |
Class B | | | 422,913,291 | |
Class E | | | 38,858,598 | |
Class G | | | 99,303,263 | |
Capital Shares Outstanding* | | | | |
Class A | | | 28,527,702 | |
Class B | | | 31,152,446 | |
Class E | | | 2,825,108 | |
Class G | | | 7,350,926 | |
Net Asset Value, Offering Price and Redemption Price Per Share | | | | |
Class A | | $ | 13.83 | |
Class B | | | 13.58 | |
Class E | | | 13.75 | |
Class G | | | 13.51 | |
| * | The Portfolio is authorized to issue an unlimited number of shares. |
| (a) | Identified cost of investments was $815,629,171. |
| (b) | Includes securities loaned at value of $32,762,132. |
| (c) | Identified cost of cash denominated in foreign currencies was $62,541. |
Statement of Operations
Year Ended December 31, 2013
| | | | |
Investment Income | | | | |
Dividends (a) | | $ | 26,286,300 | |
Interest | | | 2,540 | |
Securities lending income | | | 918,494 | |
| | | | |
Total investment income | | | 27,207,334 | |
Expenses | | | | |
Management fees | | | 2,566,600 | |
Administration fees | | | 15,797 | |
Custodian and accounting fees | | | 478,787 | |
Distribution and service fees—Class B | | | 984,120 | |
Distribution and service fees—Class E | | | 56,440 | |
Distribution and service fees—Class G | | | 259,739 | |
Audit and tax services | | | 37,723 | |
Legal | | | 27,754 | |
Trustees’ fees and expenses | | | 44,481 | |
Shareholder reporting | | | 168,384 | |
Insurance | | | 4,420 | |
Miscellaneous | | | 72,041 | |
| | | | |
Total expenses | | | 4,716,286 | |
Less management fee waiver | | | (17,777 | ) |
| | | | |
Net expenses | | | 4,698,509 | |
| | | | |
Net Investment Income | | | 22,508,825 | |
| | | | |
Net Realized and Unrealized Gain | | | | |
| Net realized gain (loss) on: | | | | |
Investments | | | 7,234,010 | |
Futures contracts | | | 627,856 | |
Foreign currency transactions | | | (186,924 | ) |
| | | | |
Net realized gain | | | 7,674,942 | |
| | | | |
| Net change in unrealized appreciation (depreciation) on: | | | | |
Investments | | | 139,460,020 | |
Futures contracts | | | 183,529 | |
Foreign currency transactions | | | (54,357 | ) |
| | | | |
Net change in unrealized appreciation | | | 139,589,192 | |
| | | | |
Net realized and unrealized gain | | | 147,264,134 | |
| | | | |
Net Increase in Net Assets from Operations | | $ | 169,772,959 | |
| | | | |
| (a) | Net of foreign withholding taxes of $1,940,450. |
See accompanying notes to financial statements.
MSF-16
Metropolitan Series Fund
MSCI EAFE Index Portfolio
Statements of Changes in Net Assets
| | | | | | | | |
| | | Year Ended
December 31,
2013 | | | Year Ended
December 31,
2012 | |
Increase (Decrease) in Net Assets: | | | | | | | | |
From Operations | | | | | | | | |
Net investment income | | $ | 22,508,825 | | | $ | 22,898,242 | |
Net realized gain (loss) | | | 7,674,942 | | | | (7,731,235 | ) |
Net change in unrealized appreciation | | | 139,589,192 | | | | 110,344,265 | |
| | | | | | | | |
Increase in net assets from operations | | | 169,772,959 | | | | 125,511,272 | |
| | | | | | | | |
From Distributions to Shareholders | | | | | | | | |
Net investment income | | | | | | | | |
Class A | | | (9,990,444 | ) | | | (8,879,126 | ) |
Class B | | | (11,350,490 | ) | | | (10,064,808 | ) |
Class E | | | (1,112,534 | ) | | | (1,073,279 | ) |
Class G | | | (2,474,557 | ) | | | (1,823,471 | ) |
| | | | | | | | |
Total distributions | | | (24,928,025 | ) | | | (21,840,684 | ) |
| | | | | | | | |
Increase (decrease) in net assets from capital share transactions | | | 30,762,370 | | | | (30,472,900 | ) |
| | | | | | | | |
Total increase in net assets | | | 175,607,304 | | | | 73,197,688 | |
| | |
Net Assets | | | | | | | | |
Beginning of period | | | 779,921,632 | | | | 706,723,944 | |
| | | | | | | | |
End of period | | $ | 955,528,936 | | | $ | 779,921,632 | |
| | | | | | | | |
Undistributed Net Investment Income | | | | | | | | |
End of period | | $ | 16,343,144 | | | $ | 18,312,704 | |
| | | | | | | | |
Other Information:
Capital Shares
Transactions in capital shares were as follows:
| | | | | | | | | | | | | | | | |
| | | Year Ended
December 31, 2013 | | | Year Ended
December 31, 2012 | |
| | | Shares | | | Value | | | Shares | | | Value | |
Class A | | | | | | | | | | | | | | | | |
Sales | | | 7,067,968 | | | $ | 88,601,835 | | | | 2,721,443 | | | $ | 29,306,923 | |
Reinvestments | | | 846,648 | | | | 9,990,444 | | | | 836,076 | | | | 8,879,126 | |
Redemptions | | | (4,787,744 | ) | | | (59,795,824 | ) | | | (5,856,533 | ) | | | (63,022,255 | ) |
| | | | | | | | | | | | | | | | |
Net increase (decrease) | | | 3,126,872 | | | $ | 38,796,455 | | | | (2,299,014 | ) | | $ | (24,836,206 | ) |
| | | | | | | | | | | | | | | | |
Class B | | | | | | | | | | | | | | | | |
Sales | | | 1,931,611 | | | $ | 23,970,765 | | | | 3,406,019 | | | $ | 34,713,506 | |
Reinvestments | | | 978,490 | | | | 11,350,490 | | | | 962,219 | | | | 10,064,808 | |
Redemptions | | | (4,356,077 | ) | | | (53,974,265 | ) | | | (4,527,085 | ) | | | (48,789,131 | ) |
| | | | | | | | | | | | | | | | |
Net decrease | | | (1,445,976 | ) | | $ | (18,653,010 | ) | | | (158,847 | ) | | $ | (4,010,817 | ) |
| | | | | | | | | | | | | | | | |
Class E | | | | | | | | | | | | | | | | |
Sales | | | 85,294 | | | $ | 1,055,384 | | | | 171,387 | | | $ | 1,753,832 | |
Reinvestments | | | 94,684 | | | | 1,112,534 | | | | 101,444 | | | | 1,073,279 | |
Redemptions | | | (528,435 | ) | | | (6,611,245 | ) | | | (584,439 | ) | | | (6,362,036 | ) |
| | | | | | | | | | | | | | | | |
Net decrease | | | (348,457 | ) | | $ | (4,443,327 | ) | | | (311,608 | ) | | $ | (3,534,925 | ) |
| | | | | | | | | | | | | | | | |
Class G | | | | | | | | | | | | | | | | |
Sales | | | 2,516,369 | | | $ | 30,525,341 | | | | 1,401,594 | | | $ | 14,496,697 | |
Reinvestments | | | 214,247 | | | | 2,474,557 | | | | 174,997 | | | | 1,823,471 | |
Redemptions | | | (1,471,213 | ) | | | (17,937,646 | ) | | | (1,372,063 | ) | | | (14,411,120 | ) |
| | | | | | | | | | | | | | | | |
Net increase | | | 1,259,403 | | | $ | 15,062,252 | | | | 204,528 | | | $ | 1,909,048 | |
| | | | | | | | | | | | | | | | |
Increase (decrease) derived from capital shares transactions | | | | | | $ | 30,762,370 | | | | | | | $ | (30,472,900 | ) |
| | | | | | | | | | | | | | | | |
See accompanying notes to financial statements.
MSF-17
Metropolitan Series Fund
MSCI EAFE Index Portfolio
Financial Highlights
| | | | | | | | | | | | | | | | | | | | |
| Selected per share data | | | |
| | | Class A | |
| | | Year Ended December 31, | |
| | | 2013 | | | 2012 | | | 2011 | | | 2010 | | | 2009 | |
Net Asset Value, Beginning of Period | | $ | 11.72 | | | $ | 10.22 | | | $ | 11.95 | | | $ | 11.34 | | | $ | 9.36 | |
| | | | | | | | | | | | | | | | | | | | |
Income (Loss) from Investment Operations | | | | | | | | | | | | | | | | | | | | |
Net investment income (a) | | | 0.35 | | | | 0.35 | | | | 0.36 | | | | 0.28 | | | | 0.28 | |
Net realized and unrealized gain (loss) on investments | | | 2.15 | | | | 1.49 | | | | (1.80 | ) | | | 0.63 | | | | 2.20 | |
| | | | | | | | | | | | | | | | | | | | |
Total from investment operations | | | 2.50 | | | | 1.84 | | | | (1.44 | ) | | | 0.91 | | | | 2.48 | |
| | | | | | | | | | | | | | | | | | | | |
Less Distributions | | | | | | | | | | | | | | | | | | | | |
Distributions from net investment income | | | (0.39 | ) | | | (0.34 | ) | | | (0.29 | ) | | | (0.30 | ) | | | (0.43 | ) |
Distributions from net realized capital gains | | | 0.00 | | | | 0.00 | | | | 0.00 | | | | 0.00 | | | | (0.07 | ) |
| | | | | | | | | | | | | | | | | | | | |
Total distributions | | | (0.39 | ) | | | (0.34 | ) | | | (0.29 | ) | | | (0.30 | ) | | | (0.50 | ) |
| | | | | | | | | | | | | | | | | | | | |
Net Asset Value, End of Period | | $ | 13.83 | | | $ | 11.72 | | | $ | 10.22 | | | $ | 11.95 | | | $ | 11.34 | |
| | | | | | | | | | | | | | | | | | | | |
Total Return (%) (b) | | | 21.86 | | | | 18.33 | | | | (12.50 | ) | | | 8.19 | | | | 28.67 | |
| | | | | |
Ratios/Supplemental Data | | | | | | | | | | | | | | | | | | | | |
Gross ratio of expenses to average net assets (%) | | | 0.40 | | | | 0.41 | | | | 0.41 | | | | 0.41 | | | | 0.44 | |
Net ratio of expenses to average net assets (%) (c) | | | 0.40 | | | | 0.40 | | | | 0.41 | | | | 0.40 | | | | 0.43 | |
Ratio of net investment income to average net assets (%) | | | 2.76 | | | | 3.25 | | | | 3.09 | | | | 2.59 | | | | 2.87 | |
Portfolio turnover rate (%) | | | 10 | | | | 8 | | | | 11 | | | | 11 | | | | 13 | |
Net assets, end of period (in millions) | | $ | 394.5 | | | $ | 297.7 | | | $ | 283.2 | | | $ | 332.7 | | | $ | 334.6 | |
| | | | | | | | | | | | | | | | | | | | |
| | | Class B | |
| | | Year Ended December 31, | |
| | | 2013 | | | 2012 | | | 2011 | | | 2010 | | | 2009 | |
Net Asset Value, Beginning of Period | | $ | 11.52 | | | $ | 10.05 | | | $ | 11.75 | | | $ | 11.16 | | | $ | 9.21 | |
| | | | | | | | | | | | | | | | | | | | |
Income (Loss) from Investment Operations | | | | | | | | | | | | | | | | | | | | |
Net investment income (a) | | | 0.31 | | | | 0.32 | | | | 0.32 | | | | 0.25 | | | | 0.25 | |
Net realized and unrealized gain (loss) on investments | | | 2.11 | | | | 1.46 | | | | (1.76 | ) | | | 0.62 | | | | 2.16 | |
| | | | | | | | | | | | | | | | | | | | |
Total from investment operations | | | 2.42 | | | | 1.78 | | | | (1.44 | ) | | | 0.87 | | | | 2.41 | |
| | | | | | | | | | | | | | | | | | | | |
Less Distributions | | | | | | | | | | | | | | | | | | | | |
Distributions from net investment income | | | (0.36 | ) | | | (0.31 | ) | | | (0.26 | ) | | | (0.28 | ) | | | (0.39 | ) |
Distributions from net realized capital gains | | | 0.00 | | | | 0.00 | | | | 0.00 | | | | 0.00 | | | | (0.07 | ) |
| | | | | | | | | | | | | | | | | | | | |
Total distributions | | | (0.36 | ) | | | (0.31 | ) | | | (0.26 | ) | | | (0.28 | ) | | | (0.46 | ) |
| | | | | | | | | | | | | | | | | | | | |
Net Asset Value, End of Period | | $ | 13.58 | | | $ | 11.52 | | | $ | 10.05 | | | $ | 11.75 | | | $ | 11.16 | |
| | | | | | | | | | | | | | | | | | | | |
Total Return (%) (b) | | | 21.52 | | | | 18.02 | | | | (12.65 | ) | | | 7.91 | | | | 28.29 | |
| | | | | |
Ratios/Supplemental Data | | | | | | | | | | | | | | | | | | | | |
Gross ratio of expenses to average net assets (%) | | | 0.65 | | | | 0.66 | | | | 0.66 | | | | 0.66 | | | | 0.69 | |
Net ratio of expenses to average net assets (%) (c) | | | 0.65 | | | | 0.65 | | | | 0.66 | | | | 0.65 | | | | 0.68 | |
Ratio of net investment income to average net assets (%) | | | 2.55 | | | | 2.99 | | | | 2.83 | | | | 2.32 | | | | 2.60 | |
Portfolio turnover rate (%) | | | 10 | | | | 8 | | | | 11 | | | | 11 | | | | 13 | |
Net assets, end of period (in millions) | | $ | 422.9 | | | $ | 375.4 | | | $ | 329.2 | | | $ | 339.0 | | | $ | 280.2 | |
Please see following page for Financial Highlights footnote legend.
See accompanying notes to financial statements.
MSF-18
Metropolitan Series Fund
MSCI EAFE Index Portfolio
Financial Highlights
| | | | | | | | | | | | | | | | | | | | |
| Selected per share data | | | |
| | | Class E | |
| | | Year Ended December 31, | |
| | | 2013 | | | 2012 | | | 2011 | | | 2010 | | | 2009 | |
Net Asset Value, Beginning of Period | | $ | 11.66 | | | $ | 10.17 | | | $ | 11.89 | | | $ | 11.29 | | | $ | 9.31 | |
| | | | | | | | | | | | | | | | | | | | |
Income (Loss) from Investment Operations | | | | | | | | | | | | | | | | | | | | |
Net investment income (a) | | | 0.33 | | | | 0.33 | | | | 0.34 | | | | 0.27 | | | | 0.27 | |
Net realized and unrealized gain (loss) on investments | | | 2.13 | | | | 1.48 | | | | (1.79 | ) | | | 0.62 | | | | 2.19 | |
| | | | | | | | | | | | | | | | | | | | |
Total from investment operations | | | 2.46 | | | | 1.81 | | | | (1.45 | ) | | | 0.89 | | | | 2.46 | |
| | | | | | | | | | | | | | | | | | | | |
Less Distributions | | | | | | | | | | | | | | | | | | | | |
Distributions from net investment income | | | (0.37 | ) | | | (0.32 | ) | | | (0.27 | ) | | | (0.29 | ) | | | (0.41 | ) |
Distributions from net realized capital gains | | | 0.00 | | | | 0.00 | | | | 0.00 | | | | 0.00 | | | | (0.07 | ) |
| | | | | | | | | | | | | | | | | | | | |
Total distributions | | | (0.37 | ) | | | (0.32 | ) | | | (0.27 | ) | | | (0.29 | ) | | | (0.48 | ) |
| | | | | | | | | | | | | | | | | | | | |
Net Asset Value, End of Period | | $ | 13.75 | | | $ | 11.66 | | | $ | 10.17 | | | $ | 11.89 | | | $ | 11.29 | |
| | | | | | | | | | | | | | | | | | | | |
Total Return (%) (b) | | | 21.62 | | | | 18.13 | | | | (12.59 | ) | | | 8.00 | | | | 28.51 | |
| | | | | |
Ratios/Supplemental Data | | | | | | | | | | | | | | | | | | | | |
Gross ratio of expenses to average net assets (%) | | | 0.55 | | | | 0.56 | | | | 0.56 | | | | 0.56 | | | | 0.59 | |
Net ratio of expenses to average net assets (%) (c) | | | 0.55 | | | | 0.55 | | | | 0.56 | | | | 0.55 | | | | 0.58 | |
Ratio of net investment income to average net assets (%) | | | 2.66 | | | | 3.11 | | | | 2.94 | | | | 2.45 | | | | 2.77 | |
Portfolio turnover rate (%) | | | 10 | | | | 8 | | | | 11 | | | | 11 | | | | 13 | |
Net assets, end of period (in millions) | | $ | 38.9 | | | $ | 37.0 | | | $ | 35.5 | | | $ | 47.9 | | | $ | 50.8 | |
| | | | | | | | | | | | | | | | | | | | |
| | | Class G | |
| | | Year Ended December 31, | |
| | | 2013 | | | 2012 | | | 2011 | | | 2010 | | | 2009(d) | |
Net Asset Value, Beginning of Period | | $ | 11.47 | | | $ | 10.01 | | | $ | 11.70 | | | $ | 11.12 | | | $ | 7.93 | |
| | | | | | | | | | | | | | | | | | | | |
Income (Loss) from Investment Operations | | | | | | | | | | | | | | | | | | | | |
Net investment income (a) | | | 0.31 | | | | 0.31 | | | | 0.31 | | | | 0.23 | | | | 0.10 | |
Net realized and unrealized gain (loss) on investments | | | 2.09 | | | | 1.46 | | | | (1.75 | ) | | | 0.62 | | | | 3.09 | |
| | | | | | | | | | | | | | | | | | | | |
Total from investment operations | | | 2.40 | | | | 1.77 | | | | (1.44 | ) | | | 0.85 | | | | 3.19 | |
| | | | | | | | | | | | | | | | | | | | |
Less Distributions | | | | | | | | | | | | | | | | | | | | |
Distributions from net investment income | | | (0.36 | ) | | | (0.31 | ) | | | (0.25 | ) | | | (0.27 | ) | | | 0.00 | |
| | | | | | | | | | | | | | | | | | | | |
Total distributions | | | (0.36 | ) | | | (0.31 | ) | | | (0.25 | ) | | | (0.27 | ) | | | 0.00 | |
| | | | | | | | | | | | | | | | | | | | |
Net Asset Value, End of Period | | $ | 13.51 | | | $ | 11.47 | | | $ | 10.01 | | | $ | 11.70 | | | $ | 11.12 | |
| | | | | | | | | | | | | | | | | | | | |
Total Return (%) (b) | | | 21.44 | | | | 17.94 | | | | (12.65 | ) | | | 7.76 | | | | 40.23 | (e) |
| | | | | |
Ratios/Supplemental Data | | | | | | | | | | | | | | | | | | | | |
Gross ratio of expenses to average net assets (%) | | | 0.70 | | | | 0.71 | | | | 0.71 | | | | 0.71 | | | | 0.74 | (f) |
Net ratio of expenses to average net assets (%) (c) | | | 0.70 | | | | 0.70 | | | | 0.71 | | | | 0.70 | | | | 0.73 | (f) |
Ratio of net investment income to average net assets (%) | | | 2.49 | | | | 2.94 | | | | 2.80 | | | | 2.16 | | | | 1.32 | (f) |
Portfolio turnover rate (%) | | | 10 | | | | 8 | | | | 11 | | | | 11 | | | | 13 | |
Net assets, end of period (in millions) | | $ | 99.3 | | | $ | 69.8 | | | $ | 58.9 | | | $ | 45.2 | | | $ | 12.6 | |
| (a) | Per share amounts based on average shares outstanding during the period. |
| (b) | Total return does not reflect any insurance, sales, separate account or administrative charges of variable annuity or life insurance contracts or any additional expenses that contract owners may bear under their variable contracts. If these charges were included, the returns would be lower. |
| (c) | Net ratio of expenses to average net assets includes the effect of management fee waivers as detailed in Note 6 of the Notes to Financial Statements. |
| (d) | Commencement of operations was April 28, 2009. |
| (e) | Periods less than one year are not computed on an annualized basis. |
| (f) | Computed on an annualized basis. |
See accompanying notes to financial statements.
MSF-19
Metropolitan Series Fund
MSCI EAFE Index Portfolio
Notes to Financial Statements—December 31, 2013
1. Organization
Metropolitan Series Fund (the “Trust”) is organized as a Delaware statutory trust and registered under the Investment Company Act of 1940, as amended (the “1940 Act”), as an open-end management investment company. The Trust is currently comprised of thirty series, each of which operates as a distinct investment vehicle of the Trust. The portfolio included in this report is MSCI EAFE Index Portfolio (the “Portfolio”), which is diversified. Shares in the Portfolio are not offered directly to the general public and are currently available only to separate accounts established by Metropolitan Life Insurance Company (“MetLife”) and other affiliated life insurance companies.
The Portfolio has registered and offers four classes of shares: Class A, B, E, and G shares. Shares of each Class of the Portfolio represent an equal pro rata interest in the Portfolio and generally give the shareholder the same voting, dividend, liquidation, and other rights. Investment income, realized and unrealized capital gains and losses, the common expenses of the Portfolio, and certain Portfolio-level expense reductions, if any, are allocated on a pro rata basis to each Class based on the relative net assets of each Class to the net assets of the Portfolio. Each Class of shares differs in its respective distribution plan and such distribution expenses are allocated to that Class.
2. Significant Accounting Policies
The preparation of financial statements in conformity with accounting principles generally accepted in the United States of America (“GAAP”) requires management to make estimates and assumptions that affect the reported amounts of assets and liabilities and disclosure of contingent assets and liabilities as of the date of the financial statements and the reported amounts of income and expenses during the reporting period. Actual results could differ from those estimates. In the preparation of these financial statements, management has evaluated events and transactions subsequent to December 31, 2013 through the date the financial statements were issued.
The following is a summary of significant accounting policies consistently followed by the Portfolio in the preparation of its financial statements.
Investment Valuation and Fair Value Measurements - Debt securities (other than short term obligations with a remaining maturity of sixty days or less), including corporate, convertible and municipal bonds and notes; obligations of the U.S. treasury and U.S. government agencies; sovereign issues; floating rate loans; and non-U.S. bonds, are generally valued on the basis of evaluated or composite bid quotations obtained from independent pricing services and/or brokers and dealers selected by MetLife Advisers, LLC (“MetLife Advisers” or the “Adviser”), an affiliate of MetLife, Inc., pursuant to authorization of the Board of Trustees of the Trust (the “Board” or “Trustees”). Such quotations utilize matrix pricing, which considers observable inputs including, among other things, issuer details, maturity dates, interest rates, yield curves, rates of prepayment, credit risks/spreads, default rates, reported trades, broker dealer quotes and quoted prices for similar securities. Securities that use similar valuation techniques and inputs as described above are generally categorized as Level 2 within the fair value hierarchy.
Mortgage and asset-backed securities are usually issued as separate tranches, or classes, of securities within each deal. These securities are also generally valued on the basis of evaluated or composite bid quotations obtained from independent pricing services and/or brokers and dealers selected by the Adviser pursuant to authorization of the Board. The pricing models for these securities usually consider tranche-level attributes, estimated cash flows and market-based yield spreads for each tranche and current market data, and incorporate deal collateral performance, as available. Mortgage and asset-backed securities that use similar valuation techniques and inputs as described above are generally categorized as Level 2 within the fair value hierarchy.
Short term obligations with a remaining maturity of sixty days or less are generally valued at amortized cost, which approximates fair market value, and are generally categorized as Level 2 within the fair value hierarchy.
Domestic and foreign equity securities, such as common stock, exchange-traded funds, rights, warrants, and preferred stock, that are traded on a securities exchange, are generally valued at their last sale price on the exchange or market in which they are principally traded on the valuation date, or, if no sales occurred on that day, at the last reported bid price. Equity securities traded over-the-counter are generally valued at the last reported sale price. Valuation adjustments may be applied to certain foreign equity securities that are traded solely on foreign exchanges that close before the close of the U.S. market to account for the market movement between the close of the foreign exchanges and the close of the U.S. market. The Portfolio may use a systematic fair valuation model provided by an independent third party to value securities principally traded in these foreign markets in order to adjust for possible stale pricing that may occur between the close of the foreign exchanges and the time of the Portfolio valuation. Foreign equity securities using these valuation adjustments are generally categorized as Level 2 within the fair value hierarchy. Equity securities that are actively traded, and have no valuation adjustments applied, are categorized as Level 1 within the fair value hierarchy. Other equity securities traded on inactive markets, or valued in reference to similar instruments traded on active markets, are generally categorized as Level 2 within the fair value hierarchy.
MSF-20
Metropolitan Series Fund
MSCI EAFE Index Portfolio
Notes to Financial Statements—December 31, 2013—(Continued)
Investments in registered open-end management investment companies are valued at reported net asset value per share on the valuation date and are categorized as Level 1 within the fair value hierarchy.
Forward foreign currency exchange contracts are valued through an independent pricing service based on the mean between closing bid and ask prices of the forward currency rates in the London foreign exchange markets on a daily basis as provided by a reliable bank or dealer. These contracts are generally categorized as Level 2 within the fair value hierarchy.
Options, whether on securities, indices, futures contracts, or otherwise, traded on exchanges are valued at the last sale price available as of the close of business on the valuation date or, if there is no such price available, at the mean between the last reported bid and ask prices. These types of options are categorized as Level 1 within the fair value hierarchy. Futures contracts, which are traded on commodity exchanges, are valued at their closing prices as of the close of such exchanges and are categorized as Level 1 within the fair value hierarchy.
Options and futures contracts that are traded over-the-counter are generally valued on the basis of quotations provided by broker-dealers or prices provided by pricing service providers who use a series of techniques, including simulation pricing models, to determine the value of the contracts. The pricing models use inputs that are observed from actively quoted markets such as issuer details, indices, spreads, interest rates, yield curves, credit curves, measures of volatility and exchange rates. These contracts are generally categorized as Level 2 within the fair value hierarchy.
If no current market value quotation or other observable inputs are readily available or market value quotations are deemed to be unreliable for a security, the fair value of the security will be determined in accordance with procedures approved by and under the general supervision of the Board. In such a circumstance, the Board has delegated the determination of the fair value of a security to a Valuation Committee (“Committee”) of MetLife Advisers. The Committee provides general pricing oversight and fair value pricing determinations related to portfolio securities and meets on a regular basis to review reports relating to the valuation of the securities in the Portfolio. The Board has delegated to State Street Bank and Trust Company, the Trust’s custodian (“custodian”), the responsibility for calculating the net asset values (“NAVs”) of the Trust’s Portfolios. The Committee is responsible for overseeing the calculation of the NAVs of the Portfolios by the custodian. The Committee also periodically reviews pricing vendors, including the vendor providing fair value pricing for the Portfolio’s foreign securities, and is responsible for overseeing the correction of pricing errors and addressing other pricing issues that arise in the ordinary course of business, such as making real-time fair value determinations, as necessary.
No single standard for determining the fair value of a security can be set forth because fair value depends upon the facts and circumstances with respect to each security. Information relating to any relevant factors may be obtained by the Committee from any appropriate source, including the subadviser of the Portfolio, the custodian, a pricing service, market maker and/or broker for such security or the issuer. Appropriate methodologies for determining fair value under particular circumstances may include: matrix pricing, comparisons of securities with comparable characteristics, value based on multiples of earnings, discount from market price of similar marketable securities or a combination of these and other methods. The Committee maintains a detailed report tracking each fair-valued security that compares the fair value price to the next available trade, vendor or broker price, and provides information on how close the fair value price was to the next quoted price. The Committee reviews a summary of such report monthly. On a quarterly basis, the Board is provided with the following for consideration and ratification or adjustment: (1) a memorandum summarizing the actions taken by the Committee in the prior quarter; and (2) a list of the Portfolio’s securities as of the most recent quarter-end for which market quotations were not readily available.
Investment Transactions and Related Investment Income - Portfolio security transactions are recorded on the trade date. Dividend income is recorded on the ex-dividend date or, for certain foreign securities, when notified. Interest income, which includes amortization of premium and accretion of discount on debt securities, is recorded on the accrual basis. Realized gains and losses on investments are determined on the identified cost basis, which is the same basis used for federal income tax purposes. Foreign income and foreign capital gains on some foreign securities may be subject to foreign taxes, which are accrued as applicable. These foreign taxes have been provided for in accordance with the Portfolio’s understanding of the applicable countries’ tax rules and rates.
Foreign Currency Translation - The books and records of the Portfolio are maintained in U.S. dollars. The values of securities, currencies, and other assets and liabilities denominated in currencies other than the U.S. dollar are translated into U.S. dollars based upon foreign exchange rates prevailing at the end of the period. Purchases and sales of investment securities, income, and expenses are translated on the respective dates of such transactions. Because the values of investment securities are translated at the foreign exchange rates prevailing at the end of the period, that portion of the results of operations arising from changes in exchange rates and that portion of the results of operations reflecting fluctuations arising from changes in market prices of the investment securities are not separated. Such fluctuations are included in the net realized and unrealized gain or loss on investments.
Net realized foreign exchange gains or losses arise from activity in forward foreign currency exchange contracts, sales of foreign currency, currency gains or losses realized between the trade and settlement dates on securities transactions, and the difference between the amounts of dividends, interest, and foreign withholding taxes recorded by the Portfolio and the U.S. dollar equivalent of
MSF-21
Metropolitan Series Fund
MSCI EAFE Index Portfolio
Notes to Financial Statements—December 31, 2013—(Continued)
the amounts actually received or paid by the Portfolio. Net unrealized foreign exchange gains and losses arise from changes in the value of assets and liabilities, other than investment securities, resulting from changes in foreign exchange rates.
Income Taxes - It is the Portfolio’s policy to comply with the requirements of the Internal Revenue Code of 1986, as amended, and regulations thereunder, applicable to regulated investment companies and to distribute, with respect to each taxable year, all of its taxable income to shareholders. Therefore, no federal income tax provision is required. The Portfolio files U.S. federal tax returns. No income tax returns are currently under examination. The Portfolio’s federal tax returns for the prior three fiscal years remain subject to examination by the Internal Revenue Service. As of December 31, 2013, the Portfolio had no uncertain tax positions that would require financial statement recognition, or de-recognition or disclosure.
Dividends and Distributions to Shareholders - The Portfolio records dividends and distributions on the ex-dividend date. Net realized gains from security transactions (if any) are generally distributed annually to shareholders. The timing and characterization of certain income and capital gains distributions are determined in accordance with federal tax regulations that may differ from GAAP. Permanent book and tax basis differences relating to shareholder distributions will result in reclassification between under/over distributed net investment income, accumulated net realized gains/losses, and paid-in surplus. Book-tax differences are primarily due to foreign currency transactions and passive foreign investment companies (PFIC). These adjustments have no impact on net assets or the results of operations.
Securities Lending - The Portfolio may lend its portfolio securities to certain qualified brokers who borrow securities in order to complete certain securities transactions. By lending its portfolio securities, the Portfolio attempts to increase its net investment income through the receipt of income on collateral held from securities on loan. Any gain or loss in the market price of the loaned securities that might occur and any interest earned or dividends declared during the term of the loan would accrue to the account of the Portfolio.
The Trust has entered into a securities lending arrangement with the custodian. Under this arrangement, the custodian is authorized to loan portfolio securities on the Portfolio’s behalf. In exchange, the Portfolio receives either cash or securities as collateral against the loaned securities. The Portfolio receives collateral at least equal to 102% of the market value of the loaned securities (105% for foreign equity securities), at each loan’s inception. Collateral representing at least 100% of the market value of the loaned securities must be maintained for the duration of the loan. A liability for cash collateral is reflected on the Statement of Assets and Liabilities, and is categorized as Level 2 within the fair value hierarchy. Cash collateral is generally invested in the State Street Navigator Securities Lending MET Portfolio (the “Navigator Portfolio”), a series of the State Street Navigator Securities Lending Trust that is managed by an affiliate of the custodian. The Navigator Portfolio is a registered money market fund that invests in a variety of high-quality, U.S. dollar-denominated instruments. If the market value of the collateral at the close of trading on a business day is less than 100% of the market value of the loaned securities at the close of trading on that day, the borrower shall be required to deliver, by the close of business on the following business day, an additional amount of collateral, so that the total amount of posted collateral is equal to at least 100% of the market value of all the loaned securities as of such preceding day. A portion of net income (income after the deduction of expenses and fees of the Navigator Portfolio) on the collateral is rebated to the borrower of the securities and the remainder is split between the custodian and the Portfolio. On loans collateralized by U.S. Treasuries, a fee is received from the borrower and is allocated between the Portfolio and the custodian. The risks associated with lending portfolio securities include, but are not limited to, possible delays in receiving additional collateral or in the recovery of the loaned securities, possible loss of rights in the collateral should the borrower fail financially, as well as risk of loss in the value of the collateral or the value of the investments made with the collateral. The lending agent has agreed to indemnify the Portfolio in the case of default of any securities borrower. Income received by the Portfolio in securities lending transactions during the year ended December 31, 2013 is reflected as Securities lending income on the Statement of Operations. Any outstanding loans by the Portfolio at December 31, 2013 are disclosed in the footnotes to the Schedule of Investments.
Repurchase Agreements - The Portfolio may enter into repurchase agreements, under the terms of a Master Repurchase Agreement, with selected commercial banks and broker-dealers, under which the Portfolio acquires securities as collateral and agrees to resell the securities at an agreed upon time and at an agreed-upon price. The Portfolio, through the custodian or a subcustodian, receives delivery of the underlying securities collateralizing any repurchase agreements. The Portfolio requires the custodian to take possession, to have legally segregated in the Federal Reserve Book Entry System, or to have segregated within the custodian’s vault, all securities held as collateral for repurchase agreements. It is the Portfolio’s policy that the market value of the collateral be at least equal to 100% of the repurchase price in the case of a repurchase agreement of one-day duration and at least equal to 102% of the repurchase price in the case of all other repurchase agreements. In the event of default or failure by a party to perform an obligation in connection with any repurchase transaction, the Master Repurchase Agreement gives the non-defaulting party the right to set-off claims and to apply property held by it in connection with any repurchase transaction against obligations owed to it.
3. Investments in Derivative Instruments
Futures Contracts - The Portfolio may buy and sell futures contracts as a hedge, to maintain investment exposure to a target asset class or to enhance return. The Portfolio may be subject to fluctuations in equity prices, interest rates, commodity prices, and foreign
MSF-22
Metropolitan Series Fund
MSCI EAFE Index Portfolio
Notes to Financial Statements—December 31, 2013—(Continued)
currency exchange rates in the normal course of pursuing its investment objective. Futures contracts are standardized agreements to buy or sell a security, or deliver a final cash settlement price in connection with an index, interest rate, currency, or other asset. The Portfolio must deposit an amount (“initial margin”) equal to a certain percentage of the face value of the futures contract. The initial margin may be in the form of cash or securities, which is returned when the Portfolio’s obligations under the contract have been satisfied. If cash is deposited as the initial margin, it is shown as cash collateral on the Statement of Assets and Liabilities. Futures contracts are marked-to-market daily, and subsequent payments (“variation margin”) are made or received by the Portfolio depending on whether unrealized gains or losses are incurred. These amounts are reflected as receivables or payables on the Statement of Assets and Liabilities and as a component of net change in unrealized appreciation/depreciation on the Statement of Operations. When the contract is closed or expires, the Portfolio records a realized gain or loss equal to the difference between the value of the contract at the time it was opened and the value at the time it was closed. Risks of entering into futures contracts (and related options) include the possibility that the market for these instruments may be illiquid and that a change in the value of the contract or option may not correlate perfectly with changes in the value of the underlying instrument. Futures contracts are exchange-traded and the exchange’s clearinghouse, as counterparty to all exchange-traded futures, guarantees the futures contracts against default. For over-the-counter futures the Portfolio’s ability to terminate the positions may be more limited than in the case of exchange-traded positions and may also involve the risk that securities dealers participating in such transactions would fail to meet their obligations to the Portfolio.
At December 31, 2013, the Portfolio had the following derivatives, categorized by risk exposure:
| | | | | | |
| | | Asset Derivatives | |
Risk Exposure | | Statement of Assets &
Liabilities Location | | Fair Value | |
Equity | | Unrealized appreciation on futures contracts* | | $ | 208,248 | |
| | | | | | |
| | * | Includes cumulative appreciation/depreciation of futures contracts as reported in the Schedule of Investments. Only the current day’s variation margin is reported within the Statement of Assets and Liabilities. |
Transactions in derivative instruments during the year ended December 31, 2013 were as follows:
| | | | |
Statement of Operations Location—Net Realized Gain (Loss) | | Equity | |
Futures contracts | | $ | 627,856 | |
| | | | |
| |
Statement of Operations Location—Net Change in Unrealized Appreciation (Depreciation) | | Equity | |
Futures contracts | | $ | 183,529 | |
| | | | |
For the year ended December 31, 2013, the average amount or number per contract outstanding for each derivative type was as follows:
| | | | |
Derivative Description | | Average
Notional Par or
Face Amount‡ | |
Futures contracts long | | $ | 2,500 | |
| | ‡ | Averages are based on activity levels during 2013. |
4. Certain Risks
Market Risk: In the normal course of business, the Portfolio invests in securities and enters into transactions where risks exist due to fluctuations in the market (market risk) or failure of the other party to a transaction to perform (credit and counterparty risk). The value of securities held by the Portfolio may decline in response to certain events, including those directly involving the companies whose securities are owned by the Portfolio; conditions affecting the general economy; overall market changes; local, regional or global political, social or economic instability; currency, interest rate, and price fluctuations.
Credit and Counterparty Risk: The Portfolio may be exposed to counterparty risk, or the risk that an entity with which the Portfolio has unsettled or open transactions may default. The potential loss could exceed the value of the financial assets and liabilities recorded in the financial statements. Financial assets that potentially expose the Portfolio to credit and counterparty risk consist principally of cash due from counterparties and investments. The Portfolio manages counterparty risk by entering into agreements only with counterparties that it believes have the financial resources to honor their obligations and by monitoring the financial stability of those counterparties. The Portfolio’s investment adviser attempts to mitigate counterparty risk by (i) periodically assessing the creditworthiness of its trading partners, (ii) monitoring and/or limiting the amount of its net exposure to each individual counterparty based on its assessment, and (iii) requiring collateral from the counterparty for certain transactions. In order to preserve certain safeguards for non-standard settlement trades, the Portfolio restricts its exposure to credit and counterparty losses by entering
MSF-23
Metropolitan Series Fund
MSCI EAFE Index Portfolio
Notes to Financial Statements—December 31, 2013—(Continued)
into master netting agreements with counterparties (approved brokers) with whom it undertakes a significant volume of transactions. Master Agreements govern the terms of certain transactions, and reduce the counterparty risk associated with relevant transactions by specifying credit protection mechanisms and providing standardization that improves legal certainty. Master Agreements can also help limit counterparty risk by specifying collateral posting arrangements at pre-arranged exposure levels. Collateral requirements may differ by type of derivative or investment, as applicable. Collateral or margin requirements are set by the broker or exchange clearing house for exchange traded derivatives (e.g., futures contracts and exchange traded options) while collateral terms are contract specific for over-the-counter traded derivatives (e.g., forward foreign currency exchange contracts, swap agreements and over-the-counter options).
Repurchase and reverse repurchase agreements are primarily executed under Global Master Repurchase Agreements (“GMRAs”) or Master Repurchase Agreements (“MRAs”), which provide the rights to set-off. Each repurchase and reverse repurchase agreement is initially collateralized at the transaction level. In the event of default, the total market value exposure will be offset against collateral exchanged to date, which would result in a net receivable/(payable) that would be due from/to the counterparty.
Customer Account Agreements and related addendums govern cleared derivatives transactions such as futures, options on futures, and cleared OTC derivatives. Cleared derivative transactions require posting of initial margin as determined by each relevant clearing agency which is segregated at a broker account registered with the Commodities Futures Trading Commission (CFTC), or the applicable regulator. In the U.S., counterparty risk is significantly reduced as creditors of the futures broker do not have claim to Portfolio assets in the segregated account. Additionally, portability of exposure in the event of default further reduces risk to the Portfolio. Variation margin, or changes in market value, are exchanged daily, but may not be netted between futures and cleared OTC derivatives.
Foreign Investment Risk: The investments by the Portfolio in foreign securities may involve risks not present in domestic investments. Because securities may be denominated in foreign currencies, may require settlement in foreign currencies and may pay interest or dividends in foreign currencies, changes in the relationship of these foreign currencies to the U.S. dollar can significantly affect the value of the investments and earnings of the Portfolio. Foreign investments may also subject the Portfolio to foreign government exchange restrictions, expropriation, taxation or other political, social or economic developments, all of which could affect the market and/or credit risk of the investments. In addition to the risks described above, risks may arise from forward foreign currency contracts with respect to the potential inability of counterparties to meet the terms of their contracts.
Additional risks associated with each type of investment are described above within the respective security type notes. The Portfolio’s prospectus includes a discussion of the principal risks of investing in the Portfolio.
5. Investment Transactions
Aggregate cost of purchases and proceeds of sales of investment securities, excluding short-term securities, for the year ended December 31, 2013 were as follows:
| | | | | | | | | | | | |
Purchases | | | Sales | |
U.S. Government | | Non U.S. Government | | | U.S. Government | | | Non U.S. Government | |
| $0 | | $ | 103,940,420 | | | $ | 0 | | | $ | 81,331,664 | |
6. Investment Management Fees and Other Transactions with Affiliates
Investment Management Agreement - MetLife Advisers is the investment adviser to the Portfolio. The Trust has entered into an investment management agreement with MetLife Advisers with respect to the Portfolio. For providing investment management services to the Portfolio, MetLife Advisers receives monthly compensation at the annual rate of 0.300% of average daily net assets. Fees earned by MetLife Advisers with respect to the Portfolio for the year ended December 31, 2013 were $2,566,600.
MetLife Advisers has entered into an investment subadvisory agreement with MetLife Investment Management, LLC (“MIM”) with respect to the Portfolio. For providing subadvisory services to the Portfolio, MetLife Advisers has agreed to pay MIM an investment subadvisory fee for each class of the Portfolio as follows:
| | |
% per annum | | Average daily net assets |
| 0.050% | | On the first $500 million |
| 0.040% | | Of the next $500 million |
| 0.020% | | On amounts over $1 billion |
Fees earned by MIM with respect to the Portfolio for the year ended December 31, 2013 were $392,213.
MSF-24
Metropolitan Series Fund
MSCI EAFE Index Portfolio
Notes to Financial Statements—December 31, 2013—(Continued)
Management Fee Waivers - Pursuant to an expense agreement, MetLife Advisers has agreed, for the period April 29, 2013 through April 27, 2014, to reduce its advisory fees set out above under “Investment Management Agreement” for each class of the Portfolio as follows:
| | |
% per annum | | Average daily net assets |
| 0.005% | | Over $500 million and under $1 billion |
| 0.010% | | Of the next $1 billion |
| 0.015% | | On amounts over $2 billion |
An identical expense agreement was in place for the period April 30, 2012 through April 28, 2013. Amounts waived for the year ended December 31, 2013 are shown as management fee waivers in the Statement of Operations.
Certain officers and trustees of the Trust may also be officers of MetLife Advisers; however, such officers and trustees receive no compensation from the Trust.
Transfer Agency Agreement - MetLife serves as the transfer agent for the Trust. MetLife receives no fees for its services to the Trust under the transfer agency agreement.
Distribution and Service Fees - The Trust has a distribution agreement with MetLife Investors Distribution Company (“MIDC” or the “Distributor”) in which MIDC serves as the distributor for the Portfolio’s Class A, B, E, and G Shares. MIDC is a wholly-owned subsidiary of MetLife Investors Group, Inc., an affiliate of the Adviser. The Trust has also adopted a Distribution and Service Plan under Rule 12b-1 of the 1940 Act for the Portfolio’s Class B, E, and G Shares. Under the Distribution and Service Plan, the Class B, E, and G Shares of the Portfolio pay a fee to compensate the Insurance Companies (or their affiliates) and other broker-dealers and financial intermediaries involved in the offer and sale of Portfolio shares for promoting or selling and servicing the Class B, E, and G Shares of the Portfolio. The fees under the Distribution and Service Plan for each class of the Portfolio’s shares are calculated as a percentage of the Portfolio’s average daily net assets that are attributable to that Class. Currently, the fee is 0.25% per year for Class B Shares, 0.15% per year for Class E Shares, and 0.30% per year for Class G Shares. Amounts incurred by the Portfolio for the year ended December 31, 2013 are shown as Distribution and service fees in the Statement of Operations.
Deferred Trustee Compensation - Each Trustee who is not currently an employee of the Adviser or any of its affiliates receives compensation from the Trust for his or her service to the Trust. A deferred compensation plan (the “Plan”) is available to the Trustees on a voluntary basis. Deferred amounts remain in the Trust until distributed in accordance with the provisions of the Plan. The value of a participating Trustee’s deferral account is based on theoretical investments of deferred amounts, on the normal payment dates in certain portfolios of the Trust or Met Investors Series Trust, an affiliate of the Trust, as designated by the participating Trustee. Changes in the value of participants’ deferral accounts are reflected as Trustees’ fees and expenses in the Statement of Operations. The portion of the accrued obligations allocated to the Portfolio under the Plan is reflected as Deferred trustees’ fees in the Statement of Assets and Liabilities.
7. Contractual Obligations
Under the Trust’s organizational documents, its officers and Trustees may be indemnified against certain liabilities and expenses arising out of the performance of their duties to the Trust. Additionally, the Trust has a variety of indemnification obligations under contracts with its service providers. The Trust’s maximum exposure under these arrangements is unknown, as this would involve future claims that may be made against the Trust that have not yet occurred.
8. Income Tax Information
The tax character of distributions paid for the periods ended December 31, 2013 and 2012 was as follows:
| | | | | | | | | | | | | | | | | | | | |
Ordinary Income | | | Long-Term Capital Gain | | | Total | |
2013 | | 2012 | | | 2013 | | | 2012 | | | 2013 | | | 2012 | |
| $24,928,025 | | $ | 21,840,684 | | | $ | — | | | $ | — | | | $ | 24,928,025 | | | $ | 21,840,684 | |
As of December 31, 2013, the components of distributable earnings (accumulated losses) on a federal income tax basis were as follows:
| | | | | | | | | | | | | | | | | | | | |
Undistributed
Ordinary
Income | | Undistributed
Long-Term
Capital Gain | | | Net
Unrealized
Appreciation | | | Loss Carryforwards | | | Other
Accumulated
Capital Losses | | | Total | |
$23,120,127 | | $ | — | | | $ | 164,335,742 | | | $ | (26,531,041 | ) | | $ | (5,919,780 | ) | | $ | 155,005,048 | |
MSF-25
Metropolitan Series Fund
MSCI EAFE Index Portfolio
Notes to Financial Statements—December 31, 2013—(Continued)
The Portfolio utilizes the provisions of the federal income tax laws that provide for the carryforward of capital losses for prior years, offsetting such losses against any future realized capital gains. Under the Regulated Investment Company Modernization Act of 2010 (the “Act”), net capital losses recognized after December 22, 2010 may be carried forward indefinitely and their character is retained as short-term and/or long-term losses. Previously, net capital losses were carried forward for up to eight years and treated as short-term losses. As a transition rule, the Act requires that post-enactment net capital losses be used before pre-enactment net capital losses.
As of December 31, 2013, the post-enactment accumulated long-term capital losses were $5,919,780 and the pre-enactment accumulated capital loss carryforwards and expiration dates were as follows:
| | | | | | | | |
Expiring
12/31/2018 | | Expiring
12/31/2017 | | | Total | |
| $3,109,329 | | $ | 23,421,712 | | | $ | 26,531,041 | |
During the year ended December 31, 2013, the Portfolio utilized capital loss carryforwards of $6,967,678.
MSF-26
Metropolitan Series Fund
MSCI EAFE Index Portfolio
Report of Independent Registered Public Accounting Firm
To the Shareholders of MSCI EAFE Index Portfolio and the Board of Trustees of Metropolitan Series Fund:
We have audited the accompanying statement of assets and liabilities, including the schedule of investments, of MSCI EAFE Index Portfolio, one of the portfolios constituting Metropolitan Series Fund (the “Trust”) as of December 31, 2013, and the related statement of operations for the year then ended, the statements of changes in net assets for each of the two years in the period then ended, and the financial highlights for each of the five years in the period then ended. These financial statements and financial highlights are the responsibility of the Trust’s management. Our responsibility is to express an opinion on these financial statements and financial highlights based on our audits.
We conducted our audits in accordance with the standards of the Public Company Accounting Oversight Board (United States). Those standards require that we plan and perform the audit to obtain reasonable assurance about whether the financial statements and financial highlights are free of material misstatement. The Trust is not required to have, nor were we engaged to perform, an audit of its internal control over financial reporting. Our audits included consideration of internal control over financial reporting as a basis for designing audit procedures that are appropriate in the circumstances, but not for the purpose of expressing an opinion on the effectiveness of the Trust’s internal control over financial reporting. Accordingly, we express no such opinion. An audit also includes examining, on a test basis, evidence supporting the amounts and disclosures in the financial statements, assessing the accounting principles used and significant estimates made by management, as well as evaluating the overall financial statement presentation. Our procedures included confirmation of securities owned as of December 31, 2013, by correspondence with the custodian and brokers; where replies were not received from brokers, we performed other auditing procedures. We believe that our audits provide a reasonable basis for our opinion.
In our opinion, the financial statements and financial highlights referred to above present fairly, in all material respects, the financial position of MSCI EAFE Index Portfolio of Metropolitan Series Fund, as of December 31, 2013, the results of its operations for the year then ended, the changes in its net assets for each of the two years in the period then ended, and the financial highlights for each of the five years in the period then ended, in conformity with accounting principles generally accepted in the United States of America.
Deloitte & Touche LLP
Boston, Massachusetts
February 26, 2014
MSF-27
Metropolitan Series Fund
Trustees and Officers of Metropolitan Series Fund
The Trustees and executive officers of the Trust, their ages and their principal occupations during the past five years are set forth below. Unless otherwise indicated, the business address of each is One Financial Center, Boston, MA 02111. Each Trustee who is deemed an “interested person,” as such term is defined in the 1940 Act, is indicated by an asterisk. Those Trustees who are not “interested persons” as defined in the 1940 Act are referred to as “Independent Trustees.” Additional information about the Trustees is available in the Statement of Additional Information, which is available without charge, upon request, by calling (800) 848-3854.
Trustees of the Trust
| | | | | | | | | | |
Name and Age | | Position(s)
Held with
Registrant | | Term of Office
and Length of
Time Served | | Principal Occupation(s) During the Past 5
Years(1) | | Number of
Portfolios
in Fund
Complex(2)
overseen | | Other Directorships Held
by Trustee During the
Past 5 Years(1) |
| Interested Trustee | | | | | | | | | | |
| Elizabeth M. Forget* (47) | | Trustee, Chairman of the Board, President and Chief Executive Officer | | Indefinite;
From
May
2006
(President
and Chief
Executive
Officer)/
August
2006
(Trustee
and
Chairman
of the
Board) to
present | | Senior Vice President, MetLife Inc.; President, MetLife Advisers, LLC and a predecessor company. | | 79 | | Trustee, Met Investors Series Trust (the “MIST Trust”);** various MetLife-affiliated boards. |
| | | | | |
| Independent Trustees | | | | | | | | | | |
| Stephen M. Alderman (54) | | Trustee | | Indefinite;
From
April
2012 to
present | | Shareholder in the law firm of Garfield & Merel, Ltd. | | 79 | | Trustee, MIST Trust;** Director, International Truck Leasing Corp. |
| | | | | |
| Robert J. Boulware (57) | | Trustee | | Indefinite;
From
April
2012 to
present | | Managing Director, Pilgrim Funds, LLC (private equity fund). | | 79 | | Trustee, MIST Trust;** Trustee, Vertical Capital Income Fund (closed-end fund); Director, Gainsco, Inc. (auto insurance). |
| | | | | |
| Susan C. Gause (61) | | Trustee | | Indefinite;
From
April
2012 to
present | | Private Investor. | | 79 | | Trustee, MIST Trust;** Trustee, HSBC Funds. |
| | | | | |
| Nancy Hawthorne (62) | | Trustee | | Indefinite;
From
May
2003 to
present | | Chief Executive Officer, Clerestory LLC (corporate advisor). | | 79 | | MIST Trust;** Director, THL Credit, Inc.**; Director, Avid Technology, Inc.** |
| | | | | |
| Barbara A. Nugent (57) | | Trustee | | Indefinite;
From
January
2014 to
present | | President, True North Board Governance, LLC (consulting); until 2014, partner in the law firm of Stradley Ronon Stevens & Young, LLP. | | 79 | | Trustee, MIST Trust**; Director, Episcopal Healthcare Foundation; until 2014, member, Mutual Fund Directors Forum Advisory Board. |
MSF-28
Metropolitan Series Fund
Trustees and Officers of Metropolitan Series Fund—(Continued)
| | | | | | | | | | |
Name and Age | | Position(s)
Held with
Registrant | | Term of Office
and Length of
Time Served | | Principal Occupation(s) During the Past 5
Years(1) | | Number of
Portfolios
in Fund
Complex(2)
overseen | | Other Directorships Held
by Trustee During the
Past 5 Years(1) |
| Keith M. Schappert (62) | | Trustee | | Indefinite;
From
August
2009 to
present | | Principal, Schappert Consulting LLC (asset management consulting). | | 79 | | Trustee, MIST Trust;** Director, The Commonfund for Nonprofit Organizations; until 2011, Director, Trilogy Global Advisors; Director, Mirae Asset Discovery Funds,** Director, Calamos Investments. |
| | | | | |
| Linda B. Strumpf (66) | | Trustee | | Indefinite;
From
May
2000 to
present | | Chair of the Investment Committee, Leona M. and Harry B. Helmsley Charitable Trust; until 2011, Chief Investment Officer, Leona M. and Harry B. Helmsley Charitable Trust. | | 79 | | Since 2012, Trustee, MIST Trust,** Trustee and Member of Investment Committee, The Pennsylvania State University. |
| | | | | |
| Dawn M. Vroegop (47) | | Trustee | | Indefinite;
From
May
2009 to
present | | Private Investor. | | 79 | | Trustee, MIST Trust,** Trustee, Driehaus Mutual Funds; Director and Investment Committee Chair, City College of San Francisco Foundation. |
Executive Officers of the Trust
| | | | | | |
Name and Age | | Position(s) Held with
Registrant | | Term of Office
and Length of
Time Served | | Principal Occupation(s) During Past 5 Years(1) |
| Elizabeth M. Forget (47) | | President, Chief Executive Officer, Trustee and Chairman of the Board | | From May
2006 (President
and Chief
Executive
Officer)/
August 2006
(Trustee and
Chairman of
the Board) to
present | | See principal occupation information in the table above. |
| | | |
| Jeffrey L. Bernier (42) | | Vice President | | From February
2008 to present | | Vice President, MetLife, Inc.; Senior Vice President, MetLife Advisers, LLC and a predecessor company. |
| | | |
| Peter H. Duffy (58) | | Chief Financial Officer and Treasurer | | From November
2000 to present | | Senior Vice President, MetLife Advisers, LLC; Vice President, MetLife, Inc. |
| | | |
| Andrew L. Gangolf (59) | | Secretary | | From May
2011to present | | Senior Vice President, MetLife Advisers, LLC; Senior Vice President & Assistant General Counsel, AllianceBerstein Investments, Inc. |
| | | |
| Jeffrey P. Halperin (46) | | Chief Compliance Officer | | From November
2005 to present | | Vice President, MetLife, Inc.; Chief Compliance Officer, MIST; Chief Compliance Officer, MSF Trust; Chief Compliance Officer, MetLife Advisers, LLC and a predecessor company; Chief Compliance Officer, MetLife Investment Management, LLC (formerly MetLife Investment Advisors Company, LLC). |
| | | |
| Alan C. Leland, Jr. (61) | | Vice President | | From February
2005 to present | | Treasurer and Chief Financial Officer, MetLife Advisers, LLC; Vice President, MetLife Group Inc.; Vice President, MetLife, Inc. |
| * | Ms. Forget is an “interested person” of the Trust because of her positions with MetLife Advisers, LLC and her ownership of securities issued by MetLife, Inc., the ultimate parent company of MetLife Advisers, LLC. |
| ** | Indicates a directorship with a registered investment company or a company subject to the reporting requirements of the Securities Exchange Act of 1934, as amended. |
| (1) | Previous positions during the past five years with the Trust, MetLife, Inc. or the Adviser are omitted if not materially different. |
| (2) | The Fund Complex includes 49 Portfolios of the MIST Trust and 30 Portfolios of the Trust. |
MSF-29
Metropolitan Series Fund
MSCI EAFE Index Portfolio
Board of Trustees’ Consideration of Advisory and Sub-Advisory Agreements
At an in-person meeting of the Boards of Trustees (the “Board”) of Met Investors Series Trust and Metropolitan Series Fund (“MIST” and “MSF,” respectively, and collectively, the “Trusts”) held on November 19-20, 2013, the Board, including a majority of the Trustees who are not considered to be “interested persons” of the Trusts (the “Independent Trustees”) under the Investment Company Act of 1940, as amended (the “1940 Act”), approved for an annual period the continuation of each Trust’s advisory agreement (the “Advisory Agreement”) with MetLife Advisers, LLC (the “Adviser”) and the applicable sub-advisory agreements (each a “Sub-Advisory Agreement,” and collectively with the Advisory Agreement, the “Agreements”) between the Adviser and the investment sub-advisers (each a “Sub-Adviser,” and collectively, the “Sub-Advisers”) for each of the series of the Trusts, including the MSCI EAFE Index Portfolio (each a “Portfolio,” and collectively, the “Portfolios”).1
In considering the Agreements, the Board reviewed a variety of materials provided by the Adviser and the Sub-Advisers relating to the Portfolios, including comparative performance, fee and expense information for an appropriate peer group of similar mutual funds, performance information for relevant benchmark indices and other information regarding the nature, extent and quality of services provided by the Adviser and the Sub-Advisers under their respective Agreements. The Board also took into account its experience with the Adviser and the Sub-Advisers and information provided to the Board in its meetings throughout the year with respect to the services provided by the Adviser and the Sub-Advisers, including quarterly performance reports prepared by management containing reviews of investment results, and periodic presentations from certain of the Sub-Advisers with respect to the Portfolios they manage. The Independent Trustees also assessed reports provided by the Board’s independent consultant, who reviewed and provided analyses regarding investment performance, fees and expenses, and other information provided by, or at the direction of, the Adviser and the Sub-Advisers, as more fully discussed below.
The Independent Trustees were separately advised by independent legal counsel throughout the process, and met with independent legal counsel in periodic executive sessions. Prior to voting to continue the Agreements at the November meeting, the Independent Trustees also received a memorandum from their independent counsel discussing the legal standards for their consideration of the proposed continuation of the Agreements. The Board also met in person with personnel of the Adviser on September 17, 2013 for the specific purpose of giving preliminary consideration to the proposed continuation of the Agreements and to request additional information they considered reasonably necessary to their deliberations. The Independent Trustees also discussed the proposed continuation of the Agreements in private sessions with their independent legal counsel at which no representatives of management were present.
In considering whether to approve the renewal of the Advisory Agreement with the Adviser and any applicable Sub-Advisory Agreements with respect to a Portfolio, the Board reviewed and analyzed the factors it deemed relevant, including: (1) the nature, extent and quality of the services to be provided to the Portfolios by the Adviser and the Sub-Advisers; (2) the performance of the Portfolios as compared to a peer group and an appropriate index; (3) the Adviser’s and each of the Sub-Adviser’s personnel and operations; (4) the financial condition of the Adviser and of the Sub-Advisers; (5) the level and method of computing each Portfolio’s advisory and sub-advisory fees; (6) the profitability of the Adviser under the Advisory Agreement and of certain of the Sub-Advisers under the Sub-Advisory Agreements; (7) any “fall-out” benefits to the Adviser, the Sub-Advisers and their affiliates (i.e., ancillary benefits realized by the Adviser, the Sub-Advisers or their affiliates from the Adviser’s or Sub-Advisers’ relationship with the Trusts); (8) the anticipated effect of growth in size on Portfolio expenses; (9) fees paid to certain of the Sub-Advisers by comparable institutional and retail accounts; and (10) possible conflicts of interest.
Nature, extent and quality of services. The Board evaluated the nature, extent and quality of the services that the Adviser, and the Sub-Advisers as relevant, have provided to the Portfolios. The Board considered the Adviser’s services as investment manager to the Portfolios, including services relating to the selection and oversight of the Sub-Advisers for the applicable Portfolios. The Board considered, among other things, the Adviser’s oversight of the provision of services to the Portfolios by the Sub-Advisers, including with respect to investment activities and trading practices, and the Sub-Adviser’s compliance with fund policies, objectives and Board directives, compliance policies and procedures and applicable law. The Adviser’s services in coordinating and overseeing the activities of the Trusts’ other service providers were also considered. The Board also evaluated the expertise and performance of the personnel of the Adviser who performed services for the Portfolios throughout the year.
The Board considered information received from the Trust’s Chief Compliance Officer (“CCO”) regarding the Portfolios’ compliance policies and procedures established pursuant to Rule 38a-l under the 1940 Act. The Board also evaluated the CCO’s ongoing reports concerning the CCO’s oversight of the risk assessment processes of the Sub-Advisers.
1 The Pyramis Managed Risk Portfolio recently commenced operations and, therefore, the Agreement with respect to this Portfolio was not up for renewal.
MSF-30
Metropolitan Series Fund
MSCI EAFE Index Portfolio
Board of Trustees’ Consideration of Advisory and Sub-Advisory Agreements—(Continued)
With respect to the services provided by each of the Sub-Advisers, the Board considered, among other things, information provided to the Board by each Sub-Adviser. The Board considered the Sub-Adviser’s current level of staffing and its overall resources, as well as its compensation program. The Board reviewed each Sub-Adviser’s history and investment experience, as well as information regarding the qualifications, background and responsibilities of the Sub-Adviser’s investment and compliance personnel who provide services to the Portfolios. The Board also considered, among other things, the Sub-Adviser’s compliance program and any disciplinary history. The Board also took into account the Sub-Adviser’s risk assessment and monitoring process. The Board noted each Sub-Adviser’s regulatory history, including whether it was currently involved in any regulatory actions or investigations as well as material litigation, and any settlements and amelioratory actions undertaken, as appropriate. The Board also noted that the CCO and his staff conduct regular, periodic compliance reviews with each of the Sub-Advisers and present reports to the Independent Trustees regarding the same, which includes evaluating the regulatory compliance systems of the Sub-Advisers and procedures reasonably designed by them to help assure compliance with the federal securities laws, including issues related to late trading and market timing, best execution, fair value pricing, and proxy voting procedures, among others. The Board also took into account the financial condition of each Sub-Adviser. In its review, the Board also received and took into account information regarding any services and/or payments provided to the Adviser by the Sub-Advisers in connection with marketing activities.
The Board considered each Sub-Adviser’s investment process and philosophy. The Board took into account that each Sub-Adviser’s responsibilities include the development and maintenance of an investment program for the applicable Portfolio which is consistent with the Portfolio’s investment objectives, the selection of investment securities and the placement of orders for the purchase and sale of such securities, as well as the implementation of compliance controls related to performance of these services. The Board also reviewed each Sub-Adviser’s brokerage policies and practices.
Performance. The Board considered the performance of the Portfolios as described in the quarterly reports prepared by management, and as also analyzed in reports prepared by the Independent Trustees’ independent consultant. The Board noted that the Adviser reviews with the Board on a quarterly basis detailed information about the Portfolios’ performance results, portfolio composition and investment strategies. The Board also reviewed and considered a separate report prepared by Lipper Inc. (“Lipper”), an independent third party, which provided a statistical analysis comparing the Portfolios’ investment performance, expenses, and fees to comparable funds underlying variable insurance products (the “Performance Universe”). In addition, the Independent Trustees met separately with a representative of Bobroff Consulting, Inc., an independent consultant (“Bobroff), at a special board meeting in September 2013, to review the separate reports prepared by such consultant (“Bobroff Report”), which analyzed the report prepared by Lipper. The Board also considered each Portfolio’s more recent performance subsequent to the performance period covered by the Lipper reports, and management’s discussion of the same, including the effect of current market conditions on each Portfolio’s more recent performance.
The Board reviewed the Portfolios’ performance records and the Adviser’s and Sub-Advisers’ management styles and long-term performance records with the Portfolios and comparable funds. The Board focused particular attention on Portfolios with less favorable performance records. The Board was mindful of the Adviser’s focus on each Sub-Adviser’s performance and noted that the Adviser has been active in monitoring and responding to any performance issues with respect to the Portfolios. The Board also took into account its discussions with management regarding factors that contributed to the performance of the Portfolios.
Among other data relating specifically to the MSCI EAFE Index Portfolio’s performance, the Board considered that the Portfolio outperformed the median of its Performance Universe for the one- and three-year periods ended June 30, 2013, and slightly underperformed the median of its Performance Universe for the five-year period ended June 30, 2013. The Board also noted that the Portfolio outperformed its Lipper Index for the one-, three- and five-year periods ended June 30, 2013. The Board took into account that the Portfolio underperformed its benchmark, the MSCI EAFE Index, for the one-, three- and five-year periods ended October 31, 2013.
Fees and Expenses. The Board gave consideration to the advisory fees payable under the Advisory Agreement and the sub-advisory fees payable under each of the Sub-Advisory Agreements. In this regard, the Board reviewed the advisory fees payable on a Portfolio-by-Portfolio basis based on information provided by the Adviser. The Independent Trustees, with the assistance of Bobroff, also examined the fees paid by a Portfolio in light of fees paid to other investment managers by comparable funds, as well as considered the fees charged by the Adviser to manage other comparable funds, as applicable. The Lipper report included comparisons of the Adviser’s fee schedule with that of its peers based on an asset-based analysis of relative fee structures according to the size of the Portfolio. In addition, the Board considered the Portfolios’ advisory and sub-advisory fees and total expenses as compared to similarly situated investment companies underlying variable insurance products deemed to be comparable to the Portfolios as determined by Lipper. The Board considered a Portfolio’s ranking within a smaller group of peer funds chosen by Lipper (the “Expense Group”), as well as
MSF-31
Metropolitan Series Fund
MSCI EAFE Index Portfolio
Board of Trustees’ Consideration of Advisory and Sub-Advisory Agreements—(Continued)
the Portfolio’s ranking within broader groups of funds (the “Expense Universe” and the “Sub-advised Expense Universe”). The Board also considered a Portfolio’s contractual sub-advisory fees, as applicable, as compared to the Sub-advised Expense Universe as well as a smaller group of funds (the “Sub-advised Expense Group”). In comparing a Portfolio’s actual and contractual management fee to that of comparable funds, the Board noted that such fee includes both advisory and administrative fees.
The Board noted that the sub-advisory fees for the Portfolios are paid by the Adviser, not the Portfolios, out of the advisory fee. It was further noted that the Adviser negotiates such fees at arm’s length. The Board also considered that the Adviser had entered into expense limitation agreements with certain of the Portfolios, pursuant to which the Adviser has agreed to waive a portion of its advisory fee and/or reimburse certain expenses as a means of limiting a Portfolio’s total annual operating expenses. The Board further considered the amount of sub-advisory fees paid out by the Adviser and the amount of the management fees that it retained in light of the services performed by Sub-Advisers and Adviser, respectively.
With respect to the MSCI EAFE Index Portfolio, the Board considered that the Portfolio’s actual management fees and total expenses (exclusive of 12b-1 fees) were below the Expense Group median, Expense Universe median and Sub-advised Expense Universe median. The Board further noted that the Portfolio’s contractual management fees were below the asset-weighted average of the Expense Group at the Portfolio’s current size. The Board also noted that the Portfolio’s contractual sub-advisory fees were below the average of the Sub-advised Expense Group and the Sub-advised Expense Universe at the Portfolio’s current size. The Board took into account that the Adviser had waived fees and/or reimbursed expenses during the past year.
Profitability. The Board examined the profitability of the Adviser on a Portfolio-by-Portfolio basis. The Board also considered that the Distributor, MetLife Investors Distribution Company, receives Rule 12b-1 payments to support the distribution of the products. The Board considered the profitability to the Sub-Advisers and their affiliates as a result of their relationships with the Portfolios, and the Board considered the ability of the Adviser to negotiate the Sub-Advisory Agreements and the fees thereunder at arm’s length. The Board also reviewed Portfolio specific data with regard to the profitability of the Portfolios to each Sub-Adviser, as available.
Economies of scale. The Board also considered the effect of the Portfolios’ growth in size on their fees. The Board noted that the fee schedules for most of the Portfolios contain breakpoints that reduce the fee rate above specified asset levels. The Board noted those Portfolios that did not contain breakpoints in the advisory fee and took into account management’s discussion of the same. The Board noted that those Portfolios with advisory fee schedules containing breakpoints generally reflect the inclusion of breakpoints in the sub-advisory fee schedule for such Portfolios. The Board considered the effective fees under the Advisory Agreement for a Portfolio as a percentage of assets at different asset levels and possible economies of scale that may be realized if the assets of the Portfolio grow. Among other data, the Board examined the effect of a Portfolio’s growth in size on various fee schedules and reviewed the Lipper and Bobroff Reports, which compared fees among peers. The Board also generally noted that if a Portfolio’s assets increase over time, the Portfolio may realize other economies of scale if assets increase proportionally more than certain other fixed expenses. In addition, the Board noted that the Adviser had taken a number of steps to date intended to share the benefits of economies of scale with contractholders.
With respect to the MSCI EAFE Index Portfolio, the Board noted that the Portfolio’s advisory fee does not contain breakpoints. The Board further considered that the Portfolio’s management fees were below the asset-weighted average of comparable funds at all asset levels. The Board considered the effect of the Portfolio’s current size and potential growth on its performance and fees. The Board noted management’s discussion of the Portfolio’s advisory fee structure. The Board also noted that if the Portfolio’s assets increased over time, the Portfolio might realize other economies of scale if assets increased proportionally more than certain other fixed expenses.
Other factors. As part of its evaluation of the Adviser’s compensation, the Board considered other benefits that may be realized by the Adviser and its affiliates from their relationship with the Trusts. Among them, the Board recognized that an affiliate of the Adviser, MetLife Investors Distribution Company, serves as the Distributor for the Trusts, and, as such, receives payments pursuant to Rule 12b-1 from the Portfolios to compensate it for providing shareholder services and selling activities, which could lead to growth in the Trusts’ assets and corresponding benefits from such growth, including economies of scale. The Board also considered that affiliates of the Adviser may benefit from certain indirect tax benefits relating to dividend received deductions and foreign tax credits. In conjunction with these considerations, the Board noted the costs of providing investment management and other services to the Portfolios and the ongoing commitment of the Adviser to the Portfolios.
The Board considered other benefits that may be realized by each Sub-Adviser and its affiliates from their relationship with the Trusts, including the opportunity to provide advisory services to additional portfolios of the Trusts and reputational benefits. In conjunction with these considerations, the Board noted the costs of providing investment advisory services to the Portfolios and the ongoing commitment of the Sub-Advisers to the Portfolios.
MSF-32
Metropolitan Series Fund
MSCI EAFE Index Portfolio
Board of Trustees’ Consideration of Advisory and Sub-Advisory Agreements—(Continued)
The Board considered possible conflicts of interest in the form of material benefits or detriments to the Trusts resulting from the nature of the Trusts’ and the Adviser’s or the Sub-Advisers’ affiliations and the services that are provided to the Trusts, and the manner in which such conflicts were mitigated.
Conclusions. After full consideration of the factors discussed above, the Board, including a majority of the Independent Trustees, approved the Advisory Agreement and the Sub-Advisory Agreement, as applicable, with respect to each Portfolio, unless otherwise noted. In making its approvals, the Board concluded that the nature, extent and quality of services provided by the Adviser and each Sub-Adviser supported the renewal of the Agreements. The Board also concluded that the investment performance of each Fund was such that each Agreement should continue. In addition, the Board concluded that fees paid by a Portfolio to the Adviser and, if applicable, the Sub-Adviser appeared to be acceptable in light of nature, extent and quality of the services provided by the Adviser and Sub-Adviser. Further, the Board concluded that the Adviser’s profitability in providing services under the Advisory Agreements did not appear unreasonably high in light of the nature, extent and quality of the services provided by the Adviser. Finally, the Board concluded that the Advisory and Sub-Advisory fees in some measure share economies of scale with contractholders. In approving the renewal of each of the Agreements, the Board, including the Independent Trustees, did not identify any single factor as controlling, and generally attributed different weights to various factors for the various Portfolios. The Board evaluated all information available to them on a Portfolio-by-Portfolio basis, and their decisions were made separately with respect to each Portfolio.
MSF-33
Metropolitan Series Fund
Neuberger Berman Genesis Portfolio
Managed By Neuberger Berman Management LLC
Portfolio Manager Commentary*
PERFORMANCE
For the one year period ended December 31, 2013, the Class A, B, and E shares of the Neuberger Berman Genesis Portfolio returned 38.52%, 38.19%, and 38.37%, respectively. The Portfolio’s benchmark, the Russell 2000 Value Index1, returned 34.52%.
MARKET ENVIRONMENT / CONDITIONS
The overall U.S. stock market capped off an outstanding year by posting strong results during the fourth quarter. The market’s rally during the reporting period was triggered by a number of factors, including generally positive economic data and corporate profits that often exceeded expectations. Demand for equities was also robust overall, as investors looked to generate higher returns and they appeared to rotate out of bonds given their overall weak results. As the year progressed the outperformance of low quality stocks dissipated and, by the fourth quarter, higher quality stocks were the market leaders. We are encouraged by this turn of events, as it plays into our long-held investment process of emphasizing higher quality/free cash flow generating companies. Even though the Federal Reserve announced the tapering of its asset purchases in December, the decision was positively received by the equity market and it ended the year at an all-time high. All told, the overall stock market, as measured by the S&P 500 Index, gained 32.39% in 2013. This represented its best calendar year return since 1997. Small-cap value stocks generated even better results, as the Russell 2000 Value Index gained 34.52% during the year.
PORTFOLIO REVIEW / PERIOD END POSITIONING
The Portfolio’s outperformance during the period was driven by both stock selection and sector allocation. In particular, from a stock selection perspective, holdings in the Financials, Energy and Consumer Discretionary sectors added the most value. On the downside, holdings in the Health Care sector detracted the most from results. Also modestly detracting from results was stock selection in the Consumer Staples and Information Technology sectors.
Individual stocks that contributed the most to the Portfolio’s results during the year were Wabtec Corp., Oceaneering International, Inc. and Altisource Asset Management Corp. Wabtec manufactures high value components, such as brake shoes and electronics, that improve safety and productivity for rail customers. The stock generates strong cash flow and has high, consistent returns. Throughout the year, the company’s revenues and profitability exceeded expectations due to strength in a key technology franchise known as “Positive Train Control.” It also benefited from recovering demand in the transit market. Oceaneering International builds and operates equipment used for subsea exploration and production of oil and gas, especially in deep water. The company’s performance remained strong during the year, driven by robust sales of subsea production equipment as major oil companies began to shift focus from exploration to development of deep-water fields. Altisource Asset Management is the management company for Altisource Residential, a single family home rental Real Estate Investment Trust (“REIT”). Altisource Asset Management receives management fees and distributions based on the cash flow generated by Altisource Residential. Altisource Residential has been successful raising and deploying capital in support of its strategy.
The Portfolio’s holdings that detracted the most from performance were Alamos Gold, Inc., NETGEAR, Inc. and Endeavour Silver Corp. Alamos Gold is a gold mining company with major operations in Mexico and Turkey. Its shares sold off during the year as the price of gold declined. We retain our positive long term view for the company and the commodity. NETGEAR provides wireless routers and associated products for the home and small business markets. The company’s business came under pressure during the year due to consolidation among its customer base, an execution issue and continued weakness in Europe. We remain confident that the company is well positioned to continue to benefit from continued broadband penetration globally. Endeavor Silver mines for gold and silver in Mexico. The stock sold off sharply in line with other small-cap silver and gold producers as the price of gold declined. We exited the position during the reporting period.
Sector allocation also contributed to the Portfolio’s relative performance during the year. Of note was the positive impact from our lack of exposure to REITs given their low entry barriers and frequent external financing requirements. This positioning was rewarded due to REITs weak performance amid the rising interest rate environment. Conversely, the Portfolio’s roughly 3% cash position was the largest detractor from performance. Even though this allocation was modest and consistent with historical levels, it was a drag on results due to the market’s strong performance and the low yields available from cash instruments.
A number of changes were made to the Portfolio during the period. In particular, we added to the Portfolio’s allocations in the Consumer Discretionary and Financials sectors, while paring its exposures to the Energy and Consumer Staples sectors. The increase in Consumer Discretionary was driven by a number of factors, including improvements in the housing market which we feel will support consumer confidence, the wealth effect and consumer spending. In addition, we felt that less upward pressure from commodities, especially Energy, would be a positive for the sector overall. Within the Financials sector, we focused on a number of areas, including evolving opportunities in special mortgage servicers, driven by changes to the regulatory environment. We also raised our exposure to banks, as
MSF-1
Metropolitan Series Fund
Neuberger Berman Genesis Portfolio
Managed By Neuberger Berman Management LLC
Portfolio Manager Commentary*—(Continued)
margin pressure and a few other economic headwinds for the industry started to ease. Our reduced exposure to the Energy sector was driven by less emerging market demand growth, especially in China, due to a structural shift in the country’s economic model from infrastructure building/export to more internal consumption. At the same time, we continue to see significant new supply from U.S. shale plays, both oil and gas. Finally, our Consumer Staples position was lowered due largely to the elimination of Harris Teeter, our second largest position in the sector at the beginning of the year. The stock was eliminated after it was announced that Kroger would be acquiring the company.
Judith M. Vale
Robert W. D’Alelio
Michael L. Bowyer
Brett S. Reiner
Portfolio Managers
Neuberger Berman Management LLC
* This commentary may include statements that constitute “forward-looking statements” under the U.S. securities laws. Forward-looking statements include, among other things, projections, estimates, and information about possible or future results related to the Portfolio, market or regulatory developments. The views expressed above are not guarantees of future performance or economic results and involve certain risks, uncertainties and assumptions that could cause actual outcomes and results to differ materially from the views expressed herein. The views expressed above are subject to change at any time based upon economic, market, or other conditions and the subadvisory firm undertakes no obligation to update the views expressed herein. Any discussions of specific securities should not be considered a recommendation to buy or sell those securities. The views expressed above (including any forward-looking statement) may not be relied upon as investment advice or as an indication of the Portfolio’s trading intent. Information about the Portfolio’s holdings, asset allocation or country diversification is historical and is not an indication of future Portfolio composition, which may vary. Direct investment in any index is not possible. The performance of any index mentioned in this commentary has not been adjusted for ongoing management, distribution and operating expenses, and sales charges applicable to mutual fund investments. In addition, the returns do not reflect additional fees charged by separate accounts or variable insurance contracts that an investor in the Portfolio may pay. If these additional fees were reflected, performance would have been lower.
MSF-2
Metropolitan Series Fund
Neuberger Berman Genesis Portfolio
A $10,000 INVESTMENT COMPARED TO THE RUSSELL 2000 VALUE INDEX

AVERAGE ANNUAL RETURNS (%) (FOR THE YEAR ENDED DECEMBER 31, 2013)
| | | | | | | | | | | | |
| | | 1 Year | | | 5 Year | | | 10 Year | |
| Neuberger Berman Genesis Portfolio | | | | | | | | | | | | |
Class A | | | 38.52 | | | | 17.27 | | | | 6.35 | |
Class B | | | 38.19 | | | | 16.98 | | | | 6.08 | |
Class E | | | 38.37 | | | | 17.10 | | | | 6.19 | |
| Russell 2000 Value Index | | | 34.52 | | | | 17.64 | | | | 8.61 | |
1 The Russell 2000 Value Index is an unmanaged measure of performance of those Russell 2000 companies that have lower price-to-book ratios and lower forecasted growth values.
Portfolio performance is calculated including reinvestment of all income and capital gain distributions. Performance numbers are net of all Portfolio expenses but do not include any insurance, sales, separate account or administrative charges of variable annuity or life insurance contracts or any additional expenses that participants may bear relating to the operations of their plans. If these charges were included, the returns would be lower. The performance of any index referenced above has not been adjusted for ongoing management, distribution and operating expenses, and sales charges applicable to mutual fund investments. Direct investment in any index is not possible. The performance of Class A shares, as set forth in the line graph above, will differ from that of other classes because of the difference in expenses paid by policyholders investing in the different share classes.
This information represents past performance and is not indicative of future results. Investment return and principal value may fluctuate so that shares, upon redemption, may be worth more or less than the original cost.
PORTFOLIO COMPOSITION AS OF DECEMBER 31, 2013
Top Holdings
| | | | |
| | | % of
Net Assets | |
| Wabtec Corp. | | | 2.2 | |
| Church & Dwight Co., Inc. | | | 2.1 | |
| Aptargroup, Inc. | | | 2.0 | |
| Oceaneering International, Inc. | | | 1.9 | |
| Polaris Industries, Inc. | | | 1.8 | |
| Altisource Portfolio Solutions S.A. | | | 1.8 | |
| Ocwen Financial Corp. | | | 1.8 | |
| CLARCOR, Inc. | | | 1.7 | |
| Solera Holdings, Inc. | | | 1.5 | |
| West Pharmaceutical Services, Inc. | | | 1.5 | |
Top Sectors
| | | | |
| | | % of
Market Value of
Total Long-Term Investments | |
| Industrials | | | 21.8 | |
| Information Technology | | | 15.9 | |
| Financials | | | 14.7 | |
| Consumer Discretionary | | | 13.7 | |
| Health Care | | | 11.1 | |
| Materials | | | 9.3 | |
| Energy | | | 6.7 | |
| Consumer Staples | | | 5.6 | |
| Utilities | | | 1.2 | |
MSF-3
Metropolitan Series Fund
Neuberger Berman Genesis Portfolio
Understanding Your Portfolio’s Expenses
Shareholder Expense Example
As a shareholder of the Portfolio, you incur ongoing costs, including management fees; distribution and service (12b-1) fees; and other Portfolio expenses. This example is intended to help you understand your ongoing costs (in dollars) (referred to as “expenses”) of investing in the Portfolio and compare these costs with the ongoing costs of investing in other mutual funds. The example is based on an investment of $1,000 invested at the beginning of the period and held for the entire period, July 1, 2013 through December 31, 2013.
Actual Expenses
The first line for each share class of the Portfolio in the table below provides information about actual account values and actual expenses. You may use the information in this line, together with the amount you invested in the particular share class of the Portfolio, to estimate the expenses that you paid over the period. Simply divide your account value by $1,000 (for example, an $8,600 account value divided by $1,000 = 8.6), then multiply the result by the number in the first line under the heading entitled “Expenses Paid During Period” to estimate the expenses you paid on your account during this period.
Hypothetical Example for Comparison Purposes
The second line for each share class of the Portfolio in the table below provides information about hypothetical account values and hypothetical expenses based on the Portfolio’s actual expense ratio and an assumed rate of return of 5% per year before expenses, which is not the Portfolio’s actual return. The hypothetical account values and expenses may not be used to estimate the actual ending account balance or expenses you paid for the period. You may use this information to compare the ongoing costs of investing in the Portfolio and other funds. To do so, compare this 5% hypothetical example with the 5% hypothetical examples that appear in the shareholder reports of the other funds.
Please note that the expenses shown in the table are meant to highlight your ongoing costs only and do not reflect any fees or charges of your variable insurance product or any additional expenses that participants in certain eligible qualified plans may bear relating to the operations of their plan. Therefore, the second line for each share class in the table is useful in comparing ongoing costs only, and will not help you determine the relative total costs of owning different funds. In addition, if these other costs were included, your costs would have been higher.
| | | | | | | | | | | | | | | | | | |
Neuberger Berman Genesis Portfolio | | | | Annualized
Expense
Ratio | | | Beginning
Account Value
July 1,
2013 | | | Ending
Account Value
December 31,
2013 | | | Expenses Paid
During Period**
July 1, 2013
to
December 31,
2013 | |
Class A(a) | | Actual | | | 0.81 | % | | $ | 1,000.00 | | | $ | 1,219.90 | | | $ | 4.53 | |
| | Hypothetical* | | | 0.81 | % | | $ | 1,000.00 | | | $ | 1,021.12 | | | $ | 4.13 | |
| | | | | |
Class B(a) | | Actual | | | 1.07 | % | | $ | 1,000.00 | | | $ | 1,218.40 | | | $ | 5.98 | |
| | Hypothetical* | | | 1.07 | % | | $ | 1,000.00 | | | $ | 1,019.81 | | | $ | 5.45 | |
| | | | | |
Class E(a) | | Actual | | | 0.96 | % | | $ | 1,000.00 | | | $ | 1,219.60 | | | $ | 5.37 | |
| | Hypothetical* | | | 0.96 | % | | $ | 1,000.00 | | | $ | 1,020.37 | | | $ | 4.89 | |
* Hypothetical assumes a rate of return of 5% per year before expenses.
** Expenses paid are equal to the Portfolio’s annualized expense ratio for the most recent six month period, as shown above, multiplied by the average account value over the period, multiplied by the number of days (184 days) in the most recent fiscal half-year, divided by 365 (to reflect the one-half year period).
(a) The annualized expense ratio shown reflects the impact of the management fee waiver as described in Note 6 of the Notes to Financial Statements.
MSF-4
Metropolitan Series Fund
Neuberger Berman Genesis Portfolio
Schedule of Investments as of December 31, 2013
Common Stocks—97.2% of Net Assets
| | | | | | | | |
| Security Description | | Shares | | | Value | |
|
Aerospace & Defense—0.1% | |
Cubic Corp. | | | 32,200 | | | $ | 1,695,652 | |
| | | | | | | | |
|
Air Freight & Logistics—0.5% | |
Forward Air Corp. | | | 191,676 | | | | 8,416,493 | |
| | | | | | | | |
|
Auto Components—0.4% | |
Gentex Corp. | | | 214,700 | | | | 7,082,953 | |
| | | | | | | | |
|
Beverages—0.9% | |
Boston Beer Co., Inc. (The) - Class A (a) | | | 62,472 | | | | 15,105,105 | |
| | | | | | | | |
|
Building Products—1.0% | |
AAON, Inc. | | | 202,615 | | | | 6,473,549 | |
AO Smith Corp. | | | 192,400 | | | | 10,378,056 | |
| | | | | | | | |
| | | | | | | 16,851,605 | |
| | | | | | | | |
|
Chemicals—4.2% | |
Balchem Corp. | | | 244,663 | | | | 14,361,718 | |
Hawkins, Inc. | | | 101,590 | | | | 3,778,132 | |
Innophos Holdings, Inc. | | | 189,311 | | | | 9,200,515 | |
NewMarket Corp. | | | 30,217 | | | | 10,097,011 | |
RPM International, Inc. | | | 167,900 | | | | 6,969,529 | |
Sensient Technologies Corp. | | | 435,800 | | | | 21,145,016 | |
Stepan Co. | | | 87,318 | | | | 5,730,680 | |
| | | | | | | | |
| | | | | | | 71,282,601 | |
| | | | | | | | |
|
Commercial Banks—7.6% | |
Bank of Hawaii Corp. | | | 302,600 | | | | 17,895,764 | |
Bank of the Ozarks, Inc. | | | 159,538 | | | | 9,028,255 | |
BankUnited, Inc. | | | 380,500 | | | | 12,526,060 | |
BOK Financial Corp. | | | 177,182 | | | | 11,750,710 | |
Community Bank System, Inc. | | | 149,387 | | | | 5,927,676 | |
Cullen/Frost Bankers, Inc. | | | 253,198 | | | | 18,845,527 | |
CVB Financial Corp. | | | 211,000 | | | | 3,601,770 | |
First Financial Bankshares, Inc. | | | 240,955 | | | | 15,980,136 | |
FNB Corp. | | | 523,048 | | | | 6,600,866 | |
PacWest Bancorp | | | 286,628 | | | | 12,101,434 | |
ViewPoint Financial Group, Inc. | | | 147,400 | | | | 4,046,130 | |
Westamerica Bancorp | | | 174,000 | | | | 9,824,040 | |
| | | | | | | | |
| | | | | | | 128,128,368 | |
| | | | | | | | |
|
Commercial Services & Supplies—4.1% | |
Copart, Inc. (a) | | | 88,600 | | | | 3,247,190 | |
Healthcare Services Group, Inc. | | | 599,414 | | | | 17,005,375 | |
Rollins, Inc. | | | 744,610 | | | | 22,554,237 | |
Team, Inc. (a) | | | 103,403 | | | | 4,378,083 | |
UniFirst Corp. | | | 51,500 | | | | 5,510,500 | |
United Stationers, Inc. | | | 358,474 | | | | 16,450,372 | |
| | | | | | | | |
| | | | | | | 69,145,757 | |
| | | | | | | | |
|
Communications Equipment—0.6% | |
NETGEAR, Inc. (a) | | | 308,600 | | | | 10,165,284 | |
| | | | | | | | |
|
Construction & Engineering—0.1% | |
Primoris Services Corp. | | | 70,000 | | | | 2,179,100 | |
| | | | | | | | |
|
Construction Materials—0.4% | |
Eagle Materials, Inc. | | | 94,800 | | | $ | 7,340,364 | |
| | | | | | | | |
|
Containers & Packaging—2.6% | |
Aptargroup, Inc. | | | 492,354 | | | | 33,386,525 | |
Silgan Holdings, Inc. | | | 215,200 | | | | 10,333,904 | |
| | | | | | | | |
| | | | | | | 43,720,429 | |
| | | | | | | | |
|
Distributors—1.3% | |
Pool Corp. | | | 377,260 | | | | 21,933,896 | |
| | | | | | | | |
|
Electrical Equipment—0.7% | |
Franklin Electric Co., Inc. | | | 102,400 | | | | 4,571,136 | |
Thermon Group Holdings, Inc. (a) | | | 241,100 | | | | 6,589,263 | |
| | | | | | | | |
| | | | | | | 11,160,399 | |
| | | | | | | | |
|
Electronic Equipment, Instruments & Components—2.3% | |
Badger Meter, Inc. | | | 165,088 | | | | 8,997,296 | |
FEI Co. | | | 231,754 | | | | 20,709,537 | |
Littelfuse, Inc. | | | 57,100 | | | | 5,306,303 | |
Rogers Corp. (a) | | | 65,200 | | | | 4,009,800 | |
| | | | | | | | |
| | | | | | | 39,022,936 | |
| | | | | | | | |
|
Energy Equipment & Services—4.5% | |
CARBO Ceramics, Inc. | | | 172,700 | | | | 20,124,731 | |
Natural Gas Services Group, Inc. (a) | | | 261,735 | | | | 7,216,034 | |
Oceaneering International, Inc. | | | 412,800 | | | | 32,561,664 | |
Pason Systems, Inc. | | | 534,200 | | | | 11,549,404 | |
ShawCor, Ltd. | | | 141,700 | | | | 5,663,749 | |
| | | | | | | | |
| | | | | | | 77,115,582 | |
| | | | | | | | |
|
Food & Staples Retailing—0.2% | |
North West Co., Inc. (The) | | | 153,900 | | | | 3,729,241 | |
| | | | | | | | |
|
Food Products—2.2% | |
B&G Foods, Inc. | | | 240,800 | | | | 8,165,528 | |
Flowers Foods, Inc. | | | 430,550 | | | | 9,243,909 | |
J&J Snack Foods Corp. | | | 102,609 | | | | 9,090,131 | |
Lancaster Colony Corp. | | | 118,700 | | | | 10,463,405 | |
| | | | | | | | |
| | | | | | | 36,962,973 | |
| | | | | | | | |
|
Gas Utilities—0.9% | |
Piedmont Natural Gas Co., Inc. | | | 30,900 | | | | 1,024,644 | |
South Jersey Industries, Inc. | | | 147,500 | | | | 8,254,100 | |
WGL Holdings, Inc. | | | 158,600 | | | | 6,353,516 | |
| | | | | | | | |
| | | | | | | 15,632,260 | |
| | | | | | | | |
|
Health Care Equipment & Supplies—5.9% | |
Abaxis, Inc. (a) | | | 181,054 | | | | 7,245,781 | |
Cyberonics, Inc. (a) | | | 29,500 | | | | 1,932,545 | |
Haemonetics Corp. (a) | | | 511,908 | | | | 21,566,684 | |
IDEXX Laboratories, Inc. (a) | | | 179,500 | | | | 19,093,415 | |
Meridian Bioscience, Inc. | | | 374,700 | | | | 9,940,791 | |
Sirona Dental Systems, Inc. (a) | | | 222,700 | | | | 15,633,540 | |
West Pharmaceutical Services, Inc. | | | 501,066 | | | | 24,582,298 | |
| | | | | | | | |
| | | | | | | 99,995,054 | |
| | | | | | | | |
See accompanying notes to financial statements.
MSF-5
Metropolitan Series Fund
Neuberger Berman Genesis Portfolio
Schedule of Investments as of December 31, 2013
Common Stocks—(Continued)
| | | | | | | | |
| Security Description | | Shares | | | Value | |
|
Health Care Providers & Services—2.9% | |
Amsurg Corp. (a) | | | 105,842 | | | $ | 4,860,265 | |
Henry Schein, Inc. (a) | | | 197,300 | | | | 22,543,498 | |
MWI Veterinary Supply, Inc. (a) | | | 123,155 | | | | 21,009,011 | |
| | | | | | | | |
| | | | | | | 48,412,774 | |
| | | | | | | | |
|
Hotels, Restaurants & Leisure—4.4% | |
Bally Technologies, Inc. (a) | | | 277,230 | | | | 21,748,693 | |
Brinker International, Inc. | | | 336,500 | | | | 15,593,410 | |
Cheesecake Factory, Inc. (The) | | | 187,000 | | | | 9,026,490 | |
Cracker Barrel Old Country Store, Inc. | | | 76,200 | | | | 8,387,334 | |
Papa John’s International, Inc. | | | 223,600 | | | | 10,151,440 | |
Texas Roadhouse, Inc. | | | 328,100 | | | | 9,121,180 | |
| | | | | | | | |
| | | | | | | 74,028,547 | |
| | | | | | | | |
|
Household Durables—0.2% | |
Leggett & Platt, Inc. | | | 128,000 | | | | 3,960,320 | |
| | | | | | | | |
|
Household Products—2.1% | |
Church & Dwight Co., Inc. | | | 540,400 | | | | 35,817,712 | |
| | | | | | | | |
|
Industrial Conglomerates—0.8% | |
Raven Industries, Inc. | | | 342,229 | | | | 14,079,301 | |
| | | | | | | | |
|
Insurance—1.1% | |
RLI Corp. | | | 132,270 | | | | 12,880,453 | |
Safety Insurance Group, Inc. | | | 113,700 | | | | 6,401,310 | |
| | | | | | | | |
| | | | | | | 19,281,763 | |
| | | | | | | | |
| | |
Internet Software & Services—0.3% | | | | | | | | |
j2 Global, Inc. | | | 106,700 | | | | 5,336,067 | |
| | | | | | | | |
|
IT Services—1.5% | |
Jack Henry & Associates, Inc. | | | 231,200 | | | | 13,689,352 | |
Sapient Corp. (a) | | | 631,573 | | | | 10,964,107 | |
| | | | | | | | |
| | | | | | | 24,653,459 | |
| | | | | | | | |
|
Leisure Equipment & Products—1.8% | |
Polaris Industries, Inc. | | | 210,898 | | | | 30,715,185 | |
| | | | | | | | |
|
Life Sciences Tools & Services—2.0% | |
ICON plc (a) | | | 492,037 | | | | 19,883,215 | |
PAREXEL International Corp. (a) | | | 157,800 | | | | 7,129,404 | |
Techne Corp. | | | 77,100 | | | | 7,299,057 | |
| | | | | | | | |
| | | | | | | 34,311,676 | |
| | | | | | | | |
|
Machinery—10.5% | |
Chart Industries, Inc. (a) | | | 73,500 | | | | 7,029,540 | |
CLARCOR, Inc. | | | 446,702 | | | | 28,745,274 | |
Donaldson Co., Inc. | | | 302,500 | | | | 13,146,650 | |
Graco, Inc. | | | 95,000 | | | | 7,421,400 | |
Lincoln Electric Holdings, Inc. | | | 65,578 | | | | 4,678,334 | |
Middleby Corp. (The) (a) | | | 61,500 | | | | 14,758,155 | |
Nordson Corp. | | | 259,262 | | | | 19,263,167 | |
RBC Bearings, Inc. (a) | | | 36,700 | | | | 2,596,525 | |
Tennant Co. | | | 87,578 | | | | 5,938,664 | |
|
Machinery—(Continued) | |
Toro Co. (The) | | | 255,100 | | | | 16,224,360 | |
Valmont Industries, Inc. | | | 137,000 | | | | 20,429,440 | |
Wabtec Corp. | | | 500,200 | | | | 37,149,854 | |
| | | | | | | | |
| | | | | | | 177,381,363 | |
| | | | | | | | |
|
Media—1.5% | |
LIN Media LLC - Class A (a) | | | 182,400 | | | | 5,236,704 | |
Media General, Inc. (a) | | | 127,800 | | | | 2,888,280 | |
Nexstar Broadcasting Group, Inc. - Class A | | | 297,500 | | | | 16,579,675 | |
| | | | | | | | |
| | | | | | | 24,704,659 | |
| | | | | | | | |
|
Metals & Mining—1.3% | |
Alamos Gold, Inc. | | | 600,400 | | | | 7,282,852 | |
Compass Minerals International, Inc. | | | 180,700 | | | | 14,465,035 | |
| | | | | | | | |
| | | | | | | 21,747,887 | |
| | | | | | | | |
|
Multi-Utilities—0.3% | |
NorthWestern Corp. | | | 108,300 | | | | 4,691,556 | |
| | | | | | | | |
|
Office Electronics—1.0% | |
Zebra Technologies Corp. - Class A (a) | | | 306,382 | | | | 16,569,139 | |
| | | | | | | | |
|
Oil, Gas & Consumable Fuels—1.9% | |
Evolution Petroleum Corp. | | | 122,500 | | | | 1,511,650 | |
Gulfport Energy Corp. (a) | | | 270,100 | | | | 17,056,815 | |
Laredo Petroleum Holdings, Inc. (a) | | | 182,500 | | | | 5,053,425 | |
Oasis Petroleum, Inc. (a) | | | 149,000 | | | | 6,998,530 | |
Painted Pony Petroleum, Ltd. (a) | | | 271,900 | | | | 1,784,661 | |
| | | | | | | | |
| | | | | | | 32,405,081 | |
| | | | | | | | |
|
Paper & Forest Products—0.5% | |
Stella-Jones, Inc. | | | 246,600 | | | | 6,374,191 | |
Stella-Jones, Inc. (144A) | | | 103,200 | | | | 2,647,399 | |
| | | | | | | | |
| | | | | | | 9,021,590 | |
| | | | | | | | |
|
Professional Services—0.9% | |
Exponent, Inc. | | | 170,178 | | | | 13,178,584 | |
Mistras Group, Inc. (a) | | | 65,934 | | | | 1,376,702 | |
| | | | | | | | |
| | | | | | | 14,555,286 | |
| | | | | | | | |
|
Real Estate Management & Development—2.8% | |
Altisource Asset Management Corp. (a) | | | 17,605 | | | | 16,372,650 | |
Altisource Portfolio Solutions S.A. (a) | | | 191,352 | | | | 30,354,168 | |
| | | | | | | | |
| | | | | | | 46,726,818 | |
| | | | | | | | |
|
Road & Rail—0.3% | |
Genesee & Wyoming, Inc. - Class A (a) | | | 61,700 | | | | 5,926,285 | |
| | | | | | | | |
|
Semiconductors & Semiconductor Equipment—1.8% | |
Hittite Microwave Corp. (a) | | | 271,092 | | | | 16,734,509 | |
Power Integrations, Inc. | | | 238,630 | | | | 13,320,327 | |
| | | | | | | | |
| | | | | | | 30,054,836 | |
| | | | | | | | |
See accompanying notes to financial statements.
MSF-6
Metropolitan Series Fund
Neuberger Berman Genesis Portfolio
Schedule of Investments as of December 31, 2013
Common Stocks—(Continued)
| | | | | | | | |
| Security Description | |
Shares | | | Value | |
|
Software—8.1% | |
Advent Software, Inc. | | | 244,800 | | | $ | 8,565,552 | |
Blackbaud, Inc. | | | 77,894 | | | | 2,932,709 | |
Computer Modelling Group, Ltd. | | | 25,500 | | | | 638,790 | |
Constellation Software, Inc. | | | 91,850 | | | | 19,414,335 | |
FactSet Research Systems, Inc. | | | 98,500 | | | | 10,695,130 | |
Manhattan Associates, Inc. (a) | | | 157,419 | | | | 18,493,584 | |
MICROS Systems, Inc. (a) | | | 401,632 | | | | 23,041,628 | |
Monotype Imaging Holdings, Inc. | | | 294,593 | | | | 9,385,733 | |
Solera Holdings, Inc. | | | 357,500 | | | | 25,296,700 | |
Tyler Technologies, Inc. (a) | | | 176,900 | | | | 18,066,797 | |
| | | | | | | | |
| | | | | | | 136,530,958 | |
| | | | | | | | |
|
Specialty Retail—3.1% | |
Hibbett Sports, Inc. (a) | | | 248,500 | | | | 16,701,685 | |
Sally Beauty Holdings, Inc. (a) | | | 496,300 | | | | 15,003,149 | |
Tractor Supply Co. | | | 280,300 | | | | 21,745,674 | |
| | | | | | | | |
| | | | | | | 53,450,508 | |
| | | | | | | | |
|
Textiles, Apparel & Luxury Goods—0.5% | |
Wolverine World Wide, Inc. | | | 270,700 | | | | 9,192,972 | |
| | | | | | | | |
|
Thrifts & Mortgage Finance—2.9% | |
Brookline Bancorp, Inc. | | | 283,363 | | | | 2,711,784 | |
Home Loan Servicing Solutions, Ltd. | | | 685,039 | | | | 15,735,346 | |
Ocwen Financial Corp. (a) | | | 545,200 | | | | 30,231,340 | |
| | | | | | | | |
| | | | | | | 48,678,470 | |
| | | | | | | | |
|
Trading Companies & Distributors—2.2% | |
Applied Industrial Technologies, Inc. | | | 304,271 | | | | 14,936,663 | |
Beacon Roofing Supply, Inc. (a) | | | 229,413 | | | | 9,240,756 | |
MSC Industrial Direct Co., Inc. - Class A | | | 60,600 | | | | 4,900,722 | |
Watsco, Inc. | | | 91,325 | | | | 8,772,680 | |
| | | | | | | | |
| | | | | | | 37,850,821 | |
| | | | | | | | |
Total Common Stocks
(Cost $1,071,862,691) | | | | | | | 1,646,751,085 | |
| | | | | | | | |
|
| Short-Term Investment—2.8% | |
| Security Description | | Principal
Amount* | | | Value | |
|
Repurchase Agreement—2.8% | |
Fixed Income Clearing Corp. Repurchase Agreement dated 12/31/13 at 0.000%
to be repurchased at $47,383,000 on
01/02/14, collateralized by
$48,395,000 U.S. Treasury Note at
0.250% due 10/31/15 with a
value of $48,334,506. | | | 47,383,000 | | | | 47,383,000 | |
| | | | | | | | |
Total Short-Term Investment
(Cost $47,383,000) | | | | | | | 47,383,000 | |
| | | | | | | | |
Total Investments—100.0%
(Cost $1,119,245,691) (b) | | | | | | | 1,694,134,085 | |
Other assets and liabilities (net)—0.0% | | | | | | | 729,868 | |
| | | | | | | | |
| Net Assets—100.0% | | | | | | $ | 1,694,863,953 | |
| | | | | | | | |
| * | Principal amount stated in U.S. dollars unless otherwise noted. |
| (a) | Non-income producing security. |
| (b) | As of December 31, 2013, the aggregate cost of investments for federal income tax purposes was $1,120,216,387. The aggregate unrealized appreciation and depreciation of investments were $578,176,704 and $(4,259,006), respectively, resulting in net unrealized appreciation of $573,917,698 for federal income tax purposes. |
| (144A)— | Securities exempt from registration under Rule 144A of the Securities Act of 1933. These securities may be resold in transactions exempt from registration, normally to qualified institutional buyers. As of December 31, 2013, the market value of 144A securities was $2,647,399, which is 0.2% of net assets. |
See accompanying notes to financial statements.
MSF-7
Metropolitan Series Fund
Neuberger Berman Genesis Portfolio
Schedule of Investments as of December 31, 2013
Fair Value Hierarchy
Accounting principles generally accepted in the United States of America (“GAAP”) define fair market value as the price that the Portfolio would receive to sell an asset or pay to transfer a liability in an orderly transaction between market participants at the measurement date. It establishes a fair value hierarchy that prioritizes inputs to valuation methods and requires disclosure of the fair value hierarchy that segregates fair value measurements into three levels. Levels 1, 2 and 3 of the fair value hierarchy are defined as follows:
Level 1 - unadjusted quoted prices in active markets for identical investments
Level 2 - other significant observable inputs (including, but not limited to, unadjusted quoted prices for similar investments in markets that are either active or inactive; inputs other than quoted prices that are observable such as interest rates, yield curves, volatilities, prepayment speeds, loss severities, credit risks, default rates, etc.)
Level 3 - significant unobservable inputs based on the best information available in the circumstances, to the extent observable inputs are unavailable (including the Portfolio’s own assumptions in determining the fair value of investments)
The inputs or methodologies used for valuing investments are not necessarily an indication of the risk associated with investing in them. Changes to the inputs or methodologies used may result in transfers between levels, which will be recognized as of the beginning of the reporting period. Information on transfers between Level 1 and Level 2, if any, will be disclosed following the fair value hierarchy table below. A reconciliation of Level 3 securities, if any, will also be disclosed following the fair value hierarchy table. For more information about the Portfolio’s policy regarding the valuation of investments, please refer to the Notes to Financial Statements.
The following table summarizes the fair value hierarchy of the Portfolio’s investments as of December 31, 2013:
| | | | | | | | | | | | | | | | |
| Description | | Level 1 | | | Level 2 | | | Level 3 | | | Total | |
| Common Stocks | | | | | | | | | | | | | | | | |
Aerospace & Defense | | $ | 1,695,652 | | | $ | — | | | $ | — | | | $ | 1,695,652 | |
Air Freight & Logistics | | | 8,416,493 | | | | — | | | | — | | | | 8,416,493 | |
Auto Components | | | 7,082,953 | | | | — | | | | — | | | | 7,082,953 | |
Beverages | | | 15,105,105 | | | | — | | | | — | | | | 15,105,105 | |
Building Products | | | 16,851,605 | | | | — | | | | — | | | | 16,851,605 | |
Chemicals | | | 71,282,601 | | | | — | | | | — | | | | 71,282,601 | |
Commercial Banks | | | 128,128,368 | | | | — | | | | — | | | | 128,128,368 | |
Commercial Services & Supplies | | | 69,145,757 | | | | — | | | | — | | | | 69,145,757 | |
Communications Equipment | | | 10,165,284 | | | | — | | | | — | | | | 10,165,284 | |
Construction & Engineering | | | 2,179,100 | | | | — | | | | — | | | | 2,179,100 | |
Construction Materials | | | 7,340,364 | | | | — | | | | — | | | | 7,340,364 | |
Containers & Packaging | | | 43,720,429 | | | | — | | | | — | | | | 43,720,429 | |
Distributors | | | 21,933,896 | | | | — | | | | — | | | | 21,933,896 | |
Electrical Equipment | | | 11,160,399 | | | | — | | | | — | | | | 11,160,399 | |
Electronic Equipment, Instruments & Components | | | 39,022,936 | | | | — | | | | — | | | | 39,022,936 | |
Energy Equipment & Services | | | 77,115,582 | | | | — | | | | — | | | | 77,115,582 | |
Food & Staples Retailing | | | 3,729,241 | | | | — | | | | — | | | | 3,729,241 | |
Food Products | | | 36,962,973 | | | | — | | | | — | | | | 36,962,973 | |
Gas Utilities | | | 15,632,260 | | | | — | | | | — | | | | 15,632,260 | |
Health Care Equipment & Supplies | | | 99,995,054 | | | | — | | | | — | | | | 99,995,054 | |
Health Care Providers & Services | | | 48,412,774 | | | | — | | | | — | | | | 48,412,774 | |
Hotels, Restaurants & Leisure | | | 74,028,547 | | | | — | | | | — | | | | 74,028,547 | |
Household Durables | | | 3,960,320 | | | | — | | | | — | | | | 3,960,320 | |
Household Products | | | 35,817,712 | | | | — | | | | — | | | | 35,817,712 | |
Industrial Conglomerates | | | 14,079,301 | | | | — | | | | — | | | | 14,079,301 | |
Insurance | | | 19,281,763 | | | | — | | | | — | | | | 19,281,763 | |
Internet Software & Services | | | 5,336,067 | | | | — | | | | — | | | | 5,336,067 | |
IT Services | | | 24,653,459 | | | | — | | | | — | | | | 24,653,459 | |
Leisure Equipment & Products | | | 30,715,185 | | | | — | | | | — | | | | 30,715,185 | |
Life Sciences Tools & Services | | | 34,311,676 | | | | — | | | | — | | | | 34,311,676 | |
Machinery | | | 177,381,363 | | | | — | | | | — | | | | 177,381,363 | |
Media | | | 24,704,659 | | | | — | | | | — | | | | 24,704,659 | |
Metals & Mining | | | 21,747,887 | | | | — | | | | — | | | | 21,747,887 | |
Multi-Utilities | | | 4,691,556 | | | | — | | | | — | | | | 4,691,556 | |
Office Electronics | | | 16,569,139 | | | | — | | | | — | | | | 16,569,139 | |
Oil, Gas & Consumable Fuels | | | 32,405,081 | | | | — | | | | — | | | | 32,405,081 | |
Paper & Forest Products | | | 6,374,191 | | | | 2,647,399 | | | | — | | | | 9,021,590 | |
See accompanying notes to financial statements.
MSF-8
Metropolitan Series Fund
Neuberger Berman Genesis Portfolio
Schedule of Investments as of December 31, 2013
Fair Value Hierarchy—(Continued)
| | | | | | | | | | | | | | | | |
| Description | | Level 1 | | | Level 2 | | | Level 3 | | | Total | |
Professional Services | | $ | 14,555,286 | | | $ | — | | | $ | — | | | $ | 14,555,286 | |
Real Estate Management & Development | | | 46,726,818 | | | | — | | | | — | | | | 46,726,818 | |
Road & Rail | | | 5,926,285 | | | | — | | | | — | | | | 5,926,285 | |
Semiconductors & Semiconductor Equipment | | | 30,054,836 | | | | — | | | | — | | | | 30,054,836 | |
Software | | | 136,530,958 | | | | — | | | | — | | | | 136,530,958 | |
Specialty Retail | | | 53,450,508 | | | | — | | | | — | | | | 53,450,508 | |
Textiles, Apparel & Luxury Goods | | | 9,192,972 | | | | — | | | | — | | | | 9,192,972 | |
Thrifts & Mortgage Finance | | | 48,678,470 | | | | — | | | | — | | | | 48,678,470 | |
Trading Companies & Distributors | | | 37,850,821 | | | | — | | | | — | | | | 37,850,821 | |
Total Common Stocks | | | 1,644,103,686 | | | | 2,647,399 | | | | — | | | | 1,646,751,085 | |
Total Short-Term Investment* | | | — | | | | 47,383,000 | | | | — | | | | 47,383,000 | |
Total Investments | | $ | 1,644,103,686 | | | $ | 50,030,399 | | | $ | — | | | $ | 1,694,134,085 | |
| | | | | | | | | | | | | | | | | |
| * | See Schedule of Investments for additional detailed categorizations. |
See accompanying notes to financial statements.
MSF-9
Metropolitan Series Fund
Neuberger Berman Genesis Portfolio
Statement of Assets and Liabilities
December 31, 2013
| | | | |
Assets | | | | |
Investments at value (a) | | $ | 1,694,134,085 | |
Cash | | | 31 | |
Receivable for: | | | | |
Investments sold | | | 3,711,280 | |
Fund shares sold | | | 97,237 | |
Dividends | | | 998,289 | |
Prepaid expenses | | | 4,016 | |
| | | | |
Total Assets | | | 1,698,944,938 | |
Liabilities | | | | |
Due to bank cash denominated in foreign currencies (b) | | | 26,201 | |
Payables for: | | | | |
Investments purchased | | | 261,883 | |
Fund shares redeemed | | | 2,345,787 | |
Accrued expenses: | | | | |
Management fees | | | 1,118,709 | |
Distribution and service fees | | | 103,176 | |
Deferred trustees’ fees | | | 89,792 | |
Other expenses | | | 135,437 | |
| | | | |
Total Liabilities | | | 4,080,985 | |
| | | | |
Net Assets | | $ | 1,694,863,953 | |
| | | | |
Net assets consist of: | | | | |
Paid in surplus | | $ | 1,384,276,074 | |
Undistributed net investment income | | | 5,002,563 | |
Accumulated net realized loss | | | (269,303,342 | ) |
Unrealized appreciation on investments and foreign currency transactions | | | 574,888,658 | |
| | | | |
Net Assets | | $ | 1,694,863,953 | |
| | | | |
Net Assets | | | | |
Class A | | $ | 1,153,973,557 | |
Class B | | | 418,909,923 | |
Class E | | | 121,980,473 | |
Capital Shares Outstanding* | | | | |
Class A | | | 63,602,793 | |
Class B | | | 23,467,065 | |
Class E | | | 6,799,682 | |
Net Asset Value, Offering Price and Redemption Price Per Share | | | | |
Class A | | $ | 18.14 | |
Class B | | | 17.85 | |
Class E | | | 17.94 | |
| * | The Portfolio is authorized to issue an unlimited number of shares. |
| (a) | Identified cost of investments was $1,119,245,691. |
| (b) | Identified cost of cash denominated in foreign currencies due to custodian was $26,157. |
Statement of Operations
Year Ended December 31, 2013
| | | | |
Investment Income | | | | |
Dividends (a) | | $ | 18,219,412 | |
Interest | | | 9,343 | |
| | | | |
Total investment income | | | 18,228,755 | |
Expenses | | | | |
Management fees | | | 11,693,294 | |
Administration fees | | | 27,777 | |
Custodian and accounting fees | | | 138,463 | |
Distribution and service fees—Class B | | | 764,565 | |
Distribution and service fees—Class E | | | 164,877 | |
Audit and tax services | | | 47,283 | |
Legal | | | 49,735 | |
Trustees’ fees and expenses | | | 36,570 | |
Shareholder reporting | | | 110,544 | |
Insurance | | | 7,644 | |
Miscellaneous | | | 12,442 | |
| | | | |
Total expenses | | | 13,053,194 | |
Less management fee waiver | | | (125,000 | ) |
Less broker commission recapture | | | (122,924 | ) |
| | | | |
Net expenses | | | 12,805,270 | |
| | | | |
Net Investment Income | | | 5,423,485 | |
| | | | |
Net Realized and Unrealized Gain | | | | |
| Net realized gain (loss) on: | | | | |
Investments | | | 173,123,308 | |
Futures contracts | | | (618,335 | ) |
Foreign currency transactions | | | (3,594 | ) |
| | | | |
Net realized gain | | | 172,501,379 | |
| | | | |
| Net change in unrealized appreciation on: | | | | |
Investments | | | 305,307,730 | |
Foreign currency transactions | | | 1,010 | |
| | | | |
Net change in unrealized appreciation | | | 305,308,740 | |
| | | | |
Net realized and unrealized gain | | | 477,810,119 | |
| | | | |
Net Increase in Net Assets from Operations | | $ | 483,233,604 | |
| | | | |
| (a) | Net of foreign withholding taxes of $162,005. |
See accompanying notes to financial statements.
MSF-10
Metropolitan Series Fund
Neuberger Berman Genesis Portfolio
Statements of Changes in Net Assets
| | | | | | | | |
| | | Year Ended
December 31,
2013 | | | Year Ended
December 31,
2012 | |
Increase (Decrease) in Net Assets: | | | | | | | | |
From Operations | | | | | | | | |
Net investment income | | $ | 5,423,485 | | | $ | 9,532,998 | |
Net realized gain | | | 172,501,379 | | | | 26,499,667 | |
Net change in unrealized appreciation | | | 305,308,740 | | | | 70,277,681 | |
| | | | | | | | |
Increase in net assets from operations | | | 483,233,604 | | | | 106,310,346 | |
| | | | | | | | |
From Distributions to Shareholders | | | | | | | | |
Net investment income | | | | | | | | |
Class A | | | (7,826,114 | ) | | | (3,314,847 | ) |
Class B | | | (764,142 | ) | | | (156,523 | ) |
Class E | | | (667,678 | ) | | | (216,498 | ) |
| | | | | | | | |
Total distributions | | | (9,257,934 | ) | | | (3,687,868 | ) |
| | | | | | | | |
Increase (decrease) in net assets from capital share transactions | | | 91,139,738 | | | | (56,260,150 | ) |
| | | | | | | | |
Total increase in net assets | | | 565,115,408 | | | | 46,362,328 | |
| | |
Net Assets | | | | | | | | |
Beginning of period | | | 1,129,748,545 | | | | 1,083,386,217 | |
| | | | | | | | |
End of period | | $ | 1,694,863,953 | | | $ | 1,129,748,545 | |
| | | | | | | | |
Undistributed Net Investment Income | | | | | | | | |
End of period | | $ | 5,002,563 | | | $ | 9,325,531 | |
| | | | | | | | |
Other Information:
Capital Shares
Transactions in capital shares were as follows:
| | | | | | | | | | | | | | | | |
| | | Year Ended
December 31, 2013 | | | Year Ended
December 31, 2012 | |
| | | Shares | | | Value | | | Shares | | | Value | |
Class A | | | | | | | | | | | | | | | | |
Sales | | | 7,032,471 | | | $ | 102,037,519 | | | | 3,260,302 | | | $ | 41,074,736 | |
Shares issued through acquisition | | | 6,103,045 | | | | 87,090,450 | | | | 0 | | | | 0 | |
Reinvestments | | | 561,414 | | | | 7,826,114 | | | | 262,874 | | | | 3,314,847 | |
Redemptions | | | (19,908,137 | ) | | | (300,671,391 | ) | | | (5,773,961 | ) | | | (73,418,076 | ) |
| | | | | | | | | | | | | | | | |
Net decrease | | | (6,211,207 | ) | | $ | (103,717,308 | ) | | | (2,250,785 | ) | | $ | (29,028,493 | ) |
| | | | | | | | | | | | | | | | |
Class B | | | | | | | | | | | | | | | | |
Sales | | | 1,388,739 | | | $ | 21,956,905 | | | | 650,314 | | | $ | 8,094,876 | |
Shares issued through acquisition | | | 18,058,543 | | | | 253,903,111 | | | | 0 | | | | 0 | |
Reinvestments | | | 55,615 | | | | 764,142 | | | | 12,582 | | | | 156,523 | |
Redemptions | | | (5,039,255 | ) | | | (77,854,399 | ) | | | (1,627,473 | ) | | | (20,313,351 | ) |
| | | | | | | | | | | | | | | | |
Net increase (decrease) | | | 14,463,642 | | | $ | 198,769,759 | | | | (964,577 | ) | | $ | (12,061,952 | ) |
| | | | | | | | | | | | | | | | |
Class E | | | | | | | | | | | | | | | | |
Sales | | | 148,626 | | | $ | 2,176,092 | | | | 283,414 | | | $ | 3,554,756 | |
Shares issued through acquisition | | | 1,348,885 | | | | 19,046,267 | | | | 0 | | | | 0 | |
Reinvestments | | | 48,382 | | | | 667,678 | | | | 17,334 | | | | 216,498 | |
Redemptions | | | (1,683,324 | ) | | | (25,802,750 | ) | | | (1,514,198 | ) | | | (18,940,959 | ) |
| | | | | | | | | | | | | | | | |
Net decrease | | | (137,431 | ) | | $ | (3,912,713 | ) | | | (1,213,450 | ) | | $ | (15,169,705 | ) |
| | | | | | | | | | | | | | | | |
Increase (decrease) derived from capital shares transactions | | | | | | $ | 91,139,738 | | | | | | | $ | (56,260,150 | ) |
| | | | | | | | | | | | | | | | |
See accompanying notes to financial statements.
MSF-11
Metropolitan Series Fund
Neuberger Berman Genesis Portfolio
Financial Highlights
| | | | | | | | | | | | | | | | | | | | |
| Selected per share data | | | |
| | | Class A | |
| | | Year Ended December 31, | |
| | | 2013 | | | 2012 | | | 2011 | | | 2010 | | | 2009 | |
Net Asset Value, Beginning of Period | | $ | 13.21 | | | $ | 12.05 | | | $ | 11.47 | | | $ | 9.48 | | | $ | 8.48 | |
| | | | | | | | | | | | | | | | | | | | |
Income (Loss) from Investment Operations | | | | | | | | | | | | | | | | | | | | |
Net investment income (a) | | | 0.07 | | | | 0.11 | | | | 0.05 | | | | 0.11 | | | | 0.06 | |
Net realized and unrealized gain on investments | | | 4.98 | | | | 1.10 | | | | 0.62 | | | | 1.93 | | | | 1.03 | |
| | | | | | | | | | | | | | | | | | | | |
Total from investment operations | | | 5.05 | | | | 1.21 | | | | 0.67 | | | | 2.04 | | | | 1.09 | |
| | | | | | | | | | | | | | | | | | | | |
Less Distributions | | | | | | | | | | | | | | | | | | | | |
Distributions from net investment income | | | (0.12 | ) | | | (0.05 | ) | | | (0.09 | ) | | | (0.05 | ) | | | (0.09 | ) |
| | | | | | | | | | | | | | | | | | | | |
Total distributions | | | (0.12 | ) | | | (0.05 | ) | | | (0.09 | ) | | | (0.05 | ) | | | (0.09 | ) |
| | | | | | | | | | | | | | | | | | | | |
Net Asset Value, End of Period | | $ | 18.14 | | | $ | 13.21 | | | $ | 12.05 | | | $ | 11.47 | | | $ | 9.48 | |
| | | | | | | | | | | | | | | | | | | | |
Total Return (%) (b) | | | 38.52 | | | | 10.03 | | | | 5.80 | | | | 21.58 | | | | 13.15 | |
| | | | | |
Ratios/Supplemental Data | | | | | | | | | | | | | | | | | | | | |
Gross ratio of expenses to average net assets (%) | | | 0.83 | | | | 0.86 | | | | 0.86 | | | | 0.89 | | | | 0.94 | |
Net ratio of expenses to average net assets (%) (c) | | | 0.82 | | | | 0.85 | | | | 0.85 | | | | 0.88 | | | | 0.94 | |
Ratio of net investment income to average net assets (%) | | | 0.42 | | | | 0.89 | | | | 0.40 | | | | 1.09 | | | | 0.67 | |
Portfolio turnover rate (%) | | | 17 | | | | 15 | | | | 12 | | | | 84 | | | | 219 | |
Net assets, end of period (in millions) | | $ | 1,154.0 | | | $ | 922.1 | | | $ | 868.1 | | | $ | 729.6 | | | $ | 264.0 | |
| | | | | | | | | | | | | | | | | | | | |
| | | Class B | |
| | | Year Ended December 31, | |
| | | 2013 | | | 2012 | | | 2011 | | | 2010 | | | 2009 | |
Net Asset Value, Beginning of Period | | $ | 13.00 | | | $ | 11.86 | | | $ | 11.30 | | | $ | 9.34 | | | $ | 8.35 | |
| | | | | | | | | | | | | | | | | | | | |
Income (Loss) from Investment Operations | | | | | | | | | | | | | | | | | | | | |
Net investment income (a) | | | 0.03 | | | | 0.08 | | | | 0.02 | | | | 0.06 | | | | 0.03 | |
Net realized and unrealized gain on investments | | | 4.91 | | | | 1.08 | | | | 0.61 | | | | 1.93 | | | | 1.03 | |
| | | | | | | | | | | | | | | | | | | | |
Total from investment operations | | | 4.94 | | | | 1.16 | | | | 0.63 | | | | 1.99 | | | | 1.06 | |
| | | | | | | | | | | | | | | | | | | | |
Less Distributions | | | | | | | | | | | | | | | | | | | | |
Distributions from net investment income | | | (0.09 | ) | | | (0.02 | ) | | | (0.07 | ) | | | (0.03 | ) | | | (0.07 | ) |
| | | | | | | | | | | | | | | | | | | | |
Total distributions | | | (0.09 | ) | | | (0.02 | ) | | | (0.07 | ) | | | (0.03 | ) | | | (0.07 | ) |
| | | | | | | | | | | | | | | | | | | | |
Net Asset Value, End of Period | | $ | 17.85 | | | $ | 13.00 | | | $ | 11.86 | | | $ | 11.30 | | | $ | 9.34 | |
| | | | | | | | | | | | | | | | | | | | |
Total Return (%) (b) | | | 38.19 | | | | 9.75 | | | | 5.51 | | | | 21.34 | | | | 12.84 | |
| | | | | |
Ratios/Supplemental Data | | | | | | | | | | | | | | | | | | | | |
Gross ratio of expenses to average net assets (%) | | | 1.08 | | | | 1.11 | | | | 1.11 | | | | 1.14 | | | | 1.19 | |
Net ratio of expenses to average net assets (%) (c) | | | 1.07 | | | | 1.10 | | | | 1.10 | | | | 1.13 | | | | 1.19 | |
Ratio of net investment income to average net assets (%) | | | 0.22 | | | | 0.63 | | | | 0.14 | | | | 0.64 | | | | 0.42 | |
Portfolio turnover rate (%) | | | 17 | | | | 15 | | | | 12 | | | | 84 | | | | 219 | |
Net assets, end of period (in millions) | | $ | 418.9 | | | $ | 117.0 | | | $ | 118.2 | | | $ | 122.3 | | | $ | 108.8 | |
Please see following page for Financial Highlights footnote legend.
See accompanying notes to financial statements.
MSF-12
Metropolitan Series Fund
Neuberger Berman Genesis Portfolio
Financial Highlights
| | | | | | | | | | | | | | | | | | | | |
| Selected per share data | | | |
| | | Class E | |
| | | Year Ended December 31, | |
| | | 2013 | | | 2012 | | | 2011 | | | 2010 | | | 2009 | |
Net Asset Value, Beginning of Period | | $ | 13.06 | | | $ | 11.91 | | | $ | 11.35 | | | $ | 9.38 | | | $ | 8.39 | |
| | | | | | | | | | | | | | | | | | | | |
Income (Loss) from Investment Operations | | | | | | | | | | | | | | | | | | | | |
Net investment income (a) | | | 0.04 | | | | 0.09 | | | | 0.03 | | | | 0.07 | | | | 0.04 | |
Net realized and unrealized gain on investments | | | 4.94 | | | | 1.09 | | | | 0.60 | | | | 1.94 | | | | 1.03 | |
| | | | | | | | | | | | | | | | | | | | |
Total from investment operations | | | 4.98 | | | | 1.18 | | | | 0.63 | | | | 2.01 | | | | 1.07 | |
| | | | | | | | | | | | | | | | | | | | |
Less Distributions | | | | | | | | | | | | | | | | | | | | |
Distributions from net investment income | | | (0.10 | ) | | | (0.03 | ) | | | (0.07 | ) | | | (0.04 | ) | | | (0.08 | ) |
| | | | | | | | | | | | | | | | | | | | |
Total distributions | | | (0.10 | ) | | | (0.03 | ) | | | (0.07 | ) | | | (0.04 | ) | | | (0.08 | ) |
| | | | | | | | | | | | | | | | | | | | |
Net Asset Value, End of Period | | $ | 17.94 | | | $ | 13.06 | | | $ | 11.91 | | | $ | 11.35 | | | $ | 9.38 | |
| | | | | | | | | | | | | | | | | | | | |
Total Return (%) (b) | | | 38.37 | | | | 9.90 | | | | 5.56 | | | | 21.45 | | | | 12.92 | |
| | | | | |
Ratios/Supplemental Data | | | | | | | | | | | | | | | | | | | | |
Gross ratio of expenses to average net assets (%) | | | 0.98 | | | | 1.01 | | | | 1.01 | | | | 1.04 | | | | 1.09 | |
Net ratio of expenses to average net assets (%) (c) | | | 0.97 | | | | 1.00 | | | | 1.00 | | | | 1.03 | | | | 1.09 | |
Ratio of net investment income to average net assets (%) | | | 0.28 | | | | 0.72 | | | | 0.24 | | | | 0.71 | | | | 0.52 | |
Portfolio turnover rate (%) | | | 17 | | | | 15 | | | | 12 | | | | 84 | | | | 219 | |
Net assets, end of period (in millions) | | $ | 122.0 | | | $ | 90.6 | | | $ | 97.1 | | | $ | 112.2 | | | $ | 108.6 | |
| (a) | Per share amounts based on average shares outstanding during the period. |
| (b) | Total return does not reflect any insurance, sales, separate account or administrative charges of variable annuity or life insurance contracts or any additional expenses that contract owners may bear under their variable contracts. If these charges were included, the returns would be lower. |
| (c) | Net ratio of expenses to average net assets includes the effect of management fee waivers as detailed in Note 6 of the Notes to Financial Statements. |
See accompanying notes to financial statements.
MSF-13
Metropolitan Series Fund
Neuberger Berman Genesis Portfolio
Notes to Financial Statements—December 31, 2013
1. Organization
Metropolitan Series Fund (the “Trust”) is organized as a Delaware statutory trust and registered under the Investment Company Act of 1940, as amended (the “1940 Act”), as an open-end management investment company. The Trust is currently comprised of thirty series, each of which operates as a distinct investment vehicle of the Trust. The portfolio included in this report is Neuberger Berman Genesis Portfolio (the “Portfolio”), which is diversified. Shares in the Portfolio are not offered directly to the general public and are currently available only to separate accounts established by Metropolitan Life Insurance Company (“MetLife”) and other affiliated life insurance companies.
The Portfolio has registered and offers three classes of shares: Class A, B, and E shares. Shares of each Class of the Portfolio represent an equal pro rata interest in the Portfolio and generally give the shareholder the same voting, dividend, liquidation, and other rights. Investment income, realized and unrealized capital gains and losses, the common expenses of the Portfolio, and certain Portfolio-level expense reductions, if any, are allocated on a pro rata basis to each Class based on the relative net assets of each Class to the net assets of the Portfolio. Each Class of shares differs in its respective distribution plan and such distribution expenses are allocated to that Class.
2. Significant Accounting Policies
The preparation of financial statements in conformity with accounting principles generally accepted in the United States of America (“GAAP”) requires management to make estimates and assumptions that affect the reported amounts of assets and liabilities and disclosure of contingent assets and liabilities as of the date of the financial statements and the reported amounts of income and expenses during the reporting period. Actual results could differ from those estimates. In the preparation of these financial statements, management has evaluated events and transactions subsequent to December 31, 2013 through the date the financial statements were issued.
The following is a summary of significant accounting policies consistently followed by the Portfolio in the preparation of its financial statements.
Investment Valuation and Fair Value Measurements - Debt securities (other than short term obligations with a remaining maturity of sixty days or less), including corporate, convertible and municipal bonds and notes; obligations of the U.S. treasury and U.S. government agencies; sovereign issues; floating rate loans; and non-U.S. bonds, are generally valued on the basis of evaluated or composite bid quotations obtained from independent pricing services and/or brokers and dealers selected by MetLife Advisers, LLC (“MetLife Advisers” or the “Adviser”), an affiliate of MetLife, Inc., pursuant to authorization of the Board of Trustees of the Trust (the “Board” or “Trustees”). Such quotations utilize matrix pricing, which considers observable inputs including, among other things, issuer details, maturity dates, interest rates, yield curves, rates of prepayment, credit risks/spreads, default rates, reported trades, broker dealer quotes and quoted prices for similar securities. Securities that use similar valuation techniques and inputs as described above are generally categorized as Level 2 within the fair value hierarchy.
Mortgage and asset-backed securities are usually issued as separate tranches, or classes, of securities within each deal. These securities are also generally valued on the basis of evaluated or composite bid quotations obtained from independent pricing services and/or brokers and dealers selected by the Adviser pursuant to authorization of the Board. The pricing models for these securities usually consider tranche-level attributes, estimated cash flows and market-based yield spreads for each tranche and current market data, and incorporate deal collateral performance, as available. Mortgage and asset-backed securities that use similar valuation techniques and inputs as described above are generally categorized as Level 2 within the fair value hierarchy.
Short term obligations with a remaining maturity of sixty days or less are generally valued at amortized cost, which approximates fair market value, and are generally categorized as Level 2 within the fair value hierarchy.
Domestic and foreign equity securities, such as common stock, exchange-traded funds, rights, warrants, and preferred stock, that are traded on a securities exchange, are generally valued at their last sale price on the exchange or market in which they are principally traded on the valuation date, or, if no sales occurred on that day, at the last reported bid price. Equity securities traded over-the-counter are generally valued at the last reported sale price. Valuation adjustments may be applied to certain foreign equity securities that are traded solely on foreign exchanges that close before the close of the U.S. market to account for the market movement between the close of the foreign exchanges and the close of the U.S. market. The Portfolio may use a systematic fair valuation model provided by an independent third party to value securities principally traded in these foreign markets in order to adjust for possible stale pricing that may occur between the close of the foreign exchanges and the time of the Portfolio valuation. Foreign equity securities using these valuation adjustments are generally categorized as Level 2 within the fair value hierarchy. Equity securities that are actively traded, and have no valuation adjustments applied, are categorized as Level 1 within the fair value hierarchy. Other equity securities traded on inactive markets, or valued in reference to similar instruments traded on active markets, are generally categorized as Level 2 within the fair value hierarchy.
MSF-14
Metropolitan Series Fund
Neuberger Berman Genesis Portfolio
Notes to Financial Statements—December 31, 2013—(Continued)
Investments in registered open-end management investment companies are valued at reported net asset value per share on the valuation date and are categorized as Level 1 within the fair value hierarchy.
Forward foreign currency exchange contracts are valued through an independent pricing service based on the mean between closing bid and ask prices of the forward currency rates in the London foreign exchange markets on a daily basis as provided by a reliable bank or dealer. These contracts are generally categorized as Level 2 within the fair value hierarchy.
Options, whether on securities, indices, futures contracts, or otherwise, traded on exchanges are valued at the last sale price available as of the close of business on the valuation date or, if there is no such price available, at the mean between the last reported bid and ask prices. These types of options are categorized as Level 1 within the fair value hierarchy. Futures contracts, which are traded on commodity exchanges, are valued at their closing prices as of the close of such exchanges and are categorized as Level 1 within the fair value hierarchy.
Options and futures contracts that are traded over-the-counter are generally valued on the basis of quotations provided by broker-dealers or prices provided by pricing service providers who use a series of techniques, including simulation pricing models, to determine the value of the contracts. The pricing models use inputs that are observed from actively quoted markets such as issuer details, indices, spreads, interest rates, yield curves, credit curves, measures of volatility and exchange rates. These contracts are generally categorized as Level 2 within the fair value hierarchy.
If no current market value quotation or other observable inputs are readily available or market value quotations are deemed to be unreliable for a security, the fair value of the security will be determined in accordance with procedures approved by and under the general supervision of the Board. In such a circumstance, the Board has delegated the determination of the fair value of a security to a Valuation Committee (“Committee”) of MetLife Advisers. The Committee provides general pricing oversight and fair value pricing determinations related to portfolio securities and meets on a regular basis to review reports relating to the valuation of the securities in the Portfolio. The Board has delegated to State Street Bank and Trust Company, the Trust’s custodian (“custodian”), the responsibility for calculating the net asset values (“NAVs”) of the Trust’s Portfolios. The Committee is responsible for overseeing the calculation of the NAVs of the Portfolios by the custodian. The Committee also periodically reviews pricing vendors, including the vendor providing fair value pricing for the Portfolio’s foreign securities, and is responsible for overseeing the correction of pricing errors and addressing other pricing issues that arise in the ordinary course of business, such as making real-time fair value determinations, as necessary.
No single standard for determining the fair value of a security can be set forth because fair value depends upon the facts and circumstances with respect to each security. Information relating to any relevant factors may be obtained by the Committee from any appropriate source, including the subadviser of the Portfolio, the custodian, a pricing service, market maker and/or broker for such security or the issuer. Appropriate methodologies for determining fair value under particular circumstances may include: matrix pricing, comparisons of securities with comparable characteristics, value based on multiples of earnings, discount from market price of similar marketable securities or a combination of these and other methods. The Committee maintains a detailed report tracking each fair-valued security that compares the fair value price to the next available trade, vendor or broker price, and provides information on how close the fair value price was to the next quoted price. The Committee reviews a summary of such report monthly. On a quarterly basis, the Board is provided with the following for consideration and ratification or adjustment: (1) a memorandum summarizing the actions taken by the Committee in the prior quarter; and (2) a list of the Portfolio’s securities as of the most recent quarter-end for which market quotations were not readily available.
Investment Transactions and Related Investment Income - Portfolio security transactions are recorded on the trade date. Dividend income is recorded on the ex-dividend date or, for certain foreign securities, when notified. Interest income, which includes amortization of premium and accretion of discount on debt securities, is recorded on the accrual basis. Realized gains and losses on investments are determined on the identified cost basis, which is the same basis used for federal income tax purposes. Foreign income and foreign capital gains on some foreign securities may be subject to foreign taxes, which are accrued as applicable. These foreign taxes have been provided for in accordance with the Portfolio’s understanding of the applicable countries’ tax rules and rates.
Foreign Currency Translation - The books and records of the Portfolio are maintained in U.S. dollars. The values of securities, currencies, and other assets and liabilities denominated in currencies other than the U.S. dollar are translated into U.S. dollars based upon foreign exchange rates prevailing at the end of the period. Purchases and sales of investment securities, income, and expenses are translated on the respective dates of such transactions. Because the values of investment securities are translated at the foreign exchange rates prevailing at the end of the period, that portion of the results of operations arising from changes in exchange rates and that portion of the results of operations reflecting fluctuations arising from changes in market prices of the investment securities are not separated. Such fluctuations are included in the net realized and unrealized gain or loss on investments.
Net realized foreign exchange gains or losses arise from activity in forward foreign currency exchange contracts, sales of foreign currency, currency gains or losses realized between the trade and settlement dates on securities transactions, and the difference between the amounts of dividends, interest, and foreign withholding taxes recorded by the Portfolio and the U.S. dollar equivalent of
MSF-15
Metropolitan Series Fund
Neuberger Berman Genesis Portfolio
Notes to Financial Statements—December 31, 2013—(Continued)
the amounts actually received or paid by the Portfolio. Net unrealized foreign exchange gains and losses arise from changes in the value of assets and liabilities, other than investment securities, resulting from changes in foreign exchange rates.
Income Taxes - It is the Portfolio’s policy to comply with the requirements of the Internal Revenue Code of 1986, as amended, and regulations thereunder, applicable to regulated investment companies and to distribute, with respect to each taxable year, all of its taxable income to shareholders. Therefore, no federal income tax provision is required. The Portfolio files U.S. federal tax returns. No income tax returns are currently under examination. The Portfolio’s federal tax returns for the prior three fiscal years remain subject to examination by the Internal Revenue Service. As of December 31, 2013, the Portfolio had no uncertain tax positions that would require financial statement recognition, or de-recognition or disclosure.
Dividends and Distributions to Shareholders - The Portfolio records dividends and distributions on the ex-dividend date. Net realized gains from security transactions (if any) are generally distributed annually to shareholders. The timing and characterization of certain income and capital gains distributions are determined in accordance with federal tax regulations that may differ from GAAP. Permanent book and tax basis differences relating to shareholder distributions will result in reclassification between under/over distributed net investment income, accumulated net realized gains/losses, and paid-in surplus. Book-tax differences are primarily due to broker commission recapture reclass, passive foreign investment companies (PFIC), merger related adjustments and foreign currency transactions. These adjustments have no impact on net assets or the results of operations.
Repurchase Agreements - The Portfolio may enter into repurchase agreements, under the terms of a Master Repurchase Agreement, with selected commercial banks and broker-dealers, under which the Portfolio acquires securities as collateral and agrees to resell the securities at an agreed upon time and at an agreed-upon price. The Portfolio, through the custodian or a subcustodian, receives delivery of the underlying securities collateralizing any repurchase agreements. The Portfolio requires the custodian to take possession, to have legally segregated in the Federal Reserve Book Entry System, or to have segregated within the custodian’s vault, all securities held as collateral for repurchase agreements. It is the Portfolio’s policy that the market value of the collateral be at least equal to 100% of the repurchase price in the case of a repurchase agreement of one-day duration and at least equal to 102% of the repurchase price in the case of all other repurchase agreements. In the event of default or failure by a party to perform an obligation in connection with any repurchase transaction, the Master Repurchase Agreement gives the non-defaulting party the right to set-off claims and to apply property held by it in connection with any repurchase transaction against obligations owed to it.
At December 31, 2013, the Portfolio had investments in repurchase agreements with a gross value of $47,383,000, which is included as part of investments at value on the Statement of Assets and Liabilities. The value of the related collateral exceeded the value of the repurchase agreements at December 31, 2013.
Directed Brokerage Agreement - The Trust has entered into a directed brokerage arrangement with State Street Global Markets (“SSGM”). Under this arrangement, the Portfolio directs certain trades to SSGM in return for a recapture credit. SSGM issues a cash rebate to the Portfolio. Amounts paid to the Portfolio are shown separately as broker commission recapture on the Statement of Operations of the Portfolio. Additionally, these amounts have been excluded from the calculation of the net ratio of expenses to average net assets presented in the Financial Highlights for each share class.
3. Investments in Derivative Instruments
Futures Contracts - The Portfolio may buy and sell futures contracts as a hedge, to maintain investment exposure to a target asset class or to enhance return. The Portfolio may be subject to fluctuations in equity prices, interest rates, commodity prices, and foreign currency exchange rates in the normal course of pursuing its investment objective. Futures contracts are standardized agreements to buy or sell a security, or deliver a final cash settlement price in connection with an index, interest rate, currency, or other asset. The Portfolio must deposit an amount (“initial margin”) equal to a certain percentage of the face value of the futures contract. The initial margin may be in the form of cash or securities, which is returned when the Portfolio’s obligations under the contract have been satisfied. If cash is deposited as the initial margin, it is shown as cash collateral on the Statement of Assets and Liabilities. Futures contracts are marked-to-market daily, and subsequent payments (“variation margin”) are made or received by the Portfolio depending on whether unrealized gains or losses are incurred. These amounts are reflected as receivables or payables on the Statement of Assets and Liabilities and as a component of net change in unrealized appreciation/depreciation on the Statement of Operations. When the contract is closed or expires, the Portfolio records a realized gain or loss equal to the difference between the value of the contract at the time it was opened and the value at the time it was closed. Risks of entering into futures contracts (and related options) include the possibility that the market for these instruments may be illiquid and that a change in the value of the contract or option may not correlate perfectly with changes in the value of the underlying instrument. Futures contracts are exchange-traded and the exchange’s clearinghouse, as counterparty to all exchange-traded futures, guarantees the futures contracts against default. For over-the-counter futures the Portfolio’s ability to terminate the positions may be more limited than in the case of exchange-traded positions and may also involve the risk that securities dealers participating in such transactions would fail to meet their obligations to the Portfolio.
During the year ended December 31, 2013, the Portfolio entered into equity index futures contracts which were subject to equity price risk. During the period April 12, 2013 through April 16, 2013, the Portfolio had bought and sold $33,987,394 in equity index futures contracts.
MSF-16
Metropolitan Series Fund
Neuberger Berman Genesis Portfolio
Notes to Financial Statements—December 31, 2013—(Continued)
At December 31, 2013, the Portfolio did not have any open futures contracts. For the year ended December 31, 2013, the Portfolio had realized losses in the amount of $618,335 which are shown under Net realized loss on futures contracts in the Statement of Operations.
4. Certain Risks
Market Risk: In the normal course of business, the Portfolio invests in securities and enters into transactions where risks exist due to fluctuations in the market (market risk) or failure of the other party to a transaction to perform (credit and counterparty risk). The value of securities held by the Portfolio may decline in response to certain events, including those directly involving the companies whose securities are owned by the Portfolio; conditions affecting the general economy; overall market changes; local, regional or global political, social or economic instability; currency, interest rate, and price fluctuations.
Credit and Counterparty Risk: The Portfolio may be exposed to counterparty risk, or the risk that an entity with which the Portfolio has unsettled or open transactions may default. The potential loss could exceed the value of the financial assets and liabilities recorded in the financial statements. Financial assets that potentially expose the Portfolio to credit and counterparty risk consist principally of cash due from counterparties and investments. The Portfolio manages counterparty risk by entering into agreements only with counterparties that it believes have the financial resources to honor their obligations and by monitoring the financial stability of those counterparties. The Portfolio’s investment adviser attempts to mitigate counterparty risk by (i) periodically assessing the creditworthiness of its trading partners, (ii) monitoring and/or limiting the amount of its net exposure to each individual counterparty based on its assessment, and (iii) requiring collateral from the counterparty for certain transactions. In order to preserve certain safeguards for non-standard settlement trades, the Portfolio restricts its exposure to credit and counterparty losses by entering into master netting agreements with counterparties (approved brokers) with whom it undertakes a significant volume of transactions. Master Agreements govern the terms of certain transactions, and reduce the counterparty risk associated with relevant transactions by specifying credit protection mechanisms and providing standardization that improves legal certainty. Master Agreements can also help limit counterparty risk by specifying collateral posting arrangements at prearranged exposure levels.
Repurchase and reverse repurchase agreements are primarily executed under Global Master Repurchase Agreements (“GMRAs”) or Master Repurchase Agreements (“MRAs”), which provide the rights to set-off. Each repurchase and reverse repurchase agreement is initially collateralized at the transaction level. In the event of default, the total market value exposure will be offset against collateral exchanged to date, which would result in a net receivable/(payable) that would be due from/to the counterparty.
Customer Account Agreements and related addendums govern cleared derivatives transactions such as futures, options on futures, and cleared OTC derivatives. Cleared derivative transactions require posting of initial margin as determined by each relevant clearing agency which is segregated at a broker account registered with the Commodities Futures Trading Commission (CFTC), or the applicable regulator. In the U.S., counterparty risk is significantly reduced as creditors of the futures broker do not have claim to Portfolio assets in the segregated account. Additionally, portability of exposure in the event of default further reduces risk to the Portfolio. Variation margin, or changes in market value, are exchanged daily, but may not be netted between futures and cleared OTC derivatives.
Additional risks associated with each type of investment are described above within the respective security type notes. The Portfolio’s prospectus includes a discussion of the principal risks of investing in the Portfolio.
5. Investment Transactions
Aggregate cost of purchases and proceeds of sales of investment securities, excluding short-term securities, for the year ended December 31, 2013 were as follows:
| | | | | | | | | | | | |
Purchases | | | Sales | |
U.S. Government | | Non U.S. Government | | | U.S. Government | | | Non U.S. Government | |
| $0 | | $ | 246,164,319 | | | $ | 0 | | | $ | 512,803,158 | |
During the year ended December 31, 2013, the Portfolio engaged in security transactions with other affiliated portfolios. These amounted to $17,949,481 in sales of investments, which are included above.
With respect to the Portfolio’s merger with MLA Mid Cap Portfolio (see Note 9) on April 26, 2013, the Portfolio acquired long-term securities with a cost of $319,840,815 that are not included in the above non-U.S. Government purchases value.
MSF-17
Metropolitan Series Fund
Neuberger Berman Genesis Portfolio
Notes to Financial Statements—December 31, 2013—(Continued)
6. Investment Management Fees and Other Transactions with Affiliates
Investment Management Agreement - MetLife Advisers is the investment adviser to the Portfolio. The Trust has entered into an investment management agreement with MetLife Advisers with respect to the Portfolio. For providing investment management services to the Portfolio, MetLife Advisers receives monthly compensation at the following annual rates:
| | | | | | |
Management
Fees earned by
MetLife Advisers
for the year ended
December 31, 2013 | | % per annum | | | Average daily net assets |
| $11,693,294 | | | 0.850 | % | | Of the first $500 million |
| | | 0.800 | % | | Of the next $500 million |
| | | 0.750 | % | | On amounts in excess of $1 billion |
MetLife Advisers has entered into an investment subadvisory agreement with respect to the Portfolio. Neuberger Berman Management LLC is compensated by MetLife Advisers to provide subadvisory services for the Portfolio.
Management Fee Waivers - Pursuant to an expense agreement, MetLife Advisers has agreed, for the period April 29, 2013 through April 27, 2014, to reduce its advisory fees set out above under “Investment Management Agreement” for each class of the Portfolio as follows:
| | | | |
% per annum | | Average daily net assets | |
| 0.025% | | | First $500 million | |
An identical expense agreement was in place for the period April 30, 2012 through April 28, 2013. Amounts waived for the year ended December 31, 2013 are shown as management fee waivers in the Statement of Operations.
Certain officers and trustees of the Trust may also be officers of MetLife Advisers; however, such officers and trustees receive no compensation from the Trust.
Transfer Agency Agreement - MetLife serves as the transfer agent for the Trust. MetLife receives no fees for its services to the Trust under the transfer agency agreement.
Distribution and Service Fees - The Trust has a distribution agreement with MetLife Investors Distribution Company (“MIDC” or the “Distributor”) in which MIDC serves as the distributor for the Portfolio’s Class A, B and E Shares. MIDC is a wholly-owned subsidiary of MetLife Investors Group, Inc., an affiliate of the Adviser. The Trust has also adopted a Distribution and Service Plan under Rule 12b-1 of the 1940 Act for the Portfolio’s Class B and E Shares. Under the Distribution and Service Plan, the Class B and E Shares of the Portfolio pay a fee to compensate the Insurance Companies (or their affiliates) and other broker-dealers and financial intermediaries involved in the offer and sale of Portfolio shares for promoting or selling and servicing the Class B and E Shares. The fees under the Distribution and Service Plan for each class of the Portfolio’s shares are calculated as a percentage of the Portfolio’s average daily net assets that are attributable to that Class. Currently, the fee is 0.25% per year for Class B Shares and 0.15% per year for Class E Shares. Amounts incurred by the Portfolio for the year ended December 31, 2013 are shown as Distribution and service fees in the Statement of Operations.
Deferred Trustee Compensation - Each Trustee who is not currently an employee of the Adviser or any of its affiliates receives compensation from the Trust for his or her service to the Trust. A deferred compensation plan (the “Plan”) is available to the Trustees on a voluntary basis. Deferred amounts remain in the Trust until distributed in accordance with the provisions of the Plan. The value of a participating Trustee’s deferral account is based on theoretical investments of deferred amounts, on the normal payment dates in certain portfolios of the Trust or Met Investors Series Trust, an affiliate of the Trust, as designated by the participating Trustee. Changes in the value of participants’ deferral accounts are reflected as Trustees’ fees and expenses in the Statement of Operations. The portion of the accrued obligations allocated to the Portfolio under the Plan is reflected as Deferred trustees’ fees in the Statement of Assets and Liabilities.
7. Contractual Obligations
Under the Trust’s organizational documents, its officers and Trustees may be indemnified against certain liabilities and expenses arising out of the performance of their duties to the Trust. Additionally, the Trust has a variety of indemnification obligations under contracts with its service providers. The Trust’s maximum exposure under these arrangements is unknown, as this would involve future claims that may be made against the Trust that have not yet occurred.
MSF-18
Metropolitan Series Fund
Neuberger Berman Genesis Portfolio
Notes to Financial Statements—December 31, 2013—(Continued)
8. Income Tax Information
The tax character of distributions paid for the periods ended December 31, 2013 and 2012 was as follows:
| | | | | | | | | | | | | | | | | | | | |
Ordinary Income | | | Long-Term Capital Gain | | | Total | |
2013 | | 2012 | | | 2013 | | | 2012 | | | 2013 | | | 2012 | |
$9,257,934 | | $ | 3,687,868 | | | $ | — | | | $ | — | | | $ | 9,257,934 | | | $ | 3,687,868 | |
As of December 31, 2013, the components of distributable earnings (accumulated losses) on a federal income tax basis were as follows:
| | | | | | | | | | | | | | | | |
Undistributed
Ordinary
Income | | Undistributed
Long-Term
Capital Gain | | | Net
Unrealized
Appreciation | | | Loss Carryforwards | | | Total | |
$5,946,569 | | $ | — | | | $ | 573,917,962 | | | $ | (269,186,862 | ) | | $ | 310,677,669 | |
The Portfolio utilizes the provisions of the federal income tax laws that provide for the carryforward of capital losses for prior years, offsetting such losses against any future realized capital gains. Under the Regulated Investment Company Modernization Act of 2010 (the “Act”), net capital losses recognized after December 22, 2010 may be carried forward indefinitely and their character is retained as short-term and/or long-term losses. Previously, net capital losses were carried forward for up to eight years and treated as short-term losses. As a transition rule, the Act requires that post-enactment net capital losses be used before pre-enactment net capital losses.
During the year ended December 31, 2013, the Portfolio utilized capital loss carryforwards of $172,750,935.
As of December 31, 2013, there were no post-enactment accumulated capital losses. The pre-enactment accumulated capital loss carryforwards and expiration dates were as follows:
| | | | | | | | |
Expiring
12/31/2017 | | Expiring
12/31/2016 | | | Total | |
| $121,521,199 | | $ | 147,665,663 | * | | $ | 269,186,862 | |
| | * | The Portfolio acquired capital losses in its merger with MIST MLA Mid Cap Value on April 26, 2013. |
9. Acquisition
At the close of business on April 26, 2013, the Portfolio, with aggregate Class A, Class B and Class E net assets of $921,911,324, $122,572,792 and $93,470,942, respectively, acquired all of the assets and liabilities of MLA Mid Cap Portfolio of the Met Investors Series Trust (“MIST MLA Mid Cap”).
The acquisition was accomplished by a tax-free exchange of 6,103,045 Class A shares of the Portfolio (valued at $87,090,450) for 7,177,798 Class A shares of MIST MLA Mid Cap; 18,058,543 Class B shares of the Portfolio (valued at $253,903,111) for 21,030,031 Class B shares of MIST MLA Mid Cap; and 1,348,885 Class E shares of the Portfolio (valued at $19,046,267) for 1,572,109 Class E shares of MIST MLA Mid Cap. Each shareholder of MIST MLA Mid Cap received shares of the Portfolio with the same class designation and at the respective Class NAV, as determined at the close of business on April 26, 2013. The transaction was part of a restructuring designed to eliminate the offering of overlapping Portfolios in the MetLife, Inc. families of funds with similar investment objectives and similar investment strategies that serve as funding vehicles for insurance contracts that are offered by affiliates of MetLife. Some of the investments held by MIST MLA Mid Cap may have been purchased or sold prior to the acquisition for the purpose of complying with the anticipated investment policies or limitations of the Portfolio after the acquisition. If such purchases or sales occurred, the transaction costs were borne by MIST MLA Mid Cap. All other costs associated with the merger were not borne by the shareholders of either portfolio.
MIST MLA Mid Cap’s net assets on April 26, 2013, were $87,090,450, $253,903,111 and $19,046,267 for Class A, Class B and Class E shares, respectively, including investments valued at $360,292,574 with a cost basis of $333,365,815. For financial reporting purposes, assets received and shares issued by the Portfolio were recorded at fair value; however, the cost basis of the investments received by the Portfolio from MIST MLA Mid Cap were carried forward to align ongoing reporting of the Portfolio’s realized and unrealized gains and losses with amounts distributable to shareholders for tax purposes. The Portfolio acquired $190,791,929 in capital loss carry forwards from MIST MLA Mid Cap.
The aggregate net assets of the Portfolio immediately after the acquisition were $1,497,994,886, which included $26,926,759 of acquired unrealized appreciation.
MSF-19
Metropolitan Series Fund
Neuberger Berman Genesis Portfolio
Notes to Financial Statements—December 31, 2013—(Continued)
Assuming the acquisition had been completed on January 1, 2013, the Portfolio’s pro-forma results of operations for the year ended December 31, 2013 are as follows:
| | | | |
Net Investment income | | $ | 5,528,138 | (a) |
Net realized and unrealized gain on investments and foreign currency transactions | | $ | 508,833,516 | (b) |
| | | | |
Net increase in net assets from operations | | $ | 514,361,654 | |
| | | | |
Because the combined investment portfolios have been managed as a single integrated portfolio since the acquisition was completed, it is not practicable to separate the amounts of revenue and earnings of MIST MLA Mid Cap that have been included in the Portfolio’s Statement of Operations since April 26, 2013.
| (a) | $5,423,485 net investment income as reported plus $166,526 from MIST MLA Mid Cap pre-merger net investment income, minus $106,780 in higher advisory fees, plus $44,907 of pro-forma eliminated other expenses. |
| (b) | $574,888,658 unrealized appreciation as reported minus $243,241,046 pro-forma December 31, 2012 unrealized appreciation, plus $172,501,379 net realized gain as reported, plus $4,684,525 in net realized gain from MIST MLA Mid Cap pre-merger. |
MSF-20
Metropolitan Series Fund
Neuberger Berman Genesis Portfolio
Report of Independent Registered Public Accounting Firm
To the Shareholders of Neuberger Berman Genesis Portfolio and the Board of Trustees of Metropolitan Series Fund:
We have audited the accompanying statement of assets and liabilities, including the schedule of investments, of Neuberger Berman Genesis Portfolio, one of the portfolios constituting Metropolitan Series Fund, (the “Trust”) as of December 31, 2013, and the related statement of operations for the year then ended, the statements of changes in net assets for each of the two years in the period then ended, and the financial highlights for each of the five years in the period then ended. These financial statements and financial highlights are the responsibility of the Trust’s management. Our responsibility is to express an opinion on these financial statements and financial highlights based on our audits.
We conducted our audits in accordance with the standards of the Public Company Accounting Oversight Board (United States). Those standards require that we plan and perform the audit to obtain reasonable assurance about whether the financial statements and financial highlights are free of material misstatement. The Trust is not required to have, nor were we engaged to perform, an audit of its internal control over financial reporting. Our audits included consideration of internal control over financial reporting as a basis for designing audit procedures that are appropriate in the circumstances, but not for the purpose of expressing an opinion on the effectiveness of the Trust’s internal control over financial reporting. Accordingly, we express no such opinion. An audit also includes examining, on a test basis, evidence supporting the amounts and disclosures in the financial statements, assessing the accounting principles used and significant estimates made by management, as well as evaluating the overall financial statement presentation. Our procedures included confirmation of securities owned as of December 31, 2013, by correspondence with the custodian and brokers; where replies were not received from brokers, we performed other auditing procedures. We believe that our audits provide a reasonable basis for our opinion.
In our opinion, the financial statements and financial highlights referred to above present fairly, in all material respects, the financial position of Neuberger Berman Genesis Portfolio of Metropolitan Series Fund, as of December 31, 2013, the results of its operations for the year then ended, the changes in its net assets for each of the two years in the period then ended, and the financial highlights for each of the five years in the period then ended, in conformity with accounting principles generally accepted in the United States of America.
Deloitte & Touche LLP
Boston, Massachusetts
February 26, 2014
MSF-21
Metropolitan Series Fund
Trustees and Officers of Metropolitan Series Fund
The Trustees and executive officers of the Trust, their ages and their principal occupations during the past five years are set forth below. Unless otherwise indicated, the business address of each is One Financial Center, Boston, MA 02111. Each Trustee who is deemed an “interested person,” as such term is defined in the 1940 Act, is indicated by an asterisk. Those Trustees who are not “interested persons” as defined in the 1940 Act are referred to as “Independent Trustees.” Additional information about the Trustees is available in the Statement of Additional Information, which is available without charge, upon request, by calling (800) 848-3854.
Trustees of the Trust
| | | | | | | | | | |
Name and Age | | Position(s)
Held with
Registrant | | Term of Office
and Length of
Time Served | | Principal Occupation(s) During the Past 5
Years(1) | | Number of
Portfolios
in Fund
Complex(2)
overseen | | Other Directorships Held
by Trustee During the
Past 5 Years(1) |
| Interested Trustee | | | | | | | | | | |
| Elizabeth M. Forget* (47) | | Trustee, Chairman of the Board, President and Chief Executive Officer | | Indefinite;
From
May
2006
(President
and Chief
Executive
Officer)/
August
2006
(Trustee
and
Chairman
of the
Board) to
present | | Senior Vice President, MetLife Inc.; President, MetLife Advisers, LLC and a predecessor company. | | 79 | | Trustee, Met Investors Series Trust (the “MIST Trust”);** various MetLife-affiliated boards. |
| | | | | |
| Independent Trustees | | | | | | | | | | |
| Stephen M. Alderman (54) | | Trustee | | Indefinite;
From
April
2012 to
present | | Shareholder in the law firm of Garfield & Merel, Ltd. | | 79 | | Trustee, MIST Trust;** Director, International Truck Leasing Corp. |
| | | | | |
| Robert J. Boulware (57) | | Trustee | | Indefinite;
From
April
2012 to
present | | Managing Director, Pilgrim Funds, LLC (private equity fund). | | 79 | | Trustee, MIST Trust;** Trustee, Vertical Capital Income Fund (closed-end fund); Director, Gainsco, Inc. (auto insurance). |
| | | | | |
| Susan C. Gause (61) | | Trustee | | Indefinite;
From
April
2012 to
present | | Private Investor. | | 79 | | Trustee, MIST Trust;** Trustee, HSBC Funds. |
| | | | | |
| Nancy Hawthorne (62) | | Trustee | | Indefinite;
From
May
2003 to
present | | Chief Executive Officer, Clerestory LLC (corporate advisor). | | 79 | | MIST Trust;** Director, THL Credit, Inc.**; Director, Avid Technology, Inc.** |
| | | | | |
| Barbara A. Nugent (57) | | Trustee | | Indefinite;
From
January
2014 to
present | | President, True North Board Governance, LLC (consulting); until 2014, partner in the law firm of Stradley Ronon Stevens & Young, LLP. | | 79 | | Trustee, MIST Trust**; Director, Episcopal Healthcare Foundation; until 2014, member, Mutual Fund Directors Forum Advisory Board. |
MSF-22
Metropolitan Series Fund
Trustees and Officers of Metropolitan Series Fund—(Continued)
| | | | | | | | | | |
Name and Age | | Position(s)
Held with
Registrant | | Term of Office
and Length of
Time Served | | Principal Occupation(s) During the Past 5
Years(1) | | Number of
Portfolios
in Fund
Complex(2)
overseen | | Other Directorships Held
by Trustee During the
Past 5 Years(1) |
| Keith M. Schappert (62) | | Trustee | | Indefinite;
From
August
2009 to
present | | Principal, Schappert Consulting LLC (asset management consulting). | | 79 | | Trustee, MIST Trust;** Director, The Commonfund for Nonprofit Organizations; until 2011, Director, Trilogy Global Advisors; Director, Mirae Asset Discovery Funds,** Director, Calamos Investments. |
| | | | | |
| Linda B. Strumpf (66) | | Trustee | | Indefinite;
From
May
2000 to
present | | Chair of the Investment Committee, Leona M. and Harry B. Helmsley Charitable Trust; until 2011, Chief Investment Officer, Leona M. and Harry B. Helmsley Charitable Trust. | | 79 | | Since 2012, Trustee, MIST Trust,** Trustee and Member of Investment Committee, The Pennsylvania State University. |
| | | | | |
| Dawn M. Vroegop (47) | | Trustee | | Indefinite;
From
May
2009 to
present | | Private Investor. | | 79 | | Trustee, MIST Trust,** Trustee, Driehaus Mutual Funds; Director and Investment Committee Chair, City College of San Francisco Foundation. |
Executive Officers of the Trust
| | | | | | |
Name and Age | | Position(s) Held with
Registrant | | Term of Office
and Length of
Time Served | | Principal Occupation(s) During Past 5 Years(1) |
| Elizabeth M. Forget (47) | | President, Chief Executive Officer, Trustee and Chairman of the Board | | From May
2006 (President
and Chief
Executive
Officer)/
August 2006
(Trustee and
Chairman of
the Board) to
present | | See principal occupation information in the table above. |
| | | |
| Jeffrey L. Bernier (42) | | Vice President | | From February
2008 to present | | Vice President, MetLife, Inc.; Senior Vice President, MetLife Advisers, LLC and a predecessor company. |
| | | |
| Peter H. Duffy (58) | | Chief Financial Officer and Treasurer | | From November
2000 to present | | Senior Vice President, MetLife Advisers, LLC; Vice President, MetLife, Inc. |
| | | |
| Andrew L. Gangolf (59) | | Secretary | | From May
2011to present | | Senior Vice President, MetLife Advisers, LLC; Senior Vice President & Assistant General Counsel, AllianceBerstein Investments, Inc. |
| | | |
| Jeffrey P. Halperin (46) | | Chief Compliance Officer | | From November
2005 to present | | Vice President, MetLife, Inc.; Chief Compliance Officer, MIST; Chief Compliance Officer, MSF Trust; Chief Compliance Officer, MetLife Advisers, LLC and a predecessor company; Chief Compliance Officer, MetLife Investment Management, LLC (formerly MetLife Investment Advisors Company, LLC). |
| | | |
| Alan C. Leland, Jr. (61) | | Vice President | | From February
2005 to present | | Treasurer and Chief Financial Officer, MetLife Advisers, LLC; Vice President, MetLife Group Inc.; Vice President, MetLife, Inc. |
| * | Ms. Forget is an “interested person” of the Trust because of her positions with MetLife Advisers, LLC and her ownership of securities issued by MetLife, Inc., the ultimate parent company of MetLife Advisers, LLC. |
| ** | Indicates a directorship with a registered investment company or a company subject to the reporting requirements of the Securities Exchange Act of 1934, as amended. |
| (1) | Previous positions during the past five years with the Trust, MetLife, Inc. or the Adviser are omitted if not materially different. |
| (2) | The Fund Complex includes 49 Portfolios of the MIST Trust and 30 Portfolios of the Trust. |
MSF-23
Metropolitan Series Fund
Neuberger Berman Genesis Portfolio
Board of Trustees’ Consideration of Advisory and Sub-Advisory Agreements
At an in-person meeting of the Boards of Trustees (the “Board”) of Met Investors Series Trust and Metropolitan Series Fund (“MIST” and “MSF,” respectively, and collectively, the “Trusts”) held on November 19-20, 2013, the Board, including a majority of the Trustees who are not considered to be “interested persons” of the Trusts (the “Independent Trustees”) under the Investment Company Act of 1940, as amended (the “1940 Act”), approved for an annual period the continuation of each Trust’s advisory agreement (the “Advisory Agreement”) with MetLife Advisers, LLC (the “Adviser”) and the applicable sub-advisory agreements (each a “Sub-Advisory Agreement,” and collectively with the Advisory Agreement, the “Agreements”) between the Adviser and the investment sub-advisers (each a “Sub-Adviser,” and collectively, the “Sub-Advisers”) for each of the series of the Trusts, including the Neuberger Berman Genesis Portfolio (each a “Portfolio,” and collectively, the “Portfolios”).1
In considering the Agreements, the Board reviewed a variety of materials provided by the Adviser and the Sub-Advisers relating to the Portfolios, including comparative performance, fee and expense information for an appropriate peer group of similar mutual funds, performance information for relevant benchmark indices and other information regarding the nature, extent and quality of services provided by the Adviser and the Sub-Advisers under their respective Agreements. The Board also took into account its experience with the Adviser and the Sub-Advisers and information provided to the Board in its meetings throughout the year with respect to the services provided by the Adviser and the Sub-Advisers, including quarterly performance reports prepared by management containing reviews of investment results, and periodic presentations from certain of the Sub-Advisers with respect to the Portfolios they manage. The Independent Trustees also assessed reports provided by the Board’s independent consultant, who reviewed and provided analyses regarding investment performance, fees and expenses, and other information provided by, or at the direction of, the Adviser and the Sub-Advisers, as more fully discussed below.
The Independent Trustees were separately advised by independent legal counsel throughout the process, and met with independent legal counsel in periodic executive sessions. Prior to voting to continue the Agreements at the November meeting, the Independent Trustees also received a memorandum from their independent counsel discussing the legal standards for their consideration of the proposed continuation of the Agreements. The Board also met in person with personnel of the Adviser on September 17, 2013 for the specific purpose of giving preliminary consideration to the proposed continuation of the Agreements and to request additional information they considered reasonably necessary to their deliberations. The Independent Trustees also discussed the proposed continuation of the Agreements in private sessions with their independent legal counsel at which no representatives of management were present.
In considering whether to approve the renewal of the Advisory Agreement with the Adviser and any applicable Sub-Advisory Agreements with respect to a Portfolio, the Board reviewed and analyzed the factors it deemed relevant, including: (1) the nature, extent and quality of the services to be provided to the Portfolios by the Adviser and the Sub-Advisers; (2) the performance of the Portfolios as compared to a peer group and an appropriate index; (3) the Adviser’s and each of the Sub-Adviser’s personnel and operations; (4) the financial condition of the Adviser and of the Sub-Advisers; (5) the level and method of computing each Portfolio’s advisory and sub-advisory fees; (6) the profitability of the Adviser under the Advisory Agreement and of certain of the Sub-Advisers under the Sub-Advisory Agreements; (7) any “fall-out” benefits to the Adviser, the Sub-Advisers and their affiliates (i.e., ancillary benefits realized by the Adviser, the Sub-Advisers or their affiliates from the Adviser’s or Sub-Advisers’ relationship with the Trusts); (8) the anticipated effect of growth in size on Portfolio expenses; (9) fees paid to certain of the Sub-Advisers by comparable institutional and retail accounts; and (10) possible conflicts of interest.
Nature, extent and quality of services. The Board evaluated the nature, extent and quality of the services that the Adviser, and the Sub-Advisers as relevant, have provided to the Portfolios. The Board considered the Adviser’s services as investment manager to the Portfolios, including services relating to the selection and oversight of the Sub-Advisers for the applicable Portfolios. The Board considered, among other things, the Adviser’s oversight of the provision of services to the Portfolios by the Sub-Advisers, including with respect to investment activities and trading practices, and the Sub-Adviser’s compliance with fund policies, objectives and Board directives, compliance policies and procedures and applicable law. The Adviser’s services in coordinating and overseeing the activities of the Trusts’ other service providers were also considered. The Board also evaluated the expertise and performance of the personnel of the Adviser who performed services for the Portfolios throughout the year.
The Board considered information received from the Trust’s Chief Compliance Officer (“CCO”) regarding the Portfolios’ compliance policies and procedures established pursuant to Rule 38a-l under the 1940 Act. The Board also evaluated the CCO’s ongoing reports concerning the CCO’s oversight of the risk assessment processes of the Sub-Advisers.
1 The Pyramis Managed Risk Portfolio recently commenced operations and, therefore, the Agreement with respect to this Portfolio was not up for renewal.
MSF-24
Metropolitan Series Fund
Neuberger Berman Genesis Portfolio
Board of Trustees’ Consideration of Advisory and Sub-Advisory Agreements—(Continued)
With respect to the services provided by each of the Sub-Advisers, the Board considered, among other things, information provided to the Board by each Sub-Adviser. The Board considered the Sub-Adviser’s current level of staffing and its overall resources, as well as its compensation program. The Board reviewed each Sub-Adviser’s history and investment experience, as well as information regarding the qualifications, background and responsibilities of the Sub-Adviser’s investment and compliance personnel who provide services to the Portfolios. The Board also considered, among other things, the Sub-Adviser’s compliance program and any disciplinary history. The Board also took into account the Sub-Adviser’s risk assessment and monitoring process. The Board noted each Sub-Adviser’s regulatory history, including whether it was currently involved in any regulatory actions or investigations as well as material litigation, and any settlements and amelioratory actions undertaken, as appropriate. The Board also noted that the CCO and his staff conduct regular, periodic compliance reviews with each of the Sub-Advisers and present reports to the Independent Trustees regarding the same, which includes evaluating the regulatory compliance systems of the Sub-Advisers and procedures reasonably designed by them to help assure compliance with the federal securities laws, including issues related to late trading and market timing, best execution, fair value pricing, and proxy voting procedures, among others. The Board also took into account the financial condition of each Sub-Adviser. In its review, the Board also received and took into account information regarding any services and/or payments provided to the Adviser by the Sub-Advisers in connection with marketing activities.
The Board considered each Sub-Adviser’s investment process and philosophy. The Board took into account that each Sub-Adviser’s responsibilities include the development and maintenance of an investment program for the applicable Portfolio which is consistent with the Portfolio’s investment objectives, the selection of investment securities and the placement of orders for the purchase and sale of such securities, as well as the implementation of compliance controls related to performance of these services. The Board also reviewed each Sub-Adviser’s brokerage policies and practices.
Performance. The Board considered the performance of the Portfolios as described in the quarterly reports prepared by management, and as also analyzed in reports prepared by the Independent Trustees’ independent consultant. The Board noted that the Adviser reviews with the Board on a quarterly basis detailed information about the Portfolios’ performance results, portfolio composition and investment strategies. The Board also reviewed and considered a separate report prepared by Lipper Inc. (“Lipper”), an independent third party, which provided a statistical analysis comparing the Portfolios’ investment performance, expenses, and fees to comparable funds underlying variable insurance products (the “Performance Universe”). In addition, the Independent Trustees met separately with a representative of Bobroff Consulting, Inc., an independent consultant (“Bobroff), at a special board meeting in September 2013, to review the separate reports prepared by such consultant (“Bobroff Report”), which analyzed the report prepared by Lipper. The Board also considered each Portfolio’s more recent performance subsequent to the performance period covered by the Lipper reports, and management’s discussion of the same, including the effect of current market conditions on each Portfolio’s more recent performance.
The Board reviewed the Portfolios’ performance records and the Adviser’s and Sub-Advisers’ management styles and long-term performance records with the Portfolios and comparable funds. The Board focused particular attention on Portfolios with less favorable performance records. The Board was mindful of the Adviser’s focus on each Sub-Adviser’s performance and noted that the Adviser has been active in monitoring and responding to any performance issues with respect to the Portfolios. The Board also took into account its discussions with management regarding factors that contributed to the performance of the Portfolios.
Among other data relating specifically to the Neuberger Berman Genesis Portfolio’s performance, the Board considered that the Portfolio underperformed the median of its Performance Universe and its Lipper Index for the one- and five-year periods ended June 30, 2013 and outperformed the median of its Performance Universe and its Lipper Index for the three-year period ended June 30, 2013. The Board further considered that the Portfolio outperformed its benchmark, the Russell 2000 Value Index, for the one- and three-year periods ended October 31, 2013 and underperformed its benchmark for the five-year period ended October 31, 2013. The Board took into account management’s discussion of the Portfolio’s performance.
Fees and Expenses. The Board gave consideration to the advisory fees payable under the Advisory Agreement and the sub-advisory fees payable under each of the Sub-Advisory Agreements. In this regard, the Board reviewed the advisory fees payable on a Portfolio-by-Portfolio basis based on information provided by the Adviser. The Independent Trustees, with the assistance of Bobroff, also examined the fees paid by a Portfolio in light of fees paid to other investment managers by comparable funds, as well as considered the fees charged by the Adviser to manage other comparable funds, as applicable. The Lipper report included comparisons of the Adviser’s fee schedule with that of its peers based on an asset-based analysis of relative fee structures according to the size of the Portfolio. In addition, the Board considered the Portfolios’ advisory and sub-advisory fees and total expenses as compared to similarly situated investment companies underlying variable insurance products deemed to be comparable to the Portfolios as determined by Lipper. The Board considered a Portfolio’s ranking within a smaller group of peer funds chosen by Lipper (the “Expense Group”), as well as
MSF-25
Metropolitan Series Fund
Neuberger Berman Genesis Portfolio
Board of Trustees’ Consideration of Advisory and Sub-Advisory Agreements—(Continued)
the Portfolio’s ranking within broader groups of funds (the “Expense Universe” and the “Sub-advised Expense Universe”). The Board also considered a Portfolio’s contractual sub-advisory fees, as applicable, as compared to the Sub-advised Expense Universe as well as a smaller group of funds (the “Sub-advised Expense Group”). In comparing a Portfolio’s actual and contractual management fee to that of comparable funds, the Board noted that such fee includes both advisory and administrative fees.
The Board noted that the sub-advisory fees for the Portfolios are paid by the Adviser, not the Portfolios, out of the advisory fee. It was further noted that the Adviser negotiates such fees at arm’s length. The Board also considered that the Adviser had entered into expense limitation agreements with certain of the Portfolios, pursuant to which the Adviser has agreed to waive a portion of its advisory fee and/or reimburse certain expenses as a means of limiting a Portfolio’s total annual operating expenses. The Board further considered the amount of sub-advisory fees paid out by the Adviser and the amount of the management fees that it retained in light of the services performed by Sub-Advisers and Adviser, respectively.
With respect to the Neuberger Berman Genesis Portfolio, the Board considered that the Portfolio’s actual management fees were equal to the median of the Expense Group and above the medians of the Expense Universe and Sub-advised Expense Universe, and that total expenses (exclusive of 12b-1 fees) were equal to the Expense Group median and Sub-advised Expense Universe median, and below the median of the Expense Universe. The Board further noted that the Portfolio’s contractual management fees were below the asset-weighted average of the Expense Group at the Portfolio’s current size. The Board took into account that the Portfolio’s contractual sub-advisory fees were below the average of the Sub-advised Expense Group and the Sub-advised Expense Universe at the Portfolio’s current size. The Board further considered that the Adviser had waived fees and/or reimbursed expenses during the past year.
Profitability. The Board examined the profitability of the Adviser on a Portfolio-by-Portfolio basis. The Board also considered that the Distributor, MetLife Investors Distribution Company, receives Rule 12b-1 payments to support the distribution of the products. The Board considered the profitability to the Sub-Advisers and their affiliates as a result of their relationships with the Portfolios, and the Board considered the ability of the Adviser to negotiate the Sub-Advisory Agreements and the fees thereunder at arm’s length. The Board also reviewed Portfolio specific data with regard to the profitability of the Portfolios to each Sub-Adviser, as available.
Economies of scale. The Board also considered the effect of the Portfolios’ growth in size on their fees. The Board noted that the fee schedules for most of the Portfolios contain breakpoints that reduce the fee rate above specified asset levels. The Board noted those Portfolios that did not contain breakpoints in the advisory fee and took into account management’s discussion of the same. The Board noted that those Portfolios with advisory fee schedules containing breakpoints generally reflect the inclusion of breakpoints in the sub-advisory fee schedule for such Portfolios. The Board considered the effective fees under the Advisory Agreement for a Portfolio as a percentage of assets at different asset levels and possible economies of scale that may be realized if the assets of the Portfolio grow. Among other data, the Board examined the effect of a Portfolio’s growth in size on various fee schedules and reviewed the Lipper and Bobroff Reports, which compared fees among peers. The Board also generally noted that if a Portfolio’s assets increase over time, the Portfolio may realize other economies of scale if assets increase proportionally more than certain other fixed expenses. In addition, the Board noted that the Adviser had taken a number of steps to date intended to share the benefits of economies of scale with contractholders.
With respect to the Neuberger Berman Genesis Portfolio, the Board noted that the Portfolio’s advisory fee and sub-advisory fee each contains breakpoints that reduce the advisory fee rate on assets above certain specified asset levels. The Board considered the fact that the Portfolio’s fee levels decline as portfolio assets increase.
Other factors. As part of its evaluation of the Adviser’s compensation, the Board considered other benefits that may be realized by the Adviser and its affiliates from their relationship with the Trusts. Among them, the Board recognized that an affiliate of the Adviser, MetLife Investors Distribution Company, serves as the Distributor for the Trusts, and, as such, receives payments pursuant to Rule 12b-1 from the Portfolios to compensate it for providing shareholder services and selling activities, which could lead to growth in the Trusts’ assets and corresponding benefits from such growth, including economies of scale. The Board also considered that affiliates of the Adviser may benefit from certain indirect tax benefits relating to dividend received deductions and foreign tax credits. In conjunction with these considerations, the Board noted the costs of providing investment management and other services to the Portfolios and the ongoing commitment of the Adviser to the Portfolios.
The Board considered other benefits that may be realized by each Sub-Adviser and its affiliates from their relationship with the Trusts, including the opportunity to provide advisory services to additional portfolios of the Trusts and reputational benefits. In conjunction with these considerations, the Board noted the costs of providing investment advisory services to the Portfolios and the ongoing commitment of the Sub-Advisers to the Portfolios.
MSF-26
Metropolitan Series Fund
Neuberger Berman Genesis Portfolio
Board of Trustees’ Consideration of Advisory and Sub-Advisory Agreements—(Continued)
The Board considered possible conflicts of interest in the form of material benefits or detriments to the Trusts resulting from the nature of the Trusts’ and the Adviser’s or the Sub-Advisers’ affiliations and the services that are provided to the Trusts, and the manner in which such conflicts were mitigated.
Conclusions. After full consideration of the factors discussed above, the Board, including a majority of the Independent Trustees, approved the Advisory Agreement and the Sub-Advisory Agreement, as applicable, with respect to each Portfolio, unless otherwise noted. In making its approvals, the Board concluded that the nature, extent and quality of services provided by the Adviser and each Sub-Adviser supported the renewal of the Agreements. The Board also concluded that the investment performance of each Fund was such that each Agreement should continue. In addition, the Board concluded that fees paid by a Portfolio to the Adviser and, if applicable, the Sub-Adviser appeared to be acceptable in light of nature, extent and quality of the services provided by the Adviser and Sub-Adviser. Further, the Board concluded that the Adviser’s profitability in providing services under the Advisory Agreements did not appear unreasonably high in light of the nature, extent and quality of the services provided by the Adviser. Finally, the Board concluded that the Advisory and Sub-Advisory fees in some measure share economies of scale with contractholders. In approving the renewal of each of the Agreements, the Board, including the Independent Trustees, did not identify any single factor as controlling, and generally attributed different weights to various factors for the various Portfolios. The Board evaluated all information available to them on a Portfolio-by-Portfolio basis, and their decisions were made separately with respect to each Portfolio.
MSF-27
Metropolitan Series Fund
Russell 2000 Index Portfolio
Managed by MetLife Investment Management, LLC
Portfolio Manager Commentary*
PERFORMANCE
For the one year period ended December 31, 2013, the Class A, B, E, and G shares of the Russell 2000 Index Portfolio returned 38.55%, 38.18%, 38.35%, and 38.12%, respectively. The Portfolio’s benchmark, the Russell 2000 Index1, returned 38.82%.
MARKET ENVIRONMENT / CONDITIONS
Equity indexes reached record highs in 2013, driven by central bank intervention and an improving economy. The year started on a positive note as U.S. lawmakers reached agreements on the fiscal cliff and debt ceiling, and earnings data was generally positive. The markets were further supported by rate cuts by the European Central Bank (the “ECB”), the Reserve Bank of Australia, the Bank of Korea, and the Bank of Israel. Despite fears that the Federal Reserve (the “Fed”) would begin tapering asset purchases and end quantitative easing, the markets continued to climb higher on better than expected macroeconomic data, including U.S. jobless claims, payrolls, and factory orders. Headwinds during the year included increased tensions in Syria and Egypt and a U.S. government shutdown following the failure of U.S. lawmakers to reach an agreement in budget negotiations. However, equity markets ended the year at their highs, as the ECB announced an unexpected rate cut, a tentative nuclear deal with Iran was negotiated, and investors continued to be optimistic that central banks would continue their easy monetary policy after Fed Chairman nominee Janet Yellen’s testimony in front of Congress was more dovish than expected.
During the year, the Federal Open Market Committee (the “Committee”) met eight times and maintained the target range for the Federal Funds Rate at zero to 0.25%. The Committee stated that economic activity was expanding at a moderate pace, labor market conditions have continued to improve, and the unemployment rate had declined but remained elevated. The Committee noted that the risks to the outlook for the economy and the labor market have become more nearly balanced. Subsequently, the Committee decided to modestly reduce the pace of its asset purchases from $85 billion per month to $75 billion per month.
All nine sectors comprising the Russell 2000 Index experienced positive returns for the year. Health Care (12.2% beginning weight in the benchmark), up 51.7%, and Consumer Staples (3.1% beginning weight), up 47.7%, were the best-performing sectors. The worst relative-performing sectors were Utilities (4.2% beginning weight), up 21.9% and Materials & Processing (7.9% beginning weight), up 28.0%.
The stocks with the largest positive impact on the benchmark return for the year were Isis Pharmaceuticals, up 280.9%, Rite Aid, up 272.1%, and CoStar Group, up 106.5%. The stocks with the largest negative impact were Atlantic Power, down 66.6%, Coeur Mining, down 55.9%, and Hecla Mining, down 46.9%.
PORTFOLIO REVIEW / PERIOD END POSITIONING
The Portfolio is managed utilizing a stratified sampling strategy versus the Russell 2000 Index. This strategy seeks to track the performance of the Index by owning a subset of Index constituents and neutralizing exposures across sectors. The Portfolio is periodically rebalanced for compositional changes in the Russell 2000 Index. Factors that impact tracking error include sampling, transaction costs, cash drag, securities lending, NAV rounding, and sales and redemptions of Portfolio shares.
Stacey Lituchy
Norman Hu
Mirsad Usejnoski
Portfolio Managers
MetLife Investment Management, LLC
* This commentary may include statements that constitute “forward-looking statements” under the U.S. securities laws. Forward-looking statements include, among other things, projections, estimates, and information about possible or future results related to the Portfolio, market or regulatory developments. The views expressed above are not guarantees of future performance or economic results and involve certain risks, uncertainties and assumptions that could cause actual outcomes and results to differ materially from the views expressed herein. The views expressed above are subject to change at any time based upon economic, market, or other conditions and the subadvisory firm undertakes no obligation to update the views expressed herein. Any discussions of specific securities should not be considered a recommendation to buy or sell those securities. The views expressed above (including any forward-looking statement) may not be relied upon as investment advice or as an indication of the Portfolio’s trading intent. Information about the Portfolio’s holdings, asset allocation or country diversification is historical and is not an indication of future Portfolio composition, which may vary. Direct investment in any index is not possible. The performance of any index mentioned in this commentary has not been adjusted for ongoing management, distribution and operating expenses, and sales charges applicable to mutual fund investments. In addition, the returns do not reflect additional fees charged by separate accounts or variable insurance contracts that an investor in the Portfolio may pay. If these additional fees were reflected, performance would have been lower.
MSF-1
Metropolitan Series Fund
Russell 2000 Index Portfolio
A $10,000 INVESTMENT COMPARED TO THE RUSSELL 2000 INDEX
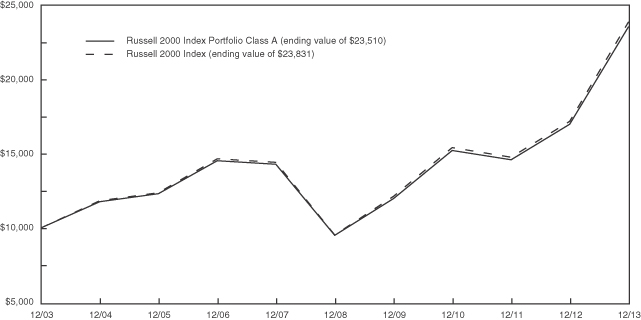
AVERAGE ANNUAL RETURNS (%) (FOR THE YEAR ENDED DECEMBER 31, 2013)
| | | | | | | | | | | | | | | | |
| | | 1 Year | | | 5 Year | | | 10 Year | | | Since Inception2 | |
| Russell 2000 Index Portfolio | | | | | | | | | | | | | | | | |
Class A | | | 38.55 | | | | 19.85 | | | | 8.92 | | | | — | |
Class B | | | 38.18 | | | | 19.54 | | | | 8.65 | | | | — | |
Class E | | | 38.35 | | | | 19.66 | | | | 8.75 | | | | — | |
Class G | | | 38.12 | | | | — | | | | — | | | | 22.39 | |
| Russell 2000 Index | | | 38.82 | | | | 20.08 | | | | 9.07 | | | | — | |
1 The Russell 2000® Index is an unmanaged measure of performance of the 2,000 smallest companies in the Russell 3000® Index.
2 Inception dates of the Class A, Class B, Class E, and Class G shares are 11/9/98, 1/2/01, 5/1/01, and 4/28/09, respectively.
Portfolio performance is calculated including reinvestment of all income and capital gain distributions. Performance numbers are net of all Portfolio expenses but do not include any insurance, sales, separate account or administrative charges of variable annuity or life insurance contracts or any additional expenses that participants may bear relating to the operations of their plans. If these charges were included, the returns would be lower. The performance of any index referenced above has not been adjusted for ongoing management, distribution and operating expenses, and sales charges applicable to mutual fund investments. Direct investment in any index is not possible. The performance of Class A shares, as set forth in the line graph above, will differ from that of other classes because of the difference in expenses paid by policyholders investing in the different share classes.
This information represents past performance and is not indicative of future results. Investment return and principal value may fluctuate so that shares, upon redemption, may be worth more or less than the original cost.
PORTFOLIO COMPOSITION AS OF DECEMBER 31, 2013
Top Holdings
| | | | |
| | | % of
Net Assets | |
| iShares Russell 2000 Index Fund | | | 3.4 | |
| CoStar Group, Inc. | | | 0.3 | |
| athenahealth, Inc. | | | 0.3 | |
| Acuity Brands, Inc. | | | 0.3 | |
| Middleby Corp. (The) | | | 0.3 | |
| Isis Pharmaceuticals, Inc. | | | 0.3 | |
| PTC, Inc. | | | 0.2 | |
| Ultimate Software Group, Inc. | | | 0.2 | |
| Align Technology, Inc. | | | 0.2 | |
| Brunswick Corp. | | | 0.2 | |
Top Sectors
| | | | |
| | | % of
Market Value of
Total Long-Term Investments | |
| Financials | | | 25.5 | |
| Information Technology | | | 17.2 | |
| Industrials | | | 14.0 | |
| Consumer Discretionary | | | 13.3 | |
| Health Care | | | 12.7 | |
| Energy | | | 5.3 | |
| Materials | | | 4.7 | |
| Consumer Staples | | | 3.7 | |
| Utilities | | | 2.9 | |
| Telecommunication Services | | | 0.7 | |
MSF-2
Metropolitan Series Fund
Russell 2000 Index Portfolio
Understanding Your Portfolio’s Expenses
Shareholder Expense Example
As a shareholder of the Portfolio, you incur ongoing costs, including management fees; distribution and service (12b-1) fees; and other Portfolio expenses. This example is intended to help you understand your ongoing costs (in dollars) (referred to as “expenses”) of investing in the Portfolio and compare these costs with the ongoing costs of investing in other mutual funds. The example is based on an investment of $1,000 invested at the beginning of the period and held for the entire period, July 1, 2013 through December 31, 2013.
Actual Expenses
The first line for each share class of the Portfolio in the table below provides information about actual account values and actual expenses. You may use the information in this line, together with the amount you invested in the particular share class of the Portfolio, to estimate the expenses that you paid over the period. Simply divide your account value by $1,000 (for example, an $8,600 account value divided by $1,000 = 8.6), then multiply the result by the number in the first line under the heading entitled “Expenses Paid During Period” to estimate the expenses you paid on your account during this period.
Hypothetical Example for Comparison Purposes
The second line for each share class of the Portfolio in the table below provides information about hypothetical account values and hypothetical expenses based on the Portfolio’s actual expense ratio and an assumed rate of return of 5% per year before expenses, which is not the Portfolio’s actual return. The hypothetical account values and expenses may not be used to estimate the actual ending account balance or expenses you paid for the period. You may use this information to compare the ongoing costs of investing in the Portfolio and other funds. To do so, compare this 5% hypothetical example with the 5% hypothetical examples that appear in the shareholder reports of the other funds.
Please note that the expenses shown in the table are meant to highlight your ongoing costs only and do not reflect any fees or charges of your variable insurance product or any additional expenses that participants in certain eligible qualified plans may bear relating to the operations of their plan. Therefore, the second line for each share class in the table is useful in comparing ongoing costs only, and will not help you determine the relative total costs of owning different funds. In addition, if these other costs were included, your costs would have been higher.
| | | | | | | | | | | | | | | | | | |
Russell 2000 Index Portfolio | | | | Annualized
Expense
Ratio | | | Beginning
Account Value
July 1,
2013 | | | Ending
Account Value
December 31,
2013 | | | Expenses Paid
During Period**
July 1, 2013
to
December 31,
2013 | |
Class A(a) | | Actual | | | 0.30 | % | | $ | 1,000.00 | | | $ | 1,197.50 | | | $ | 1.66 | |
| | Hypothetical* | | | 0.30 | % | | $ | 1,000.00 | | | $ | 1,023.69 | | | $ | 1.53 | |
| | | | | |
Class B(a) | | Actual | | | 0.55 | % | | $ | 1,000.00 | | | $ | 1,195.50 | | | $ | 3.04 | |
| | Hypothetical* | | | 0.55 | % | | $ | 1,000.00 | | | $ | 1,022.43 | | | $ | 2.80 | |
| | | | | |
Class E(a) | | Actual | | | 0.44 | % | | $ | 1,000.00 | | | $ | 1,195.90 | | | $ | 2.44 | |
| | Hypothetical* | | | 0.44 | % | | $ | 1,000.00 | | | $ | 1,022.99 | | | $ | 2.24 | |
| | | | | |
Class G(a) | | Actual | | | 0.60 | % | | $ | 1,000.00 | | | $ | 1,195.30 | | | $ | 3.32 | |
| | Hypothetical* | | | 0.60 | % | | $ | 1,000.00 | | | $ | 1,022.18 | | | $ | 3.06 | |
* Hypothetical assumes a rate of return of 5% per year before expenses.
** Expenses paid are equal to the Portfolio’s annualized expense ratio for the most recent six month period, as shown above, multiplied by the average account value over the period, multiplied by the number of days (184 days) in the most recent fiscal half-year, divided by 365 (to reflect the one-half year period).
(a) The annualized expense ratio shown reflects the impact of the management fee waiver as described in Note 6 of the Notes to Financial Statements.
MSF-3
Metropolitan Series Fund
Russell 2000 Index Portfolio
Schedule of Investments as of December 31, 2013
Common Stocks—94.0% of Net Assets
| | | | | | | | |
| Security Description | | Shares | | | Value | |
|
Aerospace & Defense—1.7% | |
AAR Corp. | | | 20,590 | | | $ | 576,726 | |
Aerovironment, Inc. (a) (b) | | | 8,967 | | | | 261,209 | |
American Science & Engineering, Inc. | | | 4,769 | | | | 342,939 | |
Astronics Corp. (a) | | | 7,718 | | | | 393,618 | |
Cubic Corp. | | | 9,993 | | | | 526,231 | |
Curtiss-Wright Corp. | | | 23,640 | | | | 1,471,117 | |
DigitalGlobe, Inc. (a) | | | 37,451 | | | | 1,541,109 | |
Ducommun, Inc. (a) | | | 5,534 | | | | 164,969 | |
Engility Holdings, Inc. (a) | | | 8,737 | | | | 291,816 | |
Esterline Technologies Corp. (a) | | | 15,964 | | | | 1,627,689 | |
GenCorp, Inc. (a) (b) | | | 29,383 | | | | 529,482 | |
HEICO Corp. (b) | | | 33,494 | | | | 1,940,977 | |
KEYW Holding Corp. (The) (a) (b) | | | 16,705 | | | | 224,515 | |
Kratos Defense & Security Solutions, Inc. (a) (b) | | | 22,697 | | | | 174,313 | |
Moog, Inc. - Class A (a) | | | 22,907 | | | | 1,556,302 | |
National Presto Industries, Inc. | | | 2,572 | | | | 207,046 | |
Orbital Sciences Corp. (a) | | | 29,768 | | | | 693,594 | |
Sparton Corp. (a) | | | 5,744 | | | | 160,545 | |
Taser International, Inc. (a) | | | 26,071 | | | | 414,007 | |
Teledyne Technologies, Inc. (a) | | | 18,825 | | | | 1,729,264 | |
| | | | | | | | |
| | | | | | | 14,827,468 | |
| | | | | | | | |
|
Air Freight & Logistics—0.4% | |
Air Transport Services Group, Inc. (a) | | | 26,883 | | | | 217,483 | |
Atlas Air Worldwide Holdings, Inc. (a) | | | 13,131 | | | | 540,341 | |
Echo Global Logistics, Inc. (a) (b) | | | 8,016 | | | | 172,184 | |
Forward Air Corp. | | | 15,560 | | | | 683,239 | |
HUB Group, Inc. - Class A (a) | | | 19,221 | | | | 766,533 | |
Pacer International, Inc. (a) | | | 18,622 | | | | 153,818 | |
Park-Ohio Holdings Corp. (a) | | | 4,748 | | | | 248,795 | |
UTi Worldwide, Inc. | | | 45,516 | | | | 799,261 | |
XPO Logistics, Inc. (a) (b) | | | 14,916 | | | | 392,142 | |
| | | | | | | | |
| | | | | | | 3,973,796 | |
| | | | | | | | |
|
Airlines—0.5% | |
Allegiant Travel Co. | | | 7,740 | | | | 816,106 | |
Hawaiian Holdings, Inc. (a) (b) | | | 26,730 | | | | 257,410 | |
JetBlue Airways Corp. (a) (b) | | | 117,553 | | | | 1,005,078 | |
Republic Airways Holdings, Inc. (a) | | | 25,789 | | | | 275,684 | |
SkyWest, Inc. | | | 24,419 | | | | 362,134 | |
Spirit Airlines, Inc. (a) | | | 30,196 | | | | 1,371,200 | |
| | | | | | | | |
| | | | | | | 4,087,612 | |
| | | | | | | | |
|
Auto Components—0.9% | |
American Axle & Manufacturing Holdings, Inc. (a) | | | 34,595 | | | | 707,468 | |
Cooper Tire & Rubber Co. | | | 32,939 | | | | 791,853 | |
Dana Holding Corp. | | | 74,123 | | | | 1,454,293 | |
Dorman Products, Inc. (a) (b) | | | 12,774 | | | | 716,238 | |
Drew Industries, Inc. | | | 11,598 | | | | 593,818 | |
Federal-Mogul Corp. (a) | | | 10,391 | | | | 204,495 | |
Gentherm, Inc. (a) | | | 16,060 | | | | 430,569 | |
Modine Manufacturing Co. (a) | | | 24,735 | | | | 317,103 | |
Remy International, Inc. | | | 9,705 | | | | 226,321 | |
Spartan Motors, Inc. (b) | | | 19,530 | | | | 130,851 | |
|
Auto Components—(Continued) | |
Standard Motor Products, Inc. (b) | | | 9,638 | | | | 354,678 | |
Stoneridge, Inc. (a) | | | 13,705 | | | | 174,739 | |
Superior Industries International, Inc. | | | 12,615 | | | | 260,247 | |
Tenneco, Inc. (a) | | | 30,850 | | | | 1,745,184 | |
| | | | | | | | |
| | | | | | | 8,107,857 | |
| | | | | | | | |
|
Automobiles—0.1% | |
Winnebago Industries, Inc. (a) | | | 16,165 | | | | 443,729 | |
| | | | | | | | |
|
Beverages—0.2% | |
Boston Beer Co., Inc. (The) - Class A (a) (b) | | | 4,482 | | | | 1,083,703 | |
Coca-Cola Bottling Co. Consolidated | | | 2,376 | | | | 173,900 | |
National Beverage Corp. (a) | | | 7,440 | | | | 149,990 | |
| | | | | | | | |
| | | | | | | 1,407,593 | |
| | | | | | | | |
|
Biotechnology—3.8% | |
ACADIA Pharmaceuticals, Inc. (a) (b) | | | 35,491 | | | | 886,920 | |
Acceleron Pharma, Inc. (a) (b) | | | 5,364 | | | | 212,414 | |
Achillion Pharmaceuticals, Inc. (a) (b) | | | 49,415 | | | | 164,058 | |
Acorda Therapeutics, Inc. (a) | | | 20,455 | | | | 597,286 | |
Aegerion Pharmaceuticals, Inc. (a) (b) | | | 14,687 | | | | 1,042,190 | |
Alnylam Pharmaceuticals, Inc. (a) (b) | | | 29,088 | | | | 1,871,231 | |
AMAG Pharmaceuticals, Inc. (a) | | | 11,699 | | | | 283,935 | |
Anacor Pharmaceuticals, Inc. (a) (b) | | | 14,559 | | | | 244,300 | |
Arena Pharmaceuticals, Inc. (a) (b) | | | 114,562 | | | | 670,188 | |
Array BioPharma, Inc. (a) (b) | | | 63,397 | | | | 317,619 | |
Cell Therapeutics, Inc. (a) (b) | | | 63,353 | | | | 121,638 | |
Celldex Therapeutics, Inc. (a) (b) | | | 45,622 | | | | 1,104,509 | |
Cepheid, Inc. (a) (b) | | | 34,332 | | | | 1,603,991 | |
Chelsea Therapeutics International, Ltd. (a) (b) | | | 38,469 | | | | 170,418 | |
Clovis Oncology, Inc. (a) | | | 9,325 | | | | 562,018 | |
Curis, Inc. (a) (b) | | | 43,921 | | | | 123,857 | |
Dendreon Corp. (a) (b) | | | 82,091 | | | | 245,452 | |
Dyax Corp. (a) (b) | | | 62,925 | | | | 473,825 | |
Dynavax Technologies Corp. (a) (b) | | | 140,824 | | | | 276,015 | |
Emergent Biosolutions, Inc. (a) | | | 13,410 | | | | 308,296 | |
Exact Sciences Corp. (a) (b) | | | 36,373 | | | | 425,200 | |
Exelixis, Inc. (a) (b) | | | 94,969 | | | | 582,160 | |
Galena Biopharma, Inc. (a) (b) | | | 47,568 | | | | 235,937 | |
Genomic Health, Inc. (a) (b) | | | 8,810 | | | | 257,869 | |
Geron Corp. (a) (b) | | | 72,481 | | | | 343,560 | |
Halozyme Therapeutics, Inc. (a) (b) | | | 47,510 | | | | 712,175 | |
Hyperion Therapeutics, Inc. (a) (b) | | | 4,670 | | | | 94,427 | |
Idenix Pharmaceuticals, Inc. (a) (b) | | | 48,904 | | | | 292,446 | |
ImmunoGen, Inc. (a) (b) | | | 44,397 | | | | 651,304 | |
Immunomedics, Inc. (a) (b) | | | 39,907 | | | | 183,572 | |
Infinity Pharmaceuticals, Inc. (a) (b) | | | 24,496 | | | | 338,290 | |
Insmed, Inc. (a) (b) | | | 18,158 | | | | 308,868 | |
Insys Therapeutics, Inc. (a) | | | 2,960 | | | | 114,582 | |
Intercept Pharmaceuticals, Inc. (a) (b) | | | 3,580 | | | | 244,442 | |
InterMune, Inc. (a) (b) | | | 43,557 | | | | 641,595 | |
Intrexon Corp. (a) (b) | | | 7,750 | | | | 184,450 | |
Ironwood Pharmaceuticals, Inc. (a) (b) | | | 47,826 | | | | 555,260 | |
Isis Pharmaceuticals, Inc. (a) (b) | | | 56,969 | | | | 2,269,645 | |
Karyopharm Therapeutics, Inc. (a) (b) | | | 6,496 | | | | 148,888 | |
See accompanying notes to financial statements.
MSF-4
Metropolitan Series Fund
Russell 2000 Index Portfolio
Schedule of Investments as of December 31, 2013
Common Stocks—(Continued)
| | | | | | | | |
| Security Description | | Shares | | | Value | |
|
Biotechnology—(Continued) | |
Keryx Biopharmaceuticals, Inc. (a) (b) | | | 41,752 | | | $ | 540,688 | |
KYTHERA Biopharmaceuticals, Inc. (a) (b) | | | 7,404 | | | | 275,799 | |
Lexicon Pharmaceuticals, Inc. (a) (b) | | | 119,680 | | | | 215,424 | |
Ligand Pharmaceuticals, Inc. - Class B (a) (b) | | | 9,228 | | | | 485,393 | |
MannKind Corp. (a) (b) | | | 74,752 | | | | 389,458 | |
Merrimack Pharmaceuticals, Inc. (a) (b) | | | 46,931 | | | | 250,612 | |
MiMedx Group, Inc. (a) (b) | | | 49,469 | | | | 432,359 | |
Momenta Pharmaceuticals, Inc. (a) | | | 23,710 | | | | 419,193 | |
Neurocrine Biosciences, Inc. (a) (b) | | | 35,916 | | | | 335,455 | |
NewLink Genetics Corp. (a) (b) | | | 12,664 | | | | 278,735 | |
Novavax, Inc. (a) (b) | | | 98,843 | | | | 506,076 | |
NPS Pharmaceuticals, Inc. (a) | | | 51,119 | | | | 1,551,973 | |
Ophthotech Corp. (a) (b) | | | 6,374 | | | | 206,199 | |
Opko Health, Inc. (a) (b) | | | 95,942 | | | | 809,750 | |
Orexigen Therapeutics, Inc. (a) (b) | | | 48,954 | | | | 275,611 | |
Osiris Therapeutics, Inc. (a) (b) | | | 9,827 | | | | 158,018 | |
PDL BioPharma, Inc. (b) | | | 75,107 | | | | 633,903 | |
Peregrine Pharmaceuticals, Inc. (a) (b) | | | 110,730 | | | | 153,915 | |
Portola Pharmaceuticals, Inc. (a) (b) | | | 6,934 | | | | 178,551 | |
Progenics Pharmaceuticals, Inc. (a) (b) | | | 49,453 | | | | 263,584 | |
Prothena Corp. plc (a) (b) | | | 6,779 | | | | 179,779 | |
PTC Therapeutics, Inc. (a) (b) | | | 6,967 | | | | 118,230 | |
Puma Biotechnology, Inc. (a) (b) | | | 11,320 | | | | 1,171,960 | |
Raptor Pharmaceutical Corp. (a) (b) | | | 30,816 | | | | 401,224 | |
Repligen Corp. (a) | | | 18,018 | | | | 245,766 | |
Rigel Pharmaceuticals, Inc. (a) | | | 47,337 | | | | 134,910 | |
Sangamo Biosciences, Inc. (a) (b) | | | 37,555 | | | | 521,639 | |
Sarepta Therapeutics, Inc. (a) (b) | | | 19,766 | | | | 402,633 | |
Spectrum Pharmaceuticals, Inc. (a) (b) | | | 30,932 | | | | 273,748 | |
Stemline Therapeutics, Inc. (a) (b) | | | 5,043 | | | | 98,843 | |
Synageva BioPharma Corp. (a) (b) | | | 9,970 | | | | 645,258 | |
Synergy Pharmaceuticals, Inc. (a) | | | 42,569 | | | | 239,663 | |
Synta Pharmaceuticals Corp. (a) (b) | | | 20,751 | | | | 108,735 | |
TESARO, Inc. (a) (b) | | | 6,990 | | | | 197,398 | |
Threshold Pharmaceuticals, Inc. (a) (b) | | | 24,847 | | | | 116,035 | |
Vanda Pharmaceuticals, Inc. (a) (b) | | | 15,947 | | | | 197,902 | |
Verastem, Inc. (a) (b) | | | 9,951 | | | | 113,441 | |
XOMA Corp. (a) (b) | | | 41,315 | | | | 278,050 | |
ZIOPHARM Oncology, Inc. (a) (b) | | | 38,299 | | | | 166,218 | |
| | | | | | | | |
| | | | | | | 33,836,958 | |
| | | | | | | | |
|
Building Products—0.8% | |
AAON, Inc. | | | 15,362 | | | | 490,816 | |
American Woodmark Corp. (a) (b) | | | 5,650 | | | | 223,344 | |
Apogee Enterprises, Inc. | | | 16,385 | | | | 588,385 | |
Builders FirstSource, Inc. (a) (b) | | | 25,665 | | | | 183,248 | |
Gibraltar Industries, Inc. (a) | | | 14,856 | | | | 276,173 | |
Griffon Corp. (b) | | | 24,495 | | | | 323,579 | |
Insteel Industries, Inc. | | | 9,958 | | | | 226,345 | |
NCI Building Systems, Inc. (a) (b) | | | 10,596 | | | | 185,854 | |
Nortek, Inc. (a) | | | 4,481 | | | | 334,283 | |
Patrick Industries, Inc. (a) | | | 3,662 | | | | 105,942 | |
PGT, Inc. (a) | | | 17,505 | | | | 177,151 | |
Ply Gem Holdings, Inc. (a) (b) | | | 10,411 | | | | 187,710 | |
Quanex Building Products Corp. | | | 17,697 | | | | 352,524 | |
Simpson Manufacturing Co., Inc. | | | 20,877 | | | | 766,812 | |
|
Building Products—(Continued) | |
Trex Co., Inc. (a) (b) | | | 8,732 | | | | 694,456 | |
Universal Forest Products, Inc. | | | 10,498 | | | | 547,366 | |
USG Corp. (a) (b) | | | 39,350 | | | | 1,116,753 | |
| | | | | | | | |
| | | | | | | 6,780,741 | |
| | | | | | | | |
|
Capital Markets—2.6% | |
Apollo Investment Corp. | | | 116,588 | | | | 988,666 | |
Arlington Asset Investment Corp. - Class A (b) | | | 7,800 | | | | 205,842 | |
BGC Partners, Inc. - Class A (b) | | | 64,999 | | | | 393,894 | |
BlackRock Kelso Capital Corp. (b) | | | 38,057 | | | | 355,072 | |
Calamos Asset Management, Inc. - Class A | | | 11,175 | | | | 132,312 | |
Capital Southwest Corp. | | | 7,000 | | | | 244,090 | |
Cohen & Steers, Inc. (b) | | | 9,693 | | | | 388,302 | |
Cowen Group, Inc. - Class A (a) | | | 63,759 | | | | 249,298 | |
Diamond Hill Investment Group, Inc. (b) | | | 1,546 | | | | 182,954 | |
Evercore Partners, Inc. - Class A | | | 16,148 | | | | 965,327 | |
FBR & Co. (a) | | | 5,282 | | | | 139,339 | |
Fidus Investment Corp. (b) | | | 7,619 | | | | 165,637 | |
Fifth Street Finance Corp. | | | 69,174 | | | | 639,860 | |
Financial Engines, Inc. | | | 24,757 | | | | 1,720,116 | |
Firsthand Technology Value Fund, Inc. (a) (b) | | | 5,589 | | | | 129,497 | |
FXCM, Inc. (b) | | | 18,846 | | | | 336,213 | |
GAMCO Investors, Inc. - Class A | | | 3,184 | | | | 276,912 | |
GFI Group, Inc. | | | 37,273 | | | | 145,737 | |
Gladstone Capital Corp. (b) | | | 12,173 | | | | 116,861 | |
Gladstone Investment Corp. (b) | | | 14,338 | | | | 115,564 | |
Golub Capital BDC, Inc. (b) | | | 17,843 | | | | 340,980 | |
Greenhill & Co., Inc. (b) | | | 13,818 | | | | 800,615 | |
GSV Capital Corp. (a) (b) | | | 10,696 | | | | 129,315 | |
Hercules Technology Growth Capital, Inc. (b) | | | 32,237 | | | | 528,687 | |
HFF, Inc. - Class A (a) | | | 17,729 | | | | 476,024 | |
ICG Group, Inc. (a) | | | 20,148 | | | | 375,357 | |
International FCStone, Inc. (a) (b) | | | 7,668 | | | | 142,165 | |
Investment Technology Group, Inc. (a) | | | 17,949 | | | | 369,031 | |
Janus Capital Group, Inc. (b) | | | 75,490 | | | | 933,811 | |
KCAP Financial, Inc. (b) | | | 12,596 | | | | 101,650 | |
KCG Holdings, Inc. - Class A (a) | | | 36,686 | | | | 438,765 | |
Ladenburg Thalmann Financial Services, Inc. (a) (b) | | | 56,603 | | | | 177,167 | |
Main Street Capital Corp. (b) | | | 19,878 | | | | 649,812 | |
Manning & Napier, Inc. | | | 8,917 | | | | 157,385 | |
MCG Capital Corp. | | | 37,449 | | | | 164,776 | |
Medallion Financial Corp. (b) | | | 11,521 | | | | 165,326 | |
Medley Capital Corp. (b) | | | 20,816 | | | | 288,302 | |
MVC Capital, Inc. | | | 13,488 | | | | 182,088 | |
New Mountain Finance Corp. | | | 23,585 | | | | 354,718 | |
Oppenheimer Holdings, Inc. - Class A | | | 5,749 | | | | 142,460 | |
PennantPark Floating Rate Capital, Ltd. | | | 8,031 | | | | 110,266 | |
PennantPark Investment Corp. (b) | | | 33,969 | | | | 394,040 | |
Piper Jaffray Cos. (a) | | | 8,439 | | | | 333,762 | |
Prospect Capital Corp. | | | 141,029 | | | | 1,582,345 | |
Safeguard Scientifics, Inc. (a) (b) | | | 11,857 | | | | 238,207 | |
Solar Capital, Ltd. (b) | | | 23,565 | | | | 531,391 | |
Solar Senior Capital, Ltd. (b) | | | 6,468 | | | | 117,847 | |
Stifel Financial Corp. (a) (b) | | | 31,775 | | | | 1,522,658 | |
See accompanying notes to financial statements.
MSF-5
Metropolitan Series Fund
Russell 2000 Index Portfolio
Schedule of Investments as of December 31, 2013
Common Stocks—(Continued)
| | | | | | | | |
| Security Description | | Shares | | | Value | |
|
Capital Markets—(Continued) | |
TCP Capital Corp. (b) | | | 18,817 | | | $ | 315,749 | |
THL Credit, Inc. | | | 17,620 | | | | 290,554 | |
TICC Capital Corp. (b) | | | 24,365 | | | | 251,934 | |
Triangle Capital Corp. | | | 13,996 | | | | 386,989 | |
Virtus Investment Partners, Inc. (a) | | | 3,430 | | | | 686,172 | |
Walter Investment Management Corp. (a) | | | 19,069 | | | | 674,280 | |
Westwood Holdings Group, Inc. | | | 3,352 | | | | 207,522 | |
WisdomTree Investments, Inc. (a) | | | 50,887 | | | | 901,209 | |
| | | | | | | | |
| | | | | | | 23,354,852 | |
| | | | | | | | |
|
Chemicals—2.2% | |
A. Schulman, Inc. | | | 15,164 | | | | 534,683 | |
Advanced Emissions Solutions, Inc. (a) | | | 4,907 | | | | 266,107 | |
American Pacific Corp. (a) | | | 3,240 | | | | 120,722 | |
American Vanguard Corp. | | | 14,887 | | | | 361,605 | |
Arabian American Development Co. (a) | | | 10,819 | | | | 135,778 | |
Axiall Corp. | | | 35,265 | | | | 1,672,972 | |
Balchem Corp. | | | 15,297 | | | | 897,934 | |
Calgon Carbon Corp. (a) | | | 26,161 | | | | 538,132 | |
Chase Corp. | | | 3,533 | | | | 124,715 | |
Chemtura Corp. (a) | | | 48,619 | | | | 1,357,442 | |
Ferro Corp. (a) | | | 34,923 | | | | 448,062 | |
Flotek Industries, Inc. (a) (b) | | | 24,436 | | | | 490,430 | |
FutureFuel Corp. (b) | | | 14,821 | | | | 234,172 | |
Hawkins, Inc. | | | 4,778 | | | | 177,694 | |
HB Fuller Co. | | | 25,868 | | | | 1,346,171 | |
Innophos Holdings, Inc. | | | 11,603 | | | | 563,906 | |
Innospec, Inc. | | | 12,490 | | | | 577,288 | |
Intrepid Potash, Inc. (a) (b) | | | 27,693 | | | | 438,657 | |
Koppers Holdings, Inc. | | | 11,124 | | | | 508,923 | |
Kraton Performance Polymers, Inc. (a) | | | 16,524 | | | | 380,878 | |
Landec Corp. (a) | | | 14,010 | | | | 169,801 | |
LSB Industries, Inc. (a) | | | 9,253 | | | | 379,558 | |
Minerals Technologies, Inc. | | | 17,678 | | | | 1,061,917 | |
Olin Corp. (b) | | | 41,593 | | | | 1,199,958 | |
OM Group, Inc. (a) | | | 16,641 | | | | 605,899 | |
OMNOVA Solutions, Inc. (a) | | | 24,497 | | | | 223,168 | |
PolyOne Corp. | | | 50,382 | | | | 1,781,004 | |
Quaker Chemical Corp. | | | 6,591 | | | | 507,968 | |
Sensient Technologies Corp. | | | 26,383 | | | | 1,280,103 | |
Stepan Co. | | | 10,436 | | | | 684,915 | |
Taminco Corp. (a) | | | 8,553 | | | | 172,856 | |
Tredegar Corp. | | | 13,367 | | | | 385,103 | |
Zep, Inc. | | | 10,762 | | | | 195,438 | |
Zoltek Cos., Inc. (a) | | | 15,344 | | | | 257,012 | |
| | | | | | | | |
| | | | | | | 20,080,971 | |
| | | | | | | | |
|
Commercial Banks—6.9% | |
1st Source Corp. | | | 8,143 | | | | 260,087 | |
1st United Bancorp, Inc. | | | 12,631 | | | | 96,122 | |
American National Bankshares, Inc. | | | 4,458 | | | | 117,023 | |
Ameris Bancorp (a) | | | 13,498 | | | | 284,943 | |
Ames National Corp. | | | 4,449 | | | | 99,613 | |
Arrow Financial Corp. (b) | | | 5,595 | | | | 148,603 | |
Bancfirst Corp. (b) | | | 4,227 | | | | 236,966 | |
|
Commercial Banks—(Continued) | |
Banco Latinoamericano de Comercio Exterior S.A. - Class E | | | 14,005 | | | | 392,420 | |
Bancorp, Inc. (a) | | | 17,608 | | | | 315,359 | |
BancorpSouth, Inc. (b) | | | 48,388 | | | | 1,230,023 | |
Bank of Kentucky Financial Corp. | | | 3,484 | | | | 128,560 | |
Bank of Marin Bancorp (b) | | | 3,199 | | | | 138,805 | |
Bank of the Ozarks, Inc. (b) | | | 15,721 | | | | 889,651 | |
Banner Corp. | | | 10,387 | | | | 465,545 | |
BBCN Bancorp, Inc. | | | 39,760 | | | | 659,618 | |
BNC Bancorp | | | 10,025 | | | | 171,829 | |
Boston Private Financial Holdings, Inc. | | | 40,232 | | | | 507,728 | |
Bridge Bancorp, Inc. | | | 6,098 | | | | 158,548 | |
Bridge Capital Holdings (a) | | | 5,459 | | | | 112,128 | |
Bryn Mawr Bank Corp. | | | 6,395 | | | | 193,001 | |
Camden National Corp. | | | 3,953 | | | | 166,896 | |
Capital Bank Financial Corp. - Class A (a) | | | 12,884 | | | | 293,111 | |
Cardinal Financial Corp. (b) | | | 17,067 | | | | 307,206 | |
Cathay General Bancorp | | | 39,976 | | | | 1,068,558 | |
Center Bancorp, Inc. | | | 6,530 | | | | 122,503 | |
Centerstate Banks, Inc. | | | 16,702 | | | | 169,525 | |
Central Pacific Financial Corp. | | | 11,945 | | | | 239,856 | |
Chemical Financial Corp. | | | 16,708 | | | | 529,142 | |
Citizens & Northern Corp. | | | 6,716 | | | | 138,551 | |
City Holding Co. (b) | | | 8,336 | | | | 386,207 | |
CNB Financial Corp. | | | 6,782 | | | | 128,858 | |
CoBiz Financial, Inc. | | | 17,832 | | | | 213,271 | |
Columbia Banking System, Inc. | | | 26,670 | | | | 733,692 | |
Community Bank System, Inc. (b) | | | 21,059 | | | | 835,621 | |
Community Trust Bancorp, Inc. | | | 7,420 | | | | 335,087 | |
Customers Bancorp, Inc. (a) | | | 10,624 | | | | 217,367 | |
CVB Financial Corp. (b) | | | 47,878 | | | | 817,277 | |
Eagle Bancorp, Inc. (a) | | | 11,635 | | | | 356,380 | |
Enterprise Financial Services Corp. | | | 11,259 | | | | 229,909 | |
Fidelity Southern Corp. | | | 7,961 | | | | 132,228 | |
Financial Institutions, Inc. | | | 6,461 | | | | 159,651 | |
First Bancorp | | | 47,258 | | | | 378,491 | |
First Busey Corp. | | | 42,355 | | | | 245,659 | |
First Commonwealth Financial Corp. | | | 50,529 | | | | 445,666 | |
First Community Bancshares, Inc. | | | 8,470 | | | | 141,449 | |
First Connecticut Bancorp, Inc. | | | 9,833 | | | | 158,508 | |
First Financial Bancorp | | | 30,745 | | | | 535,885 | |
First Financial Bankshares, Inc. (b) | | | 16,756 | | | | 1,111,258 | |
First Financial Corp. | | | 6,038 | | | | 220,749 | |
First Financial Holdings, Inc. | | | 12,195 | | | | 811,089 | |
First Interstate Bancsystem, Inc. | | | 9,233 | | | | 261,940 | |
First Merchants Corp. | | | 18,171 | | | | 413,572 | |
First Midwest Bancorp, Inc. | | | 38,435 | | | | 673,766 | |
First of Long Island Corp. (The) (b) | | | 3,365 | | | | 144,258 | |
FirstMerit Corp. | | | 83,808 | | | | 1,863,052 | |
Flushing Financial Corp. | | | 17,365 | | | | 359,455 | |
FNB Corp. (b) | | | 76,466 | | | | 965,001 | |
German American Bancorp, Inc. (b) | | | 6,759 | | | | 192,632 | |
Glacier Bancorp, Inc. (b) | | | 36,532 | | | | 1,088,288 | |
Great Southern Bancorp, Inc. | | | 6,069 | | | | 184,558 | |
Guaranty Bancorp | | | 8,675 | | | | 121,884 | |
Hancock Holding Co. | | | 42,609 | | | | 1,562,898 | |
Hanmi Financial Corp. | | | 17,546 | | | | 384,082 | |
See accompanying notes to financial statements.
MSF-6
Metropolitan Series Fund
Russell 2000 Index Portfolio
Schedule of Investments as of December 31, 2013
Common Stocks—(Continued)
| | | | | | | | |
| Security Description | | Shares | | | Value | |
|
Commercial Banks—(Continued) | |
Heartland Financial USA, Inc. | | | 7,703 | | | $ | 221,769 | |
Heritage Financial Corp. (b) | | | 10,314 | | | | 176,473 | |
Home BancShares, Inc. | | | 23,766 | | | | 887,660 | |
Home Federal Bancorp, Inc. (b) | | | 10,146 | | | | 151,175 | |
HomeTrust Bancshares, Inc. (a) (b) | | | 10,270 | | | | 164,217 | |
Horizon Bancorp (b) | | | 4,830 | | | | 122,344 | |
Hudson Valley Holding Corp. | | | 7,889 | | | | 160,541 | |
Iberiabank Corp. | | | 15,241 | | | | 957,897 | |
Independent Bank Corp. (b) | | | 11,835 | | | | 463,814 | |
International Bancshares Corp. | | | 27,173 | | | | 717,095 | |
Investors Bancorp, Inc. | | | 25,955 | | | | 663,929 | |
Lakeland Bancorp, Inc. | | | 16,496 | | | | 204,056 | |
Lakeland Financial Corp. | | | 9,208 | | | | 359,112 | |
MainSource Financial Group, Inc. | | | 12,295 | | | | 221,679 | |
MB Financial, Inc. | | | 28,968 | | | | 929,583 | |
Mercantile Bank Corp. | | | 4,833 | | | | 104,296 | |
Metro Bancorp, Inc. (a) | | | 7,930 | | | | 170,812 | |
MetroCorp Bancshares, Inc. | | | 8,864 | | | | 133,580 | |
MidWestOne Financial Group, Inc. | | | 3,830 | | | | 104,176 | |
National Bank Holdings Corp. - Class A | | | 26,547 | | | | 568,106 | |
National Bankshares, Inc. | | | 4,218 | | | | 155,602 | |
National Penn Bancshares, Inc. | | | 59,275 | | | | 671,586 | |
NBT Bancorp, Inc. | | | 24,027 | | | | 622,299 | |
NewBridge Bancorp (a) | | | 14,228 | | | | 106,710 | |
OFG Bancorp | | | 25,382 | | | | 440,124 | |
Old National Bancorp | | | 53,086 | | | | 815,932 | |
OmniAmerican Bancorp, Inc. (a) | | | 7,185 | | | | 153,615 | |
Pacific Continental Corp. | | | 10,841 | | | | 172,806 | |
Pacific Premier Bancorp, Inc. (a) (b) | | | 8,535 | | | | 134,341 | |
PacWest Bancorp (b) | | | 19,360 | | | | 817,379 | |
Park National Corp. | | | 5,759 | | | | 489,918 | |
Park Sterling Corp. | | | 31,667 | | | | 226,102 | |
Penns Woods Bancorp, Inc. | | | 1,988 | | | | 101,388 | |
Peoples Bancorp, Inc. | | | 5,988 | | | | 134,790 | |
Pinnacle Financial Partners, Inc. | | | 18,820 | | | | 612,215 | |
Preferred Bank (a) | | | 6,777 | | | | 135,879 | |
PrivateBancorp, Inc. | | | 33,931 | | | | 981,624 | |
Prosperity Bancshares, Inc. (b) | | | 30,210 | | | | 1,915,012 | |
Renasant Corp. | | | 15,636 | | | | 491,909 | |
Republic Bancorp, Inc. - Class A | | | 5,421 | | | | 133,031 | |
S&T Bancorp, Inc. | | | 15,660 | | | | 396,355 | |
Sandy Spring Bancorp, Inc. | | | 13,670 | | | | 385,357 | |
Seacoast Banking Corp. of Florida (a) | | | 10,249 | | | | 125,038 | |
Sierra Bancorp | | | 7,033 | | | | 113,161 | |
Simmons First National Corp. - Class A | | | 9,347 | | | | 347,241 | |
Southside Bancshares, Inc. (b) | | | 8,740 | | | | 238,952 | |
Southwest Bancorp, Inc. (a) | | | 11,069 | | | | 176,218 | |
State Bank Financial Corp. | | | 16,379 | | | | 297,934 | |
StellarOne Corp. | | | 12,984 | | | | 312,525 | |
Sterling Bancorp | | | 42,278 | | | | 565,257 | |
Sterling Financial Corp. | | | 17,351 | | | | 591,322 | |
Suffolk Bancorp (a) | | | 6,378 | | | | 132,662 | |
Susquehanna Bancshares, Inc. | | | 93,642 | | | | 1,202,363 | |
SY Bancorp, Inc. | | | 7,089 | | | | 226,281 | |
Taylor Capital Group, Inc. (a) | | | 7,608 | | | | 202,221 | |
Texas Capital Bancshares, Inc. (a) | | | 21,162 | | | | 1,316,276 | |
Tompkins Financial Corp. | | | 7,424 | | | | 381,519 | |
|
Commercial Banks—(Continued) | |
TowneBank (b) | | | 12,365 | | | | 190,297 | |
Trico Bancshares (b) | | | 8,062 | | | | 228,719 | |
Trustmark Corp. | | | 34,161 | | | | 916,881 | |
UMB Financial Corp. | | | 17,961 | | | | 1,154,533 | |
Umpqua Holdings Corp. (b) | | | 55,348 | | | | 1,059,361 | |
Union First Market Bankshares Corp. (b) | | | 9,844 | | | | 244,230 | |
United Bankshares, Inc. (b) | | | 25,900 | | | | 814,555 | |
United Community Banks, Inc. (a) | | | 21,449 | | | | 380,720 | |
Univest Corp. of Pennsylvania | | | 9,559 | | | | 197,680 | |
ViewPoint Financial Group, Inc. | | | 20,388 | | | | 559,651 | |
Virginia Commerce Bancorp, Inc. (a) | | | 12,273 | | | | 208,518 | |
Washington Banking Co. | | | 9,167 | | | | 162,531 | |
Washington Trust Bancorp, Inc. | | | 7,713 | | | | 287,078 | |
Webster Financial Corp. | | | 45,341 | | | | 1,413,732 | |
WesBanco, Inc. | | | 12,861 | | | | 411,552 | |
West Bancorp, Inc. | | | 8,036 | | | | 127,130 | |
Westamerica Bancorp (b) | | | 14,310 | | | | 807,943 | |
Western Alliance Bancorp (a) | | | 37,712 | | | | 899,808 | |
Wilshire Bancorp, Inc. | | | 35,291 | | | | 385,731 | |
Wintrust Financial Corp. (b) | | | 19,337 | | | | 891,822 | |
Yadkin Financial Corp. (a) | | | 7,897 | | | | 134,565 | |
| | | | | | | | |
| | | | | | | 61,733,903 | |
| | | | | | | | |
|
Commercial Services & Supplies—2.0% | |
ABM Industries, Inc. | | | 27,975 | | | | 799,805 | |
ACCO Brands Corp. (a) (b) | | | 58,424 | | | | 392,609 | |
ARC Document Solutions, Inc. (a) | | | 21,379 | | | | 175,735 | |
Brink’s Co. (The) | | | 24,924 | | | | 850,905 | |
Casella Waste Systems, Inc. - Class A (a) | | | 20,518 | | | | 119,004 | |
Ceco Environmental Corp. (b) | | | 9,240 | | | | 149,411 | |
Consolidated Graphics, Inc. (a) | | | 4,031 | | | | 271,851 | |
Costa, Inc. (a) | | | 5,065 | | | | 110,063 | |
Courier Corp. | | | 6,229 | | | | 112,683 | |
Deluxe Corp. (b) | | | 25,571 | | | | 1,334,551 | |
EnerNOC, Inc. (a) | | | 10,510 | | | | 180,877 | |
Ennis, Inc. | | | 14,123 | | | | 249,977 | |
G&K Services, Inc. - Class A | | | 9,849 | | | | 612,903 | |
Healthcare Services Group, Inc. (b) | | | 34,663 | | | | 983,389 | |
Herman Miller, Inc. | | | 29,708 | | | | 876,980 | |
HNI Corp. | | | 24,513 | | | | 951,840 | |
InnerWorkings, Inc. (a) (b) | | | 22,568 | | | | 175,805 | |
Interface, Inc. | | | 31,333 | | | | 688,073 | |
Kimball International, Inc. - Class B | | | 18,813 | | | | 282,759 | |
Knoll, Inc. (b) | | | 25,885 | | | | 473,954 | |
McGrath RentCorp (b) | | | 13,375 | | | | 532,325 | |
Mine Safety Appliances Co. | | | 14,087 | | | | 721,395 | |
Mobile Mini, Inc. (a) | | | 19,043 | | | | 784,191 | |
Multi-Color Corp. | | | 6,895 | | | | 260,217 | |
Performant Financial Corp. (a) | | | 11,558 | | | | 119,047 | |
Quad/Graphics, Inc. | | | 13,076 | | | | 356,060 | |
Schawk, Inc. | | | 7,118 | | | | 105,845 | |
SP Plus Corp. (a) | | | 8,683 | | | | 226,105 | |
Steelcase, Inc. - Class A | | | 41,383 | | | | 656,334 | |
Team, Inc. (a) | | | 10,055 | | | | 425,729 | |
Tetra Tech, Inc. (a) (c) | | | 33,211 | | | | 929,244 | |
U.S. Ecology, Inc. | | | 10,060 | | | | 374,132 | |
See accompanying notes to financial statements.
MSF-7
Metropolitan Series Fund
Russell 2000 Index Portfolio
Schedule of Investments as of December 31, 2013
Common Stocks—(Continued)
| | | | | | | | |
| Security Description | | Shares | | | Value | |
|
Commercial Services & Supplies—(Continued) | |
UniFirst Corp. | | | 7,601 | | | $ | 813,307 | |
United Stationers, Inc. | | | 20,554 | | | | 943,223 | |
Viad Corp. | | | 11,786 | | | | 327,415 | |
West Corp. (b) | | | 11,026 | | | | 283,479 | |
| | | | | | | | |
| | | | | | | 17,651,222 | |
| | | | | | | | |
|
Communications Equipment—1.7% | |
ADTRAN, Inc. (b) | | | 30,097 | | | | 812,920 | |
Anaren, Inc. (a) | | | 5,087 | | | | 142,385 | |
ARRIS Group, Inc. (a) | | | 59,022 | | | | 1,438,071 | |
Aruba Networks, Inc. (a) (b) | | | 59,276 | | | | 1,061,040 | |
Bel Fuse, Inc. - Class B | | | 5,512 | | | | 117,461 | |
Black Box Corp. | | | 10,452 | | | | 311,470 | |
CalAmp Corp. (a) | | | 19,380 | | | | 542,059 | |
Calix, Inc. (a) | | | 19,494 | | | | 187,922 | |
Ciena Corp. (a) (b) | | | 51,644 | | | | 1,235,841 | |
Comtech Telecommunications Corp. | | | 8,068 | | | | 254,303 | |
Digi International, Inc. (a) | | | 14,316 | | | | 173,510 | |
Emulex Corp. (a) | | | 45,893 | | | | 328,594 | |
Extreme Networks, Inc. (a) | | | 49,591 | | | | 347,137 | |
Finisar Corp. (a) | | | 47,662 | | | | 1,140,075 | |
Harmonic, Inc. (a) | | | 60,347 | | | | 445,361 | |
Infinera Corp. (a) (b) | | | 64,537 | | | | 631,172 | |
InterDigital, Inc. | | | 21,402 | | | | 631,145 | |
Ixia (a) | | | 28,748 | | | | 382,636 | |
KVH Industries, Inc. (a) | | | 8,641 | | | | 112,592 | |
NETGEAR, Inc. (a) (b) | | | 20,185 | | | | 664,894 | |
Oplink Communications, Inc. (a) | | | 10,830 | | | | 201,438 | |
Parkervision, Inc. (a) (b) | | | 43,816 | | | | 199,363 | |
Plantronics, Inc. | | | 21,347 | | | | 991,568 | |
Procera Networks, Inc. (a) (b) | | | 10,321 | | | | 155,021 | |
Ruckus Wireless, Inc. (a) (b) | | | 22,533 | | | | 319,969 | |
ShoreTel, Inc. (a) | | | 39,943 | | | | 370,671 | |
Sonus Networks, Inc. (a) | | | 111,897 | | | | 352,476 | |
Tessco Technologies, Inc. (b) | | | 3,116 | | | | 125,637 | |
Ubiquiti Networks, Inc. (a) (b) | | | 5,898 | | | | 271,072 | |
ViaSat, Inc. (a) | | | 19,916 | | | | 1,247,737 | |
| | | | | | | | |
| | | | | | | 15,195,540 | |
| | | | | | | | |
|
Computers & Peripherals—0.4% | |
Avid Technology, Inc. (a) | | | 15,838 | | | | 129,080 | |
Cray, Inc. (a) (b) | | | 20,870 | | | | 573,090 | |
Datalink Corp. (a) (b) | | | 9,229 | | | | 100,596 | |
Electronics for Imaging, Inc. (a) | | | 23,486 | | | | 909,613 | |
Fusion-io, Inc. (a) (b) | | | 38,656 | | | | 344,425 | |
Immersion Corp. (a) | | | 16,446 | | | | 170,710 | |
QLogic Corp. (a) | | | 44,263 | | | | 523,631 | |
Quantum Corp. (a) (b) | | | 113,826 | | | | 136,591 | |
Silicon Graphics International Corp. (a) (b) | | | 18,071 | | | | 242,332 | |
Super Micro Computer, Inc. (a) | | | 20,952 | | | | 359,536 | |
| | | | | | | | |
| | | | | | | 3,489,604 | |
| | | | | | | | |
|
Construction & Engineering—0.8% | |
Aegion Corp. (a) (b) | | | 20,173 | | | | 441,587 | |
Ameresco, Inc. - Class A (a) | | | 10,718 | | | | 103,536 | |
Argan, Inc. | | | 9,267 | | | | 255,398 | |
|
Construction & Engineering—(Continued) | |
Comfort Systems USA, Inc. | | | 19,376 | | | | 375,701 | |
Dycom Industries, Inc. (a) | | | 16,749 | | | | 465,455 | |
EMCOR Group, Inc. | | | 35,226 | | | | 1,494,991 | |
Furmanite Corp. (a) | | | 19,494 | | | | 207,026 | |
Granite Construction, Inc. (b) | | | 20,021 | | | | 700,335 | |
Great Lakes Dredge & Dock Corp. (a) | | | 32,033 | | | | 294,704 | |
Layne Christensen Co. (a) (b) | | | 10,438 | | | | 178,281 | |
MasTec, Inc. (a) (b) | | | 29,748 | | | | 973,354 | |
MYR Group, Inc. (a) | | | 10,017 | | | | 251,226 | |
Northwest Pipe Co. (a) | | | 4,794 | | | | 181,021 | |
Orion Marine Group, Inc. (a) | | | 14,575 | | | | 175,337 | |
Pike Electric Corp. (a) | | | 13,447 | | | | 142,135 | |
Primoris Services Corp. | | | 17,845 | | | | 555,515 | |
Sterling Construction Co., Inc. (a) | | | 9,052 | | | | 106,180 | |
Tutor Perini Corp. (a) | | | 19,192 | | | | 504,750 | |
| | | | | | | | |
| | | | | | | 7,406,532 | |
| | | | | | | | |
|
Construction Materials—0.1% | |
Headwaters, Inc. (a) | | | 38,364 | | | | 375,583 | |
Texas Industries, Inc. (a) (b) | | | 11,145 | | | | 766,553 | |
U.S. Concrete, Inc. (a) | | | 7,217 | | | | 163,321 | |
| | | | | | | | |
| | | | | | | 1,305,457 | |
| | | | | | | | |
|
Consumer Finance—0.7% | |
Cash America International, Inc. (b) | | | 14,003 | | | | 536,315 | |
Credit Acceptance Corp. (a) | | | 3,612 | | | | 469,524 | |
DFC Global Corp. (a) | | | 22,515 | | | | 257,797 | |
Encore Capital Group, Inc. (a) (b) | | | 12,804 | | | | 643,529 | |
Ezcorp, Inc. - Class A (a) | | | 24,505 | | | | 286,464 | |
First Cash Financial Services, Inc. (a) | | | 14,639 | | | | 905,276 | |
Green Dot Corp. - Class A (a) (b) | | | 12,988 | | | | 326,648 | |
Nelnet, Inc. - Class A | | | 12,596 | | | | 530,795 | |
Portfolio Recovery Associates, Inc. (a) (b) | | | 25,449 | | | | 1,344,725 | |
Regional Management Corp. (a) | | | 3,059 | | | | 103,792 | |
Springleaf Holdings, Inc. (a) | | | 14,832 | | | | 374,953 | |
World Acceptance Corp. (a) (b) | | | 4,646 | | | | 406,664 | |
| | | | | | | | |
| | | | | | | 6,186,482 | |
| | | | | | | | |
|
Containers & Packaging—0.2% | |
AEP Industries, Inc. (a) | | | 2,424 | | | | 128,060 | |
Berry Plastics Group, Inc. (a) | | | 27,955 | | | | 665,049 | |
Graphic Packaging Holding Co. (a) | | | 105,650 | | | | 1,014,240 | |
Myers Industries, Inc. | | | 17,592 | | | | 371,543 | |
| | | | | | | | |
| | | | | | | 2,178,892 | |
| | | | | | | | |
|
Distributors—0.2% | |
Core-Mark Holding Co., Inc. | | | 5,932 | | | | 450,417 | |
Pool Corp. | | | 23,340 | | | | 1,356,988 | |
VOXX International Corp. (a) | | | 10,683 | | | | 178,406 | |
Weyco Group, Inc. (b) | | | 4,154 | | | | 122,252 | |
| | | | | | | | |
| | | | | | | 2,108,063 | |
| | | | | | | | |
|
Diversified Consumer Services—1.0% | |
American Public Education, Inc. (a) (b) | | | 9,943 | | | | 432,222 | |
Ascent Capital Group, Inc. - Class A (a) (b) | | | 6,860 | | | | 586,942 | |
See accompanying notes to financial statements.
MSF-8
Metropolitan Series Fund
Russell 2000 Index Portfolio
Schedule of Investments as of December 31, 2013
Common Stocks—(Continued)
| | | | | | | | |
| Security Description | | Shares | | | Value | |
|
Diversified Consumer Services—(Continued) | |
Bridgepoint Education, Inc. (a) | | | 9,743 | | | $ | 172,549 | |
Bright Horizons Family Solutions, Inc. (a) | | | 6,946 | | | | 255,196 | |
Capella Education Co. | | | 5,633 | | | | 374,256 | |
Career Education Corp. (a) (b) | | | 30,241 | | | | 172,374 | |
Carriage Services, Inc. | | | 9,414 | | | | 183,855 | |
Education Management Corp. (a) (b) | | | 13,467 | | | | 135,882 | |
Grand Canyon Education, Inc. (a) | | | 22,843 | | | | 995,955 | |
Hillenbrand, Inc. | | | 28,780 | | | | 846,708 | |
Houghton Mifflin Harcourt Co. (a) | | | 14,080 | | | | 238,797 | |
ITT Educational Services, Inc. (a) (b) | | | 11,937 | | | | 400,844 | |
K12, Inc. (a) | | | 13,883 | | | | 301,955 | |
LifeLock, Inc. (a) (b) | | | 30,848 | | | | 506,216 | |
Mac-Gray Corp. | | | 7,254 | | | | 154,002 | |
Matthews International Corp. - Class A | | | 13,720 | | | | 584,609 | |
Regis Corp. (b) | | | 24,117 | | | | 349,938 | |
Sotheby’s | | | 33,921 | | | | 1,804,597 | |
Steiner Leisure, Ltd. (a) | | | 7,524 | | | | 370,106 | |
Strayer Education, Inc. (a) | | | 6,343 | | | | 218,643 | |
Universal Technical Institute, Inc. | | | 11,178 | | | | 155,486 | |
| | | | | | | | |
| | | | | | | 9,241,132 | |
| | | | | | | | |
|
Diversified Financial Services—0.3% | |
MarketAxess Holdings, Inc. | | | 19,495 | | | | 1,303,631 | |
Marlin Business Services Corp. | | | 4,620 | | | | 116,424 | |
NewStar Financial, Inc. (a) | | | 14,397 | | | | 255,835 | |
PHH Corp. (a) (b) | | | 28,995 | | | | 706,028 | |
PICO Holdings, Inc. (a) | | | 12,147 | | | | 280,717 | |
| | | | | | | | |
| | | | | | | 2,662,635 | |
| | | | | | | | |
|
Diversified Telecommunication Services—0.5% | |
8x8, Inc. (a) | | | 44,907 | | | | 456,255 | |
Atlantic Tele-Network, Inc. | | | 4,754 | | | | 268,934 | |
Cbeyond, Inc. (a) | | | 14,581 | | | | 100,609 | |
Cincinnati Bell, Inc. (a) | | | 106,292 | | | | 378,400 | |
Cogent Communications Group, Inc. (b) | | | 24,794 | | | | 1,001,926 | |
Consolidated Communications Holdings, Inc. | | | 19,216 | | | | 377,210 | |
Fairpoint Communications, Inc. (a) (b) | | | 11,602 | | | | 131,219 | |
General Communication, Inc. - Class A (a) | | | 16,537 | | | | 184,388 | |
Hawaiian Telcom Holdco, Inc. (a) (b) | | | 6,401 | | | | 187,997 | |
IDT Corp. - Class B | | | 8,438 | | | | 150,787 | |
inContact, Inc. (a) (b) | | | 27,382 | | | | 213,853 | |
Inteliquent, Inc. | | | 16,025 | | | | 183,006 | |
Iridium Communications, Inc. (a) (b) | | | 32,786 | | | | 205,240 | |
Lumos Networks Corp. | | | 8,454 | | | | 177,534 | |
magicJack VocalTec, Ltd. (a) | | | 8,170 | | | | 97,386 | |
ORBCOMM, Inc. (a) | | | 19,477 | | | | 123,484 | |
Premiere Global Services, Inc. (a) | | | 24,982 | | | | 289,541 | |
Towerstream Corp. (a) | | | 36,176 | | | | 107,081 | |
Vonage Holdings Corp. (a) | | | 74,697 | | | | 248,741 | |
| | | | | | | | |
| | | | | | | 4,883,591 | |
| | | | | | | | |
|
Electric Utilities—1.3% | |
ALLETE, Inc. | | | 20,181 | | | | 1,006,628 | |
Cleco Corp. | | | 30,631 | | | | 1,428,017 | |
El Paso Electric Co. | | | 21,145 | | | | 742,401 | |
|
Electric Utilities—(Continued) | |
Empire District Electric Co. | | | 22,399 | | | | 508,233 | |
IDACORP, Inc. (b) | | | 25,340 | | | | 1,313,626 | |
MGE Energy, Inc. | | | 12,019 | | | | 695,900 | |
NRG Yield, Inc. - Class A (b) | | | 12,728 | | | | 509,247 | |
Otter Tail Corp. (b) | | | 18,873 | | | | 552,413 | |
PNM Resources, Inc. | | | 38,653 | | | | 932,310 | |
Portland General Electric Co. (b) | | | 38,989 | | | | 1,177,468 | |
UIL Holdings Corp. (b) | | | 28,637 | | | | 1,109,684 | |
Unitil Corp. | | | 7,429 | | | | 226,510 | |
UNS Energy Corp. (b) | | | 21,055 | | | | 1,260,142 | |
| | | | | | | | |
| | | | | | | 11,462,579 | |
| | | | | | | | |
|
Electrical Equipment—1.5% | |
Acuity Brands, Inc. (b) | | | 21,597 | | | | 2,360,984 | |
AZZ, Inc. (b) | | | 13,326 | | | | 651,108 | |
Brady Corp. - Class A | | | 22,732 | | | | 703,101 | |
Capstone Turbine Corp. (a) (b) | | | 164,599 | | | | 212,333 | |
Coleman Cable, Inc. | | | 4,571 | | | | 119,851 | |
Encore Wire Corp. | | | 10,537 | | | | 571,105 | |
EnerSys, Inc. (b) | | | 25,000 | | | | 1,752,250 | |
Franklin Electric Co., Inc. | | | 24,472 | | | | 1,092,430 | |
FuelCell Energy, Inc. (a) (b) | | | 88,097 | | | | 124,217 | |
Generac Holdings, Inc. (b) | | | 25,812 | | | | 1,461,992 | |
General Cable Corp. (b) | | | 24,951 | | | | 733,809 | |
Global Power Equipment Group, Inc. | | | 8,163 | | | | 159,750 | |
GrafTech International, Ltd. (a) (b) | | | 58,953 | | | | 662,042 | |
II-VI, Inc. (a) | | | 27,302 | | | | 480,515 | |
LSI Industries, Inc. | | | 11,713 | | | | 101,552 | |
Polypore International, Inc. (a) (b) | | | 23,444 | | | | 911,971 | |
Powell Industries, Inc. | | | 4,404 | | | | 295,024 | |
PowerSecure International, Inc. (a) (b) | | | 9,992 | | | | 171,563 | |
Preformed Line Products Co. | | | 1,321 | | | | 96,644 | |
Thermon Group Holdings, Inc. (a) | | | 13,760 | | | | 376,061 | |
Vicor Corp. (a) | | | 9,542 | | | | 128,054 | |
| | | | | | | | |
| | | | | | | 13,166,356 | |
| | | | | | | | |
|
Electronic Equipment, Instruments & Components—2.5% | |
Agilysys, Inc. (a) | | | 8,133 | | | | 113,211 | |
Anixter International, Inc. | | | 13,642 | | | | 1,225,597 | |
Badger Meter, Inc. (b) | | | 6,820 | | | | 371,690 | |
Belden, Inc. | | | 22,330 | | | | 1,573,149 | |
Benchmark Electronics, Inc. (a) | | | 26,591 | | | | 613,720 | |
Checkpoint Systems, Inc. (a) | | | 21,005 | | | | 331,249 | |
Cognex Corp. | | | 44,140 | | | | 1,685,265 | |
Coherent, Inc. (a) | | | 12,319 | | | | 916,411 | |
CTS Corp. | | | 18,070 | | | | 359,774 | |
Daktronics, Inc. | | | 18,513 | | | | 290,284 | |
DTS, Inc. (a) | | | 9,298 | | | | 222,966 | |
Electro Rent Corp. | | | 9,062 | | | | 167,828 | |
Electro Scientific Industries, Inc. | | | 11,663 | | | | 121,995 | |
Fabrinet (a) | | | 14,981 | | | | 308,009 | |
FARO Technologies, Inc. (a) | | | 8,551 | | | | 498,523 | |
FEI Co. | | | 21,007 | | | | 1,877,186 | |
GSI Group, Inc. (a) | | | 18,739 | | | | 210,626 | |
Insight Enterprises, Inc. (a) (c) | | | 22,462 | | | | 510,112 | |
InvenSense, Inc. (a) (b) | | | 29,030 | | | | 603,244 | |
See accompanying notes to financial statements.
MSF-9
Metropolitan Series Fund
Russell 2000 Index Portfolio
Schedule of Investments as of December 31, 2013
Common Stocks—(Continued)
| | | | | | | | |
| Security Description | | Shares | | | Value | |
|
Electronic Equipment, Instruments & Components—(Continued) | |
Itron, Inc. (a) (b) | | | 19,812 | | | $ | 820,811 | |
Kemet Corp. (a) | | | 22,874 | | | | 129,009 | |
Littelfuse, Inc. | | | 11,202 | | | | 1,041,002 | |
Maxwell Technologies, Inc. (a) (b) | | | 14,377 | | | | 111,709 | |
Measurement Specialties, Inc. (a) | | | 8,286 | | | | 502,877 | |
Mercury Systems, Inc. (a) | | | 15,581 | | | | 170,612 | |
Mesa Laboratories, Inc. (b) | | | 1,416 | | | | 111,269 | |
Methode Electronics, Inc. | | | 19,169 | | | | 655,388 | |
MTS Systems Corp. | | | 8,022 | | | | 571,568 | |
Newport Corp. (a) | | | 20,202 | | | | 365,050 | |
OSI Systems, Inc. (a) | | | 10,001 | | | | 531,153 | |
Park Electrochemical Corp. | | | 10,569 | | | | 303,542 | |
PC Connection, Inc. | | | 5,366 | | | | 133,345 | |
Plexus Corp. (a) (c) | | | 17,502 | | | | 757,662 | |
RealD, Inc. (a) | | | 18,684 | | | | 159,561 | |
Rofin-Sinar Technologies, Inc. (a) | | | 15,227 | | | | 411,434 | |
Rogers Corp. (a) | | | 8,965 | | | | 551,348 | |
Sanmina Corp. (a) | | | 42,537 | | | | 710,368 | |
ScanSource, Inc. (a) | | | 14,516 | | | | 615,914 | |
Speed Commerce, Inc. (a) | | | 25,516 | | | | 119,160 | |
SYNNEX Corp. (a) | | | 13,438 | | | | 905,721 | |
TTM Technologies, Inc. (a) | | | 26,923 | | | | 230,999 | |
Universal Display Corp. (a) (b) | | | 21,034 | | | | 722,728 | |
Zygo Corp. (a) | | | 8,667 | | | | 128,098 | |
| | | | | | | | |
| | | | | | | 22,761,167 | |
| | | | | | | | |
|
Energy Equipment & Services—1.7% | |
Basic Energy Services, Inc. (a) (b) | | | 14,197 | | | | 224,029 | |
Bolt Technology Corp. | | | 4,652 | | | | 102,391 | |
Bristow Group, Inc. | | | 18,228 | | | | 1,368,194 | |
C&J Energy Services, Inc. (a) (b) | | | 23,819 | | | | 550,219 | |
Cal Dive International, Inc. (a) (b) | | | 54,319 | | | | 109,181 | |
CARBO Ceramics, Inc. (b) | | | 9,985 | | | | 1,163,552 | |
Dawson Geophysical Co. (a) | | | 5,124 | | | | 173,294 | |
Era Group, Inc. (a) | | | 10,332 | | | | 318,846 | |
Exterran Holdings, Inc. (a) | | | 28,971 | | | | 990,808 | |
Forum Energy Technologies, Inc. (a) | | | 19,863 | | | | 561,328 | |
Geospace Technologies Corp. (a) (b) | | | 6,866 | | | | 651,103 | |
Gulf Island Fabrication, Inc. | | | 7,812 | | | | 181,395 | |
GulfMark Offshore, Inc. - Class A | | | 13,516 | | | | 637,009 | |
Helix Energy Solutions Group, Inc. (a) | | | 52,636 | | | | 1,220,102 | |
Hercules Offshore, Inc. (a) | | | 82,886 | | | | 541,246 | |
Hornbeck Offshore Services, Inc. (a) (b) | | | 18,165 | | | | 894,263 | |
ION Geophysical Corp. (a) (b) | | | 68,572 | | | | 226,288 | |
Key Energy Services, Inc. (a) | | | 80,293 | | | | 634,315 | |
Matrix Service Co. (a) | | | 14,196 | | | | 347,376 | |
Mitcham Industries, Inc. (a) | | | 7,031 | | | | 124,519 | |
Natural Gas Services Group, Inc. (a) | | | 6,643 | | | | 183,148 | |
Newpark Resources, Inc. (a) (b) | | | 42,672 | | | | 524,439 | |
Nuverra Environmental Solutions, Inc. (a) (b) | | | 8,305 | | | | 139,438 | |
Parker Drilling Co. (a) | | | 61,149 | | | | 497,141 | |
PHI, Inc. (a) | | | 6,426 | | | | 278,888 | |
Pioneer Energy Services Corp. (a) | | | 31,825 | | | | 254,918 | |
RigNet, Inc. (a) | | | 6,898 | | | | 330,621 | |
SEACOR Holdings, Inc. (a) (b) | | | 10,116 | | | | 922,579 | |
Tesco Corp. (a) | | | 16,366 | | | | 323,719 | |
|
Energy Equipment & Services—(Continued) | |
TETRA Technologies, Inc. (a) | | | 39,068 | | | | 482,880 | |
Vantage Drilling Co. (a) (b) | | | 106,785 | | | | 196,484 | |
Willbros Group, Inc. (a) | | | 22,413 | | | | 211,130 | |
| | | | | �� | | | |
| | | | | | | 15,364,843 | |
| | | | | | | | |
|
Food & Staples Retailing—1.3% | |
Andersons, Inc. (The) | | | 9,754 | | | | 869,764 | |
Casey’s General Stores, Inc. | | | 19,362 | | | | 1,360,181 | |
Chefs’ Warehouse, Inc. (The) (a) (b) | | | 8,577 | | | | 250,105 | |
Fairway Group Holdings Corp. (a) (b) | | | 8,135 | | | | 147,406 | |
Harris Teeter Supermarkets, Inc. | | | 24,758 | | | | 1,221,807 | |
Ingles Markets, Inc. - Class A | | | 6,173 | | | | 167,288 | |
Natural Grocers by Vitamin Cottage, Inc. (a) (b) | | | 4,597 | | | | 195,143 | |
Pantry, Inc. (The) (a) | | | 12,441 | | | | 208,760 | |
Pricesmart, Inc. (b) | | | 9,705 | | | | 1,121,316 | |
Rite Aid Corp. (a) | | | 365,720 | | | | 1,850,543 | |
Roundy’s, Inc. | | | 13,261 | | | | 130,754 | |
Spartan Stores, Inc. | | | 19,948 | | | | 484,337 | |
SUPERVALU, Inc. (a) (b) | | | 101,674 | | | | 741,204 | |
Susser Holdings Corp. (a) (b) | | | 9,109 | | | | 596,548 | |
United Natural Foods, Inc. (a) | | | 24,889 | | | | 1,876,382 | |
Village Super Market, Inc. - Class A | | | 5,219 | | | | 161,841 | |
Weis Markets, Inc. | | | 6,205 | | | | 326,135 | |
| | | | | | | | |
| | | | | | | 11,709,514 | |
| | | | | | | | |
|
Food Products—1.6% | |
Annie’s, Inc. (a) (b) | | | 6,956 | | | | 299,386 | |
B&G Foods, Inc. | | | 26,523 | | | | 899,395 | |
Boulder Brands, Inc. (a) | | | 31,712 | | | | 502,952 | |
Cal-Maine Foods, Inc. (b) | | | 7,468 | | | | 449,798 | |
Calavo Growers, Inc. (b) | | | 6,124 | | | | 185,312 | |
Chiquita Brands International, Inc. (a) | | | 24,259 | | | | 283,830 | |
Darling International, Inc. (a) | | | 80,172 | | | | 1,673,991 | |
Diamond Foods, Inc. (a) (b) | | | 11,661 | | | | 301,320 | |
Fresh Del Monte Produce, Inc. | | | 19,290 | | | | 545,907 | |
Hain Celestial Group, Inc. (The) (a) (b) | | | 19,519 | | | | 1,771,935 | |
Inventure Foods, Inc. (a) | | | 8,089 | | | | 107,260 | |
J&J Snack Foods Corp. | | | 7,928 | | | | 702,342 | |
John B Sanfilippo & Son, Inc. | | | 4,642 | | | | 114,565 | |
Lancaster Colony Corp. | | | 9,483 | | | | 835,926 | |
Limoneira Co. (b) | | | 4,954 | | | | 131,727 | |
Omega Protein Corp. (a) | | | 11,349 | | | | 139,479 | |
Pilgrim’s Pride Corp. (a) | | | 32,160 | | | | 522,600 | |
Post Holdings, Inc. (a) (b) | | | 16,404 | | | | 808,225 | |
Sanderson Farms, Inc. | | | 11,409 | | | | 825,213 | |
Seaboard Corp. | | | 150 | | | | 419,246 | |
Seneca Foods Corp. - Class A (a) | | | 4,612 | | | | 147,077 | |
Snyders-Lance, Inc. | | | 26,518 | | | | 761,597 | |
Tootsie Roll Industries, Inc. (b) | | | 9,939 | | | | 323,415 | |
TreeHouse Foods, Inc. (a) | | | 18,597 | | | | 1,281,705 | |
| | | | | | | | |
| | | | | | | 14,034,203 | |
| | | | | | | | |
|
Gas Utilities—0.8% | |
Chesapeake Utilities Corp. | | | 4,498 | | | | 269,970 | |
Laclede Group, Inc. (The) | | | 16,259 | | | | 740,435 | |
See accompanying notes to financial statements.
MSF-10
Metropolitan Series Fund
Russell 2000 Index Portfolio
Schedule of Investments as of December 31, 2013
Common Stocks—(Continued)
| | | | | | | | |
| Security Description | | Shares | | | Value | |
|
Gas Utilities—(Continued) | |
New Jersey Resources Corp. (b) | | | 21,213 | | | $ | 980,889 | |
Northwest Natural Gas Co. (b) | | | 14,144 | | | | 605,646 | |
Piedmont Natural Gas Co., Inc. | | | 37,126 | | | | 1,231,098 | |
South Jersey Industries, Inc. | | | 15,904 | | | | 889,988 | |
Southwest Gas Corp. | | | 23,934 | | | | 1,338,150 | |
WGL Holdings, Inc. | | | 26,098 | | | | 1,045,486 | |
| | | | | | | | |
| | | | | | | 7,101,662 | |
| | | | | | | | |
|
Health Care Equipment & Supplies—3.3% | |
Abaxis, Inc. (a) (b) | | | 12,234 | | | | 489,605 | |
ABIOMED, Inc. (a) (b) | | | 19,803 | | | | 529,532 | |
Accuray, Inc. (a) (b) | | | 37,218 | | | | 324,169 | |
Align Technology, Inc. (a) | | | 37,075 | | | | 2,118,836 | |
Analogic Corp. | | | 6,542 | | | | 579,359 | |
AngioDynamics, Inc. (a) | | | 13,423 | | | | 230,741 | |
Anika Therapeutics, Inc. (a) | | | 7,087 | | | | 270,440 | |
Antares Pharma, Inc. (a) (b) | | | 58,477 | | | | 261,977 | |
ArthroCare Corp. (a) | | | 14,508 | | | | 583,802 | |
AtriCure, Inc. (a) | | | 10,769 | | | | 201,165 | |
Atrion Corp. | | | 874 | | | | 258,922 | |
Cantel Medical Corp. | | | 16,951 | | | | 574,808 | |
Cardiovascular Systems, Inc. (a) | | | 12,840 | | | | 440,284 | |
Cerus Corp. (a) (b) | | | 38,358 | | | | 247,409 | |
CONMED Corp. | | | 14,206 | | | | 603,755 | |
CryoLife, Inc. | | | 17,220 | | | | 190,970 | |
Cyberonics, Inc. (a) | | | 14,671 | | | | 961,097 | |
Cynosure, Inc. - Class A (a) | | | 9,126 | | | | 243,482 | |
DexCom, Inc. (a) | | | 35,316 | | | | 1,250,540 | |
Endologix, Inc. (a) | | | 32,408 | | | | 565,196 | |
Exactech, Inc. (a) | | | 5,322 | | | | 126,451 | |
GenMark Diagnostics, Inc. (a) (b) | | | 19,362 | | | | 257,708 | |
Globus Medical, Inc. - Class A (a) | | | 27,849 | | | | 561,993 | |
Greatbatch, Inc. (a) | | | 12,931 | | | | 572,067 | |
Haemonetics Corp. (a) (b) | | | 26,522 | | | | 1,117,372 | |
HeartWare International, Inc. (a) (b) | | | 8,570 | | | | 805,237 | |
ICU Medical, Inc. (a) | | | 6,398 | | | | 407,617 | |
Insulet Corp. (a) | | | 27,643 | | | | 1,025,555 | |
Integra LifeSciences Holdings Corp. (a) | | | 12,903 | | | | 615,602 | |
Invacare Corp. | | | 15,930 | | | | 369,735 | |
Masimo Corp. (a) (b) | | | 25,075 | | | | 732,942 | |
Meridian Bioscience, Inc. (b) | | | 22,552 | | | | 598,305 | |
Merit Medical Systems, Inc. (a) | | | 21,638 | | | | 340,582 | |
Natus Medical, Inc. (a) | | | 16,472 | | | | 370,620 | |
Navidea Biopharmaceuticals, Inc. (a) (b) | | | 64,614 | | | | 133,751 | |
Neogen Corp. (a) | | | 17,828 | | | | 814,740 | |
NuVasive, Inc. (a) | | | 22,552 | | | | 729,106 | |
NxStage Medical, Inc. (a) | | | 30,508 | | | | 305,080 | |
OraSure Technologies, Inc. (a) (b) | | | 29,491 | | | | 185,498 | |
Orthofix International NV (a) | | | 9,598 | | | | 219,026 | |
Quidel Corp. (a) | | | 13,903 | | | | 429,464 | |
Rockwell Medical, Inc. (a) (b) | | | 22,438 | | | | 234,253 | |
Solta Medical, Inc. (a) (b) | | | 40,872 | | | | 120,572 | |
Spectranetics Corp. (a) | | | 21,548 | | | | 538,700 | |
Staar Surgical Co. (a) (b) | | | 19,419 | | | | 314,394 | |
STERIS Corp. | | | 29,805 | | | | 1,432,130 | |
SurModics, Inc. (a) | | | 9,958 | | | | 242,876 | |
|
Health Care Equipment & Supplies—(Continued) | |
Symmetry Medical, Inc. (a) | | | 21,060 | | | | 212,285 | |
Tandem Diabetes Care, Inc. (a) | | | 7,345 | | | | 189,281 | |
TearLab Corp. (a) (b) | | | 13,828 | | | | 129,154 | |
Thoratec Corp. (a) | | | 28,903 | | | | 1,057,850 | |
Tornier NV (a) | | | 13,588 | | | | 255,319 | |
Unilife Corp. (a) (b) | | | 51,606 | | | | 227,066 | |
Vascular Solutions, Inc. (a) | | | 9,953 | | | | 230,412 | |
Volcano Corp. (a) (b) | | | 27,732 | | | | 605,944 | |
West Pharmaceutical Services, Inc. | | | 35,092 | | | | 1,721,613 | |
Wright Medical Group, Inc. (a) | | | 20,337 | | | | 624,549 | |
Zeltiq Aesthetics, Inc. (a) | | | 9,779 | | | | 184,921 | |
| | | | | | | | |
| | | | | | | 29,965,859 | |
| | | | | | | | |
|
Health Care Providers & Services—2.5% | |
Acadia Healthcare Co., Inc. (a) (b) | | | 17,958 | | | | 849,952 | |
Accretive Health, Inc. (a) | | | 30,305 | | | | 277,594 | |
Air Methods Corp. (a) (b) | | | 20,526 | | | | 1,197,282 | |
Almost Family, Inc. (a) | | | 4,642 | | | | 150,076 | |
Amedisys, Inc. (a) (b) | | | 18,591 | | | | 271,986 | |
AMN Healthcare Services, Inc. (a) | | | 23,983 | | | | 352,550 | |
Amsurg Corp. (a) | | | 17,529 | | | | 804,932 | |
Bio-Reference Labs, Inc. (a) (b) | | | 12,716 | | | | 324,767 | |
BioScrip, Inc. (a) | | | 29,688 | | | | 219,691 | |
Capital Senior Living Corp. (a) | | | 14,260 | | | | 342,097 | |
Centene Corp. (a) | | | 27,657 | | | | 1,630,380 | |
Chemed Corp. (b) | | | 9,094 | | | | 696,782 | |
Chindex International, Inc. (a) | | | 7,045 | | | | 122,794 | |
Corvel Corp. (a) | | | 5,450 | | | | 254,515 | |
Cross Country Healthcare, Inc. (a) | | | 15,246 | | | | 152,155 | |
Emeritus Corp. (a) | | | 20,542 | | | | 444,323 | |
Ensign Group, Inc. (The) | | | 11,507 | | | | 509,415 | |
ExamWorks Group, Inc. (a) | | | 15,818 | | | | 472,484 | |
Five Star Quality Care, Inc. (a) | | | 25,265 | | | | 138,705 | |
Gentiva Health Services, Inc. (a) | | | 16,117 | | | | 200,012 | |
Hanger, Inc. (a) | | | 17,356 | | | | 682,785 | |
HealthSouth Corp. | | | 44,339 | | | | 1,477,375 | |
Healthways, Inc. (a) (b) | | | 18,606 | | | | 285,602 | |
IPC The Hospitalist Co., Inc. (a) | | | 9,377 | | | | 556,900 | |
Kindred Healthcare, Inc. | | | 29,215 | | | | 576,704 | |
Landauer, Inc. | | | 5,165 | | | | 271,731 | |
LHC Group, Inc. (a) | | | 6,847 | | | | 164,602 | |
Magellan Health Services, Inc. (a) | | | 13,774 | | | | 825,200 | |
Molina Healthcare, Inc. (a) (b) | | | 14,027 | | | | 487,438 | |
MWI Veterinary Supply, Inc. (a) | | | 6,571 | | | | 1,120,947 | |
National Healthcare Corp. (b) | | | 5,246 | | | | 282,812 | |
Owens & Minor, Inc. (b) | | | 31,521 | | | | 1,152,408 | |
PharMerica Corp. (a) | | | 17,146 | | | | 368,639 | |
Providence Service Corp. (The) (a) | | | 4,943 | | | | 127,134 | |
Select Medical Holdings Corp. | | | 25,554 | | | | 296,682 | |
Surgical Care Affiliates, Inc. (a) (b) | | | 7,471 | | | | 260,290 | |
Team Health Holdings, Inc. (a) | | | 34,473 | | | | 1,570,245 | |
Triple-S Management Corp. - Class B (a) | | | 12,074 | | | | 234,719 | |
U.S. Physical Therapy, Inc. | | | 6,011 | | | | 211,948 | |
Universal American Corp. | | | 20,509 | | | | 149,716 | |
WellCare Health Plans, Inc. (a) | | | 22,057 | | | | 1,553,254 | |
| | | | | | | | |
| | | | | | | 22,069,623 | |
| | | | | | | | |
See accompanying notes to financial statements.
MSF-11
Metropolitan Series Fund
Russell 2000 Index Portfolio
Schedule of Investments as of December 31, 2013
Common Stocks—(Continued)
| | | | | | | | |
| Security Description | | Shares | | | Value | |
|
Health Care Technology—0.8% | |
athenahealth, Inc. (a) (b) | | | 18,602 | | | $ | 2,501,969 | |
Computer Programs & Systems, Inc. (b) | | | 5,856 | | | | 361,959 | |
HealthStream, Inc. (a) | | | 10,052 | | | | 329,404 | |
HMS Holdings Corp. (a) (b) | | | 44,959 | | | | 1,021,918 | |
MedAssets, Inc. (a) | | | 31,309 | | | | 620,858 | |
Medidata Solutions, Inc. (a) | | | 26,770 | | | | 1,621,459 | |
Omnicell, Inc. (a) | | | 16,926 | | | | 432,121 | |
Quality Systems, Inc. | | | 20,268 | | | | 426,844 | |
Vocera Communications, Inc. (a) (b) | | | 11,244 | | | | 175,519 | |
| | | | | | | | |
| | | | | | | 7,492,051 | |
| | | | | | | | |
|
Hotels, Restaurants & Leisure—2.7% | |
AFC Enterprises, Inc. (a) | | | 12,829 | | | | 493,917 | |
Biglari Holdings, Inc. (a) | | | 726 | | | | 367,821 | |
BJ’s Restaurants, Inc. (a) (b) | | | 13,550 | | | | 420,863 | |
Bloomin’ Brands, Inc. (a) | | | 27,840 | | | | 668,438 | |
Bob Evans Farms, Inc. | | | 14,725 | | | | 744,938 | |
Boyd Gaming Corp. (a) | | | 35,670 | | | | 401,644 | |
Bravo Brio Restaurant Group, Inc. (a) | | | 9,979 | | | | 162,358 | |
Buffalo Wild Wings, Inc. (a) (b) | | | 9,529 | | | | 1,402,669 | |
Caesars Entertainment Corp. (a) (b) | | | 21,057 | | | | 453,568 | |
CEC Entertainment, Inc. | | | 9,410 | | | | 416,675 | |
Cheesecake Factory, Inc. (The) (b) | | | 27,105 | | | | 1,308,358 | |
Churchill Downs, Inc. | | | 7,015 | | | | 628,895 | |
Chuy’s Holdings, Inc. (a) (b) | | | 8,272 | | | | 297,957 | |
ClubCorp Holdings, Inc. (b) | | | 14,120 | | | | 250,489 | |
Cracker Barrel Old Country Store, Inc. | | | 9,956 | | | | 1,095,857 | |
Del Frisco’s Restaurant Group, Inc. (a) | | | 5,668 | | | | 133,595 | |
Denny’s Corp. (a) | | | 47,722 | | | | 343,121 | |
Diamond Resorts International, Inc. (a) | | | 11,329 | | | | 209,133 | |
DineEquity, Inc. | | | 9,077 | | | | 758,383 | |
Fiesta Restaurant Group, Inc. (a) | | | 11,554 | | | | 603,581 | |
International Speedway Corp. - Class A | | | 15,258 | | | | 541,506 | |
Interval Leisure Group, Inc. (b) | | | 21,655 | | | | 669,140 | |
Jack in the Box, Inc. (a) | | | 22,716 | | | | 1,136,254 | |
Jamba, Inc. (a) (b) | | | 7,943 | | | | 98,731 | |
Krispy Kreme Doughnuts, Inc. (a) (b) | | | 33,031 | | | | 637,168 | |
Life Time Fitness, Inc. (a) (b) | | | 22,025 | | | | 1,035,175 | |
Marcus Corp. | | | 11,702 | | | | 157,275 | |
Marriott Vacations Worldwide Corp. (a) | | | 14,288 | | | | 753,835 | |
Morgans Hotel Group Co. (a) (b) | | | 12,602 | | | | 102,454 | |
Multimedia Games Holding Co., Inc. (a) | | | 15,847 | | | | 496,962 | |
Noodles & Co. (a) (b) | | | 4,118 | | | | 147,919 | |
Orient-Express Hotels, Ltd. - Class A (a) | | | 52,036 | | | | 786,264 | |
Papa John’s International, Inc. | | | 16,360 | | | | 742,744 | |
Pinnacle Entertainment, Inc. (a) | | | 30,820 | | | | 801,012 | |
Potbelly Corp. (a) (b) | | | 6,746 | | | | 163,793 | |
Red Robin Gourmet Burgers, Inc. (a) | | | 7,250 | | | | 533,165 | |
Ruby Tuesday, Inc. (a) | | | 31,853 | | | | 220,741 | |
Ruth’s Hospitality Group, Inc. | | | 17,912 | | | | 254,530 | |
Scientific Games Corp. - Class A (a) | | | 22,727 | | | | 384,768 | |
Sonic Corp. (a) | | | 27,410 | | | | 553,408 | |
Speedway Motorsports, Inc. | | | 7,078 | | | | 140,498 | |
Texas Roadhouse, Inc. | | | 33,641 | | | | 935,220 | |
Town Sports International Holdings, Inc. | | | 12,656 | | | | 186,803 | |
Vail Resorts, Inc. | | | 18,297 | | | | 1,376,483 | |
| | | | | | | | |
| | | | | | | 24,018,108 | |
| | | | | | | | |
|
Household Durables—1.0% | |
Beazer Homes USA, Inc. (a) (b) | | | 13,700 | | | | 334,554 | |
Cavco Industries, Inc. (a) | | | 4,452 | | | | 305,852 | |
CSS Industries, Inc. | | | 4,201 | | | | 120,485 | |
Ethan Allen Interiors, Inc. (b) | | | 12,159 | | | | 369,877 | |
Helen of Troy, Ltd. (a) | | | 16,965 | | | | 839,937 | |
Hooker Furniture Corp. | | | 6,126 | | | | 102,182 | |
Hovnanian Enterprises, Inc. - Class A (a) (b) | | | 56,064 | | | | 371,144 | |
iRobot Corp. (a) (b) | | | 14,746 | | | | 512,718 | |
KB Home (b) | | | 43,434 | | | | 793,974 | |
La-Z-Boy, Inc. | | | 26,643 | | | | 825,933 | |
Libbey, Inc. (a) | | | 10,247 | | | | 215,187 | |
M/I Homes, Inc. (a) | | | 12,868 | | | | 327,491 | |
MDC Holdings, Inc. (b) | | | 19,869 | | | | 640,577 | |
Meritage Homes Corp. (a) | | | 18,168 | | | | 871,882 | |
NACCO Industries, Inc. - Class A | | | 3,117 | | | | 193,846 | |
Ryland Group, Inc. (The) (b) | | | 23,149 | | | | 1,004,898 | |
Standard Pacific Corp. (a) (b) | | | 74,682 | | | | 675,872 | |
TRI Pointe Homes, Inc. (a) (b) | | | 9,540 | | | | 190,132 | |
Universal Electronics, Inc. (a) | | | 7,461 | | | | 284,339 | |
William Lyon Homes - Class A (a) (b) | | | 6,939 | | | | 153,629 | |
| | | | | | | | |
| | | | | | | 9,134,509 | |
| | | | | | | | |
|
Household Products—0.2% | |
Central Garden and Pet Co. - Class A (a) | | | 23,384 | | | | 157,842 | |
Harbinger Group, Inc. (a) (b) | | | 17,723 | | | | 210,017 | |
Orchids Paper Products Co. (b) | | | 3,201 | | | | 105,121 | |
Spectrum Brands Holdings, Inc. | | | 11,034 | | | | 778,449 | |
WD-40 Co. | | | 7,863 | | | | 587,209 | |
| | | | | | | | |
| | | | | | | 1,838,638 | |
| | | | | | | | |
|
Independent Power Producers & Energy Traders—0.2% | |
Atlantic Power Corp. (b) | | | 65,639 | | | | 228,424 | |
Dynegy, Inc. (a) (b) | | | 50,774 | | | | 1,092,656 | |
Ormat Technologies, Inc. | | | 9,298 | | | | 252,999 | |
Pattern Energy Group, Inc. | | | 11,445 | | | | 346,898 | |
| | | | | | | | |
| | | | | | | 1,920,977 | |
| | | | | | | | |
|
Industrial Conglomerates—0.1% | |
Raven Industries, Inc. | | | 18,658 | | | | 767,590 | |
| | | | | | | | |
|
Insurance—2.3% | |
Ambac Financial Group, Inc. (a) | | | 25,469 | | | | 625,519 | |
American Equity Investment Life Holding Co. (b) | | | 34,776 | | | | 917,391 | |
AMERISAFE, Inc. | | | 9,298 | | | | 392,747 | |
Amtrust Financial Services, Inc. (b) | | | 15,535 | | | | 507,839 | |
Argo Group International Holdings, Ltd. | | | 13,774 | | | | 640,353 | |
Baldwin & Lyons, Inc. - Class B | | | 4,133 | | | | 112,914 | |
Citizens, Inc. (a) (b) | | | 22,172 | | | | 194,005 | |
CNO Financial Group, Inc. | | | 111,424 | | | | 1,971,091 | |
Crawford & Co. - Class B (b) | | | 14,358 | | | | 132,668 | |
eHealth, Inc. (a) | | | 9,723 | | | | 452,022 | |
Employers Holdings, Inc. | | | 16,380 | | | | 518,427 | |
Enstar Group, Ltd. (a) | | | 4,820 | | | | 669,546 | |
FBL Financial Group, Inc. - Class A | | | 4,790 | | | | 214,544 | |
First American Financial Corp. (b) | | | 55,676 | | | | 1,570,063 | |
See accompanying notes to financial statements.
MSF-12
Metropolitan Series Fund
Russell 2000 Index Portfolio
Schedule of Investments as of December 31, 2013
Common Stocks—(Continued)
| | | | | | | | |
| Security Description | | Shares | | | Value | |
|
Insurance—(Continued) | |
Global Indemnity plc (a) | | | 3,228 | | | $ | 81,668 | |
Greenlight Capital Re, Ltd. - Class A (a) | | | 15,207 | | | | 512,628 | |
HCI Group, Inc. (b) | | | 5,174 | | | | 276,809 | |
Hilltop Holdings, Inc. (a) | | | 31,522 | | | | 729,104 | |
Horace Mann Educators Corp. | | | 21,022 | | | | 663,034 | |
Infinity Property & Casualty Corp. | | | 5,597 | | | | 401,585 | |
Kansas City Life Insurance Co. | | | 2,190 | | | | 104,551 | |
Maiden Holdings, Ltd. | | | 26,833 | | | | 293,285 | |
Meadowbrook Insurance Group, Inc. (b) | | | 26,803 | | | | 186,549 | |
Montpelier Re Holdings, Ltd. | | | 23,800 | | | | 692,580 | |
National Western Life Insurance Co. - Class A | | | 1,212 | | | | 270,943 | |
Navigators Group, Inc. (The) (a) | | | 5,301 | | | | 334,811 | |
OneBeacon Insurance Group, Ltd. - Class A | | | 11,496 | | | | 181,867 | |
Phoenix Cos., Inc. (The) (a) (b) | | | 3,332 | | | | 204,585 | |
Platinum Underwriters Holdings, Ltd. | | | 14,296 | | | | 876,059 | |
Primerica, Inc. | | | 28,650 | | | | 1,229,371 | |
RLI Corp. (b) | | | 10,795 | | | | 1,051,217 | |
Safety Insurance Group, Inc. | | | 6,815 | | | | 383,684 | |
Selective Insurance Group, Inc. | | | 28,514 | | | | 771,589 | |
State Auto Financial Corp. | | | 7,940 | | | | 168,646 | |
Stewart Information Services Corp. (b) | | | 11,286 | | | | 364,199 | |
Symetra Financial Corp. | | | 41,392 | | | | 784,792 | |
Third Point Reinsurance, Ltd. (a) | | | 15,817 | | | | 293,089 | |
United Fire Group, Inc. | | | 9,732 | | | | 278,919 | |
Universal Insurance Holdings, Inc. | | | 16,046 | | | | 232,346 | |
| | | | | | | | |
| | | | | | | 20,287,039 | |
| | | | | | | | |
|
Internet & Catalog Retail—0.4% | |
Blue Nile, Inc. (a) (b) | | | 6,605 | | | | 311,029 | |
FTD Cos., Inc. (a) (b) | | | 9,600 | | | | 312,768 | |
HSN, Inc. | | | 16,833 | | | | 1,048,696 | |
Nutrisystem, Inc. | | | 14,262 | | | | 234,467 | |
Overstock.com, Inc. (a) (b) | | | 6,499 | | | | 200,104 | |
PetMed Express, Inc. (b) | | | 11,281 | | | | 187,603 | |
RetailMeNot, Inc. (a) (b) | | | 5,972 | | | | 171,934 | |
Shutterfly, Inc. (a) (b) | | | 19,128 | | | | 974,189 | |
Valuevision Media, Inc. - Class A (a) | | | 21,040 | | | | 147,070 | |
| | | | | | | | |
| | | | | | | 3,587,860 | |
| | | | | | | | |
|
Internet Software & Services—2.9% | |
Angie’s List, Inc. (a) (b) | | | 21,237 | | | | 321,741 | |
Bankrate, Inc. (a) (b) | | | 24,648 | | | | 442,185 | |
Bazaarvoice, Inc. (a) (b) | | | 25,119 | | | | 198,942 | |
Benefitfocus, Inc. (a) (b) | | | 3,685 | | | | 212,772 | |
Blucora, Inc. (a) (b) | | | 20,338 | | | | 593,056 | |
Brightcove, Inc. (a) | | | 15,258 | | | | 215,748 | |
ChannelAdvisor Corp. (a) (b) | | | 3,321 | | | | 138,519 | |
comScore, Inc. (a) | | | 18,978 | | | | 542,961 | |
Constant Contact, Inc. (a) | | | 15,503 | | | | 481,678 | |
Cornerstone OnDemand, Inc. (a) | | | 20,352 | | | | 1,085,576 | |
CoStar Group, Inc. (a) | | | 14,394 | | | | 2,656,845 | |
Cvent, Inc. (a) (b) | | | 4,510 | | | | 164,119 | |
Dealertrack Technologies, Inc. (a) | | | 23,486 | | | | 1,129,207 | |
Demand Media, Inc. (a) (b) | | | 16,365 | | | | 94,426 | |
Demandware, Inc. (a) | | | 9,515 | | | | 610,102 | |
|
Internet Software & Services—(Continued) | |
Dice Holdings, Inc. (a) (b) | | | 16,579 | | | | 120,198 | |
Digital River, Inc. (a) | | | 21,084 | | | | 390,054 | |
E2open, Inc. (a) (b) | | | 7,997 | | | | 191,208 | |
EarthLink, Inc. | | | 52,967 | | | | 268,543 | |
Endurance International Group Holdings, Inc. (a) | | | 15,481 | | | | 219,521 | |
Envestnet, Inc. (a) | | | 11,705 | | | | 471,711 | |
Global Eagle Entertainment, Inc. (a) | | | 15,863 | | | | 235,883 | |
Gogo, Inc. (a) (b) | | | 7,988 | | | | 198,182 | |
Internap Network Services Corp. (a) | | | 29,790 | | | | 224,021 | |
IntraLinks Holdings, Inc. (a) | | | 25,608 | | | | 310,113 | |
j2 Global, Inc. (b) | | | 23,025 | | | | 1,151,480 | |
Liquidity Services, Inc. (a) (b) | | | 12,493 | | | | 283,091 | |
LivePerson, Inc. (a) (b) | | | 29,330 | | | | 434,671 | |
LogMeIn, Inc. (a) (b) | | | 11,813 | | | | 396,326 | |
Marchex, Inc. - Class B | | | 12,899 | | | | 111,576 | |
Marketo, Inc. (a) | | | 3,380 | | | | 125,297 | |
Millennial Media, Inc. (a) (b) | | | 18,853 | | | | 137,061 | |
Monster Worldwide, Inc. (a) | | | 59,471 | | | | 424,028 | |
Move, Inc. (a) | | | 21,815 | | | | 348,822 | |
NIC, Inc. | | | 33,146 | | | | 824,341 | |
OpenTable, Inc. (a) (b) | | | 11,648 | | | | 924,502 | |
Perficient, Inc. (a) | | | 17,369 | | | | 406,782 | |
QuinStreet, Inc. (a) (b) | | | 18,139 | | | | 157,628 | |
Responsys, Inc. (a) | | | 19,337 | | | | 530,027 | |
Rocket Fuel, Inc. (a) (b) | | | 3,561 | | | | 218,966 | |
SciQuest, Inc. (a) | | | 11,789 | | | | 335,751 | |
Shutterstock, Inc. (a) (b) | | | 3,831 | | | | 320,387 | |
SPS Commerce, Inc. (a) | | | 7,681 | | | | 501,569 | |
Stamps.com, Inc. (a) | | | 6,857 | | | | 288,680 | |
support.com, Inc. (a) | | | 27,508 | | | | 104,255 | |
Textura Corp. (a) (b) | | | 3,733 | | | | 111,766 | |
Trulia, Inc. (a) (b) | | | 14,268 | | | | 503,232 | |
United Online, Inc. (b) | | | 6,857 | | | | 94,352 | |
ValueClick, Inc. (a) (b) | | | 34,204 | | | | 799,347 | |
VistaPrint NV (a) (b) | | | 16,340 | | | | 928,929 | |
Vocus, Inc. (a) (b) | | | 10,713 | | | | 122,021 | |
Web.com Group, Inc. (a) | | | 21,320 | | | | 677,763 | |
WebMD Health Corp. (a) (b) | | | 16,653 | | | | 657,793 | |
Wix.com, Ltd. (a) | | | 6,469 | | | | 173,693 | |
XO Group, Inc. (a) | | | 17,057 | | | | 253,467 | |
Xoom Corp. (a) | | | 4,089 | | | | 111,916 | |
Yelp, Inc. (a) | | | 16,571 | | | | 1,142,570 | |
Zillow, Inc. - Class A (a) (b) | | | 11,762 | | | | 961,308 | |
Zix Corp. (a) (b) | | | 33,654 | | | | 153,462 | |
| | | | | | | | |
| | | | | | | 26,234,170 | |
| | | | | | | | |
|
IT Services—2.1% | |
Acxiom Corp. (a) | | | 37,591 | | | | 1,390,115 | |
Blackhawk Network Holdings, Inc. (a) (b) | | | 8,423 | | | | 212,765 | |
CACI International, Inc. - Class A (a) (b) (c) | | | 11,906 | | | | 871,757 | |
Cardtronics, Inc. (a) | | | 23,495 | | | | 1,020,858 | |
Cass Information Systems, Inc. (b) | | | 5,928 | | | | 399,251 | |
CIBER, Inc. (a) | | | 40,594 | | | | 168,059 | |
Computer Task Group, Inc. (b) | | | 8,399 | | | | 158,741 | |
Convergys Corp. (b) | | | 52,369 | | | | 1,102,367 | |
See accompanying notes to financial statements.
MSF-13
Metropolitan Series Fund
Russell 2000 Index Portfolio
Schedule of Investments as of December 31, 2013
Common Stocks—(Continued)
| | | | | | | | |
| Security Description | | Shares | | | Value | |
|
IT Services—(Continued) | |
CSG Systems International, Inc. | | | 18,310 | | | $ | 538,314 | |
EPAM Systems, Inc. (a) | | | 11,290 | | | | 394,473 | |
Euronet Worldwide, Inc. (a) | | | 25,270 | | | | 1,209,170 | |
EVERTEC, Inc. | | | 17,332 | | | | 427,407 | |
ExlService Holdings, Inc. (a) | | | 16,429 | | | | 453,769 | |
Forrester Research, Inc. | | | 5,782 | | | | 221,219 | |
Global Cash Access Holdings, Inc. (a) | | | 35,379 | | | | 353,436 | |
Heartland Payment Systems, Inc. (b) | | | 18,289 | | | | 911,524 | |
Higher One Holdings, Inc. (a) | | | 15,855 | | | | 154,745 | |
iGATE Corp. (a) | | | 17,995 | | | | 722,679 | |
Lionbridge Technologies, Inc. (a) | | | 32,857 | | | | 195,828 | |
ManTech International Corp. - Class A (b) | | | 12,440 | | | | 372,329 | |
MAXIMUS, Inc. | | | 34,354 | | | | 1,511,233 | |
ModusLink Global Solutions, Inc. (a) | | | 21,159 | | | | 121,241 | |
MoneyGram International, Inc. (a) | | | 11,813 | | | | 245,474 | |
PRGX Global, Inc. (a) | | | 15,346 | | | | 103,125 | |
Sapient Corp. (a) | | | 55,778 | | | | 968,306 | |
ServiceSource International, Inc. (a) (b) | | | 30,987 | | | | 259,671 | |
Sykes Enterprises, Inc. (a) | | | 20,461 | | | | 446,254 | |
Syntel, Inc. (a) | | | 7,981 | | | | 725,872 | |
TeleTech Holdings, Inc. (a) | | | 10,669 | | | | 255,416 | |
Unisys Corp. (a) (b) | | | 22,919 | | | | 769,391 | |
Virtusa Corp. (a) (b) | | | 10,720 | | | | 408,325 | |
WEX, Inc. (a) | | | 19,452 | | | | 1,926,332 | |
| | | | | | | | |
| | | | | | | 19,019,446 | |
| | | | | | | | |
|
Leisure Equipment & Products—0.5% | |
Arctic Cat, Inc. | | | 6,783 | | | | 386,495 | |
Black Diamond, Inc. (a) (b) | | | 10,974 | | | | 146,283 | |
Brunswick Corp. | | | 45,794 | | | | 2,109,272 | |
Callaway Golf Co. | | | 35,357 | | | | 298,060 | |
LeapFrog Enterprises, Inc. (a) (b) | | | 32,500 | | | | 258,050 | |
Nautilus, Inc. (a) (b) | | | 16,328 | | | | 137,645 | |
Smith & Wesson Holding Corp. (a) (b) | | | 32,012 | | | | 431,842 | |
Sturm Ruger & Co., Inc. (b) | | | 10,261 | | | | 749,976 | |
| | | | | | | | |
| | | | | | | 4,517,623 | |
| | | | | | | | |
|
Life Sciences Tools & Services—0.4% | |
Affymetrix, Inc. (a) (b) (c) | | | 41,239 | | | | 353,418 | |
Albany Molecular Research, Inc. (a) (b) | | | 12,484 | | | | 125,839 | |
Cambrex Corp. (a) | | | 15,180 | | | | 270,659 | |
Fluidigm Corp. (a) (b) | | | 15,271 | | | | 585,185 | |
Furiex Pharmaceuticals, Inc. (a) (b) | | | 3,553 | | | | 149,261 | |
Luminex Corp. (a) (b) | | | 18,464 | | | | 358,202 | |
Pacific Biosciences of California, Inc. (a) (b) | | | 27,011 | | | | 141,268 | |
PAREXEL International Corp. (a) | | | 28,945 | | | | 1,307,735 | |
Sequenom, Inc. (a) (b) | | | 62,512 | | | | 146,278 | |
| | | | | | | | |
| | | | | | | 3,437,845 | |
| | | | | | | | |
|
Machinery—3.1% | |
Actuant Corp. - Class A | | | 38,530 | | | | 1,411,739 | |
Alamo Group, Inc. | | | 3,532 | | | | 214,357 | |
Albany International Corp. - Class A | | | 14,147 | | | | 508,302 | |
Altra Industrial Motion Corp. | | | 14,458 | | | | 494,753 | |
American Railcar Industries, Inc. | | | 5,478 | | | | 250,619 | |
Astec Industries, Inc. | | | 10,141 | | | | 391,747 | |
|
Machinery—(Continued) | |
Barnes Group, Inc. (b) | | | 27,049 | | | | 1,036,247 | |
Blount International, Inc. (a) | | | 25,829 | | | | 373,746 | |
Briggs & Stratton Corp. (b) | | | 25,255 | | | | 549,549 | |
Chart Industries, Inc. (a) (b) | | | 15,307 | | | | 1,463,961 | |
CIRCOR International, Inc. | | | 8,835 | | | | 713,691 | |
CLARCOR, Inc. | | | 24,718 | | | | 1,590,603 | |
Columbus McKinnon Corp. (a) | | | 10,074 | | | | 273,408 | |
Douglas Dynamics, Inc. (b) | | | 9,877 | | | | 166,131 | |
Dynamic Materials Corp. (b) | | | 7,259 | | | | 157,811 | |
Energy Recovery, Inc. (a) (b) | | | 23,492 | | | | 130,616 | |
EnPro Industries, Inc. (a) (b) | | | 10,617 | | | | 612,070 | |
ESCO Technologies, Inc. | | | 13,728 | | | | 470,321 | |
ExOne Co. (The) (a) (b) | | | 3,282 | | | | 198,430 | |
Federal Signal Corp. (a) | | | 31,915 | | | | 467,555 | |
Flow International Corp. (a) | | | 25,785 | | | | 104,171 | |
FreightCar America, Inc. (b) | | | 7,047 | | | | 187,591 | |
Gerber Scientific, Inc. (a) (b) (d) | | | 14,024 | | | | 0 | |
Gorman-Rupp Co. (The) (b) | | | 10,331 | | | | 345,374 | |
Graham Corp. | | | 5,399 | | | | 195,930 | |
Greenbrier Cos., Inc. (a) (b) | | | 12,392 | | | | 406,953 | |
Hyster-Yale Materials Handling, Inc. | | | 5,945 | | | | 553,836 | |
John Bean Technologies Corp. | | | 15,202 | | | | 445,875 | |
Kadant, Inc. | | | 5,766 | | | | 233,638 | |
LB Foster Co. - Class A | | | 5,476 | | | | 258,960 | |
Lindsay Corp. (b) | | | 6,769 | | | | 560,135 | |
Lydall, Inc. (a) | | | 9,530 | | | | 167,919 | |
Manitex International, Inc. (a) (b) | | | 7,446 | | | | 118,242 | |
Meritor, Inc. (a) | | | 50,463 | | | | 526,329 | |
Middleby Corp. (The) (a) | | | 9,686 | | | | 2,324,349 | |
Miller Industries, Inc. | | | 6,185 | | | | 115,227 | |
Mueller Industries, Inc. | | | 14,168 | | | | 892,726 | |
Mueller Water Products, Inc. - Class A | | | 80,834 | | | | 757,415 | |
NN, Inc. | | | 9,533 | | | | 192,471 | |
Proto Labs, Inc. (a) (b) | | | 8,580 | | | | 610,724 | |
RBC Bearings, Inc. (a) | | | 11,531 | | | | 815,818 | |
Rexnord Corp. (a) (b) | | | 16,151 | | | | 436,239 | |
Standex International Corp. | | | 6,755 | | | | 424,754 | |
Sun Hydraulics Corp. | | | 10,558 | | | | 431,083 | |
Tennant Co. | | | 10,165 | | | | 689,289 | |
Titan International, Inc. (b) | | | 27,896 | | | | 501,570 | |
Trimas Corp. (a) | | | 22,514 | | | | 898,083 | |
Twin Disc, Inc. (b) | | | 4,666 | | | | 120,803 | |
Wabash National Corp. (a) (b) | | | 36,570 | | | | 451,640 | |
Watts Water Technologies, Inc. - Class A | | | 14,669 | | | | 907,571 | |
Woodward, Inc. | | | 35,858 | | | | 1,635,483 | |
| | | | | | | | |
| | | | | | | 27,785,854 | |
| | | | | | | | |
|
Marine—0.1% | |
Matson, Inc. | | | 21,468 | | | | 560,529 | |
| | | | | | | | |
|
Media—1.3% | |
Carmike Cinemas, Inc. (a) | | | 12,031 | | | | 334,943 | |
Central European Media Enterprises, Ltd. - Class A (a) (b) | | | 40,373 | | | | 155,032 | |
Cumulus Media, Inc. - Class A (a) | | | 45,781 | | | | 353,887 | |
Digital Generation, Inc. (a) (b) | | | 13,356 | | | | 170,289 | |
Entercom Communications Corp. -
Class A (a) (b) | | | 14,538 | | | | 152,794 | |
See accompanying notes to financial statements.
MSF-14
Metropolitan Series Fund
Russell 2000 Index Portfolio
Schedule of Investments as of December 31, 2013
Common Stocks—(Continued)
| | | | | | | | |
| Security Description | | Shares | | | Value | |
|
Media—(Continued) | |
Entravision Communications Corp. - Class A | | | 29,645 | | | $ | 180,538 | |
EW Scripps Co. - Class A (a) | | | 16,943 | | | | 368,002 | |
Gray Television, Inc. (a) (b) | | | 26,074 | | | | 387,981 | |
Harte-Hanks, Inc. | | | 19,287 | | | | 150,824 | |
Journal Communications, Inc. - Class A (a) | | | 24,659 | | | | 229,575 | |
Live Nation Entertainment, Inc. (a) | | | 70,048 | | | | 1,384,149 | |
Loral Space & Communications, Inc. (a) | | | 6,669 | | | | 540,056 | |
McClatchy Co. (The) - Class A (a) | | | 34,610 | | | | 117,674 | |
MDC Partners, Inc. - Class A | | | 19,484 | | | | 497,024 | |
Media General, Inc. (a) (b) | | | 10,457 | | | | 236,328 | |
Meredith Corp. | | | 18,123 | | | | 938,771 | |
National CineMedia, Inc. | | | 31,052 | | | | 619,798 | |
New York Times Co. (The) - Class A (b) | | | 63,935 | | | | 1,014,649 | |
Nexstar Broadcasting Group, Inc. - Class A | | | 14,830 | | | | 826,476 | |
Rentrak Corp. (a) (b) | | | 5,237 | | | | 198,430 | |
Saga Communications, Inc. - Class A | | | 2,853 | | | | 143,506 | |
Scholastic Corp. (b) | | | 14,077 | | | | 478,759 | |
SFX Entertainment, Inc. (a) (b) | | | 15,739 | | | | 188,868 | |
Sinclair Broadcast Group, Inc. - Class A (b) | | | 34,322 | | | | 1,226,325 | |
Valassis Communications, Inc. (b) | | | 20,868 | | | | 714,729 | |
World Wrestling Entertainment, Inc. - Class A | | | 13,534 | | | | 224,394 | |
| | | | | | | | |
| | | | | | | 11,833,801 | |
| | | | | | | | |
|
Metals & Mining—1.3% | |
AK Steel Holding Corp. (a) (b) | | | 70,804 | | | | 580,593 | |
Allied Nevada Gold Corp. (a) (b) | | | 53,266 | | | | 189,094 | |
A.M. Castle & Co. (a) (b) | | | 9,250 | | | | 136,623 | |
AMCOL International Corp. (b) | | | 14,133 | | | | 480,239 | |
Century Aluminum Co. (a) (b) | | | 26,722 | | | | 279,512 | |
Coeur Mining, Inc. (a) | | | 52,874 | | | | 573,683 | |
Commercial Metals Co. | | | 58,786 | | | | 1,195,119 | |
Globe Specialty Metals, Inc. | | | 33,146 | | | | 596,960 | |
Haynes International, Inc. | | | 6,653 | �� | | | 367,512 | |
Hecla Mining Co. (b) | | | 169,619 | | | | 522,427 | |
Horsehead Holding Corp. (a) (b) | | | 24,392 | | | | 395,394 | |
Kaiser Aluminum Corp. (b) | | | 9,689 | | | | 680,555 | |
Materion Corp. | | | 10,677 | | | | 329,385 | |
Molycorp, Inc. (a) (b) | | | 77,274 | | | | 434,280 | |
Olympic Steel, Inc. | | | 4,963 | | | | 143,828 | |
RTI International Metals, Inc. (a) | | | 16,034 | | | | 548,523 | |
Schnitzer Steel Industries, Inc. - Class A (b) | | | 13,529 | | | | 441,992 | |
Stillwater Mining Co. (a) | | | 61,243 | | | | 755,739 | |
SunCoke Energy, Inc. (a) | | | 35,308 | | | | 805,376 | |
U.S. Silica Holdings, Inc. | | | 11,101 | | | | 378,655 | |
Universal Stainless & Alloy Products, Inc. (a) | | | 4,303 | | | | 155,166 | |
Walter Energy, Inc. (b) | | | 32,001 | | | | 532,177 | |
Worthington Industries, Inc. | | | 26,842 | | | | 1,129,511 | |
| | | | | | | | |
| | | | | | | 11,652,343 | |
| | | | | | | | |
|
Multi-Utilities—0.3% | |
Avista Corp. (b) | | | 30,460 | | | | 858,667 | |
Black Hills Corp. | | | 22,534 | | | | 1,183,260 | |
NorthWestern Corp. | | | 19,221 | | | | 832,654 | |
| | | | | | | | |
| | | | | | | 2,874,581 | |
| | | | | | | | |
|
Multiline Retail—0.1% | |
Bon-Ton Stores, Inc. (The) | | | 7,498 | | | | 122,067 | |
Burlington Stores, Inc. (a) | | | 9,791 | | | | 313,312 | |
Fred’s, Inc. - Class A | | | 17,147 | | | | 317,563 | |
Tuesday Morning Corp. (a) (b) | | | 24,016 | | | | 383,295 | |
| | | | | | | | |
| | | | | | | 1,136,237 | |
| | | | | | | | |
|
Oil, Gas & Consumable Fuels—3.4% | |
Abraxas Petroleum Corp. (a) | | | 45,519 | | | | 149,302 | |
Alon USA Energy, Inc. | | | 12,159 | | | | 201,110 | |
Alpha Natural Resources, Inc. (a) (b) | | | 111,628 | | | | 797,024 | |
Approach Resources, Inc. (a) (b) | | | 17,593 | | | | 339,369 | |
Arch Coal, Inc. | | | 109,183 | | | | 485,864 | |
Athlon Energy, Inc. (a) | | | 10,483 | | | | 317,111 | |
Bill Barrett Corp. (a) (b) | | | 24,966 | | | | 668,590 | |
Bonanza Creek Energy, Inc. (a) | | | 14,894 | | | | 647,442 | |
BPZ Resources, Inc. (a) (b) | | | 63,498 | | | | 115,566 | |
Callon Petroleum Co. (a) | | | 21,984 | | | | 143,556 | |
Carrizo Oil & Gas, Inc. (a) | | | 23,060 | | | | 1,032,396 | |
Clayton Williams Energy, Inc. (a) | | | 3,222 | | | | 264,043 | |
Clean Energy Fuels Corp. (a) (b) | | | 35,238 | | | | 453,865 | |
Cloud Peak Energy, Inc. (a) | | | 31,583 | | | | 568,494 | |
Comstock Resources, Inc. (b) | | | 24,676 | | | | 451,324 | |
Contango Oil & Gas Co. (a) | | | 7,670 | | | | 362,484 | |
Crosstex Energy, Inc. | | | 24,128 | | | | 872,469 | |
Delek U.S. Holdings, Inc. | | | 18,779 | | | | 646,185 | |
Diamondback Energy, Inc. (a) | | | 9,479 | | | | 501,060 | |
Emerald Oil, Inc. (a) (b) | | | 29,558 | | | | 226,414 | |
Endeavour International Corp. (a) (b) | | | 27,855 | | | | 146,239 | |
Energy XXI Bermuda, Ltd. (b) | | | 40,250 | | | | 1,089,165 | |
EPL Oil & Gas, Inc. (a) | | | 15,648 | | | | 445,968 | |
Equal Energy, Ltd. | | | 19,151 | | | | 102,266 | |
Evolution Petroleum Corp. | | | 9,398 | | | | 115,971 | |
EXCO Resources, Inc. (b) | | | 68,713 | | | | 364,866 | |
Forest Oil Corp. (a) | | | 62,998 | | | | 227,423 | |
Frontline, Ltd. (a) | | | 28,049 | | | | 104,903 | |
FX Energy, Inc. (a) (b) | | | 29,231 | | | | 106,985 | |
GasLog, Ltd. | | | 14,308 | | | | 244,524 | |
Gastar Exploration, Ltd. (a) (b) | | | 33,900 | | | | 234,588 | |
Goodrich Petroleum Corp. (a) (b) | | | 16,155 | | | | 274,958 | |
Green Plains Renewable Energy, Inc. (b) | | | 14,691 | | | | 284,859 | |
Halcon Resources Corp. (a) (b) | | | 117,798 | | | | 454,700 | |
Knightsbridge Tankers, Ltd. | | | 13,531 | | | | 124,350 | |
Kodiak Oil & Gas Corp. (a) | | | 134,228 | | | | 1,504,696 | |
Magnum Hunter Resources Corp. (a) (b) | | | 87,944 | | | | 642,871 | |
Matador Resources Co. (a) | | | 29,440 | | | | 548,762 | |
Midstates Petroleum Co., Inc. (a) (b) | | | 18,106 | | | | 119,862 | |
Miller Energy Resources, Inc. (a) (b) | | | 16,902 | | | | 118,990 | |
Nordic American Tankers, Ltd. (b) | | | 38,792 | | | | 376,282 | |
Northern Oil and Gas, Inc. (a) (b) | | | 32,713 | | | | 492,985 | |
Panhandle Oil and Gas, Inc. - Class A (b) | | | 3,108 | | | | 103,838 | |
PDC Energy, Inc. (a) | | | 17,964 | | | | 956,044 | |
Penn Virginia Corp. (a) | | | 25,144 | | | | 237,108 | |
PetroQuest Energy, Inc. (a) | | | 28,823 | | | | 124,515 | |
Quicksilver Resources, Inc. (a) (b) | | | 69,322 | | | | 212,819 | |
Renewable Energy Group, Inc. (a) | | | 11,111 | | | | 127,332 | |
Rentech, Inc. (a) (b) | | | 117,208 | | | | 205,114 | |
See accompanying notes to financial statements.
MSF-15
Metropolitan Series Fund
Russell 2000 Index Portfolio
Schedule of Investments as of December 31, 2013
Common Stocks—(Continued)
| | | | | | | | |
| Security Description | | Shares | | | Value | |
|
Oil, Gas & Consumable Fuels—(Continued) | |
Resolute Energy Corp. (a) (b) | | | 32,333 | | | $ | 291,967 | |
REX American Resources Corp. (a) | | | 2,900 | | | | 129,659 | |
Rex Energy Corp. (a) | | | 22,443 | | | | 442,352 | |
Rosetta Resources, Inc. (a) | | | 30,879 | | | | 1,483,427 | |
Sanchez Energy Corp. (a) (b) | | | 19,248 | | | | 471,769 | |
Scorpio Tankers, Inc. | | | 92,909 | | | | 1,095,397 | |
SemGroup Corp. - Class A | | | 21,575 | | | | 1,407,337 | |
Ship Finance International, Ltd. (b) | | | 28,428 | | | | 465,651 | |
Solazyme, Inc. (a) (b) | | | 24,576 | | | | 267,633 | |
Stone Energy Corp. (a) | | | 25,118 | | | | 868,832 | |
Swift Energy Co. (a) (b) | | | 22,073 | | | | 297,986 | |
Synergy Resources Corp. (a) | | | 23,066 | | | | 213,591 | |
Targa Resources Corp. | | | 16,514 | | | | 1,456,039 | |
Teekay Tankers, Ltd. - Class A | | | 33,608 | | | | 132,079 | |
Triangle Petroleum Corp. (a) (b) | | | 35,098 | | | | 292,015 | |
Vaalco Energy, Inc. (a) | | | 28,122 | | | | 193,761 | |
W&T Offshore, Inc. (b) | | | 18,499 | | | | 295,984 | |
Warren Resources, Inc. (a) | | | 41,839 | | | | 131,374 | |
Western Refining, Inc. (b) | | | 28,188 | | | | 1,195,453 | |
| | | | | | | | |
| | | | | | | 30,468,957 | |
| | | | | | | | |
|
Paper & Forest Products—0.7% | |
Boise Cascade Co. (a) | | | 6,669 | | | | 196,602 | |
Clearwater Paper Corp. (a) | | | 11,093 | | | | 582,382 | |
Deltic Timber Corp. | | | 6,001 | | | | 407,708 | |
KapStone Paper and Packaging Corp. (a) | | | 21,154 | | | | 1,181,662 | |
Louisiana-Pacific Corp. (a) | | | 69,384 | | | | 1,284,298 | |
Neenah Paper, Inc. | | | 7,745 | | | | 331,254 | |
PH Glatfelter Co. | | | 21,278 | | | | 588,124 | |
Resolute Forest Products, Inc. (a) | | | 33,917 | | | | 543,350 | |
Schweitzer-Mauduit International, Inc. | | | 15,980 | | | | 822,491 | |
Wausau Paper Corp. | | | 23,588 | | | | 299,096 | |
| | | | | | | | |
| | | | | | | 6,236,967 | |
| | | | | | | | |
|
Personal Products—0.2% | |
Elizabeth Arden, Inc. (a) (b) | | | 13,201 | | | | 467,975 | |
Inter Parfums, Inc. | | | 8,191 | | | | 293,320 | |
Medifast, Inc. (a) (b) | | | 7,275 | | | | 190,096 | |
Nature’s Sunshine Products, Inc. | | | 5,787 | | | | 100,231 | |
Nutraceutical International Corp. (a) | | | 5,375 | | | | 143,943 | |
Revlon, Inc. - Class A (a) (b) | | | 6,172 | | | | 154,053 | |
Star Scientific, Inc. (a) (b) | | | 87,814 | | | | 101,864 | |
USANA Health Sciences, Inc. (a) (b) | | | 2,893 | | | | 218,653 | |
| | | | | | | | |
| | | | | | | 1,670,135 | |
| | | | | | | | |
| | |
Pharmaceuticals—1.6% | | | | | | | | |
AcelRx Pharmaceuticals, Inc. (a) (b) | | | 13,182 | | | | 149,088 | |
Akorn, Inc. (a) (b) | | | 32,384 | | | | 797,618 | |
Ampio Pharmaceuticals, Inc. (a) (b) | | | 15,630 | | | | 111,442 | |
Auxilium Pharmaceuticals, Inc. (a) (b) | | | 24,788 | | | | 514,103 | |
AVANIR Pharmaceuticals, Inc. - Class A (a) (b) | | | 74,656 | | | | 250,844 | |
Cadence Pharmaceuticals, Inc. (a) | | | 28,947 | | | | 261,970 | |
Cempra, Inc. (a) (b) | | | 11,324 | | | | 140,304 | |
Depomed, Inc. (a) (b) | | | 31,001 | | | | 327,991 | |
Endocyte, Inc. (a) (b) | | | 16,647 | | | | 177,956 | |
|
Pharmaceuticals—(Continued) | |
Hi-Tech Pharmacal Co., Inc. (a) | | | 6,764 | | | | 293,490 | |
Horizon Pharma, Inc. (a) (b) | | | 29,283 | | | | 223,137 | |
Impax Laboratories, Inc. (a) | | | 33,899 | | | | 852,221 | |
Lannett Co., Inc. (a) | | | 9,646 | | | | 319,283 | |
Medicines Co. (The) (a) | | | 32,038 | | | | 1,237,308 | |
Nektar Therapeutics (a) (b) | | | 61,506 | | | | 698,093 | |
Omeros Corp. (a) (b) | | | 16,069 | | | | 181,419 | |
Pacira Pharmaceuticals, Inc. (a) | | | 14,109 | | | | 811,126 | |
Pozen, Inc. (a) | | | 15,222 | | | | 122,385 | |
Prestige Brands Holdings, Inc. (a) | | | 26,054 | | | | 932,733 | |
Questcor Pharmaceuticals, Inc. (b) | | | 26,072 | | | | 1,419,620 | |
Repros Therapeutics, Inc. (a) (b) | | | 12,184 | | | | 222,967 | |
Sagent Pharmaceuticals, Inc. (a) (b) | | | 12,853 | | | | 326,209 | |
Santarus, Inc. (a) | | | 31,053 | | | | 992,454 | |
Sciclone Pharmaceuticals, Inc. (a) | | | 31,065 | | | | 156,568 | |
TherapeuticsMD, Inc. (a) | | | 55,042 | | | | 286,769 | |
ViroPharma, Inc. (a) | | | 32,748 | | | | 1,632,488 | |
Vivus, Inc. (a) (b) | | | 52,768 | | | | 479,133 | |
XenoPort, Inc. (a) (b) | | | 20,130 | | | | 115,748 | |
Zogenix, Inc. (a) (b) | | | 41,508 | | | | 142,788 | |
| | | | | | | | |
| | | | | | | 14,177,255 | |
| | | | | | | | |
|
Professional Services—1.3% | |
Acacia Research Corp. (b) | | | 26,332 | | | | 382,867 | |
Advisory Board Co. (The) (a) | | | 18,149 | | | | 1,155,547 | |
Barrett Business Services, Inc. | | | 3,901 | | | | 361,779 | |
CBIZ, Inc. (a) (b) | | | 20,130 | | | | 183,586 | |
CDI Corp. | | | 7,746 | | | | 143,533 | |
Corporate Executive Board Co. (The) | | | 17,121 | | | | 1,325,679 | |
CRA International, Inc. (a) | | | 6,362 | | | | 125,968 | |
Exponent, Inc. | | | 6,721 | | | | 520,474 | |
Franklin Covey Co. (a) | | | 5,203 | | | | 103,436 | |
FTI Consulting, Inc. (a) | | | 21,757 | | | | 895,083 | |
GP Strategies Corp. (a) | | | 8,646 | | | | 257,564 | |
Heidrick & Struggles International, Inc. | | | 9,634 | | | | 194,029 | |
Huron Consulting Group, Inc. (a) | | | 11,680 | | | | 732,570 | |
ICF International, Inc. (a) | | | 10,002 | | | | 347,169 | |
Insperity, Inc. | | | 12,162 | | | | 439,413 | |
Kelly Services, Inc. - Class A | | | 14,944 | | | | 372,703 | |
Kforce, Inc. | | | 12,290 | | | | 251,453 | |
Korn/Ferry International (a) | | | 24,691 | | | | 644,929 | |
Mistras Group, Inc. (a) | | | 8,222 | | | | 171,675 | |
Navigant Consulting, Inc. (a) | | | 27,414 | | | | 526,349 | |
On Assignment, Inc. (a) | | | 22,889 | | | | 799,284 | |
Pendrell Corp. (a) | | | 84,143 | | | | 169,127 | |
Resources Connection, Inc. | | | 20,687 | | | | 296,445 | |
RPX Corp. (a) | | | 16,455 | | | | 278,089 | |
TrueBlue, Inc. (a) | | | 19,573 | | | | 504,592 | |
VSE Corp. | | | 2,185 | | | | 104,902 | |
WageWorks, Inc. (a) | | | 12,583 | | | | 747,934 | |
| | | | | | | | |
| | | | | | | 12,036,179 | |
| | | | | | | | |
|
Real Estate Investment Trusts—6.8% | |
Acadia Realty Trust | | | 27,899 | | | | 692,732 | |
AG Mortgage Investment Trust, Inc. (b) | | | 14,345 | | | | 224,356 | |
Agree Realty Corp. | | | 6,955 | | | | 201,834 | |
See accompanying notes to financial statements.
MSF-16
Metropolitan Series Fund
Russell 2000 Index Portfolio
Schedule of Investments as of December 31, 2013
Common Stocks—(Continued)
| | | | | | | | |
| Security Description | | Shares | | | Value | |
|
Real Estate Investment Trusts—(Continued) | |
Alexander’s, Inc. | | | 1,140 | | | $ | 376,200 | |
American Assets Trust, Inc. | | | 17,413 | | | | 547,291 | |
American Capital Mortgage Investment Corp. | | | 30,954 | | | | 540,457 | |
American Realty Capital Properties, Inc. (b) | | | 77,373 | | | | 995,017 | |
American Residential Properties, Inc. (a) | | | 9,701 | | | | 166,469 | |
AmREIT, Inc. (b) | | | 8,595 | | | | 144,396 | |
Anworth Mortgage Asset Corp. | | | 71,422 | | | | 300,687 | |
Apollo Commercial Real Estate Finance, Inc. | | | 22,194 | | | | 360,653 | |
Apollo Residential Mortgage, Inc. (b) | | | 16,439 | | | | 242,968 | |
Ares Commercial Real Estate Corp. | | | 11,438 | | | | 149,838 | |
ARMOUR Residential REIT, Inc. (b) | | | 189,819 | | | | 761,174 | |
Ashford Hospitality Prime, Inc. | | | 6,326 | | | | 115,133 | |
Ashford Hospitality Trust, Inc. | | | 31,632 | | | | 261,913 | |
Associated Estates Realty Corp. | | | 29,461 | | | | 472,849 | |
Aviv REIT, Inc. | | | 6,229 | | | | 147,627 | |
Campus Crest Communities, Inc. (b) | | | 33,908 | | | | 319,074 | |
Capstead Mortgage Corp. (b) | | | 53,174 | | | | 642,342 | |
Cedar Realty Trust, Inc. | | | 37,954 | | | | 237,592 | |
Chambers Street Properties (b) | | | 118,956 | | | | 910,013 | |
Chatham Lodging Trust | | | 16,329 | | | | 333,928 | |
Chesapeake Lodging Trust | | | 25,632 | | | | 648,233 | |
Colony Financial, Inc. (b) | | | 39,170 | | | | 794,759 | |
Coresite Realty Corp. (b) | | | 10,812 | | | | 348,038 | |
Cousins Properties, Inc. | | | 85,111 | | | | 876,643 | |
CubeSmart | | | 67,626 | | | | 1,077,958 | |
CyrusOne, Inc. | | | 11,074 | | | | 247,282 | |
CYS Investments, Inc. (b) | | | 92,035 | | | | 681,979 | |
DCT Industrial Trust, Inc. | | | 142,805 | | | | 1,018,200 | |
DiamondRock Hospitality Co. | | | 99,299 | | | | 1,146,904 | |
DuPont Fabros Technology, Inc. (b) | | | 32,563 | | | | 804,632 | |
Dynex Capital, Inc. (b) | | | 28,987 | | | | 231,896 | |
EastGroup Properties, Inc. (b) | | | 15,137 | | | | 876,886 | |
Education Realty Trust, Inc. | | | 59,817 | | | | 527,586 | |
Empire State Realty Trust, Inc. - Class A | | | 45,644 | | | | 698,353 | |
EPR Properties | | | 26,203 | | | | 1,288,140 | |
Equity One, Inc. | | | 30,429 | | | | 682,827 | |
Excel Trust, Inc. | | | 23,675 | | | | 269,658 | |
FelCor Lodging Trust, Inc. (a) (b) | | | 63,841 | | | | 520,943 | |
First Industrial Realty Trust, Inc. | | | 55,940 | | | | 976,153 | |
First Potomac Realty Trust | | | 30,465 | | | | 354,308 | |
Franklin Street Properties Corp. | | | 45,751 | | | | 546,724 | |
GEO Group, Inc. (The) | | | 36,840 | | | | 1,186,985 | |
Getty Realty Corp. | | | 13,375 | | | | 245,699 | |
Gladstone Commercial Corp. (b) | | | 10,038 | | | | 180,383 | |
Glimcher Realty Trust | | | 73,142 | | | | 684,609 | |
Government Properties Income Trust (b) | | | 27,626 | | | | 686,506 | |
Gramercy Property Trust, Inc. (a) (b) | | | 26,297 | | | | 151,208 | |
Hannon Armstrong Sustainable Infrastructure Capital, Inc. (b) | | | 8,347 | | | | 116,524 | |
Healthcare Realty Trust, Inc. | | | 48,466 | | | | 1,032,811 | |
Hersha Hospitality Trust | | | 102,691 | | | | 571,989 | |
Highwoods Properties, Inc. (b) | | | 45,234 | | | | 1,636,114 | |
Hudson Pacific Properties, Inc. | | | 22,736 | | | | 497,236 | |
Inland Real Estate Corp. | | | 40,919 | | | | 430,468 | |
Invesco Mortgage Capital, Inc. | | | 69,617 | | | | 1,021,978 | |
Investors Real Estate Trust | | | 51,434 | | | | 441,304 | |
|
Real Estate Investment Trusts—(Continued) | |
iStar Financial, Inc. (a) (b) | | | 42,568 | | | | 607,445 | |
Kite Realty Group Trust | | | 67,776 | | | | 445,288 | |
LaSalle Hotel Properties | | | 52,656 | | | | 1,624,964 | |
Lexington Realty Trust (b) | | | 91,347 | | | | 932,653 | |
LTC Properties, Inc. | | | 18,082 | | | | 639,922 | |
Medical Properties Trust, Inc. | | | 81,685 | | | | 998,191 | |
Monmouth Real Estate Investment Corp. - Class A | | | 21,915 | | | | 199,207 | |
National Health Investors, Inc. | | | 14,922 | | | | 837,124 | |
New Residential Investment Corp. | | | 128,973 | | | | 861,540 | |
New York Mortgage Trust, Inc. (b) | | | 34,441 | | | | 240,743 | |
NorthStar Realty Finance Corp. (b) | | | 147,073 | | | | 1,978,132 | |
One Liberty Properties, Inc. | | | 6,290 | | | | 126,618 | |
Parkway Properties, Inc. | | | 28,720 | | | | 554,006 | |
Pebblebrook Hotel Trust | | | 31,889 | | | | 980,906 | |
Pennsylvania Real Estate Investment Trust | | | 35,457 | | | | 672,974 | |
PennyMac Mortgage Investment Trust | | | 35,722 | | | | 820,177 | |
Physicians Realty Trust | | | 11,109 | | | | 141,529 | |
Potlatch Corp. | | | 20,535 | | | | 857,131 | |
PS Business Parks, Inc. | | | 9,958 | | | | 760,990 | |
QTS Realty Trust, Inc. - Class A (b) | | | 10,025 | | | | 248,420 | |
RAIT Financial Trust (b) | | | 37,240 | | | | 334,043 | |
Ramco-Gershenson Properties Trust | | | 34,345 | | | | 540,590 | |
Redwood Trust, Inc. (b) | | | 42,013 | | | | 813,792 | |
Resource Capital Corp. (b) | | | 65,666 | | | | 389,399 | |
Retail Opportunity Investments Corp. (b) | | | 34,893 | | | | 513,625 | |
Rexford Industrial Realty, Inc. | | | 11,822 | | | | 156,050 | |
RLJ Lodging Trust | | | 63,634 | | | | 1,547,579 | |
Rouse Properties, Inc. (b) | | | 12,233 | | | | 271,450 | |
Ryman Hospitality Properties (b) | | | 22,239 | | | | 929,145 | |
Sabra Health Care REIT, Inc. (b) | | | 19,024 | | | | 497,287 | |
Saul Centers, Inc. | | | 4,164 | | | | 198,748 | |
Select Income REIT | | | 11,322 | | | | 302,750 | |
Silver Bay Realty Trust Corp. (b) | | | 8,199 | | | | 131,102 | |
Sovran Self Storage, Inc. | | | 16,549 | | | | 1,078,498 | |
STAG Industrial, Inc. | | | 21,343 | | | | 435,184 | |
Strategic Hotels & Resorts, Inc. (a) | | | 95,154 | | | | 899,205 | |
Summit Hotel Properties, Inc. | | | 40,984 | | | | 368,856 | |
Sun Communities, Inc. | | | 18,181 | | | | 775,238 | |
Sunstone Hotel Investors, Inc. | | | 93,140 | | | | 1,248,076 | |
Terreno Realty Corp. | | | 13,034 | | | | 230,702 | |
Universal Health Realty Income Trust | | | 6,109 | | | | 244,727 | |
Urstadt Biddle Properties, Inc. - Class A | | | 13,207 | | | | 243,669 | |
Washington Real Estate Investment Trust (b) | | | 33,712 | | | | 787,512 | |
Western Asset Mortgage Capital Corp. (b) | | | 10,783 | | | | 160,451 | |
Whitestone REIT | | | 9,141 | | | | 122,215 | |
Winthrop Realty Trust | | | 15,621 | | | | 172,612 | |
| | | | | | | | |
| | | | | | | 60,566,924 | |
| | | | | | | | |
|
Real Estate Management & Development—0.4% | |
Alexander & Baldwin, Inc. | | | 21,692 | | | | 905,207 | |
Altisource Residential Corp. (b) | | | 21,688 | | | | 653,026 | |
Consolidated-Tomoka Land Co. | | | 2,461 | | | | 89,310 | |
Forestar Group, Inc. (a) | | | 17,933 | | | | 381,435 | |
Kennedy-Wilson Holdings, Inc. (b) | | | 28,809 | | | | 641,000 | |
RE/MAX Holdings, Inc. - Class A (a) | | | 7,926 | | | | 254,187 | |
See accompanying notes to financial statements.
MSF-17
Metropolitan Series Fund
Russell 2000 Index Portfolio
Schedule of Investments as of December 31, 2013
Common Stocks—(Continued)
| | | | | | | | |
| Security Description | | Shares | | | Value | |
|
Real Estate Management & Development—(Continued) | |
Tejon Ranch Co. (a) | | | 7,566 | | | $ | 278,126 | |
| | | | | | | | |
| | | | | | | 3,202,291 | |
| | | | | | | | |
|
Road & Rail—0.5% | |
Arkansas Best Corp. | | | 13,889 | | | | 467,781 | |
Celadon Group, Inc. | | | 9,437 | | | | 183,833 | |
Heartland Express, Inc. (b) | | | 23,452 | | | | 460,128 | |
Knight Transportation, Inc. (b) | | | 29,563 | | | | 542,185 | |
Marten Transport, Ltd. | | | 13,224 | | | | 266,993 | |
Patriot Transportation Holding, Inc. (a) | | | 3,479 | | | | 144,413 | |
Quality Distribution, Inc. (a) | | | 11,883 | | | | 152,459 | |
Roadrunner Transportation Systems, Inc. (a) | | | 9,507 | | | | 256,214 | |
Saia, Inc. (a) | | | 11,835 | | | | 379,312 | |
Swift Transportation Co. (a) (b) | | | 41,048 | | | | 911,676 | |
Werner Enterprises, Inc. (b) | | | 23,073 | | | | 570,595 | |
| | | | | | | | |
| | | | | | | 4,335,589 | |
| | | | | | | | |
|
Semiconductors & Semiconductor Equipment—3.2% | |
Advanced Energy Industries, Inc. (a) | | | 20,778 | | | | 474,985 | |
Ambarella, Inc. (a) (b) | | | 9,901 | | | | 335,941 | |
Amkor Technology, Inc. (a) (b) | | | 37,843 | | | | 231,978 | |
Applied Micro Circuits Corp. (a) (b) | | | 37,494 | | | | 501,670 | |
ATMI, Inc. (a) | | | 16,612 | | | | 501,849 | |
Axcelis Technologies, Inc. (a) | | | 59,771 | | | | 145,841 | |
Brooks Automation, Inc. | | | 36,289 | | | | 380,672 | |
Cabot Microelectronics Corp. (a) | | | 12,507 | | | | 571,570 | |
Cavium, Inc. (a) (b) | | | 26,390 | | | | 910,719 | |
Ceva, Inc. (a) (b) | | | 13,754 | | | | 209,336 | |
Cirrus Logic, Inc. (a) (b) | | | 34,893 | | | | 712,864 | |
Cohu, Inc. | | | 11,848 | | | | 124,404 | |
Cypress Semiconductor Corp. (a) (b) | | | 74,272 | | | | 779,856 | |
Diodes, Inc. (a) | | | 18,315 | | | | 431,501 | |
DSP Group, Inc. (a) | | | 11,372 | | | | 110,422 | |
Entegris, Inc. (a) | | | 70,530 | | | | 818,148 | |
Entropic Communications, Inc. (a) (b) | | | 44,392 | | | | 209,086 | |
Exar Corp. (a) (c) | | | 20,123 | | | | 237,250 | |
FormFactor, Inc. (a) (c) | | | 27,182 | | | | 163,636 | |
GT Advanced Technologies, Inc. (a) (b) | | | 68,436 | | | | 596,762 | |
Hittite Microwave Corp. (a) | | | 16,228 | | | | 1,001,754 | |
Inphi Corp. (a) | | | 13,845 | | | | 178,601 | |
Integrated Device Technology, Inc. (a) | | | 67,574 | | | | 688,579 | |
Integrated Silicon Solution, Inc. (a) | | | 14,137 | | | | 170,916 | |
International Rectifier Corp. (a) | | | 35,512 | | | | 925,798 | |
Intersil Corp. - Class A | | | 65,241 | | | | 748,314 | |
IXYS Corp. | | | 13,771 | | | | 178,610 | |
Kopin Corp. (a) (b) | | | 34,528 | | | | 145,708 | |
Lattice Semiconductor Corp. (a) | | | 61,578 | | | | 339,295 | |
LTX-Credence Corp. (a) | | | 26,473 | | | | 211,519 | |
MaxLinear, Inc. - Class A (a) | | | 12,849 | | | | 134,015 | |
Micrel, Inc. | | | 25,489 | | | | 251,576 | |
Microsemi Corp. (a) | | | 47,110 | | | | 1,175,395 | |
MKS Instruments, Inc. | | | 27,174 | | | | 813,590 | |
Monolithic Power Systems, Inc. (a) | | | 18,772 | | | | 650,638 | |
MoSys, Inc. (a) (b) | | | 20,074 | | | | 110,808 | |
Nanometrics, Inc. (a) | | | 12,771 | | | | 243,288 | |
NVE Corp. (a) (b) | | | 2,605 | | | | 151,819 | |
|
Semiconductors & Semiconductor Equipment—(Continued) | |
OmniVision Technologies, Inc. (a) (b) | | | 26,397 | | | | 454,028 | |
PDF Solutions, Inc. (a) (b) | | | 13,439 | | | | 344,307 | |
Peregrine Semiconductor Corp. (a) (b) | | | 14,176 | | | | 105,044 | |
Pericom Semiconductor Corp. (a) | | | 13,974 | | | | 123,810 | |
Photronics, Inc. (a) (b) | | | 30,362 | | | | 274,169 | |
PLX Technology, Inc. (a) | | | 23,066 | | | | 151,774 | |
PMC - Sierra, Inc. (a) | | | 103,361 | | | | 664,611 | |
Power Integrations, Inc. | | | 14,941 | | | | 834,007 | |
Rambus, Inc. (a) (b) | | | 59,232 | | | | 560,927 | |
RF Micro Devices, Inc. (a) | | | 144,045 | | | | 743,272 | |
Rudolph Technologies, Inc. (a) | | | 18,288 | | | | 214,701 | |
Semtech Corp. (a) | | | 34,355 | | | | 868,494 | |
Silicon Image, Inc. (a) | | | 41,704 | | | | 256,480 | |
Spansion, Inc. - Class A (a) (b) | | | 26,069 | | | | 362,098 | |
SunEdison, Inc. (a) (b) | | | 133,724 | | | | 1,745,098 | |
SunPower Corp. (a) (b) | | | 21,029 | | | | 626,874 | |
Supertex, Inc. (a) | | | 4,577 | | | | 114,654 | |
Synaptics, Inc. (a) (b) | | | 15,998 | | | | 828,856 | |
Tessera Technologies, Inc. | | | 27,229 | | | | 536,684 | �� |
TriQuint Semiconductor, Inc. (a) (c) | | | 79,628 | | | | 664,098 | |
Ultra Clean Holdings, Inc. (a) | | | 13,513 | | | | 135,535 | |
Ultratech, Inc. (a) (b) | | | 13,618 | | | | 394,922 | |
Veeco Instruments, Inc. (a) | | | 20,425 | | | | 672,187 | |
| | | | | | | | |
| | | | | | | 28,245,343 | |
| | | | | | | | |
|
Software—3.9% | |
Accelrys, Inc. (a) | | | 31,619 | | | | 301,645 | |
ACI Worldwide, Inc. (a) | | | 20,289 | | | | 1,318,785 | |
Actuate Corp. (a) | | | 24,071 | | | | 185,587 | |
Advent Software, Inc. (b) | | | 16,892 | | | | 591,051 | |
American Software, Inc. - Class A | | | 12,761 | | | | 125,951 | |
Aspen Technology, Inc. (a) | | | 46,847 | | | | 1,958,205 | |
AVG Technologies NV (a) (b) | | | 12,487 | | | | 214,901 | |
Blackbaud, Inc. | | | 23,345 | | | | 878,939 | |
Bottomline Technologies de, Inc. (a) (b) | | | 19,170 | | | | 693,187 | |
BroadSoft, Inc. (a) | | | 14,701 | | | | 401,925 | |
Callidus Software, Inc. (a) (b) | | | 20,244 | | | | 277,950 | |
CommVault Systems, Inc. (a) | | | 23,645 | | | | 1,770,538 | |
Comverse, Inc. (a) | | | 11,872 | | | | 460,634 | |
Ebix, Inc. (b) | | | 16,296 | | | | 239,877 | |
Ellie Mae, Inc. (a) (b) | | | 13,561 | | | | 364,384 | |
EPIQ Systems, Inc. | | | 17,942 | | | | 290,840 | |
ePlus, Inc. (a) | | | 2,282 | | | | 129,709 | |
Fair Isaac Corp. | | | 18,244 | | | | 1,146,453 | |
FleetMatics Group plc (a) (b) | | | 8,467 | | | | 366,198 | |
Gigamon, Inc. (a) | | | 5,056 | | | | 141,972 | |
Glu Mobile, Inc. (a) (b) | | | 35,393 | | | | 137,679 | |
Guidewire Software, Inc. (a) | | | 24,807 | | | | 1,217,279 | |
Imperva, Inc. (a) | | | 10,304 | | | | 495,931 | |
Infoblox, Inc. (a) | | | 27,141 | | | | 896,196 | |
Interactive Intelligence Group, Inc. (a) | | | 7,901 | | | | 532,211 | |
Jive Software, Inc. (a) | | | 20,334 | | | | 228,757 | |
Manhattan Associates, Inc. (a) | | | 9,835 | | | | 1,155,416 | |
Mentor Graphics Corp. | | | 48,583 | | | | 1,169,393 | |
MicroStrategy, Inc. - Class A (a) | | | 4,507 | | | | 559,950 | |
Monotype Imaging Holdings, Inc. | | | 21,574 | | | | 687,348 | |
See accompanying notes to financial statements.
MSF-18
Metropolitan Series Fund
Russell 2000 Index Portfolio
Schedule of Investments as of December 31, 2013
Common Stocks—(Continued)
| | | | | | | | |
| Security Description | | Shares | | | Value | |
|
Software—(Continued) | |
Netscout Systems, Inc. (a) | | | 19,351 | | | $ | 572,596 | |
Pegasystems, Inc. (b) | | | 10,470 | | | | 514,915 | |
Progress Software Corp. (a) | | | 29,256 | | | | 755,682 | |
Proofpoint, Inc. (a) | | | 11,322 | | | | 375,551 | |
PROS Holdings, Inc. (a) | | | 11,234 | | | | 448,237 | |
PTC, Inc. (a) (c) | | | 60,661 | | | | 2,146,793 | |
QLIK Technologies, Inc. (a) | | | 46,199 | | | | 1,230,279 | |
Qualys, Inc. (a) | | | 8,124 | | | | 187,746 | |
RealPage, Inc. (a) (b) | | | 23,771 | | | | 555,766 | |
SeaChange International, Inc. (a) | | | 15,237 | | | | 185,282 | |
SS&C Technologies Holdings, Inc. (a) | | | 29,343 | | | | 1,298,721 | |
Synchronoss Technologies, Inc. (a) | | | 14,183 | | | | 440,666 | |
Take-Two Interactive Software, Inc. (a) | | | 41,777 | | | | 725,666 | |
Tangoe, Inc. (a) (b) | | | 15,994 | | | | 288,052 | |
TiVo, Inc. (a) | | | 63,638 | | | | 834,931 | |
Tyler Technologies, Inc. (a) | | | 15,971 | | | | 1,631,118 | |
Ultimate Software Group, Inc. (a) | | | 13,861 | | | | 2,123,782 | |
VASCO Data Security International, Inc. (a) (b) | | | 15,031 | | | | 116,190 | |
Verint Systems, Inc. (a) | | | 26,550 | | | | 1,140,057 | |
VirnetX Holding Corp. (a) (b) | | | 22,272 | | | | 432,300 | |
Vringo, Inc. (a) (b) | | | 36,972 | | | | 109,437 | |
| | | | | | | | |
| | | | | | | 35,052,658 | |
| | | | | | | | |
|
Specialty Retail—3.3% | |
Aeropostale, Inc. (a) (b) | | | 41,826 | | | | 380,198 | |
America’s Car-Mart, Inc. (a) (b) | | | 3,580 | | | | 151,183 | |
ANN, Inc. (a) | | | 23,136 | | | | 845,852 | |
Asbury Automotive Group, Inc. (a) | | | 15,706 | | | | 844,040 | |
Barnes & Noble, Inc. (a) | | | 20,590 | | | | 307,821 | |
bebe stores, Inc. (b) | | | 19,159 | | | | 101,926 | |
Big 5 Sporting Goods Corp. | | | 10,090 | | | | 199,984 | |
Brown Shoe Co., Inc. | | | 23,566 | | | | 663,147 | |
Buckle, Inc. (The) (b) | | | 14,188 | | | | 745,721 | |
Cato Corp. (The) - Class A | | | 14,157 | | | | 450,193 | |
Children’s Place Retail Stores, Inc. (The) (a) | | | 12,666 | | | | 721,582 | |
Christopher & Banks Corp. (a) | | | 19,194 | | | | 163,917 | |
Citi Trends, Inc. (a) | | | 8,551 | | | | 145,367 | |
Conn’s, Inc. (a) | | | 11,320 | | | | 891,903 | |
Container Store Group, Inc. (The) (a) (b) | | | 8,770 | | | | 408,770 | |
Destination Maternity Corp. | | | 7,452 | | | | 222,666 | |
Destination XL Group, Inc. (a) | | | 22,534 | | | | 148,048 | |
Express, Inc. (a) | | | 42,861 | | | | 800,215 | |
Finish Line, Inc. (The) - Class A | | | 27,241 | | | | 767,379 | |
Five Below, Inc. (a) (b) | | | 16,534 | | | | 714,269 | |
Francesca’s Holdings Corp. (a) (b) | | | 22,196 | | | | 408,628 | |
Genesco, Inc. (a) | | | 12,940 | | | | 945,396 | |
Group 1 Automotive, Inc. (b) | | | 10,763 | | | | 764,388 | |
Haverty Furniture Cos., Inc. | | | 10,391 | | | | 325,238 | |
hhgregg, Inc. (a) (b) | | | 8,400 | | | | 117,348 | |
Hibbett Sports, Inc. (a) (b) | | | 12,767 | | | | 858,070 | |
Jos. A. Bank Clothiers, Inc. (a) (b) | | | 14,680 | | | | 803,436 | |
Kirkland’s, Inc. (a) | | | 9,307 | | | | 220,297 | |
Lithia Motors, Inc. - Class A | | | 11,200 | | | | 777,504 | |
Lumber Liquidators Holdings, Inc. (a) (b) | | | 13,856 | | | | 1,425,644 | |
MarineMax, Inc. (a) (b) | | | 12,696 | | | | 204,152 | |
|
Specialty Retail—(Continued) | |
Mattress Firm Holding Corp. (a) (b) | | | 6,132 | | | | 263,921 | |
Men’s Wearhouse, Inc. (The) | | | 24,177 | | | | 1,234,961 | |
Monro Muffler Brake, Inc. (b) | | | 16,141 | | | | 909,707 | |
Office Depot, Inc. (a) (b) | | | 247,164 | | | | 1,307,498 | |
Outerwall, Inc. (a) (b) | | | 14,700 | | | | 988,869 | |
Penske Automotive Group, Inc. | | | 21,853 | | | | 1,030,587 | |
Pep Boys-Manny Moe & Jack (The) (a) | | | 28,658 | | | | 347,908 | |
Pier 1 Imports, Inc. | | | 47,516 | | | | 1,096,669 | |
RadioShack Corp. (a) (b) | | | 53,504 | | | | 139,110 | |
Rent-A-Center, Inc. (b) | | | 26,759 | | | | 892,145 | |
Restoration Hardware Holdings, Inc. (a) | | | 8,906 | | | | 599,374 | |
Sears Hometown and Outlet Stores, Inc. (a) | | | 4,481 | | | | 114,266 | |
Select Comfort Corp. (a) (b) | | | 26,740 | | | | 563,947 | |
Shoe Carnival, Inc. | | | 8,227 | | | | 238,665 | |
Sonic Automotive, Inc. - Class A (b) | | | 22,348 | | | | 547,079 | |
Stage Stores, Inc. (b) | | | 16,362 | | | | 363,564 | |
Stein Mart, Inc. | | | 15,504 | | | | 208,529 | |
Tile Shop Holdings, Inc. (a) (b) | | | 10,923 | | | | 197,379 | |
Vitamin Shoppe, Inc. (a) | | | 15,659 | | | | 814,425 | |
West Marine, Inc. (a) | | | 8,963 | | | | 127,543 | |
Wet Seal, Inc. (The) - Class A (a) | | | 46,742 | | | | 127,606 | |
Winmark Corp. | | | 1,277 | | | | 118,276 | |
Zale Corp. (a) | | | 16,986 | | | | 267,869 | |
Zumiez, Inc. (a) (b) | | | 11,433 | | | | 297,258 | |
| | | | | | | | |
| | | | | | | 29,321,437 | |
| | | | | | | | |
|
Textiles, Apparel & Luxury Goods—1.4% | |
Columbia Sportswear Co. | | | 6,412 | | | | 504,945 | |
Crocs, Inc. (a) (c) | | | 43,218 | | | | 688,031 | |
Fifth & Pacific Cos., Inc. (a) | | | 62,677 | | | | 2,010,051 | |
G-III Apparel Group, Ltd. (a) (b) | | | 8,109 | | | | 598,363 | |
Iconix Brand Group, Inc. (a) (b) | | | 26,325 | | | | 1,045,103 | |
Jones Group, Inc. (The) | | | 41,279 | | | | 617,534 | |
Movado Group, Inc. | | | 10,013 | | | | 440,672 | |
Oxford Industries, Inc. | | | 7,658 | | | | 617,771 | |
Perry Ellis International, Inc. (a) | | | 7,288 | | | | 115,078 | |
Quiksilver, Inc. (a) (b) | | | 66,625 | | | | 584,301 | |
R.G. Barry Corp. | | | 5,638 | | | | 108,813 | |
Skechers USA, Inc. - Class A (a) | | | 20,341 | | | | 673,897 | |
Steven Madden, Ltd. (a) | | | 31,363 | | | | 1,147,572 | |
Tumi Holdings, Inc. (a) | | | 24,156 | | | | 544,718 | |
Unifi, Inc. (a) | | | 7,892 | | | | 214,978 | |
Vera Bradley, Inc. (a) | | | 10,263 | | | | 246,723 | |
Vince Holding Corp. (a) | | | 7,839 | | | | 240,422 | |
Wolverine World Wide, Inc. (b) | | | 50,526 | | | | 1,715,863 | |
| | | | | | | | |
| | | | | | | 12,114,835 | |
| | | | | | | | |
|
Thrifts & Mortgage Finance—1.5% | |
Astoria Financial Corp. | | | 45,199 | | | | 625,102 | |
Banc of California, Inc. | | | 8,788 | | | | 117,847 | |
Bank Mutual Corp. | | | 24,774 | | | | 173,666 | |
BankFinancial Corp. (b) | | | 12,038 | | | | 110,268 | |
Beneficial Mutual Bancorp, Inc. (a) | | | 18,913 | | | | 206,530 | |
Berkshire Hills Bancorp, Inc. | | | 13,053 | | | | 355,955 | |
BofI Holding, Inc. (a) (b) | | | 6,005 | | | | 470,972 | |
Brookline Bancorp, Inc. (b) | | | 37,158 | | | | 355,602 | |
See accompanying notes to financial statements.
MSF-19
Metropolitan Series Fund
Russell 2000 Index Portfolio
Schedule of Investments as of December 31, 2013
Common Stocks—(Continued)
| | | | | | | | |
| Security Description | |
Shares | | | Value | |
|
Thrifts & Mortgage Finance—(Continued) | |
Capitol Federal Financial, Inc. | | | 75,011 | | | $ | 908,383 | |
Charter Financial Corp. | | | 12,347 | | | | 132,977 | |
Dime Community Bancshares, Inc. | | | 15,501 | | | | 262,277 | |
ESB Financial Corp. | | | 7,325 | | | | 104,015 | |
Essent Group, Ltd. (a) (b) | | | 14,220 | | | | 342,133 | |
EverBank Financial Corp. (b) | | | 40,693 | | | | 746,310 | |
Federal Agricultural Mortgage Corp. - Class C | | | 5,480 | | | | 187,690 | |
First Defiance Financial Corp. | | | 5,038 | | | | 130,837 | |
Flagstar Bancorp, Inc. (a) | | | 13,328 | | | | 261,495 | |
Fox Chase Bancorp, Inc. | | | 7,539 | | | | 131,028 | |
Franklin Financial Corp. (a) | | | 7,196 | | | | 142,337 | |
Home Loan Servicing Solutions, Ltd. | | | 36,012 | | | | 827,196 | |
HomeStreet, Inc. (b) | | | 6,935 | | | | 138,700 | |
Meridian Interstate Bancorp, Inc. (a) | | | 4,638 | | | | 104,726 | |
Meta Financial Group, Inc. (b) | | | 3,308 | | | | 133,412 | |
MGIC Investment Corp. (a) | | | 164,487 | | | | 1,388,270 | |
Northfield Bancorp, Inc. | | | 29,861 | | | | 394,165 | |
Northwest Bancshares, Inc. | | | 51,071 | | | | 754,829 | |
OceanFirst Financial Corp. | | | 6,649 | | | | 113,897 | |
Oritani Financial Corp. | | | 22,475 | | | | 360,724 | |
PennyMac Financial Services, Inc. - Class A (a) (b) | | | 8,785 | | | | 154,177 | |
Provident Financial Services, Inc. | | | 31,811 | | | | 614,589 | |
Radian Group, Inc. (b) | | | 87,729 | | | | 1,238,734 | |
Rockville Financial, Inc. (b) | | | 15,288 | | | | 217,243 | |
Territorial Bancorp, Inc. | | | 7,186 | | | | 166,715 | |
Tree.com, Inc. (a) (b) | | | 3,615 | | | | 118,717 | |
TrustCo Bank Corp. (b) | | | 49,973 | | | | 358,806 | |
United Community Financial Corp. (a) (b) | | | 22,000 | | | | 78,540 | |
United Financial Bancorp, Inc. | | | 9,478 | | | | 179,039 | |
Walker & Dunlop, Inc. (a) | | | 8,778 | | | | 141,940 | |
WSFS Financial Corp. | | | 4,212 | | | | 326,556 | |
| | | | | | | | |
| | | | | | | 13,576,399 | |
| | | | | | | | |
|
Tobacco—0.1% | |
Alliance One International, Inc. (a) | | | 45,974 | | | | 140,221 | |
Universal Corp. (b) | | | 12,065 | | | | 658,749 | |
Vector Group, Ltd. (b) | | | 31,274 | | | | 511,955 | |
| | | | | | | | |
| | | | | | | 1,310,925 | |
| | | | | | | | |
|
Trading Companies & Distributors—0.9% | |
Aceto Corp. | | | 17,480 | | | | 437,175 | |
Aircastle, Ltd. | | | 34,426 | | | | 659,602 | |
Applied Industrial Technologies, Inc. | | | 21,259 | | | | 1,043,604 | |
Beacon Roofing Supply, Inc. (a) (b) | | | 24,991 | | | | 1,006,638 | |
CAI International, Inc. (a) | | | 7,804 | | | | 183,940 | |
DXP Enterprises, Inc. (a) | | | 5,282 | | | | 608,486 | |
H&E Equipment Services, Inc. (a) | | | 14,207 | | | | 420,953 | |
Houston Wire & Cable Co. | | | 10,450 | | | | 139,821 | |
Kaman Corp. (b) | | | 14,024 | | | | 557,174 | |
Rush Enterprises, Inc. - Class A (a) | | | 17,833 | | | | 528,749 | |
TAL International Group, Inc. (a) (b) | | | 16,976 | | | | 973,574 | |
Textainer Group Holdings, Ltd. (b) | | | 10,746 | | | | 432,204 | |
|
Trading Companies & Distributors—(Continued) | |
Titan Machinery, Inc. (a) (b) | | | 8,967 | | | | 159,792 | |
Watsco, Inc. | | | 12,890 | | | | 1,238,213 | |
| | | | | | | | |
| | | | | | | 8,389,925 | |
| | | | | | | | |
|
Transportation Infrastructure—0.1% | |
Wesco Aircraft Holdings, Inc. (a) | | | 20,790 | | | | 455,717 | |
| | | | | | | | |
|
Water Utilities—0.2% | |
American States Water Co. | | | 19,788 | | | | 568,509 | |
California Water Service Group | | | 24,670 | | | | 569,137 | |
Connecticut Water Service, Inc. | | | 4,609 | | | | 163,666 | |
Consolidated Water Co., Ltd. (b) | | | 8,349 | | | | 117,721 | |
Middlesex Water Co. | | | 7,497 | | | | 156,987 | |
SJW Corp. (b) | | | 7,394 | | | | 220,267 | |
York Water Co. (b) | | | 6,695 | | | | 140,126 | |
| | | | | | | | |
| | | | | | | 1,936,413 | |
| | | | | | | | |
|
Wireless Telecommunication Services—0.2% | |
Leap Wireless International, Inc. (a) | | | 27,485 | | | | 478,239 | |
NII Holdings, Inc. (a) (b) | | | 86,612 | | | | 238,183 | |
NTELOS Holdings Corp. (b) | | | 7,785 | | | | 157,491 | |
Shenandoah Telecommunications Co. (b) | | | 12,542 | | | | 321,953 | |
USA Mobility, Inc. | | | 11,723 | | | | 167,404 | |
| | | | | | | | |
| | | | | | | 1,363,270 | |
| | | | | | | | |
Total Common Stocks
(Cost $572,175,279) | | | | | | | 841,140,856 | |
| | | | | | | | |
|
Investment Company Security—3.4% | |
iShares Russell 2000 Index Fund (b)
(Cost $28,493,443) | | | 264,000 | | | | 30,441,840 | |
| | | | | | | | |
|
| Rights—0.0% | |
| | |
Oil, Gas & Consumable—0.0% | | | | | | | | |
EXCO Resources, Inc., Expires 01/09/14 (a)
(Cost $0) | | | 68,713 | | | | 10,994 | |
| | | | | | | | |
|
| Warrant—0.0% | |
|
Oil, Gas & Consumable Fuels—0.0% | |
Magnum Hunter Resources Corp.,
Expires 04/15/16 (a) (b) (d)
(Cost $0) | | | 8,794 | | | | 0 | |
| | | | | | | | |
|
| Short-Term Investments—27.6% | |
| | |
Discount Notes—1.9% | | | | | | | | |
Federal Home Loan Bank | | | | | | | | |
0.061%, 01/22/14 (e) | | | 800,000 | | | | 799,972 | |
0.061%, 01/22/14 (e) | | | 225,000 | | | | 224,992 | |
0.076%, 03/21/14 (e) | | | 3,050,000 | | | | 3,049,498 | |
0.132%, 01/22/14 (e) | | | 1,225,000 | | | | 1,224,907 | |
0.142%, 01/22/14 (e) | | | 675,000 | | | | 674,945 | |
See accompanying notes to financial statements.
MSF-20
Metropolitan Series Fund
Russell 2000 Index Portfolio
Schedule of Investments as of December 31, 2013
Short-Term Investments—(Continued)
| | | | | | | | |
| Security Description | | Shares/
Principal
Amount* | | | Value | |
|
Discount Notes—(Continued) | |
Federal National Mortgage Association | | | | | | | | |
0.036%, 01/22/14 (e) | | | 175,000 | | | $ | 174,996 | |
0.041%, 01/22/14 (e) | | | 4,675,000 | | | | 4,674,891 | |
0.046%, 01/22/14 (e) | | | 500,000 | | | | 499,987 | |
0.051%, 01/15/14 (e) | | | 450,000 | | | | 449,991 | |
0.061%, 01/22/14 (e) | | | 2,000,000 | | | | 1,999,930 | |
0.061%, 02/25/14 (e) | | | 2,525,000 | | | | 2,524,769 | |
0.091%, 01/15/14 (e) | | | 550,000 | | | | 549,981 | |
| | | | | | | | |
| | | | | | | 16,848,859 | |
| | | | | | | | |
|
Mutual Fund—25.1% | |
State Street Navigator Securities Lending MET Portfolio (f) | | | 225,056,597 | | | | 225,056,597 | |
| | | | | | | | |
|
U.S. Treasury—0.6% | |
U.S. Treasury Bills | | | | | | | | |
0.046%, 05/15/14 (e) | | | 2,125,000 | | | | 2,124,644 | |
0.050%, 05/15/14 (e) | | | 2,850,000 | | | | 2,849,480 | |
0.063%, 05/15/14 (e) | | | 275,000 | | | | 274,937 | |
0.086%, 05/15/14 (e) | | | 275,000 | | | | 274,913 | |
0.088%, 05/15/14 (e) | | | 50,000 | | | | 49,984 | |
| | | | | | | | |
| | | | | | | 5,573,958 | |
| | | | | | | | |
Total Short-Term Investments
(Cost $247,479,414) | | | | | | | 247,479,414 | |
| | | | | | | | |
Total Investments—125.0%
(Cost $848,148,136) (g) | | | | | | | 1,119,073,104 | |
Other assets and liabilities (net)—(25.0)% | | | | | | | (223,634,883 | ) |
| | | | | | | | |
| Net Assets—100.0% | | | | | | $ | 895,438,221 | |
| | | | | | | | |
| * | Principal amount stated in U.S. dollars unless otherwise noted. |
| (a) | Non-income producing security. |
| (b) | All or a portion of the security was held on loan. As of December 31, 2013, the market value of securities loaned was $220,401,286 and the collateral received consisted of cash in the amount of $225,056,597 and non-cash collateral with a value of $972,789. The cash collateral is invested in a money market fund managed by an affiliate of the custodian. The non-cash collateral received consists primarily of government securities and bank letters of credit, and is held for the benefit of the Portfolio at the Portfolio’s custodian. The Portfolio cannot repledge or resell this collateral. As such, this collateral is excluded from the Statement of Assets and Liabilities. |
| (c) | All or a portion of the security was pledged as collateral against open futures contracts. As of December 31, 2013, the market value of securities pledged was $3,116,995. |
| (d) | Illiquid security. As of December 31, 2013, these securities represent 0.0% of net assets. |
| (e) | The rate shown represents the discount rate at the time of purchase by the Portfolio. |
| (f) | Represents investment of cash collateral received from securities lending transactions. |
| (g) | As of December 31, 2013, the aggregate cost of investments for federal income tax purposes was $852,821,498. The aggregate unrealized appreciation and depreciation of investments were $305,737,616 and $(39,486,010), respectively, resulting in net unrealized appreciation of $266,251,606 for federal income tax purposes. |
Futures Contracts
| | | | | | | | | | | | | | | | | | |
Futures Contracts—Long | | Expiration
Date | | Number of
Contracts | | | Notional
Amount | | | Unrealized
Appreciation | |
Russell 2000 Mini Index Futures | | 03/21/14 | | | 197 | | | | USD | | | | 21,631,932 | | | $ | 1,247,648 | |
| | | | | | | | | | | | | | | | | | |
| (USD)— | United States Dollar |
See accompanying notes to financial statements.
MSF-21
Metropolitan Series Fund
Russell 2000 Index Portfolio
Schedule of Investments as of December 31, 2013
Fair Value Hierarchy
Accounting principles generally accepted in the United States of America (“GAAP”) define fair market value as the price that the Portfolio would receive to sell an asset or pay to transfer a liability in an orderly transaction between market participants at the measurement date. It establishes a fair value hierarchy that prioritizes inputs to valuation methods and requires disclosure of the fair value hierarchy that segregates fair value measurements into three levels. Levels 1, 2 and 3 of the fair value hierarchy are defined as follows:
Level 1 - unadjusted quoted prices in active markets for identical investments
Level 2 - other significant observable inputs (including, but not limited to, unadjusted quoted prices for similar investments in markets that are either active or inactive; inputs other than quoted prices that are observable such as interest rates, yield curves, volatilities, prepayment speeds, loss severities, credit risks, default rates, etc.)
Level 3 - significant unobservable inputs based on the best information available in the circumstances, to the extent observable inputs are unavailable (including the Portfolio’s own assumptions in determining the fair value of investments)
The inputs or methodologies used for valuing investments are not necessarily an indication of the risk associated with investing in them. Changes to the inputs or methodologies used may result in transfers between levels, which will be recognized as of the beginning of the reporting period. Information on transfers between Level 1 and Level 2, if any, will be disclosed following the fair value hierarchy table below. A reconciliation of Level 3 securities, if any, will also be disclosed following the fair value hierarchy table. For more information about the Portfolio’s policy regarding the valuation of investments, please refer to the Notes to Financial Statements.
The following table summarizes the fair value hierarchy of the Portfolio’s investments as of December 31, 2013:
| | | | | | | | | | | | | | | | |
| Description | | Level 1 | | | Level 2 | | | Level 3 | | | Total | |
Total Common Stocks* | | $ | 841,140,856 | | | $ | — | | | $ | — | | | $ | 841,140,856 | |
Total Investment Company Security | | | 30,441,840 | | | | — | | | | — | | | | 30,441,840 | |
Total Rights* | | | 10,994 | | | | — | | | | — | | | | 10,994 | |
Total Warrant* | | | 0 | | | | — | | | | — | | | | 0 | |
| Short-Term Investments | | | | | | | | | | | | | | | | |
Discount Notes | | | — | | | | 16,848,859 | | | | — | | | | 16,848,859 | |
Mutual Fund | | | 225,056,597 | | | | — | | | | — | | | | 225,056,597 | |
U.S. Treasury | | | — | | | | 5,573,958 | | | | — | | | | 5,573,958 | |
Total Short-Term Investments | | | 225,056,597 | | | | 22,422,817 | | | | — | | | | 247,479,414 | |
Total Investments | | $ | 1,096,650,287 | | | $ | 22,422,817 | | | $ | — | | | $ | 1,119,073,104 | |
| | | | | | | | | | | | | | | | | |
Collateral for securities loaned (Liability) | | $ | — | | | $ | (225,056,597 | ) | | $ | — | | | $ | (225,056,597 | ) |
| Futures Contracts | | | | | | | | | | | | | | | | |
Futures Contracts (Unrealized Appreciation) | | $ | 1,247,648 | | | $ | — | | | $ | — | | | $ | 1,247,648 | |
| * | See Schedule of Investments for additional detailed categorizations. |
See accompanying notes to financial statements.
MSF-22
Metropolitan Series Fund
Russell 2000 Index Portfolio
Statement of Assets and Liabilities
December 31, 2013
| | | | |
Assets | | | | |
Investments at value (a) (b) | | $ | 1,119,073,104 | |
Cash | | | 250,470 | |
Receivable for: | | | | |
Investments sold | | | 978,971 | |
Fund shares sold | | | 555,498 | |
Dividends | | | 1,015,080 | |
Variation margin on futures contracts | | | 94,560 | |
Prepaid expenses | | | 1,963 | |
| | | | |
Total Assets | | | 1,121,969,646 | |
Liabilities | | | | |
Collateral for securities loaned | | | 225,056,597 | |
Payables for: | | | | |
Fund shares redeemed | | | 1,039,850 | |
Accrued expenses: | | | | |
Management fees | | | 184,316 | |
Distribution and service fees | | | 88,414 | |
Deferred trustees’ fees | | | 48,554 | |
Other expenses | | | 113,694 | |
| | | | |
Total Liabilities | | | 226,531,425 | |
| | | | |
Net Assets | | $ | 895,438,221 | |
| | | | |
Net assets consist of: | | | | |
Paid in surplus | | $ | 600,150,363 | |
Undistributed net investment income | | | 8,956,569 | |
Accumulated net realized gain | | | 14,158,673 | |
Unrealized appreciation on investments and futures contracts | | | 272,172,616 | |
| | | | |
Net Assets | | $ | 895,438,221 | |
| | | | |
Net Assets | | | | |
Class A | | $ | 485,494,019 | |
Class B | | | 238,128,383 | |
Class E | | | 30,619,445 | |
Class G | | | 141,196,374 | |
Capital Shares Outstanding* | | | | |
Class A | | | 24,488,428 | |
Class B | | | 12,243,053 | |
Class E | | | 1,552,581 | |
Class G | | | 7,278,529 | |
Net Asset Value, Offering Price and Redemption Price Per Share | | | | |
Class A | | $ | 19.83 | |
Class B | | | 19.45 | |
Class E | | | 19.72 | |
Class G | | | 19.40 | |
| * | The Portfolio is authorized to issue an unlimited number of shares. |
| (a) | Identified cost of investments was $848,148,136. |
| (b) | Includes securities loaned at value of $220,401,286. |
Statement of Operations
Year Ended December 31, 2013
| | | | |
Investment Income | | | | |
Dividends (a) | | $ | 9,559,632 | |
Interest | | | 17,304 | |
Securities lending income | | | 1,999,026 | |
| | | | |
Total investment income | | | 11,575,962 | |
Expenses | | | | |
Management fees | | | 1,945,541 | |
Administration fees | | | 14,465 | |
Custodian and accounting fees | | | 109,347 | |
Distribution and service fees—Class B | | | 529,823 | |
Distribution and service fees—Class E | | | 42,492 | |
Distribution and service fees—Class G | | | 333,845 | |
Audit and tax services | | | 38,202 | |
Legal | | | 27,754 | |
Trustees’ fees and expenses | | | 35,358 | |
Shareholder reporting | | | 157,988 | |
Insurance | | | 4,144 | |
Miscellaneous | | | 62,469 | |
| | | | |
Total expenses | | | 3,301,428 | |
Less management fee waiver | | | (13,912 | ) |
| | | | |
Net expenses | | | 3,287,516 | |
| | | | |
Net Investment Income | | | 8,288,446 | |
| | | | |
Net Realized and Unrealized Gain | | | | |
| Net realized gain on: | | | | |
Investments | | | 44,288,684 | |
Futures contracts | | | 5,402,927 | |
Foreign currency transactions | | | 2,001 | |
Capital gain distributions | | | 1,773 | |
| | | | |
Net realized gain | | | 49,695,385 | |
| | | | |
| Net change in unrealized appreciation on: | | | | |
Investments | | | 192,038,127 | |
Futures contracts | | | 1,001,108 | |
| | | | |
Net change in unrealized appreciation | | | 193,039,235 | |
| | | | |
Net realized and unrealized gain | | | 242,734,620 | |
| | | | |
Net Increase in Net Assets from Operations | | $ | 251,023,066 | |
| | | | |
| (a) | Net of foreign withholding taxes of $9,625. |
See accompanying notes to financial statements.
MSF-23
Metropolitan Series Fund
Russell 2000 Index Portfolio
Statements of Changes in Net Assets
| | | | | | | | |
| | | Year Ended
December 31,
2013 | | | Year Ended
December 31,
2012 | |
Increase (Decrease) in Net Assets: | | | | | | | | |
From Operations | | | | | | | | |
Net investment income | | $ | 8,288,446 | | | $ | 12,241,259 | |
Net realized gain | | | 49,695,385 | | | | 27,594,018 | |
Net change in unrealized appreciation | | | 193,039,235 | | | | 56,751,043 | |
| | | | | | | | |
Increase in net assets from operations | | | 251,023,066 | | | | 96,586,320 | |
| | | | | | | | |
From Distributions to Shareholders | | | | | | | | |
Net investment income | | | | | | | | |
Class A | | | (6,573,953 | ) | | | (4,238,187 | ) |
Class B | | | (2,873,317 | ) | | | (1,663,111 | ) |
Class E | | | (406,777 | ) | | | (260,017 | ) |
Class G | | | (1,391,711 | ) | | | (608,903 | ) |
| | | | | | | | |
Total distributions | | | (11,245,758 | ) | | | (6,770,218 | ) |
| | | | | | | | |
Decrease in net assets from capital share transactions | | | (11,227,054 | ) | | | (27,766,590 | ) |
| | | | | | | | |
Total increase in net assets | | | 228,550,254 | | | | 62,049,512 | |
| | |
Net Assets | | | | | | | | |
Beginning of period | | | 666,887,967 | | | | 604,838,455 | |
| | | | | | | | |
End of period | | $ | 895,438,221 | | | $ | 666,887,967 | |
| | | | | | | | |
Undistributed net investment income | | | | | | | | |
End of period | | $ | 8,956,569 | | | $ | 11,850,867 | |
| | | | | | | | |
Other Information:
Capital Shares
Transactions in capital shares were as follows:
| | | | | | | | | | | | | | | | |
| | | Year Ended
December 31, 2013 | | | Year Ended
December 31, 2012 | |
| | | Shares | | | Value | | | Shares | | | Value | |
Class A | | | | | | | | | | | | | | | | |
Sales | | | 4,227,274 | | | $ | 71,959,396 | | | | 2,175,557 | | | $ | 30,005,491 | |
Reinvestments | | | 431,362 | | | | 6,573,953 | | | | 313,012 | | | | 4,238,187 | |
Redemptions | | | (5,376,472 | ) | | | (91,266,242 | ) | | | (4,940,110 | ) | | | (67,889,434 | ) |
| | | | | | | | | | | | | | | | |
Net decrease | | | (717,836 | ) | | $ | (12,732,893 | ) | | | (2,451,541 | ) | | $ | (33,645,756 | ) |
| | | | | | | | | | | | | | | | |
Class B | | | | | | | | | | | | | | | | |
Sales | | | 1,525,782 | | | $ | 25,652,777 | | | | 1,507,027 | | | $ | 20,329,462 | |
Reinvestments | | | 191,810 | | | | 2,873,317 | | | | 124,858 | | | | 1,663,111 | |
Redemptions | | | (2,470,791 | ) | | | (41,465,694 | ) | | | (2,147,146 | ) | | | (29,136,818 | ) |
| | | | | | | | | | | | | | | | |
Net decrease | | | (753,199 | ) | | $ | (12,939,600 | ) | | | (515,261 | ) | | $ | (7,144,245 | ) |
| | | | | | | | | | | | | | | | |
Class E | | | | | | | | | | | | | | | | |
Sales | | | 232,358 | | | $ | 4,024,631 | | | | 201,952 | | | $ | 2,768,014 | |
Reinvestments | | | 26,797 | | | | 406,777 | | | | 19,275 | | | | 260,017 | |
Redemptions | | | (480,266 | ) | | | (8,259,524 | ) | | | (441,802 | ) | | | (6,048,466 | ) |
| | | | | | | | | | | | | | | | |
Net decrease | | | (221,111 | ) | | $ | (3,828,116 | ) | | | (220,575 | ) | | $ | (3,020,435 | ) |
| | | | | | | | | | | | | | | | |
Class G | | | | | | | | | | | | | | | | |
Sales | | | 2,240,269 | | | $ | 38,047,111 | | | | 3,727,220 | | | $ | 49,334,467 | |
Reinvestments | | | 93,091 | | | | 1,391,711 | | | | 45,816 | | | | 608,903 | |
Redemptions | | | (1,274,577 | ) | | | (21,165,267 | ) | | | (2,507,114 | ) | | | (33,899,524 | ) |
| | | | | | | | | | | | | | | | |
Net increase | | | 1,058,783 | | | $ | 18,273,555 | | | | 1,265,922 | | | $ | 16,043,846 | |
| | | | | | | | | | | | | | | | |
Decrease derived from capital shares transactions | | | | | | $ | (11,227,054 | ) | | | | | | $ | (27,766,590 | ) |
| | | | | | | | | | | | | | | | |
See accompanying notes to financial statements.
MSF-24
Metropolitan Series Fund
Russell 2000 Index Portfolio
Financial Highlights
| | | | | | | | | | | | | | | | | | | | |
| Selected per share data | | | | | | | | | | | | | | | |
| | | Class A | |
| | | Year Ended December 31, | |
| | | 2013 | | | 2012 | | | 2011 | | | 2010 | | | 2009 | |
Net Asset Value, Beginning of Period | | $ | 14.56 | | | $ | 12.66 | | | $ | 13.33 | | | $ | 10.61 | | | $ | 8.89 | |
| | | | | | | | | | | | | | | | | | | | |
Income (Loss) from Investment Operations | | | | | | | | | | | | | | | | | | | | |
Net investment income (a) | | | 0.20 | | | | 0.28 | | | | 0.15 | | | | 0.14 | | | | 0.13 | |
Net realized and unrealized gain (loss) on investments | | | 5.33 | | | | 1.78 | | | | (0.68 | ) | | | 2.71 | | | | 2.04 | |
| | | | | | | | | | | | | | | | | | | | |
Total from investment operations | | | 5.53 | | | | 2.06 | | | | (0.53 | ) | | | 2.85 | | | | 2.17 | |
| | | | | | | | | | | | | | | | | | | | |
Less Distributions | | | | | | | | | | | | | | | | | | | | |
Distributions from net investment income | | | (0.26 | ) | | | (0.16 | ) | | | (0.14 | ) | | | (0.13 | ) | | | (0.19 | ) |
Distributions from net realized capital gains | | | 0.00 | | | | 0.00 | | | | 0.00 | | | | 0.00 | | | | (0.26 | ) |
| | | | | | | | | | | | | | | | | | | | |
Total distributions | | | (0.26 | ) | | | (0.16 | ) | | | (0.14 | ) | | | (0.13 | ) | | | (0.45 | ) |
| | | | | | | | | | | | | | | | | | | | |
Net Asset Value, End of Period | | $ | 19.83 | | | $ | 14.56 | | | $ | 12.66 | | | $ | 13.33 | | | $ | 10.61 | |
| | | | | | | | | | | | | | | | | | | | |
Total Return (%) (b) | | | 38.55 | | | | 16.35 | | | | (4.10 | ) | | | 26.92 | | | | 26.01 | |
| | | | | |
Ratios/Supplemental Data | | | | | | | | | | | | | | | | | | | | |
Gross ratio of expenses to average net assets (%) | | | 0.31 | | | | 0.33 | | | | 0.31 | | | | 0.32 | | | | 0.35 | |
Net ratio of expenses to average net assets (%) (c) | | | 0.31 | | | | 0.33 | | | | 0.31 | | | | 0.31 | | | | 0.34 | |
Ratio of net investment income to average net assets (%) | | | 1.18 | | | | 2.01 | | | | 1.12 | | | | 1.24 | | | | 1.47 | |
Portfolio turnover rate (%) | | | 25 | | | | 26 | | | | 25 | | | | 26 | | | | 27 | |
Net assets, end of period (in millions) | | $ | 485.5 | | | $ | 366.9 | | | $ | 350.3 | | | $ | 406.2 | | | $ | 349.0 | |
| | | | | | | | | | | | | | | | | | | | |
| | | Class B | |
| | | Year Ended December 31, | |
| | | 2013 | | | 2012 | | | 2011 | | | 2010 | | | 2009 | |
Net Asset Value, Beginning of Period | | $ | 14.29 | | | $ | 12.43 | | | $ | 13.09 | | | $ | 10.43 | | | $ | 8.74 | |
| | | | | | | | | | | | | | | | | | | | |
Income (Loss) from Investment Operations | | | | | | | | | | | | | | | | | | | | |
Net investment income (a) | | | 0.16 | | | | 0.24 | | | | 0.11 | | | | 0.11 | | | | 0.11 | |
Net realized and unrealized gain (loss) on investments | | | 5.23 | | | | 1.75 | | | | (0.66 | ) | | | 2.65 | | | | 2.00 | |
| | | | | | | | | | | | | | | | | | | | |
Total from investment operations | | | 5.39 | | | | 1.99 | | | | (0.55 | ) | | | 2.76 | | | | 2.11 | |
| | | | | | | | | | | | | | | | | | | | |
Less Distributions | | | | | | | | | | | | | | | | | | | | |
Distributions from net investment income | | | (0.23 | ) | | | (0.13 | ) | | | (0.11 | ) | | | (0.10 | ) | | | (0.16 | ) |
Distributions from net realized capital gains | | | 0.00 | | | | 0.00 | | | | 0.00 | | | | 0.00 | | | | (0.26 | ) |
| | | | | | | | | | | | | | | | | | | | |
Total distributions | | | (0.23 | ) | | | (0.13 | ) | | | (0.11 | ) | | | (0.10 | ) | | | (0.42 | ) |
| | | | | | | | | | | | | | | | | | | | |
Net Asset Value, End of Period | | $ | 19.45 | | | $ | 14.29 | | | $ | 12.43 | | | $ | 13.09 | | | $ | 10.43 | |
| | | | | | | | | | | | | | | | | | | | |
Total Return (%) (b) | | | 38.18 | | | | 16.05 | | | | (4.29 | ) | | | 26.58 | | | | 25.66 | |
| | | | | |
Ratios/Supplemental Data | | | | | | | | | | | | | | | | | | | | |
Gross ratio of expenses to average net assets (%) | | | 0.56 | | | | 0.58 | | | | 0.56 | | | | 0.57 | | | | 0.60 | |
Net ratio of expenses to average net assets (%) (c) | | | 0.56 | | | | 0.58 | | | | 0.56 | | | | 0.56 | | | | 0.59 | |
Ratio of net investment income to average net assets (%) | | | 0.93 | | | | 1.77 | | | | 0.89 | | | | 1.00 | | | | 1.20 | |
Portfolio turnover rate (%) | | | 25 | | | | 26 | | | | 25 | | | | 26 | | | | 27 | |
Net assets, end of period (in millions) | | $ | 238.1 | | | $ | 185.7 | | | $ | 168.0 | | | $ | 174.7 | | | $ | 140.0 | |
Please see following page for Financial Highlights footnote legend.
See accompanying notes to financial statements.
MSF-25
Metropolitan Series Fund
Russell 2000 Index Portfolio
Financial Highlights
| | | | | | | | | | | | | | | | | | | | |
| Selected per share data | | | | | | | | | | | | | | | |
| | | Class E | |
| | | Year Ended December 31, | |
| | | 2013 | | | 2012 | | | 2011 | | | 2010 | | | 2009 | |
Net Asset Value, Beginning of Period | | $ | 14.48 | | | $ | 12.60 | | | $ | 13.26 | | | $ | 10.57 | | | $ | 8.85 | |
| | | | | | | | | | | | | | | | | | | | |
Income (Loss) from Investment Operations | | | | | | | | | | | | | | | | | | | | |
Net investment income (a) | | | 0.17 | | | | 0.25 | | | | 0.13 | | | | 0.12 | | | | 0.12 | |
Net realized and unrealized gain (loss) on investments | | | 5.31 | | | | 1.77 | | | | (0.67 | ) | | | 2.68 | | | | 2.03 | |
| | | | | | | | | | | | | | | | | | | | |
Total from investment operations | | | 5.48 | | | | 2.02 | | | | (0.54 | ) | | | 2.80 | | | | 2.15 | |
| | | | | | | | | | | | | | | | | | | | |
Less Distributions | | | | | | | | | | | | | | | | | | | | |
Distributions from net investment income | | | (0.24 | ) | | | (0.14 | ) | | | (0.12 | ) | | | (0.11 | ) | | | (0.17 | ) |
Distributions from net realized capital gains | | | 0.00 | | | | 0.00 | | | | 0.00 | | | | 0.00 | | | | (0.26 | ) |
| | | | | | | | | | | | | | | | | | | | |
Total distributions | | | (0.24 | ) | | | (0.14 | ) | | | (0.12 | ) | | | (0.11 | ) | | | (0.43 | ) |
| | | | | | | | | | | | | | | | | | | | |
Net Asset Value, End of Period | | $ | 19.72 | | | $ | 14.48 | | | $ | 12.60 | | | $ | 13.26 | | | $ | 10.57 | |
| | | | | | | | | | | | | | | | | | | | |
Total Return (%) (b) | | | 38.35 | | | | 16.10 | | | | (4.16 | ) | | | 26.60 | | | | 25.86 | |
| | | | | |
Ratios/Supplemental Data | | | | | | | | | | | | | | | | | | | | |
Gross ratio of expenses to average net assets (%) | | | 0.46 | | | | 0.48 | | | | 0.46 | | | | 0.47 | | | | 0.50 | |
Net ratio of expenses to average net assets (%) (c) | | | 0.46 | | | | 0.48 | | | | 0.46 | | | | 0.46 | | | | 0.49 | |
Ratio of net investment income to average net assets (%) | | | 1.03 | | | | 1.85 | | | | 0.96 | | | | 1.08 | | | | 1.30 | |
Portfolio turnover rate (%) | | | 25 | | | | 26 | | | | 25 | | | | 26 | | | | 27 | |
Net assets, end of period (in millions) | | $ | 30.6 | | | $ | 25.7 | | | $ | 25.1 | | | $ | 32.6 | | | $ | 29.9 | |
| |
| | | Class G | |
| | | Year Ended December 31, | |
| | | 2013 | | | 2012 | | | 2011 | | | 2010 | | | 2009(d) | |
Net Asset Value, Beginning of Period | | $ | 14.26 | | | $ | 12.41 | | | $ | 13.07 | | | $ | 10.41 | | | $ | 7.84 | |
| | | | | | | | | | | | | | | | | | | | |
Income (Loss) from Investment Operations | | | | | | | | | | | | | | | | | | | | |
Net investment income (a) | | | 0.15 | | | | 0.24 | | | | 0.11 | | | | 0.12 | | | | 0.08 | |
Net realized and unrealized gain (loss) on investments | | | 5.22 | | | | 1.73 | | | | (0.66 | ) | | | 2.64 | | | | 2.49 | |
| | | | | | | | | | | | | | | | | | | | |
Total from investment operations | | | 5.37 | | | | 1.97 | | | | (0.55 | ) | | | 2.76 | | | | 2.57 | |
| | | | | | | | | | | | | | | | | | | | |
Less Distributions | | | | | | | | | | | | | | | | | | | | |
Distributions from net investment income | | | (0.23 | ) | | | (0.12 | ) | | | (0.11 | ) | | | (0.10 | ) | | | 0.00 | |
| | | | | | | | | | | | | | | | | | | | |
Total distributions | | | (0.23 | ) | | | (0.12 | ) | | | (0.11 | ) | | | (0.10 | ) | | | 0.00 | |
| | | | | | | | | | | | | | | | | | | | |
Net Asset Value, End of Period | | $ | 19.40 | | | $ | 14.26 | | | $ | 12.41 | | | $ | 13.07 | | | $ | 10.41 | |
| | | | | | | | | | | | | | | | | | | | |
Total Return (%) (b) | | | 38.12 | | | | 15.94 | | | | (4.33 | ) | | | 26.54 | | | | 32.78 | (e) |
| | | | | |
Ratios/Supplemental Data | | | | | | | | | | | | | | | | | | | | |
Gross ratio of expenses to average net assets (%) | | | 0.61 | | | | 0.63 | | | | 0.61 | | | | 0.62 | | | | 0.65 | (f) |
Net ratio of expenses to average net assets (%) (c) | | | 0.61 | | | | 0.63 | | | | 0.61 | | | | 0.61 | | | | 0.64 | (f) |
Ratio of net investment income to average net assets (%) | | | 0.89 | | | | 1.81 | | | | 0.88 | | | | 1.09 | | | | 1.24 | (f) |
Portfolio turnover rate (%) | | | 25 | | | | 26 | | | | 25 | | | | 26 | | | | 27 | |
Net assets, end of period (in millions) | | $ | 141.2 | | | $ | 88.7 | | | $ | 61.5 | | | $ | 41.2 | | | $ | 9.3 | |
| (a) | Per share amounts based on average shares outstanding during the period. |
| (b) | Total return does not reflect any insurance, sales, separate account or administrative charges of variable annuity or life insurance contracts or any additional expenses that contract owners may bear under their variable contracts. If these charges were included, the returns would be lower. |
| (c) | Net ratio of expenses to average net assets includes the effect of management fee waivers as detailed in Note 6 of the Notes to Financial Statements. |
| (d) | Commencement of operations was April 28, 2009. |
| (e) | Periods less than one year are not computed on an annualized basis. |
| (f) | Computed on an annualized basis. |
See accompanying notes to financial statements.
MSF-26
Metropolitan Series Fund
Russell 2000 Index Portfolio
Notes to Financial Statements—December 31, 2013
1. Organization
Metropolitan Series Fund (the “Trust”) is organized as a Delaware statutory trust and registered under the Investment Company Act of 1940, as amended (the “1940 Act”), as an open-end management investment company. The Trust is currently comprised of thirty series, each of which operates as a distinct investment vehicle of the Trust. The portfolio included in this report is Russell 2000 Index Portfolio (the “Portfolio”), which is diversified. Shares in the Portfolio are not offered directly to the general public and are currently available only to separate accounts established by Metropolitan Life Insurance Company (“MetLife”) and other affiliated life insurance companies.
The Portfolio has registered and offers four classes of shares: Class A, B, E, and G shares. Shares of each Class of the Portfolio represent an equal pro rata interest in the Portfolio and generally give the shareholder the same voting, dividend, liquidation, and other rights. Investment income, realized and unrealized capital gains and losses, the common expenses of the Portfolio, and certain Portfolio-level expense reductions, if any, are allocated on a pro rata basis to each Class based on the relative net assets of each Class to the net assets of the Portfolio. Each Class of shares differs in its respective distribution plan and such distribution expenses are allocated to that Class.
2. Significant Accounting Policies
The preparation of financial statements in conformity with accounting principles generally accepted in the United States of America (“GAAP”) requires management to make estimates and assumptions that affect the reported amounts of assets and liabilities and disclosure of contingent assets and liabilities as of the date of the financial statements and the reported amounts of income and expenses during the reporting period. Actual results could differ from those estimates. In the preparation of these financial statements, management has evaluated events and transactions subsequent to December 31, 2013 through the date the financial statements were issued.
The following is a summary of significant accounting policies consistently followed by the Portfolio in the preparation of its financial statements.
Investment Valuation and Fair Value Measurements - Debt securities (other than short term obligations with a remaining maturity of sixty days or less), including corporate, convertible and municipal bonds and notes; obligations of the U.S. treasury and U.S. government agencies; sovereign issues; floating rate loans; and non-U.S. bonds, are generally valued on the basis of evaluated or composite bid quotations obtained from independent pricing services and/or brokers and dealers selected by MetLife Advisers, LLC (“MetLife Advisers” or the “Adviser”), an affiliate of MetLife, Inc., pursuant to authorization of the Board of Trustees of the Trust (the “Board” or “Trustees”). Such quotations utilize matrix pricing, which considers observable inputs including, among other things, issuer details, maturity dates, interest rates, yield curves, rates of prepayment, credit risks/spreads, default rates, reported trades, broker dealer quotes and quoted prices for similar securities. Securities that use similar valuation techniques and inputs as described above are generally categorized as Level 2 within the fair value hierarchy.
Mortgage and asset-backed securities are usually issued as separate tranches, or classes, of securities within each deal. These securities are also generally valued on the basis of evaluated or composite bid quotations obtained from independent pricing services and/or brokers and dealers selected by the Adviser pursuant to authorization of the Board. The pricing models for these securities usually consider tranche-level attributes, estimated cash flows and market-based yield spreads for each tranche and current market data, and incorporate deal collateral performance, as available. Mortgage and asset-backed securities that use similar valuation techniques and inputs as described above are generally categorized as Level 2 within the fair value hierarchy.
Short term obligations with a remaining maturity of sixty days or less are generally valued at amortized cost, which approximates fair market value, and are generally categorized as Level 2 within the fair value hierarchy.
Domestic and foreign equity securities, such as common stock, exchange-traded funds, rights, warrants, and preferred stock, that are traded on a securities exchange, are generally valued at their last sale price on the exchange or market in which they are principally traded on the valuation date, or, if no sales occurred on that day, at the last reported bid price. Equity securities traded over-the-counter are generally valued at the last reported sale price. Valuation adjustments may be applied to certain foreign equity securities that are traded solely on foreign exchanges that close before the close of the U.S. market to account for the market movement between the close of the foreign exchanges and the close of the U.S. market. The Portfolio may use a systematic fair valuation model provided by an independent third party to value securities principally traded in these foreign markets in order to adjust for possible stale pricing that may occur between the close of the foreign exchanges and the time of the Portfolio valuation. Foreign equity securities using these valuation adjustments are generally categorized as Level 2 within the fair value hierarchy. Equity securities that are actively traded, and have no valuation adjustments applied, are categorized as Level 1 within the fair value hierarchy. Other equity securities traded on inactive markets, or valued in reference to similar instruments traded on active markets, are generally categorized as Level 2 within the fair value hierarchy.
MSF-27
Metropolitan Series Fund
Russell 2000 Index Portfolio
Notes to Financial Statements—December 31, 2013—(Continued)
Investments in registered open-end management investment companies are valued at reported net asset value per share on the valuation date and are categorized as Level 1 within the fair value hierarchy.
Forward foreign currency exchange contracts are valued through an independent pricing service based on the mean between closing bid and ask prices of the forward currency rates in the London foreign exchange markets on a daily basis as provided by a reliable bank or dealer. These contracts are generally categorized as Level 2 within the fair value hierarchy.
Options, whether on securities, indices, futures contracts, or otherwise, traded on exchanges are valued at the last sale price available as of the close of business on the valuation date or, if there is no such price available, at the mean between the last reported bid and ask prices. These types of options are categorized as Level 1 within the fair value hierarchy. Futures contracts, which are traded on commodity exchanges, are valued at their closing prices as of the close of such exchanges and are categorized as Level 1 within the fair value hierarchy.
Options and futures contracts that are traded over-the-counter are generally valued on the basis of quotations provided by broker-dealers or prices provided by pricing service providers who use a series of techniques, including simulation pricing models, to determine the value of the contracts. The pricing models use inputs that are observed from actively quoted markets such as issuer details, indices, spreads, interest rates, yield curves, credit curves, measures of volatility and exchange rates. These contracts are generally categorized as Level 2 within the fair value hierarchy.
If no current market value quotation or other observable inputs are readily available or market value quotations are deemed to be unreliable for a security, the fair value of the security will be determined in accordance with procedures approved by and under the general supervision of the Board. In such a circumstance, the Board has delegated the determination of the fair value of a security to a Valuation Committee (“Committee”) of MetLife Advisers. The Committee provides general pricing oversight and fair value pricing determinations related to portfolio securities and meets on a regular basis to review reports relating to the valuation of the securities in the Portfolio. The Board has delegated to State Street Bank and Trust Company, the Trust’s custodian (“custodian”), the responsibility for calculating the net asset values (“NAVs”) of the Trust’s Portfolios. The Committee is responsible for overseeing the calculation of the NAVs of the Portfolios by the custodian. The Committee also periodically reviews pricing vendors, including the vendor providing fair value pricing for the Portfolio’s foreign securities, and is responsible for overseeing the correction of pricing errors and addressing other pricing issues that arise in the ordinary course of business, such as making real-time fair value determinations, as necessary.
No single standard for determining the fair value of a security can be set forth because fair value depends upon the facts and circumstances with respect to each security. Information relating to any relevant factors may be obtained by the Committee from any appropriate source, including the subadviser of the Portfolio, the custodian, a pricing service, market maker and/or broker for such security or the issuer. Appropriate methodologies for determining fair value under particular circumstances may include: matrix pricing, comparisons of securities with comparable characteristics, value based on multiples of earnings, discount from market price of similar marketable securities or a combination of these and other methods. The Committee maintains a detailed report tracking each fair-valued security that compares the fair value price to the next available trade, vendor or broker price, and provides information on how close the fair value price was to the next quoted price. The Committee reviews a summary of such report monthly. On a quarterly basis, the Board is provided with the following for consideration and ratification or adjustment: (1) a memorandum summarizing the actions taken by the Committee in the prior quarter; and (2) a list of the Portfolio’s securities as of the most recent quarter-end for which market quotations were not readily available.
Investment Transactions and Related Investment Income - Portfolio security transactions are recorded on the trade date. Dividend income is recorded on the ex-dividend date or, for certain foreign securities, when notified. Interest income, which includes amortization of premium and accretion of discount on debt securities, is recorded on the accrual basis. Realized gains and losses on investments are determined on the identified cost basis, which is the same basis used for federal income tax purposes. Foreign income and foreign capital gains on some foreign securities may be subject to foreign taxes, which are accrued as applicable. These foreign taxes have been provided for in accordance with the Portfolio’s understanding of the applicable countries’ tax rules and rates.
Foreign Currency Translation - The books and records of the Portfolio are maintained in U.S. dollars. The values of securities, currencies, and other assets and liabilities denominated in currencies other than the U.S. dollar are translated into U.S. dollars based upon foreign exchange rates prevailing at the end of the period. Purchases and sales of investment securities, income, and expenses are translated on the respective dates of such transactions. Because the values of investment securities are translated at the foreign exchange rates prevailing at the end of the period, that portion of the results of operations arising from changes in exchange rates and that portion of the results of operations reflecting fluctuations arising from changes in market prices of the investment securities are not separated. Such fluctuations are included in the net realized and unrealized gain or loss on investments.
Net realized foreign exchange gains or losses arise from activity in forward foreign currency exchange contracts, sales of foreign currency, currency gains or losses realized between the trade and settlement dates on securities transactions, and the difference between the amounts of dividends, interest, and foreign withholding taxes recorded by the Portfolio and the U.S. dollar equivalent of
MSF-28
Metropolitan Series Fund
Russell 2000 Index Portfolio
Notes to Financial Statements—December 31, 2013—(Continued)
the amounts actually received or paid by the Portfolio. Net unrealized foreign exchange gains and losses arise from changes in the value of assets and liabilities, other than investment securities, resulting from changes in foreign exchange rates.
Income Taxes - It is the Portfolio’s policy to comply with the requirements of the Internal Revenue Code of 1986, as amended, and regulations thereunder, applicable to regulated investment companies and to distribute, with respect to each taxable year, all of its taxable income to shareholders. Therefore, no federal income tax provision is required. The Portfolio files U.S. federal tax returns. No income tax returns are currently under examination. The Portfolio’s federal tax returns for the prior three fiscal years remain subject to examination by the Internal Revenue Service. As of December 31, 2013, the Portfolio had no uncertain tax positions that would require financial statement recognition, or de-recognition or disclosure.
Dividends and Distributions to Shareholders - The Portfolio records dividends and distributions on the ex-dividend date. Net realized gains from security transactions (if any) are generally distributed annually to shareholders. The timing and characterization of certain income and capital gains distributions are determined in accordance with federal tax regulations that may differ from GAAP. Permanent book and tax basis differences relating to shareholder distributions will result in reclassification between under/over distributed net investment income, accumulated net realized gains/losses, and paid-in surplus. Book-tax differences are primarily due to foreign currency transactions, passive foreign investment companies (PFIC), real estate investment trust (REIT) adjustments, and return of capital dividends. These adjustments have no impact on net assets or the results of operations.
Securities Lending - The Portfolio may lend its portfolio securities to certain qualified brokers who borrow securities in order to complete certain securities transactions. By lending its portfolio securities, the Portfolio attempts to increase its net investment income through the receipt of income on collateral held from securities on loan. Any gain or loss in the market price of the loaned securities that might occur and any interest earned or dividends declared during the term of the loan would accrue to the account of the Portfolio.
The Trust has entered into a securities lending arrangement with the custodian. Under this arrangement, the custodian is authorized to loan portfolio securities on the Portfolio’s behalf. In exchange, the Portfolio receives either cash or securities as collateral against the loaned securities. The Portfolio receives collateral at least equal to 102% of the market value of the loaned securities (105% for foreign equity securities), at each loan’s inception. Collateral representing at least 100% of the market value of the loaned securities must be maintained for the duration of the loan. A liability for cash collateral is reflected on the Statement of Assets and Liabilities, and is categorized as Level 2 within the fair value hierarchy. Cash collateral is generally invested in the State Street Navigator Securities Lending MET Portfolio (the “Navigator Portfolio”), a series of the State Street Navigator Securities Lending Trust that is managed by an affiliate of the custodian. The Navigator Portfolio is a registered money market fund that invests in a variety of high-quality, U.S. dollar-denominated instruments. If the market value of the collateral at the close of trading on a business day is less than 100% of the market value of the loaned securities at the close of trading on that day, the borrower shall be required to deliver, by the close of business on the following business day, an additional amount of collateral, so that the total amount of posted collateral is equal to at least 100% of the market value of all the loaned securities as of such preceding day. A portion of net income (income after the deduction of expenses and fees of the Navigator Portfolio) on the collateral is rebated to the borrower of the securities and the remainder is split between the custodian and the Portfolio. On loans collateralized by U.S. Treasuries, a fee is received from the borrower and is allocated between the Portfolio and the custodian. The risks associated with lending portfolio securities include, but are not limited to, possible delays in receiving additional collateral or in the recovery of the loaned securities, possible loss of rights in the collateral should the borrower fail financially, as well as risk of loss in the value of the collateral or the value of the investments made with the collateral. The lending agent has agreed to indemnify the Portfolio in the case of default of any securities borrower. Income received by the Portfolio in securities lending transactions during the year ended December 31, 2013 is reflected as Securities lending income on the Statement of Operations. Any outstanding loans by the Portfolio at December 31, 2013 are disclosed in the footnotes to the Schedule of Investments.
3. Investments in Derivative Instruments
Futures Contracts - The Portfolio may buy and sell futures contracts as a hedge, to maintain investment exposure to a target asset class or to enhance return. The Portfolio may be subject to fluctuations in equity prices, interest rates, commodity prices, and foreign currency exchange rates in the normal course of pursuing its investment objective. Futures contracts are standardized agreements to buy or sell a security, or deliver a final cash settlement price in connection with an index, interest rate, currency, or other asset. The Portfolio must deposit an amount (“initial margin”) equal to a certain percentage of the face value of the futures contract. The initial margin may be in the form of cash or securities, which is returned when the Portfolio’s obligations under the contract have been satisfied. If cash is deposited as the initial margin, it is shown as cash collateral on the Statement of Assets and Liabilities. Futures contracts are marked-to-market daily, and subsequent payments (“variation margin”) are made or received by the Portfolio depending on whether unrealized gains or losses are incurred. These amounts are reflected as receivables or payables on the Statement of Assets and Liabilities and as a component of net change in unrealized appreciation/depreciation on the Statement of Operations. When the contract is closed or expires, the Portfolio records a realized gain or loss equal to the difference between the value of the contract at the time it was opened and the value at the time it was closed. Risks of entering into futures contracts (and related options) include
MSF-29
Metropolitan Series Fund
Russell 2000 Index Portfolio
Notes to Financial Statements—December 31, 2013—(Continued)
the possibility that the market for these instruments may be illiquid and that a change in the value of the contract or option may not correlate perfectly with changes in the value of the underlying instrument. Futures contracts are exchange-traded and the exchange’s clearinghouse, as counterparty to all exchange-traded futures, guarantees the futures contracts against default. For over-the-counter futures the Portfolio’s ability to terminate the positions may be more limited than in the case of exchange-traded positions and may also involve the risk that securities dealers participating in such transactions would fail to meet their obligations to the Portfolio.
At December 31, 2013, the Portfolio had the following derivatives, categorized by risk exposure:
| | | | | | |
| | | Asset Derivatives | |
Risk Exposure | | Statement of Assets &
Liabilities Location | | Fair Value | |
Equity | | Unrealized appreciation on futures contracts* | | $ | 1,247,648 | |
| | | | | | |
| | * | Includes cumulative appreciation/depreciation of futures contracts as reported in the Schedule of Investments. Only the current day’s variation margin is reported within the Statement of Assets and Liabilities. |
Transactions in derivative instruments during the year ended December 31, 2013 were as follows:
| | | | |
Statement of Operations Location—Net Realized Gain (Loss) | | Equity | |
Futures contracts | | $ | 5,402,927 | |
| | | | |
| |
Statement of Operations Location—Net Change in Unrealized Appreciation (Depreciation) | | Equity | |
Futures contracts | | $ | 1,001,108 | |
| | | | |
For the year ended December 31, 2013, the average amount or number per contract outstanding for each derivative type was as follows:
| | | | |
Derivative Description | | Average
Notional Par or
Face Amount‡ | |
Futures contracts long | | $ | 19,700 | |
| | ‡ | Averages are based on activity levels during 2013. |
4. Certain Risks
Market Risk: In the normal course of business, the Portfolio invests in securities and enters into transactions where risks exist due to fluctuations in the market (market risk) or failure of the other party to a transaction to perform (credit and counterparty risk). The value of securities held by the Portfolio may decline in response to certain events, including those directly involving the companies whose securities are owned by the Portfolio; conditions affecting the general economy; overall market changes; local, regional or global political, social or economic instability; currency, interest rate, and price fluctuations.
Credit and Counterparty Risk: The Portfolio may be exposed to counterparty risk, or the risk that an entity with which the Portfolio has unsettled or open transactions may default. The potential loss could exceed the value of the financial assets and liabilities recorded in the financial statements. Financial assets that potentially expose the Portfolio to credit and counterparty risk consist principally of cash due from counterparties and investments. The Portfolio manages counterparty risk by entering into agreements only with counterparties that it believes have the financial resources to honor their obligations and by monitoring the financial stability of those counterparties. The Portfolio’s investment adviser attempts to mitigate counterparty risk by (i) periodically assessing the creditworthiness of its trading partners, (ii) monitoring and/or limiting the amount of its net exposure to each individual counterparty based on its assessment, and (iii) requiring collateral from the counterparty for certain transactions. In order to preserve certain safeguards for non-standard settlement trades, the Portfolio restricts its exposure to credit and counterparty losses by entering into master netting agreements with counterparties (approved brokers) with whom it undertakes a significant volume of transactions. Master Agreements govern the terms of certain transactions, and reduce the counterparty risk associated with relevant transactions by specifying credit protection mechanisms and providing standardization that improves legal certainty. Master Agreements can also help limit counterparty risk by specifying collateral posting arrangements at pre-arranged exposure levels. Collateral requirements may differ by type of derivative or investment, as applicable. Collateral or margin requirements are set by the broker or exchange clearing house for exchange traded derivatives (e.g., futures contracts and exchange traded options) while collateral terms are contract specific for over-the-counter traded derivatives (e.g., forward foreign currency exchange contracts, swap agreements and over-the-counter options).
MSF-30
Metropolitan Series Fund
Russell 2000 Index Portfolio
Notes to Financial Statements—December 31, 2013—(Continued)
Customer Account Agreements and related addendums govern cleared derivatives transactions such as futures, options on futures, and cleared OTC derivatives. Cleared derivative transactions require posting of initial margin as determined by each relevant clearing agency which is segregated at a broker account registered with the Commodities Futures Trading Commission (CFTC), or the applicable regulator. In the U.S., counterparty risk is significantly reduced as creditors of the futures broker do not have claim to Portfolio assets in the segregated account. Additionally, portability of exposure in the event of default further reduces risk to the Portfolio. Variation margin, or changes in market value, are exchanged daily, but may not be netted between futures and cleared OTC derivatives.
Additional risks associated with each type of investment are described above within the respective security type notes. The Portfolio’s prospectus includes a discussion of the principal risks of investing in the Portfolio.
5. Investment Transactions
Aggregate cost of purchases and proceeds of sales of investment securities, excluding short-term securities, for the year ended December 31, 2013 were as follows:
| | | | | | | | | | | | |
Purchases | | | Sales | |
U.S. Government | | Non U.S. Government | | | U.S. Government | | | Non U.S. Government | |
| $0 | | $ | 192,626,707 | | | $ | 0 | | | $ | 202,362,769 | |
6. Investment Management Fees and Other Transactions with Affiliates
Investment Management Agreement - MetLife Advisers is the investment adviser to the Portfolio. The Trust has entered into an investment management agreement with MetLife Advisers with respect to the Portfolio. For providing investment management services to the Portfolio, MetLife Advisers receives monthly compensation at the annual rate of 0.250% of average daily net assets. Fees earned by MetLife Advisers with respect to the Portfolio for the year ended December 31, 2013 were $1,945,541.
MetLife Advisers has entered into an investment subadvisory agreement with MetLife Investment Management, LLC (“MIM”) with respect to the Portfolio. For providing subadvisory services to the Portfolio, MetLife Advisers has agreed to pay MIM an investment subadvisory fee for each class of the Portfolio as follows::
| | |
% per annum | | Average Daily Net Assets |
| 0.040% | | On the first $500 million |
| 0.030% | | Of the next $500 million |
| 0.015% | | On amounts over $1 billion |
Fees earned by MIM with respect to the Portfolio for the year ended December 31, 2013 were $283,465.
Management Fee Waivers - Pursuant to an expense agreement, MetLife Advisers has agreed, for the period April 29, 2013 through April 27, 2014, to reduce its advisory fees set out above under “Investment Management Agreement” for each class of the Portfolio as follows:
| | |
% per annum | | Average Daily Net Assets |
| 0.005% | | Over $500 million and under $1 billion |
| 0.010% | | Of the next $1 billion |
| 0.015% | | On amounts over $2 billion |
An identical expense agreement was in place for the period April 30, 2012 through April 28, 2013. Amounts waived for the year ended December 31, 2013 are shown as management fee waivers in the Statement of Operations.
Certain officers and trustees of the Trust may also be officers of MetLife Advisers; however, such officers and trustees receive no compensation from the Trust.
Transfer Agency Agreement - MetLife serves as the transfer agent for the Trust. MetLife receives no fees for its services to the Trust under the transfer agency agreement.
Distribution and Service Fees - The Trust has a distribution agreement with MetLife Investors Distribution Company (“MIDC” or the “Distributor”) in which MIDC serves as the distributor for the Portfolio’s Class A, B, E, and G Shares. MIDC is a wholly-owned subsidiary of MetLife Investors Group, Inc., an affiliate of the Adviser. The Trust has also adopted a Distribution and Service Plan under Rule 12b-1 of the 1940 Act for the Portfolio’s Class B, E, and G Shares. Under the Distribution and Service Plan, the Class B, E, and G Shares of the Portfolio pay a fee to compensate the Insurance Companies (or their affiliates) and other broker-dealers and financial intermediaries involved in the offer and sale of Portfolio shares for promoting or selling and servicing the Class B, E, and G
MSF-31
Metropolitan Series Fund
Russell 2000 Index Portfolio
Notes to Financial Statements—December 31, 2013—(Continued)
Shares of the Portfolio. The fees under the Distribution and Service Plan for each class of the Portfolio’s shares are calculated as a percentage of the Portfolio’s average daily net assets that are attributable to that Class. Currently, the fee is 0.25% per year for Class B Shares, 0.15% per year for Class E Shares, and 0.30% per year for Class G Shares. Amounts incurred by the Portfolio for the year ended December 31, 2013 are shown as Distribution and service fees in the Statement of Operations.
Deferred Trustee Compensation - Each Trustee who is not currently an employee of the Adviser or any of its affiliates receives compensation from the Trust for his or her service to the Trust. A deferred compensation plan (the “Plan”) is available to the Trustees on a voluntary basis. Deferred amounts remain in the Trust until distributed in accordance with the provisions of the Plan. The value of a participating Trustee’s deferral account is based on theoretical investments of deferred amounts, on the normal payment dates in certain portfolios of the Trust or Met Investors Series Trust, an affiliate of the Trust, as designated by the participating Trustee. Changes in the value of participants’ deferral accounts are reflected as Trustees’ fees and expenses in the Statement of Operations. The portion of the accrued obligations allocated to the Portfolio under the Plan is reflected as Deferred trustees’ fees in the Statement of Assets and Liabilities.
7. Contractual Obligations
Under the Trust’s organizational documents, its officers and Trustees may be indemnified against certain liabilities and expenses arising out of the performance of their duties to the Trust. Additionally, the Trust has a variety of indemnification obligations under contracts with its service providers. The Trust’s maximum exposure under these arrangements is unknown, as this would involve future claims that may be made against the Trust that have not yet occurred.
8. Income Tax Information
The tax character of distributions paid for the periods ended December 31, 2013 and 2012 was as follows:
| | | | | | | | | | | | | | | | | | | | |
Ordinary Income | | | Long-Term Capital Gain | | | Total | |
2013 | | 2012 | | | 2013 | | | 2012 | | | 2013 | | | 2012 | |
| $11,245,758 | | $ | 6,770,218 | | | $ | — | | | $ | — | | | $ | 11,245,758 | | | $ | 6,770,218 | |
As of December 31, 2013, the components of distributable earnings (accumulated losses) on a federal income tax basis were as follows:
| | | | | | | | | | | | | | | | | | | | |
Undistributed
Ordinary
Income | | Undistributed
Long-Term
Capital Gain | | | Net
Unrealized
Appreciation | | | Loss Carryforwards | | | Other
Accumulated
Capital Losses | | | Total | |
| $9,509,767 | | $ | 19,575,039 | | | $ | 266,251,606 | | | $ | — | | | $ | — | | | $ | 295,336,412 | |
The Portfolio utilizes the provisions of the federal income tax laws that provide for the carryforward of capital losses for prior years, offsetting such losses against any future realized capital gains. Under the Regulated Investment Company Modernization Act of 2010 (the “Act”), net capital losses recognized after December 22, 2010 may be carried forward indefinitely and their character is retained as short-term and/or long-term losses. Previously, net capital losses were carried forward for up to eight years and treated as short-term losses. As a transition rule, the Act requires that post-enactment net capital losses be used before pre-enactment net capital losses.
During the year ended December 31, 2013, the Portfolio utilized capital loss carryforwards of $31,464,592.
As of December 31, 2013, the Portfolio had no post-enactment accumulated capital losses and no pre-enactment accumulated capital loss carryforwards.
MSF-32
Metropolitan Series Fund
Russell 2000 Index Portfolio
Report of Independent Registered Public Accounting Firm
To the Shareholders of Russell 2000 Index Portfolio and the Board of Trustees of Metropolitan Series Fund:
We have audited the accompanying statement of assets and liabilities, including the schedule of investments, of Russell 2000 Index Portfolio, one of the portfolios constituting Metropolitan Series Fund (the “Trust”) as of December 31, 2013, and the related statement of operations for the year then ended, the statements of changes in net assets for each of the two years in the period then ended, and the financial highlights for each of the five years in the period then ended. These financial statements and financial highlights are the responsibility of the Trust’s management. Our responsibility is to express an opinion on these financial statements and financial highlights based on our audits.
We conducted our audits in accordance with the standards of the Public Company Accounting Oversight Board (United States). Those standards require that we plan and perform the audit to obtain reasonable assurance about whether the financial statements and financial highlights are free of material misstatement. The Trust is not required to have, nor were we engaged to perform, an audit of its internal control over financial reporting. Our audits included consideration of internal control over financial reporting as a basis for designing audit procedures that are appropriate in the circumstances, but not for the purpose of expressing an opinion on the effectiveness of the Trust’s internal control over financial reporting. Accordingly, we express no such opinion. An audit also includes examining, on a test basis, evidence supporting the amounts and disclosures in the financial statements, assessing the accounting principles used and significant estimates made by management, as well as evaluating the overall financial statement presentation. Our procedures included confirmation of securities owned as of December 31, 2013, by correspondence with the custodian and brokers; where replies were not received from brokers, we performed other auditing procedures. We believe that our audits provide a reasonable basis for our opinion.
In our opinion, the financial statements and financial highlights referred to above present fairly, in all material respects, the financial position of Russell 2000 Index Portfolio of Metropolitan Series Fund, as of December 31, 2013, the results of its operations for the year then ended, the changes in its net assets for each of the two years in the period then ended, and the financial highlights for each of the five years in the period then ended, in conformity with accounting principles generally accepted in the United States of America.
Deloitte & Touche LLP
Boston, Massachusetts
February 27, 2014
MSF-33
Metropolitan Series Fund
Trustees and Officers of Metropolitan Series Fund
The Trustees and executive officers of the Trust, their ages and their principal occupations during the past five years are set forth below. Unless otherwise indicated, the business address of each is One Financial Center, Boston, MA 02111. Each Trustee who is deemed an “interested person,” as such term is defined in the 1940 Act, is indicated by an asterisk. Those Trustees who are not “interested persons” as defined in the 1940 Act are referred to as “Independent Trustees.” Additional information about the Trustees is available in the Statement of Additional Information, which is available without charge, upon request, by calling (800) 848-3854.
Trustees of the Trust
| | | | | | | | | | |
Name and Age | | Position(s)
Held with
Registrant | | Term of Office and
Length of Time
Served | | Principal Occupation(s) During the
Past 5 Years(1) | | Number of
Portfolios
in Fund
Complex(2)
overseen | | Other Directorships Held
by Trustee During the
Past 5 Years(1) |
| Interested Trustee | | | | | | | | | | |
| Elizabeth M. Forget* (47) | | Trustee, Chairman of the Board, President and Chief Executive Officer | | Indefinite; From May 2006 (President and Chief Executive Officer)/ August 2006 (Trustee and Chairman of the Board) to present | | Senior Vice President, MetLife Inc.; President, MetLife Advisers, LLC and a predecessor company. | | 79 | | Trustee, Met Investors Series Trust (the “MIST Trust”);** various MetLife-affiliated boards. |
| | | | | |
| Independent Trustees | | | | | | | | | | |
| Stephen M. Alderman (54) | | Trustee | | Indefinite; From April 2012 to present | | Shareholder in the law firm of Garfield & Merel, Ltd. | | 79 | | Trustee, MIST Trust;** Director, International Truck Leasing Corp. |
| | | | | |
| Robert J. Boulware (57) | | Trustee | | Indefinite; From April 2012 to present | | Managing Director, Pilgrim Funds, LLC (private equity fund). | | 79 | | Trustee, MIST Trust;** Trustee, Vertical Capital Income Fund (closed-end fund); Director, Gainsco, Inc. (auto insurance). |
| | | | | |
| Susan C. Gause (61) | | Trustee | | Indefinite; From April 2012 to present | | Private Investor. | | 79 | | Trustee, MIST Trust;** Trustee, HSBC Funds. |
| | | | | |
| Nancy Hawthorne (62) | | Trustee | | Indefinite; From May 2003 to present | | Chief Executive Officer, Clerestory LLC (corporate advisor). | | 79 | | MIST Trust;** Director, THL Credit, Inc.**; Director, Avid Technology, Inc.** |
| | | | | |
| Barbara A. Nugent (57) | | Trustee | | Indefinite; From January 2014 to present | | President, True North Board Governance, LLC (consulting); until 2014, partner in the law firm of Stradley Ronon Stevens & Young, LLP. | | 79 | | Trustee, MIST Trust**; Director, Episcopal Healthcare Foundation; until 2014, member, Mutual Fund Directors Forum Advisory Board. |
| | | | | |
| Keith M. Schappert (62) | | Trustee | | Indefinite; From August 2009 to present | | Principal, Schappert Consulting LLC (asset management consulting). | | 79 | | Trustee, MIST Trust;** Director, The Commonfund for Nonprofit Organizations; until 2011, Director, Trilogy Global Advisors; Director, Mirae Asset Discovery Funds,** Director, Calamos Investments. |
| | | | | |
| Linda B. Strumpf (66) | | Trustee | | Indefinite; From May 2000 to present | | Chair of the Investment Committee, Leona M. and Harry B. Helmsley Charitable Trust; until 2011, Chief Investment Officer, Leona M. and Harry B. Helmsley Charitable Trust. | | 79 | | Since 2012, Trustee, MIST Trust,** Trustee and Member of Investment Committee, The Pennsylvania State University. |
| | | | | |
| Dawn M. Vroegop (47) | | Trustee | | Indefinite; From May 2009 to present | | Private Investor. | | 79 | | Trustee, MIST Trust,** Trustee, Driehaus Mutual Funds; Director and Investment Committee Chair, City College of San Francisco Foundation. |
MSF-34
Metropolitan Series Fund
Trustees and Officers of Metropolitan Series Fund—(Continued)
Executive Officers of the Trust
| | | | | | |
Name and Age | | Position(s) Held with
Registrant | | Term of Office
and Length of
Time Served | | Principal Occupation(s) During Past 5 Years(1) |
| Elizabeth M. Forget (47) | | President, Chief Executive Officer, Trustee and Chairman of the Board | | From May
2006 (President
and Chief
Executive
Officer)/
August 2006
(Trustee and
Chairman of
the Board) to
present | | See principal occupation information in the table above. |
| | | |
| Jeffrey L. Bernier (42) | | Vice President | | From February
2008 to present | | Vice President, MetLife, Inc.; Senior Vice President, MetLife Advisers, LLC and a predecessor company. |
| | | |
| Peter H. Duffy (58) | | Chief Financial Officer and Treasurer | | From November
2000 to present | | Senior Vice President, MetLife Advisers, LLC; Vice President, MetLife, Inc. |
| | | |
| Andrew L. Gangolf (59) | | Secretary | | From May
2011to present | | Senior Vice President, MetLife Advisers, LLC; Senior Vice President & Assistant General Counsel, AllianceBerstein Investments, Inc. |
| | | |
| Jeffrey P. Halperin (46) | | Chief Compliance Officer | | From November
2005 to present | | Vice President, MetLife, Inc.; Chief Compliance Officer, MIST; Chief Compliance Officer, MSF Trust; Chief Compliance Officer, MetLife Advisers, LLC and a predecessor company; Chief Compliance Officer, MetLife Investment Management, LLC (formerly MetLife Investment Advisors Company, LLC). |
| | | |
| Alan C. Leland, Jr. (61) | | Vice President | | From February
2005 to present | | Treasurer and Chief Financial Officer, MetLife Advisers, LLC; Vice President, MetLife Group Inc.; Vice President, MetLife, Inc. |
| * | Ms. Forget is an “interested person” of the Trust because of her positions with MetLife Advisers, LLC and her ownership of securities issued by MetLife, Inc., the ultimate parent company of MetLife Advisers, LLC. |
| ** | Indicates a directorship with a registered investment company or a company subject to the reporting requirements of the Securities Exchange Act of 1934, as amended. |
| (1) | Previous positions during the past five years with the Trust, MetLife, Inc. or the Adviser are omitted if not materially different. |
| (2) | The Fund Complex includes 49 Portfolios of the MIST Trust and 30 Portfolios of the Trust. |
MSF-35
Metropolitan Series Fund
Russell 2000 Index Portfolio
Board of Trustees’ Consideration of Advisory and Sub-Advisory Agreements
At an in-person meeting of the Boards of Trustees (the “Board”) of Met Investors Series Trust and Metropolitan Series Fund (“MIST” and “MSF,” respectively, and collectively, the “Trusts”) held on November 19-20, 2013, the Board, including a majority of the Trustees who are not considered to be “interested persons” of the Trusts (the “Independent Trustees”) under the Investment Company Act of 1940, as amended (the “1940 Act”), approved for an annual period the continuation of each Trust’s advisory agreement (the “Advisory Agreement”) with MetLife Advisers, LLC (the “Adviser”) and the applicable sub-advisory agreements (each a “Sub-Advisory Agreement,” and collectively with the Advisory Agreement, the “Agreements”) between the Adviser and the investment sub-advisers (each a “Sub-Adviser,” and collectively, the “Sub-Advisers”) for each of the series of the Trusts, including the Russell 2000 Index Portfolio (each a “Portfolio,” and collectively, the “Portfolios”).1
In considering the Agreements, the Board reviewed a variety of materials provided by the Adviser and the Sub-Advisers relating to the Portfolios, including comparative performance, fee and expense information for an appropriate peer group of similar mutual funds, performance information for relevant benchmark indices and other information regarding the nature, extent and quality of services provided by the Adviser and the Sub-Advisers under their respective Agreements. The Board also took into account its experience with the Adviser and the Sub-Advisers and information provided to the Board in its meetings throughout the year with respect to the services provided by the Adviser and the Sub-Advisers, including quarterly performance reports prepared by management containing reviews of investment results, and periodic presentations from certain of the Sub-Advisers with respect to the Portfolios they manage. The Independent Trustees also assessed reports provided by the Board’s independent consultant, who reviewed and provided analyses regarding investment performance, fees and expenses, and other information provided by, or at the direction of, the Adviser and the Sub-Advisers, as more fully discussed below.
The Independent Trustees were separately advised by independent legal counsel throughout the process, and met with independent legal counsel in periodic executive sessions. Prior to voting to continue the Agreements at the November meeting, the Independent Trustees also received a memorandum from their independent counsel discussing the legal standards for their consideration of the proposed continuation of the Agreements. The Board also met in person with personnel of the Adviser on September 17, 2013 for the specific purpose of giving preliminary consideration to the proposed continuation of the Agreements and to request additional information they considered reasonably necessary to their deliberations. The Independent Trustees also discussed the proposed continuation of the Agreements in private sessions with their independent legal counsel at which no representatives of management were present.
In considering whether to approve the renewal of the Advisory Agreement with the Adviser and any applicable Sub-Advisory Agreements with respect to a Portfolio, the Board reviewed and analyzed the factors it deemed relevant, including: (1) the nature, extent and quality of the services to be provided to the Portfolios by the Adviser and the Sub-Advisers; (2) the performance of the Portfolios as compared to a peer group and an appropriate index; (3) the Adviser’s and each of the Sub-Adviser’s personnel and operations; (4) the financial condition of the Adviser and of the Sub-Advisers; (5) the level and method of computing each Portfolio’s advisory and sub-advisory fees; (6) the profitability of the Adviser under the Advisory Agreement and of certain of the Sub-Advisers under the Sub-Advisory Agreements; (7) any “fall-out” benefits to the Adviser, the Sub-Advisers and their affiliates (i.e., ancillary benefits realized by the Adviser, the Sub-Advisers or their affiliates from the Adviser’s or Sub-Advisers’ relationship with the Trusts); (8) the anticipated effect of growth in size on Portfolio expenses; (9) fees paid to certain of the Sub-Advisers by comparable institutional and retail accounts; and (10) possible conflicts of interest.
Nature, extent and quality of services. The Board evaluated the nature, extent and quality of the services that the Adviser, and the Sub-Advisers as relevant, have provided to the Portfolios. The Board considered the Adviser’s services as investment manager to the Portfolios, including services relating to the selection and oversight of the Sub-Advisers for the applicable Portfolios. The Board considered, among other things, the Adviser’s oversight of the provision of services to the Portfolios by the Sub-Advisers, including with respect to investment activities and trading practices, and the Sub-Adviser’s compliance with fund policies, objectives and Board directives, compliance policies and procedures and applicable law. The Adviser’s services in coordinating and overseeing the activities of the Trusts’ other service providers were also considered. The Board also evaluated the expertise and performance of the personnel of the Adviser who performed services for the Portfolios throughout the year.
The Board considered information received from the Trust’s Chief Compliance Officer (“CCO”) regarding the Portfolios’ compliance policies and procedures established pursuant to Rule 38a-l under the 1940 Act. The Board also evaluated the CCO’s ongoing reports concerning the CCO’s oversight of the risk assessment processes of the Sub-Advisers.
1 The Pyramis Managed Risk Portfolio recently commenced operations and, therefore, the Agreement with respect to this Portfolio was not up for renewal.
MSF-36
Metropolitan Series Fund
Russell 2000 Index Portfolio
Board of Trustees’ Consideration of Advisory and Sub-Advisory Agreements—(Continued)
With respect to the services provided by each of the Sub-Advisers, the Board considered, among other things, information provided to the Board by each Sub-Adviser. The Board considered the Sub-Adviser’s current level of staffing and its overall resources, as well as its compensation program. The Board reviewed each Sub-Adviser’s history and investment experience, as well as information regarding the qualifications, background and responsibilities of the Sub-Adviser’s investment and compliance personnel who provide services to the Portfolios. The Board also considered, among other things, the Sub-Adviser’s compliance program and any disciplinary history. The Board also took into account the Sub-Adviser’s risk assessment and monitoring process. The Board noted each Sub-Adviser’s regulatory history, including whether it was currently involved in any regulatory actions or investigations as well as material litigation, and any settlements and amelioratory actions undertaken, as appropriate. The Board also noted that the CCO and his staff conduct regular, periodic compliance reviews with each of the Sub-Advisers and present reports to the Independent Trustees regarding the same, which includes evaluating the regulatory compliance systems of the Sub-Advisers and procedures reasonably designed by them to help assure compliance with the federal securities laws, including issues related to late trading and market timing, best execution, fair value pricing, and proxy voting procedures, among others. The Board also took into account the financial condition of each Sub-Adviser. In its review, the Board also received and took into account information regarding any services and/or payments provided to the Adviser by the Sub-Advisers in connection with marketing activities.
The Board considered each Sub-Adviser’s investment process and philosophy. The Board took into account that each Sub-Adviser’s responsibilities include the development and maintenance of an investment program for the applicable Portfolio which is consistent with the Portfolio’s investment objectives, the selection of investment securities and the placement of orders for the purchase and sale of such securities, as well as the implementation of compliance controls related to performance of these services. The Board also reviewed each Sub-Adviser’s brokerage policies and practices.
Performance. The Board considered the performance of the Portfolios as described in the quarterly reports prepared by management, and as also analyzed in reports prepared by the Independent Trustees’ independent consultant. The Board noted that the Adviser reviews with the Board on a quarterly basis detailed information about the Portfolios’ performance results, portfolio composition and investment strategies. The Board also reviewed and considered a separate report prepared by Lipper Inc. (“Lipper��), an independent third party, which provided a statistical analysis comparing the Portfolios’ investment performance, expenses, and fees to comparable funds underlying variable insurance products (the “Performance Universe”). In addition, the Independent Trustees met separately with a representative of Bobroff Consulting, Inc., an independent consultant (“Bobroff), at a special board meeting in September 2013, to review the separate reports prepared by such consultant (“Bobroff Report”), which analyzed the report prepared by Lipper. The Board also considered each Portfolio’s more recent performance subsequent to the performance period covered by the Lipper reports, and management’s discussion of the same, including the effect of current market conditions on each Portfolio’s more recent performance.
The Board reviewed the Portfolios’ performance records and the Adviser’s and Sub-Advisers’ management styles and long-term performance records with the Portfolios and comparable funds. The Board focused particular attention on Portfolios with less favorable performance records. The Board was mindful of the Adviser’s focus on each Sub-Adviser’s performance and noted that the Adviser has been active in monitoring and responding to any performance issues with respect to the Portfolios. The Board also took into account its discussions with management regarding factors that contributed to the performance of the Portfolios.
Among other data relating specifically to the Russell 2000 Index Portfolio’s performance, the Board considered that the Portfolio outperformed the median of its Performance Universe and its Lipper Index for the one-, three- and five-year periods ended June 30, 2013. The Board also considered that the Portfolio underperformed its benchmark, the Russell 2000 Index, for the one-, three- and five-year periods ended October 31, 2013.
Fees and Expenses. The Board gave consideration to the advisory fees payable under the Advisory Agreement and the sub-advisory fees payable under each of the Sub-Advisory Agreements. In this regard, the Board reviewed the advisory fees payable on a Portfolio-by-Portfolio basis based on information provided by the Adviser. The Independent Trustees, with the assistance of Bobroff, also examined the fees paid by a Portfolio in light of fees paid to other investment managers by comparable funds, as well as considered the fees charged by the Adviser to manage other comparable funds, as applicable. The Lipper report included comparisons of the Adviser’s fee schedule with that of its peers based on an asset-based analysis of relative fee structures according to the size of the Portfolio. In addition, the Board considered the Portfolios’ advisory and sub-advisory fees and total expenses as compared to similarly situated investment companies underlying variable insurance products deemed to be comparable to the Portfolios as determined by Lipper. The Board considered a Portfolio’s ranking within a smaller group of peer funds chosen by Lipper (the “Expense Group”), as well as the Portfolio’s ranking within broader groups of funds (the “Expense Universe” and the “Sub-advised Expense Universe”). The Board also considered a Portfolio’s contractual sub-advisory fees, as applicable, as compared to the Sub-advised Expense Universe as well as a
MSF-37
Metropolitan Series Fund
Russell 2000 Index Portfolio
Board of Trustees’ Consideration of Advisory and Sub-Advisory Agreements—(Continued)
smaller group of funds (the “Sub-advised Expense Group”). In comparing a Portfolio’s actual and contractual management fee to that of comparable funds, the Board noted that such fee includes both advisory and administrative fees.
The Board noted that the sub-advisory fees for the Portfolios are paid by the Adviser, not the Portfolios, out of the advisory fee. It was further noted that the Adviser negotiates such fees at arm’s length. The Board also considered that the Adviser had entered into expense limitation agreements with certain of the Portfolios, pursuant to which the Adviser has agreed to waive a portion of its advisory fee and/or reimburse certain expenses as a means of limiting a Portfolio’s total annual operating expenses. The Board further considered the amount of sub-advisory fees paid out by the Adviser and the amount of the management fees that it retained in light of the services performed by Sub-Advisers and Adviser, respectively.
With respect to the Russell 2000 Index Portfolio, the Board considered that the Portfolio’s actual management fees and total expenses (exclusive of 12b-1 fees) were below the median of the Expense Group, the Expense Universe and the Sub-advised Expense Universe. The Board further noted that the Portfolio’s contractual management fees were below the asset-weighted average of the Expense Group at the Portfolio’s current size. The Board also noted that the Portfolio’s contractual sub-advisory fees were below the average of the Sub-advised Expense Group and the Sub-advised Expense Universe at the Portfolio’s current size. The Board further noted that the Adviser had waived fees and/or reimbursed expenses during the past year.
Profitability. The Board examined the profitability of the Adviser on a Portfolio-by-Portfolio basis. The Board also considered that the Distributor, MetLife Investors Distribution Company, receives Rule 12b-1 payments to support the distribution of the products. The Board considered the profitability to the Sub-Advisers and their affiliates as a result of their relationships with the Portfolios, and the Board considered the ability of the Adviser to negotiate the Sub-Advisory Agreements and the fees thereunder at arm’s length. The Board also reviewed Portfolio specific data with regard to the profitability of the Portfolios to each Sub-Adviser, as available.
Economies of scale. The Board also considered the effect of the Portfolios’ growth in size on their fees. The Board noted that the fee schedules for most of the Portfolios contain breakpoints that reduce the fee rate above specified asset levels. The Board noted those Portfolios that did not contain breakpoints in the advisory fee and took into account management’s discussion of the same. The Board noted that those Portfolios with advisory fee schedules containing breakpoints generally reflect the inclusion of breakpoints in the sub-advisory fee schedule for such Portfolios. The Board considered the effective fees under the Advisory Agreement for a Portfolio as a percentage of assets at different asset levels and possible economies of scale that may be realized if the assets of the Portfolio grow. Among other data, the Board examined the effect of a Portfolio’s growth in size on various fee schedules and reviewed the Lipper and Bobroff Reports, which compared fees among peers. The Board also generally noted that if a Portfolio’s assets increase over time, the Portfolio may realize other economies of scale if assets increase proportionally more than certain other fixed expenses. In addition, the Board noted that the Adviser had taken a number of steps to date intended to share the benefits of economies of scale with contractholders.
With respect to the Russell 2000 Index Portfolio, the Board noted that the Portfolio’s advisory fee does not contain breakpoints. The Board noted that the Portfolio’s management fees were below the asset-weighted average of comparable funds at all asset levels. The Board considered the effect of the Portfolio’s current size and potential growth on its performance and fees. The Board noted management’s discussion of the Portfolio’s advisory fee structure. The Board also noted that if the Portfolio’s assets increased over time, the Portfolio might realize other economies of scale if assets increased proportionally more than certain other fixed expenses.
Other factors. As part of its evaluation of the Adviser’s compensation, the Board considered other benefits that may be realized by the Adviser and its affiliates from their relationship with the Trusts. Among them, the Board recognized that an affiliate of the Adviser, MetLife Investors Distribution Company, serves as the Distributor for the Trusts, and, as such, receives payments pursuant to Rule 12b-1 from the Portfolios to compensate it for providing shareholder services and selling activities, which could lead to growth in the Trusts’ assets and corresponding benefits from such growth, including economies of scale. The Board also considered that affiliates of the Adviser may benefit from certain indirect tax benefits relating to dividend received deductions and foreign tax credits. In conjunction with these considerations, the Board noted the costs of providing investment management and other services to the Portfolios and the ongoing commitment of the Adviser to the Portfolios.
The Board considered other benefits that may be realized by each Sub-Adviser and its affiliates from their relationship with the Trusts, including the opportunity to provide advisory services to additional portfolios of the Trusts and reputational benefits. In conjunction with these considerations, the Board noted the costs of providing investment advisory services to the Portfolios and the ongoing commitment of the Sub-Advisers to the Portfolios.
MSF-38
Metropolitan Series Fund
Russell 2000 Index Portfolio
Board of Trustees’ Consideration of Advisory and Sub-Advisory Agreements—(Continued)
The Board considered possible conflicts of interest in the form of material benefits or detriments to the Trusts resulting from the nature of the Trusts’ and the Adviser’s or the Sub-Advisers’ affiliations and the services that are provided to the Trusts, and the manner in which such conflicts were mitigated.
Conclusions. After full consideration of the factors discussed above, the Board, including a majority of the Independent Trustees, approved the Advisory Agreement and the Sub-Advisory Agreement, as applicable, with respect to each Portfolio, unless otherwise noted. In making its approvals, the Board concluded that the nature, extent and quality of services provided by the Adviser and each Sub-Adviser supported the renewal of the Agreements. The Board also concluded that the investment performance of each Fund was such that each Agreement should continue. In addition, the Board concluded that fees paid by a Portfolio to the Adviser and, if applicable, the Sub-Adviser appeared to be acceptable in light of nature, extent and quality of the services provided by the Adviser and Sub-Adviser. Further, the Board concluded that the Adviser’s profitability in providing services under the Advisory Agreements did not appear unreasonably high in light of the nature, extent and quality of the services provided by the Adviser. Finally, the Board concluded that the Advisory and Sub-Advisory fees in some measure share economies of scale with contractholders. In approving the renewal of each of the Agreements, the Board, including the Independent Trustees, did not identify any single factor as controlling, and generally attributed different weights to various factors for the various Portfolios. The Board evaluated all information available to them on a Portfolio-by-Portfolio basis, and their decisions were made separately with respect to each Portfolio.
MSF-39
Metropolitan Series Fund
T. Rowe Price Large Cap Growth Portfolio
Managed by T. Rowe Price Associates, Inc.
Portfolio Manager Commentary*
PERFORMANCE
For the one year period ended December 31, 2013, the Class A, B, and E shares of the T. Rowe Price Large Cap Growth Portfolio returned 39.16%, 38.77%, and 38.87%, respectively. The Portfolio’s benchmark, the Russell 1000 Growth Index1, returned 33.48%.
MARKET ENVIRONMENT / CONDITIONS
Major U.S. stock markets generated excellent returns in 2013. Early on, decent employment gains and the Federal Reserve’s the “Fed” quantitative easing program helped to offset concerns about federal tax increases and automatic spending cuts. Equities fell in May after the Fed indicated that it could begin slowing monthly asset purchases, but rallied in September after the slowdown was put on hold. Stocks weakened in October amid political turmoil, but stocks climbed after a temporary solution was reached. Investors welcomed the Fed’s mid-December announcement that it would reduce asset purchases and also keep short-term interest rates low. Small-cap stocks posted the biggest annual gains, followed by mid- and large-caps. As measured by various Russell indexes, growth stocks outperformed value stocks across all market capitalizations.
PORTFOLIO REVIEW / PERIOD-END POSITIONING
The Portfolio turned in positive results and outpaced its benchmark, driven by strong stock selection in the Consumer Discretionary sector. Increased travel spending boosted the share price of priceline.com. The firm continued to take market share from other online travel companies, thanks in part to its smartphone applications that travelers found helpful. Amazon.com’s shares rose during the second half of the year as investors anticipated a strong holiday shopping season. The company’s cloud computing and storage market also grew.
Prudent stock selection among Information Technology companies also contributed to relative results. Google benefited from the popularity of smartphones running its Android operating system, as well as increased advertising sales volume from both traditional and mobile markets. Global payment networks MasterCard and Visa both took advantage of better cost controls and also saw increased consumer credit card use outside the U.S.
Telecommunication Services stock selection and an overweight to the sector detracted from relative returns. Rising interest rates had a negative impact on Real Estate Investment Trusts and tower companies like Crown Castle International, as investors found securities with lower risk profiles but comparable yields.
Weaker stock selection in the Industrials sector also weighed on relative performance. Fastenal suffered from weakness in the construction and mining markets, which make up a large portion of the company’s customer base. Construction recovery has been slow, and weakened commodity prices led to a decline in mining activity. Shares of Roper Industries were up over the year, and the firm generated robust free cash flow, but weaker sales in the company’s energy division caused it to lag the broader Industrials sector.
The Portfolio ended the period with overweights to Telecommunication Services, Energy, and Consumer Discretionary stocks relative to the benchmark. The Portfolio’s positioning in Industrials and Financials were roughly in line with the benchmark. The Portfolio was underweight to the Information Technology, Consumer Staples, Utilities, Materials, and Health Care sectors.
P. Robert Bartolo
Portfolio Manager
T. Rowe Price Associates, Inc.
Effective January 21, 2014, Joseph B. Fath assumed Portfolio Management responsibilities from P. Robert Bartolo for this Portfolio.
* This commentary may include statements that constitute “forward-looking statements” under the U.S. securities laws. Forward-looking statements include, among other things, projections, estimates, and information about possible or future results related to the Portfolio, market or regulatory developments. The views expressed above are not guarantees of future performance or economic results and involve certain risks, uncertainties and assumptions that could cause actual outcomes and results to differ materially from the views expressed herein. The views expressed above are subject to change at any time based upon economic, market, or other conditions and the subadvisory firm undertakes no obligation to update the views expressed herein. Any discussions of specific securities should not be considered a recommendation to buy or sell those securities. The views expressed above (including any forward-looking statement) may not be relied upon as investment advice or as an indication of the Portfolio’s trading intent. Information about the Portfolio’s holdings, asset allocation or country diversification is historical and is not an indication of future Portfolio composition, which may vary. Direct investment in any index is not possible. The performance of any index mentioned in this commentary has not been adjusted for ongoing management, distribution and operating expenses, and sales charges applicable to mutual fund investments. In addition, the returns do not reflect additional fees charged by separate accounts or variable insurance contracts that an investor in the Portfolio may pay. If these additional fees were reflected, performance would have been lower.
MSF-1
Metropolitan Series Fund
T. Rowe Price Large Cap Growth Portfolio
A $10,000 INVESTMENT COMPARED TO THE RUSSELL 1000 GROWTH INDEX

AVERAGE ANNUAL RETURNS (%) (FOR THE YEAR ENDED DECEMBER 31, 2013)
| | | | | | | | | | | | |
| | | 1 Year | | | 5 Year | | | 10 Year | |
| T. Rowe Price Large Cap Growth Portfolio | | | | | | | | | | | | |
Class A | | | 39.16 | | | | 22.41 | | | | 8.77 | |
Class B | | | 38.77 | | | | 22.09 | | | | 8.50 | |
Class E | | | 38.87 | | | | 22.22 | | | | 8.61 | |
| Russell 1000 Growth Index | | | 33.48 | | | | 20.39 | | | | 7.83 | |
1 The Russell 1000 Growth Index is an unmanaged measure of performance of the largest capitalized U.S. companies, within the Russell 1000 companies, that have higher price-to-book ratios and forecasted growth values.
Portfolio performance is calculated including reinvestment of all income and capital gain distributions. Performance numbers are net of all Portfolio expenses but do not include any insurance, sales, separate account or administrative charges of variable annuity or life insurance contracts or any additional expenses that participants may bear relating to the operations of their plans. If these charges were included, the returns would be lower. The performance of any index referenced above has not been adjusted for ongoing management, distribution and operating expenses, and sales charges applicable to mutual fund investments. Direct investment in any index is not possible. The performance of Class A shares, as set forth in the line graph above, will differ from that of other classes because of the difference in expenses paid by policyholders investing in the different share classes.
This information represents past performance and is not indicative of future results. Investment return and principal value may fluctuate so that shares, upon redemption, may be worth more or less than the original cost.
PORTFOLIO COMPOSITION AS OF DECEMBER 31, 2013
Top Holdings
| | | | |
| | | % of
Net Assets | |
| Google, Inc. - Class A | | | 6.2 | |
| Amazon.com, Inc. | | | 5.3 | |
| MasterCard, Inc. - Class A | | | 3.0 | |
| priceline.com, Inc. | | | 3.0 | |
| Apple, Inc. | | | 2.9 | |
| Visa, Inc. - Class A | | | 2.8 | |
| Gilead Sciences, Inc. | | | 2.8 | |
| Crown Castle International Corp. | | | 2.3 | |
| Danaher Corp. | | | 2.2 | |
| Precision Castparts Corp. | | | 2.2 | |
Top Sectors
| | | | |
| | | % of Market Value of
Total Long-Term Investments | |
| Consumer Discretionary | | | 27.7 | |
| Information Technology | | | 26.7 | |
| Industrials | | | 12.5 | |
| Health Care | | | 11.8 | |
| Financials | | | 5.6 | |
| Energy | | | 4.8 | |
| Consumer Staples | | | 4.2 | |
| Materials | | | 3.5 | |
| Telecommunication Services | | | 3.2 | |
MSF-2
Metropolitan Series Fund
T. Rowe Price Large Cap Growth Portfolio
Understanding Your Portfolio’s Expenses
Shareholder Expense Example
As a shareholder of the Portfolio, you incur ongoing costs, including management fees; distribution and service (12b-1) fees; and other Portfolio expenses. This example is intended to help you understand your ongoing costs (in dollars) (referred to as “expenses”) of investing in the Portfolio and compare these costs with the ongoing costs of investing in other mutual funds. The example is based on an investment of $1,000 invested at the beginning of the period and held for the entire period, July 1, 2013 through December 31, 2013.
Actual Expenses
The first line for each share class of the Portfolio in the table below provides information about actual account values and actual expenses. You may use the information in this line, together with the amount you invested in the particular share class of the Portfolio, to estimate the expenses that you paid over the period. Simply divide your account value by $1,000 (for example, an $8,600 account value divided by $1,000 = 8.6), then multiply the result by the number in the first line under the heading entitled “Expenses Paid During Period” to estimate the expenses you paid on your account during this period.
Hypothetical Example for Comparison Purposes
The second line for each share class of the Portfolio in the table below provides information about hypothetical account values and hypothetical expenses based on the Portfolio’s actual expense ratio and an assumed rate of return of 5% per year before expenses, which is not the Portfolio’s actual return. The hypothetical account values and expenses may not be used to estimate the actual ending account balance or expenses you paid for the period. You may use this information to compare the ongoing costs of investing in the Portfolio and other funds. To do so, compare this 5% hypothetical example with the 5% hypothetical examples that appear in the shareholder reports of the other funds.
Please note that the expenses shown in the table are meant to highlight your ongoing costs only and do not reflect any fees or charges of your variable insurance product or any additional expenses that participants in certain eligible qualified plans may bear relating to the operations of their plan. Therefore, the second line for each share class in the table is useful in comparing ongoing costs only, and will not help you determine the relative total costs of owning different funds. In addition, if these other costs were included, your costs would have been higher.
| | | | | | | | | | | | | | | | | | |
T. Rowe Price Large Cap Growth Portfolio | | | | Annualized
Expense
Ratio | | | Beginning
Account Value
July 1,
2013 | | | Ending
Account Value
December 31,
2013 | | | Expenses Paid
During Period**
July 1, 2013
to
December 31,
2013 | |
Class A(a) | | Actual | | | 0.58 | % | | $ | 1,000.00 | | | $ | 1,251.10 | | | $ | 3.29 | |
| | Hypothetical* | | | 0.58 | % | | $ | 1,000.00 | | | $ | 1,022.28 | | | $ | 2.96 | |
| | | | | |
Class B(a) | | Actual | | | 0.83 | % | | $ | 1,000.00 | | | $ | 1,249.10 | | | $ | 4.71 | |
| | Hypothetical* | | | 0.83 | % | | $ | 1,000.00 | | | $ | 1,021.02 | | | $ | 4.23 | |
| | | | | |
Class E(a) | | Actual | | | 0.73 | % | | $ | 1,000.00 | | | $ | 1,250.00 | | | $ | 4.14 | |
| | Hypothetical* | | | 0.73 | % | | $ | 1,000.00 | | | $ | 1,021.53 | | | $ | 3.72 | |
* Hypothetical assumes a rate of return of 5% per year before expenses.
** Expenses paid are equal to the Portfolio’s annualized expense ratio for the most recent six month period, as shown above, multiplied by the average account value over the period, multiplied by the number of days (184 days) in the most recent fiscal half-year, divided by 365 (to reflect the one-half year period).
(a) The annualized expense ratio shown reflects the impact of the management fee waiver as described in Note 6 of the Notes to Financial Statements.
MSF-3
Metropolitan Series Fund
T. Rowe Price Large Cap Growth Portfolio
Schedule of Investments as of December 31, 2013
Common Stocks—98.9% of Net Assets
| | | | | | | | |
| Security Description | | Shares | | | Value | |
|
Aerospace & Defense—3.8% | |
Boeing Co. (The) | | | 309,000 | | | $ | 42,175,410 | |
Precision Castparts Corp. | | | 217,080 | | | | 58,459,644 | |
| | | | | | | | |
| | | | | | | 100,635,054 | |
| | | | | | | | |
|
Air Freight & Logistics—0.7% | |
United Parcel Service, Inc. - Class B | | | 182,800 | | | | 19,208,624 | |
| | | | | | | | |
|
Airlines—0.7% | |
Delta Air Lines, Inc. | | | 321,100 | | | | 8,820,617 | |
United Continental Holdings, Inc. (a) | | | 289,200 | | | | 10,940,436 | |
| | | | | | | | |
| | | | | | | 19,761,053 | |
| | | | | | | | |
|
Automobiles—0.8% | |
Harley-Davidson, Inc. | | | 151,400 | | | | 10,482,936 | |
Tesla Motors, Inc. (a) (b) | | | 69,490 | | | | 10,449,906 | |
| | | | | | | | |
| | | | | | | 20,932,842 | |
| | | | | | | | |
|
Beverages—0.8% | |
Monster Beverage Corp. (a) | | | 124,700 | | | | 8,450,919 | |
PepsiCo, Inc. | | | 147,800 | | | | 12,258,532 | |
| | | | | | | | |
| | | | | | | 20,709,451 | |
| | | | | | | | |
|
Biotechnology—7.7% | |
Alexion Pharmaceuticals, Inc. (a) | | | 119,540 | | | | 15,905,992 | |
Biogen Idec, Inc. (a) | | | 169,990 | | | | 47,554,703 | |
Celgene Corp. (a) | | | 171,217 | | | | 28,928,824 | |
Gilead Sciences, Inc. (a) | | | 983,000 | | | | 73,872,450 | |
Incyte Corp., Ltd. (a) | | | 167,900 | | | | 8,500,777 | |
Pharmacyclics, Inc. (a) | | | 84,800 | | | | 8,970,144 | |
Regeneron Pharmaceuticals, Inc. (a) | | | 43,550 | | | | 11,986,702 | |
Vertex Pharmaceuticals, Inc. (a) | | | 115,300 | | | | 8,566,790 | |
| | | | | | | | |
| | | | | | | 204,286,382 | |
| | | | | | | | |
|
Capital Markets—2.2% | |
Affiliated Managers Group, Inc. (a) | | | 44,800 | | | | 9,716,224 | |
BlackRock, Inc. | | | 44,400 | | | | 14,051,268 | |
Franklin Resources, Inc. | | | 165,300 | | | | 9,542,769 | |
Invesco, Ltd. | | | 380,088 | | | | 13,835,203 | |
TD Ameritrade Holding Corp. | | | 385,500 | | | | 11,811,720 | |
| | | | | | | | |
| | | | | | | 58,957,184 | |
| | | | | | | | |
|
Chemicals—3.2% | |
Ecolab, Inc. | | | 264,600 | | | | 27,589,842 | |
FMC Corp. | | | 127,000 | | | | 9,583,420 | |
Praxair, Inc. | | | 167,550 | | | | 21,786,527 | |
Sherwin-Williams Co. (The) | | | 139,120 | | | | 25,528,520 | |
| | | | | | | | |
| | | | | | | 84,488,309 | |
| | | | | | | | |
|
Communications Equipment—1.5% | |
Juniper Networks, Inc. (a) | | | 329,500 | | | | 7,436,815 | |
QUALCOMM, Inc. | | | 454,200 | | | | 33,724,350 | |
| | | | | | | | |
| | | | | | | 41,161,165 | |
| | | | | | | | |
|
Computers & Peripherals—2.9% | |
Apple, Inc. | | | 136,120 | | | $ | 76,378,293 | |
| | | | | | | | |
|
Construction Materials—0.3% | |
Martin Marietta Materials, Inc. (b) | | | 70,300 | | | | 7,025,782 | |
| | | | | | | | |
|
Consumer Finance—1.1% | |
American Express Co. | | | 314,700 | | | | 28,552,731 | |
| | | | | | | | |
|
Diversified Financial Services—0.4% | |
IntercontinentalExchange Group, Inc. | | | 45,520 | | | | 10,238,358 | |
| | | | | | | | |
|
Electrical Equipment—1.0% | |
Roper Industries, Inc. | | | 189,040 | | | | 26,216,067 | |
| | | | | | | | |
|
Energy Equipment & Services—0.9% | |
FMC Technologies, Inc. (a) | | | 196,300 | | | | 10,248,823 | |
Schlumberger, Ltd. | | | 153,200 | | | | 13,804,852 | |
| | | | | | | | |
| | | | | | | 24,053,675 | |
| | | | | | | | |
|
Food & Staples Retailing—2.6% | |
Costco Wholesale Corp. | | | 150,000 | | | | 17,851,500 | |
CVS Caremark Corp. | | | 389,900 | | | | 27,905,143 | |
Whole Foods Market, Inc. | | | 400,500 | | | | 23,160,915 | |
| | | | | | | | |
| | | | | | | 68,917,558 | |
| | | | | | | | |
|
Food Products—0.5% | |
Green Mountain Coffee Roasters,
Inc. (a) (b) | | | 79,000 | | | | 5,970,820 | |
Nestle S.A. | | | 116,458 | | | | 8,548,943 | |
| | | | | | | | |
| | | | | | | 14,519,763 | |
| | | | | | | | |
|
Health Care Equipment & Supplies—0.7% | |
IDEXX Laboratories, Inc. (a) (b) | | | 113,100 | | | | 12,030,447 | |
Stryker Corp. | | | 93,700 | | | | 7,040,618 | |
| | | | | | | | |
| | | | | | | 19,071,065 | |
| | | | | | | | |
|
Health Care Providers & Services—2.1% | |
McKesson Corp. | | | 282,800 | | | | 45,643,920 | |
UnitedHealth Group, Inc. | | | 143,400 | | | | 10,798,020 | |
| | | | | | | | |
| | | | | | | 56,441,940 | |
| | | | | | | | |
|
Hotels, Restaurants & Leisure—6.6% | |
Carnival plc | | | 291,944 | | | | 12,056,032 | |
Chipotle Mexican Grill, Inc. (a) | | | 59,600 | | | | 31,753,688 | |
Las Vegas Sands Corp. | | | 415,600 | | | | 32,778,372 | |
Marriott International, Inc. - Class A | | | 175,560 | | | | 8,665,642 | |
MGM Resorts International (a) | | | 648,100 | | | | 15,243,312 | |
Starbucks Corp. | | | 591,300 | | | | 46,352,007 | |
Starwood Hotels & Resorts Worldwide, Inc. | | | 229,900 | | | | 18,265,555 | |
Wynn Macau, Ltd. | | | 2,690,000 | | | | 12,316,058 | |
| | | | | | | | |
| | | | | | | 177,430,666 | |
| | | | | | | | |
|
Household Durables—0.8% | |
D.R. Horton, Inc. (b) | | | 453,200 | | | | 10,115,424 | |
Lennar Corp. - Class A (b) | | | 258,000 | | | | 10,206,480 | |
| | | | | | | | |
| | | | | | | 20,321,904 | |
| | | | | | | | |
See accompanying notes to financial statements.
MSF-4
Metropolitan Series Fund
T. Rowe Price Large Cap Growth Portfolio
Schedule of Investments as of December 31, 2013
Common Stocks—(Continued)
| | | | | | | | |
| Security Description | | Shares | | | Value | |
|
Household Products—0.3% | |
Procter & Gamble Co. (The) | | | 93,100 | | | $ | 7,579,271 | |
| | | | | | | | |
|
Industrial Conglomerates—2.2% | |
Danaher Corp. | | | 774,700 | | | | 59,806,840 | |
| | | | | | | | |
|
Internet & Catalog Retail—10.1% | |
Amazon.com, Inc. (a) | | | 354,505 | | | | 141,373,049 | |
Ctrip.com International, Ltd. (ADR) (a) | | | 221,001 | | | | 10,966,070 | |
Netflix, Inc. (a) | | | 67,600 | | | | 24,888,292 | |
priceline.com, Inc. (a) | | | 68,640 | | | | 79,787,136 | |
TripAdvisor, Inc. (a) | | | 153,800 | | | | 12,739,254 | |
| | | | | | | | |
| | | | | | | 269,753,801 | |
| | | | | | | | |
|
Internet Software & Services—11.3% | |
Akamai Technologies, Inc. (a) | | | 168,600 | | | | 7,954,548 | |
Baidu, Inc. (ADR) (a) | | | 173,390 | | | | 30,842,613 | |
eBay, Inc. (a) | | | 596,000 | | | | 32,714,440 | |
Facebook, Inc. - Class A (a) | | | 278,000 | | | | 15,195,480 | |
Google, Inc. - Class A (a) | | | 146,970 | | | | 164,710,749 | |
LinkedIn Corp. - Class A (a) | | | 84,820 | | | | 18,391,520 | |
NAVER Corp. | | | 22,399 | | | | 15,436,450 | |
Tencent Holdings, Ltd. | | | 139,577 | | | | 8,956,904 | |
Twitter, Inc. (Private Placement) (a) (c) | | | 53,577 | | | | 3,125,995 | |
Twitter, Inc. (a) (b) | | | 54,700 | | | | 3,481,655 | |
| | | | | | | | |
| | | | | | | 300,810,354 | |
| | | | | | | | |
|
IT Services—7.6% | |
Alliance Data Systems Corp. (a) (b) | | | 42,570 | | | | 11,192,930 | |
Cognizant Technology Solutions
Corp. - Class A (a) | | | 233,500 | | | | 23,578,830 | |
Fiserv, Inc. (a) | | | 184,200 | | | | 10,877,010 | |
MasterCard, Inc. - Class A | | | 97,100 | | | | 81,123,166 | |
Visa, Inc. - Class A | | | 339,730 | | | | 75,651,076 | |
| | | | | | | | |
| | | | | | | 202,423,012 | |
| | | | | | | | |
|
Machinery—0.7% | |
Flowserve Corp. | | | 117,700 | | | | 9,278,291 | |
Wabtec Corp. | | | 113,600 | | | | 8,437,072 | |
| | | | | | | | |
| | | | | | | 17,715,363 | |
| | | | | | | | |
|
Media—2.0% | |
Charter Communications,
Inc. - Class A (a) | | | 56,600 | | | | 7,740,616 | |
Discovery Communications,
Inc. - Class C (a) | | | 149,500 | | | | 12,537,070 | |
Twenty-First Century Fox, Inc. - Class A | | | 454,400 | | | | 15,985,792 | |
Walt Disney Co. (The) | | | 219,446 | | | | 16,765,674 | |
| | | | | | | | |
| | | | | | | 53,029,152 | |
| | | | | | | | |
|
Multiline Retail—0.3% | |
Dollar Tree, Inc. (a) | | | 126,800 | | | | 7,154,056 | |
| | | | | | | | |
|
Oil, Gas & Consumable Fuels—3.9% | |
Antero Resources Corp. (a) | | | 31,600 | | | | 2,004,704 | |
Cabot Oil & Gas Corp. | | | 419,900 | | | | 16,275,324 | |
Concho Resources, Inc. (a) | | | 111,400 | | | | 12,031,200 | |
EOG Resources, Inc. | | | 72,370 | | | | 12,146,581 | |
EQT Corp. | | | 130,500 | | | | 11,716,290 | |
|
Oil, Gas & Consumable Fuels—(Continued) | |
Pioneer Natural Resources Co. | | | 153,060 | | | | 28,173,754 | |
Range Resources Corp. | | | 249,500 | | | | 21,035,345 | |
| | | | | | | | |
| | | | | | | 103,383,198 | |
| | | | | | | | |
|
Pharmaceuticals—1.2% | |
Novo Nordisk A/S - Class B | | | 38,548 | | | | 7,101,750 | |
Valeant Pharmaceuticals International, Inc. (a) | | | 204,400 | | | | 23,996,560 | |
| | | | | | | | |
| | | | | | | 31,098,310 | |
| | | | | | | | |
|
Real Estate Investment Trusts—1.8% | |
American Tower Corp. | | | 618,900 | | | | 49,400,598 | |
| | | | | | | | |
|
Road & Rail—2.0% | |
J.B. Hunt Transport Services, Inc. | | | 104,200 | | | | 8,054,660 | |
Kansas City Southern | | | 252,200 | | | | 31,229,926 | |
Union Pacific Corp. | | | 79,790 | | | | 13,404,720 | |
| | | | | | | | |
| | | | | | | 52,689,306 | |
| | | | | | | | |
|
Software—2.9% | |
Concur Technologies, Inc. (a) (b) | | | 76,300 | | | | 7,872,634 | |
NetSuite, Inc. (a) | | | 68,200 | | | | 7,025,964 | |
Red Hat, Inc. (a) | | | 207,600 | | | | 11,633,904 | |
Salesforce.com, Inc. (a) | | | 546,360 | | | | 30,153,608 | |
ServiceNow, Inc. (a) (b) | | | 235,900 | | | | 13,212,759 | |
Workday, Inc. - Class A (a) | | | 99,300 | | | | 8,257,788 | |
| | | | | | | | |
| | | | | | | 78,156,657 | |
| | | | | | | | |
|
Specialty Retail—5.4% | |
AutoZone, Inc. (a) | | | 47,340 | | | | 22,625,680 | |
CarMax, Inc. (a) | | | 330,200 | | | | 15,526,004 | |
Home Depot, Inc. (The) | | | 607,200 | | | | 49,996,848 | |
Lowe’s Cos., Inc. | | | 468,900 | | | | 23,233,995 | |
Ross Stores, Inc. | | | 170,100 | | | | 12,745,593 | |
Tractor Supply Co. | | | 247,600 | | | | 19,208,808 | |
| | | | | | | | |
| | | | | | | 143,336,928 | |
| | | | | | | | |
|
Textiles, Apparel & Luxury Goods—1.5% | |
Lululemon Athletica, Inc. (a) (b) | | | 29,488 | | | | 1,740,677 | |
NIKE, Inc. - Class B | | | 185,500 | | | | 14,587,720 | |
Prada S.p.A. | | | 891,300 | | | | 7,918,564 | |
Under Armour, Inc. - Class A (a) (b) | | | 183,800 | | | | 16,045,740 | |
| | | | | | | | |
| | | | | | | 40,292,701 | |
| | | | | | | | |
|
Trading Companies & Distributors—1.2% | |
Fastenal Co. (b) | | | 562,000 | | | | 26,700,620 | |
WW Grainger, Inc. | | | 24,600 | | | | 6,283,332 | |
| | | | | | | | |
| | | | | | | 32,983,952 | |
| | | | | | | | |
|
Wireless Telecommunication Services—3.2% | |
Crown Castle International Corp. (a) | | | 833,578 | | | | 61,209,633 | |
SBA Communications
Corp. - Class A (a) | | | 130,000 | | | | 11,679,200 | |
SoftBank Corp. | | | 144,000 | | | | 12,623,415 | |
| | | | | | | | |
| | | | | | | 85,512,248 | |
| | | | | | | | |
Total Common Stocks
(Cost $1,808,822,309) | | | | | | | 2,634,433,613 | |
| | | | | | | | |
See accompanying notes to financial statements.
MSF-5
Metropolitan Series Fund
T. Rowe Price Large Cap Growth Portfolio
Schedule of Investments as of December 31, 2013
Convertible Preferred Stocks—0.2%
| | | | | | | | |
| Security Description | | Shares | | | Value | |
|
Internet Software & Services—0.2% | |
Living Social, Inc. - Class F (a) (c) (d) | | | 101,591 | | | $ | 64,002 | |
Twitter, Inc. - Series A (a) (c) | | | 139 | | | | 8,110 | |
Twitter, Inc. - Series B (a) (c) | | | 2,171 | | | | 126,669 | |
Twitter, Inc. - Series C (a) (c) | | | 558 | | | | 32,557 | |
Twitter, Inc. - Series D (a) (c) | | | 20,565 | | | | 1,199,882 | |
Twitter, Inc. - Series G2 (a) (c) | | | 85,204 | | | | 4,971,298 | |
| | | | | | | | |
Total Convertible Preferred Stocks
(Cost $2,529,598) | | | | | | | 6,402,518 | |
| | | | | | | | |
|
| Short-Term Investments—4.8% | |
|
Mutual Funds—4.8% | |
State Street Navigator Securities Lending MET Portfolio (e) | | | 104,481,451 | | | | 104,481,451 | |
T. Rowe Price Government Reserve Investment Fund (f) | | | 21,895,777 | | | | 21,895,777 | |
| | | | | | | | |
Total Short-Term Investments
(Cost $126,377,228) | | | | | | | 126,377,228 | |
| | | | | | | | |
Total Investments—103.9%
(Cost $1,937,729,135) (g) | | | | | | | 2,767,213,359 | |
Other assets and liabilities (net)—(3.9)% | | | | | | | (104,304,848 | ) |
| | | | | | | | |
| Net Assets—100.0% | | | | | | $ | 2,662,908,511 | |
| | | | | | | | |
| (a) | Non-income producing security. |
| (b) | All or a portion of the security was held on loan. As of December 31, 2013, the market value of securities loaned was $102,704,701 and the collateral received consisted of cash in the amount of $104,481,451. The cash collateral is invested in a money market fund managed by an affiliate of the custodian. |
| (c) | Restricted securities are not registered under the Securities Act of 1933 and are subject to legal restrictions on resale. These securities generally may be resold in transactions exempt from registration or to the public if the securities are subsequently registered. Disposal of these securities may involve time-consuming negotiations and prompt sale at an acceptable price may be difficult. As of December 31, 2013, the market value of restricted securities was $9,528,513, which is 0.4% of net assets. See details shown in the Restricted Securities table that follows. |
| (d) | Security was valued in good faith under procedures approved by the Board of Trustees. As of December 31, 2013, these securities represent less than 0.05% of net assets. |
| (e) | Represents investment of cash collateral received from securities lending transactions. |
| (f) | Affiliated Issuer. (See Note 7 of the Notes to Financial Statements for a summary of transactions in securities of affiliated issuers.) |
| (g) | As of December 31, 2013, the aggregate cost of investments for federal income tax purposes was $1,943,423,187. The aggregate unrealized appreciation and depreciation of investments were $826,217,230 and $(2,427,058), respectively, resulting in net unrealized appreciation of $823,790,172 for federal income tax purposes. |
| (ADR)— | An American Depositary Receipt is a certificate issued by a custodian bank representing the right to receive securities of the foreign issuer described. Trading on exchanges not located in the United States or Canada significantly influences the value of ADRs. |
| | | | | | | | | | | | | | |
Restricted Securities | | Acquisition
Date | | Shares | | | Cost | | | Value | |
Living Social, Inc. - Class F | | 11/18/11 | | | 101,591 | | | $ | 781,235 | | | $ | 64,002 | |
Twitter, Inc. (Private Placement) | | 09/13/11 | | | 53,577 | | | | 862,247 | | | | 3,125,995 | |
Twitter, Inc. - Series A | | 09/13/11 | | | 139 | | | | 2,237 | | | | 8,110 | |
Twitter, Inc. - Series B | | 09/13/11 | | | 2,171 | | | | 34,939 | | | | 126,669 | |
Twitter, Inc. - Series C | | 09/13/11 | | | 558 | | | | 8,980 | | | | 32,557 | |
Twitter, Inc. - Series D | | 09/13/11 | | | 20,565 | | | | 330,965 | | | | 1,199,882 | |
Twitter, Inc. - Series G2 | | 07/28/11 | | | 85,204 | | | | 1,371,242 | | | | 4,971,298 | |
See accompanying notes to financial statements.
MSF-6
Metropolitan Series Fund
T. Rowe Price Large Cap Growth Portfolio
Schedule of Investments as of December 31, 2013
Fair Value Hierarchy
Accounting principles generally accepted in the United States of America (“GAAP”) define fair market value as the price that the Portfolio would receive to sell an asset or pay to transfer a liability in an orderly transaction between market participants at the measurement date. It establishes a fair value hierarchy that prioritizes inputs to valuation methods and requires disclosure of the fair value hierarchy that segregates fair value measurements into three levels. Levels 1, 2 and 3 of the fair value hierarchy are defined as follows:
Level 1 - unadjusted quoted prices in active markets for identical investments
Level 2 - other significant observable inputs (including, but not limited to, unadjusted quoted prices for similar investments in markets that are either active or inactive; inputs other than quoted prices that are observable such as interest rates, yield curves, volatilities, prepayment speeds, loss severities, credit risks, default rates, etc.)
Level 3 - significant unobservable inputs based on the best information available in the circumstances, to the extent observable inputs are unavailable (including the Portfolio’s own assumptions in determining the fair value of investments)
The inputs or methodologies used for valuing investments are not necessarily an indication of the risk associated with investing in them. Changes to the inputs or methodologies used may result in transfers between levels, which will be recognized as of the beginning of the reporting period. Information on transfers between Level 1 and Level 2, if any, will be disclosed following the fair value hierarchy table below. A reconciliation of Level 3 securities, if any, will also be disclosed following the fair value hierarchy table. For more information about the Portfolio’s policy regarding the valuation of investments, please refer to the Notes to Financial Statements.
The following table summarizes the fair value hierarchy of the Portfolio’s investments as of December 31, 2013:
| | | | | | | | | | | | | | | | |
| Description | | Level 1 | | | Level 2 | | | Level 3 | | | Total | |
| Common Stocks | | | | | | | | | | | | | | | | |
Aerospace & Defense | | $ | 100,635,054 | | | $ | — | | | $ | — | | | $ | 100,635,054 | |
Air Freight & Logistics | | | 19,208,624 | | | | — | | | | — | | | | 19,208,624 | |
Airlines | | | 19,761,053 | | | | — | | | | — | | | | 19,761,053 | |
Automobiles | | | 20,932,842 | | | | — | | | | — | | | | 20,932,842 | |
Beverages | | | 20,709,451 | | | | — | | | | — | | | | 20,709,451 | |
Biotechnology | | | 204,286,382 | | | | — | | | | — | | | | 204,286,382 | |
Capital Markets | | | 58,957,184 | | | | — | | | | — | | | | 58,957,184 | |
Chemicals | | | 84,488,309 | | | | — | | | | — | | | | 84,488,309 | |
Communications Equipment | | | 41,161,165 | | | | — | | | | — | | | | 41,161,165 | |
Computers & Peripherals | | | 76,378,293 | | | | — | | | | — | | | | 76,378,293 | |
Construction Materials | | | 7,025,782 | | | | — | | | | — | | | | 7,025,782 | |
Consumer Finance | | | 28,552,731 | | | | — | | | | — | | | | 28,552,731 | |
Diversified Financial Services | | | 10,238,358 | | | | — | | | | — | | | | 10,238,358 | |
Electrical Equipment | | | 26,216,067 | | | | — | | | | — | | | | 26,216,067 | |
Energy Equipment & Services | | | 24,053,675 | | | | — | | | | — | | | | 24,053,675 | |
Food & Staples Retailing | | | 68,917,558 | | | | — | | | | — | | | | 68,917,558 | |
Food Products | | | 5,970,820 | | | | 8,548,943 | | | | — | | | | 14,519,763 | |
Health Care Equipment & Supplies | | | 19,071,065 | | | | — | | | | — | | | | 19,071,065 | |
Health Care Providers & Services | | | 56,441,940 | | | | — | | | | — | | | | 56,441,940 | |
Hotels, Restaurants & Leisure | | | 153,058,576 | | | | 24,372,090 | | | | — | | | | 177,430,666 | |
Household Durables | | | 20,321,904 | | | | — | | | | — | | | | 20,321,904 | |
Household Products | | | 7,579,271 | | | | — | | | | — | | | | 7,579,271 | |
Industrial Conglomerates | | | 59,806,840 | | | | — | | | | — | | | | 59,806,840 | |
Internet & Catalog Retail | | | 269,753,801 | | | | — | | | | — | | | | 269,753,801 | |
Internet Software & Services | | | 273,291,005 | | | | 27,519,349 | | | | — | | | | 300,810,354 | |
IT Services | | | 202,423,012 | | | | — | | | | — | | | | 202,423,012 | |
Machinery | | | 17,715,363 | | | | — | | | | — | | | | 17,715,363 | |
Media | | | 53,029,152 | | | | — | | | | — | | | | 53,029,152 | |
Multiline Retail | | | 7,154,056 | | | | — | | | | — | | | | 7,154,056 | |
Oil, Gas & Consumable Fuels | | | 103,383,198 | | | | — | | | | — | | | | 103,383,198 | |
Pharmaceuticals | | | 23,996,560 | | | | 7,101,750 | | | | — | | | | 31,098,310 | |
Real Estate Investment Trusts | | | 49,400,598 | | | | — | | | | — | | | | 49,400,598 | |
Road & Rail | | | 52,689,306 | | | | — | | | | — | | | | 52,689,306 | |
Software | | | 78,156,657 | | | | — | | | | — | | | | 78,156,657 | |
Specialty Retail | | | 143,336,928 | | | | — | | | | — | | | | 143,336,928 | |
Textiles, Apparel & Luxury Goods | | | 32,374,137 | | | | 7,918,564 | | | | — | | | | 40,292,701 | |
Trading Companies & Distributors | | | 32,983,952 | | | | — | | | | — | | | | 32,983,952 | |
Wireless Telecommunication Services | | | 72,888,833 | | | | 12,623,415 | | | | — | | | | 85,512,248 | |
Total Common Stocks | | | 2,546,349,502 | | | | 88,084,111 | | | | — | | | | 2,634,433,613 | |
See accompanying notes to financial statements.
MSF-7
Metropolitan Series Fund
T. Rowe Price Large Cap Growth Portfolio
Schedule of Investments as of December 31, 2013
Fair Value Hierarchy—(Continued)
| | | | | | | | | | | | | | | | |
| Description | | Level 1 | | | Level 2 | | | Level 3 | | | Total | |
| Convertible Preferred Stocks | | | | | | | | | | | | | | | | |
Internet Software & Services | | $ | — | | | $ | 6,338,516 | | | $ | 64,002 | | | $ | 6,402,518 | |
Total Short-Term Investments* | | | 126,377,228 | | | | — | | | | — | | | | 126,377,228 | |
Total Investments | | $ | 2,672,726,730 | | | $ | 94,422,627 | | | $ | 64,002 | | | $ | 2,767,213,359 | |
| | | | | | | | | | | | | | | | | |
Collateral for Securities Loaned (Liability) | | $ | — | | | $ | (104,481,451 | ) | | $ | — | | | $ | (104,481,451 | ) |
| * | See Schedule of Investments for additional detailed categorizations. |
Following is a reconciliation of Level 3 assets for which significant unobservable inputs were used to determine fair value:
| | | | | | | | | | | | | | | | | | | | |
Investments in Securities | | Balance as of
December 31,
2012 | | | Change in
Unrealized
Appreciation | | | Transfers
out of
Level 3 | | | Balance as of
December 31,
2013 | | | Change in Unrealized
Depreciation from
investments still held at
December 31, 2013 | |
| Common Stocks | | | | | | | | | | | | | | | | | | | | |
Internet Software & Services | | $ | 682,571 | | | $ | — | | | $ | (682,571 | ) | | $ | — | | | $ | — | |
| Convertible Preferred Stocks | | | | | | | | | | | | | | | | | | | | |
Internet Software & Services | | | 1,564,867 | | | | (116,830 | ) | | | (1,384,035 | ) | | | 64,002 | | | | (116,830 | ) |
| | | | | | | | | | | | | | | | | | | | |
Total | | $ | 2,247,438 | | | $ | (116,830 | ) | | $ | (2,066,606 | ) | | $ | 64,002 | | | $ | (116,830 | ) |
| | | | | | | | | | | | | | | | | | | | |
Transfers out of level 3 were due to the initial public offering of the securities, which resulted in the trading of the securities on a recognized exchange and the availability of quoted prices in an active market.
See accompanying notes to financial statements.
MSF-8
Metropolitan Series Fund
T. Rowe Price Large Cap Growth Portfolio
Statement of Assets and Liabilities
December 31, 2013
| | | | |
Assets | | | | |
Investments at value (a) (b) | | $ | 2,745,317,582 | |
Affiliated investments at value (c) | | | 21,895,777 | |
Receivable for: | | | | |
Investments sold | | | 1,687,121 | |
Fund shares sold | | | 932,502 | |
Dividends | | | 773,925 | |
Dividends on affiliated investments | | | 1,091 | |
Prepaid expenses | | | 5,591 | |
| | | | |
Total Assets | | | 2,770,613,589 | |
Liabilities | | | | |
Collateral for securities loaned | | | 104,481,451 | |
Payables for: | | | | |
Fund shares redeemed | | | 1,634,485 | |
Accrued Expenses: | | | | |
Management fees | | | 1,229,331 | |
Distribution and service fees | | | 132,385 | |
Deferred trustees’ fees | | | 89,792 | |
Other expenses | | | 137,634 | |
| | | | |
Total Liabilities | | | 107,705,078 | |
| | | | |
Net Assets | | $ | 2,662,908,511 | |
| | | | |
Net Assets Consist of: | | | | |
Paid in surplus | | $ | 1,657,020,059 | |
Undistributed net investment income | | | 1,312,255 | |
Accumulated net realized gain | | | 175,089,950 | |
Unrealized appreciation on investments and foreign currency transactions | | | 829,486,247 | |
| | | | |
Net Assets | | $ | 2,662,908,511 | |
| | | | |
Net Assets | | | | |
Class A | | $ | 2,007,786,418 | |
Class B | | | 614,983,652 | |
Class E | | | 40,138,441 | |
Capital Shares Outstanding* | | | | |
Class A | | | 81,924,706 | |
Class B | | | 25,285,705 | |
Class E | | | 1,644,782 | |
Net Asset Value, Offering Price and Redemption Price Per Share | | | | |
Class A | | $ | 24.51 | |
Class B | | | 24.32 | |
Class E | | | 24.40 | |
| * | The Portfolio is authorized to issue an unlimited number of shares. |
| (a) | Identified cost of investments, excluding affiliated investments, was $1,915,833,358. |
| (b) | Includes securities loaned at value of $102,704,701. |
| (c) | Identified cost of affiliated investments was $21,895,777. |
Statement of Operations
Year Ended December 31, 2013
| | | | |
Investment Income | | | | |
Dividends (a) | | $ | 14,482,960 | |
Dividends from affiliated investments | | | 10,965 | |
Interest | | | 200,604 | |
Securities lending income | | | 305,932 | |
| | | | |
Total investment income | | | 15,000,461 | |
Expenses | | | | |
Management fees | | | 12,581,606 | |
Administration fees | | | 39,163 | |
Custodian and accounting fees | | | 241,846 | |
Distribution and service fees—Class B | | | 1,099,227 | |
Distribution and service fees—Class E | | | 46,949 | |
Audit and tax services | | | 46,916 | |
Legal | | | 34,551 | |
Trustees’ fees and expenses | | | 36,571 | |
Shareholder reporting | | | 92,245 | |
Insurance | | | 10,328 | |
Miscellaneous | | | 24,860 | |
| | | | |
Total expenses | | | 14,254,262 | |
Less management fee waiver | | | (900,322 | ) |
Less broker commission recapture | | | (19,904 | ) |
| | | | |
Net expenses | | | 13,334,036 | |
| | | | |
Net Investment Income | | | 1,666,425 | |
| | | | |
Net Realized and Unrealized Gain | | | | |
| Net realized gain (loss) on: | | | | |
Investments | | | 204,083,070 | |
Futures contracts | | | 181,297 | |
Foreign currency transactions | | | (145,507 | ) |
| | | | |
Net realized gain | | | 204,118,860 | |
| | | | |
| Net change in unrealized appreciation (depreciation) on: | | | | |
Investments | | | 502,907,265 | |
Foreign currency transactions | | | (5,638 | ) |
| | | | |
Net change in unrealized appreciation | | | 502,901,627 | |
| | | | |
Net realized and unrealized gain | | | 707,020,487 | |
| | | | |
Net Increase in Net Assets From Operations | | $ | 708,686,912 | |
| | | | |
| (a) | Net of foreign withholding taxes of $124,193. |
See accompanying notes to financial statements.
MSF-9
Metropolitan Series Fund
T. Rowe Price Large Cap Growth Portfolio
Statements of Changes in Net Assets
| | | | | | | | |
| | | Year Ended
December 31,
2013 | | | Year Ended
December 31,
2012 | |
Increase (Decrease) in Net Assets: | | | | | | | | |
From Operations | | | | | | | | |
Net investment income | | $ | 1,666,425 | | | $ | 5,007,274 | |
Net realized gain | | | 204,118,860 | | | | 62,349,670 | |
Net change in unrealized appreciation | | | 502,901,627 | | | | 159,405,934 | |
| | | | | | | | |
Increase in net assets from operations | | | 708,686,912 | | | | 226,762,878 | |
| | | | | | | | |
From Distributions to Shareholders | | | | | | | | |
Net investment income | | | | | | | | |
Class A | | | (4,787,873 | ) | | | (1,285,777 | ) |
Class B | | | (183,240 | ) | | | 0 | |
Class E | | | (27,947 | ) | | | 0 | |
| | | | | | | | |
Total distributions | | | (4,999,060 | ) | | | (1,285,777 | ) |
| | | | | | | | |
Increase in net assets from capital share transactions | | | 397,860,785 | | | | 149,290,771 | |
| | | | | | | | |
Total increase in net assets | | | 1,101,548,637 | | | | 374,767,872 | |
| | |
Net Assets | | | | | | | | |
Beginning of period | | | 1,561,359,874 | | | | 1,186,592,002 | |
| | | | | | | | |
End of period | | $ | 2,662,908,511 | | | $ | 1,561,359,874 | |
| | | | | | | | |
Undistributed net investment income | | | | | | | | |
End of period | | $ | 1,312,255 | | | $ | 4,850,589 | |
| | | | | | | | |
Other Information:
Capital Shares
Transactions in capital shares were as follows:
| | | | | | | | | | | | | | | | |
| | | Year Ended
December 31, 2013 | | | Year Ended
December 31, 2012 | |
| | | Shares | | | Value | | | Shares | | | Value | |
Class A | | | | | | | | | | | | | | | | |
Sales | | | 14,211,647 | | | $ | 301,716,419 | | | | 20,530,028 | | | $ | 356,561,006 | |
Shares issued through acquisition | | | 2,897,854 | | | | 55,320,025 | | | | 0 | | | | 0 | |
Reinvestments | | | 258,385 | | | | 4,787,873 | | | | 73,768 | | | | 1,285,777 | |
Redemptions | | | (10,632,918 | ) | | | (222,768,817 | ) | | | (10,717,684 | ) | | | (185,967,868 | ) |
| | | | | | | | | | | | | | | | |
Net increase | | | 6,734,968 | | | $ | 139,055,500 | | | | 9,886,112 | | | $ | 171,878,915 | |
| | | | | | | | | | | | | | | | |
Class B | | | | | | | | | | | | | | | | |
Sales | | | 4,928,278 | | | $ | 103,138,441 | | | | 1,548,345 | | | $ | 26,198,068 | |
Shares issued through acquisition | | | 13,508,986 | | | | 256,400,558 | | | | 0 | | | | 0 | |
Reinvestments | | | 9,948 | | | | 183,240 | | | | 0 | | | | 0 | |
Redemptions | | | (5,459,206 | ) | | | (113,287,739 | ) | | | (2,753,475 | ) | | | (46,699,769 | ) |
| | | | | | | | | | | | | | | | |
Net increase (decrease) | | | 12,988,006 | | | $ | 246,434,500 | | | | (1,205,130 | ) | | $ | (20,501,701 | ) |
| | | | | | | | | | | | | | | | |
Class E | | | | | | | | | | | | | | | | |
Sales | | | 608,820 | | | $ | 11,780,542 | | | | 131,984 | | | $ | 2,247,119 | |
Shares issued through acquisition | | | 826,063 | | | | 15,719,980 | | | | 0 | | | | 0 | |
Reinvestments | | | 1,513 | | | | 27,947 | | | | 0 | | | | 0 | |
Redemptions | | | (747,881 | ) | | | (15,157,684 | ) | | | (254,781 | ) | | | (4,333,562 | ) |
| | | | | | | | | | | | | | | | |
Net increase (decrease) | | | 688,515 | | | $ | 12,370,785 | | | | (122,797 | ) | | $ | (2,086,443 | ) |
| | | | | | | | | | | | | | | | |
Increase derived from capital shares transactions | | | | | | $ | 397,860,785 | | | | | | | $ | 149,290,771 | |
| | | | | | | | | | | | | | | | |
See accompanying notes to financial statements.
MSF-10
Metropolitan Series Fund
T. Rowe Price Large Cap Growth Portfolio
Financial Highlights
| | | | | | | | | | | | | | | | | | | | |
| Selected per share data | | | |
| | | Class A | |
| | | Year Ended December 31, | |
| | | 2013 | | | 2012 | | | 2011 | | | 2010 | | | 2009 | |
Net Asset Value, Beginning of Period | | $ | 17.67 | | | $ | 14.87 | | | $ | 15.05 | | | $ | 12.89 | | | $ | 9.05 | |
| | | | | | | | | | | | | | | | | | | | |
Income (Loss) from Investment Operations | | | | | | | | | | | | | | | | | | | | |
Net investment income (a) | | | 0.03 | | | | 0.07 | | | | 0.03 | | | | 0.02 | �� | | | 0.04 | |
Net realized and unrealized gain (loss) on investments | | | 6.87 | | | | 2.75 | | | | (0.20 | ) | | | 2.18 | | | | 3.87 | |
| | | | | | | | | | | | | | | | | | | | |
Total from investment operations | | | 6.90 | | | | 2.82 | | | | (0.17 | ) | | | 2.20 | | | | 3.91 | |
| | | | | | | | | | | | | | | | | | | | |
Less Distributions | | | | | | | | | | | | | | | | | | | | |
Distributions from net investment income | | | (0.06 | ) | | | (0.02 | ) | | | (0.01 | ) | | | (0.04 | ) | | | (0.07 | ) |
| | | | | | | | | | | | | | | | | | | | |
Total distributions | | | (0.06 | ) | | | (0.02 | ) | | | (0.01 | ) | | | (0.04 | ) | | | (0.07 | ) |
| | | | | | | | | | | | | | | | | | | | |
Net Asset Value, End of Period | | $ | 24.51 | | | $ | 17.67 | | | $ | 14.87 | | | $ | 15.05 | | | $ | 12.89 | |
| | | | | | | | | | | | | | | | | | | | |
Total Return (%) (b) | | | 39.16 | | | | 18.97 | | | | (1.12 | ) | | | 17.05 | | | | 43.44 | |
| | | | | |
Ratios/Supplemental Data | | | | | | | | | | | | | | | | | | | | |
Gross ratio of expenses to average net assets (%) | | | 0.63 | | | | 0.64 | | | | 0.64 | | | | 0.64 | | | | 0.67 | |
Net ratio of expenses to average net assets (%) (c) (d) | | | 0.58 | | | | 0.60 | | | | 0.60 | | | | 0.62 | | | | 0.65 | |
Ratio of net investment income to average net assets (%) | | | 0.14 | | | | 0.43 | | | | 0.18 | | | | 0.15 | | | | 0.35 | |
Portfolio turnover rate (%) | | | 41 | | | | 38 | | | | 33 | | | | 42 | | | | 55 | |
Net assets, end of period (in millions) | | $ | 2,007.8 | | | $ | 1,328.9 | | | $ | 971.1 | | | $ | 639.7 | | | $ | 570.4 | |
| | | | | | | | | | | | | | | | | | | | |
| | | Class B | |
| | | Year Ended December 31, | |
| | | 2013 | | | 2012 | | | 2011 | | | 2010 | | | 2009 | |
Net Asset Value, Beginning of Period | | $ | 17.54 | | | $ | 14.78 | | | $ | 14.98 | | | $ | 12.84 | | | $ | 9.01 | |
| | | | | | | | | | | | | | | | | | | | |
Income (Loss) from Investment Operations | | | | | | | | | | | | | | | | | | | | |
Net investment income (loss) (a) | | | (0.03 | ) | | | 0.02 | | | | (0.01 | ) | | | (0.01 | ) | | | 0.01 | |
Net realized and unrealized gain (loss) on investments | | | 6.83 | | | | 2.74 | | | | (0.19 | ) | | | 2.16 | | | | 3.86 | |
| | | | | | | | | | | | | | | | | | | | |
Total from investment operations | | | 6.80 | | | | 2.76 | | | | (0.20 | ) | | | 2.15 | | | | 3.87 | |
| | | | | | | | | | | | | | | | | | | | |
Less Distributions | | | | | | | | | | | | | | | | | | | | |
Distributions from net investment income | | | (0.02 | ) | | | 0.00 | | | | 0.00 | | | | (0.01 | ) | | | (0.04 | ) |
| | | | | | | | | | | | | | | | | | | | |
Total distributions | | | (0.02 | ) | | | 0.00 | | | | 0.00 | | | | (0.01 | ) | | | (0.04 | ) |
| | | | | | | | | | | | | | | | | | | | |
Net Asset Value, End of Period | | $ | 24.32 | | | $ | 17.54 | | | $ | 14.78 | | | $ | 14.98 | | | $ | 12.84 | |
| | | | | | | | | | | | | | | | | | | | |
Total Return (%) (b) | | | 38.77 | | | | 18.67 | | | | (1.34 | ) | | | 16.74 | | | | 43.03 | |
| | | | | |
Ratios/Supplemental Data | | | | | | | | | | | | | | | | | | | | |
Gross ratio of expenses to average net assets (%) | | | 0.88 | | | | 0.89 | | | | 0.89 | | | | 0.89 | | | | 0.92 | |
Net ratio of expenses to average net assets (%) (c) (d) | | | 0.83 | | | | 0.85 | | | | 0.85 | | | | 0.87 | | | | 0.90 | |
Ratio of net investment income (loss) to average net assets (%) | | | (0.12 | ) | | | 0.12 | | | | (0.09 | ) | | | (0.10 | ) | | | 0.11 | |
Portfolio turnover rate (%) | | | 41 | | | | 38 | | | | 33 | | | | 42 | | | | 55 | |
Net assets, end of period (in millions) | | $ | 615.0 | | | $ | 215.7 | | | $ | 199.5 | | | $ | 231.7 | | | $ | 223.5 | |
Please see following page for Financial Highlights footnote legend.
See accompanying notes to financial statements.
MSF-11
Metropolitan Series Fund
T. Rowe Price Large Cap Growth Portfolio
Financial Highlights
| | | | | | | | | | | | | | | | | | | | |
| Selected per share data | | | |
| | | Class E | |
| | | Year Ended December 31, | |
| | | 2013 | | | 2012 | | | 2011 | | | 2010 | | | 2009 | |
Net Asset Value, Beginning of Period | | $ | 17.60 | | | $ | 14.81 | | | $ | 15.00 | | | $ | 12.85 | | | $ | 9.02 | |
| | | | | | | | | | | | | | | | | | | | |
Income (Loss) from Investment Operations | | | | | | | | | | | | | | | | | | | | |
Net investment income (loss) (a) | | | (0.01 | ) | | | 0.04 | | | | 0.00 | (e) | | | (0.00 | )(e) | | | 0.02 | |
Net realized and unrealized gain (loss) on investments | | | 6.84 | | | | 2.75 | | | | (0.19 | ) | | | 2.17 | | | | 3.86 | |
| | | | | | | | | | | | | | | | | | | | |
Total from investment operations | | | 6.83 | | | | 2.79 | | | | (0.19 | ) | | | 2.17 | | | | 3.88 | |
| | | | | | | | | | | | | | | | | | | | |
Less Distributions | | | | | | | | | | | | | | | | | | | | |
Distributions from net investment income | | | (0.03 | ) | | | 0.00 | | | | 0.00 | | | | (0.02 | ) | | | (0.05 | ) |
| | | | | | | | | | | | | | | | | | | | |
Total distributions | | | (0.03 | ) | | | 0.00 | | | | 0.00 | | | | (0.02 | ) | | | (0.05 | ) |
| | | | | | | | | | | | | | | | | | | | |
Net Asset Value, End of Period | | $ | 24.40 | | | $ | 17.60 | | | $ | 14.81 | | | $ | 15.00 | | | $ | 12.85 | |
| | | | | | | | | | | | | | | | | | | | |
Total Return (%) (b) | | | 38.87 | | | | 18.84 | | | | (1.27 | ) | | | 16.89 | | | | 43.17 | |
| | | | | |
Ratios/Supplemental Data | | | | | | | | | | | | | | | | | | | | |
Gross ratio of expenses to average net assets (%) | | | 0.78 | | | | 0.79 | | | | 0.79 | | | | 0.79 | | | | 0.82 | |
Net ratio of expenses to average net assets (%) (c) (d) | | | 0.73 | | | | 0.75 | | | | 0.75 | | | | 0.77 | | | | 0.80 | |
Ratio of net investment income (loss) to average net assets (%) | | | (0.03 | ) | | | 0.22 | | | | 0.01 | | | | (0.01 | ) | | | 0.21 | |
Portfolio turnover rate (%) | | | 41 | | | | 38 | | | | 33 | | | | 42 | | | | 55 | |
Net assets, end of period (in millions) | | $ | 40.1 | | | $ | 16.8 | | | $ | 16.0 | | | $ | 20.6 | | | $ | 20.4 | |
| (a) | Per share amounts based on average shares outstanding during the period. |
| (b) | Total return does not reflect any insurance, sales, separate account or administrative charges of variable annuity or life insurance contracts or any additional expenses that contract owners may bear under their variable contracts. If these charges were included, the returns would be lower. |
| (c) | Net ratio of expenses to average net assets includes the effect of management fee waivers as detailed in Note 6 of the Notes to Financial Statements. |
| (d) | The effect of the voluntary portion of the waiver on average net assets was 0.02%, 0.02%, 0.03%, 0.03%, and 0.03% for the years 2009 through 2013 respectively. See Note 6 for details. |
| (e) | Net investment income (loss) was less than $0.01. |
See accompanying notes to financial statements.
MSF-12
Metropolitan Series Fund
T. Rowe Price Large Cap Growth Portfolio
Notes to Financial Statements—December 31, 2013
1. Organization
Metropolitan Series Fund (the “Trust”) is organized as a Delaware statutory trust and registered under the Investment Company Act of 1940, as amended (the “1940 Act”), as an open-end management investment company. The Trust is currently comprised of thirty series, each of which operates as a distinct investment vehicle of the Trust. The portfolio included in this report is T. Rowe Price Large Cap Growth Portfolio (the “Portfolio”), which is diversified. Shares in the Portfolio are not offered directly to the general public and are currently available only to separate accounts established by Metropolitan Life Insurance Company (“MetLife”) and other affiliated life insurance companies.
The Portfolio has registered and offers three classes of shares: Class A, B, and E shares. Shares of each Class of the Portfolio represent an equal pro rata interest in the Portfolio and generally give the shareholder the same voting, dividend, liquidation, and other rights. Investment income, realized and unrealized capital gains and losses, the common expenses of the Portfolio, and certain Portfolio-level expense reductions, if any, are allocated on a pro rata basis to each Class based on the relative net assets of each Class to the net assets of the Portfolio. Each Class of shares differs in its respective distribution plan and such distribution expenses are allocated to that Class.
2. Significant Accounting Policies
The preparation of financial statements in conformity with accounting principles generally accepted in the United States of America (“GAAP”) requires management to make estimates and assumptions that affect the reported amounts of assets and liabilities and disclosure of contingent assets and liabilities as of the date of the financial statements and the reported amounts of income and expenses during the reporting period. Actual results could differ from those estimates. In the preparation of these financial statements, management has evaluated events and transactions subsequent to December 31, 2013 through the date the financial statements were issued.
The following is a summary of significant accounting policies consistently followed by the Portfolio in the preparation of its financial statements.
Investment Valuation and Fair Value Measurements - Debt securities (other than short term obligations with a remaining maturity of sixty days or less), including corporate, convertible and municipal bonds and notes; obligations of the U.S. treasury and U.S. government agencies; sovereign issues; floating rate loans; and non-U.S. bonds, are generally valued on the basis of evaluated or composite bid quotations obtained from independent pricing services and/or brokers and dealers selected by MetLife Advisers, LLC (“MetLife Advisers” or the “Adviser”), an affiliate of MetLife, Inc., pursuant to authorization of the Board of Trustees of the Trust (the “Board” or “Trustees”). Such quotations utilize matrix pricing, which considers observable inputs including, among other things, issuer details, maturity dates, interest rates, yield curves, rates of prepayment, credit risks/spreads, default rates, reported trades, broker dealer quotes and quoted prices for similar securities. Securities that use similar valuation techniques and inputs as described above are generally categorized as Level 2 within the fair value hierarchy.
Mortgage and asset-backed securities are usually issued as separate tranches, or classes, of securities within each deal. These securities are also generally valued on the basis of evaluated or composite bid quotations obtained from independent pricing services and/or brokers and dealers selected by the Adviser pursuant to authorization of the Board. The pricing models for these securities usually consider tranche-level attributes, estimated cash flows and market-based yield spreads for each tranche and current market data, and incorporate deal collateral performance, as available. Mortgage and asset-backed securities that use similar valuation techniques and inputs as described above are generally categorized as Level 2 within the fair value hierarchy.
Short term obligations with a remaining maturity of sixty days or less are generally valued at amortized cost, which approximates fair market value, and are generally categorized as Level 2 within the fair value hierarchy.
Domestic and foreign equity securities, such as common stock, exchange-traded funds, rights, warrants, and preferred stock, that are traded on a securities exchange, are generally valued at their last sale price on the exchange or market in which they are principally traded on the valuation date, or, if no sales occurred on that day, at the last reported bid price. Equity securities traded over-the-counter are generally valued at the last reported sale price. Valuation adjustments may be applied to certain foreign equity securities that are traded solely on foreign exchanges that close before the close of the U.S. market to account for the market movement between the close of the foreign exchanges and the close of the U.S. market. The Portfolio may use a systematic fair valuation model provided by an independent third party to value securities principally traded in these foreign markets in order to adjust for possible stale pricing that may occur between the close of the foreign exchanges and the time of the Portfolio valuation. Foreign equity securities using these valuation adjustments are generally categorized as Level 2 within the fair value hierarchy. Equity securities that are actively traded, and have no valuation adjustments applied, are categorized as Level 1 within the fair value hierarchy. Other equity securities traded on inactive markets, or valued in reference to similar instruments traded on active markets, are generally categorized as Level 2 within the fair value hierarchy.
MSF-13
Metropolitan Series Fund
T. Rowe Price Large Cap Growth Portfolio
Notes to Financial Statements—December 31, 2013—(Continued)
Investments in registered open-end management investment companies are valued at reported net asset value per share on the valuation date and are categorized as Level 1 within the fair value hierarchy.
Forward foreign currency exchange contracts are valued through an independent pricing service based on the mean between closing bid and ask prices of the forward currency rates in the London foreign exchange markets on a daily basis as provided by a reliable bank or dealer. These contracts are generally categorized as Level 2 within the fair value hierarchy.
Options, whether on securities, indices, futures contracts, or otherwise, traded on exchanges are valued at the last sale price available as of the close of business on the valuation date or, if there is no such price available, at the mean between the last reported bid and ask prices. These types of options are categorized as Level 1 within the fair value hierarchy. Futures contracts, which are traded on commodity exchanges, are valued at their closing prices as of the close of such exchanges and are categorized as Level 1 within the fair value hierarchy.
Options and futures contracts that are traded over-the-counter are generally valued on the basis of quotations provided by broker-dealers or prices provided by pricing service providers who use a series of techniques, including simulation pricing models, to determine the value of the contracts. The pricing models use inputs that are observed from actively quoted markets such as issuer details, indices, spreads, interest rates, yield curves, credit curves, measures of volatility and exchange rates. These contracts are generally categorized as Level 2 within the fair value hierarchy.
If no current market value quotation or other observable inputs are readily available or market value quotations are deemed to be unreliable for a security, the fair value of the security will be determined in accordance with procedures approved by and under the general supervision of the Board. In such a circumstance, the Board has delegated the determination of the fair value of a security to a Valuation Committee (“Committee”) of MetLife Advisers. The Committee provides general pricing oversight and fair value pricing determinations related to portfolio securities and meets on a regular basis to review reports relating to the valuation of the securities in the Portfolio. The Board has delegated to State Street Bank and Trust Company, the Trust’s custodian (“custodian”), the responsibility for calculating the net asset values (“NAVs”) of the Trust’s Portfolios. The Committee is responsible for overseeing the calculation of the NAVs of the Portfolios by the custodian. The Committee also periodically reviews pricing vendors, including the vendor providing fair value pricing for the Portfolio’s foreign securities, and is responsible for overseeing the correction of pricing errors and addressing other pricing issues that arise in the ordinary course of business, such as making real-time fair value determinations, as necessary.
No single standard for determining the fair value of a security can be set forth because fair value depends upon the facts and circumstances with respect to each security. Information relating to any relevant factors may be obtained by the Committee from any appropriate source, including the subadviser of the Portfolio, the custodian, a pricing service, market maker and/or broker for such security or the issuer. Appropriate methodologies for determining fair value under particular circumstances may include: matrix pricing, comparisons of securities with comparable characteristics, value based on multiples of earnings, discount from market price of similar marketable securities or a combination of these and other methods. The Committee maintains a detailed report tracking each fair-valued security that compares the fair value price to the next available trade, vendor or broker price, and provides information on how close the fair value price was to the next quoted price. The Committee reviews a summary of such report monthly. On a quarterly basis, the Board is provided with the following for consideration and ratification or adjustment: (1) a memorandum summarizing the actions taken by the Committee in the prior quarter; and (2) a list of the Portfolio’s securities as of the most recent quarter-end for which market quotations were not readily available.
Investment Transactions and Related Investment Income - Portfolio security transactions are recorded on the trade date. Dividend income is recorded on the ex-dividend date or, for certain foreign securities, when notified. Interest income, which includes amortization of premium and accretion of discount on debt securities, is recorded on the accrual basis. Realized gains and losses on investments are determined on the identified cost basis, which is the same basis used for federal income tax purposes. Foreign income and foreign capital gains on some foreign securities may be subject to foreign taxes, which are accrued as applicable. These foreign taxes have been provided for in accordance with the Portfolio’s understanding of the applicable countries’ tax rules and rates.
Foreign Currency Translation - The books and records of the Portfolio are maintained in U.S. dollars. The values of securities, currencies, and other assets and liabilities denominated in currencies other than the U.S. dollar are translated into U.S. dollars based upon foreign exchange rates prevailing at the end of the period. Purchases and sales of investment securities, income, and expenses are translated on the respective dates of such transactions. Because the values of investment securities are translated at the foreign exchange rates prevailing at the end of the period, that portion of the results of operations arising from changes in exchange rates and that portion of the results of operations reflecting fluctuations arising from changes in market prices of the investment securities are not separated. Such fluctuations are included in the net realized and unrealized gain or loss on investments.
Net realized foreign exchange gains or losses arise from activity in forward foreign currency exchange contracts, sales of foreign currency, currency gains or losses realized between the trade and settlement dates on securities transactions, and the difference between the amounts of dividends, interest, and foreign withholding taxes recorded by the Portfolio and the U.S. dollar equivalent of
MSF-14
Metropolitan Series Fund
T. Rowe Price Large Cap Growth Portfolio
Notes to Financial Statements—December 31, 2013—(Continued)
the amounts actually received or paid by the Portfolio. Net unrealized foreign exchange gains and losses arise from changes in the value of assets and liabilities, other than investment securities, resulting from changes in foreign exchange rates.
Income Taxes - It is the Portfolio’s policy to comply with the requirements of the Internal Revenue Code of 1986, as amended, and regulations thereunder, applicable to regulated investment companies and to distribute, with respect to each taxable year, all of its taxable income to shareholders. Therefore, no federal income tax provision is required. The Portfolio files U.S. federal tax returns. No income tax returns are currently under examination. The Portfolio’s federal tax returns for the prior three fiscal years remain subject to examination by the Internal Revenue Service. As of December 31, 2013, the Portfolio had no uncertain tax positions that would require financial statement recognition, or de-recognition or disclosure.
Dividends and Distributions to Shareholders - The Portfolio records dividends and distributions on the ex-dividend date. Net realized gains from security transactions (if any) are generally distributed annually to shareholders. The timing and characterization of certain income and capital gains distributions are determined in accordance with federal tax regulations that may differ from GAAP. Permanent book and tax basis differences relating to shareholder distributions will result in reclassification between under/over distributed net investment income, accumulated net realized gains/losses, and paid-in surplus. Book-tax differences are primarily due to foreign currency transactions, tax basis merger adjustments and broker commission recapture reclasses. These adjustments have no impact on net assets or the results of operations.
Securities Lending - The Portfolio may lend its portfolio securities to certain qualified brokers who borrow securities in order to complete certain securities transactions. By lending its portfolio securities, the Portfolio attempts to increase its net investment income through the receipt of income on collateral held from securities on loan. Any gain or loss in the market price of the loaned securities that might occur and any interest earned or dividends declared during the term of the loan would accrue to the account of the Portfolio.
The Trust has entered into a securities lending arrangement with the custodian. Under this arrangement, the custodian is authorized to loan portfolio securities on the Portfolio’s behalf. In exchange, the Portfolio receives either cash or securities as collateral against the loaned securities. The Portfolio receives collateral at least equal to 102% of the market value of the loaned securities (105% for foreign equity securities), at each loan’s inception. Collateral representing at least 100% of the market value of the loaned securities must be maintained for the duration of the loan. A liability for cash collateral is reflected on the Statement of Assets and Liabilities, and is categorized as Level 2 within the fair value hierarchy. Cash collateral is generally invested in the State Street Navigator Securities Lending MET Portfolio (the “Navigator Portfolio”), a series of the State Street Navigator Securities Lending Trust that is managed by an affiliate of the custodian. The Navigator Portfolio is a registered money market fund that invests in a variety of high-quality, U.S. dollar-denominated instruments. If the market value of the collateral at the close of trading on a business day is less than 100% of the market value of the loaned securities at the close of trading on that day, the borrower shall be required to deliver, by the close of business on the following business day, an additional amount of collateral, so that the total amount of posted collateral is equal to at least 100% of the market value of all the loaned securities as of such preceding day. A portion of net income (income after the deduction of expenses and fees of the Navigator Portfolio) on the collateral is rebated to the borrower of the securities and the remainder is split between the custodian and the Portfolio. On loans collateralized by U.S. Treasuries, a fee is received from the borrower and is allocated between the Portfolio and the custodian. The risks associated with lending portfolio securities include, but are not limited to, possible delays in receiving additional collateral or in the recovery of the loaned securities, possible loss of rights in the collateral should the borrower fail financially, as well as risk of loss in the value of the collateral or the value of the investments made with the collateral. The lending agent has agreed to indemnify the Portfolio in the case of default of any securities borrower. Income received by the Portfolio in securities lending transactions during the year ended December 31, 2013 is reflected as Securities lending income on the Statement of Operations. Any outstanding loans by the Portfolio at December 31, 2013 are disclosed in the footnotes to the Schedule of Investments.
Directed Brokerage Agreement - The Trust has entered into a directed brokerage arrangement with State Street Global Markets (“SSGM”). Under this arrangement, the Portfolio directs certain trades to SSGM in return for a recapture credit. SSGM issues a cash rebate to the Portfolio. Amounts paid to the Portfolio are shown separately as broker commission recapture on the Statement of Operations of the Portfolio. Additionally, these amounts have been excluded from the calculation of the net ratio of expenses to average net assets presented in the Financial Highlights for each share class.
3. Investments in Derivative Instruments
Futures Contracts - The Portfolio may buy and sell futures contracts as a hedge, to maintain investment exposure to a target asset class or to enhance return. The Portfolio may be subject to fluctuations in equity prices, interest rates, commodity prices, and foreign currency exchange rates in the normal course of pursuing its investment objective. Futures contracts are standardized agreements to buy or sell a security, or deliver a final cash settlement price in connection with an index, interest rate, currency, or other asset. The Portfolio must deposit an amount (“initial margin”) equal to a certain percentage of the face value of the futures contract. The initial margin may be in the form of cash or securities, which is returned when the Portfolio’s obligations under the contract have been satisfied. If cash is deposited as the initial margin, it is shown as cash collateral on the Statement of Assets and Liabilities. Futures
MSF-15
Metropolitan Series Fund
T. Rowe Price Large Cap Growth Portfolio
Notes to Financial Statements—December 31, 2013—(Continued)
contracts are marked-to-market daily, and subsequent payments (“variation margin”) are made or received by the Portfolio depending on whether unrealized gains or losses are incurred. These amounts are reflected as receivables or payables on the Statement of Assets and Liabilities and as a component of net change in unrealized appreciation/depreciation on the Statement of Operations. When the contract is closed or expires, the Portfolio records a realized gain or loss equal to the difference between the value of the contract at the time it was opened and the value at the time it was closed. Risks of entering into futures contracts (and related options) include the possibility that the market for these instruments may be illiquid and that a change in the value of the contract or option may not correlate perfectly with changes in the value of the underlying instrument. Futures contracts are exchange-traded and the exchange’s clearinghouse, as counterparty to all exchange-traded futures, guarantees the futures contracts against default. For over-the-counter futures the Portfolio’s ability to terminate the positions may be more limited than in the case of exchange-traded positions and may also involve the risk that securities dealers participating in such transactions would fail to meet their obligations to the Portfolio.
During the year ended December 31, 2013, the Portfolio entered into equity index futures contracts which were subject to equity price risk. During the period October 31, 2013 through November 1, 2013, the Portfolio had bought and sold $112,495,141 in equity index futures contracts. At December 31, 2013, the Portfolio did not have any open futures contracts. For the year ended December 31, 2013, the Portfolio had realized gains in the amount of $181,297 which are shown under Net realized gain on futures contracts in the Statement of Operations.
4. Certain Risks
Market Risk: In the normal course of business, the Portfolio invests in securities and enters into transactions where risks exist due to fluctuations in the market (market risk) or failure of the other party to a transaction to perform (credit and counterparty risk). The value of securities held by the Portfolio may decline in response to certain events, including those directly involving the companies whose securities are owned by the Portfolio; conditions affecting the general economy; overall market changes; local, regional or global political, social or economic instability; currency, interest rate, and price fluctuations.
Credit and Counterparty Risk: The Portfolio may be exposed to counterparty risk, or the risk that an entity with which the Portfolio has unsettled or open transactions may default. The potential loss could exceed the value of the financial assets and liabilities recorded in the financial statements. Financial assets that potentially expose the Portfolio to credit and counterparty risk consist principally of cash due from counterparties and investments. The Portfolio manages counterparty risk by entering into agreements only with counterparties that it believes have the financial resources to honor their obligations and by monitoring the financial stability of those counterparties. The Portfolio’s investment adviser attempts to mitigate counterparty risk by (i) periodically assessing the creditworthiness of its trading partners, (ii) monitoring and/or limiting the amount of its net exposure to each individual counterparty based on its assessment, and (iii) requiring collateral from the counterparty for certain transactions. In order to preserve certain safeguards for non-standard settlement trades, the Portfolio restricts its exposure to credit and counterparty losses by entering into master netting agreements with counterparties (approved brokers) with whom it undertakes a significant volume of transactions. Master Agreements govern the terms of certain transactions, and reduce the counterparty risk associated with relevant transactions by specifying credit protection mechanisms and providing standardization that improves legal certainty. Master Agreements can also help limit counterparty risk by specifying collateral posting arrangements at pre-arranged exposure levels. Collateral requirements may differ by type of derivative or investment, as applicable. Collateral or margin requirements are set by the broker or exchange clearing house for exchange traded derivatives (e.g., futures contracts and exchange traded options) while collateral terms are contract specific for over-the-counter traded derivatives (e.g., forward foreign currency exchange contracts, swap agreements and over-the-counter options).
Repurchase and reverse repurchase agreements are primarily executed under Global Master Repurchase Agreements (“GMRAs”) or Master Repurchase Agreements (“MRAs”), which provide the rights to set-off. Each repurchase and reverse repurchase agreement is initially collateralized at the transaction level. In the event of default, the total market value exposure will be offset against collateral exchanged to date, which would result in a net receivable/(payable) that would be due from/to the counterparty.
Customer Account Agreements and related addendums govern cleared derivatives transactions such as futures, options on futures, and cleared OTC derivatives. Cleared derivative transactions require posting of initial margin as determined by each relevant clearing agency which is segregated at a broker account registered with the Commodities Futures Trading Commission (CFTC), or the applicable regulator. In the U.S., counterparty risk is significantly reduced as creditors of the futures broker do not have claim to Portfolio assets in the segregated account. Additionally, portability of exposure in the event of default further reduces risk to the Portfolio. Variation margin, or changes in market value, are exchanged daily, but may not be netted between futures and cleared OTC derivatives.
Additional risks associated with each type of investment are described above within the respective security type notes. The Portfolio’s prospectus includes a discussion of the principal risks of investing in the Portfolio.
MSF-16
Metropolitan Series Fund
T. Rowe Price Large Cap Growth Portfolio
Notes to Financial Statements—December 31, 2013—(Continued)
5. Investment Transactions
Aggregate cost of purchases and proceeds of sales of investment securities, excluding short-term securities, for the year ended December 31, 2013 were as follows:
| | | | | | | | | | | | | | |
| Purchases | | | Sales | |
| U.S. Government | | | Non U.S. Government | | | U.S. Government | | | Non U.S. Government | |
| $ | 0 | | | $ | 933,313,364 | | | $ | 0 | | | $ | 850,329,384 | |
The Portfolio engaged in security transactions with other accounts managed by T. Rowe Price Associates, Inc. that amounted to $153,843 in purchases of investments and $1,734,929 in sales of investments, which is included above.
During the year ended December 31, 2013, the Portfolio engaged in security transactions with other affiliated portfolios. These amounted to $80,447,177 in purchases of investments, which are included above.
With respect to the Portfolio’s merger with RCM Technology Portfolio (see Note 10) on April 26, 2013, the Portfolio acquired long-term securities with a cost of $302,620,180 that are not included in the above non-U.S. Government purchases value.
6. Investment Management Fees and Other Transactions with Affiliates
Investment Management Agreement - MetLife Advisers is the investment adviser to the Portfolio. The Trust has entered into an investment management agreement with MetLife Advisers with respect to the Portfolio. For providing investment management services to the Portfolio, MetLife Advisers receives monthly compensation at the following annual rates:
| | | | | | |
Management
Fees earned by
MetLife Advisers
for the year ended
December 31, 2013 | | % per annum | | | Average daily net assets |
| $12,581,606 | | | 0.650 | % | | Of the first $50 million |
| | | 0.600 | % | | On amounts in excess of $50 million |
MetLife Advisers has entered into an investment subadvisory agreement with respect to the Portfolio. T. Rowe Price Associates, Inc. (“T. Rowe Price”) is compensated by MetLife Advisers to provide subadvisory services for the Portfolio.
Management Fee Waivers - Pursuant to an expense agreement, MetLife Advisers has agreed, for the period April 29, 2013 through April 27, 2014, to reduce its advisory fees set out above under “Investment Management Agreement” for each class of the Portfolio as follows provided the Portfolio’s assets exceed $1 billion:
| | |
| % per annum | | Average daily net assets |
| 0.030% | | On the first $50 million |
| 0.010% | | On amounts between $100 million and $1.5 billion |
| 0.025% | | On amounts in excess of $1.5 billion |
If the Portfolio’s average daily net assets fall below $1 billion, the per annum fee reduction would be 0.015% on the first $50 million.
An identical expense agreement was in place for the period April 30, 2012 through April 28, 2013. Amounts waived for the year ended December 31, 2013 amounted to $303,168 and are included in the total amounts shown as management fee waivers in the Statement of Operations.
Effective February 17, 2005, T. Rowe Price agreed to a voluntary subadvisory fee waiver that applies if (i) assets under management by T. Rowe Price for the Trust and Met Investors Series Trust (“MIST”), an affiliate of the Trust, in the aggregate, exceed $750,000,000, (ii) T. Rowe Price subadvises three or more portfolios of the Trust and MIST in the aggregate, and (iii) at least one of those portfolios is a large cap domestic equity portfolio.
If the aforementioned conditions are met, T. Rowe Price will waive its subadvisory fee paid by MetLife Advisers by 5% for combined Trust and MIST average daily net assets over $750,000,000, 7.5% for the next $1,500,000,000 of combined assets, and 10% for amounts over $3,000,000,000. Any amounts waived pursuant to this subadvisory fee waiver will be allocated with respect to the Trust and MIST portfolios in proportion to such portfolios’ net assets. MetLife Advisers has voluntarily agreed to reduce its advisory fee for the Portfolio by the amount waived (if any) by T. Rowe Price for the Portfolio pursuant to this voluntary subadvisory fee waiver. Because these fee waivers are voluntary, and not contractual, they may be discontinued by T. Rowe Price and MetLife Advisers at any time. Amounts voluntarily waived by MetLife Advisers for the year ended December 31, 2013 amounted to $597,154 and are included in the total amounts shown as management fee waivers in the Statement of Operations.
MSF-17
Metropolitan Series Fund
T. Rowe Price Large Cap Growth Portfolio
Notes to Financial Statements—December 31, 2013—(Continued)
Certain officers and trustees of the Trust may also be officers of MetLife Advisers; however, such officers and trustees receive no compensation from the Trust.
Transfer Agency Agreement - MetLife serves as the transfer agent for the Trust. MetLife receives no fees for its services to the Trust under the transfer agency agreement.
Distribution and Service Fees - The Trust has a distribution agreement with MetLife Investors Distribution Company (“MIDC” or the “Distributor”) in which MIDC serves as the distributor for the Portfolio’s Class A, B and E Shares. MIDC is a wholly-owned subsidiary of MetLife Investors Group, Inc., an affiliate of the Adviser. The Trust has also adopted a Distribution and Service Plan under Rule 12b-1 of the 1940 Act for the Portfolio’s Class B and E Shares. Under the Distribution and Service Plan, the Class B and E Shares of the Portfolio pay a fee to compensate the Insurance Companies (or their affiliates) and other broker-dealers and financial intermediaries involved in the offer and sale of Portfolio shares for promoting or selling and servicing the Class B and E Shares. The fees under the Distribution and Service Plan for each class of the Portfolio’s shares are calculated as a percentage of the Portfolio’s average daily net assets that are attributable to that Class. Currently, the fee is 0.25% per year for Class B Shares and 0.15% per year for Class E Shares. Amounts incurred by the Portfolio for the year ended December 31, 2013 are shown as Distribution and service fees in the Statement of Operations.
Deferred Trustee Compensation - Each Trustee who is not currently an employee of the Adviser or any of its affiliates receives compensation from the Trust for his or her service to the Trust. A deferred compensation plan (the “Plan”) is available to the Trustees on a voluntary basis. Deferred amounts remain in the Trust until distributed in accordance with the provisions of the Plan. The value of a participating Trustee’s deferral account is based on theoretical investments of deferred amounts, on the normal payment dates in certain portfolios of the Trust or Met Investors Series Trust, an affiliate of the Trust, as designated by the participating Trustee. Changes in the value of participants’ deferral accounts are reflected as Trustees’ fees and expenses in the Statement of Operations. The portion of the accrued obligations allocated to the Portfolio under the Plan is reflected as Deferred trustees’ fees in the Statement of Assets and Liabilities.
7. Transactions in Securities of Affiliated Issuers
A summary of the Portfolio’s transactions in the securities of affiliated issuers during the year ended December 31, 2013 is as follows:
| | | | | | | | | | | | | | | | | | | | | | | | |
Security Description | | Number of
shares held at
December 31, 2012 | | | Shares
purchased | | | Shares sold | | | Number of
shares held at
December 31, 2013 | | | Realized
Gain/(Loss)
on shares sold | | | Income for
the year ended
December 31, 2013 | |
T. Rowe Price Government Reserve Investment Fund | | | 27,902,755 | | | | 792,495,287 | | | | (798,502,265 | ) | | | 21,895,777 | | | $ | 0 | | | $ | 10,965 | |
8. Contractual Obligations
Under the Trust’s organizational documents, its officers and Trustees may be indemnified against certain liabilities and expenses arising out of the performance of their duties to the Trust. Additionally, the Trust has a variety of indemnification obligations under contracts with its service providers. The Trust’s maximum exposure under these arrangements is unknown, as this would involve future claims that may be made against the Trust that have not yet occurred.
9. Income Tax Information
The tax character of distributions paid for the periods ended December 31, 2013 and 2012 was as follows:
| | | | | | | | | | | | | | | | | | | | |
Ordinary Income | | | Long-Term Capital Gain | | | Total | |
2013 | | 2012 | | | 2013 | | | 2012 | | | 2013 | | | 2012 | |
| $4,999,060 | | $ | 1,285,777 | | | $ | — | | | $ | — | | | $ | 4,999,060 | | | $ | 1,285,777 | |
As of December 31, 2013, the components of distributable earnings (accumulated losses) on a federal income tax basis were as follows:
| | | | | | | | | | | | | | | | |
Undistributed
Ordinary
Income | | Undistributed
Long-Term
Capital Gain | | | Net
Unrealized
Appreciation | | | Loss Carryforwards | | | Total | |
| $1,402,047 | | $ | 180,784,002 | | | $ | 823,792,195 | | | $ | — | | | $ | 1,005,978,244 | |
The Portfolio utilizes the provisions of the federal income tax laws that provide for the carryforward of capital losses for prior years, offsetting such losses against any future realized capital gains. Under the Regulated Investment Company Modernization Act of 2010 (the “Act”), net capital losses recognized after December 22, 2010 may be carried forward indefinitely and their character is retained as short-term and/or long-term losses. Previously, net capital losses were carried forward for up to eight years and treated as short-term losses. As a transition rule, the Act requires that post-enactment net capital losses be used before pre-enactment net capital losses.
MSF-18
Metropolitan Series Fund
T. Rowe Price Large Cap Growth Portfolio
Notes to Financial Statements—December 31, 2013—(Continued)
As of December 31, 2013, the Portfolio had no post-enactment accumulated capital losses and no pre-enactment accumulated capital loss carryforwards.
During the year ended December 31, 2013, the Portfolio utilized capital loss carryforwards of $23,615,896.
10. Acquisition
At the close of business on April 26, 2013, the Portfolio, with aggregate Class A, Class B and Class E net assets of $1,526,495,286, $231,435,766 and $17,215,784, respectively, acquired all of the assets and liabilities of RCM Technology Portfolio of the Met Investors Series Trust (“RCM Technology”).
The acquisition was accomplished by a tax-free exchange of 2,897,854 Class A shares of the Portfolio (valued at $55,320,025) for 13,535,094 Class A shares of RCM Technology; 13,508,986 Class B shares of the Portfolio (valued at $256,400,558) for 65,404,490 of Class B shares of RCM Technology; and 826,063 Class E shares of the Portfolio (valued at $15,719,980) for 3,941,164 of Class E shares of RCM Technology. Each shareholder of RCM Technology received shares of the Portfolio with the same class designation and at the respective Class NAV, as determined at the close of business on April 26, 2013. The transaction was part of a restructuring designed to eliminate the offering of overlapping Portfolios in the MetLife, Inc. families of funds with similar investment objectives and similar investment strategies that serve as funding vehicles for insurance contracts that are offered by affiliates of MetLife. Some of the investments held by RCM Technology may have been purchased or sold prior to the acquisition for the purpose of complying with the anticipated investment policies or limitations of the Portfolio after the acquisition. If such purchases or sales occurred, the transaction costs were borne by RCM Technology. All other costs associated with the merger were not borne by the shareholders of either portfolio.
RCM Technology’s net assets on April 26, 2013, were $55,320,025, $256,400,558 and $15,719,980 for Class A, Class B and Class E shares, respectively, including investments valued at $327,542,456 with a cost basis of $314,461,180. For financial reporting purposes, assets received, liabilities assumed and shares issued by the Portfolio were recorded at fair value; however, the cost basis of the investments received by the Portfolio from RCM Technology were carried forward to align ongoing reporting of the Portfolio’s realized and unrealized gains and losses with amounts distributable to shareholders for tax purposes.
The aggregate net assets of the Portfolio immediately after the acquisition were $2,102,587,399, which included $13,079,428 of acquired unrealized appreciation on investments and foreign currency transactions.
Assuming the acquisition had been completed on January 1, 2013, the Portfolio’s pro-forma results of operations for the year ended December 31, 2013 are as follows:
| | | | |
Net Investment income | | $ | 2,217,513 | (a) |
Net realized and unrealized gain on investments and foreign currency transactions | | $ | 723,537,821 | (b) |
| | | | |
Net increase in net assets from operations | | $ | 725,755,334 | |
| | | | |
Because the combined investment portfolios have been managed as a single integrated portfolio since the acquisition was completed, it is not practicable to separate the amounts of revenue and earnings of RCM Technology that have been included in the Portfolio’s Statement of Operations since April 26, 2013.
| (a) | $1,666,425 net investment income as reported plus $202,254 from RCM Technology pre-merger net investment income, plus $350,357 in lower advisory fees, minus $1,523 of pro-forma additional other expenses. |
| (b) | $829,486,247 Unrealized appreciation as reported minus $336,326,710 pro-forma December 31, 2012 Unrealized depreciation, plus $204,118,860 Net realized gain as reported, plus $26,259,424 in Net Realized gain from RCM Technology pre-merger. |
MSF-19
Metropolitan Series Fund
T. Rowe Price Large Cap Growth Portfolio
Report of Independent Registered Public Accounting Firm
To the Shareholders of T. Rowe Price Large Cap Growth Portfolio and the Board of Trustees of Metropolitan Series Fund:
We have audited the accompanying statement of assets and liabilities, including the schedule of investments, of T. Rowe Price Large Cap Growth Portfolio, one of the portfolios constituting Metropolitan Series Fund, (the “Trust”) as of December 31, 2013, and the related statement of operations for the year then ended, the statements of changes in net assets for each of the two years in the period then ended, and the financial highlights for each of the five years in the period then ended. These financial statements and financial highlights are the responsibility of the Trust’s management. Our responsibility is to express an opinion on these financial statements and financial highlights based on our audits.
We conducted our audits in accordance with the standards of the Public Company Accounting Oversight Board (United States). Those standards require that we plan and perform the audit to obtain reasonable assurance about whether the financial statements and financial highlights are free of material misstatement. The Trust is not required to have, nor were we engaged to perform, an audit of its internal control over financial reporting. Our audits included consideration of internal control over financial reporting as a basis for designing audit procedures that are appropriate in the circumstances, but not for the purpose of expressing an opinion on the effectiveness of the Trust’s internal control over financial reporting. Accordingly, we express no such opinion. An audit also includes examining, on a test basis, evidence supporting the amounts and disclosures in the financial statements, assessing the accounting principles used and significant estimates made by management, as well as evaluating the overall financial statement presentation. Our procedures included confirmation of securities owned as of December 31, 2013, by correspondence with the custodian and brokers; where replies were not received from brokers, we performed other auditing procedures. We believe that our audits provide a reasonable basis for our opinion.
In our opinion, the financial statements and financial highlights referred to above present fairly, in all material respects, the financial position of the T. Rowe Price Large Cap Growth Portfolio of Metropolitan Series Fund, as of December 31, 2013, the results of its operations for the year then ended, the changes in its net assets for each of the two years in the period then ended, and the financial highlights for each of the five years in the period then ended, in conformity with accounting principles generally accepted in the United States of America.
Deloitte & Touche LLP
Boston, Massachusetts
February 26, 2014
MSF-20
Metropolitan Series Fund
Trustees and Officers of Metropolitan Series Fund
The Trustees and executive officers of the Trust, their ages and their principal occupations during the past five years are set forth below. Unless otherwise indicated, the business address of each is One Financial Center, Boston, MA 02111. Each Trustee who is deemed an “interested person,” as such term is defined in the 1940 Act, is indicated by an asterisk. Those Trustees who are not “interested persons” as defined in the 1940 Act are referred to as “Independent Trustees.” Additional information about the Trustees is available in the Statement of Additional Information, which is available without charge, upon request, by calling (800) 848-3854.
Trustees of the Trust
| | | | | | | | | | |
Name and Age | | Position(s)
Held with
Registrant | | Term of Office
and Length of
Time Served | | Principal Occupation(s) During the Past 5
Years(1) | | Number of
Portfolios
in Fund
Complex(2)
overseen | | Other Directorships Held
by Trustee During the
Past 5 Years(1) |
| Interested Trustee | | | | | | | | | | |
| Elizabeth M. Forget* (47) | | Trustee, Chairman of the Board, President and Chief Executive Officer | | Indefinite;
From
May
2006
(President
and Chief
Executive
Officer)/
August
2006
(Trustee
and
Chairman
of the
Board) to
present | | Senior Vice President, MetLife Inc.; President, MetLife Advisers, LLC and a predecessor company. | | 79 | | Trustee, Met Investors Series Trust (the “MIST Trust”);** various MetLife-affiliated boards. |
| | | | | |
| Independent Trustees | | | | | | | | | | |
| Stephen M. Alderman (54) | | Trustee | | Indefinite;
From
April
2012 to
present | | Shareholder in the law firm of Garfield & Merel, Ltd. | | 79 | | Trustee, MIST Trust;** Director, International Truck Leasing Corp. |
| | | | | |
| Robert J. Boulware (57) | | Trustee | | Indefinite;
From
April
2012 to
present | | Managing Director, Pilgrim Funds, LLC (private equity fund). | | 79 | | Trustee, MIST Trust;** Trustee, Vertical Capital Income Fund (closed-end fund); Director, Gainsco, Inc. (auto insurance). |
| | | | | |
| Susan C. Gause (61) | | Trustee | | Indefinite;
From
April
2012 to
present | | Private Investor. | | 79 | | Trustee, MIST Trust;** Trustee, HSBC Funds. |
| | | | | |
| Nancy Hawthorne (62) | | Trustee | | Indefinite;
From
May
2003 to
present | | Chief Executive Officer, Clerestory LLC (corporate advisor). | | 79 | | MIST Trust;** Director, THL Credit, Inc.**; Director, Avid Technology, Inc.** |
| | | | | |
| Barbara A. Nugent (57) | | Trustee | | Indefinite;
From
January
2014 to
present | | President, True North Board Governance, LLC (consulting); until 2014, partner in the law firm of Stradley Ronon Stevens & Young, LLP. | | 79 | | Trustee, MIST Trust**; Director, Episcopal Healthcare Foundation; until 2014, member, Mutual Fund Directors Forum Advisory Board. |
MSF-21
Metropolitan Series Fund
Trustees and Officers of Metropolitan Series Fund—(Continued)
| | | | | | | | | | |
Name and Age | | Position(s)
Held with
Registrant | | Term of Office
and Length of
Time Served | | Principal Occupation(s) During the Past 5
Years(1) | | Number of
Portfolios
in Fund
Complex(2)
overseen | | Other Directorships Held
by Trustee During the
Past 5 Years(1) |
| Keith M. Schappert (62) | | Trustee | | Indefinite;
From
August
2009 to
present | | Principal, Schappert Consulting LLC (asset management consulting). | | 79 | | Trustee, MIST Trust;** Director, The Commonfund for Nonprofit Organizations; until 2011, Director, Trilogy Global Advisors; Director, Mirae Asset Discovery Funds,** Director, Calamos Investments. |
| | | | | |
| Linda B. Strumpf (66) | | Trustee | | Indefinite;
From
May
2000 to
present | | Chair of the Investment Committee, Leona M. and Harry B. Helmsley Charitable Trust; until 2011, Chief Investment Officer, Leona M. and Harry B. Helmsley Charitable Trust. | | 79 | | Since 2012, Trustee, MIST Trust,** Trustee and Member of Investment Committee, The Pennsylvania State University. |
| | | | | |
| Dawn M. Vroegop (47) | | Trustee | | Indefinite;
From
May
2009 to
present | | Private Investor. | | 79 | | Trustee, MIST Trust,** Trustee, Driehaus Mutual Funds; Director and Investment Committee Chair, City College of San Francisco Foundation. |
Executive Officers of the Trust
| | | | | | |
Name and Age | | Position(s) Held with
Registrant | | Term of Office
and Length of
Time Served | | Principal Occupation(s) During Past 5 Years(1) |
| Elizabeth M. Forget (47) | | President, Chief Executive Officer, Trustee and Chairman of the Board | | From May
2006 (President
and Chief
Executive
Officer)/
August 2006
(Trustee and
Chairman of
the Board) to
present | | See principal occupation information in the table above. |
| | | |
| Jeffrey L. Bernier (42) | | Vice President | | From February
2008 to present | | Vice President, MetLife, Inc.; Senior Vice President, MetLife Advisers, LLC and a predecessor company. |
| | | |
| Peter H. Duffy (58) | | Chief Financial Officer and Treasurer | | From November
2000 to present | | Senior Vice President, MetLife Advisers, LLC; Vice President, MetLife, Inc. |
| | | |
| Andrew L. Gangolf (59) | | Secretary | | From May
2011to present | | Senior Vice President, MetLife Advisers, LLC; Senior Vice President & Assistant General Counsel, AllianceBerstein Investments, Inc. |
| | | |
| Jeffrey P. Halperin (46) | | Chief Compliance Officer | | From November
2005 to present | | Vice President, MetLife, Inc.; Chief Compliance Officer, MIST; Chief Compliance Officer, MSF Trust; Chief Compliance Officer, MetLife Advisers, LLC and a predecessor company; Chief Compliance Officer, MetLife Investment Management, LLC (formerly MetLife Investment Advisors Company, LLC). |
| | | |
| Alan C. Leland, Jr. (61) | | Vice President | | From February
2005 to present | | Treasurer and Chief Financial Officer, MetLife Advisers, LLC; Vice President, MetLife Group Inc.; Vice President, MetLife, Inc. |
| * | Ms. Forget is an “interested person” of the Trust because of her positions with MetLife Advisers, LLC and her ownership of securities issued by MetLife, Inc., the ultimate parent company of MetLife Advisers, LLC. |
| ** | Indicates a directorship with a registered investment company or a company subject to the reporting requirements of the Securities Exchange Act of 1934, as amended. |
| (1) | Previous positions during the past five years with the Trust, MetLife, Inc. or the Adviser are omitted if not materially different. |
| (2) | The Fund Complex includes 49 Portfolios of the MIST Trust and 30 Portfolios of the Trust. |
MSF-22
Metropolitan Series Fund
T. Rowe Price Large Cap Growth Portfolio
Board of Trustees’ Consideration of Advisory and Sub-Advisory Agreements
At an in-person meeting of the Boards of Trustees (the “Board”) of Met Investors Series Trust and Metropolitan Series Fund (“MIST” and “MSF,” respectively, and collectively, the “Trusts”) held on November 19-20, 2013, the Board, including a majority of the Trustees who are not considered to be “interested persons” of the Trusts (the “Independent Trustees”) under the Investment Company Act of 1940, as amended (the “1940 Act”), approved for an annual period the continuation of each Trust’s advisory agreement (the “Advisory Agreement”) with MetLife Advisers, LLC (the “Adviser”) and the applicable sub-advisory agreements (each a “Sub-Advisory Agreement,” and collectively with the Advisory Agreement, the “Agreements”) between the Adviser and the investment sub-advisers (each a “Sub-Adviser,” and collectively, the “Sub-Advisers”) for each of the series of the Trusts, including the T. Rowe Price Large Cap Growth Portfolio (each a “Portfolio,” and collectively, the “Portfolios”).1
In considering the Agreements, the Board reviewed a variety of materials provided by the Adviser and the Sub-Advisers relating to the Portfolios, including comparative performance, fee and expense information for an appropriate peer group of similar mutual funds, performance information for relevant benchmark indices and other information regarding the nature, extent and quality of services provided by the Adviser and the Sub-Advisers under their respective Agreements. The Board also took into account its experience with the Adviser and the Sub-Advisers and information provided to the Board in its meetings throughout the year with respect to the services provided by the Adviser and the Sub-Advisers, including quarterly performance reports prepared by management containing reviews of investment results, and periodic presentations from certain of the Sub-Advisers with respect to the Portfolios they manage. The Independent Trustees also assessed reports provided by the Board’s independent consultant, who reviewed and provided analyses regarding investment performance, fees and expenses, and other information provided by, or at the direction of, the Adviser and the Sub-Advisers, as more fully discussed below.
The Independent Trustees were separately advised by independent legal counsel throughout the process, and met with independent legal counsel in periodic executive sessions. Prior to voting to continue the Agreements at the November meeting, the Independent Trustees also received a memorandum from their independent counsel discussing the legal standards for their consideration of the proposed continuation of the Agreements. The Board also met in person with personnel of the Adviser on September 17, 2013 for the specific purpose of giving preliminary consideration to the proposed continuation of the Agreements and to request additional information they considered reasonably necessary to their deliberations. The Independent Trustees also discussed the proposed continuation of the Agreements in private sessions with their independent legal counsel at which no representatives of management were present.
In considering whether to approve the renewal of the Advisory Agreement with the Adviser and any applicable Sub-Advisory Agreements with respect to a Portfolio, the Board reviewed and analyzed the factors it deemed relevant, including: (1) the nature, extent and quality of the services to be provided to the Portfolios by the Adviser and the Sub-Advisers; (2) the performance of the Portfolios as compared to a peer group and an appropriate index; (3) the Adviser’s and each of the Sub-Adviser’s personnel and operations; (4) the financial condition of the Adviser and of the Sub-Advisers; (5) the level and method of computing each Portfolio’s advisory and sub-advisory fees; (6) the profitability of the Adviser under the Advisory Agreement and of certain of the Sub-Advisers under the Sub-Advisory Agreements; (7) any “fall-out” benefits to the Adviser, the Sub-Advisers and their affiliates (i.e., ancillary benefits realized by the Adviser, the Sub-Advisers or their affiliates from the Adviser’s or Sub-Advisers’ relationship with the Trusts); (8) the anticipated effect of growth in size on Portfolio expenses; (9) fees paid to certain of the Sub-Advisers by comparable institutional and retail accounts; and (10) possible conflicts of interest.
Nature, extent and quality of services. The Board evaluated the nature, extent and quality of the services that the Adviser, and the Sub-Advisers as relevant, have provided to the Portfolios. The Board considered the Adviser’s services as investment manager to the Portfolios, including services relating to the selection and oversight of the Sub-Advisers for the applicable Portfolios. The Board considered, among other things, the Adviser’s oversight of the provision of services to the Portfolios by the Sub-Advisers, including with respect to investment activities and trading practices, and the Sub-Adviser’s compliance with fund policies, objectives and Board directives, compliance policies and procedures and applicable law. The Adviser’s services in coordinating and overseeing the activities of the Trusts’ other service providers were also considered. The Board also evaluated the expertise and performance of the personnel of the Adviser who performed services for the Portfolios throughout the year.
The Board considered information received from the Trust’s Chief Compliance Officer (“CCO”) regarding the Portfolios’ compliance policies and procedures established pursuant to Rule 38a-l under the 1940 Act. The Board also evaluated the CCO’s ongoing reports concerning the CCO’s oversight of the risk assessment processes of the Sub-Advisers.
1 The Pyramis Managed Risk Portfolio recently commenced operations and, therefore, the Agreement with respect to this Portfolio was not up for renewal.
MSF-23
Metropolitan Series Fund
T. Rowe Price Large Cap Growth Portfolio
Board of Trustees’ Consideration of Advisory and Sub-Advisory Agreements—(Continued)
With respect to the services provided by each of the Sub-Advisers, the Board considered, among other things, information provided to the Board by each Sub-Adviser. The Board considered the Sub-Adviser’s current level of staffing and its overall resources, as well as its compensation program. The Board reviewed each Sub-Adviser’s history and investment experience, as well as information regarding the qualifications, background and responsibilities of the Sub-Adviser’s investment and compliance personnel who provide services to the Portfolios. The Board also considered, among other things, the Sub-Adviser’s compliance program and any disciplinary history. The Board also took into account the Sub-Adviser’s risk assessment and monitoring process. The Board noted each Sub-Adviser’s regulatory history, including whether it was currently involved in any regulatory actions or investigations as well as material litigation, and any settlements and amelioratory actions undertaken, as appropriate. The Board also noted that the CCO and his staff conduct regular, periodic compliance reviews with each of the Sub-Advisers and present reports to the Independent Trustees regarding the same, which includes evaluating the regulatory compliance systems of the Sub-Advisers and procedures reasonably designed by them to help assure compliance with the federal securities laws, including issues related to late trading and market timing, best execution, fair value pricing, and proxy voting procedures, among others. The Board also took into account the financial condition of each Sub-Adviser. In its review, the Board also received and took into account information regarding any services and/or payments provided to the Adviser by the Sub-Advisers in connection with marketing activities.
The Board considered each Sub-Adviser’s investment process and philosophy. The Board took into account that each Sub-Adviser’s responsibilities include the development and maintenance of an investment program for the applicable Portfolio which is consistent with the Portfolio’s investment objectives, the selection of investment securities and the placement of orders for the purchase and sale of such securities, as well as the implementation of compliance controls related to performance of these services. The Board also reviewed each Sub-Adviser’s brokerage policies and practices.
Performance. The Board considered the performance of the Portfolios as described in the quarterly reports prepared by management, and as also analyzed in reports prepared by the Independent Trustees’ independent consultant. The Board noted that the Adviser reviews with the Board on a quarterly basis detailed information about the Portfolios’ performance results, portfolio composition and investment strategies. The Board also reviewed and considered a separate report prepared by Lipper Inc. (“Lipper”), an independent third party, which provided a statistical analysis comparing the Portfolios’ investment performance, expenses, and fees to comparable funds underlying variable insurance products (the “Performance Universe”). In addition, the Independent Trustees met separately with a representative of Bobroff Consulting, Inc., an independent consultant (“Bobroff), at a special board meeting in September 2013, to review the separate reports prepared by such consultant (“Bobroff Report”), which analyzed the report prepared by Lipper. The Board also considered each Portfolio’s more recent performance subsequent to the performance period covered by the Lipper reports, and management’s discussion of the same, including the effect of current market conditions on each Portfolio’s more recent performance.
The Board reviewed the Portfolios’ performance records and the Adviser’s and Sub-Advisers’ management styles and long-term performance records with the Portfolios and comparable funds. The Board focused particular attention on Portfolios with less favorable performance records. The Board was mindful of the Adviser’s focus on each Sub-Adviser’s performance and noted that the Adviser has been active in monitoring and responding to any performance issues with respect to the Portfolios. The Board also took into account its discussions with management regarding factors that contributed to the performance of the Portfolios.
Among other data relating specifically to the T. Rowe Price Large Cap Growth Portfolio’s performance, the Board considered that the Portfolio outperformed the median of its Performance Universe and its Lipper Index for the three- and five-year periods ended June 30, 2013. The Board also considered that the Portfolio outperformed the median of its Performance Universe for the one-year period ended June 30, 2013 but underperformed its Lipper Index for that same period. The Board also considered that the Portfolio outperformed its benchmark, the Russell 1000 Growth Index, for the one-, three- and five-year periods ended October 31, 2013.
Fees and Expenses. The Board gave consideration to the advisory fees payable under the Advisory Agreement and the sub-advisory fees payable under each of the Sub-Advisory Agreements. In this regard, the Board reviewed the advisory fees payable on a Portfolio-by-Portfolio basis based on information provided by the Adviser. The Independent Trustees, with the assistance of Bobroff, also examined the fees paid by a Portfolio in light of fees paid to other investment managers by comparable funds, as well as considered the fees charged by the Adviser to manage other comparable funds, as applicable. The Lipper report included comparisons of the Adviser’s fee schedule with that of its peers based on an asset-based analysis of relative fee structures according to the size of the Portfolio. In addition, the Board considered the Portfolios’ advisory and sub-advisory fees and total expenses as compared to similarly situated investment companies underlying variable insurance products deemed to be comparable to the Portfolios as determined by Lipper. The Board considered a Portfolio’s ranking within a smaller group of peer funds chosen by Lipper (the “Expense Group”), as well as the Portfolio’s ranking within broader groups of funds (the “Expense Universe” and the “Sub-advised Expense Universe”). The Board
MSF-24
Metropolitan Series Fund
T. Rowe Price Large Cap Growth Portfolio
Board of Trustees’ Consideration of Advisory and Sub-Advisory Agreements—(Continued)
also considered a Portfolio’s contractual sub-advisory fees, as applicable, as compared to the Sub-advised Expense Universe as well as a smaller group of funds (the “Sub-advised Expense Group”). In comparing a Portfolio’s actual and contractual management fee to that of comparable funds, the Board noted that such fee includes both advisory and administrative fees.
The Board noted that the sub-advisory fees for the Portfolios are paid by the Adviser, not the Portfolios, out of the advisory fee. It was further noted that the Adviser negotiates such fees at arm’s length. The Board also considered that the Adviser had entered into expense limitation agreements with certain of the Portfolios, pursuant to which the Adviser has agreed to waive a portion of its advisory fee and/or reimburse certain expenses as a means of limiting a Portfolio’s total annual operating expenses. The Board further considered the amount of sub-advisory fees paid out by the Adviser and the amount of the management fees that it retained in light of the services performed by Sub-Advisers and Adviser, respectively.
With respect to the T. Rowe Price Large Cap Growth Portfolio, the Board considered that the Portfolio’s actual management fees and total expenses (exclusive of 12b-1 fees) were below the median of the Expense Group, Expense Universe and Sub-advised Expense Universe. The Board further noted that the Portfolio’s contractual management fees were below the asset-weighted average of the Expense Group at the Portfolio’s current size. The Board also noted that the Portfolio’s contractual sub-advisory fees were above the average of the Sub-advised Expense Group and the Sub-advised Expense Universe at the Portfolio’s current size. The Board further noted that the Adviser had waived fees and/or reimbursed expenses during the past year.
Profitability. The Board examined the profitability of the Adviser on a Portfolio-by-Portfolio basis. The Board also considered that the Distributor, MetLife Investors Distribution Company, receives Rule 12b-1 payments to support the distribution of the products. The Board considered the profitability to the Sub-Advisers and their affiliates as a result of their relationships with the Portfolios, and the Board considered the ability of the Adviser to negotiate the Sub-Advisory Agreements and the fees thereunder at arm’s length. The Board also reviewed Portfolio specific data with regard to the profitability of the Portfolios to each Sub-Adviser, as available.
Economies of scale. The Board also considered the effect of the Portfolios’ growth in size on their fees. The Board noted that the fee schedules for most of the Portfolios contain breakpoints that reduce the fee rate above specified asset levels. The Board noted those Portfolios that did not contain breakpoints in the advisory fee and took into account management’s discussion of the same. The Board noted that those Portfolios with advisory fee schedules containing breakpoints generally reflect the inclusion of breakpoints in the sub-advisory fee schedule for such Portfolios. The Board considered the effective fees under the Advisory Agreement for a Portfolio as a percentage of assets at different asset levels and possible economies of scale that may be realized if the assets of the Portfolio grow. Among other data, the Board examined the effect of a Portfolio’s growth in size on various fee schedules and reviewed the Lipper and Bobroff Reports, which compared fees among peers. The Board also generally noted that if a Portfolio’s assets increase over time, the Portfolio may realize other economies of scale if assets increase proportionally more than certain other fixed expenses. In addition, the Board noted that the Adviser had taken a number of steps to date intended to share the benefits of economies of scale with contractholders.
With respect to the T. Rowe Price Large Cap Growth Portfolio, the Board noted that the Portfolio’s advisory fee and sub-advisory fee each contain breakpoints that reduce the advisory fee rate on assets above certain specified asset levels. The Board considered the fact that the Portfolio’s fee levels decline as portfolio assets increase.
Other factors. As part of its evaluation of the Adviser’s compensation, the Board considered other benefits that may be realized by the Adviser and its affiliates from their relationship with the Trusts. Among them, the Board recognized that an affiliate of the Adviser, MetLife Investors Distribution Company, serves as the Distributor for the Trusts, and, as such, receives payments pursuant to Rule 12b-1 from the Portfolios to compensate it for providing shareholder services and selling activities, which could lead to growth in the Trusts’ assets and corresponding benefits from such growth, including economies of scale. The Board also considered that affiliates of the Adviser may benefit from certain indirect tax benefits relating to dividend received deductions and foreign tax credits. In conjunction with these considerations, the Board noted the costs of providing investment management and other services to the Portfolios and the ongoing commitment of the Adviser to the Portfolios.
The Board considered other benefits that may be realized by each Sub-Adviser and its affiliates from their relationship with the Trusts, including the opportunity to provide advisory services to additional portfolios of the Trusts and reputational benefits. In conjunction with these considerations, the Board noted the costs of providing investment advisory services to the Portfolios and the ongoing commitment of the Sub-Advisers to the Portfolios.
The Board considered possible conflicts of interest in the form of material benefits or detriments to the Trusts resulting from the nature of the Trusts’ and the Adviser’s or the Sub-Advisers’ affiliations and the services that are provided to the Trusts, and the manner in which such conflicts were mitigated.
MSF-25
Metropolitan Series Fund
T. Rowe Price Large Cap Growth Portfolio
Board of Trustees’ Consideration of Advisory and Sub-Advisory Agreements—(Continued)
Conclusions. After full consideration of the factors discussed above, the Board, including a majority of the Independent Trustees, approved the Advisory Agreement and the Sub-Advisory Agreement, as applicable, with respect to each Portfolio, unless otherwise noted. In making its approvals, the Board concluded that the nature, extent and quality of services provided by the Adviser and each Sub-Adviser supported the renewal of the Agreements. The Board also concluded that the investment performance of each Fund was such that each Agreement should continue. In addition, the Board concluded that fees paid by a Portfolio to the Adviser and, if applicable, the Sub-Adviser appeared to be acceptable in light of nature, extent and quality of the services provided by the Adviser and Sub-Adviser. Further, the Board concluded that the Adviser’s profitability in providing services under the Advisory Agreements did not appear unreasonably high in light of the nature, extent and quality of the services provided by the Adviser. Finally, the Board concluded that the Advisory and Sub-Advisory fees in some measure share economies of scale with contractholders. In approving the renewal of each of the Agreements, the Board, including the Independent Trustees, did not identify any single factor as controlling, and generally attributed different weights to various factors for the various Portfolios. The Board evaluated all information available to them on a Portfolio-by-Portfolio basis, and their decisions were made separately with respect to each Portfolio.
MSF-26
Metropolitan Series Fund
T. Rowe Price Small Cap Growth Portfolio
Managed by T. Rowe Price Associates, Inc.
Portfolio Manager Commentary*
PERFORMANCE
For the one year period ended December 31, 2013, the Class A, B, and E shares of the T. Rowe Price Small Cap Growth Portfolio returned 44.55%, 44.17%, and 44.32%, respectively. The Portfolio’s benchmark, the MSCI U.S. Small Cap Growth Index1, returned 44.50%.
MARKET ENVIRONMENT / CONDITIONS
Major U.S. stock markets generated excellent returns in 2013. Early on, decent employment gains and the Federal Reserve’s the “Fed” quantitative easing program helped to offset concerns about federal tax increases and automatic spending cuts. Equities fell in May after the Fed indicated that it could begin slowing monthly asset purchases, but rallied in September after the slowdown was put on hold. Stocks weakened in October amid political turmoil, but stocks climbed after a temporary solution was reached. Investors welcomed the Fed’s mid-December announcement that it would reduce asset purchases and also keep short-term interest rates low. Small-cap stocks posted the biggest annual gains, followed by mid- and large-caps. As measured by various Russell indexes, growth stocks outperformed value stocks across all market capitalizations.
PORTFOLIO REVIEW / PERIOD-END POSITIONING
The Portfolio turned in double-digit positive absolute returns for the year and outpaced its benchmark. Stock selection was the cause of the relative outperformance, while sector allocations were slightly negative. Stock choices were especially effective in the Financials, Consumer Staples, and Materials sectors. Adverse stock selection in the Consumer Discretionary and Information Technology arenas detracted from relative results.
Among Financials holdings, Altisource Portfolio Solutions and Altisource Asset Management performed well. Altisource Portfolio Solutions spun off Altisource Asset Management in late 2012. Both companies focus in real estate and reported solid earnings for the year.
Prudent stock selection in the Consumer Staples sector boosted relative returns. Nu Skin Enterprises develops and distributes anti-aging products and nutritional supplements. Increased demand for beauty products from China and the successful launch of a new weight loss product pushed revenue and earnings higher. Multi-level marketing nutrition company Herbalife also performed well.
Materials names rounded out significant relative contributors for the Portfolio. Paper container and packaging product manufacturer KapStone Paper and Packaging was successful in integrating a strategic acquisition, and earnings were solid.
In the Consumer Discretionary realm, multi-channel retailer HSN struggled. Higher shipping and handling costs exacerbated slowed sales when consumers took longer than anticipated to adjust to the company’s redeveloped website. Macroeconomic pressures also weighed on the stock during the third quarter.
Information Technology holdings also hampered relative results. TIBCO Software provides infrastructure software that enables real-time movement of data between applications. Increased competition hurt the company as price-sensitive customers looked elsewhere. The firm lowered quarterly guidance late in the year, creating a hurdle for the stock price.
The Portfolio ended the year with an overweight to the Financials, Health Care, and Industrials sectors. Portfolio holdings among Consumer Staples, Telecommunication Services, Materials, and Consumer Discretionary stocks were roughly in line with the benchmark. The Portfolio was underweight the benchmark in the Energy, Utilities, and Information Technology sectors.
Sudhir Nanda
Portfolio Manager
T. Rowe Price Associates, Inc.
* This commentary may include statements that constitute “forward-looking statements” under the U.S. securities laws. Forward-looking statements include, among other things, projections, estimates, and information about possible or future results related to the Portfolio, market or regulatory developments. The views expressed above are not guarantees of future performance or economic results and involve certain risks, uncertainties and assumptions that could cause actual outcomes and results to differ materially from the views expressed herein. The views expressed above are subject to change at any time based upon economic, market, or other conditions and the subadvisory firm undertakes no obligation to update the views expressed herein. Any discussions of specific securities should not be considered a recommendation to buy or sell those securities. The views expressed above (including any forward-looking statement) may not be relied upon as investment advice or as an indication of the Portfolio’s trading intent. Information about the Portfolio’s holdings, asset allocation or country diversification is historical and is not an indication of future Portfolio composition, which may vary. Direct investment in any index is not possible. The performance of any index mentioned in this commentary has not been adjusted for ongoing management, distribution and operating expenses, and sales charges applicable to mutual fund investments. In addition, the returns do not reflect additional fees charged by separate accounts or variable insurance contracts that an investor in the Portfolio may pay. If these additional fees were reflected, performance would have been lower.
MSF-1
Metropolitan Series Fund
T. Rowe Price Small Cap Growth Portfolio
A $10,000 INVESTMENT COMPARED TO THE MSCI U.S. SMALL CAP GROWTH INDEX

AVERAGE ANNUAL RETURNS (%) (FOR THE YEAR ENDED DECEMBER 31, 2013)
| | | | | | | | | | | | |
| | | 1 Year | | | 5 Year | | | 10 Year | |
| T. Rowe Price Small Cap Growth Portfolio | | | | | | | | | | | | |
Class A | | | 44.55 | | | | 26.22 | | | | 11.15 | |
Class B | | | 44.17 | | | | 25.91 | | | | 10.89 | |
Class E | | | 44.32 | | | | 26.03 | | | | 10.99 | |
| MSCI U.S. Small Cap Growth Index | | | 44.50 | | | | 25.43 | | | | 11.17 | |
1 The MSCI U.S. Small Cap Growth Index represents the growth companies of the MSCI U.S. Small Cap 1750 Index. (The MSCI U.S. Small Cap 1750 Index represents the universe of small capitalization companies in the U.S. equity market).
Portfolio performance is calculated including reinvestment of all income and capital gain distributions. Performance numbers are net of all Portfolio expenses but do not include any insurance, sales, separate account or administrative charges of variable annuity or life insurance contracts or any additional expenses that participants may bear relating to the operations of their plans. If these charges were included, the returns would be lower. The performance of any index referenced above has not been adjusted for ongoing management, distribution and operating expenses, and sales charges applicable to mutual fund investments. Direct investment in any index is not possible. The performance of Class A shares, as set forth in the line graph above, will differ from that of other classes because of the difference in expenses paid by policyholders investing in the different share classes.
This information represents past performance and is not indicative of future results. Investment return and principal value may fluctuate so that shares, upon redemption, may be worth more or less than the original cost.
PORTFOLIO COMPOSITION AS OF DECEMBER 31, 2013
Top Holdings
| | | | |
| | |
% of
Net Assets | |
| 3D Systems Corp. | | | 1.0 | |
| Middleby Corp. (The) | | | 1.0 | |
| Tyler Technologies, Inc. | | | 1.0 | |
| Polaris Industries, Inc. | | | 0.9 | |
| Nu Skin Enterprises, Inc - Class A | | | 0.9 | |
| Incyte Corp., Ltd. | | | 0.9 | |
| MAXIMUS, Inc. | | | 0.9 | |
| Wabtec Corp. | | | 0.8 | |
| Ultimate Software Group, Inc. | | | 0.8 | |
| Boston Beer Co., Inc. (The) - Class A | | | 0.8 | |
Top Sectors
| | | | |
| | | % of
Market Value of
Total Long-Term Investments | |
| Information Technology | | | 23.1 | |
| Health Care | | | 19.3 | |
| Consumer Discretionary | | | 18.1 | |
| Industrials | | | 17.7 | |
| Financials | | | 8.2 | |
| Energy | | | 5.1 | |
| Consumer Staples | | | 4.4 | |
| Materials | | | 3.6 | |
| Telecommunication Services | | | 0.5 | |
MSF-2
Metropolitan Series Fund
T. Rowe Price Small Cap Growth Portfolio
Understanding Your Portfolio’s Expenses
Shareholder Expense Example
As a shareholder of the Portfolio, you incur ongoing costs, including management fees; distribution and service (12b-1) fees; and other Portfolio expenses. This example is intended to help you understand your ongoing costs (in dollars) (referred to as “expenses”) of investing in the Portfolio and compare these costs with the ongoing costs of investing in other mutual funds. The example is based on an investment of $1,000 invested at the beginning of the period and held for the entire period, July 1, 2013 through December 31, 2013.
Actual Expenses
The first line for each share class of the Portfolio in the table below provides information about actual account values and actual expenses. You may use the information in this line, together with the amount you invested in the particular share class of the Portfolio, to estimate the expenses that you paid over the period. Simply divide your account value by $1,000 (for example, an $8,600 account value divided by $1,000 = 8.6), then multiply the result by the number in the first line under the heading entitled “Expenses Paid During Period” to estimate the expenses you paid on your account during this period.
Hypothetical Example for Comparison Purposes
The second line for each share class of the Portfolio in the table below provides information about hypothetical account values and hypothetical expenses based on the Portfolio’s actual expense ratio and an assumed rate of return of 5% per year before expenses, which is not the Portfolio’s actual return. The hypothetical account values and expenses may not be used to estimate the actual ending account balance or expenses you paid for the period. You may use this information to compare the ongoing costs of investing in the Portfolio and other funds. To do so, compare this 5% hypothetical example with the 5% hypothetical examples that appear in the shareholder reports of the other funds.
Please note that the expenses shown in the table are meant to highlight your ongoing costs only and do not reflect any fees or charges of your variable insurance product or any additional expenses that participants in certain eligible qualified plans may bear relating to the operations of their plan. Therefore, the second line for each share class in the table is useful in comparing ongoing costs only, and will not help you determine the relative total costs of owning different funds. In addition, if these other costs were included, your costs would have been higher.
| | | | | | | | | | | | | | | | | | |
T. Rowe Price Small Cap Growth Portfolio | | | | Annualized
Expense
Ratio | | | Beginning
Account Value
July 1,
2013 | | | Ending
Account Value
December 31,
2013 | | | Expenses Paid
During Period**
July 1, 2013
to
December 31,
2013 | |
Class A(a) | | Actual | | | 0.48 | % | | $ | 1,000.00 | | | $ | 1,242.60 | | | $ | 2.71 | |
| | Hypothetical* | | | 0.48 | % | | $ | 1,000.00 | | | $ | 1,022.79 | | | $ | 2.45 | |
| | | | | |
Class B(a) | | Actual | | | 0.73 | % | | $ | 1,000.00 | | | $ | 1,240.90 | | | $ | 4.12 | |
| | Hypothetical* | | | 0.73 | % | | $ | 1,000.00 | | | $ | 1,021.53 | | | $ | 3.72 | |
| | | | | |
Class E(a) | | Actual | | | 0.63 | % | | $ | 1,000.00 | | | $ | 1,242.10 | | | $ | 3.56 | |
| | Hypothetical* | | | 0.63 | % | | $ | 1,000.00 | | | $ | 1,022.03 | | | $ | 3.21 | |
* Hypothetical assumes a rate of return of 5% per year before expenses.
** Expenses paid are equal to the Portfolio’s annualized expense ratio for the most recent six month period, as shown above, multiplied by the average account value over the period, multiplied by the number of days (184 days) in the most recent fiscal half-year, divided by 365 (to reflect the one-half year period).
(a) The annualized expense ratio shown reflects the impact of the management fee waiver as described in Note 6 of the Notes to Financial Statements.
MSF-3
Metropolitan Series Fund
T. Rowe Price Small Cap Growth Portfolio
Schedule of Investments as of December 31, 2013
Common Stocks—99.5% of Net Assets
| | | | | | | | |
| Security Description | | Shares | | | Value | |
|
Aerospace & Defense—2.6% | |
Esterline Technologies Corp. (a) | | | 38,200 | | | $ | 3,894,872 | |
GenCorp, Inc. (a) (b) | | | 115,200 | | | | 2,075,904 | |
HEICO Corp. - Class A | | | 112,481 | | | | 4,737,700 | |
Hexcel Corp. (a) | | | 100,700 | | | | 4,500,283 | |
Teledyne Technologies, Inc. (a) | | | 59,300 | | | | 5,447,298 | |
TransDigm Group, Inc. | | | 28,600 | | | | 4,605,172 | |
Triumph Group, Inc. | | | 49,500 | | | | 3,765,465 | |
| | | | | | | | |
| | | | | | | 29,026,694 | |
| | | | | | | | |
|
Air Freight & Logistics—0.1% | |
HUB Group, Inc. - Class A (a) | | | 35,400 | | | | 1,411,752 | |
| | | | | | | | |
|
Airlines—0.5% | |
Allegiant Travel Co. | | | 19,400 | | | | 2,045,536 | |
Spirit Airlines, Inc. (a) | | | 64,300 | | | | 2,919,863 | |
| | | | | | | | |
| | | | | | | 4,965,399 | |
| | | | | | | | |
|
Auto Components—0.5% | |
Dana Holding Corp. | | | 91,400 | | | | 1,793,268 | |
Tenneco, Inc. (a) | | | 73,100 | | | | 4,135,267 | |
| | | | | | | | |
| | | | | | | 5,928,535 | |
| | | | | | | | |
|
Beverages—0.8% | |
Boston Beer Co., Inc. (The) - Class A (a) (b) | | | 36,587 | | | | 8,846,371 | |
| | | | | | | | |
| | |
Biotechnology—7.0% | | | | | | | | |
ACADIA Pharmaceuticals, Inc. (a) (b) | | | 70,800 | | | | 1,769,292 | |
Acorda Therapeutics, Inc. (a) | | | 38,300 | | | | 1,118,360 | |
Aegerion Pharmaceuticals, Inc. (a) (b) | | | 35,400 | | | | 2,511,984 | |
Alkermes plc (a) | | | 144,900 | | | | 5,891,634 | |
Alnylam Pharmaceuticals, Inc. (a) | | | 57,800 | | | | 3,718,274 | |
AMAG Pharmaceuticals, Inc. (a) | | | 35,100 | | | | 851,877 | |
BioMarin Pharmaceutical, Inc. (a) | | | 77,000 | | | | 5,410,790 | |
Cepheid, Inc. (a) (b) | | | 79,300 | | | | 3,704,896 | |
Cubist Pharmaceuticals, Inc. (a) (b) | | | 91,400 | | | | 6,294,718 | |
Exelixis, Inc. (a) (b) | | | 215,100 | | | | 1,318,563 | |
Idenix Pharmaceuticals, Inc. (a) (b) | | | 120,300 | | | | 719,394 | |
Incyte Corp., Ltd. (a) (b) | | | 192,100 | | | | 9,726,023 | |
InterMune, Inc. (a) (b) | | | 72,400 | | | | 1,066,452 | |
Isis Pharmaceuticals, Inc. (a) (b) | | | 43,900 | | | | 1,748,976 | |
Lexicon Pharmaceuticals, Inc. (a) (b) | | | 113,100 | | | | 203,580 | |
Ligand Pharmaceuticals, Inc. - Class B (a) (b) | | | 25,200 | | | | 1,325,520 | |
Medivation, Inc. (a) | | | 28,600 | | | | 1,825,252 | |
Neurocrine Biosciences, Inc. (a) (b) | | | 106,400 | | | | 993,776 | |
NPS Pharmaceuticals, Inc. (a) | | | 114,400 | | | | 3,473,184 | |
Opko Health, Inc. (a) (b) | | | 105,500 | | | | 890,420 | |
Pharmacyclics, Inc. (a) | | | 55,600 | | | | 5,881,368 | |
Prothena Corp. plc (a) (b) | | | 19,200 | | | | 509,184 | |
Puma Biotechnology, Inc. (a) (b) | | | 38,000 | | | | 3,934,140 | |
Seattle Genetics, Inc. (a) (b) | | | 95,600 | | | | 3,813,484 | |
Sunesis Pharmaceuticals, Inc. (a) (b) | | | 71,700 | | | | 339,858 | |
Theravance, Inc. (a) (b) | | | 69,100 | | | | 2,463,415 | |
United Therapeutics Corp. (a) (b) | | | 56,500 | | | | 6,389,020 | |
| | | | | | | | |
| | | | | | | 77,893,434 | |
| | | | | | | | |
| | | | | | | | |
| Security Description | | Shares | | | Value | |
|
Capital Markets—1.8% | |
Affiliated Managers Group, Inc. (a) | | | 25,549 | | | $ | 5,541,067 | |
E*Trade Financial Corp. (a) | | | 196,160 | | | | 3,852,582 | |
Virtus Investment Partners, Inc. (a) | | | 19,300 | | | | 3,860,965 | |
Waddell & Reed Financial, Inc. - Class A | | | 107,900 | | | | 7,026,448 | |
| | | | | | | | |
| | | | | | | 20,281,062 | |
| | | | | | | | |
|
Chemicals—2.3% | |
Koppers Holdings, Inc. | | | 22,100 | | | | 1,011,075 | |
NewMarket Corp. (b) | | | 20,300 | | | | 6,783,245 | |
Rockwood Holdings, Inc. | | | 80,200 | | | | 5,767,984 | |
Stepan Co. | | | 65,900 | | | | 4,325,017 | |
WR Grace & Co. (a) | | | 71,100 | | | | 7,029,657 | |
| | | | | | | | |
| | | | | | | 24,916,978 | |
| | | | | | | | |
|
Commercial Banks—1.3% | |
Signature Bank (a) | | | 52,200 | | | | 5,607,324 | |
SVB Financial Group (a) | | | 39,100 | | | | 4,100,026 | |
Texas Capital Bancshares, Inc. (a) | | | 75,300 | | | | 4,683,660 | |
| | | | | | | | |
| | | | | | | 14,391,010 | |
| | | | | | | | |
|
Commercial Services & Supplies—1.7% | |
Clean Harbors, Inc. (a) (b) | | | 55,500 | | | | 3,327,780 | |
Healthcare Services Group, Inc. (b) | | | 107,300 | | | | 3,044,101 | |
Rollins, Inc. | | | 107,750 | | | | 3,263,747 | |
Team, Inc. (a) | | | 55,500 | | | | 2,349,870 | |
U.S. Ecology, Inc. | | | 62,800 | | | | 2,335,532 | |
Waste Connections, Inc. (b) | | | 113,900 | | | | 4,969,457 | |
| | | | | | | | |
| | | | | | | 19,290,487 | |
| | | | | | | | |
|
Communications Equipment—1.4% | |
ADTRAN, Inc. (b) | | | 103,900 | | | | 2,806,339 | |
Aruba Networks, Inc. (a) (b) | | | 152,800 | | | | 2,735,120 | |
JDS Uniphase Corp. (a) | | | 192,500 | | | | 2,498,650 | |
Plantronics, Inc. | | | 83,800 | | | | 3,892,510 | |
Polycom, Inc. (a) | | | 103,286 | | | | 1,159,902 | |
Riverbed Technology, Inc. (a) | | | 153,767 | | | | 2,780,107 | |
| | | | | | | | |
| | | | | | | 15,872,628 | |
| | | | | | | | |
|
Computers & Peripherals—1.3% | |
3D Systems Corp. (a) (b) | | | 122,900 | | | | 11,421,097 | |
Stratasys, Ltd. (a) | | | 21,000 | | | | 2,828,700 | |
| | | | | | | | |
| | | | | | | 14,249,797 | |
| | | | | | | | |
|
Consumer Finance—0.8% | |
Portfolio Recovery Associates, Inc. (a) | | | 112,700 | | | | 5,955,068 | |
World Acceptance Corp. (a) (b) | | | 37,200 | | | | 3,256,116 | |
| | | | | | | | |
| | | | | | | 9,211,184 | |
| | | | | | | | |
|
Containers & Packaging—0.4% | |
Graphic Packaging Holding Co. (a) | | | 250,300 | | | | 2,402,880 | |
Rock-Tenn Co. - Class A | | | 21,400 | | | | 2,247,214 | |
| | | | | | | | |
| | | | | | | 4,650,094 | |
| | | | | | | | |
See accompanying notes to financial statements.
MSF-4
Metropolitan Series Fund
T. Rowe Price Small Cap Growth Portfolio
Schedule of Investments as of December 31, 2013
Common Stocks—(Continued)
| | | | | | | | |
| Security Description | | Shares | | | Value | |
|
Distributors—0.8% | |
LKQ Corp. (a) | | | 104,900 | | | $ | 3,451,210 | |
Pool Corp. | | | 89,200 | | | | 5,186,088 | |
| | | | | | | | |
| | | | | | | 8,637,298 | |
| | | | | | | | |
|
Diversified Consumer Services—1.0% | |
American Public Education, Inc. (a) (b) | | | 46,500 | | | | 2,021,355 | |
Ascent Capital Group, Inc. - Class A (a) | | | 43,700 | | | | 3,738,972 | |
Sotheby’s | | | 80,700 | | | | 4,293,240 | |
Steiner Leisure, Ltd. (a) | | | 19,700 | | | | 969,043 | |
| | | | | | | | |
| | | | | | | 11,022,610 | |
| | | | | | | | |
|
Diversified Financial Services—0.9% | |
CBOE Holdings, Inc. | | | 89,900 | | | | 4,671,204 | |
MarketAxess Holdings, Inc. | | | 49,100 | | | | 3,283,317 | |
MSCI, Inc. (a) | | | 15,678 | | | | 685,442 | |
NewStar Financial, Inc. (a) (b) | | | 87,791 | | | | 1,560,046 | |
| | | | | | | | |
| | | | | | | 10,200,009 | |
| | | | | | | | |
|
Diversified Telecommunication Services—0.5% | |
tw telecom, Inc. (a) | | | 187,100 | | | | 5,700,937 | |
| | | | | | | | |
|
Electrical Equipment—1.3% | |
Acuity Brands, Inc. (b) | | | 63,400 | | | | 6,930,888 | |
Generac Holdings, Inc. | | | 102,900 | | | | 5,828,256 | |
II-VI, Inc. (a) | | | 75,600 | | | | 1,330,560 | |
| | | | | | | | |
| | | | | | | 14,089,704 | |
| | | | | | | | |
|
Electronic Equipment, Instruments & Components—1.7% | |
Anixter International, Inc. | | | 68,800 | | | | 6,180,992 | |
Coherent, Inc. (a) | | | 64,200 | | | | 4,775,838 | |
FARO Technologies, Inc. (a) | | | 18,900 | | | | 1,101,870 | |
FEI Co. | | | 73,500 | | | | 6,567,960 | |
Itron, Inc. (a) (b) | | | 12,800 | | | | 530,304 | |
| | | | | | | | |
| | | | | | | 19,156,964 | |
| | | | | | | | |
|
Energy Equipment & Services—2.1% | |
Atwood Oceanics, Inc. (a) | | | 58,400 | | | | 3,117,976 | |
Core Laboratories NV | | | 24,200 | | | | 4,620,990 | |
Dawson Geophysical Co. (a) | | | 7,891 | | | | 266,874 | |
Dril-Quip, Inc. (a) | | | 46,300 | | | | 5,089,759 | |
Oceaneering International, Inc. | | | 49,100 | | | | 3,873,008 | |
Oil States International, Inc. (a) | | | 41,700 | | | | 4,241,724 | |
Superior Energy Services, Inc. (a) | | | 37,519 | | | | 998,380 | |
Tesco Corp. (a) | | | 41,400 | | | | 818,892 | |
Unit Corp. (a) | | | 10,500 | | | | 542,010 | |
| | | | | | | | |
| | | | | | | 23,569,613 | |
| | | | | | | | |
|
Food & Staples Retailing—1.0% | |
Rite Aid Corp. (a) | | | 1,000,900 | | | | 5,064,554 | |
Susser Holdings Corp. (a) (b) | | | 87,800 | | | | 5,750,022 | |
| | | | | | | | |
| | | | | | | 10,814,576 | |
| | | | | | | | |
| | | | | | | | |
| Security Description | | Shares | | | Value | |
|
Food Products—1.3% | |
Dean Foods Co. (a) | | | 91,200 | | | $ | 1,567,728 | |
J&J Snack Foods Corp. | | | 70,900 | | | | 6,281,031 | |
TreeHouse Foods, Inc. (a) | | | 95,400 | | | | 6,574,968 | |
| | | | | | | | |
| | | | | | | 14,423,727 | |
| | | | | | | | |
|
Health Care Equipment & Supplies—3.6% | |
Align Technology, Inc. (a) | | | 99,300 | | | | 5,674,995 | |
ArthroCare Corp. (a) | | | 63,900 | | | | 2,571,336 | |
Cooper Cos., Inc. (The) | | | 37,200 | | | | 4,606,848 | |
DexCom, Inc. (a) | | | 2,400 | | | | 84,984 | |
Edwards Lifesciences Corp. (a) (b) | | | 7,800 | | | | 512,928 | |
HeartWare International, Inc. (a) | | | 14,900 | | | | 1,400,004 | |
ICU Medical, Inc. (a) | | | 28,500 | | | | 1,815,735 | |
IDEXX Laboratories, Inc. (a) (b) | | | 41,800 | | | | 4,446,266 | |
Masimo Corp. (a) (b) | | | 53,700 | | | | 1,569,651 | |
Meridian Bioscience, Inc. (b) | | | 35,600 | | | | 944,468 | |
Orthofix International NV (a) | | | 50,400 | | | | 1,150,128 | |
Sirona Dental Systems, Inc. (a) | | | 86,700 | | | | 6,086,340 | |
Thoratec Corp. (a) | | | 61,700 | | | | 2,258,220 | |
Volcano Corp. (a) (b) | | | 61,800 | | | | 1,350,330 | |
West Pharmaceutical Services, Inc. | | | 100,000 | | | | 4,906,000 | |
| | | | | | | | |
| | | | | | | 39,378,233 | |
| | | | | | | | |
|
Health Care Providers & Services—3.6% | |
Air Methods Corp. (a) (b) | | | 119,000 | | | | 6,941,270 | |
Bio-Reference Labs, Inc. (a) (b) | | | 58,400 | | | | 1,491,536 | |
Centene Corp. (a) | | | 65,900 | | | | 3,884,805 | |
Chemed Corp. (b) | | | 23,100 | | | | 1,769,922 | |
Corvel Corp. (a) | | | 78,800 | | | | 3,679,960 | |
HealthSouth Corp. | | | 106,500 | | | | 3,548,580 | |
MEDNAX, Inc. (a) | | | 85,600 | | | | 4,569,328 | |
MWI Veterinary Supply, Inc. (a) | | | 30,500 | | | | 5,202,995 | |
Team Health Holdings, Inc. (a) | | | 128,000 | | | | 5,830,400 | |
WellCare Health Plans, Inc. (a) | | | 46,500 | | | | 3,274,530 | |
| | | | | | | | |
| | | | | | | 40,193,326 | |
| | | | | | | | |
|
Health Care Technology—0.2% | |
HMS Holdings Corp. (a) | | | 111,300 | | | | 2,529,849 | |
| | | | | | | | |
|
Hotels, Restaurants & Leisure—3.9% | |
Bally Technologies, Inc. (a) (b) | | | 59,300 | | | | 4,652,085 | |
Brinker International, Inc. (b) | | | 95,200 | | | | 4,411,568 | |
Buffalo Wild Wings, Inc. (a) | | | 9,800 | | | | 1,442,560 | |
Cheesecake Factory, Inc. (The) (b) | | | 59,200 | | | | 2,857,584 | |
Choice Hotels International, Inc. (b) | | | 80,800 | | | | 3,968,088 | |
Denny’s Corp. (a) | | | 580,400 | | | | 4,173,076 | |
Domino’s Pizza, Inc. | | | 91,100 | | | | 6,345,115 | |
Red Robin Gourmet Burgers, Inc. (a) | | | 57,300 | | | | 4,213,842 | |
Six Flags Entertainment Corp. (b) | | | 152,100 | | | | 5,600,322 | |
Vail Resorts, Inc. | | | 70,300 | | | | 5,288,669 | |
| | | | | | | | |
| | | | | | | 42,952,909 | |
| | | | | | | | |
|
Household Durables—0.7% | |
Helen of Troy, Ltd. (a) | | | 84,100 | | | | 4,163,791 | |
iRobot Corp. (a) (b) | | | 70,200 | | | | 2,440,854 | |
NACCO Industries, Inc. - Class A | | | 12,697 | | | | 789,626 | |
| | | | | | | | |
| | | | | | | 7,394,271 | |
| | | | | | | | |
See accompanying notes to financial statements.
MSF-5
Metropolitan Series Fund
T. Rowe Price Small Cap Growth Portfolio
Schedule of Investments as of December 31, 2013
Common Stocks—(Continued)
| | | | | | | | |
| Security Description | | Shares | | | Value | |
|
Insurance—0.2% | |
Amtrust Financial Services, Inc. (b) | | | 75,478 | | | $ | 2,467,376 | |
| | | | | | | | |
|
Internet & Catalog Retail—1.6% | |
HSN, Inc. | | | 112,600 | | | | 7,014,980 | |
Liberty Ventures - Series A (a) | | | 50,900 | | | | 6,239,831 | |
Shutterfly, Inc. (a) (b) | | | 87,000 | | | | 4,430,910 | |
| | | | | | | | |
| | | | | | | 17,685,721 | |
| | | | | | | | |
|
Internet Software & Services—2.4% | |
Cornerstone OnDemand, Inc. (a) | | | 92,500 | | | | 4,933,950 | |
CoStar Group, Inc. (a) | | | 29,300 | | | | 5,408,194 | |
j2 Global, Inc. (b) | | | 61,700 | | | | 3,085,617 | |
MercadoLibre, Inc. (b) | | | 41,800 | | | | 4,505,622 | |
Perficient, Inc. (a) | | | 77,300 | | | | 1,810,366 | |
ValueClick, Inc. (a) (b) | | | 108,500 | | | | 2,535,645 | |
WebMD Health Corp. (a) (b) | | | 102,100 | | | | 4,032,950 | |
| | | | | | | | |
| | | | | | | 26,312,344 | |
| | | | | | | | |
|
IT Services—5.5% | |
Cardtronics, Inc. (a) | | | 141,400 | | | | 6,143,830 | |
CoreLogic, Inc. (a) | | | 184,200 | | | | 6,544,626 | |
DST Systems, Inc. | | | 27,300 | | | | 2,477,202 | |
Euronet Worldwide, Inc. (a) (b) | | | 106,300 | | | | 5,086,455 | |
Gartner, Inc. (a) | | | 119,800 | | | | 8,511,790 | |
Heartland Payment Systems, Inc. (b) | | | 132,660 | | | | 6,611,775 | |
Jack Henry & Associates, Inc. | | | 89,400 | | | | 5,293,374 | |
MAXIMUS, Inc. | | | 219,100 | | | | 9,638,209 | |
TeleTech Holdings, Inc. (a) | | | 46,400 | | | | 1,110,816 | |
Unisys Corp. (a) | | | 67,609 | | | | 2,269,634 | |
VeriFone Systems, Inc. (a) | | | 34,100 | | | | 914,562 | |
WEX, Inc. (a) | | | 63,200 | | | | 6,258,696 | |
| | | | | | | | |
| | | | | | | 60,860,969 | |
| | | | | | | | |
|
Leisure Equipment & Products—1.5% | |
Brunswick Corp. | | | 126,200 | | | | 5,812,772 | |
Polaris Industries, Inc. (b) | | | 71,200 | | | | 10,369,568 | |
| | | | | | | | |
| | | | | | | 16,182,340 | |
| | | | | | | | |
|
Life Sciences Tools & Services—1.2% | |
Bio-Rad Laboratories, Inc. - Class A (a) | | | 18,300 | | | | 2,262,063 | |
Bruker Corp. (a) | | | 93,500 | | | | 1,848,495 | |
Illumina, Inc. (a) (b) | | | 23,700 | | | | 2,621,694 | |
Mettler-Toledo International, Inc. (a) | | | 10,000 | | | | 2,425,900 | |
PAREXEL International Corp. (a) | | | 86,300 | | | | 3,899,034 | |
| | | | | | | | |
| | | | | | | 13,057,186 | |
| | | | | | | | |
|
Machinery—7.0% | |
Actuant Corp. - Class A (b) | | | 122,900 | | | | 4,503,056 | |
Chart Industries, Inc. (a) (b) | | | 36,300 | | | | 3,471,732 | |
Graco, Inc. | | | 62,000 | | | | 4,843,440 | |
Hyster-Yale Materials Handling, Inc. | | | 34,894 | | | | 3,250,725 | |
IDEX Corp. | | | 54,100 | | | | 3,995,285 | |
John Bean Technologies Corp. | | | 109,200 | | | | 3,202,836 | |
Lincoln Electric Holdings, Inc. | | | 95,500 | | | | 6,812,970 | |
Middleby Corp. (The) (a) | | | 44,800 | | | | 10,750,656 | |
|
Machinery—(Continued) | |
Nordson Corp. | | | 85,500 | | | $ | 6,352,650 | |
Standex International Corp. | | | 26,600 | | | | 1,672,608 | |
Sun Hydraulics Corp. | | | 51,300 | | | | 2,094,579 | |
Toro Co. (The) | | | 124,700 | | | | 7,930,920 | |
Valmont Industries, Inc. (b) | | | 41,700 | | | | 6,218,304 | |
Wabtec Corp. | | | 126,500 | | | | 9,395,155 | |
Woodward, Inc. | | | 51,900 | | | | 2,367,159 | |
| | | | | | | | |
| | | | | | | 76,862,075 | |
| | | | | | | | |
|
Marine—0.7% | |
Kirby Corp. (a) (b) | | | 75,000 | | | | 7,443,750 | |
| | | | | | | | |
|
Media—1.4% | |
Digital Generation, Inc. (a) (b) | | | 70,300 | | | | 896,325 | |
John Wiley & Sons, Inc. - Class A (b) | | | 22,800 | | | | 1,258,560 | |
Live Nation Entertainment, Inc. (a) | | | 242,400 | | | | 4,789,824 | |
Madison Square Garden Co. (The) - Class A (a) | | | 109,000 | | | | 6,276,220 | |
Starz - Class A (a) | | | 92,100 | | | | 2,693,004 | |
| | | | | | | | |
| | | | | | | 15,913,933 | |
| | | | | | | | |
|
Metals & Mining—0.3% | |
Compass Minerals International, Inc. | | | 25,200 | | | | 2,017,260 | |
Stillwater Mining Co. (a) | | | 63,300 | | | | 781,122 | |
| | | | | | | | |
| | | | | | | 2,798,382 | |
| | | | | | | | |
|
Multiline Retail—0.2% | |
Big Lots, Inc. (a) | | | 58,900 | | | | 1,901,881 | |
| | | | | | | | |
|
Oil, Gas & Consumable Fuels—2.9% | |
Bill Barrett Corp. (a) (b) | | | 45,400 | | | | 1,215,812 | |
Clayton Williams Energy, Inc. (a) | | | 39,800 | | | | 3,261,610 | |
Contango Oil & Gas Co. (a) | | | 70,800 | | | | 3,346,008 | |
Delek U.S. Holdings, Inc. | | | 50,000 | | | | 1,720,500 | |
Energy XXI Bermuda, Ltd. (b) | | | 78,100 | | | | 2,113,386 | |
Gran Tierra Energy, Inc. (a) | | | 297,700 | | | | 2,176,187 | |
Halcon Resources Corp. (a) (b) | | | 179,700 | | | | 693,642 | |
Oasis Petroleum, Inc. (a) | | | 107,500 | | | | 5,049,275 | |
Rosetta Resources, Inc. (a) | | | 72,900 | | | | 3,502,116 | |
SemGroup Corp. - Class A | | | 71,500 | | | | 4,663,945 | |
SM Energy Co. | | | 57,600 | | | | 4,787,136 | |
| | | | | | | | |
| | | | | | | 32,529,617 | |
| | | | | | | | |
|
Paper & Forest Products—0.6% | |
Clearwater Paper Corp. (a) | | | 27,500 | | | | 1,443,750 | |
KapStone Paper and Packaging Corp. (a) | | | 98,400 | | | | 5,496,624 | |
| | | | | | | | |
| | | | | | | 6,940,374 | |
| | | | | | | | |
|
Personal Products—1.2% | |
Herbalife, Ltd. (b) | | | 47,700 | | | | 3,753,990 | |
Nu Skin Enterprises, Inc. - Class A | | | 72,200 | | | | 9,979,484 | |
| | | | | | | | |
| | | | | | | 13,733,474 | |
| | | | | | | | |
|
Pharmaceuticals—3.6% | |
Akorn, Inc. (a) (b) | | | 118,500 | | | | 2,918,655 | |
Auxilium Pharmaceuticals, Inc. (a) (b) | | | 40,100 | | | | 831,674 | |
See accompanying notes to financial statements.
MSF-6
Metropolitan Series Fund
T. Rowe Price Small Cap Growth Portfolio
Schedule of Investments as of December 31, 2013
Common Stocks—(Continued)
| | | | | | | | |
| Security Description | | Shares | | | Value | |
|
Pharmaceuticals—(Continued) | |
AVANIR Pharmaceuticals, Inc. - Class A (a) (b) | | | 267,700 | | | $ | 899,472 | |
Cadence Pharmaceuticals, Inc. (a) (b) | | | 57,600 | | | | 521,280 | |
Jazz Pharmaceuticals plc (a) | | | 64,200 | | | | 8,125,152 | |
Medicines Co. (The) (a) | | | 108,600 | | | | 4,194,132 | |
Nektar Therapeutics (a) (b) | | | 75,500 | | | | 856,925 | |
Pacira Pharmaceuticals, Inc. (a) | | | 29,800 | | | | 1,713,202 | |
Prestige Brands Holdings, Inc. (a) | | | 154,400 | | | | 5,527,520 | |
Questcor Pharmaceuticals, Inc. (b) | | | 76,800 | | | | 4,181,760 | |
Salix Pharmaceuticals, Ltd. (a) | | | 65,300 | | | | 5,873,082 | |
ViroPharma, Inc. (a) (b) | | | 85,300 | | | | 4,252,205 | |
| | | | | | | | |
| | | | | | | 39,895,059 | |
| | | | | | | | |
|
Professional Services—1.1% | |
Advisory Board Co. (The) (a) | | | 78,300 | | | | 4,985,361 | |
Exponent, Inc. | | | 33,600 | | | | 2,601,984 | |
Huron Consulting Group, Inc. (a) | | | 64,900 | | | | 4,070,528 | |
RPX Corp. (a) | | | 58,200 | | | | 983,580 | |
| | | | | | | | |
| | | | | | | 12,641,453 | |
| | | | | | | | |
|
Real Estate Investment Trusts—0.6% | |
DuPont Fabros Technology, Inc. (b) | | | 42,200 | | | | 1,042,762 | |
Sabra Health Care REIT, Inc. | | | 59,433 | | | | 1,553,579 | |
Strategic Hotels & Resorts, Inc. (a) | | | 164,000 | | | | 1,549,800 | |
Taubman Centers, Inc. | | | 33,300 | | | | 2,128,536 | |
| | | | | | | | |
| | | | | | | 6,274,677 | |
| | | | | | | | |
|
Real Estate Management & Development—1.8% | |
Altisource Asset Management Corp. (a) | | | 4,220 | | | | 3,924,600 | |
Altisource Portfolio Solutions S.A. (a) | | | 47,600 | | | | 7,550,788 | |
Altisource Residential Corp. (b) | | | 39,300 | | | | 1,183,323 | |
Forest City Enterprises, Inc. - Class A (a) | | | 154,200 | | | | 2,945,220 | |
Jones Lang LaSalle, Inc. | | | 19,400 | | | | 1,986,366 | |
Kennedy-Wilson Holdings, Inc. | | | 87,943 | | | | 1,956,732 | |
| | | | | | | | |
| | | | | | | 19,547,029 | |
| | | | | | | | |
|
Road & Rail—1.9% | |
AMERCO (a) | | | 19,900 | | | | 4,733,016 | |
Avis Budget Group, Inc. (a) | | | 113,600 | | | | 4,591,712 | |
Landstar System, Inc. | | | 55,100 | | | | 3,165,495 | |
Old Dominion Freight Line, Inc. (a) | | | 152,650 | | | | 8,093,503 | |
| | | | | | | | |
| | | | | | | 20,583,726 | |
| | | | | | | | |
|
Semiconductors & Semiconductor Equipment—2.8% | |
Amkor Technology, Inc. (a) (b) | | | 94,900 | | | | 581,737 | |
Atmel Corp. (a) | | | 278,700 | | | | 2,182,221 | |
Cabot Microelectronics Corp. (a) | | | 30,400 | | | | 1,389,280 | |
Cavium, Inc. (a) (b) | | | 99,100 | | | | 3,419,941 | |
Diodes, Inc. (a) | | | 90,600 | | | | 2,134,536 | |
Hittite Microwave Corp. (a) | | | 60,800 | | | | 3,753,184 | |
Magnachip Semiconductor Corp. (a) | | | 105,300 | | | | 2,053,350 | |
Microsemi Corp. (a) | | | 112,700 | | | | 2,811,865 | |
Semtech Corp. (a) | | | 88,400 | | | | 2,234,752 | |
Silicon Laboratories, Inc. (a) | | | 30,300 | | | | 1,312,293 | |
Synaptics, Inc. (a) (b) | | | 89,400 | | | | 4,631,814 | |
Teradyne, Inc. (a) (b) | | | 140,100 | | | | 2,468,562 | |
| | | | | | | | |
| Security Description | | Shares | | | Value | |
|
Semiconductors & Semiconductor Equipment—(Continued) | |
Ultratech, Inc. (a) (b) | | | 40,300 | | | $ | 1,168,700 | |
Veeco Instruments, Inc. (a) (b) | | | 34,300 | | | | 1,128,813 | |
| | | | | | | | |
| | | | | | | 31,271,048 | |
| | | | | | | | |
|
Software—7.9% | |
Actuate Corp. (a) | | | 83,119 | | | | 640,848 | |
Advent Software, Inc. (b) | | | 66,300 | | | | 2,319,837 | |
Aspen Technology, Inc. (a) | | | 183,800 | | | | 7,682,840 | |
CommVault Systems, Inc. (a) | | | 98,100 | | | | 7,345,728 | |
Computer Modelling Group, Ltd. (b) | | | 107,900 | | | | 2,702,960 | |
Concur Technologies, Inc. (a) (b) | | | 55,100 | | | | 5,685,218 | |
FactSet Research Systems, Inc. (b) | | | 43,700 | | | | 4,744,946 | |
Fortinet, Inc. (a) | | | 130,700 | | | | 2,500,291 | |
Informatica Corp. (a) | | | 95,400 | | | | 3,959,100 | |
Manhattan Associates, Inc. (a) | | | 26,400 | | | | 3,101,472 | |
MICROS Systems, Inc. (a) (b) | | | 77,900 | | | | 4,469,123 | |
Monotype Imaging Holdings, Inc. | | | 105,605 | | | | 3,364,575 | |
Netscout Systems, Inc. (a) | | | 118,900 | | | | 3,518,251 | |
PTC, Inc. (a) | | | 132,100 | | | | 4,675,019 | |
Rovi Corp. (a) | | | 41,800 | | | | 823,042 | |
SolarWinds, Inc. (a) | | | 60,700 | | | | 2,296,281 | |
Solera Holdings, Inc. | | | 24,600 | | | | 1,740,696 | |
SS&C Technologies Holdings, Inc. (a) | | | 39,400 | | | | 1,743,844 | |
TIBCO Software, Inc. (a) | | | 169,900 | | | | 3,819,352 | |
Tyler Technologies, Inc. (a) | | | 104,100 | | | | 10,631,733 | |
Ultimate Software Group, Inc. (a) | | | 60,400 | | | | 9,254,488 | |
| | | | | | | | |
| | | | | | | 87,019,644 | |
| | | | | | | | |
|
Specialty Retail—4.2% | |
Aaron’s, Inc. | | | 82,500 | | | | 2,425,500 | |
Ascena Retail Group, Inc. (a) | | | 213,100 | | | | 4,509,196 | |
Buckle, Inc. (The) (b) | | | 53,500 | | | | 2,811,960 | |
Chico’s FAS, Inc. | | | 186,200 | | | | 3,508,008 | |
Children’s Place Retail Stores, Inc. (The) (a) | | | 34,100 | | | | 1,942,677 | |
DSW, Inc. - Class A (b) | | | 191,600 | | | | 8,187,068 | |
Guess?, Inc. | | | 31,300 | | | | 972,491 | |
Hibbett Sports, Inc. (a) (b) | | | 46,550 | | | | 3,128,625 | |
Monro Muffler Brake, Inc. (b) | | | 130,200 | | | | 7,338,072 | |
Sally Beauty Holdings, Inc. (a) | | | 211,100 | | | | 6,381,553 | |
Tractor Supply Co. | | | 73,600 | | | | 5,709,888 | |
| | | | | | | | |
| | | | | | | 46,915,038 | |
| | | | | | | | |
|
Textiles, Apparel & Luxury Goods—2.3% | |
Deckers Outdoor Corp. (a) (b) | | | 42,000 | | | | 3,547,320 | |
Fossil Group, Inc. (a) | | | 22,949 | | | | 2,752,503 | |
Hanesbrands, Inc. | | | 121,300 | | | | 8,523,751 | |
Iconix Brand Group, Inc. (a) | | | 86,900 | | | | 3,449,930 | |
PVH Corp. | | | 21,885 | | | | 2,976,798 | |
Steven Madden, Ltd. (a) | | | 107,500 | | | | 3,933,425 | |
| | | | | | | | |
| | | | | | | 25,183,727 | |
| | | | | | | | |
|
Thrifts & Mortgage Finance—0.7% | |
MGIC Investment Corp. (a) | | | 338,500 | | | | 2,856,940 | |
Ocwen Financial Corp. (a) | | | 50,100 | | | | 2,778,045 | |
Radian Group, Inc. (b) | | | 148,000 | | | | 2,089,760 | |
| | | | | | | | |
| | | | | | | 7,724,745 | |
| | | | | | | | |
See accompanying notes to financial statements.
MSF-7
Metropolitan Series Fund
T. Rowe Price Small Cap Growth Portfolio
Schedule of Investments as of December 31, 2013
Common Stocks—(Continued)
| | | | | | | | |
| Security Description | | Shares/
Principal
Amount* | | | Value | |
|
Trading Companies & Distributors—0.8% | |
Beacon Roofing Supply, Inc. (a) (b) | | | 91,800 | | | $ | 3,697,704 | |
United Rentals, Inc. (a) (b) | | | 58,432 | | | | 4,554,774 | |
| | | | | | | | |
| | | | | | | 8,252,478 | |
| | | | | | | | |
Total Common Stocks
(Cost $727,488,412) | | | | | | | 1,100,997,497 | |
| | | | | | | | |
|
| Short-Term Investments—20.6% | |
| |
Mutual Funds—20.5% | | | | | |
State Street Navigator Securities Lending MET Portfolio (c) | | | 223,936,477 | | | | 223,936,477 | |
T. Rowe Price Government Reserve Investment Fund (d) | | | 3,163,723 | | | | 3,163,723 | |
| | | | | | | | |
| | | | | | | 227,100,200 | |
| | | | | | | | |
|
Repurchase Agreement—0.1% | |
Fixed Income Clearing Corp.
Repurchase Agreement dated 12/31/13 at 0.000% to be repurchased at $1,249,000 on 01/02/14, collateralized by $1,425,000 Federal Home Loan Mortgage Corp. at 2.000% due 01/30/23 with a value of $1,276,291. | | | 1,249,000 | | | | 1,249,000 | |
| | | | | | | | |
Total Short-Term Investments
(Cost $228,349,200) | | | | | | | 228,349,200 | |
| | | | | | | | |
Total Investments—120.1%
(Cost $955,837,612) (e) | | | | | | | 1,329,346,697 | |
Other assets and liabilities (net)—(20.1)% | | | | | | | (222,785,191 | ) |
| | | | | | | | |
| Net Assets—100.0% | | | | | | $ | 1,106,561,506 | |
| | | | | | | | |
| * | Principal amount stated in U.S. dollars unless otherwise noted. |
| (a) | Non-income producing security. |
| (b) | All or a portion of the security was held on loan. As of December 31, 2013, the market value of securities loaned was $220,000,723 and the collateral received consisted of cash in the amount of $223,936,477 and non-cash collateral with a value of $544,248. The cash collateral is invested in a money market fund managed by an affiliate of the custodian. The non-cash collateral received consists primarily of government securities and bank letters of credit, and is held for the benefit of the Portfolio at the Portfolio’s custodian. The Portfolio cannot repledge or resell this collateral. As such, this collateral is excluded from the Statement of Assets and Liabilities. |
| (c) | Represents investment of cash collateral received from securities lending transactions. |
| (d) | Affiliated Issuer. (See Note 7 of the Notes to Financial Statements for a summary of transactions in securities of affiliated issuers.) |
| (e) | As of December 31, 2013, the aggregate cost of investments for federal income tax purposes was $958,105,067. The aggregate unrealized appreciation and depreciation of investments were $381,413,571 and $(10,171,941), respectively, resulting in net unrealized appreciation of $371,241,630 for federal income tax purposes. |
See accompanying notes to financial statements.
MSF-8
Metropolitan Series Fund
T. Rowe Price Small Cap Growth Portfolio
Schedule of Investments as of December 31, 2013
Fair Value Hierarchy
Accounting principles generally accepted in the United States of America (“GAAP”) define fair market value as the price that the Portfolio would receive to sell an asset or pay to transfer a liability in an orderly transaction between market participants at the measurement date. It establishes a fair value hierarchy that prioritizes inputs to valuation methods and requires disclosure of the fair value hierarchy that segregates fair value measurements into three levels. Levels 1, 2 and 3 of the fair value hierarchy are defined as follows:
Level 1 - unadjusted quoted prices in active markets for identical investments
Level 2 - other significant observable inputs (including, but not limited to, unadjusted quoted prices for similar investments in markets that are either active or inactive; inputs other than quoted prices that are observable such as interest rates, yield curves, volatilities, prepayment speeds, loss severities, credit risks, default rates, etc.)
Level 3 - significant unobservable inputs based on the best information available in the circumstances, to the extent observable inputs are unavailable (including the Portfolio’s own assumptions in determining the fair value of investments)
The inputs or methodologies used for valuing investments are not necessarily an indication of the risk associated with investing in them. Changes to the inputs or methodologies used may result in transfers between levels, which will be recognized as of the beginning of the reporting period. Information on transfers between Level 1 and Level 2, if any, will be disclosed following the fair value hierarchy table below. A reconciliation of Level 3 securities, if any, will also be disclosed following the fair value hierarchy table. For more information about the Portfolio’s policy regarding the valuation of investments, please refer to the Notes to Financial Statements.
The following table summarizes the fair value hierarchy of the Portfolio’s investments as of December 31, 2013:
| | | | | | | | | | | | | | | | |
| Description | | Level 1 | | | Level 2 | | | Level 3 | | | Total | |
Total Common Stocks* | | $ | 1,100,997,497 | | | $ | — | | | $ | — | | | $ | 1,100,997,497 | |
| Short-Term Investments | | | | | | | | | | | | | | | | |
Mutual Funds | | | 227,100,200 | | | | — | | | | — | | | | 227,100,200 | |
Repurchase Agreement | | | — | | | | 1,249,000 | | | | — | | | | 1,249,000 | |
Total Short-Term Investments | | | 227,100,200 | | | | 1,249,000 | | | | — | | | | 228,349,200 | |
Total Investments | | $ | 1,328,097,697 | | | $ | 1,249,000 | | | $ | — | | | $ | 1,329,346,697 | |
| | | | | | | | | | | | | | | | | |
Collateral for securities loaned (Liability) | | $ | — | | | $ | (223,936,477 | ) | | $ | — | | | $ | (223,936,477 | ) |
| * | See Schedule of Investments for additional detailed categorizations. |
See accompanying notes to financial statements.
MSF-9
Metropolitan Series Fund
T. Rowe Price Small Cap Growth Portfolio
Statement of Assets and Liabilities
December 31, 2013
| | | | |
Assets | | | | |
Investments at value (a) (b) | | $ | 1,326,182,974 | |
Affiliated investments at value (c) | | | 3,163,723 | |
Cash | | | 863 | |
Cash denominated in foreign currencies (d) | | | 45,184 | |
Receivable for: | | | | |
Investments sold | | | 7,062,073 | |
Fund shares sold | | | 647,371 | |
Dividends | | | 736,409 | |
Dividends on affiliated investments | | | 102 | |
Prepaid expenses | | | 2,442 | |
| | | | |
Total Assets | | | 1,337,841,141 | |
Liabilities | | | | |
Collateral for securities loaned | | | 223,936,477 | |
Payables for: | | | | |
Investments purchased | | | 6,075,630 | |
Fund shares redeemed | | | 643,856 | |
Accrued expenses: | | | | |
Management fees | | | 408,680 | |
Distribution and service fees | | | 79,947 | |
Deferred trustees’ fees | | | 48,554 | |
Other expenses | | | 86,491 | |
| | | | |
Total Liabilities | | | 231,279,635 | |
| | | | |
Net Assets | | $ | 1,106,561,506 | |
| | | | |
Net assets consist of: | | | | |
Paid in surplus | | $ | 652,389,656 | |
Undistributed net investment income | | | 917,166 | |
Accumulated net realized gain | | | 79,746,071 | |
Unrealized appreciation on investments and foreign currency transactions | | | 373,508,613 | |
| | | | |
Net Assets | | $ | 1,106,561,506 | |
| | | | |
Net Assets | | | | |
Class A | | $ | 714,179,593 | |
Class B | | | 373,603,333 | |
Class E | | | 18,778,580 | |
Capital Shares Outstanding* | | | | |
Class A | | | 30,044,947 | |
Class B | | | 16,405,148 | |
Class E | | | 813,418 | |
Net Asset Value, Offering Price and Redemption Price Per Share | | | | |
Class A | | $ | 23.77 | |
Class B | | | 22.77 | |
Class E | | | 23.09 | |
| * | The Portfolio is authorized to issue an unlimited number of shares. |
| (a) | Identified cost of investments, excluding affiliated investments, was $952,673,889. |
| (b) | Includes securities loaned at value of $220,000,723. |
| (c) | Identified cost of affiliated investments was $3,163,723. |
| (d) | Identified cost of cash denominated in foreign currencies was $45,656. |
Statement of Operations
Year Ended December 31, 2013
| | | | |
Investment Income | | | | |
Dividends (a) | | $ | 5,068,673 | |
Dividends from affiliated investments | | | 2,086 | |
Interest | | | 132 | |
Securities lending income | | | 1,312,710 | |
| | | | |
Total investment income | | | 6,383,601 | |
Expenses | | | | |
Management fees | | | 4,390,500 | |
Administration fees | | | 19,634 | |
Custodian and accounting fees | | | 122,862 | |
Distribution and service fees—Class B | | | 812,068 | |
Distribution and service fees—Class E | | | 24,629 | |
Audit and tax services | | | 37,723 | |
Legal | | | 27,754 | |
Trustees’ fees and expenses | | | 35,359 | |
Shareholder reporting | | | 93,468 | |
Insurance | | | 4,960 | |
Miscellaneous | | | 9,357 | |
| | | | |
Total expenses | | | 5,578,314 | |
Less management fee waiver | | | (262,479 | ) |
Less broker commission recapture | | | (5,861 | ) |
| | | | |
Net expenses | | | 5,309,974 | |
| | | | |
Net Investment Income | | | 1,073,627 | |
| | | | |
Net Realized and Unrealized Gain | | | | |
| Net realized gain (loss) on: | | | | |
Investments | | | 82,831,924 | |
Futures contracts | | | (1,560,081 | ) |
Foreign currency transactions | | | (166 | ) |
| | | | |
Net realized gain | | | 81,271,677 | |
| | | | |
| Net change in unrealized appreciation (depreciation) on: | | | | |
Investments | | | 255,807,624 | |
Foreign currency transactions | | | (417 | ) |
| | | | |
Net change in unrealized appreciation | | | 255,807,207 | |
| | | | |
Net realized and unrealized gain | | | 337,078,884 | |
| | | | |
Net Increase in Net Assets From Operations | | $ | 338,152,511 | |
| | | | |
| (a) | Net of foreign withholding taxes of $14,766. |
See accompanying notes to financial statements.
MSF-10
Metropolitan Series Fund
T. Rowe Price Small Cap Growth Portfolio
Statements of Changes in Net Assets
| | | | | | | | |
| | | Year Ended
December 31,
2013 | | | Year Ended
December 31,
2012 | |
Increase (Decrease) in Net Assets: | | | | | | | | |
From Operations | | | | | | | | |
Net investment income | | $ | 1,073,627 | | | $ | 2,640,862 | |
Net realized gain | | | 81,271,677 | | | | 50,548,731 | |
Net change in unrealized appreciation | | | 255,807,207 | | | | 35,928,165 | |
| | | | | | | | |
Increase in net assets from operations | | | 338,152,511 | | | | 89,117,758 | |
| | | | | | | | |
From Distributions to Shareholders | | | | | | | | |
Net investment income | | | | | | | | |
Class A | | | (2,084,759 | ) | | | 0 | |
Class B | | | (435,146 | ) | | | 0 | |
Class E | | | (34,617 | ) | | | 0 | |
Net realized capital gains | | | | | | | | |
Class A | | | (32,210,993 | ) | | | (27,467,785 | ) |
Class B | | | (17,679,828 | ) | | | (28,726,678 | ) |
Class E | | | (883,139 | ) | | | (1,518,493 | ) |
| | | | | | | | |
Total distributions | | | (53,328,482 | ) | | | (57,712,956 | ) |
| | | | | | | | |
Increase in net assets from capital share transactions | | | 144,101,028 | | | | 99,799,343 | |
| | | | | | | | |
Total increase in net assets | | | 428,925,057 | | | | 131,204,145 | |
| | |
Net Assets | | | | | | | | |
Beginning of period | | | 677,636,449 | | | | 546,432,304 | |
| | | | | | | | |
End of period | | $ | 1,106,561,506 | | | $ | 677,636,449 | |
| | | | | | | | |
| | |
Undistributed net investment income | | | | | | | | |
End of period | | $ | 917,166 | | | $ | 2,584,196 | |
| | | | | | | | |
Other Information:
Capital Shares
Transactions in capital shares were as follows:
| | | | | | | | | | | | | | | | |
| | | Year Ended
December 31, 2013 | | | Year Ended
December 31, 2012 | |
| | | Shares | | | Value | | | Shares | | | Value | |
Class A | | | | | | | | | | | | | | | | |
Sales | | | 10,721,735 | | | $ | 208,173,361 | | | | 7,162,096 | | | $ | 121,338,969 | |
Reinvestments | | | 1,939,805 | | | | 34,295,752 | | | | 1,635,961 | | | | 27,467,785 | |
Redemptions | | | (4,687,332 | ) | | | (94,950,297 | ) | | | (2,546,185 | ) | | | (43,800,643 | ) |
| | | | | | | | | | | | | | | | |
Net increase | | | 7,974,208 | | | $ | 147,518,816 | | | | 6,251,872 | | | $ | 105,006,111 | |
| | | | | | | | | | | | | | | | |
Class B | | | | | | | | | | | | | | | | |
Sales | | | 1,937,054 | | | $ | 37,911,446 | | | | 1,693,551 | | | $ | 28,380,354 | |
Reinvestments | | | 1,067,471 | | | | 18,114,974 | | | | 1,777,641 | | | | 28,726,678 | |
Redemptions | | | (3,017,882 | ) | | | (58,976,676 | ) | | | (3,699,866 | ) | | | (61,593,421 | ) |
| | | | | | | | | | | | | | | | |
Net decrease | | | (13,357 | ) | | $ | (2,950,256 | ) | | | (228,674 | ) | | $ | (4,486,389 | ) |
| | | | | | | | | | | | | | | | |
Class E | | | | | | | | | | | | | | | | |
Sales | | | 119,207 | | | $ | 2,364,626 | | | | 97,688 | | | $ | 1,666,818 | |
Reinvestments | | | 53,389 | | | | 917,756 | | | | 92,874 | | | | 1,518,493 | |
Redemptions | | | (189,722 | ) | | | (3,749,914 | ) | | | (233,792 | ) | | | (3,905,690 | ) |
| | | | | | | | | | | | | | | | |
Net decrease | | | (17,126 | ) | | $ | (467,532 | ) | | | (43,230 | ) | | $ | (720,379 | ) |
| | | | | | | | | | | | | | | | |
Increase derived from capital shares transactions | | | | | | $ | 144,101,028 | | | | | | | $ | 99,799,343 | |
| | | | | | | | | | | | | | | | |
See accompanying notes to financial statements.
MSF-11
Metropolitan Series Fund
T. Rowe Price Small Cap Growth Portfolio
Financial Highlights
| | | | | | | | | | | | | | | | | | | | |
| Selected per share data | | | |
| | | Class A | |
| | | Year Ended December 31, | |
| | | 2013 | | | 2012 | | | 2011 | | | 2010 | | | 2009 | |
Net Asset Value, Beginning of Period | | $ | 17.53 | | | $ | 16.68 | | | $ | 16.39 | | | $ | 12.15 | | | $ | 9.05 | |
| | | | | | | | | | | | | | | | | | | | |
Income (Loss) from Investment Operations | | | | | | | | | | | | | | | | | | | | |
Net investment income (loss) (a) | | | 0.04 | | | | 0.10 | | | | (0.02 | ) | | | 0.00 | (b) | | | 0.01 | |
Net realized and unrealized gain on investments | | | 7.37 | | | | 2.52 | | | | 0.31 | | | | 4.24 | | | | 3.41 | |
| | | | | | | | | | | | | | | | | | | | |
Total from investment operations | | | 7.41 | | | | 2.62 | | | | 0.29 | | | | 4.24 | | | | 3.42 | |
| | | | | | | | | | | | | | | | | | | | |
Less Distributions | | | | | | | | | | | | | | | | | | | | |
Distributions from net investment income | | | (0.07 | ) | | | 0.00 | | | | 0.00 | | | | 0.00 | | | | (0.04 | ) |
Distributions from net realized capital gains | | | (1.10 | ) | | | (1.77 | ) | | | 0.00 | | | | 0.00 | | | | (0.28 | ) |
| | | | | | | | | | | | | | | | | | | | |
Total distributions | | | (1.17 | ) | | | (1.77 | ) | | | 0.00 | | | | 0.00 | | | | (0.32 | ) |
| | | | | | | | | | | | | | | | | | | | |
Net Asset Value, End of Period | | $ | 23.77 | | | $ | 17.53 | | | $ | 16.68 | | | $ | 16.39 | | | $ | 12.15 | |
| | | | | | | | | | | | | | | | | | | | |
Total Return (%) (c) | | | 44.55 | | | | 16.18 | | | | 1.77 | | | | 34.90 | | | | 38.97 | |
| | | | | |
Ratios/Supplemental Data | | | | | | | | | | | | | | | | | | | | |
Gross ratio of expenses to average net assets (%) | | | 0.52 | | | | 0.55 | | | | 0.55 | | | | 0.57 | | | | 0.62 | |
Net ratio of expenses to average net assets (%) (d) | | | 0.49 | | | | 0.52 | | | | 0.53 | | | | 0.55 | | | | 0.60 | |
Ratio of net investment income (loss) to average net assets (%) | | | 0.21 | | | | 0.56 | | | | (0.09 | ) | | | 0.02 | | | | 0.14 | |
Portfolio turnover rate (%) | | | 29 | | | | 26 | | | | 29 | | | | 33 | | | | 28 | |
Net assets, end of period (in millions) | | $ | 714.2 | | | $ | 387.0 | | | $ | 263.8 | | | $ | 281.0 | | | $ | 218.7 | |
| | | | | | | | | | | | | | | | | | | | |
| | | Class B | |
| | | Year Ended December 31, | |
| | | 2013 | | | 2012 | | | 2011 | | | 2010 | | | 2009 | |
Net Asset Value, Beginning of Period | | $ | 16.84 | | | $ | 16.12 | | | $ | 15.89 | | | $ | 11.80 | | | $ | 8.79 | |
| | | | | | | | | | | | | | | | | | | | |
Income (Loss) from Investment Operations | | | | | | | | | | | | | | | | | | | | |
Net investment income (loss) (a) | | | (0.01 | ) | | | 0.04 | | | | (0.06 | ) | | | (0.03 | ) | | | (0.01 | ) |
Net realized and unrealized gain on investments | | | 7.07 | | | | 2.45 | | | | 0.29 | | | | 4.12 | | | | 3.31 | |
| | | | | | | | | | | | | | | | | | | | |
Total from investment operations | | | 7.06 | | | | 2.49 | | | | 0.23 | | | | 4.09 | | | | 3.30 | |
| | | | | | | | | | | | | | | | | | | | |
Less Distributions | | | | | | | | | | | | | | | | | | | | |
Distributions from net investment income | | | (0.03 | ) | | | 0.00 | | | | 0.00 | | | | 0.00 | | | | (0.01 | ) |
Distributions from net realized capital gains | | | (1.10 | ) | | | (1.77 | ) | | | 0.00 | | | | 0.00 | | | | (0.28 | ) |
| | | | | | | | | | | | | | | | | | | | |
Total distributions | | | (1.13 | ) | | | (1.77 | ) | | | 0.00 | | | | 0.00 | | | | (0.29 | ) |
| | | | | | | | | | | | | | | | | | | | |
Net Asset Value, End of Period | | $ | 22.77 | | | $ | 16.84 | | | $ | 16.12 | | | $ | 15.89 | | | $ | 11.80 | |
| | | | | | | | | | | | | | | | | | | | |
Total Return (%) (c) | | | 44.17 | | | | 15.91 | | | | 1.45 | | | | 34.66 | | | | 38.63 | |
| | | | | |
Ratios/Supplemental Data | | | | | | | | | | | | | | | | | | | | |
Gross ratio of expenses to average net assets (%) | | | 0.77 | | | | 0.80 | | | | 0.80 | | | | 0.82 | | | | 0.87 | |
Net ratio of expenses to average net assets (%) (d) | | | 0.74 | | | | 0.77 | | | | 0.78 | | | | 0.80 | | | | 0.85 | |
Ratio of net investment income (loss) to average net assets (%) | | | (0.05 | ) | | | 0.25 | | | | (0.34 | ) | | | (0.22 | ) | | | (0.11 | ) |
Portfolio turnover rate (%) | | | 29 | | | | 26 | | | | 29 | | | | 33 | | | | 28 | |
Net assets, end of period (in millions) | | $ | 373.6 | | | $ | 276.5 | | | $ | 268.4 | | | $ | 266.0 | | | $ | 189.6 | |
Please see following page for Financial Highlights footnote legend.
See accompanying notes to financial statements.
MSF-12
Metropolitan Series Fund
T. Rowe Price Small Cap Growth Portfolio
Financial Highlights
| | | | | | | | | | | | | | | | | | | | |
| Selected per share data | | | |
| | | Class E | |
| | | Year Ended December 31, | |
| | | 2013 | | | 2012 | | | 2011 | | | 2010 | | | 2009 | |
Net Asset Value, Beginning of Period | | $ | 17.06 | | | $ | 16.29 | | | $ | 16.04 | | | $ | 11.91 | | | $ | 8.87 | |
| | | | | | | | | | | | | | | | | | | | |
Income (Loss) from Investment Operations | | | | | | | | | | | | | | | | | | | | |
Net investment income (loss) (a) | | | 0.01 | | | | 0.06 | | | | (0.04 | ) | | | (0.02 | ) | | | (0.00 | )(b) |
Net realized and unrealized gain on investments | | | 7.16 | | | | 2.48 | | | | 0.29 | | | | 4.15 | | | | 3.34 | |
| | | | | | | | | | | | | | | | | | | | |
Total from investment operations | | | 7.17 | | | | 2.54 | | | | 0.25 | | | | 4.13 | | | | 3.34 | |
| | | | | | | | | | | | | | | | | | | | |
Less Distributions | | | | | | | | | | | | | | | | | | | | |
Distributions from net investment income | | | (0.04 | ) | | | 0.00 | | | | 0.00 | | | | 0.00 | | | | (0.02 | ) |
Distributions from net realized capital gains | | | (1.10 | ) | | | (1.77 | ) | | | 0.00 | | | | 0.00 | | | | (0.28 | ) |
| | | | | | | | | | | | | | | | | | | | |
Total distributions | | | (1.14 | ) | | | (1.77 | ) | | | 0.00 | | | | 0.00 | | | | (0.30 | ) |
| | | | | | | | | | | | | | | | | | | | |
Net Asset Value, End of Period | | $ | 23.09 | | | $ | 17.06 | | | $ | 16.29 | | | $ | 16.04 | | | $ | 11.91 | |
| | | | | | | | | | | | | | | | | | | | |
Total Return (%) (c) | | | 44.32 | | | | 16.06 | | | | 1.56 | | | | 34.68 | | | | 38.78 | |
| | | | | |
Ratios/Supplemental Data | | | | | | | | | | | | | | | | | | | | |
Gross ratio of expenses to average net assets (%) | | | 0.67 | | | | 0.70 | | | | 0.70 | | | | 0.72 | | | | 0.77 | |
Net ratio of expenses to average net assets (%) (d) | | | 0.64 | | | | 0.67 | | | | 0.68 | | | | 0.70 | | | | 0.75 | |
Ratio of net investment income (loss) to average net assets (%) | | | 0.05 | | | | 0.34 | | | | (0.24 | ) | | | (0.14 | ) | | | (0.01 | ) |
Portfolio turnover rate (%) | | | 29 | | | | 26 | | | | 29 | | | | 33 | | | | 28 | |
Net assets, end of period (in millions) | | $ | 18.8 | | | $ | 14.2 | | | $ | 14.2 | | | $ | 16.3 | | | $ | 12.8 | |
| (a) | Per share amounts based on average shares outstanding during the period. |
| (b) | Net investment income (loss) was less than $0.01. |
| (c) | Total return does not reflect any insurance, sales, separate account or administrative charges of variable annuity or life insurance contracts or any additional expenses that contract owners may bear under their variable contracts. If these charges were included, the returns would be lower. |
| (d) | Net ratio of expenses to average net assets includes the effect of management fee waivers as detailed in Note 6 of the Notes to Financial Statements. |
See accompanying notes to financial statements.
MSF-13
Metropolitan Series Fund
T. Rowe Price Small Cap Growth Portfolio
Notes to Financial Statements—December 31, 2013
1. Organization
Metropolitan Series Fund (the “Trust”) is organized as a Delaware statutory trust and registered under the Investment Company Act of 1940, as amended (the “1940 Act”), as an open-end management investment company. The Trust is currently comprised of thirty series, each of which operates as a distinct investment vehicle of the Trust. The portfolio included in this report is T. Rowe Price Small Cap Growth Portfolio (the “Portfolio”), which is diversified. Shares in the Portfolio are not offered directly to the general public and are currently available only to separate accounts established by Metropolitan Life Insurance Company (“MetLife”) and other affiliated life insurance companies.
The Portfolio has registered and offers three classes of shares: Class A, B, and E shares. Shares of each Class of the Portfolio represent an equal pro rata interest in the Portfolio and generally give the shareholder the same voting, dividend, liquidation, and other rights. Investment income, realized and unrealized capital gains and losses, the common expenses of the Portfolio, and certain Portfolio-level expense reductions, if any, are allocated on a pro rata basis to each Class based on the relative net assets of each Class to the net assets of the Portfolio. Each Class of shares differs in its respective distribution plan and such distribution expenses are allocated to that Class.
2. Significant Accounting Policies
The preparation of financial statements in conformity with accounting principles generally accepted in the United States of America (“GAAP”) requires management to make estimates and assumptions that affect the reported amounts of assets and liabilities and disclosure of contingent assets and liabilities as of the date of the financial statements and the reported amounts of income and expenses during the reporting period. Actual results could differ from those estimates. In the preparation of these financial statements, management has evaluated events and transactions subsequent to December 31, 2013 through the date the financial statements were issued.
The following is a summary of significant accounting policies consistently followed by the Portfolio in the preparation of its financial statements.
Investment Valuation and Fair Value Measurements - Debt securities (other than short term obligations with a remaining maturity of sixty days or less), including corporate, convertible and municipal bonds and notes; obligations of the U.S. treasury and U.S. government agencies; sovereign issues; floating rate loans; and non-U.S. bonds, are generally valued on the basis of evaluated or composite bid quotations obtained from independent pricing services and/or brokers and dealers selected by MetLife Advisers, LLC (“MetLife Advisers” or the “Adviser”), an affiliate of MetLife, Inc., pursuant to authorization of the Board of Trustees of the Trust (the “Board” or “Trustees”). Such quotations utilize matrix pricing, which considers observable inputs including, among other things, issuer details, maturity dates, interest rates, yield curves, rates of prepayment, credit risks/spreads, default rates, reported trades, broker dealer quotes and quoted prices for similar securities. Securities that use similar valuation techniques and inputs as described above are generally categorized as Level 2 within the fair value hierarchy.
Mortgage and asset-backed securities are usually issued as separate tranches, or classes, of securities within each deal. These securities are also generally valued on the basis of evaluated or composite bid quotations obtained from independent pricing services and/or brokers and dealers selected by the Adviser pursuant to authorization of the Board. The pricing models for these securities usually consider tranche-level attributes, estimated cash flows and market-based yield spreads for each tranche and current market data, and incorporate deal collateral performance, as available. Mortgage and asset-backed securities that use similar valuation techniques and inputs as described above are generally categorized as Level 2 within the fair value hierarchy.
Short term obligations with a remaining maturity of sixty days or less are generally valued at amortized cost, which approximates fair market value, and are generally categorized as Level 2 within the fair value hierarchy.
Domestic and foreign equity securities, such as common stock, exchange-traded funds, rights, warrants, and preferred stock, that are traded on a securities exchange, are generally valued at their last sale price on the exchange or market in which they are principally traded on the valuation date, or, if no sales occurred on that day, at the last reported bid price. Equity securities traded over-the-counter are generally valued at the last reported sale price. Valuation adjustments may be applied to certain foreign equity securities that are traded solely on foreign exchanges that close before the close of the U.S. market to account for the market movement between the close of the foreign exchanges and the close of the U.S. market. The Portfolio may use a systematic fair valuation model provided by an independent third party to value securities principally traded in these foreign markets in order to adjust for possible stale pricing that may occur between the close of the foreign exchanges and the time of the Portfolio valuation. Foreign equity securities using these valuation adjustments are generally categorized as Level 2 within the fair value hierarchy. Equity securities that are actively traded, and have no valuation adjustments applied, are categorized as Level 1 within the fair value hierarchy. Other equity securities traded on inactive markets, or valued in reference to similar instruments traded on active markets, are generally categorized as Level 2 within the fair value hierarchy.
MSF-14
Metropolitan Series Fund
T. Rowe Price Small Cap Growth Portfolio
Notes to Financial Statements—December 31, 2013—(Continued)
Investments in registered open-end management investment companies are valued at reported net asset value per share on the valuation date and are categorized as Level 1 within the fair value hierarchy.
Forward foreign currency exchange contracts are valued through an independent pricing service based on the mean between closing bid and ask prices of the forward currency rates in the London foreign exchange markets on a daily basis as provided by a reliable bank or dealer. These contracts are generally categorized as Level 2 within the fair value hierarchy.
Options, whether on securities, indices, futures contracts, or otherwise, traded on exchanges are valued at the last sale price available as of the close of business on the valuation date or, if there is no such price available, at the mean between the last reported bid and ask prices. These types of options are categorized as Level 1 within the fair value hierarchy. Futures contracts, which are traded on commodity exchanges, are valued at their closing prices as of the close of such exchanges and are categorized as Level 1 within the fair value hierarchy.
Options and futures contracts that are traded over-the-counter are generally valued on the basis of quotations provided by broker-dealers or prices provided by pricing service providers who use a series of techniques, including simulation pricing models, to determine the value of the contracts. The pricing models use inputs that are observed from actively quoted markets such as issuer details, indices, spreads, interest rates, yield curves, credit curves, measures of volatility and exchange rates. These contracts are generally categorized as Level 2 within the fair value hierarchy.
If no current market value quotation or other observable inputs are readily available or market value quotations are deemed to be unreliable for a security, the fair value of the security will be determined in accordance with procedures approved by and under the general supervision of the Board. In such a circumstance, the Board has delegated the determination of the fair value of a security to a Valuation Committee (“Committee”) of MetLife Advisers. The Committee provides general pricing oversight and fair value pricing determinations related to portfolio securities and meets on a regular basis to review reports relating to the valuation of the securities in the Portfolio. The Board has delegated to State Street Bank and Trust Company, the Trust’s custodian (“custodian”), the responsibility for calculating the net asset values (“NAVs”) of the Trust’s Portfolios. The Committee is responsible for overseeing the calculation of the NAVs of the Portfolios by the custodian. The Committee also periodically reviews pricing vendors, including the vendor providing fair value pricing for the Portfolio’s foreign securities, and is responsible for overseeing the correction of pricing errors and addressing other pricing issues that arise in the ordinary course of business, such as making real-time fair value determinations, as necessary.
No single standard for determining the fair value of a security can be set forth because fair value depends upon the facts and circumstances with respect to each security. Information relating to any relevant factors may be obtained by the Committee from any appropriate source, including the subadviser of the Portfolio, the custodian, a pricing service, market maker and/or broker for such security or the issuer. Appropriate methodologies for determining fair value under particular circumstances may include: matrix pricing, comparisons of securities with comparable characteristics, value based on multiples of earnings, discount from market price of similar marketable securities or a combination of these and other methods. The Committee maintains a detailed report tracking each fair-valued security that compares the fair value price to the next available trade, vendor or broker price, and provides information on how close the fair value price was to the next quoted price. The Committee reviews a summary of such report monthly. On a quarterly basis, the Board is provided with the following for consideration and ratification or adjustment: (1) a memorandum summarizing the actions taken by the Committee in the prior quarter; and (2) a list of the Portfolio’s securities as of the most recent quarter-end for which market quotations were not readily available.
Investment Transactions and Related Investment Income - Portfolio security transactions are recorded on the trade date. Dividend income is recorded on the ex-dividend date or, for certain foreign securities, when notified. Interest income, which includes amortization of premium and accretion of discount on debt securities, is recorded on the accrual basis. Realized gains and losses on investments are determined on the identified cost basis, which is the same basis used for federal income tax purposes. Foreign income and foreign capital gains on some foreign securities may be subject to foreign taxes, which are accrued as applicable. These foreign taxes have been provided for in accordance with the Portfolio’s understanding of the applicable countries’ tax rules and rates.
Foreign Currency Translation - The books and records of the Portfolio are maintained in U.S. dollars. The values of securities, currencies, and other assets and liabilities denominated in currencies other than the U.S. dollar are translated into U.S. dollars based upon foreign exchange rates prevailing at the end of the period. Purchases and sales of investment securities, income, and expenses are translated on the respective dates of such transactions. Because the values of investment securities are translated at the foreign exchange rates prevailing at the end of the period, that portion of the results of operations arising from changes in exchange rates and that portion of the results of operations reflecting fluctuations arising from changes in market prices of the investment securities are not separated. Such fluctuations are included in the net realized and unrealized gain or loss on investments.
Net realized foreign exchange gains or losses arise from activity in forward foreign currency exchange contracts, sales of foreign currency, currency gains or losses realized between the trade and settlement dates on securities transactions, and the difference between the amounts of dividends, interest, and foreign withholding taxes recorded by the Portfolio and the U.S. dollar equivalent of
MSF-15
Metropolitan Series Fund
T. Rowe Price Small Cap Growth Portfolio
Notes to Financial Statements—December 31, 2013—(Continued)
the amounts actually received or paid by the Portfolio. Net unrealized foreign exchange gains and losses arise from changes in the value of assets and liabilities, other than investment securities, resulting from changes in foreign exchange rates.
Income Taxes - It is the Portfolio’s policy to comply with the requirements of the Internal Revenue Code of 1986, as amended, and regulations thereunder, applicable to regulated investment companies and to distribute, with respect to each taxable year, all of its taxable income to shareholders. Therefore, no federal income tax provision is required. The Portfolio files U.S. federal tax returns. No income tax returns are currently under examination. The Portfolio’s federal tax returns for the prior three fiscal years remain subject to examination by the Internal Revenue Service. As of December 31, 2013, the Portfolio had no uncertain tax positions that would require financial statement recognition, or de-recognition or disclosure.
Dividends and Distributions to Shareholders - The Portfolio records dividends and distributions on the ex-dividend date. Net realized gains from security transactions (if any) are generally distributed annually to shareholders. The timing and characterization of certain income and capital gains distributions are determined in accordance with federal tax regulations that may differ from GAAP. Permanent book and tax basis differences relating to shareholder distributions will result in reclassification between under/over distributed net investment income, accumulated net realized gains/losses, and paid-in surplus. Book-tax differences are primarily due to foreign currency transactions, real estate investment trust (REIT) adjustments, and broker commission recapture reclasses. These adjustments have no impact on net assets or the results of operations.
Securities Lending - The Portfolio may lend its portfolio securities to certain qualified brokers who borrow securities in order to complete certain securities transactions. By lending its portfolio securities, the Portfolio attempts to increase its net investment income through the receipt of income on collateral held from securities on loan. Any gain or loss in the market price of the loaned securities that might occur and any interest earned or dividends declared during the term of the loan would accrue to the account of the Portfolio.
The Trust has entered into a securities lending arrangement with the custodian. Under this arrangement, the custodian is authorized to loan portfolio securities on the Portfolio’s behalf. In exchange, the Portfolio receives either cash or securities as collateral against the loaned securities. The Portfolio receives collateral at least equal to 102% of the market value of the loaned securities (105% for foreign equity securities), at each loan’s inception. Collateral representing at least 100% of the market value of the loaned securities must be maintained for the duration of the loan. A liability for cash collateral is reflected on the Statement of Assets and Liabilities, and is categorized as Level 2 within the fair value hierarchy. Cash collateral is generally invested in the State Street Navigator Securities Lending MET Portfolio (the “Navigator Portfolio”), a series of the State Street Navigator Securities Lending Trust that is managed by an affiliate of the custodian. The Navigator Portfolio is a registered money market fund that invests in a variety of high-quality, U.S. dollar-denominated instruments. If the market value of the collateral at the close of trading on a business day is less than 100% of the market value of the loaned securities at the close of trading on that day, the borrower shall be required to deliver, by the close of business on the following business day, an additional amount of collateral, so that the total amount of posted collateral is equal to at least 100% of the market value of all the loaned securities as of such preceding day. A portion of net income (income after the deduction of expenses and fees of the Navigator Portfolio) on the collateral is rebated to the borrower of the securities and the remainder is split between the custodian and the Portfolio. On loans collateralized by U.S. Treasuries, a fee is received from the borrower and is allocated between the Portfolio and the custodian. The risks associated with lending portfolio securities include, but are not limited to, possible delays in receiving additional collateral or in the recovery of the loaned securities, possible loss of rights in the collateral should the borrower fail financially, as well as risk of loss in the value of the collateral or the value of the investments made with the collateral. The lending agent has agreed to indemnify the Portfolio in the case of default of any securities borrower. Income received by the Portfolio in securities lending transactions during the year ended December 31, 2013 is reflected as Securities lending income on the Statement of Operations. Any outstanding loans by the Portfolio at December 31, 2013 are disclosed in the footnotes to the Schedule of Investments.
Repurchase Agreements - The Portfolio may enter into repurchase agreements, under the terms of a Master Repurchase Agreement, with selected commercial banks and broker-dealers, under which the Portfolio acquires securities as collateral and agrees to resell the securities at an agreed upon time and at an agreed-upon price. The Portfolio, through the custodian or a subcustodian, receives delivery of the underlying securities collateralizing any repurchase agreements. The Portfolio requires the custodian to take possession, to have legally segregated in the Federal Reserve Book Entry System, or to have segregated within the custodian’s vault, all securities held as collateral for repurchase agreements. It is the Portfolio’s policy that the market value of the collateral be at least equal to 100% of the repurchase price in the case of a repurchase agreement of one-day duration and at least equal to 102% of the repurchase price in the case of all other repurchase agreements. In the event of default or failure by a party to perform an obligation in connection with any repurchase transaction, the Master Repurchase Agreement gives the non-defaulting party the right to set-off claims and to apply property held by it in connection with any repurchase transaction against obligations owed to it.
At December 31, 2013, the Portfolio had investments in repurchase agreements with a gross value of $1,249,000, which is included as part of investments at value on the Statement of Assets and Liabilities. The value of the related collateral exceeded the value of the repurchase agreements at December 31, 2013.
MSF-16
Metropolitan Series Fund
T. Rowe Price Small Cap Growth Portfolio
Notes to Financial Statements—December 31, 2013—(Continued)
Directed Brokerage Agreement - The Trust has entered into a directed brokerage arrangement with State Street Global Markets (“SSGM”). Under this arrangement, the Portfolio directs certain trades to SSGM in return for a recapture credit. SSGM issues a cash rebate to the Portfolio. Amounts paid to the Portfolio are shown separately as broker commission recapture on the Statement of Operations of the Portfolio. Additionally, these amounts have been excluded from the calculation of the net ratio of expenses to average net assets presented in the Financial Highlights for each share class.
3. Investments in Derivative Instruments
Futures Contracts - The Portfolio may buy and sell futures contracts as a hedge, to maintain investment exposure to a target asset class or to enhance return. The Portfolio may be subject to fluctuations in equity prices, interest rates, commodity prices, and foreign currency exchange rates in the normal course of pursuing its investment objective. Futures contracts are standardized agreements to buy or sell a security, or deliver a final cash settlement price in connection with an index, interest rate, currency, or other asset. The Portfolio must deposit an amount (“initial margin”) equal to a certain percentage of the face value of the futures contract. The initial margin may be in the form of cash or securities, which is returned when the Portfolio’s obligations under the contract have been satisfied. If cash is deposited as the initial margin, it is shown as cash collateral on the Statement of Assets and Liabilities. Futures contracts are marked-to-market daily, and subsequent payments (“variation margin”) are made or received by the Portfolio depending on whether unrealized gains or losses are incurred. These amounts are reflected as receivables or payables on the Statement of Assets and Liabilities and as a component of net change in unrealized appreciation/depreciation on the Statement of Operations. When the contract is closed or expires, the Portfolio records a realized gain or loss equal to the difference between the value of the contract at the time it was opened and the value at the time it was closed. Risks of entering into futures contracts (and related options) include the possibility that the market for these instruments may be illiquid and that a change in the value of the contract or option may not correlate perfectly with changes in the value of the underlying instrument. Futures contracts are exchange-traded and the exchange’s clearinghouse, as counterparty to all exchange-traded futures, guarantees the futures contracts against default. For over-the-counter futures the Portfolio’s ability to terminate the positions may be more limited than in the case of exchange-traded positions and may also involve the risk that securities dealers participating in such transactions would fail to meet their obligations to the Portfolio.
During the year ended December 31, 2013, the Portfolio entered into equity index futures contracts which were subject to equity price risk. During the period April 16, 2013 through April 18, 2013, the Portfolio had bought and sold $88,744,295 in equity index futures contracts. At December 31, 2013, the Portfolio did not have any open futures contracts. For the year ended December 31, 2013, the Portfolio had realized losses in the amount of $(1,560,081) which are shown under Net realized loss on futures contracts in the Statement of Operations.
4. Certain Risks
Market Risk: In the normal course of business, the Portfolio invests in securities and enters into transactions where risks exist due to fluctuations in the market (market risk) or failure of the other party to a transaction to perform (credit and counterparty risk). The value of securities held by the Portfolio may decline in response to certain events, including those directly involving the companies whose securities are owned by the Portfolio; conditions affecting the general economy; overall market changes; local, regional or global political, social or economic instability; currency, interest rate, and price fluctuations.
Credit and Counterparty Risk: The Portfolio may be exposed to counterparty risk, or the risk that an entity with which the Portfolio has unsettled or open transactions may default. The potential loss could exceed the value of the financial assets and liabilities recorded in the financial statements. Financial assets that potentially expose the Portfolio to credit and counterparty risk consist principally of cash due from counterparties and investments. The Portfolio manages counterparty risk by entering into agreements only with counterparties that it believes have the financial resources to honor their obligations and by monitoring the financial stability of those counterparties. The Portfolio’s investment adviser attempts to mitigate counterparty risk by (i) periodically assessing the creditworthiness of its trading partners, (ii) monitoring and/or limiting the amount of its net exposure to each individual counterparty based on its assessment, and (iii) requiring collateral from the counterparty for certain transactions. In order to preserve certain safeguards for non-standard settlement trades, the Portfolio restricts its exposure to credit and counterparty losses by entering into master netting agreements with counterparties (approved brokers) with whom it undertakes a significant volume of transactions. Master Agreements govern the terms of certain transactions, and reduce the counterparty risk associated with relevant transactions by specifying credit protection mechanisms and providing standardization that improves legal certainty. Master Agreements can also help limit counterparty risk by specifying collateral posting arrangements at pre-arranged exposure levels. Collateral requirements may differ by type of derivative or investment, as applicable. Collateral or margin requirements are set by the broker or exchange clearing house for exchange traded derivatives (e.g., futures contracts and exchange traded options) while collateral terms are contract specific for over-the-counter traded derivatives (e.g., forward foreign currency exchange contracts, swap agreements and over-the-counter options).
Repurchase and reverse repurchase agreements are primarily executed under Global Master Repurchase Agreements (“GMRAs”) or Master Repurchase Agreements (“MRAs”), which provide the rights to set-off. Each repurchase and reverse repurchase agreement is
MSF-17
Metropolitan Series Fund
T. Rowe Price Small Cap Growth Portfolio
Notes to Financial Statements—December 31, 2013—(Continued)
initially collateralized at the transaction level. In the event of default, the total market value exposure will be offset against collateral exchanged to date, which would result in a net receivable/(payable) that would be due from/to the counterparty.
Customer Account Agreements and related addendums govern cleared derivatives transactions such as futures, options on futures, and cleared OTC derivatives. Cleared derivative transactions require posting of initial margin as determined by each relevant clearing agency which is segregated at a broker account registered with the Commodities Futures Trading Commission (CFTC), or the applicable regulator. In the U.S., counterparty risk is significantly reduced as creditors of the futures broker do not have claim to Portfolio assets in the segregated account. Additionally, portability of exposure in the event of default further reduces risk to the Portfolio. Variation margin, or changes in market value, are exchanged daily, but may not be netted between futures and cleared OTC derivatives.
Additional risks associated with each type of investment are described above within the respective security type notes. The Portfolio’s prospectus includes a discussion of the principal risks of investing in the Portfolio.
5. Investment Transactions
Aggregate cost of purchases and proceeds of sales of investment securities, excluding short-term securities, for the year ended December 31, 2013 were as follows:
| | | | | | | | | | | | |
Purchases | | | Sales | |
U.S. Government | | Non U.S. Government | | | U.S. Government | | | Non U.S. Government | |
| $0 | | $ | 354,668,554 | | | $ | 0 | | | $ | 262,964,910 | |
The Portfolio engaged in security transactions with other accounts managed by T. Rowe Price Associates, Inc. that amounted to $17,640 in purchases of investments, which is included above.
During the year ended December 31, 2013, the Portfolio engaged in security transactions with other affiliated portfolios. These amounted to $43,389,373 in purchases of investments, which are included above.
6. Investment Management Fees and Other Transactions with Affiliates
Investment Management Agreement - MetLife Advisers is the investment adviser to the Portfolio. The Trust has entered into an investment management agreement with MetLife Advisers with respect to the Portfolio. For providing investment management services to the Portfolio, MetLife Advisers receives monthly compensation at the following annual rates:
| | | | | | |
Management
Fees earned by
MetLife Advisers
for the year ended
December 31, 2013 | | % per annum | | | Average daily net assets |
| $4,390,500 | | | 0.550 | % | | Of the first $100 million |
| | | 0.500 | % | | Of the next $300 million |
| | | 0.450 | % | | On amounts in excess of $400 million |
MetLife Advisers has entered into an investment subadvisory agreement with respect to the Portfolio. T. Rowe Price Associates, Inc. (“T. Rowe Price”) is compensated by MetLife Advisers to provide subadvisory services for the Portfolio.
Management Fee Waivers - Effective February 17, 2005, T. Rowe Price agreed to a voluntary subadvisory fee waiver that applies if (i) assets under management by T. Rowe Price for the Trust and Met Investors Series Trust (“MIST”), an affiliate of the Trust, in the aggregate, exceed $750,000,000, (ii) T. Rowe Price subadvises three or more portfolios of the Trust and MIST in the aggregate, and (iii) at least one of those portfolios is a large cap domestic equity portfolio.
If the aforementioned conditions are met, T. Rowe Price will waive its subadvisory fee paid by MetLife Advisers by 5% for combined Trust and MIST average daily net assets over $750,000,000, 7.5% for the next $1,500,000,000 of combined assets, and 10% for amounts over $3,000,000,000. Any amounts waived pursuant to this subadvisory fee waiver will be allocated with respect to the Trust and MIST portfolios in proportion to such portfolios’ net assets. MetLife Advisers has voluntarily agreed to reduce its advisory fee for the Portfolio by the amount waived (if any) by T. Rowe Price for the Portfolio pursuant to this voluntary subadvisory fee waiver. Because these fee waivers are voluntary, and not contractual, they may be discontinued by T. Rowe Price and MetLife Advisers at any time. Amounts waived for the year ended December 31, 2013 are shown as management fee waivers in the Statement of Operations.
Certain officers and trustees of the Trust may also be officers of MetLife Advisers; however, such officers and trustees receive no compensation from the Trust.
MSF-18
Metropolitan Series Fund
T. Rowe Price Small Cap Growth Portfolio
Notes to Financial Statements—December 31, 2013—(Continued)
Transfer Agency Agreement - MetLife serves as the transfer agent for the Trust. MetLife receives no fees for its services to the Trust under the transfer agency agreement.
Distribution and Service Fees - The Trust has a distribution agreement with MetLife Investors Distribution Company (“MIDC” or the “Distributor”) in which MIDC serves as the distributor for the Portfolio’s Class A, B and E Shares. MIDC is a wholly-owned subsidiary of MetLife Investors Group, Inc., an affiliate of the Adviser. The Trust has also adopted a Distribution and Service Plan under Rule 12b-1 of the 1940 Act for the Portfolio’s Class B and E Shares. Under the Distribution and Service Plan, the Class B and E Shares of the Portfolio pay a fee to compensate the Insurance Companies (or their affiliates) and other broker-dealers and financial intermediaries involved in the offer and sale of Portfolio shares for promoting or selling and servicing the Class B and E Shares. The fees under the Distribution and Service Plan for each class of the Portfolio’s shares are calculated as a percentage of the Portfolio’s average daily net assets that are attributable to that Class. Currently, the fee is 0.25% per year for Class B Shares and 0.15% per year for Class E Shares. Amounts incurred by the Portfolio for the year ended December 31, 2013 are shown as Distribution and service fees in the Statement of Operations.
Deferred Trustee Compensation - Each Trustee who is not currently an employee of the Adviser or any of its affiliates receives compensation from the Trust for his or her service to the Trust. A deferred compensation plan (the “Plan”) is available to the Trustees on a voluntary basis. Deferred amounts remain in the Trust until distributed in accordance with the provisions of the Plan. The value of a participating Trustee’s deferral account is based on theoretical investments of deferred amounts, on the normal payment dates in certain portfolios of the Trust or Met Investors Series Trust, an affiliate of the Trust, as designated by the participating Trustee. Changes in the value of participants’ deferral accounts are reflected as Trustees’ fees and expenses in the Statement of Operations. The portion of the accrued obligations allocated to the Portfolio under the Plan is reflected as Deferred trustees’ fees in the Statement of Assets and Liabilities.
7. Transactions in Securities of Affiliated Issuers
A summary of the Portfolio’s transactions in the securities of affiliated issuers during the year ended December 31, 2013 is as follows:
| | | | | | | | | | | | | | | | | | | | | | | | |
Security Description | | Number of
shares held at
December 31, 2012 | | | Shares
purchased | | | Shares sold | | | Number of
shares held at
December 31, 2013 | | | Realized
Gain/(Loss)
on shares sold | | | Income for
the year ended
December 31, 2013 | |
T. Rowe Price Government Reserve Investment Fund | | | 3,877,723 | | | | 103,691,502 | | | | (104,405,502 | ) | | | 3,163,723 | | | $ | 0 | | | $ | 2,086 | |
8. Contractual Obligations
Under the Trust’s organizational documents, its officers and Trustees may be indemnified against certain liabilities and expenses arising out of the performance of their duties to the Trust. Additionally, the Trust has a variety of indemnification obligations under contracts with its service providers. The Trust’s maximum exposure under these arrangements is unknown, as this would involve future claims that may be made against the Trust that have not yet occurred.
9. Income Tax Information
The tax character of distributions paid for the periods ended December 31, 2013 and 2012 was as follows:
| | | | | | | | | | | | | | | | | | | | |
Ordinary Income | | | Long-Term Capital Gain | | | Total | |
2013 | | 2012 | | | 2013 | | | 2012 | | | 2013 | | | 2012 | |
| $6,905,254 | | $ | — | | | $ | 46,423,228 | | | $ | 57,712,956 | | | $ | 53,328,482 | | | $ | 57,712,956 | |
As of December 31, 2013, the components of distributable earnings (accumulated losses) on a federal income tax basis were as follows:
| | | | | | | | | | | | | | | | |
Undistributed
Ordinary
Income | | Undistributed
Long-Term
Capital Gain | | | Net
Unrealized
Appreciation | | | Loss Carryforwards | | | Total | |
$1,233,813 | | $ | 81,745,433 | | | $ | 371,241,158 | | | $ | — | | | $ | 454,220,404 | |
The Portfolio utilizes the provisions of the federal income tax laws that provide for the carryforward of capital losses for prior years, offsetting such losses against any future realized capital gains. Under the Regulated Investment Company Modernization Act of 2010 (the “Act”), net capital losses recognized after December 22, 2010 may be carried forward indefinitely and their character is retained as short-term and/or long-term losses. Previously, net capital losses were carried forward for up to eight years and treated as short-term losses. As a transition rule, the Act requires that post-enactment net capital losses be used before pre-enactment net capital losses.
As of December 31, 2013, the Portfolio had no post-enactment accumulated capital losses and no pre-enactment accumulated capital loss carryforwards.
MSF-19
Metropolitan Series Fund
T. Rowe Price Small Cap Growth Portfolio
Report of Independent Registered Public Accounting Firm
To the Shareholders of T. Rowe Price Small Cap Growth Portfolio and the Board of Trustees of Metropolitan Series Fund:
We have audited the accompanying statement of assets and liabilities, including the schedule of investments, of T. Rowe Price Small Cap Growth Portfolio, one of the portfolios constituting Metropolitan Series Fund, (the “Trust”) as of December 31, 2013, and the related statement of operations for the year then ended, the statements of changes in net assets for each of the two years in the period then ended, and the financial highlights for each of the five years in the period then ended. These financial statements and financial highlights are the responsibility of the Trust’s management. Our responsibility is to express an opinion on these financial statements and financial highlights based on our audits.
We conducted our audits in accordance with the standards of the Public Company Accounting Oversight Board (United States). Those standards require that we plan and perform the audit to obtain reasonable assurance about whether the financial statements and financial highlights are free of material misstatement. The Trust is not required to have, nor were we engaged to perform, an audit of its internal control over financial reporting. Our audits included consideration of internal control over financial reporting as a basis for designing audit procedures that are appropriate in the circumstances, but not for the purpose of expressing an opinion on the effectiveness of the Trust’s internal control over financial reporting. Accordingly, we express no such opinion. An audit also includes examining, on a test basis, evidence supporting the amounts and disclosures in the financial statements, assessing the accounting principles used and significant estimates made by management, as well as evaluating the overall financial statement presentation. Our procedures included confirmation of securities owned as of December 31, 2013, by correspondence with the custodian and brokers; where replies were not received from brokers, we performed other auditing procedures. We believe that our audits provide a reasonable basis for our opinion.
In our opinion, the financial statements and financial highlights referred to above present fairly, in all material respects, the financial position of the T. Rowe Price Small Cap Growth Portfolio of Metropolitan Series Funds, as of December 31, 2013, the results of its operations for the year then ended, the changes in its net assets for each of the two years in the period then ended, and the financial highlights for each of the five years in the period then ended, in conformity with accounting principles generally accepted in the United States of America.
Deloitte & Touche LLP
Boston, Massachusetts
February 26, 2014
MSF-20
Metropolitan Series Fund
Trustees and Officers of Metropolitan Series Fund
The Trustees and executive officers of the Trust, their ages and their principal occupations during the past five years are set forth below. Unless otherwise indicated, the business address of each is One Financial Center, Boston, MA 02111. Each Trustee who is deemed an “interested person,” as such term is defined in the 1940 Act, is indicated by an asterisk. Those Trustees who are not “interested persons” as defined in the 1940 Act are referred to as “Independent Trustees.” Additional information about the Trustees is available in the Statement of Additional Information, which is available without charge, upon request, by calling (800) 848-3854.
Trustees of the Trust
| | | | | | | | | | |
Name and Age | | Position(s)
Held with
Registrant | | Term of Office
and Length of
Time Served | | Principal Occupation(s) During the Past 5
Years(1) | | Number of
Portfolios
in Fund
Complex(2)
overseen | | Other Directorships Held
by Trustee During the
Past 5 Years(1) |
| Interested Trustee | | | | | | | | | | |
| Elizabeth M. Forget* (47) | | Trustee, Chairman of the Board, President and Chief Executive Officer | | Indefinite;
From
May
2006
(President
and Chief
Executive
Officer)/
August
2006
(Trustee
and
Chairman
of the
Board) to
present | | Senior Vice President, MetLife Inc.; President, MetLife Advisers, LLC and a predecessor company. | | 79 | | Trustee, Met Investors Series Trust (the “MIST Trust”);** various MetLife-affiliated boards. |
| | | | | |
| Independent Trustees | | | | | | | | | | |
| Stephen M. Alderman (54) | | Trustee | | Indefinite;
From
April
2012 to
present | | Shareholder in the law firm of Garfield & Merel, Ltd. | | 79 | | Trustee, MIST Trust;** Director, International Truck Leasing Corp. |
| | | | | |
| Robert J. Boulware (57) | | Trustee | | Indefinite;
From
April
2012 to
present | | Managing Director, Pilgrim Funds, LLC (private equity fund). | | 79 | | Trustee, MIST Trust;** Trustee, Vertical Capital Income Fund (closed-end fund); Director, Gainsco, Inc. (auto insurance). |
| | | | | |
| Susan C. Gause (61) | | Trustee | | Indefinite;
From
April
2012 to
present | | Private Investor. | | 79 | | Trustee, MIST Trust;** Trustee, HSBC Funds. |
| | | | | |
| Nancy Hawthorne (62) | | Trustee | | Indefinite;
From
May
2003 to
present | | Chief Executive Officer, Clerestory LLC (corporate advisor). | | 79 | | MIST Trust;** Director, THL Credit, Inc.**; Director, Avid Technology, Inc.** |
| | | | | |
| Barbara A. Nugent (57) | | Trustee | | Indefinite;
From
January
2014 to
present | | President, True North Board Governance, LLC (consulting); until 2014, partner in the law firm of Stradley Ronon Stevens & Young, LLP. | | 79 | | Trustee, MIST Trust**; Director, Episcopal Healthcare Foundation; until 2014, member, Mutual Fund Directors Forum Advisory Board. |
MSF-21
Metropolitan Series Fund
Trustees and Officers of Metropolitan Series Fund—(Continued)
| | | | | | | | | | |
Name and Age | | Position(s)
Held with
Registrant | | Term of Office
and Length of
Time Served | | Principal Occupation(s) During the Past 5
Years(1) | | Number of
Portfolios
in Fund
Complex(2)
overseen | | Other Directorships Held
by Trustee During the
Past 5 Years(1) |
| Keith M. Schappert (62) | | Trustee | | Indefinite;
From
August
2009 to
present | | Principal, Schappert Consulting LLC (asset management consulting). | | 79 | | Trustee, MIST Trust;** Director, The Commonfund for Nonprofit Organizations; until 2011, Director, Trilogy Global Advisors; Director, Mirae Asset Discovery Funds,** Director, Calamos Investments. |
| | | | | |
| Linda B. Strumpf (66) | | Trustee | | Indefinite;
From
May
2000 to
present | | Chair of the Investment Committee, Leona M. and Harry B. Helmsley Charitable Trust; until 2011, Chief Investment Officer, Leona M. and Harry B. Helmsley Charitable Trust. | | 79 | | Since 2012, Trustee, MIST Trust,** Trustee and Member of Investment Committee, The Pennsylvania State University. |
| | | | | |
| Dawn M. Vroegop (47) | | Trustee | | Indefinite;
From
May
2009 to
present | | Private Investor. | | 79 | | Trustee, MIST Trust,** Trustee, Driehaus Mutual Funds; Director and Investment Committee Chair, City College of San Francisco Foundation. |
Executive Officers of the Trust
| | | | | | |
Name and Age | | Position(s) Held with
Registrant | | Term of Office
and Length of
Time Served | | Principal Occupation(s) During Past 5 Years(1) |
| Elizabeth M. Forget (47) | | President, Chief Executive Officer, Trustee and Chairman of the Board | | From May
2006 (President
and Chief
Executive
Officer)/
August 2006
(Trustee and
Chairman of
the Board) to
present | | See principal occupation information in the table above. |
| | | |
| Jeffrey L. Bernier (42) | | Vice President | | From February
2008 to present | | Vice President, MetLife, Inc.; Senior Vice President, MetLife Advisers, LLC and a predecessor company. |
| | | |
| Peter H. Duffy (58) | | Chief Financial Officer and Treasurer | | From November
2000 to present | | Senior Vice President, MetLife Advisers, LLC; Vice President, MetLife, Inc. |
| | | |
| Andrew L. Gangolf (59) | | Secretary | | From May
2011to present | | Senior Vice President, MetLife Advisers, LLC; Senior Vice President & Assistant General Counsel, AllianceBerstein Investments, Inc. |
| | | |
| Jeffrey P. Halperin (46) | | Chief Compliance Officer | | From November
2005 to present | | Vice President, MetLife, Inc.; Chief Compliance Officer, MIST; Chief Compliance Officer, MSF Trust; Chief Compliance Officer, MetLife Advisers, LLC and a predecessor company; Chief Compliance Officer, MetLife Investment Management, LLC (formerly MetLife Investment Advisors Company, LLC). |
| | | |
| Alan C. Leland, Jr. (61) | | Vice President | | From February
2005 to present | | Treasurer and Chief Financial Officer, MetLife Advisers, LLC; Vice President, MetLife Group Inc.; Vice President, MetLife, Inc. |
| * | Ms. Forget is an “interested person” of the Trust because of her positions with MetLife Advisers, LLC and her ownership of securities issued by MetLife, Inc., the ultimate parent company of MetLife Advisers, LLC. |
| ** | Indicates a directorship with a registered investment company or a company subject to the reporting requirements of the Securities Exchange Act of 1934, as amended. |
| (1) | Previous positions during the past five years with the Trust, MetLife, Inc. or the Adviser are omitted if not materially different. |
| (2) | The Fund Complex includes 49 Portfolios of the MIST Trust and 30 Portfolios of the Trust. |
MSF-22
Metropolitan Series Fund
T. Rowe Price Small Cap Growth Portfolio
Board of Trustees’ Consideration of Advisory and Sub-Advisory Agreements
At an in-person meeting of the Boards of Trustees (the “Board”) of Met Investors Series Trust and Metropolitan Series Fund (“MIST” and “MSF,” respectively, and collectively, the “Trusts”) held on November 19-20, 2013, the Board, including a majority of the Trustees who are not considered to be “interested persons” of the Trusts (the “Independent Trustees”) under the Investment Company Act of 1940, as amended (the “1940 Act”), approved for an annual period the continuation of each Trust’s advisory agreement (the “Advisory Agreement”) with MetLife Advisers, LLC (the “Adviser”) and the applicable sub-advisory agreements (each a “Sub-Advisory Agreement,” and collectively with the Advisory Agreement, the “Agreements”) between the Adviser and the investment sub-advisers (each a “Sub-Adviser,” and collectively, the “Sub-Advisers”) for each of the series of the Trusts, including the T. Rowe Price Small Cap Growth Portfolio (each a “Portfolio,” and collectively, the “Portfolios”).1
In considering the Agreements, the Board reviewed a variety of materials provided by the Adviser and the Sub-Advisers relating to the Portfolios, including comparative performance, fee and expense information for an appropriate peer group of similar mutual funds, performance information for relevant benchmark indices and other information regarding the nature, extent and quality of services provided by the Adviser and the Sub-Advisers under their respective Agreements. The Board also took into account its experience with the Adviser and the Sub-Advisers and information provided to the Board in its meetings throughout the year with respect to the services provided by the Adviser and the Sub-Advisers, including quarterly performance reports prepared by management containing reviews of investment results, and periodic presentations from certain of the Sub-Advisers with respect to the Portfolios they manage. The Independent Trustees also assessed reports provided by the Board’s independent consultant, who reviewed and provided analyses regarding investment performance, fees and expenses, and other information provided by, or at the direction of, the Adviser and the Sub-Advisers, as more fully discussed below.
The Independent Trustees were separately advised by independent legal counsel throughout the process, and met with independent legal counsel in periodic executive sessions. Prior to voting to continue the Agreements at the November meeting, the Independent Trustees also received a memorandum from their independent counsel discussing the legal standards for their consideration of the proposed continuation of the Agreements. The Board also met in person with personnel of the Adviser on September 17, 2013 for the specific purpose of giving preliminary consideration to the proposed continuation of the Agreements and to request additional information they considered reasonably necessary to their deliberations. The Independent Trustees also discussed the proposed continuation of the Agreements in private sessions with their independent legal counsel at which no representatives of management were present.
In considering whether to approve the renewal of the Advisory Agreement with the Adviser and any applicable Sub-Advisory Agreements with respect to a Portfolio, the Board reviewed and analyzed the factors it deemed relevant, including: (1) the nature, extent and quality of the services to be provided to the Portfolios by the Adviser and the Sub-Advisers; (2) the performance of the Portfolios as compared to a peer group and an appropriate index; (3) the Adviser’s and each of the Sub-Adviser’s personnel and operations; (4) the financial condition of the Adviser and of the Sub-Advisers; (5) the level and method of computing each Portfolio’s advisory and sub-advisory fees; (6) the profitability of the Adviser under the Advisory Agreement and of certain of the Sub-Advisers under the Sub-Advisory Agreements; (7) any “fall-out” benefits to the Adviser, the Sub-Advisers and their affiliates (i.e., ancillary benefits realized by the Adviser, the Sub-Advisers or their affiliates from the Adviser’s or Sub-Advisers’ relationship with the Trusts); (8) the anticipated effect of growth in size on Portfolio expenses; (9) fees paid to certain of the Sub-Advisers by comparable institutional and retail accounts; and (10) possible conflicts of interest.
Nature, extent and quality of services. The Board evaluated the nature, extent and quality of the services that the Adviser, and the Sub-Advisers as relevant, have provided to the Portfolios. The Board considered the Adviser’s services as investment manager to the Portfolios, including services relating to the selection and oversight of the Sub-Advisers for the applicable Portfolios. The Board considered, among other things, the Adviser’s oversight of the provision of services to the Portfolios by the Sub-Advisers, including with respect to investment activities and trading practices, and the Sub-Adviser’s compliance with fund policies, objectives and Board directives, compliance policies and procedures and applicable law. The Adviser’s services in coordinating and overseeing the activities of the Trusts’ other service providers were also considered. The Board also evaluated the expertise and performance of the personnel of the Adviser who performed services for the Portfolios throughout the year.
The Board considered information received from the Trust’s Chief Compliance Officer (“CCO”) regarding the Portfolios’ compliance policies and procedures established pursuant to Rule 38a-l under the 1940 Act. The Board also evaluated the CCO’s ongoing reports concerning the CCO’s oversight of the risk assessment processes of the Sub-Advisers.
1 The Pyramis Managed Risk Portfolio recently commenced operations and, therefore, the Agreement with respect to this Portfolio was not up for renewal.
MSF-23
Metropolitan Series Fund
T. Rowe Price Small Cap Growth Portfolio
Board of Trustees’ Consideration of Advisory and Sub-Advisory Agreements—(Continued)
With respect to the services provided by each of the Sub-Advisers, the Board considered, among other things, information provided to the Board by each Sub-Adviser. The Board considered the Sub-Adviser’s current level of staffing and its overall resources, as well as its compensation program. The Board reviewed each Sub-Adviser’s history and investment experience, as well as information regarding the qualifications, background and responsibilities of the Sub-Adviser’s investment and compliance personnel who provide services to the Portfolios. The Board also considered, among other things, the Sub-Adviser’s compliance program and any disciplinary history. The Board also took into account the Sub-Adviser’s risk assessment and monitoring process. The Board noted each Sub-Adviser’s regulatory history, including whether it was currently involved in any regulatory actions or investigations as well as material litigation, and any settlements and amelioratory actions undertaken, as appropriate. The Board also noted that the CCO and his staff conduct regular, periodic compliance reviews with each of the Sub-Advisers and present reports to the Independent Trustees regarding the same, which includes evaluating the regulatory compliance systems of the Sub-Advisers and procedures reasonably designed by them to help assure compliance with the federal securities laws, including issues related to late trading and market timing, best execution, fair value pricing, and proxy voting procedures, among others. The Board also took into account the financial condition of each Sub-Adviser. In its review, the Board also received and took into account information regarding any services and/or payments provided to the Adviser by the Sub-Advisers in connection with marketing activities.
The Board considered each Sub-Adviser’s investment process and philosophy. The Board took into account that each Sub-Adviser’s responsibilities include the development and maintenance of an investment program for the applicable Portfolio which is consistent with the Portfolio’s investment objectives, the selection of investment securities and the placement of orders for the purchase and sale of such securities, as well as the implementation of compliance controls related to performance of these services. The Board also reviewed each Sub-Adviser’s brokerage policies and practices.
Performance. The Board considered the performance of the Portfolios as described in the quarterly reports prepared by management, and as also analyzed in reports prepared by the Independent Trustees’ independent consultant. The Board noted that the Adviser reviews with the Board on a quarterly basis detailed information about the Portfolios’ performance results, portfolio composition and investment strategies. The Board also reviewed and considered a separate report prepared by Lipper Inc. (“Lipper”), an independent third party, which provided a statistical analysis comparing the Portfolios’ investment performance, expenses, and fees to comparable funds underlying variable insurance products (the “Performance Universe”). In addition, the Independent Trustees met separately with a representative of Bobroff Consulting, Inc., an independent consultant (“Bobroff), at a special board meeting in September 2013, to review the separate reports prepared by such consultant (“Bobroff Report”), which analyzed the report prepared by Lipper. The Board also considered each Portfolio’s more recent performance subsequent to the performance period covered by the Lipper reports, and management’s discussion of the same, including the effect of current market conditions on each Portfolio’s more recent performance.
The Board reviewed the Portfolios’ performance records and the Adviser’s and Sub-Advisers’ management styles and long-term performance records with the Portfolios and comparable funds. The Board focused particular attention on Portfolios with less favorable performance records. The Board was mindful of the Adviser’s focus on each Sub-Adviser’s performance and noted that the Adviser has been active in monitoring and responding to any performance issues with respect to the Portfolios. The Board also took into account its discussions with management regarding factors that contributed to the performance of the Portfolios.
Among other data relating specifically to the T. Rowe Price Small Cap Growth Portfolio’s performance, the Board considered that the Portfolio outperformed the median of its Performance Universe and its Lipper Index for the one-, three- and five-year periods ended June 30, 2013. The Board also considered that the Portfolio underperformed its benchmark, the MSCI U.S. Small Cap Growth Index, for the one-year period ended October 31, 2013 but outperformed its benchmark for the three- and five-year periods ended October 31, 2013.
Fees and Expenses. The Board gave consideration to the advisory fees payable under the Advisory Agreement and the sub-advisory fees payable under each of the Sub-Advisory Agreements. In this regard, the Board reviewed the advisory fees payable on a Portfolio-by-Portfolio basis based on information provided by the Adviser. The Independent Trustees, with the assistance of Bobroff, also examined the fees paid by a Portfolio in light of fees paid to other investment managers by comparable funds, as well as considered the fees charged by the Adviser to manage other comparable funds, as applicable. The Lipper report included comparisons of the Adviser’s fee schedule with that of its peers based on an asset-based analysis of relative fee structures according to the size of the Portfolio. In addition, the Board considered the Portfolios’ advisory and sub-advisory fees and total expenses as compared to similarly situated investment companies underlying variable insurance products deemed to be comparable to the Portfolios as determined by Lipper. The Board considered a Portfolio’s ranking within a smaller group of peer funds chosen by Lipper (the “Expense Group”), as well as the Portfolio’s ranking within broader groups of funds (the “Expense Universe” and the “Sub-advised Expense Universe”). The Board
MSF-24
Metropolitan Series Fund
T. Rowe Price Small Cap Growth Portfolio
Board of Trustees’ Consideration of Advisory and Sub-Advisory Agreements—(Continued)
also considered a Portfolio’s contractual sub-advisory fees, as applicable, as compared to the Sub-advised Expense Universe as well as a smaller group of funds (the “Sub-advised Expense Group”). In comparing a Portfolio’s actual and contractual management fee to that of comparable funds, the Board noted that such fee includes both advisory and administrative fees.
The Board noted that the sub-advisory fees for the Portfolios are paid by the Adviser, not the Portfolios, out of the advisory fee. It was further noted that the Adviser negotiates such fees at arm’s length. The Board also considered that the Adviser had entered into expense limitation agreements with certain of the Portfolios, pursuant to which the Adviser has agreed to waive a portion of its advisory fee and/or reimburse certain expenses as a means of limiting a Portfolio’s total annual operating expenses. The Board further considered the amount of sub-advisory fees paid out by the Adviser and the amount of the management fees that it retained in light of the services performed by Sub-Advisers and Adviser, respectively.
With respect to the T. Rowe Price Small Cap Growth Portfolio, the Board considered that the Portfolio’s actual management fees and total expenses (exclusive of 12b-1 fees) were below the median of the Expense Group, Expense Universe and Sub-advised Expense Universe. The Board further noted that the Portfolio’s contractual management fees were below the asset-weighted average of the Expense Group at the Portfolio’s current size and were the lowest in the Expense Group. The Board also noted that the Portfolio’s contractual sub-advisory fees were below the average of the Sub-advised Expense Group and the Sub-advised Expense Universe at the Portfolio’s current size. The Board further noted that the Adviser had waived fees and/or reimbursed expenses during the past year.
Profitability. The Board examined the profitability of the Adviser on a Portfolio-by-Portfolio basis. The Board also considered that the Distributor, MetLife Investors Distribution Company, receives Rule 12b-1 payments to support the distribution of the products. The Board considered the profitability to the Sub-Advisers and their affiliates as a result of their relationships with the Portfolios, and the Board considered the ability of the Adviser to negotiate the Sub-Advisory Agreements and the fees thereunder at arm’s length. The Board also reviewed Portfolio specific data with regard to the profitability of the Portfolios to each Sub-Adviser, as available.
Economies of scale. The Board also considered the effect of the Portfolios’ growth in size on their fees. The Board noted that the fee schedules for most of the Portfolios contain breakpoints that reduce the fee rate above specified asset levels. The Board noted those Portfolios that did not contain breakpoints in the advisory fee and took into account management’s discussion of the same. The Board noted that those Portfolios with advisory fee schedules containing breakpoints generally reflect the inclusion of breakpoints in the sub-advisory fee schedule for such Portfolios. The Board considered the effective fees under the Advisory Agreement for a Portfolio as a percentage of assets at different asset levels and possible economies of scale that may be realized if the assets of the Portfolio grow. Among other data, the Board examined the effect of a Portfolio’s growth in size on various fee schedules and reviewed the Lipper and Bobroff Reports, which compared fees among peers. The Board also generally noted that if a Portfolio’s assets increase over time, the Portfolio may realize other economies of scale if assets increase proportionally more than certain other fixed expenses. In addition, the Board noted that the Adviser had taken a number of steps to date intended to share the benefits of economies of scale with contractholders.
With respect to the T. Rowe Price Small Cap Growth Portfolio, the Board noted that the Portfolio’s advisory fee and sub-advisory fee each contain breakpoints that reduce the advisory fee rate on assets above certain specified asset levels. The Board considered the fact that the Portfolio’s fee levels decline as portfolio assets increase.
Other factors. As part of its evaluation of the Adviser’s compensation, the Board considered other benefits that may be realized by the Adviser and its affiliates from their relationship with the Trusts. Among them, the Board recognized that an affiliate of the Adviser, MetLife Investors Distribution Company, serves as the Distributor for the Trusts, and, as such, receives payments pursuant to Rule 12b-1 from the Portfolios to compensate it for providing shareholder services and selling activities, which could lead to growth in the Trusts’ assets and corresponding benefits from such growth, including economies of scale. The Board also considered that affiliates of the Adviser may benefit from certain indirect tax benefits relating to dividend received deductions and foreign tax credits. In conjunction with these considerations, the Board noted the costs of providing investment management and other services to the Portfolios and the ongoing commitment of the Adviser to the Portfolios.
The Board considered other benefits that may be realized by each Sub-Adviser and its affiliates from their relationship with the Trusts, including the opportunity to provide advisory services to additional portfolios of the Trusts and reputational benefits. In conjunction with these considerations, the Board noted the costs of providing investment advisory services to the Portfolios and the ongoing commitment of the Sub-Advisers to the Portfolios.
The Board considered possible conflicts of interest in the form of material benefits or detriments to the Trusts resulting from the nature of the Trusts’ and the Adviser’s or the Sub-Advisers’ affiliations and the services that are provided to the Trusts, and the manner in which such conflicts were mitigated.
MSF-25
Metropolitan Series Fund
T. Rowe Price Small Cap Growth Portfolio
Board of Trustees’ Consideration of Advisory and Sub-Advisory Agreements—(Continued)
Conclusions. After full consideration of the factors discussed above, the Board, including a majority of the Independent Trustees, approved the Advisory Agreement and the Sub-Advisory Agreement, as applicable, with respect to each Portfolio, unless otherwise noted. In making its approvals, the Board concluded that the nature, extent and quality of services provided by the Adviser and each Sub-Adviser supported the renewal of the Agreements. The Board also concluded that the investment performance of each Fund was such that each Agreement should continue. In addition, the Board concluded that fees paid by a Portfolio to the Adviser and, if applicable, the Sub-Adviser appeared to be acceptable in light of nature, extent and quality of the services provided by the Adviser and Sub-Adviser. Further, the Board concluded that the Adviser’s profitability in providing services under the Advisory Agreements did not appear unreasonably high in light of the nature, extent and quality of the services provided by the Adviser. Finally, the Board concluded that the Advisory and Sub-Advisory fees in some measure share economies of scale with contractholders. In approving the renewal of each of the Agreements, the Board, including the Independent Trustees, did not identify any single factor as controlling, and generally attributed different weights to various factors for the various Portfolios. The Board evaluated all information available to them on a Portfolio-by-Portfolio basis, and their decisions were made separately with respect to each Portfolio.
MSF-26
Metropolitan Series Fund
Van Eck Global Natural Resources Portfolio
Managed by Van Eck Associates Corporation
Portfolio Manager Commentary*
PERFORMANCE
For the one year period ended December 31, 2013, the Class A and B shares of the Van Eck Global Natural Resources Portfolio returned 11.06% and 10.76%, respectively. The Portfolio’s benchmark, the Standard & Poor’s (“S&P”) North American Natural Resources Sector Index1, returned 16.49%.
MARKET ENVIRONMENT / CONDITIONS
The most significant factor influencing the markets in which the Portfolio invested over the past 12 months was a deceleration in growth in the emerging markets that led to an underperformance of metals and mining shares and the commodities that industry produces relative to energy shares and energy related commodities.
Precious metals, including gold, but with the exception of palladium, and base metals suffered declines during the year. Copper and nickel, for example, experienced drops in price of 7.2% and 18.5% respectively. Corn and all the grains also declined over the 12-month period. On the other hand, West Texas Intermediate (WTI) crude prices increased 7.2% to end the year at $98.42 per barrel and North American natural gas was up significantly, albeit from a very low base.
PORTFOLIO REVIEW / PERIOD END POSITIONING
Two key aspects of the Portfolio that detracted from performance relative to its benchmark were an overweight position in Gold Miners, Diversified Metals & Mining, and Steel. The Portfolio’s weakest contributors were gold mining companies. The shares of the three weakest of these, Newmont Mining, New Gold, and Eldorado Gold, all dropped as weakness was seen in the gold mining sector broadly, driven by falling gold prices.
The three strongest positive-contributing sub-sectors to the Portfolio’s performance relative to the benchmark were Oil & Gas Exploration and Production, Precious Metals & Minerals, and Agricultural Products. Within the Oil and Gas sub-sector mentioned above, an overweight allocation and, even more, stock selection both contributed to performance. The Precious Metals & Minerals sub-sector consists mostly of silver mining stocks which had significant negative performance over the annual period, and to which the Portfolio had no exposure over that time frame which led to positive relative performance contribution. Shares of the two strongest contributors, Pioneer Natural Resources and Cimarex Energy, both Oil & Gas Exploration and Production companies, gained on strong drilling results and resource additions in the Permian Basin of West Texas. Shares of oilfield services giant Halliburton rose on strong revenue growth from North American unconventional drilling activities and continued expansion in international exploration and development operations. Conversely, the Portfolio had exposure to the Agricultural Products sub-sector, via its Archer-Daniels-Midland Co. position, which performed positively, and to which the benchmark index had no exposure during the 12-month period.
Significant purchases by the Portfolio were made in the Oil & Gas Refining and Marketing sub-sector, which saw the addition of shares in Phillips 66, Marathon Petroleum, and Delek. The Portfolio’s largest sales during the period were Diversified Metals & Mining companies Rio Tinto, BHP Billiton, and Freeport-McMoRan Copper & Gold (all eliminated from the Portfolio by period end). The Portfolio’s overall exposure to Diversified Metals & Mining was reduced because of slowing emerging market growth and weakness in base metal and bulk commodity prices. Exposure to Gold Miners was also reduced.
While the Portfolio’s allocation to the Energy sector trended higher overall, within the sector itself, the Oil & Gas Refining and Marketing sub-sector saw the most significant increase in allocation, with both the Oil & Gas Exploration and Production and Oil & Gas Equipment and Services sub-sectors also seeing increases. The Portfolio remained underweight relative to the benchmark in the Energy sector overall at the end of the annual period, but maintained one of the Portfolio’s highest historical energy allocations. Within Energy, the Portfolio was overweight the Oil & Gas Equipment and services, Oil & Gas Drilling, and Oil & Gas Exploration and Production sub-sectors. The Portfolio was also overweight the Diversified Metals & Mining and Agricultural Products sub-sectors as the benchmark has low exposures to these subsectors.
Charles Cameron
Shawn Reynolds
Portfolio Managers
Van Eck Associates Corporation
* This commentary may include statements that constitute “forward-looking statements” under the U.S. securities laws. Forward-looking statements include, among other things, projections, estimates, and information about possible or future results related to the Portfolio, market or regulatory developments. The views expressed above are not guarantees of future performance or economic results and involve certain risks, uncertainties and assumptions that could cause actual outcomes and results to differ materially from the views expressed herein. The views expressed above are subject to change at any time based upon economic, market, or other conditions and the subadvisory firm undertakes no obligation to update the views expressed herein. Any discussions of specific securities should not be considered a recommendation to buy or sell those securities. The views expressed above (including any forward-looking statement) may not be relied upon as investment advice or as an indication of the Portfolio’s trading intent. Information about the Portfolio’s holdings, asset allocation or country diversification is historical and is not an indication of future Portfolio composition, which may vary. Direct investment in any index is not possible. The performance of any index mentioned in this commentary has not been adjusted for ongoing management, distribution and operating expenses, and sales charges applicable to mutual fund investments. In addition, the returns do not reflect additional fees charged by separate accounts or variable insurance contracts that an investor in the Portfolio may pay. If these additional fees were reflected, performance would have been lower.
MSF-1
Metropolitan Series Fund
Van Eck Global Natural Resources Portfolio
A $10,000 INVESTMENT COMPARED TO THE S&P NORTH AMERICAN NATURAL RESOURCES SECTOR INDEX

AVERAGE ANNUAL RETURNS (%) (FOR THE YEAR ENDED DECEMBER 31, 2013)
| | | | | | | | | | | | |
| | | 1 Year | | | 5 Year | | | Since Inception2 | |
| Van Eck Global Natural Resources Portfolio | | | | | | | | | | | | |
Class A | | | 11.06 | | | | 13.88 | | | | 12.75 | |
Class B | | | 10.76 | | | | — | | | | 12.43 | |
| S&P North American Natural Resources Sector Index | | | 16.49 | | | | 13.45 | | | | 12.09 | |
1 The S&P North American Natural Resources Sector Index was developed as an equity benchmark for U.S. traded natural resource related stocks.
2 Inception dates of the Class A and Class B shares are 10/31/08 and 4/28/09, respectively. Index since inception return is based on the Class A inception date.
Portfolio performance is calculated including reinvestment of all income and capital gain distributions. Performance numbers are net of all Portfolio expenses but do not include any insurance, sales, separate account or administrative charges of variable annuity or life insurance contracts or any additional expenses that participants may bear relating to the operations of their plans. If these charges were included, the returns would be lower. The performance of any index referenced above has not been adjusted for ongoing management, distribution and operating expenses, and sales charges applicable to mutual fund investments. Direct investment in any index is not possible. The performance of Class A shares, as set forth in the line graph above, will differ from that of other classes because of the difference in expenses paid by policyholders investing in the different share classes.
This information represents past performance and is not indicative of future results. Investment return and principal value may fluctuate so that shares, upon redemption, may be worth more or less than the original cost.
PORTFOLIO COMPOSITION AS OF DECEMBER 31, 2013
Top Holdings
| | | | |
| | |
% of
Net Assets | |
| GlencoreXstrata plc | | | 5.1 | |
| Schlumberger, Ltd. | | | 3.9 | |
| Halliburton Co. | | | 3.8 | |
| CONSOL Energy, Inc. | | | 3.7 | |
| Cimarex Energy Co. | | | 3.7 | |
| Concho Resources, Inc. | | | 3.6 | |
| Pioneer Natural Resources Co. | | | 3.5 | |
| Marathon Oil Corp. | | | 3.3 | |
| First Quantum Minerals, Ltd. | | | 3.1 | |
| Anadarko Petroleum Corp. | | | 3.0 | |
Top Sectors
| | | | |
| | | % of
Market Value of
Total Long-Term Investments | |
| Energy | | | 81.1 | |
| Materials | | | 15.7 | |
| Industrials | | | 2.5 | |
| Consumer Staples | | | 0.7 | |
MSF-2
Metropolitan Series Fund
Van Eck Global Natural Resources Portfolio
Understanding Your Portfolio’s Expenses
Shareholder Expense Example
As a shareholder of the Portfolio, you incur ongoing costs, including management fees; distribution and service (12b-1) fees; and other Portfolio expenses. This example is intended to help you understand your ongoing costs (in dollars) (referred to as “expenses”) of investing in the Portfolio and compare these costs with the ongoing costs of investing in other mutual funds. The example is based on an investment of $1,000 invested at the beginning of the period and held for the entire period, July 1, 2013 through December 31, 2013.
Actual Expenses
The first line for each share class of the Portfolio in the table below provides information about actual account values and actual expenses. You may use the information in this line, together with the amount you invested in the particular share class of the Portfolio, to estimate the expenses that you paid over the period. Simply divide your account value by $1,000 (for example, an $8,600 account value divided by $1,000 = 8.6), then multiply the result by the number in the first line under the heading entitled “Expenses Paid During Period” to estimate the expenses you paid on your account during this period.
Hypothetical Example for Comparison Purposes
The second line for each share class of the Portfolio in the table below provides information about hypothetical account values and hypothetical expenses based on the Portfolio’s actual expense ratio and an assumed rate of return of 5% per year before expenses, which is not the Portfolio’s actual return. The hypothetical account values and expenses may not be used to estimate the actual ending account balance or expenses you paid for the period. You may use this information to compare the ongoing costs of investing in the Portfolio and other funds. To do so, compare this 5% hypothetical example with the 5% hypothetical examples that appear in the shareholder reports of the other funds.
Please note that the expenses shown in the table are meant to highlight your ongoing costs only and do not reflect any fees or charges of your variable insurance product or any additional expenses that participants in certain eligible qualified plans may bear relating to the operations of their plan. Therefore, the second line for each share class in the table is useful in comparing ongoing costs only, and will not help you determine the relative total costs of owning different funds. In addition, if these other costs were included, your costs would have been higher.
| | | | | | | | | | | | | | | | | | |
Van Eck Global Natural Resources Portfolio | | | | Annualized
Expense
Ratio | | | Beginning
Account Value
July 1,
2013 | | | Ending
Account Value
December 31,
2013 | | | Expenses Paid
During Period**
July 1, 2013
to
December 31,
2013 | |
Class A(a) | | Actual | | | 0.79 | % | | $ | 1,000.00 | | | $ | 1,164.80 | | | $ | 4.31 | |
| | Hypothetical* | | | 0.79 | % | | $ | 1,000.00 | | | $ | 1,021.22 | | | $ | 4.02 | |
| | | | | |
Class B(a) | | Actual | | | 1.04 | % | | $ | 1,000.00 | | | $ | 1,163.10 | | | $ | 5.67 | |
| | Hypothetical* | | | 1.04 | % | | $ | 1,000.00 | | | $ | 1,019.96 | | | $ | 5.30 | |
* Hypothetical assumes a rate of return of 5% per year before expenses.
** Expenses paid are equal to the Portfolio’s annualized expense ratio for the most recent six month period, as shown above, multiplied by the average account value over the period, multiplied by the number of days (184 days) in the most recent fiscal half-year, divided by 365 (to reflect the one-half year period).
(a) The annualized expense ratio shown reflects the impact of the management fee waiver as described in Note 5 of the Notes to Financial Statements.
MSF-3
Metropolitan Series Fund
Van Eck Global Natural Resources Portfolio
Schedule of Investments as of December 31, 2013
Common Stocks—93.7% of Net Assets
| | | | | | | | |
| Security Description | |
Shares | | | Value | |
|
Chemicals—1.4% | |
Agrium, Inc. (a) | | | 177,100 | | | $ | 16,201,108 | |
| | | | | | | | |
|
Construction & Engineering—0.7% | |
Jacobs Engineering Group, Inc. (b) | | | 143,200 | | | | 9,020,168 | |
| | | | | | | | |
|
Energy Equipment & Services—22.3% | |
Atwood Oceanics, Inc. (b) | | | 406,300 | | | | 21,692,357 | |
Cameron International Corp. (b) | | | 581,200 | | | | 34,598,836 | |
Diamond Offshore Drilling, Inc. (a) | | | 174,700 | | | | 9,943,924 | |
Dril-Quip, Inc. (b) | | | 215,900 | | | | 23,733,887 | |
Halliburton Co. | | | 874,500 | | | | 44,380,875 | |
Nabors Industries, Ltd. | | | 212,300 | | | | 3,606,977 | |
National Oilwell Varco, Inc. | | | 433,400 | | | | 34,468,302 | |
Noble Corp. plc | | | 402,300 | | | | 15,074,181 | |
Schlumberger, Ltd. | | | 511,000 | | | | 46,046,210 | |
Seadrill, Ltd. (a) | | | 263,024 | | | | 10,805,026 | |
Superior Energy Services, Inc. (b) | | | 685,700 | | | | 18,246,477 | |
| | | | | | | | |
| | | | | | | 262,597,052 | |
| | | | | | | | |
|
Food Products—0.7% | |
Archer-Daniels-Midland Co. | | | 187,200 | | | | 8,124,480 | |
| | | | | | | | |
|
Machinery—1.6% | |
Cummins, Inc. | | | 134,100 | | | | 18,904,077 | |
| | | | | | | | |
|
Metals & Mining—16.0% | |
African Minerals, Ltd. (b) | | | 800,198 | | | | 2,644,340 | |
Eldorado Gold Corp. | | | 1,764,900 | | | | 10,042,281 | |
First Quantum Minerals, Ltd. | | | 2,056,200 | | | | 37,049,346 | |
GlencoreXstrata plc | | | 11,547,837 | | | | 60,031,722 | |
Goldcorp, Inc. | | | 572,600 | | | | 12,408,242 | |
Kinross Gold Corp. | | | 1,213,804 | | | | 5,316,461 | |
New Gold, Inc. (b) | | | 1,937,800 | | | | 10,154,072 | |
Newmont Mining Corp. | | | 576,600 | | | | 13,279,098 | |
Randgold Resources, Ltd. (ADR) | | | 239,700 | | | | 15,055,557 | |
Steel Dynamics, Inc. | | | 520,500 | | | | 10,170,570 | |
United States Steel Corp. (a) | | | 420,100 | | | | 12,392,950 | |
| | | | | | | | |
| | | | | | | 188,544,639 | |
| | | | | | | | |
|
Oil, Gas & Consumable Fuels—49.3% | |
Afren plc (b) | | | 8,328,101 | | | | 23,341,874 | |
Alpha Natural Resources, Inc. (a) (b) | | | 270,220 | | | | 1,929,371 | |
Anadarko Petroleum Corp. | | | 448,850 | | | | 35,602,782 | |
Cimarex Energy Co. | | | 416,800 | | | | 43,726,488 | |
Cloud Peak Energy, Inc. (b) | | | 321,900 | | | | 5,794,200 | |
Concho Resources, Inc. (b) | | | 387,450 | | | | 41,844,600 | |
CONSOL Energy, Inc. | | | 1,152,000 | | | | 43,822,080 | |
Delek U.S. Holdings, Inc. | | | 385,100 | | | | 13,251,291 | |
Diamondback Energy, Inc. (b) | | | 255,800 | | | | 13,521,588 | |
EOG Resources, Inc. | | | 187,400 | | | | 31,453,216 | |
Genel Energy plc (b) | | | 376,100 | | | | 6,710,782 | |
Green Plains Renewable Energy, Inc. (a) | | | 69,100 | | | | 1,339,849 | |
Gulfport Energy Corp. (b) | | | 105,000 | | | | 6,630,750 | |
Halcon Resources Corp. (a) (b) | | | 1,475,900 | | | | 5,696,974 | |
|
Oil, Gas & Consumable Fuels—(Continued) | |
HollyFrontier Corp. (a) | | | 597,000 | | | | 29,664,930 | |
Marathon Oil Corp. | | | 1,091,800 | | | | 38,540,540 | |
Marathon Petroleum Corp. | | | 312,800 | | | | 28,693,144 | |
Newfield Exploration Co. (b) | | | 558,800 | | | | 13,763,244 | |
Occidental Petroleum Corp. | | | 336,100 | | | | 31,963,110 | |
Ophir Energy plc (a) (b) | | | 2,277,903 | | | | 12,461,725 | |
Phillips 66 | | | 399,900 | | | | 30,844,287 | |
Pioneer Natural Resources Co. | | | 221,800 | | | | 40,826,726 | |
Scorpio Tankers, Inc. | | | 450,600 | | | | 5,312,574 | |
SM Energy Co. | | | 411,800 | | | | 34,224,698 | |
Tesoro Corp. | | | 509,600 | | | | 29,811,600 | |
Whiting Petroleum Corp. (b) | | | 153,502 | | | | 9,497,169 | |
| | | | | | | | |
| | | | | | | 580,269,592 | |
| | | | | | | | |
|
Paper & Forest Products—1.7% | |
Louisiana-Pacific Corp. (b) | | | 1,099,700 | | | | 20,355,447 | |
| | | | | | | | |
Total Common Stocks
(Cost $1,032,140,115) | | | | | | | 1,104,016,563 | |
| | | | | | | | |
|
| Investment Company Security—0.8% | |
SPDR Gold Shares (a) (b)
(Cost $12,151,662) | | | 84,800 | | | | 9,851,216 | |
| | | | | | | | |
|
| Warrant—0.0% | |
|
Metals & Mining—0.0% | |
Kinross Gold Corp., Strike Price $21.70, Expires 09/17/14 (b)
(Cost $140,490) | | | 29,480 | | | | 416 | |
| | | | | | | | |
|
| Short-Term Investments—10.5% | |
|
Mutual Funds—10.5% | |
AIM STIT-STIC Prime Portfolio | | | 65,237,344 | | | | 65,237,344 | |
State Street Navigator Securities Lending MET Portfolio (c) | | | 57,884,363 | | | | 57,884,363 | |
| | | | | | | | |
Total Short-Term Investments
(Cost $123,121,707) | | | | | | | 123,121,707 | |
| | | | | | | | |
Total Investments—105.0%
(Cost $1,167,553,974) (d) | | | | | | | 1,236,989,902 | |
Other assets and liabilities
(net)—(5.0)% | | | | | | | (59,337,981 | ) |
| | | | | | | | |
| Net Assets—100.0% | | | | | | $ | 1,177,651,921 | |
| | | | | | | | |
| (a) | All or a portion of the security was held on loan. As of December 31, 2013, the market value of securities loaned was $57,323,598 and the collateral received consisted of cash in the amount of $57,884,363 and non-cash collateral with a value of $711,722. The cash collateral is invested in a money market fund managed by an affiliate of the custodian. The non-cash collateral received consists primarily of |
MSF-4
Metropolitan Series Fund
Van Eck Global Natural Resources Portfolio
Schedule of Investments as of December 31, 2013
| | government securities and bank letters of credit, and is held for the benefit of the Portfolio at the Portfolio’s custodian. The Portfolio cannot repledge or resell this collateral. As such, this collateral is excluded from the Statement of Assets and Liabilities. |
| (b) | Non-income producing security. |
| (c) | Represents investment of cash collateral received from securities lending transactions. |
| (d) | As of December 31, 2013, the aggregate cost of investments for federal income tax purposes was $1,170,168,423. The aggregate unrealized appreciation and depreciation of investments were $167,702,343 and $(100,880,864), respectively, resulting in net unrealized appreciation of $66,821,479 for federal income tax purposes. |
| (ADR)— | An American Depositary Receipt is a certificate issued by a custodian bank representing the right to receive securities of the foreign issuer described. Trading on exchanges not located in the United States or Canada significantly influences the value of ADRs. |
Fair Value Hierarchy
Accounting principles generally accepted in the United States of America (“GAAP”) define fair market value as the price that the Portfolio would receive to sell an asset or pay to transfer a liability in an orderly transaction between market participants at the measurement date. It establishes a fair value hierarchy that prioritizes inputs to valuation methods and requires disclosure of the fair value hierarchy that segregates fair value measurements into three levels. Levels 1, 2 and 3 of the fair value hierarchy are defined as follows:
Level 1 - unadjusted quoted prices in active markets for identical investments
Level 2 - other significant observable inputs (including, but not limited to, unadjusted quoted prices for similar investments in markets that are either active or inactive; inputs other than quoted prices that are observable such as interest rates, yield curves, volatilities, prepayment speeds, loss severities, credit risks, default rates, etc.)
Level 3 - significant unobservable inputs based on the best information available in the circumstances, to the extent observable inputs are unavailable (including the Portfolio’s own assumptions in determining the fair value of investments)
The inputs or methodologies used for valuing investments are not necessarily an indication of the risk associated with investing in them. Changes to the inputs or methodologies used may result in transfers between levels, which will be recognized as of the beginning of the reporting period. Information on transfers between Level 1 and Level 2, if any, will be disclosed following the fair value hierarchy table below. A reconciliation of Level 3 securities, if any, will also be disclosed following the fair value hierarchy table. For more information about the Portfolio’s policy regarding the valuation of investments, please refer to the Notes to Financial Statements.
The following table summarizes the fair value hierarchy of the Portfolio’s investments as of December 31, 2013:
| | | | | | | | | | | | | | | | |
| Description | | Level 1 | | | Level 2 | | | Level 3 | | | Total | |
| Common Stocks | | | | | | | | | | | | | | | | |
Chemicals | | $ | 16,201,108 | | | $ | — | | | $ | — | | | $ | 16,201,108 | |
Construction & Engineering | | | 9,020,168 | | | | — | | | | — | | | | 9,020,168 | |
Energy Equipment & Services | | | 262,597,052 | | | | — | | | | — | | | | 262,597,052 | |
Food Products | | | 8,124,480 | | | | — | | | | — | | | | 8,124,480 | |
Machinery | | | 18,904,077 | | | | — | | | | — | | | | 18,904,077 | |
Metals & Mining | | | 125,868,577 | | | | 62,676,062 | | | | — | | | | 188,544,639 | |
Oil, Gas & Consumable Fuels | | | 537,755,211 | | | | 42,514,381 | | | | — | | | | 580,269,592 | |
Paper & Forest Products | | | 20,355,447 | | | | — | | | | — | | | | 20,355,447 | |
Total Common Stocks | | | 998,826,120 | | | | 105,190,443 | | | | — | | | | 1,104,016,563 | |
Total Investment Company Security | | | 9,851,216 | | | | — | | | | — | | | | 9,851,216 | |
Total Warrant* | | | 416 | | | | — | | | | — | | | | 416 | |
Total Short-Term Investments* | | | 123,121,707 | | | | — | | | | — | | | | 123,121,707 | |
Total Investments | | $ | 1,131,799,459 | | | $ | 105,190,443 | | | $ | — | | | $ | 1,236,989,902 | |
| | | | | | | | | | | | | | | | | |
Collateral for securities loaned (Liability) | | $ | — | | | $ | (57,884,363 | ) | | $ | — | | | $ | (57,884,363 | ) |
| * | See Schedule of Investments for additional detailed categorizations. |
See accompanying notes to financial statements.
MSF-5
Metropolitan Series Fund
Van Eck Global Natural Resources Portfolio
Statement of Assets and Liabilities
December 31, 2013
| | | | |
Assets | | | | |
Investments at value (a) (b) | | $ | 1,236,989,902 | |
Cash denominated in foreign currencies (c) | | | 6,308,053 | |
Receivable for: | | | | |
Fund shares sold | | | 80,175 | |
Dividends and interest | | | 609,176 | |
Prepaid expenses | | | 2,820 | |
| | | | |
Total Assets | | | 1,243,990,126 | |
Liabilities | | | | |
Collateral for securities loaned | | | 57,884,363 | |
Payables for: | | | | |
Investments purchased | | | 7,428,345 | |
Fund shares redeemed | | | 126,580 | |
Accrued Expenses: | | | | |
Management fees | | | 747,177 | |
Distribution and service fees | | | 33,038 | |
Deferred trustees’ fees | | | 48,554 | |
Other expenses | | | 70,148 | |
| | | | |
Total Liabilities | | | 66,338,205 | |
| | | | |
Net Assets | | $ | 1,177,651,921 | |
| | | | |
Net Assets Consist of: | | | | |
Paid in surplus | | $ | 1,086,229,686 | |
Undistributed net investment income | | | 4,260,240 | |
Accumulated net realized gain | | | 17,926,824 | |
Unrealized appreciation on investments and foreign currency transactions | | | 69,235,171 | |
| | | | |
Net Assets | | $ | 1,177,651,921 | |
| | | | |
Net Assets | | | | |
Class A | | $ | 1,018,813,802 | |
Class B | | | 158,838,119 | |
Capital Shares Outstanding* | | | | |
Class A | | | 71,707,739 | |
Class B | | | 11,248,459 | |
Net Asset Value, Offering Price and Redemption Price Per Share | | | | |
Class A | | $ | 14.21 | |
Class B | | | 14.12 | |
| * | The Portfolio is authorized to issue an unlimited number of shares. |
| (a) | Identified cost of investments was $1,167,553,974. |
| (b) | Includes securities loaned at value of $57,323,598. |
| (c) | Identified cost of cash denominated in foreign currencies was $6,508,810. |
Statement of Operations
Year Ended December 31, 2013
| | | | |
Investment Income | | | | |
Dividends (a) | | $ | 14,931,937 | |
Interest | | | 40,320 | |
Securities lending income | | | 529,706 | |
| | | | |
Total investment income | | | 15,501,963 | |
| | | | |
Expenses | | | | |
Management fees | | | 8,450,531 | |
Administration fees | | | 15,364 | |
Custodian and accounting fees | | | 130,692 | |
Distribution and service fees—Class B | | | 413,987 | |
Audit and tax services | | | 49,423 | |
Legal | | | 27,754 | |
Trustees’ fees and expenses | | | 39,105 | |
Shareholder reporting | | | 32,510 | |
Insurance | | | 5,602 | |
Miscellaneous | | | 12,665 | |
| | | | |
Total expenses | | | 9,177,633 | |
Less management fee waiver | | | (124,763 | ) |
Less broker commission recapture | | | (46,730 | ) |
| | | | |
Net expenses | | | 9,006,140 | |
| | | | |
Net Investment Income | | | 6,495,823 | |
| | | | |
Net Realized and Unrealized Gain | | | | |
| Net realized gain on: | | | | |
Investments | | | 22,724,642 | |
Foreign currency transactions | | | 31,276 | |
| | | | |
Net realized gain | | | 22,755,918 | |
| | | | |
| Net change in unrealized appreciation (depreciation) on: | | | | |
Investments | | | 93,417,046 | |
Foreign currency transactions | | | (445,389 | ) |
| | | | |
Net change in unrealized appreciation | | | 92,971,657 | |
| | | | |
Net realized and unrealized gain | | | 115,727,575 | |
| | | | |
Net Increase in Net Assets From Operations | | $ | 122,223,398 | |
| | | | |
| (a) | Net of foreign withholding taxes of $158,181. |
MSF-6
Metropolitan Series Fund
Van Eck Global Natural Resources Portfolio
Statements of Changes in Net Assets
| | | | | | | | |
| | | Year Ended
December 31,
2013 | | | Year Ended
December 31,
2012 | |
Increase (Decrease) in Net Assets: | | | | | | | | |
From Operations | | | | | | | | |
Net investment income | | $ | 6,495,823 | | | $ | 8,719,283 | |
Net realized gain (loss) | | | 22,755,918 | | | | (969,402 | ) |
Net change in unrealized appreciation | | | 92,971,657 | | | | 23,458,145 | |
| | | | | | | | |
Increase in net assets from operations | | | 122,223,398 | | | | 31,208,026 | |
| | | | | | | | |
From Distributions to Shareholders | | | | | | | | |
Net investment income | | | | | | | | |
Class A | | | (8,129,244 | ) | | | 0 | |
Class B | | | (1,089,226 | ) | | | 0 | |
Net realized capital gains | | | | | | | | |
Class A | | | 0 | | | | (52,987,301 | ) |
Class B | | | 0 | | | | (11,368,332 | ) |
| | | | | | | | |
Total distributions | | | (9,218,470 | ) | | | (64,355,633 | ) |
| | | | | | | | |
Increase in net assets from capital share transactions | | | 71,526,494 | | | | 177,600,606 | |
| | | | | | | | |
Total increase in net assets | | | 184,531,422 | | | | 144,452,999 | |
| | |
Net Assets | | | | | | | | |
Beginning of period | | | 993,120,499 | | | | 848,667,500 | |
| | | | | | | | |
End of period | | $ | 1,177,651,921 | | | $ | 993,120,499 | |
| | | | | | | | |
Undistributed net investment income | | | | | | | | |
End of period | | $ | 4,260,240 | | | $ | 4,569,274 | |
| | | | | | | | |
Other Information:
Capital Shares
Transactions in capital shares were as follows:
| | | | | | | | | | | | | | | | |
| | | Year Ended
December 31, 2013 | | | Year Ended
December 31, 2012 | |
| | | Shares | | | Value | | | Shares | | | Value | |
Class A | | | | | | | | | | | | | | | | |
Sales | | | 8,667,519 | | | $ | 109,883,439 | | | | 10,241,510 | | | $ | 128,869,403 | |
Reinvestments | | | 680,841 | | | | 8,129,244 | | | | 4,063,443 | | | | 52,987,301 | |
Redemptions | | | (1,759,833 | ) | | | (23,803,281 | ) | | | (1,659,535 | ) | | | (22,122,249 | ) |
| | | | | | | | | | | | | | | | |
Net increase | | | 7,588,527 | | | $ | 94,209,402 | | | | 12,645,418 | | | $ | 159,734,455 | |
| | | | | | | | | | | | | | | | |
Class B | | | | | | | | | | | | | | | | |
Sales | | | 1,616,477 | | | $ | 20,813,286 | | | | 2,753,099 | | | $ | 34,272,305 | |
Reinvestments | | | 91,609 | | | | 1,089,226 | | | | 875,835 | | | | 11,368,332 | |
Redemptions | | | (3,320,396 | ) | | | (44,585,420 | ) | | | (2,125,642 | ) | | | (27,774,486 | ) |
| | | | | | | | | | | | | | | | |
Net increase (decrease) | | | (1,612,310 | ) | | $ | (22,682,908 | ) | | | 1,503,292 | | | $ | 17,866,151 | |
| | | | | | | | | | | | | | | | |
Increase derived from capital shares transactions | | | | | | $ | 71,526,494 | | | | | | | $ | 177,600,606 | |
| | | | | | | | | | | | | | | | |
See accompanying notes to financial statements.
MSF-7
Metropolitan Series Fund
Van Eck Global Natural Resources Portfolio
Financial Highlights
| | | | | | | | | | | | | | | | | | | | |
| Selected per share data | | | | | | | | | | | | | | | |
| | | Class A | |
| | | Year Ended December 31, | |
| | | 2013 | | | 2012 | | | 2011 | | | 2010 | | | 2009 | |
Net Asset Value, Beginning of Period | | $ | 12.91 | | | $ | 13.52 | | | $ | 18.06 | | | $ | 15.05 | | | $ | 9.71 | |
| | | | | | | | | | | | | | | | | | | | |
Income (Loss) from Investment Operations | | | | | | | | | | | | | | | | | | | | |
Net investment income (a) | | | 0.08 | | | | 0.13 | | | | 0.04 | | | | 0.01 | | | | 0.01 | |
Net realized and unrealized gain (loss) on investments | | | 1.34 | | | | 0.25 | | | | (2.56 | ) | | | 4.19 | | | | 5.34 | |
| | | | | | | | | | | | | | | | | | | | |
Total from investment operations | | | 1.42 | | | | 0.38 | | | | (2.52 | ) | | | 4.20 | | | | 5.35 | |
| | | | | | | | | | | | | | | | | | | | |
Less Distributions | | | | | | | | | | | | | | | | | | | | |
Distributions from net investment income | | | (0.12 | ) | | | 0.00 | | | | (0.24 | ) | | | (0.08 | ) | | | (0.01 | ) |
Distributions from net realized capital gains | | | 0.00 | | | | (0.99 | ) | | | (1.78 | ) | | | (1.11 | ) | | | 0.00 | |
| | | | | | | | | | | | | | | | | | | | |
Total distributions | | | (0.12 | ) | | | (0.99 | ) | | | (2.02 | ) | | | (1.19 | ) | | | (0.01 | ) |
| | | | | | | | | | | | | | | | | | | | |
Net Asset Value, End of Period | | $ | 14.21 | | | $ | 12.91 | | | $ | 13.52 | | | $ | 18.06 | | | $ | 15.05 | |
| | | | | | | | | | | | | | | | | | | | |
Total Return (%) (b) | | | 11.06 | | | | 2.80 | | | | (16.45 | ) | | | 29.39 | | | | 55.19 | |
| | | | | |
Ratios/Supplemental Data | | | | | | | | | | | | | | | | | | | | |
Gross ratio of expenses to average net assets (%) | | | 0.81 | | | | 0.82 | | | | 0.82 | | | | 0.84 | | | | 0.85 | |
Net ratio of expenses to average net assets (%) (c) | | | 0.80 | | | | 0.82 | | | | 0.82 | | | | 0.84 | | | | 0.85 | |
Ratio of net investment income to average net assets (%) | | | 0.64 | | | | 0.98 | | | | 0.25 | | | | 0.10 | | | | 0.07 | |
Portfolio turnover rate (%) | | | 36 | | | | 23 | | | | 42 | | | | 72 | | | | 101 | |
Net assets, end of period (in millions) | | $ | 1,018.8 | | | $ | 828.1 | | | $ | 695.7 | | | $ | 575.6 | | | $ | 426.4 | |
| | | | | | | | | | | | | | | | | | | | |
| | | Class B | |
| | | Year Ended December 31, | |
| | | 2013 | | | 2012 | | | 2011 | | | 2010 | | | 2009(d) | |
Net Asset Value, Beginning of Period | | $ | 12.83 | | | $ | 13.47 | | | $ | 18.01 | | | $ | 15.03 | | | $ | 10.61 | |
| | | | | | | | | | | | | | | | | | | | |
Income (Loss) from Investment Operations | | | | | | | | | | | | | | | | | | | | |
Net investment income (loss) (a) | | | 0.05 | | | | 0.09 | | | | 0.00 | (e) | | | (0.01 | ) | | | (0.04 | ) |
Net realized and unrealized gain (loss) on investments | | | 1.33 | | | | 0.26 | | | | (2.55 | ) | | | 4.15 | | | | 4.46 | |
| | | | | | | | | | | | | | | | | | | | |
Total from investment operations | | | 1.38 | | | | 0.35 | | | | (2.55 | ) | | | 4.14 | | | | 4.42 | |
| | | | | | | | | | | | | | | | | | | | |
Less Distributions | | | | | | | | | | | | | | | | | | | | |
Distributions from net investment income | | | (0.09 | ) | | | 0.00 | | | | (0.21 | ) | | | (0.05 | ) | | | 0.00 | |
Distributions from net realized capital gains | | | 0.00 | | | | (0.99 | ) | | | (1.78 | ) | | | (1.11 | ) | | | 0.00 | |
| | | | | | | | | | | | | | | | | | | | |
Total distributions | | | (0.09 | ) | | | (0.99 | ) | | | (1.99 | ) | | | (1.16 | ) | | | 0.00 | |
| | | | | | | | | | | | | | | | | | | | |
Net Asset Value, End of Period | | $ | 14.12 | | | $ | 12.83 | | | $ | 13.47 | | | $ | 18.01 | | | $ | 15.03 | |
| | | | | | | | | | | | | | | | | | | | |
Total Return (%) (b) | | | 10.76 | | | | 2.58 | | | | (16.67 | ) | | | 29.02 | | | | 41.66 | (f) |
| | | | | |
Ratios/Supplemental Data | | | | | | | | | | | | | | | | | | | | |
Gross ratio of expenses to average net assets (%) | | | 1.06 | | | | 1.07 | | | | 1.07 | | | | 1.09 | | | | 1.10 | (g) |
Net ratio of expenses to average net assets (%) (c) | | | 1.05 | | | | 1.07 | | | | 1.07 | | | | 1.09 | | | | 1.10 | (g) |
Ratio of net investment income (loss) to average net assets (%) | | | 0.38 | | | | 0.72 | | | | 0.01 | | | | (0.09 | ) | | | (0.47 | )(g) |
Portfolio turnover rate (%) | | | 36 | | | | 23 | | | | 42 | | | | 72 | | | | 101 | |
Net assets, end of period (in millions) | | $ | 158.8 | | | $ | 165.1 | | | $ | 153.0 | | | $ | 108.0 | | | $ | 24.9 | |
| (a) | Per share amounts based on average shares outstanding during the period. |
| (b) | Total return does not reflect any insurance, sales, separate account or administrative charges of variable annuity or life insurance contracts or any additional expenses that contract owners may bear under their variable contracts. If these charges were included, the returns would be lower. |
| (c) | Net ratio of expenses to average net assets in 2013 includes the effect of management fee waivers as detailed in Note 5 of the Notes to Financial Statements. Net ratio of expenses to average net assets for the period 2009 through 2010 includes the effect of an expense limitation agreement which expired during 2010. |
| (d) | Commencement of operations was April 28, 2009. |
| (e) | Net investment income (loss) was less than $0.01. |
| (f) | Periods less than one year are not computed on an annualized basis. |
| (g) | Computed on an annualized basis. |
See accompanying notes to financial statements.
MSF-8
Metropolitan Series Fund
Van Eck Global Natural Resources Portfolio
Notes to Financial Statements—December 31, 2013
1. Organization
Metropolitan Series Fund (the “Trust”) is organized as a Delaware statutory trust and registered under the Investment Company Act of 1940, as amended (the “1940 Act”), as an open-end management investment company. The Trust is currently comprised of thirty series, each of which operates as a distinct investment vehicle of the Trust. The portfolio included in this report is Van Eck Global Natural Resources Portfolio (the “Portfolio”), which is diversified. Shares in the Portfolio are not offered directly to the general public and are currently available only to separate accounts established by Metropolitan Life Insurance Company (“MetLife”) and other affiliated life insurance companies.
The Portfolio has registered and offers two classes of shares: Class A and B shares. Shares of each Class of the Portfolio represent an equal pro rata interest in the Portfolio and generally give the shareholder the same voting, dividend, liquidation, and other rights. Investment income, realized and unrealized capital gains and losses, the common expenses of the Portfolio, and certain Portfolio-level expense reductions, if any, are allocated on a pro rata basis to each Class based on the relative net assets of each Class to the net assets of the Portfolio. Each Class of shares differs in its respective distribution plan and such distribution expenses are allocated to that Class.
2. Significant Accounting Policies
The preparation of financial statements in conformity with accounting principles generally accepted in the United States of America (“GAAP”) requires management to make estimates and assumptions that affect the reported amounts of assets and liabilities and disclosure of contingent assets and liabilities as of the date of the financial statements and the reported amounts of income and expenses during the reporting period. Actual results could differ from those estimates. In the preparation of these financial statements, management has evaluated events and transactions subsequent to December 31, 2013 through the date the financial statements were issued.
The following is a summary of significant accounting policies consistently followed by the Portfolio in the preparation of its financial statements.
Investment Valuation and Fair Value Measurements - Debt securities (other than short term obligations with a remaining maturity of sixty days or less), including corporate, convertible and municipal bonds and notes; obligations of the U.S. treasury and U.S. government agencies; sovereign issues; floating rate loans; and non-U.S. bonds, are generally valued on the basis of evaluated or composite bid quotations obtained from independent pricing services and/or brokers and dealers selected by MetLife Advisers, LLC (“MetLife Advisers” or the “Adviser”), an affiliate of MetLife, Inc., pursuant to authorization of the Board of Trustees of the Trust (the “Board” or “Trustees”). Such quotations utilize matrix pricing, which considers observable inputs including, among other things, issuer details, maturity dates, interest rates, yield curves, rates of prepayment, credit risks/spreads, default rates, reported trades, broker dealer quotes and quoted prices for similar securities. Securities that use similar valuation techniques and inputs as described above are generally categorized as Level 2 within the fair value hierarchy.
Mortgage and asset-backed securities are usually issued as separate tranches, or classes, of securities within each deal. These securities are also generally valued on the basis of evaluated or composite bid quotations obtained from independent pricing services and/or brokers and dealers selected by the Adviser pursuant to authorization of the Board. The pricing models for these securities usually consider tranche-level attributes, estimated cash flows and market-based yield spreads for each tranche and current market data, and incorporate deal collateral performance, as available. Mortgage and asset-backed securities that use similar valuation techniques and inputs as described above are generally categorized as Level 2 within the fair value hierarchy.
Short term obligations with a remaining maturity of sixty days or less are generally valued at amortized cost, which approximates fair market value, and are generally categorized as Level 2 within the fair value hierarchy.
Domestic and foreign equity securities, such as common stock, exchange-traded funds, rights, warrants, and preferred stock, that are traded on a securities exchange, are generally valued at their last sale price on the exchange or market in which they are principally traded on the valuation date, or, if no sales occurred on that day, at the last reported bid price. Equity securities traded over-the-counter are generally valued at the last reported sale price. Valuation adjustments may be applied to certain foreign equity securities that are traded solely on foreign exchanges that close before the close of the U.S. market to account for the market movement between the close of the foreign exchanges and the close of the U.S. market. The Portfolio may use a systematic fair valuation model provided by an independent third party to value securities principally traded in these foreign markets in order to adjust for possible stale pricing that may occur between the close of the foreign exchanges and the time of the Portfolio valuation. Foreign equity securities using these valuation adjustments are generally categorized as Level 2 within the fair value hierarchy. Equity securities that are actively traded, and have no valuation adjustments applied, are categorized as Level 1 within the fair value hierarchy. Other equity securities traded on inactive markets, or valued in reference to similar instruments traded on active markets, are generally categorized as Level 2 within the fair value hierarchy.
MSF-9
Metropolitan Series Fund
Van Eck Global Natural Resources Portfolio
Notes to Financial Statements—December 31, 2013—(Continued)
Investments in registered open-end management investment companies are valued at reported net asset value per share on the valuation date and are categorized as Level 1 within the fair value hierarchy.
Forward foreign currency exchange contracts are valued through an independent pricing service based on the mean between closing bid and ask prices of the forward currency rates in the London foreign exchange markets on a daily basis as provided by a reliable bank or dealer. These contracts are generally categorized as Level 2 within the fair value hierarchy.
Options, whether on securities, indices, futures contracts, or otherwise, traded on exchanges are valued at the last sale price available as of the close of business on the valuation date or, if there is no such price available, at the mean between the last reported bid and ask prices. These types of options are categorized as Level 1 within the fair value hierarchy. Futures contracts, which are traded on commodity exchanges, are valued at their closing prices as of the close of such exchanges and are categorized as Level 1 within the fair value hierarchy.
Options and futures contracts that are traded over-the-counter are generally valued on the basis of quotations provided by broker-dealers or prices provided by pricing service providers who use a series of techniques, including simulation pricing models, to determine the value of the contracts. The pricing models use inputs that are observed from actively quoted markets such as issuer details, indices, spreads, interest rates, yield curves, credit curves, measures of volatility and exchange rates. These contracts are generally categorized as Level 2 within the fair value hierarchy.
If no current market value quotation or other observable inputs are readily available or market value quotations are deemed to be unreliable for a security, the fair value of the security will be determined in accordance with procedures approved by and under the general supervision of the Board. In such a circumstance, the Board has delegated the determination of the fair value of a security to a Valuation Committee (“Committee”) of MetLife Advisers. The Committee provides general pricing oversight and fair value pricing determinations related to portfolio securities and meets on a regular basis to review reports relating to the valuation of the securities in the Portfolio. The Board has delegated to State Street Bank and Trust Company, the Trust’s custodian (“custodian”), the responsibility for calculating the net asset values (“NAVs”) of the Trust’s Portfolios. The Committee is responsible for overseeing the calculation of the NAVs of the Portfolios by the custodian. The Committee also periodically reviews pricing vendors, including the vendor providing fair value pricing for the Portfolio’s foreign securities, and is responsible for overseeing the correction of pricing errors and addressing other pricing issues that arise in the ordinary course of business, such as making real-time fair value determinations, as necessary.
No single standard for determining the fair value of a security can be set forth because fair value depends upon the facts and circumstances with respect to each security. Information relating to any relevant factors may be obtained by the Committee from any appropriate source, including the subadviser of the Portfolio, the custodian, a pricing service, market maker and/or broker for such security or the issuer. Appropriate methodologies for determining fair value under particular circumstances may include: matrix pricing, comparisons of securities with comparable characteristics, value based on multiples of earnings, discount from market price of similar marketable securities or a combination of these and other methods. The Committee maintains a detailed report tracking each fair-valued security that compares the fair value price to the next available trade, vendor or broker price, and provides information on how close the fair value price was to the next quoted price. The Committee reviews a summary of such report monthly. On a quarterly basis, the Board is provided with the following for consideration and ratification or adjustment: (1) a memorandum summarizing the actions taken by the Committee in the prior quarter; and (2) a list of the Portfolio’s securities as of the most recent quarter-end for which market quotations were not readily available.
Investment Transactions and Related Investment Income - Portfolio security transactions are recorded on the trade date. Dividend income is recorded on the ex-dividend date or, for certain foreign securities, when notified. Interest income, which includes amortization of premium and accretion of discount on debt securities, is recorded on the accrual basis. Realized gains and losses on investments are determined on the identified cost basis, which is the same basis used for federal income tax purposes. Foreign income and foreign capital gains on some foreign securities may be subject to foreign taxes, which are accrued as applicable. These foreign taxes have been provided for in accordance with the Portfolio’s understanding of the applicable countries’ tax rules and rates.
Foreign Currency Translation - The books and records of the Portfolio are maintained in U.S. dollars. The values of securities, currencies, and other assets and liabilities denominated in currencies other than the U.S. dollar are translated into U.S. dollars based upon foreign exchange rates prevailing at the end of the period. Purchases and sales of investment securities, income, and expenses are translated on the respective dates of such transactions. Because the values of investment securities are translated at the foreign exchange rates prevailing at the end of the period, that portion of the results of operations arising from changes in exchange rates and that portion of the results of operations reflecting fluctuations arising from changes in market prices of the investment securities are not separated. Such fluctuations are included in the net realized and unrealized gain or loss on investments.
Net realized foreign exchange gains or losses arise from activity in forward foreign currency exchange contracts, sales of foreign currency, currency gains or losses realized between the trade and settlement dates on securities transactions, and the difference between the amounts of dividends, interest, and foreign withholding taxes recorded by the Portfolio and the U.S. dollar equivalent of
MSF-10
Metropolitan Series Fund
Van Eck Global Natural Resources Portfolio
Notes to Financial Statements—December 31, 2013—(Continued)
the amounts actually received or paid by the Portfolio. Net unrealized foreign exchange gains and losses arise from changes in the value of assets and liabilities, other than investment securities, resulting from changes in foreign exchange rates.
Income Taxes - It is the Portfolio’s policy to comply with the requirements of the Internal Revenue Code of 1986, as amended, and regulations thereunder, applicable to regulated investment companies and to distribute, with respect to each taxable year, all of its taxable income to shareholders. Therefore, no federal income tax provision is required. The Portfolio files U.S. federal tax returns. No income tax returns are currently under examination. The Portfolio’s federal tax returns for the prior three fiscal years remain subject to examination by the Internal Revenue Service. As of December 31, 2013, the Portfolio had no uncertain tax positions that would require financial statement recognition, or de-recognition or disclosure.
Dividends and Distributions to Shareholders - The Portfolio records dividends and distributions on the ex-dividend date. Net realized gains from security transactions (if any) are generally distributed annually to shareholders. The timing and characterization of certain income and capital gains distributions are determined in accordance with federal tax regulations that may differ from GAAP. Permanent book and tax basis differences relating to shareholder distributions will result in reclassification between under/over distributed net investment income, accumulated net realized gains/losses, and paid-in surplus. Book-tax differences are primarily due to foreign currency transactions, passive foreign investment companies (PFICs), and broker commission recapture reclasses. These adjustments have no impact on net assets or the results of operations.
Securities Lending - The Portfolio may lend its portfolio securities to certain qualified brokers who borrow securities in order to complete certain securities transactions. By lending its portfolio securities, the Portfolio attempts to increase its net investment income through the receipt of income on collateral held from securities on loan. Any gain or loss in the market price of the loaned securities that might occur and any interest earned or dividends declared during the term of the loan would accrue to the account of the Portfolio.
The Trust has entered into a securities lending arrangement with the custodian. Under this arrangement, the custodian is authorized to loan portfolio securities on the Portfolio’s behalf. In exchange, the Portfolio receives either cash or securities as collateral against the loaned securities. The Portfolio receives collateral at least equal to 102% of the market value of the loaned securities (105% for foreign equity securities), at each loan’s inception. Collateral representing at least 100% of the market value of the loaned securities must be maintained for the duration of the loan. A liability for cash collateral is reflected on the Statement of Assets and Liabilities, and is categorized as Level 2 within the fair value hierarchy. Cash collateral is generally invested in the State Street Navigator Securities Lending MET Portfolio (the “Navigator Portfolio”), a series of the State Street Navigator Securities Lending Trust that is managed by an affiliate of the custodian. The Navigator Portfolio is a registered money market fund that invests in a variety of high-quality, U.S. dollar-denominated instruments. If the market value of the collateral at the close of trading on a business day is less than 100% of the market value of the loaned securities at the close of trading on that day, the borrower shall be required to deliver, by the close of business on the following business day, an additional amount of collateral, so that the total amount of posted collateral is equal to at least 100% of the market value of all the loaned securities as of such preceding day. A portion of net income (income after the deduction of expenses and fees of the Navigator Portfolio) on the collateral is rebated to the borrower of the securities and the remainder is split between the custodian and the Portfolio. On loans collateralized by U.S. Treasuries, a fee is received from the borrower and is allocated between the Portfolio and the custodian. The risks associated with lending portfolio securities include, but are not limited to, possible delays in receiving additional collateral or in the recovery of the loaned securities, possible loss of rights in the collateral should the borrower fail financially, as well as risk of loss in the value of the collateral or the value of the investments made with the collateral. The lending agent has agreed to indemnify the Portfolio in the case of default of any securities borrower. Income received by the Portfolio in securities lending transactions during the year ended December 31, 2013 is reflected as Securities lending income on the Statement of Operations. Any outstanding loans by the Portfolio at December 31, 2013 are disclosed in the footnotes to the Schedule of Investments.
Directed Brokerage Agreement - The Trust has entered into a directed brokerage arrangement with State Street Global Markets (“SSGM”). Under this arrangement, the Portfolio directs certain trades to SSGM in return for a recapture credit. SSGM issues a cash rebate to the Portfolio. Amounts paid to the Portfolio are shown separately as broker commission recapture on the Statement of Operations of the Portfolio. Additionally, these amounts have been excluded from the calculation of the net ratio of expenses to average net assets presented in the Financial Highlights for each share class.
3. Certain Risks
Market Risk: In the normal course of business, the Portfolio invests in securities and enters into transactions where risks exist due to fluctuations in the market (market risk) or failure of the other party to a transaction to perform (credit and counterparty risk). The value of securities held by the Portfolio may decline in response to certain events, including those directly involving the companies whose securities are owned by the Portfolio; conditions affecting the general economy; overall market changes; local, regional or global political, social or economic instability; currency, interest rate, and price fluctuations.
Credit and Counterparty Risk: The Portfolio may be exposed to counterparty risk, or the risk that an entity with which the Portfolio has unsettled or open transactions may default. The potential loss could exceed the value of the financial assets and liabilities
MSF-11
Metropolitan Series Fund
Van Eck Global Natural Resources Portfolio
Notes to Financial Statements—December 31, 2013—(Continued)
recorded in the financial statements. Financial assets that potentially expose the Portfolio to credit and counterparty risk consist principally of cash due from counterparties and investments. The Portfolio manages counterparty risk by entering into agreements only with counterparties that it believes have the financial resources to honor their obligations and by monitoring the financial stability of those counterparties. The Portfolio’s investment adviser attempts to mitigate counterparty risk by (i) periodically assessing the creditworthiness of its trading partners, (ii) monitoring and/or limiting the amount of its net exposure to each individual counterparty based on its assessment, and (iii) requiring collateral from the counterparty for certain transactions. In order to preserve certain safeguards for non-standard settlement trades, the Portfolio restricts its exposure to credit and counterparty losses by entering into master netting agreements with counterparties (approved brokers) with whom it undertakes a significant volume of transactions. Master Agreements govern the terms of certain transactions, and reduce the counterparty risk associated with relevant transactions by specifying credit protection mechanisms and providing standardization that improves legal certainty. Master Agreements can also help limit counterparty risk by specifying collateral posting arrangements at pre-arranged exposure levels.
Repurchase agreements are primarily executed under Global Master Repurchase Agreements (“GMRAs”) or Master Repurchase Agreements (“MRAs”), which provide the rights to set-off. Each repurchase agreement is initially collateralized at the transaction level. In the event of default, the total market value exposure will be offset against collateral exchanged to date, which would result in a net receivable/(payable) that lwould be due from/to the counterparty. Securities pledged as collateral are noted in the Schedule of Investments.
Natural Resource and Foreign Investment Risk: The Portfolio may concentrate its investments in companies which are significantly engaged in the exploration, development, production and distribution of gold and other natural resources such as strategic and other metals, minerals, forest products, oil, natural gas and coal and by investing in gold bullion and coins. Since the Portfolio may concentrate, it may be subject to greater risks and market fluctuations than other more diversified portfolios. The production and marketing of gold and other natural resources may be affected by actions and changes in governments. In addition, gold and natural resources may be cyclical in nature. In addition, the investments by the Portfolio in foreign securities may involve risks not present in domestic investments. Since securities may be denominated in foreign currencies, may require settlement in foreign currencies and pay interest or dividends in foreign currencies, changes in the relationship of these foreign currencies to the U.S. dollar can significantly affect the value of the investments and earnings of the Portfolio. Foreign investments may also subject the Portfolio to foreign government exchange restrictions, expropriation, taxation or other political, social or economic developments, all of which could affect the market and/or credit risk of the investments. In addition to the risks described above, risks may arise from forward foreign currency contracts with respect to the potential inability of counterparties to meet the terms of their contracts.
Additional risks associated with each type of investment are described above within the respective security type notes. The Portfolio’s prospectus includes a discussion of the principal risks of investing in the Portfolio.
4. Investment Transactions
Aggregate cost of purchases and proceeds of sales of investment securities, excluding short-term securities, for the year ended December 31, 2013 were as follows:
| | | | | | | | | | | | |
Purchases | | | Sales | |
U.S. Government | | Non U.S. Government | | | U.S. Government | | | Non U.S. Government | |
| $0 | | $ | 449,145,253 | | | $ | 0 | | | $ | 363,705,990 | |
During the year ended December 31, 2013, the Portfolio engaged in security transactions with other affiliated portfolios. These amounted to $14,084,042 in purchases of investments, which are included above.
5. Investment Management Fees and Other Transactions with Affiliates
Investment Management Agreement - MetLife Advisers is the investment adviser to the Portfolio. The Trust has entered into an investment management agreement with MetLife Advisers with respect to the Portfolio. For providing investment management services to the Portfolio, MetLife Advisers receives monthly compensation at the following annual rates:
| | | | | | |
Management
Fees earned by
MetLife Advisers
for the year ended
December 31, 2013 | | % per annum | | | Average daily net assets |
| $8,450,531 | | | 0.800 | % | | Of the first $250 million |
| | | 0.775 | % | | Of the next $750 million |
| | | 0.750 | % | | On amounts in excess of $1 billion |
MSF-12
Metropolitan Series Fund
Van Eck Global Natural Resources Portfolio
Notes to Financial Statements—December 31, 2013—(Continued)
Certain officers and trustees of the Trust may also be officers of MetLife Advisers; however, such officers and trustees receive no compensation from the Trust.
MetLife Advisers has entered into an investment subadvisory agreement with respect to the Portfolio. Van Eck Associates Corp. is compensated by MetLife Advisers to provide subadvisory services for the Portfolio.
Management Fee Waivers - Pursuant to an expense agreement, MetLife Advisers has agreed, for the period January 1, 2013 through April 27, 2014, to reduce its advisory fees set out above under “Investment Management Agreement” for each class of the Portfolio as follows:
| | | | |
% per annum | | Average daily net assets | |
| 0.025% | | On amount over $ | 500 million and under $1 billion | |
Amounts waived for the year ended December 31, 2013 are shown as management fee waivers in the Statement of Operations.
Transfer Agency Agreement - MetLife serves as the transfer agent for the Trust. MetLife receives no fees for its services to the Trust under the transfer agency agreement.
Distribution and Service Fees - The Trust has a distribution agreement with MetLife Investors Distribution Company (“MIDC” or the “Distributor”) in which MIDC serves as the distributor for the Portfolio’s Class A and B Shares. MIDC is a wholly-owned subsidiary of MetLife Investors Group, Inc., an affiliate of the Adviser. The Trust has also adopted a Distribution and Service Plan under Rule 12b-1 of the 1940 Act for the Portfolio’s Class B Shares. Under the Distribution and Service Plan, the Class B Shares of the Portfolio pay a fee to compensate the Insurance Companies (or their affiliates) and other broker-dealers and financial intermediaries involved in the offer and sale of Portfolio shares for promoting or selling and servicing the Class B Shares. The fees under the Distribution and Service Plan for each class of the Portfolio’s shares are calculated as a percentage of the Portfolio’s average daily net assets that are attributable to that Class. Currently, the fee is 0.25% per year for Class B Shares. Amounts incurred by the Portfolio for the year ended December 31, 2013 are shown as Distribution and service fees in the Statement of Operations.
Deferred Trustee Compensation - Each Trustee who is not currently an employee of the Adviser or any of its affiliates receives compensation from the Trust for his or her service to the Trust. A deferred compensation plan (the “Plan”) is available to the Trustees on a voluntary basis. Deferred amounts remain in the Trust until distributed in accordance with the provisions of the Plan. The value of a participating Trustee’s deferral account is based on theoretical investments of deferred amounts, on the normal payment dates in certain portfolios of the Trust or Met Investors Series Trust, an affiliate of the Trust, as designated by the participating Trustee. Changes in the value of participants’ deferral accounts are reflected as Trustees’ fees and expenses in the Statement of Operations. The portion of the accrued obligations allocated to the Portfolio under the Plan is reflected as Deferred trustees’ fees in the Statement of Assets and Liabilities.
6. Contractual Obligations
Under the Trust’s organizational documents, its officers and Trustees may be indemnified against certain liabilities and expenses arising out of the performance of their duties to the Trust. Additionally, the Trust has a variety of indemnification obligations under contracts with its service providers. The Trust’s maximum exposure under these arrangements is unknown, as this would involve future claims that may be made against the Trust that have not yet occurred.
7. Income Tax Information
The tax character of distributions paid for the periods ended December 31, 2013 and 2012 was as follows:
| | | | | | | | | | | | | | | | | | | | |
Ordinary Income | | | Long-Term Capital Gain | | | Total | |
2013 | | 2012 | | | 2013 | | | 2012 | | | 2013 | | | 2012 | |
| $9,218,470 | | $ | 6,312,388 | | | $ | — | | | $ | 58,043,245 | | | $ | 9,218,470 | | | $ | 64,355,633 | |
As of December 31, 2013, the components of distributable earnings (accumulated losses) on a federal income tax basis were as follows:
| | | | | | | | | | | | | | | | |
Undistributed
Ordinary
Income | | Undistributed
Long-Term
Capital Gain | | | Net
Unrealized
Appreciation | | | Loss Carryforwards | | | Total | |
| $6,102,309 | | $ | 18,748,006 | | | $ | 66,620,722 | | | $ | — | | | $ | 91,471,037 | |
The Portfolio utilizes the provisions of the federal income tax laws that provide for the carryforward of capital losses for prior years, offsetting such losses against any future realized capital gains. Under the Regulated Investment Company Modernization Act of 2010 (the “Act”), net capital losses recognized after December 22, 2010 may be carried forward indefinitely, and their character is retained
MSF-13
Metropolitan Series Fund
Van Eck Global Natural Resources Portfolio
Notes to Financial Statements—December 31, 2013—(Continued)
as short-term and/or long-term losses. Previously, net capital losses were carried forward for up to eight years and treated as short term losses. As a transition rule, the Act requires that post-enactment net capital losses be used before pre-enactment net capital losses.
During the year ended December 31, 2013, the Portfolio utilized capital loss carryforwards of $1,588,525.
As of December 31, 2013, the Portfolio had no post-enactment accumulated capital losses and no pre-enactment accumulated capital loss carryforwards.
MSF-14
Metropolitan Series Fund
Van Eck Global Natural Resources Portfolio
Report of Independent Registered Public Accounting Firm
To the Shareholders of Van Eck Global Natural Resources Portfolio and the Board of Trustees of Metropolitan Series Fund:
We have audited the accompanying statement of assets and liabilities, including the schedule of investments, of Van Eck Global Natural Resources Portfolio, one of the portfolios constituting Metropolitan Series Fund, (the “Trust”), as of December 31, 2013, and the related statement of operations for the year then ended, the statements of changes in net assets for each of the two years in the period then ended, and the financial highlights for each of the five years in the period then ended. These financial statements and financial highlights are the responsibility of the Trust’s management. Our responsibility is to express an opinion on these financial statements and financial highlights based on our audits.
We conducted our audits in accordance with the standards of the Public Company Accounting Oversight Board (United States). Those standards require that we plan and perform the audit to obtain reasonable assurance about whether the financial statements and financial highlights are free of material misstatement. The Trust is not required to have, nor were we engaged to perform, an audit of its internal control over financial reporting. Our audits included consideration of internal control over financial reporting as a basis for designing audit procedures that are appropriate in the circumstances, but not for the purpose of expressing an opinion on the effectiveness of the Trust’s internal control over financial reporting. Accordingly, we express no such opinion. An audit also includes examining, on a test basis, evidence supporting the amounts and disclosures in the financial statements, assessing the accounting principles used and significant estimates made by management, as well as evaluating the overall financial statement presentation. Our procedures included confirmation of securities owned as of December 31, 2013, by correspondence with the custodian and brokers; where replies were not received from brokers, we performed other auditing procedures. We believe that our audits provide a reasonable basis for our opinion.
In our opinion, the financial statements and financial highlights referred to above present fairly, in all material respects, the financial position of Van Eck Global Natural Resources Portfolio of Metropolitan Series Fund, as of December 31, 2013, the results of its operations for the year then ended, the changes in its net assets for each of the two years in the period then ended, and the financial highlights for each of the five years in the period then ended, in conformity with accounting principles generally accepted in the United States of America.
Deloitte & Touche LLP
Boston, Massachusetts
February 26, 2014
MSF-15
Metropolitan Series Fund
Trustees and Officers of Metropolitan Series Fund
The Trustees and executive officers of the Trust, their ages and their principal occupations during the past five years are set forth below. Unless otherwise indicated, the business address of each is One Financial Center, Boston, MA 02111. Each Trustee who is deemed an “interested person,” as such term is defined in the 1940 Act, is indicated by an asterisk. Those Trustees who are not “interested persons” as defined in the 1940 Act are referred to as “Independent Trustees.” Additional information about the Trustees is available in the Statement of Additional Information, which is available without charge, upon request, by calling (800) 848-3854.
Trustees of the Trust
| | | | | | | | | | |
Name and Age | | Position(s)
Held with
Registrant | | Term of Office
and Length of
Time Served | | Principal Occupation(s) During the Past 5
Years(1) | | Number of
Portfolios
in Fund
Complex(2)
overseen | | Other Directorships Held
by Trustee During the
Past 5 Years(1) |
| Interested Trustee | | | | | | | | | | |
| Elizabeth M. Forget* (47) | | Trustee, Chairman of the Board, President and Chief Executive Officer | | Indefinite;
From
May
2006
(President
and Chief
Executive
Officer)/
August
2006
(Trustee
and
Chairman
of the
Board) to
present | | Senior Vice President, MetLife Inc.; President, MetLife Advisers, LLC and a predecessor company. | | 79 | | Trustee, Met Investors Series Trust (the “MIST Trust”);** various MetLife-affiliated boards. |
| | | | | |
| Independent Trustees | | | | | | | | | | |
| Stephen M. Alderman (54) | | Trustee | | Indefinite;
From
April
2012 to
present | | Shareholder in the law firm of Garfield & Merel, Ltd. | | 79 | | Trustee, MIST Trust;** Director, International Truck Leasing Corp. |
| | | | | |
| Robert J. Boulware (57) | | Trustee | | Indefinite;
From
April
2012 to
present | | Managing Director, Pilgrim Funds, LLC (private equity fund). | | 79 | | Trustee, MIST Trust;** Trustee, Vertical Capital Income Fund (closed-end fund); Director, Gainsco, Inc. (auto insurance). |
| | | | | |
| Susan C. Gause (61) | | Trustee | | Indefinite;
From
April
2012 to
present | | Private Investor. | | 79 | | Trustee, MIST Trust;** Trustee, HSBC Funds. |
| | | | | |
| Nancy Hawthorne (62) | | Trustee | | Indefinite;
From
May
2003 to
present | | Chief Executive Officer, Clerestory LLC (corporate advisor). | | 79 | | MIST Trust;** Director, THL Credit, Inc.**; Director, Avid Technology, Inc.** |
| | | | | |
| Barbara A. Nugent (57) | | Trustee | | Indefinite;
From
January
2014 to
present | | President, True North Board Governance, LLC (consulting); until 2014, partner in the law firm of Stradley Ronon Stevens & Young, LLP. | | 79 | | Trustee, MIST Trust**; Director, Episcopal Healthcare Foundation; until 2014, member, Mutual Fund Directors Forum Advisory Board. |
MSF-16
Metropolitan Series Fund
Trustees and Officers of Metropolitan Series Fund—(Continued)
| | | | | | | | | | |
Name and Age | | Position(s)
Held with
Registrant | | Term of Office
and Length of
Time Served | | Principal Occupation(s) During the Past 5
Years(1) | | Number of
Portfolios
in Fund
Complex(2)
overseen | | Other Directorships Held
by Trustee During the
Past 5 Years(1) |
| Keith M. Schappert (62) | | Trustee | | Indefinite;
From
August
2009 to
present | | Principal, Schappert Consulting LLC (asset management consulting). | | 79 | | Trustee, MIST Trust;** Director, The Commonfund for Nonprofit Organizations; until 2011, Director, Trilogy Global Advisors; Director, Mirae Asset Discovery Funds,** Director, Calamos Investments. |
| | | | | |
| Linda B. Strumpf (66) | | Trustee | | Indefinite;
From
May
2000 to
present | | Chair of the Investment Committee, Leona M. and Harry B. Helmsley Charitable Trust; until 2011, Chief Investment Officer, Leona M. and Harry B. Helmsley Charitable Trust. | | 79 | | Since 2012, Trustee, MIST Trust,** Trustee and Member of Investment Committee, The Pennsylvania State University. |
| | | | | |
| Dawn M. Vroegop (47) | | Trustee | | Indefinite;
From
May
2009 to
present | | Private Investor. | | 79 | | Trustee, MIST Trust,** Trustee, Driehaus Mutual Funds; Director and Investment Committee Chair, City College of San Francisco Foundation. |
Executive Officers of the Trust
| | | | | | |
Name and Age | | Position(s) Held with
Registrant | | Term of Office
and Length of
Time Served | | Principal Occupation(s) During Past 5 Years(1) |
| Elizabeth M. Forget (47) | | President, Chief Executive Officer, Trustee and Chairman of the Board | | From May
2006 (President
and Chief
Executive
Officer)/
August 2006
(Trustee and
Chairman of
the Board) to
present | | See principal occupation information in the table above. |
| | | |
| Jeffrey L. Bernier (42) | | Vice President | | From February
2008 to present | | Vice President, MetLife, Inc.; Senior Vice President, MetLife Advisers, LLC and a predecessor company. |
| | | |
| Peter H. Duffy (58) | | Chief Financial Officer and Treasurer | | From November
2000 to present | | Senior Vice President, MetLife Advisers, LLC; Vice President, MetLife, Inc. |
| | | |
| Andrew L. Gangolf (59) | | Secretary | | From May
2011to present | | Senior Vice President, MetLife Advisers, LLC; Senior Vice President & Assistant General Counsel, AllianceBerstein Investments, Inc. |
| | | |
| Jeffrey P. Halperin (46) | | Chief Compliance Officer | | From November
2005 to present | | Vice President, MetLife, Inc.; Chief Compliance Officer, MIST; Chief Compliance Officer, MSF Trust; Chief Compliance Officer, MetLife Advisers, LLC and a predecessor company; Chief Compliance Officer, MetLife Investment Management, LLC (formerly MetLife Investment Advisors Company, LLC). |
| | | |
| Alan C. Leland, Jr. (61) | | Vice President | | From February
2005 to present | | Treasurer and Chief Financial Officer, MetLife Advisers, LLC; Vice President, MetLife Group Inc.; Vice President, MetLife, Inc. |
| * | Ms. Forget is an “interested person” of the Trust because of her positions with MetLife Advisers, LLC and her ownership of securities issued by MetLife, Inc., the ultimate parent company of MetLife Advisers, LLC. |
| ** | Indicates a directorship with a registered investment company or a company subject to the reporting requirements of the Securities Exchange Act of 1934, as amended. |
| (1) | Previous positions during the past five years with the Trust, MetLife, Inc. or the Adviser are omitted if not materially different. |
| (2) | The Fund Complex includes 49 Portfolios of the MIST Trust and 30 Portfolios of the Trust. |
MSF-17
Metropolitan Series Fund
Van Eck Global Natural Resources Portfolio
Board of Trustees’ Consideration of Advisory and Sub-Advisory Agreements
At an in-person meeting of the Boards of Trustees (the “Board”) of Met Investors Series Trust and Metropolitan Series Fund (“MIST” and “MSF,” respectively, and collectively, the “Trusts”) held on November 19-20, 2013, the Board, including a majority of the Trustees who are not considered to be “interested persons” of the Trusts (the “Independent Trustees”) under the Investment Company Act of 1940, as amended (the “1940 Act”), approved for an annual period the continuation of each Trust’s advisory agreement (the “Advisory Agreement”) with MetLife Advisers, LLC (the “Adviser”) and the applicable sub-advisory agreements (each a “Sub-Advisory Agreement,” and collectively with the Advisory Agreement, the “Agreements”) between the Adviser and the investment sub-advisers (each a “Sub-Adviser,” and collectively, the “Sub-Advisers”) for each of the series of the Trusts, including the Van Eck Global Natural Resources Portfolio (each a “Portfolio,” and collectively, the “Portfolios”).1
In considering the Agreements, the Board reviewed a variety of materials provided by the Adviser and the Sub-Advisers relating to the Portfolios, including comparative performance, fee and expense information for an appropriate peer group of similar mutual funds, performance information for relevant benchmark indices and other information regarding the nature, extent and quality of services provided by the Adviser and the Sub-Advisers under their respective Agreements. The Board also took into account its experience with the Adviser and the Sub-Advisers and information provided to the Board in its meetings throughout the year with respect to the services provided by the Adviser and the Sub-Advisers, including quarterly performance reports prepared by management containing reviews of investment results, and periodic presentations from certain of the Sub-Advisers with respect to the Portfolios they manage. The Independent Trustees also assessed reports provided by the Board’s independent consultant, who reviewed and provided analyses regarding investment performance, fees and expenses, and other information provided by, or at the direction of, the Adviser and the Sub-Advisers, as more fully discussed below.
The Independent Trustees were separately advised by independent legal counsel throughout the process, and met with independent legal counsel in periodic executive sessions. Prior to voting to continue the Agreements at the November meeting, the Independent Trustees also received a memorandum from their independent counsel discussing the legal standards for their consideration of the proposed continuation of the Agreements. The Board also met in person with personnel of the Adviser on September 17, 2013 for the specific purpose of giving preliminary consideration to the proposed continuation of the Agreements and to request additional information they considered reasonably necessary to their deliberations. The Independent Trustees also discussed the proposed continuation of the Agreements in private sessions with their independent legal counsel at which no representatives of management were present.
In considering whether to approve the renewal of the Advisory Agreement with the Adviser and any applicable Sub-Advisory Agreements with respect to a Portfolio, the Board reviewed and analyzed the factors it deemed relevant, including: (1) the nature, extent and quality of the services to be provided to the Portfolios by the Adviser and the Sub-Advisers; (2) the performance of the Portfolios as compared to a peer group and an appropriate index; (3) the Adviser’s and each of the Sub-Adviser’s personnel and operations; (4) the financial condition of the Adviser and of the Sub-Advisers; (5) the level and method of computing each Portfolio’s advisory and sub-advisory fees; (6) the profitability of the Adviser under the Advisory Agreement and of certain of the Sub-Advisers under the Sub-Advisory Agreements; (7) any “fall-out” benefits to the Adviser, the Sub-Advisers and their affiliates (i.e., ancillary benefits realized by the Adviser, the Sub-Advisers or their affiliates from the Adviser’s or Sub-Advisers’ relationship with the Trusts); (8) the anticipated effect of growth in size on Portfolio expenses; (9) fees paid to certain of the Sub-Advisers by comparable institutional and retail accounts; and (10) possible conflicts of interest.
Nature, extent and quality of services. The Board evaluated the nature, extent and quality of the services that the Adviser, and the Sub-Advisers as relevant, have provided to the Portfolios. The Board considered the Adviser’s services as investment manager to the Portfolios, including services relating to the selection and oversight of the Sub-Advisers for the applicable Portfolios. The Board considered, among other things, the Adviser’s oversight of the provision of services to the Portfolios by the Sub-Advisers, including with respect to investment activities and trading practices, and the Sub-Adviser’s compliance with fund policies, objectives and Board directives, compliance policies and procedures and applicable law. The Adviser’s services in coordinating and overseeing the activities of the Trusts’ other service providers were also considered. The Board also evaluated the expertise and performance of the personnel of the Adviser who performed services for the Portfolios throughout the year.
The Board considered information received from the Trust’s Chief Compliance Officer (“CCO”) regarding the Portfolios’ compliance policies and procedures established pursuant to Rule 38a-l under the 1940 Act. The Board also evaluated the CCO’s ongoing reports concerning the CCO’s oversight of the risk assessment processes of the Sub-Advisers.
1 The Pyramis Managed Risk Portfolio recently commenced operations and, therefore, the Agreement with respect to this Portfolio was not up for renewal.
MSF-18
Metropolitan Series Fund
Van Eck Global Natural Resources Portfolio
Board of Trustees’ Consideration of Advisory and Sub-Advisory Agreements—(Continued)
With respect to the services provided by each of the Sub-Advisers, the Board considered, among other things, information provided to the Board by each Sub-Adviser. The Board considered the Sub-Adviser’s current level of staffing and its overall resources, as well as its compensation program. The Board reviewed each Sub-Adviser’s history and investment experience, as well as information regarding the qualifications, background and responsibilities of the Sub-Adviser’s investment and compliance personnel who provide services to the Portfolios. The Board also considered, among other things, the Sub-Adviser’s compliance program and any disciplinary history. The Board also took into account the Sub-Adviser’s risk assessment and monitoring process. The Board noted each Sub-Adviser’s regulatory history, including whether it was currently involved in any regulatory actions or investigations as well as material litigation, and any settlements and amelioratory actions undertaken, as appropriate. The Board also noted that the CCO and his staff conduct regular, periodic compliance reviews with each of the Sub-Advisers and present reports to the Independent Trustees regarding the same, which includes evaluating the regulatory compliance systems of the Sub-Advisers and procedures reasonably designed by them to help assure compliance with the federal securities laws, including issues related to late trading and market timing, best execution, fair value pricing, and proxy voting procedures, among others. The Board also took into account the financial condition of each Sub-Adviser. In its review, the Board also received and took into account information regarding any services and/or payments provided to the Adviser by the Sub-Advisers in connection with marketing activities.
The Board considered each Sub-Adviser’s investment process and philosophy. The Board took into account that each Sub-Adviser’s responsibilities include the development and maintenance of an investment program for the applicable Portfolio which is consistent with the Portfolio’s investment objectives, the selection of investment securities and the placement of orders for the purchase and sale of such securities, as well as the implementation of compliance controls related to performance of these services. The Board also reviewed each Sub-Adviser’s brokerage policies and practices.
Performance. The Board considered the performance of the Portfolios as described in the quarterly reports prepared by management, and as also analyzed in reports prepared by the Independent Trustees’ independent consultant. The Board noted that the Adviser reviews with the Board on a quarterly basis detailed information about the Portfolios’ performance results, portfolio composition and investment strategies. The Board also reviewed and considered a separate report prepared by Lipper Inc. (“Lipper”), an independent third party, which provided a statistical analysis comparing the Portfolios’ investment performance, expenses, and fees to comparable funds underlying variable insurance products (the “Performance Universe”). In addition, the Independent Trustees met separately with a representative of Bobroff Consulting, Inc., an independent consultant (“Bobroff), at a special board meeting in September 2013, to review the separate reports prepared by such consultant (“Bobroff Report”), which analyzed the report prepared by Lipper. The Board also considered each Portfolio’s more recent performance subsequent to the performance period covered by the Lipper reports, and management’s discussion of the same, including the effect of current market conditions on each Portfolio’s more recent performance.
The Board reviewed the Portfolios’ performance records and the Adviser’s and Sub-Advisers’ management styles and long-term performance records with the Portfolios and comparable funds. The Board focused particular attention on Portfolios with less favorable performance records. The Board was mindful of the Adviser’s focus on each Sub-Adviser’s performance and noted that the Adviser has been active in monitoring and responding to any performance issues with respect to the Portfolios. The Board also took into account its discussions with management regarding factors that contributed to the performance of the Portfolios.
Among other data relating specifically to the Van Eck Global Natural Resources Portfolio’s performance, the Board considered that the Portfolio underperformed the median of its Performance Universe and its Lipper Index for the one- and three-year periods ended June 30, 2013. The Board also considered that the Portfolio underperformed its benchmark, the S&P North American Natural Resources Index, for the one- and three-year periods ended October 31, 2013 but outperformed its benchmark for the five-year period ended October 31, 2013.
Fees and Expenses. The Board gave consideration to the advisory fees payable under the Advisory Agreement and the sub-advisory fees payable under each of the Sub-Advisory Agreements. In this regard, the Board reviewed the advisory fees payable on a Portfolio-by-Portfolio basis based on information provided by the Adviser. The Independent Trustees, with the assistance of Bobroff, also examined the fees paid by a Portfolio in light of fees paid to other investment managers by comparable funds, as well as considered the fees charged by the Adviser to manage other comparable funds, as applicable. The Lipper report included comparisons of the Adviser’s fee schedule with that of its peers based on an asset-based analysis of relative fee structures according to the size of the Portfolio. In addition, the Board considered the Portfolios’ advisory and sub-advisory fees and total expenses as compared to similarly situated investment companies underlying variable insurance products deemed to be comparable to the Portfolios as determined by Lipper. The Board considered a Portfolio’s ranking within a smaller group of peer funds chosen by Lipper (the “Expense Group”), as well as the Portfolio’s ranking within broader groups of funds (the “Expense Universe” and the “Sub-advised Expense Universe”). The Board
MSF-19
Metropolitan Series Fund
Van Eck Global Natural Resources Portfolio
Board of Trustees’ Consideration of Advisory and Sub-Advisory Agreements—(Continued)
also considered a Portfolio’s contractual sub-advisory fees, as applicable, as compared to the Sub-advised Expense Universe as well as a smaller group of funds (the “Sub-advised Expense Group”). In comparing a Portfolio’s actual and contractual management fee to that of comparable funds, the Board noted that such fee includes both advisory and administrative fees.
The Board noted that the sub-advisory fees for the Portfolios are paid by the Adviser, not the Portfolios, out of the advisory fee. It was further noted that the Adviser negotiates such fees at arm’s length. The Board also considered that the Adviser had entered into expense limitation agreements with certain of the Portfolios, pursuant to which the Adviser has agreed to waive a portion of its advisory fee and/or reimburse certain expenses as a means of limiting a Portfolio’s total annual operating expenses. The Board further considered the amount of sub-advisory fees paid out by the Adviser and the amount of the management fees that it retained in light of the services performed by Sub-Advisers and Adviser, respectively.
With respect to the Van Eck Global Natural Resources Portfolio, the Board considered that the Portfolio’s actual management fees were below the Expense Group median and the Sub-advised Expense Universe median but above the Expense Universe median. The Board further considered that the Portfolio’s total expenses (exclusive of 12b-1 fees) were below the median of the Expense Group, the Expense Universe and the Sub-advised Expense Universe. The Board further noted that the Portfolio’s contractual management fees were below the asset-weighted average of the Expense Group at the Portfolio’s current size. The Board also noted that the Portfolio’s contractual sub-advisory fees were above the average of the Sub-advised Expense Group and the Sub-advised Expense Universe at the Portfolio’s current size. In addition, the Board noted that the Adviser had recently negotiated a reduction to the Portfolio’s sub-advisory fee schedule and that the Adviser agreed to waive a corresponding portion of its advisory fee in order for contractholders to benefit from the lower sub-advisory fee effective January 1, 2013.
Profitability. The Board examined the profitability of the Adviser on a Portfolio-by-Portfolio basis. The Board also considered that the Distributor, MetLife Investors Distribution Company, receives Rule 12b-1 payments to support the distribution of the products. The Board considered the profitability to the Sub-Advisers and their affiliates as a result of their relationships with the Portfolios, and the Board considered the ability of the Adviser to negotiate the Sub-Advisory Agreements and the fees thereunder at arm’s length. The Board also reviewed Portfolio specific data with regard to the profitability of the Portfolios to each Sub-Adviser, as available.
Economies of scale. The Board also considered the effect of the Portfolios’ growth in size on their fees. The Board noted that the fee schedules for most of the Portfolios contain breakpoints that reduce the fee rate above specified asset levels. The Board noted those Portfolios that did not contain breakpoints in the advisory fee and took into account management’s discussion of the same. The Board noted that those Portfolios with advisory fee schedules containing breakpoints generally reflect the inclusion of breakpoints in the sub-advisory fee schedule for such Portfolios. The Board considered the effective fees under the Advisory Agreement for a Portfolio as a percentage of assets at different asset levels and possible economies of scale that may be realized if the assets of the Portfolio grow. Among other data, the Board examined the effect of a Portfolio’s growth in size on various fee schedules and reviewed the Lipper and Bobroff Reports, which compared fees among peers. The Board also generally noted that if a Portfolio’s assets increase over time, the Portfolio may realize other economies of scale if assets increase proportionally more than certain other fixed expenses. In addition, the Board noted that the Adviser had taken a number of steps to date intended to share the benefits of economies of scale with contractholders.
With respect to the Van Eck Global Natural Resources Portfolio, the Board noted that the Portfolio’s advisory fee and sub-advisory fee each contains breakpoints that reduce the advisory fee rate on assets above certain specified asset levels. The Board considered the fact that the Portfolio’s fee levels decline as portfolio assets increase.
Other factors. As part of its evaluation of the Adviser’s compensation, the Board considered other benefits that may be realized by the Adviser and its affiliates from their relationship with the Trusts. Among them, the Board recognized that an affiliate of the Adviser, MetLife Investors Distribution Company, serves as the Distributor for the Trusts, and, as such, receives payments pursuant to Rule 12b-1 from the Portfolios to compensate it for providing shareholder services and selling activities, which could lead to growth in the Trusts’ assets and corresponding benefits from such growth, including economies of scale. The Board also considered that affiliates of the Adviser may benefit from certain indirect tax benefits relating to dividend received deductions and foreign tax credits. In conjunction with these considerations, the Board noted the costs of providing investment management and other services to the Portfolios and the ongoing commitment of the Adviser to the Portfolios.
The Board considered other benefits that may be realized by each Sub-Adviser and its affiliates from their relationship with the Trusts, including the opportunity to provide advisory services to additional portfolios of the Trusts and reputational benefits. In conjunction with these considerations, the Board noted the costs of providing investment advisory services to the Portfolios and the ongoing commitment of the Sub-Advisers to the Portfolios.
MSF-20
Metropolitan Series Fund
Van Eck Global Natural Resources Portfolio
Board of Trustees’ Consideration of Advisory and Sub-Advisory Agreements—(Continued)
The Board considered possible conflicts of interest in the form of material benefits or detriments to the Trusts resulting from the nature of the Trusts’ and the Adviser’s or the Sub-Advisers’ affiliations and the services that are provided to the Trusts, and the manner in which such conflicts were mitigated.
Conclusions. After full consideration of the factors discussed above, the Board, including a majority of the Independent Trustees, approved the Advisory Agreement and the Sub-Advisory Agreement, as applicable, with respect to each Portfolio, unless otherwise noted. In making its approvals, the Board concluded that the nature, extent and quality of services provided by the Adviser and each Sub-Adviser supported the renewal of the Agreements. The Board also concluded that the investment performance of each Fund was such that each Agreement should continue. In addition, the Board concluded that fees paid by a Portfolio to the Adviser and, if applicable, the Sub-Adviser appeared to be acceptable in light of nature, extent and quality of the services provided by the Adviser and Sub-Adviser. Further, the Board concluded that the Adviser’s profitability in providing services under the Advisory Agreements did not appear unreasonably high in light of the nature, extent and quality of the services provided by the Adviser. Finally, the Board concluded that the Advisory and Sub-Advisory fees in some measure share economies of scale with contractholders. In approving the renewal of each of the Agreements, the Board, including the Independent Trustees, did not identify any single factor as controlling, and generally attributed different weights to various factors for the various Portfolios. The Board evaluated all information available to them on a Portfolio-by-Portfolio basis, and their decisions were made separately with respect to each Portfolio.
MSF-21
Metropolitan Series Fund
Western Asset Management Strategic Bond Opportunities Portfolio
Managed by Western Asset Management Company
Portfolio Manager Commentary*
PERFORMANCE
For the one year period ended December 31, 2013, the Class A, B, and E shares of the Western Asset Management Strategic Bond Opportunities Portfolio returned 1.09%, 0.83%, and 0.94%, respectively. The Portfolio’s benchmark, the Barclays U.S. Aggregate Bond Index1, returned -2.02%.
MARKET ENVIRONMENT / CONDITIONS
The year began as Congress worked through the final moments of 2012 putting together an agreement to prevent a collection of tax increases and spending cuts known as the fiscal cliff. While a lackluster compromise was reached, some taxes were increased, notably payroll taxes, and the federal spending cuts proved unavoidable. Given this new set of headwinds, economic performance over the year was perhaps better than expected. Corporations continued to generate robust profits and equity markets climbed to new highs, with the S&P 500 Index gaining 32.4% on the year. Certainly the continued support of the Federal Reserve (the “Fed”) was a large help to risk markets, through its non-traditional methods of monetary accommodation. The European debt crisis also continued to ease on the back of aggressive action from the European Central Bank (the “ECB”). As a result, uncertainty among investors diminished, and as the Fed encouraged them to take risk, they did so.
The U.S. economic recovery picked up moderately over the year. The final estimate for the annualized Gross Domestic Product (“GDP”) growth rate over the third quarter (the last GDP data point released in 2013) came in at 4.1%. This compared favorably to the 0.1% growth rate from the fourth quarter of 2012, as well as to the 1.1% and 2.5% growth rates experienced in first and second quarters of 2013. At the same time, the unemployment rate notched down from 7.9% a year ago to the most recent rate of 6.7%.
The details behind the headlines are not quite as rosy, however. The drop in the unemployment rate, instead of being due to a robust and growing economy, was mostly driven by a decline in the labor force participation rate. Many discouraged workers simply gave up looking for work. This signals that the economy still has plenty of slack despite the recovery. Aggregate demand remains relatively weak. In spite of this, markets in 2013 were mostly risk-on environments. Risk sector spreads generally ended tighter. Improvement in the housing market remained a bright spot as the Case-Shiller Home Price Index (20 city composite, seasonally adjusted) improved to a year-over-year gain of 13.6%, up from a 4.3% gain a year ago. This is the index’s strongest yearly performance since February 2006.
The Fed remained extraordinarily accommodative during 2013, holding interest rates steady in a range of 0% to 0.25%. The Fed hinted several times over the year that it was considering reducing its $85 billion per month purchases of U.S. Treasuries and of agency mortgage-backed securities (“MBS”). The Fed finally announced the initial reduction at its December 2013 meeting, that asset purchases would decrease by $10 billion to a rate of $75 billion per month. Fed Chairman Ben Bernanke emphasized that this move should not be considered monetary tightening. He cited several continuing accommodations: the Fed’s continued promise of extraordinary low rates, guidance that short term rates would likely remain low even when the unemployment rate dips below 6.5%, and the fact that the Fed is still continuing to expand its balance sheet, albeit slightly less aggressively. Previous Fed guidance indicated that rates would be kept low as long as the unemployment rate remains above 6.5% and expected inflation one to two years out is below 2.5% with longer-term inflation expectations well anchored.
While interest rates rose significantly over the year, they generally drifted higher on expectations of reduced Fed purchases. Rates only moved modestly higher on the actual news of tapering. Ben Bernanke also experienced his final full year as Fed Chairman in 2013. His term was marked by aggressive Fed experimentation as the central bank attempted to add further accommodation despite a near-zero fed funds rate.
PORTFOLIO REVIEW / PERIOD END POSITIONING
The Portfolio outperformed its benchmark over 2013. Spread sectors ended the year meaningfully higher on investors’ demand for risky assets which helped drive the Portfolio’s strong performance.
An overweight exposure to high yield bonds was the single largest contributor to performance as default rates remained low and spreads tightened by 129 basis points (bps) over the year to end at 382 bps over Treasuries.
The Portfolio’s non-agency MBS allocation was also a major contributor to performance as the sector benefited from price improvement and positive carry, as well as from continued coupon and principal payments. Through the year we continued to find opportunities in non-agency MBS as improved homeowner equity positions and higher prepayment rates are expected to boost yields to the asset class.
Investment Grade credit spreads tightened by 20 bps with investors’ higher appetite for risk, and the Portfolio’s allocation to Financial and Industrial companies’ bonds aided performance.
In line with other spread sectors, commercial MBS outperformed during the year. The Portfolio’s slight underweight position relative to the benchmark in this sector mildly detracted from performance. The Portfolio’s underweight allocation to agency MBS also slightly detracted from performance as the sector outperformed U.S. Treasuries of similar interest rate risk over the year. We focused on selecting certain mortgage pools and coupon stacks which avoided exaggerated risk of government-sponsored mortgage refinancing, thus decreasing the risk of loss of interest income through prepayments.
The Portfolio’s overall tactical exposure to interest rate risk had a small positive impact on performance as rates ended the year
MSF-1
Metropolitan Series Fund
Western Asset Management Strategic Bond Opportunities Portfolio
Managed by Western Asset Management Company
Portfolio Manager Commentary*—(Continued)
significantly higher. The Portfolio held less exposure than the benchmark to medium-term interest rates over the year, contributing to outperformance as those rates rose.
At year end economic data continued to support our expectations for a mild yet ongoing economic recovery. Going into 2014, we expected continued positive domestic economic growth, and we remained overweight to certain spread sectors that have demonstrated strong fundamentals. We remained mindful of the potential negative consequences of domestically-driven events such as another debt ceiling showdown in Congress and are also cognizant of potential negative spillover effects should another crisis erupt or reignite overseas. Importantly, the Fed remains highly accommodative even though it has slightly reduced asset purchases.
Stephen A. Walsh
Carl L. Eichsteadt
Mark S. Lindbloom
Christophe Orndorff
Michael Buchanan
Keith J. Gardner
Portfolio Managers
Western Asset Management Company
* This commentary may include statements that constitute “forward-looking statements” under the U.S. securities laws. Forward-looking statements include, among other things, projections, estimates, and information about possible or future results related to the Portfolio, market or regulatory developments. The views expressed above are not guarantees of future performance or economic results and involve certain risks, uncertainties and assumptions that could cause actual outcomes and results to differ materially from the views expressed herein. The views expressed above are subject to change at any time based upon economic, market, or other conditions and the subadvisory firm undertakes no obligation to update the views expressed herein. Any discussions of specific securities should not be considered a recommendation to buy or sell those securities. The views expressed above (including any forward-looking statement) may not be relied upon as investment advice or as an indication of the Portfolio’s trading intent. Information about the Portfolio’s holdings, asset allocation or country diversification is historical and is not an indication of future Portfolio composition, which may vary. Direct investment in any index is not possible. The performance of any index mentioned in this commentary has not been adjusted for ongoing management, distribution and operating expenses, and sales charges applicable to mutual fund investments. In addition, the returns do not reflect additional fees charged by separate accounts or variable insurance contracts that an investor in the Portfolio may pay. If these additional fees were reflected, performance would have been lower.
MSF-2
Metropolitan Series Fund
Western Asset Management Strategic Bond Opportunities Portfolio
A $10,000 INVESTMENT COMPARED TO THE BARCLAYS U.S. AGGREGATE BOND INDEX
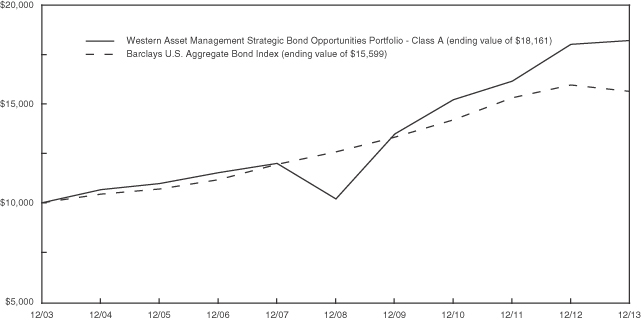
AVERAGE ANNUAL RETURNS (%) (FOR THE YEAR ENDED DECEMBER 31, 2013)
| | | | | | | | | | | | |
| | | 1 Year | | | 5 Year | | | 10 Year | |
| Western Asset Management Strategic Bond Opportunities Portfolio | | | | | | | | | | | | |
Class A | | | 1.09 | | | | 12.26 | | | | 6.15 | |
Class B | | | 0.83 | | | | 11.99 | | | | 5.87 | |
Class E | | | 0.94 | | | | 12.08 | | | | 5.98 | |
| Barclays U.S. Aggregate Bond Index | | | -2.02 | | | | 4.44 | | | | 4.55 | |
1 Barclays U.S. Aggregate Bond Index is a broad based benchmark that measures the investment grade, U.S. dollar-denominated, fixed-rate taxable bond market, including Treasuries, government-related and corporate securities, mortgage-backed securities, asset-backed securities, and commercial mortgage-backed securities.
Portfolio performance is calculated including reinvestment of all income and capital gain distributions. Performance numbers are net of all Portfolio expenses but do not include any insurance, sales, separate account or administrative charges of variable annuity or life insurance contracts or any additional expenses that participants may bear relating to the operations of their plans. If these charges were included, the returns would be lower. The performance of any index referenced above has not been adjusted for ongoing management, distribution and operating expenses, and sales charges applicable to mutual fund investments. Direct investment in any index is not possible. The performance of Class A shares, as set forth in the line graph above, will differ from that of other classes because of the difference in expenses paid by policyholders investing in the different share classes.
This information represents past performance and is not indicative of future results. Investment return and principal value may fluctuate so that shares, upon redemption, may be worth more or less than the original cost.
PORTFOLIO COMPOSITION AS OF DECEMBER 31, 2013
Top Sectors
| | | | |
| | | % of Market Value of
Total Long-Term Investments | |
Corporate Bonds & Notes | | | 53.4 | |
Foreign Government | | | 14.4 | |
U.S. Treasury & Government Agencies | | | 14.0 | |
Mortgage-Backed Securities | | | 12.7 | |
Asset-Backed Securities | | | 4.4 | |
Preferred Stocks | | | 0.8 | |
Common Stocks | | | 0.2 | |
Floating Rate Loans | | | 0.1 | |
MSF-3
Metropolitan Series Fund
Western Asset Management Strategic Bond Opportunities Portfolio
Understanding Your Portfolio’s Expenses
Shareholder Expense Example
As a shareholder of the Portfolio, you incur ongoing costs, including management fees; distribution and service (12b-1) fees; and other Portfolio expenses. This example is intended to help you understand your ongoing costs (in dollars) (referred to as “expenses”) of investing in the Portfolio and compare these costs with the ongoing costs of investing in other mutual funds. The example is based on an investment of $1,000 invested at the beginning of the period and held for the entire period, July 1, 2013 through December 31, 2013.
Actual Expenses
The first line for each share class of the Portfolio in the table below provides information about actual account values and actual expenses. You may use the information in this line, together with the amount you invested in the particular share class of the Portfolio, to estimate the expenses that you paid over the period. Simply divide your account value by $1,000 (for example, an $8,600 account value divided by $1,000 = 8.6), then multiply the result by the number in the first line under the heading entitled “Expenses Paid During Period” to estimate the expenses you paid on your account during this period.
Hypothetical Example for Comparison Purposes
The second line for each share class of the Portfolio in the table below provides information about hypothetical account values and hypothetical expenses based on the Portfolio’s actual expense ratio and an assumed rate of return of 5% per year before expenses, which is not the Portfolio’s actual return. The hypothetical account values and expenses may not be used to estimate the actual ending account balance or expenses you paid for the period. You may use this information to compare the ongoing costs of investing in the Portfolio and other funds. To do so, compare this 5% hypothetical example with the 5% hypothetical examples that appear in the shareholder reports of the other funds.
Please note that the expenses shown in the table are meant to highlight your ongoing costs only and do not reflect any fees or charges of your variable insurance product or any additional expenses that participants in certain eligible qualified plans may bear relating to the operations of their plan. Therefore, the second line for each share class in the table is useful in comparing ongoing costs only, and will not help you determine the relative total costs of owning different funds. In addition, if these other costs were included, your costs would have been higher.
| | | | | | | | | | | | | | | | | | |
Western Asset Management Strategic Bond
Opportunities Portfolio | | | | Annualized
Expense
Ratio | | | Beginning
Account Value
July 1,
2013 | | | Ending
Account Value
December 31,
2013 | | | Expenses Paid
During Period**
July 1, 2013
to
December 31,
2013 | |
Class A(a) | | Actual | | | 0.62 | % | | $ | 1,000.00 | | | $ | 1,022.80 | | | $ | 3.16 | |
| | Hypothetical* | | | 0.62 | % | | $ | 1,000.00 | | | $ | 1,022.08 | | | $ | 3.16 | |
| | | | | |
Class B(a) | | Actual | | | 0.87 | % | | $ | 1,000.00 | | | $ | 1,021.40 | | | $ | 4.43 | |
| | Hypothetical* | | | 0.87 | % | | $ | 1,000.00 | | | $ | 1,020.82 | | | $ | 4.43 | |
| | | | | |
Class E(a) | | Actual | | | 0.77 | % | | $ | 1,000.00 | | | $ | 1,021.40 | | | $ | 3.92 | |
| | Hypothetical* | | | 0.77 | % | | $ | 1,000.00 | | | $ | 1,021.32 | | | $ | 3.92 | |
* Hypothetical assumes a rate of return of 5% per year before expenses.
** Expenses paid are equal to the Portfolio’s annualized expense ratio for the most recent six month period, as shown above, multiplied by the average account value over the period, multiplied by the number of days (184 days) in the most recent fiscal half-year, divided by 365 (to reflect the one-half year period).
(a) The annualized expense ratio shown reflects the impact of the management fee waiver as described in Note 6 of the Notes to Financial Statements.
MSF-4
Metropolitan Series Fund
Western Asset Management Strategic Bond Opportunities Portfolio
Schedule of Investments as of December 31, 2013
Corporate Bonds & Notes—50.8% of Net Assets
| | | | | | | | |
| Security Description | | Principal
Amount* | | | Value | |
| | |
Advertising—0.0% | | | | | | | | |
WPP Finance UK
8.000%, 09/15/14 | | | 230,000 | | | $ | 241,445 | |
| | | | | | | | |
| | |
Aerospace & Defense—0.0% | | | | | | | | |
Boeing Capital Corp.
4.700%, 10/27/19 | | | 350,000 | | | | 392,719 | |
| | | | | | | | |
| | |
Aerospace/Defense—0.4% | | | | | | | | |
Boeing Co. (The)
4.875%, 02/15/20 | | | 540,000 | | | | 602,065 | |
6.000%, 03/15/19 | | | 50,000 | | | | 58,893 | |
Kratos Defense & Security Solutions, Inc.
10.000%, 06/01/17 (a) | | | 3,000,000 | | | | 3,236,250 | |
Raytheon Co.
3.125%, 10/15/20 | | | 30,000 | | | | 30,034 | |
United Technologies Corp.
4.500%, 06/01/42 | | | 360,000 | | | | 349,591 | |
| | | | | | | | |
| | | | | | | 4,276,833 | |
| | | | | | | | |
| | |
Agriculture—0.7% | | | | | | | | |
Altria Group, Inc.
4.000%, 01/31/24 | | | 2,820,000 | | | | 2,756,308 | |
4.750%, 05/05/21 | | | 890,000 | | | | 955,113 | |
5.375%, 01/31/44 | | | 490,000 | | | | 492,029 | |
Imperial Tobacco Finance plc
2.050%, 02/11/18 (144A) | | | 560,000 | | | | 553,739 | |
Lorillard Tobacco Co.
8.125%, 06/23/19 | | | 390,000 | | | | 475,077 | |
Philip Morris International, Inc.
2.500%, 08/22/22 | | | 440,000 | | | | 401,086 | |
2.900%, 11/15/21 | | | 640,000 | | | | 610,979 | |
Reynolds American, Inc.
3.250%, 11/01/22 (a) | | | 270,000 | | | | 248,863 | |
6.750%, 06/15/17 | | | 325,000 | | | | 372,015 | |
| | | | | | | | |
| | | | | | | 6,865,209 | |
| | | | | | | | |
| | |
Airlines—0.6% | | | | | | | | |
Delta Air Lines Pass-Through Trust
6.821%, 02/10/24 | | | 565,110 | | | | 637,161 | |
8.021%, 02/10/24 | | | 2,479,783 | | | | 2,789,756 | |
Northwest Airlines Pass-Through Trust
7.575%, 09/01/20 | | | 19,487 | | | | 22,166 | |
UAL Pass-Through Trust
9.750%, 07/15/18 | | | 79,065 | | | | 90,925 | |
United Airlines, Inc.
6.750%, 09/15/15 (144A) | | | 1,964,000 | | | | 2,025,375 | |
| | | | | | | | |
| | | | | | | 5,565,383 | |
| | | | | | | | |
| | |
Auto Manufacturers—0.2% | | | | | | | | |
Daimler Finance North America LLC
1.300%, 07/31/15 (144A) | | | 370,000 | | | | 372,171 | |
2.625%, 09/15/16 (144A) | | | 790,000 | | | | 816,940 | |
Ford Motor Co.
4.750%, 01/15/43 | | | 1,020,000 | | | | 919,911 | |
| | | | | | | | |
| | | | | | | 2,109,022 | |
| | | | | | | | |
|
Banks—6.7% | |
Bank of America Corp.
2.600%, 01/15/19 | | | 1,560,000 | | | $ | 1,566,886 | |
3.875%, 03/22/17 (a) | | | 300,000 | | | | 320,195 | |
4.100%, 07/24/23 (a) | | | 1,730,000 | | | | 1,737,340 | |
5.420%, 03/15/17 | | | 1,530,000 | | | | 1,682,064 | |
5.650%, 05/01/18 | | | 1,970,000 | | | | 2,242,390 | |
6.500%, 08/01/16 | | | 1,900,000 | | | | 2,145,267 | |
Barclays Bank plc
6.050%, 12/04/17 (144A) | | | 140,000 | | | | 156,518 | |
10.179%, 06/12/21 (144A) | | | 100,000 | | | | 132,178 | |
BBVA US Senior S.A. Unipersonal | | | | | | | | |
Zero Coupon, 05/16/14 | | | 970,000 | | | | 977,791 | |
4.664%, 10/09/15 | | | 1,050,000 | | | | 1,103,842 | |
BNP Paribas S.A.
2.375%, 09/14/17 | | | 310,000 | | | | 316,499 | |
CIT Group, Inc.
5.000%, 08/01/23 | | | 2,030,000 | | | | 1,953,875 | |
Citigroup, Inc.
4.050%, 07/30/22 | | | 4,180,000 | | | | 4,133,422 | |
5.125%, 05/05/14 | | | 15,000 | | | | 15,219 | |
5.350%, 05/15/23 (b) | | | 560,000 | | | | 491,680 | |
5.500%, 10/15/14 | | | 76,000 | | | | 78,823 | |
5.500%, 09/13/25 | | | 990,000 | | | | 1,042,707 | |
5.900%, 02/15/23 (a) (b) | | | 320,000 | | | | 299,200 | |
5.950%, 01/30/23 (a) (b) | | | 590,000 | | | | 545,957 | |
6.000%, 08/15/17 | | | 650,000 | | | | 740,844 | |
6.010%, 01/15/15 | | | 680,000 | | | | 716,069 | |
6.375%, 08/12/14 | | | 133,000 | | | | 137,472 | |
Commonwealth Bank of Australia
1.250%, 09/18/15 | | | 470,000 | | | | 475,159 | |
3.750%, 10/15/14 (144A) | | | 710,000 | | | | 728,101 | |
5.000%, 10/15/19 (144A) | | | 320,000 | | | | 356,682 | |
Cooperatieve Centrale Raiffeisen-Boerenleenbank BA
4.625%, 12/01/23 | | | 1,400,000 | | | | 1,409,825 | |
5.750%, 12/01/43 | | | 1,480,000 | | | | 1,568,927 | |
11.000%, 06/30/19 (144A) (b) | | | 415,000 | | | | 549,356 | |
Credit Agricole S.A.
8.375%, 10/13/19 (144A) (b) | | | 890,000 | | | | 1,010,150 | |
Goldman Sachs Capital II
4.000%, 01/31/14 (a) (b) | | | 3,490,000 | | | | 2,453,470 | |
Goldman Sachs Group, Inc. (The)
2.375%, 01/22/18 | | | 1,720,000 | | | | 1,726,538 | |
2.900%, 07/19/18 | | | 410,000 | | | | 417,246 | |
5.250%, 07/27/21 | | | 1,680,000 | | | | 1,839,335 | |
6.000%, 05/01/14 | | | 210,000 | | | | 213,750 | |
6.150%, 04/01/18 | | | 30,000 | | | | 34,400 | |
6.250%, 02/01/41 | | | 210,000 | | | | 242,004 | |
6.750%, 10/01/37 | | | 400,000 | | | | 445,018 | |
7.500%, 02/15/19 | | | 20,000 | | | | 24,359 | |
HBOS plc
6.750%, 05/21/18 (144A) | | | 240,000 | | | | 271,470 | |
ING Bank NV
5.800%, 09/25/23 (144A) | | | 1,510,000 | | | | 1,578,847 | |
Intesa Sanpaolo S.p.A.
3.125%, 01/15/16 | | | 1,040,000 | | | | 1,059,824 | |
See accompanying notes to financial statements.
MSF-5
Metropolitan Series Fund
Western Asset Management Strategic Bond Opportunities Portfolio
Schedule of Investments as of December 31, 2013
Corporate Bonds & Notes—(Continued)
| | | | | | | | |
| Security Description | | Principal
Amount* | | | Value | |
|
Banks—(Continued) | |
JPMorgan Chase & Co.
1.100%, 10/15/15 | | | 1,490,000 | | | $ | 1,495,683 | |
3.375%, 05/01/23 (a) | | | 1,550,000 | | | | 1,444,600 | |
4.350%, 08/15/21 | | | 160,000 | | | | 168,627 | |
4.500%, 01/24/22 | | | 160,000 | | | | 169,237 | |
5.150%, 10/01/15 | | | 1,980,000 | | | | 2,116,222 | |
6.125%, 06/27/17 | | | 160,000 | | | | 181,731 | |
M&T Bank Corp.
6.875%, 06/15/16 (144A) | | | 2,540,000 | | | | 2,439,690 | |
Morgan Stanley
0.696%, 10/18/16 (b) | | | 360,000 | | | | 357,035 | |
4.750%, 03/22/17 | | | 140,000 | | | | 152,785 | |
5.450%, 01/09/17 | | | 530,000 | | | | 587,771 | |
5.950%, 12/28/17 | | | 430,000 | | | | 491,284 | |
Nordea Bank AB
4.875%, 05/13/21 (144A) | | | 950,000 | | | | 981,941 | |
Royal Bank of Scotland Group plc
2.550%, 09/18/15 (a) | | | 280,000 | | | | 286,372 | |
5.000%, 10/01/14 | | | 730,000 | | | | 746,025 | |
6.100%, 06/10/23 | | | 780,000 | | | | 786,315 | |
7.648%, 09/30/31 (a) (b) | | | 120,000 | | | | 125,400 | |
Royal Bank of Scotland plc
7.250%, 03/10/14 (AUD) | | | 3,350,000 | | | | 3,012,609 | |
13.125%, 03/19/22 (AUD) (b) | | | 1,580,000 | | | | 1,659,141 | |
Santander US Debt S.A. Unipersonal
3.724%, 01/20/15 (144A) | | | 100,000 | | | | 101,993 | |
State Street Corp.
4.956%, 03/15/18 | | | 320,000 | | | | 347,168 | |
UBS AG
2.250%, 01/28/14 | | | 250,000 | | | | 250,322 | |
3.875%, 01/15/15 | | | 390,000 | | | | 403,203 | |
Wachovia Bank N.A.
6.000%, 11/15/17 | | | 1,990,000 | | | | 2,296,261 | |
Wachovia Capital Trust III
5.570%, 01/31/14 (b) | | | 1,321,000 | | | | 1,208,715 | |
Wells Fargo & Co. | | | | | | | | |
1.500%, 01/16/18 | | | 300,000 | | | | 298,062 | |
3.450%, 02/13/23 | | | 970,000 | | | | 917,072 | |
4.480%, 01/16/24 (144A) | | | 2,596,000 | | | | 2,584,167 | |
4.600%, 04/01/21 (a) | | | 110,000 | | | | 120,585 | |
5.375%, 11/02/43 | | | 660,000 | | | | 675,844 | |
Wells Fargo Capital X
5.950%, 12/01/86 | | | 600,000 | | | | 588,900 | |
| | | | | | | | |
| | | | | | | 65,935,459 | |
| | | | | | | | |
|
Beverages—0.6% | |
Anheuser-Busch InBev Worldwide, Inc.
2.500%, 07/15/22 | | | 280,000 | | | | 258,991 | |
5.000%, 04/15/20 | | | 260,000 | | | | 294,245 | |
5.375%, 01/15/20 | | | 1,110,000 | | | | 1,273,899 | |
Diageo Finance BV
3.250%, 01/15/15 (a) | | | 60,000 | | | | 61,721 | |
Diageo Investment Corp.
2.875%, 05/11/22 | | | 670,000 | | | | 638,664 | |
|
Beverages—(Continued) | |
Heineken NV
1.400%, 10/01/17 (144A) | | | 260,000 | | | | 255,079 | |
Molson Coors Brewing Co.
3.500%, 05/01/22 (a) | | | 60,000 | | | | 58,909 | |
PepsiCo, Inc.
0.700%, 08/13/15 | | | 850,000 | | | | 850,899 | |
4.000%, 03/05/42 | | | 670,000 | | | | 583,455 | |
7.900%, 11/01/18 (a) | | | 76,000 | | | | 94,999 | |
Pernod-Ricard S.A.
2.950%, 01/15/17 (144A) (a) | | | 270,000 | | | | 278,833 | |
4.450%, 01/15/22 (144A) | | | 940,000 | | �� | | 950,861 | |
| | | | | | | | |
| | | | | | | 5,600,555 | |
| | | | | | | | |
|
Building Materials—1.1% | |
Building Materials Corp. of America
7.500%, 03/15/20 (144A) (a) | | | 3,400,000 | | | | 3,672,000 | |
Cemex Finance LLC
9.375%, 10/12/22 (144A) (a) | | | 6,470,000 | | | | 7,294,925 | |
| | | | | | | | |
| | | | | | | 10,966,925 | |
| | | | | | | | |
| | |
Chemicals—0.7% | | | | | | | | |
Alpek S.A. de C.V.
4.500%, 11/20/22 (144A) | | | 890,000 | | | | 845,500 | |
Braskem Finance, Ltd.
5.375%, 05/02/22 (144A) (a) | | | 1,980,000 | | | | 1,847,340 | |
Ecolab, Inc.
4.350%, 12/08/21 | | | 180,000 | | | | 186,648 | |
LyondellBasell Industries NV
5.000%, 04/15/19 | | | 1,190,000 | | | | 1,321,639 | |
Potash Corp. of Saskatchewan, Inc.
4.875%, 03/30/20 | | | 40,000 | | | | 43,277 | |
Rain CII Carbon LLC / CII Carbon Corp.
8.250%, 01/15/21 (144A) | | | 2,650,000 | | | | 2,703,000 | |
| | | | | | | | |
| | | | | | | 6,947,404 | |
| | | | | | | | |
| | |
Coal—1.2% | | | | | | | | |
Arch Coal, Inc.
7.000%, 06/15/19 (a) | | | 2,630,000 | | | | 2,090,850 | |
9.875%, 06/15/19 | | | 1,110,000 | | | | 987,900 | |
CONSOL Energy, Inc.
8.250%, 04/01/20 | | | 3,720,000 | | | | 4,026,900 | |
Natural Resource Partners L.P.
9.125%, 10/01/18 (144A) | | | 720,000 | | | | 736,200 | |
Peabody Energy Corp.
6.500%, 09/15/20 (a) | | | 3,990,000 | | | | 4,199,475 | |
| | | | | | | | |
| | | | | | | 12,041,325 | |
| | | | | | | | |
| | |
Commercial Services—0.8% | | | | | | | | |
NES Rentals Holdings, Inc.
7.875%, 05/01/18 (144A) | | | 990,000 | | | | 1,041,975 | |
Service Corp. International
7.500%, 04/01/27 | | | 350,000 | | | | 369,250 | |
7.625%, 10/01/18 | | | 125,000 | | | | 143,750 | |
See accompanying notes to financial statements.
MSF-6
Metropolitan Series Fund
Western Asset Management Strategic Bond Opportunities Portfolio
Schedule of Investments as of December 31, 2013
Corporate Bonds & Notes—(Continued)
| | | | | | | | |
| Security Description | | Principal
Amount* | | | Value | |
| | |
Commercial Services—(Continued) | | | | | | | | |
United Rentals North America, Inc.
8.375%, 09/15/20 (a) | | | 2,952,000 | | | $ | 3,291,480 | |
WEX, Inc.
4.750%, 02/01/23 (144A) | | | 3,440,000 | | | | 3,164,800 | |
| | | | | | | | |
| | | | | | | 8,011,255 | |
| | | | | | | | |
| | |
Computers—0.0% | | | | | | | | |
Compiler Finance Sub, Inc.
7.000%, 05/01/21 (144A) | | | 200,000 | | | | 198,500 | |
| | | | | | | | |
| | |
Cosmetics/Personal Care—0.1% | | | | | | | | |
First Quality Finance Co., Inc.
4.625%, 05/15/21 (144A) | | | 490,000 | | | | 465,500 | |
| | | | | | | | |
| | |
Diversified Financial Services—2.5% | | | | | | | | |
American Express Co.
6.800%, 09/01/66 (b) | | | 1,650,000 | | | | 1,758,075 | |
American Express Credit Corp.
5.125%, 08/25/14 | | | 60,000 | | | | 61,827 | |
American Honda Finance Corp.
1.000%, 08/11/15 (144A) | | | 700,000 | | | | 702,744 | |
Ausdrill Finance Pty, Ltd.
6.875%, 11/01/19 (144A) (a) | | | 3,050,000 | | | | 2,775,500 | |
Ford Motor Credit Co. LLC
8.125%, 01/15/20 | | | 1,240,000 | | | | 1,550,558 | |
General Electric Capital Corp.
1.625%, 07/02/15 | | | 330,000 | | | | 335,363 | |
4.375%, 09/16/20 | | | 70,000 | | | | 75,865 | |
4.625%, 01/07/21 | | | 40,000 | | | | 43,618 | |
6.375%, 11/15/67 (b) | | | 2,490,000 | | | | 2,701,650 | |
6.875%, 01/10/39 | | | 4,511,000 | | | | 5,799,323 | |
General Motors Financial Co., Inc.
2.750%, 05/15/16 (144A) | | | 30,000 | | | | 30,375 | |
Hyundai Capital America
2.125%, 10/02/17 (144A) | | | 240,000 | | | | 238,359 | |
ILFC E-Capital Trust II
6.250%, 12/21/65 (144A) (b) | | | 330,000 | | | | 311,850 | |
International Lease Finance Corp.
6.250%, 05/15/19 | | | 1,150,000 | | | | 1,244,875 | |
6.500%, 09/01/14 (144A) | | | 50,000 | | | | 51,687 | |
6.750%, 09/01/16 (144A) | | | 250,000 | | | | 278,750 | |
8.250%, 12/15/20 (a) | | | 3,150,000 | | | | 3,685,500 | |
8.750%, 03/15/17 (a) | | | 1,550,000 | | | | 1,825,125 | |
John Deere Capital Corp.
2.250%, 04/17/19 | | | 310,000 | | | | 309,338 | |
Lehman Brothers Holdings Capital Trust VII
5.857%, 01/31/14 (c) | | | 3,870,000 | | | | 387 | |
Lehman Brothers Holdings E-Capital Trust I
3.589%, 08/19/65 (c) | | | 1,190,000 | | | | 119 | |
Lehman Brothers Holdings, Inc.
6.750%, 12/28/17 (c) | | | 3,280,000 | | | | 328 | |
Merrill Lynch & Co., Inc.
6.875%, 04/25/18 | | | 280,000 | | | | 331,063 | |
SLM Corp.
8.000%, 03/25/20 | | | 150,000 | | | | 169,875 | |
|
Diversified Financial Services—(Continued) | |
TMX Finance LLC / TitleMax Finance Corp.
8.500%, 09/15/18 (144A) (a) | | | 360,000 | | | | 383,400 | |
Vesey Street Investment Trust I
4.404%, 09/01/16 (d) | | | 370,000 | | | | 397,273 | |
| | | | | | | | |
| | | | | | | 25,062,827 | |
| | | | | | | | |
| | |
Electric—2.9% | | | | | | | | |
Calpine Corp.
7.500%, 02/15/21 (144A) | | | 1,972,000 | | | | 2,151,945 | |
7.875%, 07/31/20 (144A) | | | 1,000 | | | | 1,095 | |
7.875%, 01/15/23 (144A) | | | 2,309,000 | | | | 2,522,582 | |
Centrais Eletricas Brasileiras S.A.
5.750%, 10/27/21 (144A) (a) | | | 1,930,000 | | | | 1,874,513 | |
Dominion Resources, Inc.
8.875%, 01/15/19 | | | 70,000 | | | | 88,943 | |
DPL, Inc.
7.250%, 10/15/21 | | | 5,500,000 | | | | 5,568,750 | |
Duke Energy Carolinas LLC
5.300%, 02/15/40 | | | 980,000 | | | | 1,064,003 | |
Dynegy Roseton LLC / Dynegy Danskammer LLC Pass-Through Trust
7.670%, 08/11/16 (c) | | | 500,000 | | | | 0 | |
Energy Future Intermediate Holding Co. LLC / EFIH Finance, Inc.
10.000%, 12/01/20 | | | 2,000,000 | | | | 2,125,000 | |
Exelon Corp.
5.625%, 06/15/35 | | | 375,000 | | | | 371,765 | |
FirstEnergy Corp.
4.250%, 03/15/23 | | | 1,910,000 | | | | 1,780,412 | |
7.375%, 11/15/31 | | | 4,200,000 | | | | 4,563,653 | |
Mirant Mid Atlantic Pass-Through Trust
10.060%, 12/30/28 | | | 5,056,588 | | | | 5,625,454 | |
Pacific Gas & Electric Co.
6.050%, 03/01/34 | | | 430,000 | | | | 492,563 | |
8.250%, 10/15/18 | | | 210,000 | | | | 262,642 | |
| | | | | | | | |
| | | | | | | 28,493,320 | |
| | | | | | | | |
| | |
Electronics—0.2% | | | | | | | | |
Rexel S.A.
5.250%, 06/15/20 (144A) | | | 2,210,000 | | | | 2,221,050 | |
Thermo Fisher Scientific, Inc.
3.600%, 08/15/21 | | | 200,000 | | | | 198,209 | |
| | | | | | | | |
| | | | | | | 2,419,259 | |
| | | | | | | | |
| | |
Engineering & Construction—0.4% | | | | | | | | |
Empresas ICA S.A.B. de C.V.
8.375%, 07/24/17 (a) | | | 440,000 | | | | 434,500 | |
8.900%, 02/04/21 (a) | | | 1,250,000 | | | | 1,218,750 | |
OAS Investments GmbH
8.250%, 10/19/19 (144A) | | | 1,930,000 | | | | 1,886,575 | |
| | | | | | | | |
| | | | | | | 3,539,825 | |
| | | | | | | | |
See accompanying notes to financial statements.
MSF-7
Metropolitan Series Fund
Western Asset Management Strategic Bond Opportunities Portfolio
Schedule of Investments as of December 31, 2013
Corporate Bonds & Notes—(Continued)
| | | | | | | | |
| Security Description | | Principal
Amount* | | | Value | |
| | |
Environmental Control—0.0% | | | | | | | | |
Waste Management, Inc.
4.600%, 03/01/21 | | | 180,000 | | | $ | 191,784 | |
7.375%, 05/15/29 | | | 190,000 | | | | 231,188 | |
| | | | | | | | |
| | | | | | | 422,972 | |
| | | | | | | | |
| | |
Food—0.8% | | | | | | | | |
Hawk Acquisition Sub, Inc.
4.250%, 10/15/20 (144A) (a) | | | 1,060,000 | | | | 1,025,550 | |
Kraft Foods Group, Inc.
3.500%, 06/06/22 | | | 690,000 | | | | 672,470 | |
Marfrig Holding Europe B.V.
8.375%, 05/09/18 (a) | | | 2,200,000 | | | | 2,046,000 | |
11.250%, 09/20/21 (144A) (a) | | | 1,850,000 | | | | 1,766,750 | |
Mondelez International, Inc.
5.375%, 02/10/20 | | | 534,000 | | | | 603,094 | |
WM Wrigley Jr. Co.
2.400%, 10/21/18 (144A) (a) | | | 220,000 | | | | 218,651 | |
2.900%, 10/21/19 (144A) | | | 790,000 | | | | 783,469 | |
3.375%, 10/21/20 (144A) (a) | | | 250,000 | | | | 247,129 | |
| | | | | | | | |
| | | | | | | 7,363,113 | |
| | | | | | | | |
| | |
Forest Products & Paper—0.7% | | | | | | | | |
Appvion, Inc.
9.000%, 06/01/20 (144A) (a) | | | 2,060,000 | | | | 2,080,600 | |
Fibria Overseas Finance, Ltd.
6.750%, 03/03/21 | | | 3,110,000 | | | | 3,389,900 | |
7.500%, 05/04/20 (a) | | | 634,000 | | | | 693,438 | |
Resolute Forest Products, Inc.
5.875%, 05/15/23 (144A) (a) | | | 960,000 | | | | 888,000 | |
Smurfit Kappa Treasury Funding, Ltd.
7.500%, 11/20/25 | | | 275,000 | | | | 300,781 | |
| | | | | | | | |
| | | | | | | 7,352,719 | |
| | | | | | | | |
|
Healthcare-Products—0.1% | |
Mallinckrodt International Finance S.A.
4.750%, 04/15/23 (144A) | | | 880,000 | | | | 812,185 | |
Medtronic, Inc.
3.125%, 03/15/22 (a) | | | 60,000 | | | | 58,299 | |
4.450%, 03/15/20 | | | 340,000 | | | | 372,612 | |
| | | | | | | | |
| | | | | | | 1,243,096 | |
| | | | | | | | |
|
Healthcare-Services—1.6% | |
Fresenius Medical Care U.S. Finance, Inc.
6.500%, 09/15/18 (144A) (a) | | | 3,709,000 | | | | 4,191,170 | |
HCA Holdings, Inc.
6.250%, 02/15/21 (a) | | | 1,300,000 | | | | 1,360,125 | |
HCA, Inc.
5.750%, 03/15/14 | | | 90,000 | | | | 90,810 | |
6.375%, 01/15/15 | | | 1,500,000 | | | | 1,575,000 | |
Humana, Inc.
3.150%, 12/01/22 (a) | | | 190,000 | | | | 175,885 | |
7.200%, 06/15/18 | | | 320,000 | | | | 378,576 | |
Radnet Management, Inc.
10.375%, 04/01/18 (a) | | | 1,630,000 | | | | 1,625,925 | |
|
Healthcare-Services—(Continued) | |
Roche Holdings, Inc.
6.000%, 03/01/19 (144A) | | | 428,000 | | | | 500,860 | |
Tenet Healthcare Corp.
6.000%, 10/01/20 (144A) | | | 1,130,000 | | | | 1,179,437 | |
8.125%, 04/01/22 | | | 360,000 | | | | 387,900 | |
UnitedHealth Group, Inc.
5.700%, 10/15/40 | | | 10,000 | | | | 10,956 | |
5.800%, 03/15/36 | | | 10,000 | | | | 11,001 | |
6.000%, 02/15/18 | | | 900,000 | | | | 1,039,783 | |
WellCare Health Plans, Inc.
5.750%, 11/15/20 | | | 1,330,000 | | | | 1,359,925 | |
WellPoint, Inc.
1.250%, 09/10/15 | | | 160,000 | | | | 161,112 | |
3.125%, 05/15/22 | | | 400,000 | | | | 375,152 | |
3.700%, 08/15/21 | | | 340,000 | | | | 338,744 | |
5.875%, 06/15/17 | | | 120,000 | | | | 135,350 | |
7.000%, 02/15/19 | | | 510,000 | | | | 605,113 | |
| | | | | | | | |
| | | | | | | 15,502,824 | |
| | | | | | | | |
|
Holding Companies-Diversified—0.6% | |
DH Services Luxembourg S.a.r.l.
7.750%, 12/15/20 (144A) | | | 5,670,000 | | | | 6,024,375 | |
| | | | | | | | |
|
Home Builders—0.8% | |
Taylor Morrison Communities, Inc.
7.750%, 04/15/20 (144A) | | | 4,432,000 | | | | 4,875,200 | |
William Lyon Homes, Inc.
8.500%, 11/15/20 | | | 2,430,000 | | | | 2,630,475 | |
| | | | | | | | |
| | | | | | | 7,505,675 | |
| | | | | | | | |
|
Household Products/Wares—0.2% | |
Reynolds Group Issuer, Inc. / Reynolds Group Issuer LLC / Reynolds Group Issuer Lu
6.875%, 02/15/21 | | | 480,000 | | | | 517,200 | |
9.000%, 04/15/19 (a) | | | 1,710,000 | | | | 1,833,975 | |
| | | | | | | | |
| | | | | | | 2,351,175 | |
| | | | | | | | |
|
Insurance—0.2% | |
American International Group, Inc.
6.250%, 03/15/87 | | | 620,000 | | | | 620,000 | |
ING U.S., Inc.
2.900%, 02/15/18 | | | 300,000 | | | | 306,836 | |
Teachers Insurance & Annuity Association of America
6.850%, 12/16/39 (144A) | | | 700,000 | | | | 864,072 | |
| | | | | | | | |
| | | | | | | 1,790,908 | |
| | | | | | | | |
|
Internet—0.4% | |
Cogent Communications Group, Inc.
8.375%, 02/15/18 (144A) | | | 3,480,000 | | | | 3,775,800 | |
| | | | | | | | |
|
Iron/Steel—0.7% | |
ArcelorMittal
5.000%, 02/25/17 | | | 380,000 | | | | 407,550 | |
See accompanying notes to financial statements.
MSF-8
Metropolitan Series Fund
Western Asset Management Strategic Bond Opportunities Portfolio
Schedule of Investments as of December 31, 2013
Corporate Bonds & Notes—(Continued)
| | | | | | | | |
| Security Description | | Principal
Amount* | | | Value | |
|
Iron/Steel—(Continued) | |
Cliffs Natural Resources, Inc.
3.950%, 01/15/18 (a) | | | 1,480,000 | | | $ | 1,494,497 | |
4.800%, 10/01/20 (a) | | | 520,000 | | | | 516,836 | |
4.875%, 04/01/21 (a) | | | 100,000 | | | | 97,253 | |
Steel Dynamics, Inc.
7.625%, 03/15/20 | | | 3,710,000 | | | | 4,025,350 | |
| | | | | | | | |
| | | | | | | 6,541,486 | |
| | | | | | | | |
|
Lodging—0.4% | |
Caesars Entertainment Operating Co., Inc.
8.500%, 02/15/20 | | | 320,000 | | | | 308,000 | |
11.250%, 06/01/17 | | | 2,000,000 | | | | 2,035,000 | |
Hilton Worldwide Finance LLC / Hilton Worldwide Finance Corp.
5.625%, 10/15/21 (144A) | | | 1,800,000 | | | | 1,867,500 | |
| | | | | | | | |
| | | | | | | 4,210,500 | |
| | | | | | | | |
|
Media—2.7% | |
21st Century Fox America, Inc.
6.200%, 12/15/34 | | | 10,000 | | | | 11,070 | |
6.650%, 11/15/37 | | | 70,000 | | | | 81,708 | |
CCO Holdings LLC / CCO Holdings Capital Corp.
6.500%, 04/30/21 (a) | | | 2,000,000 | | | | 2,055,000 | |
7.000%, 01/15/19 (a) | | | 90,000 | | | | 94,838 | |
Comcast Cable Communications Holdings, Inc.
9.455%, 11/15/22 | | | 230,000 | | | | 318,567 | |
Comcast Cable Communications LLC
8.875%, 05/01/17 | | | 420,000 | | | | 515,759 | |
Comcast Corp.
5.650%, 06/15/35 | | | 10,000 | | | | 10,651 | |
5.875%, 02/15/18 | | | 150,000 | | | | 172,049 | |
6.500%, 01/15/15 | | | 460,000 | | | | 487,748 | |
CSC Holdings LLC
6.750%, 11/15/21 | | | 2,420,000 | | | | 2,607,550 | |
DISH DBS Corp.
5.000%, 03/15/23 (a) | | | 50,000 | | | | 46,625 | |
6.625%, 10/01/14 | | | 90,000 | | | | 93,600 | |
6.750%, 06/01/21 | | | 115,000 | | | | 121,900 | |
7.875%, 09/01/19 | | | 2,075,000 | | | | 2,375,875 | |
Gannett Co., Inc.
6.375%, 10/15/23 (144A) | | | 940,000 | | | | 972,900 | |
Nara Cable Funding, Ltd.
8.875%, 12/01/18 (144A) | | | 4,260,000 | | | | 4,579,500 | |
NBCUniversal Enterprise, Inc.
1.974%, 04/15/19 (144A) | | | 1,950,000 | | | | 1,907,449 | |
Time Warner Cable, Inc.
4.125%, 02/15/21 | | | 10,000 | | | | 9,478 | |
5.500%, 09/01/41 | | | 330,000 | | | | 273,443 | |
5.875%, 11/15/40 | | | 10,000 | | | | 8,650 | |
6.750%, 06/15/39 | | | 170,000 | | | | 160,089 | |
8.250%, 04/01/19 | | | 850,000 | | | | 995,779 | |
8.750%, 02/14/19 | | | 80,000 | | | | 95,427 | |
Time Warner, Inc.
7.700%, 05/01/32 | | | 800,000 | | | | 1,027,177 | |
|
Media—(Continued) | |
UBM plc
5.750%, 11/03/20 (144A) | | | 50,000 | | | | 51,981 | |
Unitymedia Hessen GmbH & Co. KG / Unitymedia NRW GmbH
5.500%, 01/15/23 (144A) | | | 3,000,000 | | | | 2,910,000 | |
Univision Communications, Inc.
6.875%, 05/15/19 (144A) | | | 1,000,000 | | | | 1,068,750 | |
7.875%, 11/01/20 (144A) | | | 2,700,000 | | | | 2,966,625 | |
Viacom, Inc.
4.250%, 09/01/23 | | | 970,000 | | | | 967,982 | |
| | | | | | | | |
| | | | | | | 26,988,170 | |
| | | | | | | | |
|
Mining—2.8% | |
AngloGold Ashanti Holdings plc
8.500%, 07/30/20 (a) | | | 1,720,000 | | | | 1,776,072 | |
Barminco Finance Pty, Ltd.
9.000%, 06/01/18 (144A) (a) | | | 630,000 | | | | 579,600 | |
Barrick Gold Corp.
3.850%, 04/01/22 | | | 280,000 | | | | 252,176 | |
4.100%, 05/01/23 | | | 1,430,000 | | | | 1,292,564 | |
6.950%, 04/01/19 | | | 380,000 | | | | 438,626 | |
Barrick North America Finance LLC
4.400%, 05/30/21 | | | 510,000 | | | | 491,051 | |
BHP Billiton Finance USA, Ltd.
3.250%, 11/21/21 | | | 590,000 | | | | 586,504 | |
5.000%, 09/30/43 | | | 750,000 | | | | 762,556 | |
FMG Resources (August 2006) Pty, Ltd.
6.375%, 02/01/16 (144A) (a) | | | 4,280,000 | | | | 4,429,800 | |
Freeport-McMoRan Copper & Gold, Inc.
3.100%, 03/15/20 | | | 930,000 | | | | 903,525 | |
3.550%, 03/01/22 | | | 515,000 | | | | 489,456 | |
Midwest Vanadium Pty, Ltd.
11.500%, 02/15/18 (144A) (e) | | | 1,000,000 | | | | 830,000 | |
Mirabela Nickel, Ltd.
3.500%, 03/28/14 (144A) (f) | | | 555,333 | | | | 555,333 | |
8.750%, 04/15/18 (144A) (a) (c) | | | 270,000 | | | | 67,500 | |
Molycorp, Inc.
10.000%, 06/01/20 (a) | | | 2,180,000 | | | | 2,163,650 | |
Rio Tinto Finance USA plc
2.250%, 12/14/18 | | | 240,000 | | | | 238,816 | |
Rio Tinto Finance USA, Ltd.
1.875%, 11/02/15 | | | 10,000 | | | | 10,198 | |
2.500%, 05/20/16 (a) | | | 70,000 | | | | 72,188 | |
3.500%, 11/02/20 (a) | | | 100,000 | | | | 102,097 | |
4.125%, 05/20/21 (a) | | | 130,000 | | | | 134,848 | |
6.500%, 07/15/18 | | | 230,000 | | | | 271,509 | |
9.000%, 05/01/19 | | | 620,000 | | | | 809,486 | |
St Barbara, Ltd.
8.875%, 04/15/18 (144A) | | | 980,000 | | | | 806,050 | |
Thompson Creek Metals Co., Inc.
9.750%, 12/01/17 (a) | | | 2,780,000 | | | | 3,058,000 | |
Vedanta Resources plc
6.750%, 06/07/16 (144A) (a) | | | 2,960,000 | | | | 3,067,300 | |
8.250%, 06/07/21 (a) | | | 1,120,000 | | | | 1,124,200 | |
8.750%, 01/15/14 (144A) (a) | | | 410,000 | | | | 410,000 | |
See accompanying notes to financial statements.
MSF-9
Metropolitan Series Fund
Western Asset Management Strategic Bond Opportunities Portfolio
Schedule of Investments as of December 31, 2013
Corporate Bonds & Notes—(Continued)
| | | | | | | | |
| Security Description | | Principal
Amount* | | | Value | |
|
Mining—(Continued) | |
Xstrata Finance Canada, Ltd.
2.050%, 10/23/15 (144A) | | | 1,440,000 | | | $ | 1,458,327 | |
2.700%, 10/25/17 (144A) | | | 720,000 | | | | 728,173 | |
| | | | | | | | |
| | | | | | | 27,909,605 | |
| | | | | | | | |
|
Miscellaneous Manufacturing—0.3% | |
Eaton Corp.
2.750%, 11/02/22 | | | 3,510,000 | | | | 3,274,332 | |
| | | | | | | | |
|
Oil & Gas—7.2% | |
Anadarko Finance Co.
7.500%, 05/01/31 (a) | | | 80,000 | | | | 97,265 | |
Anadarko Petroleum Corp.
6.375%, 09/15/17 | | | 1,530,000 | | | | 1,756,546 | |
Apache Corp.
3.250%, 04/15/22 (a) | | | 774,000 | | | | 762,587 | |
BP Capital Markets plc
3.245%, 05/06/22 | | | 800,000 | | | | 775,410 | |
3.561%, 11/01/21 | | | 100,000 | | | | 100,781 | |
Calumet Specialty Products Partners L.P. / Calumet Finance Corp.
7.625%, 01/15/22 (144A) | | | 1,860,000 | | | | 1,878,600 | |
Chesapeake Energy Corp.
5.750%, 03/15/23 (a) | | | 3,300,000 | | | | 3,399,000 | |
6.875%, 11/15/20 | | | 760,000 | | | | 858,800 | |
Concho Resources, Inc.
5.500%, 10/01/22 | | | 220,000 | | | | 227,150 | |
6.500%, 01/15/22 (a) | | | 1,400,000 | | | | 1,515,500 | |
ConocoPhillips Holding Co.
6.950%, 04/15/29 (a) | | | 495,000 | | | | 626,362 | |
Continental Resources, Inc.
4.500%, 04/15/23 | | | 580,000 | | | | 587,975 | |
7.125%, 04/01/21 | | | 1,090,000 | | | | 1,235,787 | |
Devon Energy Corp.
3.250%, 05/15/22 | | | 280,000 | | | | 266,994 | |
Devon Financing Corp. LLC
7.875%, 09/30/31 | | | 140,000 | | | | 180,068 | |
Ecopetrol S.A.
5.875%, 09/18/23 | | | 441,000 | | | | 465,255 | |
Halcon Resources Corp.
8.875%, 05/15/21 | | | 4,240,000 | | | | 4,282,400 | |
Hercules Offshore, Inc.
7.125%, 04/01/17 (144A) | | | 3,000,000 | | | | 3,191,250 | |
8.750%, 07/15/21 (144A) (a) | | | 770,000 | | | | 858,550 | |
Hess Corp.
7.875%, 10/01/29 | | | 150,000 | | | | 191,158 | |
8.125%, 02/15/19 | | | 90,000 | | | | 111,790 | |
Kerr-McGee Corp.
6.950%, 07/01/24 | | | 360,000 | | | | 418,198 | |
7.875%, 09/15/31 | | | 405,000 | | | | 506,793 | |
Kodiak Oil & Gas Corp.
8.125%, 12/01/19 | | | 3,250,000 | | | | 3,607,500 | |
Magnum Hunter Resources Corp.
9.750%, 05/15/20 | | | 3,200,000 | | | | 3,456,000 | |
|
Oil & Gas—(Continued) | |
MEG Energy Corp.
6.375%, 01/30/23 (144A) | | | 3,600,000 | | | | 3,622,500 | |
6.500%, 03/15/21 (144A) (a) | | | 290,000 | | | | 305,225 | |
Murphy Oil USA, Inc.
6.000%, 08/15/23 (144A) | | | 660,000 | | | | 663,300 | |
Occidental Petroleum Corp.
2.700%, 02/15/23 (a) | | | 520,000 | | | | 476,044 | |
3.125%, 02/15/22 | | | 310,000 | | | | 301,931 | |
Pacific Drilling V, Ltd.
7.250%, 12/01/17 (144A) | | | 1,760,000 | | | | 1,900,800 | |
Pacific Rubiales Energy Corp.
5.375%, 01/26/19 (144A) | | | 1,660,000 | | | | 1,672,450 | |
Parker Drilling Co.
9.125%, 04/01/18 | | | 3,650,000 | | | | 3,869,000 | |
Petrobras International Finance Co.
5.375%, 01/27/21 | | | 6,020,000 | | | | 5,974,176 | |
5.750%, 01/20/20 (a) | | | 513,000 | | | | 527,846 | |
Plains Exploration & Production Co.
6.500%, 11/15/20 | | | 250,000 | | | | 276,095 | |
8.625%, 10/15/19 | | | 205,000 | | | | 224,939 | |
QEP Resources, Inc.
5.250%, 05/01/23 | | | 2,650,000 | | | | 2,484,375 | |
6.875%, 03/01/21 | | | 2,130,000 | | | | 2,284,425 | |
Quicksilver Resources, Inc.
11.000%, 07/01/21 (144A) (a) | | | 1,320,000 | | | | 1,432,200 | |
Range Resources Corp.
5.000%, 08/15/22 | | | 870,000 | | | | 854,775 | |
5.750%, 06/01/21 (a) | | | 570,000 | | | | 604,200 | |
8.000%, 05/15/19 | | | 2,830,000 | | | | 3,017,487 | |
Reliance Holdings USA, Inc.
5.400%, 02/14/22 | | | 1,860,000 | | | | 1,881,096 | |
Samson Investment Co.
10.500%, 02/15/20 (144A) (a) | | | 3,750,000 | | | | 4,087,500 | |
Sanchez Energy Corp.
7.750%, 06/15/21 (144A) | | | 1,650,000 | | | | 1,687,125 | |
SandRidge Energy, Inc.
7.500%, 02/15/23 | | | 200,000 | | | | 203,000 | |
Sinopec Group Overseas Development 2012, Ltd.
2.750%, 05/17/17 (144A) | | | 690,000 | | | | 705,513 | |
Transocean, Inc.
5.050%, 12/15/16 | | | 290,000 | | | | 320,355 | |
6.375%, 12/15/21 | | | 430,000 | | | | 483,197 | |
| | | | | | | | |
| | | | | | | 71,217,273 | |
| | | | | | | | |
| | |
Oil & Gas Services—1.0% | | | | | | | | |
Baker Hughes, Inc.
3.200%, 08/15/21 (a) | | | 480,000 | | | | 476,595 | |
CGG S.A.
6.500%, 06/01/21 (a) | | | 2,840,000 | | | | 2,911,000 | |
7.750%, 05/15/17 | | | 555,000 | | | | 571,650 | |
Exterran Holdings, Inc.
7.250%, 12/01/18 | | | 2,020,000 | | | | 2,133,625 | |
Hiland Partners L.P. / Hiland Partner Finance Corp.
7.250%, 10/01/20 (144A) | | | 520,000 | | | | 557,700 | |
See accompanying notes to financial statements.
MSF-10
Metropolitan Series Fund
Western Asset Management Strategic Bond Opportunities Portfolio
Schedule of Investments as of December 31, 2013
Corporate Bonds & Notes—(Continued)
| | | | | | | | |
| Security Description | | Principal
Amount* | | | Value | |
| | |
Oil & Gas Services—(Continued) | | | | | | | | |
Key Energy Services, Inc.
6.750%, 03/01/21 | | | 2,150,000 | | | $ | 2,203,750 | |
SESI LLC
7.125%, 12/15/21 | | | 1,050,000 | | | | 1,170,750 | |
| | | | | | | | |
| | | | | | | 10,025,070 | |
| | | | | | | | |
| | |
Packaging & Containers—0.9% | | | | | | | | |
Ardagh Packaging Finance plc
9.125%, 10/15/20 (144A) | | | 4,660,000 | | | | 5,102,700 | |
Ardagh Packaging Finance plc / Ardagh MP Holdings USA, Inc.
9.125%, 10/15/20 (144A) (a) | | | 540,000 | | | | 588,600 | |
Ball Corp.
4.000%, 11/15/23 (a) | | | 770,000 | | | | 689,150 | |
5.000%, 03/15/22 | | | 30,000 | | | | 29,700 | |
5.750%, 05/15/21 | | | 930,000 | | | | 978,825 | |
Graphic Packaging International, Inc.
4.750%, 04/15/21 | | | 360,000 | | | | 356,400 | |
Pactiv LLC
8.375%, 04/15/27 (a) | | | 1,050,000 | | | | 976,500 | |
Rock Tenn Co.
3.500%, 03/01/20 | | | 230,000 | | | | 226,224 | |
4.000%, 03/01/23 | | | 360,000 | | | | 343,833 | |
| | | | | | | | |
| | | | | | | 9,291,932 | |
| | | | | | | | |
| | |
Pharmaceuticals—0.9% | | | | | | | | |
AbbVie, Inc.
1.750%, 11/06/17 | | | 970,000 | | | | 968,338 | |
2.900%, 11/06/22 | | | 590,000 | | | | 551,447 | |
Express Scripts Holding Co.
3.500%, 11/15/16 | | | 1,410,000 | | | | 1,490,675 | |
Forest Laboratories, Inc.
5.000%, 12/15/21 (144A) | | | 1,390,000 | | | | 1,395,213 | |
GlaxoSmithKline Capital plc
2.850%, 05/08/22 | | | 590,000 | | | | 556,456 | |
Lantheus Medical Imaging, Inc.
9.750%, 05/15/17 (a) | | | 1,510,000 | | | | 1,343,900 | |
Pfizer, Inc.
6.200%, 03/15/19 | | | 400,000 | | | | 474,172 | |
Teva Pharmaceutical Finance Co. B.V.
3.650%, 11/10/21 | | | 50,000 | | | | 49,041 | |
Teva Pharmaceutical Finance IV B.V.
3.650%, 11/10/21 | | | 70,000 | | | | 68,657 | |
Valeant Pharmaceuticals International, Inc.
5.625%, 12/01/21 (144A) (a) | | | 970,000 | | | | 974,850 | |
Wyeth LLC
5.950%, 04/01/37 | | | 290,000 | | | | 336,167 | |
Zoetis, Inc.
3.250%, 02/01/23 | | | 240,000 | | | | 224,561 | |
| | | | | | | | |
| | | | | | | 8,433,477 | |
| | | | | | | | |
| | |
Pipelines—2.3% | | | | | | | | |
Access Midstream Partners L.P. / ACMP Finance Corp. | | | | | | | | |
4.875%, 05/15/23 | | | 3,400,000 | | | | 3,281,000 | |
| | |
Pipelines—(Continued) | | | | | | | | |
Atlas Pipeline Partners, L.P.
5.875%, 08/01/23 (144A) | | | 3,290,000 | | | | 3,133,725 | |
El Paso LLC
7.800%, 08/01/31 | | | 67,000 | | | | 67,989 | |
El Paso Natural Gas Co. LLC
8.375%, 06/15/32 | | | 190,000 | | | | 243,825 | |
Enterprise Products Operating LLC
5.700%, 02/15/42 | | | 200,000 | | | | 210,861 | |
9.750%, 01/31/14 | | | 1,010,000 | | | | 1,017,065 | |
Kinder Morgan, Inc.
5.625%, 11/15/23 (144A) | | | 3,180,000 | | | | 3,078,994 | |
MarkWest Energy Partners L.P. / MarkWest Energy Finance Corp. | | | | | | | | |
4.500%, 07/15/23 (a) | | | 2,070,000 | | | | 1,940,625 | |
5.500%, 02/15/23 | | | 1,350,000 | | | | 1,360,125 | |
6.250%, 06/15/22 | | | 970,000 | | | | 1,025,775 | |
6.500%, 08/15/21 (a) | | | 910,000 | | | | 978,250 | |
Regency Energy Partners L.P.
6.500%, 07/15/21 | | | 950,000 | | | | 1,007,000 | |
Rockies Express Pipeline LLC
6.000%, 01/15/19 (144A) | | | 3,260,000 | | | | 3,015,500 | |
Southern Natural Gas Co. LLC
5.900%, 04/01/17 (144A) | | | 10,000 | | | | 11,207 | |
8.000%, 03/01/32 | | | 25,000 | | | | 31,967 | |
Targa Resources Partners L.P. / Targa Resources Partners Finance Corp. | | | | | | | | |
4.250%, 11/15/23 (144A) | | | 1,580,000 | | | | 1,414,100 | |
Williams Cos., Inc. (The)
7.500%, 01/15/31 | | | 45,000 | | | | 47,563 | |
7.750%, 06/15/31 | | | 14,000 | | | | 15,011 | |
7.875%, 09/01/21 | | | 436,000 | | | | 502,756 | |
8.750%, 03/15/32 | | | 255,000 | | | | 297,716 | |
| | | | | | | | |
| | | | | | | 22,681,054 | |
| | | | | | | | |
|
Real Estate—0.2% | |
Country Garden Holdings Co., Ltd.
11.125%, 02/23/18 | | | 324,000 | | | | 359,640 | |
Howard Hughes Corp.
6.875%, 10/01/21 (144A) | | | 1,350,000 | | | | 1,404,000 | |
| | | | | | | | |
| | | | | | | 1,763,640 | |
| | | | | | | | |
|
Retail—0.9% | |
Arcos Dorados Holdings, Inc.
6.625%, 09/27/23 (144A) (a) | | | 1,030,000 | | | | 1,045,965 | |
CST Brands, Inc.
5.000%, 05/01/23 (a) | | | 340,000 | | | | 328,100 | |
CVS Caremark Corp.
2.750%, 12/01/22 | | | 530,000 | | | | 489,176 | |
CVS Pass-Through Trust
6.943%, 01/10/30 | | | 747,374 | | | | 856,566 | |
Dufry Finance SCA
5.500%, 10/15/20 (144A) | | | 4,130,000 | | | | 4,233,250 | |
Limited Brands, Inc.
6.950%, 03/01/33 (a) | | | 60,000 | | | | 59,100 | |
See accompanying notes to financial statements.
MSF-11
Metropolitan Series Fund
Western Asset Management Strategic Bond Opportunities Portfolio
Schedule of Investments as of December 31, 2013
Corporate Bonds & Notes—(Continued)
| | | | | | | | |
| Security Description | | Principal
Amount* | | | Value | |
|
Retail—(Continued) | |
Neiman Marcus Group Ltd., Inc.
8.000%, 10/15/21 (144A) | | | 470,000 | | | $ | 491,150 | |
8.750%, 10/15/21 (144A) (a) (f) | | | 1,250,000 | | | | 1,309,375 | |
| | | | | | | | |
| | | | | | | 8,812,682 | |
| | | | | | | | |
|
Semiconductors—0.1% | |
Magnachip Semiconductor Corp.
6.625%, 07/15/21 (a) | | | 530,000 | | | | 539,275 | |
| | | | | | | | |
|
Software—0.3% | |
Activision Blizzard, Inc.
5.625%, 09/15/21 (144A) | | | 680,000 | | | | 703,800 | |
6.125%, 09/15/23 (144A) | | | 580,000 | | | | 604,650 | |
First Data Corp.
7.375%, 06/15/19 (144A) | | | 1,070,000 | | | | 1,142,225 | |
| | | | | | | | |
| | | | | | | 2,450,675 | |
| | | | | | | | |
|
Telecommunications—4.8% | |
AT&T, Inc.
4.350%, 06/15/45 | | | 1,480,000 | | | | 1,252,956 | |
4.450%, 05/15/21 | | | 300,000 | | | | 315,849 | |
5.500%, 02/01/18 | | | 170,000 | | | | 191,366 | |
Cellco Partnership / Verizon Wireless Capital LLC 8.500%, 11/15/18 | | | 630,000 | | | | 797,664 | |
CenturyLink, Inc.
6.750%, 12/01/23 | | | 760,000 | | | | 769,500 | |
Hughes Satellite Systems Corp.
7.625%, 06/15/21 (a) | | | 1,500,000 | | | | 1,672,500 | |
Inmarsat Finance plc
7.375%, 12/01/17 (144A) (a) | | | 760,000 | | | | 790,400 | |
Intelsat Jackson Holdings S.A.
5.500%, 08/01/23 (144A) | | | 3,160,000 | | | | 3,005,950 | |
7.500%, 04/01/21 (a) | | | 2,673,000 | | | | 2,946,982 | |
Level 3 Financing, Inc.
6.125%, 01/15/21 (144A) | | | 1,380,000 | | | | 1,393,800 | |
Rogers Communications, Inc.
6.800%, 08/15/18 | | | 280,000 | | | | 333,714 | |
SoftBank Corp.
4.500%, 04/15/20 (144A) (a) | | | 1,360,000 | | | | 1,326,000 | |
Sprint Capital Corp.
6.875%, 11/15/28 | | | 5,290,000 | | | | 4,985,825 | |
8.750%, 03/15/32 | | | 2,520,000 | | | | 2,702,700 | |
Sprint Corp.
7.875%, 09/15/23 (144A) | | | 3,160,000 | | | | 3,397,000 | |
T-Mobile USA, Inc.
6.125%, 01/15/22 | | | 880,000 | | | | 895,400 | |
Telecom Italia Capital S.A.
7.175%, 06/18/19 | | | 40,000 | | | | 44,900 | |
Telefonica Emisiones S.A.U.
5.134%, 04/27/20 | | | 140,000 | | | | 148,730 | |
5.462%, 02/16/21 | | | 140,000 | | | | 147,720 | |
5.877%, 07/15/19 | | | 140,000 | | | | 156,114 | |
6.221%, 07/03/17 | | | 40,000 | | | | 45,093 | |
tw telecom holdings, Inc.
6.375%, 09/01/23 (144A) (a) | | | 1,240,000 | | | | 1,289,600 | |
|
Telecommunications—(Continued) | |
UPC Holding B.V.
9.875%, 04/15/18 (144A) | | | 395,000 | | | | 423,638 | |
UPCB Finance III, Ltd.
6.625%, 07/01/20 (144A) | | | 700,000 | | | | 743,750 | |
Verizon Communications, Inc.
2.450%, 11/01/22 (a) | | | 390,000 | | | | 345,246 | |
4.500%, 09/15/20 | | | 760,000 | | | | 813,630 | |
5.150%, 09/15/23 | | | 4,960,000 | | | | 5,325,512 | |
6.350%, 04/01/19 (a) | | | 980,000 | | | | 1,151,882 | |
6.400%, 09/15/33 | | | 3,970,000 | | | | 4,565,980 | |
Wind Acquisition Holdings Finance S.A.
12.250%, 07/15/17 (144A) (a) (f) | | | 3,378,754 | | | | 3,365,286 | |
Windstream Corp.
7.500%, 04/01/23 (a) | | | 2,000,000 | | | | 2,010,000 | |
| | | | | | | | |
| | | | | | | 47,354,687 | |
| | | | | | | | |
| | |
Transportation—0.8% | | | | | | | | |
CMA CGM S.A.
8.500%, 04/15/17 (144A) (a) | | | 1,500,000 | | | | 1,462,500 | |
Florida East Coast Railway Corp.
8.125%, 02/01/17 | | | 2,000,000 | | | | 2,087,500 | |
Gulfmark Offshore, Inc.
6.375%, 03/15/22 | | | 2,080,000 | | | | 2,095,600 | |
Navios Maritime Acquisition Corp.
8.125%, 11/15/21 (144A) | | | 900,000 | | | | 918,000 | |
Watco Cos. LLC / Watco Finance Corp.
6.375%, 04/01/23 (144A) | | | 1,280,000 | | | | 1,267,200 | |
| | | | | | | | |
| | | | | | | 7,830,800 | |
| | | | | | | | |
Total Corporate Bonds & Notes
(Cost $506,635,715) | | | | | | | 501,790,080 | |
| | | | | | | | |
|
| Foreign Government—13.7% | |
| | |
Regional Government—0.2% | | | | | | | | |
Japan Finance Organization for Municipalities
4.000%, 01/13/21 | | | 1,900,000 | | | | 2,026,597 | |
| | | | | | | | |
| | |
Sovereign—13.5% | | | | | | | | |
Argentina Boden Bond
7.000%, 10/03/15 | | | 6,920,000 | | | | 6,766,991 | |
Brazil Notas do Tesouro Nacional
10.000%, 01/01/17 (BRL) | | | 18,099,000 | | | | 7,252,020 | |
10.000%, 01/01/21 (BRL) | | | 53,647,000 | | | | 19,765,153 | |
Hungary Government International Bond
5.750%, 11/22/23 | | | 2,180,000 | | | | 2,190,900 | |
Indonesia Government International Bond
3.750%, 04/25/22 (144A) | | | 280,000 | | | | 252,350 | |
3.750%, 04/25/22 | | | 430,000 | | | | 387,537 | |
4.875%, 05/05/21 | | | 400,000 | | | | 396,000 | |
5.875%, 03/13/20 | | | 300,000 | | | | 317,100 | |
Japan Bank for International Cooperation
2.875%, 02/02/15 | | | 1,580,000 | | | | 1,621,731 | |
Mexican Bonos
6.500%, 06/09/22 (MXN) | | | 540,143,700 | | | | 41,821,267 | |
8.000%, 06/11/20 (MXN) | | | 90,954,000 | | | | 7,783,208 | |
See accompanying notes to financial statements.
MSF-12
Metropolitan Series Fund
Western Asset Management Strategic Bond Opportunities Portfolio
Schedule of Investments as of December 31, 2013
Foreign Government—(Continued)
| | | | | | | | |
| Security Description | | Principal
Amount* | | | Value | |
| | |
Sovereign—(Continued) | | | | | | | | |
Russian Federal Bonds
7.000%, 01/25/23 (RUB) | | | 286,110,000 | | | $ | 8,389,927 | |
7.600%, 07/20/22 (RUB) | | | 489,000,000 | | | | 14,926,788 | |
Russian Foreign Bond - Eurobond
7.500%, 03/31/30 (d) | | | 2,064,205 | | | | 2,405,212 | |
South Africa Government International Bond
5.875%, 09/16/25 (a) | | | 2,310,000 | | | | 2,402,400 | |
Turkey Government International Bond
6.250%, 09/26/22 | | | 4,810,000 | | | | 4,995,185 | |
Venezuela Government International Bond
7.750%, 10/13/19 | | | 15,230,000 | | | | 11,346,350 | |
| | | | | | | | |
| | | | | | | 133,020,119 | |
| | | | | | | | |
Total Foreign Government
(Cost $151,524,113) | | | | | | | 135,046,716 | |
| | | | | | | | |
|
| U.S. Treasury & Government Agencies—13.4% | |
|
Agency Sponsored Mortgage-Backed—10.4% | |
Fannie Mae 15 Yr. Pool
3.500%, TBA (g) | | | 8,400,000 | | | | 8,784,235 | |
5.500%, 12/01/16 | | | 9,633 | | | | 10,232 | |
6.500%, 03/01/16 | | | 688 | | | | 710 | |
6.500%, 09/01/16 | | | 8,383 | | | | 8,699 | |
6.500%, 12/01/16 | | | 10,647 | | | | 11,133 | |
6.500%, 01/01/17 | | | 6,969 | | | | 7,342 | |
Fannie Mae 20 Yr. Pool
4.500%, 04/01/31 | | | 319,834 | | | | 343,766 | |
4.500%, 05/01/31 | | | 918,593 | | | | 987,485 | |
4.500%, 06/01/31 | | | 324,515 | | | | 348,836 | |
8.500%, 08/01/19 | | | 18,562 | | | | 20,277 | |
Fannie Mae 30 Yr. Pool | | | | | | | | |
2.500%, 10/01/42 | | | 1,132,758 | | | | 1,026,600 | |
3.500%, TBA (g) | | | 1,500,000 | | | | 1,490,039 | |
4.000%, TBA (g) | | | 14,400,000 | | | | 14,823,000 | |
4.500%, 10/01/41 | | | 1,448,933 | | | | 1,535,510 | |
4.500%, TBA (g) | | | 4,600,000 | | | | 4,874,023 | |
5.000%, 01/01/39 | | | 29,427 | | | | 32,122 | |
5.000%, 08/01/39 | | | 73,958 | | | | 80,328 | |
5.000%, 11/01/39 | | | 18,033 | | | | 19,743 | |
5.000%, 12/01/39 | | | 49,298 | | | | 53,885 | |
5.000%, 05/01/40 | | | 111,024 | | | | 121,374 | |
5.000%, 07/01/40 | | | 83,279 | | | | 91,094 | |
5.000%, 11/01/40 | | | 2,450,371 | | | | 2,681,772 | |
5.000%, 01/01/41 | | | 77,758 | | | | 84,998 | |
5.000%, 02/01/41 | | | 127,368 | | | | 139,248 | |
5.000%, 04/01/41 | | | 257,133 | | | | 281,255 | |
5.000%, 05/01/41 | | | 5,350,712 | | | | 5,854,578 | |
5.000%, 06/01/41 | | | 493,049 | | | | 539,363 | |
6.000%, 04/01/32 | | | 87,552 | | | | 97,327 | |
6.500%, 08/01/31 | | | 1,443 | | | | 1,603 | |
6.500%, 10/01/31 | | | 2,186 | | | | 2,434 | |
6.500%, 03/01/32 | | | 27,308 | | | | 30,366 | |
6.500%, 06/01/37 | | | 67,416 | | | | 75,089 | |
7.000%, 05/01/26 | | | 1,945 | | | | 2,167 | |
|
Agency Sponsored Mortgage-Backed—(Continued) | |
Fannie Mae 30 Yr. Pool | | | | | | | | |
7.000%, 07/01/30 | | | 308 | | | | 320 | |
7.000%, 12/01/30 | | | 396 | | | | 405 | |
7.000%, 01/01/31 | | | 497 | | | | 559 | |
7.000%, 09/01/31 | | | 7,485 | | | | 8,441 | |
7.000%, 10/01/31 | | | 4,506 | | | | 5,105 | |
7.000%, 11/01/31 | | | 57,469 | | | | 65,033 | |
7.000%, 01/01/32 | | | 13,811 | | | | 15,027 | |
7.000%, 02/01/32 | | | 7,810 | | | | 8,782 | |
7.500%, 12/01/29 | | | 546 | | | | 563 | |
7.500%, 02/01/30 | | | 382 | | | | 391 | |
7.500%, 06/01/30 | | | 848 | | | | 854 | |
7.500%, 08/01/30 | | | 99 | | | | 102 | |
7.500%, 09/01/30 | | | 1,526 | | | | 1,816 | |
7.500%, 11/01/30 | | | 11,537 | | | | 12,467 | |
7.500%, 02/01/31 | | | 6,394 | | | | 6,793 | |
7.500%, 07/01/31 | | | 30,826 | | | | 33,755 | |
8.000%, 08/01/27 | | | 1,617 | | | | 1,842 | |
8.000%, 07/01/30 | | | 1,325 | | | | 1,522 | |
8.000%, 09/01/30 | | | 849 | | | | 955 | |
8.000%, 01/01/31 | | | 43,399 | | | | 48,902 | |
Fannie Mae Pool
3.500%, 08/01/42 | | | 1,427,438 | | | | 1,400,827 | |
3.500%, 12/01/42 | | | 765,306 | | | | 753,904 | |
3.500%, 05/01/43 | | | 195,938 | | | | 193,017 | |
4.000%, 10/01/42 | | | 382,381 | | | | 390,124 | |
5.000%, 05/01/40 | | | 97,832 | | | | 106,999 | |
Fannie Mae REMICS (CMO)
Zero Coupon, 03/25/42 (h) | | | 322,669 | | | | 288,462 | |
0.515%, 05/25/34 (b) | | | 294,587 | | | | 294,096 | |
6.365%, 12/25/40 (b) (i) | | | 2,179,728 | | | | 244,457 | |
6.365%, 01/25/41 (b) (i) | | | 2,963,910 | | | | 439,993 | |
6.385%, 10/25/41 (b) (i) | | | 4,126,082 | | | | 596,826 | |
6.435%, 04/25/42 (b) (i) | | | 2,388,093 | | | | 415,967 | |
6.515%, 07/25/41 (b) (i) | | | 949,644 | | | | 125,770 | |
9.750%, 11/25/18 | | | 551,708 | | | | 625,905 | |
9.750%, 08/25/19 | | | 188,452 | | | | 213,570 | |
10.400%, 04/25/19 | | | 4 | | | | 4 | |
Freddie Mac 15 Yr. Gold Pool
7.000%, 02/01/15 | | | 1,970 | | | | 1,975 | |
7.000%, 05/01/16 | | | 10,093 | | | | 10,476 | |
Freddie Mac 30 Yr. Gold Pool | | | | | | | | |
3.500%, TBA (g) | | | 7,900,000 | | | | 7,838,281 | |
5.000%, 12/01/34 | | | 25,201 | | | | 27,279 | |
5.000%, 11/01/41 | | | 1,762,719 | | | | 1,908,249 | |
6.000%, 12/01/36 | | | 2,719 | | | | 3,000 | |
6.000%, 02/01/37 | | | 97,898 | | | | 107,947 | |
6.500%, 09/01/31 | | | 78,478 | | | | 87,448 | |
7.000%, 03/01/39 | | | 406,338 | | | | 446,885 | |
Freddie Mac 30 Yr. Pool | | | | | | | | |
7.000%, 07/01/31 | | | 2,471 | | | | 2,793 | |
Freddie Mac ARM Non-Gold Pool | | | | | | | | |
1.945%, 02/01/37 (b) | | | 27,636 | | | | 29,013 | |
1.945%, 04/01/37 (b) | | | 64,188 | | | | 68,193 | |
1.949%, 03/01/37 (b) | | | 123,428 | | | | 130,932 | |
2.171%, 05/01/37 (b) | | | 71,977 | | | | 76,416 | |
See accompanying notes to financial statements.
MSF-13
Metropolitan Series Fund
Western Asset Management Strategic Bond Opportunities Portfolio
Schedule of Investments as of December 31, 2013
U.S. Treasury & Government Agencies—(Continued)
| | | | | | | | |
| Security Description | | Principal
Amount* | | | Value | |
|
Agency Sponsored Mortgage-Backed—(Continued) | |
Freddie Mac ARM Non-Gold Pool | | | | | | | | |
2.495%, 05/01/37 (b) | | | 85,349 | | | $ | 89,911 | |
2.508%, 01/01/38 (b) | | | 40,856 | | | | 43,564 | |
2.695%, 02/01/36 (b) | | | 71,847 | | | | 76,824 | |
Freddie Mac Gold Pool | | | | | | | | |
3.500%, 04/01/43 | | | 293,694 | | | | 289,529 | |
4.000%, 10/01/42 | | | 2,284,240 | | | | 2,328,318 | |
Freddie Mac Multifamily Structured Pass-Through Certificates | | | | | | | | |
1.039%, 01/25/20 (b) (i) | | | 210,512 | | | | 10,643 | |
1.217%, 04/25/20 (b) (i) | | | 494,642 | | | | 28,056 | |
1.446%, 12/25/21 (b) (i) | | | 2,297,980 | | | | 199,614 | |
1.490%, 08/25/20 (b) (i) | | | 285,928 | | | | 20,850 | |
1.512%, 06/25/22 (b) (i) | | | 5,320,097 | | | | 522,205 | |
1.575%, 10/25/21 (b) (i) | | | 6,383,525 | | | | 609,607 | |
1.665%, 06/25/20 (b) (i) | | | 481,219 | | | | 38,520 | |
1.666%, 07/25/21 (b) (i) | | | 4,349,383 | | | | 426,909 | |
2.083%, 05/25/18 (b) (i) | | | 6,586,254 | | | | 522,362 | |
Freddie Mac REMICS (CMO) | | | | | | | | |
0.517%, 04/15/33 (b) | | | 74,011 | | | | 74,028 | |
11.565%, 06/15/21 (i) | | | 13 | | | | 246 | |
Ginnie Mae I 30 Yr. Pool | | | | | | | | |
3.500%, TBA (g) | | | 2,100,000 | | | | 2,116,488 | |
5.000%, 01/15/40 | | | 352,245 | | | | 388,655 | |
6.000%, 07/15/38 | | | 38,903 | | | | 43,229 | |
6.500%, 09/15/28 | | | 2,411 | | | | 2,691 | |
6.500%, 10/15/28 | | | 1,613 | | | | 1,800 | |
6.500%, 01/15/29 | | | 19,680 | | | | 21,950 | |
6.500%, 02/15/29 | | | 39,775 | | | | 44,391 | |
6.500%, 06/15/29 | | | 7,976 | | | | 8,897 | |
6.500%, 10/15/30 | | | 2,231 | | | | 2,488 | |
6.500%, 02/15/31 | | | 3,215 | | | | 3,588 | |
7.000%, 06/15/28 | | | 24,439 | | | | 27,361 | |
7.000%, 07/15/29 | | | 1,427 | | | | 1,602 | |
Ginnie Mae II 30 Yr. Pool | | | | | | | | |
3.500%, TBA (g) | | | 9,500,000 | | | | 9,583,496 | |
4.500%, 01/20/40 | | | 52,006 | | | | 55,778 | |
4.500%, 05/20/40 | | | 53,877 | | | | 57,760 | |
4.500%, 07/20/40 | | | 3,067,053 | | | | 3,288,876 | |
4.500%, 03/20/41 | | | 53,083 | | | | 56,989 | |
5.000%, 07/20/40 | | | 1,697,630 | | | | 1,856,519 | |
5.000%, 08/20/40 | | | 856,914 | | | | 943,812 | |
5.000%, 09/20/40 | | | 93,724 | | | | 102,644 | |
5.000%, 11/20/40 | | | 46,042 | | | | 50,172 | |
6.000%, 12/20/36 | | | 23,764 | | | | 26,769 | |
6.000%, 09/20/39 | | | 595,180 | | | | 664,705 | |
6.000%, 09/20/40 | | | 33,345 | | | | 37,143 | |
6.000%, 11/20/40 | | | 535,481 | | | | 598,388 | |
6.000%, 09/20/41 | | | 109,132 | | | | 123,026 | |
Ginnie Mae II ARM Pool | | | | | | | | |
1.540%, 01/20/60 (b) | | | 985,032 | | | | 1,004,815 | |
1.910%, 05/20/60 (b) | | | 921,969 | | | | 950,231 | |
Government National Mortgage Association (CMO) | | | | | | | | |
0.499%, 10/20/60 (b) | | | 4,315,313 | | | | 4,263,909 | |
0.619%, 02/20/61 (b) | | | 308,948 | | | | 305,135 | |
|
Agency Sponsored Mortgage-Backed—(Continued) | |
Government National Mortgage Association (CMO) | | | | | | | | |
0.669%, 01/20/61 (b) | | | 663,567 | | | | 660,746 | |
0.669%, 03/20/61 (b) | | | 262,244 | | | | 261,092 | |
1.164%, 05/20/60 (b) | | | 1,880,419 | | | | 1,906,098 | |
1.317%, 11/20/59 (b) | | | 6,017,908 | | | | 6,131,171 | |
6.333%, 03/20/39 (b) (i) | | | 488,077 | | | | 78,933 | |
6.483%, 01/20/40 (b) (i) | | | 1,914,010 | | | | 329,081 | |
| | | | | | | | |
| | | | | | | 102,784,689 | |
| | | | | | | | |
|
Federal Agencies—1.6% | |
Farmer Mac Guaranteed Notes Trust | | | | | | | | |
5.125%, 04/19/17 (144A) | | | 4,100,000 | | | | 4,635,968 | |
Federal Home Loan Bank | | | | | | | | |
5.500%, 07/15/36 | | | 1,990,000 | | | | 2,302,106 | |
Federal National Mortgage Association | | | | | | | | |
Zero Coupon, 10/09/19 | | | 1,670,000 | | | | 1,419,986 | |
6.250%, 05/15/29 | | | 1,890,000 | | | | 2,369,385 | |
Tennessee Valley Authority | | | | | | | | |
3.875%, 02/15/21 | | | 150,000 | | | | 158,390 | |
4.625%, 09/15/60 | | | 1,260,000 | | | | 1,126,981 | |
5.250%, 09/15/39 | | | 750,000 | | | | 800,486 | |
5.980%, 04/01/36 | | | 2,490,000 | | | | 2,910,939 | |
| | | | | | | | |
| | | | | | | 15,724,241 | |
| | | | | | | | |
|
U.S. Treasury—1.4% | |
U.S. Treasury Bonds | | | | | | | | |
2.750%, 08/15/42 | | | 12,890,000 | | | | 10,213,314 | |
2.875%, 05/15/43 | | | 5,000 | | | | 4,052 | |
3.625%, 08/15/43 | | | 130,000 | | | | 122,769 | |
U.S. Treasury Notes | | | | | | | | |
0.250%, 06/30/14 (a) | | | 10,000 | | | | 10,008 | |
0.250%, 10/31/15 | | | 70,000 | | | | 69,902 | |
0.375%, 11/15/15 (a) | | | 270,000 | | | | 270,158 | |
1.250%, 11/30/18 (a) | | | 930,000 | | | | 910,093 | |
1.375%, 06/30/18 | | | 540,000 | | | | 535,908 | |
1.375%, 09/30/18 (a) | | | 20,000 | | | | 19,756 | |
2.000%, 09/30/20 (a) | | | 390,000 | | | | 381,225 | |
2.750%, 11/15/23 (a) | | | 930,000 | | | | 909,801 | |
| | | | | | | | |
| | | | | | | 13,446,986 | |
| | | | | | | | |
Total U.S. Treasury & Government Agencies
(Cost $131,210,808) | | | | | | | 131,955,916 | |
| | | | | | | | |
|
| Mortgage-Backed Securities—12.1% | |
|
Collateralized Mortgage Obligations—10.2% | |
American Home Mortgage Investment Trust | | | | | | | | |
0.385%, 06/25/45 (b) | | | 983,356 | | | | 863,828 | |
0.455%, 11/25/45 (b) | | | 851,003 | | | | 733,141 | |
Banc of America Funding Trust | | | | | | | | |
0.337%, 05/20/36 (b) | | | 594,811 | | | | 559,675 | |
Banc of America Mortgage Securities, Inc. | | | | | | | | |
2.774%, 09/25/35 (b) | | | 247,510 | | | | 231,922 | |
5.154%, 12/25/34 (b) | | | 16,478 | | | | 16,183 | |
See accompanying notes to financial statements.
MSF-14
Metropolitan Series Fund
Western Asset Management Strategic Bond Opportunities Portfolio
Schedule of Investments as of December 31, 2013
Mortgage-Backed Securities—(Continued)
| | | | | | | | |
| Security Description | | Principal
Amount* | | | Value | |
|
Collateralized Mortgage Obligations—(Continued) | |
Bear Stearns Adjustable Rate Mortgage Trust | | | | | | | | |
2.660%, 10/25/35 (b) | | | 2,436,604 | | | $ | 2,442,808 | |
Bear Stearns Asset Backed Securities Trust | | | | | | | | |
0.395%, 04/25/36 (b) | | | 1,235,864 | | | | 888,322 | |
Citigroup Mortgage Loan Trust, Inc. | | | | | | | | |
2.767%, 12/25/35 (b) | | | 2,971,238 | | | | 2,216,469 | |
CitiMortgage Alternative Loan Trust | | | | | | | | |
34.677%, 07/25/37 (b) | | | 2,882,944 | | | | 4,901,712 | |
Countrywide Alternative Loan Trust | | | | | | | | |
0.397%, 07/20/35 (b) | | | 170,850 | | | | 147,131 | |
0.435%, 01/25/36 (b) | | | 399,494 | | | | 342,548 | |
5.500%, 10/25/33 | | | 17,457 | | | | 18,462 | |
22.306%, 02/25/36 (b) | | | 3,588,206 | | | | 4,823,180 | |
27.942%, 07/25/36 (b) | | | 3,021,603 | | | | 4,638,249 | |
38.012%, 08/25/37 (b) | | | 2,739,036 | | | | 4,890,053 | |
Countrywide Home Loan Mortgage Pass-Through Trust | | | | | | | | |
2.441%, 11/25/34 (b) | | | 172,562 | | | | 137,417 | |
Countrywide Home Loan Reperforming Loan REMIC Trust | | | | | | | | |
0.525%, 03/25/35 (144A) (b) | | | 270,649 | | | | 235,825 | |
0.585%, 11/25/34 (144A) (b) | | | 145,175 | | | | 125,721 | |
Credit Suisse Mortgage Trust | | | | | | | | |
29.620%, 02/25/36 (b) | | | 3,715,697 | | | | 5,368,030 | |
Deutsche ALT-A Securities, Inc. Mortgage Loan Trust | | | | | | | | |
1.763%, 08/25/35 (b) | | | 78,650 | | | | 59,894 | |
DSLA Mortgage Loan Trust | | | | | | | | |
0.376%, 03/19/45 (b) | | | 284,329 | | | | 252,400 | |
1.064%, 03/19/46 (b) | | | 166,091 | | | | 124,898 | |
GreenPoint MTA Trust | | | | | | | | |
0.385%, 06/25/45 (b) | | | 2,388,145 | | | | 2,143,795 | |
GSMPS Mortgage Loan Trust | | | | | | | | |
0.565%, 04/25/36 (144A) (b) | | | 1,290,150 | | | | 1,079,837 | |
GSR Mortgage Loan Trust | | | | | | | | |
2.794%, 10/25/35 (b) | | | 609,173 | | | | 527,821 | |
HarborView Mortgage Loan Trust | | | | | | | | |
0.416%, 01/19/36 (b) | | | 1,396,338 | | | | 923,962 | |
0.516%, 01/19/35 (b) | | | 319,821 | | | | 231,628 | |
0.566%, 11/19/34 (b) | | | 362,765 | | | | 304,619 | |
1.165%, 11/25/47 (b) | | | 2,622,014 | | | | 2,344,760 | |
Impac Secured Assets CMN Owner Trust | | | | | | | | |
0.485%, 03/25/36 (b) | | | 1,438,048 | | | | 975,658 | |
Impac Secured Assets Trust | | | | | | | | |
0.515%, 08/25/36 (b) | | | 211,502 | | | | 205,075 | |
IndyMac INDA Mortgage Loan Trust | | | | | | | | |
2.800%, 11/25/37 (b) | | | 1,603,667 | | | | 1,464,168 | |
IndyMac INDX Mortgage Loan Trust | | | | | | | | |
0.885%, 01/25/35 (b) | | | 732,791 | | | | 556,607 | |
2.475%, 03/25/35 (b) | | | 931,042 | | | | 889,083 | |
4.519%, 08/25/37 (b) | | | 2,655,880 | | | | 2,212,321 | |
JPMorgan Mortgage Trust | | | | | | | | |
6.500%, 01/25/36 | | | 175,829 | | | | 146,590 | |
Lehman Mortgage Trust | | | | | | | | |
6.465%, 02/25/37 (b) (i) | | | 11,316,247 | | | | 2,931,700 | |
|
Collateralized Mortgage Obligations—(Continued) | |
Lehman XS Trust | | | | | | | | |
0.325%, 03/25/47 (b) | | | 4,450,677 | | | | 3,061,403 | |
0.375%, 09/25/46 (b) | | | 420,517 | | | | 305,348 | |
Luminent Mortgage Trust | | | | | | | | |
0.355%, 05/25/46 (b) | | | 1,777,437 | | | | 1,264,314 | |
MASTR Adjustable Rate Mortgages Trust | | | | | | | | |
2.527%, 11/25/35 (144A) (b) | | | 100,277 | | | | 67,188 | |
MASTR Seasoned Securities Trust | | | | | | | | |
3.391%, 10/25/32 (b) | | | 306,491 | | | | 307,393 | |
Merrill Lynch Mortgage Investors Trust
5.047%, 05/25/34 (b) | | | 218,113 | | | | 213,834 | |
Morgan Stanley Mortgage Loan Trust | | | | | | | | |
0.485%, 01/25/35 (b) | | | 2,024,618 | | | | 1,841,492 | |
2.835%, 03/25/36 (b) | | | 239,201 | | | | 186,278 | |
Nomura Resecuritization Trust
2.966%, 08/26/34 (144A) (b) | | | 3,321,513 | | | | 2,305,196 | |
NovaStar Mortgage-Backed Notes
0.355%, 09/25/46 (b) | | | 1,509,490 | | | | 1,262,359 | |
Opteum Mortgage Acceptance Corp. Asset Backed Pass-Through Certificates | | | | | | | | |
0.735%, 02/25/35 (b) | | | 5,000,000 | | | | 4,593,675 | |
Prime Mortgage Trust
5.500%, 05/25/35 (144A) | | | 891,441 | | | | 893,536 | |
6.000%, 05/25/35 (144A) | | | 3,711,132 | | | | 3,737,357 | |
RBSGC Mortgage Loan Trust
0.615%, 01/25/37 (b) | | | 1,588,285 | | | | 1,063,243 | |
Residential Accredit Loans, Inc. Trust
0.345%, 12/25/36 (b) | | | 3,422,231 | | | | 2,369,187 | |
0.355%, 05/25/47 (b) | | | 2,364,177 | | | | 1,831,499 | |
0.365%, 05/25/47 (b) | | | 2,942,428 | | | | 2,282,335 | |
0.375%, 04/25/46 (b) | | | 2,262,244 | | | | 1,119,001 | |
0.425%, 04/25/46 (b) | | | 1,173,797 | | | | 587,759 | |
0.495%, 04/25/46 (b) | | | 1,642,912 | | | | 836,670 | |
22.459%, 05/25/35 (b) | | | 2,086,739 | | | | 2,766,826 | |
45.405%, 11/25/36 (b) | | | 2,008,778 | | | | 3,891,307 | |
Sequoia Mortgage Trust
1.039%, 06/20/33 (b) | | | 268,509 | | | | 257,365 | |
Structured Adjustable Rate Mortgage Loan Trust | | | | | | | | |
0.485%, 10/25/35 (b) | | | 139,387 | | | | 121,149 | |
2.370%, 01/25/35 (b) | | | 1,154,425 | | | | 1,120,485 | |
2.715%, 09/25/35 (b) | | | 1,337,187 | | | | 1,132,692 | |
Structured Asset Mortgage Investments II Trust
0.375%, 05/25/46 (b) | | | 337,846 | | | | 249,701 | |
2.474%, 08/25/35 (b) | | | 165,246 | | | | 162,917 | |
WaMu Mortgage Pass-Through Certificates Trust
0.435%, 12/25/45 (b) | | | 1,222,062 | | | | 1,125,372 | |
0.445%, 11/25/45 (b) | | | 2,001,252 | | | | 1,762,961 | |
0.455%, 07/25/45 (b) | | | 35,513 | | | | 33,196 | |
0.455%, 10/25/45 (b) | | | 1,129,427 | | | | 1,045,684 | |
0.949%, 07/25/47 (b) | | | 347,333 | | | | 116,893 | |
2.240%, 09/25/36 (b) | | | 1,776,167 | | | | 1,482,110 | |
2.369%, 09/25/36 (b) | | | 881,425 | | | | 769,532 | |
2.435%, 10/25/34 (b) | | | 1,569,455 | | | | 1,539,720 | |
Wells Fargo Mortgage Backed Securities Trust
2.626%, 04/25/36 (b) | | | 232,695 | | | | 213,288 | |
2.629%, 10/25/35 (b) | | | 170,753 | | | | 171,896 | |
2.660%, 06/25/35 (b) | | | 143,591 | | | | 145,531 | |
| | | | | | | | |
| | | | | | | 99,193,184 | |
| | | | | | | | |
See accompanying notes to financial statements.
MSF-15
Metropolitan Series Fund
Western Asset Management Strategic Bond Opportunities Portfolio
Schedule of Investments as of December 31, 2013
Mortgage-Backed Securities—(Continued)
| | | | | | | | |
| Security Description | | Principal
Amount* | | | Value | |
|
Commercial Mortgage-Backed Securities—1.9% | |
Americold 2010 LLC Trust
4.954%, 01/14/29 (144A) | | | 500,000 | | | $ | 530,836 | |
Banc of America Commercial Mortgage Trust
5.421%, 09/10/45 (b) | | | 359,000 | | | | 387,110 | |
5.448%, 09/10/47 | | | 150,000 | | | | 160,525 | |
CD Mortgage Trust
5.351%, 01/15/46 (b) | | | 100,000 | | | | 107,387 | |
6.118%, 11/15/44 (b) | | | 420,000 | | | | 467,870 | |
COBALT CMBS Commercial Mortgage Trust
5.526%, 04/15/47 (b) | | | 295,000 | | | | 326,112 | |
Commercial Mortgage Pass-Through Certificates
4.046%, 10/10/46 | | | 1,130,000 | | | | 1,140,463 | |
4.300%, 10/10/46 | | | 340,000 | | | | 341,586 | |
4.715%, 10/10/46 (b) | | | 710,000 | | | | 736,249 | |
4.762%, 10/10/46 (b) | | | 150,000 | | | | 149,955 | |
5.086%, 10/10/46 (b) | | | 70,000 | | | | 69,089 | |
5.173%, 10/10/46 (144A) (b) | | | 274,000 | | | | 241,901 | |
Credit Suisse Commerical Mortgage Trust
5.614%, 01/15/49 (b) | | | 140,000 | | | | 148,623 | |
DBUBS Mortgage Trust
1.435%, 08/10/44 (144A) (b) (i) | | | 3,618,830 | | | | 123,355 | |
Extended Stay America Trust
2.958%, 12/05/31 (144A) | | | 300,000 | | | | 291,119 | |
Greenwich Capital Commercial Funding Corp.
5.820%, 07/10/38 (b) | | | 560,000 | | | | 611,337 | |
GS Mortgage Securities Corp. II
4.271%, 11/10/46 | | | 2,380,000 | | | | 2,439,783 | |
4.649%, 11/10/46 | | | 680,000 | | | | 699,878 | |
5.161%, 11/10/46 (b) | | | 550,000 | | | | 564,801 | |
GS Mortgage Securities Trust
1.724%, 08/10/44 (144A) (b) (i) | | | 1,377,687 | | | | 97,896 | |
4.040%, 07/10/46 (b) | | | 270,000 | | | | 276,570 | |
JPMBB Commercial Mortgage Securities Trust
4.420%, 11/15/45 | | | 750,000 | | | | 766,925 | |
5.081%, 11/15/45 (b) | | | 310,000 | | | | 311,424 | |
5.081%, 11/15/45 (144A) (b) | | | 360,000 | | | | 322,775 | |
JPMorgan Chase Commercial Mortgage Securities Trust
1.567%, 10/15/30 (144A) (b) | | | 1,170,000 | | | | 1,172,229 | |
2.717%, 10/15/30 (144A) (b) | | | 900,000 | | | | 900,728 | |
5.593%, 05/12/45 | | | 130,000 | | | | 142,799 | |
5.874%, 02/12/51 (b) | | | 30,000 | | | | 33,944 | |
LB-UBS Commercial Mortgage Trust
6.164%, 09/15/45 (b) | | | 280,000 | | | | 320,039 | |
ML-CFC Commercial Mortgage Trust
5.485%, 03/12/51 (b) | | | 2,140,000 | | | | 2,353,953 | |
5.894%, 08/12/49 (b) | | | 235,000 | | | | 262,083 | |
Morgan Stanley Bank of America Merrill Lynch Trust
1.887%, 08/15/45 (144A) (b) (i) | | | 3,094,642 | | | | 292,502 | |
2.918%, 02/15/46 | | | 410,000 | | | | 384,099 | |
3.456%, 05/15/46 | | | 510,000 | | | | 482,093 | |
UBS-Barclays Commercial Mortgage Trust
3.317%, 12/10/45 (144A) | | | 370,000 | | | | 347,202 | |
Wachovia Bank Commercial Mortgage Trust
5.383%, 12/15/43 | | | 360,000 | | | | 387,357 | |
5.500%, 04/15/47 | | | 70,000 | | | | 77,379 | |
|
Commercial Mortgage-Backed Securities—(Continued) | |
Wells Fargo Commercial Mortgage Trust
4.218%, 07/15/46 (b) | | | 200,000 | | | | 205,880 | |
WF-RBS Commercial Mortgage Trust
1.120%, 02/15/44 (144A) (b) (i) | | | 4,449,323 | | | | 173,991 | |
| | | | | | | | |
| | | | | | | 18,849,847 | |
| | | | | | | | |
Total Mortgage-Backed Securities
(Cost $117,322,448) | | | | | | | 118,043,031 | |
| | | | | | | | |
|
| Asset-Backed Securities—4.2% | |
| | |
Asset-Backed - Automobile—0.4% | | | | | | | | |
Avis Budget Rental Car Funding AESOP LLC
1.920%, 09/20/19 (144A) | | | 570,000 | | | | 559,117 | |
2.100%, 03/20/19 (144A) | | | 1,100,000 | | | | 1,098,376 | |
2.802%, 05/20/18 (144A) | | | 675,000 | | | | 696,128 | |
3.150%, 03/20/17 (144A) | | | 230,000 | | | | 239,074 | |
Hertz Vehicle Financing LLC
1.830%, 08/25/19 (144A) | | | 790,000 | | | | 773,792 | |
5.290%, 03/25/16 (144A) | | | 580,000 | | | | 606,510 | |
| | | | | | | | |
| | | | | | | 3,972,997 | |
| | | | | | | | |
|
Asset-Backed - Home Equity—0.7% | |
ABFC Trust
0.825%, 03/25/35 (b) | | | 2,482,334 | | | | 1,761,357 | |
Accredited Mortgage Loan Trust
0.400%, 09/25/35 (b) | | | 42,993 | | | | 42,318 | |
ACE Securities Corp. Home Equity Loan Trust
0.505%, 01/25/36 (b) | | | 626,325 | | | | 61,006 | |
Asset Backed Securities Corp. Home Equity Loan Trust
3.017%, 04/15/33 (b) | | | 32,876 | | | | 30,397 | |
Bear Stearns Asset Backed Securities Trust
0.905%, 01/25/34 (b) | | | 32,261 | | | | 30,845 | |
EMC Mortgage Loan Trust
0.615%, 05/25/43 (144A) (b) | | | 1,055,007 | | | | 908,604 | |
0.865%, 01/25/41 (144A) (b) | | | 211,669 | | | | 202,459 | |
Home Equity Mortgage Loan Asset-Backed Trust
0.425%, 06/25/36 (b) | | | 2,295,423 | | | | 568,576 | |
Morgan Stanley Mortgage Loan Trust
0.465%, 03/25/36 (b) | | | 1,012,258 | | | | 421,884 | |
SASCO Mortgage Loan Trust
0.445%, 04/25/35 (b) | | | 36,929 | | | | 36,094 | |
Soundview Home Loan Trust
0.325%, 10/25/36 (b) | | | 3,263,438 | | | | 2,585,155 | |
Structured Asset Securities Corp. Mortgage Loan Trust
0.385%, 02/25/36 (144A) (b) | | | 2,749,716 | | | | 191,719 | |
| | | | | | | | |
| | | | | | | 6,840,414 | |
| | | | | | | | |
|
Asset-Backed - Other—2.3% | |
ACE Home Equity Loan Trust
0.425%, 02/25/31 (b) | | | 296,127 | | | | 274,186 | |
Amortizing Residential Collateral Trust
1.165%, 10/25/34 (b) | | | 993,494 | | | | 975,131 | |
1.965%, 08/25/32 (b) | | | 90,304 | | | | 18,197 | |
See accompanying notes to financial statements.
MSF-16
Metropolitan Series Fund
Western Asset Management Strategic Bond Opportunities Portfolio
Schedule of Investments as of December 31, 2013
Asset-Backed Securities—(Continued)
| | | | | | | | |
| Security Description | | Principal
Amount* | | | Value | |
|
Asset-Backed - Other—(Continued) | |
Bear Stearns Asset Backed Securities Trust
6.000%, 10/25/36 | | | 2,555,561 | | | $ | 2,048,908 | |
Countrywide Asset-Backed Certificates
2.040%, 06/25/34 (b) | | | 230,435 | | | | 153,966 | |
Countrywide Revolving Home Equity Loan Resecuritization Trust
0.467%, 12/15/33 (144A) (b) | | | 383,980 | | | | 297,938 | |
Countrywide Revolving Home Equity Loan Trust
0.307%, 07/15/36 (b) | | | 769,888 | | | | 595,417 | |
First Horizon Asset Backed Trust
0.325%, 10/25/34 (b) | | | 134,674 | | | | 111,458 | |
Greenpoint Manufactured Housing
2.929%, 03/18/29 (b) | | | 550,000 | | | | 473,548 | |
3.556%, 06/19/29 (b) | | | 375,000 | | | | 317,755 | |
3.667%, 02/20/30 (b) | | | 350,000 | | | | 292,217 | |
GSAMP Trust
0.255%, 05/25/36 (b) | | | 740,128 | | | | 146,599 | |
0.365%, 01/25/36 (b) | | | 109,161 | | | | 12,631 | |
1.140%, 06/25/34 (b) | | | 670,000 | | | | 614,869 | |
GSRPM Mortgage Loan Trust
0.465%, 03/25/35 (144A) (b) | | | 1,048,295 | | | | 1,012,001 | |
HLSS Servicer Advance Receivables Backed Notes
1.979%, 08/15/46 (144A) | | | 1,470,000 | | | | 1,470,735 | |
Home Equity Mortgage Loan Asset-Backed Notes
0.335%, 04/25/36 (b) | | | 282,065 | | | | 175,531 | |
HSI Asset Securitization Corp. Trust
0.585%, 11/25/35 (b) | | | 4,000,000 | | | | 2,937,828 | |
Long Beach Mortgage Loan Trust
0.685%, 01/21/31 (b) | | | 24,729 | | | | 22,243 | |
Manufactured Housing Contract Trust Pass-Through Certificates
3.669%, 02/20/32 (b) | | | 375,000 | | | | 338,874 | |
3.669%, 03/13/32 (b) | | | 625,000 | | | | 554,734 | |
Mid-State Trust
7.340%, 07/01/35 | | | 318,715 | | | | 344,459 | |
Origen Manufactured Housing Contract Trust
2.368%, 10/15/37 (b) | | | 2,684,810 | | | | 2,187,112 | |
2.381%, 04/15/37 (b) | | | 2,448,185 | | | | 2,026,392 | |
RAAC Trust
0.415%, 02/25/37 (144A) (b) | | | 861,353 | | | | 829,887 | |
SACO I Trust
0.425%, 06/25/36 (b) | | | 597,726 | | | | 753,936 | |
0.505%, 03/25/36 (b) | | | 173,004 | | | | 224,052 | |
Sail Net Interest Margin Notes
5.500%, 03/27/34 (144A) (c) (e) | | | 35,690 | | | | 0 | |
7.750%, 04/27/33 (144A) (c) (e) | | | 10,486 | | | | 3 | |
Structured Asset Securities Corp.
0.825%, 02/25/35 (b) | | | 1,225,350 | | | | 1,183,070 | |
Trade MAPS 1, Ltd.
0.870%, 12/10/18 (144A) (b) | | | 2,660,000 | | | | 2,664,895 | |
| | | | | | | | |
| | | | | | | 23,058,572 | |
| | | | | | | | |
|
Asset-Backed - Student Loan—0.8% | |
Nelnet Student Loan Trust
0.858%, 03/22/32 (b) | | | 6,650,000 | | | | 6,182,073 | |
Northstar Education Finance, Inc.
1.213%, 10/30/45 (b) | | | 100,000 | | | | 77,837 | |
Pennsylvania Higher Education Assistance Agency
1.669%, 07/25/42 (b) | | | 1,500,000 | | | | 1,488,336 | |
| | | | | | | | |
| | | | | | | 7,748,246 | |
| | | | | | | | |
Total Asset-Backed Securities
(Cost $43,938,885) | | | | | | | 41,620,229 | |
| | | | | | | | |
|
| Preferred Stocks—0.8% | |
|
Commercial Banks—0.7% | |
GMAC Capital Trust I, 8.125% | | | 244,339 | | | | 6,533,625 | |
| | | | | | | | |
|
Diversified Financial Services—0.1% | |
Citigroup Capital XIII, 7.875% | | | 35,900 | | | | 978,275 | |
| | | | | | | | |
Total Preferred Stocks
(Cost $7,190,437) | | | | | | | 7,511,900 | |
| | | | | | | | |
|
| Common Stocks—0.2% | |
|
Marine—0.1% | |
Deep Ocean Group Holding A/S (j) (k) (l) | | | 44,744 | | | | 1,474,561 | |
| | | | | | | | |
|
Real Estate Management & Development—0.1% | |
Realogy Holdings Corp. (k) (l) | | | 14,540 | | | | 719,294 | |
| | | | | | | | |
Total Common Stocks
(Cost $1,380,800) | | | | | | | 2,193,855 | |
| | | | | | | | |
|
| Floating Rate Loan—0.1% (b) | |
|
Software—0.1% | |
First Data Corp. Extended 2018 Term Loan B, 4.164%, 03/23/18
(Cost $1,042,453) | | | 1,047,353 | | | | 1,050,768 | |
| | | | | | | | |
|
| Municipals—0.0% | |
Virginia Housing Development Authority 6.000%, 06/25/34
(Cost $1,291,565) | | | 1,310,435 | | | | 1,355,894 | |
| | | | | | | | |
|
| Warrant—0.0% | |
|
Sovereign—0.0% | |
Venezuela Government Oil-Linked Payment Obligation, Expires 04/15/20 (b)
(Cost $24,160) | | | 4,550 | | | | 112,612 | |
| | | | | | | | |
See accompanying notes to financial statements.
MSF-17
Metropolitan Series Fund
Western Asset Management Strategic Bond Opportunities Portfolio
Schedule of Investments as of December 31, 2013
Purchased Option—0.0%
| | | | | | | | |
| Security Description | | Shares/
Contracts/ Principal
Amount* | | | Value | |
|
Call Options—0.0% | |
OTC - 10 Year Interest Rate Swap, Exercise Rate 2.65%, Expires 01/08/14 (Counterparty - Bank of America Securities LLC)
(Cost $1,853,087) | | | 158,000,000 | | | $ | 0 | |
| | | | | | | | |
|
| Short-Term Investments—16.1% | |
|
Mutual Fund—9.0% | |
State Street Navigator Securities Lending MET Portfolio (m) | | | 88,736,614 | | | | 88,736,614 | |
| | | | | | | | |
|
Repurchase Agreements—7.1% | |
Barclays Capital, Inc.
Repurchase Agreement dated 12/31/13 at 0.010% to be repurchased at $28,735,016 on 01/02/14 collateralized by $28,251,000 U.S. Treasury Note at 2.000% due 04/30/16 with a value $29,309,650. | | | 28,735,000 | | | | 28,735,000 | |
Fixed Income Clearing Corp. Repurchase Agreement dated 12/31/13 at 0.000% to be repurchased at $2,993,000 on 01/02/14, collateralized by $3,335,000 Federal National Mortgage Association at 2.200% due 10/17/22 with a value of $3,057,031. | | | 2,993,000 | | | | 2,993,000 | |
Merrill Lynch Pierce Fenner & Smith Repurchase Agreement dated 12/31/13 at 0.001% to be repurchased at $13,122,001 on 01/02/14, collateralized by $10,582,000 U.S. Treasury Bonds at rates ranging from 4.500% - 6.125%, maturity dates ranging from 11/15/27 - 08/15/39 with a value of $13,384,439. | | | 13,122,000 | | | | 13,122,000 | |
Royal Bank of Scotland Group plc Repurchase Agreement dated 12/31/13 at 0.010% to be repurchased at $25,143,014 on 01/02/14 collteralized by $25,593,000 U.S. Treasury Note at 0.875% due 12/31/16 with a value $25,645,850. | | | 25,143,000 | | | | 25,143,000 | |
| | | | | | | | |
| | | | | | | 69,993,000 | |
| | | | | | | | |
Total Short-Term Investments
(Cost $158,729,614) | | | | | | | 158,729,614 | |
| | | | | | | | |
Total Investments—111.4%
(Cost $1,122,144,085) (n) | | | | | | | 1,099,410,615 | |
Other assets and liabilities (net)—(11.4)% | | | | | | | (112,036,441 | ) |
| | | | | | | | |
| Net Assets—100.0% | | | | | | $ | 987,374,174 | |
| | | | | | | | |
| * | Principal amount stated in U.S. dollars unless otherwise noted. |
| (a) | All or a portion of the security was held on loan. As of December 31, 2013, the market value of securities loaned was $85,929,508 and the collateral received consisted of cash in the amount of $88,736,614 and non-cash collateral with a value of $528,750. The cash collateral is invested in a money market fund managed by an affiliate of the custodian. The non-cash collateral received consists primarily of government securities and bank letters of credit, and is held for the benefit of the Portfolio at the Portfolio’s custodian. The Portfolio cannot repledge or resell this collateral. As such, this collateral is excluded from the Statement of Assets and Liabilities. |
| (b) | Variable or floating rate security. The stated rate represents the rate at December 31, 2013. Maturity date shown for callable securities reflects the earliest possible call date. |
| (c) | Non-income producing; Security is in default and/or issuer is in bankruptcy. |
| (d) | Security is a “step-up” bond where coupon increases or steps up at a predetermined date. Rate shown is current coupon rate. |
| (e) | Restricted securities are not registered under the Securities Act of 1933 and are subject to legal restrictions on resale. These securities generally may be resold in transactions exempt from registration or to the public if the securities are subsequently registered. Disposal of these securities may involve time-consuming negotiations and prompt sale at an acceptable price may be difficult. As of December 31, 2013, the market value of restricted securities was $830,003, which is 0.1% of net assets. See details shown in the Restricted Securities table that follows. |
| (f) | Payment-in-kind security for which part of the income earned may be paid as additional principal. |
| (g) | TBA (To Be Announced) Securities are purchased on a forward commitment basis with an approximate principal amount and no defined maturity date. The actual principal and maturity date will be determined upon settlement date. |
| (h) | Principal only security. |
| (i) | Interest only security. |
| (j) | Security was valued in good faith under procedures approved by the Board of Trustees. As of December 31, 2013, these securities represent 0.1% of net assets. |
| (k) | Non-income producing security. |
| (l) | Illiquid security. As of December 31, 2013, these securities represent 0.2% of net assets. |
| (m) | Represents investment of cash collateral received from securities lending transactions. |
| (n) | As of December 31, 2013, the aggregate cost of investments for federal income tax purposes was $1,125,361,421. The aggregate unrealized appreciation and depreciation of investments were $27,577,663 and $(53,528,469), respectively, resulting in net unrealized depreciation of $(25,950,806) for federal income tax purposes. |
| (144A)— | Securities exempt from registration under Rule 144A of the Securities Act of 1933. These securities may be resold in transactions exempt from registration, normally to qualified institutional buyers. As of December 31, 2013, the market value of 144A securities was $213,199,036, which is 21.6% of net assets. |
| (ARM)— | Adjustable-Rate Mortgage |
| (CMO)— | Collateralized Mortgage Obligation |
| (REMIC)— | Real Estate Mortgage Investment Conduit |
See accompanying notes to financial statements.
MSF-18
Metropolitan Series Fund
Western Asset Management Strategic Bond Opportunities Portfolio
Schedule of Investments as of December 31, 2013
| | | | | | | | | | | | | | |
Restricted Securities | | Acquisition
Date | | Principal
Amount | | | Cost | | | Value | |
Midwest Vanadium Pty, Ltd. | | 05/05/11-05/24/11 | | $ | 1,000,000 | | | $ | 1,031,250 | | | $ | 830,000 | |
Sail Net Interest Margin Notes | | 05/22/03 | | | 10,486 | | | | 779 | | | | 3 | |
Sail Net Interest Margin Notes | | 12/17/04 | | | 35,690 | | | | 35,908 | | | | 0 | |
Forward Foreign Currency Exchange Contracts
| | | | | | | | | | | | | | | | | | |
Contracts to Buy | | | Counterparty | | Settlement
Date | | | In Exchange
for | | | Unrealized
Appreciation/
(Depreciation) | |
| CHF | | | 17,900,000 | | | Bank of America N.A. | | | 01/27/14 | | | $ | 19,700,422 | | | $ | 369,223 | |
| CLP | | | 7,480,000,000 | | | Bank of America N.A. | | | 01/27/14 | | | | 14,731,079 | | | | (534,880 | ) |
| EUR | | | 2,510,000 | | | Goldman Sachs International | | | 01/27/14 | | | | 3,430,643 | | | | 22,324 | |
| EUR | | | 1,100,759 | | | UBS AG | | | 02/18/14 | | | | 1,483,459 | | | | 30,826 | |
| GBP | | | 3,000,000 | | | Bank of America N.A. | | | 01/27/14 | | | | 4,896,492 | | | | 70,568 | |
| SEK | | | 35,670,000 | | | Citibank N.A. | | | 02/18/14 | | | | 5,447,359 | | | | 94,056 | |
| SGD | | | 10,799,000 | | | Citibank N.A. | | | 02/18/14 | | | | 8,675,011 | | | | (117,542 | ) |
| | | | |
Contracts to Deliver | | | | | | | | | | | | |
| AUD | | | 3,402,830 | | | Bank of America N.A. | | | 01/28/14 | | | | 3,267,465 | | | | 234,047 | |
| AUD | | | 11,787,269 | | | Citibank N.A. | | | 02/18/14 | | | | 11,100,543 | | | | 607,451 | |
| CAD | | | 5,400,000 | | | Goldman Sachs International | | | 01/27/14 | | | | 5,232,507 | | | | 151,985 | |
| CAD | | | 5,070,000 | | | Goldman Sachs International | | | 01/27/14 | | | | 4,754,960 | | | | (15,086 | ) |
| CHF | | | 17,900,000 | | | Bank of America N.A. | | | 01/27/14 | | | | 20,090,080 | | | | 20,435 | |
| CLP | | | 7,480,000,000 | | | Bank of America N.A. | | | 01/27/14 | | | | 14,078,675 | | | | (117,524 | ) |
| JPY | | | 3,964,000,000 | | | Bank of America N.A. | | | 01/27/14 | | | | 40,401,075 | | | | 2,756,274 | |
| MXN | | | 188,070,000 | | | Barclays Bank plc | | | 01/27/14 | | | | 14,568,567 | | | | 192,160 | |
| | | | | | | | | | | | | | | | | | |
Net Unrealized Appreciation | | | $ | 3,764,317 | |
| | | | | | | | | | | | | | | | | | |
Futures Contracts
| | | | | | | | | | | | | | | | | | | | |
Futures Contracts—Long | | Expiration
Date | | | Number of
Contracts | | | Notional
Amount | | | Unrealized
Appreciation/
(Depreciation) | |
U.S. Treasury Note 10 Year Futures | | | 03/20/14 | | | | 356 | | | | USD | | | | 44,629,095 | | | $ | (824,407 | ) |
Ultra Long U.S. Treasury Bond Futures | | | 03/20/14 | | | | 297 | | | | USD | | | | 41,096,020 | | | | (629,770 | ) |
|
Futures Contracts—Short | |
U.S. Treasury Long Bond Futures | | | 03/20/14 | | | | (118 | ) | | | USD | | | | (15,453,554 | ) | | | 312,679 | |
U.S. Treasury Note 2 year Futures | | | 03/31/14 | | | | (159 | ) | | | USD | | | | (35,020,483 | ) | | | 70,296 | |
U.S. Treasury Note 5 Year Futures | | | 03/31/14 | | | | (17 | ) | | | USD | | | | (2,058,140 | ) | | | 29,827 | |
| | | | | | | | | | | | | | | | | | | | |
Net Unrealized Depreciation | | | $ | (1,041,375 | ) |
| | | | | | | | | | | | | | | | | | | | |
Written Options
| | | | | | | | | | | | | | | | | | | | | | | | | | | | |
Interest Rate Swaptions | | Exercise
Rate | | Counterparty | | Floating Rate
Index | | Pay/
Receive
Floating
Rate | | Expiration
Date | | | Notional
Amount | | | Premiums
Received | | | Market
Value | | | Unrealized
Appreciation | |
Put - OTC - 10 Year Interest Rate Swap | | 3.750% | | Bank of America N.A. | | 3-Month USD-LIBOR | | Pay | | | 01/08/14 | | | $ | (158,000,000 | ) | | $ | (1,690,535 | ) | | $ | (1 | ) | | $ | 1,690,534 | |
| | | | | | | | | | | | | | | | | | | | | | | | | | | | |
See accompanying notes to financial statements.
MSF-19
Metropolitan Series Fund
Western Asset Management Strategic Bond Opportunities Portfolio
Schedule of Investments as of December 31, 2013
Swap Agreements
Centrally Cleared Interest Rate Swap agreements
| | | | | | | | | | | | | | | | | | | | | | | | |
Pay/Receive Floating Rate | | Floating
Rate Index | | | Fixed
Rate | | | Maturity
Date | | | Notional
Amount | | | Unrealized
Appreciation | |
Receive | | | 3-Month USD-LIBOR | | | | 3.100 | % | | | 01/10/24 | | | | USD | | | | 158,000,000 | | | $ | 63,646 | |
| | | | | | | | | | | | | | | | | | | | | | | | |
| (LIBOR)— | London InterBank Offered Rate |
| (USD)— | United States Dollar |
See accompanying notes to financial statements.
MSF-20
Metropolitan Series Fund
Western Asset Management Strategic Bond Opportunities Portfolio
Schedule of Investments as of December 31, 2013
Fair Value Hierarchy
Accounting principles generally accepted in the United States of America (“GAAP”) define fair market value as the price that the Portfolio would receive to sell an asset or pay to transfer a liability in an orderly transaction between market participants at the measurement date. It establishes a fair value hierarchy that prioritizes inputs to valuation methods and requires disclosure of the fair value hierarchy that segregates fair value measurements into three levels. Levels 1, 2 and 3 of the fair value hierarchy are defined as follows:
Level 1 - unadjusted quoted prices in active markets for identical investments
Level 2 - other significant observable inputs (including, but not limited to, unadjusted quoted prices for similar investments in markets that are either active or inactive; inputs other than quoted prices that are observable such as interest rates, yield curves, volatilities, prepayment speeds, loss severities, credit risks, default rates, etc.)
Level 3 - significant unobservable inputs based on the best information available in the circumstances, to the extent observable inputs are unavailable (including the Portfolio’s own assumptions in determining the fair value of investments)
The inputs or methodologies used for valuing investments are not necessarily an indication of the risk associated with investing in them. Changes to the inputs or methodologies used may result in transfers between levels, which will be recognized as of the beginning of the reporting period. Information on transfers between Level 1 and Level 2, if any, will be disclosed following the fair value hierarchy table below. A reconciliation of Level 3 securities, if any, will also be disclosed following the fair value hierarchy table. For more information about the Portfolio’s policy regarding the valuation of investments, please refer to the Notes to Financial Statements.
The following table summarizes the fair value hierarchy of the Portfolio’s investments as of December 31, 2013:
| | | | | | | | | | | | | | | | |
| Description | | Level 1 | | | Level 2 | | | Level 3 | | | Total | |
Total Corporate Bonds & Notes* | | $ | — | | | $ | 501,790,080 | | | $ | — | | | $ | 501,790,080 | |
Total Foreign Government* | | | — | | | | 135,046,716 | | | | — | | | | 135,046,716 | |
Total U.S. Treasury & Government Agencies* | | | — | | | | 131,955,916 | | | | — | | | | 131,955,916 | |
Total Mortgage-Backed Securities* | | | — | | | | 118,043,031 | | | | — | | | | 118,043,031 | |
Total Asset-Backed Securities* | | | — | | | | 41,620,229 | | | | — | | | | 41,620,229 | |
Total Preferred Stocks* | | | 7,511,900 | | | | — | | | | — | | | | 7,511,900 | |
| Common Stocks | | | | | | | | | | | | | | | | |
Marine | | | — | | | | — | | | | 1,474,561 | | | | 1,474,561 | |
Real Estate Management & Development | | | 719,294 | | | | — | | | | — | | | | 719,294 | |
Total Common Stocks | | | 719,294 | | | | — | | | | 1,474,561 | | | | 2,193,855 | |
Total Floating Rate Loan* | | | — | | | | 1,050,768 | | | | — | | | | 1,050,768 | |
Total Municipals* | | | — | | | | 1,355,894 | | | | — | | | | 1,355,894 | |
Total Warrant* | | | — | | | | 112,612 | | | | — | | | | 112,612 | |
Total Purchased Option* | | | — | | | | 0 | | | | — | | | | 0 | |
| Short-Term Investments | | | | | | | | | | | | | | | | |
Mutual Fund | | | 88,736,614 | | | | — | | | | — | | | | 88,736,614 | |
Repurchase Agreements | | | — | | | | 69,993,000 | | | | — | | | | 69,993,000 | |
Total Short-Term Investments | | | 88,736,614 | | | | 69,993,000 | | | | — | | | | 158,729,614 | |
Total Investments | | $ | 96,967,808 | | | $ | 1,000,968,246 | | | $ | 1,474,561 | | | $ | 1,099,410,615 | |
| | | | | | | | | | | | | | | | | |
Collateral for securities loaned (Liability) | | $ | — | | | $ | (88,736,614 | ) | | $ | — | | | $ | (88,736,614 | ) |
| Forward Contracts | | | | | | | | | | | | | | | | |
Forward Foreign Currency Exchange Contracts (Unrealized Appreciation) | | $ | — | | | $ | 4,549,349 | | | $ | — | | | $ | 4,549,349 | |
Forward Foreign Currency Exchange Contracts (Unrealized Depreciation) | | | — | | | | (785,032 | ) | | | — | | | | (785,032 | ) |
Total Forward Contracts | | $ | — | | | $ | 3,764,317 | | | $ | — | | | $ | 3,764,317 | |
| Futures Contracts | | | | | | | | | | | | | | | | |
Futures Contracts (Unrealized Appreciation) | | $ | 412,802 | | | $ | — | | | $ | — | | | $ | 412,802 | |
Futures Contracts (Unrealized Depreciation) | | �� | (1,454,177 | ) | | | — | | | | — | | | | (1,454,177 | ) |
Total Futures Contracts | | $ | (1,041,375 | ) | | $ | — | | | $ | — | | | $ | (1,041,375 | ) |
Written Options at Value | | | — | | | | (1 | ) | | | — | | | | (1 | ) |
| Centrally Cleared Swap Contracts | | | | | | | | | | | | | | | | |
Centrally Cleared Swap Contracts (Unrealized Appreciation) | | $ | — | | | $ | 63,646 | | | $ | — | | | $ | 63,646 | |
| * | See Schedule of Investments for additional detailed categorizations. |
See accompanying notes to financial statements.
MSF-21
Metropolitan Series Fund
Western Asset Management Strategic Bond Opportunities Portfolio
Schedule of Investments as of December 31, 2013
Fair Value Hierarchy—(Continued)
Following is a reconciliation of Level 3 assets for which significant unobservable inputs were used to determine fair value:
| | | | | | | | | | | | | | | | | | | | | | | | | | | | | | | | | | | | | | | | |
Investments in
Securities | | Balance as of
December 31,
2012 | | | Accrued
Discount/
(Premium) | | | Realized
Gain/
(Loss) | | | Change in
Unrealized
Appreciation/
(Depreciation) | | | Purchases | | | Sales | | | Transfers
in to
Level 3 | | | Transfers
out of
Level 3 | | | Balance as of
December 31,
2013 | | | Change in
Unrealized
Appreciation/
(Depreciation)
from investments
still held at
December 31, 2013 | |
| Common Stocks | | | | | | | | | | | | | | | | | | | | | | | | | | | | | | | | | | | | | | | | |
Marine | | $ | 907,078 | | | $ | — | | | $ | — | | | $ | 567,483 | | | $ | — | | | $ | — | | | $ | — | | | $ | — | | | $ | 1,474,561 | | | $ | 567,483 | |
| | | | | | | | | | | | | | | | | | | | | | | | | | | | | | | | | | | | | | | | |
See accompanying notes to financial statements.
MSF-22
Metropolitan Series Fund
Western Asset Management Strategic Bond Opportunities Portfolio
Statement of Assets and Liabilities
December 31, 2013
| | | | |
Assets | | | | |
Investments at value (a) (b) | | $ | 1,099,410,615 | |
Cash denominated in foreign currencies (c) | | | 3,420,317 | |
Cash collateral (d) | | | 6,246,697 | |
Unrealized appreciation on forward foreign currency exchange contracts | | | 4,549,349 | |
Receivable for: | | | | |
Investments sold | | | 100,311 | |
Fund shares sold | | | 1,655,673 | |
Interest | | | 11,417,910 | |
Variation margin on swap contracts | | | 913,751 | |
Prepaid expenses | | | 189,336 | |
Other assets | | | 168,573 | |
| | | | |
Total Assets | | | 1,128,072,532 | |
Liabilities | | | | |
Due to custodian | | | 282,673 | |
Written options at value (e) | | | 1 | |
Unrealized depreciation on forward foreign currency exchange contracts | | | 785,032 | |
Collateral for securities loaned | | | 88,736,614 | |
Payables for: | | | | |
TBA securities purchased | | | 49,649,453 | |
Fund shares redeemed | | | 291,205 | |
Variation margin on futures contracts | | | 245,594 | |
Accrued expenses: | | | | |
Management fees | | | 466,793 | |
Distribution and service fees | | | 59,053 | |
Deferred trustees’ fees | | | 51,451 | |
Other expenses | | | 130,489 | |
| | | | |
Total Liabilities | | | 140,698,358 | |
| | | | |
Net Assets | | $ | 987,374,174 | |
| | | | |
Net assets consist of: | | | | |
Paid in surplus | | $ | 976,415,550 | |
Undistributed net investment income | | | 48,570,607 | |
Accumulated net realized loss | | | (19,498,774 | ) |
Unrealized depreciation on investments, written options, futures contracts, swap contracts and foreign currency transactions | | | (18,113,209 | ) |
| | | | |
Net Assets | | $ | 987,374,174 | |
| | | | |
Net Assets | | | | |
Class A | | $ | 682,734,872 | |
Class B | | | 238,412,809 | |
Class E | | | 66,226,493 | |
Capital Shares Outstanding* | | | | |
Class A | | | 50,769,957 | |
Class B | | | 17,834,329 | |
Class E | | | 4,944,491 | |
Net Asset Value, Offering Price and Redemption Price Per Share | | | | |
Class A | | $ | 13.45 | |
Class B | | | 13.37 | |
Class E | | | 13.39 | |
| * | The Portfolio is authorized to issue an unlimited number of shares. |
| (a) | Identified cost of investments was $1,122,144,085. |
| (b) | Includes securities loaned at value of $85,929,508. |
| (c) | Identified cost of cash denominated in foreign currencies was $3,436,113. |
| (d) | Includes collateral of $1,685,997 for futures contracts and $4,560,700 for centrally cleared swap contracts. |
| (e) | Premiums received on written options were $1,690,535. |
Statement of Operations
Year Ended December 31, 2013
| | | | |
Investment Income | | | | |
Dividends | | $ | 594,292 | |
Interest | | | 51,459,612 | |
Securities lending income | | | 402,834 | |
| | | | |
Total investment income | | | 52,456,738 | |
Expenses | | | | |
Management fees | | | 5,979,637 | |
Administration fees | | | 18,035 | |
Custodian and accounting fees | | | 270,667 | |
Distribution and service fees—Class B | | | 634,298 | |
Distribution and service fees—Class E | | | 104,748 | |
Audit and tax services | | | 84,525 | |
Legal | | | 27,754 | |
Trustees’ fees and expenses | | | 35,357 | |
Shareholder reporting | | | 104,054 | |
Insurance | | | 5,347 | |
Miscellaneous | | | 10,397 | |
| | | | |
Total expenses | | | 7,274,819 | |
Less management fee waiver | | | (403,852 | ) |
| | | | |
Net expenses | | | 6,870,967 | |
| | | | |
Net Investment Income | | | 45,585,771 | |
| | | | |
Net Realized and Unrealized Gain (Loss) | | | | |
| Net realized gain (loss) on: | | | | |
Investments | | | (2,889,207 | ) |
Futures contracts | | | (1,472,233 | ) |
Written options | | | 9,038,335 | |
Foreign currency transactions | | | (1,266,719 | ) |
| | | | |
Net realized gain | | | 3,410,176 | |
| | | | |
| Net change in unrealized appreciation (depreciation) on: | | | | |
Investments | | | (42,809,975 | ) |
Futures contracts | | | (364,369 | ) |
Written options | | | 2,359,367 | |
Swap contracts | | | 63,646 | |
Foreign currency transactions | | | 3,955,354 | |
| | | | |
Net change in unrealized depreciation | | | (36,795,977 | ) |
| | | | |
Net realized and unrealized loss | | | (33,385,801 | ) |
| | | | |
Net Increase in Net Assets From Operations | | $ | 12,199,970 | |
| | | | |
See accompanying notes to financial statements.
MSF-23
Metropolitan Series Fund
Western Asset Management Strategic Bond Opportunities Portfolio
Statements of Changes in Net Assets
| | | | | | | | |
| | | Year Ended
December 31,
2013 | | | Year Ended
December 31,
2012 | |
Increase (Decrease) in Net Assets: | | | | | | | | |
From Operations | | | | | | | | |
Net investment income | | $ | 45,585,771 | | | $ | 36,210,811 | |
Net realized gain | | | 3,410,176 | | | | 23,772,363 | |
Net change in unrealized appreciation (depreciation) | | | (36,795,977 | ) | | | 48,038,444 | |
| | | | | | | | |
Increase in net assets from operations | | | 12,199,970 | | | | 108,021,618 | |
| | | | | | | | |
From Distributions to Shareholders | | | | | | | | |
Net investment income | | | | | | | | |
Class A | | | (31,203,024 | ) | | | (22,840,121 | ) |
Class B | | | (12,259,852 | ) | | | (9,409,912 | ) |
Class E | | | (3,437,042 | ) | | | (2,674,216 | ) |
| | | | | | | | |
Total distributions | | | (46,899,918 | ) | | | (34,924,249 | ) |
| | | | | | | | |
Increase (decrease) in net assets from capital share transactions | | | (28,460,603 | ) | | | 48,978,461 | |
| | | | | | | | |
Total increase (decrease) in net assets | | | (63,160,551 | ) | | | 122,075,830 | |
| | |
Net Assets | | | | | | | | |
Beginning of period | | | 1,050,534,725 | | | | 928,458,895 | |
| | | | | | | | |
End of period | | $ | 987,374,174 | | | $ | 1,050,534,725 | |
| | | | | | | | |
Undistributed Net Investment Income | | | | | | | | |
End of period | | $ | 48,570,607 | | | $ | 46,724,426 | |
| | | | | | | | |
Other Information:
Capital Shares
Transactions in capital shares were as follows:
| | | | | | | | | | | | | | | | |
| | | Year Ended
December 31, 2013 | | | Year Ended
December 31, 2012 | |
| | | Shares | | | Value | | | Shares | | | Value | |
Class A | | | | | | | | | | | | | | | | |
Sales | | | 7,876,373 | | | $ | 106,738,077 | | | | 8,359,614 | | | $ | 112,147,731 | |
Reinvestments | | | 2,282,591 | | | | 31,203,024 | | | | 1,759,639 | | | | 22,840,121 | |
Redemptions | | | (10,051,818 | ) | | | (142,052,123 | ) | | | (3,966,827 | ) | | | (53,182,535 | ) |
| | | | | | | | | | | | | | | | |
Net increase | | | 107,146 | | | $ | (4,111,022 | ) | | | 6,152,426 | | | $ | 81,805,317 | |
| | | | | | | | | | | | | | | | |
Class B | | | | | | | | | | | | | | | | |
Sales | | | 1,436,217 | | | $ | 19,527,805 | | | | 1,263,282 | | | $ | 16,916,948 | |
Reinvestments | | | 900,136 | | | | 12,259,852 | | | | 727,758 | | | | 9,409,912 | |
Redemptions | | | (3,780,484 | ) | | | (51,107,823 | ) | | | (3,868,210 | ) | | | (51,842,372 | ) |
| | | | | | | | | | | | | | | | |
Net decrease | | | (1,444,131 | ) | | $ | (19,320,166 | ) | | | (1,877,170 | ) | | $ | (25,515,512 | ) |
| | | | | | | | | | | | | | | | |
Class E | | | | | | | | | | | | | | | | |
Sales | | | 490,593 | | | $ | 6,636,938 | | | | 512,614 | | | $ | 6,859,672 | |
Reinvestments | | | 252,167 | | | | 3,437,042 | | | | 206,503 | | | | 2,674,216 | |
Redemptions | | | (1,114,219 | ) | | | (15,103,395 | ) | | | (1,260,647 | ) | | | (16,845,232 | ) |
| | | | | | | | | | | | | | | | |
Net decrease | | | (371,459 | ) | | $ | (5,029,415 | ) | | | (541,530 | ) | | $ | (7,311,344 | ) |
| | | | | | | | | | | | | | | | |
Increase (decrease) derived from capital shares transactions | | | | | | $ | (28,460,603 | ) | | | | | | $ | 48,978,461 | |
| | | | | | | | | | | | | | | | |
See accompanying notes to financial statements.
MSF-24
Metropolitan Series Fund
Western Asset Management Strategic Bond Opportunities Portfolio
Financial Highlights
| | | | | | | | | | | | | | | | | | | | |
| Selected per share data | | | |
| | | Class A | |
| | | Year Ended December 31, | |
| | | 2013 | | | 2012 | | | 2011 | | | 2010 | | | 2009 | |
Net Asset Value, Beginning of Period | | $ | 13.98 | | | $ | 13.01 | | | $ | 12.90 | | | $ | 12.19 | | | $ | 10.30 | |
| | | | | | | | | | | | | | | | | | | | |
Income (Loss) from Investment Operations | | | | | | | | | | | | | | | | | | | | |
Net investment income (a) | | | 0.63 | | | | 0.50 | | | | 0.53 | | | | 0.63 | | | | 0.75 | |
Net realized and unrealized gain (loss) on investments | | | (0.47 | ) | | | 0.96 | | | | 0.24 | | | | 0.87 | | | | 2.28 | |
| | | | | | | | | | | | | | | | | | | | |
Total from investment operations | | | 0.16 | | | | 1.46 | | | | 0.77 | | | | 1.50 | | | | 3.03 | |
| | | | | | | | | | | | | | | | | | | | |
Less Distributions | | | | | | | | | | | | | | | | | | | | |
Distributions from net investment income | | | (0.69 | ) | | | (0.49 | ) | | | (0.66 | ) | | | (0.79 | ) | | | (0.79 | ) |
Distributions from net realized capital gains | | | 0.00 | | | | 0.00 | | | | 0.00 | | | | 0.00 | | | | (0.35 | ) |
| | | | | | | | | | | | | | | | | | | | |
Total distributions | | | (0.69 | ) | | | (0.49 | ) | | | (0.66 | ) | | | (0.79 | ) | | | (1.14 | ) |
| | | | | | | | | | | | | | | | | | | | |
Net Asset Value, End of Period | | $ | 13.45 | | | $ | 13.98 | | | $ | 13.01 | | | $ | 12.90 | | | $ | 12.19 | |
| | | | | | | | | | | | | | | | | | | | |
Total Return (%) (b) | | | 1.09 | | | | 11.50 | | | | 6.14 | | | | 12.73 | | | | 32.22 | |
| | | | | |
Ratios/Supplemental Data | | | | | | | | | | | | | | | | | | | | |
Gross ratio of expenses to average net assets (%) | | | 0.66 | | | | 0.65 | | | | 0.67 | | | | 0.67 | | | | 0.69 | |
Net ratio of expenses to average net assets (%) (c) | | | 0.62 | | | | 0.61 | | | | 0.63 | | | | 0.63 | | | | 0.67 | |
Ratio of net investment income to average net assets (%) | | | 4.65 | | | | 3.70 | | | | 4.13 | | | | 5.00 | | | | 6.87 | |
Portfolio turnover rate (%) | | | 132 | (d) | | | 228 | (d) | | | 473 | | | | 295 | | | | 228 | |
Net assets, end of period (in millions) | | $ | 682.7 | | | $ | 708.5 | | | $ | 578.9 | | | $ | 343.2 | | | $ | 418.6 | |
| | | | | | | | | | | | | | | | | | | | |
| | | Class B | |
| | | Year Ended December 31, | |
| | | 2013 | | | 2012 | | | 2011 | | | 2010 | | | 2009 | |
Net Asset Value, Beginning of Period | | $ | 13.90 | | | $ | 12.93 | | | $ | 12.83 | | | $ | 12.13 | | | $ | 10.26 | |
| | | | | | | | | | | | | | | | | | | | |
Income (Loss) from Investment Operations | | | | | | | | | | | | | | | | | | | | |
Net investment income (a) | | | 0.59 | | | | 0.46 | | | | 0.49 | | | | 0.59 | | | | 0.70 | |
Net realized and unrealized gain (loss) on investments | | | (0.46 | ) | | | 0.97 | | | | 0.24 | | | | 0.87 | | | | 2.28 | |
| | | | | | | | | | | | | | | | | | | | |
Total from investment operations | | | 0.13 | | | | 1.43 | | | | 0.73 | | | | 1.46 | | | | 2.98 | |
| | | | | | | | | | | | | | | | | | | | |
Less Distributions | | | | | | | | | | | | | | | | | | | | |
Distributions from net investment income | | | (0.66 | ) | | | (0.46 | ) | | | (0.63 | ) | | | (0.76 | ) | | | (0.76 | ) |
Distributions from net realized capital gains | | | 0.00 | | | | 0.00 | | | | 0.00 | | | | 0.00 | | | | (0.35 | ) |
| | | | | | | | | | | | | | | | | | | | |
Total distributions | | | (0.66 | ) | | | (0.46 | ) | | | (0.63 | ) | | | (0.76 | ) | | | (1.11 | ) |
| | | | | | | | | | | | | | | | | | | | |
Net Asset Value, End of Period | | $ | 13.37 | | | $ | 13.90 | | | $ | 12.93 | | | $ | 12.83 | | | $ | 12.13 | |
| | | | | | | | | | | | | | | | | | | | |
Total Return (%) (b) | | | 0.83 | | | | 11.29 | | | | 5.83 | | | | 12.45 | | | | 31.89 | |
| | | | | |
Ratios/Supplemental Data | | | | | | | | | | | | | | | | | | | | |
Gross ratio of expenses to average net assets (%) | | | 0.91 | | | | 0.90 | | | | 0.92 | | | | 0.92 | | | | 0.94 | |
Net ratio of expenses to average net assets (%) (c) | | | 0.87 | | | | 0.86 | | | | 0.88 | | | | 0.88 | | | | 0.92 | |
Ratio of net investment income to average net assets (%) | | | 4.39 | | | | 3.45 | | | | 3.83 | | | | 4.70 | | | | 6.48 | |
Portfolio turnover rate (%) | | | 132 | (d) | | | 228 | (d) | | | 473 | | | | 295 | | | | 228 | |
Net assets, end of period (in millions) | | $ | 238.4 | | | $ | 268.0 | | | $ | 273.6 | | | $ | 227.6 | | | $ | 208.6 | |
Please see following page for Financial Highlights footnote legend.
See accompanying notes to financial statements.
MSF-25
Metropolitan Series Fund
Western Asset Management Strategic Bond Opportunities Portfolio
Financial Highlights
| | | | | | | | | | | | | | | | | | | | |
| Selected per share data | | | |
| | | Class E | |
| | | Year Ended December 31, | |
| | | 2013 | | | 2012 | | | 2011 | | | 2010 | | | 2009 | |
Net Asset Value, Beginning of Period | | $ | 13.93 | | | $ | 12.96 | | | $ | 12.85 | | | $ | 12.15 | | | $ | 10.27 | |
| | | | | | | | | | | | | | | | | | | | |
Income (Loss) from Investment Operations | | | | | | | | | | | | | | | | | | | | |
Net investment income (a) | | | 0.61 | | | | 0.48 | | | | 0.50 | | | | 0.60 | | | | 0.72 | |
Net realized and unrealized gain (loss) on investments | | | (0.48 | ) | | | 0.96 | | | | 0.25 | | | | 0.88 | | | | 2.29 | |
| | | | | | | | | | | | | | | | | | | | |
Total from investment operations | | | 0.13 | | | | 1.44 | | | | 0.75 | | | | 1.48 | | | | 3.01 | |
| | | | | | | | | | | | | | | | | | | | |
Less Distributions | | | | | | | | | | | | | | | | | | | | |
Distributions from net investment income | | | (0.67 | ) | | | (0.47 | ) | | | (0.64 | ) | | | (0.78 | ) | | | (0.78 | ) |
Distributions from net realized capital gains | | | 0.00 | | | | 0.00 | | | | 0.00 | | | | 0.00 | | | | (0.35 | ) |
| | | | | | | | | | | | | | | | | | | | |
Total distributions | | | (0.67 | ) | | | (0.47 | ) | | | (0.64 | ) | | | (0.78 | ) | | | (1.13 | ) |
| | | | | | | | | | | | | | | | | | | | |
Net Asset Value, End of Period | | $ | 13.39 | | | $ | 13.93 | | | $ | 12.96 | | | $ | 12.85 | | | $ | 12.15 | |
| | | | | | | | | | | | | | | | | | | | |
Total Return (%) (b) | | | 0.94 | | | | 11.30 | | | | 5.92 | | | | 12.62 | | | | 31.97 | |
| | | | | |
Ratios/Supplemental Data | | | | | | | | | | | | | | | | | | | | |
Gross ratio of expenses to average net assets (%) | | | 0.81 | | | | 0.80 | | | | 0.82 | | | | 0.82 | | | | 0.84 | |
Net ratio of expenses to average net assets (%) (c) | | | 0.77 | | | | 0.76 | | | | 0.78 | | | | 0.78 | | | | 0.82 | |
Ratio of net investment income to average net assets (%) | | | 4.49 | | | | 3.55 | | | | 3.90 | | | | 4.81 | | | | 6.59 | |
Portfolio turnover rate (%) | | | 132 | (d) | | | 228 | (d) | | | 473 | | | | 295 | | | | 228 | |
Net assets, end of period (in millions) | | $ | 66.2 | | | $ | 74.0 | | | $ | 75.9 | | | $ | 89.9 | | | $ | 91.3 | |
| (a) | Per share amounts based on average shares outstanding during the period. |
| (b) | Total return does not reflect any insurance, sales, separate account or administrative charges of variable annuity or life insurance contracts or any additional expenses that contract owners may bear under their variable contracts. If these charges were included, the returns would be lower. |
| (c) | Net ratio of expenses to average net assets includes the effect of management fee waivers as detailed in Note 6 of the Notes to Financial Statements. |
| (d) | Includes mortgage dollar roll and TBA transactions; excluding these transactions the portfolio turnover rate would have been 62% and 84% for 2013 and 2012, respectively |
See accompanying notes to financial statements.
MSF-26
Metropolitan Series Fund
Western Asset Management Strategic Bond Opportunities Portfolio
Notes to Financial Statements—December 31, 2013
1. Organization
Metropolitan Series Fund (the “Trust”) is organized as a Delaware statutory trust and registered under the Investment Company Act of 1940, as amended (the “1940 Act”), as an open-end management investment company. The Trust is currently comprised of thirty series, each of which operates as a distinct investment vehicle of the Trust. The portfolio included in this report is Western Asset Management Strategic Bond Opportunities Portfolio (the “Portfolio”), which is diversified. Shares in the Portfolio are not offered directly to the general public and are currently available only to separate accounts established by Metropolitan Life Insurance Company (“MetLife”) and other affiliated life insurance companies.
The Portfolio has registered and offers three classes of shares: Class A, B, and E shares. Shares of each Class of the Portfolio represent an equal pro rata interest in the Portfolio and generally give the shareholder the same voting, dividend, liquidation, and other rights. Investment income, realized and unrealized capital gains and losses, the common expenses of the Portfolio, and certain Portfolio-level expense reductions, if any, are allocated on a pro rata basis to each Class based on the relative net assets of each Class to the net assets of the Portfolio. Each Class of shares differs in its respective distribution plan and such distribution expenses are allocated to that Class.
2. Significant Accounting Policies
The preparation of financial statements in conformity with accounting principles generally accepted in the United States of America (“GAAP”) requires management to make estimates and assumptions that affect the reported amounts of assets and liabilities and disclosure of contingent assets and liabilities as of the date of the financial statements and the reported amounts of income and expenses during the reporting period. Actual results could differ from those estimates. In the preparation of these financial statements, management has evaluated events and transactions subsequent to December 31, 2013 through the date the financial statements were issued.
The following is a summary of significant accounting policies consistently followed by the Portfolio in the preparation of its financial statements.
Investment Valuation and Fair Value Measurements - Debt securities (other than short term obligations with a remaining maturity of sixty days or less), including corporate, convertible and municipal bonds and notes; obligations of the U.S. treasury and U.S. government agencies; sovereign issues; floating rate loans; and non-U.S. bonds, are generally valued on the basis of evaluated or composite bid quotations obtained from independent pricing services and/or brokers and dealers selected by MetLife Advisers, LLC (“MetLife Advisers” or the “Adviser”), an affiliate of MetLife, Inc., pursuant to authorization of the Board of Trustees of the Trust (the “Board” or “Trustees”). Such quotations utilize matrix pricing, which considers observable inputs including, among other things, issuer details, maturity dates, interest rates, yield curves, rates of prepayment, credit risks/spreads, default rates, reported trades, broker dealer quotes and quoted prices for similar securities. Securities that use similar valuation techniques and inputs as described above are generally categorized as Level 2 within the fair value hierarchy.
Mortgage and asset-backed securities are usually issued as separate tranches, or classes, of securities within each deal. These securities are also generally valued on the basis of evaluated or composite bid quotations obtained from independent pricing services and/or brokers and dealers selected by the Adviser pursuant to authorization of the Board. The pricing models for these securities usually consider tranche-level attributes, estimated cash flows and market-based yield spreads for each tranche and current market data, and incorporate deal collateral performance, as available. Mortgage and asset-backed securities that use similar valuation techniques and inputs as described above are generally categorized as Level 2 within the fair value hierarchy.
Short term obligations with a remaining maturity of sixty days or less are generally valued at amortized cost, which approximates fair market value, and are generally categorized as Level 2 within the fair value hierarchy.
Domestic and foreign equity securities, such as common stock, exchange-traded funds, rights, warrants, and preferred stock, that are traded on a securities exchange, are generally valued at their last sale price on the exchange or market in which they are principally traded on the valuation date, or, if no sales occurred on that day, at the last reported bid price. Equity securities traded over-the-counter are generally valued at the last reported sale price. Valuation adjustments may be applied to certain foreign equity securities that are traded solely on foreign exchanges that close before the close of the U.S. market to account for the market movement between the close of the foreign exchanges and the close of the U.S. market. The Portfolio may use a systematic fair valuation model provided by an independent third party to value securities principally traded in these foreign markets in order to adjust for possible stale pricing that may occur between the close of the foreign exchanges and the time of the Portfolio valuation. Foreign equity securities using these valuation adjustments are generally categorized as Level 2 within the fair value hierarchy. Equity securities that are actively traded, and have no valuation adjustments applied, are categorized as Level 1 within the fair value hierarchy. Other equity securities traded on inactive markets, or valued in reference to similar instruments traded on active markets, are generally categorized as Level 2 within the fair value hierarchy.
MSF-27
Metropolitan Series Fund
Western Asset Management Strategic Bond Opportunities Portfolio
Notes to Financial Statements—December 31, 2013—(Continued)
Investments in registered open-end management investment companies are valued at reported net asset value per share on the valuation date and are categorized as Level 1 within the fair value hierarchy.
Forward foreign currency exchange contracts are valued through an independent pricing service based on the mean between closing bid and ask prices of the forward currency rates in the London foreign exchange markets on a daily basis as provided by a reliable bank or dealer. These contracts are generally categorized as Level 2 within the fair value hierarchy.
Options, whether on securities, indices, futures contracts, or otherwise, traded on exchanges are valued at the last sale price available as of the close of business on the valuation date or, if there is no such price available, at the mean between the last reported bid and ask prices. These types of options are categorized as Level 1 within the fair value hierarchy. Futures contracts, which are traded on commodity exchanges, are valued at their closing prices as of the close of such exchanges and are categorized as Level 1 within the fair value hierarchy.
Options and futures contracts that are traded over-the-counter are generally valued on the basis of quotations provided by broker-dealers or prices provided by pricing service providers who use a series of techniques, including simulation pricing models, to determine the value of the contracts. The pricing models use inputs that are observed from actively quoted markets such as issuer details, indices, spreads, interest rates, yield curves, credit curves, measures of volatility and exchange rates. These contracts are generally categorized as Level 2 within the fair value hierarchy.
Swap contracts (other than centrally cleared swaps) are marked-to-market daily based on quotations and prices supplied by market makers, broker-dealers and other pricing services. Such quotations and prices are derived utilizing significant observable data, including the underlying reference securities or indices. These contracts are generally categorized as Level 2 within the fair value hierarchy.
Centrally cleared swaps listed or traded on a multilateral or trade facility platform, such as a registered exchange, are valued at the daily settlement price determined by the respective exchange or an independent pricing service when the exchange price is not available. For centrally cleared credit default swaps the clearing facility requires its members to provide actionable price levels across complete term structures. These levels along with external third party prices are used to produce daily settlement prices. These securities are categorized as Level 2 of the fair value hierarchy. Centrally cleared interest rate swaps are valued using a pricing model that references the underlying rates including the overnight index swap rate and London Interbank Offered Rate (“LIBOR”) forward rate to produce the daily settlement price. These securities are categorized as Level 2 of the fair value hierarchy.
If no current market value quotation or other observable inputs are readily available or market value quotations are deemed to be unreliable for a security, the fair value of the security will be determined in accordance with procedures approved by and under the general supervision of the Board. In such a circumstance, the Board has delegated the determination of the fair value of a security to a Valuation Committee (“Committee”) of MetLife Advisers. The Committee provides general pricing oversight and fair value pricing determinations related to portfolio securities and meets on a regular basis to review reports relating to the valuation of the securities in the Portfolio. The Board has delegated to State Street Bank and Trust Company, the Trust’s custodian (“custodian”), the responsibility for calculating the net asset values (“NAVs”) of the Trust’s Portfolios. The Committee is responsible for overseeing the calculation of the NAVs of the Portfolios by the custodian. The Committee also periodically reviews pricing vendors, including the vendor providing fair value pricing for the Portfolio’s foreign securities, and is responsible for overseeing the correction of pricing errors and addressing other pricing issues that arise in the ordinary course of business, such as making real-time fair value determinations, as necessary.
No single standard for determining the fair value of a security can be set forth because fair value depends upon the facts and circumstances with respect to each security. Information relating to any relevant factors may be obtained by the Committee from any appropriate source, including the subadviser of the Portfolio, the custodian, a pricing service, market maker and/or broker for such security or the issuer. Appropriate methodologies for determining fair value under particular circumstances may include: matrix pricing, comparisons of securities with comparable characteristics, value based on multiples of earnings, discount from market price of similar marketable securities or a combination of these and other methods. The Committee maintains a detailed report tracking each fair-valued security that compares the fair value price to the next available trade, vendor or broker price, and provides information on how close the fair value price was to the next quoted price. The Committee reviews a summary of such report monthly. On a quarterly basis, the Board is provided with the following for consideration and ratification or adjustment: (1) a memorandum summarizing the actions taken by the Committee in the prior quarter; and (2) a list of the Portfolio’s securities as of the most recent quarter-end for which market quotations were not readily available.
Investment Transactions and Related Investment Income - Portfolio security transactions are recorded on the trade date. Dividend income is recorded on the ex-dividend date or, for certain foreign securities, when notified. Interest income, which includes amortization of premium and accretion of discount on debt securities, is recorded on the accrual basis. Realized gains and losses on investments are determined on the identified cost basis, which is the same basis used for federal income tax purposes. Foreign income and foreign capital gains on some foreign securities may be subject to foreign taxes, which are accrued as applicable. These foreign taxes have been provided for in accordance with the Portfolio’s understanding of the applicable countries’ tax rules and rates.
MSF-28
Metropolitan Series Fund
Western Asset Management Strategic Bond Opportunities Portfolio
Notes to Financial Statements—December 31, 2013—(Continued)
Foreign Currency Translation - The books and records of the Portfolio are maintained in U.S. dollars. The values of securities, currencies, and other assets and liabilities denominated in currencies other than the U.S. dollar are translated into U.S. dollars based upon foreign exchange rates prevailing at the end of the period. Purchases and sales of investment securities, income, and expenses are translated on the respective dates of such transactions. Because the values of investment securities are translated at the foreign exchange rates prevailing at the end of the period, that portion of the results of operations arising from changes in exchange rates and that portion of the results of operations reflecting fluctuations arising from changes in market prices of the investment securities are not separated. Such fluctuations are included in the net realized and unrealized gain or loss on investments.
Net realized foreign exchange gains or losses arise from activity in forward foreign currency exchange contracts, sales of foreign currency, currency gains or losses realized between the trade and settlement dates on securities transactions, and the difference between the amounts of dividends, interest, and foreign withholding taxes recorded by the Portfolio and the U.S. dollar equivalent of the amounts actually received or paid by the Portfolio. Net unrealized foreign exchange gains and losses arise from changes in the value of assets and liabilities, other than investment securities, resulting from changes in foreign exchange rates.
Income Taxes - It is the Portfolio’s policy to comply with the requirements of the Internal Revenue Code of 1986, as amended, and regulations thereunder, applicable to regulated investment companies and to distribute, with respect to each taxable year, all of its taxable income to shareholders. Therefore, no federal income tax provision is required. The Portfolio files U.S. federal tax returns. No income tax returns are currently under examination. The Portfolio’s federal tax returns for the prior three fiscal years remain subject to examination by the Internal Revenue Service. As of December 31, 2013, the Portfolio had no uncertain tax positions that would require financial statement recognition, or de-recognition or disclosure.
Dividends and Distributions to Shareholders - The Portfolio records dividends and distributions on the ex-dividend date. Net realized gains from security transactions (if any) are generally distributed annually to shareholders. The timing and characterization of certain income and capital gains distributions are determined in accordance with federal tax regulations that may differ from GAAP. Permanent book and tax basis differences relating to shareholder distributions will result in reclassification between under/over distributed net investment income, accumulated net realized gains/losses, and paid-in surplus. Book-tax differences are primarily due to premium amortization, paydown gain/loss reclasses, defaulted bond adjustments, and foreign currency transactions. These adjustments have no impact on net assets or the results of operations.
Securities Lending - The Portfolio may lend its portfolio securities to certain qualified brokers who borrow securities in order to complete certain securities transactions. By lending its portfolio securities, the Portfolio attempts to increase its net investment income through the receipt of income on collateral held from securities on loan. Any gain or loss in the market price of the loaned securities that might occur and any interest earned or dividends declared during the term of the loan would accrue to the account of the Portfolio.
The Trust has entered into a securities lending arrangement with the custodian. Under this arrangement, the custodian is authorized to loan portfolio securities on the Portfolio’s behalf. In exchange, the Portfolio receives either cash or securities as collateral against the loaned securities. The Portfolio receives collateral at least equal to 102% of the market value of the loaned securities (105% for foreign equity securities), at each loan’s inception. Collateral representing at least 100% of the market value of the loaned securities must be maintained for the duration of the loan. A liability for cash collateral is reflected on the Statement of Assets and Liabilities, and is categorized as Level 2 within the fair value hierarchy. Cash collateral is generally invested in the State Street Navigator Securities Lending MET Portfolio (the “Navigator Portfolio”), a series of the State Street Navigator Securities Lending Trust that is managed by an affiliate of the custodian. The Navigator Portfolio is a registered money market fund that invests in a variety of high-quality, U.S. dollar-denominated instruments. If the market value of the collateral at the close of trading on a business day is less than 100% of the market value of the loaned securities at the close of trading on that day, the borrower shall be required to deliver, by the close of business on the following business day, an additional amount of collateral, so that the total amount of posted collateral is equal to at least 100% of the market value of all the loaned securities as of such preceding day. A portion of net income (income after the deduction of expenses and fees of the Navigator Portfolio) on the collateral is rebated to the borrower of the securities and the remainder is split between the custodian and the Portfolio. On loans collateralized by U.S. Treasuries, a fee is received from the borrower and is allocated between the Portfolio and the custodian. The risks associated with lending portfolio securities include, but are not limited to, possible delays in receiving additional collateral or in the recovery of the loaned securities, possible loss of rights in the collateral should the borrower fail financially, as well as risk of loss in the value of the collateral or the value of the investments made with the collateral. The lending agent has agreed to indemnify the Portfolio in the case of default of any securities borrower. Income received by the Portfolio in securities lending transactions during the year ended December 31, 2013 is reflected as Securities lending income on the Statement of Operations. Any outstanding loans by the Portfolio at December 31, 2013 are disclosed in the footnotes to the Schedule of Investments.
Repurchase Agreements - The Portfolio may enter into repurchase agreements, under the terms of a Master Repurchase Agreement, with selected commercial banks and broker-dealers, under which the Portfolio acquires securities as collateral and agrees to resell the securities at an agreed upon time and at an agreed-upon price. The Portfolio, through the custodian or a subcustodian, receives delivery of the underlying securities collateralizing any repurchase agreements. The Portfolio requires the custodian to take
MSF-29
Metropolitan Series Fund
Western Asset Management Strategic Bond Opportunities Portfolio
Notes to Financial Statements—December 31, 2013—(Continued)
possession, to have legally segregated in the Federal Reserve Book Entry System, or to have segregated within the custodian’s vault, all securities held as collateral for repurchase agreements. It is the Portfolio’s policy that the market value of the collateral be at least equal to 100% of the repurchase price in the case of a repurchase agreement of one-day duration and at least equal to 102% of the repurchase price in the case of all other repurchase agreements. In the event of default or failure by a party to perform an obligation in connection with any repurchase transaction, the Master Repurchase Agreement gives the non-defaulting party the right to set-off claims and to apply property held by it in connection with any repurchase transaction against obligations owed to it.
At December 31, 2013, the Portfolio had investments in repurchase agreements with a gross value of $69,993,000, which is included as part of investments at value on the Statement of Assets and Liabilities. The value of the related collateral exceeded the value of the repurchase agreements at December 31, 2013.
Mortgage Dollar Rolls - The Portfolio may enter into mortgage “dollar rolls” in which a Portfolio sells to-be-announced (“TBA”) mortgage-backed securities for delivery in the current month and simultaneously contracts to repurchase substantially similar (same type, coupon, and maturity) securities on a specified future date. For the duration of the transaction, or roll period, the Portfolio foregoes principal (including prepayments of principal) and interest paid on the securities sold. Dollar rolls are accounted for as purchase and sale transactions; gain or loss is recognized at the commencement of the term of the dollar roll and each time the mortgage-backed security is rolled.
Mortgage dollar roll transactions involve the risk that the market value of the securities that the Portfolio is required to reacquire may be less than the agreed-upon repurchase price of those securities and that the investment performance of securities purchased with proceeds from these transactions does not exceed the income, capital appreciation and gain or loss that would have been realized on the securities transferred or sold, as applicable, as part of the treasury or mortgage dollar roll.
Mortgage Related and Other Asset-Backed Securities - The Portfolio may invest in mortgage-related or other asset-backed securities. These securities may include mortgage pass-through securities, collateralized mortgage obligations (“CMOs”), commercial mortgage-backed securities, CMO residuals, stripped mortgage backed securities (“SMBS”), and other securities that directly or indirectly represent a participation in, or are secured by or payable from, mortgage loans on real property or other receivables. The value of some mortgage- or asset-backed securities may be particularly sensitive to changes in prevailing interest rates. Early repayment of principal on some mortgage-related securities may expose the Portfolio to a lower rate of return upon reinvestment of principal. The value of these securities may fluctuate in response to the market’s perception of the creditworthiness of the issuers. Additionally, although mortgages and mortgage-related securities are generally supported by some form of government or private guarantee and/or insurance, there is no assurance that private guarantors or insurers will meet their obligations.
In one type of SMBS, one class receives all of the interest from the mortgage assets (the interest-only or “IO” class), while the other class will receive all of the principal (the principal-only or “PO” class). Because principal will not be received at the maturity of an IO, adjustments are made to the book value of the security until maturity. These adjustments are netted against payments received for the IOs and the net amount is included in interest income on the Statement of Operations of the Portfolio. Payments received for POs are treated as reductions to the cost and par value of the securities. Details of mortgage related and other asset-backed securities held by the Portfolio are included in the Portfolio’s Schedule of Investments.
The Portfolio may invest a significant portion of its assets in securities of issuers that hold mortgage and asset-backed securities and direct investments in securities backed by commercial and residential mortgage loans and other financial assets. The value and related income of these securities are sensitive to changes in economic conditions, including delinquencies and/or defaults, and may be negatively impacted by increased volatility of market prices and periods of illiquidity.
When-Issued and Delayed-Delivery Securities - The Portfolio may purchase securities on a when-issued or delayed-delivery basis. Settlement of such transactions normally occurs within a month or more after the purchase commitment is made. The Portfolio may purchase securities under such conditions only with the intention of actually acquiring them, but may enter into a separate agreement to sell the securities before the settlement date. Since the value of securities purchased may fluctuate prior to settlement, the Portfolio may be required to pay more at settlement than the security is worth. In addition, the purchaser is not entitled to any of the interest earned prior to settlement.
Upon making a commitment to purchase a security on a when-issued or delayed-delivery basis, the Portfolio will hold liquid assets in a segregated account with the Portfolio’s custodian, or set aside liquid assets in the Portfolio’s records, worth at least the equivalent of the amount due. The liquid assets will be monitored on a daily basis and adjusted as necessary to maintain the necessary value.
TBA Purchase & Forward Sale Commitments - The Portfolio may enter into TBA commitments to purchase or sell securities for a fixed price at a future date. TBA commitments are considered securities in themselves, and involve a risk of loss if the value of the security to be purchased or sold declines or increases prior to settlement date, which is in addition to the risk of decline in the value of the Portfolio’s other assets. TBA forward sales commitments are valued at the current market value of the underlying securities, according to the procedures described under “Investment Valuation and Fair Value Measurements”.
MSF-30
Metropolitan Series Fund
Western Asset Management Strategic Bond Opportunities Portfolio
Notes to Financial Statements—December 31, 2013—(Continued)
High Yield Debt Securities - The Portfolio may invest in high yield debt securities, or “junk bonds,” which are securities that are rated below “investment grade” or, if not rated, are of equivalent quality. A portfolio with high yield debt securities generally will be exposed to greater market risk and credit risk than a portfolio that invests only in investment grade debt securities because issuers of high yield debt securities are generally less secure financially, are more likely to default on their obligations, and their securities are more sensitive to interest rate changes and downturns in the economy. In addition, the secondary market for lower-rated debt securities may not be as liquid as that for more highly rated debt securities. As a result, the Portfolio’s Subadviser may find it more difficult to value lower-rated debt securities or sell them and may have to sell them at prices significantly lower than the values assigned to them by the Portfolio.
3. Investments in Derivative Instruments
Forward Foreign Currency Exchange Contracts - The Portfolio may enter into forward foreign currency exchange contracts to obtain investment exposure, enhance return or hedge or protect its portfolio holdings against the risk of future movements in certain foreign currency exchange rates. When entering into these contracts, the Portfolio agrees to receive or deliver a fixed quantity of foreign currency for an agreed-upon price on an agreed-upon future date. These contracts are valued daily and the Portfolio’s net equity therein, representing unrealized gain or loss on the contracts as measured by the difference between the forward foreign exchange rates at the dates of entry into the contracts and the forward foreign exchange rates at the valuation date, is included in the Statement of Assets and Liabilities. When a contract is closed, the Portfolio recognizes a realized gain or loss equal to the difference between the value of the contract at the time it was opened and the value at the time it was closed.
Realized and unrealized gains and losses on forward foreign currency exchange contracts are included in the Statement of Operations. These contracts involve market and/or credit risk in excess of the amount recognized in the Statement of Assets and Liabilities. The use of forward foreign currency exchange contracts does not eliminate fluctuations in the underlying prices of the securities of the Portfolio, but it does establish a rate of exchange that can be achieved in the future. Although forward foreign currency exchange contracts may limit the risk of loss due to a decline in the value of the currency holdings, they also limit any potential gain that might result should the value of the currency increase. In addition, the Portfolio could be exposed to losses if the counterparties to the contracts are unable to meet the terms of the contracts. The Portfolio’s maximum potential loss from such contracts is the aggregate face value in U.S. dollars at the time the contract was opened.
Futures Contracts - The Portfolio may buy and sell futures contracts as a hedge, to maintain investment exposure to a target asset class or to enhance return. The Portfolio may be subject to fluctuations in equity prices, interest rates, commodity prices, and foreign currency exchange rates in the normal course of pursuing its investment objective. Futures contracts are standardized agreements to buy or sell a security, or deliver a final cash settlement price in connection with an index, interest rate, currency, or other asset. The Portfolio must deposit an amount (“initial margin”) equal to a certain percentage of the face value of the futures contract. The initial margin may be in the form of cash or securities, which is returned when the Portfolio’s obligations under the contract have been satisfied. If cash is deposited as the initial margin, it is shown as cash collateral on the Statement of Assets and Liabilities. Futures contracts are marked-to-market daily, and subsequent payments (“variation margin”) are made or received by the Portfolio depending on whether unrealized gains or losses are incurred. These amounts are reflected as receivables or payables on the Statement of Assets and Liabilities and as a component of net change in unrealized appreciation/depreciation on the Statement of Operations. When the contract is closed or expires, the Portfolio records a realized gain or loss equal to the difference between the value of the contract at the time it was opened and the value at the time it was closed. Risks of entering into futures contracts (and related options) include the possibility that the market for these instruments may be illiquid and that a change in the value of the contract or option may not correlate perfectly with changes in the value of the underlying instrument. Futures contracts are exchange-traded and the exchange’s clearinghouse, as counterparty to all exchange-traded futures, guarantees the futures contracts against default. For over-the-counter futures the Portfolio’s ability to terminate the positions may be more limited than in the case of exchange-traded positions and may also involve the risk that securities dealers participating in such transactions would fail to meet their obligations to the Portfolio.
Options Contracts - An option contract purchased by the Portfolio gives the Portfolio the right, but not the obligation, to buy (call) or sell (put) an underlying instrument at a fixed exercise price during a specified period. Call options written by the Portfolio give the holder the right to buy the underlying instrument from the Portfolio at a fixed exercise price; put options written by the Portfolio give the holder the right to sell the underlying instrument to the Portfolio at a fixed exercise price.
The Portfolio may use options to hedge against changes in values of securities the Portfolio owns or expects to purchase, to maintain exposure to the broad equity markets or to enhance return. Writing puts or buying calls tends to increase the Portfolio’s exposure to the underlying instrument and writing calls or buying puts tends to decrease the Portfolio’s exposure to the underlying instrument, and can be used to hedge other Portfolio investments. For options used to hedge the Portfolio’s investments, the potential risk to the Portfolio is that the change in value of options contracts may not correspond perfectly to the change in value of the hedged instruments. The Portfolio also bears the risk of an unfavorable change in the value of the underlying instrument or the risk that the Portfolio may not be able to enter into a closing transaction due to an illiquid market. The Portfolio’s maximum risk of loss from counterparty credit risk, as opposed to investment and other types of risk, in respect of purchased options is typically the premium initially paid for the option plus any unrealized gains.
MSF-31
Metropolitan Series Fund
Western Asset Management Strategic Bond Opportunities Portfolio
Notes to Financial Statements—December 31, 2013—(Continued)
The main risk associated with purchasing an option is that the option expires without being exercised. In this case, the option is worthless when it expires and the premium paid for the option is considered a realized loss. The risk associated with writing a call option is that the Portfolio may forgo the opportunity for a profit if the market value of the underlying instrument increases and the option is exercised, requiring the Portfolio to sell the underlying instrument at a price below its market value. When the Portfolio writes a call option on a security it does not own, its exposure on such an option is theoretically unlimited. The risk in writing a put option is that the Portfolio may incur a loss if the market value of the underlying instrument decreases and the option is exercised, requiring the Portfolio to purchase the underlying instrument at a price above its market value. In addition, the Portfolio risks not being able to enter into a closing transaction for the written option as the result of an illiquid market for the option.
Purchases of put and call options are recorded as investments, the value of which are marked-to-market daily. When a purchased option expires without being exercised, the Portfolio will realize a loss equal to the premium paid. When the Portfolio enters into a closing sale transaction, the Portfolio will realize a gain or loss depending on whether the sales proceeds from the closing sale transaction are greater or less than the premium initially paid for the option. When the Portfolio exercises a put option, it will realize a gain or loss from the sale of the underlying instrument and the proceeds from such sale will be decreased by the premium originally paid for the put option. When the Portfolio exercises a call option, the cost of the security which the Portfolio purchases upon exercise will be increased by the premium originally paid for the call option.
The premium received for a written option is recorded as an asset and an equivalent liability. The liability is subsequently marked to market to reflect the current value of the option written. When a written option expires without being exercised or the Portfolio enters into a closing purchase transaction, the Portfolio realizes a gain (or loss if the cost of the closing purchase transaction exceeds the premium received when the option was sold) without regard to any unrealized gain or loss on the underlying instrument and the liability related to such option is eliminated. When a written call option is exercised, the Portfolio realizes a gain or loss, as adjusted for the premium received, from the sale of the underlying instrument. When a written put option is exercised, the premium received is offset against the amount paid for the purchase of the underlying instrument.
The purpose of inflation-capped options is to protect the buyer from inflation, above a specified rate, eroding the value of investments in inflation-linked products with a given notional exposure. Inflation-capped options are used to give downside protection to investments in inflation-linked products by establishing a floor on the value of such products.
Swap Agreements - The Portfolio may enter into swap agreements in which the Portfolio and a counterparty agree to either make periodic net payments on a specified notional amount or net payment upon termination. Swap agreements are either privately negotiated in the over-the-counter market (“OTC swaps”) or executed in a multilateral or other trade facility platform, such as a registered commodities exchange (“centrally-cleared swaps”). The Portfolio may enter into swap agreements for the purposes of managing exposure to interest rate, credit or market risk, or for other purposes. In connection with these agreements, securities or cash may be paid or received, as applicable, by the Portfolio as collateral or margin in accordance with the terms of the respective swap agreements to provide assets of value and recourse in the event of default or bankruptcy/insolvency. Securities posted by the Portfolio as collateral for swap contracts are identified in the Schedule of Investments and restricted cash, if any, is reflected on the Statement of Assets and Liabilities.
Centrally-Cleared Swaps: Certain clearinghouses currently offer clearing for limited types of derivatives transactions, principally credit derivatives. In a cleared derivative transaction, a Portfolio typically enters into the transaction with a financial institution counterparty, and performance of the transaction is effectively guaranteed by a central clearinghouse, thereby reducing or eliminating the Portfolio’s exposure to the credit risk of the original counterparty. The Portfolio typically will be required to post specified levels of margin with the clearinghouse or at the instruction of the clearinghouse; the margin required by a clearinghouse may be greater than the margin the Portfolio would be required to post in an uncleared derivative transaction. Only a limited number of derivative transactions are currently eligible for clearing.
Swap agreements are marked-to-market daily. The fair value of an OTC swap is reflected on the Statement of Assets and Liabilities. The changes in value, if any, are reflected as a component of net change in unrealized appreciation/depreciation on the Statement of Operations. Daily changes in valuation of centrally cleared swaps, if any, are recorded as a receivable or payable for variation margin on the Statement of Assets and Liabilities and as a component of unrealized appreciation/depreciation on the Statement of Operations. Upfront payments paid or received upon entering into the swap agreement compensate for differences between the stated terms of the swap agreement and prevailing market conditions (such as credit spreads, currency exchange rates, interest rates, and other relevant factors). Upon termination or maturity of the swap, upfront premiums are recorded as realized gains or losses on the Statement of Operations. A liquidation payment received or made at the termination of the swap is recorded as realized gain or loss on the Statement of Operations. Net periodic payments received or paid by the Portfolio are included as part of realized gains or losses on the Statement of Operations.
Swap transactions involve, to varying degrees, elements of interest rate, credit, and market risk in excess of the amounts recognized in the Statement of Assets and Liabilities. Such risks involve the possibility that there will be no liquid market for these agreements, that the counterparty to the agreements may default on its obligation to perform, or that there may be unfavorable changes in market
MSF-32
Metropolitan Series Fund
Western Asset Management Strategic Bond Opportunities Portfolio
Notes to Financial Statements—December 31, 2013—(Continued)
conditions or interest rates. In addition, entering into swap agreements involves documentation risk resulting from the possibility that the parties to a swap agreement may disagree as to the meaning of contractual terms in the agreement. The Portfolio may enter into swap transactions with counterparties in accordance with guidelines established by the Board. These guidelines provide for a minimum credit rating for each counterparty and various credit enhancement techniques (for example, collateralization of amounts due from counterparties) to limit exposure to counterparties that have lower credit ratings. A Portfolio’s maximum risk of loss from counterparty credit risk is the discounted value of the net cash flows to be received from the counterparty over the contract’s remaining life, to the extent that amount is positive, or the fair value of the contract. The risk may be mitigated by having a master netting arrangement between the Portfolio and the counterparty and by the posting of collateral by the counterparty to cover the Portfolio’s exposure to the counterparty. Counterparty risk related to centrally-cleared swaps is mitigated due to the protection against defaults provided by the exchange on which these contracts trade.
At December 31, 2013, the Portfolio had the following derivatives, categorized by risk exposure:
| | | | | | | | | | | | |
| | | Asset Derivatives | | | Liability Derivatives | |
Risk Exposure | | Statement of Assets &
Liabilities Location | | Fair Value | | | Statement of Assets &
Liabilities Location | | Fair Value | |
| Interest Rate | | Unrealized appreciation on centrally cleared swap contracts* (a) | | $ | 63,646 | | | | | | | |
| | Unrealized appreciation on futures contracts** (a) | | | 412,802 | | | Unrealized depreciation on futures contracts** (a) | | $ | 1,454,177 | |
| | | | | | | | Written options at value | | | 1 | |
| Foreign Exchange | | Unrealized appreciation on forward foreign currency exchange contracts | | | 4,549,349 | | | Unrealized depreciation on forward foreign currency exchange contracts | | | 785,032 | |
| | | | | | | | | | | | |
| Total | | | | $ | 5,025,797 | | | | | $ | 2,239,210 | |
| | | | | | | | | | | | |
| | * | Represents the unrealized appreciation/depreciation of centrally cleared swaps as reported in the Schedule of Investments. Only the variation margin is reported within the Statement of Assets and Liabilities. |
| | ** | Includes cumulative appreciation/depreciation of futures contracts as reported in the Schedule of Investments. Only the current day’s variation margin is reported within the Statement of Assets and Liabilities. |
| | (a) | Financial instrument not subject to a master netting agreement. |
The Portfolio is required to disclose the impact of offsetting assets and liabilities represented in the Statement of Assets and Liabilities to enable users of the financial statements to evaluate the effect or potential effect of netting arrangements on its financial position for recognized assets and liabilities.
The following table presents the Portfolio’s derivative assets by counterparty net of amounts available for offset under a master netting agreement (“MNA”), or similar agreement, and net of the related collateral received by the Portfolio as of December 31, 2013.
| | | | | | | | | | | | | | | | |
Counterparty | | Derivative Assets
subject to a MNA
by Counterparty | | | Financial
Instruments
available for offset | | | Collateral
Received† | | | Net
Amount* | |
Bank of America N.A. | | $ | 3,450,547 | | | $ | (652,405 | ) | | $ | — | | | $ | 2,798,142 | |
Barclays Bank plc | | | 192,160 | | | | — | | | | — | | | | 192,160 | |
Citibank N.A. | | | 701,507 | | | | (117,542 | ) | | | — | | | | 583,965 | |
Goldman Sachs International | | | 174,309 | | | | (15,086 | ) | | | — | | | | 159,223 | |
UBS AG | | | 30,826 | | | | — | | | | — | | | | 30,826 | |
| | | | | | | | | | | | | | | | |
| | $ | 4,549,349 | | | $ | (785,033 | ) | | $ | — | | | $ | 3,764,316 | |
| | | | | | | | | | | | | | | | |
The following table presents the Portfolio’s derivative liabilities by counterparty net of amounts available for offset under a master netting agreement, or similar agreement, and net of the related collateral pledged by the Portfolio as of December 31, 2013.
| | | | | | | | | | | | | | | | |
Counterparty | | Derivative Liabilities
subject to a MNA
by Counterparty | | | Financial
Instruments
available for offset | | | Collateral
Pledged† | | | Net
Amount** | |
Bank of America N.A. | | $ | 652,405 | | | $ | (652,405 | ) | | $ | — | | | $ | — | |
Citibank N.A. | | | 117,542 | | | | (117,542 | ) | | | — | | | | — | |
Goldman Sachs International | | | 15,086 | | | | (15,086 | ) | | | — | | | | — | |
| | | | | | | | | | | | | | | | |
| | $ | 785,033 | | | $ | (785,033 | ) | | $ | — | | | $ | — | |
| | | | | | | | | | | | | | | | |
| | * | Net amount represents the net amount receivable from the counterparty in the event of default. |
| | ** | Net amount represents the net amount payable due to the counterparty in the event of default. |
| | † | In some instances, the actual collateral received and/or pledged may be more than the amount shown here due to overcollateralization. |
MSF-33
Metropolitan Series Fund
Western Asset Management Strategic Bond Opportunities Portfolio
Notes to Financial Statements—December 31, 2013—(Continued)
Transactions in derivative instruments during the year ended December 31, 2013 were as follows:
| | | | | | | | | | | | | | | | |
Statement of Operations Location—Net Realized Gain (Loss) | | Interest Rate | | | Credit | | | Foreign
Exchange | | | Total | |
Investments (a) | | $ | (2,760,945 | ) | | $ | (4,974,708 | ) | | $ | (1,323,993 | ) | | $ | (9,059,646 | ) |
Forward foreign currency transactions | | | — | | | | — | | | | (1,187,185 | ) | | | (1,187,185 | ) |
Futures contracts | | | (1,472,233 | ) | | | — | | | | — | | | | (1,472,233 | ) |
Written options | | | 3,962,741 | | | | 4,780,221 | | | | 295,373 | | | | 9,038,335 | |
| | | | | | | | | | | | | | | | |
| | $ | (270,437 | ) | | $ | (194,487 | ) | | $ | (2,215,805 | ) | | $ | (2,680,729 | ) |
| | | | | | | | | | | | | | | | |
| | | | |
Statement of Operations Location—Net Change in Unrealized Appreciation
(Depreciation) | | Interest Rate | | | Credit | | | Foreign
Exchange | | | Total | |
Investments (a) | | $ | (1,713,369 | ) | | $ | (896,062 | ) | | $ | (59,079 | ) | | $ | (2,668,510 | ) |
Forward foreign currency transactions | | | — | | | | — | | | | 4,001,794 | | | | 4,001,794 | |
Futures contracts | | | (364,369 | ) | | | — | | | | — | | | | (364,369 | ) |
Swap contracts | | | 63,646 | | | | — | | | | — | | | | 63,646 | |
Written options | | | 1,549,226 | | | | 857,387 | | | | (47,246 | ) | | | 2,359,367 | |
| | | | | | | | | | | | | | | | |
| | $ | (464,866 | ) | | $ | (38,675 | ) | | $ | 3,895,469 | | | $ | 3,391,928 | |
| | | | | | | | | | | | | | | | |
For the year ended December 31, 2013, the average amount or number per contract outstanding for each derivative type was as follows:
| | | | |
Derivative Description | | Average
Notional Par or
Face Amount‡ | |
Investments (a) | | $ | 289,459,728 | |
Forward Foreign currency transactions | | | 145,413,816 | |
Futures contracts long | | | 126,266,667 | |
Futures contracts short | | | (114,025,000 | ) |
Swap contracts | | | 158,000,000 | |
Written options | | | (371,986,059 | ) |
| | ‡ | Averages are based on activity levels during 2013. |
| | (a) | Includes purchased options which are part of net realized gain (loss) on investments and net change in unrealized appreciation (depreciation) on investments as shown in the Statement of Operations. |
Written Options
The Portfolio transactions in written options during the year December 31, 2013:
| | | | | | | | | | | | |
Call Options | | Notional
Amount | | | Number of
Contracts | | | Premium
Received | |
Options outstanding December 31, 2012 | | $ | — | | | | — | | | $ | — | |
Options written | | | 281,113,600 | | | | 7,555 | | | | 2,992,897 | |
Options bought back | | | (224,000,000 | ) | | | (913 | ) | | | (399,946 | ) |
Options expired | | | (57,113,600 | ) | | | (6,642 | ) | | | (2,592,951 | ) |
| | | | | | | | | | | | |
Options outstanding December 31, 2013 | | $ | — | | | | — | | | $ | — | |
| | | | | | | | | | | | |
| | | |
Put Options | | Notional
Amount | | | Number of
Contracts | | | Premium
Received | |
Options outstanding December 31, 2012 | | $ | 838,000,000 | | | | 415 | | | $ | 2,601,256 | |
Options written | | | 1,613,000,000 | | | | 5,244 | | | | 6,886,700 | |
Options bought back | | | (47,500,000 | ) | | | (3,174 | ) | | | (1,867,741 | ) |
Options expired | | | (2,245,500,000 | ) | | | (2,485 | ) | | | (5,929,680 | ) |
| | | | | | | | | | | | |
Options outstanding December 31, 2013 | | $ | 158,000,000 | | | | — | | | $ | 1,690,535 | |
| | | | | | | | | | | | |
4. Certain Risks
Market Risk: In the normal course of business, the Portfolio invests in securities and enters into transactions where risks exist due to fluctuations in the market (market risk) or failure of the other party to a transaction to perform (credit and counterparty risk). The
MSF-34
Metropolitan Series Fund
Western Asset Management Strategic Bond Opportunities Portfolio
Notes to Financial Statements—December 31, 2013—(Continued)
value of securities held by the Portfolio may decline in response to certain events, including those directly involving the companies whose securities are owned by the Portfolio; conditions affecting the general economy; overall market changes; local, regional or global political, social or economic instability; currency, interest rate, and price fluctuations.
Credit and Counterparty Risk: The Portfolio may be exposed to counterparty risk, or the risk that an entity with which the Portfolio has unsettled or open transactions may default. The potential loss could exceed the value of the financial assets and liabilities recorded in the financial statements. Financial assets that potentially expose the Portfolio to credit and counterparty risk consist principally of cash due from counterparties and investments. The Portfolio manages counterparty risk by entering into agreements only with counterparties that it believes have the financial resources to honor their obligations and by monitoring the financial stability of those counterparties. The Portfolio’s investment adviser attempts to mitigate counterparty risk by (i) periodically assessing the creditworthiness of its trading partners, (ii) monitoring and/or limiting the amount of its net exposure to each individual counterparty based on its assessment, and (iii) requiring collateral from the counterparty for certain transactions. In order to preserve certain safeguards for non-standard settlement trades, the Portfolio restricts its exposure to credit and counterparty losses by entering into master netting agreements with counterparties (approved brokers) with whom it undertakes a significant volume of transactions. Master Agreements govern the terms of certain transactions, and reduce the counterparty risk associated with relevant transactions by specifying credit protection mechanisms and providing standardization that improves legal certainty. Master Agreements can also help limit counterparty risk by specifying collateral posting arrangements at pre-arranged exposure levels. Collateral requirements may differ by type of derivative or investment, as applicable. Collateral or margin requirements are set by the broker or exchange clearing house for exchange traded derivatives (e.g., futures contracts and exchange traded options) while collateral terms are contract specific for over-the-counter traded derivatives (e.g., forward foreign currency exchange contracts, swap agreements and over-the-counter options).
For derivatives traded under an International Swaps and Derivatives Association, Inc. Master Agreement (“ISDA Master Agreement”) or similar master agreement, the collateral requirements are netted across all transactions traded under such agreement and one amount is posted from one party to the other to collateralize such obligations. The ISDA Master Agreement gives each party to the agreement the right to terminate all transactions traded under such agreement if there is a certain deterioration in the credit quality of the other party. The ISDA Master Agreement gives the Portfolio the right, upon an event of default by the applicable counterparty or a termination of the agreement, to close out all transactions traded under such agreement and to net amounts owed under each transaction to one net amount payable by one party to the other. This right to close out and net payments across all transactions traded under the ISDA Master Agreement could result in a reduction of the Portfolio’s credit risk to such counterparty equal to any amounts payable by the Portfolio under the applicable transactions, if any. However, absent an event of default by the counterparty or a termination of the agreement, the ISDA Master Agreement does not result in an offset of reported amounts of assets and liabilities in the Statement of Assets and Liabilities across transactions between the Portfolio and the applicable counterparty. The enforceability of the right to offset may vary by jurisdiction. Cash collateral that has been pledged to cover obligations of the Portfolio under derivative contracts, if any, will be reported separately in the Statement of Assets and Liabilities. Securities pledged as collateral, if any, for the same purpose are noted in the Schedule of Investments.
Repurchase and reverse repurchase agreements are primarily executed under Global Master Repurchase Agreements (“GMRAs”) or Master Repurchase Agreements (“MRAs”), which provide the rights to set-off. Each repurchase and reverse repurchase agreement is initially collateralized at the transaction level. In the event of default, the total market value exposure will be offset against collateral exchanged to date, which would result in a net receivable/(payable) that would be due from/to the counterparty.
Master Securities Forward Transaction Agreements (“Master Forward Agreements”) govern the considerations and factors surrounding the settlement of certain forward settling transactions, such as To-Be-Announced securities, delayed-delivery or secured borrowings transactions by and between the Portfolio and select counterparties. The Master Forward Agreements maintain provisions for, among other things, initiation and confirmation, payment and transfer, events of default, termination, and maintenance of collateral.
Customer Account Agreements and related addendums govern cleared derivatives transactions such as futures, options on futures, and cleared OTC derivatives. Cleared derivative transactions require posting of initial margin as determined by each relevant clearing agency which is segregated at a broker account registered with the Commodities Futures Trading Commission (CFTC), or the applicable regulator. In the U.S., counterparty risk is significantly reduced as creditors of the futures broker do not have claim to Portfolio assets in the segregated account. Additionally, portability of exposure in the event of default further reduces risk to the Portfolio. Variation margin, or changes in market value, are exchanged daily, but may not be netted between futures and cleared OTC derivatives.
Additional risks associated with each type of investment are described above within the respective security type notes. The Portfolio’s prospectus includes a discussion of the principal risks of investing in the Portfolio.
MSF-35
Metropolitan Series Fund
Western Asset Management Strategic Bond Opportunities Portfolio
Notes to Financial Statements—December 31, 2013—(Continued)
5. Investment Transactions
Aggregate cost of purchases and proceeds of sales of investment securities, including mortgage dollar roll and TBA transactions but excluding short-term securities, for the year ended December 31, 2013 were as follows:
| | | | | | | | | | | | |
Purchases | | | Sales | |
U.S. Government | | Non U.S. Government | | | U.S. Government | | | Non U.S. Government | |
| $800,397,487 | | $ | 489,242,233 | | | $ | 883,222,462 | | | $ | 443,299,148 | |
Purchases and sales of mortgage dollar rolls and TBA transactions for the year ended December 31, 2013 were $723,984,254 and $731,602,982, respectively.
6. Investment Management Fees and Other Transactions with Affiliates
Investment Management Agreement - MetLife Advisers is the investment adviser to the Portfolio. The Trust has entered into an investment management agreement with MetLife Advisers with respect to the Portfolio. For providing investment management services to the Portfolio, MetLife Advisers receives monthly compensation at the following annual rates:
| | | | | | |
Management
Fees earned by
MetLife Advisers
for the year ended
December 31, 2013 | | % per annum | | | Average Daily Net Assets |
| $5,979,637 | | | 0.650 | % | | Of the first $500 Million |
| | | 0.550 | % | | On amounts in excess of $500 Million |
MetLife Advisers has entered into an investment subadvisory agreement with respect to the Portfolio. Western Asset Management Company is compensated by MetLife Advisers to provide subadvisory services for the Portfolio.
Management Fee Waivers - Pursuant to an expense agreement, MetLife Advisers agreed, for the period April 29, 2013 through April 27, 2014, to reduce its advisory fees set out above under “Investment Management Agreement” for each class of the Portfolio as follows:
| | |
% per annum | | Average Daily Net Assets |
| 0.055% | | On the first $500 Million |
| 0.025% | | On the next $500 Million |
| 0.050% | | On amounts in excess of $1 Billion |
An identical expense agreement was in place for the period January 1, 2012 through April 28, 2013. Amounts waived for the year ended December 31, 2013 are shown as management fee waivers in the Statement of Operations.
Certain officers and trustees of the Trust may also be officers of MetLife Advisers; however, such officers and trustees receive no compensation from the Trust.
Transfer Agency Agreement - MetLife serves as the transfer agent for the Trust. MetLife receives no fees for its services to the Trust under the transfer agency agreement.
Distribution and Service Fees - The Trust has a distribution agreement with MetLife Investors Distribution Company (“MIDC” or the “Distributor”) in which MIDC serves as the distributor for the Portfolio’s Class A, B and E Shares. MIDC is a wholly-owned subsidiary of MetLife Investors Group, Inc., an affiliate of the Adviser. The Trust has also adopted a Distribution and Service Plan under Rule 12b-1 of the 1940 Act for the Portfolio’s Class B and E Shares. Under the Distribution and Service Plan, the Class B and E Shares of the Portfolio pay a fee to compensate the Insurance Companies (or their affiliates) and other broker-dealers and financial intermediaries involved in the offer and sale of Portfolio shares for promoting or selling and servicing the Class B and E Shares. The fees under the Distribution and Service Plan for each class of the Portfolio’s shares are calculated as a percentage of the Portfolio’s average daily net assets that are attributable to that Class. Currently, the fee is 0.25% per year for Class B Shares and 0.15% per year for Class E Shares. Amounts incurred by the Portfolio for the year ended December 31, 2013 are shown as Distribution and service fees in the Statement of Operations.
Deferred Trustee Compensation - Each Trustee who is not currently an employee of the Adviser or any of its affiliates receives compensation from the Trust for his or her service to the Trust. A deferred compensation plan (the “Plan”) is available to the Trustees on a voluntary basis. Deferred amounts remain in the Trust until distributed in accordance with the provisions of the Plan. The value of a participating Trustee’s deferral account is based on theoretical investments of deferred amounts, on the normal payment dates in certain portfolios of the Trust or Met Investors Series Trust, an affiliate of the Trust, as designated by the participating Trustee.
MSF-36
Metropolitan Series Fund
Western Asset Management Strategic Bond Opportunities Portfolio
Notes to Financial Statements—December 31, 2013—(Continued)
Changes in the value of participants’ deferral accounts are reflected as Trustees’ fees and expenses in the Statement of Operations. The portion of the accrued obligations allocated to the Portfolio under the Plan is reflected as Deferred trustees’ fees in the Statement of Assets and Liabilities.
7. Contractual Obligations
Under the Trust’s organizational documents, its officers and Trustees may be indemnified against certain liabilities and expenses arising out of the performance of their duties to the Trust. Additionally, the Trust has a variety of indemnification obligations under contracts with its service providers. The Trust’s maximum exposure under these arrangements is unknown, as this would involve future claims that may be made against the Trust that have not yet occurred.
8. Income Tax Information
The tax character of distributions paid for the periods ended December 31, 2013 and 2012 was as follows:
| | | | | | | | | | | | | | | | | | | | |
Ordinary Income | | | Long-Term Capital Gain | | | Total | |
2013 | | 2012 | | | 2013 | | | 2012 | | | 2013 | | | 2012 | |
| $46,899,918 | | $ | 34,924,249 | | | $ | — | | | $ | — | | | $ | 46,899,918 | | | $ | 34,924,249 | |
As of December 31, 2013, the components of distributable earnings (accumulated losses) on a federal income tax basis were as follows:
| | | | | | | | | | | | | | | | | | | | |
Undistributed
Ordinary
Income | | Undistributed
Long-Term
Capital Gain | | | Net
Unrealized
Depreciation | | | Loss Carryforwards | | | Other
Accumulated
Capital Losses | | | Total | |
| $53,169,475 | | $ | — | | | $ | (24,823,433 | ) | | $ | (16,715,740 | ) | | $ | (620,227 | ) | | $ | 11,010,075 | |
The Portfolio utilizes the provisions of the federal income tax laws that provide for the carryforward of capital losses for prior years, offsetting such losses against any future realized capital gains. Under the Regulated Investment Company Modernization Act of 2010 (the “Act”), net capital losses recognized after December 22, 2010 may be carried forward indefinitely and their character is retained as short-term and/or long-term losses. Previously, net capital losses were carried forward for up to eight years and treated as short-term losses. As a transition rule, the Act requires that post-enactment net capital losses be used before pre-enactment net capital losses.
As of December 31, 2013, there were post-enactment short-term accumulated capital losses of $620,227. The pre-enactment accumulated capital loss carryforwards and expiration dates were as follows:
| | | | | | | | |
Expiring
12/31/2018 | | Expiring
12/31/2017 | | | Total | |
| $2,454,113 | | $ | 14,261,627 | | | $ | 16,715,740 | |
MSF-37
Metropolitan Series Fund
Western Asset Management Strategic Bond Opportunities Portfolio
Report of Independent Registered Public Accounting Firm
To the Shareholders of Western Asset Management Strategic Bond Opportunities Portfolio and the Board of Trustees of Metropolitan Series Fund:
We have audited the accompanying statement of assets and liabilities, including the schedule of investments, of Western Asset Management Strategic Bond Opportunities Portfolio, one of the portfolios constituting Metropolitan Series Fund (the “Trust”) as of December 31, 2013, and the related statement of operations for the year then ended, the statements of changes in net assets for each of the two years in the period then ended, and the financial highlights for each of the five years in the period then ended. These financial statements and financial highlights are the responsibility of the Trust’s management. Our responsibility is to express an opinion on these financial statements and financial highlights based on our audits.
We conducted our audits in accordance with the standards of the Public Company Accounting Oversight Board (United States). Those standards require that we plan and perform the audit to obtain reasonable assurance about whether the financial statements and financial highlights are free of material misstatement. The Trust is not required to have, nor were we engaged to perform, an audit of its internal control over financial reporting. Our audits included consideration of internal control over financial reporting as a basis for designing audit procedures that are appropriate in the circumstances, but not for the purpose of expressing an opinion on the effectiveness of the Trust’s internal control over financial reporting. Accordingly, we express no such opinion. An audit also includes examining, on a test basis, evidence supporting the amounts and disclosures in the financial statements, assessing the accounting principles used and significant estimates made by management, as well as evaluating the overall financial statement presentation. Our procedures included confirmation of securities owned as of December 31, 2013, by correspondence with the custodian and brokers; where replies were not received from brokers, we performed other auditing procedures. We believe that our audits provide a reasonable basis for our opinion.
In our opinion, the financial statements and financial highlights referred to above present fairly, in all material respects, the financial position of Western Asset Management Strategic Bond Opportunities Portfolio of Metropolitan Series Fund, as of December 31, 2013, the results of its operations for the year then ended, the changes in its net assets for each of the two years in the period then ended, and the financial highlights for each of the five years in the period then ended, in conformity with accounting principles generally accepted in the United States of America.
Deloitte & Touche LLP
Boston, Massachusetts
February 27, 2014
MSF-38
Metropolitan Series Fund
Trustees and Officers of Metropolitan Series Fund
The Trustees and executive officers of the Trust, their ages and their principal occupations during the past five years are set forth below. Unless otherwise indicated, the business address of each is One Financial Center, Boston, MA 02111. Each Trustee who is deemed an “interested person,” as such term is defined in the 1940 Act, is indicated by an asterisk. Those Trustees who are not “interested persons” as defined in the 1940 Act are referred to as “Independent Trustees.” Additional information about the Trustees is available in the Statement of Additional Information, which is available without charge, upon request, by calling (800) 848-3854.
Trustees of the Trust
| | | | | | | | | | |
Name and Age | | Position(s)
Held with
Registrant | | Term of Office and
Length of Time
Served | | Principal Occupation(s) During the
Past 5 Years(1) | | Number of
Portfolios
in Fund
Complex(2)
overseen | | Other Directorships Held
by Trustee During the
Past 5 Years(1) |
| Interested Trustee | | | | | | | | | | |
| Elizabeth M. Forget* (47) | | Trustee, Chairman of the Board, President and Chief Executive Officer | | Indefinite; From May 2006 (President and Chief Executive Officer)/ August 2006 (Trustee and Chairman of the Board) to present | | Senior Vice President, MetLife Inc.; President, MetLife Advisers, LLC and a predecessor company. | | 79 | | Trustee, Met Investors Series Trust (the “MIST Trust”);** various MetLife-affiliated boards. |
| | | | | |
| Independent Trustees | | | | | | | | | | |
| Stephen M. Alderman (54) | | Trustee | | Indefinite; From April 2012 to present | | Shareholder in the law firm of Garfield & Merel, Ltd. | | 79 | | Trustee, MIST Trust;** Director, International Truck Leasing Corp. |
| | | | | |
| Robert J. Boulware (57) | | Trustee | | Indefinite; From April 2012 to present | | Managing Director, Pilgrim Funds, LLC (private equity fund). | | 79 | | Trustee, MIST Trust;** Trustee, Vertical Capital Income Fund (closed-end fund); Director, Gainsco, Inc. (auto insurance). |
| | | | | |
| Susan C. Gause (61) | | Trustee | | Indefinite; From April 2012 to present | | Private Investor. | | 79 | | Trustee, MIST Trust;** Trustee, HSBC Funds. |
| | | | | |
| Nancy Hawthorne (62) | | Trustee | | Indefinite; From May 2003 to present | | Chief Executive Officer, Clerestory LLC (corporate advisor). | | 79 | | MIST Trust;** Director, THL Credit, Inc.**; Director, Avid Technology, Inc.** |
| | | | | |
| Barbara A. Nugent (57) | | Trustee | | Indefinite; From January 2014 to present | | President, True North Board Governance, LLC (consulting); until 2014, partner in the law firm of Stradley Ronon Stevens & Young, LLP. | | 79 | | Trustee, MIST Trust**; Director, Episcopal Healthcare Foundation; until 2014, member, Mutual Fund Directors Forum Advisory Board. |
| | | | | |
| Keith M. Schappert (62) | | Trustee | | Indefinite; From August 2009 to present | | Principal, Schappert Consulting LLC (asset management consulting). | | 79 | | Trustee, MIST Trust;** Director, The Commonfund for Nonprofit Organizations; until 2011, Director, Trilogy Global Advisors; Director, Mirae Asset Discovery Funds,** Director, Calamos Investments. |
| | | | | |
| Linda B. Strumpf (66) | | Trustee | | Indefinite; From May 2000 to present | | Chair of the Investment Committee, Leona M. and Harry B. Helmsley Charitable Trust; until 2011, Chief Investment Officer, Leona M. and Harry B. Helmsley Charitable Trust. | | 79 | | Since 2012, Trustee, MIST Trust,** Trustee and Member of Investment Committee, The Pennsylvania State University. |
| | | | | |
| Dawn M. Vroegop (47) | | Trustee | | Indefinite; From May 2009 to present | | Private Investor. | | 79 | | Trustee, MIST Trust,** Trustee, Driehaus Mutual Funds; Director and Investment Committee Chair, City College of San Francisco Foundation. |
MSF-39
Metropolitan Series Fund
Trustees and Officers of Metropolitan Series Fund—(Continued)
Executive Officers of the Trust
| | | | | | |
Name and Age | | Position(s) Held with
Registrant | | Term of Office
and Length of
Time Served | | Principal Occupation(s) During Past 5 Years(1) |
| Elizabeth M. Forget (47) | | President, Chief Executive Officer, Trustee and Chairman of the Board | | From May
2006 (President
and Chief
Executive
Officer)/
August 2006
(Trustee and
Chairman of
the Board) to
present | | See principal occupation information in the table above. |
| | | |
| Jeffrey L. Bernier (42) | | Vice President | | From February
2008 to present | | Vice President, MetLife, Inc.; Senior Vice President, MetLife Advisers, LLC and a predecessor company. |
| | | |
| Peter H. Duffy (58) | | Chief Financial Officer and Treasurer | | From November
2000 to present | | Senior Vice President, MetLife Advisers, LLC; Vice President, MetLife, Inc. |
| | | |
| Andrew L. Gangolf (59) | | Secretary | | From May
2011to present | | Senior Vice President, MetLife Advisers, LLC; Senior Vice President & Assistant General Counsel, AllianceBerstein Investments, Inc. |
| | | |
| Jeffrey P. Halperin (46) | | Chief Compliance Officer | | From November
2005 to present | | Vice President, MetLife, Inc.; Chief Compliance Officer, MIST; Chief Compliance Officer, MSF Trust; Chief Compliance Officer, MetLife Advisers, LLC and a predecessor company; Chief Compliance Officer, MetLife Investment Management, LLC (formerly MetLife Investment Advisors Company, LLC). |
| | | |
| Alan C. Leland, Jr. (61) | | Vice President | | From February
2005 to present | | Treasurer and Chief Financial Officer, MetLife Advisers, LLC; Vice President, MetLife Group Inc.; Vice President, MetLife, Inc. |
| * | Ms. Forget is an “interested person” of the Trust because of her positions with MetLife Advisers, LLC and her ownership of securities issued by MetLife, Inc., the ultimate parent company of MetLife Advisers, LLC. |
| ** | Indicates a directorship with a registered investment company or a company subject to the reporting requirements of the Securities Exchange Act of 1934, as amended. |
| (1) | Previous positions during the past five years with the Trust, MetLife, Inc. or the Adviser are omitted if not materially different. |
| (2) | The Fund Complex includes 49 Portfolios of the MIST Trust and 30 Portfolios of the Trust. |
MSF-40
Metropolitan Series Fund
Western Asset Management Strategic Bond Opportunities Portfolio
Board of Trustees’ Consideration of Advisory and Sub-Advisory Agreements
At an in-person meeting of the Boards of Trustees (the “Board”) of Met Investors Series Trust and Metropolitan Series Fund (“MIST” and “MSF,” respectively, and collectively, the “Trusts”) held on November 19-20, 2013, the Board, including a majority of the Trustees who are not considered to be “interested persons” of the Trusts (the “Independent Trustees”) under the Investment Company Act of 1940, as amended (the “1940 Act”), approved for an annual period the continuation of each Trust’s advisory agreement (the “Advisory Agreement”) with MetLife Advisers, LLC (the “Adviser”) and the applicable sub-advisory agreements (each a “Sub-Advisory Agreement,” and collectively with the Advisory Agreement, the “Agreements”) between the Adviser and the investment sub-advisers (each a “Sub-Adviser,” and collectively, the “Sub-Advisers”) for each of the series of the Trusts, including the Western Asset Management Strategic Bond Opportunities Portfolio (each a “Portfolio,” and collectively, the “Portfolios”).1
In considering the Agreements, the Board reviewed a variety of materials provided by the Adviser and the Sub-Advisers relating to the Portfolios, including comparative performance, fee and expense information for an appropriate peer group of similar mutual funds, performance information for relevant benchmark indices and other information regarding the nature, extent and quality of services provided by the Adviser and the Sub-Advisers under their respective Agreements. The Board also took into account its experience with the Adviser and the Sub-Advisers and information provided to the Board in its meetings throughout the year with respect to the services provided by the Adviser and the Sub-Advisers, including quarterly performance reports prepared by management containing reviews of investment results, and periodic presentations from certain of the Sub-Advisers with respect to the Portfolios they manage. The Independent Trustees also assessed reports provided by the Board’s independent consultant, who reviewed and provided analyses regarding investment performance, fees and expenses, and other information provided by, or at the direction of, the Adviser and the Sub-Advisers, as more fully discussed below.
The Independent Trustees were separately advised by independent legal counsel throughout the process, and met with independent legal counsel in periodic executive sessions. Prior to voting to continue the Agreements at the November meeting, the Independent Trustees also received a memorandum from their independent counsel discussing the legal standards for their consideration of the proposed continuation of the Agreements. The Board also met in person with personnel of the Adviser on September 17, 2013 for the specific purpose of giving preliminary consideration to the proposed continuation of the Agreements and to request additional information they considered reasonably necessary to their deliberations. The Independent Trustees also discussed the proposed continuation of the Agreements in private sessions with their independent legal counsel at which no representatives of management were present.
In considering whether to approve the renewal of the Advisory Agreement with the Adviser and any applicable Sub-Advisory Agreements with respect to a Portfolio, the Board reviewed and analyzed the factors it deemed relevant, including: (1) the nature, extent and quality of the services to be provided to the Portfolios by the Adviser and the Sub-Advisers; (2) the performance of the Portfolios as compared to a peer group and an appropriate index; (3) the Adviser’s and each of the Sub-Adviser’s personnel and operations; (4) the financial condition of the Adviser and of the Sub-Advisers; (5) the level and method of computing each Portfolio’s advisory and sub-advisory fees; (6) the profitability of the Adviser under the Advisory Agreement and of certain of the Sub-Advisers under the Sub-Advisory Agreements; (7) any “fall-out” benefits to the Adviser, the Sub-Advisers and their affiliates (i.e., ancillary benefits realized by the Adviser, the Sub-Advisers or their affiliates from the Adviser’s or Sub-Advisers’ relationship with the Trusts); (8) the anticipated effect of growth in size on Portfolio expenses; (9) fees paid to certain of the Sub-Advisers by comparable institutional and retail accounts; and (10) possible conflicts of interest.
Nature, extent and quality of services. The Board evaluated the nature, extent and quality of the services that the Adviser, and the Sub-Advisers as relevant, have provided to the Portfolios. The Board considered the Adviser’s services as investment manager to the Portfolios, including services relating to the selection and oversight of the Sub-Advisers for the applicable Portfolios. The Board considered, among other things, the Adviser’s oversight of the provision of services to the Portfolios by the Sub-Advisers, including with respect to investment activities and trading practices, and the Sub-Adviser’s compliance with fund policies, objectives and Board directives, compliance policies and procedures and applicable law. The Adviser’s services in coordinating and overseeing the activities of the Trusts’ other service providers were also considered. The Board also evaluated the expertise and performance of the personnel of the Adviser who performed services for the Portfolios throughout the year.
The Board considered information received from the Trust’s Chief Compliance Officer (“CCO”) regarding the Portfolios’ compliance policies and procedures established pursuant to Rule 38a-l under the 1940 Act. The Board also evaluated the CCO’s ongoing reports concerning the CCO’s oversight of the risk assessment processes of the Sub-Advisers.
1 The Pyramis Managed Risk Portfolio recently commenced operations and, therefore, the Agreement with respect to this Portfolio was not up for renewal.
MSF-41
Metropolitan Series Fund
Western Asset Management Strategic Bond Opportunities Portfolio
Board of Trustees’ Consideration of Advisory and Sub-Advisory Agreements—(Continued)
With respect to the services provided by each of the Sub-Advisers, the Board considered, among other things, information provided to the Board by each Sub-Adviser. The Board considered the Sub-Adviser’s current level of staffing and its overall resources, as well as its compensation program. The Board reviewed each Sub-Adviser’s history and investment experience, as well as information regarding the qualifications, background and responsibilities of the Sub-Adviser’s investment and compliance personnel who provide services to the Portfolios. The Board also considered, among other things, the Sub-Adviser’s compliance program and any disciplinary history. The Board also took into account the Sub-Adviser’s risk assessment and monitoring process. The Board noted each Sub-Adviser’s regulatory history, including whether it was currently involved in any regulatory actions or investigations as well as material litigation, and any settlements and amelioratory actions undertaken, as appropriate. The Board also noted that the CCO and his staff conduct regular, periodic compliance reviews with each of the Sub-Advisers and present reports to the Independent Trustees regarding the same, which includes evaluating the regulatory compliance systems of the Sub-Advisers and procedures reasonably designed by them to help assure compliance with the federal securities laws, including issues related to late trading and market timing, best execution, fair value pricing, and proxy voting procedures, among others. The Board also took into account the financial condition of each Sub-Adviser. In its review, the Board also received and took into account information regarding any services and/or payments provided to the Adviser by the Sub-Advisers in connection with marketing activities.
The Board considered each Sub-Adviser’s investment process and philosophy. The Board took into account that each Sub-Adviser’s responsibilities include the development and maintenance of an investment program for the applicable Portfolio which is consistent with the Portfolio’s investment objectives, the selection of investment securities and the placement of orders for the purchase and sale of such securities, as well as the implementation of compliance controls related to performance of these services. The Board also reviewed each Sub-Adviser’s brokerage policies and practices.
Performance. The Board considered the performance of the Portfolios as described in the quarterly reports prepared by management, and as also analyzed in reports prepared by the Independent Trustees’ independent consultant. The Board noted that the Adviser reviews with the Board on a quarterly basis detailed information about the Portfolios’ performance results, portfolio composition and investment strategies. The Board also reviewed and considered a separate report prepared by Lipper Inc. (“Lipper”), an independent third party, which provided a statistical analysis comparing the Portfolios’ investment performance, expenses, and fees to comparable funds underlying variable insurance products (the “Performance Universe”). In addition, the Independent Trustees met separately with a representative of Bobroff Consulting, Inc., an independent consultant (“Bobroff), at a special board meeting in September 2013, to review the separate reports prepared by such consultant (“Bobroff Report”), which analyzed the report prepared by Lipper. The Board also considered each Portfolio’s more recent performance subsequent to the performance period covered by the Lipper reports, and management’s discussion of the same, including the effect of current market conditions on each Portfolio’s more recent performance.
The Board reviewed the Portfolios’ performance records and the Adviser’s and Sub-Advisers’ management styles and long-term performance records with the Portfolios and comparable funds. The Board focused particular attention on Portfolios with less favorable performance records. The Board was mindful of the Adviser’s focus on each Sub-Adviser’s performance and noted that the Adviser has been active in monitoring and responding to any performance issues with respect to the Portfolios. The Board also took into account its discussions with management regarding factors that contributed to the performance of the Portfolios.
Among other data relating specifically to the Western Asset Management Strategic Bond Opportunities Portfolio’s performance, the Board considered that the Portfolio outperformed the median of its Performance Universe and its Lipper Index for the one-, three- and five-year periods ended June 30, 2013. The Board further considered that the Portfolio outperformed its benchmark, the Barclays Capital Aggregate Bond Index, for the one-, three- and five-year periods ended October 31, 2013.
Fees and Expenses. The Board gave consideration to the advisory fees payable under the Advisory Agreement and the sub-advisory fees payable under each of the Sub-Advisory Agreements. In this regard, the Board reviewed the advisory fees payable on a Portfolio-by-Portfolio basis based on information provided by the Adviser. The Independent Trustees, with the assistance of Bobroff, also examined the fees paid by a Portfolio in light of fees paid to other investment managers by comparable funds, as well as considered the fees charged by the Adviser to manage other comparable funds, as applicable. The Lipper report included comparisons of the Adviser’s fee schedule with that of its peers based on an asset-based analysis of relative fee structures according to the size of the Portfolio. In addition, the Board considered the Portfolios’ advisory and sub-advisory fees and total expenses as compared to similarly situated investment companies underlying variable insurance products deemed to be comparable to the Portfolios as determined by Lipper. The Board considered a Portfolio’s ranking within a smaller group of peer funds chosen by Lipper (the “Expense Group”), as well as the Portfolio’s ranking within broader groups of funds (the “Expense Universe” and the “Sub-advised Expense Universe”). The Board also considered a Portfolio’s contractual sub-advisory fees, as applicable, as compared to the Sub-advised Expense Universe as well as a
MSF-42
Metropolitan Series Fund
Western Asset Management Strategic Bond Opportunities Portfolio
Board of Trustees’ Consideration of Advisory and Sub-Advisory Agreements—(Continued)
smaller group of funds (the “Sub-advised Expense Group”). In comparing a Portfolio’s actual and contractual management fee to that of comparable funds, the Board noted that such fee includes both advisory and administrative fees.
The Board noted that the sub-advisory fees for the Portfolios are paid by the Adviser, not the Portfolios, out of the advisory fee. It was further noted that the Adviser negotiates such fees at arm’s length. The Board also considered that the Adviser had entered into expense limitation agreements with certain of the Portfolios, pursuant to which the Adviser has agreed to waive a portion of its advisory fee and/or reimburse certain expenses as a means of limiting a Portfolio’s total annual operating expenses. The Board further considered the amount of sub-advisory fees paid out by the Adviser and the amount of the management fees that it retained in light of the services performed by Sub-Advisers and Adviser, respectively.
With respect to the Western Asset Management Strategic Bond Opportunities Portfolio, the Board considered that the Portfolio’s actual management fees were slightly above the Expense Group median, the Expense Universe median and the Sub-advised Expense Universe median. The Board also considered that the Portfolio’s total expenses (exclusive of 12b-l fees) were below the Expense Group median, the Expense Universe median and the Sub-advised Expense Universe median. The Board further noted that the Portfolio’s contractual management fees were below the asset-weighted average of the Expense Group at the Portfolio’s current size. The Board also noted that the Portfolio’s contractual sub-advisory fees were below the average of the Sub-advised Expense Group and the Sub-advised Expense Universe at the Portfolio’s current size. The Board further noted that the Adviser had waived fees and/or reimbursed expenses during the past year.
Profitability. The Board examined the profitability of the Adviser on a Portfolio-by-Portfolio basis. The Board also considered that the Distributor, MetLife Investors Distribution Company, receives Rule 12b-1 payments to support the distribution of the products. The Board considered the profitability to the Sub-Advisers and their affiliates as a result of their relationships with the Portfolios, and the Board considered the ability of the Adviser to negotiate the Sub-Advisory Agreements and the fees thereunder at arm’s length. The Board also reviewed Portfolio specific data with regard to the profitability of the Portfolios to each Sub-Adviser, as available.
Economies of scale. The Board also considered the effect of the Portfolios’ growth in size on their fees. The Board noted that the fee schedules for most of the Portfolios contain breakpoints that reduce the fee rate above specified asset levels. The Board noted those Portfolios that did not contain breakpoints in the advisory fee and took into account management’s discussion of the same. The Board noted that those Portfolios with advisory fee schedules containing breakpoints generally reflect the inclusion of breakpoints in the sub-advisory fee schedule for such Portfolios. The Board considered the effective fees under the Advisory Agreement for a Portfolio as a percentage of assets at different asset levels and possible economies of scale that may be realized if the assets of the Portfolio grow. Among other data, the Board examined the effect of a Portfolio’s growth in size on various fee schedules and reviewed the Lipper and Bobroff Reports, which compared fees among peers. The Board also generally noted that if a Portfolio’s assets increase over time, the Portfolio may realize other economies of scale if assets increase proportionally more than certain other fixed expenses. In addition, the Board noted that the Adviser had taken a number of steps to date intended to share the benefits of economies of scale with contractholders.
With respect to the Western Asset Management Strategic Bond Opportunities Portfolio, the Board noted that the Portfolio’s advisory fee and sub-advisory fee each contains breakpoints that reduce the advisory fee rate on assets above certain specified asset levels. The Board considered the fact that the Portfolio’s fee levels decline as portfolio assets increase.
Other factors. As part of its evaluation of the Adviser’s compensation, the Board considered other benefits that may be realized by the Adviser and its affiliates from their relationship with the Trusts. Among them, the Board recognized that an affiliate of the Adviser, MetLife Investors Distribution Company, serves as the Distributor for the Trusts, and, as such, receives payments pursuant to Rule 12b-1 from the Portfolios to compensate it for providing shareholder services and selling activities, which could lead to growth in the Trusts’ assets and corresponding benefits from such growth, including economies of scale. The Board also considered that affiliates of the Adviser may benefit from certain indirect tax benefits relating to dividend received deductions and foreign tax credits. In conjunction with these considerations, the Board noted the costs of providing investment management and other services to the Portfolios and the ongoing commitment of the Adviser to the Portfolios.
The Board considered other benefits that may be realized by each Sub-Adviser and its affiliates from their relationship with the Trusts, including the opportunity to provide advisory services to additional portfolios of the Trusts and reputational benefits. In conjunction with these considerations, the Board noted the costs of providing investment advisory services to the Portfolios and the ongoing commitment of the Sub-Advisers to the Portfolios.
The Board considered possible conflicts of interest in the form of material benefits or detriments to the Trusts resulting from the nature of the Trusts’ and the Adviser’s or the Sub-Advisers’ affiliations and the services that are provided to the Trusts, and the manner in which such conflicts were mitigated.
MSF-43
Metropolitan Series Fund
Western Asset Management Strategic Bond Opportunities Portfolio
Board of Trustees’ Consideration of Advisory and Sub-Advisory Agreements—(Continued)
Conclusions. After full consideration of the factors discussed above, the Board, including a majority of the Independent Trustees, approved the Advisory Agreement and the Sub-Advisory Agreement, as applicable, with respect to each Portfolio, unless otherwise noted. In making its approvals, the Board concluded that the nature, extent and quality of services provided by the Adviser and each Sub-Adviser supported the renewal of the Agreements. The Board also concluded that the investment performance of each Fund was such that each Agreement should continue. In addition, the Board concluded that fees paid by a Portfolio to the Adviser and, if applicable, the Sub-Adviser appeared to be acceptable in light of nature, extent and quality of the services provided by the Adviser and Sub-Adviser. Further, the Board concluded that the Adviser’s profitability in providing services under the Advisory Agreements did not appear unreasonably high in light of the nature, extent and quality of the services provided by the Adviser. Finally, the Board concluded that the Advisory and Sub-Advisory fees in some measure share economies of scale with contractholders. In approving the renewal of each of the Agreements, the Board, including the Independent Trustees, did not identify any single factor as controlling, and generally attributed different weights to various factors for the various Portfolios. The Board evaluated all information available to them on a Portfolio-by-Portfolio basis, and their decisions were made separately with respect to each Portfolio.
MSF-44
Metropolitan Series Fund
Western Asset Management U.S. Government Portfolio
Managed by Western Asset Management Company
Portfolio Manager Commentary*
PERFORMANCE
For the one year period ended December 31, 2013, the Class A, B, and E shares of the Western Asset Management U.S. Government Portfolio returned -0.74%, -0.91%, and -0.75%, respectively. The Portfolio’s benchmark, the Barclays U.S. Intermediate Government Bond Index1, returned -1.25%.
MARKET ENVIRONMENT / CONDITIONS
The year began as Congress worked through the final moments of 2012 putting together an agreement to prevent a collection of tax increases and spending cuts known as the fiscal cliff. While a lackluster compromise was reached, some taxes were increased, notably payroll taxes, and the federal spending cuts proved unavoidable. Given this new set of headwinds, economic performance over the year was perhaps better than expected. Corporations continued to generate robust profits and equity markets climbed to new highs, with the S&P 500 Index gaining 32.4% on the year. Certainly the continued support of the Federal Reserve (the “Fed”) was a large help to risk markets, through its non-traditional methods of monetary accommodation. The European debt crisis also continued to ease on the back of aggressive action from the European Central Bank (the “ECB”). As a result, uncertainty among investors diminished, and as the Fed encouraged them to take risk, they did so.
The U.S. economic recovery picked up moderately over the year. The final estimate for the annualized Gross Domestic Product (“GDP”) growth rate over the third quarter (the last GDP data point released in 2013) came in at 4.1%. This compared favorably to the 0.1% growth rate from the fourth quarter of 2012, as well as to the 1.1% and 2.5% growth rates experienced in first and second quarters of 2013. At the same time, the unemployment rate notched down from 7.9% a year ago to the most recent rate of 6.7%.
The details behind the headlines are not quite as rosy, however. The drop in the unemployment rate, instead of being due to a robust and growing economy, was mostly driven by a decline in the labor force participation rate. Many discouraged workers simply gave up looking for work. This signals that the economy still has plenty of slack despite the recovery. Aggregate demand remains relatively weak. In spite of this, markets in 2013 were mostly risk-on environments. Risk sector spreads generally ended tighter. Improvement in the housing market remained a bright spot as the Case-Shiller Home Price Index (20 city composite, seasonally adjusted) improved to a year-over-year gain of 13.6%, up from a 4.3% gain a year ago. This is the index’s strongest yearly performance since February 2006.
The Fed remained extraordinarily accommodative during 2013, holding interest rates steady in a range of 0% to 0.25%. The Fed hinted several times over the year that it was considering reducing its $85 billion per month purchases of U.S. Treasuries and of agency mortgage-backed securities (“MBS”). The Fed finally announced the initial reduction at its December 2013 meeting, that asset purchases would decrease by $10 billion to a rate of $75 billion per month. Fed Chairman Ben Bernanke emphasized that this move should not be considered monetary tightening. He cited several continuing accommodations: the Fed’s continued promise of extraordinary low rates, guidance that short term rates would likely remain low even when the unemployment rate dips below 6.5%, and the fact that the Fed is still continuing to expand its balance sheet, albeit slightly less aggressively. Previous Fed guidance indicated that rates would be kept low as long as the unemployment rate remains above 6.5% and expected inflation one to two years out is below 2.5% with longer-term inflation expectations well anchored.
While interest rates rose significantly over the year, they generally drifted higher on expectations of reduced Fed purchases. Rates only moved modestly higher on the actual news of tapering. Ben Bernanke also experienced his final full year as Fed Chairman in 2013. His term was marked by aggressive Fed experimentation as the central bank attempted to add further accommodation despite a near-zero fed funds rate.
PORTFOLIO REVIEW / PERIOD END POSITIONING
The Western Asset Management U.S. Government Portfolio outperformed its benchmark during the period. The main contributor to performance was the Portfolio’s exposure to non-agency mortgages. The sector outperformed the benchmark as U.S. housing is recovering from its lows. Excess housing inventory has declined, new mortgage delinquencies have slowed, and short sales and liquidations have increased. These developments helped to improve pricing in the sector, bolstering performance along with continuing coupon payments and principal paydowns.
Agency MBS outperformed Treasuries of similar interest rate risk during the year, and allocations to this sector contributed to the Portfolio’s outperformance. The Portfolio’s overweight allocation to Agency debt contributed to performance as the sector slightly outperformed U.S. Treasuries of similar interest rate risk. For the majority of the year, the Portfolio held less exposure to interest rates than the benchmark, which helped performance as rates generally rose. Excess exposure to longer term interest rates, relative to the benchmark, hurt performance as longer rates rose the most over the year.
MSF-1
Metropolitan Series Fund
Western Asset Management U.S. Government Portfolio
Managed by Western Asset Management Company
Portfolio Manager Commentary*—(Continued)
Over the reporting period, we reduced exposure to U.S. Treasuries and added exposure to Agency bonds. Within the agency MBS sector, we reduced exposure to 30-year agency mortgages and added to lower coupon 15-year agency mortgages. We also shifted our exposure in Federal National Mortgage Association MBS from lower coupon securities to 4% and 5% coupon issues.
Stephen A. Walsh
Mark S. Lindbloom
Fredrick Marki
Portfolio Managers
Western Asset Management Company
* This commentary may include statements that constitute “forward-looking statements” under the U.S. securities laws. Forward-looking statements include, among other things, projections, estimates, and information about possible or future results related to the Portfolio, market or regulatory developments. The views expressed above are not guarantees of future performance or economic results and involve certain risks, uncertainties and assumptions that could cause actual outcomes and results to differ materially from the views expressed herein. The views expressed above are subject to change at any time based upon economic, market, or other conditions and the subadvisory firm undertakes no obligation to update the views expressed herein. Any discussions of specific securities should not be considered a recommendation to buy or sell those securities. The views expressed above (including any forward-looking statement) may not be relied upon as investment advice or as an indication of the Portfolio’s trading intent. Information about the Portfolio’s holdings, asset allocation or country diversification is historical and is not an indication of future Portfolio composition, which may vary. Direct investment in any index is not possible. The performance of any index mentioned in this commentary has not been adjusted for ongoing management, distribution and operating expenses, and sales charges applicable to mutual fund investments. In addition, the returns do not reflect additional fees charged by separate accounts or variable insurance contracts that an investor in the Portfolio may pay. If these additional fees were reflected, performance would have been lower.
MSF-2
Metropolitan Series Fund
Western Asset Management U.S. Government Portfolio
A $10,000 INVESTMENT COMPARED TO THE BARCLAYS U.S. INTERMEDIATE GOVERNMENT BOND INDEX
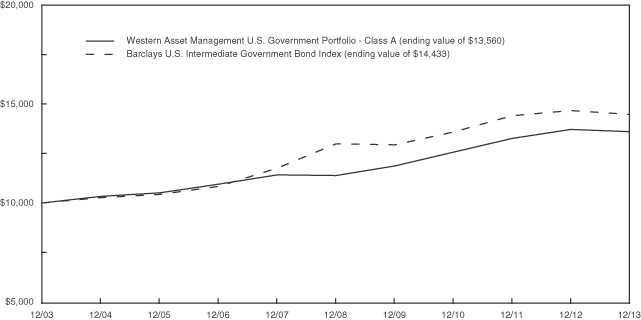
AVERAGE ANNUAL RETURNS (%) (FOR THE YEAR ENDED DECEMBER 31, 2013)
| | | | | | | | | | | | |
| | | 1 Year | | | 5 Year | | | 10 Year | |
| Western Asset Management U.S. Government Portfolio | | | | | | | | | | | | |
Class A | | | -0.74 | | | | 3.63 | | | | 3.09 | |
Class B | | | -0.91 | | | | 3.37 | | | | 2.83 | |
Class E | | | -0.75 | | | | 3.48 | | | | 2.94 | |
| Barclays U.S. Intermediate Government Bond Index | | | -1.25 | | | | 2.20 | | | | 3.74 | |
1 The Barclays U.S. Intermediate Government Bond Index includes most obligations of the U.S. Treasury, agencies and quasi-federal corporations having maturities between one to ten years.
Portfolio performance is calculated including reinvestment of all income and capital gain distributions. Performance numbers are net of all Portfolio expenses but do not include any insurance, sales, separate account or administrative charges of variable annuity or life insurance contracts or any additional expenses that participants may bear relating to the operations of their plans. If these charges were included, the returns would be lower. The performance of any index referenced above has not been adjusted for ongoing management, distribution and operating expenses, and sales charges applicable to mutual fund investments. Direct investment in any index is not possible. The performance of Class A shares, as set forth in the line graph above, will differ from that of other classes because of the difference in expenses paid by policyholders investing in the different share classes.
This information represents past performance and is not indicative of future results. Investment return and principal value may fluctuate so that shares, upon redemption, may be worth more or less than the original cost.
PORTFOLIO COMPOSITION AS OF DECEMBER 31, 2013
Top Sectors
| | | | |
| | | % of
Market Value of
Total Long-Term
Investments | |
| U.S. Treasury & Government Agencies | | | 82.4 | |
| Corporate Bonds & Notes | | | 9.0 | |
| Mortgage-Backed Securities | | | 4.0 | |
| Foreign Government | | | 3.8 | |
| Asset-Backed Securities | | | 0.8 | |
MSF-3
Metropolitan Series Fund
Western Asset Management U.S. Government Portfolio
Understanding Your Portfolio’s Expenses
Shareholder Expense Example
As a shareholder of the Portfolio, you incur ongoing costs, including management fees; distribution and service (12b-1) fees; and other Portfolio expenses. This example is intended to help you understand your ongoing costs (in dollars) (referred to as “expenses”) of investing in the Portfolio and compare these costs with the ongoing costs of investing in other mutual funds. The example is based on an investment of $1,000 invested at the beginning of the period and held for the entire period, July 1, 2013 through December 31, 2013.
Actual Expenses
The first line for each share class of the Portfolio in the table below provides information about actual account values and actual expenses. You may use the information in this line, together with the amount you invested in the particular share class of the Portfolio, to estimate the expenses that you paid over the period. Simply divide your account value by $1,000 (for example, an $8,600 account value divided by $1,000 = 8.6), then multiply the result by the number in the first line under the heading entitled “Expenses Paid During Period” to estimate the expenses you paid on your account during this period.
Hypothetical Example for Comparison Purposes
The second line for each share class of the Portfolio in the table below provides information about hypothetical account values and hypothetical expenses based on the Portfolio’s actual expense ratio and an assumed rate of return of 5% per year before expenses, which is not the Portfolio’s actual return. The hypothetical account values and expenses may not be used to estimate the actual ending account balance or expenses you paid for the period. You may use this information to compare the ongoing costs of investing in the Portfolio and other funds. To do so, compare this 5% hypothetical example with the 5% hypothetical examples that appear in the shareholder reports of the other funds.
Please note that the expenses shown in the table are meant to highlight your ongoing costs only and do not reflect any fees or charges of your variable insurance product or any additional expenses that participants in certain eligible qualified plans may bear relating to the operations of their plan. Therefore, the second line for each share class in the table is useful in comparing ongoing costs only, and will not help you determine the relative total costs of owning different funds. In addition, if these other costs were included, your costs would have been higher.
| | | | | | | | | | | | | | | | | | |
Western Asset Management U.S. Government Portfolio | | | | Annualized
Expense
Ratio | | | Beginning
Account Value
July 1,
2013 | | | Ending
Account Value
December 31,
2013 | | | Expenses Paid
During Period**
July 1, 2013
to
December 31,
2013 | |
Class A(a) | | Actual | | | 0.48 | % | | $ | 1,000.00 | | | $ | 1,004.20 | | | $ | 2.42 | |
| | Hypothetical* | | | 0.48 | % | | $ | 1,000.00 | | | $ | 1,022.79 | | | $ | 2.45 | |
| | | | | |
Class B(a) | | Actual | | | 0.73 | % | | $ | 1,000.00 | | | $ | 1,002.50 | | | $ | 3.68 | |
| | Hypothetical* | | | 0.73 | % | | $ | 1,000.00 | | | $ | 1,021.53 | | | $ | 3.72 | |
| | | | | |
Class E(a) | | Actual | | | 0.63 | % | | $ | 1,000.00 | | | $ | 1,003.40 | | | $ | 3.18 | |
| | Hypothetical* | | | 0.63 | % | | $ | 1,000.00 | | | $ | 1,022.03 | | | $ | 3.21 | |
* Hypothetical assumes a rate of return of 5% per year before expenses.
** Expenses paid are equal to the Portfolio’s annualized expense ratio for the most recent six month period, as shown above, multiplied by the average account value over the period, multiplied by the number of days (184 days) in the most recent fiscal half-year, divided by 365 (to reflect the one-half year period).
(a) The annualized expense ratio shown reflects the impact of the management fee waiver as described in Note 6 of the Notes to Financial Statements.
MSF-4
Metropolitan Series Fund
Western Asset Management U.S. Government Portfolio
Schedule of Investments as of December 31, 2013
U.S. Treasury & Government Agencies—94.3% of Net Assets
| | | | | | | | |
| Security Description | | Principal
Amount* | | | Value | |
|
Agency Sponsored Mortgage-Backed—28.4% | |
Fannie Mae 15 Yr. Pool | | | | | | | | |
3.000%, TBA (a) | | | 46,100,000 | | | $ | 47,045,410 | |
3.500%, TBA (a) | | | 17,400,000 | | | | 18,195,914 | |
4.500%, 03/01/20 | | | 133,936 | | | | 145,611 | |
5.000%, 03/01/18 | | | 222,338 | | | | 236,914 | |
6.500%, 06/01/17 | | | 67,363 | | | | 70,791 | |
7.000%, 12/01/14 | | | 1,295 | | | | 1,316 | |
7.000%, 07/01/15 | | | 476 | | | | 477 | |
7.500%, 02/01/16 | | | 19,083 | | | | 19,282 | |
Fannie Mae 20 Yr. Pool | | | | | | | | |
4.500%, 11/01/31 | | | 1,802,449 | | | | 1,930,618 | |
4.500%, 12/01/31 | | | 2,313,220 | | | | 2,476,771 | |
Fannie Mae 30 Yr. Pool | | | | | | | | |
3.000%, 09/01/42 | | | 14,061,150 | | | | 13,369,038 | |
3.500%, TBA (a) | | | 90,100,000 | | | | 89,501,682 | |
4.000%, 07/01/42 | | | 5,983,224 | | | | 6,167,729 | |
4.000%, TBA (a) | | | 57,500,000 | | | | 59,189,063 | |
4.500%, 04/01/41 | | | 19,784,546 | | | | 21,022,833 | |
4.500%, 06/01/41 | | | 1,745,805 | | | | 1,850,151 | |
4.500%, 09/01/41 | | | 3,156,571 | | | | 3,353,308 | |
4.500%, 10/01/41 | | | 15,500,785 | | | | 16,428,575 | |
4.500%, TBA (a) | | | 126,600,000 | | | | 134,141,600 | |
5.000%, 07/01/33 | | | 655,367 | | | | 713,781 | |
5.000%, 09/01/33 | | | 787,893 | | | | 858,461 | |
5.000%, 10/01/35 | | | 2,202,265 | | | | 2,398,639 | |
5.000%, 01/01/39 | | | 29,427 | | | | 32,122 | |
5.000%, 08/01/39 | | | 73,958 | | | | 80,328 | |
5.000%, 12/01/39 | | | 49,298 | | | | 53,885 | |
5.000%, 05/01/40 | | | 111,024 | | | | 121,374 | |
5.000%, 07/01/40 | | | 95,307 | | | | 104,251 | |
5.000%, 11/01/40 | | | 2,387,541 | | | | 2,613,009 | |
5.000%, 01/01/41 | | | 77,758 | | | | 84,998 | |
5.000%, 02/01/41 | | | 127,368 | | | | 139,248 | |
5.000%, 04/01/41 | | | 257,133 | | | | 281,255 | |
5.000%, 05/01/41 | | | 5,143,092 | | | | 5,627,410 | |
5.000%, 06/01/41 | | | 412,389 | | | | 451,125 | |
5.000%, 05/01/42 | | | 624,130 | | | | 681,113 | |
5.000%, TBA (a) | | | 22,800,000 | | | | 24,761,156 | |
6.000%, 04/01/33 | | | 171,749 | | | | 192,755 | |
6.000%, 02/01/34 | | | 37,645 | | | | 42,240 | |
6.000%, 11/01/35 | | | 388,073 | | | | 435,616 | |
6.000%, 08/01/37 | | | 838,001 | | | | 940,545 | |
6.500%, 03/01/26 | | | 1,819 | | | | 2,024 | |
6.500%, 04/01/29 | | | 100,187 | | | | 111,464 | |
7.000%, 11/01/28 | | | 2,832 | | | | 3,166 | |
7.000%, 02/01/29 | | | 3,844 | | | | 4,237 | |
7.000%, 01/01/30 | | | 2,495 | | | | 2,595 | |
7.000%, 10/01/37 | | | 64,958 | | | | 68,488 | |
7.000%, 11/01/37 | | | 60,526 | | | | 69,399 | |
7.000%, 12/01/37 | | | 53,831 | | | | 58,473 | |
7.000%, 02/01/38 | | | 73,043 | | | | 84,482 | |
7.000%, 08/01/38 | | | 80,139 | | | | 92,728 | |
7.000%, 09/01/38 | | | 7,214 | | | | 7,864 | |
7.000%, 11/01/38 | | | 414,120 | | | | 448,846 | |
7.000%, 02/01/39 | | | 3,823,646 | | | | 4,292,264 | |
7.500%, 04/01/32 | | | 14,982 | | | | 15,498 | |
|
Agency Sponsored Mortgage-Backed—(Continued) | |
Fannie Mae 30 Yr. Pool | | | | | | | | |
8.000%, 05/01/28 | | | 4,870 | | | | 5,599 | |
8.000%, 07/01/32 | | | 1,251 | | | | 1,448 | |
11.500%, 09/01/19 | | | 27 | | | | 27 | |
12.000%, 10/01/15 | | | 1,163 | | | | 1,170 | |
Fannie Mae ARM Pool | | | | | | | | |
1.836%, 07/01/37 (b) | | | 73,027 | | | | 77,581 | |
Fannie Mae Interest Strip (CMO) | | | | | | | | |
3.500%, 11/25/41 (c) | | | 4,883,205 | | | | 1,048,687 | |
4.000%, 04/25/42 (c) | | | 7,389,492 | | | | 1,786,140 | |
4.500%, 11/25/39 (c) | | | 5,352,907 | | | | 976,491 | |
Fannie Mae Pool | | | | | | | | |
3.500%, 10/01/42 | | | 12,062,257 | | | | 11,837,464 | |
3.500%, 12/01/42 | | | 1,913,043 | | | | 1,884,545 | |
3.500%, 05/01/43 | | | 489,845 | | | | 482,543 | |
4.000%, 10/01/42 | | | 3,345,829 | | | | 3,413,580 | |
4.000%, 07/01/43 | | | 98,625 | | | | 100,611 | |
4.000%, 08/01/43 | | | 2,183,808 | | | | 2,227,842 | |
5.000%, 05/01/40 | | | 48,916 | | | | 53,499 | |
6.500%, 12/01/27 | | | 5,450 | | | | 5,551 | |
6.500%, 04/01/29 | | | 1,411 | | | | 1,571 | |
6.500%, 05/01/32 | | | 63,043 | | | | 68,611 | |
12.000%, 01/15/16 | | | 179 | | | | 181 | |
12.500%, 09/20/15 | | | 39 | | | | 39 | |
12.500%, 01/15/16 | | | 587 | | | | 590 | |
Fannie Mae REMICS (CMO) | | | | | | | | |
Zero Coupon, 03/25/42 (d) | | | 1,210,010 | | | | 1,082,733 | |
3.000%, 12/25/27 (c) | | | 13,838,495 | | | | 1,874,415 | |
5.500%, 07/25/41 | | | 6,996,952 | | | | 7,612,348 | |
5.500%, 04/25/42 | | | 5,627,005 | | | | 6,133,318 | |
5.935%, 07/25/40 (b) (c) | | | 4,922,178 | | | | 878,479 | |
5.935%, 09/25/42 (b) (c) | | | 2,363,607 | | | | 499,417 | |
5.985%, 03/25/42 (b) (c) | | | 19,682,830 | | | | 2,731,386 | |
5.985%, 12/25/42 (b) (c) | | | 1,723,109 | | | | 385,593 | |
6.000%, 05/25/42 | | | 4,468,552 | | | | 4,886,120 | |
6.335%, 02/25/42 (b) (c) | | | 4,135,842 | | | | 852,920 | |
6.365%, 12/25/40 (b) (c) | | | 3,041,481 | | | | 341,102 | |
6.365%, 01/25/41 (b) (c) | | | 7,597,629 | | | | 1,127,868 | |
6.385%, 07/25/39 (b) (c) | | | 2,776,606 | | | | 501,820 | |
6.385%, 10/25/41 (b) (c) | | | 11,627,558 | | | | 1,681,893 | |
6.435%, 10/25/40 (b) (c) | | | 7,982,061 | | | | 1,496,338 | |
6.435%, 04/25/42 (b) (c) | | | 5,878,382 | | | | 1,023,919 | |
6.485%, 02/25/41 (b) (c) | | | 1,726,440 | | | | 362,453 | |
6.485%, 03/25/42 (b) (c) | | | 4,759,373 | | | | 733,086 | |
6.500%, 06/25/39 | | | 886,307 | | | | 988,162 | |
6.500%, 07/25/42 | | | 7,811,853 | | | | 8,556,353 | |
9.750%, 11/25/18 | | | 2,084,231 | | | | 2,364,530 | |
9.750%, 08/25/19 | | | 690,992 | | | | 783,090 | |
Fannie Mae Whole Loan | | | | | | | | |
3.395%, 01/25/43 (b) | | | 466,298 | | | | 482,623 | |
Freddie Mac 30 Yr. Gold Pool | | | | | | | | |
5.000%, 08/01/33 | | | 50,515 | | | | 54,700 | |
6.000%, 10/01/36 | | | 2,348,606 | | | | 2,627,906 | |
6.500%, 09/01/39 | | | 858,822 | | | | 955,767 | |
8.000%, 12/01/19 | | | 3,296 | | | | 3,324 | |
8.000%, 09/01/30 | | | 7,296 | | | | 8,586 | |
See accompanying notes to financial statements.
MSF-5
Metropolitan Series Fund
Western Asset Management U.S. Government Portfolio
Schedule of Investments as of December 31, 2013
U.S. Treasury & Government Agencies—(Continued)
| | | | | | | | |
| Security Description | | Principal
Amount* | | | Value | |
|
Agency Sponsored Mortgage-Backed—(Continued) | |
Freddie Mac 30 Yr. Non-Gold Pool | | | | | | | | |
8.000%, 07/01/20 | | | 5,959 | | | $ | 6,357 | |
Freddie Mac ARM Non-Gold Pool | | | | | | | | |
1.945%, 02/01/37 (b) | | | 20,099 | | | | 21,100 | |
2.171%, 05/01/37 (b) | | | 52,458 | | | | 55,693 | |
2.495%, 05/01/37 (b) | | | 62,072 | | | | 65,390 | |
2.697%, 01/01/35 (b) | | | 29,018 | | | | 31,124 | |
Freddie Mac Gold Pool | | | | | | | | |
3.500%, 04/01/43 | | | 587,388 | | | | 579,058 | |
4.000%, 04/01/43 | | | 2,360,822 | | | | 2,406,405 | |
4.000%, 08/01/43 | | | 1,389,486 | | | | 1,416,142 | |
Freddie Mac REMICS (CMO) | | | | | | | | |
4.500%, 04/15/32 | | | 304,579 | | | | 324,726 | |
5.983%, 10/15/42 (b) (c) | | | 3,086,881 | | | | 673,871 | |
6.000%, 05/15/36 | | | 1,715,031 | | | | 1,897,313 | |
6.433%, 11/15/41 (b) (c) | | | 5,655,110 | | | | 1,072,184 | |
8.500%, 06/15/21 | | | 26,264 | | | | 29,425 | |
Ginnie Mae I 30 Yr. Pool | | | | | | | | |
3.500%, TBA (a) | | | 4,000,000 | | | | 4,031,406 | |
5.500%, 06/15/36 | | | 1,130,492 | | | | 1,254,975 | |
6.000%, 03/15/33 | | | 1,663,381 | | | | 1,878,026 | |
6.500%, 06/15/31 | | | 7,928 | | | | 8,845 | |
6.500%, 08/15/34 | | | 320,661 | | | | 357,875 | |
7.500%, 01/15/29 | | | 11,983 | | | | 13,118 | |
7.500%, 09/15/29 | | | 3,105 | | | | 3,534 | |
7.500%, 02/15/30 | | | 3,830 | | | | 4,358 | |
8.500%, 05/15/18 | | | 9,713 | | | | 9,756 | |
8.500%, 06/15/25 | | | 50,569 | | | | 55,384 | |
9.000%, 12/15/16 | | | 2,317 | | | | 2,328 | |
Ginnie Mae II 30 Yr. Pool | | | | | | | | |
3.500%, TBA (a) | | | 1,800,000 | | | | 1,815,820 | |
4.000%, TBA (a) | | | 26,400,000 | | | | 27,448,782 | |
4.500%, 01/20/40 | | | 1,976,219 | | | | 2,119,574 | |
4.500%, 05/20/40 | | | 2,801,615 | | | | 3,003,532 | |
4.500%, 07/20/40 | | | 4,653,460 | | | | 4,990,019 | |
4.500%, 09/20/40 | | | 54,220 | | | | 58,336 | |
4.500%, 11/20/40 | | | 533,363 | | | | 572,806 | |
4.500%, 12/20/40 | | | 1,314,999 | | | | 1,411,716 | |
4.500%, 01/20/41 | | | 406,366 | | | | 436,248 | |
4.500%, 07/20/41 | | | 2,894,844 | | | | 3,098,318 | |
5.000%, 07/20/40 | | | 2,119,907 | | | | 2,321,755 | |
6.000%, 11/20/34 | | | 3,308 | | | | 3,750 | |
6.000%, 06/20/35 | | | 5,533 | | | | 6,184 | |
6.000%, 07/20/36 | | | 393,051 | | | | 442,605 | |
6.000%, 09/20/36 | | | 18,832 | | | | 21,212 | |
6.000%, 07/20/38 | | | 1,138,970 | | | | 1,282,325 | |
6.000%, 09/20/38 | | | 3,195,196 | | | | 3,597,759 | |
6.000%, 06/20/39 | | | 9,755 | | | | 10,992 | |
6.000%, 05/20/40 | | | 256,794 | | | | 289,138 | |
6.000%, 06/20/40 | | | 674,079 | | | | 759,067 | |
6.000%, 08/20/40 | | | 328,460 | | | | 370,126 | |
6.000%, 09/20/40 | | | 857,852 | | | | 955,540 | |
6.000%, 10/20/40 | | | 527,397 | | | | 587,859 | |
6.000%, 11/20/40 | | | 651,260 | | | | 727,768 | |
6.000%, 01/20/41 | | | 778,867 | | | | 870,587 | |
6.000%, 03/20/41 | | | 2,807,893 | | | | 3,130,214 | |
|
Agency Sponsored Mortgage-Backed—(Continued) | |
Ginnie Mae II 30 Yr. Pool | | | | | | | | |
6.000%, 07/20/41 | | | 618,024 | | | | 688,708 | |
6.000%, 12/20/41 | | | 463,770 | | | | 521,127 | |
6.500%, 10/20/37 | | | 850,117 | | | | 964,086 | |
Government National Mortgage Association | | | | | | | | |
0.773%, 09/16/51 (b) (c) | | | 24,723,667 | | | | 1,692,904 | |
0.856%, 02/16/53 (b) (c) | | | 30,306,092 | | | | 2,183,463 | |
0.870%, 02/16/53 (b) (c) | | | 66,503,325 | | | | 4,541,579 | |
0.950%, 06/16/55 (b) (c) | | | 16,171,940 | | | | 1,064,437 | |
0.952%, 09/16/46 (b) (c) | | | 88,026,654 | | | | 4,713,387 | |
2.000%, 12/16/49 | | | 4,320,000 | | | | 4,257,331 | |
2.250%, 03/16/35 | | | 6,652,262 | | | | 6,656,925 | |
2.900%, 02/16/44 (b) | | | 10,221,012 | | | | 10,452,460 | |
2.900%, 06/16/44 (b) | | | 3,385,090 | | | | 3,462,791 | |
Government National Mortgage Association (CMO) | | | | | | | | |
0.549%, 12/20/60 (b) | | | 22,924,341 | | | | 22,695,189 | |
0.569%, 12/20/60 (b) | | | 8,420,917 | | | | 8,334,644 | |
0.649%, 03/20/61 (b) | | | 6,572,148 | | | | 6,537,894 | |
0.669%, 12/20/60 (b) | | | 61,268,858 | | | | 61,003,112 | |
5.933%, 08/16/42 (b) (c) | | | 2,736,106 | | | | 460,606 | |
6.333%, 03/20/39 (b) (c) | | | 1,220,463 | | | | 197,376 | |
6.483%, 01/20/40 (b) (c) | | | 2,666,606 | | | | 458,477 | |
| | | | | | | | |
| | | | | | | 753,442,862 | |
| | | | | | | | |
|
Federal Agencies—29.7% | |
Federal Farm Credit Bank | | | | | | | | |
0.250%, 07/28/14 | | | 20,000,000 | | | | 20,011,440 | |
0.250%, 01/07/15 | | | 20,000,000 | | | | 20,010,960 | |
0.390%, 05/09/16 | | | 20,000,000 | | | | 19,917,820 | |
0.540%, 06/06/16 | | | 20,000,000 | | | | 19,976,160 | |
0.820%, 02/21/17 | | | 20,000,000 | | | | 19,926,520 | |
1.500%, 11/16/15 | | | 20,000,000 | | | | 20,426,900 | |
1.950%, 11/15/17 | | | 19,980,000 | | | | 20,394,845 | |
2.625%, 04/17/14 | | | 25,000,000 | | | | 25,181,800 | |
Federal Home Loan Bank | | | | | | | | |
2.125%, 06/09/23 | | | 17,700,000 | | | | 15,813,835 | |
2.750%, 06/08/18 (e) | | | 15,000,000 | | | | 15,647,130 | |
5.250%, 12/11/20 | | | 12,000,000 | | | | 13,899,168 | |
Federal Home Loan Bank of Chicago | | | | | | | | |
5.625%, 06/13/16 | | | 43,170,000 | | | | 48,160,582 | |
Federal Home Loan Mortgage Corp. | | | | | | | | |
1.250%, 10/02/19 (e) | | | 6,500,000 | | | | 6,157,690 | |
2.375%, 01/13/22 (e) | | | 73,000,000 | | | | 69,785,445 | |
5.000%, 12/14/18 (e) | | | 13,241,000 | | | | 15,012,010 | |
6.750%, 03/15/31 | | | 1,000,000 | | | | 1,323,086 | |
Federal National Mortgage Association | | | | | | | | |
Zero Coupon, 10/09/19 | | | 50,000,000 | | | | 42,514,550 | |
0.500%, 10/22/15 | | | 30,000,000 | | | | 30,046,530 | |
0.550%, 09/06/16 | | | 22,600,000 | | | | 22,500,718 | |
0.625%, 08/26/16 (e) | | | 20,000,000 | | | | 19,966,880 | |
0.700%, 05/22/17 | | | 8,375,000 | | | | 8,217,123 | |
2.250%, 10/17/22 | | | 14,000,000 | | | | 12,722,766 | |
5.125%, 01/02/14 | | | 37,250,000 | | | | 37,254,693 | |
6.625%, 11/15/30 | | | 3,000,000 | | | | 3,902,334 | |
See accompanying notes to financial statements.
MSF-6
Metropolitan Series Fund
Western Asset Management U.S. Government Portfolio
Schedule of Investments as of December 31, 2013
U.S. Treasury & Government Agencies—(Continued)
| | | | | | | | |
| Security Description | | Principal
Amount* | | | Value | |
|
Federal Agencies—(Continued) | |
Financing Corp. Fico | | | | | | | | |
Zero Coupon, 10/06/17 | | | 20,433,000 | | | $ | 19,252,075 | |
Zero Coupon, 12/27/18 | | | 16,254,000 | | | | 14,644,334 | |
Zero Coupon, 06/06/19 | | | 27,884,000 | | | | 24,777,555 | |
Zero Coupon, 09/26/19 | | | 14,535,000 | | | | 12,549,970 | |
Government Trust Certificates | | | | | | | | |
Zero Coupon, 10/01/16 | | | 8,567,000 | | | | 8,242,559 | |
National Archives Facility Trust | | | | | | | | |
8.500%, 09/01/19 | | | 3,108,989 | | | | 3,727,093 | |
New Valley Generation II | | | | | | | | |
5.572%, 05/01/20 | | | 9,970,336 | | | | 11,266,480 | |
Overseas Private Investment Corp. | | | | | | | | |
Zero Coupon, 11/18/15 | | | 8,000,000 | | | | 7,979,376 | |
Zero Coupon, 03/15/18 | | | 5,000,000 | | | | 5,225,930 | |
2.310%, 11/15/30 | | | 9,673,002 | | | | 8,605,953 | |
3.490%, 12/20/29 (f) | | | 10,000,000 | | | | 10,000,000 | |
Residual Funding Corp. Principal Strip | | | | | | | | |
Zero Coupon, 10/15/20 | | | 38,159,000 | | | | 31,411,764 | |
Tennessee Valley Authority | | | | | | | | |
1.750%, 10/15/18 (e) | | | 20,000,000 | | | | 19,875,740 | |
3.875%, 02/15/21 | | | 35,000,000 | | | | 36,957,585 | |
4.500%, 04/01/18 | | | 20,000,000 | | | | 22,191,340 | |
5.500%, 07/18/17 | | | 21,306,000 | | | | 24,397,863 | |
| | | | | | | | |
| | | | | | | 789,876,602 | |
| | | | | | | | |
|
U.S. Treasury—36.2% | |
U.S. Treasury Bonds | | | | | | | | |
8.000%, 11/15/21 | | | 12,800,000 | | | | 17,779,994 | |
U.S. Treasury Inflation Indexed Bonds | | | | | | | | |
0.625%, 02/15/43 | | | 16,254,400 | | | | 12,498,106 | |
0.750%, 02/15/42 (e) | | | 3,514,444 | | | | 2,825,283 | |
U.S. Treasury Inflation Indexed Notes | | | | | | | | |
0.125%, 01/15/23 | | | 8,095,120 | | | | 7,645,460 | |
0.375%, 07/15/23 | | | 16,058,240 | | | | 15,487,418 | |
U.S. Treasury Notes | | | | | | | | |
0.125%, 07/31/14 (e) | | | 31,000,000 | | | | 31,003,627 | |
0.250%, 05/31/14 (e) | | | 13,000,000 | | | | 13,007,618 | |
0.250%, 06/30/14 (e) | | | 94,000,000 | | | | 94,073,414 | |
0.250%, 09/30/14 (e) | | | 20,000,000 | | | | 20,016,400 | |
0.250%, 10/31/14 | | | 30,000,000 | | | | 30,025,770 | |
0.250%, 10/15/15 (e) | | | 59,000,000 | | | | 58,923,949 | |
0.250%, 11/30/15 (e) | | | 343,000,000 | | | | 342,316,744 | |
0.750%, 06/30/17 | | | 59,000,000 | | | | 58,377,727 | |
1.500%, 07/31/16 (e) | | | 92,000,000 | | | | 94,098,704 | |
2.750%, 11/15/23 (e) | | | 38,600,000 | | | | 37,761,646 | |
3.125%, 01/31/17 (e) | | | 118,000,000 | | | | 126,149,316 | |
| | | | | | | | |
| | | | | | | 961,991,176 | |
| | | | | | | | |
Total U.S. Treasury & Government Agencies
(Cost $2,526,349,756) | | | | 2,505,310,640 | |
| | | | | | | | |
| Corporate Bonds & Notes—10.3% | |
| Security Description | | Principal
Amount* | | | Value | |
|
Banks—2.1% | |
National Australia Bank, Ltd. | | | | | | | | |
1.250%, 03/08/18 (144A) (e) | | | 13,000,000 | | | | 12,654,395 | |
National Bank of Canada | | | | | | | | |
2.200%, 10/19/16 (144A) (e) | | | 13,000,000 | | | | 13,417,313 | |
Royal Bank of Canada | | | | | | | | |
2.000%, 10/01/19 (e) | | | 10,000,000 | | | | 9,948,100 | |
Stadshypotek AB | | | | | | | | |
1.875%, 10/02/19 (144A) (e) | | | 5,000,000 | | | | 4,819,000 | |
UBS AG | | | | | | | | |
0.750%, 03/24/17 (144A) (e) | | | 16,000,000 | | | | 16,089,232 | |
| | | | | | | | |
| | | | | | | 56,928,040 | |
| | | | | | | | |
|
Diversified Financial Services—7.9% | |
COP I LLC | | | | | | | | |
3.650%, 12/05/21 | | | 10,316,719 | | | | 10,950,991 | |
MSN 41079 & 41084, Ltd. | | | | | | | | |
1.717%, 07/13/24 | | | 9,058,619 | | | | 8,642,801 | |
National Credit Union Administration Guaranteed Notes | | | | | | | | |
3.450%, 06/12/21 | | | 45,000,000 | | | | 46,903,500 | |
NCUA Guaranteed Notes | | | | | | | | |
3.000%, 06/12/19 | | | 16,250,000 | | | | 16,997,500 | |
Postal Square, L.P. | | | | | | | | |
6.500%, 06/15/22 | | | 9,416,340 | | | | 11,060,951 | |
Private Export Funding Corp. | | | | | | | | |
1.375%, 02/15/17 | | | 25,000,000 | | | | 25,234,275 | |
2.250%, 12/15/17 | | | 40,000,000 | | | | 41,194,760 | |
3.050%, 10/15/14 | | | 20,000,000 | | | | 20,438,720 | |
4.950%, 11/15/15 (e) | | | 25,000,000 | | | | 27,111,700 | |
| | | | | | | | |
| | | | | | | 208,535,198 | |
| | | | | | | | |
|
Oil & Gas—0.3% | |
Petroleos Mexicanos | | | | | | | | |
1.700%, 12/20/22 | | | 9,000,000 | | | | 8,746,317 | |
| | | | | | | | |
Total Corporate Bonds & Notes
(Cost $259,767,688) | | | | | | | 274,209,555 | |
| | | | | | | | |
|
| Mortgage-Backed Securities—4.6% | |
|
Collateralized Mortgage Obligations—2.8% | |
American Home Mortgage Assets LLC | | | | | | | | |
0.355%, 09/25/46 (b) | | | 1,076,613 | | | | 757,241 | |
0.355%, 12/25/46 (b) | | | 3,144,215 | | | | 2,062,702 | |
Banc of America Funding Corp. | | | | | | | | |
2.393%, 06/20/35 (b) | | | 463,999 | | | | 291,266 | |
Banc of America Mortgage 2005-F Trust | | | | | | | | |
2.739%, 07/25/35 (b) | | | 189,819 | | | | 180,150 | |
Citigroup Mortgage Loan Trust, Inc. | | | | | | | | |
2.510%, 10/25/35 (b) | | | 351,874 | | | | 343,405 | |
Countrywide Alternative Loan Trust | | | | | | | | |
0.367%, 07/20/46 (b) | | | 3,954,067 | | | | 2,353,077 | |
0.397%, 07/20/35 (b) | | | 1,506,417 | | | | 1,297,281 | |
0.455%, 05/25/34 (b) | | | 3,628,158 | | | | 3,518,805 | |
See accompanying notes to financial statements.
MSF-7
Metropolitan Series Fund
Western Asset Management U.S. Government Portfolio
Schedule of Investments as of December 31, 2013
Mortgage-Backed Securities—(Continued)
| | | | | | | | |
| Security Description | | Principal
Amount* | | | Value | |
|
Collateralized Mortgage Obligations—(Continued) | |
Countrywide Home Loan Mortgage Pass-Through Trust | | | | | | | | |
0.525%, 03/25/35 (144A) (b) | | | 154,656 | | | $ | 134,757 | |
0.585%, 07/25/36 (144A) (b) | | | 1,307,452 | | | | 1,135,855 | |
Deutsche Mortgage Securities, Inc. | | | | | | | | |
5.230%, 06/26/35 (144A) (b) | | | 3,247,305 | | | | 3,265,392 | |
FDIC Structured Sale Guaranteed Notes | | | | | | | | |
0.719%, 02/25/48 (144A) (b) | | | 2,110,682 | | | | 2,115,614 | |
First Horizon Alternative Mortgage Securities | | | | | | | | |
0.535%, 02/25/37 (b) | | | 355,536 | | | | 237,872 | |
GMAC Mortgage Corp. Loan Trust | | | | | | | | |
2.691%, 11/19/35 (b) | | | 997,581 | | | | 924,794 | |
Greenpoint Mortgage Funding Trust | | | | | | | | |
0.245%, 02/25/47 (b) | | | 216,679 | | | | 183,141 | |
GSMPS Mortgage Loan Trust | | | | | | | | |
0.515%, 01/25/35 (144A) (b) | | | 518,374 | | | | 434,551 | |
0.565%, 06/25/34 (144A) (b) | | | 899,051 | | | | 785,384 | |
3.271%, 06/25/34 (144A) (b) | | | 5,304,227 | | | | 4,776,690 | |
GSR Mortgage Loan Trust | | | | | | | | |
2.598%, 04/25/35 (b) | | | 1,110,998 | | | | 1,060,292 | |
HarborView Mortgage Loan Trust | | | | | | | | |
0.346%, 11/19/46 (b) | | | 180,365 | | | | 123,400 | |
0.366%, 09/19/46 (b) | | | 436,902 | | | | 333,711 | |
Impac Secured Assets CMN Owner Trust | | | | | | | | |
0.485%, 03/25/36 (b) | | | 5,590,030 | | | | 3,792,612 | |
JPMorgan Mortgage Trust | | | | | | | | |
2.107%, 06/25/34 (b) | | | 333,192 | | | | 328,027 | |
Luminent Mortgage Trust | | | | | | | | |
0.355%, 05/25/46 (b) | | | 3,493,582 | | | | 2,485,030 | |
MASTR Adjustable Rate Mortgages Trust | | | | | | | | |
0.365%, 05/25/47 (b) | | | 7,017,928 | | | | 4,906,879 | |
0.939%, 12/25/46 (b) | | | 6,494,257 | | | | 3,562,256 | |
2.236%, 02/25/34 (b) | | | 288,194 | | | | 285,769 | |
3.179%, 12/25/34 (b) | | | 25,038 | | | | 24,685 | |
MASTR Reperforming Loan Trust | | | | | | | | |
0.515%, 05/25/35 (144A) (b) | | | 431,083 | | | | 363,028 | |
3.336%, 05/25/35 (144A) (b) | | | 5,315,547 | | | | 4,278,181 | |
4.875%, 05/25/36 (144A) (b) | | | 4,258,660 | | | | 4,056,945 | |
6.000%, 08/25/34 (144A) | | | 108,971 | | | | 111,866 | |
7.000%, 08/25/34 (144A) | | | 521,919 | | | | 539,227 | |
MASTR Seasoned Securities Trust | | | | | | | | |
3.391%, 10/25/32 (b) | | | 29,169 | | | | 29,255 | |
Merrill Lynch Mortgage Investors Trust | | | | | | | | |
0.435%, 04/25/35 (b) | | | 69,230 | | | | 66,780 | |
Morgan Stanley Mortgage Loan Trust | | | | | | | | |
0.235%, 06/25/36 (b) | | | 807,598 | | | | 373,319 | |
2.462%, 10/25/34 (b) | | | 229,930 | | | | 230,795 | |
2.463%, 07/25/35 (b) | | | 462,623 | | | | 393,316 | |
NovaStar Mortgage-Backed Notes | | | | | | | | |
0.355%, 09/25/46 (b) | | | 2,966,928 | | | | 2,481,189 | |
Provident Funding Mortgage Loan Trust | | | | | | | | |
2.638%, 10/25/35 (b) | | | 174,971 | | | | 172,359 | |
2.720%, 05/25/35 (b) | | | 1,169,416 | | | | 1,148,995 | |
RALI Trust | | | | | | | | |
0.325%, 01/25/37 (b) | | | 574,499 | | | | 411,362 | |
|
Collateralized Mortgage Obligations—(Continued) | |
RALI Trust | | | | | | | | |
0.565%, 10/25/45 (b) | | | 541,655 | | | | 404,928 | |
3.590%, 12/25/35 (b) | | | 2,920,498 | | | | 2,307,760 | |
RFMSI Trust | | | | | | | | |
4.750%, 12/25/18 | | | 481,042 | | | | 490,319 | |
SACO I, Inc. | | | | | | | | |
9.056%, 06/25/21 (144A) (b) | | | 2,111,723 | | | | 2,158,012 | |
Structured Adjustable Rate Mortgage Loan Trust | | | | | | | | |
2.540%, 05/25/35 (b) | | | 5,670,626 | | | | 5,207,942 | |
Structured Asset Mortgage Investments II Trust | | | | | | | | |
0.345%, 07/25/46 (b) | | | 316,848 | | | | 242,941 | |
Structured Asset Securities Corp. | | | | | | | | |
0.515%, 04/25/35 (144A) (b) | | | 3,811,123 | | | | 3,229,866 | |
3.438%, 06/25/35 (144A) (b) | | | 218,612 | | | | 194,584 | |
Structured Asset Securities Corp. Mortgage Loan Trust | | | | | | | | |
0.965%, 09/25/33 (144A) (b) | | | 41,824 | | | | 38,757 | |
Thornburg Mortgage Securities Trust | | | | | | | | |
6.086%, 09/25/37 (b) | | | 110,246 | | | | 108,294 | |
6.102%, 09/25/37 (b) | | | 105,961 | | | | 109,990 | |
WaMu Mortgage Pass-Through Certificates | | | | | | | | |
0.425%, 11/25/45 (b) | | | 102,628 | | | | 93,319 | |
0.435%, 12/25/45 (b) | | | 2,606,458 | | | | 2,368,872 | |
0.455%, 12/25/45 (b) | | | 215,626 | | | | 197,283 | |
0.485%, 08/25/45 (b) | | | 245,622 | | | | 236,867 | |
0.565%, 08/25/45 (b) | | | 504,702 | | | | 458,284 | |
0.878%, 06/25/47 (b) | | | 281,904 | | | | 243,890 | |
2.425%, 04/25/35 (b) | | | 100,000 | | | | 93,138 | |
| | | | | | | | |
| | | | | | | 74,542,301 | |
| | | | | | | | |
|
Commercial Mortgage-Backed Securities—1.8% | |
FDIC Structured Sale Guaranteed Notes | | | | | | | | |
2.980%, 12/06/20 (144A) | | | 15,815,563 | | | | 16,302,366 | |
NCUA Guaranteed Notes Trust | | | | | | | | |
2.900%, 10/29/20 | | | 30,000,000 | | | | 30,988,770 | |
| | | | | | | | |
| | | | | | | 47,291,136 | |
| | | | | | | | |
Total Mortgage-Backed Securities
(Cost $126,245,295) | | | | | | | 121,833,437 | |
| | | | | | | | |
|
| Foreign Government—4.4% | |
|
Sovereign—4.4% | |
Egypt Government AID Bonds | | | | | | | | |
4.450%, 09/15/15 | | | 20,000,000 | | | | 21,350,740 | |
Indonesia Government International Bond | | | | | | | | |
3.750%, 04/25/22 (144A) | | | 410,000 | | | | 369,513 | |
3.750%, 04/25/22 | | | 1,900,000 | | | | 1,712,375 | |
4.875%, 05/05/21 (e) | | | 2,957,000 | | | | 2,927,430 | |
5.875%, 03/13/20 | | | 310,000 | | | | 327,670 | |
Israel Government AID Bonds | | | | | | | | |
Zero Coupon, 08/15/16 | | | 28,251,000 | | | | 27,559,359 | |
Zero Coupon, 09/15/16 | | | 10,000,000 | | | | 9,736,890 | |
See accompanying notes to financial statements.
MSF-8
Metropolitan Series Fund
Western Asset Management U.S. Government Portfolio
Schedule of Investments as of December 31, 2013
Foreign Government—(Continued)
| | | | | | | | |
| Security Description | |
Principal
Amount* | | | Value | |
|
Sovereign—(Continued) | |
Israel Government AID Bonds | | | | | | | | |
Zero Coupon, 11/15/18 | | | 20,869,000 | | | $ | 18,868,059 | |
Province of British Columbia | | | | | | | | |
2.650%, 09/22/21 (e) | | | 4,000,000 | | | | 3,905,080 | |
Russian Foreign Bond - Eurobond | | | | | | | | |
7.500%, 03/31/30 | | | 11,179,740 | | | | 13,026,633 | |
South Africa Government International Bond | | | | | | | | |
5.875%, 09/16/25 (e) | | | 10,010,000 | | | | 10,410,400 | |
Turkey Government International Bonds | | | | | | | | |
5.625%, 03/30/21 | | | 1,078,000 | | | | 1,082,312 | |
6.250%, 09/26/22 | | | 2,205,000 | | | | 2,289,893 | |
7.000%, 03/11/19 | | | 1,660,000 | | | | 1,817,700 | |
7.500%, 11/07/19 | | | 540,000 | | | | 603,990 | |
| | | | | | | | |
Total Foreign Government
(Cost $117,233,639) | | | | | | | 115,988,044 | |
| | | | | | | | |
|
| Asset-Backed Securities—0.9% | |
|
Asset-Backed - Credit Card—0.0% | |
Compucredit Acquired Portfolio Voltage Master Trust | | | | | | | | |
0.337%, 09/17/18 (144A) (b) | | | 213,436 | | | | 213,436 | |
| | | | | | | | |
|
Asset-Backed - Home Equity—0.1% | |
Bayview Financial Acquisition Trust | | | | | | | | |
0.752%, 08/28/44 (b) | | | 3,501 | | | | 3,487 | |
Bayview Financial Asset Trust | | | | | | | | |
0.765%, 12/25/39 (144A) (b) | | | 319,282 | | | | 301,283 | |
EMC Mortgage Loan Trust | | | | | | | | |
0.615%, 12/25/42 (144A) (b) | | | 88,058 | | | | 81,510 | |
Home Equity Mortgage Loan Asset-Backed Trust | | | | | | | | |
0.425%, 06/25/36 (b) | | | 4,550,576 | | | | 1,127,178 | |
Morgan Stanley Mortgage Loan Trust | | | | | | | | |
0.255%, 12/25/36 (b) | | | 284,417 | | | | 148,614 | |
0.465%, 03/25/36 (b) | | | 1,989,611 | | | | 829,220 | |
Option One Mortgage Loan Trust | | | | | | | | |
0.745%, 06/25/33 (b) | | | 134,878 | | | | 126,351 | |
Structured Asset Securities Corp. Mortgage Loan Trust | | | | | | | | |
0.385%, 02/25/36 (144A) (b) | | | 4,930,525 | | | | 343,771 | |
| | | | | | | | |
| | | | | | | 2,961,414 | |
| | | | | | | | |
|
Asset-Backed - Other—0.4% | |
ACE Securities Corp. | | | | | | | | |
0.425%, 02/25/31 (b) | | | 582,043 | | | | 538,918 | |
Amortizing Residential Collateral Trust | | | | | | | | |
0.846%, 01/01/32 (b) | | | 69,696 | | | | 62,554 | |
|
Asset-Backed - Other—(Continued) | |
Countrywide Home Equity Loan Trust | | | | | | | | |
0.307%, 07/15/36 (b) | | | 1,526,501 | | | $ | 1,180,568 | |
0.317%, 11/15/36 (b) | | | 66,930 | | | | 56,126 | |
0.447%, 02/15/34 (b) | | | 363,377 | | | | 308,314 | |
0.457%, 02/15/34 (b) | | | 210,015 | | | | 183,238 | |
Fremont Home Loan Trust | | | | | | | | |
0.265%, 08/25/36 (b) | | | 185,950 | | | | 72,249 | |
GMAC Mortgage Corp. Loan Trust | | | | | | | | |
0.345%, 12/25/36 (b) | | | 721,421 | | | | 609,147 | |
0.375%, 11/25/36 (b) | | | 3,918,976 | | | | 3,173,215 | |
GSAMP Trust | | | | | | | | |
0.255%, 05/25/36 (b) | | | 1,280,539 | | | | 253,640 | |
GSR Mortgage Loan Trust | | | | | | | | |
0.705%, 11/25/30 (b) | | | 7,583 | | | | 1,598 | |
Ownit Mortgage Loan Trust | | | | | | | | |
3.577%, 12/25/36 | | | 1,359,854 | | | | 603,331 | |
RAAC Series | | | | | | | | |
0.435%, 05/25/36 (144A) (b) | | | 2,044,964 | | | | 1,770,369 | |
SACO I, Inc. | | | | | | | | |
0.425%, 06/25/36 (b) | | | 1,059,129 | | | | 1,335,922 | |
0.465%, 04/25/36 (b) | | | 422,880 | | | | 505,468 | |
0.685%, 06/25/36 (b) | | | 17,464 | | | | 19,072 | |
Soundview Home Loan Trust | | | | | | | | |
5.588%, 10/25/36 | | | 375,913 | | | | 306,623 | |
WMC Mortgage Loan Trust | | | | | | | | |
0.797%, 07/20/29 (b) | | | 29,530 | | | | 27,731 | |
| | | | | | | | |
| | | | | | | 11,008,083 | |
| | | | | | | | |
|
Asset-Backed - Student Loan—0.4% | |
NCUA Guaranteed Notes Trust 2010-A1 | | | | | | | | |
0.521%, 12/07/20 (b) | | | 10,017,195 | | | | 10,027,813 | |
| | | | | | | | |
Total Asset-Backed Securities
(Cost $32,066,571) | | | | | | | 24,210,746 | |
| | | | | | | | |
|
| Short-Term Investments—21.1% | |
|
Mutual Fund—20.8% | |
State Street Navigator Securities Lending MET Portfolio (g) | | | 553,809,056 | | | | 553,809,056 | |
| | | | | | | | |
|
Repurchase Agreements—0.3% | |
Barclays Capital, Inc.
Repurchase Agreement dated 12/31/2013 at 0.01% to be repurchased at $5,000,003 on 01/02/14 collateralized by $4,916,000 U.S. Treasury Note at 2.000% due 04/30/16 with a value $5,100,217. | | | 5,000,000 | | | | 5,000,000 | |
See accompanying notes to financial statements.
MSF-9
Metropolitan Series Fund
Western Asset Management U.S. Government Portfolio
Schedule of Investments as of December 31, 2013
Short-Term Investments—(Continued)
| | | | | | | | |
| Security Description | | Principal
Amount* | | | Value | |
|
Repurchase Agreements—(Continued) | |
Fixed Income Clearing Corp.
Repurchase Agreement dated 12/31/13 at 0.000% to be repurchased at $4,515,000 on 01/02/14, collateralized by $4,180,000 U.S. Treasury Note at 3.625% due 02/15/20 with a value of $4,608,450. | | | 4,515,000 | | | $ | 4,515,000 | |
| | | | | | | | |
| | | | | | | 9,515,000 | |
| | | | | | | | |
Total Short-Term Investments
(Cost $563,324,056) | | | | | | | 563,324,056 | |
| | | | | | | | |
Total Investments—135.6%
(Cost $3,624,987,005) (h) | | | | | | | 3,604,876,478 | |
Other assets and liabilities (net)—(35.6)% | | | | | | | (947,287,780 | ) |
| | | | | | | | |
| Net Assets—100.0% | | | | | | $ | 2,657,588,698 | |
| | | | | | | | |
| * | Principal amount stated in U.S. dollars unless otherwise noted. |
| (a) | TBA (To Be Announced) Securities are purchased on a forward commitment basis with an approximate principal amount and no defined maturity date. The actual principal and maturity date will be determined upon settlement date. |
| (b) | Variable or floating rate security. The stated rate represents the rate at December 31, 2013. Maturity date shown for callable securities reflects the earliest possible call date. |
| (c) | Interest only security. |
| (d) | Principal only security. |
| (e) | All or a portion of the security was held on loan. As of December 31, 2013, the market value of securities loaned was $740,156,798 and the collateral received consisted of cash in the amount of $553,809,056 and non-cash collateral with a value of $203,531,428. The cash collateral is invested in a money market fund managed by an affiliate of the custodian. The non-cash collateral received consists primarily of government securities and bank letters of credit, and is held for the benefit of the Portfolio at the Portfolio’s custodian. The Portfolio cannot repledge or resell this collateral. As such, this collateral is excluded from the Statement of Assets and Liabilities. |
| (f) | Security was valued in good faith under procedures approved by the Board of Trustees. As of December 31, 2013, these securities represent 0.4% of net assets. |
| (g) | Represents investment of cash collateral received from securities lending transactions. |
| (h) | As of December 31, 2013, the aggregate cost of investments for federal income tax purposes was $3,642,839,539. The aggregate unrealized appreciation and depreciation of investments were $21,278,364 and $(59,241,425), respectively, resulting in net unrealized depreciation of $(37,963,061) for federal income tax purposes. |
| (144A)— | Securities exempt from registration under Rule 144A of the Securities Act of 1933. These securities may be resold in transactions exempt from registration, normally to qualified institutional buyers. As of December 31, 2013, the market value of 144A securities was $93,980,897, which is 3.5% of net assets. |
| (ARM)— | Adjustable-Rate Mortgage |
| (CMO)— | Collateralized Mortgage Obligation |
| (REMIC)— | Real Estate Mortgage Investment Conduit |
Futures Contracts
| | | | | | | | | | | | | | | | | | | | |
Futures Contracts—Long | | Expiration
Date | | | Number of
Contracts | | | Notional
Amount | | | Unrealized
Appreciation/
(Depreciation) | |
U.S. Treasury Note 5 Year Futures | | | 03/31/14 | | | | 753 | | | | USD | | | | 90,624,901 | | | $ | (782,588 | ) |
| | | | | |
Futures Contracts—Short | | | | | | | | | | | | | | | |
U.S. Treasury Long Bond Futures | | | 03/20/14 | | | | (247 | ) | | | USD | | | | (32,388,307 | ) | | | 695,119 | |
U.S. Treasury Note 10 Year Futures | | | 03/20/14 | | | | (2,029 | ) | | | USD | | | | (253,953,820 | ) | | | 4,291,711 | |
U.S. Treasury Ultra Long Bond Futures | | | 03/20/14 | | | | (36 | ) | | | USD | | | | (4,970,133 | ) | | | 65,133 | |
| | | | | | | | | | | | | | | | | | | | |
Net Unrealized Appreciation | | | $ | 4,269,375 | |
| | | | | | | | | | | | | | | | | | | | |
| (USD)— | United States Dollar |
See accompanying notes to financial statements.
MSF-10
Metropolitan Series Fund
Western Asset Management U.S. Government Portfolio
Schedule of Investments as of December 31, 2013
Fair Value Hierarchy
Accounting principles generally accepted in the United States of America (“GAAP”) define fair market value as the price that the Portfolio would receive to sell an asset or pay to transfer a liability in an orderly transaction between market participants at the measurement date. It establishes a fair value hierarchy that prioritizes inputs to valuation methods and requires disclosure of the fair value hierarchy that segregates fair value measurements into three levels. Levels 1, 2 and 3 of the fair value hierarchy are defined as follows:
Level 1 - unadjusted quoted prices in active markets for identical investments
Level 2 - other significant observable inputs (including, but not limited to, unadjusted quoted prices for similar investments in markets that are either active or inactive; inputs other than quoted prices that are observable such as interest rates, yield curves, volatilities, prepayment speeds, loss severities, credit risks, default rates, etc.)
Level 3 - significant unobservable inputs based on the best information available in the circumstances, to the extent observable inputs are unavailable (including the Portfolio’s own assumptions in determining the fair value of investments)
The inputs or methodologies used for valuing investments are not necessarily an indication of the risk associated with investing in them. Changes to the inputs or methodologies used may result in transfers between levels, which will be recognized as of the beginning of the reporting period. Information on transfers between Level 1 and Level 2, if any, will be disclosed following the fair value hierarchy table below. A reconciliation of Level 3 securities, if any, will also be disclosed following the fair value hierarchy table. For more information about the Portfolio’s policy regarding the valuation of investments, please refer to the Notes to Financial Statements.
The following table summarizes the fair value hierarchy of the Portfolio’s investments as of December 31, 2013:
| | | | | | | | | | | | | | | | |
| Description | | Level 1 | | | Level 2 | | | Level 3 | | | Total | |
| U.S. Treasury & Government Agencies | | | | | | | | | | | | | | | | |
Agency Sponsored Mortgage-Backed | | $ | — | | | $ | 753,442,862 | | | $ | — | | | $ | 753,442,862 | |
Federal Agencies | | | — | | | | 779,876,602 | | | | 10,000,000 | | | | 789,876,602 | |
U.S. Treasury | | | — | | | | 961,991,176 | | | | — | | | | 961,991,176 | |
Total U.S. Treasury & Government Agencies | | | — | | | | 2,495,310,640 | | | | 10,000,000 | | | | 2,505,310,640 | |
Total Corporate Bonds & Notes* | | | — | | | | 274,209,555 | | | | — | | | | 274,209,555 | |
Total Mortgage-Backed Securities* | | | — | | | | 121,833,437 | | | | — | | | | 121,833,437 | |
Total Foreign Government* | | | — | | | | 115,988,044 | | | | — | | | | 115,988,044 | |
Total Asset-Backed Securities* | | | — | | | | 24,210,746 | | | | — | | | | 24,210,746 | |
| Short-Term Investments | | | | | | | | | | | | | | | | |
Mutual Fund | | | 553,809,056 | | | | — | | | | — | | | | 553,809,056 | |
Repurchase Agreements | | | — | | | | 9,515,000 | | | | — | | | | 9,515,000 | |
Total Short-Term Investments | | | 553,809,056 | | | | 9,515,000 | | | | — | | | | 563,324,056 | |
Total Investments | | $ | 553,809,056 | | | $ | 3,041,067,422 | | | $ | 10,000,000 | | | $ | 3,604,876,478 | |
| | | | | | | | | | | | | | | | | |
Collateral for securities loaned (Liability) | | $ | — | | | $ | (553,809,056 | ) | | $ | — | | | $ | (553,809,056 | ) |
| Futures Contracts | | | | | | | | | | | | | | | | |
Futures Contracts (Unrealized Appreciation) | | $ | 5,051,963 | | | $ | — | | | $ | — | | | $ | 5,051,963 | |
Futures Contracts (Unrealized Depreciation) | | | (782,588 | ) | | | — | | | | — | | | | (782,588 | ) |
Total Futures Contracts | | $ | 4,269,375 | | | $ | — | | | $ | — | | | $ | 4,269,375 | |
| * | See Schedule of Investments for additional detailed categorizations. |
Following is a reconciliation of Level 3 assets for which significant unobservable inputs were used to determine fair value:
| | | | | | | | | | | | | | | | |
Investments in Securities | | Balance as of
December 31,
2012 | | | Purchases | | | Balance as of
December 31,
2013 | | | Change in Unrealized
Appreciation/
(Depreciation) from
investments still held at
December 31, 2013 | |
| U.S Treasury & Government Agencies | | | | | | | | | | | | | | | | |
Federal Agencies | | $ | — | | | $ | 10,000,000 | | | $ | 10,000,000 | | | $ | — | |
| | | | | | | | | | | | | | | | |
See accompanying notes to financial statements.
MSF-11
Metropolitan Series Fund
Western Asset Management U.S. Government Portfolio
Statement of Assets and Liabilities
December 31, 2013
| | | | |
Assets | | | | |
Investments at value (a) (b) | | $ | 3,604,876,478 | |
Cash | | | 945 | |
Cash collateral for futures contracts | | | 4,062,900 | |
Receivable for: | | | | |
TBA securities sold | | | 154,326,602 | |
Fund shares sold | | | 1,721,894 | |
Interest | | | 9,842,561 | |
Variation margin on futures contracts | | | 423,172 | |
Prepaid expenses | | | 7,134 | |
Other assets | | | 189,700 | |
| | | | |
Total Assets | | | 3,775,451,386 | |
Liabilities | | | | |
Collateral for securities loaned | | | 553,809,056 | |
Payables for: | | | | |
TBA securities purchased | | | 562,276,676 | |
Fund shares redeemed | | | 462,404 | |
Accrued expenses: | | | | |
Management fees | | | 1,025,482 | |
Distribution and service fees | | | 116,617 | |
Deferred trustees’ fees | | | 50,424 | |
Other expenses | | | 122,029 | |
| | | | |
Total Liabilities | | | 1,117,862,688 | |
| | | | |
Net Assets | | $ | 2,657,588,698 | |
| | | | |
Net assets consist of: | | | | |
Paid in surplus | | $ | 2,668,031,779 | |
Undistributed net investment income | | | 49,720,491 | |
Accumulated net realized loss | | | (44,512,120 | ) |
Unrealized depreciation on investments and futures contracts | | | (15,651,452 | ) |
| | | | |
Net Assets | | $ | 2,657,588,698 | |
| | | | |
Net Assets | | | | |
Class A | | $ | 2,094,855,302 | |
Class B | | | 524,871,261 | |
Class E | | | 37,862,135 | |
Capital Shares Outstanding* | | | | |
Class A | | | 174,371,055 | |
Class B | | | 43,921,722 | |
Class E | | | 3,164,043 | |
Net Asset Value, Offering Price and Redemption Price Per Share | | | | |
Class A | | $ | 12.01 | |
Class B | | | 11.95 | |
Class E | | | 11.97 | |
| * | The Portfolio is authorized to issue an unlimited number of shares. |
| (a) | Identified cost of investments was $3,624,987,005. |
| (b) | Includes securities loaned at value of $740,156,798. |
Statement of Operations
Year Ended December 31, 2013
| | | | |
Investment Income | | | | |
Interest | | $ | 39,398,158 | |
Securities lending income | | | 900,321 | |
| | | | |
Total investment income | | | 40,298,479 | |
Expenses | | | | |
Management fees | | | 12,367,012 | |
Administration fees | | | 47,251 | |
Custodian and accounting fees | | | 237,910 | |
Distribution and service fees—Class B | | | 1,367,087 | |
Distribution and service fees—Class E | | | 60,176 | |
Audit and tax services | | | 62,150 | |
Legal | | | 27,754 | |
Trustees’ fees and expenses | | | 35,358 | |
Shareholder reporting | | | 112,117 | |
Insurance | | | 12,951 | |
Miscellaneous | | | 19,495 | |
| | | | |
Total expenses | | | 14,349,261 | |
Less management fee waiver | | | (377,422 | ) |
| | | | |
Net expenses | | | 13,971,839 | |
| | | | |
Net Investment Income | | | 26,326,640 | |
| | | | |
Net Realized and Unrealized Loss | | | | |
| Net realized gain (loss) on: | | | | |
Investments | | | (10,451,629 | ) |
Futures contracts | | | 7,622,512 | |
| | | | |
Net realized loss | | | (2,829,117 | ) |
| | | | |
| Net change in unrealized appreciation (depreciation) on: | | | | |
Investments | | | (45,536,589 | ) |
Futures contracts | | | 2,733,668 | |
| | | | |
Net change in unrealized depreciation | | | (42,802,921 | ) |
| | | | |
Net realized and unrealized loss | | | (45,632,038 | ) |
| | | | |
Net Decrease in Net Assets From Operations | | $ | (19,305,398 | ) |
| | | | |
See accompanying notes to financial statements.
MSF-12
Metropolitan Series Fund
Western Asset Management U.S. Government Portfolio
Statements of Changes in Net Assets
| | | | | | | | |
| | | Year Ended
December 31,
2013 | | | Year Ended
December 31,
2012 | |
Increase (Decrease) in Net Assets: | | | | | | | | |
From Operations | | | | | | | | |
Net investment income | | $ | 26,326,640 | | | $ | 25,035,636 | |
Net realized gain (loss) | | | (2,829,117 | ) | | | 30,322,134 | |
Net change in unrealized appreciation (depreciation) | | | (42,802,921 | ) | | | 27,380,882 | |
| | | | | | | | |
Increase (decrease) in net assets from operations | | | (19,305,398 | ) | | | 82,738,652 | |
| | | | | | | | |
From Distributions to Shareholders | | | | | | | | |
Net investment income | | | | | | | | |
Class A | | | (43,315,200 | ) | | | (40,807,280 | ) |
Class B | | | (10,582,515 | ) | | | (10,274,093 | ) |
Class E | | | (813,173 | ) | | | (927,136 | ) |
| | | | | | | | |
Total distributions | | | (54,710,888 | ) | | | (52,008,509 | ) |
| | | | | | | | |
Increase in net assets from capital share transactions | | | 104,703,093 | | | | 104,753,535 | |
| | | | | | | | |
Total increase in net assets | | | 30,686,807 | | | | 135,483,678 | |
| | |
Net Assets | | | | | | | | |
Beginning of period | | | 2,626,901,891 | | | | 2,491,418,213 | |
| | | | | | | | |
End of period | | $ | 2,657,588,698 | | | $ | 2,626,901,891 | |
| | | | | | | | |
| | |
Undistributed net investment income | | | | | | | | |
End of period | | $ | 49,720,491 | | | $ | 54,452,337 | |
| | | | | | | | |
Other Information:
Capital Shares
Transactions in capital shares were as follows:
| | | | | | | | | | | | | | | | |
| | | Year Ended
December 31, 2013 | | | Year Ended
December 31, 2012 | |
| | | Shares | | | Value | | | Shares | | | Value | |
Class A | | | | | | | | | | | | | | | | |
Sales | | | 17,350,300 | | | $ | 209,912,604 | | | | 13,517,982 | | | $ | 165,830,507 | |
Reinvestments | | | 3,562,105 | | | | 43,315,200 | | | | 3,372,502 | | | | 40,807,280 | |
Redemptions | | | (9,856,222 | ) | | | (119,217,102 | ) | | | (9,553,676 | ) | | | (116,963,586 | ) |
| | | | | | | | | | | | | | | | |
Net increase | | | 11,056,183 | | | $ | 134,010,702 | | | | 7,336,808 | | | $ | 89,674,201 | |
| | | | | | | | | | | | | | | | |
Class B | | | | | | | | | | | | | | | | |
Sales | | | 5,800,933 | | | $ | 70,153,449 | | | | 8,844,216 | | | $ | 108,006,785 | |
Reinvestments | | | 873,145 | | | | 10,582,515 | | | | 851,915 | | | | 10,274,093 | |
Redemptions | | | (8,730,200 | ) | | | (105,248,059 | ) | | | (8,014,495 | ) | | | (97,750,360 | ) |
| | | | | | | | | | | | | | | | |
Net increase (decrease) | | | (2,056,122 | ) | | $ | (24,512,095 | ) | | | 1,681,636 | | | $ | 20,530,518 | |
| | | | | | | | | | | | | | | | |
Class E | | | | | | | | | | | | | | | | |
Sales | | | 302,766 | | | $ | 3,653,423 | | | | 338,417 | | | $ | 4,138,565 | |
Reinvestments | | | 67,038 | | | | 813,173 | | | | 76,877 | | | | 927,136 | |
Redemptions | | | (765,493 | ) | | | (9,262,110 | ) | | | (861,429 | ) | | | (10,516,885 | ) |
| | | | | | | | | | | | | | | | |
Net decrease | | | (395,689 | ) | | $ | (4,795,514 | ) | | | (446,135 | ) | | $ | (5,451,184 | ) |
| | | | | | | | | | | | | | | | |
Increase derived from capital shares transactions | | | | | | $ | 104,703,093 | | | | | | | $ | 104,753,535 | |
| | | | | | | | | | | | | | | | |
See accompanying notes to financial statements.
MSF-13
Metropolitan Series Fund
Western Asset Management U.S. Government Portfolio
Financial Highlights
| | | | | | | | | | | | | | | | | | | | |
| Selected per share data | | | |
| | | Class A | |
| | | Year Ended December 31, | |
| | | 2013 | | | 2012 | | | 2011 | | | 2010 | | | 2009 | |
Net Asset Value, Beginning of Period | | $ | 12.36 | | | $ | 12.21 | | | $ | 12.17 | | | $ | 11.86 | | | $ | 11.92 | |
| | | | | | | | | | | | | | | | | | | | |
Income (Loss) From Investment Operations | | | | | | | | | | | | | | | | | | | | |
Net investment income (a) | | | 0.13 | | | | 0.13 | | | | 0.18 | | | | 0.17 | | | | 0.36 | |
Net realized and unrealized gain (loss) on investments | | | (0.22 | ) | | | 0.28 | | | | 0.46 | | | | 0.51 | | | | 0.13 | |
| | | | | | | | | | | | | | | | | | | | |
Total from investment operations | | | (0.09 | ) | | | 0.41 | | | | 0.64 | | | | 0.68 | | | | 0.49 | |
| | | | | | | | | | | | | | | | | | | | |
Less Distributions | | | | | | | | | | | | | | | | | | | | |
Distributions from net investment income | | | (0.26 | ) | | | (0.26 | ) | | | (0.18 | ) | | | (0.33 | ) | | | (0.55 | ) |
Distributions from net realized capital gains | | | 0.00 | | | | 0.00 | | | | (0.42 | ) | | | (0.04 | ) | | | 0.00 | |
| | | | | | | | | | | | | | | | | | | | |
Total distributions | | | (0.26 | ) | | | (0.26 | ) | | | (0.60 | ) | | | (0.37 | ) | | | (0.55 | ) |
| | | | | | | | | | | | | | | | | | | | |
Net Asset Value, End of Period | | $ | 12.01 | | | $ | 12.36 | | | $ | 12.21 | | | $ | 12.17 | | | $ | 11.86 | |
| | | | | | | | | | | | | | | | | | | | |
Total Return (%) (b) | | | (0.74 | ) | | | 3.37 | | | | 5.51 | | | | 5.81 | | | | 4.33 | |
| | | | | |
Ratios/Supplemental Data | | | | | | | | | | | | | | | | | | | | |
Gross ratio of expenses to average net assets (%) | | | 0.49 | | | | 0.50 | | | | 0.49 | | | | 0.50 | | | | 0.52 | |
Net ratio of expenses to average net assets (%) (c) | | | 0.48 | | | | 0.48 | | | | 0.49 | | | | 0.49 | | | | 0.52 | |
Ratio of net investment income to average net assets (%) | | | 1.05 | | | | 1.03 | | | | 1.51 | | | | 1.36 | | | | 3.04 | |
Portfolio turnover rate (%) | | | 317 | (d) | | | 340 | (d) | | | 549 | | | | 551 | | | | 262 | |
Net assets, end of period (in millions) | | $ | 2,094.9 | | | $ | 2,017.9 | | | $ | 1,904.6 | | | $ | 1,830.2 | | | $ | 1,259.0 | |
| |
| | | Class B | |
| | | Year Ended December 31, | |
| | | 2013 | | | 2012 | | | 2011 | | | 2010 | | | 2009 | |
Net Asset Value, Beginning of Period | | $ | 12.29 | | | $ | 12.15 | | | $ | 12.11 | | | $ | 11.81 | | | $ | 11.87 | |
| | | | | | | | | | | | | | | | | | | | |
Income (Loss) From Investment Operations | | | | | | | | | | | | | | | | | | | | |
Net investment income (a) | | | 0.10 | | | | 0.10 | | | | 0.15 | | | | 0.13 | | | | 0.32 | |
Net realized and unrealized gain (loss) on investments | | | (0.21 | ) | | | 0.27 | | | | 0.46 | | | | 0.51 | | | | 0.14 | |
| | | | | | | | | | | | | | | | | | | | |
Total from investment operations | | | (0.11 | ) | | | 0.37 | | | | 0.61 | | | | 0.64 | | | | 0.46 | |
| | | | | | | | | | | | | | | | | | | | |
Less Distributions | | | | | | | | | | | | | | | | | | | | |
Distributions from net investment income | | | (0.23 | ) | | | (0.23 | ) | | | (0.15 | ) | | | (0.30 | ) | | | (0.52 | ) |
Distributions from net realized capital gains | | | 0.00 | | | | 0.00 | | | | (0.42 | ) | | | (0.04 | ) | | | 0.00 | |
| | | | | | | | | | | | | | | | | | | | |
Total distributions | | | (0.23 | ) | | | (0.23 | ) | | | (0.57 | ) | | | (0.34 | ) | | | (0.52 | ) |
| | | | | | | | | | | | | | | | | | | | |
Net Asset Value, End of Period | | $ | 11.95 | | | $ | 12.29 | | | $ | 12.15 | | | $ | 12.11 | | | $ | 11.81 | |
| | | | | | | | | | | | | | | | | | | | |
Total Return (%) (b) | | | (0.91 | ) | | | 3.05 | | | | 5.27 | | | | 5.49 | | | | 4.08 | |
| | | | | |
Ratios/Supplemental Data | | | | | | | | | | | | | | | | | | | | |
Gross ratio of expenses to average net assets (%) | | | 0.74 | | | | 0.75 | | | | 0.74 | | | | 0.75 | | | | 0.77 | |
Net ratio of expenses to average net assets (%) (c) | | | 0.73 | | | | 0.73 | | | | 0.74 | | | | 0.74 | | | | 0.77 | |
Ratio of net investment income to average net assets (%) | | | 0.80 | | | | 0.78 | | | | 1.26 | | | | 1.12 | | | | 2.79 | |
Portfolio turnover rate (%) | | | 317 | (d) | | | 340 | (d) | | | 549 | | | | 551 | | | | 262 | |
Net assets, end of period (in millions) | | $ | 524.9 | | | $ | 565.2 | | | $ | 538.2 | | | $ | 466.5 | | | $ | 356.3 | |
Please see following page for Financial Highlights footnote legend.
See accompanying notes to financial statements.
MSF-14
Metropolitan Series Fund
Western Asset Management U.S. Government Portfolio
Financial Highlights
| | | | | | | | | | | | | | | | | | | | |
| Selected per share data | | | |
| | | Class E | |
| | | Year Ended December 31, | |
| | | 2013 | | | 2012 | | | 2011 | | | 2010 | | | 2009 | |
Net Asset Value, Beginning of Period | | $ | 12.31 | | | $ | 12.16 | | | $ | 12.13 | | | $ | 11.82 | | | $ | 11.88 | |
| | | | | | | | | | | | | | | | | | | | |
Income (Loss) From Investment Operations | | | | | | | | | | | | | | | | | | | | |
Net investment income (a) | | | 0.11 | | | | 0.11 | | | | 0.16 | | | | 0.15 | | | | 0.34 | |
Net realized and unrealized gain (loss) on investments | | | (0.21 | ) | | | 0.28 | | | | 0.46 | | | | 0.51 | | | | 0.14 | |
| | | | | | | | | | | | | | | | | | | | |
Total from investment operations | | | (0.10 | ) | | | 0.39 | | | | 0.62 | | | | 0.66 | | | | 0.48 | |
| | | | | | | | | | | | | | | | | | | | |
Less Distributions | | | | | | | | | | | | | | | | | | | | |
Distributions from net investment income | | | (0.24 | ) | | | (0.24 | ) | | | (0.17 | ) | | | (0.31 | ) | | | (0.54 | ) |
Distributions from net realized capital gains | | | 0.00 | | | | 0.00 | | | | (0.42 | ) | | | (0.04 | ) | | | 0.00 | |
| �� | | | | | | | | | | | | | | | | | | | |
Total distributions | | | (0.24 | ) | | | (0.24 | ) | | | (0.59 | ) | | | (0.35 | ) | | | (0.54 | ) |
| | | | | | | | | | | | | | | | | | | | |
Net Asset Value, End of Period | | $ | 11.97 | | | $ | 12.31 | | | $ | 12.16 | | | $ | 12.13 | | | $ | 11.82 | |
| | | | | | | | | | | | | | | | | | | | |
Total Return (%) (b) | | | (0.75 | ) | | | 3.15 | | | | 5.28 | | | | 5.67 | | | | 4.19 | |
| | | | | |
Ratios/Supplemental Data | | | | | | | | | | | | | | | | | | | | |
Gross ratio of expenses to average net assets (%) | | | 0.64 | | | | 0.65 | | | | 0.64 | | | | 0.65 | | | | 0.67 | |
Net ratio of expenses to average net assets (%) (c) | | | 0.63 | | | | 0.63 | | | | 0.64 | | | | 0.64 | | | | 0.67 | |
Ratio of net investment income to average net assets (%) | | | 0.90 | | | | 0.88 | | | | 1.35 | | | | 1.20 | | | | 2.94 | |
Portfolio turnover rate (%) | | | 317 | (d) | | | 340 | (d) | | | 549 | | | | 551 | | | | 262 | |
Net assets, end of period (in millions) | | $ | 37.9 | | | $ | 43.8 | | | $ | 48.7 | | | $ | 57.6 | | | $ | 64.6 | |
| (a) | Per share amounts based on average shares outstanding during the period. |
| (b) | Total return does not reflect any insurance, sales, separate account or administrative charges of variable annuity or life insurance contracts or any additional expenses that contract owners may bear under their variable contracts. If these charges were included, the returns would be lower. |
| (c) | Net ratio of expenses to average net assets includes the effect of management fee waivers as detailed in Note 6 of the Notes to Financial Statements. |
| (d) | Includes mortgage dollar roll and TBA transactions; excluding these transactions the portfolio turnover rate would have been 137% and 164% for 2013 and 2012, respectively. |
See accompanying notes to financial statements.
MSF-15
Metropolitan Series Fund
Western Asset Management U.S. Government Portfolio
Notes to Financial Statements—December 31, 2013
1. Organization
Metropolitan Series Fund (the “Trust”) is organized as a Delaware statutory trust and registered under the Investment Company Act of 1940, as amended (the “1940 Act”), as an open-end management investment company. The Trust is currently comprised of thirty series, each of which operates as a distinct investment vehicle of the Trust. The portfolio included in this report is Western Asset Management U.S. Government Portfolio (the “Portfolio”), which is diversified. Shares in the Portfolio are not offered directly to the general public and are currently available only to separate accounts established by Metropolitan Life Insurance Company (“MetLife”) and other affiliated life insurance companies.
The Portfolio has registered and offers three classes of shares: Class A, B, and E shares. Shares of each Class of the Portfolio represent an equal pro rata interest in the Portfolio and generally give the shareholder the same voting, dividend, liquidation, and other rights. Investment income, realized and unrealized capital gains and losses, the common expenses of the Portfolio, and certain Portfolio-level expense reductions, if any, are allocated on a pro rata basis to each Class based on the relative net assets of each Class to the net assets of the Portfolio. Each Class of shares differs in its respective distribution plan and such distribution expenses are allocated to that Class.
2. Significant Accounting Policies
The preparation of financial statements in conformity with accounting principles generally accepted in the United States of America (“GAAP”) requires management to make estimates and assumptions that affect the reported amounts of assets and liabilities and disclosure of contingent assets and liabilities as of the date of the financial statements and the reported amounts of income and expenses during the reporting period. Actual results could differ from those estimates. In the preparation of these financial statements, management has evaluated events and transactions subsequent to December 31, 2013 through the date the financial statements were issued.
The following is a summary of significant accounting policies consistently followed by the Portfolio in the preparation of its financial statements.
Investment Valuation and Fair Value Measurements - Debt securities (other than short term obligations with a remaining maturity of sixty days or less), including corporate, convertible and municipal bonds and notes; obligations of the U.S. treasury and U.S. government agencies; sovereign issues; floating rate loans; and non-U.S. bonds, are generally valued on the basis of evaluated or composite bid quotations obtained from independent pricing services and/or brokers and dealers selected by MetLife Advisers, LLC (“MetLife Advisers” or the “Adviser”), an affiliate of MetLife, Inc., pursuant to authorization of the Board of Trustees of the Trust (the “Board” or “Trustees”). Such quotations utilize matrix pricing, which considers observable inputs including, among other things, issuer details, maturity dates, interest rates, yield curves, rates of prepayment, credit risks/spreads, default rates, reported trades, broker dealer quotes and quoted prices for similar securities. Securities that use similar valuation techniques and inputs as described above are generally categorized as Level 2 within the fair value hierarchy.
Mortgage and asset-backed securities are usually issued as separate tranches, or classes, of securities within each deal. These securities are also generally valued on the basis of evaluated or composite bid quotations obtained from independent pricing services and/or brokers and dealers selected by the Adviser pursuant to authorization of the Board. The pricing models for these securities usually consider tranche-level attributes, estimated cash flows and market-based yield spreads for each tranche and current market data, and incorporate deal collateral performance, as available. Mortgage and asset-backed securities that use similar valuation techniques and inputs as described above are generally categorized as Level 2 within the fair value hierarchy.
Short term obligations with a remaining maturity of sixty days or less are generally valued at amortized cost, which approximates fair market value, and are generally categorized as Level 2 within the fair value hierarchy.
Domestic and foreign equity securities, such as common stock, exchange-traded funds, rights, warrants, and preferred stock, that are traded on a securities exchange, are generally valued at their last sale price on the exchange or market in which they are principally traded on the valuation date, or, if no sales occurred on that day, at the last reported bid price. Equity securities traded over-the-counter are generally valued at the last reported sale price. Valuation adjustments may be applied to certain foreign equity securities that are traded solely on foreign exchanges that close before the close of the U.S. market to account for the market movement between the close of the foreign exchanges and the close of the U.S. market. The Portfolio may use a systematic fair valuation model provided by an independent third party to value securities principally traded in these foreign markets in order to adjust for possible stale pricing that may occur between the close of the foreign exchanges and the time of the Portfolio valuation. Foreign equity securities using these valuation adjustments are generally categorized as Level 2 within the fair value hierarchy. Equity securities that are actively traded, and have no valuation adjustments applied, are categorized as Level 1 within the fair value hierarchy. Other equity securities traded on inactive markets, or valued in reference to similar instruments traded on active markets, are generally categorized as Level 2 within the fair value hierarchy.
MSF-16
Metropolitan Series Fund
Western Asset Management U.S. Government Portfolio
Notes to Financial Statements—December 31, 2013—(Continued)
Investments in registered open-end management investment companies are valued at reported net asset value per share on the valuation date and are categorized as Level 1 within the fair value hierarchy.
Forward foreign currency exchange contracts are valued through an independent pricing service based on the mean between closing bid and ask prices of the forward currency rates in the London foreign exchange markets on a daily basis as provided by a reliable bank or dealer. These contracts are generally categorized as Level 2 within the fair value hierarchy.
Options, whether on securities, indices, futures contracts, or otherwise, traded on exchanges are valued at the last sale price available as of the close of business on the valuation date or, if there is no such price available, at the mean between the last reported bid and ask prices. These types of options are categorized as Level 1 within the fair value hierarchy. Futures contracts, which are traded on commodity exchanges, are valued at their closing prices as of the close of such exchanges and are categorized as Level 1 within the fair value hierarchy.
Options and futures contracts that are traded over-the-counter are generally valued on the basis of quotations provided by broker-dealers or prices provided by pricing service providers who use a series of techniques, including simulation pricing models, to determine the value of the contracts. The pricing models use inputs that are observed from actively quoted markets such as issuer details, indices, spreads, interest rates, yield curves, credit curves, measures of volatility and exchange rates. These contracts are generally categorized as Level 2 within the fair value hierarchy.
If no current market value quotation or other observable inputs are readily available or market value quotations are deemed to be unreliable for a security, the fair value of the security will be determined in accordance with procedures approved by and under the general supervision of the Board. In such a circumstance, the Board has delegated the determination of the fair value of a security to a Valuation Committee (“Committee”) of MetLife Advisers. The Committee provides general pricing oversight and fair value pricing determinations related to portfolio securities and meets on a regular basis to review reports relating to the valuation of the securities in the Portfolio. The Board has delegated to State Street Bank and Trust Company, the Trust’s custodian (“custodian”), the responsibility for calculating the net asset values (“NAVs”) of the Trust’s Portfolios. The Committee is responsible for overseeing the calculation of the NAVs of the Portfolios by the custodian. The Committee also periodically reviews pricing vendors, including the vendor providing fair value pricing for the Portfolio’s foreign securities, and is responsible for overseeing the correction of pricing errors and addressing other pricing issues that arise in the ordinary course of business, such as making real-time fair value determinations, as necessary.
No single standard for determining the fair value of a security can be set forth because fair value depends upon the facts and circumstances with respect to each security. Information relating to any relevant factors may be obtained by the Committee from any appropriate source, including the subadviser of the Portfolio, the custodian, a pricing service, market maker and/or broker for such security or the issuer. Appropriate methodologies for determining fair value under particular circumstances may include: matrix pricing, comparisons of securities with comparable characteristics, value based on multiples of earnings, discount from market price of similar marketable securities or a combination of these and other methods. The Committee maintains a detailed report tracking each fair-valued security that compares the fair value price to the next available trade, vendor or broker price, and provides information on how close the fair value price was to the next quoted price. The Committee reviews a summary of such report monthly. On a quarterly basis, the Board is provided with the following for consideration and ratification or adjustment: (1) a memorandum summarizing the actions taken by the Committee in the prior quarter; and (2) a list of the Portfolio’s securities as of the most recent quarter-end for which market quotations were not readily available.
Investment Transactions and Related Investment Income - Portfolio security transactions are recorded on the trade date. Dividend income is recorded on the ex-dividend date or, for certain foreign securities, when notified. Interest income, which includes amortization of premium and accretion of discount on debt securities, is recorded on the accrual basis. Realized gains and losses on investments are determined on the identified cost basis, which is the same basis used for federal income tax purposes. Foreign income and foreign capital gains on some foreign securities may be subject to foreign taxes, which are accrued as applicable. These foreign taxes have been provided for in accordance with the Portfolio’s understanding of the applicable countries’ tax rules and rates.
Income Taxes - It is the Portfolio’s policy to comply with the requirements of the Internal Revenue Code of 1986, as amended, and regulations thereunder, applicable to regulated investment companies and to distribute, with respect to each taxable year, all of its taxable income to shareholders. Therefore, no federal income tax provision is required. The Portfolio files U.S. federal tax returns. No income tax returns are currently under examination. The Portfolio’s federal tax returns for the prior three fiscal years remain subject to examination by the Internal Revenue Service. As of December 31, 2013, the Portfolio had no uncertain tax positions that would require financial statement recognition, or de-recognition or disclosure.
Dividends and Distributions to Shareholders - The Portfolio records dividends and distributions on the ex-dividend date. Net realized gains from security transactions (if any) are generally distributed annually to shareholders. The timing and characterization of certain income and capital gains distributions are determined in accordance with federal tax regulations that may differ from GAAP. Permanent book and tax basis differences relating to shareholder distributions will result in reclassification between under/over distributed net investment income, accumulated net realized gains/losses, and paid-in surplus.
MSF-17
Metropolitan Series Fund
Western Asset Management U.S. Government Portfolio
Notes to Financial Statements—December 31, 2013—(Continued)
Book-tax differences are primarily due to premium amortization, paydown gain/loss reclasses, and Treasury Inflation Protected Security (TIPS) deflation adjustments. These adjustments have no impact on net assets or the results of operations.
Securities Lending - The Portfolio may lend its portfolio securities to certain qualified brokers who borrow securities in order to complete certain securities transactions. By lending its portfolio securities, the Portfolio attempts to increase its net investment income through the receipt of income on collateral held from securities on loan. Any gain or loss in the market price of the loaned securities that might occur and any interest earned or dividends declared during the term of the loan would accrue to the account of the Portfolio.
The Trust has entered into a securities lending arrangement with the custodian. Under this arrangement, the custodian is authorized to loan portfolio securities on the Portfolio’s behalf. In exchange, the Portfolio receives either cash or securities as collateral against the loaned securities. The Portfolio receives collateral at least equal to 102% of the market value of the loaned securities (105% for foreign equity securities), at each loan’s inception. Collateral representing at least 100% of the market value of the loaned securities must be maintained for the duration of the loan. A liability for cash collateral is reflected on the Statement of Assets and Liabilities, and is categorized as Level 2 within the fair value hierarchy. Cash collateral is generally invested in the State Street Navigator Securities Lending MET Portfolio (the “Navigator Portfolio”), a series of the State Street Navigator Securities Lending Trust that is managed by an affiliate of the custodian. The Navigator Portfolio is a registered money market fund that invests in a variety of high-quality, U.S. dollar-denominated instruments. If the market value of the collateral at the close of trading on a business day is less than 100% of the market value of the loaned securities at the close of trading on that day, the borrower shall be required to deliver, by the close of business on the following business day, an additional amount of collateral, so that the total amount of posted collateral is equal to at least 100% of the market value of all the loaned securities as of such preceding day. A portion of net income (income after the deduction of expenses and fees of the Navigator Portfolio) on the collateral is rebated to the borrower of the securities and the remainder is split between the custodian and the Portfolio. On loans collateralized by U.S. Treasuries, a fee is received from the borrower and is allocated between the Portfolio and the custodian. The risks associated with lending portfolio securities include, but are not limited to, possible delays in receiving additional collateral or in the recovery of the loaned securities, possible loss of rights in the collateral should the borrower fail financially, as well as risk of loss in the value of the collateral or the value of the investments made with the collateral. The lending agent has agreed to indemnify the Portfolio in the case of default of any securities borrower. Income received by the Portfolio in securities lending transactions during the year ended December 31, 2013 is reflected as Securities lending income on the Statement of Operations. Any outstanding loans by the Portfolio at December 31, 2013 are disclosed in the footnotes to the Schedule of Investments.
Foreign Currency Translation - The books and records of the Portfolio are maintained in U.S. dollars. The values of securities, currencies, and other assets and liabilities denominated in currencies other than the U.S. dollar are translated into U.S. dollars based upon foreign exchange rates prevailing at the end of the period. Purchases and sales of investment securities, income, and expenses are translated on the respective dates of such transactions. Because the values of investment securities are translated at the foreign exchange rates prevailing at the end of the period, that portion of the results of operations arising from changes in exchange rates and that portion of the results of operations reflecting fluctuations arising from changes in market prices of the investment securities are not separated. Such fluctuations are included in the net realized and unrealized gain or loss on investments.
Net realized foreign exchange gains or losses arise from activity in forward foreign currency exchange contracts, sales of foreign currency, currency gains or losses realized between the trade and settlement dates on securities transactions, and the difference between the amounts of dividends, interest, and foreign withholding taxes recorded by the Portfolio and the U.S. dollar equivalent of the amounts actually received or paid by the Portfolio. Net unrealized foreign exchange gains and losses arise from changes in the value of assets and liabilities, other than investment securities, resulting from changes in foreign exchange rates.
Repurchase Agreements - The Portfolio may enter into repurchase agreements, under the terms of a Master Repurchase Agreement, with selected commercial banks and broker-dealers, under which the Portfolio acquires securities as collateral and agrees to resell the securities at an agreed upon time and at an agreed-upon price. The Portfolio, through the custodian or a subcustodian, receives delivery of the underlying securities collateralizing any repurchase agreements. The Portfolio requires the custodian to take possession, to have legally segregated in the Federal Reserve Book Entry System, or to have segregated within the custodian’s vault, all securities held as collateral for repurchase agreements. It is the Portfolio’s policy that the market value of the collateral be at least equal to 100% of the repurchase price in the case of a repurchase agreement of one-day duration and at least equal to 102% of the repurchase price in the case of all other repurchase agreements. In the event of default or failure by a party to perform an obligation in connection with any repurchase transaction, the Master Repurchase Agreement gives the non-defaulting party the right to set-off claims and to apply property held by it in connection with any repurchase transaction against obligations owed to it.
At December 31, 2013, the Portfolio had investments in repurchase agreements with a gross value of $9,515,000, which is included as part of investments at value on the Statement of Assets and Liabilities. The value of the related collateral exceeded the value of the repurchase agreements at December 31, 2013.
Mortgage Dollar Rolls - The Portfolio may enter into mortgage “dollar rolls” in which a Portfolio sells to-be-announced (“TBA”) mortgage-backed securities for delivery in the current month and simultaneously contracts to repurchase substantially similar (same
MSF-18
Metropolitan Series Fund
Western Asset Management U.S. Government Portfolio
Notes to Financial Statements—December 31, 2013—(Continued)
type, coupon, and maturity) securities on a specified future date. For the duration of the transaction, or roll period, the Portfolio foregoes principal (including prepayments of principal) and interest paid on the securities sold. Dollar rolls are accounted for as purchase and sale transactions; gain or loss is recognized at the commencement of the term of the dollar roll and each time the mortgage-backed security is rolled.
Mortgage dollar roll transactions involve the risk that the market value of the securities that the Portfolio is required to reacquire may be less than the agreed-upon repurchase price of those securities and that the investment performance of securities purchased with proceeds from these transactions does not exceed the income, capital appreciation and gain or loss that would have been realized on the securities transferred or sold, as applicable, as part of the treasury or mortgage dollar roll.
Mortgage Related and Other Asset-Backed Securities - The Portfolio may invest in mortgage-related or other asset-backed securities. These securities may include mortgage pass-through securities, collateralized mortgage obligations (“CMOs”), commercial mortgage-backed securities, CMO residuals, stripped mortgage backed securities (“SMBS”), and other securities that directly or indirectly represent a participation in, or are secured by or payable from, mortgage loans on real property or other receivables. The value of some mortgage- or asset-backed securities may be particularly sensitive to changes in prevailing interest rates. Early repayment of principal on some mortgage-related securities may expose the Portfolio to a lower rate of return upon reinvestment of principal. The value of these securities may fluctuate in response to the market’s perception of the creditworthiness of the issuers. Additionally, although mortgages and mortgage-related securities are generally supported by some form of government or private guarantee and/or insurance, there is no assurance that private guarantors or insurers will meet their obligations.
In one type of SMBS, one class receives all of the interest from the mortgage assets (the interest-only or “IO” class), while the other class will receive all of the principal (the principal-only or “PO” class). Because principal will not be received at the maturity of an IO, adjustments are made to the book value of the security until maturity. These adjustments are netted against payments received for the IOs and the net amount is included in interest income on the Statement of Operations of the Portfolio. Payments received for POs are treated as reductions to the cost and par value of the securities. Details of mortgage related and other asset-backed securities held by the Portfolio are included in the Portfolio’s Schedule of Investments.
The Portfolio may invest a significant portion of its assets in securities of issuers that hold mortgage and asset-backed securities and direct investments in securities backed by commercial and residential mortgage loans and other financial assets. The value and related income of these securities are sensitive to changes in economic conditions, including delinquencies and/or defaults, and may be negatively impacted by increased volatility of market prices and periods of illiquidity.
TBA Purchase & Forward Sale Commitments - The Portfolio may enter into TBA commitments to purchase or sell securities for a fixed price at a future date. TBA commitments are considered securities in themselves, and involve a risk of loss if the value of the security to be purchased or sold declines or increases prior to settlement date, which is in addition to the risk of decline in the value of the Portfolio’s other assets. TBA forward sales commitments are valued at the current market value of the underlying securities, according to the procedures described under “Investment Valuation and Fair Value Measurements”.
When-Issued and Delayed-Delivery Securities - The Portfolio may purchase securities on a when-issued or delayed-delivery basis. Settlement of such transactions normally occurs within a month or more after the purchase commitment is made. The Portfolio may purchase securities under such conditions only with the intention of actually acquiring them, but may enter into a separate agreement to sell the securities before the settlement date. Since the value of securities purchased may fluctuate prior to settlement, the Portfolio may be required to pay more at settlement than the security is worth. In addition, the purchaser is not entitled to any of the interest earned prior to settlement.
Upon making a commitment to purchase a security on a when-issued or delayed-delivery basis, the Portfolio will hold liquid assets in a segregated account with the Portfolio’s custodian, or set aside liquid assets in the Portfolio’s records, worth at least the equivalent of the amount due. The liquid assets will be monitored on a daily basis and adjusted as necessary to maintain the necessary value.
3. Investments in Derivative Instruments
Futures Contracts - The Portfolio may buy and sell futures contracts as a hedge, to maintain investment exposure to a target asset class or to enhance return. The Portfolio may be subject to fluctuations in equity prices, interest rates, commodity prices, and foreign currency exchange rates in the normal course of pursuing its investment objective. Futures contracts are standardized agreements to buy or sell a security, or deliver a final cash settlement price in connection with an index, interest rate, currency, or other asset. The Portfolio must deposit an amount (“initial margin”) equal to a certain percentage of the face value of the futures contract. The initial margin may be in the form of cash or securities, which is returned when the Portfolio’s obligations under the contract have been satisfied. If cash is deposited as the initial margin, it is shown as cash collateral on the Statement of Assets and Liabilities. Futures contracts are marked-to-market daily, and subsequent payments (“variation margin”) are made or received by the Portfolio depending on whether unrealized gains or losses are incurred. These amounts are reflected as receivables or payables on the Statement of Assets and Liabilities and as a component of net change in unrealized appreciation/depreciation on the Statement of Operations. When the
MSF-19
Metropolitan Series Fund
Western Asset Management U.S. Government Portfolio
Notes to Financial Statements—December 31, 2013—(Continued)
contract is closed or expires, the Portfolio records a realized gain or loss equal to the difference between the value of the contract at the time it was opened and the value at the time it was closed. Risks of entering into futures contracts (and related options) include the possibility that the market for these instruments may be illiquid and that a change in the value of the contract or option may not correlate perfectly with changes in the value of the underlying instrument. Futures contracts are exchange-traded and the exchange’s clearinghouse, as counterparty to all exchange-traded futures, guarantees the futures contracts against default. For over-the-counter futures the Portfolio’s ability to terminate the positions may be more limited than in the case of exchange-traded positions and may also involve the risk that securities dealers participating in such transactions would fail to meet their obligations to the Portfolio.
At December 31, 2013, the Portfolio had the following derivatives, categorized by risk exposure:
| | | | | | | | | | | | |
| | | Asset Derivatives | | | Liability Derivatives | |
Risk Exposure | | Statement of Assets &
Liabilities Location | | Fair Value | | | Statement of Assets &
Liabilities Location | | Fair
Value | |
| Interest Rate | | Unrealized appreciation on futures contracts* | | $ | 5,051,963 | | | Unrealized depreciation on futures contracts* | | $ | 782,588 | |
| | | | | | | | | | | | |
| | * | Includes cumulative appreciation/depreciation of futures contracts as reported in the Schedule of Investments. Only the current day’s variation margin is reported within the Statement of Assets and Liabilities. |
Transactions in derivative instruments during the year ended December 31, 2013 were as follows:
| | | | |
Statement of Operations Location—Net Realized Gain (Loss) | | Interest Rate | |
Futures contracts | | $ | 7,622,512 | |
| | | | |
| |
Statement of Operations Location—Net Change in Unrealized Appreciation (Depreciation) | | Interest Rate | |
Futures contracts | | $ | 2,733,668 | |
| | | | |
For the year ended December 31, 2013, the average amount or number per contract outstanding for each derivative type was as follows:
| | | | |
Derivative Description | | Average
Notional Par or
Face Amount‡ | |
Futures contracts long | | $ | 57,809,091 | |
Futures contracts short | | | (188,133,333 | ) |
| | ‡ | Averages are based on activity levels during 2013. |
4. Certain Risks
Market Risk: In the normal course of business, the Portfolio invests in securities and enters into transactions where risks exist due to fluctuations in the market (market risk) or failure of the other party to a transaction to perform (credit and counterparty risk). The value of securities held by the Portfolio may decline in response to certain events, including those directly involving the companies whose securities are owned by the Portfolio; conditions affecting the general economy; overall market changes; local, regional or global political, social or economic instability; currency, interest rate, and price fluctuations.
Credit and Counterparty Risk: The Portfolio may be exposed to counterparty risk, or the risk that an entity with which the Portfolio has unsettled or open transactions may default. The potential loss could exceed the value of the financial assets and liabilities recorded in the financial statements. Financial assets that potentially expose the Portfolio to credit and counterparty risk consist principally of cash due from counterparties and investments. The Portfolio manages counterparty risk by entering into agreements only with counterparties that it believes have the financial resources to honor their obligations and by monitoring the financial stability of those counterparties. The Portfolio’s investment adviser attempts to mitigate counterparty risk by (i) periodically assessing the creditworthiness of its trading partners, (ii) monitoring and/or limiting the amount of its net exposure to each individual counterparty based on its assessment, and (iii) requiring collateral from the counterparty for certain transactions. In order to preserve certain safeguards for non-standard settlement trades, the Portfolio restricts its exposure to credit and counterparty losses by entering into master netting agreements with counterparties (approved brokers) with whom it undertakes a significant volume of transactions. Master Agreements govern the terms of certain transactions, and reduce the counterparty risk associated with relevant transactions by specifying credit protection mechanisms and providing standardization that improves legal certainty. Master Agreements can also help limit counterparty risk by specifying collateral posting arrangements at pre-arranged exposure levels. Collateral requirements may differ by type of derivative or investment, as applicable. Collateral or margin requirements are set by the broker or exchange clearing
MSF-20
Metropolitan Series Fund
Western Asset Management U.S. Government Portfolio
Notes to Financial Statements—December 31, 2013—(Continued)
house for exchange traded derivatives (e.g., futures contracts and exchange traded options) while collateral terms are contract specific for over-the-counter traded derivatives (e.g., forward foreign currency exchange contracts, swap agreements and over-the-counter options).
For derivatives traded under an International Swaps and Derivatives Association, Inc. Master Agreement (“ISDA Master Agreement”) or similar master agreement, the collateral requirements are netted across all transactions traded under such agreement and one amount is posted from one party to the other to collateralize such obligations. The ISDA Master Agreement gives each party to the agreement the right to terminate all transactions traded under such agreement if there is a certain deterioration in the credit quality of the other party. The ISDA Master Agreement gives the Portfolio the right, upon an event of default by the applicable counterparty or a termination of the agreement, to close out all transactions traded under such agreement and to net amounts owed under each transaction to one net amount payable by one party to the other. This right to close out and net payments across all transactions traded under the ISDA Master Agreement could result in a reduction of the Portfolio’s credit risk to such counterparty equal to any amounts payable by the Portfolio under the applicable transactions, if any. However, absent an event of default by the counterparty or a termination of the agreement, the ISDA Master Agreement does not result in an offset of reported amounts of assets and liabilities in the Statement of Assets and Liabilities across transactions between the Portfolio and the applicable counterparty. The enforceability of the right to offset may vary by jurisdiction. Cash collateral that has been pledged to cover obligations of the Portfolio under derivative contracts, if any, will be reported separately in the Statement of Assets and Liabilities. Securities pledged as collateral, if any, for the same purpose are noted in the Schedule of Investments.
Repurchase and reverse repurchase agreements are primarily executed under Global Master Repurchase Agreements (“GMRAs”) or Master Repurchase Agreements (“MRAs”), which provide the rights to set-off. Each repurchase and reverse repurchase agreement is initially collateralized at the transaction level. In the event of default, the total market value exposure will be offset against collateral exchanged to date, which would result in a net receivable/(payable) that would be due from/to the counterparty.
Master Securities Forward Transaction Agreements (���Master Forward Agreements”) govern the considerations and factors surrounding the settlement of certain forward settling transactions, such as To-Be-Announced securities, delayed-delivery or secured borrowings transactions by and between the Portfolio and select counterparties. The Master Forward Agreements maintain provisions for, among other things, initiation and confirmation, payment and transfer, events of default, termination, and maintenance of collateral.
Customer Account Agreements and related addendums govern cleared derivatives transactions such as futures, options on futures, and cleared OTC derivatives. Cleared derivative transactions require posting of initial margin as determined by each relevant clearing agency which is segregated at a broker account registered with the Commodities Futures Trading Commission (CFTC), or the applicable regulator. In the U.S., counterparty risk is significantly reduced as creditors of the futures broker do not have claim to Portfolio assets in the segregated account. Additionally, portability of exposure in the event of default further reduces risk to the Portfolio. Variation margin, or changes in market value, are exchanged daily, but may not be netted between futures and cleared OTC derivatives.
Additional risks associated with each type of investment are described above within the respective security type notes. The Portfolio’s prospectus includes a discussion of the principal risks of investing in the Portfolio.
5. Investment Transactions
Aggregate cost of purchases and proceeds of sales of investment securities, including mortgage dollar roll and TBA transactions but excluding short-term securities, for the year ended December 31, 2013 were as follows:
| | | | | | | | | | | | |
Purchases | | | Sales | |
U.S. Government | | Non U.S. Government | | | U.S. Government | | | Non U.S. Government | |
| $8,852,240,049 | | $ | 107,235,407 | | | $ | 8,769,987,350 | | | $ | 79,618,906 | |
Purchases and sales of mortgage dollar rolls and TBA transactions for the year ended December 31, 2013 were $5,487,163,080 and $5,380,296,778, respectively.
MSF-21
Metropolitan Series Fund
Western Asset Management U.S. Government Portfolio
Notes to Financial Statements—December 31, 2013—(Continued)
6. Investment Management Fees and Other Transactions with Affiliates
Investment Management Agreement - MetLife Advisers is the investment adviser to the Portfolio. The Trust has entered into an investment management agreement with MetLife Advisers with respect to the Portfolio. For providing investment management services to the Portfolio, MetLife Advisers receives monthly compensation at the following annual rates:
| | | | | | |
Management
Fees earned by
MetLife Advisers
for the year ended
December 31, 2013 | | % per annum | | | Average Daily Net Assets |
| $12,367,012 | | | 0.550 | % | | Of the first $500 million |
| | | 0.450 | % | | On amounts in excess of $500 million |
MetLife Advisers has entered into an investment subadvisory agreement with respect to the Portfolio. Western Asset Management Company is compensated by MetLife Advisers to provide subadvisory services for the Portfolio.
Management Fee Waivers - Pursuant to an expense agreement, MetLife Advisers agreed, for the period April 29, 2013 through April 27, 2014, to reduce its advisory fees set out above under “Investment Management Agreement” for each class of the Portfolio as follows:
| | |
% per annum | | Average Daily Net Assets |
| 0.050% | | On amounts over $200 million and under $500 million |
| 0.010% | | On amounts over $1 billion and under $2 billion |
| 0.020% | | On amounts in excess of $2 billion |
An identical expense agreement was in place for the period January 1, 2012 through April 28, 2013. Amounts waived for the year ended December 31, 2013 are shown as management fee waivers in the Statement of Operations.
Certain officers and trustees of the Trust may also be officers of MetLife Advisers; however, such officers and trustees receive no compensation from the Trust.
Transfer Agency Agreement - MetLife serves as the transfer agent for the Trust. MetLife receives no fees for its services to the Trust under the transfer agency agreement.
Distribution and Service Fees - The Trust has a distribution agreement with MetLife Investors Distribution Company (“MIDC” or the “Distributor”) in which MIDC serves as the distributor for the Portfolio’s Class A, B and E Shares. MIDC is a wholly-owned subsidiary of MetLife Investors Group, Inc., an affiliate of the Adviser. The Trust has also adopted a Distribution and Service Plan under Rule 12b-1 of the 1940 Act for the Portfolio’s Class B and E Shares. Under the Distribution and Service Plan, the Class B and E Shares of the Portfolio pay a fee to compensate the Insurance Companies (or their affiliates) and other broker-dealers and financial intermediaries involved in the offer and sale of Portfolio shares for promoting or selling and servicing the Class B and E Shares. The fees under the Distribution and Service Plan for each class of the Portfolio’s shares are calculated as a percentage of the Portfolio’s average daily net assets that are attributable to that Class. Currently, the fee is 0.25% per year for Class B Shares and 0.15% per year for Class E Shares. Amounts incurred by the Portfolio for the year ended December 31, 2013 are shown as Distribution and service fees in the Statement of Operations.
Deferred Trustee Compensation - Each Trustee who is not currently an employee of the Adviser or any of its affiliates receives compensation from the Trust for his or her service to the Trust. A deferred compensation plan (the “Plan”) is available to the Trustees on a voluntary basis. Deferred amounts remain in the Trust until distributed in accordance with the provisions of the Plan. The value of a participating Trustee’s deferral account is based on theoretical investments of deferred amounts, on the normal payment dates in certain portfolios of the Trust or Met Investors Series Trust, an affiliate of the Trust, as designated by the participating Trustee. Changes in the value of participants’ deferral accounts are reflected as Trustees’ fees and expenses in the Statement of Operations. The portion of the accrued obligations allocated to the Portfolio under the Plan is reflected as Deferred trustees’ fees in the Statement of Assets and Liabilities.
7. Contractual Obligations
Under the Trust’s organizational documents, its officers and Trustees may be indemnified against certain liabilities and expenses arising out of the performance of their duties to the Trust. Additionally, the Trust has a variety of indemnification obligations under contracts with its service providers. The Trust’s maximum exposure under these arrangements is unknown, as this would involve future claims that may be made against the Trust that have not yet occurred.
MSF-22
Metropolitan Series Fund
Western Asset Management U.S. Government Portfolio
Notes to Financial Statements—December 31, 2013—(Continued)
8. Income Tax Information
The tax character of distributions paid for the periods ended December 31, 2013 and 2012 was as follows:
| | | | | | | | | | | | | | | | | | | | |
Ordinary Income | | | Long-Term Capital Gain | | | Total | |
2013 | | 2012 | | | 2013 | | | 2012 | | | 2013 | | | 2012 | |
| $54,710,888 | | $ | 52,008,509 | | | $ | — | | | $ | — | | | $ | 54,710,888 | | | $ | 52,008,509 | |
As of December 31, 2013, the components of distributable earnings (accumulated losses) on a federal income tax basis were as follows:
| | | | | | | | | | | | | | | | | | | | |
Undistributed
Ordinary
Income | | Undistributed
Long-Term
Capital Gain | | | Net
Unrealized
Depreciation | | | Loss Carryforwards | | | Other
Accumulated
Capital Losses | | | Total | |
| $49,815,865 | | $ | — | | | $ | (37,773,361 | ) | | $ | — | | | $ | (22,435,160 | ) | | $ | (10,392,656 | ) |
The Portfolio utilizes the provisions of the federal income tax laws that provide for the carryforward of capital losses for prior years, offsetting such losses against any future realized capital gains. Under the Regulated Investment Company Modernization Act of 2010 (the “Act”), net capital losses recognized after December 22, 2010 may be carried forward indefinitely and their character is retained as short-term and/or long-term losses. Previously, net capital losses were carried forward for up to eight years and treated as short-term losses. As a transition rule, the Act requires that post-enactment net capital losses be used before pre-enactment net capital losses.
As of December 31, 2013, the Portfolio had post-enactment short-term accumulated capital losses in the amount of $13,099,133 and post-enactment long-term accumulated capital losses in the amount of $9,336,027.
MSF-23
Metropolitan Series Fund
Western Asset Management U.S. Government Portfolio
Report of Independent Registered Public Accounting Firm
To the Shareholders of Western Asset Management U.S. Government Portfolio and the Board of Trustees of Metropolitan Series Fund:
We have audited the accompanying statement of assets and liabilities, including the schedule of investments, of Western Asset Management U.S. Government Portfolio, one of the portfolios constituting Metropolitan Series Fund (the “Trust”) as of December 31, 2013, and the related statement of operations for the year then ended, the statements of changes in net assets for each of the two years in the period then ended, and the financial highlights for each of the five years in the period then ended. These financial statements and financial highlights are the responsibility of the Trust’s management. Our responsibility is to express an opinion on these financial statements and financial highlights based on our audits.
We conducted our audits in accordance with the standards of the Public Company Accounting Oversight Board (United States). Those standards require that we plan and perform the audit to obtain reasonable assurance about whether the financial statements and financial highlights are free of material misstatement. The Trust is not required to have, nor were we engaged to perform, an audit of its internal control over financial reporting. Our audits included consideration of internal control over financial reporting as a basis for designing audit procedures that are appropriate in the circumstances, but not for the purpose of expressing an opinion on the effectiveness of the Trust’s internal control over financial reporting. Accordingly, we express no such opinion. An audit also includes examining, on a test basis, evidence supporting the amounts and disclosures in the financial statements, assessing the accounting principles used and significant estimates made by management, as well as evaluating the overall financial statement presentation. Our procedures included confirmation of securities owned as of December 31, 2013, by correspondence with the custodian and brokers; where replies were not received from brokers, we performed other auditing procedures. We believe that our audits provide a reasonable basis for our opinion.
In our opinion, the financial statements and financial highlights referred to above present fairly, in all material respects, the financial position of Western Asset Management U.S. Government Portfolio of Metropolitan Series Fund, as of December 31, 2013, the results of its operations for the year then ended, the changes in its net assets for each of the two years in the period then ended, and the financial highlights for each of the five years in the period then ended, in conformity with accounting principles generally accepted in the United States of America.
Deloitte & Touche LLP
Boston, Massachusetts
February 27, 2014
MSF-24
Metropolitan Series Fund
Trustees and Officers of Metropolitan Series Fund
The Trustees and executive officers of the Trust, their ages and their principal occupations during the past five years are set forth below. Unless otherwise indicated, the business address of each is One Financial Center, Boston, MA 02111. Each Trustee who is deemed an “interested person,” as such term is defined in the 1940 Act, is indicated by an asterisk. Those Trustees who are not “interested persons” as defined in the 1940 Act are referred to as “Independent Trustees.” Additional information about the Trustees is available in the Statement of Additional Information, which is available without charge, upon request, by calling (800) 848-3854.
Trustees of the Trust
| | | | | | | | | | |
Name and Age | | Position(s)
Held with
Registrant | | Term of Office and
Length of Time
Served | | Principal Occupation(s) During the
Past 5 Years(1) | | Number of
Portfolios
in Fund
Complex(2)
overseen | | Other Directorships Held
by Trustee During the
Past 5 Years(1) |
| Interested Trustee | | | | | | | | | | |
| Elizabeth M. Forget* (47) | | Trustee, Chairman of the Board, President and Chief Executive Officer | | Indefinite; From May 2006 (President and Chief Executive Officer)/ August 2006 (Trustee and Chairman of the Board) to present | | Senior Vice President, MetLife Inc.; President, MetLife Advisers, LLC and a predecessor company. | | 79 | | Trustee, Met Investors Series Trust (the “MIST Trust”);** various MetLife-affiliated boards. |
| | | | | |
| Independent Trustees | | | | | | | | | | |
| Stephen M. Alderman (54) | | Trustee | | Indefinite; From April 2012 to present | | Shareholder in the law firm of Garfield & Merel, Ltd. | | 79 | | Trustee, MIST Trust;** Director, International Truck Leasing Corp. |
| | | | | |
| Robert J. Boulware (57) | | Trustee | | Indefinite; From April 2012 to present | | Managing Director, Pilgrim Funds, LLC (private equity fund). | | 79 | | Trustee, MIST Trust;** Trustee, Vertical Capital Income Fund (closed-end fund); Director, Gainsco, Inc. (auto insurance). |
| | | | | |
| Susan C. Gause (61) | | Trustee | | Indefinite; From April 2012 to present | | Private Investor. | | 79 | | Trustee, MIST Trust;** Trustee, HSBC Funds. |
| | | | | |
| Nancy Hawthorne (62) | | Trustee | | Indefinite; From May 2003 to present | | Chief Executive Officer, Clerestory LLC (corporate advisor). | | 79 | | MIST Trust;** Director, THL Credit, Inc.**; Director, Avid Technology, Inc.** |
| | | | | |
| Barbara A. Nugent (57) | | Trustee | | Indefinite; From January 2014 to present | | President, True North Board Governance, LLC (consulting); until 2014, partner in the law firm of Stradley Ronon Stevens & Young, LLP. | | 79 | | Trustee, MIST Trust**; Director, Episcopal Healthcare Foundation; until 2014, member, Mutual Fund Directors Forum Advisory Board. |
| | | | | |
| Keith M. Schappert (62) | | Trustee | | Indefinite; From August 2009 to present | | Principal, Schappert Consulting LLC (asset management consulting). | | 79 | | Trustee, MIST Trust;** Director, The Commonfund for Nonprofit Organizations; until 2011, Director, Trilogy Global Advisors; Director, Mirae Asset Discovery Funds,** Director, Calamos Investments. |
| | | | | |
| Linda B. Strumpf (66) | | Trustee | | Indefinite; From May 2000 to present | | Chair of the Investment Committee, Leona M. and Harry B. Helmsley Charitable Trust; until 2011, Chief Investment Officer, Leona M. and Harry B. Helmsley Charitable Trust. | | 79 | | Since 2012, Trustee, MIST Trust,** Trustee and Member of Investment Committee, The Pennsylvania State University. |
| | | | | |
| Dawn M. Vroegop (47) | | Trustee | | Indefinite; From May 2009 to present | | Private Investor. | | 79 | | Trustee, MIST Trust,** Trustee, Driehaus Mutual Funds; Director and Investment Committee Chair, City College of San Francisco Foundation. |
MSF-25
Metropolitan Series Fund
Trustees and Officers of Metropolitan Series Fund—(Continued)
Executive Officers of the Trust
| | | | | | |
Name and Age | | Position(s) Held with
Registrant | | Term of Office
and Length of
Time Served | | Principal Occupation(s) During Past 5 Years(1) |
| Elizabeth M. Forget (47) | | President, Chief Executive Officer, Trustee and Chairman of the Board | | From May
2006 (President
and Chief
Executive
Officer)/
August 2006
(Trustee and
Chairman of
the Board) to
present | | See principal occupation information in the table above. |
| | | |
| Jeffrey L. Bernier (42) | | Vice President | | From February
2008 to present | | Vice President, MetLife, Inc.; Senior Vice President, MetLife Advisers, LLC and a predecessor company. |
| | | |
| Peter H. Duffy (58) | | Chief Financial Officer and Treasurer | | From November
2000 to present | | Senior Vice President, MetLife Advisers, LLC; Vice President, MetLife, Inc. |
| | | |
| Andrew L. Gangolf (59) | | Secretary | | From May
2011to present | | Senior Vice President, MetLife Advisers, LLC; Senior Vice President & Assistant General Counsel, AllianceBerstein Investments, Inc. |
| | | |
| Jeffrey P. Halperin (46) | | Chief Compliance Officer | | From November
2005 to present | | Vice President, MetLife, Inc.; Chief Compliance Officer, MIST; Chief Compliance Officer, MSF Trust; Chief Compliance Officer, MetLife Advisers, LLC and a predecessor company; Chief Compliance Officer, MetLife Investment Management, LLC (formerly MetLife Investment Advisors Company, LLC). |
| | | |
| Alan C. Leland, Jr. (61) | | Vice President | | From February
2005 to present | | Treasurer and Chief Financial Officer, MetLife Advisers, LLC; Vice President, MetLife Group Inc.; Vice President, MetLife, Inc. |
| * | Ms. Forget is an “interested person” of the Trust because of her positions with MetLife Advisers, LLC and her ownership of securities issued by MetLife, Inc., the ultimate parent company of MetLife Advisers, LLC. |
| ** | Indicates a directorship with a registered investment company or a company subject to the reporting requirements of the Securities Exchange Act of 1934, as amended. |
| (1) | Previous positions during the past five years with the Trust, MetLife, Inc. or the Adviser are omitted if not materially different. |
| (2) | The Fund Complex includes 49 Portfolios of the MIST Trust and 30 Portfolios of the Trust. |
MSF-26
Metropolitan Series Fund
Western Asset Management U.S. Government Portfolio
Board of Trustees’ Consideration of Advisory and Sub-Advisory Agreements
At an in-person meeting of the Boards of Trustees (the “Board”) of Met Investors Series Trust and Metropolitan Series Fund (“MIST” and “MSF,” respectively, and collectively, the “Trusts”) held on November 19-20, 2013, the Board, including a majority of the Trustees who are not considered to be “interested persons” of the Trusts (the “Independent Trustees”) under the Investment Company Act of 1940, as amended (the “1940 Act”), approved for an annual period the continuation of each Trust’s advisory agreement (the “Advisory Agreement”) with MetLife Advisers, LLC (the “Adviser”) and the applicable sub-advisory agreements (each a “Sub-Advisory Agreement,” and collectively with the Advisory Agreement, the “Agreements”) between the Adviser and the investment sub-advisers (each a “Sub-Adviser,” and collectively, the “Sub-Advisers”) for each of the series of the Trusts, including the Western Asset Management U.S. Government Portfolio (each a “Portfolio,” and collectively, the “Portfolios”).1
In considering the Agreements, the Board reviewed a variety of materials provided by the Adviser and the Sub-Advisers relating to the Portfolios, including comparative performance, fee and expense information for an appropriate peer group of similar mutual funds, performance information for relevant benchmark indices and other information regarding the nature, extent and quality of services provided by the Adviser and the Sub-Advisers under their respective Agreements. The Board also took into account its experience with the Adviser and the Sub-Advisers and information provided to the Board in its meetings throughout the year with respect to the services provided by the Adviser and the Sub-Advisers, including quarterly performance reports prepared by management containing reviews of investment results, and periodic presentations from certain of the Sub-Advisers with respect to the Portfolios they manage. The Independent Trustees also assessed reports provided by the Board’s independent consultant, who reviewed and provided analyses regarding investment performance, fees and expenses, and other information provided by, or at the direction of, the Adviser and the Sub-Advisers, as more fully discussed below.
The Independent Trustees were separately advised by independent legal counsel throughout the process, and met with independent legal counsel in periodic executive sessions. Prior to voting to continue the Agreements at the November meeting, the Independent Trustees also received a memorandum from their independent counsel discussing the legal standards for their consideration of the proposed continuation of the Agreements. The Board also met in person with personnel of the Adviser on September 17, 2013 for the specific purpose of giving preliminary consideration to the proposed continuation of the Agreements and to request additional information they considered reasonably necessary to their deliberations. The Independent Trustees also discussed the proposed continuation of the Agreements in private sessions with their independent legal counsel at which no representatives of management were present.
In considering whether to approve the renewal of the Advisory Agreement with the Adviser and any applicable Sub-Advisory Agreements with respect to a Portfolio, the Board reviewed and analyzed the factors it deemed relevant, including: (1) the nature, extent and quality of the services to be provided to the Portfolios by the Adviser and the Sub-Advisers; (2) the performance of the Portfolios as compared to a peer group and an appropriate index; (3) the Adviser’s and each of the Sub-Adviser’s personnel and operations; (4) the financial condition of the Adviser and of the Sub-Advisers; (5) the level and method of computing each Portfolio’s advisory and sub-advisory fees; (6) the profitability of the Adviser under the Advisory Agreement and of certain of the Sub-Advisers under the Sub-Advisory Agreements; (7) any “fall-out” benefits to the Adviser, the Sub-Advisers and their affiliates (i.e., ancillary benefits realized by the Adviser, the Sub-Advisers or their affiliates from the Adviser’s or Sub-Advisers’ relationship with the Trusts); (8) the anticipated effect of growth in size on Portfolio expenses; (9) fees paid to certain of the Sub-Advisers by comparable institutional and retail accounts; and (10) possible conflicts of interest.
Nature, extent and quality of services. The Board evaluated the nature, extent and quality of the services that the Adviser, and the Sub-Advisers as relevant, have provided to the Portfolios. The Board considered the Adviser’s services as investment manager to the Portfolios, including services relating to the selection and oversight of the Sub-Advisers for the applicable Portfolios. The Board considered, among other things, the Adviser’s oversight of the provision of services to the Portfolios by the Sub-Advisers, including with respect to investment activities and trading practices, and the Sub-Adviser’s compliance with fund policies, objectives and Board directives, compliance policies and procedures and applicable law. The Adviser’s services in coordinating and overseeing the activities of the Trusts’ other service providers were also considered. The Board also evaluated the expertise and performance of the personnel of the Adviser who performed services for the Portfolios throughout the year.
The Board considered information received from the Trust’s Chief Compliance Officer (“CCO”) regarding the Portfolios’ compliance policies and procedures established pursuant to Rule 38a-l under the 1940 Act. The Board also evaluated the CCO’s ongoing reports concerning the CCO’s oversight of the risk assessment processes of the Sub-Advisers.
1 The Pyramis Managed Risk Portfolio recently commenced operations and, therefore, the Agreement with respect to this Portfolio was not up for renewal.
MSF-27
Metropolitan Series Fund
Western Asset Management U.S. Government Portfolio
Board of Trustees’ Consideration of Advisory and Sub-Advisory Agreements—(Continued)
With respect to the services provided by each of the Sub-Advisers, the Board considered, among other things, information provided to the Board by each Sub-Adviser. The Board considered the Sub-Adviser’s current level of staffing and its overall resources, as well as its compensation program. The Board reviewed each Sub-Adviser’s history and investment experience, as well as information regarding the qualifications, background and responsibilities of the Sub-Adviser’s investment and compliance personnel who provide services to the Portfolios. The Board also considered, among other things, the Sub-Adviser’s compliance program and any disciplinary history. The Board also took into account the Sub-Adviser’s risk assessment and monitoring process. The Board noted each Sub-Adviser’s regulatory history, including whether it was currently involved in any regulatory actions or investigations as well as material litigation, and any settlements and amelioratory actions undertaken, as appropriate. The Board also noted that the CCO and his staff conduct regular, periodic compliance reviews with each of the Sub-Advisers and present reports to the Independent Trustees regarding the same, which includes evaluating the regulatory compliance systems of the Sub-Advisers and procedures reasonably designed by them to help assure compliance with the federal securities laws, including issues related to late trading and market timing, best execution, fair value pricing, and proxy voting procedures, among others. The Board also took into account the financial condition of each Sub-Adviser. In its review, the Board also received and took into account information regarding any services and/or payments provided to the Adviser by the Sub-Advisers in connection with marketing activities.
The Board considered each Sub-Adviser’s investment process and philosophy. The Board took into account that each Sub-Adviser’s responsibilities include the development and maintenance of an investment program for the applicable Portfolio which is consistent with the Portfolio’s investment objectives, the selection of investment securities and the placement of orders for the purchase and sale of such securities, as well as the implementation of compliance controls related to performance of these services. The Board also reviewed each Sub-Adviser’s brokerage policies and practices.
Performance. The Board considered the performance of the Portfolios as described in the quarterly reports prepared by management, and as also analyzed in reports prepared by the Independent Trustees’ independent consultant. The Board noted that the Adviser reviews with the Board on a quarterly basis detailed information about the Portfolios’ performance results, portfolio composition and investment strategies. The Board also reviewed and considered a separate report prepared by Lipper Inc. (“Lipper”), an independent third party, which provided a statistical analysis comparing the Portfolios’ investment performance, expenses, and fees to comparable funds underlying variable insurance products (the “Performance Universe”). In addition, the Independent Trustees met separately with a representative of Bobroff Consulting, Inc., an independent consultant (“Bobroff), at a special board meeting in September 2013, to review the separate reports prepared by such consultant (“Bobroff Report”), which analyzed the report prepared by Lipper. The Board also considered each Portfolio’s more recent performance subsequent to the performance period covered by the Lipper reports, and management’s discussion of the same, including the effect of current market conditions on each Portfolio’s more recent performance.
The Board reviewed the Portfolios’ performance records and the Adviser’s and Sub-Advisers’ management styles and long-term performance records with the Portfolios and comparable funds. The Board focused particular attention on Portfolios with less favorable performance records. The Board was mindful of the Adviser’s focus on each Sub-Adviser’s performance and noted that the Adviser has been active in monitoring and responding to any performance issues with respect to the Portfolios. The Board also took into account its discussions with management regarding factors that contributed to the performance of the Portfolios.
Among other data relating specifically to the Western Asset Management U.S. Government Portfolio’s performance, the Board considered that the Portfolio outperformed the median of its Performance Universe and its Lipper Index for the one-year period ended June 30, 2013 and underperformed the median of its Performance Universe and Lipper Index for the five-year period ended June 30, 2013. The Board also considered that the Portfolio outperformed the median of its Performance Universe for the three-year period ended June 30, 2013 but underperformed its Lipper Index for that same period. The Board further considered that the Portfolio outperformed its benchmark, the Barclays Intermediate U.S. Government Bond Index, for the one-, three- and five-year periods ended October 31, 2013.
Fees and Expenses. The Board gave consideration to the advisory fees payable under the Advisory Agreement and the sub-advisory fees payable under each of the Sub-Advisory Agreements. In this regard, the Board reviewed the advisory fees payable on a Portfolio-by-Portfolio basis based on information provided by the Adviser. The Independent Trustees, with the assistance of Bobroff, also examined the fees paid by a Portfolio in light of fees paid to other investment managers by comparable funds, as well as considered the fees charged by the Adviser to manage other comparable funds, as applicable. The Lipper report included comparisons of the Adviser’s fee schedule with that of its peers based on an asset-based analysis of relative fee structures according to the size of the Portfolio. In addition, the Board considered the Portfolios’ advisory and sub-advisory fees and total expenses as compared to similarly situated investment companies underlying variable insurance products deemed to be comparable to the Portfolios as determined by Lipper.
MSF-28
Metropolitan Series Fund
Western Asset Management U.S. Government Portfolio
Board of Trustees’ Consideration of Advisory and Sub-Advisory Agreements—(Continued)
The Board considered a Portfolio’s ranking within a smaller group of peer funds chosen by Lipper (the “Expense Group”), as well as the Portfolio’s ranking within broader groups of funds (the “Expense Universe” and the “Sub-advised Expense Universe”). The Board also considered a Portfolio’s contractual sub-advisory fees, as applicable, as compared to the Sub-advised Expense Universe as well as a smaller group of funds (the “Sub-advised Expense Group”). In comparing a Portfolio’s actual and contractual management fee to that of comparable funds, the Board noted that such fee includes both advisory and administrative fees.
The Board noted that the sub-advisory fees for the Portfolios are paid by the Adviser, not the Portfolios, out of the advisory fee. It was further noted that the Adviser negotiates such fees at arm’s length. The Board also considered that the Adviser had entered into expense limitation agreements with certain of the Portfolios, pursuant to which the Adviser has agreed to waive a portion of its advisory fee and/or reimburse certain expenses as a means of limiting a Portfolio’s total annual operating expenses. The Board further considered the amount of sub-advisory fees paid out by the Adviser and the amount of the management fees that it retained in light of the services performed by Sub-Advisers and Adviser, respectively.
With respect to the Western Asset Management U.S. Government Portfolio, the Board considered that the Portfolio’s actual management fees and that total expenses (exclusive of 12b-1 fees) were below the Expense Group median, the Expense Universe median and the Sub-advised Expense Universe median. The Board further noted that the Portfolio’s contractual management fees were above the asset-weighted average of the Expense Group at the Portfolio’s current size. The Board also noted that the Portfolio’s contractual sub-advisory fees were below the average of the Sub-advised Expense Group and the Sub-advised Expense Universe at the Portfolio’s current size. The Board further noted that the Adviser had waived fees and/or reimbursed expenses during the past year.
Profitability. The Board examined the profitability of the Adviser on a Portfolio-by-Portfolio basis. The Board also considered that the Distributor, MetLife Investors Distribution Company, receives Rule 12b-1 payments to support the distribution of the products. The Board considered the profitability to the Sub-Advisers and their affiliates as a result of their relationships with the Portfolios, and the Board considered the ability of the Adviser to negotiate the Sub-Advisory Agreements and the fees thereunder at arm’s length. The Board also reviewed Portfolio specific data with regard to the profitability of the Portfolios to each Sub-Adviser, as available.
Economies of scale. The Board also considered the effect of the Portfolios’ growth in size on their fees. The Board noted that the fee schedules for most of the Portfolios contain breakpoints that reduce the fee rate above specified asset levels. The Board noted those Portfolios that did not contain breakpoints in the advisory fee and took into account management’s discussion of the same. The Board noted that those Portfolios with advisory fee schedules containing breakpoints generally reflect the inclusion of breakpoints in the sub-advisory fee schedule for such Portfolios. The Board considered the effective fees under the Advisory Agreement for a Portfolio as a percentage of assets at different asset levels and possible economies of scale that may be realized if the assets of the Portfolio grow. Among other data, the Board examined the effect of a Portfolio’s growth in size on various fee schedules and reviewed the Lipper and Bobroff Reports, which compared fees among peers. The Board also generally noted that if a Portfolio’s assets increase over time, the Portfolio may realize other economies of scale if assets increase proportionally more than certain other fixed expenses. In addition, the Board noted that the Adviser had taken a number of steps to date intended to share the benefits of economies of scale with contractholders.
With respect to the Western Asset U.S. Government Portfolio, the Board noted that the Portfolio’s advisory fee and sub-advisory fee each contains breakpoints that reduce the advisory fee rate on assets above certain specified asset levels. The Board considered the fact that the Portfolio’s fee levels decline as portfolio assets increase.
Other factors. As part of its evaluation of the Adviser’s compensation, the Board considered other benefits that may be realized by the Adviser and its affiliates from their relationship with the Trusts. Among them, the Board recognized that an affiliate of the Adviser, MetLife Investors Distribution Company, serves as the Distributor for the Trusts, and, as such, receives payments pursuant to Rule 12b-1 from the Portfolios to compensate it for providing shareholder services and selling activities, which could lead to growth in the Trusts’ assets and corresponding benefits from such growth, including economies of scale. The Board also considered that affiliates of the Adviser may benefit from certain indirect tax benefits relating to dividend received deductions and foreign tax credits. In conjunction with these considerations, the Board noted the costs of providing investment management and other services to the Portfolios and the ongoing commitment of the Adviser to the Portfolios.
The Board considered other benefits that may be realized by each Sub-Adviser and its affiliates from their relationship with the Trusts, including the opportunity to provide advisory services to additional portfolios of the Trusts and reputational benefits. In conjunction with these considerations, the Board noted the costs of providing investment advisory services to the Portfolios and the ongoing commitment of the Sub-Advisers to the Portfolios.
MSF-29
Metropolitan Series Fund
Western Asset Management U.S. Government Portfolio
Board of Trustees’ Consideration of Advisory and Sub-Advisory Agreements—(Continued)
The Board considered possible conflicts of interest in the form of material benefits or detriments to the Trusts resulting from the nature of the Trusts’ and the Adviser’s or the Sub-Advisers’ affiliations and the services that are provided to the Trusts, and the manner in which such conflicts were mitigated.
Conclusions. After full consideration of the factors discussed above, the Board, including a majority of the Independent Trustees, approved the Advisory Agreement and the Sub-Advisory Agreement, as applicable, with respect to each Portfolio, unless otherwise noted. In making its approvals, the Board concluded that the nature, extent and quality of services provided by the Adviser and each Sub-Adviser supported the renewal of the Agreements. The Board also concluded that the investment performance of each Fund was such that each Agreement should continue. In addition, the Board concluded that fees paid by a Portfolio to the Adviser and, if applicable, the Sub-Adviser appeared to be acceptable in light of nature, extent and quality of the services provided by the Adviser and Sub-Adviser. Further, the Board concluded that the Adviser’s profitability in providing services under the Advisory Agreements did not appear unreasonably high in light of the nature, extent and quality of the services provided by the Adviser. Finally, the Board concluded that the Advisory and Sub-Advisory fees in some measure share economies of scale with contractholders. In approving the renewal of each of the Agreements, the Board, including the Independent Trustees, did not identify any single factor as controlling, and generally attributed different weights to various factors for the various Portfolios. The Board evaluated all information available to them on a Portfolio-by-Portfolio basis, and their decisions were made separately with respect to each Portfolio.
MSF-30
Metropolitan Series Fund
WMC Balanced Portfolio (formerly, BlackRock Diversified Portfolio)
Managed by BlackRock Advisors, LLC
Portfolio Manager Commentary*
PERFORMANCE
BlackRock Advisors, LLC (“BlackRock”), the Portfolio’s subadviser prior to February 3, 2014, prepared this commentary, which addresses the Portfolio’s performance for the one year period ended December 31, 2013. On February 3, 2014, Wellington Management Company, LLP (“Wellington”) succeeded BlackRock as the subadviser to the Portfolio and the name of the Portfolio was changed from the BlackRock Diversified Portfolio to the WMC Balanced Portfolio. This commentary and performance does not reflect the management of Wellington.
For the one year period ended December 31, 2013, the Class A, B, and E shares of the BlackRock Diversified Portfolio returned 20.59%, 20.28%, and 20.39%, respectively. The Portfolio’s benchmarks, the Russell 1000 Index1 and the Barclays U.S. Aggregate Bond Index2, returned 33.11% and -2.02%, respectively. A blend of the Russell 1000 Index (60%) and the Barclays U.S. Aggregate Bond Index (40%) returned 17.95%.
MARKET ENVIRONMENT / CONDITIONS
Most broad-based indices were up more than 30% in 2013 and for the most part unscathed by ongoing political and economic uncertainty. Furthermore, accommodative monetary policy and the avoidance of major risks made 2013 a strong year for U.S. stocks. The Russell 1000 Index ended the year up by more than 30%.
U.S. stocks had an impressive start to the year, strongly outpacing most other developed markets and emerging market equities. The U.S. stock rally continued to gather momentum as investors latched onto the latest favorable data on the economy and corporate earnings.
While monetary policy was the main driving force behind the rally in risk assets, it was also the main culprit for the bouts of volatility during the year. The first quarter of 2013 was characterized by Japan’s flooding of the global financial markets with liquidity, which served to buoy all assets, including the very expensive risk-free rates in the beginning of the year. In May, comments from the Federal Reserve (the “Fed”) suggesting a possible reduction of its bond-buying program before the end of 2013 roiled markets around the world. Equities plummeted and a dramatic increase in U.S. Treasury yields resulted in tumbling bond prices. Risk assets rebounded in late June, however, when the Fed’s tone turned more dovish, and improving economic indicators and better corporate earnings helped extend gains through most of the summer.
The Fed defied market expectations with its decision to delay tapering in the fall. Easing of earlier political tensions boosted investor sentiment, but higher volatility returned in late September when the U.S. Treasury Department warned that the national debt would soon breach its statutory maximum. The ensuing political brinksmanship led to a partial government shut-down, roiling global financial markets through the first half of October. The rally quickly resumed when politicians engineered a compromise to reopen the government and extend the debt ceiling, at least temporarily. During the last quarter of the year, U.S. Treasury rates generally rose across the yield curve. In December, the 5- to 10- year part of the yield curve significantly underperformed 30-year rates. About half of the rise in rates occurred in the first half of the month, consistent with stronger economic data releases in the U.S., and anticipation that the Fed may start to taper its bond-buying program sooner rather than later.
PORTFOLIO REVIEW / CURRENT POSITIONING
The equity sleeve within the Portfolio outperformed the Russell 1000 Index during the 12-month period ended December 31, 2013. An intentional underweight in expensive, defensive segments contributed meaningfully to performance relative to the benchmark index. An analysis of real estate investment trusts (“REITs”) and the Consumer Staples, Utilities, and Telecommunication Services sectors in early 2013 suggested that relative valuations in these sectors represented a premium to the rest of the market that was nearly as high as any seen in the last 35 years. This confirmed our view and during the year, we widened already existing underweights and remained mostly underweight throughout the year.
Elsewhere in the strategy, stock selection proved beneficial in the Industrials, Information Technology (“IT”), Materials, and Consumer Discretionary sectors. Within Industrials, United Continental (“UAL”) performed well as industry pricing data points remained positive and the Department of Justice approved the merger of American Airlines and U.S. Airways, which will likely lead to further consolidation of the U.S. airline industry. UAL also held an “investor day” during which it outlined aggressive cost-saving initiatives and a strong outlook for earnings growth. Within Materials, positions in the Containers & Packaging industry and an underweight in the Metals & Mining industry drove returns.
In the IT sector, positions in MasterCard, Inc., and Google, Inc. were strong performers. Shares of MasterCard gained 70% as the company continued to enjoy strong growth amid the secular shift from cash to credit card/debit card payments, both domestically and in emerging markets. A favorable court ruling on debit card processing fees also provided a boost for MasterCard shares, as it is likely to lead to market share gains in debit transactions. Google’s stock rose more than 17% after the company handily beat top- and bottom-line expectations, and it ended the year up 58%.
Within Consumer Discretionary, Twenty-First Century Fox was a significant contributor as shares soared following the completed spin-off transaction of the News Corp. publishing division, a catalyst we had anticipated would highlight the strong growth and capital allocation characteristics of the company.
Conversely, negative performance in the Health Care, Consumer Discretionary, and IT sectors detracted from relative performance. In Health Care, a lack of exposure to Biotechnology—the
MSF-1
Metropolitan Series Fund
WMC Balanced Portfolio (formerly, BlackRock Diversified Portfolio)
Managed by BlackRock Advisors, LLC
Portfolio Manager Commentary*—(Continued)
top-performing industry in the sector—had a negative impact on relative returns. Although the strategy added exposure to Biotechnology later in the reporting period, the move proved untimely in the short run, as a couple of these stocks subsequently declined. Positioning in the Pharmaceuticals industry was an additional source of weakness.
Within Consumer Discretionary, stock selection was the greatest detractor, most notably the strategy’s lack of exposure to the Internet & Catalog Retail industry. Furthermore, an overweight in Time Warner Cable hindered relative returns as shares underperformed following the issuance of disappointing 2013 guidance, in which the company forecast an unexpectedly high increase in programming expenses.
Within the Energy sector, volatility in crude oil prices and the narrowing of crack spreads (i.e., the difference between the price of crude oil and prices of the petroleum products derived from it) raised concerns about the sustainability of profit margins for Oil Refiners held by the strategy, including PBF Energy, Inc. and shares of Canadian Oil & Gas Refiner Suncor Energy, Inc., also detracted.
In the IT sector, overweights in Teradata Corp. and EMC Corp. detracted from relative results, as did strategy holdings in the computers & peripherals industry. Shares of data analytics firms Teradata Corp. and EMC Corp. lagged amid ongoing softness in enterprise IT spending. Within Computers & Peripherals, positioning in Apple, Inc. detracted as the stock tumbled amid investors’ increasing concerns about weakening profit margins and the company’s ability to continue to innovate and drive demand for its products.
While valuations in certain segments of the market have become rich, there remain many good companies that are fairly priced with the potential to perform well over the long term. We believe that broad-based multiple expansion is likely behind us, making stock-specific factors a more relevant determinant of price movements going forward.
In our opinion, underlying corporate fundamentals remain constructive looking out over the medium term. This, coupled with an improving economic outlook in Europe and increasing momentum for the U.S. economy, should allow for further equity market appreciation. Against this backdrop at period end, we maintain a bias toward cyclical stocks, while increasing holdings in companies with European exposure. In particular, we expect a resurgence of investment (specifically in durables ranging from housing to enterprise IT infrastructure) to contribute the next leg of economic growth and, thus, favor names poised to benefit from a rebound in U.S. capital expenditures. We also have a strong preference for Financials (ex-REITs), which benefit from capital expenditures through loan growth, housing via falling legacy mortgage expense and rising consumer spending, and improved economic conditions through rising interest rates. The Financials sector remains our largest risk exposure in the Portfolio. For ballast, we continue to like Health Care, which is cheaper than other defensive segments of the market and has superior growth prospects, in our view.
At year-end, the equity sleeve’s largest sector overweights relative to the Russell 1000 Index were in Health Care, Financials, and Information Technology, while Consumer Staples and Utilities were notable underweights.
The fixed income sleeve within the Portfolio maintained a neutral duration bias relative to its benchmark index for most of the period.
Throughout the 12-month period, the fixed income sleeve of the Portfolio was overweight relative to its benchmark index in non-government spread sectors and underweight in government owned/government-related sectors which contributed to performance.
Corporate credit (mainly in the Industrials sector and high yield market) contributed significantly toward performance. Security selection and sector allocation within structured products (commercial mortgage-backed securities [“CMBS”], asset-backed securities [“ABS”], agency and non-agency residential Mortgage-backed securities [“MBS”]) also added to performance. Rounding out the contributors to performance was the strategy’s allocation to non-U.S. securities and currencies, particularly the euro and the Australian dollar.
On the negative side, detractors from the fixed income strategy’s performance included an allocation to Treasury Inflation-Protected Securities (“TIPS”). Security selection in U.S. Treasuries, and an allocation to agency MBS, particularly 30-year pass-through securities, also detracted from performance.
At the end of the period, the Portfolio was overweight relative to the benchmark index in CMBS and ABS, with non-benchmark allocations to high yield bonds, non-agency residential MBS and TIPS. The strategy was underweight in investment grade credit, agency MBS, agency debentures and U.S. Treasuries. The strategy ended the period with a neutral duration versus the benchmark.
MSF-2
Metropolitan Series Fund
WMC Balanced Portfolio (formerly, BlackRock Diversified Portfolio)
Managed By BlackRock Advisors, LLC
Portfolio Manager Commentary*—(Continued)
The Portfolio held derivatives during the period as a part of its investment strategy. Derivatives are used by the portfolio management team as a means to hedge and/or take outright views on interest rates, credit risk and/or foreign exchange positions in the strategy. Specifically, the strategy used Treasury futures to express a neutral bias for most of the period. In addition, the strategy held a yield-curve-flattening bias in the short end and a steepening bias in the long end of the curve, expressed by a combination of long-dated Treasury securities and short-to-intermediate Treasury futures. The overall impact of duration and yield curve positioning on performance was neutral over the period.
As of December 31, 2013, the Portfolio invested 67.8% of its net assets in equities and 32.2% in bonds.
Peter Stournaras
Rick Rieder
Bob Miller
Philip Green
Portfolio Manager
BlackRock Advisors, LLC
* This commentary may include statements that constitute “forward-looking statements” under the U.S. securities laws. Forward-looking statements include, among other things, projections, estimates, and information about possible or future results related to the Portfolio, market or regulatory developments. The views expressed above are not guarantees of future performance or economic results and involve certain risks, uncertainties and assumptions that could cause actual outcomes and results to differ materially from the views expressed herein. The views expressed above are subject to change at any time based upon economic, market, or other conditions and the subadvisory firm undertakes no obligation to update the views expressed herein. Any discussions of specific securities should not be considered a recommendation to buy or sell those securities. The views expressed above (including any forward-looking statement) may not be relied upon as investment advice or as an indication of the Portfolio’s trading intent. Information about the Portfolio’s holdings, asset allocation or country diversification is historical and is not an indication of future Portfolio composition, which may vary. Direct investment in any index is not possible. The performance of any index mentioned in this commentary has not been adjusted for ongoing management, distribution and operating expenses, and sales charges applicable to mutual fund investments. In addition, the returns do not reflect additional fees charged by separate accounts or variable insurance contracts that an investor in the Portfolio may pay. If these additional fees were reflected, performance would have been lower.
MSF-3
Metropolitan Series Fund
WMC Balanced Portfolio (formerly, BlackRock Diversified Portfolio)
A $10,000 INVESTMENT COMPARED TO THE RUSSELL 1000 INDEX & THE BARCLAYS U.S. AGGREGATE BOND INDEX

AVERAGE ANNUAL RETURNS (%) (FOR THE YEAR ENDED DECEMBER 31, 2013)
| | | | | | | | | | | | | | | | |
| | | 1 Year | | | 5 Year | | | 10 Year | | | Since Inception3 | |
| WMC Balanced Portfolio | | | | | | | | | | | | | | | | |
Class A | | | 20.59 | | | | 12.59 | | | | 5.94 | | | | — | |
Class B | | | 20.28 | | | | 12.30 | | | | — | | | | 5.75 | |
Class E | | | 20.39 | | | | 12.41 | | | | 5.78 | | | | — | |
| Russell 1000 Index | | | 33.11 | | | | 18.59 | | | | 7.78 | | | | — | |
| Barclays U.S. Aggregate Bond Index | | | -2.02 | | | | 4.44 | | | | 4.55 | | | | — | |
1 The Russell 1000 Index is an unmanaged measure of the 1,000 largest companies in the Russell 3000 Index, which represents approximately 90% of the investable U.S. equity market.
2 Barclays U.S. Aggregate Bond Index is a broad based benchmark that measures the investment grade, U.S. dollar-denominated, fixed-rate taxable bond market, including Treasuries, government-related and corporate securities, mortgage-backed securities, asset-backed securities, and commercial mortgage-backed securities.
3 Inception dates of the Class A, Class B, and Class E shares are 7/25/86, 4/26/04, and 5/1/01, respectively.
Portfolio performance is calculated including reinvestment of all income and capital gain distributions. Performance numbers are net of all Portfolio expenses but do not include any insurance, sales, separate account or administrative charges of variable annuity or life insurance contracts or any additional expenses that participants may bear relating to the operations of their plans. If these charges were included, the returns would be lower. The performance of any index referenced above has not been adjusted for ongoing management, distribution and operating expenses, and sales charges applicable to mutual fund investments. Direct investment in any index is not possible. The performance of Class A shares, as set forth in the line graph above, will differ from that of other classes because of the difference in expenses paid by policyholders investing in the different share classes.
This information represents past performance and is not indicative of future results. Investment return and principal value may fluctuate so that shares, upon redemption, may be worth more or less than the original cost.
PORTFOLIO COMPOSITION AS OF DECEMBER 31, 2013
Top Equity Holdings
| | | | |
| | |
% of
Net Assets | |
| Google, Inc. | | | 2.5 | |
| JPMorgan Chase & Co. | | | 2.1 | |
| 3M Co. | | | 2.1 | |
| CVS Caremark Corp. | | | 1.9 | |
| Comcast Corp. | | | 1.9 | |
Top Fixed Income Issuers
| | | | |
| | |
% of
Net Assets | |
| U.S. Treasury Notes | | | 4.6 | |
| Fannie Mae 30 Yr. Pool | | | 4.2 | |
| Freddie Mac 30 Yr. Gold Pool | | | 2.2 | |
| Ginnie Mae II 30 Yr. Pool | | | 2.0 | |
| U.S. Treasury Bonds | | | 1.9 | |
Top Equity Sectors
| | | | |
| | | % of
Market Value of
Total Investments | |
| Financials | | | 13.1 | |
| Information Technology | | | 13.0 | |
| Health Care | | | 11.4 | |
| Consumer Discretionary | | | 7.4 | |
| Industrials | | | 7.4 | |
Top Fixed Income Sectors
| | | | |
| | | % of
Market Value of
Total Investments | |
| U.S. Treasury & Government Agencies | | | 18.1 | |
| Corporate Bonds & Notes | | | 7.8 | |
| Asset-Backed Securities | | | 6.3 | |
| Mortgage-Backed Securities | | | 4.4 | |
| Foreign Government | | | 0.4 | |
MSF-4
Metropolitan Series Fund
WMC Balanced Portfolio (formerly, BlackRock Diversified Portfolio)
Understanding Your Portfolio’s Expenses
Shareholder Expense Example
As a shareholder of the Portfolio, you incur ongoing costs, including management fees; distribution and service (12b-1) fees; and other Portfolio expenses. This example is intended to help you understand your ongoing costs (in dollars) (referred to as “expenses”) of investing in the Portfolio and compare these costs with the ongoing costs of investing in other mutual funds. The example is based on an investment of $1,000 invested at the beginning of the period and held for the entire period, July 1, 2013 through December 31, 2013.
Actual Expenses
The first line for each share class of the Portfolio in the table below provides information about actual account values and actual expenses. You may use the information in this line, together with the amount you invested in the particular share class of the Portfolio, to estimate the expenses that you paid over the period. Simply divide your account value by $1,000 (for example, an $8,600 account value divided by $1,000 = 8.6), then multiply the result by the number in the first line under the heading entitled “Expenses Paid During Period” to estimate the expenses you paid on your account during this period.
Hypothetical Example for Comparison Purposes
The second line for each share class of the Portfolio in the table below provides information about hypothetical account values and hypothetical expenses based on the Portfolio’s actual expense ratio and an assumed rate of return of 5% per year before expenses, which is not the Portfolio’s actual return. The hypothetical account values and expenses may not be used to estimate the actual ending account balance or expenses you paid for the period. You may use this information to compare the ongoing costs of investing in the Portfolio and other funds. To do so, compare this 5% hypothetical example with the 5% hypothetical examples that appear in the shareholder reports of the other funds.
Please note that the expenses shown in the table are meant to highlight your ongoing costs only and do not reflect any fees or charges of your variable insurance product or any additional expenses that participants in certain eligible qualified plans may bear relating to the operations of their plan. Therefore, the second line for each share class in the table is useful in comparing ongoing costs only, and will not help you determine the relative total costs of owning different funds. In addition, if these other costs were included, your costs would have been higher.
| | | | | | | | | | | | | | | | | | |
WMC Balanced Portfolio
(formerly, BlackRock Diversified Portfolio) | | | | Annualized
Expense
Ratio | | | Beginning
Account Value
July 1,
2013 | | | Ending
Account Value
December 31,
2013 | | | Expenses Paid
During Period**
July 1, 2013
to
December 31,
2013 | |
Class A | | Actual | | | 0.51 | % | | $ | 1,000.00 | | | $ | 1,128.20 | | | $ | 2.74 | |
| | Hypothetical* | | | 0.51 | % | | $ | 1,000.00 | | | $ | 1,022.64 | | | $ | 2.60 | |
| | | | | |
Class B | | Actual | | | 0.76 | % | | $ | 1,000.00 | | | $ | 1,126.50 | | | $ | 4.07 | |
| | Hypothetical* | | | 0.76 | % | | $ | 1,000.00 | | | $ | 1,021.37 | | | $ | 3.87 | |
| | | | | |
Class E | | Actual | | | 0.66 | % | | $ | 1,000.00 | | | $ | 1,126.70 | | | $ | 3.54 | |
| | Hypothetical* | | | 0.66 | % | | $ | 1,000.00 | | | $ | 1,021.88 | | | $ | 3.36 | |
* Hypothetical assumes a rate of return of 5% per year before expenses.
** Expenses paid are equal to the Portfolio’s annualized expense ratio for the most recent six month period, as shown above, multiplied by the average account value over the period, multiplied by the number of days (184 days) in the most recent fiscal half-year, divided by 365 (to reflect the one-half year period).
MSF-5
Metropolitan Series Fund
WMC Balanced Portfolio (formerly, BlackRock Diversified Portfolio)
Schedule of Investments as of December 31, 2013
Common Stocks—67.0% of Net Assets
| | | | | | | | |
| Security Description | | Shares | | | Value | |
|
Aerospace & Defense—1.5% | |
Boeing Co. (The) | | | 83,500 | | | $ | 11,396,915 | |
Raytheon Co. | | | 72,875 | | | | 6,609,762 | |
Rockwell Collins, Inc. (a) | | | 35,900 | | | | 2,653,728 | |
| | | | | | | | |
| | | | | | | 20,660,405 | |
| | | | | | | | |
|
Airlines—1.3% | |
United Continental Holdings, Inc. (a) (b) | | | 465,675 | | | | 17,616,485 | |
| | | | | | | | |
|
Auto Components—1.4% | |
BorgWarner, Inc. | | | 101,780 | | | | 5,690,520 | |
TRW Automotive Holdings Corp. (b) | | | 185,774 | | | | 13,819,728 | |
| | | | | | | | |
| | | | | | | 19,510,248 | |
| | | | | | | | |
|
Biotechnology—1.8% | |
Amgen, Inc. | | | 77,600 | | | | 8,858,816 | |
Biogen Idec, Inc. (b) | | | 20,900 | | | | 5,846,775 | |
Celgene Corp. (b) | | | 39,300 | | | | 6,640,128 | |
Gilead Sciences, Inc. (b) | | | 38,400 | | | | 2,885,760 | |
| | | | | | | | |
| | | | | | | 24,231,479 | |
| | | | | | | | |
|
Capital Markets—1.0% | |
Goldman Sachs Group, Inc. (The) | | | 75,352 | | | | 13,356,896 | |
| | | | | | | | |
|
Chemicals—0.7% | |
Cabot Corp. (a) | | | 65,426 | | | | 3,362,896 | |
Dow Chemical Co. (The) | | | 111,400 | | | | 4,946,160 | |
PPG Industries, Inc. | | | 9,875 | | | | 1,872,893 | |
| | | | | | | | |
| | | | | | | 10,181,949 | |
| | | | | | | | |
|
Commercial Banks—2.5% | |
SunTrust Banks, Inc. | | | 298,600 | | | | 10,991,466 | |
U.S. Bancorp | | | 572,975 | | | | 23,148,190 | |
| | | | | | | | |
| | | | | | | 34,139,656 | |
| | | | | | | | |
|
Commercial Services & Supplies—0.4% | |
Tyco International, Ltd. | | | 147,575 | | | | 6,056,478 | |
| | | | | | | | |
|
Communications Equipment—1.4% | |
Brocade Communications Systems, Inc. (b) | | | 401,800 | | | | 3,563,966 | |
Cisco Systems, Inc. | | | 681,800 | | | | 15,306,410 | |
| | | | | | | | |
| | | | | | | 18,870,376 | |
| | | | | | | | |
|
Computers & Peripherals—3.4% | |
Apple, Inc. | | | 31,050 | | | | 17,422,466 | |
EMC Corp. | | | 581,100 | | | | 14,614,665 | |
NetApp, Inc. | | | 148,003 | | | | 6,088,843 | |
Western Digital Corp. | | | 96,100 | | | | 8,062,790 | |
| | | | | | | | |
| | | | | | | 46,188,764 | |
| | | | | | | | |
|
Construction & Engineering—0.3% | |
KBR, Inc. (a) | | | 146,670 | | | | 4,677,306 | |
| | | | | | | | |
|
Consumer Finance—1.6% | |
Discover Financial Services | | | 388,075 | | | | 21,712,796 | |
| | | | | | | | |
|
Containers & Packaging—0.7% | |
Packaging Corp. of America | | | 157,445 | | | | 9,963,120 | |
| | | | | | | | |
|
Diversified Financial Services—5.7% | |
Bank of America Corp. | | | 1,555,549 | | | | 24,219,898 | |
Citigroup, Inc. | | | 458,173 | | | | 23,875,395 | |
JPMorgan Chase & Co. | | | 496,283 | | | | 29,022,630 | |
| | | | | | | | |
| | | | | | | 77,117,923 | |
| | | | | | | | |
|
Electronic Equipment, Instruments & Components—0.8% | |
Avnet, Inc. | | | 132,500 | | | | 5,844,575 | |
TE Connectivity, Ltd. | | | 94,300 | | | | 5,196,873 | |
| | | | | | | | |
| | | | | | | 11,041,448 | |
| | | | | | | | |
|
Energy Equipment & Services—2.4% | |
Halliburton Co. | | | 182,000 | | | | 9,236,500 | |
Oceaneering International, Inc. | | | 76,900 | | | | 6,065,872 | |
Schlumberger, Ltd. | | | 186,600 | | | | 16,814,526 | |
| | | | | | | | |
| | | | | | | 32,116,898 | |
| | | | | | | | |
|
Food & Staples Retailing—2.1% | |
CVS Caremark Corp. | | | 367,775 | | | | 26,321,657 | |
Wal-Mart Stores, Inc. | | | 22,400 | | | | 1,762,656 | |
| | | | | | | | |
| | | | | | | 28,084,313 | |
| | | | | | | | |
|
Health Care Equipment & Supplies—1.4% | |
Abbott Laboratories | | | 193,575 | | | | 7,419,730 | |
Medtronic, Inc. | | | 207,900 | | | | 11,931,381 | |
| | | | | | | | |
| | | | | | | 19,351,111 | |
| | | | | | | | |
|
Health Care Providers & Services—3.3% | |
Aetna, Inc. | | | 163,500 | | | | 11,214,465 | |
Envision Healthcare Holdings, Inc. (b) | | | 19,700 | | | | 699,744 | |
McKesson Corp. | | | 93,400 | | | | 15,074,760 | |
UnitedHealth Group, Inc. | | | 113,000 | | | | 8,508,900 | |
Universal Health Services, Inc. - Class B | | | 113,177 | | | | 9,196,763 | |
| | | | | | | | |
| | | | | | | 44,694,632 | |
| | | | | | | | |
|
Industrial Conglomerates—2.4% | |
3M Co. | | | 202,200 | | | | 28,358,550 | |
General Electric Co. | | | 153,250 | | | | 4,295,597 | |
| | | | | | | | |
| | | | | | | 32,654,147 | |
| | | | | | | | |
|
Insurance—3.2% | |
Allied World Assurance Co.
Holdings AG (a) | | | 9,500 | | | | 1,071,695 | |
American Financial Group, Inc. | | | 44,775 | | | | 2,584,413 | |
American International Group, Inc. | | | 442,200 | | | | 22,574,310 | |
Genworth Financial, Inc. - Class A (b) | | | 261,500 | | | | 4,061,095 | |
Travelers Cos., Inc. (The) | | | 145,050 | | | | 13,132,827 | |
| | | | | | | | |
| | | | | | | 43,424,340 | |
| | | | | | | | |
|
Internet Software & Services—3.2% | |
AOL, Inc. (a) (b) | | | 102,800 | | | | 4,792,536 | |
Google, Inc. - Class A (b) | | | 30,360 | | | | 34,024,756 | |
See accompanying notes to financial statements.
MSF-6
Metropolitan Series Fund
WMC Balanced Portfolio (formerly, BlackRock Diversified Portfolio)
Schedule of Investments as of December 31, 2013
Common Stocks—(Continued)
| | | | | | | | |
| Security Description | | Shares | | | Value | |
|
Internet Software & Services—(Continued) | |
Yahoo!, Inc. (b) | | | 107,300 | | | $ | 4,339,212 | |
| | | | | | | | |
| | | | | | | 43,156,504 | |
| | | | | | | | |
|
IT Services—2.2% | |
Alliance Data Systems Corp. (a) (b) | | | 6,500 | | | | 1,709,045 | |
MasterCard, Inc. - Class A | | | 28,150 | | | | 23,518,199 | |
Teradata Corp. (b) | | | 111,200 | | | | 5,058,488 | |
| | | | | | | | |
| | | | | | | 30,285,732 | |
| | | | | | | | |
|
Life Sciences Tools & Services—0.9% | |
Agilent Technologies, Inc. | | | 223,800 | | | | 12,799,122 | |
| | | | | | | | |
|
Machinery—1.7% | |
Cummins, Inc. | | | 12,750 | | | | 1,797,367 | |
Ingersoll-Rand plc | | | 153,400 | | | | 9,449,440 | |
Parker Hannifin Corp. | | | 57,845 | | | | 7,441,181 | |
WABCO Holdings, Inc. (b) | | | 55,000 | | | | 5,137,550 | |
| | | | | | | | |
| | | | | | | 23,825,538 | |
| | | | | | | | |
|
Media—2.8% | |
Comcast Corp. - Class A | | | 493,400 | | | | 25,639,531 | |
Twenty-First Century Fox, Inc. - Class A | | | 345,717 | | | | 12,162,324 | |
| | | | | | | | |
| | | | | | | 37,801,855 | |
| | | | | | | | |
|
Multiline Retail—0.8% | |
Dillard’s, Inc. - Class A | | | 47,100 | | | | 4,578,591 | |
Macy’s, Inc. | | | 103,400 | | | | 5,521,560 | |
Nordstrom, Inc. (a) | | | 11,525 | | | | 712,245 | |
| | | | | | | | |
| | | | | | | 10,812,396 | |
| | | | | | | | |
|
Oil, Gas & Consumable Fuels—4.3% | |
Chevron Corp. | | | 49,935 | | | | 6,237,381 | |
Exxon Mobil Corp. | | | 88,775 | | | | 8,984,030 | |
Marathon Petroleum Corp. | | | 174,420 | | | | 15,999,547 | |
PBF Energy, Inc. - Class A (a) | | | 183,075 | | | | 5,759,539 | |
Suncor Energy, Inc. | | | 466,040 | | | | 16,334,702 | |
Tesoro Corp. | | | 85,290 | | | | 4,989,465 | |
| | | | | | | | |
| | | | | | | 58,304,664 | |
| | | | | | | | |
|
Paper & Forest Products—1.0% | |
Domtar Corp. | | | 73,200 | | | | 6,905,688 | |
International Paper Co. | | | 127,725 | | | | 6,262,357 | |
| | | | | | | | |
| | | | | | | 13,168,045 | |
| | | | | | | | |
|
Pharmaceuticals—4.7% | |
AbbVie, Inc. | | | 189,075 | | | | 9,985,051 | |
Eli Lilly & Co. | | | 132,675 | | | | 6,766,425 | |
Johnson & Johnson | | | 33,750 | | | | 3,091,162 | |
Merck & Co., Inc. | | | 415,175 | | | | 20,779,509 | |
Pfizer, Inc. | | | 771,925 | | | | 23,644,063 | |
| | | | | | | | |
| | | | | | | 64,266,210 | |
| | | | | | | | |
|
Semiconductors & Semiconductor Equipment—0.8% | |
Applied Materials, Inc. | | | 587,150 | | | | 10,386,683 | |
| | | | | | | | |
|
Software—2.2% | |
Activision Blizzard, Inc. | | | 150,400 | | | | 2,681,632 | |
Microsoft Corp. | | | 140,275 | | | | 5,250,493 | |
Oracle Corp. | | | 451,500 | | | | 17,274,390 | |
Symantec Corp. | | | 177,600 | | | | 4,187,808 | |
| | | | | | | | |
| | | | | | | 29,394,323 | |
| | | | | | | | |
|
Specialty Retail—2.9% | |
Lowe’s Cos., Inc. | | | 462,200 | | | | 22,902,010 | |
Ross Stores, Inc. | | | 225,900 | | | | 16,926,687 | |
| | | | | | | | |
| | | | | | | 39,828,697 | |
| | | | | | | | |
|
Trading Companies & Distributors—0.2% | |
MRC Global, Inc. (b) | | | 70,400 | | | | 2,271,104 | |
| | | | | | | | |
Total Common Stocks
(Cost $674,927,710) | | | | | | | 911,951,643 | |
| | | | | | | | |
|
| U.S. Treasury & Government Agencies—19.3% | |
|
Agency Sponsored Mortgage-Backed—12.1% | |
Fannie Mae 15 Yr. Pool
2.500%, 09/01/27 | | | 6,470,940 | | | | 6,411,666 | |
3.000%, TBA (c) | | | 3,500,000 | | | | 3,571,777 | |
3.500%, 07/01/28 | | | 527,304 | | | | 552,854 | |
3.500%, TBA (c) | | | 2,000,000 | | | | 2,091,484 | |
4.000%, 02/01/25 | | | 1,232,948 | | | | 1,307,391 | |
4.000%, 09/01/25 | | | 220,152 | | | | 233,353 | |
4.000%, 10/01/25 | | | 637,468 | | | | 675,905 | |
4.000%, 01/01/26 | | | 181,839 | | | | 192,806 | |
4.000%, 04/01/26 | | | 104,713 | | | | 111,614 | |
4.000%, 07/01/26 | | | 513,012 | | | | 543,919 | |
4.000%, 08/01/26 | | | 245,808 | | | | 260,633 | |
4.500%, 02/01/25 | | | 239,778 | | | | 255,234 | |
4.500%, 04/01/25 | | | 31,895 | | | | 33,954 | |
4.500%, 07/01/25 | | | 170,606 | | | | 181,638 | |
4.500%, 06/01/26 | | | 3,530,613 | | | | 3,757,575 | |
4.500%, TBA (c) | | | 1,900,000 | | | | 2,021,644 | |
Fannie Mae 30 Yr. Pool | | | | | | | | |
3.000%, 02/01/43 | | | 1,254,089 | | | | 1,192,257 | |
3.000%, 03/01/43 | | | 3,557,917 | | | | 3,381,998 | |
3.000%, 04/01/43 | | | 2,793,886 | | | | 2,656,120 | |
3.000%, 05/01/43 | | | 3,503,419 | | | | 3,330,774 | |
3.000%, 06/01/43 | | | 470,569 | | | | 447,475 | |
3.000%, 08/01/43 | | | 1,395,000 | | | | 1,323,242 | |
3.500%, 06/01/42 | | | 86,865 | | | | 86,460 | |
3.500%, 03/01/43 | | | 99,218 | | | | 98,694 | |
3.500%, 04/01/43 | | | 1,151,030 | | | | 1,143,978 | |
3.500%, 05/01/43 | | | 195,663 | | | | 194,632 | |
3.500%, 06/01/43 | | | 697,831 | | | | 694,558 | |
3.500%, 07/01/43 | | | 1,103,520 | | | | 1,098,075 | |
3.500%, 08/01/43 | | | 4,740,566 | | | | 4,717,486 | |
See accompanying notes to financial statements.
MSF-7
Metropolitan Series Fund
WMC Balanced Portfolio (formerly, BlackRock Diversified Portfolio)
Schedule of Investments as of December 31, 2013
U.S. Treasury & Government Agencies—(Continued)
| | | | | | | | |
| Security Description | | Principal
Amount* | | | Value | |
|
Agency Sponsored Mortgage-Backed—(Continued) | |
Fannie Mae 30 Yr. Pool | | | | | | | | |
4.000%, 05/01/42 | | | 93,417 | | | $ | 96,602 | |
4.000%, 02/01/43 | | | 369,346 | | | | 381,383 | |
4.000%, 08/01/43 | | | 558,135 | | | | 575,805 | |
4.000%, 09/01/43 | | | 146,355 | | | | 150,976 | |
4.000%, 10/01/43 | | | 1,330,137 | | | | 1,370,241 | |
4.000%, 11/01/43 | | | 1,107,000 | | | | 1,140,313 | |
4.000%, 12/01/43 | | | 2,310,350 | | | | 2,382,058 | |
4.000%, 01/01/44 | | | 2,600,000 | | | | 2,682,211 | |
4.000%, TBA (c) | | | 4,000,000 | | | | 4,117,500 | |
4.500%, 09/01/41 | | | 173,079 | | | | 183,468 | |
4.500%, 06/01/42 | | | 1,664,461 | | | | 1,768,075 | |
4.500%, 08/01/42 | | | 254,020 | | | | 269,500 | |
4.500%, 08/01/43 | | | 99,651 | | | | 105,692 | |
4.500%, 09/01/43 | | | 4,210,266 | | | | 4,466,980 | |
4.500%, 10/01/43 | | | 589,673 | | | | 625,717 | |
4.500%, 12/01/43 | | | 500,000 | | | | 530,461 | |
5.000%, 04/01/33 | | | 12,045 | | | | 13,130 | |
5.000%, 07/01/33 | | | 33,395 | | | | 36,350 | |
5.000%, 09/01/33 | | | 520,844 | | | | 567,428 | |
5.000%, 11/01/33 | | | 125,276 | | | | 136,475 | |
5.000%, 12/01/33 | | | 51,467 | | | | 56,063 | |
5.000%, 02/01/34 | | | 22,450 | | | | 24,451 | |
5.000%, 03/01/34 | | | 10,790 | | | | 11,736 | |
5.000%, 04/01/34 | | | 10,798 | | | | 11,748 | |
5.000%, 06/01/34 | | | 9,585 | | | | 10,430 | |
5.000%, 07/01/34 | | | 1,107,719 | | | | 1,203,604 | |
5.000%, 10/01/34 | | | 418,624 | | | | 456,088 | |
5.000%, 12/01/34 | | | 19,090 | | | | 20,774 | |
5.000%, 07/01/35 | | | 1,248,096 | | | | 1,359,008 | |
5.000%, 10/01/35 | | | 739,281 | | | | 805,202 | |
5.000%, 12/01/35 | | | 234,167 | | | | 254,413 | |
5.000%, 08/01/36 | | | 226,176 | | | | 245,664 | |
5.000%, 07/01/37 | | | 108,535 | | | | 118,215 | |
5.000%, 11/01/40 | | | 1,810,786 | | | | 1,971,070 | |
5.000%, 07/01/41 | | | 162,863 | | | | 177,717 | |
5.000%, 08/01/41 | | | 117,680 | | | | 128,473 | |
5.500%, 08/01/28 | | | 33,567 | | | | 36,873 | |
5.500%, 04/01/33 | | | 132,655 | | | | 146,093 | |
5.500%, 08/01/37 | | | 846,590 | | | | 931,759 | |
5.500%, 04/01/41 | | | 80,566 | | | | 89,170 | |
5.500%, 06/01/41 | | | 770,573 | | | | 839,828 | |
6.000%, 03/01/28 | | | 12,510 | | | | 13,985 | |
6.000%, 05/01/28 | | | 16,944 | | | | 18,779 | |
6.000%, 06/01/28 | | | 2,619 | | | | 2,904 | |
6.000%, 02/01/34 | | | 527,026 | | | | 591,355 | |
6.000%, 08/01/34 | | | 292,538 | | | | 328,362 | |
6.000%, 04/01/35 | | | 2,383,713 | | | | 2,674,773 | |
6.000%, 02/01/38 | | | 219,638 | | | | 243,753 | |
6.000%, 03/01/38 | | | 87,943 | | | | 97,839 | |
6.000%, 05/01/38 | | | 257,975 | | | | 286,556 | |
6.000%, 10/01/38 | | | 77,316 | | | | 85,531 | |
6.000%, 12/01/38 | | | 99,290 | | | | 110,378 | |
6.500%, 05/01/40 | | | 2,104,967 | | | | 2,338,544 | |
|
Agency Sponsored Mortgage-Backed—(Continued) | |
Fannie Mae ARM Pool | | | | | | | | |
3.011%, 03/01/41 (d) | | | 220,979 | | | | 233,199 | |
3.131%, 03/01/41 (d) | | | 277,962 | | | | 291,789 | |
3.222%, 12/01/40 (d) | | | 456,571 | | | | 478,163 | |
3.355%, 06/01/41 (d) | | | 561,309 | | | | 588,117 | |
3.496%, 09/01/41 (d) | | | 412,293 | | | | 433,178 | |
Fannie Mae REMICS | | | | | | | | |
4.000%, 08/25/19 | | | 697,168 | | | | 731,770 | |
Fannie Mae-ACES | | | | | | | | |
2.396%, 01/25/22 (d) (e) | | | 1,799,565 | | | | 230,607 | |
3.329%, 10/25/23 (d) | | | 505,000 | | | | 493,389 | |
Freddie Mac 15 Yr. Gold Pool | | | | | | | | |
3.000%, TBA (c) | | | 1,300,000 | | | | 1,324,070 | |
Freddie Mac 30 Yr. Gold Pool | | | | | | | | |
2.500%, TBA (c) | | | 2,300,000 | | | | 2,278,707 | |
3.000%, 03/01/43 | | | 579,708 | | | | 549,888 | |
3.000%, 04/01/43 | | | 3,107,888 | | | | 2,948,020 | |
3.500%, 04/01/42 | | | 398,418 | | | | 396,285 | |
3.500%, 08/01/42 | | | 324,001 | | | | 322,348 | |
3.500%, 09/01/42 | | | 182,562 | | | | 181,445 | |
3.500%, 11/01/42 | | | 367,221 | | | | 364,867 | |
3.500%, TBA (c) | | | 8,800,000 | | | | 8,731,250 | |
4.000%, TBA (c) | | | 4,400,000 | | | | 4,504,844 | |
4.500%, 09/01/43 | | | 383,793 | | | | 407,163 | |
4.500%, 11/01/43 | | | 799,057 | | | | 847,644 | |
4.500%, TBA (c) | | | 3,300,000 | | | | 3,480,340 | |
5.000%, TBA (c) | | | 3,500,000 | | | | 3,774,531 | |
5.500%, 07/01/33 | | | 387,389 | | | | 426,565 | |
5.500%, TBA (c) | | | 200,000 | | | | 218,313 | |
Freddie Mac ARM Non-Gold Pool | | | | | | | | |
3.029%, 02/01/41 (d) | | | 428,309 | | | | 452,549 | |
Freddie Mac Multifamily Mortgage Trust | | | | | | | | |
3.625%, 07/25/46 (144A) (d) | | | 707,000 | | | | 636,190 | |
Freddie Mac Multifamily Structured Pass-Through Certificates | | | | | | | | |
1.512%, 06/25/22 (d) (e) | | | 1,963,961 | | | | 192,777 | |
1.557%, 12/25/18 (d) (e) | | | 3,245,391 | | | | 213,865 | |
1.743%, 03/25/22 (d) (e) | | | 1,515,615 | | | | 164,347 | |
1.783%, 05/25/19 (d) (e) | | | 2,533,662 | | | | 203,909 | |
2.637%, 01/25/23 | | | 1,525,000 | | | | 1,432,175 | |
3.060%, 07/25/23 (d) | | | 70,000 | | | | 67,416 | |
3.300%, 04/25/23 (d) | | | 1,055,000 | | | | 1,038,862 | |
3.458%, 08/25/23 (d) | | | 455,000 | | | | 452,147 | |
Ginnie Mae (CMO) | | | | | | | | |
1.015%, 02/16/53 (d) (e) | | | 3,363,409 | | | | 247,022 | |
Ginnie Mae I 15 Yr. Pool | | | | | | | | |
7.500%, 12/15/14 | | | 16,500 | | | | 16,722 | |
Ginnie Mae I 30 Yr. Pool | | | | | | | | |
3.500%, 02/15/42 | | | 99,176 | | | | 100,304 | |
3.500%, 05/15/42 | | | 99,052 | | | | 100,179 | |
3.500%, 08/15/42 | | | 183,406 | | | | 185,311 | |
3.500%, 11/15/42 | | | 99,162 | | | | 100,271 | |
3.500%, 12/15/42 | | | 295,053 | | | | 298,352 | |
3.500%, 01/15/43 | | | 99,134 | | | | 100,242 | |
3.500%, 02/15/43 | | | 196,776 | | | | 198,981 | |
3.500%, 04/15/43 | | | 198,347 | | | | 200,577 | |
3.500%, 05/15/43 | | | 580,565 | | | | 587,105 | |
See accompanying notes to financial statements.
MSF-8
Metropolitan Series Fund
WMC Balanced Portfolio (formerly, BlackRock Diversified Portfolio)
Schedule of Investments as of December 31, 2013
U.S. Treasury & Government Agencies—(Continued)
| | | | | | | | |
| Security Description | | Principal
Amount* | | | Value | |
|
Agency Sponsored Mortgage-Backed—(Continued) | |
Ginnie Mae I 30 Yr. Pool | | | | | | | | |
3.500%, 06/15/43 | | | 99,204 | | | $ | 100,325 | |
3.500%, 07/15/43 | | | 494,687 | | | | 500,279 | |
4.000%, 09/15/42 | | | 2,336,746 | | | | 2,436,113 | |
4.500%, 02/15/42 | | | 4,376,824 | | | | 4,699,416 | |
4.500%, TBA (c) | | | 2,100,000 | | | | 2,240,602 | |
5.000%, 12/15/38 | | | 153,188 | | | | 166,580 | |
5.000%, 07/15/39 | | | 305,049 | | | | 331,009 | |
5.000%, 12/15/40 | | | 450,635 | | | | 489,571 | |
5.000%, TBA (c) | | | 3,500,000 | | | | 3,793,535 | |
5.500%, TBA (c) | | | 1,500,000 | | | | 1,647,422 | |
9.000%, 11/15/19 | | | 6,666 | | | | 6,698 | |
Ginnie Mae II 30 Yr. Pool | | | | | | | | |
3.000%, TBA (c) | | | 4,600,000 | | | | 4,444,391 | |
3.500%, TBA (c) | | | 7,700,000 | | | | 7,767,676 | |
4.000%, 11/20/43 | | | 8,583,092 | | | | 8,945,190 | |
4.500%, 05/20/41 | | | 4,485,689 | | | | 4,815,100 | |
4.500%, 06/20/41 | | | 431,924 | | | | 463,644 | |
4.500%, 07/20/41 | | | 259,652 | | | | 278,720 | |
5.000%, 10/20/39 | | | 174,701 | | | | 191,313 | |
| | | | | | | | |
| | | | | | | 164,404,078 | |
| | | | | | | | |
| | |
Federal Agencies—0.2% | | | | | | | | |
Farmer Mac Guaranteed Notes Trust | | | | | | | | |
5.125%, 04/19/17 (144A) | | | 400,000 | | | | 452,290 | |
Federal Home Loan Bank | | | | | | | | |
5.500%, 07/15/36 | | | 360,000 | | | | 416,461 | |
Federal National Mortgage Association | | | | | | | | |
5.125%, 01/02/14 | | | 1,205,000 | | | | 1,205,152 | |
Tennessee Valley Authority | | | | | | | | |
5.980%, 04/01/36 | | | 430,000 | | | | 502,692 | |
| | | | | | | | |
| | | | | | | 2,576,595 | |
| | | | | | | | |
| | |
U.S. Treasury—7.0% | | | | | | | | |
U.S. Treasury Bonds | | | | | | | | |
2.750%, 08/15/42 | | | 1,115,000 | | | | 883,463 | |
2.750%, 11/15/42 | | | 55,000 | | | | 43,484 | |
3.750%, 11/15/43 | | | 25,345,000 | | | | 24,497,514 | |
U.S. Treasury Inflation Indexed Bonds | | | | | | | | |
0.750%, 02/15/42 | | | 1,715,876 | | | | 1,379,403 | |
U.S. Treasury Inflation Indexed Notes | | | | | | | | |
0.125%, 01/15/23 | | | 1,001,771 | | | | 946,126 | |
0.375%, 07/15/23 (f) | | | 5,921,476 | | | | 5,710,985 | |
U.S. Treasury Notes | | | | | | | | |
0.250%, 11/30/15 (g) | | | 6,095,000 | | | | 6,082,859 | |
0.500%, 12/15/16 (g) | | | 17,965,000 | | | | 17,892,026 | |
1.000%, 11/30/19 | | | 6,763,000 | | | | 6,354,576 | |
1.250%, 11/30/18 (g) | | | 12,275,500 | | | | 12,012,731 | |
1.500%, 12/31/18 | | | 3,780,000 | | | | 3,737,475 | |
1.625%, 11/15/22 | | | 1,057,100 | | | | 954,198 | |
2.000%, 11/30/20 | | | 5,435,000 | | | | 5,290,635 | |
2.750%, 11/15/23 (g) | | | 9,850,000 | | | | 9,636,068 | |
| | | | | | | | |
| | | | | | | 95,421,543 | |
| | | | | | | | |
Total U.S. Treasury & Government Agencies (Cost $266,614,548) | | | | | | | 262,402,216 | |
| | | | | | | | |
| | | | | | | | |
|
| Corporate Bonds & Notes—8.3% | |
| Security Description | | Principal
Amount* | | | Value | |
| | |
Agriculture—0.1% | | | | | | | | |
Altria Group, Inc. | | | | | | | | |
4.000%, 01/31/24 | | | 286,000 | | | $ | 279,540 | |
Philip Morris International, Inc. | | | | | | | | |
1.875%, 01/15/19 | | | 658,000 | | | | 643,033 | |
4.875%, 11/15/43 | | | 214,000 | | | | 211,995 | |
| | | | | | | | |
| | | | | | | 1,134,568 | |
| | | | | | | | |
| | |
Airlines—0.1% | | | | | | | | |
United Continental Holdings, Inc. | | | | | | | | |
6.000%, 07/15/28 | | | 245,000 | | | | 206,412 | |
8.000%, 07/15/24 | | | 745,000 | | | | 747,235 | |
| | | | | | | | |
| | | | | | | 953,647 | |
| | | | | | | | |
| | |
Auto Manufacturers—0.0% | | | | | | | | |
General Motors Co. | | | | | | | | |
4.875%, 10/02/23 (144A) | | | 280,000 | | | | 283,500 | |
6.250%, 10/02/43 (144A) | | | 170,000 | | | | 176,588 | |
| | | | | | | | |
| | | | | | | 460,088 | |
| | | | | | | | |
|
Banks—1.4% | |
ABN Amro Bank NV | | | | | | | | |
6.375%, 04/27/21 (EUR) | | | 115,000 | | | | 182,804 | |
Bank of America Corp. | | | | | | | | |
2.600%, 01/15/19 | | | 554,000 | | | | 556,445 | |
3.300%, 01/11/23 | | | 1,960,000 | | | | 1,854,683 | |
3.700%, 09/01/15 | | | 1,385,000 | | | | 1,447,756 | |
4.100%, 07/24/23 | | | 1,673,000 | | | | 1,680,099 | |
Bank of New York Mellon Corp. (The) | | | | | | | | |
2.100%, 01/15/19 | | | 865,000 | | | | 857,388 | |
Caixa Economica Federal | | | | | | | | |
2.375%, 11/06/17 (144A) | | | 580,000 | | | | 538,675 | |
Citigroup, Inc. | | | | | | | | |
3.375%, 03/01/23 | | | 480,000 | | | | 456,247 | |
4.450%, 01/10/17 | | | 280,000 | | | | 303,464 | |
Commerzbank AG | | | | | | | | |
6.375%, 03/22/19 (EUR) (a) | | | 300,000 | | | | 456,517 | |
Cooperatieve Centrale Raiffeisen-Boerenleenbank BA | | | | | | | | |
5.750%, 12/01/43 | | | 277,000 | | | | 293,644 | |
Goldman Sachs Group, Inc. (The) | | | | | | | | |
1.838%, 11/29/23 (d) | | | 900,000 | | | | 913,927 | |
3.625%, 02/07/16 | | | 345,000 | | | | 362,071 | |
3.625%, 01/22/23 (a) | | | 575,000 | | | | 556,803 | |
5.750%, 01/24/22 | | | 452,000 | | | | 508,811 | |
HSBC Bank Brasil S.A. - Banco Multiplo | | | | | | | | |
4.000%, 05/11/16 (144A) | | | 1,900,000 | | | | 1,930,875 | |
JPMorgan Chase & Co. | | | | | | | | |
3.200%, 01/25/23 | | | 190,000 | | | | 180,125 | |
3.250%, 09/23/22 | | | 407,000 | | | | 390,037 | |
4.750%, 03/01/15 | | | 695,000 | | | | 727,124 | |
LBI HF | | | | | | | | |
6.100%, 08/25/11 (144A) (h) (i) | | | 320,000 | | | | 28,800 | |
Morgan Stanley | | | | | | | | |
3.450%, 11/02/15 | | | 1,135,000 | | | | 1,181,428 | |
3.800%, 04/29/16 | | | 345,000 | | | | 364,951 | |
5.000%, 11/24/25 | | | 955,000 | | | | 957,855 | |
See accompanying notes to financial statements.
MSF-9
Metropolitan Series Fund
WMC Balanced Portfolio (formerly, BlackRock Diversified Portfolio)
Schedule of Investments as of December 31, 2013
Corporate Bonds & Notes—(Continued)
| | | | | | | | |
| Security Description | | Principal
Amount* | | | Value | |
|
Banks—(Continued) | |
State Street Capital Trust IV | | | | | | | | |
1.243%, 06/01/77 (d) | | | 90,000 | | | $ | 67,995 | |
US Bancorp | | | | | | | | |
1.950%, 11/15/18 | | | 836,000 | | | | 831,516 | |
Wells Fargo & Co. | | | | | | | | |
1.500%, 07/01/15 | | | 345,000 | | | | 349,851 | |
2.150%, 01/15/19 | | | 315,000 | | | | 314,013 | |
5.375%, 11/02/43 | | | 285,000 | | | | 291,842 | |
| | | | | | | | |
| | | | | | | 18,585,746 | |
| | | | | | | | |
|
Beverages—0.0% | |
PepsiCo, Inc. | | | | | | | | |
3.600%, 08/13/42 | | | 445,000 | | | | 366,283 | |
| | | | | | | | |
|
Biotechnology—0.2% | |
Amgen, Inc. | | | | | | | | |
5.150%, 11/15/41 | | | 260,000 | | | | 259,034 | |
5.650%, 06/15/42 | | | 465,000 | | | | 492,452 | |
Life Technologies Corp. | | | | | | | | |
6.000%, 03/01/20 | | | 1,125,000 | | | | 1,292,649 | |
| | | | | | | | |
| | | | | | | 2,044,135 | |
| | | | | | | | |
|
Chemicals—0.2% | |
LYB International Finance BV | | | | | | | | |
5.250%, 07/15/43 | | | 6,000 | | | | 6,031 | |
LyondellBasell Industries NV | | | | | | | | |
5.000%, 04/15/19 | | | 2,188,000 | | | | 2,430,039 | |
| | | | | | | | |
| | | | | | | 2,436,070 | |
| | | | | | | | |
|
Coal—0.0% | |
CONSOL Energy, Inc. | | | | | | | | |
8.250%, 04/01/20 | | | 93,000 | | | | 100,673 | |
Peabody Energy Corp. | | | | | | | | |
6.000%, 11/15/18 | | | 82,000 | | | | 87,330 | |
6.250%, 11/15/21 (a) | | | 483,000 | | | | 487,830 | |
| | | | | | | | |
| | | | | | | 675,833 | |
| | | | | | | | |
|
Commercial Services—0.1% | |
United Rentals North America, Inc. | | | | | | | | |
7.625%, 04/15/22 | | | 1,098,000 | | | | 1,220,152 | |
| | | | | | | | |
|
Computers—0.0% | |
International Business Machines Corp. | | | | | | | | |
3.375%, 08/01/23 | | | 600,000 | | | | 584,582 | |
| | | | | | | | |
|
Diversified Financial Services—0.3% | |
Discover Financial Services | | | | | | | | |
3.850%, 11/21/22 | | | 800,000 | | | | 758,536 | |
Ford Motor Credit Co. LLC | | | | | | | | |
4.375%, 08/06/23 | | | 233,000 | | | | 234,249 | |
5.000%, 05/15/18 | | | 1,438,000 | | | | 1,601,801 | |
Lehman Brothers Holdings Capital Trust VII | | | | | | | | |
5.857%, 01/31/14 (h) | | | 325,000 | | | | 32 | |
Lehman Brothers Holdings, Inc. | | | | | | | | |
6.500%, 07/19/17 (h) | | | 1,770,000 | | | | 177 | |
6.750%, 12/28/17 (h) | | | 2,505,000 | | | | 250 | |
|
Diversified Financial Services—(Continued) | |
Novus USA Trust | | | | | | | | |
1.538%, 02/28/14 (144A) (d) | | | 960,000 | | | | 961,197 | |
| | | | | | | | |
| | | | | | | 3,556,242 | |
| | | | | | | | |
|
Electric—0.5% | |
Cleveland Electric Illuminating Co. (The) | | | | | | | | |
5.950%, 12/15/36 | | | 328,000 | | | | 333,982 | |
8.875%, 11/15/18 | | | 181,000 | | | | 228,937 | |
Dominion Gas Holdings LLC | | | | | | | | |
4.800%, 11/01/43 (144A) | | | 57,000 | | | | 55,110 | |
Dominion Resources, Inc. | | | | | | | | |
1.950%, 08/15/16 | | | 880,000 | | | | 894,561 | |
Duke Energy Carolinas LLC | | | | | | | | |
4.250%, 12/15/41 | | | 515,000 | | | | 479,527 | |
Energy Future Intermediate Holding Co. LLC / EFIH Finance, Inc. | | | | | | | | |
10.000%, 12/01/20 | | | 2,590,000 | | | | 2,751,875 | |
Georgia Power Co. | | | | | | | | |
3.000%, 04/15/16 | | | 1,095,000 | | | | 1,141,409 | |
Jersey Central Power & Light Co. | | | | | | | | |
7.350%, 02/01/19 | | | 330,000 | | | | 389,699 | |
MidAmerican Energy Holdings Co. | | | | | | | | |
6.500%, 09/15/37 | | | 725,000 | | | | 842,117 | |
| | | | | | | | |
| | | | | | | 7,117,217 | |
| | | | | | | | |
|
Electronics—0.1% | |
Thermo Fisher Scientific, Inc.
2.400%, 02/01/19 | | | 764,000 | | | | 756,888 | |
5.300%, 02/01/44 | | | 58,000 | | | | 58,648 | |
| | | | | | | | |
| | | | | | | 815,536 | |
| | | | | | | | |
|
Engineering & Construction—0.0% | |
Odebrecht Offshore Drilling Finance, Ltd.
6.750%, 10/01/22 (144A) | | | 369,225 | | | | 377,902 | |
| | | | | | | | |
|
Entertainment—0.0% | |
GLP Capital L.P. / GLP Financing II, Inc.
4.375%, 11/01/18 (144A) | | | 31,000 | | | | 31,698 | |
4.875%, 11/01/20 (144A) | | | 50,000 | | | | 50,000 | |
| | | | | | | | |
| | | | | | | 81,698 | |
| | | | | | | | |
|
Food—0.1% | |
WM Wrigley Jr. Co.
2.900%, 10/21/19 (144A) | | | 700,000 | | | | 694,213 | |
| | | | | | | | |
|
Forest Products & Paper—0.1% | |
International Paper Co.
4.750%, 02/15/22 | | | 1,794,000 | | | | 1,880,867 | |
| | | | | | | | |
|
Healthcare - Products—0.1% | |
Boston Scientific Corp.
2.650%, 10/01/18 | | | 966,000 | | | | 972,572 | |
Edwards Lifesciences Corp.
2.875%, 10/15/18 | | | 738,000 | | | | 733,693 | |
| | | | | | | | |
| | | | | | | 1,706,265 | |
| | | | | | | | |
See accompanying notes to financial statements.
MSF-10
Metropolitan Series Fund
WMC Balanced Portfolio (formerly, BlackRock Diversified Portfolio)
Schedule of Investments as of December 31, 2013
Corporate Bonds & Notes—(Continued)
| | | | | | | | |
| Security Description | | Principal
Amount* | | | Value | |
|
Healthcare - Services—0.2% | |
Coventry Health Care, Inc.
5.450%, 06/15/21 | | | 569,000 | | | $ | 633,084 | |
HCA, Inc.
7.250%, 09/15/20 | | | 520,000 | | | | 566,800 | |
Tenet Healthcare Corp.
6.250%, 11/01/18 | | | 690,000 | | | | 764,175 | |
UnitedHealth Group, Inc.
3.375%, 11/15/21 | | | 230,000 | | | | 227,162 | |
WellPoint, Inc.
1.875%, 01/15/18 | | | 650,000 | | | | 642,727 | |
2.300%, 07/15/18 | | | 492,000 | | | | 488,095 | |
| | | | | | | | |
| | | | | | | 3,322,043 | |
| | | | | | | | |
|
Household Products/Wares—0.1% | |
Reynolds Group Issuer, Inc. / Reynolds Group Issuer LLC / Reynolds Group Issuer Lu
6.875%, 02/15/21 | | | 625,000 | | | | 673,437 | |
7.875%, 08/15/19 | | | 715,000 | | | | 790,075 | |
| | | | | | | | |
| | | | | | | 1,463,512 | |
| | | | | | | | |
|
Insurance—0.6% | |
American International Group, Inc.
3.375%, 08/15/20 | | | 820,000 | | | | 824,769 | |
3.800%, 03/22/17 | | | 1,170,000 | | | | 1,249,442 | |
4.125%, 02/15/24 | | | 471,000 | | | | 468,270 | |
5.450%, 05/18/17 | | | 505,000 | | | | 564,449 | |
8.175%, 05/15/68 (d) | | | 360,000 | | | | 435,600 | |
Manulife Financial Corp.
3.400%, 09/17/15 | | | 960,000 | | | | 999,292 | |
Muenchener Rueckversicherungs AG
6.000%, 05/26/41 (EUR) (d) | | | 100,000 | | | | 159,117 | |
Prudential Financial, Inc.
4.750%, 09/17/15 | | | 877,000 | | | | 934,568 | |
5.375%, 06/21/20 | | | 770,000 | | | | 870,187 | |
5.875%, 09/15/42 (a) (d) | | | 346,000 | | | | 351,622 | |
XL Group plc
6.500%, 04/15/17 (d) | | | 1,005,000 | | | | 988,669 | |
XLIT, Ltd.
2.300%, 12/15/18 | | | 219,000 | | | | 215,099 | |
5.250%, 12/15/43 | | | 100,000 | | | | 100,670 | |
| | | | | | | | |
| | | | | | | 8,161,754 | |
| | | | | | | | |
| | |
Leisure Time—0.0% | | | | | | | | |
Carnival Corp.
3.950%, 10/15/20 | | | 128,000 | | | | 128,099 | |
| | | | | | | | |
| | |
Lodging—0.1% | | | | | | | | |
Paris Las Vegas Holding LLC
8.000%, 10/01/20 (144A) (a) | | | 536,000 | | | | 557,440 | |
11.000%, 10/01/21 (144A) (a) | | | 596,000 | | | | 610,900 | |
| | | | | | | | |
| | | | | | | 1,168,340 | |
| | | | | | | | |
| | |
Media—0.9% | | | | | | | | |
CBS Corp.
4.625%, 05/15/18 | | | 205,000 | | | | 222,236 | |
5.750%, 04/15/20 | | | 160,000 | | | | 179,604 | |
8.875%, 05/15/19 | | | 350,000 | | | | 447,485 | |
Comcast Corp.
4.650%, 07/15/42 | | | 642,000 | | | | 597,448 | |
5.875%, 02/15/18 | | | 195,000 | | | | 223,664 | |
COX Communications, Inc.
4.700%, 12/15/42 (144A) | | | 32,000 | | | | 26,874 | |
8.375%, 03/01/39 (144A) | | | 1,510,000 | | | | 1,831,289 | |
DIRECTV Holdings LLC / DIRECTV Financing Co., Inc.
3.800%, 03/15/22 | | | 265,000 | | | | 254,569 | |
5.000%, 03/01/21 | | | 610,000 | | | | 640,810 | |
5.150%, 03/15/42 | | | 525,000 | | | | 471,504 | |
NBCUniversal Enterprise, Inc.
5.250%, 12/19/49 (144A) | | | 500,000 | | | | 495,000 | |
NBCUniversal Media LLC
4.375%, 04/01/21 | | | 1,020,000 | | | | 1,079,590 | |
4.450%, 01/15/43 | | | 431,000 | | | | 386,100 | |
5.150%, 04/30/20 | | | 886,000 | | | | 990,323 | |
TCI Communications, Inc.
7.875%, 02/15/26 | | | 1,079,000 | | | | 1,397,824 | |
Time Warner Cable, Inc.
8.250%, 04/01/19 | | | 1,683,000 | | | | 1,971,643 | |
8.750%, 02/14/19 | | | 697,000 | | | | 831,411 | |
| | | | | | | | |
| | | | | | | 12,047,374 | |
| | | | | | | | |
| | |
Mining—0.2% | | | | | | | | |
BHP Billiton Finance USA, Ltd.
3.850%, 09/30/23 | | | 639,000 | | | | 641,772 | |
5.000%, 09/30/43 | | | 251,000 | | | | 255,202 | |
Novelis, Inc. | | | | | | | | |
8.750%, 12/15/20 | | | 1,095,000 | | | | 1,218,187 | |
| | | | | | | | |
| | | | | | | 2,115,161 | |
| | | | | | | | |
|
Oil & Gas—1.2% | |
Apache Corp. | | | | | | | | |
4.250%, 01/15/44 | | | 285,000 | | | | 256,234 | |
4.750%, 04/15/43 | | | 165,000 | | | | 160,041 | |
BP Capital Markets plc | | | | | | | | |
2.750%, 05/10/23 | | | 645,000 | | | | 588,947 | |
Laredo Petroleum, Inc. | | | | | | | | |
7.375%, 05/01/22 | | | 440,000 | | | | 477,400 | |
Linn Energy LLC / Linn Energy Finance Corp. | | | | | | | | |
7.000%, 11/01/19 (144A) | | | 532,000 | | | | 537,320 | |
MEG Energy Corp. | | | | | | | | |
6.500%, 03/15/21 (144A) | | | 1,495,000 | | | | 1,573,487 | |
Murphy Oil Corp. | | | | | | | | |
2.500%, 12/01/17 | | | 708,000 | | | | 712,305 | |
3.700%, 12/01/22 | | | 373,000 | | | | 344,654 | |
Nexen, Inc. | | | | | | | | |
5.875%, 03/10/35 | | | 30,000 | | | | 32,039 | |
See accompanying notes to financial statements.
MSF-11
Metropolitan Series Fund
WMC Balanced Portfolio (formerly, BlackRock Diversified Portfolio)
Schedule of Investments as of December 31, 2013
Corporate Bonds & Notes—(Continued)
| | | | | | | | |
| Security Description | | Principal
Amount* | | | Value | |
|
Oil & Gas—(Continued) | |
Noble Energy, Inc. | | | | | | | | |
4.150%, 12/15/21 | | | 350,000 | | | $ | 359,887 | |
5.250%, 11/15/43 | | | 465,000 | | | | 464,620 | |
6.000%, 03/01/41 | | | 400,000 | | | | 427,710 | |
8.250%, 03/01/19 | | | 340,000 | | | | 422,602 | |
Noble Holding International, Ltd. | | | | | | | | |
5.250%, 03/15/42 | | | 155,000 | | | | 148,720 | |
Petrobras International Finance Co. | | | | | | | | |
3.875%, 01/27/16 | | | 1,835,000 | | | | 1,889,063 | |
Range Resources Corp. | | | | | | | | |
5.750%, 06/01/21 | | | 20,000 | | | | 21,200 | |
Shell International Finance BV | | | | | | | | |
2.000%, 11/15/18 | | | 763,000 | | | | 763,481 | |
4.550%, 08/12/43 | | | 659,000 | | | | 642,751 | |
Statoil ASA | | | | | | | | |
2.900%, 11/08/20 | | | 870,000 | | | | 864,308 | |
Total Capital International S.A. | | | | | | | | |
3.700%, 01/15/24 | | | 665,000 | | | | 657,535 | |
Transocean, Inc. | | | | | | | | |
2.500%, 10/15/17 | | | 1,130,000 | | | | 1,141,971 | |
5.050%, 12/15/16 | | | 800,000 | | | | 883,737 | |
6.000%, 03/15/18 | | | 1,734,000 | | | | 1,944,587 | |
6.500%, 11/15/20 | | | 490,000 | | | | 559,551 | |
6.800%, 03/15/38 | | | 285,000 | | | | 317,209 | |
| | | | | | | | |
| | | | | | | 16,191,359 | |
| | | | | | | | |
|
Oil & Gas Services—0.0% | |
Schlumberger Investment S.A. | | | | | | | | |
3.650%, 12/01/23 | | | 280,000 | | | | 277,562 | |
| | | | | | | | |
|
Packaging & Containers—0.0% | |
Rock Tenn Co. | | | | | | | | |
4.000%, 03/01/23 | | | 214,000 | | | | 204,389 | |
| | | | | | | | |
|
Pharmaceuticals—0.1% | |
AbbVie, Inc. | | | | | | | | |
4.400%, 11/06/42 | | | 520,000 | | | | 484,991 | |
Actavis, Inc. | | | | | | | | |
4.625%, 10/01/42 | | | 520,000 | | | | 473,096 | |
Bristol-Myers Squibb Co. | | | | | | | | |
4.500%, 03/01/44 | | | 570,000 | | | | 545,969 | |
Teva Pharmaceutical Finance Co. B.V. | | | | | | | | |
3.650%, 11/10/21 | | | 290,000 | | | | 284,438 | |
| | | | | | | | |
| | | | | | | 1,788,494 | |
| | | | | | | | |
|
Pipelines—0.4% | |
Energy Transfer Partners L.P. | | | | | | | | |
4.150%, 10/01/20 | | | 1,200,000 | | | | 1,217,497 | |
Enterprise Products Operating LLC | | | | | | | | |
4.450%, 02/15/43 | | | 335,000 | | | | 295,911 | |
Kinder Morgan Energy Partners L.P. | | | | | | | | |
4.150%, 02/01/24 | | | 1,045,000 | | | | 1,011,007 | |
TransCanada PipeLines, Ltd. | | | | | | | | |
3.750%, 10/16/23 | | | 340,000 | | | | 331,384 | |
|
Pipelines—(Continued) | |
Western Gas Partners L.P. | | | | | | | | |
4.000%, 07/01/22 | | | 385,000 | | | | 367,452 | |
5.375%, 06/01/21 | | | 668,000 | | | | 715,628 | |
Williams Cos., Inc. (The) | | | | | | | | |
3.700%, 01/15/23 | | | 1,090,000 | | | | 951,361 | |
7.875%, 09/01/21 | | | 256,000 | | | | 295,196 | |
| | | | | | | | |
| | | | | | | 5,185,436 | |
| | | | | | | | |
|
Real Estate—0.1% | |
Realogy Group LLC | | | | | | | | |
7.875%, 02/15/19 (144A) | | | 847,000 | | | | 929,583 | |
| | | | | | | | |
|
Real Estate Investment Trusts—0.0% | |
Ventas Realty L.P. / Ventas Capital Corp. | | | | | | | | |
2.700%, 04/01/20 | | | 177,000 | | | | 169,248 | |
| | | | | | | | |
| | |
Retail—0.1% | | | | | | | | |
CVS Caremark Corp. | | | | | | | | |
5.300%, 12/05/43 | | | 106,000 | | | | 109,621 | |
QVC, Inc. | | | | | | | | |
7.500%, 10/01/19 (144A) | | | 590,000 | | | | 635,930 | |
Wal-Mart Stores, Inc. | | | | | | | | |
4.000%, 04/11/43 | | | 395,000 | | | | 351,543 | |
| | | | | | | | |
| | | | | | | 1,097,094 | |
| | | | | | | | |
| | |
Software—0.0% | | | | | | | | |
First Data Corp. | | | | | | | | |
7.375%, 06/15/19 (144A) | | | 280,000 | | | | 298,900 | |
Oracle Corp. | | | | | | | | |
3.625%, 07/15/23 | | | 38,000 | | | | 37,695 | |
| | | | | | | | |
| | | | | | | 336,595 | |
| | | | | | | | |
| | |
Telecommunications—1.0% | | | | | | | | |
America Movil S.A.B. de C.V. | | | | | | | | |
2.375%, 09/08/16 | | | 1,140,000 | | | | 1,173,254 | |
AT&T, Inc. | | | | | | | | |
2.375%, 11/27/18 | | | 440,000 | | | | 440,378 | |
CC Holdings GS V LLC / Crown Castle GS III Corp. | | | | | | | | |
3.849%, 04/15/23 | | | 489,000 | | | | 457,754 | |
Intelsat Jackson Holdings S.A. | | | | | | | | |
7.250%, 04/01/19 | | | 611,000 | | | | 659,880 | |
Level 3 Financing, Inc. | | | | | | | | |
8.125%, 07/01/19 | | | 581,000 | | | | 636,195 | |
MetroPCS Wireless, Inc. | | | | | | | | |
7.875%, 09/01/18 (a) | | | 42,000 | | | | 45,098 | |
Sprint Communications, Inc. | | | | | | | | |
9.000%, 11/15/18 (144A) | | | 1,470,000 | | | | 1,771,350 | |
Sprint Corp. | | | | | | | | |
7.875%, 09/15/23 (144A) | | | 425,000 | | | | 456,875 | |
T-Mobile USA, Inc. | | | | | | | | |
6.464%, 04/28/19 | | | 50,000 | | | | 53,125 | |
6.633%, 04/28/21 | | | 160,000 | | | | 168,400 | |
6.731%, 04/28/22 | | | 150,000 | | | | 156,375 | |
6.836%, 04/28/23 | | | 50,000 | | | | 51,875 | |
See accompanying notes to financial statements.
MSF-12
Metropolitan Series Fund
WMC Balanced Portfolio (formerly, BlackRock Diversified Portfolio)
Schedule of Investments as of December 31, 2013
Corporate Bonds & Notes—(Continued)
| | | | | | | | |
| Security Description | | Principal
Amount* | | | Value | |
| | |
Telecommunications—(Continued) | | | | | | | | |
Verizon Communications, Inc. | | | | | | | | |
3.650%, 09/14/18 | | | 1,725,000 | | | $ | 1,826,023 | |
3.850%, 11/01/42 | | | 2,152,000 | | | | 1,757,762 | |
4.500%, 09/15/20 | | | 380,000 | | | | 406,815 | |
5.150%, 09/15/23 | | | 814,000 | | | | 873,985 | |
6.550%, 09/15/43 | | | 2,486,000 | | | | 2,908,518 | |
| | | | | | | | |
| | | | | | | 13,843,662 | |
| | | | | | | | |
|
Transportation—0.0% | |
Burlington Northern Santa Fe LLC | | | | | | | | |
3.000%, 03/15/23 | | | 152,000 | | | | 141,552 | |
| | | | | | | | |
Total Corporate Bonds & Notes
(Cost $116,781,918) | | | | | | | 113,262,301 | |
| | | | | | | | |
|
| Asset-Backed Securities—6.8% | |
|
Asset-Backed - Automobile—2.1% | |
AmeriCredit Automobile Receivables Trust | | | | | | | | |
1.310%, 11/08/17 | | | 265,000 | | | | 265,830 | |
1.520%, 01/08/19 | | | 185,000 | | | | 184,353 | |
1.660%, 09/10/18 | | | 170,000 | | | | 170,589 | |
1.690%, 11/08/18 | | | 325,000 | | | | 324,484 | |
1.930%, 08/08/18 | | | 415,000 | | | | 417,897 | |
2.290%, 11/08/19 | | | 100,000 | | | | 100,003 | |
2.420%, 05/08/18 | | | 440,000 | | | | 447,836 | |
2.640%, 10/10/17 | | | 430,000 | | | | 442,186 | |
2.720%, 09/09/19 | | | 100,000 | | | | 101,174 | |
3.310%, 10/08/19 | | | 245,000 | | | | 248,436 | |
3.440%, 10/08/17 | | | 565,000 | | | | 584,900 | |
AUTO ABS SRL | | | | | | | | |
2.800%, 04/27/25 (EUR) | | | 488,179 | | | | 676,820 | |
Chesapeake Funding LLC | | | | | | | | |
1.768%, 11/07/23 (144A) (d) | | | 390,000 | | | | 391,515 | |
2.168%, 11/07/23 (144A) (d) | | | 255,000 | | | | 255,988 | |
Chrysler Capital Auto Receivables Trust | | | | | | | | |
0.560%, 12/15/16 (144A) | | | 605,000 | | | | 604,999 | |
0.850%, 05/15/18 (144A) | | | 530,000 | | | | 529,950 | |
1.270%, 03/15/19 (144A) | | | 365,000 | | | | 365,005 | |
1.780%, 06/17/19 (144A) | | | 165,000 | | | | 164,979 | |
2.240%, 09/16/19 (144A) | | | 175,000 | | | | 174,949 | |
2.890%, 10/15/20 (144A) | | | 170,000 | | | | 169,945 | |
Credit Acceptance Auto Loan Trust | | | | | | | | |
1.210%, 10/15/20 (144A) | | | 340,000 | | | | 340,236 | |
1.500%, 04/15/21 (144A) | | | 330,000 | | | | 329,921 | |
DT Auto Owner Trust | | | | | | | | |
2.260%, 10/16/17 (144A) | | | 117,029 | | | | 117,111 | |
3.380%, 10/16/17 (144A) | | | 280,000 | | | | 281,504 | |
4.030%, 02/15/17 (144A) | | | 130,897 | | | | 131,055 | |
4.940%, 07/16/18 (144A) | | | 565,000 | | | | 582,805 | |
Hyundai Auto Receivables Trust | | | | | | | | |
2.610%, 05/15/18 | | | 360,000 | | | | 369,535 | |
Prestige Auto Receivables Trust | | | | | | | | |
1.090%, 02/15/18 (144A) | | | 519,746 | | | | 521,098 | |
1.330%, 05/15/19 (144A) | | | 330,000 | | | | 329,487 | |
|
Asset-Backed - Automobile—(Continued) | |
Santander Drive Auto Receivables Trust | | | | | | | | |
1.190%, 05/15/18 | | | 1,090,000 | | | | 1,085,170 | |
1.210%, 10/16/17 (144A) | | | 1,260,000 | | | | 1,261,197 | |
1.330%, 05/15/17 | | | 510,000 | | | | 511,450 | |
1.330%, 03/15/18 | | | 1,210,000 | | | | 1,213,023 | |
1.480%, 05/15/17 (144A) | | | 142,324 | | | | 142,395 | |
1.550%, 10/15/18 | | | 1,410,000 | | | | 1,407,713 | |
1.560%, 08/15/18 | | | 730,000 | | | | 734,949 | |
1.780%, 11/15/18 (144A) | | | 2,360,000 | | | | 2,353,649 | |
1.890%, 10/15/19 (144A) | | | 775,000 | | | | 780,022 | |
1.940%, 12/15/16 | | | 1,115,000 | | | | 1,125,257 | |
1.940%, 03/15/18 | | | 535,000 | | | | 539,289 | |
2.160%, 01/15/20 | | | 610,000 | | | | 618,825 | |
2.250%, 06/17/19 | | | 665,000 | | | | 662,726 | |
2.700%, 08/15/18 | | | 350,000 | | | | 359,525 | |
2.720%, 05/16/16 | | | 330,000 | | | | 333,663 | |
2.940%, 12/15/17 | | | 520,000 | | | | 535,161 | |
3.010%, 04/16/18 | | | 1,520,000 | | | | 1,564,249 | |
3.120%, 10/15/19 (144A) | | | 300,000 | | | | 307,683 | |
3.200%, 02/15/18 | | | 1,175,000 | | | | 1,207,609 | |
3.250%, 01/15/20 | | | 510,000 | | | | 523,936 | |
3.780%, 11/15/17 | | | 445,000 | | | | 460,093 | |
3.780%, 10/15/19 (144A) | | | 195,000 | | | | 201,024 | |
4.670%, 01/15/20 (144A) | | | 1,085,000 | | | | 1,114,022 | |
| | | | | | | | |
| | | | | | | 28,667,220 | |
| | | | | | | | |
|
Asset-Backed - Credit Card—0.3% | |
CHLUPA Trust | | | | | | | | |
3.326%, 08/15/20 (144A) | | | 885,799 | | | | 886,906 | |
World Financial Network Credit Card Master Trust | | | | | | | | |
2.150%, 04/17/23 | | | 1,570,000 | | | | 1,527,853 | |
2.230%, 08/15/22 | | | 1,270,000 | | | | 1,258,616 | |
| | | | | | | | |
| | | | | | | 3,673,375 | |
| | | | | | | | |
|
Asset-Backed - Home Equity—0.0% | |
Morgan Stanley Home Equity Loan Trust | | | | | | | | |
0.485%, 09/25/35 (d) | | | 279,953 | | | | 270,178 | |
RASC Trust | | | | | | | | |
6.349%, 03/25/32 | | | 82,399 | | | | 81,342 | |
| | | | | | | | |
| | | | | | | 351,520 | |
| | | | | | | | |
|
Asset-Backed - Other—2.5% | |
Battalion CLO, Ltd. | | | | | | | | |
1.689%, 10/22/25 (144A) (d) | | | 615,000 | | | | 610,809 | |
Benefit Street Partners CLO II, Ltd. | | | | | | | | |
1.472%, 07/15/24 (144A) (d) | | | 320,000 | | | | 316,374 | |
Carlyle Global Market Strategies, Ltd. | | | | | | | | |
1.632%, 01/20/25 (144A) (d) | | | 1,935,000 | | | | 1,933,382 | |
Cavalary CLO II | | | | | | | | |
2.244%, 01/17/24 (144A) (d) | | | 990,000 | | | | 971,743 | |
Cent CLO 19, Ltd. | | | | | | | | |
1.567%, 10/29/25 (144A) (d) | | | 670,000 | | | | 663,959 | |
Chase Funding Trust | | | | | | | | |
6.333%, 04/25/32 | | | 187,494 | | | | 191,486 | |
See accompanying notes to financial statements.
MSF-13
Metropolitan Series Fund
WMC Balanced Portfolio (formerly, BlackRock Diversified Portfolio)
Schedule of Investments as of December 31, 2013
Asset-Backed Securities—(Continued)
| | | | | | | | |
| Security Description | | Principal
Amount* | | | Value | |
|
Asset-Backed - Other—(Continued) | |
Countrywide Asset-Backed Certificates | | | | | | | | |
0.615%, 03/25/47 (144A) (d) | | | 327,352 | | | $ | 177,002 | |
1.170%, 07/25/34 (d) | | | 146,847 | | | | 139,252 | |
5.071%, 04/25/35 (d) | | | 546,757 | | | | 444,974 | |
CT CDO IV, Ltd.
0.477%, 10/20/43 (144A) (d) | | | 542,059 | | | | 513,954 | |
Finance America Mortgage Loan Trust
1.215%, 09/25/33 (d) | | | 138,177 | | | | 129,536 | |
Ford Credit Floorplan Master Owner Trust
1.667%, 01/15/16 (d) | | | 345,000 | | | | 345,145 | |
2.090%, 09/15/16 | | | 535,000 | | | | 538,151 | |
2.267%, 01/15/16 (d) | | | 580,000 | | | | 580,289 | |
2.860%, 01/15/19 | | | 139,000 | | | | 142,573 | |
3.500%, 01/15/19 | | | 265,000 | | | | 274,835 | |
Fremont Home Loan Trust
1.215%, 12/25/33 (d) | | | 136,050 | | | | 128,045 | |
GMACM Home Equity Loan Trust
0.405%, 10/25/34 (144A) (d) | | | 224,944 | | | | 197,995 | |
GreenPoint Mortgage Funding Trust
0.765%, 09/25/34 (d) | | | 454 | | | | 454 | |
GT Loan Financing I, Ltd.
1.472%, 10/28/24 (144A) (d) | | | 680,000 | | | | 673,466 | |
HLSS Servicer Advance Receivables Backed Notes
1.183%, 08/15/44 (144A) | | | 995,000 | | | | 993,806 | |
1.287%, 09/15/44 (144A) | | | 740,000 | | | | 739,556 | |
1.495%, 05/16/44 (144A) | | | 140,000 | | | | 139,482 | |
1.495%, 01/16/46 (144A) | | | 1,580,000 | | | | 1,574,154 | |
1.793%, 05/15/46 (144A) | | | 2,210,000 | | | | 2,162,264 | |
1.979%, 08/15/46 (144A) | | | 385,000 | | | | 385,192 | |
1.990%, 10/15/45 (144A) | | | 440,000 | | | | 442,904 | |
ING Investment Management Co.
1.686%, 01/18/26 (144A) (d) | | | 780,000 | | | | 780,000 | |
1.774%, 10/15/22 (144A) (d) | | | 435,000 | | | | 435,038 | |
JG Wentworth XX LLC
5.560%, 07/15/59 (144A) | | | 1,404,896 | | | | 1,567,350 | |
JG Wentworth XXI LLC
4.070%, 01/15/48 (144A) | | | 343,804 | | | | 361,459 | |
JG Wentworth XXII LLC
3.820%, 12/15/48 (144A) | | | 448,141 | | | | 466,085 | |
KKR Financial CLO, Corp.
0.994%, 10/15/17 (144A) (d) | | | 864,813 | | | | 861,353 | |
KKR Financial CLO, Ltd.
1.394%, 07/15/25 (144A) (d) | | | 565,000 | | | | 554,060 | |
Knollwood CDO, Ltd.
3.443%, 01/10/39 (144A) (d) (i) | | | 538,940 | | | | 5 | |
Long Beach Mortgage Loan Trust
1.815%, 02/25/34 (d) | | | 166,235 | | | | 148,093 | |
Nationstar Mortgage Advance Receivable Trust
1.080%, 06/20/44 (144A) | | | 1,240,000 | | | | 1,239,213 | |
1.679%, 06/20/46 (144A) | | | 1,765,000 | | | | 1,762,318 | |
Northwoods Capital Corp. / Northwoods Capital, Ltd.
1.666%, 01/18/24 (144A) (d) | | | 615,000 | | | | 613,935 | |
2.496%, 01/18/24 (144A) (d) | | | 580,000 | | | | 580,898 | |
|
Asset-Backed - Other—(Continued) | |
Octagon Investment Partners XVI, Ltd.
1.392%, 07/17/25 (144A) (d) | | | 720,000 | | | | 708,894 | |
OHA Loan Funding, Ltd.
1.680%, 08/23/24 (144A) (d) | | | 695,000 | | | | 689,055 | |
OZLM Funding IV, Ltd.
1.739%, 07/22/25 (144A) (d) | | | 1,205,000 | | | | 1,182,922 | |
OZLM Funding, Ltd.
1.716%, 10/30/23 (144A) (d) | | | 1,070,000 | | | | 1,067,359 | |
PFS Financing Corp.
1.367%, 02/15/16 (144A) (d) | | | 800,000 | | | | 800,525 | |
Sound Point CLO, Ltd.
1.653%, 01/21/26 (144A) (d) | | | 260,000 | | | | 260,000 | |
SpringCastle America Funding LLC
3.750%, 04/03/21 (144A) | | | 1,935,717 | | | | 1,939,355 | |
Structured Asset Securities Corp. Mortgage Loan Trust
0.415%, 11/25/37 (d) | | | 56,728 | | | | 54,981 | |
Vibrant CLO, Ltd.
1.724%, 07/17/24 (144A) (d) | | | 1,920,000 | | | | 1,911,166 | |
2.644%, 07/17/24 (144A) (d) | | | 500,000 | | | | 501,851 | |
| | | | | | | | |
| | | | | | | 33,896,697 | |
| | | | | | | | |
|
Asset-Backed - Student Loan—1.9% | |
Nelnet Student Loan Trust
0.348%, 08/23/27 (d) | | | 695,000 | | | | 678,453 | |
1.888%, 11/25/24 (d) | | | 796,000 | | | | 827,032 | |
Scholar Funding Trust
1.138%, 10/28/43 (144A) (d) | | | 467,856 | | | | 468,362 | |
SLC Private Student Loan Trust
0.414%, 07/15/36 (d) | | | 1,290,000 | | | | 1,272,228 | |
SLM Private Credit Student Loan Trust
0.423%, 03/15/23 (d) | | | 416,416 | | | | 407,300 | |
0.443%, 06/15/21 (d) | | | 894,178 | | | | 883,618 | |
0.793%, 12/16/30 (d) | | | 599,706 | | | | 584,600 | |
SLM Private Education Loan Trust
0.767%, 08/15/22 (144A) (d) | | | 295,243 | | | | 294,793 | |
0.817%, 07/15/22 (144A) (d) | | | 606,205 | | | | 605,902 | |
0.917%, 10/16/23 (144A) (d) | | | 585,592 | | | | 585,961 | |
1.017%, 02/15/22 (144A) (d) | | | 1,054,030 | | | | 1,056,932 | |
1.217%, 05/17/27 (144A) (d) | | | 1,550,000 | | | | 1,528,751 | |
1.267%, 08/15/23 (144A) (d) | | | 614,247 | | | | 617,722 | |
1.567%, 08/15/25 (144A) (d) | | | 305,532 | | | | 308,467 | |
1.567%, 10/15/31 (144A) (d) | | | 440,000 | | | | 440,953 | |
1.770%, 05/17/27 (144A) | | | 2,305,000 | | | | 2,235,730 | |
1.850%, 06/17/30 (144A) | | | 2,885,000 | | | | 2,782,222 | |
2.090%, 06/15/45 (144A) | | | 530,000 | | | | 522,454 | |
2.940%, 10/15/31 (144A) | | | 830,000 | | | | 838,747 | |
2.950%, 02/15/46 (144A) | | | 1,965,000 | | | | 2,004,406 | |
3.310%, 10/15/46 (144A) | | | 1,550,000 | | | | 1,602,878 | |
3.480%, 10/15/30 (144A) | | | 110,000 | | | | 114,894 | |
3.740%, 02/15/29 (144A) | | | 200,000 | | | | 208,598 | |
3.830%, 01/17/45 (144A) | | | 445,000 | | | | 461,737 | |
4.540%, 10/17/44 (144A) | | | 610,000 | | | | 655,261 | |
SLM Student Loan Trust
0.819%, 06/26/28 (d) | | | 1,105,000 | | | | 1,105,027 | |
See accompanying notes to financial statements.
MSF-14
Metropolitan Series Fund
WMC Balanced Portfolio (formerly, BlackRock Diversified Portfolio)
Schedule of Investments as of December 31, 2013
Asset-Backed Securities—(Continued)
| | | | | | | | |
| Security Description | | Principal
Amount* | | | Value | |
|
Asset-Backed - Student Loan—(Continued) | |
SLM Student Loan Trust
0.993%, 12/15/25 (144A) (d) | | | 1,105,000 | | | $ | 1,095,748 | |
1.938%, 07/25/23 (d) | | | 1,100,000 | | | | 1,149,901 | |
| | | | | | | | |
| | | | | | | 25,338,677 | |
| | | | | | | | |
Total Asset-Backed Securities
(Cost $92,186,012) | | | | | | | 91,927,489 | |
| | | | | | | | |
|
| Mortgage-Backed Securities—4.8% | |
|
Collateralized Mortgage Obligations—0.7% | |
Countrywide Alternative Loan Trust
5.500%, 11/25/35 | | | 1,851,585 | | | | 1,566,193 | |
5.500%, 04/25/37 | | | 849,970 | | | | 630,835 | |
6.500%, 09/25/37 | | | 3,153,131 | | | | 2,433,914 | |
Countrywide Home Loan Mortgage Pass-Through Trust | | | | | | | | |
0.365%, 04/25/46 (d) | | | 552,242 | | | | 421,992 | |
0.505%, 02/25/35 (d) | | | 296,430 | | | | 255,303 | |
Credit Suisse Mortgage Capital Certificates | | | | | | | | |
2.556%, 08/27/46 (144A) (d) | | | 1,010,338 | | | | 931,213 | |
2.560%, 05/27/36 (144A) (d) | | | 872,157 | | | | 800,917 | |
Deutsche Alt-A Securities, Inc. Mortgage Loan Trust
0.315%, 12/25/36 (d) | | | 714,852 | | | | 562,249 | |
Deutsche Mortgage Securities, Inc.
5.230%, 06/26/35 (144A) (d) | | | 186,703 | | | | 187,743 | |
GSR Mortgage Loan Trust
6.000%, 07/25/37 | | | 842,974 | | | | 774,995 | |
IndyMac INDX Mortgage Loan Trust | | | | | | | | |
0.785%, 06/25/34 (d) | | | 46,164 | | | | 42,853 | |
2.626%, 10/25/35 (d) | | | 160,442 | | | | 135,532 | |
JP Morgan Mortgage Trust
6.500%, 08/25/36 | | | 215,862 | | | | 188,170 | |
MASTR Adjustable Rate Mortgages Trust
2.109%, 09/25/33 (d) | | | 224,814 | | | | 221,809 | |
MASTR Reperforming Loan Trust
4.875%, 05/25/36 (144A) (d) | | | 283,320 | | | | 269,901 | |
WaMu Mortgage Pass-Through Certificates Trust
4.755%, 08/25/36 (d) | | | 202,945 | | | | 178,764 | |
| | | | | | | | |
| | | | | | | 9,602,383 | |
| | | | | | | | |
|
Commercial Mortgage-Backed Securities—4.1% | |
Banc of America Commercial Mortgage Trust | | | | | | | | |
5.482%, 01/15/49 (d) | | | 80,000 | | | | 83,529 | |
5.649%, 06/10/49 (d) | | | 1,723,925 | | | | 1,884,241 | |
Banc of America Merrill Lynch Commercial Mortgage, Inc.
5.171%, 11/10/42 (d) | | | 1,495,865 | | | | 1,519,108 | |
Bayview Commercial Asset Trust
0.395%, 07/25/36 (144A) (d) | | | 388,389 | | | | 329,922 | |
BB-UBS Trust
0.596%, 11/05/36 (144A) (d) (e) | | | 10,235,000 | | | | 573,027 | |
|
Commercial Mortgage-Backed Securities—(Continued) | |
Bear Stearns Commercial Mortgage Securities Trust | | | | | | | | |
5.189%, 12/11/38 | | | 971,133 | | | | 1,061,511 | |
5.317%, 02/11/44 | | | 688,937 | | | | 754,438 | |
5.449%, 12/11/40 (d) | | | 170,000 | | | | 181,519 | |
5.650%, 06/11/50 (d) | | | 684,419 | | | | 757,177 | |
CD Mortgage Trust
6.118%, 11/15/44 (d) | | | 80,000 | | | | 89,118 | |
Citigroup Commercial Mortgage Trust | | | | | | | | |
1.308%, 09/10/46 (d) (e) | | | 2,144,211 | | | | 159,257 | |
6.132%, 12/10/49 (d) | | | 440,000 | | | | 487,685 | |
Commercial Mortgage Pass-Through Certificates | | | | | | | | |
1.556%, 03/10/46 (d) (e) | | | 7,614,361 | | | | 585,826 | |
1.612%, 03/10/46 (d) (e) | | | 5,487,929 | | | | 489,715 | |
1.684%, 10/13/28 (144A) (d) | | | 850,000 | | | | 852,894 | |
2.231%, 05/15/45 (d) (e) | | | 3,658,426 | | | | 437,723 | |
3.367%, 02/10/28 (144A) | | | 680,000 | | | | 646,436 | |
3.400%, 10/05/30 (144A) | | | 605,000 | | | | 559,993 | |
4.715%, 10/10/46 (d) | | | 185,000 | | | | 191,840 | |
5.347%, 12/10/46 | | | 665,000 | | | | 726,428 | |
5.543%, 12/11/49 (144A) (d) | | | 320,000 | | | | 345,120 | |
Credit Suisse First Boston Mortgage Securities Corp.
4.771%, 07/15/37 | | | 125,000 | | | | 128,799 | |
Credit Suisse Mortgage Capital Certificates
0.437%, 04/15/22 (144A) (d) | | | 880,000 | | | | 845,391 | |
DBRR Trust
0.946%, 09/25/45 (144A) | | | 1,105,805 | | | | 1,105,857 | |
1.636%, 12/18/49 (144A) (d) | | | 523,322 | | | | 524,140 | |
5.733%, 06/17/49 (144A) (d) | | | 410,000 | | | | 446,881 | |
Del Coronado Trust
5.167%, 03/15/18 (144A) (d) | | | 520,000 | | | | 521,820 | |
Extended Stay America Trust | | | | | | | | |
2.675%, 12/05/31 (144A) | | | 1,120,000 | | | | 1,094,166 | |
2.958%, 12/05/31 (144A) | | | 535,000 | | | | 519,161 | |
FREMF Mortgage Trust | | | | | | | | |
3.165%, 04/25/46 (144A) (d) | | | 85,000 | | | | 79,480 | |
3.562%, 08/25/45 (144A) (d) | | | 540,000 | | | | 525,222 | |
3.741%, 04/25/45 (144A) (d) | | | 500,000 | | | | 473,287 | |
4.023%, 11/25/44 (144A) (d) | | | 101,100 | | | | 97,760 | |
GE Capital Commercial Mortgage Corp.
4.578%, 06/10/48 | | | 1,397,792 | | | | 1,410,393 | |
Greenwich Capital Commercial Mortgage Trust | | | | | | | | |
5.736%, 12/10/49 | | | 280,000 | | | | 312,694 | |
5.867%, 12/10/49 (d) | | | 385,000 | | | | 421,855 | |
GS Mortgage Securities Corp. II | | | | | | | | |
3.249%, 11/08/29 (144A) (d) (e) | | | 6,767,000 | | | | 312,041 | |
3.435%, 12/10/27 (144A) (d) | | | 1,080,000 | | | | 939,766 | |
GS Mortgage Securities Corp. Trust | | | | | | | | |
3.551%, 04/10/34 (144A) | | | 933,000 | | | | 917,339 | |
3.633%, 06/05/31 (144A) | | | 130,000 | | | | 130,383 | |
GS Mortgage Securities Trust | | | | | | | | |
5.591%, 11/10/39 | | | 230,000 | | | | 252,099 | |
5.622%, 11/10/39 | | | 420,000 | | | | 411,342 | |
5.804%, 08/10/45 (d) | | | 777,425 | | | | 853,459 | |
See accompanying notes to financial statements.
MSF-15
Metropolitan Series Fund
WMC Balanced Portfolio (formerly, BlackRock Diversified Portfolio)
Schedule of Investments as of December 31, 2013
Mortgage-Backed Securities—(Continued)
| | | | | | | | |
| Security Description | | Principal
Amount* | | | Value | |
|
Commercial Mortgage-Backed Securities—(Continued) | |
Hilton USA Trust | | | | | | | | |
1.668%, 11/05/30 (144A) (d) (e) | | | 7,315,000 | | | $ | 121,897 | |
4.407%, 11/05/30 (d) | | | 315,000 | | | | 315,257 | |
5.222%, 11/05/30 (144A) (d) | | | 900,000 | | | | 905,099 | |
JP Morgan Chase Commercial Mortgage Securities Corp.
1.945%, 12/15/47 (d) (e) | | | 6,302,793 | | | | 658,617 | |
JP Morgan Chase Commercial Mortgage Securities Trust | | | | | | | | |
0.587%, 04/15/46 (d) (e) | | | 1,030,000 | | | | 45,886 | |
1.043%, 08/15/46 (d) (e) | | | 9,135,006 | | | | 463,318 | |
1.587%, 04/15/46 (d) (e) | | | 3,527,107 | | | | 336,648 | |
2.013%, 06/15/45 (d) (e) | | | 3,084,727 | | | | 303,226 | |
3.958%, 04/15/46 (d) | | | 280,000 | | | | 257,052 | |
4.161%, 12/15/47 (d) | | | 245,000 | | | | 231,194 | |
5.372%, 05/15/47 | | | 155,000 | | | | 163,756 | |
5.431%, 06/12/47 (d) | | | 1,414,816 | | | | 1,551,213 | |
5.439%, 01/15/49 | | | 988,244 | | | | 1,089,040 | |
5.445%, 12/12/44 (d) | | | 650,000 | | | | 697,940 | |
5.447%, 06/12/47 | | | 184,240 | | | | 186,353 | |
5.850%, 02/15/51 (d) | | | 1,299,970 | | | | 1,459,105 | |
5.951%, 06/15/43 (144A) | | | 1,150,000 | | | | 1,311,177 | |
6.125%, 02/12/51 (d) | | | 603,675 | | | | 646,851 | |
JPMorgan Chase Commercial Mortgage Securities Trust
5.874%, 02/12/51 (d) | | | 925,012 | | | | 1,046,614 | |
LB-UBS Commercial Mortgage Trust | | | | | | | | |
5.205%, 04/15/30 (d) | | | 430,000 | | | | 445,180 | |
5.866%, 09/15/45 (d) | | | 432,220 | | | | 479,357 | |
6.164%, 09/15/45 (d) | | | 295,000 | | | | 337,184 | |
Merrill Lynch Mortgage Trust | | | | | | | | |
5.280%, 11/12/37 (d) | | | 1,000,000 | | | | 1,051,703 | |
5.859%, 06/12/50 (d) | | | 391,941 | | | | 419,525 | |
Merrill Lynch/Countrywide Commercial Mortgage Trust
5.700%, 09/12/49 | | | 1,630,000 | | | | 1,811,096 | |
Morgan Stanley Bank of America Merrill Lynch Trust
1.747%, 02/15/46 (d) (e) | | | 2,969,442 | | | | 291,478 | |
Morgan Stanley Capital I Trust | | | | | | | | |
2.669%, 03/15/45 (144A) (d) (e) | | | 5,781,877 | | | | 714,114 | |
5.312%, 03/15/44 | | | 1,386,802 | | | | 1,519,181 | |
5.406%, 03/15/44 | | | 360,000 | | | | 391,318 | |
5.597%, 04/12/49 (d) | | | 930,000 | | | | 1,014,811 | |
5.665%, 04/15/49 (d) | | | 521,971 | | | | 569,819 | |
5.910%, 06/11/49 (d) | | | 195,000 | | | | 209,775 | |
Morgan Stanley Capital I, Inc. | | | | | | | | |
6.340%, 07/15/30 (144A) (d) | | | 129,123 | | | | 130,756 | |
Morgan Stanley Re-REMIC Trust | | | | | | | | |
Zero Coupon, 03/23/51 (144A) (e) | | | 460,000 | | | | 441,572 | |
Zero Coupon, 07/17/56 (144A) (e) | | | 652,239 | | | | 641,803 | |
1.000%, 03/27/51 (144A) (e) | | | 345,470 | | | | 345,463 | |
1.000%, 03/27/51 (144) (144A) (e) | | | 380,000 | | | | 372,400 | |
2.000%, 07/27/49 (144A) | | | 652,819 | | | | 658,042 | |
2.500%, 03/23/51 (144A) (e) | | | 287,050 | | | | 290,724 | |
|
Commercial Mortgage-Backed Securities—(Continued) | |
Motel 6 Trust | | | | | | | | |
2.743%, 10/05/25 (144A) | | | 390,000 | | | | 386,815 | |
RBSCF Trust | | | | | | | | |
5.925%, 02/16/51 (144A) (d) | | | 2,261,964 | | | | 2,471,191 | |
S2 Hospitality LLC | | | | | | | | |
4.500%, 04/15/25 (144A) | | | 4,414 | | | | 4,414 | |
SCG Trust | | | | | | | | |
1.567%, 11/15/26 (144A) (d) | | | 590,000 | | | | 590,680 | |
2.117%, 11/15/26 (144A) (d) | | | 375,000 | | | | 375,005 | |
STRIPs, Ltd. | | | | | | | | |
1.500%, 12/25/44 (144A) | | | 948,824 | | | | 939,336 | |
Wachovia Bank Commercial Mortgage Trust | | | | | | | | |
5.925%, 02/15/51 (d) | | | 520,000 | | | | 520,840 | |
Wells Fargo Resecuritization Trust | | | | | | | | |
1.750%, 08/20/21 (144A) | | | 584,545 | | | | 581,038 | |
WF-RBS Commercial Mortgage Trust | | | | | | | | |
0.717%, 08/15/46 (d) (e) | | | 5,451,000 | | | | 230,141 | |
1.829%, 12/15/45 (144A) (d) (e) | | | 5,102,212 | | | | 547,774 | |
| | | | | | | | |
| | | | | | | 55,612,620 | |
| | | | | | | | |
Total Mortgage-Backed Securities
(Cost $64,090,248) | | | | | | | 65,215,003 | |
| | | | | | | | |
|
| Foreign Government—0.4% | |
|
Sovereign—0.4% | |
Brazilian Government International Bond | | | | | | | | |
7.125%, 01/20/37 | | | 230,000 | | | | 263,350 | |
Hellenic Republic Government Bond | | | | | | | | |
2.000%, 02/24/23 (EUR) (d) | | | 590,000 | | | | 546,158 | |
Italy Government International Bond | | | | | | | | |
2.550%, 10/22/16 (EUR) | | | 802,247 | | | | 1,129,862 | |
Mexico Government International Bonds | | | | | | | | |
4.000%, 10/02/23 | | | 1,650,000 | | | | 1,633,500 | |
6.750%, 09/27/34 | | | 215,000 | | | | 253,700 | |
South Africa Government International Bond | | | | | | | | |
4.665%, 01/17/24 (a) | | | 340,000 | | | | 325,125 | |
Spain Government Bond | | | | | | | | |
4.400%, 10/31/23 (144A) (EUR) | | | 885,000 | | | | 1,239,531 | |
| | | | | | | | |
Total Foreign Government
(Cost $5,413,641) | | | | | | | 5,391,226 | |
| | | | | | | | |
|
| Floating Rate Loans (d)—0.1% | |
|
Lodging—0.1% | |
Hilton Fort Lauderdale | | | | | | | | |
Mezzanine Term Loan, 7.360%, 02/22/16 | | | 1,000,000 | | | | 1,000,000 | |
Motel 6 Trust
Mezzanine Term Loan, 10.000%, 10/15/17 (i) | | | 896,352 | | | | 934,447 | |
| | | | | | | | |
Total Floating Rate Loans
(Cost $1,892,476) | | | | | | | 1,934,447 | |
| | | | | | | | |
See accompanying notes to financial statements.
MSF-16
Metropolitan Series Fund
WMC Balanced Portfolio (formerly, BlackRock Diversified Portfolio)
Schedule of Investments as of December 31, 2013
Preferred Stocks—0.1%
| | | | | | | | |
| Security Description | | Shares/
Principal/
Contracts/
Notional
Amount* | | | Value | |
|
Diversified Financial Services—0.1% | |
Citigroup Capital XIII, 7.875% (d) | | | 41,099 | | | $ | 1,119,948 | |
| | | | | | | | |
|
Thrifts & Mortgage Finance—0.0% | |
Federal Home Loan Mortgage Corp.
Series Z, 8.375% (d) | | | 20,000 | | | | 179,400 | |
Federal National Mortgage Association
Series S, 8.250% (d) | | | 20,000 | | | | 175,000 | |
| | | | | | | | |
| | | | | | | 354,400 | |
| | | | | | | | |
Total Preferred Stocks
(Cost $1,188,916) | | | | | | | 1,474,348 | |
| | | | | | | | |
|
| Municipals—0.1% | |
New York City Municipal Water Finance Authority | | | | | |
5.375%, 06/15/43 | | | 530,000 | | | | 559,017 | |
5.500%, 06/15/43 | | | 630,000 | | | | 671,095 | |
| | | | | | | | |
Total Municipals
(Cost $1,143,653) | | | | | | | 1,230,112 | |
| | | | | | | | |
|
| Purchased Options—0.0% | |
|
Call Options—0.0% | |
10 Year Interest Rate Swap, Exercise Rate 4.50, Expires 02/26/14 (Counterparty - Barclays Bank plc) (AUD) | | | 6,645,000 | | | | 36,942 | |
|
Put Options—0.0% | |
10 Year Interest Rate Swap, Exercise Rate 1.10, Expires 06/05/14 (Counterparty - Barclays Bank plc) (JPY) | | | 461,000,000 | | | | 31,653 | |
10 Year Interest Rate Swap, Exercise Rate 1.10, Expires 06/06/14 (Counterparty - Barclays Bank plc) (JPY) | | | 230,000,000 | | | | 15,908 | |
10 Year Interest Rate Swap, Exercise Rate 1.10, Expires 06/09/14 (Counterparty - Bank of America N.A.) (JPY) | | | 479,000,000 | | | | 33,389 | |
AUD Currency, Strike Price USD 0.89, Expires 02/01/14 (Counterparty - Deutsche Bank AG) (AUD) | | | 15,040,000 | | | | 199,545 | |
Eurodollar Midcurve 2 Year Futures @ 98.75, Expires 03/01/14 | | | 542,500 | | | | 146,475 | |
USD Currency, Strike Price TRY 1.98, Expires 01/21/14 (Counterparty - Morgan Stanley Capital Services) | | | 1,130,000 | | | | 29 | |
USD Currency, Strike Price TRY 1.99, Expires 01/03/14 (Counterparty - Morgan Stanley Capital Services) | | | 1,130,000 | | | | 0 | |
| | | | | | | | |
| | | | | | | 426,999 | |
| | | | | | | | |
Total Purchased Options
(Cost $354,750) | | | | | | | 463,941 | |
| | | | | | | | |
| Short-Term Investments—3.0% | |
| Security Description | | Shares/
Principal
Amount* | | | Value | |
|
Mutual Fund—1.6% | |
State Street Navigator Securities Lending Met Portfolio (k) | | | 21,850,278 | | | | 21,850,278 | |
| | | | | | | | |
| |
Repurchase Agreement—1.4% | | | | | |
Fixed Income Clearing Corp.
Repurchase Agreement dated 12/31/13 at 0.000% to be repurchased at $18,428,000 on 01/02/14, collateralized by $19,205,000 U.S. Treasury Note at 3.625% due 05/31/18 with a value of $18,796,894. | | | 18,428,000 | | | | 18,428,000 | |
| | | | | | | | |
Total Short-Term Investments
(Cost $40,278,278) | | | | | | | 40,278,278 | |
| | | | | | | | |
Total Investments—109.9%
(Cost $1,264,872,150) (l) | | | | | | | 1,495,531,004 | |
Other assets and liabilities (net)—(9.9)% | | | | | | | (134,577,222 | ) |
| | | | | | | | |
| Net Assets—100.0% | | | | | | $ | 1,360,953,782 | |
| | | | | | | | |
| * | Principal amount stated in U.S. dollars unless otherwise noted. |
| (a) | All or a portion of the security was held on loan. As of December 31, 2013, the market value of securities loaned was $21,608,253 and the collateral received consisted of cash in the amount of $21,850,278. The cash collateral is invested in a money market fund managed by an affiliate of the custodian. |
| (b) | Non-income producing security. |
| (c) | TBA (To Be Announced) Securities are purchased on a forward commitment basis with an approximate principal amount and no defined maturity date. The actual principal and maturity date will be determined upon settlement date. |
| (d) | Variable or floating rate security. The stated rate represents the rate at December 31, 2013. Maturity date shown for callable securities reflects the earliest possible call date. |
| (e) | Interest only security. |
| (f) | All or a portion of the security was pledged as collateral against open futures contracts. As of December 31, 2013, the market value of securities pledged was $721,133. |
| (g) | All or a portion of the security was pledged as collateral against open reverse repurchase agreements. As of December 31, 2013, the value of securities pledged amounted to $62,207,365. |
| (h) | Non-income producing; Security is in default and/or issuer is in bankruptcy. |
| (i) | Restricted securities are not registered under the Securities Act of 1933 and are subject to legal restrictions on resale. These securities generally may be resold in transactions exempt from registration or to the public if the securities are subsequently registered. Disposal of these securities may involve time-consuming negotiations and prompt sale at an acceptable price may be difficult. As of December 31, 2013, the market value of restricted securities was $963,252, which is 0.1% of net assets. See details shown in the Restricted Securities table that follows. |
| (k) | Represents investment of cash collateral received from securities lending transactions. |
See accompanying notes to financial statements.
MSF-17
Metropolitan Series Fund
WMC Balanced Portfolio (formerly, BlackRock Diversified Portfolio)
Schedule of Investments as of December 31, 2013
| (l) | As of December 31, 2013, the aggregate cost of investments for federal income tax purposes was $1,269,710,675. The aggregate unrealized appreciation and depreciation of investments were $244,969,117 and $(19,148,788), respectively, resulting in net unrealized appreciation of $225,820,329 for federal income tax purposes. |
| (144A)— | Securities exempt from registration under Rule 144A of the Securities Act of 1933. These securities may be resold in transactions exempt from registration, normally to qualified institutional buyers. As of December 31, 2013, the market value of 144A securities was $104,587,523, which is 7.7% of net assets. |
| (ACES)— | Alternative Credit Enhancement Securities. |
| (ARM)— | Adjustable-Rate Mortgage |
| (CDO)— | Collateralized Debt Obligation |
| (CLO)— | Collateralized Loan Obligation |
| (CMO)— | Collateralized Mortgage Obligation |
| (REMIC)— | Real Estate Mortgage Investment Conduit |
| | | | | | | | | | | | | | |
Restricted Securities | | Acquisition
Date | | Principal
Amount | | | Cost | | | Value | |
Knollwood CDO, Ltd. | | 02/10/04 | | $ | 538,940 | | | $ | 538,940 | | | $ | 5 | |
LBI HF | | 08/22/06 | | | 320,000 | | | | 320,000 | | | | 28,800 | |
Motel 6 Trust Mezzanine Term Loan | | 07/11/12 | | | 896,352 | | | | 896,352 | | | | 934,447 | |
Forward Foreign Currency Exchange Contracts
| | | | | | | | | | | | | | | | | | | | | | |
Contracts to Buy | | | Counterparty | | Settlement
Date | | | In Exchange
for | | | Unrealized
Appreciation/
(Depreciation) | |
| AUD | | | 1,819,000 | | | Westpac Banking Corp. | | | 03/19/14 | | | | USD | | | | 1,609,844 | | | $ | 6,347 | |
| EUR | | | 1,712,000 | | | BNP Paribas S.A. | | | 01/22/14 | | | | USD | | | | 2,354,393 | | | | 783 | |
| INR | | | 68,172,200 | | | BNP Paribas S.A. | | | 03/19/14 | | | | USD | | | | 1,075,000 | | | | 7,593 | |
| INR | | | 276,572,560 | | | UBS AG | | | 03/19/14 | | | | USD | | | | 4,400,000 | | | | (7,952 | ) |
| MXN | | | 11,927,800 | | | Deutsche Bank AG | | | 03/19/14 | | | | USD | | | | 920,000 | | | | (11,944 | ) |
| MXN | | | 36,489,638 | | | Royal Bank of Canada (RBC) | | | 03/19/14 | | | | USD | | | | 2,785,000 | | | | (7,066 | ) |
| | | | | |
Contracts to Deliver | | | | | | | | | | | | | | | |
| AUD | | | 1,819,000 | | | Bank of America N.A. | | | 03/19/14 | | | | USD | | | | 1,613,260 | | | | (2,930 | ) |
| EUR | | | 3,334,000 | | | Barclays Bank plc | | | 01/22/14 | | | | USD | | | | 4,502,147 | | | | (84,394 | ) |
| JPY | | | 97,108,380 | | | Barclays Bank plc | | | 03/19/14 | | | | USD | | | | 948,000 | | | | 25,549 | |
| TRY | | | 1,219,890 | | | BNP Paribas S.A. | | | 01/06/14 | | | | USD | | | | 564,000 | | | | (3,195 | ) |
| TRY | | | 939,818 | | | Deutsche Bank AG | | | 01/06/14 | | | | USD | | | | 435,000 | | | | (1,973 | ) |
| TRY | | | 449,587 | | | Deutsche Bank AG | | | 01/06/14 | | | | USD | | | | 215,000 | | | | 5,962 | |
| TRY | | | 753,480 | | | Morgan Stanley Capital Services | | | 01/06/14 | | | | USD | | | | 360,000 | | | | 9,665 | |
| | | | | |
Cross Currency
Contracts to Buy | | | | | | | | | | | | | | | |
| PLN | | | 3,319,834 | | | Citibank N.A. | | | 03/19/14 | | | | EUR | | | | 790,000 | | | | 7,011 | |
| | | | | | | | | | | | | | | | | | | | | | |
Net Unrealized Depreciation | | | $ | (56,544 | ) |
| | | | | | | | | | | | | | | | | | | | | | |
Forward Sale Commitments
| | | | | | | | | | | | | | | | | | | | |
Security Description | | Interest Rate | | | Maturity | | | Face
Amount | | | Proceeds | | | Value | |
Fannie Mae 15 Yr. Pool | | | 2.500 | % | | | TBA | | | | (1,100,000 | ) | | $ | (1,090,547 | ) | | $ | (1,088,656 | ) |
Fannie Mae 15 Yr. Pool | | | 4.000 | % | | | TBA | | | | (3,100,000 | ) | | | (3,291,449 | ) | | | (3,284,789 | ) |
Fannie Mae 30 Yr. Pool | | | 3.000 | % | | | TBA | | | | (100,000 | ) | | | (94,875 | ) | | | (94,930 | ) |
Fannie Mae 30 Yr. Pool | | | 6.000 | % | | | TBA | | | | (200,000 | ) | | | (221,312 | ) | | | (221,641 | ) |
Fannie Mae 30 Yr. Pool | | | 4.500 | % | | | TBA | | | | (700,000 | ) | | | (737,188 | ) | | | (739,402 | ) |
Fannie Mae 30 Yr. Pool | | | 5.000 | % | | | TBA | | | | (4,100,000 | ) | | | (4,423,516 | ) | | | (4,439,851 | ) |
Fannie Mae 30 Yr. Pool | | | 3.500 | % | | | TBA | | | | (6,205,000 | ) | | | (6,166,219 | ) | | | (6,145,374 | ) |
Freddie Mac 30 Yr. Gold Pool | | | 3.000 | % | | | TBA | | | | (1,900,000 | ) | | | (1,809,453 | ) | | | (1,799,656 | ) |
GNMA I 30 Yr. Pool | | | 4.000 | % | | | TBA | | | | (2,300,000 | ) | | | (2,404,578 | ) | | | (2,389,934 | ) |
GNMA I 30 Yr. Pool | | | 3.500 | % | | | TBA | | | | (2,400,000 | ) | | | (2,432,063 | ) | | | (2,418,844 | ) |
GNMA II 30 Yr. Pool | | | 5.000 | % | | | TBA | | | | (100,000 | ) | | | (108,687 | ) | | | (108,356 | ) |
GNMA II 30 Yr. Pool | | | 4.000 | % | | | TBA | | | | (4,100,000 | ) | | | (4,270,406 | ) | | | (4,262,879 | ) |
GNMA II 30 Yr. Pool | | | 4.500 | % | | | TBA | | | | (5,100,000 | ) | | | (5,489,672 | ) | | | (5,452,617 | ) |
| | | | | | | | | | | | | | | | | | | | |
Total | | | | | | | | | | | | | | $ | (32,539,965 | ) | | $ | (32,446,929 | ) |
| | | | | | | | | | | | | | | | | | | | |
See accompanying notes to financial statements.
MSF-18
Metropolitan Series Fund
WMC Balanced Portfolio (formerly, BlackRock Diversified Portfolio)
Schedule of Investments as of December 31, 2013
Futures Contracts
| | | | | | | | | | | | | | | | | | | | |
Futures Contracts—Long | | Expiration
Date | | | Number of
Contracts | | | Notional
Amount | | | Unrealized
Appreciation/
(Depreciation) | |
U.S. Treasury Long Bond Futures | | | 03/20/14 | | | | 79 | | | | USD | | | | 10,318,356 | | | $ | (181,669 | ) |
U.S. Treasury Note 2 Year Futures | | | 03/31/14 | | | | 73 | | | | USD | | | | 16,062,253 | | | | (15,941 | ) |
| | | | | |
Futures Contracts—Short | | | | | | | | | | | | | | | |
90 Day Euro Dollar Futures | | | 12/14/15 | | | | (30 | ) | | | USD | | | | (7,428,707 | ) | | | 13,082 | |
Euro Bund Futures | | | 03/06/14 | | | | (3 | ) | | | EUR | | | | (423,557 | ) | | | 8,319 | |
U.S. Treasury Note 10 Year Futures | | | 03/20/14 | | | | (241 | ) | | | USD | | | | (30,145,369 | ) | | | 491,072 | |
U.S. Treasury Note 5 Year Futures | | | 03/31/14 | | | | (232 | ) | | | USD | | | | (27,841,994 | ) | | | 161,494 | |
U.S. Treasury Ultra Long Bond Futures | | | 03/20/14 | | | | (10 | ) | | | USD | | | | (1,374,528 | ) | | | 12,028 | |
| | | | | | | | | | | | | | | | | | | | |
Net Unrealized Appreciation | | | $ | 488,385 | |
| | | | | | | | | | | | | | | | | | | | |
Written Options
| | | | | | | | | | | | | | | | | | | | | | | | | | | | | | |
Foreign Currency Written
Options | | Strike
Price | | | Counterparty | | Expiration
Date | | | Notional
Amount | | | Premiums
Received | | | Market
Value | | | Unrealized
Appreciation | |
Call - USD vs TRY | | | TRY 2.10 | | | Morgan Stanley Capital Services | | | 01/03/14 | | | | USD | | | | (1,130,000 | ) | | $ | (4,831 | ) | | $ | (28,792 | ) | | $ | (23,961 | ) |
Call - USD vs TRY | | | TRY 2.15 | | | Morgan Stanley Capital Services | | | 01/21/14 | | | | USD | | | | (1,130,000 | ) | | | (4,152 | ) | | | (19,654 | ) | | | (15,502 | ) |
Put - AUD vs USD | | | USD 0.85 | | | Deutsche Bank AG | | | 02/07/14 | | | | AUD | | | | (5,010,000 | ) | | | (17,919 | ) | | | (7,810 | ) | | | 10,109 | |
Put - AUD vs USD | | | USD 0.85 | | | Citibank N.A. | | | 02/07/14 | | | | AUD | | | | (5,010,000 | ) | | | (19,053 | ) | | | (7,811 | ) | | | 11,242 | |
Put - AUD vs USD | | | USD 0.85 | | | Deutsche Bank AG | | | 02/07/14 | | | | AUD | | | | (5,020,000 | ) | | | (15,873 | ) | | | (7,826 | ) | | | 8,047 | |
| | | | | | | | | | | | | | | | | | | | | | | | | | | | | | |
Total | | | | | | | | | | | | | | | | | | | | $ | (61,828 | ) | | $ | (71,893 | ) | | $ | (10,065 | ) |
| | | | | | | | | | | | | | | | | | | | | | | | | | | | | | |
| | | | | | | | | | | | | | | | | | | | | | | | | | | | | | | | | | |
Interest Rate
Swaptions | | Exercise
Rate | | Counterparty | | Floating Rate
Index | | Pay/
Receive
Floating
Rate | | | Expiration
Date | | | Notional
Amount | | | Premiums
Received | | | Market
Value | | | Unrealized
Appreciation/
(Depreciation) | |
Put - OTC - 10 Year Interest Rate Swap | | 1.400% | | Barclays Bank plc | | 6-Month JPY-LIBOR | | | Pay | | | | 06/06/14 | | | | JPY | | | | (230,000,000 | ) | | $ | (5,644 | ) | | $ | (5,485 | ) | | $ | 159 | |
Put - OTC - 10 Year Interest Rate Swap | | 1.400% | | Barclays Bank plc | | 6-Month JPY-LIBOR | | | Pay | | | | 06/05/14 | | | | JPY | | | | (461,000,000 | ) | | | (9,970 | ) | | | (10,855 | ) | | | (885 | ) |
Put - OTC - 10 Year Interest Rate Swap | | 1.400% | | Bank of America N.A. | | 6-Month JPY-LIBOR | | | Pay | | | | 06/09/14 | | | | JPY | | | | (479,000,000 | ) | | | (14,595 | ) | | | (11,567 | ) | | | 3,028 | |
| | | | | | | | | | | | | | | | | | | | | | | | | | | | | | | | | | |
Totals | | | $ | (30,209 | ) | | $ | (27,907 | ) | | $ | 2,302 | |
| | | | | | | | | | | | | | | | | | | | | | | | | | | | | | | | | | |
| | | | | | | | | | | | | | | | | | | | | | | | |
Options on Exchange-Traded Futures Contracts | | Exercise
Price | | | Expiration
Date | | | Number
of Contracts | | | Premiums
Received | | | Market
Value | | | Unrealized
Appreciation | |
Put - Eurodollar Midcurve 2 Year Futures | | $ | 98.25 | | | | 03/14/14 | | | | (217 | ) | | $ | (15,852 | ) | | $ | (35,263 | ) | | $ | (19,411 | ) |
Reverse Repurchase Agreements
| | | | | | | | | | | | | | | | | | | | | | | | |
Counterparty | | Interest
Rate | | | Settlement
Date | | | Maturity
Date | | | Principal
Amount | | | Net Closing
Amount | |
Bank of America N.A. | | | 0.04 | % | | | 12/12/13 | | | | Open | | | | USD | | | | 5,353,475 | | | $ | 5,353,475 | |
BNP Paribas S.A. | | | 0.38 | % | | | 12/31/13 | | | | 01/02/14 | | | | USD | | | | 6,087,381 | | | | 6,087,381 | |
Bank of America N.A. | | | 0.07 | % | | | 12/31/13 | | | | 01/02/14 | | | | USD | | | | 8,820,000 | | | | 8,820,000 | |
Credit Suisse International | | | 0.15 | % | | | 12/31/13 | | | | 01/02/14 | | | | USD | | | | 9,677,625 | | | | 9,677,625 | |
BNP Paribas S.A. | | | 0.05 | % | | | 12/5/13 | | | | Open | | | | USD | | | | 14,606,250 | | | | 14,606,250 | |
Deutsche Bank AG | | | 0.46 | % | | | 12/31/13 | | | | 01/02/14 | | | | USD | | | | 17,897,631 | | | | 17,897,632 | |
| | | | | | | | | | | | | | | | | | | | | | | | |
Total | | | $ | 62,442,363 | |
| | | | | | | | | | | | | | | | | | | | | | | | |
Securities pledged as collateral against open reverse repurchase agreements are noted in the Schedule of Investments.
See accompanying notes to financial statements.
MSF-19
Metropolitan Series Fund
WMC Balanced Portfolio (formerly, BlackRock Diversified Portfolio)
Schedule of Investments as of December 31, 2013
Swap Agreements
OTC Interest Rate Swap Agreements
| | | | | | | | | | | | | | | | | | | | | | | | | | | | | | |
Pay/Receive
Floating Rate | | Floating
Rate Index | | Fixed
Rate | | | Maturity
Date | | Counterparty | | Notional
Amount | | | Market
Value | | | Upfront
Premium
Paid/(Received) | | | Unrealized
Appreciation/
(Depreciation) | |
Receive | | 3M LIBOR | | | 1.758 | % | | 06/25/22 | | JPMorgan Chase Bank N.A. | | | USD | | | | 2,300,000 | | | $ | 188,300 | | | $ | — | | | $ | 188,300 | |
Pay | | 6M EURIBOR | | | 2.800 | % | | 11/10/41 | | Bank of America N.A. | | | EUR | | | | 1,200,000 | | | | 20,959 | | | | — | | | | 20,959 | |
Receive | | 6M EURIBOR | | | 2.783 | % | | 11/10/41 | | Deutsche Bank AG | | | EUR | | | | 1,200,000 | | | | (15,186 | ) | | | — | | | | (15,186 | ) |
Pay | | BRL CDI | | | 11.430 | % | | 01/04/16 | | Barclays Bank plc | | | BRL | | | | 5,553,468 | | | | (3,908 | ) | | | — | | | | (3,908 | ) |
Pay | | BRL CDI | | | 11.410 | % | | 01/04/16 | | Credit Suisse International | | | BRL | | | | 1,621,532 | | | | (1,344 | ) | | | — | | | | (1,344 | ) |
Pay | | MXN TIIE | | | 6.360 | % | | 10/18/23 | | Deutsche Bank AG | | | MXN | | | | 5,905,000 | | | | (14,441 | ) | | | — | | | | (14,441 | ) |
Pay | | MXN TIIE | | | 6.830 | % | | 11/03/23 | | JPMorgan Chase Bank N.A. | | | MXN | | | | 11,415,000 | | | | 2,289 | | | | — | | | | 2,289 | |
| | | | | | | | | | | | | | | | | | | | | | | | | | | | | | |
Totals | | | $ | 176,669 | | | $ | — | | | $ | 176,669 | |
| | | | | | | | | | | | | | | | | | | | | | | | | | | | | | |
Centrally Cleared Interest Rate Swap Agreements
| | | | | | | | | | | | | | | | | | | | | | |
Pay/Receive Floating Rate | | Floating
Rate Index | | Fixed
Rate | | | Maturity
Date | | | Notional
Amount | | | Unrealized
Appreciation/
(Depreciation) | |
Receive | | 3-Month USD-LIBOR | | | 0.648 | % | | | 11/26/16 | | | | USD | | | | 1,580,000 | | | $ | 8,226 | |
Receive | | 3-Month USD-LIBOR | | | 2.820 | % | | | 11/18/23 | | | | USD | | | | 755,000 | | | | 15,821 | |
Receive | | 6-Month JPY-LIBOR | | | 0.815 | % | | | 11/25/23 | | | | JPY | | | | 224,290,000 | | | | 2,916 | |
Receive | | 6-Month JPY-LIBOR | | | 0.789 | % | | | 11/28/23 | | | | JPY | | | | 244,675,000 | | | | 28,054 | |
| | | | | | | | | | | | | | | | | | | | | | |
Total | | | $ | 55,017 | |
| | | | | | | | | | | | | | | | | | | | | | |
Centrally Cleared Credit Default Swap Agreements on Credit Indices—Buy Protection (a)
| | | | | | | | | | | | | | | | | | | | | | |
Reference Obligation | | Fixed Deal
(Pay) Rate | | | Maturity
Date | | | Implied Credit
Spread at
December 31,
2013(b) | | Notional
Amount(c) | | | Unrealized
Depreciation | |
Markit CDX North America High Yield Index, Series 21, Version 1 | | | (5.000%) | | | | 12/20/18 | | | 3.063% | | | USD | | | | 4,660,000 | | | $ | (87,115) | |
| | | | | | | | | | | | | | | | | | | | | | |
OTC Credit Default Swaps on Corporate Issues—Sell Protection (d)
| | | | | | | | | | | | | | | | | | | | | | | | | | | | | | | | | | |
Reference Obligation | | Fixed Deal
Receive Rate | | | Maturity
Date | | | Counterparty | | Implied Credit
Spread at
December 31,
2013(b) | | | Notional
Amount(c) | | | Market
Value | | | Upfront
Premium
(Received) | | | Unrealized
Appreciation | |
Goldman Sachs Group, Inc. (The)
5.950%, due 01/18/2018 | | | 1.000% | | | | 12/20/18 | | | Deutsche Bank AG | | | 0.884% | | | | USD | | | | 1,610,000 | | | $ | 8,912 | | | $ | (14,036) | | | $ | 22,948 | |
| | | | | | | | | | | | | | | | | | | | | | | | | | | | | | | | | | |
OTC Credit Default Swaps on Credit Indices—Buy Protection (a)
| | | | | | | | | | | | | | | | | | | | | | | | | | | | | | | | | | |
Reference Obligation | | Fixed Deal
(Pay) Rate | | | Maturity
Date | | | Counterparty | | Implied Credit
Spread at
December 31,
2013(b) | | | Notional
Amount(c) | | | Market
Value | | | Upfront
Premium
Paid | | | Unrealized
Depreciation | |
Markit CMBX North America AAA-Rated Index, AM Tranche, Version 2 | | | (0.500%) | | | | 05/11/63 | | | Credit Suisse International | | | N/A | | | | USD | | | | 148,000 | | | $ | 3,748 | | | $ | 5,080 | | | $ | (1,332) | |
Markit CMBX North America AAA-Rated Index, AM Tranche, Version 6 | | | (0.500%) | | | | 05/11/63 | | | Morgan Stanley Capital Services | | | N/A | | | | USD | | | | 470,000 | | | | 11,904 | | | | 17,555 | | | | (5,651) | |
| | | | | | | | | | | | | | | | | | | | | | | | | | | | | | | | | | |
Totals | | | $ | 15,652 | | | $ | 22,635 | | | $ | (6,983) | |
| | | | | | | | | | | | | | | | | | | | | | | | | | | | | | | | | | |
See accompanying notes to financial statements.
MSF-20
Metropolitan Series Fund
WMC Balanced Portfolio (formerly, BlackRock Diversified Portfolio)
Schedule of Investments as of December 31, 2013
OTC Credit Default Swaps on Credit Indices—Sell Protection (d)
| | | | | | | | | | | | | | | | | | | | | | | | | | | | | | | | | | |
Reference Obligation | | Fixed Deal
Receive Rate | | | Maturity
Date | | | Counterparty | | Implied Credit
Spread at
December 31,
2013(b) | | | Notional
Amount(c) | | | Market
Value | | | Upfront
Premium
Paid/(Received) | | | Unrealized
Appreciation/
(Depreciation) | |
Markit CDX Emerging Markets Index, Series 20, Version 1 | | | 5.000% | | | | 12/20/18 | | | Bank of America N.A. | | | 2.734% | | | | USD | | | | 330,000 | | | $ | 33,492 | | | $ | 33,825 | | | $ | (333) | |
Markit CDX Emerging Markets Index, Series 20, Version 1 | | | 5.000% | | | | 12/20/18 | | | Barclays Bank plc | | | 2.734% | | | | USD | | | | 632,000 | | | | 64,143 | | | | 63,516 | | | | 627 | |
Markit CDX Emerging Markets Index, Series 20, Version 1 | | | 5.000% | | | | 12/20/18 | | | Barclays Bank plc | | | 2.734% | | | | USD | | | | 579,000 | | | | 58,764 | | | | 58,190 | | | | 574 | |
Markit CDX Emerging Markets Index, Series 20, Version 1 | | | 5.000% | | | | 12/20/18 | | | Barclays Bank plc | | | 2.734% | | | | USD | | | | 329,000 | | | | 33,391 | | | | 34,216 | | | | (825) | |
Markit CMBX North America AAA-Rated Index, AM Tranche, Version 2 | | | 0.500% | | | | 03/15/49 | | | Deutsche Bank AG | | | N/A | | | | USD | | | | 645,000 | | | | (15,923) | | | | (94,743) | | | | 78,820 | |
Markit CMBX North America AAA-Rated Index, AM Tranche, Version 4 | | | 0.500% | | | | 02/17/51 | | | Deutsche Bank AG | | | N/A | | | | USD | | | | 285,000 | | | | (19,537) | | | | (43,289) | | | | 23,752 | |
| | | | | | | | | | | | | | | | | | | | | | | | | | | | | | | | | | |
Totals | | | $ | 154,330 | | | $ | 51,715 | | | $ | 102,615 | |
| | | | | | | | | | | | | | | | | | | | | | | | | | | | | | | | | | |
Securities in the amount of $10,105 has been received at the custodian bank as collateral for swap contracts.
| (a) | If the Portfolio is a buyer of protection and a credit event occurs, as defined under the terms of that particular swap agreement, the Portfolio will either (i) receive from the seller of protection an amount equal to the notional amount of the swap and deliver the referenced obligation or underlying securities comprising the referenced index or (ii) receive a net settlement amount in the form of cash or securities equal to the notional amount of the swap less the recovery value of the referenced obligation or underlying securities comprising the referenced index. |
| (b) | Implied credit spreads, represented in absolute terms, utilized in determining the market value of credit default swap agreements on corporate issues or indices as of period end serve as an indicator of the current status of the payment/performance risk and represent the likelihood or risk of default for the credit derivative. The implied credit spread of a particular referenced entity reflects the cost of buying/selling protection and may include upfront payments required to be made to enter into the agreement. Wider credit spreads represent a deterioration of the referenced entity’s credit soundness and a greater likelihood or risk of default or other credit event occurring as defined under the terms of the agreement. A credit spread identified as “Defaulted” indicates a credit event has occurred for the referenced entity or obligation. |
| (c) | The maximum potential amount of future undiscounted payments that the Portfolio could be required to make under a credit default swap contract would be the notional amount of the contract. These potential amounts would be partially offset by any recovery values of the referenced debt obligation or net amounts received from the settlement purchased protection credit default swap contracts entered into by the Portfolio for the same referenced debt obligation. |
| (d) | If the Portfolio is a seller of protection and a credit event occurs, as defined under the terms of that particular swap agreement, the Portfolio will either (i) pay to the buyer of protection an amount equal to the notional amount of the swap and take delivery of the referenced obligation or underlying securities comprising the referenced index or (ii) pay a net settlement amount in the form of cash or securities equal to the notional amount of the swap less the recovery value of the referenced obligation or underlying securities comprising the referenced index. |
| (CDI)— | Brazil Interbank Deposit Rate |
| (EURIBOR)— | Euro InterBank Offered Rate |
| (LIBOR)— | London InterBank Offered Rate |
| (TIIE)— | Interbank Equilibrium Interest Rate |
See accompanying notes to financial statements.
MSF-21
Metropolitan Series Fund
WMC Balanced Portfolio (formerly, BlackRock Diversified Portfolio)
Schedule of Investments as of December 31, 2013
Fair Value Hierarchy
Accounting principles generally accepted in the United States of America (“GAAP”) define fair market value as the price that the Portfolio would receive to sell an asset or pay to transfer a liability in an orderly transaction between market participants at the measurement date. It establishes a fair value hierarchy that prioritizes inputs to valuation methods and requires disclosure of the fair value hierarchy that segregates fair value measurements into three levels. Levels 1, 2 and 3 of the fair value hierarchy are defined as follows:
Level 1 - unadjusted quoted prices in active markets for identical investments
Level 2 - other significant observable inputs (including, but not limited to, unadjusted quoted prices for similar investments in markets that are either active or inactive; inputs other than quoted prices that are observable such as interest rates, yield curves, volatilities, prepayment speeds, loss severities, credit risks, default rates, etc.)
Level 3 - significant unobservable inputs based on the best information available in the circumstances, to the extent observable inputs are unavailable (including the Portfolio’s own assumptions in determining the fair value of investments)
The inputs or methodologies used for valuing investments are not necessarily an indication of the risk associated with investing in them. Changes to the inputs or methodologies used may result in transfers between levels, which will be recognized as of the beginning of the reporting period. Information on transfers between Level 1 and Level 2, if any, will be disclosed following the fair value hierarchy table below. A reconciliation of Level 3 securities, if any, will also be disclosed following the fair value hierarchy table. For more information about the Portfolio’s policy regarding the valuation of investments, please refer to the Notes to Financial Statements.
The following table summarizes the fair value hierarchy of the Portfolio’s investments as of December 31, 2013:
| | | | | | | | | | | | | | | | |
| Description | | Level 1 | | | Level 2 | | | Level 3 | | | Total | |
Total Common Stocks* | | $ | 911,951,643 | | | $ | — | | | $ | — | | | $ | 911,951,643 | |
Total U.S. Treasury & Government Agencies* | | | — | | | | 262,402,216 | | | | — | | | | 262,402,216 | |
Total Corporate Bonds & Notes* | | | — | | | | 113,262,301 | | | | — | | | | 113,262,301 | |
Total Asset-Backed Securities* | | | — | | | | 91,927,489 | | | | — | | | | 91,927,489 | |
Total Mortgage-Backed Securities* | | | — | | | | 65,215,003 | | | | — | | | | 65,215,003 | |
Total Foreign Government* | | | — | | | | 5,391,226 | | | | — | | | | 5,391,226 | |
Total Floating Rate Loans* | | | — | | | | 1,934,447 | | | | — | | | | 1,934,447 | |
Total Preferred Stocks* | | | 1,474,348 | | | | — | | | | — | | | | 1,474,348 | |
Total Municipals | | | — | | | | 1,230,112 | | | | — | | | | 1,230,112 | |
| Purchased Options | | | | | | | | | | | | | | | | |
Call Options | | | — | | | | 36,942 | | | | — | | | | 36,942 | |
Put Options | | | 146,475 | | | | 280,524 | | | | — | | | | 426,999 | |
Total Purchased Options | | | 146,475 | | | | 317,466 | | | | — | | | | 463,941 | |
| Short-Term Investments | | | | | | | | | | | | | | | | |
Mutual Fund | | | 21,850,278 | | | | — | | | | — | | | | 21,850,278 | |
Repurchase Agreement | | | — | | | | 18,428,000 | | | | — | | | | 18,428,000 | |
Total Short-Term Investments | | | 21,850,278 | | | | 18,428,000 | | | | — | | | | 40,278,278 | |
Total Investments | | $ | 935,422,744 | | | $ | 560,108,260 | | | $ | — | | | $ | 1,495,531,004 | |
| | | | | | | | | | | | | | | | | |
Collateral for securities loaned (Liability) | | $ | — | | | $ | (21,850,278 | ) | | $ | — | | | $ | (21,850,278 | ) |
Forward Sales Commitments | | $ | — | | | $ | (32,446,929 | ) | | $ | — | | | $ | (32,446,929 | ) |
| Forward Contracts | | | | | | | | | | | | | | | | |
Forward Foreign Currency Exchange Contracts (Unrealized Appreciation) | | $ | — | | | $ | 62,910 | | | $ | — | | | $ | 62,910 | |
Forward Foreign Currency Exchange Contracts (Unrealized Depreciation) | | | — | | | | (119,454 | ) | | | — | | | | (119,454 | ) |
Total Forward Contracts | | $ | — | | | $ | (56,544 | ) | | $ | — | | | $ | (56,544 | ) |
| Futures Contracts | | | | | | | | | | | | | | | | |
Futures Contracts (Unrealized Appreciation) | | $ | 685,995 | | | $ | — | | | $ | — | | | $ | 685,995 | |
Futures Contracts (Unrealized Depreciation) | | | (197,610 | ) | | | — | | | | — | | | | (197,610 | ) |
Total Futures Contracts | | $ | 488,385 | | | $ | — | | | $ | — | | | $ | 488,385 | |
See accompanying notes to financial statements.
MSF-22
Metropolitan Series Fund
WMC Balanced Portfolio (formerly, BlackRock Diversified Portfolio)
Schedule of Investments as of December 31, 2013
Fair Value Hierarchy—(Continued)
| | | | | | | | | | | | | | | | |
| Description | | Level 1 | | | Level 2 | | | Level 3 | | | Total | |
| Written Options | | | | | | | | | | | | | | | | |
Foreign Currency Written Options at Value | | $ | — | | | $ | (71,893 | ) | | $ | — | | | $ | (71,893 | ) |
Interest Rate Swaptions at Value | | | — | | | | (27,907 | ) | | | — | | | | (27,907 | ) |
Options on Exchange-Traded Futures | | | | | | | | | | | | | | | | |
Contracts at Value | | | (35,263 | ) | | | — | | | | — | | | | (35,263 | ) |
Total Written Options | | $ | (35,263 | ) | | $ | (99,800 | ) | | $ | — | | | $ | (135,063 | ) |
| Centrally Cleared Swap Contracts | | | | | | | | | | | | | | | | |
Centrally Cleared Swap Contracts (Unrealized Appreciation) | | $ | — | | | $ | 55,017 | | | $ | — | | | $ | 55,017 | |
Centrally Cleared Swap Contracts (Unrealized Depreciation) | | | — | | | | (87,115 | ) | | | — | | | | (87,115 | ) |
Total Centrally Cleared Swap Contracts | | $ | — | | | $ | (32,098 | ) | | $ | — | | | $ | (32,098 | ) |
| OTC Swap Contracts | | | | | | | | | | | | | | | | |
OTC Swap Contracts at Value (Assets) | | $ | — | | | $ | 425,902 | | | $ | — | | | $ | 425,902 | |
OTC Swap Contracts at Value (Liabilities) | | | — | | | | (70,339 | ) | | | — | | | | (70,339 | ) |
Total OTC Swap Contracts | | $ | — | | | $ | 355,563 | | | $ | — | | | $ | 355,563 | |
Total Reverse Repurchase Agreements (Liability) | | $ | — | | | $ | (62,442,363 | ) | | $ | — | | | $ | (62,442,363 | ) |
| * | See Schedule of Investments for additional detailed categorizations. |
Following is a reconciliation of Level 3 assets for which significant unobservable inputs were used to determine fair value:
| | | | | | | | | | | | | | | | | | | | | | | | | | | | | | | | | | | | |
Investments in Securities | | Balance as of
December 31,
2012 | | | Realized
Gain/
(Loss) | | | Change in
Unrealized
Appreciation/
(Depreciation) | | | Purchases | | | Sales | | | Transfers
in to
Level 3 | | | Transfers
out of
Level 3 | | | Balance as of
December 31,
2013 | | | Change in Unrealized
Appreciation/
(Depreciation) from
investments still held at
December 31, 2013 | |
| Asset-Backed Securities | | | | | | | | | | | | | | | | | | | | | | | | | | | | | | | | | | | | |
Asset Backed - Other | | $ | 2,409,500 | | | $ | — | | | $ | — | | | $ | — | | | $ | — | | | $ | — | | | $ | (2,409,500 | ) | | $ | — | | | $ | — | |
| | | | | | | | | | | | | | | | | | | | | | | | | | | | | | | | | | | | |
Asset-backed securities were transferred out of level 3 due to the initiation of a vendor or broker providing quotations based on market activity which has been determined to be a significant observable input.
See accompanying notes to financial statements.
MSF-23
Metropolitan Series Fund
WMC Balanced Portfolio (formerly, BlackRock Diversified Portfolio)
Statement of Assets and Liabilities
December 31, 2013
| | | | |
Assets | | | | |
Investments at value (a) (b) | | $ | 1,495,531,004 | |
Cash denominated in foreign currencies (c) | | | 98,872 | |
Cash collateral for swap contracts | | | 490,000 | |
OTC swap contracts at market value (d) | | | 425,902 | |
Unrealized appreciation on forward foreign currency exchange contracts | | | 62,910 | |
Receivable for: | | | | |
Investments sold | | | 7,873,486 | |
TBA securities sold (e) | | | 80,462,526 | |
Fund shares sold | | | 65,005 | |
Principal paydowns | | | 16,318 | |
Dividends and interest | | | 3,632,060 | |
Variation margin on futures contracts | | | 44,670 | |
Interest on swap contracts | | | 14,357 | |
Prepaid expenses | | | 4,820 | |
| | | | |
Total Assets | | | 1,588,721,930 | |
Liabilities | | | | |
Due to custodian | | | 195,343 | |
Written options at value (f) | | | 135,063 | |
Forward sales commitments, at value | | | 32,446,929 | |
Reverse repurchase agreements | | | 62,442,363 | |
OTC swap contracts at market value (g) | | | 70,339 | |
Cash collateral for swap contracts | | | 165,000 | |
Unrealized depreciation on forward foreign currency exchange contracts | | | 119,454 | |
Collateral for securities loaned | | | 21,850,278 | |
Payables for: | | | | |
Investments purchased | | | 4,932,464 | |
TBA securities purchased | | | 104,150,105 | |
Fund shares redeemed | | | 377,555 | |
Variation margin on swap contracts | | | 32,754 | |
Interest on forward sales commitments | | | 55,752 | |
Accrued expenses: | | | | |
Management fees | | | 519,266 | |
Distribution and service fees | | | 20,356 | |
Deferred trustees’ fees | | | 50,220 | |
Other expenses | | | 204,907 | |
| | | | |
Total Liabilities | | | 227,768,148 | |
| | | | |
Net Assets | | $ | 1,360,953,782 | |
| | | | |
Net assets consist of: | | | | |
Paid in surplus | | $ | 1,124,573,540 | |
Undistributed net investment income | | | 26,722,022 | |
Accumulated net realized loss | | | (21,763,166 | ) |
Unrealized appreciation on investments, written options, futures contracts, swap contracts and foreign currency transactions | | | 231,421,386 | |
| | | | |
Net Assets | | $ | 1,360,953,782 | |
| | | | |
Net Assets | | | | |
Class A | | $ | 1,249,087,020 | |
Class B | | | 74,984,045 | |
Class E | | | 36,882,717 | |
Capital Shares Outstanding* | | | | |
Class A | | | 60,663,745 | |
Class B | | | 3,661,189 | |
Class E | | | 1,795,263 | |
Net Asset Value, Offering Price and Redemption Price Per Share | | | | |
Class A | | $ | 20.59 | |
Class B | | | 20.48 | |
Class E | | | 20.54 | |
| * | The Portfolio is authorized to issue an unlimited number of shares. |
| (a) | Identified cost of investments was $1,264,872,150. |
| (b) | Includes securities loaned at value of $21,608,253. |
| (c) | Identified cost of cash denominated in foreign currencies was $98,528. |
| (d) | Net premium received on swap contracts was $226,418. |
| (e) | Includes $32,539,965 related to TBA sale commitments. |
| (f) | Premiums received on written options were $107,889. |
| (g) | Net premium received on swap contracts was $138,032. |
Statement of Operations
Year Ended December 31, 2013
| | | | |
Investment Income | | | | |
Dividends (a) | | $ | 13,739,709 | |
Interest | | | 17,317,154 | |
Securities lending income | | | 130,077 | |
| | | | |
Total investment income | | | 31,186,940 | |
Expenses | | | | |
Management fees | | | 5,933,205 | |
Administration fees | | | 18,188 | |
Custodian and accounting fees | | | 289,210 | |
Distribution and service fees—Class B | | | 179,530 | |
Distribution and service fees—Class E | | | 53,851 | |
Audit and tax services | | | 80,110 | |
Legal | | | 30,260 | |
Trustees’ fees and expenses | | | 35,359 | |
Shareholder reporting | | | 232,364 | |
Insurance | | | 6,647 | |
Miscellaneous | | | 13,908 | |
| | | | |
Total expenses | | | 6,872,632 | |
| | | | |
Net Investment Income | | | 24,314,308 | |
| | | | |
Net Realized and Unrealized Gain | | | | |
| Net realized gain on: | | | | |
Investments | | | 71,606,551 | |
Net increase from payments by affiliates (b) | | | 299,000 | |
Futures contracts | | | 5,985,606 | |
Written options | | | 3,529,732 | |
Swap contracts | | | 5,276,928 | |
Foreign currency transactions | | | 451,705 | |
| | | | |
Net realized gain | | | 87,149,522 | |
| | | | |
| Net change in unrealized appreciation (depreciation) on: | | | | |
Investments | | | 131,574,352 | |
Futures contracts | | | (269,885 | ) |
Written options | | | 436,267 | |
Swap contracts | | | (358,158 | ) |
Foreign currency transactions | | | (64,024 | ) |
| | | | |
Net change in unrealized appreciation | | | 131,318,552 | |
| | | | |
Net realized and unrealized gain | | | 218,468,074 | |
| | | | |
Net Increase in Net Assets From Operations | | $ | 242,782,382 | |
| | | | |
| (a) | Net of foreign withholding taxes of $49,693. |
| (b) | See Note 6 of the Notes to Financial Statements. |
See accompanying notes to financial statements.
MSF-24
Metropolitan Series Fund
WMC Balanced Portfolio (formerly, BlackRock Diversified Portfolio)
Statements of Changes in Net Assets
| | | | | | | | |
| | | Year Ended
December 31,
2013 | | | Year Ended
December 31,
2012 | |
Increase (Decrease) in Net Assets: | | | | | | | | |
From Operations | | | | | | | | |
Net investment income | | $ | 24,314,308 | | | $ | 27,869,693 | |
Net realized gain | | | 87,149,522 | | | | 66,402,098 | |
Net change in unrealized appreciation | | | 131,318,552 | | | | 51,897,109 | |
| | | | | | | | |
Increase in net assets from operations | | | 242,782,382 | | | | 146,168,900 | |
| | | | | | | | |
From Distributions to Shareholders | | | | | | | | |
Net investment income | | | | | | | | |
Class A | | | (29,469,679 | ) | | | (26,542,556 | ) |
Class B | | | (1,608,768 | ) | | | (1,452,240 | ) |
Class E | | | (844,948 | ) | | | (780,158 | ) |
| | | | | | | | |
Total distributions | | | (31,923,395 | ) | | | (28,774,954 | ) |
| | | | | | | | |
Decrease in net assets from capital share transactions | | | (90,973,572 | ) | | | (106,073,967 | ) |
| | | | | | | | |
Total increase in net assets | | | 119,885,415 | | | | 11,319,979 | |
| | |
Net Assets | | | | | | | | |
Beginning of period | | | 1,241,068,367 | | | | 1,229,748,388 | |
| | | | | | | | |
End of period | | $ | 1,360,953,782 | | | $ | 1,241,068,367 | |
| | | | | | | | |
| | |
Undistributed net investment income | | | | | | | | |
End of period | | $ | 26,722,022 | | | $ | 31,125,871 | |
| | | | | | | | |
Other Information:
Capital Shares
Transactions in capital shares were as follows:
| | | | | | | | | | | | | | | | |
| | | Year Ended
December 31, 2013 | | | Year Ended
December 31, 2012 | |
| | | Shares | | | Value | | | Shares | | | Value | |
Class A | | | | | | | | | | | | | | | | |
Sales | | | 1,816,467 | | | $ | 34,142,526 | | | | 875,127 | | | $ | 14,858,006 | |
Reinvestments | | | 1,648,192 | | | | 29,469,679 | | | | 1,580,855 | | | | 26,542,556 | |
Redemptions | | | (7,721,804 | ) | | | (145,181,520 | ) | | | (8,144,906 | ) | | | (138,244,740 | ) |
| | | | | | | | | | | | | | | | |
Net decrease | | | (4,257,145 | ) | | $ | (81,569,315 | ) | | | (5,688,924 | ) | | $ | (96,844,178 | ) |
| | | | | | | | | | | | | | | | |
Class B | | | | | | | | | | | | | | | | |
Sales | | | 236,375 | | | $ | 4,430,064 | | | | 393,605 | | | $ | 6,645,534 | |
Reinvestments | | | 90,329 | | | | 1,608,768 | | | | 86,805 | | | | 1,452,240 | |
Redemptions | | | (609,866 | ) | | | (11,469,641 | ) | | | (805,787 | ) | | | (13,617,740 | ) |
| | | | | | | | | | | | | | | | |
Net decrease | | | (283,162 | ) | | $ | (5,430,809 | ) | | | (325,377 | ) | | $ | (5,519,966 | ) |
| | | | | | | | | | | | | | | | |
Class E | | | | | | | | | | | | | | | | |
Sales | | | 56,048 | | | $ | 1,067,699 | | | | 46,068 | | | $ | 784,938 | |
Reinvestments | | | 47,309 | | | | 844,948 | | | | 46,521 | | | | 780,158 | |
Redemptions | | | (312,756 | ) | | | (5,886,095 | ) | | | (311,046 | ) | | | (5,274,919 | ) |
| | | | | | | | | | | | | | | | |
Net decrease | | | (209,399 | ) | | $ | (3,973,448 | ) | | | (218,457 | ) | | $ | (3,709,823 | ) |
| | | | | | | | | | | | | | | | |
Decrease derived from capital shares transactions | | | | | | $ | (90,973,572 | ) | | | | | | $ | (106,073,967 | ) |
| | | | | | | | | | | | | | | | |
See accompanying notes to financial statements.
MSF-25
Metropolitan Series Fund
WMC Balanced Portfolio (formerly, BlackRock Diversified Portfolio)
Financial Highlights
| | | | | | | | | | | | | | | | | | | | |
| Selected per share data | | | | | | | | | | | | | | | |
| | | Class A | |
| | | Year Ended December 31, | |
| | | 2013 | | | 2012 | | | 2011 | | | 2010 | | | 2009 | |
Net Asset Value, Beginning of Period | | $ | 17.52 | | | $ | 15.95 | | | $ | 15.72 | | | $ | 14.61 | | | $ | 13.18 | |
| | | | | | | | | | | | | | | | | | | | |
Income (Loss) from Investment Operations | | | | | | | | | | | | | | | | | | | | |
Net investment income (a) | | | 0.36 | | | | 0.38 | | | | 0.36 | | | | 0.33 | | | | 0.35 | |
Net realized and unrealized gain on investments | | | 3.18 | | | | 1.58 | | | | 0.26 | | | | 1.06 | | | | 1.78 | |
| | | | | | | | | | | | | | | | | | | | |
Total from investment operations | | | 3.54 | | | | 1.96 | | | | 0.62 | | | | 1.39 | | | | 2.13 | |
| | | | | | | | | | | | | | | | | | | | |
Less Distributions | | | | | | | | | | | | | | | | | | | | |
Distributions from net investment income | | | (0.47 | ) | | | (0.39 | ) | | | (0.39 | ) | | | (0.28 | ) | | | (0.70 | ) |
| | | | | | | | | | | | | | | | | | | | |
Total distributions | | | (0.47 | ) | | | (0.39 | ) | | | (0.39 | ) | | | (0.28 | ) | | | (0.70 | ) |
| | | | | | | | | | | | | | | | | | | | |
Net Asset Value, End of Period | | $ | 20.59 | | | $ | 17.52 | | | $ | 15.95 | | | $ | 15.72 | | | $ | 14.61 | |
| | | | | | | | | | | | | | | | | | | | |
Total Return (%) (b) (c) | | | 20.59 | | | | 12.38 | | | | 3.80 | | | | 9.65 | | | | 17.30 | |
| | | | | |
Ratios/Supplemental Data | | | | | | | | | | | | | | | | | | | | |
Ratio of expenses to average net assets (%) | | | 0.51 | | | | 0.52 | | | | 0.51 | | | | 0.50 | | | | 0.52 | |
Ratio of net investment income to average net assets (%) | | | 1.89 | | | | 2.23 | | | | 2.23 | | | | 2.21 | | | | 2.67 | |
Portfolio turnover rate (%) | | | 340 | (d) | | | 494 | (d) | | | 942 | | | | 1,014 | | | | 611 | |
Net assets, end of period (in millions) | | $ | 1,249.1 | | | $ | 1,137.3 | | | $ | 1,126.6 | | | $ | 1,216.2 | | | $ | 1,256.9 | |
| | | | | | | | | | | | | | | | | | | | |
| | | Class B | |
| | | Year Ended December 31, | |
| | | 2013 | | | 2012 | | | 2011 | | | 2010 | | | 2009 | |
Net Asset Value, Beginning of Period | | $ | 17.43 | | | $ | 15.88 | | | $ | 15.65 | | | $ | 14.55 | | | $ | 13.11 | |
| | | | | | | | | | | | | | | | | | | | |
Income (Loss) from Investment Operations | | | | | | | | | | | | | | | | | | | | |
Net investment income (a) | | | 0.31 | | | | 0.33 | | | | 0.32 | | | | 0.29 | | | | 0.32 | |
Net realized and unrealized gain on investments | | | 3.16 | | | | 1.57 | | | | 0.26 | | | | 1.06 | | | | 1.77 | |
| | | | | | | | | | | | | | | | | | | | |
Total from investment operations | | | 3.47 | | | | 1.90 | | | | 0.58 | | | | 1.35 | | | | 2.09 | |
| | | | | | | | | | | | | | | | | | | | |
Less Distributions | | | | | | | | | | | | | | | | | | | | |
Distributions from net investment income | | | (0.42 | ) | | | (0.35 | ) | | | (0.35 | ) | | | (0.25 | ) | | | (0.65 | ) |
| | | | | | | | | | | | | | | | | | | | |
Total distributions | | | (0.42 | ) | | | (0.35 | ) | | | (0.35 | ) | | | (0.25 | ) | | | (0.65 | ) |
| | | | | | | | | | | | | | | | | | | | |
Net Asset Value, End of Period | | $ | 20.48 | | | $ | 17.43 | | | $ | 15.88 | | | $ | 15.65 | | | $ | 14.55 | |
| | | | | | | | | | | | | | | | | | | | |
Total Return (%) (b) (c) | | | 20.28 | | | | 12.11 | | | | 3.59 | | | | 9.31 | | | | 17.00 | |
| | | | | |
Ratios/Supplemental Data | | | | | | | | | | | | | | | | | | | | |
Ratio of expenses to average net assets (%) | | | 0.76 | | | | 0.77 | | | | 0.76 | | | | 0.75 | | | | 0.77 | |
Ratio of net investment income to average net assets (%) | | | 1.64 | | | | 1.98 | | | | 1.98 | | | | 1.97 | | | | 2.42 | |
Portfolio turnover rate (%) | | | 340 | (d) | | | 494 | (d) | | | 942 | | | | 1,014 | | | | 611 | |
Net assets, end of period (in millions) | | $ | 75.0 | | | $ | 68.7 | | | $ | 67.8 | | | $ | 72.4 | | | $ | 70.4 | |
Please see following page for Financial Highlights footnote legend.
See accompanying notes to financial statements.
MSF-26
Metropolitan Series Fund
WMC Balanced Portfolio (formerly, BlackRock Diversified Portfolio)
Financial Highlights
| | | | | | | | | | | | | | | | | | | | |
| Selected per share data | | | | | | | | | | | | | | | |
| | | Class E | |
| | | Year Ended December 31, | |
| | | 2013 | | | 2012 | | | 2011 | | | 2010 | | | 2009 | |
Net Asset Value, Beginning of Period | | $ | 17.48 | | | $ | 15.92 | | | $ | 15.70 | | | $ | 14.59 | | | $ | 13.15 | |
| | | | | | | | | | | | | | | | | | | | |
Income (Loss) from Investment Operations | | | | | | | | | | | | | | | | | | | | |
Net investment income (a) | | | 0.33 | | | | 0.35 | | | | 0.33 | | | | 0.31 | | | | 0.34 | |
Net realized and unrealized gain on investments | | | 3.17 | | | | 1.57 | | | | 0.26 | | | | 1.06 | | | | 1.77 | |
| | | | | | | | | | | | | | | | | | | | |
Total from investment operations | | | 3.50 | | | | 1.92 | | | | 0.59 | | | | 1.37 | | | | 2.11 | |
| | | | | | | | | | | | | | | | | | | | |
Less Distributions | | | | | | | | | | | | | | | | | | | | |
Distributions from net investment income | | | (0.44 | ) | | | (0.36 | ) | | | (0.37 | ) | | | (0.26 | ) | | | (0.67 | ) |
| | | | | | | | | | | | | | | | | | | | |
Total distributions | | | (0.44 | ) | | | (0.36 | ) | | | (0.37 | ) | | | (0.26 | ) | | | (0.67 | ) |
| | | | | | | | | | | | | | | | | | | | |
Net Asset Value, End of Period | | $ | 20.54 | | | $ | 17.48 | | | $ | 15.92 | | | $ | 15.70 | | | $ | 14.59 | |
| | | | | | | | | | | | | | | | | | | | |
Total Return (%) (b) (c) | | | 20.39 | | | | 12.18 | | | | 3.67 | | | | 9.45 | | | | 17.14 | |
| | | | | |
Ratios/Supplemental Data | | | | | | | | | | | | | | | | | | | | |
Ratio of expenses to average net assets (%) | | | 0.66 | | | | 0.67 | | | | 0.66 | | | | 0.65 | | | | 0.67 | |
Ratio of net investment income to average net assets (%) | | | 1.74 | | | | 2.08 | | | | 2.07 | | | | 2.06 | | | | 2.54 | |
Portfolio turnover rate (%) | | | 340 | (d) | | | 494 | (d) | | | 942 | | | | 1,014 | | | | 611 | |
Net assets, end of period (in millions) | | $ | 36.9 | | | $ | 35.0 | | | $ | 35.4 | | | $ | 40.9 | | | $ | 44.4 | |
| (a) | Per share amounts based on average shares outstanding during the period. |
| (b) | Total return does not reflect any insurance, sales, separate account or administrative charges of variable annuity or life insurance contracts or any additional expenses that contract owners may bear under their variable contracts. If these charges were included, the returns would be lower. |
| (c) | In 2013, 0.04%, 0.04% and 0.04% of the Portfolio’s total return for Class A, Class B and Class E, respectively, consists of a voluntary reimbursement by the subadvisor (see Note 6 of the Notes to Financial Statements). Excluding this item, total return would have been 20.55%, 20.24% and 20.35% for Class A, Class B and Class E, respectively. |
| (d) | Includes mortgage dollar roll and TBA transactions; excluding these transactions the portfolio turnover rate would have been 139% and 243% for 2013 and 2012, respectively. |
See accompanying notes to financial statements.
MSF-27
Metropolitan Series Fund
WMC Balanced Portfolio (formerly, BlackRock Diversified Portfolio)
Notes to Financial Statements—December 31, 2013
1. Organization
Metropolitan Series Fund (the “Trust”) is organized as a Delaware statutory trust and registered under the Investment Company Act of 1940, as amended (the “1940 Act”), as an open-end management investment company. The Trust is currently comprised of thirty series, each of which operates as a distinct investment vehicle of the Trust. The portfolio included in this report is WMC Balanced Portfolio, formerly known as BlackRock Diversified Portfolio (the “Portfolio”), which is diversified. Shares in the Portfolio are not offered directly to the general public and are currently available only to separate accounts established by Metropolitan Life Insurance Company (“MetLife”) and other affiliated life insurance companies.
The Portfolio has registered and offers three classes of shares: Class A, B, and E shares. Shares of each Class of the Portfolio represent an equal pro rata interest in the Portfolio and generally give the shareholder the same voting, dividend, liquidation, and other rights. Investment income, realized and unrealized capital gains and losses, the common expenses of the Portfolio, and certain Portfolio-level expense reductions, if any, are allocated on a pro rata basis to each Class based on the relative net assets of each Class to the net assets of the Portfolio. Each Class of shares differs in its respective distribution plan and such distribution expenses are allocated to that Class.
2. Significant Accounting Policies
The preparation of financial statements in conformity with accounting principles generally accepted in the United States of America (“GAAP”) requires management to make estimates and assumptions that affect the reported amounts of assets and liabilities and disclosure of contingent assets and liabilities as of the date of the financial statements and the reported amounts of income and expenses during the reporting period. Actual results could differ from those estimates. In the preparation of these financial statements, management has evaluated events and transactions subsequent to December 31, 2013 through the date the financial statements were issued.
The following is a summary of significant accounting policies consistently followed by the Portfolio in the preparation of its financial statements.
Investment Valuation and Fair Value Measurements - Debt securities (other than short term obligations with a remaining maturity of sixty days or less), including corporate, convertible and municipal bonds and notes; obligations of the U.S. treasury and U.S. government agencies; sovereign issues; floating rate loans; and non-U.S. bonds, are generally valued on the basis of evaluated or composite bid quotations obtained from independent pricing services and/or brokers and dealers selected by MetLife Advisers, LLC (“MetLife Advisers” or the “Adviser”), an affiliate of MetLife, Inc., pursuant to authorization of the Board of Trustees of the Trust (the “Board” or “Trustees”). Such quotations utilize matrix pricing, which considers observable inputs including, among other things, issuer details, maturity dates, interest rates, yield curves, rates of prepayment, credit risks/spreads, default rates, reported trades, broker dealer quotes and quoted prices for similar securities. Securities that use similar valuation techniques and inputs as described above are generally categorized as Level 2 within the fair value hierarchy.
Mortgage and asset-backed securities are usually issued as separate tranches, or classes, of securities within each deal. These securities are also generally valued on the basis of evaluated or composite bid quotations obtained from independent pricing services and/or brokers and dealers selected by the Adviser pursuant to authorization of the Board. The pricing models for these securities usually consider tranche-level attributes, estimated cash flows and market-based yield spreads for each tranche and current market data, and incorporate deal collateral performance, as available. Mortgage and asset-backed securities that use similar valuation techniques and inputs as described above are generally categorized as Level 2 within the fair value hierarchy.
Short term obligations with a remaining maturity of sixty days or less are generally valued at amortized cost, which approximates fair market value, and are generally categorized as Level 2 within the fair value hierarchy.
Domestic and foreign equity securities, such as common stock, exchange-traded funds, rights, warrants, and preferred stock, that are traded on a securities exchange, are generally valued at their last sale price on the exchange or market in which they are principally traded on the valuation date, or, if no sales occurred on that day, at the last reported bid price. Equity securities traded over-the-counter are generally valued at the last reported sale price. Valuation adjustments may be applied to certain foreign equity securities that are traded solely on foreign exchanges that close before the close of the U.S. market to account for the market movement between the close of the foreign exchanges and the close of the U.S. market. The Portfolio may use a systematic fair valuation model provided by an independent third party to value securities principally traded in these foreign markets in order to adjust for possible stale pricing that may occur between the close of the foreign exchanges and the time of the Portfolio valuation. Foreign equity securities using these valuation adjustments are generally categorized as Level 2 within the fair value hierarchy. Equity securities that are actively traded, and have no valuation adjustments applied, are categorized as Level 1 within the fair value hierarchy. Other equity securities traded on inactive markets, or valued in reference to similar instruments traded on active markets, are generally categorized as Level 2 within the fair value hierarchy.
MSF-28
Metropolitan Series Fund
WMC Balanced Portfolio (formerly, BlackRock Diversified Portfolio)
Notes to Financial Statements—December 31, 2013—(Continued)
Investments in registered open-end management investment companies are valued at reported net asset value per share on the valuation date and are categorized as Level 1 within the fair value hierarchy.
Forward foreign currency exchange contracts are valued through an independent pricing service based on the mean between closing bid and ask prices of the forward currency rates in the London foreign exchange markets on a daily basis as provided by a reliable bank or dealer. These contracts are generally categorized as Level 2 within the fair value hierarchy.
Options, whether on securities, indices, futures contracts, or otherwise, traded on exchanges are valued at the last sale price available as of the close of business on the valuation date or, if there is no such price available, at the mean between the last reported bid and ask prices. These types of options are categorized as Level 1 within the fair value hierarchy. Futures contracts, which are traded on commodity exchanges, are valued at their closing prices as of the close of such exchanges and are categorized as Level 1 within the fair value hierarchy.
Options and futures contracts that are traded over-the-counter are generally valued on the basis of quotations provided by broker-dealers or prices provided by pricing service providers who use a series of techniques, including simulation pricing models, to determine the value of the contracts. The pricing models use inputs that are observed from actively quoted markets such as issuer details, indices, spreads, interest rates, yield curves, credit curves, measures of volatility and exchange rates. These contracts are generally categorized as Level 2 within the fair value hierarchy.
Swap contracts (other than centrally cleared swaps) are marked-to-market daily based on quotations and prices supplied by market makers, broker-dealers and other pricing services. Such quotations and prices are derived utilizing significant observable data, including the underlying reference securities or indices. These contracts are generally categorized as Level 2 within the fair value hierarchy.
Centrally cleared swaps listed or traded on a multilateral or trade facility platform, such as a registered exchange, are valued at the daily settlement price determined by the respective exchange or an independent pricing service when the exchange price is not available. For centrally cleared credit default swaps the clearing facility requires its members to provide actionable price levels across complete term structures. These levels along with external third party prices are used to produce daily settlement prices. These securities are categorized as Level 2 of the fair value hierarchy. Centrally cleared interest rate swaps are valued using a pricing model that references the underlying rates including the overnight index swap rate and London Interbank Offered Rate (“LIBOR”) forward rate to produce the daily settlement price. These securities are categorized as Level 2 of the fair value hierarchy.
If no current market value quotation or other observable inputs are readily available or market value quotations are deemed to be unreliable for a security, the fair value of the security will be determined in accordance with procedures approved by and under the general supervision of the Board. In such a circumstance, the Board has delegated the determination of the fair value of a security to a Valuation Committee (“Committee”) of MetLife Advisers. The Committee provides general pricing oversight and fair value pricing determinations related to portfolio securities and meets on a regular basis to review reports relating to the valuation of the securities in the Portfolio. The Board has delegated to State Street Bank and Trust Company, the Trust’s custodian (“custodian”), the responsibility for calculating the net asset values (“NAVs”) of the Trust’s Portfolios. The Committee is responsible for overseeing the calculation of the NAVs of the Portfolios by the custodian. The Committee also periodically reviews pricing vendors, including the vendor providing fair value pricing for the Portfolio’s foreign securities, and is responsible for overseeing the correction of pricing errors and addressing other pricing issues that arise in the ordinary course of business, such as making real-time fair value determinations, as necessary.
No single standard for determining the fair value of a security can be set forth because fair value depends upon the facts and circumstances with respect to each security. Information relating to any relevant factors may be obtained by the Committee from any appropriate source, including the subadviser of the Portfolio, the custodian, a pricing service, market maker and/or broker for such security or the issuer. Appropriate methodologies for determining fair value under particular circumstances may include: matrix pricing, comparisons of securities with comparable characteristics, value based on multiples of earnings, discount from market price of similar marketable securities or a combination of these and other methods. The Committee maintains a detailed report tracking each fair-valued security that compares the fair value price to the next available trade, vendor or broker price, and provides information on how close the fair value price was to the next quoted price. The Committee reviews a summary of such report monthly. On a quarterly basis, the Board is provided with the following for consideration and ratification or adjustment: (1) a memorandum summarizing the actions taken by the Committee in the prior quarter; and (2) a list of the Portfolio’s securities as of the most recent quarter-end for which market quotations were not readily available.
Investment Transactions and Related Investment Income - Portfolio security transactions are recorded on the trade date. Dividend income is recorded on the ex-dividend date or, for certain foreign securities, when notified. Interest income, which includes amortization of premium and accretion of discount on debt securities, is recorded on the accrual basis. Realized gains and losses on investments are determined on the identified cost basis, which is the same basis used for federal income tax purposes. Foreign income and foreign capital gains on some foreign securities may be subject to foreign taxes, which are accrued as applicable. These foreign taxes have been provided for in accordance with the Portfolio’s understanding of the applicable countries’ tax rules and rates.
MSF-29
Metropolitan Series Fund
WMC Balanced Portfolio (formerly, BlackRock Diversified Portfolio)
Notes to Financial Statements—December 31, 2013—(Continued)
Foreign Currency Translation - The books and records of the Portfolio are maintained in U.S. dollars. The values of securities, currencies, and other assets and liabilities denominated in currencies other than the U.S. dollar are translated into U.S. dollars based upon foreign exchange rates prevailing at the end of the period. Purchases and sales of investment securities, income, and expenses are translated on the respective dates of such transactions. Because the values of investment securities are translated at the foreign exchange rates prevailing at the end of the period, that portion of the results of operations arising from changes in exchange rates and that portion of the results of operations reflecting fluctuations arising from changes in market prices of the investment securities are not separated. Such fluctuations are included in the net realized and unrealized gain or loss on investments.
Net realized foreign exchange gains or losses arise from activity in forward foreign currency exchange contracts, sales of foreign currency, currency gains or losses realized between the trade and settlement dates on securities transactions, and the difference between the amounts of dividends, interest, and foreign withholding taxes recorded by the Portfolio and the U.S. dollar equivalent of the amounts actually received or paid by the Portfolio. Net unrealized foreign exchange gains and losses arise from changes in the value of assets and liabilities, other than investment securities, resulting from changes in foreign exchange rates.
Income Taxes - It is the Portfolio’s policy to comply with the requirements of the Internal Revenue Code of 1986, as amended, and regulations thereunder, applicable to regulated investment companies and to distribute, with respect to each taxable year, all of its taxable income to shareholders. Therefore, no federal income tax provision is required. The Portfolio files U.S. federal tax returns. No income tax returns are currently under examination. The Portfolio’s federal tax returns for the prior three fiscal years remain subject to examination by the Internal Revenue Service. As of December 31, 2013, the Portfolio had no uncertain tax positions that would require financial statement recognition, or de-recognition or disclosure.
Dividends and Distributions to Shareholders - The Portfolio records dividends and distributions on the ex-dividend date. Net realized gains from security transactions (if any) are generally distributed annually to shareholders. The timing and characterization of certain income and capital gains distributions are determined in accordance with federal tax regulations that may differ from GAAP. Permanent book and tax basis differences relating to shareholder distributions will result in reclassification between under/over distributed net investment income, accumulated net realized gains/losses, and paid-in surplus. Book-tax differences are primarily due to foreign currency transactions, paydown reclasses, premium amortization adjustments, convertible preferred stocks, dollar roll transactions, and swap contract transactions. These adjustments have no impact on net assets or the results of operations.
Securities Lending - The Portfolio may lend its portfolio securities to certain qualified brokers who borrow securities in order to complete certain securities transactions. By lending its portfolio securities, the Portfolio attempts to increase its net investment income through the receipt of income on collateral held from securities on loan. Any gain or loss in the market price of the loaned securities that might occur and any interest earned or dividends declared during the term of the loan would accrue to the account of the Portfolio.
The Trust has entered into a securities lending arrangement with the custodian. Under this arrangement, the custodian is authorized to loan portfolio securities on the Portfolio’s behalf. In exchange, the Portfolio receives either cash or securities as collateral against the loaned securities. The Portfolio receives collateral at least equal to 102% of the market value of the loaned securities (105% for foreign equity securities), at each loan’s inception. Collateral representing at least 100% of the market value of the loaned securities must be maintained for the duration of the loan. A liability for cash collateral is reflected on the Statement of Assets and Liabilities, and is categorized as Level 2 within the fair value hierarchy. Cash collateral is generally invested in the State Street Navigator Securities Lending MET Portfolio (the “Navigator Portfolio”), a series of the State Street Navigator Securities Lending Trust that is managed by an affiliate of the custodian. The Navigator Portfolio is a registered money market fund that invests in a variety of high-quality, U.S. dollar-denominated instruments. If the market value of the collateral at the close of trading on a business day is less than 100% of the market value of the loaned securities at the close of trading on that day, the borrower shall be required to deliver, by the close of business on the following business day, an additional amount of collateral, so that the total amount of posted collateral is equal to at least 100% of the market value of all the loaned securities as of such preceding day. A portion of net income (income after the deduction of expenses and fees of the Navigator Portfolio) on the collateral is rebated to the borrower of the securities and the remainder is split between the custodian and the Portfolio. On loans collateralized by U.S. Treasuries, a fee is received from the borrower and is allocated between the Portfolio and the custodian. The risks associated with lending portfolio securities include, but are not limited to, possible delays in receiving additional collateral or in the recovery of the loaned securities, possible loss of rights in the collateral should the borrower fail financially, as well as risk of loss in the value of the collateral or the value of the investments made with the collateral. The lending agent has agreed to indemnify the Portfolio in the case of default of any securities borrower. Income received by the Portfolio in securities lending transactions during the year ended December 31, 2013 is reflected as Securities lending income on the Statement of Operations. Any outstanding loans by the Portfolio at December 31, 2013 are disclosed in the footnotes to the Schedule of Investments.
Repurchase Agreements - The Portfolio may enter into repurchase agreements, under the terms of a Master Repurchase Agreement, (“MRA”), with selected commercial banks and broker-dealers, under which the Portfolio acquires securities as collateral and agrees to resell the securities at an agreed upon time and at an agreed-upon price. The Portfolio, through the custodian or a subcustodian,
MSF-30
Metropolitan Series Fund
WMC Balanced Portfolio (formerly, BlackRock Diversified Portfolio)
Notes to Financial Statements—December 31, 2013—(Continued)
receives delivery of the underlying securities collateralizing any repurchase agreements. The Portfolio requires the custodian to take possession, to have legally segregated in the Federal Reserve Book Entry System, or to have segregated within the custodian’s vault, all securities held as collateral for repurchase agreements. It is the Portfolio’s policy that the market value of the collateral be at least equal to 100% of the repurchase price in the case of a repurchase agreement of one-day duration and at least equal to 102% of the repurchase price in the case of all other repurchase agreements. In the event of default or failure by a party to perform an obligation in connection with any repurchase transaction, the Master Repurchase Agreement gives the non-defaulting party the right to set-off claims and to apply property held by it in connection with any repurchase transaction against obligations owed to it.
At December 31, 2013, the Portfolio had investments in repurchase agreements with a gross value of $18,428,000, which is included as part of investments at value on the Statement of Assets and Liabilities. The value of the related collateral exceeded the value of the repurchase agreements at December 31, 2013.
Reverse Repurchase Agreements - The Portfolio may enter into reverse repurchase agreements with qualified institutions. In a reverse repurchase agreement, the Portfolio transfers securities in exchange for cash to a financial institution or counterparty, concurrently with an agreement by the Portfolio to re-acquire the same securities at an agreed upon price and date. During the reverse repurchase agreement period, the Portfolio continues to receive principal and interest payments on these securities. The Portfolio will establish a segregated account with its custodian in which it will maintain liquid assets equal in value to its obligations in respect of reverse repurchase agreements. Reverse repurchase agreements involve the risk that the market value of the securities transferred by the Portfolio may decline below the agreed-upon reacquisition price of the securities. In the event of default or failure by a party to perform an obligation in connection with any reverse repurchase transaction, the Master Repurchase Agreement entitles the non-defaulting party with a right to set-off claims and apply property held by it in respect of any reverse repurchase transaction against obligations owed to it. Cash received in exchange for securities transferred under reverse repurchase agreements plus accrued interest payments to be made by the Portfolio to counterparties are reflected as liabilities on the Statement of Assets and Liabilities. For the year ended December 31, 2013, the Portfolio had an outstanding reverse repurchase agreement balance of 278 days. The average amount of borrowings was $89,862,732 and the weighted average interest rate was (0.054%) during the 278 day period.
The following table is a summary of open reverse repurchase agreements by counterparty which are subject to offset under a MRA on a net basis as of December 31, 2013:
| | | | | | | | | | | | |
Counterparty | | Reverse
Repurchase
Agreements | | | Collateral
Pledged | | | Net
Amount1 | |
Bank of America N.A. | | $ | 14,173,475 | | | $ | (14,097,982 | ) | | $ | 75,493 | |
BNP Paribas S.A | | | 20,693,631 | | | | (20,581,289 | ) | | | 112,342 | |
Credit Suisse International | | | 9,677,625 | | | | (9,636,068 | ) | | | 41,557 | |
Deutsche Bank AG | | | 17,897,632 | | | | (17,892,026 | ) | | | 5,606 | |
| | | | | | | | | | | | |
| | $ | 62,442,363 | | | $ | (62,207,365 | ) | | $ | 234,998 | |
| | | | | | | | | | | | |
| 1 | Net amount represents the net amount payable to the counterparty in the event of default. |
Secured Borrowing Transactions - The Portfolio may enter into transactions consisting of a transfer of a security by the Portfolio to a financial institution or counterparty, with a simultaneous agreement to reacquire the same, or substantially the same security, at an agreed-upon price and future settlement date. Such transactions are treated as secured borrowings, and not as purchases and sales. The Portfolio receives cash from the transfer of the security to use for other investment purposes. During the year ended December 31, 2013, the Portfolio entered into secured borrowing transactions involving U.S. Treasury. During the term of the borrowing, the Portfolio is not entitled to receive principal and interest payments, if any, made on the security transferred to the counterparty during the term of the agreement. The difference between the transfer price and the reacquisition price, known as the “price drop”, is included in net investment income with the cost of the secured borrowing transaction being recorded as interest expense over the term of the borrowing. The agreed upon proceeds for securities to be reacquired by the Portfolio are reflected as a liability on the Statement of Assets and Liabilities. For the year ended December 31, 2013, the Portfolio’s average amount of borrowings was $85,936,152 and the weighted average interest rate was 0.098%. At December 31, 2013, the Portfolio had no outstanding borrowings. For the year ended December 31, 2013, the Portfolio had an outstanding secured borrowing transaction balance for 117 days.
Mortgage Dollar Rolls - The Portfolio may enter into mortgage “dollar rolls” in which a Portfolio sells to-be-announced (“TBA”) mortgage-backed securities for delivery in the current month and simultaneously contracts to repurchase substantially similar (same type, coupon, and maturity) securities on a specified future date. For the duration of the transaction, or roll period, the Portfolio foregoes principal (including prepayments of principal) and interest paid on the securities sold. Dollar rolls are accounted for as purchase and sale transactions; gain or loss is recognized at the commencement of the term of the dollar roll and each time the mortgage-backed security is rolled.
MSF-31
Metropolitan Series Fund
WMC Balanced Portfolio (formerly, BlackRock Diversified Portfolio)
Notes to Financial Statements—December 31, 2013—(Continued)
Treasury and mortgage dollar roll transactions involve the risk that the market value of the securities that the Portfolio is required to repurchase or reacquire may be less than the agreed-upon repurchase price of those securities and that the investment performance of securities purchased with proceeds from these transactions does not exceed the income, capital appreciation, and gain or loss that would have been realized on the securities transferred or sold, as applicable, as part of the treasury or mortgage dollar roll.
Mortgage Related and Other Asset-Backed Securities - The Portfolio may invest in mortgage-related or other asset-backed securities. These securities may include mortgage pass-through securities, collateralized mortgage obligations (“CMOs”), commercial mortgage-backed securities, CMO residuals, stripped mortgage backed securities (“SMBS”), and other securities that directly or indirectly represent a participation in, or are secured by or payable from, mortgage loans on real property or other receivables. The value of some mortgage- or asset-backed securities may be particularly sensitive to changes in prevailing interest rates. Early repayment of principal on some mortgage-related securities may expose the Portfolio to a lower rate of return upon reinvestment of principal. The value of these securities may fluctuate in response to the market’s perception of the creditworthiness of the issuers. Additionally, although mortgages and mortgage-related securities are generally supported by some form of government or private guarantee and/or insurance, there is no assurance that private guarantors or insurers will meet their obligations.
In one type of SMBS, one class receives all of the interest from the mortgage assets (the interest-only or “IO” class), while the other class will receive all of the principal (the principal-only or “PO” class). Because principal will not be received at the maturity of an IO, adjustments are made to the book value of the security until maturity. These adjustments are netted against payments received for the IOs and the net amount is included in interest income on the Statement of Operations of the Portfolio. Payments received for POs are treated as reductions to the cost and par value of the securities. Details of mortgage related and other asset-backed securities held by the Portfolio are included in the Portfolio’s Schedule of Investments.
The Portfolio may invest a significant portion of its assets in securities of issuers that hold mortgage and asset-backed securities and direct investments in securities backed by commercial and residential mortgage loans and other financial assets. The value and related income of these securities are sensitive to changes in economic conditions, including delinquencies and/or defaults, and may be negatively impacted by increased volatility of market prices and periods of illiquidity.
TBA Purchase & Forward Sale Commitments - The Portfolio may enter into TBA commitments to purchase or sell securities for a fixed price at a future date. TBA commitments are considered securities in themselves, and involve a risk of loss if the value of the security to be purchased or sold declines or increases prior to settlement date, which is in addition to the risk of decline in the value of the Portfolio’s other assets. TBA forward sales commitments are valued at the current market value of the underlying securities, according to the procedures described under “Investment Valuation and Fair Value Measurements”.
When-Issued and Delayed-Delivery Securities - The Portfolio may purchase securities on a when-issued or delayed-delivery basis. Settlement of such transactions normally occurs within a month or more after the purchase commitment is made. The Portfolio may purchase securities under such conditions only with the intention of actually acquiring them, but may enter into a separate agreement to sell the securities before the settlement date. Since the value of securities purchased may fluctuate prior to settlement, the Portfolio may be required to pay more at settlement than the security is worth. In addition, the purchaser is not entitled to any of the interest earned prior to settlement.
Upon making a commitment to purchase a security on a when-issued or delayed-delivery basis, the Portfolio will hold liquid assets in a segregated account with the Portfolio’s custodian, or set aside liquid assets in the Portfolio’s records, worth at least the equivalent of the amount due. The liquid assets will be monitored on a daily basis and adjusted as necessary to maintain the necessary value.
High Yield Debt Securities - The Portfolio may invest in high yield debt securities, or “junk bonds,” which are securities that are rated below “investment grade” or, if not rated, are of equivalent quality. A portfolio with high yield debt securities generally will be exposed to greater market risk and credit risk than a portfolio that invests only in investment grade debt securities because issuers of high yield debt securities are generally less secure financially, are more likely to default on their obligations, and their securities are more sensitive to interest rate changes and downturns in the economy. In addition, the secondary market for lower-rated debt securities may not be as liquid as that for more highly rated debt securities. As a result, the Portfolio’s Subadviser may find it more difficult to value lower-rated debt securities or sell them and may have to sell them at prices significantly lower than the values assigned to them by the Portfolio.
3. Investments in Derivative Instruments
Forward Foreign Currency Exchange Contracts - The Portfolio may enter into forward foreign currency exchange contracts to obtain investment exposure, enhance return or hedge or protect its portfolio holdings against the risk of future movements in certain foreign currency exchange rates. When entering into these contracts, the Portfolio agrees to receive or deliver a fixed quantity of foreign currency for an agreed-upon price on an agreed-upon future date. These contracts are valued daily and the Portfolio’s net equity therein, representing unrealized gain or loss on the contracts as measured by the difference between the forward foreign exchange rates at the dates of entry into the contracts and the forward foreign exchange rates at the valuation date, is included in the Statement
MSF-32
Metropolitan Series Fund
WMC Balanced Portfolio (formerly, BlackRock Diversified Portfolio)
Notes to Financial Statements—December 31, 2013—(Continued)
of Assets and Liabilities. When a contract is closed, the Portfolio recognizes a realized gain or loss equal to the difference between the value of the contract at the time it was opened and the value at the time it was closed.
Realized and unrealized gains and losses on forward foreign currency exchange contracts are included in the Statement of Operations. These contracts involve market and/or credit risk in excess of the amount recognized in the Statement of Assets and Liabilities. The use of forward foreign currency exchange contracts does not eliminate fluctuations in the underlying prices of the securities of the Portfolio, but it does establish a rate of exchange that can be achieved in the future. Although forward foreign currency exchange contracts may limit the risk of loss due to a decline in the value of the currency holdings, they also limit any potential gain that might result should the value of the currency increase. In addition, the Portfolio could be exposed to losses if the counterparties to the contracts are unable to meet the terms of the contracts. The Portfolio’s maximum potential loss from such contracts is the aggregate face value in U.S. dollars at the time the contract was opened.
Futures Contracts - The Portfolio may buy and sell futures contracts as a hedge, to maintain investment exposure to a target asset class or to enhance return. The Portfolio may be subject to fluctuations in equity prices, interest rates, commodity prices, and foreign currency exchange rates in the normal course of pursuing its investment objective. Futures contracts are standardized agreements to buy or sell a security, or deliver a final cash settlement price in connection with an index, interest rate, currency, or other asset. The Portfolio must deposit an amount (“initial margin”) equal to a certain percentage of the face value of the futures contract. The initial margin may be in the form of cash or securities, which is returned when the Portfolio’s obligations under the contract have been satisfied. If cash is deposited as the initial margin, it is shown as cash collateral on the Statement of Assets and Liabilities. Futures contracts are marked-to-market daily, and subsequent payments (“variation margin”) are made or received by the Portfolio depending on whether unrealized gains or losses are incurred. These amounts are reflected as receivables or payables on the Statement of Assets and Liabilities and as a component of net change in unrealized appreciation/depreciation on the Statement of Operations. When the contract is closed or expires, the Portfolio records a realized gain or loss equal to the difference between the value of the contract at the time it was opened and the value at the time it was closed. Risks of entering into futures contracts (and related options) include the possibility that the market for these instruments may be illiquid and that a change in the value of the contract or option may not correlate perfectly with changes in the value of the underlying instrument. Futures contracts are exchange-traded and the exchange’s clearinghouse, as counterparty to all exchange-traded futures, guarantees the futures contracts against default. For over-the-counter futures the Portfolio’s ability to terminate the positions may be more limited than in the case of exchange-traded positions and may also involve the risk that securities dealers participating in such transactions would fail to meet their obligations to the Portfolio.
Options Contracts - An option contract purchased by the Portfolio gives the Portfolio the right, but not the obligation, to buy (call) or sell (put) an underlying instrument at a fixed exercise price during a specified period. Call options written by the Portfolio give the holder the right to buy the underlying instrument from the Portfolio at a fixed exercise price; put options written by the Portfolio give the holder the right to sell the underlying instrument to the Portfolio at a fixed exercise price.
The Portfolio may use options to hedge against changes in values of securities the Portfolio owns or expects to purchase, to maintain exposure to the broad equity markets or to enhance return. Writing puts or buying calls tends to increase the Portfolio’s exposure to the underlying instrument and writing calls or buying puts tends to decrease the Portfolio’s exposure to the underlying instrument, and can be used to hedge other Portfolio investments. For options used to hedge the Portfolio’s investments, the potential risk to the Portfolio is that the change in value of options contracts may not correspond perfectly to the change in value of the hedged instruments. The Portfolio also bears the risk of an unfavorable change in the value of the underlying instrument or the risk that the Portfolio may not be able to enter into a closing transaction due to an illiquid market. The Portfolio’s maximum risk of loss from counterparty credit risk, as opposed to investment and other types of risk, in respect of purchased options is typically the premium initially paid for the option plus any unrealized gains.
The main risk associated with purchasing an option is that the option expires without being exercised. In this case, the option is worthless when it expires and the premium paid for the option is considered a realized loss. The risk associated with writing a call option is that the Portfolio may forgo the opportunity for a profit if the market value of the underlying instrument increases and the option is exercised, requiring the Portfolio to sell the underlying instrument at a price below its market value. When the Portfolio writes a call option on a security it does not own, its exposure on such an option is theoretically unlimited. The risk in writing a put option is that the Portfolio may incur a loss if the market value of the underlying instrument decreases and the option is exercised, requiring the Portfolio to purchase the underlying instrument at a price above its market value. In addition, the Portfolio risks not being able to enter into a closing transaction for the written option as the result of an illiquid market for the option.
Purchases of put and call options are recorded as investments, the value of which are marked-to-market daily. When a purchased option expires without being exercised, the Portfolio will realize a loss equal to the premium paid. When the Portfolio enters into a closing sale transaction, the Portfolio will realize a gain or loss depending on whether the sales proceeds from the closing sale transaction are greater or less than the premium initially paid for the option. When the Portfolio exercises a put option, it will realize a gain or loss from the sale of the underlying instrument and the proceeds from such sale will be decreased by the premium originally paid for the put option. When the Portfolio exercises a call option, the cost of the security which the Portfolio purchases upon exercise will be increased by the premium originally paid for the call option.
MSF-33
Metropolitan Series Fund
WMC Balanced Portfolio (formerly, BlackRock Diversified Portfolio)
Notes to Financial Statements—December 31, 2013—(Continued)
The premium received for a written option is recorded as an asset and an equivalent liability. The liability is subsequently marked to market to reflect the current value of the option written. When a written option expires without being exercised or the Portfolio enters into a closing purchase transaction, the Portfolio realizes a gain (or loss if the cost of the closing purchase transaction exceeds the premium received when the option was sold) without regard to any unrealized gain or loss on the underlying instrument and the liability related to such option is eliminated. When a written call option is exercised, the Portfolio realizes a gain or loss, as adjusted for the premium received, from the sale of the underlying instrument. When a written put option is exercised, the premium received is offset against the amount paid for the purchase of the underlying instrument.
The purpose of inflation-capped options is to protect the buyer from inflation, above a specified rate, eroding the value of investments in inflation-linked products with a given notional exposure. Inflation-capped options are used to give downside protection to investments in inflation-linked products by establishing a floor on the value of such products.
Swap Agreements - The Portfolio may enter into swap agreements in which the Portfolio and a counterparty agree to either make periodic net payments on a specified notional amount or net payment upon termination. Swap agreements are either privately negotiated in the over-the-counter market (“OTC swaps”) or executed in a multilateral or other trade facility platform, such as a registered commodities exchange (“centrally-cleared swaps”). The Portfolio may enter into swap agreements for the purposes of managing exposure to interest rate, credit or market risk, or for other purposes. In connection with these agreements, securities or cash may be paid or received, as applicable, by the Portfolio as collateral or margin in accordance with the terms of the respective swap agreements to provide assets of value and recourse in the event of default or bankruptcy/insolvency. Securities posted by the Portfolio as collateral for swap contracts are identified in the Schedule of Investments and restricted cash, if any, is reflected on the Statement of Assets and Liabilities.
Centrally-Cleared Swaps: Certain clearinghouses currently offer clearing for limited types of derivatives transactions, principally credit derivatives. In a cleared derivative transaction, a Portfolio typically enters into the transaction with a financial institution counterparty, and performance of the transaction is effectively guaranteed by a central clearinghouse, thereby reducing or eliminating the Portfolio’s exposure to the credit risk of the original counterparty. The Portfolio typically will be required to post specified levels of margin with the clearinghouse or at the instruction of the clearinghouse; the margin required by a clearinghouse may be greater than the margin the Portfolio would be required to post in an uncleared derivative transaction. Only a limited number of derivative transactions are currently eligible for clearing.
Swap agreements are marked-to-market daily. The fair value of an OTC swap is reflected on the Statement of Assets and Liabilities. The changes in value, if any, are reflected as a component of net change in unrealized appreciation/depreciation on the Statement of Operations. Daily changes in valuation of centrally cleared swaps, if any, are recorded as a receivable or payable for variation margin on the Statement of Assets and Liabilities and as a component of unrealized appreciation/depreciation on the Statement of Operations. Upfront payments paid or received upon entering into the swap agreement compensate for differences between the stated terms of the swap agreement and prevailing market conditions (such as credit spreads, currency exchange rates, interest rates, and other relevant factors). Upon termination or maturity of the swap, upfront premiums are recorded as realized gains or losses on the Statement of Operations. A liquidation payment received or made at the termination of the swap is recorded as realized gain or loss on the Statement of Operations. Net periodic payments received or paid by the Portfolio are included as part of realized gains or losses on the Statement of Operations.
Swap transactions involve, to varying degrees, elements of interest rate, credit, and market risk in excess of the amounts recognized in the Statement of Assets and Liabilities. Such risks involve the possibility that there will be no liquid market for these agreements, that the counterparty to the agreements may default on its obligation to perform, or that there may be unfavorable changes in market conditions or interest rates. In addition, entering into swap agreements involves documentation risk resulting from the possibility that the parties to a swap agreement may disagree as to the meaning of contractual terms in the agreement. The Portfolio may enter into swap transactions with counterparties in accordance with guidelines established by the Board. These guidelines provide for a minimum credit rating for each counterparty and various credit enhancement techniques (for example, collateralization of amounts due from counterparties) to limit exposure to counterparties that have lower credit ratings. A Portfolio’s maximum risk of loss from counterparty credit risk is the discounted value of the net cash flows to be received from the counterparty over the contract’s remaining life, to the extent that amount is positive, or the fair value of the contract. The risk may be mitigated by having a master netting arrangement between the Portfolio and the counterparty and by the posting of collateral by the counterparty to cover the Portfolio’s exposure to the counterparty. Counterparty risk related to centrally-cleared swaps is mitigated due to the protection against defaults provided by the exchange on which these contracts trade.
Credit Default Swaps: The Portfolio is subject to credit risk in the normal course of pursuing its investment objectives. The Portfolio may enter into credit default swaps to manage its exposure to the market or certain sectors of the market, to reduce its risk exposure to defaults of corporate and/or sovereign issuers, or to create exposure to corporate and/or sovereign issuers to which they are not otherwise exposed. Credit default swaps involve one party making a stream of payments (referred to as the buyer of protection) to another party (the seller of protection) in exchange for the right to receive a specified return if a credit event occurs for the
MSF-34
Metropolitan Series Fund
WMC Balanced Portfolio (formerly, BlackRock Diversified Portfolio)
Notes to Financial Statements—December 31, 2013—(Continued)
referenced entity, obligation or index. A credit event is defined under the terms of each swap agreement and may include, but is not limited to, underlying entity default, bankruptcy, write-down, principal shortfall or interest shortfall. As the seller of protection, if an underlying credit event occurs, the Portfolio will either pay the buyer an amount equal to the notional amount of the swap and take delivery of the referenced obligation (or underlying securities comprising the referenced index), or pay a net settlement amount in the form of cash or securities equal to the notional amount of the swap less the recovery value of the referenced obligation (or underlying securities comprising the referenced index). In return, the Portfolio would receive from the counterparty an upfront or periodic stream of payments throughout the life of the credit default swap agreement provided that no credit event has occurred. As the seller of protection, the Portfolio would effectively add leverage to its portfolio because, in addition to its total net assets, the Portfolio would be subject to investment exposure on the notional amount of the credit default swap.
The Portfolio may also purchase credit default swap contracts in order to hedge against the risk of default of debt securities held in its portfolio. This would involve the risk that the investment may be worthless when it expires and would only generate income in the event of an actual default by the issuer of the underlying obligation (as opposed to a credit downgrade or other indication of financial instability). It would also involve credit risk, whereby the seller may fail to satisfy its payment obligations to the Portfolio in the event of a default. As the buyer of protection, if an underlying credit event occurs, the Portfolio will either receive from the seller of protection an amount equal to the notional amount of the swap and deliver the referenced obligation (or underlying securities comprising the referenced index), or receive a net settlement amount in the form of cash or securities equal to the notional amount of the swap less the recovery value of the referenced obligation (or underlying securities comprising the referenced index). If no credit event occurs and the Portfolio is a buyer of protection, the Portfolio will typically recover nothing under the credit default swap agreement, but it will have had to pay the required upfront payment or stream of continuing payments under the credit default swap agreement. Recovery values are at times established through the credit event auction process in which market participants are ensured that a transparent price has been set for the defaulted obligation.
Credit default swap agreements on credit indices involve one party making a stream of payments to another party in exchange for the right to receive a specified return in the event of a write-down, principal shortfall, interest shortfall or default of all or part of the referenced entities comprising the credit index. A credit index is a basket of credit instruments or exposures designed to be representative of some part of the credit market as a whole. An index credit default swap references all the names in the index, and if there is a credit event involving an entity in the index, the credit event is settled based on that entity’s weight in the index. A Portfolio may use credit default swaps on credit indices as a hedge for credit default swaps or bonds held in the portfolio, which is less expensive than it would be to buy many individual credit default swaps to achieve similar effect. Credit default swaps on indices are benchmarks for protecting investors owning bonds against default, and may be used to speculate on changes in credit quality.
Implied credit spreads, represented in absolute terms, utilized in determining the market value of credit default swap agreements on a credit index or corporate or sovereign issuer, serve as some indication of the status of the payment/performance risk and the likelihood or risk of default for the credit derivative. The implied credit spread of a particular referenced entity or index also reflects the cost of buying/selling protection and may reflect upfront payments required to be made to enter into the agreement. Wider credit spreads generally represent a deterioration of the referenced entity’s credit soundness and a greater likelihood or risk of default or other credit event occurring as defined under the terms of the particular swap agreement. When no implied credit spread is available for a credit default swap, the current unrealized appreciation/depreciation on the position may be used as an indicator of the current status of the payment/performance risk.
The maximum potential amount of future payments (undiscounted) that the Portfolio as a seller of protection could be required to make under a credit default swap agreement would be an amount equal to the notional amount of the agreement. Notional amounts of all credit default swap agreements outstanding as of December 31, 2013, for which the Portfolio is the seller of protection, are disclosed in the Schedule of Investments. These potential amounts would be partially offset by any recovery values of the respective referenced obligations, upfront payments received upon entering into the agreement or net amounts received from the settlement of buy protection credit default swap agreements entered into by the Portfolio for the same referenced entity or entities.
Interest Rate Swaps: The Portfolio may enter into interest rate swaps to manage its exposure to interest rates or to protect against currency fluctuations, to adjust the interest rate sensitivity (duration), to preserve a return or spread on a particular investment, or otherwise as a substitute for a direct investment in debt securities. The Portfolio is subject to interest rate risk exposure in the normal course of pursuing its investment objectives. Because the Portfolio holds fixed rate bonds, the value of these bonds may decrease if interest rates rise. To help hedge against this risk and to maintain its ability to generate income at prevailing market rates, the Portfolio may enter into interest rate swap agreements. Interest rate swaps are agreements in which one party pays a stream of interest payments, either fixed or floating rate, for another party’s stream of interest payments, either fixed or floating, on the same notional amount for a specified period of time. Other forms of interest rate swap agreements may include: (1) interest rate caps, under which, in return for a premium, one party agrees to make payments to the other to the extent that interest rates exceed a specified rate, or “cap”; (2) interest rate floors, under which, in return for a premium, one party agrees to make payments to the other to the extent that interest rates fall below a specified rate, or “floor”; and (3) interest rate collars, under which a party sells a cap and purchases a floor or vice versa in an attempt to protect itself against interest rate movements exceeding given minimum or maximum
MSF-35
Metropolitan Series Fund
WMC Balanced Portfolio (formerly, BlackRock Diversified Portfolio)
Notes to Financial Statements—December 31, 2013—(Continued)
levels. The Portfolio’s maximum risk of loss from counterparty credit risk, as opposed to investment and other types of risk, in respect of interest rate swaps is typically the discounted net value of the cash flows to be received from the counterparty over the contract’s remaining life, to the extent that amount is positive.
At December 31, 2013, the Portfolio had the following derivatives, categorized by risk exposure:
| | | | | | | | | | | | |
| | | Asset Derivatives | | | Liability Derivatives | |
Risk Exposure | | Statement of Assets &
Liabilities Location | | Fair Value | | | Statement of Assets &
Liabilities Location | | Fair Value | |
| Interest Rate | | Investments at market value (a) (d) | | $ | 264,367 | | | | | | | |
| | OTC swap contracts at market value (b) | | | 211,548 | | | OTC swap contracts at market value (b) | | $ | 34,879 | |
| | Unrealized appreciation on centrally cleared swap contracts** (c) | | | 55,017 | | | | | | | |
| | Unrealized appreciation on futures contracts* (c) | | | 685,995 | | | Unrealized depreciation on futures contracts* (c) | | | 197,610 | |
| | | | | | | | Written options at value (e) | | | 63,170 | |
| Credit | | | | | | | | Unrealized depreciation on centrally cleared swap contracts** | | | 87,115 | |
| | OTC swap contracts at market value (b) | | | 214,354 | | | OTC swap contracts at market value (b) | | | 35,460 | |
| Foreign Exchange | | Investments at market value (a) | | | 199,574 | | | | | | | |
| | Unrealized appreciation on forward foreign currency exchange contracts | | | 62,910 | | | Unrealized depreciation on forward foreign currency exchange contracts | | | 119,454 | |
| | | | | | | | Written options at value | | | 71,893 | |
| | | | | | | | | | | | |
| Total | | | | $ | 1,693,765 | | | | | $ | 609,581 | |
| | | | | | | | | | | | |
| | * | Includes cumulative appreciation/depreciation of futures contracts as reported in the Schedule of Investments. Only the current day’s variation margin is reported within the Statement of Assets and Liabilities. |
| | ** | Represents the unrealized appreciation/depreciation of centrally cleared swaps as reported in the Schedule of Investments. Only the variation margin is reported within the Statement of Assets and Liabilities. |
| | (a) | Includes purchased options which are part of investments as shown in the Statement of Assets and Liabilities. |
| | (b) | Excludes interest receivable on swap contracts of $4,820. |
| | (c) | Financial instrument not subject to a master netting agreement. |
| | (d) | Includes an exchange traded purchased option with a value of $146,475 that is not subject to a master netting agreement. |
| | (e) | Includes an exchange traded written option with a value of $35,263 that is not subject to a master netting agreement. |
The Portfolio is required to disclose the impact of offsetting assets and liabilities represented in the Statement of Assets and Liabilities to enable users of the financial statements to evaluate the effect or potential effect of netting arrangements on its financial position for recognized assets and liabilities.
The following table presents the Portfolio’s derivative assets by counterparty net of amounts available for offset under a master netting agreement (“MNA”), or similar agreement, and net of the related collateral received by the Portfolio as of December 31, 2013.
| | | | | | | | | | | | | | | | |
Counterparty | | Derivative Assets
subject to a MNA
by Counterparty | | | Financial
Instruments
available for offset | | | Collateral
Received† | | | Net Amount* | |
Bank of America N.A. | | $ | 87,840 | | | $ | (14,497 | ) | | $ | (65,000 | ) | | $ | 8,343 | |
Barclays Bank plc | | | 266,350 | | | | (104,642 | ) | | | (10,105 | ) | | | 151,603 | |
BNP Paribas S.A. | | | 8,376 | | | | (3,195 | ) | | | — | | | | 5,181 | |
Citibank N.A. | | | 7,011 | | | | (7,011 | ) | | | — | | | | — | |
Credit Suisse International | | | 3,748 | | | | (1,344 | ) | | | — | | | | 2,404 | |
Deutsche Bank AG | | | 214,419 | | | | (94,640 | ) | | | ��� | | | | 119,779 | |
JPMorgan Chase Bank N.A. | | | 190,589 | | | | — | | | | (100,000 | ) | | | 90,589 | |
Morgan Stanley Capital Services | | | 21,598 | | | | (21,598 | ) | | | — | | | | — | |
Westpac Banking Corp. | | | 6,347 | | | | — | | | | — | | | | 6,347 | |
| | | | | | | | | | | | | | | | |
| | $ | 806,278 | | | $ | (246,927 | ) | | $ | (175,105 | ) | | $ | 384,246 | |
| | | | | | | | | | | | | | | | |
The following table presents the Portfolio’s derivative liabilities by counterparty net of amounts available for offset under a master netting agreement, or similar agreement, and net of the related collateral pledged by the Portfolio as of December 31, 2013.
| | | | | | | | | | | | | | | | |
Counterparty | | Derivative Liabilities
subject to a MNA
by Counterparty | | | Financial
Instruments
available for offset | | | Collateral
Pledged† | | | Net Amount** | |
Bank of America N.A. | | $ | 14,497 | | | $ | (14,497 | ) | | $ | — | | | $ | — | |
Barclays Bank plc | | | 104,642 | | | | (104,642 | ) | | | — | | | | — | |
BNP Paribas S.A. | | | 3,195 | | | | (3,195 | ) | | | — | | | | — | |
MSF-36
Metropolitan Series Fund
WMC Balanced Portfolio (formerly, BlackRock Diversified Portfolio)
Notes to Financial Statements—December 31, 2013—(Continued)
| | | | | | | | | | | | | | | | |
Counterparty | | Derivative Liabilities
subject to a MNA
by Counterparty | | | Financial
Instruments
available for offset | | | Collateral
Pledged† | | | Net Amount** | |
Citibank N.A. | | $ | 7,811 | | | $ | (7,011 | ) | | $ | — | | | $ | 800 | |
Credit Suisse International | | | 1,344 | | | | (1,344 | ) | | | — | | | | — | |
Deutsche Bank AG | | | 94,640 | | | | (94,640 | ) | | | — | | | | — | |
Morgan Stanley Capital Services | | | 48,446 | | | | (21,598 | ) | | | — | | | | 26,848 | |
Royal Bank of Canada (RBC) | | | 7,066 | | | | — | | | | — | | | | 7,066 | |
UBS AG | | | 7,952 | | | | — | | | | — | | | | 7,952 | |
| | | | | | | | | | | | | | | | |
| | $ | 289,593 | | | $ | (246,927 | ) | | $ | — | | | $ | 42,666 | |
| | | | | | | | | | | | | | | | |
| | * | Net amount represents the net amount receivable from the counterparty in the event of default. |
| | ** | Net amount represents the net amount payable due to the counterparty in the event of default. |
| | † | In some instances, the actual collateral received and/or pledged may be more than the amount shown here due to overcollateralization. |
Transactions in derivative instruments during the year ended December 31, 2013 were as follows:
| | | | | | | | | | | | | | | | |
Statement of Operations Location—Net Realized Gain (Loss) | | Interest Rate | | | Credit | | | Foreign
Exchange | | | Total | |
Investments (a) | | $ | 405,338 | | | $ | — | | | $ | (2,171,391 | ) | | $ | (1,766,053 | ) |
Forward foreign currency transactions | | | — | | | | — | | | | 210,450 | | | | 210,450 | |
Futures contracts | | | 5,985,606 | | | | — | | | | — | | | | 5,985,606 | |
Swap contracts | | | 4,608,106 | | | | 668,822 | | | | — | | | | 5,276,928 | |
Written options | | | (225,505 | ) | | | — | | | | 3,755,237 | | | | 3,529,732 | |
| | | | | | | | | | | | | | | | |
| | $ | 10,773,545 | | | $ | 668,822 | | | $ | 1,794,296 | | | $ | 13,236,663 | |
| | | | | | | | | | | | | | | | |
| | | | |
Statement of Operations Location—Net Change in Unrealized Appreciation
(Depreciation) | | Interest Rate | | | Credit | | | Foreign
Exchange | | | Total | |
Investments (a) | | $ | 65,228 | | | $ | — | | | $ | (796,516 | ) | | $ | (731,288 | ) |
Forward foreign currency transactions | | | — | | | | — | | | | (65,779 | ) | | | (65,779 | ) |
Futures contracts | | | (269,885 | ) | | | — | | | | — | | | | (269,885 | ) |
Swap contracts | | | 232,804 | | | | (590,962 | ) | | | — | | | | (358,158 | ) |
Written options | | | (41,725 | ) | | | — | | | | 477,992 | | | | 436,267 | |
| | | | | | | | | | | | | | | | |
| | $ | (13,578 | ) | | $ | (590,962 | ) | | $ | (384,303 | ) | | $ | (988,843 | ) |
| | | | | | | | | | | | | | | | |
For the year ended December 31, 2013, the average amount or number per contract outstanding for each derivative type was as follows:
| | | | |
Derivative Description | | Average
Notional Par or
Face Amount‡ | |
Investments (a) | | $ | 66,929,910 | |
Forward foreign currency transactions | | | 68,497,942 | |
Futures contracts long | | | 89,639,052 | |
Futures contracts short | | | (78,013,815 | ) |
Swap contracts | | | 109,436,344 | |
Written options | | | (40,304,893 | ) |
| | ‡ | Averages are based on activity levels during 2013. |
| | (a) | Includes purchased options which are part of net realized gain (loss) on investments and net change in unrealized appreciation (depreciation) on investments as shown in the Statement of Operations. |
Written Options
The Portfolio transactions in written options during the year December 31, 2013:
| | | | | | | | | | | | |
Call Options | | Notional
Amount | | | Number of
Contracts | | | Premium
Received | |
Options outstanding December 31, 2012 | | | 29,865,000 | | | | — | | | $ | 516,523 | |
Options written | | | 75,078,000 | | | | 532 | | | | 2,461,872 | |
Options bought back | | | — | | | | (532 | ) | | | (225,901 | ) |
Options expired | | | (102,683,000 | ) | | | — | | | | (2,743,511 | ) |
| | | | | | | | | | | | |
Options outstanding December 31, 2013 | | | 2,260,000 | | | | — | | | $ | 8,983 | |
| | | | | | | | | | | | |
MSF-37
Metropolitan Series Fund
WMC Balanced Portfolio (formerly, BlackRock Diversified Portfolio)
Notes to Financial Statements—December 31, 2013—(Continued)
| | | | | | | | | | | | |
Put Options | | Notional
Amount | | | Number of
Contracts | | | Premium
Received | |
Options outstanding December 31, 2012 | | | 4,000,000 | | | | — | | | $ | 74,347 | |
Options written | | | 1,244,720,000 | | | | 1,497 | | | | 1,525,898 | |
Options bought back | | | (4,000,000 | ) | | | (1,280 | ) | | | (489,614 | ) |
Options expired | | | (59,680,000 | ) | | | — | | | | (1,011,725 | ) |
| | | | | | | | | | | | |
Options outstanding December 31, 2013 | | | 1,185,040,000 | | | | 217 | | | $ | 98,906 | |
| | | | | | | | | | | | |
4. Certain Risks
Market Risk: In the normal course of business, the Portfolio invests in securities and enters into transactions where risks exist due to fluctuations in the market (market risk) or failure of the other party to a transaction to perform (credit and counterparty risk). The value of securities held by the Portfolio may decline in response to certain events, including those directly involving the companies whose securities are owned by the Portfolio; conditions affecting the general economy; overall market changes; local, regional or global political, social or economic instability; currency, interest rate, and price fluctuations.
Credit and Counterparty Risk: The Portfolio may be exposed to counterparty risk, or the risk that an entity with which the Portfolio has unsettled or open transactions may default. The potential loss could exceed the value of the financial assets and liabilities recorded in the financial statements. Financial assets that potentially expose the Portfolio to credit and counterparty risk consist principally of cash due from counterparties and investments. The Portfolio manages counterparty risk by entering into agreements only with counterparties that it believes have the financial resources to honor their obligations and by monitoring the financial stability of those counterparties. The Portfolio’s investment adviser attempts to mitigate counterparty risk by (i) periodically assessing the creditworthiness of its trading partners, (ii) monitoring and/or limiting the amount of its net exposure to each individual counterparty based on its assessment, and (iii) requiring collateral from the counterparty for certain transactions. In order to preserve certain safeguards for non-standard settlement trades, the Portfolio restricts its exposure to credit and counterparty losses by entering into master netting agreements with counterparties (approved brokers) with whom it undertakes a significant volume of transactions. Master Agreements govern the terms of certain transactions, and reduce the counterparty risk associated with relevant transactions by specifying credit protection mechanisms and providing standardization that improves legal certainty. Master Agreements can also help limit counterparty risk by specifying collateral posting arrangements at pre-arranged exposure levels. Collateral requirements may differ by type of derivative or investment, as applicable. Collateral or margin requirements are set by the broker or exchange clearing house for exchange traded derivatives (e.g., futures contracts and exchange traded options) while collateral terms are contract specific for over-the-counter traded derivatives (e.g., forward foreign currency exchange contracts, swap agreements and over-the-counter options).
For derivatives traded under an International Swaps and Derivatives Association, Inc. Master Agreement (“ISDA Master Agreement”) or similar master agreement, the collateral requirements are netted across all transactions traded under such agreement and one amount is posted from one party to the other to collateralize such obligations. The ISDA Master Agreement gives each party to the agreement the right to terminate all transactions traded under such agreement if there is a certain deterioration in the credit quality of the other party. The ISDA Master Agreement gives the Portfolio the right, upon an event of default by the applicable counterparty or a termination of the agreement, to close out all transactions traded under such agreement and to net amounts owed under each transaction to one net amount payable by one party to the other. This right to close out and net payments across all transactions traded under the ISDA Master Agreement could result in a reduction of the Portfolio’s credit risk to such counterparty equal to any amounts payable by the Portfolio under the applicable transactions, if any. However, absent an event of default by the counterparty or a termination of the agreement, the ISDA Master Agreement does not result in an offset of reported amounts of assets and liabilities in the Statement of Assets and Liabilities across transactions between the Portfolio and the applicable counterparty. The enforceability of the right to offset may vary by jurisdiction. Cash collateral that has been pledged to cover obligations of the Portfolio under derivative contracts, if any, will be reported separately in the Statement of Assets and Liabilities. Securities pledged as collateral, if any, for the same purpose are noted in the Schedule of Investments.
Repurchase and reverse repurchase agreements are primarily executed under Global Master Repurchase Agreements (“GMRAs”) or Master Repurchase Agreements (“MRAs”), which provide the rights to set-off. Each repurchase and reverse repurchase agreement is initially collateralized at the transaction level. In the event of default, the total market value exposure will be offset against collateral exchanged to date, which would result in a net receivable/(payable) that would be due from/to the counterparty.
Master Securities Forward Transaction Agreements (“Master Forward Agreements”) govern the considerations and factors surrounding the settlement of certain forward settling transactions, such as To-Be-Announced securities, delayed-delivery or secured borrowings transactions by and between the Portfolio and select counterparties. The Master Forward Agreements maintain provisions for, among other things, initiation and confirmation, payment and transfer, events of default, termination, and maintenance of collateral.
MSF-38
Metropolitan Series Fund
WMC Balanced Portfolio (formerly, BlackRock Diversified Portfolio)
Notes to Financial Statements—December 31, 2013—(Continued)
Customer Account Agreements and related addendums govern cleared derivatives transactions such as futures, options on futures, and cleared OTC derivatives. Cleared derivative transactions require posting of initial margin as determined by each relevant clearing agency which is segregated at a broker account registered with the Commodities Futures Trading Commission (CFTC), or the applicable regulator. In the U.S., counterparty risk is significantly reduced as creditors of the futures broker do not have claim to Portfolio assets in the segregated account. Additionally, portability of exposure in the event of default further reduces risk to the Portfolio. Variation margin, or changes in market value, are exchanged daily, but may not be netted between futures and cleared OTC derivatives.
Foreign Investment Risk: The investments by the Portfolio in foreign securities may involve risks not present in domestic investments. Because securities may be denominated in foreign currencies, may require settlement in foreign currencies and may pay interest or dividends in foreign currencies, changes in the relationship of these foreign currencies to the U.S. dollar can significantly affect the value of the investments and earnings of the Portfolio. Foreign investments may also subject the Portfolio to foreign government exchange restrictions, expropriation, taxation or other political, social or economic developments, all of which could affect the market and/or credit risk of the investments. In addition to the risks described above, risks may arise from forward foreign currency contracts with respect to the potential inability of counterparties to meet the terms of their contracts.
Additional risks associated with each type of investment are described above within the respective security type notes. The Portfolio’s prospectus includes a discussion of the principal risks of investing in the Portfolio.
5. Investment Transactions
Aggregate cost of purchases and proceeds of sales of investment securities, including mortgage dollar roll and TBA transactions but excluding short-term securities, for the year ended December 31, 2013 were as follows:
| | | | | | | | | | | | | | |
| Purchases | | | Sales | |
| U.S. Government | | | Non U.S. Government | | | U.S. Government | | | Non U.S. Government | |
| $ | 4,113,393,257 | | | $ | 590,273,243 | | | $ | 4,202,601,331 | | | $ | 671,257,342 | |
Purchases and sales of mortgage dollar rolls and TBA transactions for the year ended December 31, 2013 were as follows:
| | | | | | |
| Purchases | | | Sales | |
| $ | 2,812,412,826 | | | $ | 2,854,030,662 | |
6. Investment Management Fees and Other Transactions with Affiliates
Investment Management Agreement - MetLife Advisers is the investment adviser to the Portfolio. The Trust has entered into an investment management agreement with MetLife Advisers with respect to the Portfolio. For providing investment management services to the Portfolio, MetLife Advisers receives monthly compensation at the annual rates:
| | | | | | |
Management
Fees earned by
MetLife Advisers
for the year ended
December 31, 2013 | | % per annum | | | Average Daily Net Assets |
| $5,933,205 | | | 0.500 | % | | Of the first $500 million |
| | | 0.450 | % | | Of the next $500 million |
| | | 0.400 | % | | On amounts in excess of $1 billion |
MetLife Advisers had entered into an investment subadvisory agreement with respect to the Portfolio. Prior to February 3, 2014, BlackRock Advisors, LLC is compensated by MetLife Advisers to provide subadvisory services for the Portfolio (see Note 9 of the Notes to Financial Statements).
Certain officers and trustees of the Trust may also be officers of the Adviser; however, such officers and trustees receive no compensation from the Trust.
During the year ended December 31, 2013, the Subadvisor voluntarily reimbursed the Portfolio for certain trading costs during a transition of the Portfolio. This reimbursement is reflected as net increase from payments by affiliates in the Statement of Operations.
Transfer Agency Agreement - MetLife serves as the transfer agent for the Trust. MetLife receives no fees for its services to the Trust under the transfer agency agreement.
Distribution and Service Fees - The Trust has a distribution agreement with MetLife Investors Distribution Company (“MIDC” or the “Distributor”) in which MIDC serves as the distributor for the Portfolio’s Class A, B and E Shares. MIDC is a wholly-owned subsidiary of
MSF-39
Metropolitan Series Fund
WMC Balanced Portfolio (formerly, BlackRock Diversified Portfolio)
Notes to Financial Statements—December 31, 2013—(Continued)
MetLife Investors Group, Inc., an affiliate of the Adviser. The Trust has also adopted a Distribution and Service Plan under Rule 12b-1 of the 1940 Act for the Portfolio’s Class B and E Shares. Under the Distribution and Service Plan, the Class B and E Shares of the Portfolio pay a fee to compensate the Insurance Companies (or their affiliates) and other broker-dealers and financial intermediaries involved in the offer and sale of Portfolio shares for promoting or selling and servicing the Class B and E Shares. The fees under the Distribution and Service Plan for each class of the Portfolio’s shares are calculated as a percentage of the Portfolio’s average daily net assets that are attributable to that Class. Currently, the fee is 0.25% per year for Class B Shares and 0.15% per year for Class E Shares. Amounts incurred by the Portfolio for the year ended December 31, 2013 are shown as Distribution and service fees in the Statement of Operations.
Deferred Trustee Compensation - Each Trustee who is not currently an active employee of MetLife or its affiliates receives compensation from the Trust for his or her service to the Trust. A deferred compensation plan (the “Plan”) is available to the Trustees on a voluntary basis. Deferred amounts remain in the Trust until distributed in accordance with the provisions of the Plan. The value of a participating Trustee’s deferral account is based on theoretical investments of deferred amounts, on the normal payment dates in certain portfolios of the Trust or Met Investors Series Trust, an affiliate of the Trust, as designated by the participating Trustee. Changes in the value of participants’ deferral accounts are reflected as Trustees’ fees and expenses in the Statement of Operations. The portion of the accrued obligations allocated to the Portfolio under the Plan is reflected as Deferred trustees’ fees in the Statement of Assets and Liabilities.
7. Contractual Obligations
Under the Trust’s organizational documents, its officers and Trustees may be indemnified against certain liabilities and expenses arising out of the performance of their duties to the Trust. Additionally, the Trust has a variety of indemnification obligations under contracts with its service providers. The Trust’s maximum exposure under these arrangements is unknown, as this would involve future claims that may be made against the Trust that have not yet occurred.
8. Income Tax Information
The tax character of distributions paid for the periods ended December 31, 2013 and 2012 was as follows:
| | | | | | | | | | | | | | | | | | | | |
Ordinary Income | | | Long-Term Capital Gain | | | Total | |
2013 | | 2012 | | | 2013 | | | 2012 | | | 2013 | | | 2012 | |
| $31,923,395 | | $ | 28,774,954 | | | $ | — | | | $ | — | | | $ | 31,923,395 | | | $ | 28,774,954 | |
As of December 31, 2013, the components of distributable earnings (accumulated losses) on a federal income tax basis were as follows:
| | | | | | | | | | | | | | | | |
Undistributed
Ordinary
Income | | Undistributed
Long-Term
Capital Gain | | | Net
Unrealized
Appreciation | | | Loss Carryforwards | | | Total | |
| $26,762,222 | | $ | — | | | $ | 226,055,302 | | | $ | (16,387,061 | ) | | $ | 236,430,463 | |
The Portfolio utilizes the provisions of the federal income tax laws that provide for the carryforward of capital losses for prior years, offsetting such losses against any future realized capital gains. Under the Regulated Investment Company Modernization Act of 2010 (the “Act”), net capital losses recognized after December 22, 2010 may be carried forward indefinitely and their character is retained as short-term and/or long-term losses. Previously, net capital losses were carried forward for up to eight years and treated as short-term losses. As a transition rule, the Act requires that post-enactment net capital losses be used before pre-enactment net capital losses.
During the year ended December 31, 2013, the Portfolio utilized capital loss carryforwards of $80,924,105.
As of December 31, 2013, the Portfolio had no post-enactment accumulated capital losses and the pre-enactment accumulated capital loss carryforwards expiring on December 31, 2017 were $16,387,061.
9. Subsequent Events
On November 20, 2013, the Board approved a new Subadvisory Agreement (the “Agreement”) with respect to the Portfolio between MetLife Advisers and Wellington Management Company, LLP (“Wellington”). The Agreement is not subject to shareholder approval and became effective February 3, 2014. The Advisory Agreement between the Trust, with respect to the Portfolio, and MetLife Advisers will remain in effect and fees payable thereunder to MetLife Advisers will not change. Under the Agreement, Wellington became subadviser to the Portfolio, succeeding BlackRock Advisors, LLC, and became responsible for the day-to-day management of the Portfolio’s investment operations under the oversight of MetLife Advisers and the Board. The name of the BlackRock Diversified Portfolio changed to the WMC Balanced Portfolio at the time the Agreement took effect.
MSF-40
Metropolitan Series Fund
WMC Balanced Portfolio (formerly, BlackRock Diversified Portfolio)
Report of Independent Registered Public Accounting Firm
To the Shareholders of WMC Balanced Portfolio and the Board of Trustees of Metropolitan Series Fund:
We have audited the accompanying statement of assets and liabilities, including the schedule of investments, of WMC Balanced Portfolio (formerly, BlackRock Diversified Portfolio), one of the portfolios constituting Metropolitan Series Fund (the “Trust”) as of December 31, 2013, and the related statement of operations for the year then ended, the statements of changes in net assets for each of the two years in the period then ended, and the financial highlights for each of the five years in the period then ended. These financial statements and financial highlights are the responsibility of the Trust’s management. Our responsibility is to express an opinion on these financial statements and financial highlights based on our audits.
We conducted our audits in accordance with the standards of the Public Company Accounting Oversight Board (United States). Those standards require that we plan and perform the audit to obtain reasonable assurance about whether the financial statements and financial highlights are free of material misstatement. The Trust is not required to have, nor were we engaged to perform, an audit of its internal control over financial reporting. Our audits included consideration of internal control over financial reporting as a basis for designing audit procedures that are appropriate in the circumstances, but not for the purpose of expressing an opinion on the effectiveness of the Trust’s internal control over financial reporting. Accordingly, we express no such opinion. An audit also includes examining, on a test basis, evidence supporting the amounts and disclosures in the financial statements, assessing the accounting principles used and significant estimates made by management, as well as evaluating the overall financial statement presentation. Our procedures included confirmation of securities owned as of December 31, 2013, by correspondence with the custodian and brokers; where replies were not received from brokers, we performed other auditing procedures. We believe that our audits provide a reasonable basis for our opinion.
In our opinion, the financial statements and financial highlights referred to above present fairly, in all material respects, the financial position of WMC Balanced Portfolio of Metropolitan Series Fund, as of December 31, 2013, the results of its operations for the year then ended, the changes in its net assets for each of the two years in the period then ended, and the financial highlights for each of the five years in the period then ended, in conformity with accounting principles generally accepted in the United States of America.
Deloitte & Touche LLP
Boston, Massachusetts
February 27, 2014
MSF-41
Metropolitan Series Fund
Trustees and Officers of Metropolitan Series Fund
The Trustees and executive officers of the Trust, their ages and their principal occupations during the past five years are set forth below. Unless otherwise indicated, the business address of each is One Financial Center, Boston, MA 02111. Each Trustee who is deemed an “interested person,” as such term is defined in the 1940 Act, is indicated by an asterisk. Those Trustees who are not “interested persons” as defined in the 1940 Act are referred to as “Independent Trustees.” Additional information about the Trustees is available in the Statement of Additional Information, which is available without charge, upon request, by calling (800) 848-3854.
Trustees of the Trust
| | | | | | | | | | |
Name and Age | | Position(s)
Held with
Registrant | | Term of Office and
Length of Time
Served | | Principal Occupation(s) During the
Past 5 Years(1) | | Number of
Portfolios
in Fund
Complex(2)
overseen | | Other Directorships Held
by Trustee During the
Past 5 Years(1) |
| Interested Trustee | | | | | | | | | | |
| Elizabeth M. Forget* (47) | | Trustee, Chairman of the Board, President and Chief Executive Officer | | Indefinite; From May 2006 (President and Chief Executive Officer)/ August 2006 (Trustee and Chairman of the Board) to present | | Senior Vice President, MetLife Inc.; President, MetLife Advisers, LLC and a predecessor company. | | 79 | | Trustee, Met Investors Series Trust (the “MIST Trust”);** various MetLife-affiliated boards. |
| | | | | |
| Independent Trustees | | | | | | | | | | |
| Stephen M. Alderman (54) | | Trustee | | Indefinite; From April 2012 to present | | Shareholder in the law firm of Garfield & Merel, Ltd. | | 79 | | Trustee, MIST Trust;** Director, International Truck Leasing Corp. |
| | | | | |
| Robert J. Boulware (57) | | Trustee | | Indefinite; From April 2012 to present | | Managing Director, Pilgrim Funds, LLC (private equity fund). | | 79 | | Trustee, MIST Trust;** Trustee, Vertical Capital Income Fund (closed-end fund); Director, Gainsco, Inc. (auto insurance). |
| | | | | |
| Susan C. Gause (61) | | Trustee | | Indefinite; From April 2012 to present | | Private Investor. | | 79 | | Trustee, MIST Trust;** Trustee, HSBC Funds. |
| | | | | |
| Nancy Hawthorne (62) | | Trustee | | Indefinite; From May 2003 to present | | Chief Executive Officer, Clerestory LLC (corporate advisor). | | 79 | | MIST Trust;** Director, THL Credit, Inc.**; Director, Avid Technology, Inc.** |
| | | | | |
| Barbara A. Nugent (57) | | Trustee | | Indefinite; From January 2014 to present | | President, True North Board Governance, LLC (consulting); until 2014, partner in the law firm of Stradley Ronon Stevens & Young, LLP. | | 79 | | Trustee, MIST Trust**; Director, Episcopal Healthcare Foundation; until 2014, member, Mutual Fund Directors Forum Advisory Board. |
| | | | | |
| Keith M. Schappert (62) | | Trustee | | Indefinite; From August 2009 to present | | Principal, Schappert Consulting LLC (asset management consulting). | | 79 | | Trustee, MIST Trust;** Director, The Commonfund for Nonprofit Organizations; until 2011, Director, Trilogy Global Advisors; Director, Mirae Asset Discovery Funds,** Director, Calamos Investments. |
| | | | | |
| Linda B. Strumpf (66) | | Trustee | | Indefinite; From May 2000 to present | | Chair of the Investment Committee, Leona M. and Harry B. Helmsley Charitable Trust; until 2011, Chief Investment Officer, Leona M. and Harry B. Helmsley Charitable Trust. | | 79 | | Since 2012, Trustee, MIST Trust,** Trustee and Member of Investment Committee, The Pennsylvania State University. |
| | | | | |
| Dawn M. Vroegop (47) | | Trustee | | Indefinite; From May 2009 to present | | Private Investor. | | 79 | | Trustee, MIST Trust,** Trustee, Driehaus Mutual Funds; Director and Investment Committee Chair, City College of San Francisco Foundation. |
MSF-42
Metropolitan Series Fund
Trustees and Officers of Metropolitan Series Fund—(Continued)
Executive Officers of the Trust
| | | | | | |
Name and Age | | Position(s) Held with
Registrant | | Term of Office
and Length of
Time Served | | Principal Occupation(s) During Past 5 Years(1) |
| Elizabeth M. Forget (47) | | President, Chief Executive Officer, Trustee and Chairman of the Board | | From May
2006 (President
and Chief
Executive
Officer)/
August 2006
(Trustee and
Chairman of
the Board) to
present | | See principal occupation information in the table above. |
| | | |
| Jeffrey L. Bernier (42) | | Vice President | | From February
2008 to present | | Vice President, MetLife, Inc.; Senior Vice President, MetLife Advisers, LLC and a predecessor company. |
| | | |
| Peter H. Duffy (58) | | Chief Financial Officer and Treasurer | | From November
2000 to present | | Senior Vice President, MetLife Advisers, LLC; Vice President, MetLife, Inc. |
| | | |
| Andrew L. Gangolf (59) | | Secretary | | From May
2011to present | | Senior Vice President, MetLife Advisers, LLC; Senior Vice President & Assistant General Counsel, AllianceBerstein Investments, Inc. |
| | | |
| Jeffrey P. Halperin (46) | | Chief Compliance Officer | | From November
2005 to present | | Vice President, MetLife, Inc.; Chief Compliance Officer, MIST; Chief Compliance Officer, MSF Trust; Chief Compliance Officer, MetLife Advisers, LLC and a predecessor company; Chief Compliance Officer, MetLife Investment Management, LLC (formerly MetLife Investment Advisors Company, LLC). |
| | | |
| Alan C. Leland, Jr. (61) | | Vice President | | From February
2005 to present | | Treasurer and Chief Financial Officer, MetLife Advisers, LLC; Vice President, MetLife Group Inc.; Vice President, MetLife, Inc. |
| * | Ms. Forget is an “interested person” of the Trust because of her positions with MetLife Advisers, LLC and her ownership of securities issued by MetLife, Inc., the ultimate parent company of MetLife Advisers, LLC. |
| ** | Indicates a directorship with a registered investment company or a company subject to the reporting requirements of the Securities Exchange Act of 1934, as amended. |
| (1) | Previous positions during the past five years with the Trust, MetLife, Inc. or the Adviser are omitted if not materially different. |
| (2) | The Fund Complex includes 49 Portfolios of the MIST Trust and 30 Portfolios of the Trust. |
MSF-43
Metropolitan Series Fund
WMC Balanced Portfolio (formerly, BlackRock Diversified Portfolio)
Board of Trustees’ Consideration of Advisory and Sub-Advisory Agreements
At an in-person meeting of the Boards of Trustees (the “Board”) of Met Investors Series Trust and Metropolitan Series Fund (“MIST” and “MSF,” respectively, and collectively, the “Trusts”) held on November 19-20, 2013, the Board, including a majority of the Trustees who are not considered to be “interested persons” of the Trusts (the “Independent Trustees”) under the Investment Company Act of 1940, as amended (the “1940 Act”), approved for an annual period the continuation of each Trust’s advisory agreement (the “Advisory Agreement”) with MetLife Advisers, LLC (the “Adviser”) and the applicable sub-advisory agreements (each a “Sub-Advisory Agreement,” and collectively with the Advisory Agreement, the “Agreements”) between the Adviser and the investment sub-advisers (each a “Sub-Adviser,” and collectively, the “Sub-Advisers”) for each of the series of the Trusts, including the WMC Balanced Portfolio (each a “Portfolio,” and collectively, the “Portfolios”).1 With respect to the WMC Balanced Portfolio, the Board approved its Advisory Agreement and two Sub-Advisory Agreements: One Sub-Advisory Agreement for the then-existing Sub-Adviser, BlackRock Advisors, LLC (“BlackRock”), and one Sub-Advisory Agreement for the new Sub-Adviser, Wellington Management Company, LLP (“Wellington”), which was proposed to succeed BlackRock on or about February 3, 2014. The BlackRock Sub-Advisory Agreement was approved for the period of time leading up until Wellington’s succession of BlackRock.
In considering the Agreements, the Board reviewed a variety of materials provided by the Adviser and the Sub-Advisers relating to the Portfolios, including comparative performance, fee and expense information for an appropriate peer group of similar mutual funds, performance information for relevant benchmark indices and other information regarding the nature, extent and quality of services provided by the Adviser and the Sub-Advisers under their respective Agreements. The Board also took into account its experience with the Adviser and the Sub-Advisers and information provided to the Board in its meetings throughout the year with respect to the services provided by the Adviser and the Sub-Advisers, including quarterly performance reports prepared by management containing reviews of investment results, and periodic presentations from certain of the Sub-Advisers with respect to the Portfolios they manage. The Independent Trustees also assessed reports provided by the Board’s independent consultant, who reviewed and provided analyses regarding investment performance, fees and expenses, and other information provided by, or at the direction of, the Adviser and the Sub-Advisers, as more fully discussed below.
The Independent Trustees were separately advised by independent legal counsel throughout the process, and met with independent legal counsel in periodic executive sessions. Prior to voting to continue the Agreements at the November meeting, the Independent Trustees also received a memorandum from their independent counsel discussing the legal standards for their consideration of the proposed continuation of the Agreements. The Board also met in person with personnel of the Adviser on September 17, 2013 for the specific purpose of giving preliminary consideration to the proposed continuation of the Agreements and to request additional information they considered reasonably necessary to their deliberations. The Independent Trustees also discussed the proposed continuation of the Agreements in private sessions with their independent legal counsel at which no representatives of management were present.
In considering whether to approve the renewal of the Advisory Agreement with the Adviser and any applicable Sub-Advisory Agreements with respect to a Portfolio, the Board reviewed and analyzed the factors it deemed relevant, including: (1) the nature, extent and quality of the services to be provided to the Portfolios by the Adviser and the Sub-Advisers; (2) the performance of the Portfolios as compared to a peer group and an appropriate index; (3) the Adviser’s and each of the Sub-Adviser’s personnel and operations; (4) the financial condition of the Adviser and of the Sub-Advisers; (5) the level and method of computing each Portfolio’s advisory and sub-advisory fees; (6) the profitability of the Adviser under the Advisory Agreement and of certain of the Sub-Advisers under the Sub-Advisory Agreements; (7) any “fall-out” benefits to the Adviser, the Sub-Advisers and their affiliates (i.e., ancillary benefits realized by the Adviser, the Sub-Advisers or their affiliates from the Adviser’s or Sub-Advisers’ relationship with the Trusts); (8) the anticipated effect of growth in size on Portfolio expenses; (9) fees paid to certain of the Sub-Advisers by comparable institutional and retail accounts; and (10) possible conflicts of interest.
Nature, extent and quality of services. The Board evaluated the nature, extent and quality of the services that the Adviser, and the Sub-Advisers as relevant, have provided to the Portfolios. The Board considered the Adviser’s services as investment manager to the Portfolios, including services relating to the selection and oversight of the Sub-Advisers for the applicable Portfolios. The Board considered, among other things, the Adviser’s oversight of the provision of services to the Portfolios by the Sub-Advisers, including with respect to investment activities and trading practices, and the Sub-Adviser’s compliance with fund policies, objectives and Board directives, compliance policies and procedures and applicable law. The Adviser’s services in coordinating and overseeing the activities of the Trusts’ other service providers were also considered. The Board also evaluated the expertise and performance of the personnel of the Adviser who performed services for the Portfolios throughout the year.
1 The Pyramis Managed Risk Portfolio recently commenced operations and, therefore, the Agreement with respect to this Portfolio was not up for renewal.
MSF-44
Metropolitan Series Fund
WMC Balanced Portfolio (formerly, BlackRock Diversified Portfolio)
Board of Trustees’ Consideration of Advisory and Sub-Advisory Agreements—(Continued)
The Board considered information received from the Trust’s Chief Compliance Officer (“CCO”) regarding the Portfolios’ compliance policies and procedures established pursuant to Rule 38a-l under the 1940 Act. The Board also evaluated the CCO’s ongoing reports concerning the CCO’s oversight of the risk assessment processes of the Sub-Advisers.
With respect to the services provided by each of the Sub-Advisers, the Board considered, among other things, information provided to the Board by each Sub-Adviser. The Board considered the Sub-Adviser’s current level of staffing and its overall resources, as well as its compensation program. The Board reviewed each Sub-Adviser’s history and investment experience, as well as information regarding the qualifications, background and responsibilities of the Sub-Adviser’s investment and compliance personnel who provide services to the Portfolios. The Board also considered, among other things, the Sub-Adviser’s compliance program and any disciplinary history. The Board also took into account the Sub-Adviser’s risk assessment and monitoring process. The Board noted each Sub-Adviser’s regulatory history, including whether it was currently involved in any regulatory actions or investigations as well as material litigation, and any settlements and amelioratory actions undertaken, as appropriate. The Board also noted that the CCO and his staff conduct regular, periodic compliance reviews with each of the Sub-Advisers and present reports to the Independent Trustees regarding the same, which includes evaluating the regulatory compliance systems of the Sub-Advisers and procedures reasonably designed by them to help assure compliance with the federal securities laws, including issues related to late trading and market timing, best execution, fair value pricing, and proxy voting procedures, among others. The Board also took into account the financial condition of each Sub-Adviser. In its review, the Board also received and took into account information regarding any services and/or payments provided to the Adviser by the Sub-Advisers in connection with marketing activities.
The Board considered each Sub-Adviser’s investment process and philosophy. The Board took into account that each Sub-Adviser’s responsibilities include the development and maintenance of an investment program for the applicable Portfolio which is consistent with the Portfolio’s investment objectives, the selection of investment securities and the placement of orders for the purchase and sale of such securities, as well as the implementation of compliance controls related to performance of these services. The Board also reviewed each Sub-Adviser’s brokerage policies and practices.
Performance. The Board considered the performance of the Portfolios as described in the quarterly reports prepared by management, and as also analyzed in reports prepared by the Independent Trustees’ independent consultant. The Board noted that the Adviser reviews with the Board on a quarterly basis detailed information about the Portfolios’ performance results, portfolio composition and investment strategies. The Board also reviewed and considered a separate report prepared by Lipper Inc. (“Lipper”), an independent third party, which provided a statistical analysis comparing the Portfolios’ investment performance, expenses, and fees to comparable funds underlying variable insurance products (the “Performance Universe”). In addition, the Independent Trustees met separately with a representative of Bobroff Consulting, Inc., an independent consultant (“Bobroff), at a special board meeting in September 2013, to review the separate reports prepared by such consultant (“Bobroff Report”), which analyzed the report prepared by Lipper. Both the Lipper Report and the Bobroff Report relate to the Portfolio’s performance and expenses when BlackRock was the Sub-Adviser. The Board also considered each Portfolio’s more recent performance subsequent to the performance period covered by the Lipper reports, and management’s discussion of the same, including the effect of current market conditions on each Portfolio’s more recent performance.
The Board reviewed the Portfolios’ performance records and the Adviser’s and Sub-Advisers’ management styles and, to the extent applicable, long-term performance records with the Portfolios and comparable funds. The Board focused particular attention on Portfolios with less favorable performance records. The Board was mindful of the Adviser’s focus on each Sub-Adviser’s performance and noted that the Adviser has been active in monitoring and responding to any performance issues with respect to the Portfolios. The Board also took into account its discussions with management regarding factors that contributed to the performance of the Portfolios.
Among other data relating specifically to the WMC Balanced Portfolio’s performance, the Board considered that the Portfolio outperformed the median of its Performance Universe and its Lipper Index for the one-, three- and five-year periods ended June 30, 2013. The Board further considered that the Portfolio outperformed its blended benchmark for the one- and three-year periods ended October 31, 2013 and underperformed its blended benchmark for the five-year period ended October 31, 2013. The Board also noted the pending Sub-Adviser change effective on or about February 3, 2014.
With respect to Wellington, the Board considered the performance of the investment strategy Wellington proposed to use in managing the Portfolio (the “Wellington Strategy”). Among other data relating specifically to the Wellington Strategy, the Board noted that both the equity and fixed-income sleeves of the Wellington Strategy had outperformed their respective indices, the Russell 1000 Index and the Barclays U.S. Aggregate Bond Index, for the trailing one-, three- and five-year periods ended September 30, 2013. The Board also noted that the equity sleeve of the Wellington Strategy performed above the median of its peer group for the same periods and that the fixed-income sleeve of the Wellington Strategy performed above the median of its peer group for the trailing three- and five-year
MSF-45
Metropolitan Series Fund
WMC Balanced Portfolio (formerly, BlackRock Diversified Portfolio)
Board of Trustees’ Consideration of Advisory and Sub-Advisory Agreements—(Continued)
periods ended September 30, 2013. The Board further noted that the fixed income sleeve of the Wellington Strategy performed below the median of its peer group for the trailing one-year period ended September 30, 2013. The Board took into account that the portfolio managers who managed the Wellington Strategy were expected to manage the Portfolio. In addition, the Board took into consideration the differences in principal investment strategies between the Portfolio and the Wellington Strategy. The Board further noted the proposed Sub-Adviser change would be effective on or about February 3, 2014.
Fees and Expenses. The Board gave consideration to the advisory fees payable under the Advisory Agreement and the sub-advisory fees payable under each of the Sub-Advisory Agreements. In this regard, the Board reviewed the advisory fees payable on a Portfolio-by-Portfolio basis based on information provided by the Adviser. The Independent Trustees, with the assistance of Bobroff, also examined the fees paid by a Portfolio in light of fees paid to other investment managers by comparable funds, as well as considered the fees charged by the Adviser to manage other comparable funds, as applicable. The Lipper report included comparisons of the Adviser’s fee schedule with that of its peers based on an asset-based analysis of relative fee structures according to the size of the Portfolio. In addition, the Board considered the Portfolios’ advisory and sub-advisory fees and total expenses as compared to similarly situated investment companies underlying variable insurance products deemed to be comparable to the Portfolios as determined by Lipper. The Board considered a Portfolio’s ranking within a smaller group of peer funds chosen by Lipper (the “Expense Group”), as well as the Portfolio’s ranking within broader groups of funds (the “Expense Universe” and the “Sub-advised Expense Universe”). The Board also considered a Portfolio’s contractual sub-advisory fees, as applicable, as compared to the Sub-advised Expense Universe as well as a smaller group of funds (the “Sub-advised Expense Group”). In comparing a Portfolio’s actual and contractual management fee to that of comparable funds, the Board noted that such fee includes both advisory and administrative fees.
The Board noted that the sub-advisory fees for the Portfolios are paid by the Adviser, not the Portfolios, out of the advisory fee. It was further noted that the Adviser negotiates such fees at arm’s length. The Board also considered that the Adviser had entered into expense limitation agreements with certain of the Portfolios, pursuant to which the Adviser has agreed to waive a portion of its advisory fee and/or reimburse certain expenses as a means of limiting a Portfolio’s total annual operating expenses. The Board further considered the amount of sub-advisory fees paid out by the Adviser and the amount of the management fees that it retained in light of the services performed by Sub-Advisers and Adviser, respectively.
The Board considered that the WMC Balanced Portfolio’s actual management fee and total expenses (exclusive of 12b-l fees) were below the Expense Group median, the Expense Universe median and Sub-advised Expense Universe median. The Board noted that the Portfolio’s contractual management fees were below the asset-weighted average of the Expense Group at the Portfolio’s current size. The Board also noted that the Portfolio’s contractual sub-advisory fees were above the average of the Sub-advised Expense Group and equal to the average of the Sub-advised Expense Universe at the Portfolio’s current size.
With respect to the hiring of Wellington, the Board noted that the rate of compensation to be paid to Wellington is lower at current asset levels than the rate of compensation the Adviser paid to BlackRock for managing the Portfolio under the BlackRock Sub-Advisory Agreement. The Board further considered, with the assistance of a Lipper-based report prepared by Bobroff, the Portfolio’s peer group ranking in light of its revised fee arrangement. In addition, the Board noted that the Adviser had recently negotiated a reduction with Wellington to the Portfolio’s sub-advisory fee schedule and that the Adviser agreed to waive a portion of its advisory fee in order for contractholders to benefit from the lower sub-advisory fee effective February 3, 2014.
Profitability. The Board examined the profitability of the Adviser on a Portfolio-by-Portfolio basis. The Board also considered that the Distributor, MetLife Investors Distribution Company, receives Rule 12b-1 payments to support the distribution of the products. The Board considered the profitability to the Sub-Advisers and their affiliates as a result of their relationships with the Portfolios, and the Board considered the ability of the Adviser to negotiate the Sub-Advisory Agreements and the fees thereunder at arm’s length. The Board also reviewed Portfolio specific data with regard to the profitability of the Portfolios to each Sub-Adviser, as available.
Economies of scale. The Board also considered the effect of the Portfolios’ growth in size on their fees. The Board noted that the fee schedules for most of the Portfolios contain breakpoints that reduce the fee rate above specified asset levels. The Board noted those Portfolios that did not contain breakpoints in the advisory fee and took into account management’s discussion of the same. The Board noted that those Portfolios with advisory fee schedules containing breakpoints generally reflect the inclusion of breakpoints in the sub-advisory fee schedule for such Portfolios. The Board considered the effective fees under the Advisory Agreement for a Portfolio as a percentage of assets at different asset levels and possible economies of scale that may be realized if the assets of the Portfolio grow. Among other data, the Board examined the effect of a Portfolio’s growth in size on various fee schedules and reviewed the Lipper and Bobroff Reports, which compared fees among peers. The Board also generally noted that if a Portfolio’s assets increase over time, the Portfolio may realize other economies of scale if assets increase proportionally more than certain other fixed expenses. In addition, the Board noted that the Adviser had taken a number of steps to date intended to share the benefits of economies of scale with contractholders.
MSF-46
Metropolitan Series Fund
WMC Balanced Portfolio (formerly, BlackRock Diversified Portfolio)
Board of Trustees’ Consideration of Advisory and Sub-Advisory Agreements—(Continued)
With respect to the WMC Balanced Portfolio, the Board noted that the Portfolio’s advisory fee and sub-advisory fee each contains breakpoints that reduce the advisory fee rate on assets above certain specified asset levels.
Other factors. As part of its evaluation of the Adviser’s compensation, the Board considered other benefits that may be realized by the Adviser and its affiliates from their relationship with the Trusts. Among them, the Board recognized that an affiliate of the Adviser, MetLife Investors Distribution Company, serves as the Distributor for the Trusts, and, as such, receives payments pursuant to Rule 12b-1 from the Portfolios to compensate it for providing shareholder services and selling activities, which could lead to growth in the Trusts’ assets and corresponding benefits from such growth, including economies of scale. The Board also considered that affiliates of the Adviser may benefit from certain indirect tax benefits relating to dividend received deductions and foreign tax credits. In conjunction with these considerations, the Board noted the costs of providing investment management and other services to the Portfolios and the ongoing commitment of the Adviser to the Portfolios.
The Board considered other benefits that may be realized by each Sub-Adviser and its affiliates from their relationship with the Trusts, including the opportunity to provide advisory services to additional portfolios of the Trusts and reputational benefits. In conjunction with these considerations, the Board noted the costs of providing investment advisory services to the Portfolios and the ongoing commitment of the Sub-Advisers to the Portfolios.
The Board considered possible conflicts of interest in the form of material benefits or detriments to the Trusts resulting from the nature of the Trusts’ and the Adviser’s or the Sub-Advisers’ affiliations and the services that are provided to the Trusts, and the manner in which such conflicts were mitigated.
Conclusions. After full consideration of the factors discussed above, the Board, including a majority of the Independent Trustees, approved the Advisory Agreement and the Sub-Advisory Agreement, as applicable, with respect to each Portfolio, unless otherwise noted. In making its approvals, the Board concluded that the nature, extent and quality of services provided by the Adviser and each Sub-Adviser supported the renewal of the Agreements. The Board also concluded that the investment performance of each Fund was such that each Agreement should continue. In addition, the Board concluded that fees paid by a Portfolio to the Adviser and, if applicable, the Sub-Adviser appeared to be acceptable in light of nature, extent and quality of the services provided by the Adviser and Sub-Adviser. Further, the Board concluded that the Adviser’s profitability in providing services under the Advisory Agreements did not appear unreasonably high in light of the nature, extent and quality of the services provided by the Adviser. Finally, the Board concluded that the Advisory and Sub-Advisory fees in some measure share economies of scale with contractholders. In approving the renewal of each of the Agreements, the Board, including the Independent Trustees, did not identify any single factor as controlling, and generally attributed different weights to various factors for the various Portfolios. The Board evaluated all information available to them on a Portfolio-by-Portfolio basis, and their decisions were made separately with respect to each Portfolio.
MSF-47
Metropolitan Series Fund
WMC Core Equity Opportunities Portfolio (formerly, Davis Venture Value Portfolio)
Managed by Wellington Management Company, LLP
Portfolio Manager Commentary*
PERFORMANCE
Davis Selected Advisers, L.P. (“Davis”), the Portfolio’s subadviser prior to February 3, 2014, prepared this commentary, which addresses the Portfolio’s performance for the one year period ended December 31, 2013. On February 3, 2014, Wellington Management Company, LLP (“Wellington”) succeeded Davis as the subadviser to the Portfolio and the name of the Portfolio was changed from the Davis Venture Value Portfolio to the WMC Core Equity Opportunities Portfolio. This commentary and performance does not reflect the management of Wellington.
For the one year period ended December 31, 2013, the Class A, B, and E shares of the WMC Core Equity Opportunities Portfolio returned 33.70%, 33.36%, and 33.53%, respectively. The Portfolio’s benchmark, the Standard & Poor’s (“S&P”) 500 Index1, returned 32.39%.
MARKET ENVIRONMENT / CONDITIONS
A number of central banks from around the globe continued to hold interest rates low during 2013 in an attempt to spur the economy. In addition to the support that U.S. markets received from low rates, the markets also benefited from a reduction to the unemployment rate and an increase to consumer confidence as measured by the sentiment index of The Conference Board. The October and November consumer spending figures as reported by the U.S. Commerce Department also showed healthy gains. The Federal Reserve Board held its target for the shortest-term interest rates at between 0% and 0.25%. The twelve-months ending December 31, 2013 saw positive returns across all sectors in the S&P 500 Index. Each sector realized double digit increases rising by as much as 43% (Consumer Discretionary) to a low of 11% (Telecommunication Services). Among the sectors producing the strongest results were Health Care and Industrials.
PORTFOLIO REVIEW / PERIOD ENDING POSITIONING
Information Technology (“IT”) companies were the most important contributor to the Portfolio’s performance relative to the Index. The Portfolio’s IT companies out-performed the corresponding sector within the Index. Google was among the most important contributor to performance. Financial companies were the second most important contributor to the Portfolio’s performance relative to the Index. The Portfolio’s Financial companies slightly out-performed the corresponding sector within the Index and had a higher average weighting in this stronger performing sector. American Express, Bank of New York Mellon, Wells Fargo, Berkshire Hathaway, and Progressive were among the most important contributors to performance.
Industrial companies were one of the most important detractors from the Portfolio’s performance relative to the Index. The Portfolio’s Industrial companies under-performed the corresponding sector within the Index and had a lower average weighting in this stronger performing sector. Health Care companies were also an important detractor from the Portfolio’s performance relative to the Index. The Portfolio’s Health Care companies under-performed the corresponding sector within the Index and had a lower average weighting in this stronger performing sector. Laboratory Corp. of America was among the most important detractors from performance.
Other important contributors to performance included two Consumer Discretionary companies (Bed Bath & Beyond and Netflix) and a Consumer Staples company (CVS Caremark). Other important detractors from performance included three Materials companies, Rio Tinto (United Kingdom), BHP Billiton (United Kingdom), and Potash (Canada). Within Financials, Hang Lung Group (Hong Kong) was also a detractor. The Portfolio no longer owns Rio Tinto, BHP Billiton, or Potash.
Our focus is on selecting investments one company at a time without reference to a benchmark index. Our long-term focus usually results in low Portfolio turnover. We do not overreact to past short-term performance from individual holdings on either the upside or the downside. Market conditions may vary from period to period, yet the core tenets of the Davis Investment Discipline and approach remain the same. We start with the premise that stocks represent fractional ownership in real businesses. We seek to purchase durable businesses at value prices and hold them for the long term. We believe that owning shares of well-managed businesses with attractive reinvestment rates, purchased at reasonable valuations and held for years to allow the power of compounding to work, is a reliable method for building capital over long investment horizons.
MSF-1
Metropolitan Series Fund
WMC Core Equity Opportunities Portfolio (formerly, Davis Venture Value Portfolio)
Managed by Wellington Management Company, LLP
Portfolio Manager Commentary*—(Continued)
As of December 31, 2013, the Portfolio’s largest sector holdings were in Financials, Consumer Staples, and Information Technology. Only two companies dropped out of the Portfolio’s top 10 holdings from the end of 2012. The Portfolio continues to own both companies that dropped out, Monsanto and Loews. The two new additions to the Portfolio’s top 10 holdings were Canadian Natural Resources and UnitedHealth Group.
Christopher Davis
Portfolio Manager
Davis Selected Advisers, L.P.
* This commentary may include statements that constitute “forward-looking statements” under the U.S. securities laws. Forward-looking statements include, among other things, projections, estimates, and information about possible or future results related to the Portfolio, market or regulatory developments. The views expressed above are not guarantees of future performance or economic results and involve certain risks, uncertainties and assumptions that could cause actual outcomes and results to differ materially from the views expressed herein. The views expressed above are subject to change at any time based upon economic, market, or other conditions and the subadvisory firm undertakes no obligation to update the views expressed herein. Any discussions of specific securities should not be considered a recommendation to buy or sell those securities. The views expressed above (including any forward-looking statement) may not be relied upon as investment advice or as an indication of the Portfolio’s trading intent. Information about the Portfolio’s holdings, asset allocation or country diversification is historical and is not an indication of future Portfolio composition, which may vary. Direct investment in any index is not possible. The performance of any index mentioned in this commentary has not been adjusted for ongoing management, distribution and operating expenses, and sales charges applicable to mutual fund investments. In addition, the returns do not reflect additional fees charged by separate accounts or variable insurance contracts that an investor in the Portfolio may pay. If these additional fees were reflected, performance would have been lower.
MSF-2
Metropolitan Series Fund
WMC Core Equity Opportunities Portfolio (formerly, Davis Venture Value Portfolio)
A $10,000 INVESTMENT COMPARED TO THE S&P 500 INDEX
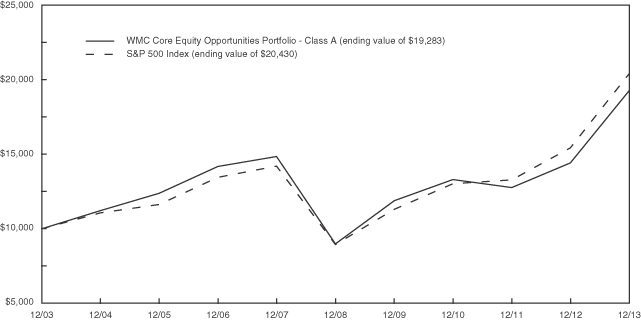
AVERAGE ANNUAL RETURNS (%) (FOR THE YEAR ENDED DECEMBER 31, 2013)
| | | | | | | | | | | | |
| | | 1 Year | | | 5 Year | | | 10 Year | |
| WMC Core Equity Opportunities Portfolio | | | | | | | | | | | | |
Class A | | | 33.70 | | | | 16.44 | | | | 6.79 | |
Class B | | | 33.36 | | | | 16.16 | | | | 6.51 | |
Class E | | | 33.53 | | | | 16.28 | | | | 6.62 | |
| S&P 500 Index | | | 32.39 | | | | 17.94 | | | | 7.41 | |
1 The Standard & Poor’s 500 Index is an unmanaged index representing the performance of 500 major companies, most of which are listed on the New York Stock Exchange.
Portfolio performance is calculated including reinvestment of all income and capital gain distributions. Performance numbers are net of all Portfolio expenses but do not include any insurance, sales, separate account or administrative charges of variable annuity or life insurance contracts or any additional expenses that participants may bear relating to the operations of their plans. If these charges were included, the returns would be lower. The performance of any index referenced above has not been adjusted for ongoing management, distribution and operating expenses, and sales charges applicable to mutual fund investments. Direct investment in any index is not possible. The performance of Class A shares, as set forth in the line graph above, will differ from that of other classes because of the difference in expenses paid by policyholders investing in the different share classes.
This information represents past performance and is not indicative of future results. Investment return and principal value may fluctuate so that shares, upon redemption, may be worth more or less than the original cost.
PORTFOLIO COMPOSITION AS OF DECEMBER 31, 2013
Top Holdings
| | | | |
| | |
% of
Net Assets | |
| American Express Co. | | | 8.2 | |
| Wells Fargo & Co. | | | 6.8 | |
| Bank of New York Mellon Corp. (The) | | | 6.6 | |
| Google, Inc. - Class A | | | 6.1 | |
| CVS Caremark Corp. | | | 5.6 | |
| Berkshire Hathaway, Inc. - Class A | | | 4.9 | |
| Bed Bath & Beyond, Inc. | | | 3.9 | |
| Costco Wholesale Corp. | | | 3.1 | |
| UnitedHealth Group, Inc. | | | 2.8 | |
| Canadian Natural Resources, Ltd. | | | 2.7 | |
Top Sectors
| | | | |
| | | % of
Market Value of
Total Long-Term Investments | |
| Financials | | | 40.9 | |
| Information Technology | | | 12.3 | |
| Consumer Staples | | | 12.2 | |
| Consumer Discretionary | | | 11.5 | |
| Health Care | | | 7.9 | |
| Materials | | | 5.7 | |
| Energy | | | 5.3 | |
| Industrials | | | 4.2 | |
MSF-3
Metropolitan Series Fund
WMC Core Equity Opportunities Portfolio (formerly, Davis Venture Value Portfolio)
Understanding Your Portfolio’s Expenses
Shareholder Expense Example
As a shareholder of the Portfolio, you incur ongoing costs, including management fees; distribution and service (12b-1) fees; and other Portfolio expenses. This example is intended to help you understand your ongoing costs (in dollars) (referred to as “expenses”) of investing in the Portfolio and compare these costs with the ongoing costs of investing in other mutual funds. The example is based on an investment of $1,000 invested at the beginning of the period and held for the entire period, July 1, 2013 through December 31, 2013.
Actual Expenses
The first line for each share class of the Portfolio in the table below provides information about actual account values and actual expenses. You may use the information in this line, together with the amount you invested in the particular share class of the Portfolio, to estimate the expenses that you paid over the period. Simply divide your account value by $1,000 (for example, an $8,600 account value divided by $1,000 = 8.6), then multiply the result by the number in the first line under the heading entitled “Expenses Paid During Period” to estimate the expenses you paid on your account during this period.
Hypothetical Example for Comparison Purposes
The second line for each share class of the Portfolio in the table below provides information about hypothetical account values and hypothetical expenses based on the Portfolio’s actual expense ratio and an assumed rate of return of 5% per year before expenses, which is not the Portfolio’s actual return. The hypothetical account values and expenses may not be used to estimate the actual ending account balance or expenses you paid for the period. You may use this information to compare the ongoing costs of investing in the Portfolio and other funds. To do so, compare this 5% hypothetical example with the 5% hypothetical examples that appear in the shareholder reports of the other funds.
Please note that the expenses shown in the table are meant to highlight your ongoing costs only and do not reflect any fees or charges of your variable insurance product or any additional expenses that participants in certain eligible qualified plans may bear relating to the operations of their plan. Therefore, the second line for each share class in the table is useful in comparing ongoing costs only, and will not help you determine the relative total costs of owning different funds. In addition, if these other costs were included, your costs would have been higher.
| | | | | | | | | | | | | | | | | | |
WMC Core Equity Opportunities Portfolio
(formerly Davis Venture Value Portfolio) | | | | Annualized
Expense
Ratio | | | Beginning
Account Value
July 1,
2013 | | | Ending
Account Value
December 31,
2013 | | | Expenses Paid
During Period**
July 1, 2013
to
December 31,
2013 | |
Class A(a) | | Actual | | | 0.67 | % | | $ | 1,000.00 | | | $ | 1,157.90 | | | $ | 3.64 | |
| | Hypothetical* | | | 0.67 | % | | $ | 1,000.00 | | | $ | 1,021.83 | | | $ | 3.41 | |
| | | | | |
Class B(a) | | Actual | | | 0.92 | % | | $ | 1,000.00 | | | $ | 1,156.40 | | | $ | 5.00 | |
| | Hypothetical* | | | 0.92 | % | | $ | 1,000.00 | | | $ | 1,020.57 | | | $ | 4.69 | |
| | | | | |
Class E(a) | | Actual | | | 0.82 | % | | $ | 1,000.00 | | | $ | 1,157.00 | | | $ | 4.46 | |
| | Hypothetical* | | | 0.82 | % | | $ | 1,000.00 | | | $ | 1,021.07 | | | $ | 4.18 | |
* Hypothetical assumes a rate of return of 5% per year before expenses.
** Expenses paid are equal to the Portfolio’s annualized expense ratio for the most recent six month period, as shown above, multiplied by the average account value over the period, multiplied by the number of days (184 days) in the most recent fiscal half-year, divided by 365 (to reflect the one-half year period).
(a) The annualized expense ratio shown reflects the impact of the management fee waiver as described in Note 5 of the Notes to Financial Statements.
MSF-4
Metropolitan Series Fund
WMC Core Equity Opportunities Portfolio (formerly, Davis Venture Value Portfolio)
Schedule of Investments as of December 31, 2013
Common Stocks—94.8% of Net Assets
| | | | | | | | |
| Security Description | | Shares | | | Value | |
| | |
Aerospace & Defense—0.5% | | | | | | | | |
Textron, Inc. (a) | | | 582,900 | | | $ | 21,427,404 | |
| | | | | | | | |
| | |
Automobiles—0.4% | | | | | | | | |
Harley-Davidson, Inc. (a) | | | 245,872 | | | | 17,024,177 | |
| | | | | | | | |
| | |
Beverages—2.2% | | | | | | | | |
Coca-Cola Co. (The) | | | 843,536 | | | | 34,846,472 | |
Diageo plc (ADR) | | | 264,362 | | | | 35,006,816 | |
Heineken Holding NV | | | 338,883 | | | | 21,491,083 | |
| | | | | | | | |
| | | | | | | 91,344,371 | |
| | | | | | | | |
| | |
Capital Markets—10.3% | | | | | | | | |
Ameriprise Financial, Inc. | | | 204,016 | | | | 23,472,041 | |
Bank of New York Mellon Corp. (The) | | | 7,812,673 | | | | 272,974,795 | |
Charles Schwab Corp. (The) (a) | | | 2,031,394 | | | | 52,816,244 | |
Goldman Sachs Group, Inc. (The) | | | 50,033 | | | | 8,868,849 | |
Julius Baer Group, Ltd. (b) | | | 1,430,768 | | | | 68,990,889 | |
| | | | | | | | |
| | | | | | | 427,122,818 | |
| | | | | | | | |
| | |
Chemicals—4.6% | | | | | | | | |
Air Products & Chemicals, Inc. (a) | | | 638,413 | | | | 71,361,805 | |
Ecolab, Inc. | | | 534,473 | | | | 55,729,500 | |
Monsanto Co. | | | 249,314 | | | | 29,057,547 | |
Praxair, Inc. | | | 268,941 | | | | 34,970,398 | |
| | | | | | | | |
| | | | | | | 191,119,250 | |
| | | | | | | | |
| | |
Commercial Banks—6.8% | | | | | | | | |
Wells Fargo & Co. | | | 6,193,147 | | | | 281,168,874 | |
| | | | | | | | |
| |
Commercial Services & Supplies—0.7% | | | | | |
Iron Mountain, Inc. | | | 912,776 | | | | 27,702,752 | |
| | | | | | | | |
| | |
Computers & Peripherals—0.4% | | | | | | | | |
Hewlett-Packard Co. | | | 577,419 | | | | 16,156,184 | |
| | | | | | | | |
| | |
Construction Materials—0.8% | | | | | | | | |
Lafarge S.A. | | | 312,900 | | | | 23,546,067 | |
Martin Marietta Materials, Inc. (a) | | | 103,749 | | | | 10,368,675 | |
| | | | | | | | |
| | | | | | | 33,914,742 | |
| | | | | | | | |
| | |
Consumer Finance—8.2% | | | | | | | | |
American Express Co. | | | 3,767,710 | | | | 341,844,328 | |
| | | | | | | | |
| | |
Diversified Financial Services—6.0% | | | | | | | | |
Berkshire Hathaway, Inc. - Class A (b) | | | 1,144 | | | | 203,517,600 | |
JPMorgan Chase & Co. | | | 770,845 | | | | 45,079,016 | |
| | | | | | | | |
| | | | | | | 248,596,616 | |
| | | | | | | | |
| | |
Energy Equipment & Services—0.7% | | | | | | | | |
Schlumberger, Ltd. | | | 304,053 | | | | 27,398,216 | |
| | | | | | | | |
| | |
Food & Staples Retailing—8.6% | | | | | | | | |
Costco Wholesale Corp. | | | 1,068,694 | | | | 127,185,273 | |
CVS Caremark Corp. | | | 3,247,037 | | | | 232,390,438 | |
| | | | | | | | |
| | | | | | | 359,575,711 | |
| | | | | | | | |
| | |
Food Products—0.2% | | | | | | | | |
Nestle S.A. | | | 117,524 | | | | 8,627,195 | |
| | | | | | | | |
|
Health Care Providers & Services—7.0% | |
Express Scripts Holding Co. (a) (b) | | | 1,406,856 | | | | 98,817,566 | |
Laboratory Corp. of America Holdings (a) (b) | | | 853,846 | | | | 78,015,909 | |
UnitedHealth Group, Inc. | | | 1,540,877 | | | | 116,028,038 | |
| | | | | | | | |
| | | | | | | 292,861,513 | |
| | | | | | | | |
| | |
Household Durables—0.1% | | | | | | | | |
Hunter Douglas NV | | | 73,878 | | | | 3,346,521 | |
| | | | | | | | |
| | |
Insurance—6.0% | | | | | | | | |
ACE, Ltd. | | | 388,384 | | | | 40,209,396 | |
Alleghany Corp. (b) | | | 61,972 | | | | 24,786,321 | |
Everest Re Group, Ltd. | | | 120,205 | | | | 18,736,353 | |
Fairfax Financial Holdings, Ltd. | | | 17,000 | | | | 6,787,357 | |
Loews Corp. | | | 1,250,564 | | | | 60,327,207 | |
Markel Corp. (a) (b) | | | 13,511 | | | | 7,841,109 | |
Progressive Corp. (The) (a) | | | 3,268,623 | | | | 89,135,349 | |
| | | | | | | | |
| | | | | | | 247,823,092 | |
| | | | | | | | |
| | |
Internet & Catalog Retail—2.5% | | | | | | | | |
Liberty Interactive Corp. - Class A (b) | | | 1,078,576 | | | | 31,656,206 | |
Liberty Ventures - Series A (b) | | | 67,227 | | | | 8,241,358 | |
Netflix, Inc. (a) (b) | | | 51,927 | | | | 19,117,963 | |
priceline.com, Inc. (b) | | | 39,420 | | | | 45,821,808 | |
| | | | | | | | |
| | | | | | | 104,837,335 | |
| | | | | | | | |
| | |
Internet Software & Services—6.4% | | | | | | | | |
Google, Inc. - Class A (b) | | | 228,186 | | | | 255,730,332 | |
Twitter, Inc. (a) (b) | | | 194,030 | | | | 12,350,010 | |
| | | | | | | | |
| | | | | | | 268,080,342 | |
| | | | | | | | |
| | |
IT Services—0.9% | | | | | | | | |
Visa, Inc. - Class A (a) | | | 172,505 | | | | 38,413,413 | |
| | | | | | | | |
| | |
Life Sciences Tools & Services—0.5% | | | | | | | | |
Agilent Technologies, Inc. | | | 322,916 | | | | 18,467,566 | |
| | | | | | | | |
| | |
Machinery—1.1% | | | | | | | | |
PACCAR, Inc. (a) | | | 802,957 | | | | 47,510,966 | |
| | | | | | | | |
| | |
Marine—0.4% | | | | | | | | |
Kuehne & Nagel International AG (a) | | | 118,553 | | | | 15,592,116 | |
| | | | | | | | |
| | |
Media—2.6% | | | | | | | | |
Liberty Global plc - Series C (b) | | | 895,210 | | | | 75,484,107 | |
Walt Disney Co. (The) | | | 418,360 | | | | 31,962,704 | |
| | | | | | | | |
| | | | | | | 107,446,811 | |
| | | | | | | | |
| | |
Oil, Gas & Consumable Fuels—4.4% | | | | | | | | |
Canadian Natural Resources, Ltd. | | | 3,312,651 | | | | 112,100,110 | |
EOG Resources, Inc. | | | 246,802 | | | | 41,423,247 | |
Occidental Petroleum Corp. | | | 304,938 | | | | 28,999,604 | |
| | | | | | | | |
| | | | | | | 182,522,961 | |
| | | | | | | | |
See accompanying notes to financial statements.
MSF-5
Metropolitan Series Fund
WMC Core Equity Opportunities Portfolio (formerly, Davis Venture Value Portfolio)
Schedule of Investments as of December 31, 2013
Common Stocks—(Continued)
| | | | | | | | |
| Security Description | |
Shares | | | Value | |
|
Professional Services—0.2% | |
Experian plc | | | 541,850 | | | $ | 10,000,497 | |
| | | | | | | | |
|
Real Estate Management & Development—1.4% | |
Brookfield Asset Management, Inc. - Class A (a) | | | 665,188 | | | | 25,829,250 | |
Brookfield Property Partners L.P. | | | 38,674 | | | | 771,160 | |
Hang Lung Group, Ltd. | | | 6,032,524 | | | | 30,618,714 | |
| | | | | | | | |
| | | | | | | 57,219,124 | |
| | | | | | | | |
|
Semiconductors & Semiconductor Equipment—1.2% | |
Texas Instruments, Inc. (a) | | | 1,168,652 | | | | 51,315,509 | |
| | | | | | | | |
|
Software—2.7% | |
Activision Blizzard, Inc. | | | 1,928,628 | | | | 34,387,437 | |
Microsoft Corp. | | | 1,060,984 | | | | 39,712,631 | |
Oracle Corp. | | | 1,043,039 | | | | 39,906,672 | |
| | | | | | | | |
| | | | | | | 114,006,740 | |
| | | | | | | | |
|
Specialty Retail—5.1% | |
Bed Bath & Beyond, Inc. (a) (b) | | | 2,030,376 | | | | 163,039,193 | |
CarMax, Inc. (a) (b) | | | 1,056,637 | | | | 49,683,072 | |
| | | | | | | | |
| | | | | | | 212,722,265 | |
| | | | | | | | |
|
Textiles, Apparel & Luxury Goods—0.2% | |
Cie Financiere Richemont S.A. | | | 98,746 | | | | 9,881,404 | |
| | | | | | | | |
|
Tobacco—0.6% | |
Philip Morris International, Inc. | | | 296,719 | | | | 25,853,126 | |
| | | | | | | | |
|
Transportation Infrastructure—1.1% | |
China Merchants Holdings International Co., Ltd. | | | 10,740,468 | | | | 39,554,908 | |
Wesco Aircraft Holdings, Inc. (a) (b) | | | 262,620 | | | | 5,756,631 | |
| | | | | | | | |
| | | | | | | 45,311,539 | |
| | | | | | | | |
Total Common Stocks
(Cost $2,488,581,519) | | | | | | | 3,946,235,478 | |
| | | | | | | | |
|
| Investment Company Security—0.5% | |
SPDR S&P 500 ETF Trust
(Cost $20,013,056) | | | 112,000 | | | | 20,683,040 | |
| | | | | | | | |
| Corporate Bonds & Notes—0.0% | |
| Security Description | | Shares/
Principal
Amount* | | | Value | |
|
Forest Products & Paper—0.0% | |
Emerald Plantation Holdings, Ltd.
6.000%, 01/30/20 (c) (d)
(Cost $602,424) | | | 993,939 | | | $ | 675,878 | |
| | | | | | | | |
|
| Short-Term Investment—4.9% | |
|
Mutual Fund—4.9% | |
State Street Navigator Securities Lending MET Portfolio (e) | | | 202,835,534 | | | | 202,835,534 | |
| | | | | | | | |
Total Short-Term Investment
(Cost $202,835,534) | | | | | | | 202,835,534 | |
| | | | | | | | |
Total Investments—100.2%
(Cost $2,712,032,533) (f) | | | | | | | 4,170,429,930 | |
Other assets and liabilities (net)—(0.2)% | | | | | | | (8,771,688 | ) |
| | | | | | | | |
| Net Assets—100.0% | | | | | | $ | 4,161,658,242 | |
| | | | | | | | |
| * | Principal amount stated in U.S. dollars unless otherwise noted. |
| (a) | All or a portion of the security was held on loan. As of December 31, 2013, the market value of securities loaned was $199,603,977 and the collateral received consisted of cash in the amount of $202,835,534. The cash collateral is invested in a money market fund managed by an affiliate of the custodian. |
| (b) | Non-income producing security. |
| (c) | Payment-in-kind security for which part of the income earned may be paid as additional principal. |
| (d) | Illiquid security. As of December 31, 2013, these securities represent 0.0% of net assets. |
| (e) | Represents investment of cash collateral received from securities lending transactions. |
| (f) | As of December 31, 2013, the aggregate cost of investments for federal income tax purposes was $2,693,914,022. The aggregate unrealized appreciation and depreciation of investments were $1,478,389,423 and $(1,873,515), respectively, resulting in net unrealized appreciation of $1,476,515,908 for federal income tax purposes. |
| (ADR)— | An American Depositary Receipt is a certificate issued by a custodian bank representing the right to receive securities of the foreign issuer described. Trading on exchanges not located in the United States or Canada significantly influences the value of ADRs. |
| (ETF)— | Exchange-Traded Fund |
See accompanying notes to financial statements.
MSF-6
Metropolitan Series Fund
WMC Core Equity Opportunities Portfolio (formerly, Davis Venture Value Portfolio)
Schedule of Investments as of December 31, 2013
Fair Value Hierarchy
Accounting principles generally accepted in the United States of America (“GAAP”) define fair market value as the price that the Portfolio would receive to sell an asset or pay to transfer a liability in an orderly transaction between market participants at the measurement date. It establishes a fair value hierarchy that prioritizes inputs to valuation methods and requires disclosure of the fair value hierarchy that segregates fair value measurements into three levels. Levels 1, 2 and 3 of the fair value hierarchy are defined as follows:
Level 1 - unadjusted quoted prices in active markets for identical investments
Level 2 - other significant observable inputs (including, but not limited to, unadjusted quoted prices for similar investments in markets that are either active or inactive; inputs other than quoted prices that are observable such as interest rates, yield curves, volatilities, prepayment speeds, loss severities, credit risks, default rates, etc.)
Level 3 - significant unobservable inputs based on the best information available in the circumstances, to the extent observable inputs are unavailable (including the Portfolio’s own assumptions in determining the fair value of investments)
The inputs or methodologies used for valuing investments are not necessarily an indication of the risk associated with investing in them. Changes to the inputs or methodologies used may result in transfers between levels, which will be recognized as of the beginning of the reporting period. Information on transfers between Level 1 and Level 2, if any, will be disclosed following the fair value hierarchy table below. A reconciliation of Level 3 securities, if any, will also be disclosed following the fair value hierarchy table. For more information about the Portfolio’s policy regarding the valuation of investments, please refer to the Notes to Financial Statements.
The following table summarizes the fair value hierarchy of the Portfolio’s investments as of December 31, 2013:
| | | | | | | | | | | | | | | | |
| Description | | Level 1 | | | Level 2 | | | Level 3 | | | Total | |
| Common Stocks | | | | | | | | | | | | | | | | |
Aerospace & Defense | | $ | 21,427,404 | | | $ | — | | | $ | — | | | $ | 21,427,404 | |
Automobiles | | | 17,024,177 | | | | — | | | | — | | | | 17,024,177 | |
Beverages | | | 69,853,288 | | | | 21,491,083 | | | | — | | | | 91,344,371 | |
Capital Markets | | | 358,131,929 | | | | 68,990,889 | | | | — | | | | 427,122,818 | |
Chemicals | | | 191,119,250 | | | | — | | | | — | | | | 191,119,250 | |
Commercial Banks | | | 281,168,874 | | | | — | | | | — | | | | 281,168,874 | |
Commercial Services & Supplies | | | 27,702,752 | | | | — | | | | — | | | | 27,702,752 | |
Computers & Peripherals | | | 16,156,184 | | | | — | | | | — | | | | 16,156,184 | |
Construction Materials | | | 10,368,675 | | | | 23,546,067 | | | | — | | | | 33,914,742 | |
Consumer Finance | | | 341,844,328 | | | | — | | | | — | | | | 341,844,328 | |
Diversified Financial Services | | | 248,596,616 | | | | — | | | | — | | | | 248,596,616 | |
Energy Equipment & Services | | | 27,398,216 | | | | — | | | | — | | | | 27,398,216 | |
Food & Staples Retailing | | | 359,575,711 | | | | — | | | | — | | | | 359,575,711 | |
Food Products | | | — | | | | 8,627,195 | | | | — | | | | 8,627,195 | |
Health Care Providers & Services | | | 292,861,513 | | | | — | | | | — | | | | 292,861,513 | |
Household Durables | | | — | | | | 3,346,521 | | | | — | | | | 3,346,521 | |
Insurance | | | 247,823,092 | | | | — | | | | — | | | | 247,823,092 | |
Internet & Catalog Retail | | | 104,837,335 | | | | — | | | | — | | | | 104,837,335 | |
Internet Software & Services | | | 268,080,342 | | | | — | | | | — | | | | 268,080,342 | |
IT Services | | | 38,413,413 | | | | — | | | | — | | | | 38,413,413 | |
Life Sciences Tools & Services | | | 18,467,566 | | | | — | | | | — | | | | 18,467,566 | |
Machinery | | | 47,510,966 | | | | — | | | | — | | | | 47,510,966 | |
Marine | | | — | | | | 15,592,116 | | | | — | | | | 15,592,116 | |
Media | | | 107,446,811 | | | | — | | | | — | | | | 107,446,811 | |
Oil, Gas & Consumable Fuels | | | 182,522,961 | | | | — | | | | — | | | | 182,522,961 | |
Professional Services | | | — | | | | 10,000,497 | | | | — | | | | 10,000,497 | |
Real Estate Management & Development | | | 26,600,410 | | | | 30,618,714 | | | | — | | | | 57,219,124 | |
Semiconductors & Semiconductor Equipment | | | 51,315,509 | | | | — | | | | — | | | | 51,315,509 | |
Software | | | 114,006,740 | | | | — | | | | — | | | | 114,006,740 | |
Specialty Retail | | | 212,722,265 | | | | — | | | | — | | | | 212,722,265 | |
Textiles, Apparel & Luxury Goods | | | — | | | | 9,881,404 | | | | — | | | | 9,881,404 | |
Tobacco | | | 25,853,126 | | | | — | | | | — | | | | 25,853,126 | |
Transportation Infrastructure | | | 5,756,631 | | | | 39,554,908 | | | | — | | | | 45,311,539 | |
Total Common Stocks | | | 3,714,586,084 | | | | 231,649,394 | | | | — | | | | 3,946,235,478 | |
Total Investment Company Security | | | 20,683,040 | | | | — | | | | — | | | | 20,683,040 | |
Total Corporate Bonds & Notes* | | | — | | | | 675,878 | | | | — | | | | 675,878 | |
Total Short-Term Investment* | | | 202,835,534 | | | | — | | | | — | | | | 202,835,534 | |
Total Investments | | $ | 3,938,104,658 | | | $ | 232,325,272 | | | $ | — | | | $ | 4,170,429,930 | |
| | | | | | | | | | | | | | | | | |
Collateral for securities loaned (Liability) | | $ | — | | | $ | (202,835,534 | ) | | $ | — | | | $ | (202,835,534 | ) |
| * | See Schedule of Investments for additional detailed categorizations. |
See accompanying notes to financial statements.
MSF-7
Metropolitan Series Fund
WMC Core Equity Opportunities Portfolio (formerly, Davis Venture Value Portfolio)
Statement of Assets and Liabilities
December 31, 2013
| | | | |
Assets | | | | |
Investments at value (a) (b) | | $ | 4,170,429,930 | |
Cash | | | 184,543,748 | |
Receivable for: | | | | |
Investments sold | | | 10,232,690 | |
Fund shares sold | | | 267,023 | |
Dividends and interest | | | 5,109,347 | |
Prepaid expenses | | | 10,377 | |
| | | | |
Total Assets | | | 4,370,593,115 | |
Liabilities | | | | |
Collateral for securities loaned | | | 202,835,534 | |
Payables for: | | | | |
Fund shares redeemed | | | 3,320,169 | |
Accrued expenses: | | | | |
Management fees | | | 2,265,793 | |
Distribution and service fees | | | 282,912 | |
Deferred trustees’ fees | | | 55,284 | |
Other expenses | | | 175,181 | |
| | | | |
Total Liabilities | | | 208,934,873 | |
| | | | |
Net Assets | | $ | 4,161,658,242 | |
| | | | |
Net assets consist of: | | | | |
Paid in surplus | | $ | 2,316,508,174 | |
Undistributed net investment income | | | 25,357,882 | |
Accumulated net realized gain | | | 361,321,270 | |
Unrealized appreciation on investments and foreign currency transactions | | | 1,458,470,916 | |
| | | | |
Net Assets | | $ | 4,161,658,242 | |
| | | | |
Net Assets | | | | |
Class A | | $ | 2,390,950,544 | |
Class B | | | 738,005,047 | |
Class E | | | 1,032,702,651 | |
Capital Shares Outstanding* | | | | |
Class A | | | 55,637,949 | |
Class B | | | 17,298,804 | |
Class E | | | 24,164,343 | |
Net Asset Value, Offering Price and Redemption Price Per Share | | | | |
Class A | | $ | 42.97 | |
Class B | | | 42.66 | |
Class E | | | 42.74 | |
| * | The Portfolio is authorized to issue an unlimited number of shares. |
| (a) | Identified cost of investments was $2,712,032,533. |
| (b) | Includes securities loaned at value of $199,603,977. |
Statement of Operations
Year Ended December 31, 2013
| | | | |
Investment Income | | | | |
Dividends (a) | | $ | 54,827,485 | |
Interest | | | 254,335 | |
Securities lending income | | | 481,200 | |
| | | | |
Total investment income | | | 55,563,020 | |
| | | | |
Expenses | | | | |
Management fees | | | 27,533,988 | |
Administration fees | | | 70,369 | |
Custodian and accounting fees | | | 391,781 | |
Distribution and service fees—Class B | | | 1,733,970 | |
Distribution and service fees—Class E | | | 1,467,757 | |
Audit and tax services | | | 37,723 | |
Legal | | | 30,260 | |
Trustees’ fees and expenses | | | 35,359 | |
Shareholder reporting | | | 218,222 | |
Insurance | | | 18,476 | |
Miscellaneous | | | 27,209 | |
| | | | |
Total expenses | | | 31,565,114 | |
Less management fee waiver | | | (1,862,498 | ) |
Less broker commission recapture | | | (11,837 | ) |
| | | | |
Net expenses | | | 29,690,779 | |
| | | | |
Net Investment Income | | | 25,872,241 | |
| | | | |
Net Realized and Unrealized Gain | | | | |
| Net realized gain on: | | | | |
Investments | | | 346,283,912 | |
Foreign currency transactions | | | 1,786 | |
| | | | |
Net realized gain | | | 346,285,698 | |
| | | | |
| Net change in unrealized appreciation on: | | | | |
Investments | | | 760,865,222 | |
Foreign currency transactions | | | 72,064 | |
| | | | |
Net change in unrealized appreciation | | | 760,937,286 | |
| | | | |
Net realized and unrealized gain | | | 1,107,222,984 | |
| | | | |
Net Increase in Net Assets From Operations | | $ | 1,133,095,225 | |
| | | | |
| (a) | Net of foreign withholding taxes of $1,048,872. |
See accompanying notes to financial statements.
MSF-8
Metropolitan Series Fund
WMC Core Equity Opportunities Portfolio (formerly, Davis Venture Value Portfolio)
Statements of Changes in Net Assets
| | | | | | | | |
| | | Year Ended
December 31,
2013 | | | Year Ended
December 31,
2012 | |
Increase (Decrease) in Net Assets: | | | | | | | | |
From Operations | | | | | | | | |
Net investment income | | $ | 25,872,241 | | | $ | 52,370,153 | |
Net realized gain | | | 346,285,698 | | | | 188,509,695 | |
Net change in unrealized appreciation | | | 760,937,286 | | | | 205,427,291 | |
| | | | | | | | |
Increase in net assets from operations | | | 1,133,095,225 | | | | 446,307,139 | |
| | | | | | | | |
From Distributions to Shareholders | | | | | | | | |
Net investment income | | | | | | | | |
Class A | | | (31,490,128 | ) | | | (17,983,910 | ) |
Class B | | | (8,152,158 | ) | | | (3,907,446 | ) |
Class E | | | (12,388,595 | ) | | | (6,686,295 | ) |
Net realized capital gains | | | | | | | | |
Class A | | | (37,609,908 | ) | | | 0 | |
Class B | | | (11,674,923 | ) | | | 0 | |
Class E | | | (16,474,748 | ) | | | 0 | |
| | | | | | | | |
Total distributions | | | (117,790,460 | ) | | | (28,577,651 | ) |
| | | | | | | | |
Decrease in net assets from capital share transactions | | | (490,709,115 | ) | | | (387,938,166 | ) |
| | | | | | | | |
Total increase in net assets | | | 524,595,650 | | | | 29,791,322 | |
| | |
Net Assets | | | | | | | | |
Beginning of period | | | 3,637,062,592 | | | | 3,607,271,270 | |
| | | | | | | | |
End of period | | $ | 4,161,658,242 | | | $ | 3,637,062,592 | |
| | | | | | | | |
| | |
Undistributed Net Investment Income | | | | | | | | |
End of period | | $ | 25,357,882 | | | $ | 48,881,396 | |
| | | | | | | | |
Other Information:
Capital Shares
Transactions in capital shares were as follows:
| | | | | | | | | | | | | | | | |
| | | Year Ended
December 31, 2013 | | | Year Ended
December 31, 2012 | |
| | | Shares | | | Value | | | Shares | | | Value | |
Class A | | | | | | | | | | | | | | | | |
Sales | | | 2,486,744 | | | $ | 92,199,353 | | | | 921,596 | | | $ | 29,348,079 | |
Reinvestments | | | 1,979,376 | | | | 69,100,036 | | | | 562,173 | | | | 17,983,910 | |
Redemptions | | | (12,006,298 | ) | | | (452,672,435 | ) | | | (7,082,648 | ) | | | (228,153,429 | ) |
| | | | | | | | | | | | | | | | |
Net decrease | | | (7,540,178 | ) | | $ | (291,373,046 | ) | | | (5,598,879 | ) | | $ | (180,821,440 | ) |
| | | | | | | | | | | | | | | | |
Class B | | | | | | | | | | | | | | | | |
Sales | | | 472,141 | | | $ | 18,005,282 | | | | 516,866 | | | $ | 16,351,213 | |
Reinvestments | | | 571,221 | | | | 19,827,081 | | | | 122,798 | | | | 3,907,446 | |
Redemptions | | | (3,096,663 | ) | | | (116,991,585 | ) | | | (2,716,476 | ) | | | (86,528,176 | ) |
| | | | | | | | | | | | | | | | |
Net decrease | | | (2,053,301 | ) | | $ | (79,159,222 | ) | | | (2,076,812 | ) | | $ | (66,269,517 | ) |
| | | | | | | | | | | | | | | | |
Class E | | | | | | | | | | | | | | | | |
Sales | | | 1,157,229 | | | $ | 43,504,691 | | | | 1,044,634 | | | $ | 33,142,403 | |
Reinvestments | | | 830,600 | | | | 28,863,343 | | | | 209,931 | | | | 6,686,295 | |
Redemptions | | | (5,090,245 | ) | | | (192,544,881 | ) | | | (5,685,296 | ) | | | (180,675,907 | ) |
| | | | | | | | | | | | | | | | |
Net decrease | | | (3,102,416 | ) | | $ | (120,176,847 | ) | | | (4,430,731 | ) | | $ | (140,847,209 | ) |
| | | | | | | | | | | | | | | | |
Decrease derived from capital shares transactions | | | | | | $ | (490,709,115 | ) | | | | | | $ | (387,938,166 | ) |
| | | | | | | | | | | | | | | | |
See accompanying notes to financial statements.
MSF-9
Metropolitan Series Fund
WMC Core Equity Opportunities Portfolio (formerly, Davis Venture Value Portfolio)
Financial Highlights
| | | | | | | | | | | | | | | | | | | | |
| Selected per share data | | | | | | | | | | | | | | | |
| | | Class A | |
| | | Year Ended December 31, | |
| | | 2013 | | | 2012 | | | 2011 | | | 2010 | | | 2009 | |
Net Asset Value, Beginning of Period | | $ | 33.21 | | | $ | 29.67 | | | $ | 31.25 | | | $ | 28.17 | | | $ | 21.72 | |
| | | | | | | | | | | | | | | | | | | | |
Income (Loss) from Investment Operations | | | | | | | | | | | | | | | | | | | | |
Net investment income (a) | | | 0.28 | | | | 0.48 | | | | 0.33 | | | | 0.28 | | | | 0.25 | |
Net realized and unrealized gain (loss) on investments | | | 10.64 | | | | 3.33 | | | | (1.56 | ) | | | 3.09 | | | | 6.57 | |
| | | | | | | | | | | | | | | | | | | | |
Total from investment operations | | | 10.92 | | | | 3.81 | | | | (1.23 | ) | | | 3.37 | | | | 6.82 | |
| | | | | | | | | | | | | | | | | | | | |
Less Distributions | | | | | | | | | | | | | | | | | | | | |
Distributions from net investment income | | | (0.53 | ) | | | (0.27 | ) | | | (0.35 | ) | | | (0.29 | ) | | | (0.37 | ) |
Distributions from net realized capital gains | | | (0.63 | ) | | | 0.00 | | | | 0.00 | | | | 0.00 | | | | 0.00 | |
| | | | | | | | | | | | | | | | | | | | |
Total distributions | | | (1.16 | ) | | | (0.27 | ) | | | (0.35 | ) | | | (0.29 | ) | | | (0.37 | ) |
| | | | | | | | | | | | | | | | | | | | |
Net Asset Value, End of Period | | $ | 42.97 | | | $ | 33.21 | | | $ | 29.67 | | | $ | 31.25 | | | $ | 28.17 | |
| | | | | | | | | | | | | | | | | | | | |
Total Return (%) (b) | | | 33.70 | | | | 12.86 | | | | (4.03 | ) | | | 12.00 | | | | 31.99 | |
| | | | | |
Ratios/Supplemental Data | | | | | | | | | | | | | | | | | | | | |
Gross ratio of expenses to average net assets (%) | | | 0.72 | | | | 0.73 | | | | 0.73 | | | | 0.73 | | | | 0.74 | |
Net ratio of expenses to average net assets (%) (c) | | | 0.67 | | | | 0.68 | | | | 0.68 | | | | 0.68 | | | | 0.69 | |
Ratio of net investment income to average net assets (%) | | | 0.74 | | | | 1.50 | | | | 1.06 | | | | 0.99 | | | | 1.06 | |
Portfolio turnover rate (%) | | | 11 | | | | 16 | | | | 19 | | | | 19 | | | | 24 | |
Net assets, end of period (in millions) | | $ | 2,391.0 | | | $ | 2,098.2 | | | $ | 2,040.4 | | | $ | 2,412.4 | | | $ | 2,472.8 | |
| | | | | | | | | | | | | | | | | | | | |
| | | Class B | |
| | | Year Ended December 31, | |
| | | 2013 | | | 2012 | | | 2011 | | | 2010 | | | 2009 | |
Net Asset Value, Beginning of Period | | $ | 32.98 | | | $ | 29.46 | | | $ | 31.04 | | | $ | 28.00 | | | $ | 21.58 | |
| | | | | | | | | | | | | | | | | | | | |
Income (Loss) from Investment Operations | | | | | | | | | | | | | | | | | | | | |
Net investment income (a) | | | 0.18 | | | | 0.40 | | | | 0.24 | | | | 0.21 | | | | 0.18 | |
Net realized and unrealized gain (loss) on investments | | | 10.57 | | | | 3.31 | | | | (1.54 | ) | | | 3.06 | | | | 6.54 | |
| | | | | | | | | | | | | | | | | | | | |
Total from investment operations | | | 10.75 | | | | 3.71 | | | | (1.30 | ) | | | 3.27 | | | | 6.72 | |
| | | | | | | | | | | | | | | | | | | | |
Less Distributions | | | | | | | | | | | | | | | | | | | | |
Distributions from net investment income | | | (0.44 | ) | | | (0.19 | ) | | | (0.28 | ) | | | (0.23 | ) | | | (0.30 | ) |
Distributions from net realized capital gains | | | (0.63 | ) | | | 0.00 | | | | 0.00 | | | | 0.00 | | | | 0.00 | |
| | | | | | | | | | | | | | | | | | | | |
Total distributions | | | (1.07 | ) | | | (0.19 | ) | | | (0.28 | ) | | | (0.23 | ) | | | (0.30 | ) |
| | | | | | | | | | | | | | | | | | | | |
Net Asset Value, End of Period | | $ | 42.66 | | | $ | 32.98 | | | $ | 29.46 | | | $ | 31.04 | | | $ | 28.00 | |
| | | | | | | | | | | | | | | | | | | | |
Total Return (%) (b) | | | 33.36 | | | | 12.62 | | | | (4.27 | ) | | | 11.71 | | | | 31.65 | |
| | | | | |
Ratios/Supplemental Data | | | | | | | | | | | | | | | | | | | | |
Gross ratio of expenses to average net assets (%) | | | 0.97 | | | | 0.98 | | | | 0.98 | | | | 0.98 | | | | 0.99 | |
Net ratio of expenses to average net assets (%) (c) | | | 0.92 | | | | 0.93 | | | | 0.93 | | | | 0.93 | | | | 0.94 | |
Ratio of net investment income to average net assets (%) | | | 0.49 | | | | 1.25 | | | | 0.80 | | | | 0.75 | | | | 0.79 | |
Portfolio turnover rate (%) | | | 11 | | | | 16 | | | | 19 | | | | 19 | | | | 24 | |
Net assets, end of period (in millions) | | $ | 738.0 | | | $ | 638.2 | | | $ | 631.4 | | | $ | 593.6 | | | $ | 492.6 | |
Please see following page for Financial Highlights footnote legend.
See accompanying notes to financial statements.
MSF-10
Metropolitan Series Fund
WMC Core Equity Opportunities Portfolio (formerly, Davis Venture Value Portfolio)
Financial Highlights
| | | | | | | | | | | | | | | | | | | | |
| Selected per share data | | | | | | | | | | | | | | | |
| | | Class E | |
| | | Year Ended December 31, | |
| | | 2013 | | | 2012 | | | 2011 | | | 2010 | | | 2009 | |
Net Asset Value, Beginning of Period | | $ | 33.03 | | | $ | 29.51 | | | $ | 31.09 | | | $ | 28.04 | | | $ | 21.61 | |
| | | | | | | | | | | | | | | | | | | | |
Income (Loss) from Investment Operations | | | | | | | | | | | | | | | | | | | | |
Net investment income (a) | | | 0.22 | | | | 0.43 | | | | 0.28 | | | | 0.24 | | | | 0.21 | |
Net realized and unrealized gain (loss) on investments | | | 10.60 | | | | 3.31 | | | | (1.55 | ) | | | 3.06 | | | | 6.54 | |
| | | | | | | | | | | | | | | | | | | | |
Total from investment operations | | | 10.82 | | | | 3.74 | | | | (1.27 | ) | | | 3.30 | | | | 6.75 | |
| | | | | | | | | | | | | | | | | | | | |
Less Distributions | | | | | | | | | | | | | | | | | | | | |
Distributions from net investment income | | | (0.48 | ) | | | (0.22 | ) | | | (0.31 | ) | | | (0.25 | ) | | | (0.32 | ) |
Distributions from net realized capital gains | | | (0.63 | ) | | | 0.00 | | | | 0.00 | | | | 0.00 | | | | 0.00 | |
| | | | | | | | | | | | | | | | | | | | |
Total distributions | | | (1.11 | ) | | | (0.22 | ) | | | (0.31 | ) | | | (0.25 | ) | | | (0.32 | ) |
| | | | | | | | | | | | | | | | | | | | |
Net Asset Value, End of Period | | $ | 42.74 | | | $ | 33.03 | | | $ | 29.51 | | | $ | 31.09 | | | $ | 28.04 | |
| | | | | | | | | | | | | | | | | | | | |
Total Return (%) (b) | | | 33.53 | | | | 12.70 | | | | (4.18 | ) | | | 11.82 | | | | 31.83 | |
| | | | | |
Ratios/Supplemental Data | | | | | | | | | | | | | | | | | | | | |
Gross ratio of expenses to average net assets (%) | | | 0.87 | | | | 0.88 | | | | 0.88 | | | | 0.88 | | | | 0.89 | |
Net ratio of expenses to average net assets (%) (c) | | | 0.82 | | | | 0.83 | | | | 0.83 | | | | 0.83 | | | | 0.84 | |
Ratio of net investment income to average net assets (%) | | | 0.59 | | | | 1.34 | | | | 0.90 | | | | 0.85 | | | | 0.90 | |
Portfolio turnover rate (%) | | | 11 | | | | 16 | | | | 19 | | | | 19 | | | | 24 | |
Net assets, end of period (in millions) | | $ | 1,032.7 | | | $ | 900.7 | | | $ | 935.4 | | | $ | 1,016.6 | | | $ | 887.3 | |
| (a) | Per share amounts based on average shares outstanding during the period. |
| (b) | Total return does not reflect any insurance, sales, separate account or administrative charges of variable annuity or life insurance contracts or any additional expenses that contract owners may bear under their variable contracts. If these charges were included, the returns would be lower. |
| (c) | Net ratio of expenses to average net assets includes the effect of management fee waivers as detailed in Note 5 of the Notes to Financial Statements. |
See accompanying notes to financial statements.
MSF-11
Metropolitan Series Fund
WMC Core Equity Opportunities Portfolio (formerly, Davis Venture Value Portfolio)
Notes to Financial Statements—December 31, 2013
1. Organization
Metropolitan Series Fund (the “Trust”) is organized as a Delaware statutory trust and registered under the Investment Company Act of 1940, as amended (the “1940 Act”), as an open-end management investment company. The Trust is currently comprised of thirty series, each of which operates as a distinct investment vehicle of the Trust. The portfolio included in this report is WMC Core Equity Opportunities Portfolio, formerly known as Davis Venture Value Portfolio (the “Portfolio”), which is diversified. Shares in the Portfolio are not offered directly to the general public and are currently available only to separate accounts established by Metropolitan Life Insurance Company (“MetLife”) and other affiliated life insurance companies.
The Portfolio has registered and offers three classes of shares: Class A, B, and E shares. Shares of each Class of the Portfolio represent an equal pro rata interest in the Portfolio and generally give the shareholder the same voting, dividend, liquidation, and other rights. Investment income, realized and unrealized capital gains and losses, the common expenses of the Portfolio, and certain Portfolio-level expense reductions, if any, are allocated on a pro rata basis to each Class based on the relative net assets of each Class to the net assets of the Portfolio. Each Class of shares differs in its respective distribution plan and such distribution expenses are allocated to that Class.
2. Significant Accounting Policies
The preparation of financial statements in conformity with accounting principles generally accepted in the United States of America (“GAAP”) requires management to make estimates and assumptions that affect the reported amounts of assets and liabilities and disclosure of contingent assets and liabilities as of the date of the financial statements and the reported amounts of income and expenses during the reporting period. Actual results could differ from those estimates. In the preparation of these financial statements, management has evaluated events and transactions subsequent to December 31, 2013 through the date the financial statements were issued.
The following is a summary of significant accounting policies consistently followed by the Portfolio in the preparation of its financial statements.
Investment Valuation and Fair Value Measurements - Debt securities (other than short term obligations with a remaining maturity of sixty days or less), including corporate, convertible and municipal bonds and notes; obligations of the U.S. treasury and U.S. government agencies; sovereign issues; floating rate loans; and non-U.S. bonds, are generally valued on the basis of evaluated or composite bid quotations obtained from independent pricing services and/or brokers and dealers selected by MetLife Advisers, LLC (“MetLife Advisers” or the “Adviser”), an affiliate of MetLife, Inc., pursuant to authorization of the Board of Trustees of the Trust (the “Board” or “Trustees”). Such quotations utilize matrix pricing, which considers observable inputs including, among other things, issuer details, maturity dates, interest rates, yield curves, rates of prepayment, credit risks/spreads, default rates, reported trades, broker dealer quotes and quoted prices for similar securities. Securities that use similar valuation techniques and inputs as described above are generally categorized as Level 2 within the fair value hierarchy.
Mortgage and asset-backed securities are usually issued as separate tranches, or classes, of securities within each deal. These securities are also generally valued on the basis of evaluated or composite bid quotations obtained from independent pricing services and/or brokers and dealers selected by the Adviser pursuant to authorization of the Board. The pricing models for these securities usually consider tranche-level attributes, estimated cash flows and market-based yield spreads for each tranche and current market data, and incorporate deal collateral performance, as available. Mortgage and asset-backed securities that use similar valuation techniques and inputs as described above are generally categorized as Level 2 within the fair value hierarchy.
Short term obligations with a remaining maturity of sixty days or less are generally valued at amortized cost, which approximates fair market value, and are generally categorized as Level 2 within the fair value hierarchy.
Domestic and foreign equity securities, such as common stock, exchange-traded funds, rights, warrants, and preferred stock, that are traded on a securities exchange, are generally valued at their last sale price on the exchange or market in which they are principally traded on the valuation date, or, if no sales occurred on that day, at the last reported bid price. Equity securities traded over-the-counter are generally valued at the last reported sale price. Valuation adjustments may be applied to certain foreign equity securities that are traded solely on foreign exchanges that close before the close of the U.S. market to account for the market movement between the close of the foreign exchanges and the close of the U.S. market. The Portfolio may use a systematic fair valuation model provided by an independent third party to value securities principally traded in these foreign markets in order to adjust for possible stale pricing that may occur between the close of the foreign exchanges and the time of the Portfolio valuation. Foreign equity securities using these valuation adjustments are generally categorized as Level 2 within the fair value hierarchy. Equity securities that are actively traded, and have no valuation adjustments applied, are categorized as Level 1 within the fair value hierarchy. Other equity securities traded on inactive markets, or valued in reference to similar instruments traded on active markets, are generally categorized as Level 2 within the fair value hierarchy.
MSF-12
Metropolitan Series Fund
WMC Core Equity Opportunities Portfolio (formerly, Davis Venture Value Portfolio)
Notes to Financial Statements—December 31, 2013—(Continued)
Investments in registered open-end management investment companies are valued at reported net asset value per share on the valuation date and are categorized as Level 1 within the fair value hierarchy.
Forward foreign currency exchange contracts are valued through an independent pricing service based on the mean between closing bid and ask prices of the forward currency rates in the London foreign exchange markets on a daily basis as provided by a reliable bank or dealer. These contracts are generally categorized as Level 2 within the fair value hierarchy.
Options, whether on securities, indices, futures contracts, or otherwise, traded on exchanges are valued at the last sale price available as of the close of business on the valuation date or, if there is no such price available, at the mean between the last reported bid and ask prices. These types of options are categorized as Level 1 within the fair value hierarchy. Futures contracts, which are traded on commodity exchanges, are valued at their closing prices as of the close of such exchanges and are categorized as Level 1 within the fair value hierarchy.
Options and futures contracts that are traded over-the-counter are generally valued on the basis of quotations provided by broker-dealers or prices provided by pricing service providers who use a series of techniques, including simulation pricing models, to determine the value of the contracts. The pricing models use inputs that are observed from actively quoted markets such as issuer details, indices, spreads, interest rates, yield curves, credit curves, measures of volatility and exchange rates. These contracts are generally categorized as Level 2 within the fair value hierarchy.
If no current market value quotation or other observable inputs are readily available or market value quotations are deemed to be unreliable for a security, the fair value of the security will be determined in accordance with procedures approved by and under the general supervision of the Board. In such a circumstance, the Board has delegated the determination of the fair value of a security to a Valuation Committee (“Committee”) of MetLife Advisers. The Committee provides general pricing oversight and fair value pricing determinations related to portfolio securities and meets on a regular basis to review reports relating to the valuation of the securities in the Portfolio. The Board has delegated to State Street Bank and Trust Company, the Trust’s custodian (“custodian”), the responsibility for calculating the net asset values (“NAVs”) of the Trust’s Portfolios. The Committee is responsible for overseeing the calculation of the NAVs of the Portfolios by the custodian. The Committee also periodically reviews pricing vendors, including the vendor providing fair value pricing for the Portfolio’s foreign securities, and is responsible for overseeing the correction of pricing errors and addressing other pricing issues that arise in the ordinary course of business, such as making real-time fair value determinations, as necessary.
No single standard for determining the fair value of a security can be set forth because fair value depends upon the facts and circumstances with respect to each security. Information relating to any relevant factors may be obtained by the Committee from any appropriate source, including the subadviser of the Portfolio, the custodian, a pricing service, market maker and/or broker for such security or the issuer. Appropriate methodologies for determining fair value under particular circumstances may include: matrix pricing, comparisons of securities with comparable characteristics, value based on multiples of earnings, discount from market price of similar marketable securities or a combination of these and other methods. The Committee maintains a detailed report tracking each fair-valued security that compares the fair value price to the next available trade, vendor or broker price, and provides information on how close the fair value price was to the next quoted price. The Committee reviews a summary of such report monthly. On a quarterly basis, the Board is provided with the following for consideration and ratification or adjustment: (1) a memorandum summarizing the actions taken by the Committee in the prior quarter; and (2) a list of the Portfolio’s securities as of the most recent quarter-end for which market quotations were not readily available.
Investment Transactions and Related Investment Income - Portfolio security transactions are recorded on the trade date. Dividend income is recorded on the ex-dividend date or, for certain foreign securities, when notified. Interest income, which includes amortization of premium and accretion of discount on debt securities, is recorded on the accrual basis. Realized gains and losses on investments are determined on the identified cost basis, which is the same basis used for federal income tax purposes. Foreign income and foreign capital gains on some foreign securities may be subject to foreign taxes, which are accrued as applicable. These foreign taxes have been provided for in accordance with the Portfolio’s understanding of the applicable countries’ tax rules and rates.
Foreign Currency Translation - The books and records of the Portfolio are maintained in U.S. dollars. The values of securities, currencies, and other assets and liabilities denominated in currencies other than the U.S. dollar are translated into U.S. dollars based upon foreign exchange rates prevailing at the end of the period. Purchases and sales of investment securities, income, and expenses are translated on the respective dates of such transactions. Because the values of investment securities are translated at the foreign exchange rates prevailing at the end of the period, that portion of the results of operations arising from changes in exchange rates and that portion of the results of operations reflecting fluctuations arising from changes in market prices of the investment securities are not separated. Such fluctuations are included in the net realized and unrealized gain or loss on investments.
Net realized foreign exchange gains or losses arise from activity in forward foreign currency exchange contracts, sales of foreign currency, currency gains or losses realized between the trade and settlement dates on securities transactions, and the difference between the amounts of dividends, interest, and foreign withholding taxes recorded by the Portfolio and the U.S. dollar equivalent of
MSF-13
Metropolitan Series Fund
WMC Core Equity Opportunities Portfolio (formerly, Davis Venture Value Portfolio)
Notes to Financial Statements—December 31, 2013—(Continued)
the amounts actually received or paid by the Portfolio. Net unrealized foreign exchange gains and losses arise from changes in the value of assets and liabilities, other than investment securities, resulting from changes in foreign exchange rates.
Income Taxes - It is the Portfolio’s policy to comply with the requirements of the Internal Revenue Code of 1986, as amended, and regulations thereunder, applicable to regulated investment companies and to distribute, with respect to each taxable year, all of its taxable income to shareholders. Therefore, no federal income tax provision is required. The Portfolio files U.S. federal tax returns. No income tax returns are currently under examination. The Portfolio’s federal tax returns for the prior three fiscal years remain subject to examination by the Internal Revenue Service. As of December 31, 2013, the Portfolio had no uncertain tax positions that would require financial statement recognition, or de-recognition or disclosure.
Dividends and Distributions to Shareholders - The Portfolio records dividends and distributions on the ex-dividend date. Net realized gains from security transactions (if any) are generally distributed annually to shareholders. The timing and characterization of certain income and capital gains distributions are determined in accordance with federal tax regulations that may differ from GAAP. Permanent book and tax basis differences relating to shareholder distributions will result in reclassification between under/over distributed net investment income, accumulated net realized gains/losses, and paid-in surplus. Book-tax differences are primarily due to foreign currency transactions, passive foreign investment companies (PFICs), defaulted bonds, and broker commission recapture reclasses. These adjustments have no impact on net assets or the results of operations.
Securities Lending - The Portfolio may lend its portfolio securities to certain qualified brokers who borrow securities in order to complete certain securities transactions. By lending its portfolio securities, the Portfolio attempts to increase its net investment income through the receipt of income on collateral held from securities on loan. Any gain or loss in the market price of the loaned securities that might occur and any interest earned or dividends declared during the term of the loan would accrue to the account of the Portfolio.
The Trust has entered into a securities lending arrangement with the custodian. Under this arrangement, the custodian is authorized to loan portfolio securities on the Portfolio’s behalf. In exchange, the Portfolio receives either cash or securities as collateral against the loaned securities. The Portfolio receives collateral at least equal to 102% of the market value of the loaned securities (105% for foreign equity securities), at each loan’s inception. Collateral representing at least 100% of the market value of the loaned securities must be maintained for the duration of the loan. A liability for cash collateral is reflected on the Statement of Assets and Liabilities, and is categorized as Level 2 within the fair value hierarchy. Cash collateral is generally invested in the State Street Navigator Securities Lending MET Portfolio (the “Navigator Portfolio”), a series of the State Street Navigator Securities Lending Trust that is managed by an affiliate of the custodian. The Navigator Portfolio is a registered money market fund that invests in a variety of high-quality, U.S. dollar-denominated instruments. If the market value of the collateral at the close of trading on a business day is less than 100% of the market value of the loaned securities at the close of trading on that day, the borrower shall be required to deliver, by the close of business on the following business day, an additional amount of collateral, so that the total amount of posted collateral is equal to at least 100% of the market value of all the loaned securities as of such preceding day. A portion of net income (income after the deduction of expenses and fees of the Navigator Portfolio) on the collateral is rebated to the borrower of the securities and the remainder is split between the custodian and the Portfolio. On loans collateralized by U.S. Treasuries, a fee is received from the borrower and is allocated between the Portfolio and the custodian. The risks associated with lending portfolio securities include, but are not limited to, possible delays in receiving additional collateral or in the recovery of the loaned securities, possible loss of rights in the collateral should the borrower fail financially, as well as risk of loss in the value of the collateral or the value of the investments made with the collateral. The lending agent has agreed to indemnify the Portfolio in the case of default of any securities borrower. Income received by the Portfolio in securities lending transactions during the year ended December 31, 2013 is reflected as Securities lending income on the Statement of Operations. Any outstanding loans by the Portfolio at December 31, 2013 are disclosed in the footnotes to the Schedule of Investments.
Directed Brokerage Agreement - The Trust has entered into a directed brokerage arrangement with State Street Global Markets (“SSGM”). Under this arrangement, the Portfolio directs certain trades to SSGM in return for a recapture credit. SSGM issues a cash rebate to the Portfolio. Amounts paid to the Portfolio are shown separately as broker commission recapture on the Statement of Operations of the Portfolio. Additionally, these amounts have been excluded from the calculation of the net ratio of expenses to average net assets presented in the Financial Highlights for each share class.
3. Certain Risks
Market Risk: In the normal course of business, the Portfolio invests in securities and enters into transactions where risks exist due to fluctuations in the market (market risk) or failure of the other party to a transaction to perform (credit and counterparty risk). The value of securities held by the Portfolio may decline in response to certain events, including those directly involving the companies whose securities are owned by the Portfolio; conditions affecting the general economy; overall market changes; local, regional or global political, social or economic instability; currency, interest rate, and price fluctuations.
Credit and Counterparty Risk: The Portfolio may be exposed to counterparty risk, or the risk that an entity with which the Portfolio has unsettled or open transactions may default. The potential loss could exceed the value of the financial assets and liabilities
MSF-14
Metropolitan Series Fund
WMC Core Equity Opportunities Portfolio (formerly, Davis Venture Value Portfolio)
Notes to Financial Statements—December 31, 2013—(Continued)
recorded in the financial statements. Financial assets that potentially expose the Portfolio to credit and counterparty risk consist principally of cash due from counterparties and investments. The Portfolio manages counterparty risk by entering into agreements only with counterparties that it believes have the financial resources to honor their obligations and by monitoring the financial stability of those counterparties. The Portfolio’s investment adviser attempts to mitigate counterparty risk by (i) periodically assessing the creditworthiness of its trading partners, (ii) monitoring and/or limiting the amount of its net exposure to each individual counterparty based on its assessment, and (iii) requiring collateral from the counterparty for certain transactions. In order to preserve certain safeguards for non-standard settlement trades, the Portfolio restricts its exposure to credit and counterparty losses by entering into master netting agreements with counterparties (approved brokers) with whom it undertakes a significant volume of transactions. Master Agreements govern the terms of certain transactions, and reduce the counterparty risk associated with relevant transactions by specifying credit protection mechanisms and providing standardization that improves legal certainty. Master Agreements can also help limit counterparty risk by specifying collateral posting arrangements at pre-arranged exposure levels.
Repurchase agreements are primarily executed under Global Master Repurchase Agreements (“GMRAs”) or Master Repurchase Agreements (“MRAs”), which provide the rights to set-off. Each repurchase agreement is initially collateralized at the transaction level. In the event of default, the total market value exposure will be offset against collateral exchanged to date, which would result in a net receivable/(payable) that would be due from/to the counterparty. Securities pledged as collateral are noted in the Schedule of Investments.
Additional risks associated with each type of investment are described above within the respective security type notes. The Portfolio’s prospectus includes a discussion of the principal risks of investing in the Portfolio.
4. Investment Transactions
Aggregate cost of purchases and proceeds of sales of investment securities, excluding short-term securities, for the year ended December 31, 2013 were as follows:
| | | | | | | | | | | | |
Purchases | | | Sales | |
U.S. Government | | Non U.S. Government | | | U.S. Government | | | Non U.S. Government | |
| $0 | | $ | 415,216,848 | | | $ | 0 | | | $ | 1,036,272,420 | |
During the year ended December 31, 2013, the Portfolio engaged in security sale transactions with other affiliated portfolios. These amounted to $32,910,257 in sales of investments, which are included above.
5. Investment Management Fees and Other Transactions with Affiliates
Investment Management Agreement - MetLife Advisers is the investment adviser to the Portfolio. The Trust has entered into an investment management agreement with MetLife Advisers with respect to the Portfolio. For providing investment management services to the Portfolio, MetLife Advisers receives monthly compensation at the following annual rates:
| | | | | | |
Management
Fees earned by
MetLife Advisers
for the year ended
December 31, 2013 | | % per annum | | | Average Daily Net Assets |
| $27,533,988 | | | 0.750 | % | | Of the first $1 billion |
| | | 0.700 | % | | On the next $2 billion |
| | | 0.650 | % | | On amounts in excess of $3 billion |
Prior to February 3, 2014 MetLife Advisers had entered into an investment subadvisory agreement with respect to the Portfolio under which Davis Selected Advisers, L.P. was compensated by MetLife Advisers to provide subadvisory services for the Portfolio.
Management Fee Waivers - Pursuant to an expense agreement, MetLife Advisers has agreed, for the period April 29, 2013 through April 27, 2014, to reduce its advisory fees set out above under “Investment Management Agreement” for each class of the Portfolio as follows:
| | |
% per annum | | Average Daily Net Assets |
| 0.050% | | On the first $50 million |
| 0.075% | | On the next $450 million |
| 0.100% | | On the next $500 million |
| 0.050% | | On the next $2 billion |
| 0.025% | | On amounts in excess of $4.5 billion |
MSF-15
Metropolitan Series Fund
WMC Core Equity Opportunities Portfolio (formerly, Davis Venture Value Portfolio)
Notes to Financial Statements—December 31, 2013—(Continued)
An identical expense agreement was in place for the period April 30, 2012 through April 28, 2013. Amounts waived for the year ended December 31, 2013 are shown as management fee waivers in the Statement of Operations.
Certain officers and trustees of the Trust may also be officers of MetLife Advisers; however, such officers and trustees receive no compensation from the Trust.
Transfer Agency Agreement - MetLife serves as the transfer agent for the Trust. MetLife receives no fees for its services to the Trust under the transfer agency agreement.
Distribution and Service Fees - The Trust has a distribution agreement with MetLife Investors Distribution Company (“MIDC” or the “Distributor”) in which MIDC serves as the distributor for the Portfolio’s Class A, B and E Shares. MIDC is a wholly-owned subsidiary of MetLife Investors Group, Inc., an affiliate of the Adviser. The Trust has also adopted a Distribution and Service Plan under Rule 12b-1 of the 1940 Act for the Portfolio’s Class B and E Shares. Under the Distribution and Service Plan, the Class B and E Shares of the Portfolio pay a fee to compensate the Insurance Companies (or their affiliates) and other broker-dealers and financial intermediaries involved in the offer and sale of Portfolio shares for promoting or selling and servicing the Class B and E Shares. The fees under the Distribution and Service Plan for each class of the Portfolio’s shares are calculated as a percentage of the Portfolio’s average daily net assets that are attributable to that Class. Currently, the fee is 0.25% per year for Class B Shares and 0.15% per year for Class E Shares. Amounts incurred by the Portfolio for the year ended December 31, 2013 are shown as Distribution and service fees in the Statement of Operations.
Deferred Trustee Compensation - Each Trustee who is not currently an employee of the Adviser or any of its affiliates receives compensation from the Trust for his or her service to the Trust. A deferred compensation plan (the “Plan”) is available to the Trustees on a voluntary basis. Deferred amounts remain in the Trust until distributed in accordance with the provisions of the Plan. The value of a participating Trustee’s deferral account is based on theoretical investments of deferred amounts, on the normal payment dates in certain portfolios of the Trust or Met Investors Series Trust, an affiliate of the Trust, as designated by the participating Trustee. Changes in the value of participants’ deferral accounts are reflected as Trustees’ fees and expenses in the Statement of Operations. The portion of the accrued obligations allocated to the Portfolio under the Plan is reflected as Deferred trustees’ fees in the Statement of Assets and Liabilities.
6. Contractual Obligations
Under the Trust’s organizational documents, its officers and Trustees may be indemnified against certain liabilities and expenses arising out of the performance of their duties to the Trust. Additionally, the Trust has a variety of indemnification obligations under contracts with its service providers. The Trust’s maximum exposure under these arrangements is unknown, as this would involve future claims that may be made against the Trust that have not yet occurred.
7. Income Tax Information
The tax character of distributions paid for the periods ended December 31, 2013 and 2012 was as follows:
| | | | | | | | | | | | | | | | | | | | |
Ordinary Income | | | Long-Term Capital Gain | | | Total | |
2013 | | 2012 | | | 2013 | | | 2012 | | | 2013 | | | 2012 | |
| $52,030,881 | | $ | 28,577,651 | | | $ | 65,759,579 | | | $ | — | | | $ | 117,790,460 | | | $ | 28,577,651 | |
As of December 31, 2013, the components of distributable earnings (accumulated losses) on a federal income tax basis were as follows:
| | | | | | | | | | | | | | | | |
Undistributed
Ordinary
Income | | Undistributed
Long-Term
Capital Gain | | | Net
Unrealized
Appreciation | | | Loss Carryforwards | | | Total | |
| $39,145,226 | | $ | 329,496,474 | | | $ | 1,476,563,653 | | | $ | — | | | $ | 1,845,205,353 | |
The Portfolio utilizes the provisions of the federal income tax laws that provide for the carryforward of capital losses for prior years, offsetting such losses against any future realized capital gains. Under the Regulated Investment Company Modernization Act of 2010 (the “Act”), net capital losses recognized after December 22, 2010 may be carried forward indefinitely and their character is retained as short-term and/or long-term losses. Previously, net capital losses were carried forward for up to eight years and treated as short-term losses. As a transition rule, the Act requires that post-enactment net capital losses be used before pre-enactment net capital losses.
As of December 31, 2013, the Portfolio had no post-enactment accumulated capital losses and no pre-enactment accumulated capital loss carryforwards.
MSF-16
Metropolitan Series Fund
WMC Core Equity Opportunities Portfolio (formerly, Davis Venture Value Portfolio)
Notes to Financial Statements—December 31, 2013—(Continued)
8. Subsequent Events
On November 20, 2013, the Board approved a new Subadvisory Agreement (the “Agreement”) with respect to the Portfolio between MetLife Advisers and Wellington Management Company, LLP (“Wellington”). The Agreement is not subject to shareholder approval and became effective February 3, 2014. The Advisory Agreement between the Fund, with respect to the Portfolio, and MetLife Advisers will remain in effect and fees payable thereunder to MetLife Advisers will not change. Under the Agreement, Wellington became subadviser to the Portfolio, succeeding Davis Selected Advisers, L.P., and became responsible for the day-to-day management of the Portfolio’s investment operations under the oversight of MetLife Advisers and the Board. The name of the Davis Venture Value Portfolio changed to the WMC Core Equity Opportunities Portfolio at the time the Agreement took effect.
MSF-17
Metropolitan Series Fund
WMC Core Equity Opportunities Portfolio (formerly, Davis Venture Value Portfolio)
Report of Independent Registered Public Accounting Firm
To the Shareholders of WMC Core Equity Opportunities Portfolio (formerly, Davis Venture Value Portfolio) and the Board of Trustees of Metropolitan Series Fund:
We have audited the accompanying statement of assets and liabilities, including the schedule of investments, of WMC Core Equity Opportunities Portfolio (formerly, Davis Venture Value Portfolio), one of the portfolios constituting Metropolitan Series Fund, (the “Trust”) as of December 31, 2013, and the related statement of operations for the year then ended, the statements of changes in net assets for each of the two years in the period then ended, and the financial highlights for each of the five years in the period then ended. These financial statements and financial highlights are the responsibility of the Trust’s management. Our responsibility is to express an opinion on these financial statements and financial highlights based on our audits.
We conducted our audits in accordance with the standards of the Public Company Accounting Oversight Board (United States). Those standards require that we plan and perform the audit to obtain reasonable assurance about whether the financial statements and financial highlights are free of material misstatement. The Trust is not required to have, nor were we engaged to perform, an audit of its internal control over financial reporting. Our audits included consideration of internal control over financial reporting as a basis for designing audit procedures that are appropriate in the circumstances, but not for the purpose of expressing an opinion on the effectiveness of the Trust’s internal control over financial reporting. Accordingly, we express no such opinion. An audit also includes examining, on a test basis, evidence supporting the amounts and disclosures in the financial statements, assessing the accounting principles used and significant estimates made by management, as well as evaluating the overall financial statement presentation. Our procedures included confirmation of securities owned as of December 31, 2013, by correspondence with the custodian and brokers; where replies were not received from brokers, we performed other auditing procedures. We believe that our audits provide a reasonable basis for our opinion.
In our opinion, the financial statements and financial highlights referred to above present fairly, in all material respects, the financial position of WMC Core Equity Opportunities Portfolio (formerly, Davis Venture Value Portfolio) of Metropolitan Series Fund, as of December 31, 2013, the results of its operations for the year then ended, the changes in its net assets for each of the two years in the period then ended, and the financial highlights for each of the five years in the period then ended, in conformity with accounting principles generally accepted in the United States of America.
Deloitte & Touche LLP
Boston, Massachusetts
February 26, 2014
MSF-18
Metropolitan Series Fund
Trustees and Officers of Metropolitan Series Fund
The Trustees and executive officers of the Trust, their ages and their principal occupations during the past five years are set forth below. Unless otherwise indicated, the business address of each is One Financial Center, Boston, MA 02111. Each Trustee who is deemed an “interested person,” as such term is defined in the 1940 Act, is indicated by an asterisk. Those Trustees who are not “interested persons” as defined in the 1940 Act are referred to as “Independent Trustees.” Additional information about the Trustees is available in the Statement of Additional Information, which is available without charge, upon request, by calling (800) 848-3854.
Trustees of the Trust
| | | | | | | | | | |
Name and Age | | Position(s)
Held with
Registrant | | Term of Office
and Length of
Time Served | | Principal Occupation(s) During the Past 5
Years(1) | | Number of
Portfolios
in Fund
Complex(2)
overseen | | Other Directorships Held
by Trustee During the
Past 5 Years(1) |
| Interested Trustee | | | | | | | | | | |
| Elizabeth M. Forget* (47) | | Trustee, Chairman of the Board, President and Chief Executive Officer | | Indefinite;
From
May
2006
(President
and Chief
Executive
Officer)/
August
2006
(Trustee
and
Chairman
of the
Board) to
present | | Senior Vice President, MetLife Inc.; President, MetLife Advisers, LLC and a predecessor company. | | 79 | | Trustee, Met Investors Series Trust (the “MIST Trust”);** various MetLife-affiliated boards. |
| | | | | |
| Independent Trustees | | | | | | | | | | |
| Stephen M. Alderman (54) | | Trustee | | Indefinite;
From
April
2012 to
present | | Shareholder in the law firm of Garfield & Merel, Ltd. | | 79 | | Trustee, MIST Trust;** Director, International Truck Leasing Corp. |
| | | | | |
| Robert J. Boulware (57) | | Trustee | | Indefinite;
From
April
2012 to
present | | Managing Director, Pilgrim Funds, LLC (private equity fund). | | 79 | | Trustee, MIST Trust;** Trustee, Vertical Capital Income Fund (closed-end fund); Director, Gainsco, Inc. (auto insurance). |
| | | | | |
| Susan C. Gause (61) | | Trustee | | Indefinite;
From
April
2012 to
present | | Private Investor. | | 79 | | Trustee, MIST Trust;** Trustee, HSBC Funds. |
| | | | | |
| Nancy Hawthorne (62) | | Trustee | | Indefinite;
From
May
2003 to
present | | Chief Executive Officer, Clerestory LLC (corporate advisor). | | 79 | | MIST Trust;** Director, THL Credit, Inc.**; Director, Avid Technology, Inc.** |
| | | | | |
| Barbara A. Nugent (57) | | Trustee | | Indefinite;
From
January
2014 to
present | | President, True North Board Governance, LLC (consulting); until 2014, partner in the law firm of Stradley Ronon Stevens & Young, LLP. | | 79 | | Trustee, MIST Trust**; Director, Episcopal Healthcare Foundation; until 2014, member, Mutual Fund Directors Forum Advisory Board. |
MSF-19
Metropolitan Series Fund
Trustees and Officers of Metropolitan Series Fund—(Continued)
| | | | | | | | | | |
Name and Age | | Position(s)
Held with
Registrant | | Term of Office
and Length of
Time Served | | Principal Occupation(s) During the Past 5
Years(1) | | Number of
Portfolios
in Fund
Complex(2)
overseen | | Other Directorships Held
by Trustee During the
Past 5 Years(1) |
| Keith M. Schappert (62) | | Trustee | | Indefinite;
From
August
2009 to
present | | Principal, Schappert Consulting LLC (asset management consulting). | | 79 | | Trustee, MIST Trust;** Director, The Commonfund for Nonprofit Organizations; until 2011, Director, Trilogy Global Advisors; Director, Mirae Asset Discovery Funds,** Director, Calamos Investments. |
| | | | | |
| Linda B. Strumpf (66) | | Trustee | | Indefinite;
From
May
2000 to
present | | Chair of the Investment Committee, Leona M. and Harry B. Helmsley Charitable Trust; until 2011, Chief Investment Officer, Leona M. and Harry B. Helmsley Charitable Trust. | | 79 | | Since 2012, Trustee, MIST Trust,** Trustee and Member of Investment Committee, The Pennsylvania State University. |
| | | | | |
| Dawn M. Vroegop (47) | | Trustee | | Indefinite;
From
May
2009 to
present | | Private Investor. | | 79 | | Trustee, MIST Trust,** Trustee, Driehaus Mutual Funds; Director and Investment Committee Chair, City College of San Francisco Foundation. |
Executive Officers of the Trust
| | | | | | |
Name and Age | | Position(s) Held with
Registrant | | Term of Office
and Length of
Time Served | | Principal Occupation(s) During Past 5 Years(1) |
| Elizabeth M. Forget (47) | | President, Chief Executive Officer, Trustee and Chairman of the Board | | From May
2006 (President
and Chief
Executive
Officer)/
August 2006
(Trustee and
Chairman of
the Board) to
present | | See principal occupation information in the table above. |
| | | |
| Jeffrey L. Bernier (42) | | Vice President | | From February
2008 to present | | Vice President, MetLife, Inc.; Senior Vice President, MetLife Advisers, LLC and a predecessor company. |
| | | |
| Peter H. Duffy (58) | | Chief Financial Officer and Treasurer | | From November
2000 to present | | Senior Vice President, MetLife Advisers, LLC; Vice President, MetLife, Inc. |
| | | |
| Andrew L. Gangolf (59) | | Secretary | | From May
2011to present | | Senior Vice President, MetLife Advisers, LLC; Senior Vice President & Assistant General Counsel, AllianceBerstein Investments, Inc. |
| | | |
| Jeffrey P. Halperin (46) | | Chief Compliance Officer | | From November
2005 to present | | Vice President, MetLife, Inc.; Chief Compliance Officer, MIST; Chief Compliance Officer, MSF Trust; Chief Compliance Officer, MetLife Advisers, LLC and a predecessor company; Chief Compliance Officer, MetLife Investment Management, LLC (formerly MetLife Investment Advisors Company, LLC). |
| | | |
| Alan C. Leland, Jr. (61) | | Vice President | | From February
2005 to present | | Treasurer and Chief Financial Officer, MetLife Advisers, LLC; Vice President, MetLife Group Inc.; Vice President, MetLife, Inc. |
| * | Ms. Forget is an “interested person” of the Trust because of her positions with MetLife Advisers, LLC and her ownership of securities issued by MetLife, Inc., the ultimate parent company of MetLife Advisers, LLC. |
| ** | Indicates a directorship with a registered investment company or a company subject to the reporting requirements of the Securities Exchange Act of 1934, as amended. |
| (1) | Previous positions during the past five years with the Trust, MetLife, Inc. or the Adviser are omitted if not materially different. |
| (2) | The Fund Complex includes 49 Portfolios of the MIST Trust and 30 Portfolios of the Trust. |
MSF-20
Metropolitan Series Fund
WMC Core Equity Opportunities Portfolio (formerly, Davis Venture Value Portfolio)
Board of Trustees’ Consideration of Advisory and Sub-Advisory Agreements
At an in-person meeting of the Boards of Trustees (the “Board”) of Met Investors Series Trust and Metropolitan Series Fund (“MIST” and “MSF,” respectively, and collectively, the “Trusts”) held on November 19-20, 2013, the Board, including a majority of the Trustees who are not considered to be “interested persons” of the Trusts (the “Independent Trustees”) under the Investment Company Act of 1940, as amended (the “1940 Act”), approved for an annual period the continuation of each Trust’s advisory agreement (the “Advisory Agreement”) with MetLife Advisers, LLC (the “Adviser”) and the applicable sub-advisory agreements (each a “Sub-Advisory Agreement,” and collectively with the Advisory Agreement, the “Agreements”) between the Adviser and the investment sub-advisers (each a “Sub-Adviser,” and collectively, the “Sub-Advisers”) for each of the series of the Trusts, including the WMC Core Equity Opportunities Portfolio (each a “Portfolio,” and collectively, the “Portfolios”).1 With respect to the WMC Core Equity Opportunities Portfolio, the Board approved its Advisory Agreement and two Sub-Advisory Agreements: One Sub-Advisory Agreement for the then-existing Sub-Adviser, Davis Selected Advisers, L.P. (“Davis”), and one Sub-Advisory Agreement for the new Sub-Adviser, Wellington Management Company, LLP (“Wellington”), which was proposed to succeed BlackRock on or about February 3, 2014. The Davis Sub-Advisory Agreement was approved for the period of time leading up until Wellington’s succession of Davis.
In considering the Agreements, the Board reviewed a variety of materials provided by the Adviser and the Sub-Advisers relating to the Portfolios, including comparative performance, fee and expense information for an appropriate peer group of similar mutual funds, performance information for relevant benchmark indices and other information regarding the nature, extent and quality of services provided by the Adviser and the Sub-Advisers under their respective Agreements. The Board also took into account its experience with the Adviser and the Sub-Advisers and information provided to the Board in its meetings throughout the year with respect to the services provided by the Adviser and the Sub-Advisers, including quarterly performance reports prepared by management containing reviews of investment results, and periodic presentations from certain of the Sub-Advisers with respect to the Portfolios they manage. The Independent Trustees also assessed reports provided by the Board’s independent consultant, who reviewed and provided analyses regarding investment performance, fees and expenses, and other information provided by, or at the direction of, the Adviser and the Sub-Advisers, as more fully discussed below.
The Independent Trustees were separately advised by independent legal counsel throughout the process, and met with independent legal counsel in periodic executive sessions. Prior to voting to continue the Agreements at the November meeting, the Independent Trustees also received a memorandum from their independent counsel discussing the legal standards for their consideration of the proposed continuation of the Agreements. The Board also met in person with personnel of the Adviser on September 17, 2013 for the specific purpose of giving preliminary consideration to the proposed continuation of the Agreements and to request additional information they considered reasonably necessary to their deliberations. The Independent Trustees also discussed the proposed continuation of the Agreements in private sessions with their independent legal counsel at which no representatives of management were present.
In considering whether to approve the renewal of the Advisory Agreement with the Adviser and any applicable Sub-Advisory Agreements with respect to a Portfolio, the Board reviewed and analyzed the factors it deemed relevant, including: (1) the nature, extent and quality of the services to be provided to the Portfolios by the Adviser and the Sub-Advisers; (2) the performance of the Portfolios as compared to a peer group and an appropriate index; (3) the Adviser’s and each of the Sub-Adviser’s personnel and operations; (4) the financial condition of the Adviser and of the Sub-Advisers; (5) the level and method of computing each Portfolio’s advisory and sub-advisory fees; (6) the profitability of the Adviser under the Advisory Agreement and of certain of the Sub-Advisers under the Sub-Advisory Agreements; (7) any “fall-out” benefits to the Adviser, the Sub-Advisers and their affiliates (i.e., ancillary benefits realized by the Adviser, the Sub-Advisers or their affiliates from the Adviser’s or Sub-Advisers’ relationship with the Trusts); (8) the anticipated effect of growth in size on Portfolio expenses; (9) fees paid to certain of the Sub-Advisers by comparable institutional and retail accounts; and (10) possible conflicts of interest.
Nature, extent and quality of services. The Board evaluated the nature, extent and quality of the services that the Adviser, and the Sub-Advisers as relevant, have provided to the Portfolios. The Board considered the Adviser’s services as investment manager to the Portfolios, including services relating to the selection and oversight of the Sub-Advisers for the applicable Portfolios. The Board considered, among other things, the Adviser’s oversight of the provision of services to the Portfolios by the Sub-Advisers, including with respect to investment activities and trading practices, and the Sub-Adviser’s compliance with fund policies, objectives and Board directives, compliance policies and procedures and applicable law. The Adviser’s services in coordinating and overseeing the activities of the Trusts’ other service providers were also considered. The Board also evaluated the expertise and performance of the personnel of the Adviser who performed services for the Portfolios throughout the year.
1 The Pyramis Managed Risk Portfolio recently commenced operations and, therefore, the Agreement with respect to this Portfolio was not up for renewal.
MSF-21
Metropolitan Series Fund
WMC Core Equity Opportunities Portfolio (formerly, Davis Venture Value Portfolio)
Board of Trustees’ Consideration of Advisory and Sub-Advisory Agreements—(Continued)
The Board considered information received from the Trust’s Chief Compliance Officer (“CCO”) regarding the Portfolios’ compliance policies and procedures established pursuant to Rule 38a-l under the 1940 Act. The Board also evaluated the CCO’s ongoing reports concerning the CCO’s oversight of the risk assessment processes of the Sub-Advisers.
With respect to the services provided by each of the Sub-Advisers, the Board considered, among other things, information provided to the Board by each Sub-Adviser. The Board considered the Sub-Adviser’s current level of staffing and its overall resources, as well as its compensation program. The Board reviewed each Sub-Adviser’s history and investment experience, as well as information regarding the qualifications, background and responsibilities of the Sub-Adviser’s investment and compliance personnel who provide services to the Portfolios. The Board also considered, among other things, the Sub-Adviser’s compliance program and any disciplinary history. The Board also took into account the Sub-Adviser’s risk assessment and monitoring process. The Board noted each Sub-Adviser’s regulatory history, including whether it was currently involved in any regulatory actions or investigations as well as material litigation, and any settlements and amelioratory actions undertaken, as appropriate. The Board also noted that the CCO and his staff conduct regular, periodic compliance reviews with each of the Sub-Advisers and present reports to the Independent Trustees regarding the same, which includes evaluating the regulatory compliance systems of the Sub-Advisers and procedures reasonably designed by them to help assure compliance with the federal securities laws, including issues related to late trading and market timing, best execution, fair value pricing, and proxy voting procedures, among others. The Board also took into account the financial condition of each Sub-Adviser. In its review, the Board also received and took into account information regarding any services and/or payments provided to the Adviser by the Sub-Advisers in connection with marketing activities.
The Board considered each Sub-Adviser’s investment process and philosophy. The Board took into account that each Sub-Adviser’s responsibilities include the development and maintenance of an investment program for the applicable Portfolio which is consistent with the Portfolio’s investment objectives, the selection of investment securities and the placement of orders for the purchase and sale of such securities, as well as the implementation of compliance controls related to performance of these services. The Board also reviewed each Sub-Adviser’s brokerage policies and practices.
Performance. The Board considered the performance of the Portfolios as described in the quarterly reports prepared by management, and as also analyzed in reports prepared by the Independent Trustees’ independent consultant. The Board noted that the Adviser reviews with the Board on a quarterly basis detailed information about the Portfolios’ performance results, portfolio composition and investment strategies. The Board also reviewed and considered a separate report prepared by Lipper Inc. (“Lipper”), an independent third party, which provided a statistical analysis comparing the Portfolios’ investment performance, expenses, and fees to comparable funds underlying variable insurance products (the “Performance Universe”). In addition, the Independent Trustees met separately with a representative of Bobroff Consulting, Inc., an independent consultant (“Bobroff), at a special board meeting in September 2013, to review the separate reports prepared by such consultant (“Bobroff Report”), which analyzed the report prepared by Lipper. Both the Lipper Report and the Bobroff Report relate to the Portfolio’s performance and expenses when Davis was the Sub-Adviser. The Board also considered each Portfolio’s more recent performance subsequent to the performance period covered by the Lipper reports, and management’s discussion of the same, including the effect of current market conditions on each Portfolio’s more recent performance.
The Board reviewed the Portfolios’ performance records and the Adviser’s and Sub-Advisers’ management styles and, to the extent applicable, long-term performance records with the Portfolios and comparable funds. The Board focused particular attention on Portfolios with less favorable performance records. The Board was mindful of the Adviser’s focus on each Sub-Adviser’s performance and noted that the Adviser has been active in monitoring and responding to any performance issues with respect to the Portfolios. The Board also took into account its discussions with management regarding factors that contributed to the performance of the Portfolios.
Among other data relating specifically to the WMC Core Equity Opportunities Portfolio’s performance, the Board considered that the Portfolio underperformed the median of its Performance Universe and its Lipper Index for the one-, three- and five-year periods ended June 30, 2013. The Board further considered that the Portfolio outperformed its benchmark, the S&P 500 Index, for the one year period ended October 31, 2013 but underperformed for the three- and five-year periods ended October 31, 2013. The Board also took into account management’s discussion of the Portfolio’s performance and the pending Sub-Adviser change effective on or about February 3, 2014.
With respect to Wellington, the Board considered the performance of an investment strategy Wellington proposed to use in managing the Portfolio (the “Proposed Strategy”). Among other data relating specifically to the Proprosed Strategy, the Board noted that the Proposed Strategy had outperformed the Portfolio for the trailing three- and five-year periods ended September 30, 2013 and underperformed the Portfolio for the trailing one-year period ended September 30, 2013. The Board noted that the Proposed Strategy had underperformed its benchmark, the Russell 1000 Index, for the one-, three- and five-year periods ended September 30, 2013. The Board also noted that the Proposed Strategy performed above the median of its peer group for the same periods. In addition, the Board
MSF-22
Metropolitan Series Fund
WMC Core Equity Opportunities Portfolio (formerly, Davis Venture Value Portfolio)
Board of Trustees’ Consideration of Advisory and Sub-Advisory Agreements—(Continued)
took into consideration the differences in principal investment strategies between the Portfolio and the Proposed Strategy. The Board further noted the proposed Sub-Adviser change would be effective on or about February 3, 2014.
Fees and Expenses. The Board gave consideration to the advisory fees payable under the Advisory Agreement and the sub-advisory fees payable under each of the Sub-Advisory Agreements. In this regard, the Board reviewed the advisory fees payable on a Portfolio-by-Portfolio basis based on information provided by the Adviser. The Independent Trustees, with the assistance of Bobroff, also examined the fees paid by a Portfolio in light of fees paid to other investment managers by comparable funds, as well as considered the fees charged by the Adviser to manage other comparable funds, as applicable. The Lipper report included comparisons of the Adviser’s fee schedule with that of its peers based on an asset-based analysis of relative fee structures according to the size of the Portfolio. In addition, the Board considered the Portfolios’ advisory and sub-advisory fees and total expenses as compared to similarly situated investment companies underlying variable insurance products deemed to be comparable to the Portfolios as determined by Lipper. The Board considered a Portfolio’s ranking within a smaller group of peer funds chosen by Lipper (the “Expense Group”), as well as the Portfolio’s ranking within broader groups of funds (the “Expense Universe” and the “Sub-advised Expense Universe”). The Board also considered a Portfolio’s contractual sub-advisory fees, as applicable, as compared to the Sub-advised Expense Universe as well as a smaller group of funds (the “Sub-advised Expense Group”). In comparing a Portfolio’s actual and contractual management fee to that of comparable funds, the Board noted that such fee includes both advisory and administrative fees.
The Board noted that the sub-advisory fees for the Portfolios are paid by the Adviser, not the Portfolios, out of the advisory fee. It was further noted that the Adviser negotiates such fees at arm’s length. The Board also considered that the Adviser had entered into expense limitation agreements with certain of the Portfolios, pursuant to which the Adviser has agreed to waive a portion of its advisory fee and/or reimburse certain expenses as a means of limiting a Portfolio’s total annual operating expenses. The Board further considered the amount of sub-advisory fees paid out by the Adviser and the amount of the management fees that it retained in light of the services performed by Sub-Advisers and Adviser, respectively.
The Board considered that the WMC Core Equity Opportunities Portfolio’s actual management fees and total expenses (exclusive of 12b-1 fees) were below the Expense Group median, the Expense Universe median and the Sub-advised Expense Universe median. The Board further noted that the Portfolio’s contractual management fees were above the asset-weighted average of the Expense Group at the Portfolio’s current size. The Board also noted that the Portfolio’s contractual sub-advisory fees were above the average of the Sub-advised Expense Group and the Sub-advised Expense Universe at the Portfolio’s current size. The Board further noted that the Adviser had waived fees and/or reimbursed expenses during the past year.
With respect to the hiring of Wellington, the Board noted that the rate of compensation to be paid to Wellington is lower at current asset levels than the rate of compensation the Adviser paid to Davis for managing the Portfolio under the Davis Sub-Advisory Agreement. The Board further considered, with the assistance of a Lipper-based report prepared by Bobroff, the Portfolio’s peer group ranking in light of its revised fee arrangement. In addition, the Board noted that the Adviser had recently negotiated a reduction to the Portfolio’s sub-advisory fee schedule with Wellington and that the Adviser agreed to waive a corresponding portion of its advisory fee in order for contractholders to benefit from the lower sub-advisory fee effective February 3, 2014.
Profitability. The Board examined the profitability of the Adviser on a Portfolio-by-Portfolio basis. The Board also considered that the Distributor, MetLife Investors Distribution Company, receives Rule 12b-1 payments to support the distribution of the products. The Board considered the profitability to the Sub-Advisers and their affiliates as a result of their relationships with the Portfolios, and the Board considered the ability of the Adviser to negotiate the Sub-Advisory Agreements and the fees thereunder at arm’s length. The Board also reviewed Portfolio specific data with regard to the profitability of the Portfolios to each Sub-Adviser, as available.
Economies of scale. The Board also considered the effect of the Portfolios’ growth in size on their fees. The Board noted that the fee schedules for most of the Portfolios contain breakpoints that reduce the fee rate above specified asset levels. The Board noted those Portfolios that did not contain breakpoints in the advisory fee and took into account management’s discussion of the same. The Board noted that those Portfolios with advisory fee schedules containing breakpoints generally reflect the inclusion of breakpoints in the sub-advisory fee schedule for such Portfolios. The Board considered the effective fees under the Advisory Agreement for a Portfolio as a percentage of assets at different asset levels and possible economies of scale that may be realized if the assets of the Portfolio grow. Among other data, the Board examined the effect of a Portfolio’s growth in size on various fee schedules and reviewed the Lipper and Bobroff Reports, which compared fees among peers. The Board also generally noted that if a Portfolio’s assets increase over time, the Portfolio may realize other economies of scale if assets increase proportionally more than certain other fixed expenses. In addition, the Board noted that the Adviser had taken a number of steps to date intended to share the benefits of economies of scale with contractholders.
MSF-23
Metropolitan Series Fund
WMC Core Equity Opportunities Portfolio (formerly, Davis Venture Value Portfolio)
Board of Trustees’ Consideration of Advisory and Sub-Advisory Agreements—(Continued)
With respect to the WMC Core Equity Opportunities Portfolio, the Board noted that the Portfolio’s advisory fee and sub-advisory fee each contains breakpoints that reduce the advisory fee rate on assets above certain specified asset levels. The Board considered the fact that the Portfolio’s fee levels decline as portfolio assets increase.
Other factors. As part of its evaluation of the Adviser’s compensation, the Board considered other benefits that may be realized by the Adviser and its affiliates from their relationship with the Trusts. Among them, the Board recognized that an affiliate of the Adviser, MetLife Investors Distribution Company, serves as the Distributor for the Trusts, and, as such, receives payments pursuant to Rule 12b-1 from the Portfolios to compensate it for providing shareholder services and selling activities, which could lead to growth in the Trusts’ assets and corresponding benefits from such growth, including economies of scale. The Board also considered that affiliates of the Adviser may benefit from certain indirect tax benefits relating to dividend received deductions and foreign tax credits. In conjunction with these considerations, the Board noted the costs of providing investment management and other services to the Portfolios and the ongoing commitment of the Adviser to the Portfolios.
The Board considered other benefits that may be realized by each Sub-Adviser and its affiliates from their relationship with the Trusts, including the opportunity to provide advisory services to additional portfolios of the Trusts and reputational benefits. In conjunction with these considerations, the Board noted the costs of providing investment advisory services to the Portfolios and the ongoing commitment of the Sub-Advisers to the Portfolios.
The Board considered possible conflicts of interest in the form of material benefits or detriments to the Trusts resulting from the nature of the Trusts’ and the Adviser’s or the Sub-Advisers’ affiliations and the services that are provided to the Trusts, and the manner in which such conflicts were mitigated.
Conclusions. After full consideration of the factors discussed above, the Board, including a majority of the Independent Trustees, approved the Advisory Agreement and the Sub-Advisory Agreement, as applicable, with respect to each Portfolio, unless otherwise noted. In making its approvals, the Board concluded that the nature, extent and quality of services provided by the Adviser and each Sub-Adviser supported the renewal of the Agreements. The Board also concluded that the investment performance of each Fund was such that each Agreement should continue. In addition, the Board concluded that fees paid by a Portfolio to the Adviser and, if applicable, the Sub-Adviser appeared to be acceptable in light of nature, extent and quality of the services provided by the Adviser and Sub-Adviser. Further, the Board concluded that the Adviser’s profitability in providing services under the Advisory Agreements did not appear unreasonably high in light of the nature, extent and quality of the services provided by the Adviser. Finally, the Board concluded that the Advisory and Sub-Advisory fees in some measure share economies of scale with contractholders. In approving the renewal of each of the Agreements, the Board, including the Independent Trustees, did not identify any single factor as controlling, and generally attributed different weights to various factors for the various Portfolios. The Board evaluated all information available to them on a Portfolio-by-Portfolio basis, and their decisions were made separately with respect to each Portfolio.
MSF-24
As of the end of the period covered by this report, the registrant has adopted a code of ethics that applies to the registrant’s principal executive officer, principal financial officer, principal accounting officer, or persons performing similar functions (the “Code of Ethics”). During the period covered by this report, no material amendments were made to the provisions of the Code of Ethics, nor did the registrant grant any waivers, including any implicit waivers, from any provision of the Code of Ethics.
| Item 3. | Audit Committee Financial Expert. |
The registrant’s Board of Trustees has determined that the registrant has at least one “audit committee financial expert” (as defined in Item 3 of Form N-CSR) serving on its audit committee. Susan C. Gause, Nancy Hawthorne, Keith M. Schappert, Linda B. Strumpf, and Dawn M. Vroegop have each been determined to be an “audit committee financial expert” and each is “independent” (as each term is defined in Item 3 of Form N-CSR).
| Item 4. | Principal Accountant Fees and Services. |
Information provided in response to Item 4 includes amounts billed during the applicable time period for services rendered by Deloitte & Touche LLP (“Deloitte”), the registrant’s principal accountant.
(a) Audit Fees
The aggregate fees billed for professional services rendered by Deloitte for the audit of the registrant’s annual financial statements and for services that are normally provided by Deloitte in connection with statutory and regulatory filings for the fiscal years ended December 31, 2012 and December 31, 2013 were $1,060,828 and $1,100,510, respectively.
(b) Audit-Related Fees
During the fiscal years ended December 31, 2012 and December 31, 2013, Deloitte billed $0 and $0, respectively, for assurance and related services that relate directly to the operations and financial reporting of the registrant, the registrant’s investment adviser or any other entity controlling, controlled by, or under common control with the registrant’s investment adviser that provides ongoing services to the registrant.
(c) Tax Fees
The aggregate fees billed for professional services rendered by Deloitte for tax compliance, tax advice and tax planning in the form of preparation of excise filings and income tax returns for the fiscal years ended December 31, 2012 and December 31, 2013 were $208,125 and $210,580, respectively. Represent fees for services rendered to the registrant for review of tax returns for the year end December 31, 2013 and for tax compliance, tax advice and tax planning in the form of preparation of excise filings and income tax returns for the fiscal year end December 31, 2012.
During the fiscal years ended December 31, 2012 and December 31, 2013, no fees for tax compliance, tax advice or tax planning services that relate directly to the operations and financial reporting of the registrant were billed by Deloitte to the registrant’s investment adviser or any other entity controlling, controlled by, or under common control with the registrant’s investment adviser that provides ongoing services to the registrant.
(d) All Other Fees
The registrant was not billed for any other products or services provided by Deloitte for the fiscal years ended December 31, 2012 and December 31, 2013 other than the services reported in paragraphs (a) through (c) above.
During the fiscal years ended December 31, 2012 and December 31, 2013, no fees for other products or services that relate directly to the operations and financial reporting of the registrant, other than the services reported in paragraphs (a) through (c) above, were billed by Deloitte to the registrant’s investment adviser or any other entity controlling, controlled by, or under common control with the registrant’s investment adviser that provides ongoing services to the registrant.
(e)(1) The registrant’s Audit Committee has established pre-approval procedures pursuant to paragraph (c)(7)(i)(B) of Rule 2-01 of Regulation S-X, which include regular pre-approval procedures and interim pre-approval procedures. Under the regular pre-approval procedures, the Audit Committee pre-approves at its regularly scheduled meetings audit and non-audit services that are required to be pre-approved under paragraph (c)(7) of Rule 2-01 of Regulation S-X. Under the interim pre-approval procedures, any member of the Audit Committee who is an independent Trustee is authorized to pre-approve proposed services that arise between regularly scheduled Audit Committee meetings and that need to commence prior to the next regularly scheduled Audit Committee meeting. Such Audit Committee member must report to the Audit Committee at its next regularly scheduled meeting on the pre-approval decision.
(2) Not applicable.
(f) Not applicable.
(g) The aggregate fees billed for the most recent fiscal year and the preceding fiscal year by the registrant’s principal accountant for non-audit services rendered to the registrant, its investment adviser, and adviser affiliates that provide ongoing services to the registrant for 2013 and 2012 were $0 and $0, respectively.
(h) The Audit Committee of the registrant’s Board of Trustees considered the provision of non-audit services that were rendered to the registrant’s investment adviser (not including any subadviser whose role is primarily portfolio management and is subcontracted with or overseen by another investment adviser), and any entity controlling, controlled by or under common control with the investment adviser that provides ongoing services to the registrant that were not pre-approved pursuant to paragraph (c)(7)(ii) of Rule 2-01 of Regulation S-X and concluded that such services are compatible with maintaining the principal accountant’s independence.
| Item 5. | Audit Committee of Listed Registrants. |
Not applicable.
(a) Schedule of Investments is included as a part of the report to shareholders included under Item 1 of this Form N-CSR.
(b) Not applicable.
| Item 7. | Disclosure of Proxy Voting Policies and Procedures for Closed-End Management Investment Companies. |
Not applicable.
| Item 8. | Portfolio Managers of Closed-End Management Investment Companies. |
Not applicable.
| Item 9. | Purchases of Equity Securities by Closed-End Management Investment Company and Affiliated Purchasers. |
Not applicable.
| Item 10. | Submission of Matters to a Vote of Security Holders. |
The registrant does not have procedures by which shareholders may recommend nominees to the registrant’s Board of Trustees.
| Item 11. | Controls and Procedures. |
(a) The President and Treasurer of the registrant have concluded, based on their evaluation of the effectiveness of the registrant’s disclosure controls and procedures (as defined in Rule 30a-3(c) under the Act) as of a date within 90 days of the filing date of this report on Form N-CSR, that the design and operation of such procedures provide reasonable assurance that information required to be disclosed by the registrant in this report on Form N-CSR is recorded, processed, summarized, and reported within the time periods specified in the Securities and Exchange Commission’s rules and forms.
(b) There were no significant changes in the registrant’s internal control over financial reporting (as defined in Rule 30a-3(d) under the 1940 Act) that occurred during the registrant’s second fiscal quarter of the period covered by this report that have materially affected, or are reasonably likely to materially affect, the registrant’s internal control over financial reporting.
(a)(1) Code of Ethics is attached hereto.
(a)(2) The certifications required by Rule 30a-2(a) under the 1940 Act are attached hereto.
(a)(3) Not applicable.
(b) The certifications required by Rule 30a-2(b) under the 1940 Act and Section 906 of the Sarbanes-Oxley Act of 2002 are attached hereto.
SIGNATURES
Pursuant to the requirements of the Securities Exchange Act of 1934 and the Investment Company Act of 1940, the registrant has duly caused this report to be signed on its behalf by the undersigned, thereunto duly authorized.
| | |
| METROPOLITAN SERIES FUND |
| |
| By: | | /s/ Elizabeth M. Forget |
| | Elizabeth M. Forget |
| | President and Chief Executive Officer |
Date: March 5, 2014
Pursuant to the requirements of the Securities Exchange Act of 1934 and the Investment Company Act of 1940, this report has been signed below by the following persons on behalf of the registrant and in the capacities and on the dates indicated.
| | |
| By: | | /s/ Elizabeth M. Forget |
| | Elizabeth M. Forget |
| | President and Chief Executive Officer |
Date: March 5, 2014
| | |
| By: | | /s/ Peter H. Duffy |
| | Peter H. Duffy |
| | Chief Financial Officer and Treasurer |
Date: March 5, 2014