UNITED STATES
SECURITIES AND EXCHANGE COMMISSION
Washington, D.C. 20549
FORM N-CSR
CERTIFIED SHAREHOLDER REPORT OF REGISTERED
MANAGEMENT INVESTMENT COMPANIES
Investment Company Act file number: 811-3618
METROPOLITAN SERIES FUND
(Exact name of registrant as specified in charter)
One Financial Center
Boston, MA 02111
(Address of principal executive offices) (Zip code)
| | |
| (Name and Address of Agent for Service) | | Copy to: |
Michael P. Lawlor c/o MetLife Advisers, LLC One Financial Center Boston, MA 02111 | | Brian McCabe, Esq. Ropes & Gray LLP Prudential Tower 800 Boylston Street Boston, MA 02199 |
Registrant’s telephone number, including area code: 617-578-4036
Date of fiscal year end: December 31
Date of reporting period: January 1, 2016 through June 30, 2016
Item 1: Report to Shareholders.
The following is a copy of the report transmitted to stockholders pursuant to Rule 30e-1 under the Investment Company Act of 1940 (the “Act”):
Metropolitan Series Fund
Baillie Gifford International Stock Portfolio
Managed by Baillie Gifford Overseas Limited
Portfolio Manager Commentary*
PERFORMANCE
For the six month period ended June 30, 2016, the Class A, B and E shares of the Baillie Gifford International Stock Portfolio returned 0.24%, 0.06%, and 0.17%, respectively. The Portfolio’s benchmark, the MSCI All Country World ex-U.S. Index1, returned -1.02%.
MARKET ENVIRONMENT / CONDITIONS
It has been a lackluster period for global market returns overall but the underlying picture was diverse with polarized returns at both the country and sector level. In a reversal of fortunes from the previous 12 months, Energy and Materials were the standout positive sectors following a rise in commodity prices, and their rebound also drove country performance, with nations heavily reliant on commodity exports, including Brazil, Russia, Peru and Canada delivering strong returns.
Beyond these limited bright spots, global markets traded sideways to downwards, reflecting continued cautious sentiment, before reacting strongly to the unexpected decision of the United Kingdom (the “U.K.”) to leave the European Union (the “E.U.”). As a result, the British pound and many international currencies fell sharply against the U.S. dollar. The U.K. and other global markets dropped in the immediate aftermath but have since recovered, although Financials remained under pressure as the prospect of rising interest rates was pushed out further.
While Angela Merkel, the German Chancellor urged “calm and focus” following the referendum, other European politicians are pressing for a start to the exit process. Though it answered one question (the preference of the U.K. populace to break free from the E.U.), the referendum result has opened up many others that reach beyond U.K. borders into Europe and further afield.
PORTFOLIO REVIEW / PERIOD END POSITIONING
The Portfolio outperformed the benchmark during the period. The main positive contributions came from European and Emerging Markets equities though, as is typical for this strategy, regional allocation effects were muted and dwarfed by the effects of stock selection. Stock selection also dominated within sectors, with Information Technology the strongest area, but the Portfolio’s underweight position in Energy was unhelpful given the strong returns in that sector.
Information Technology stocks TSMC (Taiwan), Samsung Electronics (Korea) and MercadoLibre (Brazil) featured as the strongest contributors. TSMC is the world’s leading semiconductor foundry and largest holding in the Portfolio. It has become virtually indispensable to many of the largest semiconductor design companies in the industry which outsource the manufacturing process. The company’s success has been self-fulfilling as its market leading position allows it to attract best in class engineers and to maintain strong relationships with its customers and suppliers. In an industry that hinges on scale and capacity utilization, the fact that TSMC’s production capacity is more than three times that of its key competitors combined (UMC, Global Foundries and SMIC) highlights the strength of the company’s position.
Samsung Electronics, the electronics manufacturer, and MercadoLibre, the leading e-commerce platform in Latin America, performed well following the announcement of strong results. Robust sales of Samsung Electronics’ flagship S7 smartphone seem to have tempered market concerns about shrinking profits and a drop in the division’s market share. Beyond smartphones, Samsung Electronics has strong memory chip, foundry and display screen businesses which tend to be given less attention by the market. We added to the Portfolio’s holding earlier in the year in the belief that the group’s long term growth prospects were underestimated by the stock’s valuation. Despite a difficult economic and political backdrop in MercadoLibre’s key market of Brazil, it is noteworthy that e-commerce remains a stellar industry and MercadoLibre continues to outperform market growth rates, while further enhancing the quality and quantity of value added services.
Latin American banks held in the Portfolio, including Credicorp (Peru) and Itau Unibanco (Brazil) also performed well, buoyed in part by the broader halo of commodity price rises. Both are well run, highly profitable banks with long term growth opportunities driven by the rising provision of banking services from relatively low levels, although the economic backdrop has been a headwind in recent years. The Portfolio’s long held underweight position in banks has been helpful given downward pressure on the industry this year.
Beyond the Portfolio’s underweight position in Energy, detractors from relative performance were largely concentrated among stocks hit by the U.K. referendum vote. Although there are a number of U.K.-domiciled companies held in the Portfolio, many of these are multinational businesses with substantial overseas sales, for example Rolls Royce, the aircraft engine manufacturer and ARM Holdings, the semiconductor designer, are both U.K. based but export to markets globally. The more domestically-focused U.K. holdings, including retail savings platforms St. James’s Place and Hargreaves Lansdown, and kitchen supplier Howden Joinery, were particularly weak following the vote. We believe these businesses have enduring competitive advantages and should continue to grow for structural reasons, and we took the opportunity to add to the position in Howden Joinery, which was initially purchased in February this year.
Stock exchanges worldwide were caught up in the market volatility and for Japan Exchange Group, the securities and derivatives exchange, negative sentiment combined with a drop in operating profits to drive the shares downwards. Japan Exchange remains the dominant exchange for equity and derivative settlement in Japan and has significant pricing power. We believe the investment case is unchanged by the recent events and made a small addition to the Portfolio’s position.
MSF-1
Metropolitan Series Fund
Baillie Gifford International Stock Portfolio
Managed by Baillie Gifford Overseas Limited
Portfolio Manager Commentary*—(Continued)
The overall positioning of the Portfolio is driven by individual stock selection and turnover remains low, reflecting the long term investment approach. Other transactions made during the period include new holdings in global testing, inspection & certification market leaders SGS (Switzerland) and Bureau Veritas (France), and a position in jewellery company Pandora (Denmark), whose strong brand in the affordable luxury segment, we believe, looks well placed for further geographic and product line expansion.
Energy holdings BG Group (U.K.), Petrofac (U.K.) and Seadrill (Norway) have been sold, increasing the Portfolio’s underweight position in that sector. BG Group was bid for by oil & gas major Royal Dutch Shell while, for Petrofac and Seadrill, the more challenging environment presented by a low oil price has been compounded by operational difficulties and rising financing risks. At period end, the Portfolio also remained underweight in Health Care, Financials (largely driven by the underweight in banks) and Telecommunications sectors where we have struggled to find attractive growth businesses.
The Industrials and Information Technology sectors continued to be the largest segments of the Portfolio, reflecting both the broad nature of those sectors and the Portfolio’s bias towards growth. The industries and end markets represented are well diversified, including global leaders in aerospace, car parts and robotics in the case of Industrials, and e-commerce, semiconductors and enterprise software within Information Technology.
Gerald Smith
Jonathan Bates
Angus Franklin
Portfolio Managers
Baillie Gifford Overseas Limited
* This commentary may include statements that constitute “forward-looking statements” under the U.S. securities laws. Forward-looking statements include, among other things, projections, estimates, and information about possible or future results related to the Portfolio, market or regulatory developments. The views expressed above are not guarantees of future performance or economic results and involve certain risks, uncertainties and assumptions that could cause actual outcomes and results to differ materially from the views expressed herein. The views expressed above are subject to change at any time based upon economic, market, or other conditions and the subadvisory firm undertakes no obligation to update the views expressed herein. Any discussions of specific securities should not be considered a recommendation to buy or sell those securities. The views expressed above (including any forward-looking statement) may not be relied upon as investment advice or as an indication of the Portfolio’s trading intent. Information about the Portfolio’s holdings, asset allocation or country diversification is historical and is not an indication of future Portfolio composition, which may vary. Direct investment in any index is not possible. The performance of any index mentioned in this commentary has not been adjusted for ongoing management, distribution and operating expenses, and sales charges applicable to mutual fund investments. In addition, the returns do not reflect additional fees charged by separate accounts or variable insurance contracts that an investor in the Portfolio may pay. If these additional fees were reflected, performance would have been lower.
MSF-2
Metropolitan Series Fund
Baillie Gifford International Stock Portfolio
A $10,000 INVESTMENT COMPARED TO THE MSCI ALL COUNTRY WORLD EX-U.S. INDEX
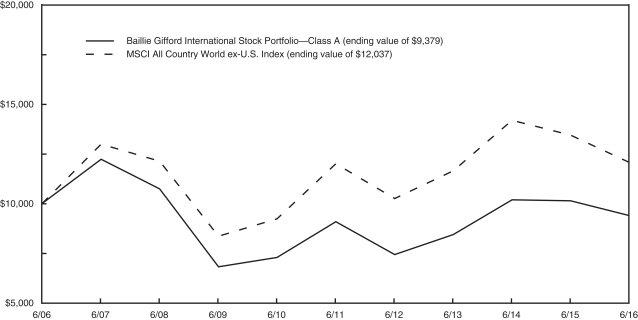
SIX MONTH RETURN & AVERAGE ANNUAL RETURNS (%) AS OF JUNE 30, 2016
| | | | | | | | | | | | | | | | |
| | | 6 Month | | | 1 Year | | | 5 Year | | | 10 Year | |
| Baillie Gifford International Stock Portfolio | | | | | | | | | | | | | | | | |
Class A | | | 0.24 | | | | -7.39 | | | | 0.65 | | | | -0.64 | |
Class B | | | 0.06 | | | | -7.66 | | | | 0.38 | | | | -0.90 | |
Class E | | | 0.17 | | | | -7.53 | | | | 0.49 | | | | -0.79 | |
| MSCI All Country World ex-U.S. Index | | | -1.02 | | | | -10.24 | | | | 0.10 | | | | 1.87 | |
1 The MSCI All Country World ex-U.S. Index is an unmanaged free float-adjusted market capitalization index that is designed to measure equity market performance in the global developed and emerging markets, excluding the U.S. The Index returns shown above were calculated with net dividends: they reflect the reinvestment of dividends after the deduction of the maximum possible withholding taxes.
Portfolio performance is calculated including reinvestment of all income and capital gain distributions. Performance numbers are net of all Portfolio expenses but do not include any insurance, sales, separate account or administrative charges of variable annuity or life insurance contracts or any additional expenses that participants may bear relating to the operations of their plans. If these charges were included, the returns would be lower. The performance of any index referenced above has not been adjusted for ongoing management, distribution and operating expenses, and sales charges applicable to mutual fund investments. Direct investment in any index is not possible. The performance of Class A shares, as set forth in the line graph above, will differ from that of other classes because of the difference in expenses paid by policyholders investing in the different share classes.
This information represents past performance and is not indicative of future results. Investment return and principal value may fluctuate so that shares, upon redemption, may be worth more or less than the original cost.
PORTFOLIO COMPOSITION AS OF JUNE 30, 2016
Top Holdings
| | | | |
| | | % of
Net Assets | |
| Taiwan Semiconductor Manufacturing Co., Ltd. | | | 4.0 | |
| Samsung Electronics Co., Ltd. | | | 3.3 | |
| Naspers, Ltd. - N Shares | | | 3.2 | |
| Nestle S.A. | | | 3.0 | |
| ARM Holdings plc | | | 2.3 | |
| Ryanair Holdings plc (ADR) | | | 2.1 | |
| Fairfax Financial Holdings, Ltd. | | | 2.0 | |
| Svenska Handelsbanken AB - A Shares | | | 2.0 | |
| Industria de Diseno Textil S.A. | | | 1.9 | |
| Atlas Copco AB - B Shares | | | 1.9 | |
Top Countries
| | | | |
| | | % of
Net Assets | |
| United Kingdom | | | 15.3 | |
| Japan | | | 12.8 | |
| Ireland | | | 6.5 | |
| Germany | | | 5.5 | |
| Switzerland | | | 5.4 | |
| South Korea | | | 5.2 | |
| Taiwan | | | 4.9 | |
| Canada | | | 4.7 | |
| Sweden | | | 4.5 | |
| Denmark | | | 4.3 | |
MSF-3
Metropolitan Series Fund
Baillie Gifford International Stock Portfolio
Understanding Your Portfolio’s Expenses (Unaudited)
Shareholder Expense Example
As a shareholder of the Portfolio, you incur ongoing costs, including management fees; distribution and service (12b-1) fees; and other Portfolio expenses. This example is intended to help you understand your ongoing costs (in dollars) (referred to as “expenses”) of investing in the Portfolio and compare these costs with the ongoing costs of investing in other mutual funds. The example is based on an investment of $1,000 invested at the beginning of the period and held for the entire period, January 1, 2016 through June 30, 2016.
Actual Expenses
The first line for each share class of the Portfolio in the table below provides information about actual account values and actual expenses. You may use the information in this line, together with the amount you invested in the particular share class of the Portfolio, to estimate the expenses that you paid over the period. Simply divide your account value by $1,000 (for example, an $8,600 account value divided by $1,000 = 8.6), then multiply the result by the number in the first line under the heading entitled “Expenses Paid During Period” to estimate the expenses you paid on your account during this period.
Hypothetical Example for Comparison Purposes
The second line for each share class of the Portfolio in the table below provides information about hypothetical account values and hypothetical expenses based on the Portfolio’s actual expense ratio and an assumed rate of return of 5% per year before expenses, which is not the Portfolio’s actual return. The hypothetical account values and expenses may not be used to estimate the actual ending account balance or expenses you paid for the period. You may use this information to compare the ongoing costs of investing in the Portfolio and other funds. To do so, compare this 5% hypothetical example with the 5% hypothetical examples that appear in the shareholder reports of the other funds.
Please note that the expenses shown in the table are meant to highlight your ongoing costs only and do not reflect any fees or charges of your variable insurance product or any additional expenses that participants in certain eligible qualified plans may bear relating to the operations of their plan. Therefore, the second line for each share class in the table is useful in comparing ongoing costs only, and will not help you determine the relative total costs of owning different funds. In addition, if these other costs were included, your costs would have been higher.
| | | | | | | | | | | | | | | | | | |
Baillie Gifford International Stock Portfolio | | | | Annualized
Expense
Ratio | | | Beginning
Account Value
January 1,
2016 | | | Ending
Account Value
June 30,
2016 | | | Expenses Paid
During Period**
January 1, 2016
to
June 30,
2016 | |
Class A(a) | | Actual | | | 0.73 | % | | $ | 1,000.00 | | | $ | 1,002.40 | | | $ | 3.63 | |
| | Hypothetical* | | | 0.73 | % | | $ | 1,000.00 | | | $ | 1,021.23 | | | $ | 3.67 | |
| | | | | |
Class B(a) | | Actual | | | 0.98 | % | | $ | 1,000.00 | | | $ | 1,000.60 | | | $ | 4.87 | |
| | Hypothetical* | | | 0.98 | % | | $ | 1,000.00 | | | $ | 1,019.99 | | | $ | 4.92 | |
| | | | | |
Class E(a) | | Actual | | | 0.88 | % | | $ | 1,000.00 | | | $ | 1,001.70 | | | $ | 4.38 | |
| | Hypothetical* | | | 0.88 | % | | $ | 1,000.00 | | | $ | 1,020.49 | | | $ | 4.42 | |
* Hypothetical assumes a rate of return of 5% per year before expenses.
** Expenses paid are equal to the Portfolio’s annualized expense ratio for the most recent six month period, as shown above, multiplied by the average account value over the period, multiplied by the number of days (182 days) in the most recent fiscal half-year, divided by 366 (to reflect the one-half year period).
(a) The annualized expense ratio shown reflects the impact of the management fee waiver as described in Note 5 of the Notes to Financial Statements.
MSF-4
Metropolitan Series Fund
Baillie Gifford International Stock Portfolio
Schedule of Investments as of June 30, 2016 (Unaudited)
Common Stocks—98.8% of Net Assets
| | | | | | | | |
| Security Description | | Shares | | | Value | |
| | |
Argentina—1.8% | | | | | | | | |
MercadoLibre, Inc. (a) | | | 214,935 | | | $ | 30,234,906 | |
| | | | | | | | |
| | |
Australia—2.8% | | | | | | | | |
Brambles, Ltd. | | | 2,199,727 | | | | 20,411,580 | |
Cochlear, Ltd. | | | 221,159 | | | | 20,059,439 | |
Seek, Ltd. | | | 605,864 | | | | 6,913,184 | |
| | | | | | | | |
| | | | | | | 47,384,203 | |
| | | | | | | | |
| | |
Brazil—0.7% | | | | | | | | |
Itau Unibanco Holding S.A. (ADR) | | | 1,231,649 | | | | 11,626,767 | |
| | | | | | | | |
| | |
Canada—4.7% | | | | | | | | |
Constellation Software, Inc. | | | 41,514 | | | | 16,066,733 | |
Fairfax Financial Holdings, Ltd. | | | 63,132 | | | | 34,002,198 | |
Restaurant Brands International, Inc. | | | 370,843 | | | | 15,437,081 | |
Ritchie Bros. Auctioneers, Inc. (a) | | | 425,062 | | | | 14,358,594 | |
| | | | | | | | |
| | | | | | | 79,864,606 | |
| | | | | | | | |
| | |
China—2.8% | | | | | | | | |
Alibaba Group Holding, Ltd. (ADR) (a) (b) | | | 184,162 | | | | 14,646,404 | |
Baidu, Inc. (ADR) (b) | | | 142,800 | | | | 23,583,420 | |
Want Want China Holdings, Ltd. (a) | | | 13,272,626 | | | | 9,519,910 | |
| | | | | | | | |
| | | | | | | 47,749,734 | |
| | | | | | | | |
| | |
Denmark—4.3% | | | | | | | | |
DSV A/S | | | 477,254 | | | | 20,065,959 | |
Novo Nordisk A/S - Class B | | | 390,136 | | | | 20,980,368 | |
Novozymes A/S - B Shares | | | 416,844 | | | | 20,087,972 | |
Pandora A/S | | | 78,842 | | | | 10,702,388 | |
| | | | | | | | |
| | | | | | | 71,836,687 | |
| | | | | | | | |
| | |
Finland—2.2% | | | | | | | | |
Kone Oyj - Class B (a) | | | 455,402 | | | | 21,027,033 | |
Sampo Oyj - A Shares | | | 379,676 | | | | 15,512,002 | |
| | | | | | | | |
| | | | | | | 36,539,035 | |
| | | | | | | | |
| | |
France—3.1% | | | | | | | | |
Bureau Veritas S.A. | | | 359,291 | | | | 7,585,773 | |
Edenred | | | 513,263 | | | | 10,590,181 | |
Essilor International S.A. | | | 139,630 | | | | 18,583,768 | |
Legrand S.A. | | | 295,313 | | | | 15,236,659 | |
| | | | | | | | |
| | | | | | | 51,996,381 | |
| | | | | | | | |
| | |
Germany—5.5% | | | | | | | | |
Brenntag AG | | | 282,662 | | | | 13,659,552 | |
Continental AG | | | 80,447 | | | | 15,118,258 | |
Deutsche Boerse AG | | | 359,487 | | | | 29,433,619 | |
MTU Aero Engines AG | | | 121,146 | | | | 11,333,015 | |
SAP SE | | | 306,729 | | | | 22,927,259 | |
| | | | | | | | |
| | | | | | | 92,471,703 | |
| | | | | | | | |
| | |
Hong Kong—2.8% | | | | | | | | |
Hang Seng Bank, Ltd. | | | 1,104,500 | | | | 18,973,445 | |
| | |
Hong Kong—(Continued) | | | | | | | | |
Hong Kong Exchanges and Clearing, Ltd. | | | 1,156,900 | | | | 28,223,751 | |
| | | | | | | | |
| | | | | | | 47,197,196 | |
| | | | | | | | |
| | |
Ireland—6.5% | | | | | | | | |
CRH plc | | | 837,029 | | | | 24,646,635 | |
Experian plc | | | 1,316,289 | | | | 25,002,326 | |
James Hardie Industries plc | | | 1,629,595 | | | | 24,961,465 | |
Ryanair Holdings plc (ADR) | | | 494,900 | | | | 34,415,346 | |
| | | | | | | | |
| | | | | | | 109,025,772 | |
| | | | | | | | |
| | |
Japan—12.8% | | | | | | | | |
Denso Corp. | | | 494,600 | | | | 17,375,799 | |
FANUC Corp. | | | 101,500 | | | | 16,429,438 | |
Fast Retailing Co., Ltd. | | | 41,300 | | | | 11,072,451 | |
Japan Exchange Group, Inc. | | | 2,255,400 | | | | 25,801,160 | |
MS&AD Insurance Group Holdings, Inc. | | | 641,800 | | | | 16,529,170 | |
Nidec Corp. | | | 229,900 | | | | 17,352,864 | |
Rakuten, Inc. | | | 2,187,200 | | | | 23,590,270 | |
Shimano, Inc. (a) | | | 155,800 | | | | 23,612,221 | |
SMC Corp. | | | 94,500 | | | | 23,051,507 | |
Sumitomo Mitsui Trust Holdings, Inc. | | | 6,505,000 | | | | 21,052,093 | |
Toyota Tsusho Corp. | | | 854,300 | | | | 18,326,310 | |
| | | | | | | | |
| | | | | | | 214,193,283 | |
| | | | | | | | |
| | |
Netherlands—1.8% | | | | | | | | |
Heineken Holding NV | | | 363,058 | | | | 29,657,320 | |
| | | | | | | | |
| | |
Panama—0.7% | | | | | | | | |
Copa Holdings S.A. - Class A (a) | | | 213,638 | | | | 11,164,722 | |
| | | | | | | | |
| | |
Peru—0.9% | | | | | | | | |
Credicorp, Ltd. | | | 94,356 | | | | 14,561,962 | |
| | | | | | | | |
| | |
Russia—1.8% | | | | | | | | |
Magnit PJSC (GDR) | | | 390,167 | | | | 12,979,403 | |
Yandex NV - Class A (b) | | | 798,318 | | | | 17,443,248 | |
| | | | | | | | |
| | | | | | | 30,422,651 | |
| | | | | | | | |
| | |
Singapore—1.3% | | | | | | | | |
United Overseas Bank, Ltd. | | | 1,618,473 | | | | 22,349,135 | |
| | | | | | | | |
| | |
South Africa—3.2% | | | | | | | | |
Naspers, Ltd. - N Shares | | | 353,833 | | | | 54,216,876 | |
| | | | | | | | |
| | |
South Korea—5.2% | | | | | | | | |
NAVER Corp. | | | 29,269 | | | | 18,199,410 | |
Samsung Electronics Co., Ltd. | | | 44,619 | | | | 55,544,353 | |
SK Telecom Co., Ltd. | | | 76,078 | | | | 14,235,878 | |
| | | | | | | | |
| | | | | | | 87,979,641 | |
| | | | | | | | |
| | |
Spain—2.9% | | | | | | | | |
Bankinter S.A. (a) | | | 2,532,099 | | | | 16,286,132 | |
Industria de Diseno Textil S.A. | | | 952,164 | | | | 31,752,252 | |
| | | | | | | | |
| | | | | | | 48,038,384 | |
| | | | | | | | |
See accompanying notes to financial statements.
MSF-5
Metropolitan Series Fund
Baillie Gifford International Stock Portfolio
Schedule of Investments as of June 30, 2016 (Unaudited)
Common Stocks—(Continued)
| | | | | | | | |
| Security Description | |
Shares | | | Value | |
| | |
Sweden—4.5% | | | | | | | | |
Atlas Copco AB - B Shares | | | 1,323,232 | | | $ | 31,240,660 | |
Svenska Handelsbanken AB - A Shares | | | 2,801,998 | | | | 33,893,956 | |
Volvo AB - B Shares | | | 1,067,847 | | | | 10,545,131 | |
| | | | | | | | |
| | | | | | | 75,679,747 | |
| | | | | | | | |
| | |
Switzerland—5.4% | | | | | | | | |
Cie Financiere Richemont S.A. | | | 277,349 | | | | 16,270,687 | |
LafargeHolcim, Ltd. (b) | | | 305,658 | | | | 12,656,398 | |
Nestle S.A. | | | 654,221 | | | | 50,463,784 | |
SGS S.A. (a) | | | 4,872 | | | | 11,171,379 | |
| | | | | | | | |
| | | | | | | 90,562,248 | |
| | | | | | | | |
| | |
Taiwan—4.9% | | | | | | | | |
Hon Hai Precision Industry Co., Ltd. | | | 5,514,895 | | | | 14,190,378 | |
Taiwan Semiconductor Manufacturing Co., Ltd. | | | 13,391,000 | | | | 67,712,480 | |
| | | | | | | | |
| | | | | | | 81,902,858 | |
| | | | | | | | |
| | |
United Kingdom—15.3% | | | | | | | | |
ARM Holdings plc | | | 2,540,645 | | | | 38,480,500 | |
ASOS plc (b) | | | 193,858 | | | | 10,329,061 | |
British American Tobacco plc | | | 394,077 | | | | 25,642,771 | |
Burberry Group plc | | | 658,751 | | | | 10,297,496 | |
Capita plc | | | 1,418,200 | | | | 18,215,637 | |
Hargreaves Lansdown plc | | | 983,746 | | | | 16,370,328 | |
Howden Joinery Group plc | | | 1,515,587 | | | | 7,904,828 | |
Prudential plc | | | 1,284,634 | | | | 21,884,768 | |
Rio Tinto plc | | | 809,299 | | | | 25,015,532 | |
Rolls-Royce Holdings plc (b) | | | 968,421 | | | | 9,195,898 | |
St. James’s Place plc | | | 1,268,651 | | | | 13,588,761 | |
Tullow Oil plc (a) (b) | | | 2,422,659 | | | | 8,476,468 | |
Unilever NV | | | 596,325 | | | | 27,800,106 | |
Wolseley plc | | | 442,269 | | | | 22,920,668 | |
| | | | | | | | |
| | | | | | | 256,122,822 | |
| | | | | | | | |
| | |
United States—0.9% | | | | | | | | |
Pricesmart, Inc. (a) | | | 158,049 | | | | 14,788,645 | |
| | | | | | | | |
Total Common Stocks
(Cost $1,468,191,745) | | | | | | | 1,657,567,284 | |
| | | | | | | | |
|
| Short-Term Investments—6.7% | |
|
Mutual Fund—5.8% | |
State Street Navigator Securities Lending MET Portfolio (c) | | | 96,997,498 | | | | 96,997,498 | |
| | | | | | | | |
|
Repurchase Agreement—0.9% | |
Fixed Income Clearing Corp. Repurchase Agreement dated 06/30/16 at 0.030% to be repurchased at $14,704,719 on 07/01/16, collateralized by $14,545,000 U.S. Treasury Note at 1.750% due 12/31/20 with a value of $14,999,531. | | | 14,704,707 | | | | 14,704,707 | |
| | | | | | | | |
Total Short-Term Investments
(Cost $111,702,205) | | | | | | | 111,702,205 | |
| | | | | | | | |
Total Investments—105.5%
(Cost $1,579,893,950) (d) | | | | | | | 1,769,269,489 | |
Other assets and liabilities (net)—(5.5)% | | | | | | | (91,851,883 | ) |
| | | | | | | | |
| Net Assets—100.0% | | | | | | $ | 1,677,417,606 | |
| | | | | | | | |
| * | Principal amount stated in U.S. dollars unless otherwise noted. |
| (a) | All or a portion of the security was held on loan. As of June 30, 2016, the market value of securities loaned was $109,212,894 and the collateral received consisted of cash in the amount of $96,997,498 and non-cash collateral with a value of $14,171,595. The cash collateral is invested in a money market fund managed by an affiliate of the custodian. The non-cash collateral received consists primarily of government securities and bank letters of credit, and is held for the benefit of the Portfolio at the Portfolio’s custodian. The Portfolio cannot repledge or resell this collateral. As such, this collateral is excluded from the Statement of Assets and Liabilities. |
| (b) | Non-income producing security. |
| (c) | Represents investment of cash collateral received from securities on loan as of June 30, 2016. |
| (d) | As of June 30, 2016, the aggregate cost of investments was $1,579,893,950. The aggregate unrealized appreciation and depreciation of investments were $331,163,883 and $(141,788,344), respectively, resulting in net unrealized appreciation of $189,375,539. |
| (ADR)— | An American Depositary Receipt is a certificate issued by a custodian bank representing the right to receive securities of the foreign issuer described. Trading on exchanges not located in the United States or Canada significantly influences the value of ADRs. |
| (GDR)— | A Global Depositary Receipt is a negotiable certificate issued by one country’s bank against a certain number of shares of a company’s stock held in its custody but traded on the stock exchange of another country. |
| | | | |
Ten Largest Industries as of
June 30, 2016 (Unaudited) | | % of
Net Assets | |
Banks | | | 8.3 | |
Semiconductors & Semiconductor Equipment | | | 6.3 | |
Internet Software & Services | | | 6.2 | |
Machinery | | | 6.1 | |
Insurance | | | 6.1 | |
Diversified Financial Services | | | 5.0 | |
Professional Services | | | 4.1 | |
Trading Companies & Distributors | | | 3.7 | |
Construction Materials | | | 3.7 | |
Food Products | | | 3.6 | |
See accompanying notes to financial statements.
MSF-6
Metropolitan Series Fund
Baillie Gifford International Stock Portfolio
Schedule of Investments as of June 30, 2016 (Unaudited)
Fair Value Hierarchy
Accounting principles generally accepted in the United States of America (“GAAP”) define fair market value as the price that the Portfolio would receive to sell an asset or pay to transfer a liability in an orderly transaction between market participants at the measurement date. It establishes a fair value hierarchy that prioritizes inputs to valuation methods and requires disclosure of the fair value hierarchy, separately for each major category of assets and liabilities, that segregates fair value measurements into three levels. Levels 1, 2 and 3 of the fair value hierarchy are defined as follows:
Level 1 - unadjusted quoted prices in active markets for identical investments
Level 2 - other significant observable inputs (including, but not limited to, quoted prices for similar assets or liabilities in markets that are either active or inactive; inputs other than quoted prices that are observable such as interest rates, yield curves, volatilities, prepayment speeds, loss severities, credit risks, default rates, or other market corroborated inputs)
Level 3 - significant unobservable inputs based on the best information available in the circumstances, to the extent observable inputs are unavailable (including the Portfolio’s own assumptions used in determining the fair value of investments and derivative financial instruments)
The inputs or methodologies used for valuing investments are not necessarily an indication of the risk associated with investing in them. Changes to the inputs or methodologies used may result in transfers between levels, which will be recognized as of the beginning of the reporting period. Information on transfers between Level 1 and Level 2, if any, will be disclosed following the fair value hierarchy table below. A reconciliation of Level 3 securities, if any, will also be disclosed following the fair value hierarchy table. For more information about the Portfolio’s policy regarding the valuation of investments, please refer to the Notes to Financial Statements.
The following table summarizes the fair value hierarchy of the Portfolio’s investments as of June 30, 2016:
| | | | | | | | | | | | | | | | |
| Description | | Level 1 | | | Level 2 | | | Level 3 | | | Total | |
| Common Stocks | | | | | | | | | | | | | | | | |
Argentina | | $ | 30,234,906 | | | $ | — | | | $ | — | | | $ | 30,234,906 | |
Australia | | | — | | | | 47,384,203 | | | | — | | | | 47,384,203 | |
Brazil | | | 11,626,767 | | | | — | | | | — | | | | 11,626,767 | |
Canada | | | 79,864,606 | | | | — | | | | — | | | | 79,864,606 | |
China | | | 38,229,824 | | | | 9,519,910 | | | | — | | | | 47,749,734 | |
Denmark | | | — | | | | 71,836,687 | | | | — | | | | 71,836,687 | |
Finland | | | — | | | | 36,539,035 | | | | — | | | | 36,539,035 | |
France | | | — | | | | 51,996,381 | | | | — | | | | 51,996,381 | |
Germany | | | — | | | | 92,471,703 | | | | — | | | | 92,471,703 | |
Hong Kong | | | — | | | | 47,197,196 | | | | — | | | | 47,197,196 | |
Ireland | | | 34,415,346 | | | | 74,610,426 | | | | — | | | | 109,025,772 | |
Japan | | | — | | | | 214,193,283 | | | | — | | | | 214,193,283 | |
Netherlands | | | — | | | | 29,657,320 | | | | — | | | | 29,657,320 | |
Panama | | | 11,164,722 | | | | — | | | | — | | | | 11,164,722 | |
Peru | | | 14,561,962 | | | | — | | | | — | | | | 14,561,962 | |
Russia | | | 17,443,248 | | | | 12,979,403 | | | | — | | | | 30,422,651 | |
Singapore | | | — | | | | 22,349,135 | | | | — | | | | 22,349,135 | |
South Africa | | | — | | | | 54,216,876 | | | | — | | | | 54,216,876 | |
South Korea | | | — | | | | 87,979,641 | | | | — | | | | 87,979,641 | |
Spain | | | — | | | | 48,038,384 | | | | — | | | | 48,038,384 | |
Sweden | | | — | | | | 75,679,747 | | | | — | | | | 75,679,747 | |
Switzerland | | | — | | | | 90,562,248 | | | | — | | | | 90,562,248 | |
Taiwan | | | — | | | | 81,902,858 | | | | — | | | | 81,902,858 | |
United Kingdom | | | — | | | | 256,122,822 | | | | — | | | | 256,122,822 | |
United States | | | 14,788,645 | | | | — | | | | — | | | | 14,788,645 | |
Total Common Stocks | | | 252,330,026 | | | | 1,405,237,258 | | | | — | | | | 1,657,567,284 | |
| Short-Term Investments | | | | | | | | | | | | | | | | |
Mutual Fund | | | 96,997,498 | | | | — | | | | — | | | | 96,997,498 | |
Repurchase Agreement | | | — | | | | 14,704,707 | | | | — | | | | 14,704,707 | |
Total Short-Term Investments | | | 96,997,498 | | | | 14,704,707 | | | | — | | | | 111,702,205 | |
Total Investments | | $ | 349,327,524 | | | $ | 1,419,941,965 | | | $ | — | | | $ | 1,769,269,489 | |
| | | | | | | | | | | | | | | | | |
Collateral for Securities Loaned (Liability) | | $ | — | | | $ | (96,997,498 | ) | | $ | — | | | $ | (96,997,498 | ) |
See accompanying notes to financial statements.
MSF-7
Metropolitan Series Fund
Baillie Gifford International Stock Portfolio
Statement of Assets and Liabilities
June 30, 2016 (Unaudited)
| | | | |
Assets | |
Investments at value (a) (b) | | $ | 1,769,269,489 | |
Cash denominated in foreign currencies (c) | | | 2,240,139 | |
Receivable for: | | | | |
Investments sold | | | 91,349 | |
Fund shares sold | | | 220,936 | |
Dividends and interest | | | 4,511,478 | |
Prepaid expenses | | | 10,707 | |
| | | | |
Total Assets | | | 1,776,344,098 | |
Liabilities | | | | |
Collateral for securities loaned | | | 96,997,498 | |
Payables for: | | | | |
Fund shares redeemed | | | 164,784 | |
Accrued Expenses: | | | | |
Management fees | | | 931,365 | |
Distribution and service fees | | | 68,531 | |
Deferred trustees’ fees | | | 107,300 | |
Other expenses | | | 657,014 | |
| | | | |
Total Liabilities | | | 98,926,492 | |
| | | | |
Net Assets | | $ | 1,677,417,606 | |
| | | | |
Net Assets Consist of: | | | | |
Paid in surplus | | $ | 1,856,416,929 | |
Undistributed net investment income | | | 19,194,468 | |
Accumulated net realized loss | | | (387,571,230 | ) |
Unrealized appreciation on investments and foreign currency transactions | | | 189,377,439 | |
| | | | |
Net Assets | | $ | 1,677,417,606 | |
| | | | |
Net Assets | | | | |
Class A | | $ | 1,335,586,504 | |
Class B | | | 323,174,946 | |
Class E | | | 18,656,156 | |
Capital Shares Outstanding* | | | | |
Class A | | | 139,617,353 | |
Class B | | | 34,276,844 | |
Class E | | | 1,968,842 | |
Net Asset Value, Offering Price and Redemption Price Per Share | | | | |
Class A | | $ | 9.57 | |
Class B | | | 9.43 | |
Class E | | | 9.48 | |
| * | The Portfolio is authorized to issue an unlimited number of shares. |
| (a) | Identified cost of investments was $1,579,893,950. |
| (b) | Includes securities loaned at value of $109,212,894. |
| (c) | Identified cost of cash denominated in foreign currencies was $2,178,779. |
Statement of Operations
Six Months Ended June 30, 2016 (Unaudited)
| | | | |
Investment Income | |
Dividends (a) | | $ | 25,239,254 | |
Interest | | | 2,276 | |
Securities lending income | | | 772,898 | |
| | | | |
Total investment income | | | 26,014,428 | |
Expenses | | | | |
Management fees | | | 6,583,586 | |
Administration fees | | | 20,939 | |
Custodian and accounting fees | | | 287,503 | |
Distribution and service fees—Class B | | | 401,235 | |
Distribution and service fees—Class E | | | 13,892 | |
Audit and tax services | | | 26,849 | |
Legal | | | 13,588 | |
Trustees’ fees and expenses | | | 15,990 | |
Shareholder reporting | | | 54,103 | |
Insurance | | | 6,035 | |
Miscellaneous | | | 38,126 | |
| | | | |
Total expenses | | | 7,461,846 | |
Less management fee waiver | | | (991,007 | ) |
Less broker commission recapture | | | (9,817 | ) |
| | | | |
Net expenses | | | 6,461,022 | |
| | | | |
Net Investment Income | | | 19,553,406 | |
| | | | |
Net Realized and Unrealized Gain (Loss) | | | | |
| Net realized loss on: | | | | |
Investments | | | (24,542,913 | ) |
Foreign currency transactions | | | (228,813 | ) |
| | | | |
Net realized loss | | | (24,771,726 | ) |
| | | | |
| Net change in unrealized appreciation on: | | | | |
Investments | | | 9,304,974 | |
Foreign currency transactions | | | 87,152 | |
| | | | |
Net change in unrealized appreciation | | | 9,392,126 | |
| | | | |
Net realized and unrealized loss | | | (15,379,600 | ) |
| | | | |
Net Increase in Net Assets From Operations | | $ | 4,173,806 | |
| | | | |
| (a) | Net of foreign withholding taxes of $3,083,369. |
See accompanying notes to financial statements.
MSF-8
Metropolitan Series Fund
Baillie Gifford International Stock Portfolio
Statements of Changes in Net Assets
| | | | | | | | |
| | | Six Months
Ended
June 30,
2016
(Unaudited) | | | Year Ended
December 31,
2015 | |
Increase (Decrease) in Net Assets: | | | | | | | | |
From Operations | | | | | | | | |
Net investment income | | $ | 19,553,406 | | | $ | 27,899,598 | |
Net realized gain (loss) | | | (24,771,726 | ) | | | 24,113,055 | |
Net change in unrealized appreciation (depreciation) | | | 9,392,126 | | | | (76,932,510 | ) |
| | | | | | | | |
Increase (decrease) in net assets from operations | | | 4,173,806 | | | | (24,919,857 | ) |
| | | | | | | | |
From Distributions to Shareholders | | | | | | | | |
Net investment income | | | | | | | | |
Class A | | | (22,026,648 | ) | | | (24,534,596 | ) |
Class B | | | (4,502,541 | ) | | | (5,302,305 | ) |
Class E | | | (277,159 | ) | | | (338,291 | ) |
| | | | | | | | |
Total distributions | | | (26,806,348 | ) | | | (30,175,192 | ) |
| | | | | | | | |
Decrease in net assets from capital share transactions | | | (17,518,432 | ) | | | (127,460,178 | ) |
| | | | | | | | |
Total decrease in net assets | | | (40,150,974 | ) | | | (182,555,227 | ) |
| | |
Net Assets | | | | | | | | |
Beginning of period | | | 1,717,568,580 | | | | 1,900,123,807 | |
| | | | | | | | |
End of period | | $ | 1,677,417,606 | | | $ | 1,717,568,580 | |
| | | | | | | | |
Undistributed net investment income | | | | | | | | |
End of period | | $ | 19,194,468 | | | $ | 26,447,410 | |
| | | | | | | | |
Other Information:
Capital Shares
Transactions in capital shares were as follows:
| | | | | | | | | | | | | | | | |
| | | Six Months Ended
June 30, 2016
(Unaudited) | | | Year Ended
December 31, 2015 | |
| | | Shares | | | Value | | | Shares | | | Value | |
Class A | | | | | | | | | | | | | | | | |
Sales | | | 1,430,375 | | | $ | 12,850,302 | | | | 1,684,311 | | | $ | 16,946,244 | |
Reinvestments | | | 2,355,791 | | | | 22,026,648 | | | | 2,308,052 | | | | 24,534,596 | |
Redemptions | | | (4,413,382 | ) | | | (42,810,122 | ) | | | (11,712,040 | ) | | | (125,786,552 | ) |
| | | | | | | | | | | | | | | | |
Net decrease | | | (627,216 | ) | | $ | (7,933,172 | ) | | | (7,719,677 | ) | | $ | (84,305,712 | ) |
| | | | | | | | | | | | | | | | |
Class B | | | | | | | | | | | | | | | | |
Sales | | | 931,271 | | | $ | 8,342,206 | | | | 1,943,249 | | | $ | 19,197,690 | |
Reinvestments | | | 488,345 | | | | 4,502,541 | | | | 505,945 | | | | 5,302,305 | |
Redemptions | | | (2,297,352 | ) | | | (21,609,985 | ) | | | (6,369,573 | ) | | | (65,246,092 | ) |
| | | | | | | | | | | | | | | | |
Net decrease | | | (877,736 | ) | | $ | (8,765,238 | ) | | | (3,920,379 | ) | | $ | (40,746,097 | ) |
| | | | | | | | | | | | | | | | |
Class E | | | | | | | | | | | | | | | | |
Sales | | | 26,300 | | | $ | 247,964 | | | | 93,807 | | | $ | 933,987 | |
Reinvestments | | | 29,899 | | | | 277,159 | | | | 32,126 | | | | 338,291 | |
Redemptions | | | (143,057 | ) | | | (1,345,145 | ) | | | (359,665 | ) | | | (3,680,647 | ) |
| | | | | | | | | | | | | | | | |
Net decrease | | | (86,858 | ) | | $ | (820,022 | ) | | | (233,732 | ) | | $ | (2,408,369 | ) |
| | | | | | | | | | | | | | | | |
Decrease derived from capital shares transactions | | | | | | $ | (17,518,432 | ) | | | | | | $ | (127,460,178 | ) |
| | | | | | | | | | | | | | | | |
See accompanying notes to financial statements.
MSF-9
Metropolitan Series Fund
Baillie Gifford International Stock Portfolio
Financial Highlights
| | | | | | | | | | | | | | | | | | | | | | | | |
| Selected per share data | | | | | | | | | | | | | | | | | | |
| | | Class A | |
| | | Six Months
Ended
June 30,
2016
(Unaudited) | | | Year Ended December 31, | |
| | | | 2015 | | | 2014 | | | 2013 | | | 2012 | | | 2011 | |
Net Asset Value, Beginning of Period | | $ | 9.71 | | | $ | 10.07 | | | $ | 10.54 | | | $ | 9.28 | | | $ | 7.87 | | | $ | 9.98 | |
| | | | | | | | | | | | | | | | | | | | | | | | |
Income (Loss) from Investment Operations | | | | | | | | | | | | | | | | | | | | | | | | |
Net investment income (a) | | | 0.11 | | | | 0.16 | | | | 0.16 | | | | 0.16 | | | | 0.16 | | | | 0.10 | |
Net realized and unrealized gain (loss) on investments | | | (0.09 | ) | | | (0.34 | ) | | | (0.48 | ) | | | 1.26 | | | | 1.37 | | | | (2.04 | ) |
| | | | | | | | | | | | | | | | | | | | | | | | |
Total from investment operations | | | 0.02 | | | | (0.18 | ) | | | (0.32 | ) | | | 1.42 | | | | 1.53 | | | | (1.94 | ) |
| | | | | | | | | | | | | | | | | | | | | | | | |
Less Distributions | | | | | | | | | | | | | | | | | | | | | | | | |
Distributions from net investment income | | | (0.16 | ) | | | (0.18 | ) | | | (0.15 | ) | | | (0.16 | ) | | | (0.12 | ) | | | (0.17 | ) |
| | | | | | | | | | | | | | | | | | | | | | | | |
Total distributions | | | (0.16 | ) | | | (0.18 | ) | | | (0.15 | ) | | | (0.16 | ) | | | (0.12 | ) | | | (0.17 | ) |
| | | | | | | | | | | | | | | | | | | | | | | | |
Net Asset Value, End of Period | | $ | 9.57 | | | $ | 9.71 | | | $ | 10.07 | | | $ | 10.54 | | | $ | 9.28 | | | $ | 7.87 | |
| | | | | | | | | | | | | | | | | | | | | | | | |
Total Return (%) (b) | | | 0.24 | (c) | | | (1.97 | ) | | | (3.10 | ) | | | 15.54 | | | | 19.52 | | | | (19.87 | ) |
| | | | | | |
Ratios/Supplemental Data | | | | | | | | | | | | | | | | | | | | | | | | |
Gross ratio of expenses to average net assets (%) | | | 0.85 | (d) | | | 0.87 | | | | 0.87 | | | | 0.87 | | | | 0.91 | | | | 0.95 | |
Net ratio of expenses to average net assets (%) (e) | | | 0.73 | (d) | | | 0.74 | | | | 0.75 | | | | 0.77 | | | | 0.81 | | | | 0.90 | |
Ratio of net investment income to average net assets (%) | | | 2.42 | (d) | | | 1.56 | | | | 1.58 | | | | 1.70 | | | | 1.83 | | | | 1.06 | |
Portfolio turnover rate (%) | | | 5 | (c) | | | 12 | | | | 8 | | | | 19 | | | | 62 | | | | 96 | |
Net assets, end of period (in millions) | | $ | 1,335.6 | | | $ | 1,361.8 | | | $ | 1,490.0 | | | $ | 1,680.7 | | | $ | 1,476.3 | | | $ | 623.9 | |
| |
| | | Class B | |
| | | Six Months
Ended
June 30,
2016
(Unaudited) | | | Year Ended December 31, | |
| | | | 2015 | | | 2014 | | | 2013 | | | 2012 | | | 2011 | |
Net Asset Value, Beginning of Period | | $ | 9.56 | | | $ | 9.91 | | | $ | 10.38 | | | $ | 9.15 | | | $ | 7.75 | | | $ | 9.84 | |
| | | | | | | | | | | | | | | | | | | | | | | | |
Income (Loss) from Investment Operations | | | | | | | | | | | | | | | | | | | | | | | | |
Net investment income (a) | | | 0.10 | | | | 0.13 | | | | 0.14 | | | | 0.13 | (f) | | | 0.14 | | | | 0.08 | |
Net realized and unrealized gain (loss) on investments | | | (0.10 | ) | | | (0.33 | ) | | | (0.48 | ) | | | 1.23 | | | | 1.35 | | | | (2.03 | ) |
| | | | | | | | | | | | | | | | | | | | | | | | |
Total from investment operations | | | 0.00 | | | | (0.20 | ) | | | (0.34 | ) | | | 1.36 | | | | 1.49 | | | | (1.95 | ) |
| | | | | | | | | | | | | | | | | | | | | | | | |
Less Distributions | | | | | | | | | | | | | | | | | | | | | | | | |
Distributions from net investment income | | | (0.13 | ) | | | (0.15 | ) | | | (0.13 | ) | | | (0.13 | ) | | | (0.09 | ) | | | (0.14 | ) |
| | | | | | | | | | | | | | | | | | | | | | | | |
Total distributions | | | (0.13 | ) | | | (0.15 | ) | | | (0.13 | ) | | | (0.13 | ) | | | (0.09 | ) | | | (0.14 | ) |
| | | | | | | | | | | | | | | | | | | | | | | | |
Net Asset Value, End of Period | | $ | 9.43 | | | $ | 9.56 | | | $ | 9.91 | | | $ | 10.38 | | | $ | 9.15 | | | $ | 7.75 | |
| | | | | | | | | | | | | | | | | | | | | | | | |
Total Return (%) (b) | | | 0.06 | (c) | | | (2.17 | ) | | | (3.34 | ) | | | 15.14 | | | | 19.37 | | | | (20.13 | ) |
| | | | | | |
Ratios/Supplemental Data | | | | | | | | | | | | | | | | | | | | | | | | |
Gross ratio of expenses to average net assets (%) | | | 1.10 | (d) | | | 1.12 | | | | 1.12 | | | | 1.13 | | | | 1.16 | | | | 1.20 | |
Net ratio of expenses to average net assets (%) (e) | | | 0.98 | (d) | | | 0.99 | | | | 1.00 | | | | 1.03 | | | | 1.06 | | | | 1.15 | |
Ratio of net investment income to average net assets (%) | | | 2.17 | (d) | | | 1.31 | | | | 1.32 | | | | 1.34 | (f) | | | 1.68 | | | | 0.87 | |
Portfolio turnover rate (%) | | | 5 | (c) | | | 12 | | | | 8 | | | | 19 | | | | 62 | | | | 96 | |
Net assets, end of period (in millions) | | $ | 323.2 | | | $ | 336.0 | | | $ | 387.3 | | | $ | 434.8 | | | $ | 97.8 | | | $ | 89.5 | |
Please see following page for Financial Highlights footnote legend.
See accompanying notes to financial statements.
MSF-10
Metropolitan Series Fund
Baillie Gifford International Stock Portfolio
Financial Highlights
| | | | | | | | | | | | | | | | | | | | | | | | |
| Selected per share data | | | | | | | | | | | | | | | | | | |
| | | Class E | |
| | | Six Months
Ended
June 30,
2016
(Unaudited) | | | Year Ended December 31, | |
| | | | 2015 | | | 2014 | | | 2013 | | | 2012 | | | 2011 | |
Net Asset Value, Beginning of Period | | $ | 9.61 | | | $ | 9.97 | | | $ | 10.43 | | | $ | 9.19 | | | $ | 7.79 | | | $ | 9.88 | |
| | | | | | | | | | | | | | | | | | | | | | | | |
Income (Loss) from Investment Operations | | | | | | | | | | | | | | | | | | | | | | | | |
Net investment income (a) | | | 0.11 | | | | 0.14 | | | | 0.15 | | | | 0.15 | | | | 0.15 | | | | 0.09 | |
Net realized and unrealized gain (loss) on investments | | | (0.10 | ) | | | (0.34 | ) | | | (0.48 | ) | | | 1.23 | | | | 1.35 | | | | (2.03 | ) |
| | | | | | | | | | | | | | | | | | | | | | | | |
Total from investment operations | | | 0.01 | | | | (0.20 | ) | | | (0.33 | ) | | | 1.38 | | | | 1.50 | | | | (1.94 | ) |
| | | | | | | | | | | | | | | | | | | | | | | | |
Less Distributions | | | | | | | | | | | | | | | | | | | | | | | | |
Distributions from net investment income | | | (0.14 | ) | | | (0.16 | ) | | | (0.13 | ) | | | (0.14 | ) | | | (0.10 | ) | | | (0.15 | ) |
| | | | | | | | | | | | | | | | | | | | | | | | |
Total distributions | | | (0.14 | ) | | | (0.16 | ) | | | (0.13 | ) | | | (0.14 | ) | | | (0.10 | ) | | | (0.15 | ) |
| | | | | | | | | | | | | | | | | | | | | | | | |
Net Asset Value, End of Period | | $ | 9.48 | | | $ | 9.61 | | | $ | 9.97 | | | $ | 10.43 | | | $ | 9.19 | | | $ | 7.79 | |
| | | | | | | | | | | | | | | | | | | | | | | | |
Total Return (%) (b) | | | 0.17 | (c) | | | (2.15 | ) | | | (3.19 | ) | | | 15.30 | | | | 19.39 | | | | (19.98 | ) |
| | | | | | |
Ratios/Supplemental Data | | | | | | | | | | | | | | | | | | | | | | | | |
Gross ratio of expenses to average net assets (%) | | | 1.00 | (d) | | | 1.02 | | | | 1.02 | | | | 1.02 | | | | 1.06 | | | | 1.10 | |
Net ratio of expenses to average net assets (%) (e) | | | 0.88 | (d) | | | 0.89 | | | | 0.90 | | | | 0.92 | | | | 0.96 | | | | 1.05 | |
Ratio of net investment income to average net assets (%) | | | 2.26 | (d) | | | 1.42 | | | | 1.43 | | | | 1.56 | | | | 1.79 | | | | 0.97 | |
Portfolio turnover rate (%) | | | 5 | (c) | | | 12 | | | | 8 | | | | 19 | | | | 62 | | | | 96 | |
Net assets, end of period (in millions) | | $ | 18.7 | | | $ | 19.8 | | | $ | 22.8 | | | $ | 26.8 | | | $ | 26.9 | | | $ | 25.0 | |
| (a) | Per share amounts based on average shares outstanding during the period. |
| (b) | Total return does not reflect any insurance, sales, separate account or administrative charges of variable annuity or life insurance contracts or any additional expenses that contract owners may bear under their variable contracts. If these charges were included, the returns would be lower. |
| (c) | Periods less than one year are not computed on an annualized basis. |
| (d) | Computed on an annualized basis. |
| (e) | Includes the effects of management fee waivers (see Note 5 of the Notes to Financial Statements). |
| (f) | Net investment income per share and the ratio of net investment income to average net assets for Class B during 2013 were impacted by the timing of dividends received from the Portfolio’s investments and the assets received through a merger with the Met Investors Series Trust American Funds International Portfolio. |
See accompanying notes to financial statements.
MSF-11
Metropolitan Series Fund
Baillie Gifford International Stock Portfolio
Notes to Financial Statements—June 30, 2016 (Unaudited)
1. Organization
Metropolitan Series Fund (the “Trust”) is organized as a Delaware statutory trust and registered under the Investment Company Act of 1940, as amended (the “1940 Act”), as an open-end management investment company. The Trust, which is managed by MetLife Advisers, LLC (“MetLife Advisers” or the “Adviser”), an affiliate of MetLife, Inc., is currently comprised of thirty series, each of which operates as a distinct investment vehicle of the Trust. The portfolio included in this report is Baillie Gifford International Stock Portfolio (the “Portfolio”), which is diversified. Shares in the Portfolio are not offered directly to the general public and are currently available only to separate accounts established by Metropolitan Life Insurance Company (“MetLife”) and other affiliated life insurance companies.
The Portfolio has registered and offers three classes of shares: Class A, B and E shares. Shares of each Class of the Portfolio represent an equal pro rata interest in the Portfolio and generally give the shareholder the same voting, dividend, liquidation, and other rights. Investment income, realized and unrealized capital gains and losses, the common expenses of the Portfolio, and certain Portfolio-level expense reductions, if any, are allocated on a pro rata basis to each Class based on the relative net assets of each Class to the net assets of the Portfolio. Each Class of shares differs in its respective distribution plan and such distribution expenses are allocated to the corresponding Class of shares.
2. Significant Accounting Policies
The preparation of financial statements in conformity with accounting principles generally accepted in the United States of America (“GAAP”) requires management to make estimates and assumptions that affect the reported amounts of assets and liabilities and disclosure of contingent assets and liabilities as of the date of the financial statements and the reported amounts of income and expenses during the reporting period. Actual results could differ from those estimates. In the preparation of these financial statements, management has evaluated events and transactions subsequent to June 30, 2016 through the date the financial statements were issued.
The Portfolio is an investment company and follows the accounting and reporting guidance of the Financial Accounting Standards Board (“FASB”) Accounting Standards Codification Topic 946—Financial Services—Investment Companies and Topic 820—Fair Value Measurement. The following is a summary of significant accounting policies consistently followed by the Portfolio in the preparation of its financial statements.
Investment Valuation and Fair Value Measurements - Domestic and foreign equity securities, such as common stock, exchange-traded funds, rights, warrants, and preferred stock, that are traded on a securities exchange on a valuation date are generally valued at their last quoted sale price or official closing price on the primary exchange for such security, or, if no sales occurred on that day, at the last reported bid price. Equity securities traded over-the-counter (“OTC”) are generally valued at the last reported bid price. In the event of a major exchange closing during the trading day, the Adviser may use other market information obtained from quotation reporting systems, established market makers, or pricing services in valuing the securities. Valuation adjustments may be applied to certain foreign equity securities that are traded solely on foreign exchanges that close before the time as of which the Portfolio determines its NAV to account for the market movement between the close of the foreign exchanges and the time as of which the Portfolio determines its NAV. The Portfolio may use a systematic fair valuation model provided by a pricing service to value securities principally traded in these foreign markets in order to adjust for possible market movements or other changes that may occur between the close of the foreign exchanges and the time as of which the Portfolio determines its NAV. Foreign equity securities valued using these valuation adjustments are generally categorized as Level 2 within the fair value hierarchy. Equity securities that are actively traded, and have no valuation adjustments applied, are categorized as Level 1 within the fair value hierarchy. Other equity securities traded on inactive markets, or valued in reference to similar instruments traded on active markets, are generally categorized as Level 2 within the fair value hierarchy.
Investments in registered open-end management investment companies are valued at reported net asset value per share on the valuation date and are categorized as Level 1 within the fair value hierarchy.
Debt securities, including corporate, convertible and municipal bonds and notes; obligations of the U.S. Treasury and U.S. government agencies; foreign sovereign issues; and non-U.S. bonds, are generally valued on the basis of evaluated or composite bid quotations obtained from independent pricing services and/or brokers and dealers selected by the Adviser (each a “pricing service”), pursuant to authorization of and subject to general oversight by the Board of Trustees of the Trust (the “Board” or “Trustees”). Such pricing services may use matrix pricing, which considers observable inputs including, among other things, issuer details, maturity dates, interest rates, yield curves, rates of prepayment, credit risks/spreads, default rates, reported trades, broker dealer quotes and quoted prices for similar assets. Short-term obligations with a remaining maturity of sixty days or less may be valued at amortized cost in the absence of market quotes, so long as the amortized cost value of such short-term debt instrument is approximately the same as the fair value of the instrument as determined without the use of amortized cost valuation. Floating rate loans are generally valued on the
MSF-12
Metropolitan Series Fund
Baillie Gifford International Stock Portfolio
Notes to Financial Statements—June 30, 2016—(Continued)
basis of an evaluated or composite average of aggregate bid and ask quotations supplied by brokers or dealers, as obtained from the pricing service. Securities that use similar valuation techniques and inputs as described above are generally categorized as Level 2 within the fair value hierarchy.
Foreign currency forward contracts are valued through an independent pricing service by interpolating between forward and spot currency rates in the London foreign exchange markets as of a designated hour on a valuation day. These contracts are generally categorized as Level 2 within the fair value hierarchy.
Options, whether on securities, indices, futures contracts, or otherwise, traded on exchanges are valued at the last sale price available as of the close of business on a valuation day or, if there is no such price available, at the last reported bid price. These types of options are categorized as Level 1 within the fair value hierarchy. Futures contracts that are traded on commodity exchanges are valued at their settlement prices established by the exchanges on which they are traded as of the close of such exchanges and are categorized as Level 1 within the fair value hierarchy.
Options, including swaptions, and futures contracts that are traded OTC are generally valued on the basis of interdealer bid and asked prices or prices provided by pricing service providers who use a series of techniques, including simulation pricing models, to determine the value of the contracts. The pricing models use inputs that are observed from actively quoted markets such as issuer details, indices, spreads, interest rates, yield curves, credit curves, measures of volatility and exchange rates. These contracts are generally categorized as Level 2 within the fair value hierarchy.
If no current market value quotation or other observable inputs are readily available or market value quotations are deemed to be unreliable for an investment, the fair value of the investment will be determined in accordance with procedures approved by, and under the general supervision of, the Board. In such a circumstance, the Board will be assisted in its responsibility to determine the fair value of an investment by the Valuation Committee (“Committee”) of MetLife Advisers. The Committee provides general pricing oversight and fair value pricing determinations related to portfolio securities and meets on a regular basis to review reports relating to the valuation of the securities in the Portfolio. The Board has delegated to State Street Bank and Trust Company, the Trust’s custodian (“custodian”), the responsibility for calculating the net asset values (“NAVs”) of the Trust’s Portfolios. The Committee is responsible for overseeing the calculation of the NAVs of the Portfolios by the custodian. The Committee also periodically reviews pricing services, including the pricing services providing fair value pricing for the Portfolio’s foreign securities, and is responsible for overseeing the correction of pricing errors and addressing other pricing issues that arise in the ordinary course of business, such as making real-time fair value determinations, as necessary.
No single standard for determining the fair value of an investment can be set forth because fair value depends upon the facts and circumstances with respect to each investment. Information relating to any relevant factors may be obtained by the Committee from any appropriate source, including the subadviser of the Portfolio, the custodian, a pricing service, market maker and/or broker for such security or the issuer. Appropriate methodologies for determining fair value under particular circumstances may include: matrix pricing, a discounted cash flow analysis, comparisons of securities with comparable characteristics, value based on multiples of earnings, discount from market price of similar marketable securities or a combination of these and other methods.
Investment Transactions and Related Investment Income - Portfolio security transactions are recorded on the trade date. Dividend income is recorded on the ex-dividend date or, for certain foreign securities, when notified. Interest income, which includes amortization of premium and accretion of discount on debt securities, is recorded on the accrual basis. Realized gains and losses on investments are determined on the identified cost basis, which is the same basis used for federal income tax purposes. Foreign income and foreign capital gains on some foreign securities may be subject to foreign taxes, which are accrued as applicable. These foreign taxes have been provided for in accordance with the Portfolio’s understanding of the applicable countries’ tax rules and rates.
Foreign Currency Translation - The books and records of the Portfolio are maintained in U.S. dollars. The values of securities, currencies, and other assets and liabilities denominated in currencies other than the U.S. dollar are translated into U.S. dollars based upon foreign exchange rates prevailing at the end of the period. Purchases and sales of investment securities, income, and expenses are translated on the respective dates of such transactions. Because the values of investment securities are translated at the foreign exchange rates prevailing at the end of the period, that portion of the results of operations arising from changes in exchange rates and that portion of the results of operations reflecting fluctuations arising from changes in market prices of the investment securities are not separated. Such fluctuations are included in the net realized and unrealized gain or loss on investments.
Net realized foreign exchange gains or losses arise from activity in forward foreign currency exchange contracts, sales of foreign currency, currency gains or losses realized between the trade and settlement dates on securities transactions, and the difference between the amounts of dividends, interest, and foreign withholding taxes recorded by the Portfolio and the U.S. dollar equivalent of the amounts actually received or paid by the Portfolio. Net unrealized foreign exchange gains and losses arise from changes in the value of assets and liabilities, other than investment securities, resulting from changes in foreign exchange rates.
MSF-13
Metropolitan Series Fund
Baillie Gifford International Stock Portfolio
Notes to Financial Statements—June 30, 2016—(Continued)
Dividends and Distributions to Shareholders - The Portfolio records dividends and distributions on the ex-dividend date. Net realized gains from securities transactions (if any) are generally distributed annually to shareholders. The timing and characterization of certain income and capital gains distributions are determined in accordance with federal tax regulations that may differ from GAAP. Permanent book and tax basis differences relating to shareholder distributions will result in reclassification between under/over distributed net investment income, accumulated net realized gains/losses, and paid-in surplus. Book-tax differences are primarily due to foreign currency transactions, broker commission recapture and passive foreign investment companies (PFICs). These adjustments have no impact on net assets or the results of operations.
Income Taxes - It is the Portfolio’s policy to comply with the requirements of the Internal Revenue Code of 1986, as amended, and regulations thereunder, applicable to regulated investment companies and to distribute, with respect to each taxable year, all of its taxable income to shareholders. Therefore, no federal income tax provision is required. The Portfolio files U.S. federal tax returns. No income tax returns are currently under examination. The Portfolio’s federal tax returns for the prior three fiscal years remain subject to examination by the Internal Revenue Service. As of June 30, 2016, the Portfolio had no uncertain tax positions that would require financial statement recognition, or de-recognition or disclosure.
Directed Brokerage Agreement - The Trust has entered into a directed brokerage arrangement with State Street Global Markets (“SSGM”). Under this arrangement, the Portfolio directs certain trades to SSGM in return for a recapture credit. SSGM issues a cash rebate to the Portfolio. Amounts paid to the Portfolio are shown separately as broker commission recapture on the Statement of Operations of the Portfolio. Additionally, these amounts have been excluded from the calculation of the net ratio of expenses to average net assets presented in the Financial Highlights for each share class.
Repurchase Agreements - The Portfolio may enter into repurchase agreements, under the terms of a Master Repurchase Agreement (“MRA”), with selected commercial banks and broker-dealers, under which the Portfolio acquires securities as collateral and agrees to resell the securities at an agreed-upon time and at an agreed-upon price. The Portfolio, through the custodian or a subcustodian, under a tri-party repurchase agreement, receives delivery of the underlying securities collateralizing any repurchase agreements. It is the Portfolio’s policy that the market value of the collateral be equal to at least 100% of the repurchase price in the case of a repurchase agreement of one-day duration and equal to at least 102% of the repurchase price in the case of all other repurchase agreements. In the event of default or failure by a party to perform an obligation in connection with any repurchase transaction, the MRA gives the non-defaulting party the right to set-off claims and to apply property held by it in connection with any repurchase transaction against obligations owed to it.
At June 30, 2016, the Portfolio had investments in repurchase agreements with a gross value of $14,704,707, which is included as part of investments at value on the Statement of Assets and Liabilities. The value of the related collateral exceeded the value of the repurchase agreements at June 30, 2016.
Securities Lending - The Portfolio may lend its portfolio securities to certain qualified brokers who borrow securities in order to complete certain securities transactions. By lending its portfolio securities, the Portfolio attempts to increase its net investment income through the receipt of income on collateral held from securities on loan. Any gain or loss in the market price of the loaned securities that might occur and any interest earned or dividends declared during the term of the loan would accrue to the account of the Portfolio.
The Trust has entered into a Securities Lending Authorization Agreement with the custodian as the lending agent. Under this agreement, the custodian is authorized to loan portfolio securities on the Portfolio’s behalf. In exchange, the Portfolio receives either cash or securities as collateral against the loaned securities. The Portfolio receives collateral equal to at least 102% of the market value of the loaned securities (105% for foreign equity securities), at each loan’s inception. Collateral representing at least 100% of the market value of the loaned securities must be maintained for the duration of the loan. Cash collateral is generally invested in the State Street Navigator Securities Lending MET Portfolio (the “Navigator Portfolio”), a series of the State Street Navigator Securities Lending Trust that is managed by an affiliate of the custodian. The Navigator Portfolio is a registered money market fund that invests in a variety of high-quality, U.S. dollar-denominated instruments. If the market value of the collateral at the close of trading on a business day is less than 100% of the market value of the loaned securities at the close of trading on that day, the borrower shall be required to deliver, by the close of business on the following business day, an additional amount of collateral, so that the total amount of posted collateral is equal to at least 100% of the market value of all the loaned securities as of such preceding day. A portion of net income (income after the deduction of expenses and fees of the Navigator Portfolio) on the collateral is rebated to the borrower of the securities and the remainder is split between the custodian and the Portfolio. On loans collateralized by U.S. Treasuries, a fee is received from the borrower and is allocated between the Portfolio and the custodian. Income received by the Portfolio in securities lending transactions during the six months ended June 30, 2016 is reflected as Securities lending income on the Statement of Operations. The values of any securities loaned by the Portfolio and the related collateral at June 30, 2016 are disclosed in the footnotes to the Schedule of Investments. The value of the related collateral received by the Portfolio exceeded the value of the securities out on loan at June 30, 2016.
MSF-14
Metropolitan Series Fund
Baillie Gifford International Stock Portfolio
Notes to Financial Statements—June 30, 2016—(Continued)
The risks associated with lending portfolio securities include, but are not limited to, possible delays in receiving additional collateral or in the recovery of the loaned securities, possible loss of rights in the collateral should the borrower fail financially, as well as risk of loss in the value of the collateral or the value of the investments made with the collateral. The lending agent shall indemnify the Portfolio in the case of default of any securities borrower.
All securities on loan are classified as Common Stocks in the Portfolio’s Schedule of Investments as of June 30, 2016, with a contractual maturity of overnight and continuous.
3. Certain Risks
In the normal course of business, the Portfolio invests in securities and enters into transactions where risks exist due to fluctuations in the market (“market risk”) or failure of the other party to a transaction to perform (“credit and counterparty risk”).
Market Risk: The value of securities held by the Portfolio may decline in response to certain events, including those directly involving the companies whose securities are owned by the Portfolio; conditions affecting the general economy; overall market changes; local, regional or global political, social or economic instability; and currency, interest rate, and price fluctuations.
Credit and Counterparty Risk: The Portfolio may be exposed to counterparty risk, or the risk that an entity with which the Portfolio has unsettled or open transactions may default. The potential loss could exceed the value of the financial assets and liabilities recorded in the financial statements. Financial assets that potentially expose the Portfolio to credit and counterparty risk consist principally of cash due from counterparties and investments. The Portfolio manages counterparty risk by entering into agreements only with counterparties that it believes have the financial resources to honor their obligations and by monitoring the financial stability of those counterparties. The Portfolio’s investment adviser attempts to mitigate counterparty risk by (i) periodically assessing the creditworthiness of its trading partners, (ii) monitoring and/or limiting the amount of its net exposure to each individual counterparty based on its assessment, and (iii) requiring collateral from the counterparty for certain transactions. In order to preserve certain safeguards for non-standard settlement trades, the Portfolio restricts its exposure to credit and counterparty losses by entering into master netting agreements (“Master Agreements”) with counterparties (approved brokers) with whom it undertakes a significant volume of transactions. Master Agreements govern the terms of certain transactions, and reduce the counterparty risk associated with relevant transactions by specifying credit protection mechanisms and providing standardization that improves legal certainty. Master Agreements can also help limit counterparty risk by specifying collateral posting arrangements at pre-arranged exposure levels.
Repurchase and reverse repurchase agreements are primarily executed under Global Master Repurchase Agreements (“GMRAs”) or Master Repurchase Agreements (“MRAs”), which provide the rights to set-off. Each repurchase and reverse repurchase agreement is initially collateralized at the transaction level. In the event of default, the total market value exposure will be offset against collateral exchanged to date, which would result in a net receivable/(payable) that would be due from/to the counterparty.
Foreign Investment Risk: The investments by the Portfolio in foreign securities may involve risks not present in domestic investments. Because securities may be denominated in foreign currencies, may require settlement in foreign currencies and may pay interest or dividends in foreign currencies, changes in the relationship of these foreign currencies to the U.S. dollar can significantly affect the value of the investments and earnings of the Portfolio. Foreign investments may also subject the Portfolio to foreign government exchange restrictions, expropriation, taxation or other political, social or economic developments, all of which could affect the market and/or credit risk of the investments. In addition to the risks described above, risks may arise from forward foreign currency contracts with respect to the potential inability of counterparties to meet the terms of their contracts.
Additional risks associated with each type of investment are described above within the respective security type notes. The Portfolio’s prospectus includes a discussion of the principal risks of investing in the Portfolio.
4. Investment Transactions
Aggregate cost of purchases and proceeds of sales of investment securities, excluding short-term securities, for the six months ended June 30, 2016 were as follows:
| | | | | | | | | | | | |
Purchases | | | Sales | |
U.S. Government | | Non U.S. Government | | | U.S. Government | | | Non U.S. Government | |
| $0 | | $ | 86,752,495 | | | $ | 0 | | | $ | 111,423,982 | |
MSF-15
Metropolitan Series Fund
Baillie Gifford International Stock Portfolio
Notes to Financial Statements—June 30, 2016—(Continued)
5. Investment Management Fees and Other Transactions with Affiliates
Investment Management Agreement - MetLife Advisers is the investment adviser to the Portfolio. The Trust has entered into an investment management agreement with MetLife Advisers with respect to the Portfolio. For providing investment management services to the Portfolio, MetLife Advisers receives monthly compensation at the following annual rates:
| | | | | | |
Management
Fees earned by
MetLife Advisers
for the six months ended
June 30, 2016 | | % per annum | | | Average Daily Net Assets |
| $6,583,586 | | | 0.860 | % | | Of the first $500 million |
| | | 0.800 | % | | Of the next $500 million |
| | | 0.750 | % | | On amounts in excess of $1 billion |
MetLife Advisers has entered into an investment subadvisory agreement with respect to managing the Portfolio. Baillie Gifford Overseas Limited is compensated by MetLife Advisers to provide subadvisory services for the Portfolio.
Management Fee Waivers - Pursuant to an expense agreement, MetLife Advisers has agreed, for the period May 1, 2016 to April 30, 2017, to reduce its advisory fees set out above under “Investment Management Agreement” for each class of the Portfolio as follows:
| | | | |
| % per annum reduction | | | Average Daily Net Assets |
| | 0.080 | % | | On amounts over $156.25 million and under $400 million |
| | 0.180 | % | | Of the next $100 million |
| | 0.120 | % | | Of the next to $400 million |
| | 0.150 | % | | On amounts in excess of $900 million |
An identical expense agreement was in place for the period May 1, 2015 to April 30, 2016. Amounts waived for the six months ended June 30, 2016 are shown as management fee waivers in the Statement of Operations.
Certain officers and trustees of the Trust may also be officers of MetLife Advisers; however, such officers and trustees receive no compensation from the Trust.
On January 12, 2016, MetLife, Inc. announced its plan to pursue the separation of a substantial portion of its retail segment and is currently evaluating structural alternatives for such separation. It is anticipated that MetLife Advisers would be included in any such separation. Any separation transaction that might occur will be subject to the satisfaction of various conditions and approvals, including approval of any transaction by the MetLife, Inc. Board of Directors, satisfaction of any applicable requirements of the SEC, and receipt of insurance and other regulatory approvals and other anticipated conditions. Because the form of a separation had yet to be determined, MetLife, Inc. cannot currently provide a specific potential completion date or information about the potential impact on MetLife Advisers. No assurance can be given regarding the form that a separation transaction may take or the specific terms thereof, or that a separation will in fact occur. Depending on the form a separation takes, MetLife Advisers’ continued service as investment adviser to the Trusts could be subject to the satisfaction of various conditions and approvals, which may include obtaining approvals from the Trusts’ Board and shareholders.
Transfer Agency Agreement - MetLife serves as the transfer agent for the Trust. MetLife receives no fees for its services to the Trust under the transfer agency agreement.
Distribution and Service Fees - The Trust has a distribution agreement with MetLife Investors Distribution Company (“MIDC” or the “Distributor”) in which MIDC serves as the distributor for the Portfolio’s Class A, B and E Shares. MIDC is a wholly-owned subsidiary of MetLife Investors Group, LLC, an affiliate of the Adviser. The Trust has also adopted a Distribution and Service Plan under Rule 12b-1 of the 1940 Act for the Portfolio’s Class B and E Shares. Under the Distribution and Service Plan, the Class B and E Shares of the Portfolio pay a fee to compensate the Insurance Companies (or their affiliates) and other broker-dealers and financial intermediaries involved in the offer and sale of Portfolio shares for promoting or selling and servicing the Class B and E Shares. The fees under the Distribution and Service Plan for each class of the Portfolio’s shares are calculated as a percentage of the Portfolio’s average daily net assets that are attributable to that Class. Currently, the fee is 0.25% per year for Class B Shares and 0.15% per year for Class E Shares. Amounts incurred by the Portfolio for the six months ended June 30, 2016 are shown as Distribution and service fees in the Statement of Operations.
Deferred Trustee Compensation - Each Trustee who is not currently an employee of the Adviser or any of its affiliates receives compensation from the Trust for his or her service to the Trust. A deferred compensation plan (the “Plan”) is available to the Trustees on a voluntary basis. Deferred amounts remain in the Trust until distributed in accordance with the provisions of the Plan. The value of a participating Trustee’s deferral account is based on theoretical investments of deferred amounts on the normal payment dates in certain portfolios of the Trust or Met Investors Series Trust, an affiliate of the Trust, as designated by the participating Trustee.
MSF-16
Metropolitan Series Fund
Baillie Gifford International Stock Portfolio
Notes to Financial Statements—June 30, 2016—(Continued)
Changes in the value of participants’ deferral accounts are reflected as Trustees’ fees and expenses in the Statement of Operations. The portion of the accrued obligations allocated to the Portfolio under the Plan is reflected as Deferred trustees’ fees in the Statement of Assets and Liabilities.
6. Contractual Obligations
Under the Trust’s organizational documents, its officers and Trustees may be indemnified against certain liabilities and expenses arising out of the performance of their duties to the Trust. Additionally, the Trust has a variety of indemnification obligations under contracts with its service providers. The Trust’s maximum exposure under these arrangements is unknown, as this would involve future claims that may be made against the Trust that have not yet occurred.
7. Income Tax Information
The tax character of distributions paid for the years ended December 31, 2015 and 2014 were as follows:
| | | | | | | | | | | | | | | | | | | | |
Ordinary Income | | | Long-Term Capital Gain | | | Total | |
2015 | | 2014 | | | 2015 | | | 2014 | | | 2015 | | | 2014 | |
| $30,175,192 | | $ | 28,583,790 | | | $ | — | | | $ | — | | | $ | 30,175,192 | | | $ | 28,583,790 | |
As of December 31, 2015, the components of distributable earnings (accumulated losses) on a federal income tax basis were as follows:
| | | | | | | | | | | | | | | | | | | | |
Undistributed
Ordinary
Income | | Undistributed
Long-Term
Capital Gain | | | Net
Unrealized
Appreciation | | | Loss Carryforwards | | | Other
Accumulated
Capital Losses | | | Total | |
| $26,700,656 | | $ | — | | | $ | 177,436,061 | | | $ | (360,395,923 | ) | | $ | — | | | $ | (156,259,206 | ) |
The Portfolio utilizes the provisions of the federal income tax laws that provide for the carryforward of capital losses for prior years, offsetting such losses against any future realized capital gains. Under the Regulated Investment Company Modernization Act of 2010 (the “Act”), net capital losses recognized after December 22, 2010 may be carried forward indefinitely and their character is retained as short-term and/or long-term losses. Previously, net capital losses were carried forward for up to eight years and treated as short-term losses. As a transition rule, the Act requires that post-enactment net capital losses be used before pre-enactment net capital losses.
During the year ended December 31, 2015, the Portfolio utilized capital loss carryforwards of $22,479,628.
As of December 31, 2015, the Portfolio had no post-enactment accumulated capital losses. The pre-enactment accumulated capital loss carryforwards and expiration dates were as follows:
| | | | | | | | |
Expiring
12/31/17 | | Expiring
12/31/16 | | | Total | |
| $169,332,274 | | $ | 191,063,649 | | | $ | 360,395,923 | |
MSF-17
Metropolitan Series Fund
Barclays Aggregate Bond Index Portfolio
Managed by MetLife Investment Advisors, LLC
Portfolio Manager Commentary*
PERFORMANCE
For the six month period ended June 30, 2016, the Class A, B, E and G shares of the Barclays Aggregate Bond Index Portfolio returned 5.17%, 5.02%, 5.02%, and 5.07%, respectively. The Portfolio’s benchmark, the Barclays U.S. Aggregate Bond Index1, returned 5.31%.
MARKET ENVIRONMENT / CONDITIONS
The Federal Open Market Committee (the “Committee”) met four times during the six-month period and held the target range for the federal funds rate at 0.25% to 0.50%, a range set in December 2015. Following their most recent meeting, the Committee noted that the pace of labor market improvement had slowed, and economic activity growth had increased. The Committee stated that it would maintain the program of reinvesting principal payments from its retained Agency debt and Agency Mortgage-Backed Securities (“MBS”) into Agency MBS and would continue rolling over maturing Treasury securities at auction.
The United Kingdom’s vote to leave the European Union and ongoing global economic concerns helped to push Treasury yields down and bolstered the appeal of U.S. Government bonds by the end of the second quarter. By period end, the yield curve flattened (longer term yields fell more than shorter maturity yields) from the 2015 year-end levels. The 2-year Treasury finished at 0.58% (down from 1.05% at year-end), and the 30-year Treasury finished at 2.29% (down from 3.02% at year-end).
Geopolitical uncertainty contributed to crude oil price volatility during the six-month period. After posting a high of approximately $51 per barrel and a low of $26 per barrel, crude oil finished the period at approximately $48 per barrel.
The Corporate sector was the strongest performing Index sector for the six-month period on a total return basis. Total returns for the Index sectors were: 7.68% for Corporate; 5.93% for Commercial Mortgage-Backed Securities (“CMBS”); 5.69% for Government-Related; 5.37% for Treasury; 3.11% for MBS and 2.54% for Asset-Backed Securities (“ABS”).
PORTFOLIO REVIEW / PERIOD END POSITIONING
The Portfolio is managed utilizing a Stratified Sampling approach where the objective is to track the performance of the Index by holding a subset of Index constituents and neutralizing exposures across key characteristics (i.e., duration, term structure, high sector, sub-sector, quality). Factors that impact tracking error include: sampling, transaction costs, contributions and withdrawals.
Stacey Lituchy
Tresa Lau
Brian Leonard
Portfolio Managers
MetLife Investment Advisors, LLC
* This commentary may include statements that constitute “forward-looking statements” under the U.S. securities laws. Forward-looking statements include, among other things, projections, estimates, and information about possible or future results related to the Portfolio, market or regulatory developments. The views expressed above are not guarantees of future performance or economic results and involve certain risks, uncertainties and assumptions that could cause actual outcomes and results to differ materially from the views expressed herein. The views expressed above are subject to change at any time based upon economic, market, or other conditions and the subadvisory firm undertakes no obligation to update the views expressed herein. Any discussions of specific securities should not be considered a recommendation to buy or sell those securities. The views expressed above (including any forward-looking statement) may not be relied upon as investment advice or as an indication of the Portfolio’s trading intent. Information about the Portfolio’s holdings, asset allocation or country diversification is historical and is not an indication of future Portfolio composition, which may vary. Direct investment in any index is not possible. The performance of any index mentioned in this commentary has not been adjusted for ongoing management, distribution and operating expenses, and sales charges applicable to mutual fund investments. In addition, the returns do not reflect additional fees charged by separate accounts or variable insurance contracts that an investor in the Portfolio may pay. If these additional fees were reflected, performance would have been lower.
MSF-1
Metropolitan Series Fund
Barclays Aggregate Bond Index Portfolio
A $10,000 INVESTMENT COMPARED TO THE BARCLAYS U.S. AGGREGATE BOND INDEX
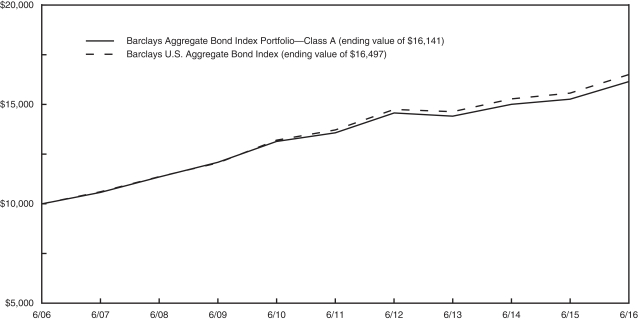
SIX MONTH RETURN & AVERAGE ANNUAL RETURNS (%) AS OF JUNE 30, 2016
| | | | | | | | | | | | | | | | | | | | |
| | | 6 Month | | | 1 Year | | | 5 Year | | | 10 Year | | | Since Inception2 | |
| Barclays Aggregate Bond Index Portfolio | | | | | | | | | | | | | | | | | | | | |
Class A | | | 5.17 | | | | 5.75 | | | | 3.52 | | | | 4.90 | | | | — | |
Class B | | | 5.02 | | | | 5.51 | | | | 3.25 | | | | 4.64 | | | | — | |
Class E | | | 5.02 | | | | 5.51 | | | | 3.35 | | | | 4.74 | | | | — | |
Class G | | | 5.07 | | | | 5.46 | | | | 3.21 | | | | — | | | | 3.96 | |
| Barclays U.S. Aggregate Bond Index | | | 5.31 | | | | 6.00 | | | | 3.76 | | | | 5.13 | | | | — | |
1 Barclays U.S. Aggregate Bond Index is a broad based benchmark that measures the investment grade, U.S. dollar-denominated, fixed-rate taxable bond market, including Treasuries, government-related and corporate securities, mortgage-backed securities, asset-backed securities, and commercial mortgage-backed securities.
2 Inception dates of the Class A, Class B, Class E and Class G shares are 11/9/98,1/2/01, 5/1/01 and 4/28/09, respectively.
Portfolio performance is calculated including reinvestment of all income and capital gain distributions. Performance numbers are net of all Portfolio expenses but do not include any insurance, sales, separate account or administrative charges of variable annuity or life insurance contracts or any additional expenses that participants may bear relating to the operations of their plans. If these charges were included, the returns would be lower. The performance of any index referenced above has not been adjusted for ongoing management, distribution and operating expenses, and sales charges applicable to mutual fund investments. Direct investment in any index is not possible. The performance of Class A shares, as set forth in the line graph above, will differ from that of other classes because of the difference in expenses paid by policyholders investing in the different share classes.
This information represents past performance and is not indicative of future results. Investment return and principal value may fluctuate so that shares, upon redemption, may be worth more or less than the original cost.
PORTFOLIO COMPOSITION AS OF JUNE 30, 2016
Top Sectors
| | | | |
| | | % of
Net Assets | |
| U.S. Treasury & Government Agencies | | | 67.2 | |
| Corporate Bonds & Notes | | | 27.0 | |
| Foreign Government | | | 2.0 | |
| Mortgage-Backed Securities | | | 1.5 | |
| Municipals | | | 0.8 | |
| Asset-Backed Securities | | | 0.5 | |
MSF-2
Metropolitan Series Fund
Barclays Aggregate Bond Index Portfolio
Understanding Your Portfolio’s Expenses (Unaudited)
Shareholder Expense Example
As a shareholder of the Portfolio, you incur ongoing costs, including management fees; distribution and service (12b-1) fees; and other Portfolio expenses. This example is intended to help you understand your ongoing costs (in dollars) (referred to as “expenses”) of investing in the Portfolio and compare these costs with the ongoing costs of investing in other mutual funds. The example is based on an investment of $1,000 invested at the beginning of the period and held for the entire period, January 1, 2016 through June 30, 2016.
Actual Expenses
The first line for each share class of the Portfolio in the table below provides information about actual account values and actual expenses. You may use the information in this line, together with the amount you invested in the particular share class of the Portfolio, to estimate the expenses that you paid over the period. Simply divide your account value by $1,000 (for example, an $8,600 account value divided by $1,000 = 8.6), then multiply the result by the number in the first line under the heading entitled “Expenses Paid During Period” to estimate the expenses you paid on your account during this period.
Hypothetical Example for Comparison Purposes
The second line for each share class of the Portfolio in the table below provides information about hypothetical account values and hypothetical expenses based on the Portfolio’s actual expense ratio and an assumed rate of return of 5% per year before expenses, which is not the Portfolio’s actual return. The hypothetical account values and expenses may not be used to estimate the actual ending account balance or expenses you paid for the period. You may use this information to compare the ongoing costs of investing in the Portfolio and other funds. To do so, compare this 5% hypothetical example with the 5% hypothetical examples that appear in the shareholder reports of the other funds.
Please note that the expenses shown in the table are meant to highlight your ongoing costs only and do not reflect any fees or charges of your variable insurance product or any additional expenses that participants in certain eligible qualified plans may bear relating to the operations of their plan. Therefore, the second line for each share class in the table is useful in comparing ongoing costs only, and will not help you determine the relative total costs of owning different funds. In addition, if these other costs were included, your costs would have been higher.
| | | | | | | | | | | | | | | | | | |
Barclays Aggregate Bond Index Portfolio | | | | Annualized
Expense
Ratio | | | Beginning
Account Value
January 1,
2016 | | | Ending
Account Value
June 30,
2016 | | | Expenses Paid
During Period**
January 1, 2016
to
June 30,
2016 | |
Class A(a) | | Actual | | | 0.27 | % | | $ | 1,000.00 | | | $ | 1,051.70 | | | $ | 1.38 | |
| | Hypothetical* | | | 0.27 | % | | $ | 1,000.00 | | | $ | 1,023.52 | | | $ | 1.36 | |
| | | | | |
Class B(a) | | Actual | | | 0.52 | % | | $ | 1,000.00 | | | $ | 1,050.20 | | | $ | 2.65 | |
| | Hypothetical* | | | 0.52 | % | | $ | 1,000.00 | | | $ | 1,022.28 | | | $ | 2.61 | |
| | | | | |
Class E(a) | | Actual | | | 0.42 | % | | $ | 1,000.00 | | | $ | 1,050.20 | | | $ | 2.14 | |
| | Hypothetical* | | | 0.42 | % | | $ | 1,000.00 | | | $ | 1,022.78 | | | $ | 2.11 | |
| | | | | |
Class G(a) | | Actual | | | 0.57 | % | | $ | 1,000.00 | | | $ | 1,050.70 | | | $ | 2.91 | |
| | Hypothetical* | | | 0.57 | % | | $ | 1,000.00 | | | $ | 1,022.03 | | | $ | 2.87 | |
* Hypothetical assumes a rate of return of 5% per year before expenses.
** Expenses paid are equal to the Portfolio’s annualized expense ratio for the most recent six month period, as shown above, multiplied by the average account value over the period, multiplied by the number of days (182 days) in the most recent fiscal half-year, divided by 366 (to reflect the one-half year period).
(a) The annualized expense ratio shown reflects the impact of the management fee waiver as described in Note 5 of the Notes to Financial Statements.
MSF-3
Metropolitan Series Fund
Barclays Aggregate Bond Index Portfolio
Schedule of Investments as of June 30, 2016 (Unaudited)
U.S. Treasury & Government Agencies—67.2% of Net Assets
| | | | | | | | |
| Security Description | | Principal
Amount* | | | Value | |
|
Agency Sponsored Mortgage-Backed—27.7% | |
Fannie Mae 15 Yr. Pool
2.500%, 12/01/27 | | | 4,133,424 | | | $ | 4,291,517 | |
2.500%, 02/01/28 | | | 3,241,032 | | | | 3,365,133 | |
2.500%, 07/01/28 | | | 5,604,575 | | | | 5,819,176 | |
2.500%, 10/01/28 | | | 3,691,642 | | | | 3,832,996 | |
2.500%, 03/01/30 | | | 3,552,199 | | | | 3,677,335 | |
3.000%, 01/01/27 | | | 1,673,935 | | | | 1,758,113 | |
3.000%, 02/01/27 | | | 2,745,668 | | | | 2,883,807 | |
3.000%, 03/01/27 | | | 1,415,641 | | | | 1,486,864 | |
3.000%, 01/01/29 | | | 6,191,466 | | | | 6,496,076 | |
3.000%, 10/01/29 | | | 2,936,832 | | | | 3,080,201 | |
3.000%, 06/01/30 | | | 3,449,414 | | | | 3,618,296 | |
3.500%, 02/01/26 | | | 2,688,978 | | | | 2,855,109 | |
3.500%, 03/01/26 | | | 1,035,328 | | | | 1,099,293 | |
3.500%, 05/01/29 | | | 2,686,633 | | | | 2,850,621 | |
4.000%, 04/01/19 | | | 62,953 | | | | 65,216 | |
4.000%, 05/01/19 | | | 157,807 | | | | 163,491 | |
4.000%, 01/01/20 | | | 283,050 | | | | 293,312 | |
4.000%, 06/01/24 | | | 429,769 | | | | 450,410 | |
4.000%, 11/01/24 | | | 2,373,339 | | | | 2,487,326 | |
4.500%, 07/01/18 | | | 200,097 | | | | 207,521 | |
4.500%, 05/01/19 | | | 90,245 | | | | 93,647 | |
4.500%, 08/01/24 | | | 566,920 | | | | 597,055 | |
4.500%, 06/01/25 | | | 1,058,953 | | | | 1,115,232 | |
5.000%, 06/01/18 | | | 33,994 | | | | 35,342 | |
5.000%, 01/01/19 | | | 85,930 | | | | 88,242 | |
5.000%, 02/01/20 | | | 174,851 | | | | 184,310 | |
5.000%, 01/01/22 | | | 249,461 | | | | 267,926 | |
5.000%, 02/01/24 | | | 677,428 | | | | 727,281 | |
5.500%, 11/01/17 | | | 15,876 | | | | 16,132 | |
5.500%, 02/01/18 | | | 14,643 | | | | 14,952 | |
5.500%, 04/01/18 | | | 137,962 | | | | 142,037 | |
6.000%, 09/01/17 | | | 28,195 | | | | 28,560 | |
6.500%, 04/01/17 | | | 65,421 | | | | 66,015 | |
Fannie Mae 20 Yr. Pool
3.000%, 02/01/33 | | | 2,048,176 | | | | 2,147,782 | |
3.000%, 08/01/35 | | | 2,814,880 | | | | 2,952,036 | |
3.000%, 05/01/36 | | | 3,815,386 | | | | 4,002,607 | |
3.500%, 04/01/32 | | | 1,979,049 | | | | 2,115,597 | |
3.500%, 09/01/35 | | | 2,975,482 | | | | 3,166,905 | |
4.000%, 02/01/31 | | | 934,521 | | | | 1,015,523 | |
4.500%, 08/01/30 | | | 584,114 | | | | 637,289 | |
5.000%, 02/01/24 | | | 215,308 | | | | 238,892 | |
5.000%, 09/01/25 | | | 179,925 | | | | 199,672 | |
5.500%, 07/01/23 | | | 134,357 | | | | 150,813 | |
5.500%, 01/01/24 | | | 89,574 | | | | 100,555 | |
5.500%, 07/01/24 | | | 232,141 | | | | 260,577 | |
5.500%, 07/01/25 | | | 203,514 | | | | 228,391 | |
7.000%, 10/01/21 | | | 10,534 | | | | 11,430 | |
Fannie Mae 30 Yr. Pool
3.000%, 08/01/42 | | | 1,669,456 | | | | 1,736,947 | |
3.000%, 09/01/42 | | | 2,319,681 | | | | 2,413,459 | |
3.000%, 11/01/42 | | | 2,809,249 | | | | 2,922,818 | |
3.000%, 12/01/42 | | | 5,210,684 | | | | 5,421,336 | |
3.000%, 01/01/43 | | | 1,357,565 | | | | 1,412,447 | |
3.000%, 02/01/43 | | | 4,738,673 | | | | 4,928,774 | |
|
Agency Sponsored Mortgage-Backed—(Continued) | |
Fannie Mae 30 Yr. Pool
3.000%, 03/01/43 | | | 5,877,869 | | | | 6,113,671 | |
3.000%, 05/01/43 | | | 4,281,058 | | | | 4,452,801 | |
3.000%, 07/01/43 | | | 11,180,094 | | | | 11,628,608 | |
3.000%, 09/01/43 | | | 3,442,972 | | | | 3,581,094 | |
3.000%, 05/01/45 | | | 3,704,492 | | | | 3,845,282 | |
3.000%, 05/01/46 | | | 3,874,288 | | | | 4,022,506 | |
3.000%, 06/01/46 | | | 4,849,805 | | | | 5,035,343 | |
3.500%, 12/01/40 | | | 2,250,662 | | | | 2,382,951 | |
3.500%, 03/01/42 | | | 1,454,306 | | | | 1,539,068 | |
3.500%, 04/01/42 | | | 3,109,816 | | | | 3,291,067 | |
3.500%, 05/01/42 | | | 3,740,784 | | | | 3,958,810 | |
3.500%, 06/01/42 | | | 2,800,896 | | | | 2,964,142 | |
3.500%, 08/01/42 | | | 1,863,540 | | | | 1,972,153 | |
3.500%, 09/01/42 | | | 5,012,103 | | | | 5,304,225 | |
3.500%, 10/01/42 | | | 2,427,763 | | | | 2,569,261 | |
3.500%, 01/01/43 | | | 2,239,219 | | | | 2,369,729 | |
3.500%, 02/01/43 | | | 3,612,915 | | | | 3,823,488 | |
3.500%, 04/01/43 | | | 3,935,514 | | | | 4,156,382 | |
3.500%, 06/01/43 | | | 2,149,369 | | | | 2,269,995 | |
3.500%, 08/01/44 | | | 3,111,759 | | | | 3,282,727 | |
3.500%, 02/01/45 | | | 4,077,361 | | | | 4,301,383 | |
3.500%, 03/01/45 | | | 6,055,024 | | | | 6,390,121 | |
3.500%, 04/01/45 | | | 7,638,975 | | | | 8,061,733 | |
3.500%, 09/01/45 | | | 12,649,566 | | | | 13,349,620 | |
3.500%, 11/01/45 | | | 4,524,990 | | | | 4,775,412 | |
3.500%, 01/01/46 | | | 4,718,008 | | | | 4,979,112 | |
4.000%, 08/01/39 | | | 1,556,422 | | | | 1,668,396 | |
4.000%, 09/01/39 | | | 1,140,433 | | | | 1,222,479 | |
4.000%, 12/01/39 | | | 1,442,175 | | | | 1,545,929 | |
4.000%, 06/01/40 | | | 1,700,821 | | | | 1,832,963 | |
4.000%, 09/01/40 | | | 931,783 | | | | 1,004,176 | |
4.000%, 12/01/40 | | | 6,572,322 | | | | 7,082,946 | |
4.000%, 01/01/41 | | | 3,758,462 | | | | 4,049,437 | |
4.000%, 02/01/41 | | | 4,118,333 | | | | 4,436,027 | |
4.000%, 12/01/41 | | | 1,564,031 | | | | 1,684,683 | |
4.000%, 02/01/42 | | | 1,781,902 | | | | 1,918,520 | |
4.000%, 09/01/43 | | | 2,641,820 | | | | 2,831,937 | |
4.000%, 02/01/44 | | | 3,801,124 | | | | 4,074,498 | |
4.000%, 05/01/44 | | | 2,973,974 | | | | 3,187,860 | |
4.000%, 08/01/44 | | | 4,106,009 | | | | 4,401,310 | |
4.000%, 10/01/44 | | | 2,558,468 | | | | 2,742,471 | |
4.000%, 11/01/44 | | | 5,337,954 | | | | 5,721,856 | |
4.000%, 01/01/45 | | | 4,267,125 | | | | 4,574,013 | |
4.000%, 03/01/45 | | | 3,572,214 | | | | 3,831,314 | |
4.000%, 10/01/45 | | | 4,602,387 | | | | 4,936,208 | |
4.500%, 08/01/33 | | | 269,152 | | | | 295,162 | |
4.500%, 10/01/33 | | | 285,396 | | | | 312,976 | |
4.500%, 04/01/34 | | | 124,128 | | | | 135,977 | |
4.500%, 01/01/39 | | | 153,020 | | | | 167,063 | |
4.500%, 07/01/39 | | | 1,863,815 | | | | 2,034,570 | |
4.500%, 09/01/39 | | | 2,804,750 | | | | 3,061,709 | |
4.500%, 10/01/39 | | | 1,324,209 | | | | 1,445,527 | |
4.500%, 05/01/40 | | | 1,650,094 | | | | 1,808,649 | |
4.500%, 08/01/40 | | | 2,778,999 | | | | 3,046,028 | |
4.500%, 11/01/40 | | | 1,448,816 | | | | 1,588,030 | |
See accompanying notes to financial statements.
MSF-4
Metropolitan Series Fund
Barclays Aggregate Bond Index Portfolio
Schedule of Investments as of June 30, 2016 (Unaudited)
U.S. Treasury & Government Agencies—(Continued)
| | | | | | | | |
| Security Description | | Principal
Amount* | | | Value | |
|
Agency Sponsored Mortgage-Backed—(Continued) | |
Fannie Mae 30 Yr. Pool
4.500%, 12/01/40 | | | 2,446,537 | | | $ | 2,681,620 | |
4.500%, 04/01/41 | | | 5,920,085 | | | | 6,489,699 | |
4.500%, 05/01/41 | | | 1,448,090 | | | | 1,587,421 | |
4.500%, 03/01/44 | | | 2,362,176 | | | | 2,577,551 | |
5.000%, 07/01/33 | | | 184,606 | | | | 205,874 | |
5.000%, 08/01/33 | | | 529,558 | | | | 590,565 | |
5.000%, 09/01/33 | | | 254,241 | | | | 283,531 | |
5.000%, 10/01/33 | | | 2,446,939 | | | | 2,728,836 | |
5.000%, 03/01/34 | | | 290,921 | | | | 324,436 | |
5.000%, 04/01/34 | | | 668,551 | | | | 745,320 | |
5.000%, 05/01/34 | | | 84,298 | | | | 93,953 | |
5.000%, 09/01/34 | | | 227,996 | | | | 254,108 | |
5.000%, 02/01/35 | | | 346,598 | | | | 386,295 | |
5.000%, 04/01/35 | | | 187,600 | | | | 208,808 | |
5.000%, 05/01/35 | | | 47,785 | | | | 53,187 | |
5.000%, 11/01/35 | | | 190,434 | | | | 211,962 | |
5.000%, 03/01/36 | | | 698,053 | | | | 776,968 | |
5.000%, 07/01/37 | | | 555,953 | | | | 617,755 | |
5.000%, 01/01/39 | | | 546,217 | | | | 606,153 | |
5.000%, 04/01/40 | | | 1,858,541 | | | | 2,066,512 | |
5.000%, 07/01/41 | | | 1,386,749 | | | | 1,542,204 | |
5.500%, 10/01/32 | | | 57,252 | | | | 64,668 | |
5.500%, 02/01/33 | | | 143,761 | | | | 162,396 | |
5.500%, 03/01/33 | | | 506,321 | | | | 571,952 | |
5.500%, 05/01/33 | | | 1,623,175 | | | | 1,833,577 | |
5.500%, 08/01/33 | | | 685,470 | | | | 774,323 | |
5.500%, 10/01/33 | | | 99,955 | | | | 112,912 | |
5.500%, 12/01/33 | | | 914,454 | | | | 1,032,989 | |
5.500%, 02/01/34 | | | 191,584 | | | | 216,389 | |
5.500%, 03/01/34 | | | 158,323 | | | | 178,821 | |
5.500%, 04/01/34 | | | 65,553 | | | | 74,041 | |
5.500%, 06/01/34 | | | 262,850 | | | | 296,882 | |
5.500%, 09/01/34 | | | 243,014 | | | | 274,477 | |
5.500%, 12/01/34 | | | 590,576 | | | | 667,039 | |
5.500%, 01/01/35 | | | 193,648 | | | | 218,720 | |
5.500%, 02/01/35 | | | 469,478 | | | | 530,262 | |
5.500%, 04/01/35 | | | 199,885 | | | | 225,146 | |
5.500%, 06/01/35 | | | 934,287 | | | | 1,052,361 | |
5.500%, 01/01/37 | | | 255,507 | | | | 286,916 | |
5.500%, 05/01/37 | | | 148,533 | | | | 166,788 | |
5.500%, 05/01/38 | | | 116,375 | | | | 130,666 | |
5.500%, 06/01/38 | | | 170,917 | | | | 191,905 | |
5.500%, 07/01/38 | | | 104,545 | | | | 117,382 | |
6.000%, 08/01/28 | | | 2,982 | | | | 3,406 | |
6.000%, 11/01/28 | | | 886 | | | | 1,016 | |
6.000%, 12/01/28 | | | 1,030 | | | | 1,189 | |
6.000%, 06/01/31 | | | 38,226 | | | | 44,227 | |
6.000%, 09/01/32 | | | 103,443 | | | | 119,651 | |
6.000%, 01/01/33 | | | 24,378 | | | | 28,197 | |
6.000%, 02/01/33 | | | 84,917 | | | | 98,227 | |
6.000%, 03/01/33 | | | 101,864 | | | | 117,830 | |
6.000%, 04/01/33 | | | 354,534 | | | | 410,103 | |
6.000%, 05/01/33 | | | 286,633 | | | | 331,561 | |
6.000%, 05/01/34 | | | 406,379 | | | | 469,743 | |
6.000%, 09/01/34 | | | 237,738 | | | | 274,807 | |
|
Agency Sponsored Mortgage-Backed—(Continued) | |
Fannie Mae 30 Yr. Pool
6.000%, 11/01/34 | | | 373,231 | | | | 431,427 | |
6.000%, 01/01/35 | | | 155,513 | | | | 178,038 | |
6.000%, 07/01/36 | | | 67,075 | | | | 76,636 | |
6.000%, 09/01/36 | | | 191,582 | | | | 218,891 | |
6.000%, 07/01/37 | | | 174,113 | | | | 198,905 | |
6.000%, 08/01/37 | | | 265,051 | | | | 302,792 | |
6.000%, 09/01/37 | | | 656,027 | | | | 749,439 | |
6.000%, 10/01/37 | | | 223,540 | | | | 255,371 | |
6.000%, 05/01/38 | | | 746,855 | | | | 853,201 | |
6.000%, 12/01/38 | | | 183,245 | | | | 209,353 | |
6.500%, 05/01/28 | | | 53,152 | | | | 62,376 | |
6.500%, 12/01/28 | | | 207,597 | | | | 238,900 | |
6.500%, 03/01/29 | | | 3,680 | | | | 4,235 | |
6.500%, 04/01/29 | | | 30,348 | | | | 35,029 | |
6.500%, 05/01/29 | | | 5,304 | | | | 6,103 | |
6.500%, 08/01/29 | | | 861 | | | | 991 | |
6.500%, 05/01/30 | | | 30,659 | | | | 35,282 | |
6.500%, 09/01/31 | | | 6,173 | | | | 7,237 | |
6.500%, 06/01/32 | | | 28,988 | | | | 33,991 | |
6.500%, 09/01/33 | | | 16,362 | | | | 18,829 | |
6.500%, 10/01/33 | | | 106,090 | | | | 122,087 | |
6.500%, 10/01/34 | | | 297,813 | | | | 353,832 | |
6.500%, 10/01/37 | | | 107,556 | | | | 124,973 | |
7.000%, 06/01/26 | | | 700 | | | | 769 | |
7.000%, 06/01/28 | | | 7,358 | | | | 7,356 | |
7.000%, 10/01/29 | | | 10,288 | | | | 12,311 | |
7.000%, 12/01/29 | | | 3,587 | | | | 3,695 | |
7.000%, 04/01/32 | | | 3,132 | | | | 3,131 | |
7.000%, 06/01/32 | | | 57,423 | | | | 65,933 | |
7.000%, 10/01/37 | | | 188,403 | | | | 214,642 | |
7.500%, 09/01/25 | | | 4,674 | | | | 5,467 | |
7.500%, 06/01/26 | | | 5,251 | | | | 6,268 | |
7.500%, 07/01/29 | | | 11,944 | | | | 14,270 | |
7.500%, 10/01/29 | | | 7,169 | | | | 7,669 | |
8.000%, 11/01/29 | | | 168 | | | | 198 | |
8.000%, 05/01/30 | | | 17,349 | | | | 18,064 | |
8.000%, 11/01/30 | | | 3,538 | | | | 4,119 | |
8.000%, 01/01/31 | | | 3,580 | | | | 4,163 | |
8.000%, 02/01/31 | | | 6,105 | | | | 7,358 | |
Fannie Mae ARM Pool
2.547%, 02/01/45 (a) | | | 1,037,775 | | | | 1,068,603 | |
2.746%, 11/01/43 (a) | | | 1,662,890 | | | | 1,731,643 | |
2.768%, 02/01/42 (a) | | | 2,170,546 | | | | 2,257,771 | |
3.005%, 10/01/41 (a) | | | 252,555 | | | | 266,324 | |
Fannie Mae-ACES
2.679%, 05/25/21 (a) | | | 5,000,000 | | | | 5,236,550 | |
Freddie Mac 15 Yr. Gold Pool
2.500%, 12/01/27 | | | 2,018,513 | | | | 2,094,453 | |
2.500%, 02/01/28 | | | 3,001,975 | | | | 3,115,101 | |
2.500%, 04/01/28 | | | 2,652,137 | | | | 2,752,080 | |
2.500%, 12/01/29 | | | 3,917,443 | | | | 4,052,658 | |
2.500%, 01/01/31 | | | 4,707,822 | | | | 4,872,026 | |
3.000%, 03/01/27 | | | 1,532,928 | | | | 1,609,633 | |
3.000%, 05/01/27 | | | 2,026,334 | | | | 2,127,729 | |
3.000%, 11/01/28 | | | 2,485,409 | | | | 2,608,372 | |
See accompanying notes to financial statements.
MSF-5
Metropolitan Series Fund
Barclays Aggregate Bond Index Portfolio
Schedule of Investments as of June 30, 2016 (Unaudited)
U.S. Treasury & Government Agencies—(Continued)
| | | | | | | | |
| Security Description | | Principal
Amount* | | | Value | |
|
Agency Sponsored Mortgage-Backed—(Continued) | |
Freddie Mac 15 Yr. Gold Pool
3.000%, 12/01/29 | | | 4,400,846 | | | $ | 4,618,524 | |
3.000%, 05/01/31 | | | 4,769,615 | | | | 5,007,841 | |
3.500%, 12/01/25 | | | 1,788,429 | | | | 1,897,559 | |
3.500%, 05/01/26 | | | 629,513 | | | | 668,402 | |
3.500%, 09/01/30 | | | 3,652,688 | | | | 3,871,083 | |
4.000%, 06/01/19 | | | 104,662 | | | | 108,335 | |
4.000%, 05/01/25 | | | 987,767 | | | | 1,031,279 | |
4.000%, 08/01/25 | | | 503,809 | | | | 526,003 | |
4.000%, 10/01/25 | | | 464,265 | | | | 484,717 | |
4.500%, 09/01/18 | | | 99,715 | | | | 103,278 | |
4.500%, 10/01/18 | | | 219,308 | | | | 227,143 | |
4.500%, 04/01/19 | | | 201,722 | | | | 206,751 | |
4.500%, 06/01/19 | | | 126,228 | | | | 129,152 | |
4.500%, 08/01/19 | | | 39,638 | | | | 40,617 | |
5.000%, 05/01/18 | | | 241,741 | | | | 250,986 | |
5.000%, 12/01/18 | | | 48,513 | | | | 50,368 | |
5.000%, 06/01/19 | | | 164,138 | | | | 169,331 | |
5.500%, 11/01/17 | | | 17,324 | | | | 17,669 | |
5.500%, 01/01/24 | | | 458,663 | | | | 503,662 | |
6.000%, 05/01/17 | | | 6,630 | | | | 6,699 | |
Freddie Mac 20 Yr. Gold Pool
3.000%, 04/01/33 | | | 3,195,984 | | | | 3,351,613 | |
3.500%, 04/01/32 | | | 2,727,078 | | | | 2,908,558 | |
4.000%, 01/01/31 | | | 1,005,654 | | | | 1,095,474 | |
4.000%, 08/01/31 | | | 1,016,876 | | | | 1,107,698 | |
4.500%, 05/01/29 | | | 274,297 | | | | 299,257 | |
5.000%, 03/01/27 | | | 136,160 | | | | 150,271 | |
Freddie Mac 30 Yr. Gold Pool
2.500%, 07/01/43 | | | 2,856,039 | | | | 2,881,368 | |
3.000%, 10/01/42 | | | 2,622,352 | | | | 2,726,225 | |
3.000%, 01/01/43 | | | 2,635,382 | | | | 2,739,771 | |
3.000%, 03/01/43 | | | 6,247,367 | | | | 6,492,932 | |
3.000%, 04/01/43 | | | 4,889,379 | | | | 5,081,566 | |
3.000%, 06/01/43 | | | 1,851,459 | | | | 1,924,235 | |
3.000%, 07/01/43 | | | 4,312,587 | | | | 4,482,102 | |
3.000%, 06/01/45 | | | 4,724,013 | | | | 4,898,354 | |
3.000%, 01/01/46 | | | 2,890,636 | | | | 2,997,316 | |
3.000%, 06/01/46 | | | 4,818,396 | | | | 4,999,882 | |
3.500%, 01/01/42 | | | 1,626,216 | | | | 1,719,935 | |
3.500%, 03/01/42 | | | 1,469,701 | | | | 1,554,400 | |
3.500%, 08/01/42 | | | 4,842,688 | | | | 5,121,774 | |
3.500%, 02/01/43 | | | 2,035,712 | | | | 2,149,242 | |
3.500%, 05/01/43 | | | 3,536,523 | | | | 3,733,753 | |
3.500%, 06/01/43 | | | 2,127,707 | | | | 2,246,368 | |
3.500%, 06/01/44 | | | 2,691,643 | | | | 2,837,795 | |
3.500%, 10/01/44 | | | 2,887,224 | | | | 3,043,996 | |
3.500%, 11/01/44 | | | 3,507,140 | | | | 3,697,573 | |
3.500%, 12/01/44 | | | 3,848,922 | | | | 4,057,913 | |
3.500%, 05/01/45 | | | 4,436,995 | | | | 4,679,494 | |
3.500%, 08/01/45 | | | 3,896,866 | | | | 4,109,844 | |
3.500%, 11/01/45 | | | 4,615,320 | | | | 4,867,564 | |
3.500%, 12/01/45 | | | 2,774,116 | | | | 2,925,732 | |
3.500%, 03/01/46 | | | 8,541,971 | | | | 9,012,566 | |
4.000%, 06/01/39 | | | 1,001,593 | | | | 1,072,046 | |
4.000%, 12/01/39 | | | 1,539,777 | | | | 1,648,086 | |
|
Agency Sponsored Mortgage-Backed—(Continued) | |
Freddie Mac 30 Yr. Gold Pool
4.000%, 11/01/40 | | | 1,498,734 | | | | 1,611,687 | |
4.000%, 04/01/41 | | | 1,408,231 | | | | 1,514,510 | |
4.000%, 09/01/41 | | | 1,478,958 | | | | 1,590,574 | |
4.000%, 10/01/41 | | | 3,308,852 | | | | 3,558,570 | |
4.000%, 11/01/41 | | | 1,413,206 | | | | 1,519,860 | |
4.000%, 10/01/43 | | | 3,663,206 | | | | 3,921,021 | |
4.000%, 07/01/44 | | | 4,417,518 | | | | 4,728,149 | |
4.000%, 10/01/44 | | | 3,393,582 | | | | 3,632,213 | |
4.000%, 07/01/45 | | | 5,059,449 | | | | 5,418,239 | |
4.000%, 02/01/46 | | | 2,746,015 | | | | 2,942,449 | |
4.500%, 10/01/35 | | | 507,562 | | | | 554,889 | |
4.500%, 06/01/38 | | | 761,605 | | | | 832,620 | |
4.500%, 02/01/39 | | | 461,175 | | | | 502,665 | |
4.500%, 03/01/39 | | | 332,115 | | | | 361,995 | |
4.500%, 04/01/39 | | | 731,051 | | | | 796,822 | |
4.500%, 09/01/39 | | | 870,844 | | | | 949,192 | |
4.500%, 10/01/39 | | | 2,297,827 | | | | 2,504,557 | |
4.500%, 11/01/39 | | | 740,079 | | | | 806,662 | |
4.500%, 01/01/40 | | | 563,956 | | | | 617,941 | |
4.500%, 05/01/40 | | | 914,753 | | | | 1,002,319 | |
4.500%, 11/01/40 | | | 1,234,075 | | | | 1,352,208 | |
4.500%, 02/01/41 | | | 505,049 | | | | 553,144 | |
4.500%, 05/01/41 | | | 759,161 | | | | 831,455 | |
4.500%, 06/01/41 | | | 569,926 | | | | 624,200 | |
4.500%, 12/01/43 | | | 1,341,902 | | | | 1,463,425 | |
5.000%, 10/01/33 | | | 576,307 | | | | 639,095 | |
5.000%, 03/01/34 | | | 135,374 | | | | 150,042 | |
5.000%, 08/01/35 | | | 617,262 | | | | 683,230 | |
5.000%, 09/01/35 | | | 282,491 | | | | 312,682 | |
5.000%, 10/01/35 | | | 205,831 | | | | 227,828 | |
5.000%, 01/01/36 | | | 706,981 | | | | 782,537 | |
5.000%, 04/01/38 | | | 349,132 | | | | 385,342 | |
5.000%, 11/01/39 | | | 1,654,117 | | | | 1,825,921 | |
5.000%, 05/01/40 | | | 2,097,623 | | | | 2,320,099 | |
5.500%, 06/01/34 | | | 532,988 | | | | 599,462 | |
5.500%, 10/01/35 | | | 226,479 | | | | 253,826 | |
5.500%, 12/01/35 | | | 777,067 | | | | 870,899 | |
5.500%, 01/01/36 | | | 475,634 | | | | 532,058 | |
5.500%, 12/01/37 | | | 444,378 | | | | 496,300 | |
5.500%, 04/01/38 | | | 2,033,005 | | | | 2,270,452 | |
5.500%, 07/01/38 | | | 226,520 | | | | 252,976 | |
5.500%, 08/01/38 | | | 601,242 | | | | 671,464 | |
6.000%, 11/01/28 | | | 8,815 | | | | 10,154 | |
6.000%, 12/01/28 | | | 6,823 | | | | 7,877 | |
6.000%, 04/01/29 | | | 3,544 | | | | 4,054 | |
6.000%, 05/01/29 | | | 1,960 | | | | 2,225 | |
6.000%, 06/01/31 | | | 2,173 | | | | 2,467 | |
6.000%, 07/01/31 | | | 735 | | | | 842 | |
6.000%, 09/01/31 | | | 60,398 | | | | 68,667 | |
6.000%, 04/01/32 | | | 90,982 | | | | 105,336 | |
6.000%, 11/01/32 | | | 31,211 | | | | 36,135 | |
6.000%, 06/01/34 | | | 144,183 | | | | 166,901 | |
6.000%, 11/01/35 | | | 89,037 | | | | 103,007 | |
6.000%, 02/01/36 | | | 132,942 | | | | 151,809 | |
6.000%, 08/01/36 | | | 86,318 | | | | 98,568 | |
See accompanying notes to financial statements.
MSF-6
Metropolitan Series Fund
Barclays Aggregate Bond Index Portfolio
Schedule of Investments as of June 30, 2016 (Unaudited)
U.S. Treasury & Government Agencies—(Continued)
| | | | | | | | |
| Security Description | | Principal
Amount* | | | Value | |
|
Agency Sponsored Mortgage-Backed—(Continued) | |
Freddie Mac 30 Yr. Gold Pool
6.000%, 10/01/36 | | | 192,509 | | | $ | 219,830 | |
6.000%, 11/01/36 | | | 113,244 | | | | 129,316 | |
6.000%, 01/01/37 | | | 169,798 | | | | 193,896 | |
6.000%, 02/01/38 | | | 197,295 | | | | 225,252 | |
6.000%, 11/01/39 | | | 1,651,629 | | | | 1,885,998 | |
6.000%, 04/01/40 | | | 528,489 | | | | 603,376 | |
6.500%, 02/01/30 | | | 5,411 | | | | 6,216 | |
6.500%, 08/01/31 | | | 10,110 | | | | 11,757 | |
6.500%, 10/01/31 | | | 7,211 | | | | 8,284 | |
6.500%, 11/01/31 | | | 21,305 | | | | 24,775 | |
6.500%, 03/01/32 | | | 355,140 | | | | 412,971 | |
6.500%, 04/01/32 | | | 291,260 | | | | 338,689 | |
6.500%, 09/01/36 | | | 407,820 | | | | 472,028 | |
6.500%, 11/01/37 | | | 200,588 | | | | 232,628 | |
7.000%, 12/01/27 | | | 1,380 | | | | 1,644 | |
7.000%, 11/01/28 | | | 3,508 | | | | 4,195 | |
7.000%, 04/01/29 | | | 3,821 | | | | 4,511 | |
7.000%, 05/01/29 | | | 686 | | | | 768 | |
7.000%, 06/01/29 | | | 5,965 | | | | 6,191 | |
7.000%, 07/01/29 | | | 2,001 | | | | 2,284 | |
7.000%, 01/01/31 | | | 101,314 | | | | 108,429 | |
7.500%, 08/01/24 | | | 10,581 | | | | 10,727 | |
7.500%, 10/01/27 | | | 10,751 | | | | 12,438 | |
7.500%, 10/01/29 | | | 14,697 | | | | 18,338 | |
7.500%, 05/01/30 | | | 12,098 | | | | 13,937 | |
8.000%, 02/01/27 | | | 3,376 | | | | 3,989 | |
8.000%, 10/01/28 | | | 6,704 | | | | 8,141 | |
Ginnie Mae I 15 Yr. Pool
3.000%, 08/15/28 | | | 3,164,941 | | | | 3,339,836 | |
5.000%, 10/15/20 | | | 148,767 | | | | 156,484 | |
5.000%, 01/15/21 | | | 130,179 | | | | 136,934 | |
Ginnie Mae I 30 Yr. Pool
3.000%, 11/15/42 | | | 3,084,353 | | | | 3,231,393 | |
3.000%, 12/15/42 | | | 2,262,550 | | | | 2,370,412 | |
3.000%, 02/15/43 | | | 1,995,073 | | | | 2,087,165 | |
3.000%, 03/15/43 | | | 2,515,959 | | | | 2,632,094 | |
3.000%, 05/15/43 | | | 3,382,191 | | | | 3,538,311 | |
3.000%, 07/15/43 | | | 2,155,892 | | | | 2,255,407 | |
3.500%, 01/15/42 | | | 3,080,128 | | | | 3,282,867 | |
3.500%, 02/15/42 | | | 1,115,142 | | | | 1,186,495 | |
3.500%, 03/15/42 | | | 2,106,783 | | | | 2,241,587 | |
3.500%, 05/15/42 | | | 1,509,539 | | | | 1,606,128 | |
3.500%, 09/15/42 | | | 1,825,677 | | | | 1,942,494 | |
3.500%, 05/15/43 | | | 2,332,121 | | | | 2,478,894 | |
4.000%, 07/15/39 | | | 2,270,445 | | | | 2,452,769 | |
4.000%, 07/15/40 | | | 1,283,449 | | | | 1,388,619 | |
4.000%, 03/15/41 | | | 1,029,870 | | | | 1,112,695 | |
4.000%, 10/15/41 | | | 2,198,095 | | | | 2,374,872 | |
4.500%, 01/15/39 | | | 337,055 | | | | 372,336 | |
4.500%, 04/15/39 | | | 1,001,721 | | | | 1,106,576 | |
4.500%, 05/15/39 | | | 2,378,725 | | | | 2,627,717 | |
4.500%, 08/15/39 | | | 1,039,987 | | | | 1,148,848 | |
4.500%, 01/15/40 | | | 997,955 | | | | 1,103,124 | |
4.500%, 04/15/40 | | | 1,160,955 | | | | 1,283,302 | |
4.500%, 02/15/41 | | | 409,273 | | | | 451,901 | |
|
Agency Sponsored Mortgage-Backed—(Continued) | |
Ginnie Mae I 30 Yr. Pool
4.500%, 04/15/41 | | | 600,531 | | | | 663,081 | |
5.000%, 12/15/35 | | | 365,067 | | | | 411,547 | |
5.000%, 12/15/36 | | | 142,450 | | | | 161,126 | |
5.000%, 01/15/39 | | | 1,156,291 | | | | 1,291,679 | |
5.000%, 02/15/39 | | | 192,953 | | | | 216,016 | |
5.000%, 08/15/39 | | | 1,618,327 | | | | 1,811,753 | |
5.000%, 09/15/39 | | | 387,092 | | | | 433,358 | |
5.000%, 12/15/39 | | | 726,472 | | | | 813,301 | |
5.000%, 05/15/40 | | | 1,173,733 | | | | 1,316,312 | |
5.500%, 03/15/36 | | | 324,496 | | | | 367,701 | |
5.500%, 01/15/37 | | | 470,992 | | | | 536,727 | |
5.500%, 11/15/37 | | | 530,126 | | | | 596,619 | |
5.500%, 09/15/38 | | | 220,091 | | | | 248,291 | |
5.500%, 08/15/39 | | | 1,221,653 | | | | 1,379,389 | |
6.000%, 01/15/29 | | | 5,951 | | | | 6,903 | |
6.000%, 01/15/33 | | | 230,161 | | | | 269,481 | |
6.000%, 03/15/35 | | | 238,753 | | | | 278,639 | |
6.000%, 12/15/35 | | | 165,223 | | | | 192,049 | |
6.000%, 06/15/36 | | | 168,852 | | | | 192,070 | |
6.000%, 09/15/36 | | | 244,256 | | | | 277,843 | |
6.000%, 07/15/38 | | | 1,040,806 | | | | 1,201,140 | |
6.500%, 05/15/23 | | | 1,196 | | | | 1,365 | |
6.500%, 02/15/27 | | | 29,743 | | | | 34,128 | |
6.500%, 07/15/28 | | | 12,224 | | | | 13,946 | |
6.500%, 08/15/28 | | | 9,852 | | | | 11,240 | |
6.500%, 11/15/28 | | | 8,796 | | | | 10,477 | |
6.500%, 12/15/28 | | | 10,508 | | | | 11,988 | |
6.500%, 07/15/29 | | | 2,081 | | | | 2,374 | |
6.500%, 05/15/36 | | | 135,355 | | | | 154,457 | |
7.000%, 01/15/28 | | | 1,745 | | | | 1,960 | |
7.000%, 04/15/28 | | | 2,996 | | | | 3,083 | |
7.000%, 05/15/28 | | | 10,283 | | | | 11,049 | |
7.000%, 06/15/28 | | | 8,045 | | | | 9,157 | |
7.000%, 10/15/28 | | | 7,744 | | | | 8,673 | |
7.000%, 06/15/29 | | | 2,000 | | | | 2,045 | |
7.000%, 09/15/29 | | | 5,171 | | | | 5,470 | |
7.000%, 01/15/31 | | | 1,329 | | | | 1,357 | |
7.000%, 03/15/31 | | | 12,553 | | | | 12,836 | |
7.000%, 07/15/31 | | | 421,699 | | | | 508,746 | |
7.000%, 08/15/31 | | | 64,778 | | | | 80,816 | |
7.000%, 02/15/32 | | | 14,112 | | | | 14,495 | |
7.000%, 07/15/32 | | | 24,391 | | | | 29,283 | |
7.500%, 08/15/29 | | | 43 | | | | 43 | |
7.500%, 04/15/30 | | | 8,220 | | | | 8,376 | |
8.000%, 08/15/26 | | | 3,296 | | | | 3,802 | |
8.000%, 09/15/26 | | | 3,503 | | | | 3,983 | |
8.000%, 05/15/27 | | | 1,325 | | | | 1,352 | |
8.000%, 06/15/29 | | | 22,493 | | | | 24,147 | |
9.000%, 11/15/24 | | | 7,032 | | | | 7,818 | |
Ginnie Mae II 30 Yr. Pool
3.000%, 12/20/42 | | | 2,844,717 | | | | 2,986,503 | |
3.000%, 03/20/43 | | | 3,848,109 | | | | 4,032,937 | |
3.000%, 12/20/44 | | | 3,905,672 | | | | 4,088,199 | |
3.000%, 04/20/45 | | | 3,523,741 | | | | 3,684,948 | |
3.000%, 08/20/45 | | | 4,726,631 | | | | 4,942,868 | |
See accompanying notes to financial statements.
MSF-7
Metropolitan Series Fund
Barclays Aggregate Bond Index Portfolio
Schedule of Investments as of June 30, 2016 (Unaudited)
U.S. Treasury & Government Agencies—(Continued)
| | | | | | | | |
| Security Description | | Principal
Amount* | | | Value | |
|
Agency Sponsored Mortgage-Backed—(Continued) | |
Ginnie Mae II 30 Yr. Pool
3.000%, 11/20/45 | | | 2,807,569 | | | $ | 2,936,011 | |
3.000%, 01/20/46 | | | 4,792,735 | | | | 5,011,996 | |
3.500%, 12/20/41 | | | 1,854,850 | | | | 1,977,398 | |
3.500%, 03/20/42 | | | 3,839,380 | | | | 4,089,841 | |
3.500%, 08/20/42 | | | 1,787,828 | | | | 1,904,457 | |
3.500%, 01/20/43 | | | 5,248,326 | | | | 5,585,140 | |
3.500%, 04/20/43 | | | 2,056,808 | | | | 2,187,234 | |
3.500%, 05/20/43 | | | 3,531,310 | | | | 3,755,237 | |
3.500%, 07/20/44 | | | 4,958,185 | | | | 5,265,079 | |
3.500%, 02/20/45 | | | 5,563,284 | | | | 5,906,018 | |
3.500%, 06/20/45 | | | 3,447,703 | | | | 3,660,104 | |
3.500%, 08/20/45 | | | 7,727,868 | | | | 8,203,955 | |
3.500%, 09/20/45 | | | 8,853,918 | | | | 9,399,377 | |
3.500%, 12/20/45 | | | 4,497,352 | | | | 4,774,418 | |
3.500%, 01/20/46 | | | 4,538,409 | | | | 4,818,005 | |
3.500%, 02/20/46 | | | 3,715,163 | | | | 3,947,174 | |
3.500%, 05/20/46 | | | 4,695,395 | | | | 4,992,294 | |
4.000%, 11/20/40 | | | 1,845,008 | | | | 1,990,341 | |
4.000%, 12/20/40 | | | 1,891,010 | | | | 2,039,966 | |
4.000%, 05/20/43 | | | 2,671,676 | | | | 2,860,341 | |
4.000%, 11/20/43 | | | 1,430,465 | | | | 1,531,479 | |
4.000%, 02/20/44 | | | 3,999,679 | | | | 4,277,406 | |
4.000%, 04/20/44 | | | 1,953,630 | | | | 2,089,285 | |
4.000%, 05/20/44 | | | 2,412,371 | | | | 2,579,879 | |
4.000%, 09/20/44 | | | 3,790,110 | | | | 4,053,286 | |
4.000%, 10/20/44 | | | 5,493,551 | | | | 5,875,008 | |
4.000%, 11/20/44 | | | 1,087,024 | | | | 1,162,504 | |
4.000%, 11/20/45 | | | 2,554,346 | | | | 2,732,041 | |
4.500%, 08/20/40 | | | 1,637,772 | | | | 1,790,985 | |
4.500%, 12/20/40 | | | 996,593 | | | | 1,089,823 | |
4.500%, 04/20/41 | | | 904,587 | | | | 984,793 | |
4.500%, 03/20/42 | | | 682,995 | | | | 743,554 | |
4.500%, 10/20/43 | | | 1,187,544 | | | | 1,279,586 | |
4.500%, 02/20/44 | | | 2,246,667 | | | | 2,420,796 | |
4.500%, 04/20/45 | | | 2,390,718 | | | | 2,576,012 | |
5.000%, 08/20/40 | | | 725,511 | | | | 805,869 | |
5.000%, 10/20/40 | | | 713,987 | | | | 793,068 | |
5.000%, 06/20/44 | | | 1,817,544 | | | | 2,018,856 | |
6.500%, 06/20/31 | | | 25,679 | | | | 30,600 | |
6.500%, 11/20/38 | | | 604,189 | | | | 699,562 | |
7.500%, 02/20/28 | | | 3,163 | | | | 3,865 | |
| | | | | | | | |
| | | | | | | 757,934,573 | |
| | | | | | | | |
|
Federal Agencies—2.9% | |
Federal Home Loan Bank
1.750%, 06/12/20 | | | 17,700,000 | | | | 18,213,560 | |
Federal Home Loan Mortgage Corp.
0.875%, 03/07/18 | | | 17,000,000 | | | | 17,055,355 | |
1.250%, 10/02/19 | | | 3,000,000 | | | | 3,036,004 | |
1.375%, 05/01/20 (b) | | | 5,145,000 | | | | 5,224,560 | |
5.125%, 11/17/17 | | | 3,530,000 | | | | 3,743,113 | |
Federal National Mortgage Association
0.875%, 05/21/18 | | | 10,160,000 | | | | 10,200,096 | |
2.125%, 04/24/26 | | | 13,500,000 | | | | 13,887,692 | |
|
Federal Agencies—(Continued) | |
Federal National Mortgage Association
6.625%, 11/15/30 | | | 2,450,000 | | | | 3,748,205 | |
Tennessee Valley Authority
5.250%, 09/15/39 | | | 3,350,000 | | | | 4,597,438 | |
| | | | | | | | |
| | | | | | | 79,706,023 | |
| | | | | | | | |
|
U.S. Treasury—36.6% | |
U.S. Treasury Bonds
2.500%, 02/15/45 | | | 9,900,000 | | | | 10,289,268 | |
2.500%, 02/15/46 (b) | | | 8,200,000 | | | | 8,523,818 | |
2.500%, 05/15/46 | | | 4,800,000 | | | | 5,001,936 | |
2.750%, 08/15/42 | | | 2,020,000 | | | | 2,221,131 | |
2.875%, 05/15/43 | | | 4,760,000 | | | | 5,341,577 | |
2.875%, 08/15/45 | | | 5,000,000 | | | | 5,601,600 | |
3.000%, 11/15/44 | | | 11,000,000 | | | | 12,624,590 | |
3.000%, 11/15/45 (b) | | | 7,700,000 | | | | 8,838,214 | |
3.125%, 02/15/42 | | | 1,800,000 | | | | 2,122,812 | |
3.125%, 02/15/43 | | | 3,270,000 | | | | 3,847,449 | |
3.125%, 08/15/44 | | | 4,700,000 | | | | 5,521,983 | |
3.375%, 05/15/44 | | | 3,000,000 | | | | 3,690,570 | |
3.500%, 02/15/39 | | | 2,080,000 | | | | 2,620,550 | |
3.625%, 02/15/44 (b) | | | 10,120,000 | | | | 13,023,630 | |
3.750%, 08/15/41 | | | 1,830,000 | | | | 2,383,154 | |
3.875%, 08/15/40 | | | 10,380,000 | | | | 13,753,500 | |
4.250%, 11/15/40 | | | 7,280,000 | | | | 10,177,586 | |
4.375%, 11/15/39 | | | 3,900,000 | | | | 5,534,880 | |
4.375%, 05/15/40 | | | 5,220,000 | | | | 7,416,263 | |
4.375%, 05/15/41 | | | 5,850,000 | | | | 8,338,473 | |
4.500%, 05/15/38 (b) | | | 4,950,000 | | | | 7,169,877 | |
5.000%, 05/15/37 | | | 6,560,000 | | | | 10,068,485 | |
5.250%, 02/15/29 | | | 750,000 | | | | 1,060,147 | |
5.375%, 02/15/31 (b) | | | 3,675,000 | | | | 5,446,607 | |
6.125%, 11/15/27 | | | 5,750,000 | | | | 8,483,607 | |
6.250%, 08/15/23 | | | 7,700,000 | | | | 10,324,390 | |
6.375%, 08/15/27 | | | 6,900,000 | | | | 10,308,186 | |
6.500%, 11/15/26 | | | 4,500,000 | | | | 6,663,960 | |
7.125%, 02/15/23 | | | 11,125,000 | | | | 15,318,123 | |
7.250%, 08/15/22 | | | 6,120,000 | | | | 8,332,992 | |
7.875%, 02/15/21 | | | 4,450,000 | | | | 5,839,379 | |
8.000%, 11/15/21 | | | 2,920,000 | | | | 3,975,609 | |
8.125%, 08/15/19 | | | 2,645,000 | | | | 3,246,526 | |
8.125%, 08/15/21 | | | 1,250,000 | | | | 1,692,312 | |
8.500%, 02/15/20 | | | 6,700,000 | | | | 8,540,088 | |
8.750%, 08/15/20 | | | 1,000,000 | | | | 1,317,980 | |
8.875%, 02/15/19 | | | 10,215,000 | | | | 12,399,988 | |
9.125%, 05/15/18 | | | 1,600,000 | | | | 1,855,920 | |
U.S. Treasury Notes
0.625%, 08/31/17 (b) | | | 21,700,000 | | | | 21,721,266 | |
0.625%, 04/30/18 (b) | | | 5,000,000 | | | | 5,003,650 | |
0.750%, 01/31/18 | | | 12,000,000 | | | | 12,033,961 | |
0.750%, 02/28/18 | | | 40,500,000 | | | | 40,616,239 | |
0.875%, 11/30/17 (b) | | | 12,000,000 | | | | 12,052,079 | |
1.000%, 12/31/17 (b) | | | 11,000,000 | | | | 11,070,620 | |
1.000%, 08/15/18 | | | 28,000,000 | | | | 28,227,359 | |
1.125%, 05/31/19 | | | 12,300,000 | | | | 12,452,766 | |
See accompanying notes to financial statements.
MSF-8
Metropolitan Series Fund
Barclays Aggregate Bond Index Portfolio
Schedule of Investments as of June 30, 2016 (Unaudited)
U.S. Treasury & Government Agencies—(Continued)
| | | | | | | | |
| Security Description | | Principal
Amount* | | | Value | |
|
U.S. Treasury—(Continued) | |
U.S. Treasury Notes
1.125%, 03/31/20 | | | 5,100,000 | | | $ | 5,152,326 | |
1.125%, 02/28/21 | | | 5,000,000 | | | | 5,035,300 | |
1.250%, 10/31/19 | | | 5,130,000 | | | | 5,212,234 | |
1.250%, 01/31/20 | | | 15,000,000 | | | | 15,219,600 | |
1.250%, 02/29/20 | | | 25,800,000 | | | | 26,187,516 | |
1.375%, 09/30/18 (b) | | | 47,890,000 | | | | 48,687,365 | |
1.375%, 11/30/18 | | | 15,000,000 | | | | 15,262,350 | |
1.375%, 01/31/20 | | | 27,100,000 | | | | 27,623,301 | |
1.375%, 08/31/20 | | | 14,900,000 | | | | 15,174,311 | |
1.500%, 03/31/19 (b) | | | 31,870,000 | | | | 32,592,808 | |
1.500%, 02/28/23 | | | 4,000,000 | | | | 4,059,000 | |
1.625%, 11/30/20 | | | 5,000,000 | | | | 5,146,600 | |
1.625%, 11/15/22 | | | 5,000,000 | | | | 5,117,851 | |
1.625%, 05/31/23 (b) | | | 7,900,000 | | | | 8,078,066 | |
1.750%, 10/31/20 | | | 10,000,000 | | | | 10,336,499 | |
1.750%, 12/31/20 | | | 14,800,000 | | | | 15,309,712 | |
1.750%, 02/28/22 | | | 9,000,000 | | | | 9,301,860 | |
1.750%, 05/15/22 | | | 4,900,000 | | | | 5,063,023 | |
1.750%, 05/15/23 | | | 17,520,000 | | | | 18,072,406 | |
1.875%, 09/30/17 | | | 15,900,000 | | | | 16,162,668 | |
1.875%, 08/31/22 | | | 7,400,000 | | | | 7,691,856 | |
2.000%, 11/30/20 | | | 14,800,000 | | | | 15,465,999 | |
2.000%, 02/28/21 | | | 5,000,000 | | | | 5,231,050 | |
2.000%, 10/31/21 | | | 6,000,000 | | | | 6,285,600 | |
2.000%, 02/15/22 | | | 3,800,000 | | | | 3,980,956 | |
2.000%, 02/15/23 | | | 6,900,000 | | | | 7,227,888 | |
2.000%, 02/15/25 | | | 5,000,000 | | | | 5,229,200 | |
2.000%, 08/15/25 | | | 5,000,000 | | | | 5,225,050 | |
2.125%, 08/31/20 | | | 5,800,000 | | | | 6,084,142 | |
2.125%, 06/30/21 | | | 12,000,000 | | | | 12,642,240 | |
2.125%, 08/15/21 | | | 8,710,000 | | | | 9,179,556 | |
2.125%, 05/15/25 | | | 7,100,000 | | | | 7,496,464 | |
2.250%, 07/31/21 | | | 19,000,000 | | | | 20,133,158 | |
2.250%, 11/15/24 | | | 7,800,000 | | | | 8,317,530 | |
2.250%, 11/15/25 (b) | | | 6,800,000 | | | | 7,252,064 | |
2.375%, 05/31/18 | | | 31,000,000 | | | | 32,054,618 | |
2.375%, 12/31/20 | | | 7,600,000 | | | | 8,068,920 | |
2.375%, 08/15/24 | | | 16,800,000 | | | | 18,077,978 | |
2.500%, 08/15/23 | | | 14,400,000 | | | | 15,598,943 | |
2.500%, 05/15/24 | | | 7,000,000 | | | | 7,603,049 | |
2.625%, 08/15/20 (b) | | | 6,000,000 | | | | 6,415,560 | |
2.750%, 11/15/23 (b) | | | 19,335,000 | | | | 21,312,971 | |
2.750%, 02/15/24 | | | 5,600,000 | | | | 6,181,616 | |
3.125%, 05/15/19 | | | 3,000,000 | | | | 3,207,600 | |
3.375%, 11/15/19 | | | 4,350,000 | | | | 4,728,493 | |
3.500%, 02/15/18 | | | 4,000,000 | | | | 4,188,520 | |
3.500%, 05/15/20 | | | 7,790,000 | | | | 8,564,793 | |
3.625%, 02/15/20 | | | 17,190,000 | | | | 18,920,861 | |
3.750%, 11/15/18 | | | 4,550,000 | | | | 4,885,244 | |
3.875%, 05/15/18 | | | 4,700,000 | | | | 4,992,716 | |
4.000%, 08/15/18 | | | 9,620,000 | | | | 10,324,761 | |
4.250%, 11/15/17 | | | 4,700,000 | | | | 4,937,209 | |
| | | | | | | | |
| | | | | | | 1,002,396,501 | |
| | | | | | | | |
Total U.S. Treasury & Government Agencies
(Cost $1,739,891,829) | | | | | | | 1,840,037,097 | |
| | | | | | | | |
| Corporate Bonds & Notes—27.0% | |
| Security Description | | Principal
Amount* | | | Value | |
| | |
Aerospace/Defense—0.4% | | | | | | | | |
Boeing Co. (The)
7.250%, 06/15/25 | | | 460,000 | | | | 634,932 | |
Lockheed Martin Corp.
4.700%, 05/15/46 | | | 3,000,000 | | | | 3,501,714 | |
6.150%, 09/01/36 | | | 1,700,000 | | | | 2,263,443 | |
Northrop Grumman Systems Corp.
7.750%, 02/15/31 | | | 515,000 | | | | 769,552 | |
Raytheon Co.
3.125%, 10/15/20 | | | 1,000,000 | | | | 1,069,612 | |
United Technologies Corp.
4.500%, 06/01/42 | | | 2,645,000 | | | | 3,026,900 | |
7.500%, 09/15/29 | | | 200,000 | | | | 295,463 | |
| | | | | | | | |
| | | | | | | 11,561,616 | |
| | | | | | | | |
|
Agriculture—0.3% | |
Altria Group, Inc.
9.700%, 11/10/18 | | | 750,000 | | | | 894,049 | |
Archer-Daniels-Midland Co.
4.479%, 03/01/21 | | | 2,000,000 | | | | 2,253,572 | |
Philip Morris International, Inc.
3.250%, 11/10/24 (b) | | | 3,000,000 | | | | 3,195,703 | |
4.500%, 03/26/20 (b) | | | 925,000 | | | | 1,028,474 | |
| | | | | | | | |
| | | | | | | 7,371,798 | |
| | | | | | | | |
|
Auto Manufacturers—0.6% | |
Daimler Finance North America LLC
8.500%, 01/18/31 | | | 1,050,000 | | | | 1,702,444 | |
Ford Motor Co.
7.450%, 07/16/31 | | | 2,200,000 | | | | 2,942,894 | |
Ford Motor Credit Co. LLC
2.597%, 11/04/19 | | | 3,000,000 | | | | 3,063,911 | |
General Motors Financial Co., Inc.
2.625%, 07/10/17 | | | 4,000,000 | | | | 4,037,767 | |
Toyota Motor Credit Corp.
3.300%, 01/12/22 | | | 4,000,000 | | | | 4,306,850 | |
| | | | | | | | |
| | | | | | | 16,053,866 | |
| | | | | | | | |
|
Banks—5.7% | |
Bank of America Corp.
3.300%, 01/11/23 | | | 4,075,000 | | | | 4,197,165 | |
4.100%, 07/24/23 | | | 2,905,000 | | | | 3,127,271 | |
4.200%, 08/26/24 | | | 3,000,000 | | | | 3,116,554 | |
5.875%, 02/07/42 | | | 3,000,000 | | | | 3,775,204 | |
6.500%, 07/15/18 | | | 200,000 | | | | 218,515 | |
Bank of New York Mellon Corp. (The)
5.450%, 05/15/19 | | | 2,000,000 | | | | 2,225,115 | |
Bank of Nova Scotia (The)
2.050%, 10/30/18 | | | 3,480,000 | | | | 3,540,366 | |
Barclays Bank plc
5.000%, 09/22/16 | | | 1,750,000 | | | | 1,764,831 | |
BNP Paribas S.A.
5.000%, 01/15/21 | | | 3,225,000 | | | | 3,613,756 | |
Branch Banking & Trust Co.
2.850%, 04/01/21 | | | 3,400,000 | | | | 3,559,871 | |
See accompanying notes to financial statements.
MSF-9
Metropolitan Series Fund
Barclays Aggregate Bond Index Portfolio
Schedule of Investments as of June 30, 2016 (Unaudited)
Corporate Bonds & Notes—(Continued)
| | | | | | | | |
| Security Description | | Principal
Amount* | | | Value | |
|
Banks—(Continued) | |
Capital One Financial Corp.
6.750%, 09/15/17 | | | 1,200,000 | | | $ | 1,272,093 | |
Citigroup, Inc.
5.375%, 08/09/20 | | | 2,200,000 | | | | 2,466,749 | |
5.850%, 08/02/16 | | | 500,000 | | | | 501,787 | |
6.125%, 11/21/17 | | | 1,700,000 | | | | 1,805,412 | |
6.125%, 05/15/18 | | | 1,900,000 | | | | 2,053,808 | |
Cooperatieve Rabobank UA
5.250%, 05/24/41 | | | 3,640,000 | | | | 4,508,338 | |
Credit Suisse
4.375%, 08/05/20 | | | 2,611,000 | | | | 2,825,230 | |
Credit Suisse Group Funding Guernsey, Ltd.
3.800%, 09/15/22 | | | 3,000,000 | | | | 3,013,901 | |
Deutsche Bank AG
6.000%, 09/01/17 | | | 1,500,000 | | | | 1,571,622 | |
Fifth Third Bancorp
8.250%, 03/01/38 | | | 1,175,000 | | | | 1,734,871 | |
Goldman Sachs Group, Inc. (The)
6.000%, 06/15/20 | | | 2,000,000 | | | | 2,281,089 | |
6.125%, 02/15/33 | | | 2,075,000 | | | | 2,587,757 | |
6.450%, 05/01/36 | | | 2,000,000 | | | | 2,343,916 | |
6.750%, 10/01/37 | | | 3,500,000 | | | | 4,314,161 | |
HSBC Holdings plc
5.100%, 04/05/21 | | | 2,556,000 | | | | 2,814,440 | |
6.500%, 09/15/37 | | | 905,000 | | | | 1,065,992 | |
HSBC USA, Inc.
2.350%, 03/05/20 | | | 3,000,000 | | | | 2,987,898 | |
JPMorgan Chase & Co.
1.700%, 03/01/18 | | | 2,000,000 | | | | 2,009,618 | |
3.250%, 09/23/22 | | | 2,850,000 | | | | 2,966,654 | |
3.900%, 07/15/25 | | | 4,700,000 | | | | 5,072,152 | |
4.950%, 03/25/20 | | | 2,650,000 | | | | 2,923,266 | |
6.300%, 04/23/19 | | | 1,900,000 | | | | 2,130,217 | |
JPMorgan Chase Bank N.A.
6.000%, 10/01/17 | | | 2,700,000 | | | | 2,851,850 | |
KeyBank N.A.
3.300%, 06/01/25 | | | 3,800,000 | | | | 4,006,633 | |
KFW
1.000%, 06/11/18 | | | 3,536,000 | | | | 3,549,004 | |
2.375%, 08/25/21 (b) | | | 1,945,000 | | | | 2,047,065 | |
2.750%, 09/08/20 | | | 2,300,000 | | | | 2,449,720 | |
Lloyds Bank plc
6.375%, 01/21/21 (b) | | | 1,500,000 | | | | 1,740,715 | |
Morgan Stanley
4.350%, 09/08/26 | | | 3,800,000 | | | | 3,960,526 | |
5.625%, 09/23/19 | | | 1,900,000 | | | | 2,106,315 | |
7.250%, 04/01/32 | | | 1,850,000 | | | | 2,543,449 | |
7.300%, 05/13/19 | | | 2,460,000 | | | | 2,824,735 | |
Oesterreichische Kontrollbank AG
1.625%, 03/12/19 | | | 3,025,000 | | | | 3,077,144 | |
PNC Bank N.A.
2.950%, 02/23/25 | | | 4,100,000 | | | | 4,243,237 | |
4.875%, 09/21/17 | | | 1,000,000 | | | | 1,042,048 | |
5.250%, 01/15/17 (b) | | | 1,600,000 | | | | 1,638,053 | |
Royal Bank of Canada
2.150%, 03/15/19 (b) | | | 3,915,000 | | | | 3,992,114 | |
|
Banks—(Continued) | |
Sumitomo Mitsui Banking Corp.
1.950%, 07/23/18 | | | 4,000,000 | | | | 4,030,554 | |
Toronto-Dominion Bank (The)
2.250%, 11/05/19 | | | 4,000,000 | | | | 4,096,787 | |
U.S. Bancorp
3.600%, 09/11/24 (b) | | | 3,000,000 | | | | 3,219,370 | |
UBS AG
4.875%, 08/04/20 | | | 3,500,000 | | | | 3,883,932 | |
Wachovia Corp.
5.750%, 06/15/17 | | | 700,000 | | | | 730,566 | |
Wells Fargo & Co.
2.600%, 07/22/20 | | | 4,000,000 | | | | 4,122,304 | |
3.000%, 01/22/21 (b) | | | 3,400,000 | | | | 3,557,246 | |
Wells Fargo Bank N.A.
5.950%, 08/26/36 | | | 1,900,000 | | | | 2,389,382 | |
Westpac Banking Corp.
1.950%, 11/23/18 | | | 3,000,000 | | | | 3,035,746 | |
| | | | | | | | |
| | | | | | | 155,528,114 | |
| | | | | | | | |
|
Beverages—0.8% | |
Anheuser-Busch Cos. LLC
6.450%, 09/01/37 (b) | | | 880,000 | | | | 1,162,457 | |
Anheuser-Busch InBev Finance, Inc.
1.250%, 01/17/18 | | | 3,500,000 | | | | 3,506,851 | |
4.900%, 02/01/46 | | | 7,800,000 | | | | 9,126,725 | |
Coca-Cola Co. (The)
3.150%, 11/15/20 (b) | | | 280,000 | | | | 300,278 | |
3.200%, 11/01/23 | | | 3,000,000 | | | | 3,234,949 | |
Pepsi Bottling Group, Inc. (The)
7.000%, 03/01/29 | | | 300,000 | | | | 425,888 | |
PepsiCo, Inc.
3.600%, 03/01/24 | | | 3,975,000 | | | | 4,361,242 | |
5.000%, 06/01/18 (b) | | | 1,000,000 | | | | 1,076,303 | |
| | | | | | | | |
| | | | | | | 23,194,693 | |
| | | | | | | | |
|
Biotechnology—0.4% | |
Amgen, Inc.
5.700%, 02/01/19 | | | 850,000 | | | | 942,287 | |
6.150%, 06/01/18 (b) | | | 1,650,000 | | | | 1,802,902 | |
Celgene Corp.
4.625%, 05/15/44 | | | 4,000,000 | | | | 4,145,456 | |
Gilead Sciences, Inc.
3.650%, 03/01/26 | | | 3,000,000 | | | | 3,257,863 | |
| | | | | | | | |
| | | | | | | 10,148,508 | |
| | | | | | | | |
|
Chemicals—0.6% | |
Dow Chemical Co. (The)
4.250%, 11/15/20 | | | 2,750,000 | | | | 2,994,253 | |
9.400%, 05/15/39 | | | 650,000 | | | | 1,010,862 | |
E. I. du Pont de Nemours & Co.
5.600%, 12/15/36 | | | 1,000,000 | | | | 1,196,253 | |
6.000%, 07/15/18 | | | 1,000,000 | | | | 1,092,738 | |
LyondellBasell Industries NV
4.625%, 02/26/55 | | | 4,400,000 | | | | 4,223,936 | |
See accompanying notes to financial statements.
MSF-10
Metropolitan Series Fund
Barclays Aggregate Bond Index Portfolio
Schedule of Investments as of June 30, 2016 (Unaudited)
Corporate Bonds & Notes—(Continued)
| | | | | | | | |
| Security Description | | Principal
Amount* | | | Value | |
|
Chemicals—(Continued) | |
Potash Corp. of Saskatchewan, Inc.
4.875%, 03/30/20 (b) | | | 970,000 | | | $ | 1,065,933 | |
Praxair, Inc.
3.000%, 09/01/21 (b) | | | 3,950,000 | | | | 4,189,839 | |
| | | | | | | | |
| | | | | | | 15,773,814 | |
| | | | | | | | |
|
Computers—0.4% | |
Apple, Inc.
2.250%, 02/23/21 (b) | | | 3,000,000 | | | | 3,084,776 | |
2.400%, 05/03/23 | | | 2,072,000 | | | | 2,108,156 | |
4.450%, 05/06/44 | | | 2,944,000 | | | | 3,204,246 | |
International Business Machines Corp.
4.000%, 06/20/42 (b) | | | 3,200,000 | | | | 3,406,361 | |
8.375%, 11/01/19 | | | 425,000 | | | | 520,807 | |
| | | | | | | | |
| | | | | | | 12,324,346 | |
| | | | | | | | |
|
Cosmetics/Personal Care—0.1% | |
Procter & Gamble Co. (The)
2.300%, 02/06/22 | | | 3,600,000 | | | | 3,731,453 | |
6.450%, 01/15/26 | | | 200,000 | | | | 271,250 | |
| | | | | | | | |
| | | | | | | 4,002,703 | |
| | | | | | | | |
|
Diversified Financial Services—0.9% | |
Air Lease Corp.
2.625%, 09/04/18 | | | 4,000,000 | | | | 4,006,713 | |
American Express Co.
7.000%, 03/19/18 | | | 3,000,000 | | | | 3,280,030 | |
Associates Corp. of North America
6.950%, 11/01/18 | | | 1,700,000 | | | | 1,897,388 | |
BlackRock, Inc.
3.500%, 03/18/24 (b) | | | 3,800,000 | | | | 4,094,246 | |
HSBC Finance Corp.
6.676%, 01/15/21 | | | 3,500,000 | | | | 3,913,656 | |
National Rural Utilities Cooperative Finance Corp.
10.375%, 11/01/18 | | | 2,900,000 | | | | 3,501,192 | |
Nomura Holdings, Inc.
6.700%, 03/04/20 (b) | | | 1,325,000 | | | | 1,535,105 | |
Visa, Inc.
2.800%, 12/14/22 | | | 3,000,000 | | | | 3,156,573 | |
| | | | | | | | |
| | | | | | | 25,384,903 | |
| | | | | | | | |
|
Electric—1.8% | |
CenterPoint Energy Houston Electric LLC
4.500%, 04/01/44 | | | 3,800,000 | | | | 4,467,453 | |
Consolidated Edison Co. of New York, Inc.
3.950%, 03/01/43 | | | 3,070,000 | | | | 3,189,955 | |
5.850%, 04/01/18 | | | 855,000 | | | | 924,535 | |
Dominion Resources, Inc.
6.400%, 06/15/18 | | | 1,750,000 | | | | 1,909,591 | |
DTE Electric Co.
3.700%, 03/15/45 (b) | | | 4,000,000 | | | | 4,220,163 | |
Duke Energy Carolinas LLC
5.300%, 02/15/40 | | | 2,000,000 | | | | 2,532,223 | |
|
Electric—(Continued) | |
Duke Energy Corp.
3.050%, 08/15/22 | | | 4,000,000 | | | | 4,149,431 | |
Exelon Corp.
5.625%, 06/15/35 | | | 1,500,000 | | | | 1,793,867 | |
Florida Power & Light Co.
5.950%, 02/01/38 | | | 1,700,000 | | | | 2,331,940 | |
Georgia Power Co.
5.700%, 06/01/17 | | | 1,400,000 | | | | 1,458,013 | |
Nisource Finance Corp.
4.800%, 02/15/44 | | | 4,000,000 | | | | 4,588,124 | |
Northern States Power Co.
6.250%, 06/01/36 | | | 2,200,000 | | | | 3,068,259 | |
Ohio Power Co.
5.375%, 10/01/21 | | | 1,640,000 | | | | 1,898,109 | |
Oncor Electric Delivery Co. LLC
7.000%, 05/01/32 | | | 950,000 | | | | 1,307,059 | |
Pacific Gas & Electric Co.
5.400%, 01/15/40 | | | 3,320,000 | | | | 4,174,520 | |
PacifiCorp
2.950%, 02/01/22 | | | 2,800,000 | | | | 2,956,495 | |
PPL Capital Funding, Inc.
3.400%, 06/01/23 | | | 4,000,000 | | | | 4,176,210 | |
PSEG Power LLC
8.625%, 04/15/31 | | | 1,000,000 | | | | 1,244,200 | |
| | | | | | | | |
| | | | | | | 50,390,147 | |
| | | | | | | | |
|
Electrical Components & Equipment—0.1% | |
Emerson Electric Co.
4.875%, 10/15/19 (b) | | | 1,800,000 | | | | 1,996,949 | |
| | | | | | | | |
| | |
Electronics—0.2% | | | | | | | | |
Honeywell International, Inc.
5.000%, 02/15/19 (b) | | | 2,000,000 | | | | 2,198,029 | |
Koninklijke Philips NV
5.750%, 03/11/18 | | | 900,000 | | | | 963,082 | |
Tyco Electronics Group S.A.
6.550%, 10/01/17 | | | 1,600,000 | | | | 1,701,877 | |
| | | | | | | | |
| | | | | | | 4,862,988 | |
| | | | | | | | |
|
Environmental Control—0.1% | |
Waste Management, Inc.
7.000%, 07/15/28 | | | 1,265,000 | | | | 1,705,193 | |
| | | | | | | | |
| | |
Food—0.5% | | | | | | | | |
ConAgra Foods, Inc.
5.819%, 06/15/17 | | | 1,000,000 | | | | 1,041,872 | |
General Mills, Inc.
5.650%, 02/15/19 | | | 1,700,000 | | | | 1,889,770 | |
Kroger Co. (The)
3.300%, 01/15/21 (b) | | | 3,900,000 | | | | 4,146,840 | |
Mondelez International, Inc.
5.375%, 02/10/20 | | | 1,800,000 | | | | 2,036,279 | |
Sysco Corp.
2.600%, 06/12/22 (b) | | | 2,400,000 | | | | 2,437,791 | |
See accompanying notes to financial statements.
MSF-11
Metropolitan Series Fund
Barclays Aggregate Bond Index Portfolio
Schedule of Investments as of June 30, 2016 (Unaudited)
Corporate Bonds & Notes—(Continued)
| | | | | | | | |
| Security Description | | Principal
Amount* | | | Value | |
| | |
Food—(Continued) | | | | | | | | |
Unilever Capital Corp.
5.900%, 11/15/32 | | | 1,500,000 | | | $ | 2,079,591 | |
| | | | | | | | |
| | | | | | | 13,632,143 | |
| | | | | | | | |
|
Forest Products & Paper—0.1% | |
Georgia-Pacific LLC
8.000%, 01/15/24 | | | 1,800,000 | | | | 2,396,829 | |
| | | | | | | | |
|
Gas—0.0% | |
Sempra Energy
6.150%, 06/15/18 | | | 900,000 | | | | 977,399 | |
| | | | | | | | |
| | |
Healthcare-Products—0.5% | | | | | | | | |
Abbott Laboratories
5.125%, 04/01/19 | | | 1,073,000 | | | | 1,171,751 | |
Becton Dickinson & Co.
4.685%, 12/15/44 | | | 3,500,000 | | | | 3,955,452 | |
Medtronic, Inc.
4.000%, 04/01/43 | | | 3,900,000 | | | | 4,187,491 | |
Thermo Fisher Scientific, Inc.
4.150%, 02/01/24 | | | 3,445,000 | | | | 3,752,784 | |
| | | | | | | | |
| | | | | | | 13,067,478 | |
| | | | | | | | |
|
Healthcare-Services—0.5% | |
Aetna, Inc.
2.750%, 11/15/22 | | | 3,000,000 | | | | 3,031,278 | |
Anthem, Inc.
5.850%, 01/15/36 | | | 1,800,000 | | | | 2,135,764 | |
Cigna Corp.
5.375%, 02/15/42 | | | 3,000,000 | | | | 3,510,168 | |
Laboratory Corp. of America Holdings
4.625%, 11/15/20 (b) | | | 1,900,000 | | | | 2,071,630 | |
UnitedHealth Group, Inc.
3.750%, 07/15/25 | | | 3,600,000 | | | | 3,949,621 | |
| | | | | | | | |
| | | | | | | 14,698,461 | |
| | | | | | | | |
|
Household Products/Wares—0.0% | |
Kimberly-Clark Corp.
6.125%, 08/01/17 | | | 500,000 | | | | 528,704 | |
| | | | | | | | |
|
Insurance—1.0% | |
Aflac, Inc.
3.625%, 06/15/23 | | | 2,975,000 | | | | 3,168,972 | |
Allstate Corp. (The)
6.900%, 05/15/38 | | | 150,000 | | | | 215,324 | |
7.450%, 05/16/19 | | | 1,700,000 | | | | 1,980,653 | |
American International Group, Inc.
3.300%, 03/01/21 | | | 3,000,000 | | | | 3,127,776 | |
5.850%, 01/16/18 | | | 1,800,000 | | | | 1,921,967 | |
AXA S.A.
8.600%, 12/15/30 | | | 1,165,000 | | | | 1,549,450 | |
Berkshire Hathaway, Inc.
3.125%, 03/15/26 | | | 2,900,000 | | | | 3,040,778 | |
Chubb Corp. (The)
6.000%, 05/11/37 | | | 865,000 | | | | 1,165,363 | |
|
Insurance—(Continued) | |
Chubb INA Holdings, Inc.
3.350%, 05/15/24 | | | 4,000,000 | | | | 4,266,801 | |
Hartford Financial Services Group, Inc. (The)
6.100%, 10/01/41 | | | 780,000 | | | | 944,980 | |
Marsh & McLennan Cos., Inc.
3.750%, 03/14/26 | | | 4,000,000 | | | | 4,213,512 | |
Prudential Financial, Inc.
5.700%, 12/14/36 | | | 1,525,000 | | | | 1,787,121 | |
| | | | | | | | |
| | | | | | | 27,382,697 | |
| | | | | | | | |
|
Internet—0.2% | |
Amazon.com, Inc.
3.800%, 12/05/24 | | | 3,800,000 | | | | 4,254,537 | |
| | | | | | | | |
|
Iron/Steel—0.0% | |
Vale Overseas, Ltd.
6.875%, 11/21/36 (b) | | | 1,100,000 | | | | 1,013,375 | |
| | | | | | | | |
|
Machinery-Construction & Mining—0.1% | |
Caterpillar, Inc.
7.900%, 12/15/18 | | | 1,757,000 | | | | 2,032,092 | |
| | | | | | | | |
|
Machinery-Diversified—0.1% | |
Deere & Co.
2.600%, 06/08/22 | | | 1,950,000 | | | | 2,013,141 | |
| | | | | | | | |
|
Media—0.9% | |
21st Century Fox America, Inc. | | | | | | | | |
6.550%, 03/15/33 | | | 1,950,000 | | | | 2,464,863 | |
Comcast Corp.
4.650%, 07/15/42 | | | 3,670,000 | | | | 4,205,999 | |
5.650%, 06/15/35 | | | 1,500,000 | | | | 1,901,879 | |
Discovery Communications LLC
6.350%, 06/01/40 | | | 1,800,000 | | | | 1,868,845 | |
Historic TW, Inc.
6.875%, 06/15/18 | | | 1,800,000 | | | | 1,986,053 | |
Thomson Reuters Corp.
6.500%, 07/15/18 | | | 800,000 | | | | 875,074 | |
Time Warner Cable, Inc.
5.000%, 02/01/20 | | | 1,900,000 | | | | 2,066,230 | |
5.850%, 05/01/17 | | | 1,800,000 | | | | 1,863,315 | |
6.550%, 05/01/37 | | | 100,000 | | | | 116,131 | |
Time Warner Entertainment Co. L.P.
8.375%, 03/15/23 (b) | | | 380,000 | | | | 491,304 | |
Time Warner, Inc.
6.100%, 07/15/40 | | | 925,000 | | | | 1,138,683 | |
7.700%, 05/01/32 | | | 685,000 | | | | 953,815 | |
Viacom, Inc.
4.375%, 03/15/43 | | | 3,500,000 | | | | 2,840,826 | |
Walt Disney Co. (The)
2.750%, 08/16/21 | | | 1,930,000 | | | | 2,043,178 | |
| | | | | | | | |
| | | | | | | 24,816,195 | |
| | | | | | | | |
See accompanying notes to financial statements.
MSF-12
Metropolitan Series Fund
Barclays Aggregate Bond Index Portfolio
Schedule of Investments as of June 30, 2016 (Unaudited)
Corporate Bonds & Notes—(Continued)
| | | | | | | | |
| Security Description | | Principal
Amount* | | | Value | |
|
Mining—0.3% | |
Barrick North America Finance LLC
4.400%, 05/30/21 | | | 3,125,000 | | | $ | 3,365,650 | |
Newmont Mining Corp.
6.250%, 10/01/39 (b) | | | 1,800,000 | | | | 1,984,552 | |
Rio Tinto Alcan, Inc.
6.125%, 12/15/33 | | | 1,751,000 | | | | 2,031,040 | |
| | | | | | | | |
| | | | | | | 7,381,242 | |
| | | | | | | | |
|
Miscellaneous Manufacturing—0.7% | |
General Electric Co.
3.375%, 03/11/24 | | | 2,900,000 | | | | 3,151,858 | |
5.250%, 12/06/17 | | | 1,800,000 | | | | 1,911,255 | |
5.300%, 02/11/21 | | | 1,915,000 | | | | 2,213,491 | |
5.400%, 02/15/17 | | | 2,000,000 | | | | 2,055,272 | |
5.500%, 01/08/20 (b) | | | 3,360,000 | | | | 3,823,404 | |
5.875%, 01/14/38 | | | 2,050,000 | | | | 2,757,701 | |
6.750%, 03/15/32 | | | 1,250,000 | | | | 1,753,416 | |
7.500%, 08/21/35 | | | 100,000 | | | | 150,021 | |
Ingersoll-Rand Luxembourg Finance S.A.
2.625%, 05/01/20 | | | 1,200,000 | | | | 1,224,997 | |
| | | | | | | | |
| | | | | | | 19,041,415 | |
| | | | | | | | |
|
Multi-National—1.5% | |
Asian Development Bank
1.625%, 08/26/20 | | | 4,000,000 | | | | 4,081,872 | |
European Bank for Reconstruction & Development
1.000%, 06/15/18 (b) | | | 3,564,000 | | | | 3,577,870 | |
European Investment Bank
1.625%, 06/15/17 | | | 1,975,000 | | | | 1,992,345 | |
2.500%, 10/15/24 (b) | | | 3,800,000 | | | | 4,043,828 | |
4.000%, 02/16/21 | | | 1,700,000 | | | | 1,905,180 | |
4.875%, 02/15/36 | | | 3,700,000 | | | | 5,067,608 | |
5.125%, 05/30/17 | | | 1,750,000 | | | | 1,819,389 | |
Inter-American Development Bank
2.125%, 01/15/25 | | | 3,900,000 | | | | 4,054,878 | |
2.375%, 08/15/17 | | | 2,000,000 | | | | 2,037,863 | |
6.800%, 10/15/25 | | | 500,000 | | | | 696,031 | |
7.000%, 06/15/25 | | | 200,000 | | | | 271,296 | |
International Bank for Reconstruction & Development
2.125%, 03/03/25 | | | 3,000,000 | | | | 3,118,385 | |
7.625%, 01/19/23 | | | 2,970,000 | | | | 4,110,477 | |
8.875%, 03/01/26 | | | 535,000 | | | | 842,526 | |
International Finance Corp.
1.750%, 09/04/18 | | | 2,975,000 | | | | 3,037,513 | |
| | | | | | | | |
| | | | | | | 40,657,061 | |
| | | | | | | | |
|
Office/Business Equipment—0.1% | |
Xerox Corp.
6.350%, 05/15/18 | | | 2,550,000 | | | | 2,690,250 | |
| | | | | | | | |
|
Oil & Gas—1.5% | |
Anadarko Petroleum Corp.
6.375%, 09/15/17 | | | 2,445,000 | | | | 2,578,579 | |
|
Oil & Gas—(Continued) | |
Apache Finance Canada Corp.
7.750%, 12/15/29 | | | 300,000 | | | | 381,992 | |
BP Capital Markets plc
3.245%, 05/06/22 | | | 3,900,000 | | | | 4,086,329 | |
Canadian Natural Resources, Ltd.
6.250%, 03/15/38 | | | 1,800,000 | | | | 1,954,068 | |
Chevron Corp.
3.191%, 06/24/23 | | | 3,025,000 | | | | 3,183,670 | |
ConocoPhillips Canada Funding Co. I
5.950%, 10/15/36 | | | 1,550,000 | | | | 1,831,935 | |
ConocoPhillips Holding Co.
6.950%, 04/15/29 | | | 700,000 | | | | 873,548 | |
Devon Energy Corp.
6.300%, 01/15/19 | | | 850,000 | | | | 918,000 | |
Hess Corp.
8.125%, 02/15/19 | | | 1,630,000 | | | | 1,809,300 | |
Marathon Oil Corp.
6.600%, 10/01/37 | | | 2,000,000 | | | | 2,007,695 | |
Noble Energy, Inc.
3.900%, 11/15/24 (b) | | | 4,200,000 | | | | 4,274,918 | |
Petroleos Mexicanos
6.625%, 06/15/35 | | | 3,400,000 | | | | 3,519,222 | |
Shell International Finance B.V.
4.300%, 09/22/19 | | | 1,000,000 | | | | 1,088,630 | |
4.375%, 05/11/45 | | | 1,900,000 | | | | 2,046,809 | |
Statoil ASA
3.250%, 11/10/24 (b) | | | 3,100,000 | | | | 3,251,795 | |
6.700%, 01/15/18 | | | 300,000 | | | | 324,304 | |
Suncor Energy, Inc.
6.100%, 06/01/18 (b) | | | 2,500,000 | | | | 2,694,613 | |
Total Capital International S.A.
2.700%, 01/25/23 (b) | | | 3,000,000 | | | | 3,073,777 | |
XTO Energy, Inc.
6.500%, 12/15/18 (b) | | | 1,600,000 | | | | 1,800,766 | |
| | | | | | | | |
| | | | | | | 41,699,950 | |
| | | | | | | | |
|
Oil & Gas Services—0.2% | |
Halliburton Co.
3.500%, 08/01/23 | | | 4,000,000 | | | | 4,136,716 | |
| | | | | | | | |
|
Pharmaceuticals—1.1% | |
AbbVie, Inc.
4.400%, 11/06/42 | | | 3,200,000 | | | | 3,242,409 | |
Actavis Funding SCS
2.350%, 03/12/18 | | | 3,900,000 | | | | 3,944,040 | |
AstraZeneca plc
4.000%, 09/18/42 | | | 1,200,000 | | | | 1,232,501 | |
Express Scripts Holding Co.
6.125%, 11/15/41 (b) | | | 1,520,000 | | | | 1,809,774 | |
GlaxoSmithKline Capital, Inc.
6.375%, 05/15/38 | | | 2,100,000 | | | | 2,990,943 | |
Johnson & Johnson
5.950%, 08/15/37 | | | 910,000 | | | | 1,334,096 | |
6.950%, 09/01/29 | | | 250,000 | | | | 369,724 | |
See accompanying notes to financial statements.
MSF-13
Metropolitan Series Fund
Barclays Aggregate Bond Index Portfolio
Schedule of Investments as of June 30, 2016 (Unaudited)
Corporate Bonds & Notes—(Continued)
| | | | | | | | |
| Security Description | | Principal
Amount* | | | Value | |
|
Pharmaceuticals—(Continued) | |
Merck & Co., Inc.
2.400%, 09/15/22 (b) | | | 4,000,000 | | | $ | 4,079,252 | |
6.550%, 09/15/37 | | | 1,000,000 | | | | 1,435,788 | |
Merck Sharp & Dohme Corp.
5.950%, 12/01/28 | | | 300,000 | | | | 393,935 | |
Novartis Capital Corp.
4.400%, 04/24/20 | | | 900,000 | | | | 999,389 | |
Sanofi
4.000%, 03/29/21 (b) | | | 2,775,000 | | | | 3,042,766 | |
Wyeth LLC
5.950%, 04/01/37 | | | 3,300,000 | | | | 4,377,336 | |
| | | | | | | | |
| | | | | | | 29,251,953 | |
| | | | | | | | |
|
Pipelines—0.8% | |
El Paso Natural Gas Co. LLC
8.375%, 06/15/32 | | | 220,000 | | | | 255,415 | |
Enbridge Energy Partners L.P.
5.875%, 10/15/25 (b) | | | 3,000,000 | | | | 3,304,844 | |
Energy Transfer Partners L.P.
4.650%, 06/01/21 | | | 1,950,000 | | | | 2,013,375 | |
5.150%, 03/15/45 | | | 2,600,000 | | | | 2,410,962 | |
Enterprise Products Operating LLC
6.300%, 09/15/17 | | | 1,900,000 | | | | 2,006,342 | |
Kinder Morgan Energy Partners L.P.
6.500%, 02/01/37 | | | 2,000,000 | | | | 2,101,376 | |
Plains All American Pipeline L.P. / PAA Finance Corp.
6.500%, 05/01/18 | | | 2,485,000 | | | | 2,630,131 | |
Tennessee Gas Pipeline Co. LLC
7.000%, 10/15/28 | | | 1,050,000 | | | | 1,189,807 | |
7.625%, 04/01/37 | | | 640,000 | | | | 712,296 | |
TransCanada PipeLines, Ltd.
6.200%, 10/15/37 | | | 1,800,000 | | | | 2,184,006 | |
Williams Partners L.P.
5.250%, 03/15/20 (b) | | | 3,575,000 | | | | 3,646,500 | |
| | | | | | | | |
| | | | | | | 22,455,054 | |
| | | | | | | | |
|
Real Estate Investment Trusts—0.4% | |
AvalonBay Communities, Inc.
6.100%, 03/15/20 | | | 860,000 | | | | 988,126 | |
Boston Properties L.P.
3.850%, 02/01/23 | | | 2,950,000 | | | | 3,156,192 | |
ERP Operating L.P.
5.750%, 06/15/17 | | | 900,000 | | | | 937,550 | |
HCP, Inc.
5.375%, 02/01/21 (b) | | | 2,591,000 | | | | 2,888,205 | |
Kimco Realty Corp.
6.875%, 10/01/19 | | | 550,000 | | | | 633,843 | |
Simon Property Group L.P.
5.250%, 12/01/16 | | | 2,000,000 | | | | 2,013,538 | |
| | | | | | | | |
| | | | | | | 10,617,454 | |
| | | | | | | | |
|
Retail—1.1% | |
Costco Wholesale Corp.
5.500%, 03/15/17 | | | 465,000 | | | | 480,186 | |
|
Retail—(Continued) | |
CVS Health Corp.
2.250%, 12/05/18 (b) | | | 3,930,000 | | | | 4,018,531 | |
Home Depot, Inc. (The)
2.000%, 04/01/21 (b) | | | 3,000,000 | | | | 3,068,010 | |
4.400%, 04/01/21 | | | 1,450,000 | | | | 1,631,313 | |
Lowe’s Cos., Inc.
6.875%, 02/15/28 | | | 1,000,000 | | | | 1,392,862 | |
Macy’s Retail Holdings, Inc.
4.300%, 02/15/43 | | | 4,600,000 | | | | 3,609,853 | |
McDonald’s Corp.
3.700%, 01/30/26 | | | 6,000,000 | | | | 6,469,185 | |
5.350%, 03/01/18 | | | 885,000 | | | | 945,688 | |
Target Corp.
6.350%, 11/01/32 | | | 708,000 | | | | 961,096 | |
Wal-Mart Stores, Inc.
2.550%, 04/11/23 | | | 4,000,000 | | | | 4,170,345 | |
5.250%, 09/01/35 | | | 935,000 | | | | 1,219,839 | |
5.625%, 04/15/41 | | | 1,900,000 | | | | 2,548,144 | |
Walgreen Co.
5.250%, 01/15/19 (b) | | | 225,000 | | | | 243,856 | |
| | | | | | | | |
| | | | | | | 30,758,908 | |
| | | | | | | | |
|
Semiconductors—0.2% | |
Intel Corp.
2.700%, 12/15/22 | | | 2,000,000 | | | | 2,096,151 | |
QUALCOMM, Inc.
3.450%, 05/20/25 (b) | | | 4,000,000 | | | | 4,231,537 | |
| | | | | | | | |
| | | | | | | 6,327,688 | |
| | | | | | | | |
|
Software—0.8% | |
Adobe Systems, Inc.
4.750%, 02/01/20 (b) | | | 2,200,000 | | | | 2,427,035 | |
Fidelity National Information Services, Inc.
2.850%, 10/15/18 (b) | | | 4,000,000 | | | | 4,103,534 | |
Microsoft Corp.
2.000%, 11/03/20 | | | 3,000,000 | | | | 3,075,990 | |
4.200%, 06/01/19 | | | 2,700,000 | | | | 2,937,535 | |
Oracle Corp.
2.375%, 01/15/19 | | | 3,885,000 | | | | 4,003,228 | |
4.125%, 05/15/45 | | | 4,200,000 | | | | 4,320,946 | |
| | | | | | | | |
| | | | | | | 20,868,268 | |
| | | | | | | | |
|
Telecommunications—1.6% | |
America Movil S.A.B. de C.V.
5.625%, 11/15/17 | | | 2,700,000 | | | | 2,850,971 | |
AT&T Mobility LLC
7.125%, 12/15/31 | | | 100,000 | | | | 134,454 | |
AT&T, Inc.
2.450%, 06/30/20 | | | 4,100,000 | | | | 4,182,374 | |
5.000%, 03/01/21 | | | 2,600,000 | | | | 2,900,945 | |
5.500%, 02/01/18 | | | 3,500,000 | | | | 3,726,070 | |
5.800%, 02/15/19 | | | 1,700,000 | | | | 1,883,291 | |
6.300%, 01/15/38 | | | 1,300,000 | | | | 1,555,058 | |
British Telecommunications plc
9.375%, 12/15/30 | | | 1,000,000 | | | | 1,535,811 | |
See accompanying notes to financial statements.
MSF-14
Metropolitan Series Fund
Barclays Aggregate Bond Index Portfolio
Schedule of Investments as of June 30, 2016 (Unaudited)
Corporate Bonds & Notes—(Continued)
| | | | | | | | |
| Security Description | | Principal
Amount* | | | Value | |
|
Telecommunications—(Continued) | |
Cisco Systems, Inc.
5.500%, 01/15/40 | | | 2,000,000 | | | $ | 2,628,242 | |
Deutsche Telekom International Finance B.V.
8.750%, 06/15/30 | | | 1,000,000 | | | | 1,504,986 | |
Orange S.A.
5.500%, 02/06/44 (b) | | | 2,400,000 | | | | 3,008,378 | |
Rogers Communications, Inc.
6.800%, 08/15/18 | | | 800,000 | | | | 883,047 | |
Telefonica Emisiones S.A.U.
6.221%, 07/03/17 | | | 1,400,000 | | | | 1,467,278 | |
Verizon Communications, Inc.
4.600%, 04/01/21 | | | 2,400,000 | | | | 2,692,354 | |
5.150%, 09/15/23 | | | 3,510,000 | | | | 4,085,939 | |
6.100%, 04/15/18 | | | 1,600,000 | | | | 1,737,065 | |
6.550%, 09/15/43 | | | 3,304,000 | | | | 4,440,247 | |
Verizon New York, Inc.
7.375%, 04/01/32 | | | 500,000 | | | | 607,530 | |
Vodafone Group plc
6.150%, 02/27/37 | | | 2,170,000 | | | | 2,515,087 | |
| | | | | | | | |
| | | | | | | 44,339,127 | |
| | | | | | | | |
|
Transportation—0.4% | |
Burlington Northern Santa Fe LLC
4.150%, 04/01/45 | | | 3,900,000 | | | | 4,223,716 | |
CSX Corp.
6.150%, 05/01/37 | | | 1,600,000 | | | | 2,087,085 | |
7.900%, 05/01/17 | | | 500,000 | | | | 527,709 | |
FedEx Corp.
8.000%, 01/15/19 | | | 675,000 | | | | 783,246 | |
Norfolk Southern Corp.
3.000%, 04/01/22 | | | 1,911,000 | | | | 1,996,355 | |
5.590%, 05/17/25 | | | 28,000 | | | | 33,993 | |
Union Pacific Corp.
6.625%, 02/01/29 | | | 1,200,000 | | | | 1,669,303 | |
United Parcel Service, Inc.
5.125%, 04/01/19 | | | 760,000 | | | | 841,421 | |
| | | | | | | | |
| | | | | | | 12,162,828 | |
| | | | | | | | |
Total Corporate Bonds & Notes
(Cost $707,351,158) | | | | | | | 739,500,603 | |
| | | | | | | | |
|
| Foreign Government—2.0% | |
|
Banks—0.4% | |
KFW
0.875%, 04/19/18 | | | 3,500,000 | | | | 3,505,409 | |
1.625%, 03/15/21 | | | 3,500,000 | | | | 3,562,023 | |
Landwirtschaftliche Rentenbank
2.000%, 01/13/25 | | | 3,500,000 | | | | 3,590,164 | |
| | | | | | | | |
| | | | | | | 10,657,596 | |
| | | | | | | | |
|
Electric—0.1% | |
Hydro-Quebec
8.400%, 01/15/22 | | | 1,000,000 | | | | 1,325,890 | |
| | | | | | | | |
|
Provincial—0.3% | |
Province of British Columbia Canada
2.000%, 10/23/22 | | | 1,970,000 | | | | 2,026,982 | |
Province of Nova Scotia Canada
9.250%, 03/01/20 | | | 250,000 | | | | 315,005 | |
Province of Ontario Canada
2.450%, 06/29/22 | | | 4,000,000 | | | | 4,182,706 | |
4.400%, 04/14/20 | | | 2,100,000 | | | | 2,338,652 | |
Province of Quebec Canada
7.500%, 07/15/23 | | | 350,000 | | | | 469,805 | |
| | | | | | | | |
| | | | | | | 9,333,150 | |
| | | | | | | | |
|
Sovereign—1.2% | |
Canada Government International Bonds
1.625%, 02/27/19 | | | 4,000,000 | | | | 4,087,932 | |
Colombia Government International Bonds
8.125%, 05/21/24 (b) | | | 1,500,000 | | | | 1,958,329 | |
Mexico Government International Bonds
5.750%, 10/12/10 | | | 4,100,000 | | | | 4,551,501 | |
6.750%, 09/27/34 (b) | | | 1,050,000 | | | | 1,420,415 | |
8.000%, 09/24/22 (b) | | | 2,200,000 | | | | 2,868,188 | |
Panama Government International Bonds
5.200%, 01/30/20 | | | 1,370,000 | | | | 1,517,482 | |
Peruvian Government International Bonds
8.750%, 11/21/33 | | | 1,450,000 | | | | 2,283,651 | |
Philippine Government International Bonds
5.000%, 01/13/37 | | | 1,740,000 | | | | 2,248,950 | |
Republic of Korea
7.125%, 04/16/19 (b) | | | 4,900,000 | | | | 5,689,932 | |
Turkey Government International Bonds
3.250%, 03/23/23 (b) | | | 2,350,000 | | | | 2,263,919 | |
6.250%, 09/26/22 | | | 1,607,000 | | | | 1,815,460 | |
7.375%, 02/05/25 | | | 1,473,000 | | | | 1,816,047 | |
| | | | | | | | |
| | | | | | | 32,521,806 | |
| | | | | | | | |
Total Foreign Government
(Cost $51,338,809) | | | | | | | 53,838,442 | |
| | | | | | | | |
|
| Mortgage-Backed Securities—1.5% | |
|
Commercial Mortgage-Backed Securities—1.5% | |
Citigroup Commercial Mortgage Trust
5.431%, 10/15/49 | | | 1,052,803 | | | | 1,054,825 | |
Commercial Mortgage Trust
3.838%, 09/10/47 | | | 3,800,000 | | | | 4,186,711 | |
3.902%, 07/10/50 | | | 1,835,000 | | | | 2,028,364 | |
6.007%, 12/10/49 (a) | | | 2,182,307 | | | | 2,249,921 | |
Freddie Mac Multifamily Structured Pass-Through Certificates
2.902%, 08/25/20 | | | 1,073,260 | | | | 1,111,285 | |
3.060%, 07/25/23 (a) | | | 4,800,000 | | | | 5,181,552 | |
GS Mortgage Securities Corp. II
3.382%, 05/10/50 | | | 1,835,000 | | | | 1,956,344 | |
GS Mortgage Securities Trust
3.135%, 06/10/46 | | | 2,935,000 | | | | 3,119,055 | |
3.377%, 05/10/45 | | | 2,750,000 | | | | 2,953,163 | |
4.243%, 08/10/46 | | | 966,000 | | | | 1,094,444 | |
See accompanying notes to financial statements.
MSF-15
Metropolitan Series Fund
Barclays Aggregate Bond Index Portfolio
Schedule of Investments as of June 30, 2016 (Unaudited)
Mortgage-Backed Securities—(Continued)
| | | | | | | | |
| Security Description | |
Principal
Amount* | | | Value | |
|
Commercial Mortgage-Backed Securities—(Continued) | |
JPMBB Commercial Mortgage Securities Trust
3.598%, 11/15/48 | | | 3,900,000 | | | $ | 4,222,570 | |
JPMorgan Chase Commercial Mortgage Securities Trust
5.420%, 01/15/49 | | | 2,244,548 | | | | 2,278,182 | |
5.440%, 06/12/47 | | | 760,245 | | | | 771,796 | |
Morgan Stanley Bank of America Merrill Lynch Trust
3.732%, 05/15/48 | | | 3,750,000 | | | | 4,098,578 | |
Morgan Stanley Capital Trust
5.809%, 12/12/49 | | | 2,113,251 | | | | 2,170,904 | |
6.102%, 06/11/49 (a) | | | 1,020,326 | | | | 1,052,059 | |
WF-RBS Commercial Mortgage Trust
3.488%, 06/15/46 | | | 1,054,000 | | | | 1,118,686 | |
| | | | | | | | |
Total Mortgage-Backed Securities
(Cost $39,579,012) | | | | | | | 40,648,439 | |
| | | | | | | | |
|
| Municipals—0.8% | |
Los Angeles Community College District, Build America Bonds
6.750%, 08/01/49 | | | 2,210,000 | | | | 3,481,855 | |
Los Angeles, Unified School District, Build America Bonds
6.758%, 07/01/34 | | | 2,160,000 | | | | 3,112,452 | |
Municipal Electric Authority of Georgia, Build America Bonds
6.637%, 04/01/57 | | | 2,000,000 | | | | 2,674,380 | |
New Jersey State Turnpike Authority, Build America Bonds
7.414%, 01/01/40 | | | 3,500,000 | | | | 5,491,675 | |
Oregon School Boards Association, Build America Bonds
5.680%, 06/30/28 | | | 1,900,000 | | | | 2,423,963 | |
State of California General Obligation Unlimited, Build America Bonds
7.300%, 10/01/39 | | | 2,000,000 | | | | 3,029,040 | |
State of Illinois, Build America Bonds
5.100%, 06/01/33 | | | 1,230,000 | | | | 1,182,116 | |
| | | | | | | | |
Total Municipals
(Cost $17,304,303) | | | | | | | 21,395,481 | |
| | | | | | | | |
|
| Asset-Backed Securities—0.5% | |
|
Asset-Backed - Automobile—0.2% | |
Capital Auto Receivables Asset Trust
1.610%, 06/20/19 | | | 830,000 | | | | 834,897 | |
1.940%, 01/21/20 | | | 2,000,000 | | | | 2,024,400 | |
CarMax Auto Owner Trust
0.970%, 04/16/18 | | | 774,389 | | | | 774,629 | |
Honda Auto Receivables Owner Trust
0.770%, 05/15/17 | | | 17,019 | | | | 17,018 | |
Nissan Auto Receivables Owner Trust
0.750%, 07/15/19 | | | 794,625 | | | | 794,128 | |
|
Asset-Backed - Automobile—(Continued) | |
Volkswagen Auto Loan Enhanced Trust
0.950%, 04/22/19 | | | 1,252,000 | | | | 1,244,386 | |
| | | | | | | | |
| | | | | | | 5,689,458 | |
| | | | | | | | |
|
Asset-Backed - Credit Card—0.3% | |
Capital One Multi-Asset Execution Trust
5.750%, 07/15/20 | | | 1,960,000 | | | | 2,072,896 | |
Citibank Credit Card Issuance Trust
2.880%, 01/23/23 | | | 4,924,000 | | | | 5,233,227 | |
| | | | | | | | |
| | | | | | | 7,306,123 | |
| | | | | | | | |
|
Asset-Backed - Home Equity—0.0% | |
Centex Home Equity Loan Trust
4.250%, 12/25/31 | | | 54,794 | | | | 54,809 | |
| | | | | | | | |
Total Asset-Backed Securities
(Cost $12,874,404) | | | | | | | 13,050,390 | |
| | | | | | | | |
|
| Short-Term Investments—4.8% | |
|
Discount Notes—0.7% | |
Fannie Mae
0.010%, 07/01/16 (c) | | | 500,000 | | | | 500,000 | |
Federal Home Loan Bank
0.010%, 07/01/16 (c) | | | 1,300,000 | | | | 1,300,000 | |
0.199%, 07/06/16 (c) | | | 600,000 | | | | 599,980 | |
0.244%, 07/14/16 (c) | | | 3,400,000 | | | | 3,399,682 | |
0.249%, 07/18/16 (c) | | | 5,200,000 | | | | 5,199,362 | |
0.255%, 07/15/16 (c) | | | 5,500,000 | | | | 5,499,423 | |
Freddie Mac
0.186%, 07/08/16 (c) | | | 2,500,000 | | | | 2,499,898 | |
| | | | | | | | |
| | | | | | | 18,998,345 | |
| | | | | | | | |
|
Mutual Fund—3.3% | |
State Street Navigator Securities Lending MET Portfolio (d) | | | 91,893,408 | | | | 91,893,408 | |
| | | | | | | | |
| | |
U.S. Treasury—0.8% | | | | | | | | |
U.S. Treasury Bills
0.253%, 09/29/16 (c) | | | 23,700,000 | | | | 23,685,069 | |
| | | | | | | | |
Total Short-Term Investments
(Cost $134,576,822) | | | | | | | 134,576,822 | |
| | | | | | | | |
Total Investments—103.8%
(Cost $2,702,916,337) (e) | | | | | | | 2,843,047,274 | |
Other assets and liabilities (net)—(3.8)% | | | | | | | (104,941,081 | ) |
| | | | | | | | |
| Net Assets—100.0% | | | | | | $ | 2,738,106,193 | |
| | | | | | | | |
| * | Principal amount stated in U.S. dollars unless otherwise noted. |
| (a) | Variable or floating rate security. The stated rate represents the rate at June 30, 2016. Maturity date shown for callable securities reflects the earliest possible call date. |
See accompanying notes to financial statements.
MSF-16
Metropolitan Series Fund
Barclays Aggregate Bond Index Portfolio
Schedule of Investments as of June 30, 2016 (Unaudited)
| (b) | All or a portion of the security was held on loan. As of June 30, 2016, the market value of securities loaned was $220,020,717 and the collateral received consisted of cash in the amount of $91,893,408 and non-cash collateral with a value of $139,134,571. The cash collateral is invested in a money market fund managed by an affiliate of the custodian. The non-cash collateral received consists primarily of government securities and bank letters of credit, and is held for the benefit of the Portfolio at the Portfolio’s custodian. The Portfolio cannot repledge or resell this collateral. As such, this collateral is excluded from the Statement of Assets and Liabilities. |
| (c) | The rate shown represents current yield to maturity. |
| (d) | Represents investment of cash collateral received from securities on loan as of June 30, 2016. |
| (e) | As of June 30, 2016, the aggregate cost of investments was $2,702,916,337. The aggregate unrealized appreciation and depreciation of investments were $156,542,016 and $(16,411,079), respectively, resulting in net unrealized appreciation of $140,130,937. |
| (ACES)— | Alternative Credit Enhancement Securities |
| (ARM)— | Adjustable-Rate Mortgage |
Fair Value Hierarchy
Accounting principles generally accepted in the United States of America (“GAAP”) define fair market value as the price that the Portfolio would receive to sell an asset or pay to transfer a liability in an orderly transaction between market participants at the measurement date. It establishes a fair value hierarchy that prioritizes inputs to valuation methods and requires disclosure of the fair value hierarchy, separately for each major category of assets and liabilities, that segregates fair value measurements into three levels. Levels 1, 2 and 3 of the fair value hierarchy are defined as follows:
Level 1 - unadjusted quoted prices in active markets for identical investments
Level 2 - other significant observable inputs (including, but not limited to, quoted prices for similar assets or liabilities in markets that are either active or inactive; inputs other than quoted prices that are observable such as interest rates, yield curves, volatilities, prepayment speeds, loss severities, credit risks, default rates, or other market corroborated inputs)
Level 3 - significant unobservable inputs based on the best information available in the circumstances, to the extent observable inputs are unavailable (including the Portfolio’s own assumptions used in determining the fair value of investments and derivative financial instruments)
The inputs or methodologies used for valuing investments are not necessarily an indication of the risk associated with investing in them. Changes to the inputs or methodologies used may result in transfers between levels, which will be recognized as of the beginning of the reporting period. Information on transfers between Level 1 and Level 2, if any, will be disclosed following the fair value hierarchy table below. A reconciliation of Level 3 securities, if any, will also be disclosed following the fair value hierarchy table. For more information about the Portfolio’s policy regarding the valuation of investments, please refer to the Notes to Financial Statements.
The following table summarizes the fair value hierarchy of the Portfolio’s investments as of June 30, 2016:
| | | | | | | | | | | | | | | | |
| Description | | Level 1 | | | Level 2 | | | Level 3 | | | Total | |
Total U.S. Treasury & Government Agencies* | | $ | — | | | $ | 1,840,037,097 | | | $ | — | | | $ | 1,840,037,097 | |
Total Corporate Bonds & Notes* | | | — | | | | 739,500,603 | | | | — | | | | 739,500,603 | |
Total Foreign Government* | | | — | | | | 53,838,442 | | | | — | | | | 53,838,442 | |
Total Mortgage-Backed Securities* | | | — | | | | 40,648,439 | | | | — | | | | 40,648,439 | |
Total Municipals | | | — | | | | 21,395,481 | | | | — | | | | 21,395,481 | |
Total Asset-Backed Securities* | | | — | | | | 13,050,390 | | | | — | | | | 13,050,390 | |
| Short-Term Investments | | | | | | | | | | | | | | | | |
Discount Notes | | | — | | | | 18,998,345 | | | | — | | | | 18,998,345 | |
Mutual Fund | | | 91,893,408 | | | | — | | | | — | | | | 91,893,408 | |
U.S. Treasury | | | — | | | | 23,685,069 | | | | — | | | | 23,685,069 | |
Total Short-Term Investments | | | 91,893,408 | | | | 42,683,414 | | | | — | | | | 134,576,822 | |
Total Investments | | $ | 91,893,408 | | | $ | 2,751,153,866 | | | $ | — | | | $ | 2,843,047,274 | |
| | | | | | | | | | | | | | | | | |
Collateral for Securities Loaned (Liability) | | $ | — | | | $ | (91,893,408 | ) | | $ | — | | | $ | (91,893,408 | ) |
| * | See Schedule of Investments for additional detailed categorizations. |
See accompanying notes to financial statements.
MSF-17
Metropolitan Series Fund
Barclays Aggregate Bond Index Portfolio
Statement of Assets and Liabilities
June 30, 2016 (Unaudited)
| | | | |
Assets | |
Investments at value (a) (b) | | $ | 2,843,047,274 | |
Cash | | | 113,164 | |
Receivable for: | | | | |
Investments sold | | | 7,453,366 | |
Fund shares sold | | | 726,924 | |
Interest | | | 17,540,715 | |
Prepaid expenses | | | 17,141 | |
| | | | |
Total Assets | | | 2,868,898,584 | |
Liabilities | | | | |
Collateral for securities loaned | | | 91,893,408 | |
Payables for: | | | | |
Investments purchased | | | 36,158,095 | |
Fund shares redeemed | | | 1,438,407 | |
Accrued Expenses: | | | | |
Management fees | | | 535,962 | |
Distribution and service fees | | | 298,976 | |
Deferred trustees’ fees | | | 76,342 | |
Other expenses | | | 391,201 | |
| | | | |
Total Liabilities | | | 130,792,391 | |
| | | | |
Net Assets | | $ | 2,738,106,193 | |
| | | | |
Net Assets Consist of: | | | | |
Paid in surplus | | $ | 2,639,428,241 | |
Undistributed net investment income | | | 29,953,012 | |
Accumulated net realized loss | | | (71,405,997 | ) |
Unrealized appreciation on investments | | | 140,130,937 | |
| | | | |
Net Assets | | $ | 2,738,106,193 | |
| | | | |
Net Assets | | | | |
Class A | | $ | 1,304,780,986 | |
Class B | | | 1,018,915,923 | |
Class E | | | 65,983,808 | |
Class G | | | 348,425,476 | |
Capital Shares Outstanding* | | | | |
Class A | | | 116,818,230 | |
Class B | | | 93,043,337 | |
Class E | | | 5,936,695 | |
Class G | | | 31,915,903 | |
Net Asset Value, Offering Price and Redemption Price Per Share | | | | |
Class A | | $ | 11.17 | |
Class B | | | 10.95 | |
Class E | | | 11.11 | |
Class G | | | 10.92 | |
| * | The Portfolio is authorized to issue an unlimited number of shares. |
| (a) | Identified cost of investments was $2,702,916,337. |
| (b) | Includes securities loaned at value of $220,020,717. |
Statement of Operations
Six Months Ended June 30, 2016 (Unaudited)
| | | | |
Investment Income | |
Interest | | $ | 35,276,472 | |
Securities lending income | | | 127,439 | |
| | | | |
Total investment income | | | 35,403,911 | |
Expenses | | | | |
Management fees | | | 3,251,367 | |
Administration fees | | | 32,915 | |
Custodian and accounting fees | | | 119,496 | |
Distribution and service fees—Class B | | | 1,225,938 | |
Distribution and service fees—Class E | | | 49,092 | |
Distribution and service fees—Class G | | | 480,480 | |
Audit and tax services | | | 42,851 | |
Legal | | | 13,588 | |
Trustees’ fees and expenses | | | 15,990 | |
Shareholder reporting | | | 111,338 | |
Insurance | | | 7,594 | |
Miscellaneous | | | 8,990 | |
| | | | |
Total expenses | | | 5,359,639 | |
Less management fee waiver | | | (108,060 | ) |
| | | | |
Net expenses | | | 5,251,579 | |
| | | | |
Net Investment Income | | | 30,152,332 | |
| | | | |
Net Realized and Unrealized Gain | | | | |
Net realized gain on investments | | | 2,892,710 | |
| | | | |
Net change in unrealized appreciation on investments | | | 96,893,646 | |
| | | | |
Net realized and unrealized gain | | | 99,786,356 | |
| | | | |
Net Increase in Net Assets From Operations | | $ | 129,938,688 | |
| | | | |
See accompanying notes to financial statements.
MSF-18
Metropolitan Series Fund
Barclays Aggregate Bond Index Portfolio
Statements of Changes in Net Assets
| | | | | | | | |
| | | Six Months
Ended
June 30,
2016
(Unaudited) | | | Year Ended
December 31,
2015 | |
Increase (Decrease) in Net Assets: | | | | | | | | |
From Operations | | | | | | | | |
Net investment income | | $ | 30,152,332 | | | $ | 56,527,042 | |
Net realized gain | | | 2,892,710 | | | | 1,373,336 | |
Net change in unrealized appreciation (depreciation) | | | 96,893,646 | | | | (55,044,718 | ) |
| | | | | | | | |
Increase in net assets from operations | | | 129,938,688 | | | | 2,855,660 | |
| | | | | | | | |
From Distributions to Shareholders | | | | | | | | |
Net investment income | | | | | | | | |
Class A | | | (35,505,596 | ) | | | (31,869,029 | ) |
Class B | | | (25,827,980 | ) | | | (27,379,615 | ) |
Class E | | | (1,710,890 | ) | | | (2,026,136 | ) |
Class G | | | (8,916,198 | ) | | | (6,508,764 | ) |
| | | | | | | | |
Total distributions | | | (71,960,664 | ) | | | (67,783,544 | ) |
| | | | | | | | |
Increase in net assets from capital share transactions | | | 204,568,430 | | | | 235,033,876 | |
| | | | | | | | |
Total increase in net assets | | | 262,546,454 | | | | 170,105,992 | |
| | |
Net Assets | | | | | | | | |
Beginning of period | | | 2,475,559,739 | | | | 2,305,453,747 | |
| | | | | | | | |
End of period | | $ | 2,738,106,193 | | | $ | 2,475,559,739 | |
| | | | | | | | |
| | |
Undistributed net investment income | | | | | | | | |
End of period | | $ | 29,953,012 | | | $ | 71,761,344 | |
| | | | | | | | |
Other Information:
Capital Shares
Transactions in capital shares were as follows:
| | | | | | | | | | | | | | | | |
| | | Six Months Ended
June 30, 2016
(Unaudited) | | | Year Ended
December 31, 2015 | |
| | | Shares | | | Value | | | Shares | | | Value | |
Class A | | | | | | | | | | | | | | | | |
Sales | | | 9,382,405 | | | $ | 104,891,667 | | | | 22,094,159 | | | $ | 245,862,213 | |
Reinvestments | | | 3,198,702 | | | | 35,505,596 | | | | 2,931,833 | | | | 31,869,029 | |
Redemptions | | | (3,560,921 | ) | | | (39,874,009 | ) | | | (7,121,088 | ) | | | (79,138,007 | ) |
| | | | | | | | | | | | | | | | |
Net increase | | | 9,020,186 | | | $ | 100,523,254 | | | | 17,904,904 | | | $ | 198,593,235 | |
| | | | | | | | | | | | | | | | |
Class B | | | | | | | | | | | | | | | | |
Sales | | | 4,461,022 | | | $ | 48,946,508 | | | | 6,433,633 | | | $ | 70,248,315 | |
Reinvestments | | | 2,373,895 | | | | 25,827,980 | | | | 2,566,037 | | | | 27,379,615 | |
Redemptions | | | (4,782,741 | ) | | | (52,140,795 | ) | | | (8,707,427 | ) | | | (94,405,934 | ) |
| | | | | | | | | | | | | | | | |
Net increase | | | 2,052,176 | | | $ | 22,633,693 | | | | 292,243 | | | $ | 3,221,996 | |
| | | | | | | | | | | | | | | | |
Class E | | | | | | | | | | | | | | | | |
Sales | | | 108,744 | | | $ | 1,216,626 | | | | 205,493 | | | $ | 2,278,438 | |
Reinvestments | | | 154,832 | | | | 1,710,890 | | | | 187,258 | | | | 2,026,136 | |
Redemptions | | | (501,200 | ) | | | (5,550,160 | ) | | | (1,116,025 | ) | | | (12,326,766 | ) |
| | | | | | | | | | | | | | | | |
Net decrease | | | (237,624 | ) | | $ | (2,622,644 | ) | | | (723,274 | ) | | $ | (8,022,192 | ) |
| | | | | | | | | | | | | | | | |
Class G | | | | | | | | | | | | | | | | |
Sales | | | 10,221,429 | | | $ | 110,902,422 | | | | 7,491,067 | | | $ | 81,485,884 | |
Reinvestments | | | 821,769 | | | | 8,916,198 | | | | 611,726 | | | | 6,508,764 | |
Redemptions | | | (3,273,578 | ) | | | (35,784,493 | ) | | | (4,315,187 | ) | | | (46,753,811 | ) |
| | | | | | | | | | | | | | | | |
Net increase | | | 7,769,620 | | | $ | 84,034,127 | | | | 3,787,606 | | | $ | 41,240,837 | |
| | | | | | | | | | | | | | | | |
Increase derived from capital shares transactions | | | | | | $ | 204,568,430 | | | | | | | $ | 235,033,876 | |
| | | | | | | | | | | | | | | | |
See accompanying notes to financial statements.
MSF-19
Metropolitan Series Fund
Barclays Aggregate Bond Index Portfolio
Financial Highlights
| | | | | | | | | | | | | | | | | | | | | | | | |
| Selected per share data | | | | | | | | | | | | | | | | | | |
| | | Class A | |
| | | Six Months
Ended
June 30,
2016
(Unaudited) | | | Year Ended December 31, | |
| | | | 2015 | | | 2014 | | | 2013 | | | 2012 | | | 2011 | |
Net Asset Value, Beginning of Period | | $ | 10.92 | | | $ | 11.22 | | | $ | 10.93 | | | $ | 11.59 | | | $ | 11.58 | | | $ | 11.17 | |
| | | | | | | | | | | | | | | | | | | | | | | | |
Income (Loss) from Investment Operations | | | | | | | | | | | | | | | | | | | | | | | | |
Net investment income (a) | | | 0.14 | | | | 0.28 | | | | 0.29 | | | | 0.29 | | | | 0.34 | | | | 0.38 | |
Net realized and unrealized gain (loss) on investments | | | 0.42 | | | | (0.25 | ) | | | 0.33 | | | | (0.55 | ) | | | 0.10 | | | | 0.43 | |
| | | | | | | | | | | | | | | | | | | | | | | | |
Total from investment operations | | | 0.56 | | | | 0.03 | | | | 0.62 | | | | (0.26 | ) | | | 0.44 | | | | 0.81 | |
| | | | | | | | | | | | | | | | | | | | | | | | |
Less Distributions | | | | | | | | | | | | | | | | | | | | | | | | |
Distributions from net investment income | | | (0.31 | ) | | | (0.33 | ) | | | (0.33 | ) | | | (0.40 | ) | | | (0.43 | ) | | | (0.40 | ) |
| | | | | | | | | | | | | | | | | | | | | | | | |
Total distributions | | | (0.31 | ) | | | (0.33 | ) | | | (0.33 | ) | | | (0.40 | ) | | | (0.43 | ) | | | (0.40 | ) |
| | | | | | | | | | | | | | | | | | | | | | | | |
Net Asset Value, End of Period | | $ | 11.17 | | | $ | 10.92 | | | $ | 11.22 | | | $ | 10.93 | | | $ | 11.59 | | | $ | 11.58 | |
| | | | | | | | | | | | | | | | | | | | | | | | |
Total Return (%) (b) | | | 5.17 | (c) | | | 0.25 | | | | 5.81 | | | | (2.33 | ) | | | 3.90 | | | | 7.51 | |
| | | | | | |
Ratios/Supplemental Data | | | | | | | | | | | | | | | | | | | | | | | | |
Gross ratio of expenses to average net assets (%) | | | 0.28 | (d) | | | 0.28 | | | | 0.28 | | | | 0.28 | | | | 0.29 | | | | 0.28 | |
Net ratio of expenses to average net assets (%) (e) | | | 0.27 | (d) | | | 0.27 | | | | 0.28 | | | | 0.28 | | | | 0.28 | | | | 0.28 | |
Ratio of net investment income to average net assets (%) | | | 2.45 | (d) | | | 2.48 | | | | 2.62 | | | | 2.65 | | | | 2.92 | | | | 3.36 | |
Portfolio turnover rate (%) | | | 9 | (c) | | | 18 | | | | 13 | | | | 18 | | | | 24 | | | | 23 | |
Net assets, end of period (in millions) | | $ | 1,304.8 | | | $ | 1,177.2 | | | $ | 1,008.2 | | | $ | 797.4 | | | $ | 637.3 | | | $ | 630.8 | |
| |
| | | Class B | |
| | | Six Months
Ended
June 30,
2016
(Unaudited) | | | Year Ended December 31, | |
| | | | 2015 | | | 2014 | | | 2013 | | | 2012 | | | 2011 | |
Net Asset Value, Beginning of Period | | $ | 10.70 | | | $ | 10.99 | | | $ | 10.72 | | | $ | 11.37 | | | $ | 11.37 | | | $ | 10.97 | |
| | | | | | | | | | | | | | | | | | | | | | | | |
Income (Loss) from Investment Operations | | | | | | | | | | | | | | | | | | | | | | | | |
Net investment income (a) | | | 0.12 | | | | 0.24 | | | | 0.26 | | | | 0.26 | | | | 0.30 | | | | 0.34 | |
Net realized and unrealized gain (loss) on investments | | | 0.42 | | | | (0.23 | ) | | | 0.32 | | | | (0.54 | ) | | | 0.10 | | | | 0.44 | |
| | | | | | | | | | | | | | | | | | | | | | | | |
Total from investment operations | | | 0.54 | | | | 0.01 | | | | 0.58 | | | | (0.28 | ) | | | 0.40 | | | | 0.78 | |
| | | | | | | | | | | | | | | | | | | | | | | | |
Less Distributions | | | | | | | | | | | | | | | | | | | | | | | | |
Distributions from net investment income | | | (0.29 | ) | | | (0.30 | ) | | | (0.31 | ) | | | (0.37 | ) | | | (0.40 | ) | | | (0.38 | ) |
| | | | | | | | | | | | | | | | | | | | | | | | |
Total distributions | | | (0.29 | ) | | | (0.30 | ) | | | (0.31 | ) | | | (0.37 | ) | | | (0.40 | ) | | | (0.38 | ) |
| | | | | | | | | | | | | | | | | | | | | | | | |
Net Asset Value, End of Period | | $ | 10.95 | | | $ | 10.70 | | | $ | 10.99 | | | $ | 10.72 | | | $ | 11.37 | | | $ | 11.37 | |
| | | | | | | | | | | | | | | | | | | | | | | | |
Total Return (%) (b) | | | 5.02 | (c) | | | 0.09 | | | | 5.48 | | | | (2.53 | ) | | | 3.62 | | | | 7.28 | |
| | | | | | |
Ratios/Supplemental Data | | | | | | | | | | | | | | | | | | | | | | | | |
Gross ratio of expenses to average net assets (%) | | | 0.53 | (d) | | | 0.53 | | | | 0.53 | | | | 0.53 | | | | 0.54 | | | | 0.53 | |
Net ratio of expenses to average net assets (%) (e) | | | 0.52 | (d) | | | 0.52 | | | | 0.53 | | | | 0.53 | | | | 0.53 | | | | 0.53 | |
Ratio of net investment income to average net assets (%) | | | 2.20 | (d) | | | 2.23 | | | | 2.37 | | | | 2.40 | | | | 2.67 | | | | 3.12 | |
Portfolio turnover rate (%) | | | 9 | (c) | | | 18 | | | | 13 | | | | 18 | | | | 24 | | | | 23 | |
Net assets, end of period (in millions) | | $ | 1,018.9 | | | $ | 973.6 | | | $ | 997.1 | | | $ | 964.2 | | | $ | 934.5 | | | $ | 893.8 | |
Please see following page for Financial Highlights footnote legend.
See accompanying notes to financial statements.
MSF-20
Metropolitan Series Fund
Barclays Aggregate Bond Index Portfolio
Financial Highlights
| | | | | | | | | | | | | | | | | | | | | | | | |
| Selected per share data | | | | | | | | | | | | | | | | | | |
| | | Class E | |
| | | Six Months
Ended
June 30,
2016
(Unaudited) | | | Year Ended December 31, | |
| | | | 2015 | | | 2014 | | | 2013 | | | 2012 | | | 2011 | |
Net Asset Value, Beginning of Period | | $ | 10.86 | | | $ | 11.15 | | | $ | 10.87 | | | $ | 11.52 | | | $ | 11.52 | | | $ | 11.11 | |
| | | | | | | | | | | | | | | | | | | | | | | | |
Income (Loss) from Investment Operations | | | | | | | | | | | | | | | | | | | | | | | | |
Net investment income (a) | | | 0.13 | | | | 0.26 | | | | 0.27 | | | | 0.28 | | | | 0.32 | | | | 0.36 | |
Net realized and unrealized gain (loss) on investments | | | 0.41 | | | | (0.24 | ) | | | 0.33 | | | | (0.55 | ) | | | 0.09 | | | | 0.44 | |
| | | | | | | | | | | | | | | | | | | | | | | | |
Total from investment operations | | | 0.54 | | | | 0.02 | | | | 0.60 | | | | (0.27 | ) | | | 0.41 | | | | 0.80 | |
| | | | | | | | | | | | | | | | | | | | | | | | |
Less Distributions | | | | | | | | | | | | | | | | | | | | | | | | |
Distributions from net investment income | | | (0.29 | ) | | | (0.31 | ) | | | (0.32 | ) | | | (0.38 | ) | | | (0.41 | ) | | | (0.39 | ) |
| | | | | | | | | | | | | | | | | | | | | | | | |
Total distributions | | | (0.29 | ) | | | (0.31 | ) | | | (0.32 | ) | | | (0.38 | ) | | | (0.41 | ) | | | (0.39 | ) |
| | | | | | | | | | | | | | | | | | | | | | | | |
Net Asset Value, End of Period | | $ | 11.11 | | | $ | 10.86 | | | $ | 11.15 | | | $ | 10.87 | | | $ | 11.52 | | | $ | 11.52 | |
| | | | | | | | | | | | | | | | | | | | | | | | |
Total Return (%) (b) | | | 5.02 | (c) | | | 0.19 | | | | 5.58 | | | | (2.41 | ) | | | 3.68 | | | | 7.38 | |
| | | | | | |
Ratios/Supplemental Data | | | | | | | | | | | | | | | | | | | | | | | | |
Gross ratio of expenses to average net assets (%) | | | 0.43 | (d) | | | 0.43 | | | | 0.43 | | | | 0.43 | | | | 0.44 | | | | 0.43 | |
Net ratio of expenses to average net assets (%) (e) | | | 0.42 | (d) | | | 0.42 | | | | 0.43 | | | | 0.43 | | | | 0.43 | | | | 0.43 | |
Ratio of net investment income to average net assets (%) | | | 2.30 | (d) | | | 2.33 | | | | 2.47 | | | | 2.50 | | | | 2.77 | | | | 3.21 | |
Portfolio turnover rate (%) | | | 9 | (c) | | | 18 | | | | 13 | | | | 18 | | | | 24 | | | | 23 | |
Net assets, end of period (in millions) | | $ | 66.0 | | | $ | 67.0 | | | $ | 76.9 | | | $ | 82.2 | | | $ | 88.1 | | | $ | 91.8 | |
| |
| | | Class G | |
| | | Six Months
Ended
June 30,
2016
(Unaudited) | | | Year Ended December 31, | |
| | | | 2015 | | | 2014 | | | 2013 | | | 2012 | | | 2011 | |
Net Asset Value, Beginning of Period | | $ | 10.67 | | | $ | 10.97 | | | $ | 10.70 | | | $ | 11.35 | | | $ | 11.35 | | | $ | 10.96 | |
| | | | | | | | | | | | | | | | | | | | | | | | |
Income (Loss) from Investment Operations | | | | | | | | | | | | | | | | | | | | | | | | |
Net investment income (a) | | | 0.12 | | | | 0.24 | | | | 0.25 | | | | 0.26 | | | | 0.30 | | | | 0.34 | |
Net realized and unrealized gain (loss) on investments | | | 0.42 | | | | (0.25 | ) | | | 0.33 | | | | (0.54 | ) | | | 0.10 | | | | 0.42 | |
| | | | | | | | | | | | | | | | | | | | | | | | |
Total from investment operations | | | 0.54 | | | | (0.01 | ) | | | 0.58 | | | | (0.28 | ) | | | 0.40 | | | | 0.76 | |
| | | | | | | | | | | | | | | | | | | | | | | | |
Less Distributions | | | | | | | | | | | | | | | | | | | | | | | | |
Distributions from net investment income | | | (0.29 | ) | | | (0.29 | ) | | | (0.31 | ) | | | (0.37 | ) | | | (0.40 | ) | | | (0.37 | ) |
| | | | | | | | | | | | | | | | | | | | | | | | |
Total distributions | | | (0.29 | ) | | | (0.29 | ) | | | (0.31 | ) | | | (0.37 | ) | | | (0.40 | ) | | | (0.37 | ) |
| | | | | | | | | | | | | | | | | | | | | | | | |
Net Asset Value, End of Period | | $ | 10.92 | | | $ | 10.67 | | | $ | 10.97 | | | $ | 10.70 | | | $ | 11.35 | | | $ | 11.35 | |
| | | | | | | | | | | | | | | | | | | | | | | | |
Total Return (%) (b) | | | 5.07 | (c) | | | (0.06 | ) | | | 5.46 | | | | (2.57 | ) | | | 3.58 | | | | 7.15 | |
| | | | | | |
Ratios/Supplemental Data | | | | | | | | | | | | | | | | | | | | | | | | |
Gross ratio of expenses to average net assets (%) | | | 0.58 | (d) | | | 0.58 | | | | 0.58 | | | | 0.58 | | | | 0.59 | | | | 0.58 | |
Net ratio of expenses to average net assets (%) (e) | | | 0.57 | (d) | | | 0.57 | | | | 0.58 | | | | 0.58 | | | | 0.58 | | | | 0.58 | |
Ratio of net investment income to average net assets (%) | | | 2.16 | (d) | | | 2.18 | | | | 2.32 | | | | 2.35 | | | | 2.62 | | | | 3.09 | |
Portfolio turnover rate (%) | | | 9 | (c) | | | 18 | | | | 13 | | | | 18 | | | | 24 | | | | 23 | |
Net assets, end of period (in millions) | | $ | 348.4 | | | $ | 257.7 | | | $ | 223.3 | | | $ | 169.1 | | | $ | 157.5 | | | $ | 133.5 | |
| (a) | Per share amounts based on average shares outstanding during the period. |
| (b) | Total return does not reflect any insurance, sales, separate account or administrative charges of variable annuity or life insurance contracts or any additional expenses that contract owners may bear under their variable contracts. If these charges were included, the returns would be lower. |
| (c) | Periods less than one year are not computed on an annualized basis. |
| (d) | Computed on an annualized basis. |
| (e) | Includes the effects of management fee waivers (see Note 5 of the Notes to Financial Statements). |
See accompanying notes to financial statements.
MSF-21
Metropolitan Series Fund
Barclays Aggregate Bond Index Portfolio
Notes to Financial Statements—June 30, 2016 (Unaudited)
1. Organization
Metropolitan Series Fund (the “Trust”) is organized as a Delaware statutory trust and registered under the Investment Company Act of 1940, as amended (the “1940 Act”), as an open-end management investment company. The Trust, which is managed by MetLife Advisers, LLC (“MetLife Advisers” or the “Adviser”), an affiliate of MetLife, Inc., is currently comprised of thirty series, each of which operates as a distinct investment vehicle of the Trust. The portfolio included in this report is Barclays Aggregate Bond Index Portfolio (the “Portfolio”), which is diversified. Shares in the Portfolio are not offered directly to the general public and are currently available only to separate accounts established by Metropolitan Life Insurance Company (“MetLife”) and other affiliated life insurance companies.
The Portfolio has registered and offers four classes of shares: Class A, B, E and G shares. Shares of each Class of the Portfolio represent an equal pro rata interest in the Portfolio and generally give the shareholder the same voting, dividend, liquidation, and other rights. Investment income, realized and unrealized capital gains and losses, the common expenses of the Portfolio, and certain Portfolio-level expense reductions, if any, are allocated on a pro rata basis to each Class based on the relative net assets of each Class to the net assets of the Portfolio. Each Class of shares differs in its respective distribution plan and such distribution expenses are allocated to the corresponding Class of shares.
2. Significant Accounting Policies
The preparation of financial statements in conformity with accounting principles generally accepted in the United States of America (“GAAP”) requires management to make estimates and assumptions that affect the reported amounts of assets and liabilities and disclosure of contingent assets and liabilities as of the date of the financial statements and the reported amounts of income and expenses during the reporting period. Actual results could differ from those estimates. In the preparation of these financial statements, management has evaluated events and transactions subsequent to June 30, 2016 through the date the financial statements were issued.
The Portfolio is an investment company and follows the accounting and reporting guidance of the Financial Accounting Standards Board (“FASB”) Accounting Standards Codification Topic 946—Financial Services—Investment Companies and Topic 820—Fair Value Measurement. The following is a summary of significant accounting policies consistently followed by the Portfolio in the preparation of its financial statements.
Investment Valuation and Fair Value Measurements - Debt securities, including corporate, convertible and municipal bonds and notes; obligations of the U.S. Treasury and U.S. government agencies; foreign sovereign issues; and non-U.S. bonds, are generally valued on the basis of evaluated or composite bid quotations obtained from independent pricing services and/or brokers and dealers selected by the Adviser (each a “pricing service”), pursuant to authorization of and subject to general oversight by the Board of Trustees of the Trust (the “Board” or “Trustees”). Such pricing services may use matrix pricing, which considers observable inputs including, among other things, issuer details, maturity dates, interest rates, yield curves, rates of prepayment, credit risks/spreads, default rates, reported trades, broker dealer quotes and quoted prices for similar assets. Short-term obligations with a remaining maturity of sixty days or less may be valued at amortized cost in the absence of market quotes, so long as the amortized cost value of such short-term debt instrument is approximately the same as the fair value of the instrument as determined without the use of amortized cost valuation. Floating rate loans are generally valued on the basis of an evaluated or composite average of aggregate bid and ask quotations supplied by brokers or dealers, as obtained from the pricing service. Securities that use similar valuation techniques and inputs as described above are generally categorized as Level 2 within the fair value hierarchy.
Mortgage and asset-backed securities are generally valued on the basis of evaluated or composite bid quotations obtained from pricing services selected by the Adviser pursuant to authorization of and subject to general oversight by the Board. These securities are usually issued as separate tranches, or classes, of securities within each deal. The pricing models for these securities usually consider tranche-level attributes, current market data, estimated cash flows and market-based yield spreads for each tranche and incorporate deal collateral performance, as available. Mortgage and asset-backed securities that use similar valuation techniques and inputs as described above are generally categorized as Level 2 within the fair value hierarchy.
Domestic and foreign equity securities, such as common stock, exchange-traded funds, rights, warrants, and preferred stock, that are traded on a securities exchange on a valuation date are generally valued at their last quoted sale price or official closing price on the primary exchange for such security, or, if no sales occurred on that day, at the last reported bid price. Equity securities traded over-the-counter (“OTC”) are generally valued at the last reported bid price. In the event of a major exchange closing during the trading day, the Adviser may use other market information obtained from quotation reporting systems, established market makers, or pricing services in valuing the securities. Valuation adjustments may be applied to certain foreign equity securities that are traded solely on foreign exchanges that close before the time as of which the Portfolio determines its NAV to account for the market movement between the close of the foreign exchanges and the time as of which the Portfolio determines its NAV. The Portfolio may use a systematic fair valuation model provided by a pricing service to value securities principally traded in these foreign markets in order to adjust for possible market movements or other changes that may occur between the close of the foreign exchanges and the time as of
MSF-22
Metropolitan Series Fund
Barclays Aggregate Bond Index Portfolio
Notes to Financial Statements—June 30, 2016—(Continued)
which the Portfolio determines its NAV. Foreign equity securities valued using these valuation adjustments are generally categorized as Level 2 within the fair value hierarchy. Equity securities that are actively traded, and have no valuation adjustments applied, are categorized as Level 1 within the fair value hierarchy. Other equity securities traded on inactive markets, or valued in reference to similar instruments traded on active markets, are generally categorized as Level 2 within the fair value hierarchy.
Investments in registered open-end management investment companies are valued at reported net asset value per share on the valuation date and are categorized as Level 1 within the fair value hierarchy.
Futures contracts that are traded on commodity exchanges are valued at their closing prices as of the close of such exchanges and are categorized as Level 1 within the fair value hierarchy.
If no current market value quotation or other observable inputs are readily available or market value quotations are deemed to be unreliable for an investment, the fair value of the investment will be determined in accordance with procedures approved by, and under the general supervision of, the Board. In such a circumstance, the Board will be assisted in its responsibility to determine the fair value of an investment by the Valuation Committee (“Committee”) of MetLife Advisers. The Committee provides general pricing oversight and fair value pricing determinations related to portfolio securities and meets on a regular basis to review reports relating to the valuation of the securities in the Portfolio. The Board has delegated to State Street Bank and Trust Company, the Trust’s custodian (“custodian”), the responsibility for calculating the net asset values (“NAVs”) of the Trust’s Portfolios. The Committee is responsible for overseeing the calculation of the NAVs of the Portfolios by the custodian. The Committee also periodically reviews pricing services, including the pricing services providing fair value pricing for the Portfolio’s foreign securities, and is responsible for overseeing the correction of pricing errors and addressing other pricing issues that arise in the ordinary course of business, such as making real-time fair value determinations, as necessary.
No single standard for determining the fair value of an investment can be set forth because fair value depends upon the facts and circumstances with respect to each investment. Information relating to any relevant factors may be obtained by the Committee from any appropriate source, including the subadviser of the Portfolio, the custodian, a pricing service, market maker and/or broker for such security or the issuer. Appropriate methodologies for determining fair value under particular circumstances may include: matrix pricing, a discounted cash flow analysis, comparisons of securities with comparable characteristics, value based on multiples of earnings, discount from market price of similar marketable securities or a combination of these and other methods.
Investment Transactions and Related Investment Income - Portfolio security transactions are recorded on the trade date. Dividend income is recorded on the ex-dividend date or, for certain foreign securities, when notified. Interest income, which includes amortization of premium and accretion of discount on debt securities, is recorded on the accrual basis. Realized gains and losses on investments are determined on the identified cost basis, which is the same basis used for federal income tax purposes. Foreign income and foreign capital gains on some foreign securities may be subject to foreign taxes, which are accrued as applicable. These foreign taxes have been provided for in accordance with the Portfolio’s understanding of the applicable countries’ tax rules and rates.
Dividends and Distributions to Shareholders - The Portfolio records dividends and distributions on the ex-dividend date. Net realized gains from securities transactions (if any) are generally distributed annually to shareholders. The timing and characterization of certain income and capital gains distributions are determined in accordance with federal tax regulations that may differ from GAAP. Permanent book and tax basis differences relating to shareholder distributions will result in reclassification between under/over distributed net investment income, accumulated net realized gains/losses, and paid-in surplus. Book-tax differences are primarily due to amortization of debt securities, expired capital loss carryforwards and paydown reclasses. These adjustments have no impact on net assets or the results of operations.
Income Taxes - It is the Portfolio’s policy to comply with the requirements of the Internal Revenue Code of 1986, as amended, and regulations thereunder, applicable to regulated investment companies and to distribute, with respect to each taxable year, all of its taxable income to shareholders. Therefore, no federal income tax provision is required. The Portfolio files U.S. federal tax returns. No income tax returns are currently under examination. The Portfolio’s federal tax returns for the prior three fiscal years remain subject to examination by the Internal Revenue Service. As of June 30, 2016, the Portfolio had no uncertain tax positions that would require financial statement recognition, or de-recognition or disclosure.
Mortgage-Related and Other Asset-Backed Securities - The Portfolio may invest in mortgage-related or other asset-backed securities. These securities may include mortgage pass-through securities, collateralized mortgage obligations (“CMOs”), commercial mortgage-backed securities, CMO residuals, stripped mortgage-backed securities (“SMBS”), and other securities that directly or indirectly represent a participation in, or are secured by or payable from, mortgage loans on real property or other receivables. The value of some mortgage- or asset-backed securities may be particularly sensitive to changes in prevailing interest rates. Early repayment of principal on some mortgage-related securities may expose the Portfolio to a lower rate of return upon reinvestment of principal. The value of these securities may fluctuate in response to the market’s perception of the creditworthiness of the issuers. Additionally, although mortgages and mortgage-related securities are generally supported by some form of government or private guarantee and/or insurance, there is no assurance that private guarantors or insurers will meet their obligations.
MSF-23
Metropolitan Series Fund
Barclays Aggregate Bond Index Portfolio
Notes to Financial Statements—June 30, 2016—(Continued)
In one type of SMBS, one class receives all of the interest from the mortgage assets (the interest-only or “IO” class), while the other class will receive all of the principal (the principal-only or “PO” class). Because principal will not be received at the maturity of an IO, adjustments are made to the book value of the security until maturity. These adjustments are netted against payments received for the IOs and the net amount is included in interest income on the Statement of Operations of the Portfolio. Payments received for POs are treated as reductions to the cost and par value of the securities. Details of mortgage-related and other asset-backed securities held by the Portfolio are included in the Portfolio’s Schedule of Investments.
The Portfolio may invest a significant portion of its assets in securities of issuers that hold mortgage and asset-backed securities and direct investments in securities backed by commercial and residential mortgage loans and other financial assets. The value and related income of these securities are sensitive to changes in economic conditions, including delinquencies and/or defaults, and may be negatively impacted by increased volatility of market prices and periods of illiquidity.
When-Issued and Delayed-Delivery Securities - The Portfolio may purchase securities on a when-issued or delayed-delivery basis. Settlement of such transactions normally occurs within a month or more after the purchase commitment is made. The Portfolio may purchase securities under such conditions only with the intention of actually acquiring them, but may enter into a separate agreement to sell the securities before the settlement date. Since the value of securities purchased may fluctuate prior to settlement, the Portfolio may be required to pay more at settlement than the security is worth. In addition, the purchaser is not entitled to any of the interest earned prior to settlement.
Upon making a commitment to purchase a security on a when-issued or delayed-delivery basis, the Portfolio will hold liquid assets in a segregated account with the Portfolio’s custodian, or set aside liquid assets in the Portfolio’s records, worth at least the equivalent of the amount due. The liquid assets will be monitored on a daily basis and adjusted as necessary to maintain the necessary value.
Repurchase Agreements - The Portfolio may enter into repurchase agreements, under the terms of a Master Repurchase Agreement (“MRA”), with selected commercial banks and broker-dealers, under which the Portfolio acquires securities as collateral and agrees to resell the securities at an agreed-upon time and at an agreed-upon price. The Portfolio, through the custodian or a subcustodian, under a tri-party repurchase agreement, receives delivery of the underlying securities collateralizing any repurchase agreements. It is the Portfolio’s policy that the market value of the collateral be equal to at least 100% of the repurchase price in the case of a repurchase agreement of one-day duration and equal to at least 102% of the repurchase price in the case of all other repurchase agreements. In the event of default or failure by a party to perform an obligation in connection with any repurchase transaction, the MRA gives the non-defaulting party the right to set-off claims and to apply property held by it in connection with any repurchase transaction against obligations owed to it.
Securities Lending - The Portfolio may lend its portfolio securities to certain qualified brokers who borrow securities in order to complete certain securities transactions. By lending its portfolio securities, the Portfolio attempts to increase its net investment income through the receipt of income on collateral held from securities on loan. Any gain or loss in the market price of the loaned securities that might occur and any interest earned or dividends declared during the term of the loan would accrue to the account of the Portfolio.
The Trust has entered into a Securities Lending Authorization Agreement with the custodian as the lending agent. Under this agreement, the custodian is authorized to loan portfolio securities on the Portfolio’s behalf. In exchange, the Portfolio receives either cash or securities as collateral against the loaned securities. The Portfolio receives collateral equal to at least 102% of the market value of the loaned securities (105% for foreign equity securities), at each loan’s inception. Collateral representing at least 100% of the market value of the loaned securities must be maintained for the duration of the loan. Cash collateral is generally invested in the State Street Navigator Securities Lending MET Portfolio (the “Navigator Portfolio”), a series of the State Street Navigator Securities Lending Trust that is managed by an affiliate of the custodian. The Navigator Portfolio is a registered money market fund that invests in a variety of high-quality, U.S. dollar-denominated instruments. If the market value of the collateral at the close of trading on a business day is less than 100% of the market value of the loaned securities at the close of trading on that day, the borrower shall be required to deliver, by the close of business on the following business day, an additional amount of collateral, so that the total amount of posted collateral is equal to at least 100% of the market value of all the loaned securities as of such preceding day. A portion of net income (income after the deduction of expenses and fees of the Navigator Portfolio) on the collateral is rebated to the borrower of the securities and the remainder is split between the custodian and the Portfolio. On loans collateralized by U.S. Treasuries, a fee is received from the borrower and is allocated between the Portfolio and the custodian. Income received by the Portfolio in securities lending transactions during the six months ended June 30, 2016 is reflected as Securities lending income on the Statement of Operations. The values of any securities loaned by the Portfolio and the related collateral at June 30, 2016 are disclosed in the footnotes to the Schedule of Investments. The value of the related collateral received by the Portfolio exceeded the value of the securities out on loan at June 30, 2016.
The risks associated with lending portfolio securities include, but are not limited to, possible delays in receiving additional collateral or in the recovery of the loaned securities, possible loss of rights in the collateral should the borrower fail financially, as well as risk of loss in the value of the collateral or the value of the investments made with the collateral. The lending agent shall indemnify the Portfolio in the case of default of any securities borrower.
MSF-24
Metropolitan Series Fund
Barclays Aggregate Bond Index Portfolio
Notes to Financial Statements—June 30, 2016—(Continued)
The following table provides a breakdown of the collateral received and the remaining contractual maturities for securities lending transactions, which are accounted for as secured borrowings.
| | | | | | | | | | | | | | | | | | | | |
| | | Remaining Contractual Maturity of the Agreements
As of June 30, 2016 | |
| | | Overnight and
Continuous | | | Up to
30 Days | | | 31 - 90
Days | | | Greater than
90 days | | | Total | |
| Securities Lending Transactions | | | | | | | | | | | | | | | | | | | | |
Corporate Bonds & Notes | | $ | (35,693,474 | ) | | $ | — | | | $ | — | | | $ | — | | | $ | (35,693,474 | ) |
Foreign Government | | | (9,497,391 | ) | | | — | | | | — | | | | — | | | | (9,497,391 | ) |
U.S. Treasury & Government Agencies | | | (46,702,543 | ) | | | — | | | | — | | | | — | | | | (46,702,543 | ) |
Total | | $ | (91,893,408 | ) | | $ | — | | | $ | — | | | $ | — | | | $ | (91,893,408 | ) |
Total Borrowings | | $ | (91,893,408 | ) | | $ | — | | | $ | — | | | $ | — | | | $ | (91,893,408 | ) |
Gross amount of recognized liabilities for securities lending transactions | | | $ | (91,893,408 | ) |
| | | | | | | | | | | | | | | | | | | | |
3. Certain Risks
In the normal course of business, the Portfolio invests in securities and enters into transactions where risks exist due to fluctuations in the market (“market risk”) or failure of the other party to a transaction to perform (“credit and counterparty risk”).
Market Risk: The value of securities held by the Portfolio may decline in response to certain events, including those directly involving the companies whose securities are owned by the Portfolio; conditions affecting the general economy; overall market changes; local, regional or global political, social or economic instability; and currency, interest rate, and price fluctuations.
Credit and Counterparty Risk: The Portfolio may be exposed to counterparty risk, or the risk that an entity with which the Portfolio has unsettled or open transactions may default. The potential loss could exceed the value of the financial assets and liabilities recorded in the financial statements. Financial assets that potentially expose the Portfolio to credit and counterparty risk consist principally of cash due from counterparties and investments. The Portfolio manages counterparty risk by entering into agreements only with counterparties that it believes have the financial resources to honor their obligations and by monitoring the financial stability of those counterparties. The Portfolio’s investment adviser attempts to mitigate counterparty risk by (i) periodically assessing the creditworthiness of its trading partners, (ii) monitoring and/or limiting the amount of its net exposure to each individual counterparty based on its assessment, and (iii) requiring collateral from the counterparty for certain transactions. In order to preserve certain safeguards for non-standard settlement trades, the Portfolio restricts its exposure to credit and counterparty losses by entering into master netting agreements (“Master Agreements”) with counterparties (approved brokers) with whom it undertakes a significant volume of transactions. Master Agreements govern the terms of certain transactions, and reduce the counterparty risk associated with relevant transactions by specifying credit protection mechanisms and providing standardization that improves legal certainty. Master Agreements can also help limit counterparty risk by specifying collateral posting arrangements at pre-arranged exposure levels.
Additional risks associated with each type of investment are described above within the respective security type notes. The Portfolio’s prospectus includes a discussion of the principal risks of investing in the Portfolio.
4. Investment Transactions
Aggregate cost of purchases and proceeds of sales of investment securities, excluding short-term securities, for the six months ended June 30, 2016 were as follows:
| | | | | | | | | | | | |
Purchases | | | Sales | |
U.S. Government | | Non U.S. Government | | | U.S. Government | | | Non U.S. Government | |
| $286,903,442 | | $ | 107,817,145 | | | $ | 191,438,610 | | | $ | 32,378,615 | |
5. Investment Management Fees and Other Transactions with Affiliates
Investment Management Agreement - MetLife Advisers is the investment adviser to the Portfolio. The Trust has entered into an investment management agreement with MetLife Advisers with respect to the Portfolio. For providing investment management services to the Portfolio, MetLife Advisers receives monthly compensation at the annual rate of 0.250% of average daily net assets. Fees earned by MetLife Advisers with respect to the Portfolio for the six months ended June 30, 2016 were $3,251,367.
MSF-25
Metropolitan Series Fund
Barclays Aggregate Bond Index Portfolio
Notes to Financial Statements—June 30, 2016—(Continued)
MetLife Advisers has entered into an investment subadvisory agreement with MetLife Investment Advisors, LLC (“MIA”) with respect to managing the Portfolio. For providing subadvisory services to the Portfolio, MetLife Advisers has agreed to pay MIA an investment subadvisory fee for each class of the Portfolio as follows:
| | | | |
| % per annum | | | Average Daily Net Assets |
| | 0.040 | % | | On the first $500 million |
| | 0.030 | % | | Of the next $500 million |
| | 0.015 | % | | On amounts over $1 billion |
Fees earned by MIA with respect to the Portfolio for the six months ended June 30, 2016 were $294,536.
Management Fee Waivers - Pursuant to an expense agreement, MetLife Advisers has agreed, for the period May 1, 2016 to April 30, 2017, to reduce its advisory fees set out above under “Investment Management Agreement” for each class of the Portfolio as follows:
| | | | |
| % per annum | | | Average Daily Net Assets |
| | 0.005 | % | | Over $500 million and under $1 billion |
| | 0.010 | % | | Of the next $1 billion |
| | 0.015 | % | | On amounts over $2 billion |
An identical expense agreement was in place for the period May 1, 2015 to April 30, 2016. Amounts waived for the six months ended June 30, 2016 are shown as management fee waivers in the Statement of Operations.
Certain officers and trustees of the Trust may also be officers of MetLife Advisers; however, such officers and trustees receive no compensation from the Trust.
On January 12, 2016, MetLife, Inc. announced its plan to pursue the separation of a substantial portion of its retail segment and is currently evaluating structural alternatives for such separation. It is anticipated that MetLife Advisers would be included in any such separation. Any separation transaction that might occur will be subject to the satisfaction of various conditions and approvals, including approval of any transaction by the MetLife, Inc. Board of Directors, satisfaction of any applicable requirements of the SEC, and receipt of insurance and other regulatory approvals and other anticipated conditions. Because the form of a separation had yet to be determined, MetLife, Inc. cannot currently provide a specific potential completion date or information about the potential impact on MetLife Advisers. No assurance can be given regarding the form that a separation transaction may take or the specific terms thereof, or that a separation will in fact occur. Depending on the form a separation takes, MetLife Advisers’ continued service as investment adviser to the Trusts could be subject to the satisfaction of various conditions and approvals, which may include obtaining approvals from the Trusts’ Board and shareholders.
Transfer Agency Agreement - MetLife serves as the transfer agent for the Trust. MetLife receives no fees for its services to the Trust under the transfer agency agreement.
Distribution and Service Fees - The Trust has a distribution agreement with MetLife Investors Distribution Company (“MIDC” or the “Distributor”) in which MIDC serves as the distributor for the Portfolio’s Class A, B, E, and G Shares. MIDC is a wholly-owned subsidiary of MetLife Investors Group, LLC, an affiliate of the Adviser. The Trust has also adopted a Distribution and Service Plan under Rule 12b-1 of the 1940 Act for the Portfolio’s Class B, E, and G Shares. Under the Distribution and Service Plan, the Class B, E, and G Shares of the Portfolio pay a fee to compensate the Insurance Companies (or their affiliates) and other broker-dealers and financial intermediaries involved in the offer and sale of Portfolio shares for promoting or selling and servicing the Class B, E, and G Shares of the Portfolio. The fees under the Distribution and Service Plan for each class of the Portfolio’s shares are calculated as a percentage of the Portfolio’s average daily net assets that are attributable to that Class. Currently, the fee is 0.25% per year for Class B Shares, 0.15% per year for Class E Shares, and 0.30% per year for Class G Shares. Amounts incurred by the Portfolio for the six months ended June 30, 2016 are shown as Distribution and service fees in the Statement of Operations.
Deferred Trustee Compensation - Each Trustee who is not currently an employee of the Adviser or any of its affiliates receives compensation from the Trust for his or her service to the Trust. A deferred compensation plan (the “Plan”) is available to the Trustees on a voluntary basis. Deferred amounts remain in the Trust until distributed in accordance with the provisions of the Plan. The value of a participating Trustee’s deferral account is based on theoretical investments of deferred amounts on the normal payment dates in certain portfolios of the Trust or Met Investors Series Trust, an affiliate of the Trust, as designated by the participating Trustee. Changes in the value of participants’ deferral accounts are reflected as Trustees’ fees and expenses in the Statement of Operations. The portion of the accrued obligations allocated to the Portfolio under the Plan is reflected as Deferred trustees’ fees in the Statement of Assets and Liabilities.
6. Contractual Obligations
Under the Trust’s organizational documents, its officers and Trustees may be indemnified against certain liabilities and expenses arising out of the performance of their duties to the Trust. Additionally, the Trust has a variety of indemnification obligations under
MSF-26
Metropolitan Series Fund
Barclays Aggregate Bond Index Portfolio
Notes to Financial Statements—June 30, 2016—(Continued)
contracts with its service providers. The Trust’s maximum exposure under these arrangements is unknown, as this would involve future claims that may be made against the Trust that have not yet occurred.
7. Income Tax Information
The tax character of distributions paid for the years ended December 31, 2015 and 2014 were as follows:
| | | | | | | | | | | | | | | | | | | | |
Ordinary Income | | | Long-Term Capital Gain | | | Total | |
2015 | | 2014 | | | 2015 | | | 2014 | | | 2015 | | | 2014 | |
| $67,783,544 | | $ | 61,380,806 | | | $ | — | | | $ | — | | | $ | 67,783,544 | | | $ | 61,380,806 | |
As of December 31, 2015, the components of distributable earnings (accumulated losses) on a federal income tax basis were as follows:
| | | | | | | | | | | | | | | | | | | | |
Undistributed
Ordinary
Income | | Undistributed
Long-Term
Capital Gain | | | Net
Unrealized
Appreciation | | | Loss Carryforwards | | | Other
Accumulated
Capital Losses | | | Total | |
| $71,836,300 | | $ | — | | | $ | 11,225,597 | | | $ | (16,605,684 | ) | | $ | (25,681,329 | ) | | $ | 40,774,884 | |
The Portfolio utilizes the provisions of the federal income tax laws that provide for the carryforward of capital losses for prior years, offsetting such losses against any future realized capital gains. Under the Regulated Investment Company Modernization Act of 2010 (the “Act”), net capital losses recognized after December 22, 2010 may be carried forward indefinitely and their character is retained as short-term and/or long-term losses. Previously, net capital losses were carried forward for up to eight years and treated as short-term losses. As a transition rule, the Act requires that post-enactment net capital losses be used before pre-enactment net capital losses.
During the year ended December 31, 2015, $4,015,637 of capital loss carryforwards expired.
As of December 31, 2015, the Portfolio had post-enactment short-term accumulated capital losses of $4,227,296, post-enactment long-term accumulated capital losses of $21,454,033, and the pre-enactment accumulated capital loss carryforwards and expiration dates were as follows:
| | | | | | | | |
Expiring
12/31/17 | | Expiring
12/31/16 | | | Total | |
| $9,934,932 | | $ | 6,670,752 | | | $ | 16,605,684 | |
MSF-27
Metropolitan Series Fund
BlackRock Bond Income Portfolio
Managed by BlackRock Advisors, LLC
Portfolio Manager Commentary*
PERFORMANCE
For the six month period ended June 30, 2016, the Class A, B and E shares of the BlackRock Bond Income Portfolio returned 5.23%, 5.11%, and 5.16%, respectively. The Portfolio’s benchmark, the Barclays U.S. Aggregate Bond Index1, returned 5.31%.
MARKET ENVIRONMENT / CONDITIONS
Yields on high-quality government bonds fell as 2016 began with a rout of global equities against a backdrop of China-led risk aversion and slowing growth in leading developed economies. Bond yields showed little sign of rising significantly even after equity markets rebounded and oil found some support mid-quarter. This left 10-year yields lower over the first three months of the year, falling by 50 basis points (“bps”) to 1.78% in the U.S., 31 bps to -0.04% in Japan, 47 bps to 0.16% in Germany and 54 bps to 1.42% in the U.K.
As concerns grew of a prolonged economic downturn, the yield differential narrowed markedly between short and long-dated bonds in major sovereign markets. The yield spread between 2-year and 10-year bonds in both the U.S. Treasury and U.K. gilt markets compressed to under 100bps in February—the flattest those yield curves have been since 2007-08.
Although fears receded that U.S. economic deceleration might turn to recession, interest rate expectations also waned, causing the U.S. dollar to slip more than 4% over the first quarter—nearly 7% below its high at the end of November 2015.
Markets continued to try to time the next U.S. rate hike, without great conviction, but were rocked in late June after the U.K. voted unexpectedly to leave the European Union. Markets had been positioned for a “remain” outcome to the referendum and reacted violently to the decisive 52% to 48% vote to leave, coined the “Brexit”. Risk assets were routed in the immediate aftermath while sterling plunged more than 10% intraday in a record one-day drop that took the currency to levels not seen since 1985.
A flight to safety following the result saw sovereign bond yields decline sharply. This came on top of downward moves that had already pushed 10-year yields to record lows in Japan, Germany and the U.K. ahead of the vote as uncertainty over the outcome heightened. The momentous moves in bond markets saw 10-year yields turn negative in Germany ahead of the referendum and plunge below 1% in the U.K. following the result. The 10-year U.S. Treasury yield fell to its lowest level since mid-2012. This left 10-year yields 29 bps lower over the quarter at 1.49% in the U.S., 18 bps lower at -0.23% in Japan, 29 bps lower at -0.13% in Germany and 55 bps lower at 0.87% in the U.K.
Before Brexit fears started to grip markets back in May, risk sentiment had been continuing to rebound from the lows of the first quarter, buoyed by China’s economy showing signs of stabilizing and commodity prices strengthening further. The tight correlation of asset prices to Brexit probabilities from May (and before that to oil price fluctuations) highlights how markets now tend to focus on just one factor at a time.
PORTFOLIO REVIEW / PERIOD END POSITIONING
During the period, key detractors from performance were our relative underweight to U.S. Investment Grade Credit, which performed well, and active foreign exchange positioning, as the Portfolio held a long U.S. dollar bias versus a number of currencies. We began the year with an underweight position in Investment Grade Credit, which we began closing in the second quarter. By the end of the six month period, we were overweight Investment Grade Credit versus the benchmark as we rotated into higher quality sources of carry.
Buoyed by easy monetary policy along with a demand for yield, our overweight allocation to U.S. securitized assets, U.S. High Yield and Municipal Bonds added to performance. Additionally, as interest rates continued to rally through the quarter alongside an uptick in prepayment risk, our allocation to higher coupon mortgages in U.S. Agency Mortgage Backed Securities added to performance as well.
Through the first quarter of 2016, we maintained a neutral duration position versus the Index due to our defensive view on U.S. interest rates, which we believed could fall. However, we shifted to a modest underweight position as Federal Open Market Committee (the “FOMC”) members struck a surprisingly hawkish tone in the April FOMC minutes. While moving closer to the U.K. referendum in May and June, expecting safe-haven assets to be in demand, we moved back to a neutral duration position. Towards the end of the period, taking into consideration the extent of the rally within U.S. Treasuries alongside an indication of stability within U.S. economic data, we moved to a slight underweight position versus the benchmark.
Additionally, given the spread compression between higher and lower quality assets across the fixed income universe since the middle of February, we increased exposure across higher quality assets such as U.S. Investment Grade Credit, U.S. Agency Mortgages and U.S. Municipal Bonds. In securitized assets, while we reduced our allocation to begin the year, we modestly increased our allocation in the second quarter and remained overweight the sector at period end.
In active foreign exchange, at period end we tactically maintained a long U.S. dollar bias and remain slightly long the U.S. dollar versus the Chinese yuan, Saudi riyal and British pound at period end.
MSF-1
Metropolitan Series Fund
BlackRock Bond Income Portfolio
Managed by BlackRock Advisors, LLC
Portfolio Manager Commentary*—(Continued)
The Portfolio held derivatives during the period as a part of its investment strategy. Derivatives are used by the Portfolio as a means to manage risk and/or take outright views on interest rates, credit risk and/or foreign exchange positions in the Portfolio. During the period, the net use of derivatives had a positive impact on performance.
Rick Rieder
Bob Miller
Portfolio Managers
BlackRock Advisors, LLC
* This commentary may include statements that constitute “forward-looking statements” under the U.S. securities laws. Forward-looking statements include, among other things, projections, estimates, and information about possible or future results related to the Portfolio, market or regulatory developments. The views expressed above are not guarantees of future performance or economic results and involve certain risks, uncertainties and assumptions that could cause actual outcomes and results to differ materially from the views expressed herein. The views expressed above are subject to change at any time based upon economic, market, or other conditions and the subadvisory firm undertakes no obligation to update the views expressed herein. Any discussions of specific securities should not be considered a recommendation to buy or sell those securities. The views expressed above (including any forward-looking statement) may not be relied upon as investment advice or as an indication of the Portfolio’s trading intent. Information about the Portfolio’s holdings, asset allocation or country diversification is historical and is not an indication of future Portfolio composition, which may vary. Direct investment in any index is not possible. The performance of any index mentioned in this commentary has not been adjusted for ongoing management, distribution and operating expenses, and sales charges applicable to mutual fund investments. In addition, the returns do not reflect additional fees charged by separate accounts or variable insurance contracts that an investor in the Portfolio may pay. If these additional fees were reflected, performance would have been lower.
MSF-2
Metropolitan Series Fund
BlackRock Bond Income Portfolio
A $10,000 INVESTMENT COMPARED TO THE BARCLAYS U.S. AGGREGATE BOND INDEX
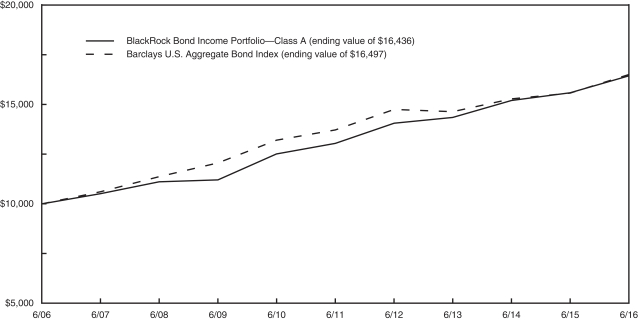
SIX MONTH RETURN & AVERAGE ANNUAL RETURNS (%) AS OF JUNE 30, 2016
| | | | | | | | | | | | | | | | |
| | | 6 Month | | | 1 Year | | | 5 Year | | | 10 Year | |
| BlackRock Bond Income Portfolio | | | | | | | | | | | | | | | | |
Class A | | | 5.23 | | | | 5.44 | | | | 4.73 | | | | 5.09 | |
Class B | | | 5.11 | | | | 5.18 | | | | 4.47 | | | | 4.83 | |
Class E | | | 5.16 | | | | 5.28 | | | | 4.57 | | | | 4.94 | |
| Barclays U.S. Aggregate Bond Index | | | 5.31 | | | | 6.00 | | | | 3.76 | | | | 5.13 | |
1 Barclays U.S. Aggregate Bond Index is a broad based benchmark that measures the investment grade, U.S. dollar-denominated, fixed-rate taxable bond market, including Treasuries, government-related and corporate securities, mortgage-backed securities, asset-backed securities, and commercial mortgage-backed securities.
Portfolio performance is calculated including reinvestment of all income and capital gain distributions. Performance numbers are net of all Portfolio expenses but do not include any insurance, sales, separate account or administrative charges of variable annuity or life insurance contracts or any additional expenses that participants may bear relating to the operations of their plans. If these charges were included, the returns would be lower. The performance of any index referenced above has not been adjusted for ongoing management, distribution and operating expenses, and sales charges applicable to mutual fund investments. Direct investment in any index is not possible. The performance of Class A shares, as set forth in the line graph above, will differ from that of other classes because of the difference in expenses paid by policyholders investing in the different share classes.
This information represents past performance and is not indicative of future results. Investment return and principal value may fluctuate so that shares, upon redemption, may be worth more or less than the original cost.
PORTFOLIO COMPOSITION AS OF JUNE 30, 2016
Top Sectors
| | | | |
| | | % of
Net Assets | |
| U.S. Treasury & Government Agencies | | | 53.8 | |
| Corporate Bonds & Notes | | | 26.0 | |
| Asset-Backed Securities | | | 9.3 | |
| Mortgage-Backed Securities | | | 7.7 | |
| Municipals | | | 4.1 | |
| Foreign Government | | | 2.7 | |
| Preferred Stocks | | | 0.4 | |
MSF-3
Metropolitan Series Fund
BlackRock Bond Income Portfolio
Understanding Your Portfolio’s Expenses
Shareholder Expense Example
As a shareholder of the Portfolio, you incur ongoing costs, including management fees; distribution and service (12b-1) fees; and other Portfolio expenses. This example is intended to help you understand your ongoing costs (in dollars) (referred to as “expenses”) of investing in the Portfolio and compare these costs with the ongoing costs of investing in other mutual funds. The example is based on an investment of $1,000 invested at the beginning of the period and held for the entire period, January 1, 2016 through June 30, 2016.
Actual Expenses
The first line for each share class of the Portfolio in the table below provides information about actual account values and actual expenses. You may use the information in this line, together with the amount you invested in the particular share class of the Portfolio, to estimate the expenses that you paid over the period. Simply divide your account value by $1,000 (for example, an $8,600 account value divided by $1,000 = 8.6), then multiply the result by the number in the first line under the heading entitled “Expenses Paid During Period” to estimate the expenses you paid on your account during this period.
Hypothetical Example for Comparison Purposes
The second line for each share class of the Portfolio in the table below provides information about hypothetical account values and hypothetical expenses based on the Portfolio’s actual expense ratio and an assumed rate of return of 5% per year before expenses, which is not the Portfolio’s actual return. The hypothetical account values and expenses may not be used to estimate the actual ending account balance or expenses you paid for the period. You may use this information to compare the ongoing costs of investing in the Portfolio and other funds. To do so, compare this 5% hypothetical example with the 5% hypothetical examples that appear in the shareholder reports of the other funds.
Please note that the expenses shown in the table are meant to highlight your ongoing costs only and do not reflect any fees or charges of your variable insurance product or any additional expenses that participants in certain eligible qualified plans may bear relating to the operations of their plan. Therefore, the second line for each share class in the table is useful in comparing ongoing costs only, and will not help you determine the relative total costs of owning different funds. In addition, if these other costs were included, your costs would have been higher.
| | | | | | | | | | | | | | | | | | |
BlackRock Bond Income Portfolio | | | | Annualized
Expense
Ratio | | | Beginning
Account Value
January 1,
2016 | | | Ending
Account Value
June 30,
2016 | | | Expenses Paid
During Period**
January 1, 2016
to
June 30,
2016 | |
Class A | | Actual | | | 0.37 | % | | $ | 1,000.00 | | | $ | 1,052.30 | | | $ | 1.89 | |
| | Hypothetical* | | | 0.37 | % | | $ | 1,000.00 | | | $ | 1,023.02 | | | $ | 1.86 | |
| | | | | |
Class B | | Actual | | | 0.62 | % | | $ | 1,000.00 | | | $ | 1,051.10 | | | $ | 3.16 | |
| | Hypothetical* | | | 0.62 | % | | $ | 1,000.00 | | | $ | 1,021.78 | | | $ | 3.12 | |
| | | | | |
Class E | | Actual | | | 0.52 | % | | $ | 1,000.00 | | | $ | 1,051.60 | | | $ | 2.65 | |
| | Hypothetical* | | | 0.52 | % | | $ | 1,000.00 | | | $ | 1,022.28 | | | $ | 2.61 | |
* Hypothetical assumes a rate of return of 5% per year before expenses.
** Expenses paid are equal to the Portfolio’s annualized expense ratio for the most recent six month period, as shown above, multiplied by the average account value over the period, multiplied by the number of days (182 days) in the most recent fiscal half-year, divided by 366 (to reflect the one-half year period).
MSF-4
Metropolitan Series Fund
BlackRock Bond Income Portfolio
Schedule of Investments as of June 30, 2016
U.S. Treasury & Government Agencies—53.8% of Net Assets
| | | | | | | | |
| Security Description | | Principal
Amount* | | | Value | |
|
Agency Sponsored Mortgage - Backed—33.1% | |
Fannie Mae 15 Yr. Pool
2.500%, 01/01/30 | | | 1,706,602 | | | $ | 1,771,904 | |
2.500%, 07/01/30 | | | 486,781 | | | | 505,262 | |
2.500%, 08/01/30 | | | 4,085,971 | | | | 4,238,511 | |
2.500%, 09/01/30 | | | 2,157,002 | | | | 2,238,416 | |
2.500%, 11/01/30 | | | 4,393,724 | | | | 4,556,419 | |
3.000%, 11/01/26 | | | 1,438,232 | | | | 1,509,728 | |
3.000%, 02/01/27 | | | 3,878,957 | | | | 4,071,058 | |
3.000%, 09/01/28 | | | 2,552,383 | | | | 2,678,726 | |
3.000%, 11/01/28 | | | 4,793,401 | | | | 5,060,636 | |
3.000%, 12/01/28 | | | 1,292,321 | | | | 1,364,706 | |
3.000%, 01/01/29 | | | 554,419 | | | | 585,820 | |
3.000%, 04/01/29 | | | 1,823,225 | | | | 1,925,083 | |
3.000%, 05/01/29 | | | 2,890,356 | | | | 3,048,609 | |
3.000%, 08/01/29 | | | 3,425,158 | | | | 3,617,192 | |
3.000%, 09/01/29 | | | 1,071,883 | | | | 1,132,743 | |
3.000%, 03/01/30 | | | 1,622,178 | | | | 1,713,369 | |
3.000%, 04/01/30 | | | 1,382,441 | | | | 1,458,997 | |
3.000%, 05/01/30 | | | 1,936,764 | | | | 2,044,869 | |
3.000%, 07/01/30 | | | 9,781,158 | | | | 10,323,291 | |
3.000%, 08/01/30 | | | 8,174,171 | | | | 8,626,023 | |
3.000%, 09/01/30 | | | 3,087,041 | | | | 3,257,400 | |
3.500%, 11/01/25 | | | 2,108,818 | | | | 2,249,236 | |
3.500%, 08/01/26 | | | 1,750,637 | | | | 1,863,571 | |
3.500%, 08/01/28 | | | 1,103,013 | | | | 1,179,635 | |
3.500%, 10/01/28 | | | 4,578,478 | | | | 4,896,376 | |
3.500%, 11/01/28 | | | 5,482,875 | | | | 5,862,992 | |
3.500%, 02/01/29 | | | 11,364,460 | | | | 12,151,005 | |
3.500%, 04/01/29 | | | 2,343,671 | | | | 2,506,427 | |
3.500%, 05/01/29 | | | 5,376,961 | | | | 5,736,947 | |
3.500%, 06/01/29 | | | 3,462,649 | | | | 3,703,016 | |
3.500%, 07/01/29 | | | 12,780,703 | | | | 13,669,419 | |
3.500%, 09/01/29 | | | 325,755 | | | | 348,495 | |
3.500%, 12/01/29 | | | 15,648,253 | | | | 16,780,368 | |
3.500%, 08/01/30 | | | 1,475,965 | | | | 1,585,342 | |
4.000%, 01/01/25 | | | 13,561 | | | | 14,059 | |
4.000%, 02/01/25 | | | 4,492,168 | | | | 4,788,447 | |
4.000%, 09/01/25 | | | 806,465 | | | | 860,774 | |
4.000%, 10/01/25 | | | 2,356,566 | | | | 2,515,486 | |
4.000%, 01/01/26 | | | 704,899 | | | | 751,045 | |
4.000%, 04/01/26 | | | 489,206 | | | | 522,367 | |
4.000%, 07/01/26 | | | 1,948,958 | | | | 2,066,511 | |
4.000%, 08/01/26 | | | 1,053,379 | | | | 1,124,563 | |
4.500%, 12/01/20 | | | 1,004,577 | | | | 1,039,852 | |
4.500%, 02/01/25 | | | 781,556 | | | | 833,224 | |
4.500%, 04/01/25 | | | 156,153 | | | | 168,477 | |
4.500%, 07/01/25 | | | 578,109 | | | | 622,442 | |
4.500%, 06/01/26 | | | 3,446,943 | | | | 3,704,442 | |
Fannie Mae 20 Yr. Pool
5.000%, 05/01/23 | | | 3,754 | | | | 4,165 | |
Fannie Mae 30 Yr. Pool
3.000%, 12/01/42 | | | 9,937,085 | | | | 10,435,976 | |
3.000%, 01/01/43 | | | 6,659,004 | | | | 6,979,110 | |
3.000%, 02/01/43 | | | 3,161,122 | | | | 3,320,271 | |
3.000%, 03/01/43 | | | 25,707,339 | | | | 26,842,344 | |
3.000%, 04/01/43 | | | 17,455,922 | | | | 18,241,367 | |
|
Agency Sponsored Mortgage - Backed—(Continued) | |
Fannie Mae 30 Yr. Pool
3.000%, 05/01/43 | | | 23,675,320 | | | | 24,835,504 | |
3.000%, 06/01/43 | | | 2,967,685 | | | | 3,122,911 | |
3.000%, 06/01/46 | | | 968,406 | | | | 1,013,306 | |
3.500%, 01/01/42 | | | 228,455 | | | | 244,514 | |
3.500%, 04/01/42 | | | 84,211 | | | | 90,598 | |
3.500%, 06/01/42 | | | 1,033,005 | | | | 1,106,477 | |
3.500%, 10/01/42 | | | 433,256 | | | | 465,647 | |
3.500%, 12/01/42 | | | 211,733 | | | | 227,788 | |
3.500%, 01/01/43 | | | 1,392,298 | | | | 1,495,317 | |
3.500%, 02/01/43 | | | 2,020,839 | | | | 2,160,063 | |
3.500%, 03/01/43 | | | 5,173,968 | | | | 5,547,145 | |
3.500%, 04/01/43 | | | 89,018 | | | | 95,680 | |
3.500%, 07/01/43 | | | 14,921,727 | | | | 15,960,642 | |
3.500%, 08/01/43 | | | 9,953,869 | | | | 10,651,810 | |
3.500%, 09/01/43 | | | 157,969 | | | | 166,736 | |
3.500%, 10/01/43 | | | 201,011 | | | | 216,230 | |
3.500%, 11/01/43 | | | 1,656,020 | | | | 1,772,230 | |
3.500%, 01/01/44 | | | 2,181,463 | | | | 2,337,930 | |
3.500%, 06/01/44 | | | 462,413 | | | | 495,579 | |
3.500%, 07/01/44 | | | 393,319 | | | | 422,091 | |
3.500%, 08/01/44 | | | 3,000,576 | | | | 3,218,532 | |
3.500%, 09/01/44 | | | 802,408 | | | | 862,555 | |
3.500%, 10/01/44 | | | 1,039,479 | | | | 1,111,496 | |
3.500%, 05/01/45 | | | 930,886 | | | | 993,937 | |
3.500%, 06/01/45 | | | 1,611,804 | | | | 1,723,668 | |
3.500%, 10/01/45 | | | 3,618,343 | | | | 3,867,450 | |
3.500%, 11/01/45 | | | 2,003,859 | | | | 2,145,069 | |
3.500%, 12/01/45 | | | 13,959,215 | | | | 14,755,030 | |
3.500%, 03/01/46 | | | 17,880,364 | | | | 18,879,565 | |
3.500%, 04/01/46 | | | 10,414,887 | | | | 10,998,974 | |
3.500%, TBA (a) | | | 12,994,000 | | | | 13,710,697 | |
4.000%, 08/01/33 | | | 1,643,766 | | | | 1,761,708 | |
4.000%, 06/01/39 | | | 1,264,878 | | | | 1,358,253 | |
4.000%, 12/01/39 | | | 129,391 | | | | 138,716 | |
4.000%, 07/01/40 | | | 1,654,980 | | | | 1,775,503 | |
4.000%, 08/01/40 | | | 3,029,388 | | | | 3,256,405 | |
4.000%, 10/01/40 | | | 164,980 | | | | 177,483 | |
4.000%, 11/01/40 | | | 544,634 | | | | 585,875 | |
4.000%, 12/01/40 | | | 2,794,632 | | | | 3,005,916 | |
4.000%, 04/01/41 | | | 280,236 | | | | 301,304 | |
4.000%, 09/01/41 | | | 7,470,165 | | | | 8,031,340 | |
4.000%, 10/01/41 | | | 483,507 | | | | 518,325 | |
4.000%, 02/01/42 | | | 4,095,900 | | | | 4,404,311 | |
4.000%, 05/01/42 | | | 1,679,237 | | | | 1,828,848 | |
4.000%, 06/01/42 | | | 992,487 | | | | 1,066,475 | |
4.000%, 07/01/42 | | | 4,672,656 | | | | 5,122,293 | |
4.000%, 08/01/42 | | | 516,226 | | | | 554,910 | |
4.000%, 09/01/42 | | | 1,264,838 | | | | 1,359,439 | |
4.000%, 12/01/42 | | | 1,503,014 | | | | 1,614,744 | |
4.000%, 01/01/43 | | | 5,446,436 | | | | 5,853,021 | |
4.000%, 10/01/43 | | | 9,694,315 | | | | 10,492,254 | |
4.000%, 11/01/43 | | | 4,899,169 | | | | 5,380,571 | |
4.000%, 01/01/44 | | | 3,636,433 | | | | 3,993,733 | |
4.000%, 02/01/44 | | | 3,329,390 | | | | 3,657,440 | |
4.000%, 05/01/44 | | | 4,965,456 | | | | 5,454,212 | |
See accompanying notes to financial statements.
MSF-5
Metropolitan Series Fund
BlackRock Bond Income Portfolio
Schedule of Investments as of June 30, 2016
U.S. Treasury & Government Agencies—(Continued)
| | | | | | | | |
| Security Description | | Principal
Amount* | | | Value | |
|
Agency Sponsored Mortgage - Backed—(Continued) | |
Fannie Mae 30 Yr. Pool
4.000%, 07/01/44 | | | 371,117 | | | $ | 402,227 | |
4.000%, 12/01/44 | | | 2,786,079 | | | | 3,047,403 | |
4.000%, 01/01/45 | | | 548,216 | | | | 600,252 | |
4.000%, 02/01/45 | | | 194,631 | | | | 214,008 | |
4.000%, 03/01/45 | | | 1,596,111 | | | | 1,734,230 | |
4.000%, 04/01/45 | | | 1,178,151 | | | | 1,291,458 | |
4.000%, 05/01/45 | | | 1,369,859 | | | | 1,484,347 | |
4.000%, 09/01/45 | | | 504,638 | | | | 543,585 | |
4.000%, 10/01/45 | | | 22,559,169 | | | | 24,588,040 | |
4.000%, 11/01/45 | | | 7,497,349 | | | | 8,116,751 | |
4.000%, 12/01/45 | | | 5,181,508 | | | | 5,629,874 | |
4.000%, 01/01/46 | | | 1,472,459 | | | | 1,622,512 | |
4.000%, TBA (a) | | | 51,404,000 | | | | 55,066,092 | |
4.500%, 08/01/39 | | | 2,749,738 | | | | 3,004,276 | |
4.500%, 11/01/39 | | | 483,175 | | | | 536,923 | |
4.500%, 01/01/40 | | | 60,976 | | | | 67,627 | |
4.500%, 04/01/40 | | | 151,775 | | | | 168,133 | |
4.500%, 05/01/40 | | | 378,359 | | | | 416,516 | |
4.500%, 06/01/40 | | | 405,516 | | | | 446,479 | |
4.500%, 07/01/40 | | | 733,147 | | | | 802,078 | |
4.500%, 08/01/40 | | | 4,974,012 | | | | 5,451,771 | |
4.500%, 11/01/40 | | | 1,461,061 | | | | 1,601,754 | |
4.500%, 07/01/41 | | | 421,231 | | | | 461,873 | |
4.500%, 08/01/41 | | | 199,111 | | | | 217,275 | |
4.500%, 09/01/41 | | | 1,273,116 | | | | 1,395,946 | |
4.500%, 01/01/42 | | | 298,004 | | | | 326,491 | |
4.500%, 06/01/42 | | | 251,170 | | | | 274,052 | |
4.500%, 08/01/42 | | | 1,655,314 | | | | 1,812,484 | |
4.500%, 09/01/42 | | | 4,897,884 | | | | 5,361,316 | |
4.500%, 09/01/43 | | | 1,416,670 | | | | 1,547,322 | |
4.500%, 10/01/43 | | | 2,125,682 | | | | 2,325,526 | |
4.500%, 12/01/43 | | | 3,125,452 | | | | 3,415,724 | |
4.500%, 01/01/44 | | | 4,746,708 | | | | 5,230,243 | |
4.500%, 02/01/44 | | | 372,919 | | | | 406,807 | |
4.500%, 03/01/44 | | | 1,942,023 | | | | 2,118,423 | |
4.500%, 10/01/45 | | | 3,726,351 | | | | 4,173,858 | |
4.500%, 11/01/45 | | | 6,773,214 | | | | 7,602,091 | |
5.000%, 11/01/32 | | | 11,313 | | | | 12,558 | |
5.000%, 06/01/39 | | | 33,915,895 | | | | 37,755,621 | |
5.000%, 04/01/41 | | | 59,337 | | | | 66,121 | |
5.000%, 07/01/41 | | | 697,249 | | | | 777,359 | |
5.000%, 08/01/41 | | | 765,766 | | | | 853,788 | |
5.000%, 01/01/42 | | | 208,406 | | | | 231,408 | |
5.500%, 11/01/32 | | | 1,848,413 | | | | 2,095,593 | |
5.500%, 12/01/32 | | | 298,514 | | | | 338,566 | |
5.500%, 01/01/33 | | | 1,157,676 | | | | 1,309,499 | |
5.500%, 12/01/33 | | | 390,252 | | | | 442,495 | |
5.500%, 05/01/34 | | | 3,101,748 | | | | 3,519,272 | |
5.500%, 08/01/37 | | | 3,224,749 | | | | 3,660,733 | |
5.500%, 02/01/38 | | | 436,106 | | | | 498,377 | |
5.500%, 03/01/38 | | | 340,326 | | | | 387,507 | |
5.500%, 04/01/38 | | | 419,284 | | | | 470,639 | |
5.500%, 06/01/38 | | | 426,555 | | | | 487,048 | |
5.500%, 12/01/38 | | | 524,121 | | | | 588,188 | |
5.500%, 08/01/39 | | | 477,092 | | | | 537,718 | |
|
Agency Sponsored Mortgage - Backed—(Continued) | |
Fannie Mae 30 Yr. Pool
5.500%, 03/01/40 | | | 374,689 | | | | 420,844 | |
5.500%, 04/01/40 | | | 144,819 | | | | 163,453 | |
5.500%, 04/01/41 | | | 525,180 | | | | 593,294 | |
5.500%, TBA (a) | | | 2,958,000 | | | | 3,324,977 | |
6.000%, 02/01/34 | | | 346,550 | | | | 402,393 | |
6.000%, 08/01/34 | | | 261,786 | | | | 303,196 | |
6.000%, 04/01/35 | | | 4,104,051 | | | | 4,765,319 | |
6.000%, 06/01/36 | | | 622,619 | | | | 722,504 | |
6.000%, 02/01/38 | | | 798,036 | | | | 919,856 | |
6.000%, 03/01/38 | | | 299,655 | | | | 347,055 | |
6.000%, 05/01/38 | | | 978,634 | | | | 1,135,983 | |
6.000%, 10/01/38 | | | 1,190,060 | | | | 1,364,526 | |
6.000%, 12/01/38 | | | 351,109 | | | | 405,251 | |
6.000%, 04/01/40 | | | 3,809,824 | | | | 4,354,924 | |
6.000%, 09/01/40 | | | 404,129 | | | | 461,617 | |
6.000%, 06/01/41 | | | 852,795 | | | | 973,837 | |
6.500%, 05/01/40 | | | 5,599,810 | | | | 6,505,561 | |
Fannie Mae ARM Pool
2.523%, 08/01/38 (b) | | | 753,002 | | | | 804,959 | |
2.815%, 03/01/41 (b) | | | 627,544 | | | | 664,653 | |
2.945%, 03/01/41 (b) | | | 377,884 | | | | 399,371 | |
3.157%, 12/01/40 (b) | | | 1,068,758 | | | | 1,125,231 | |
3.366%, 06/01/41 (b) | | | 2,129,933 | | | | 2,216,434 | |
3.517%, 09/01/41 (b) | | | 1,565,545 | | | | 1,647,894 | |
Fannie Mae REMICS (CMO)
5.000%, 04/25/35 | | | 138,570 | | | | 148,753 | |
Fannie Mae-ACES
0.243%, 08/25/24 (b) (c) | | | 117,496,487 | | | | 1,275,413 | |
Freddie Mac 15 Yr. Gold Pool
2.500%, 08/01/29 | | | 1,678,823 | | | | 1,742,966 | |
2.500%, 12/01/29 | | | 466,003 | | | | 483,678 | |
2.500%, 05/01/30 | | | 1,576,688 | | | | 1,634,527 | |
2.500%, 07/01/30 | | | 1,078,166 | | | | 1,118,435 | |
2.500%, 08/01/30 | | | 3,101,411 | | | | 3,219,292 | |
2.500%, 09/01/30 | | | 3,965,628 | | | | 4,111,492 | |
3.000%, 05/01/27 | | | 1,983,721 | | | | 2,085,936 | |
3.000%, 01/01/30 | | | 1,312,267 | | | | 1,386,053 | |
3.000%, 04/01/30 | | | 6,064,292 | | | | 6,412,083 | |
3.000%, 05/01/30 | | | 986,719 | | | | 1,043,990 | |
3.000%, 06/01/30 | | | 42,186 | | | | 44,598 | |
3.000%, 07/01/30 | | | 2,259,246 | | | | 2,387,491 | |
3.000%, 08/01/30 | | | 3,395,807 | | | | 3,589,688 | |
3.000%, TBA (a) | | | 4,794,000 | | | | 5,029,018 | |
3.500%, TBA (a) | | | 7,978,000 | | | | 8,443,291 | |
Freddie Mac 30 Yr. Gold Pool
3.000%, 01/01/43 | | | 2,347,716 | | | | 2,447,070 | |
3.000%, 03/01/43 | | | 5,331,997 | | | | 5,539,719 | |
3.000%, 07/01/43 | | | 15,219,084 | | | | 15,956,972 | |
3.000%, TBA (a) | | | 5,531,000 | | | | 5,733,734 | |
3.500%, 04/01/42 | | | 2,431,792 | | | | 2,603,494 | |
3.500%, 08/01/42 | | | 1,930,903 | | | | 2,073,541 | |
3.500%, 10/01/42 | | | 250,427 | | | | 265,201 | |
3.500%, 02/01/43 | | | 490,764 | | | | 528,160 | |
3.500%, 07/01/43 | | | 3,513,985 | | | | 3,785,599 | |
3.500%, 12/01/43 | | | 2,178,051 | | | | 2,346,005 | |
See accompanying notes to financial statements.
MSF-6
Metropolitan Series Fund
BlackRock Bond Income Portfolio
Schedule of Investments as of June 30, 2016
U.S. Treasury & Government Agencies—(Continued)
| | | | | | | | |
| Security Description | | Principal
Amount* | | | Value | |
|
Agency Sponsored Mortgage - Backed—(Continued) | |
Freddie Mac 30 Yr. Gold Pool
3.500%, 01/01/44 | | | 694,713 | | | $ | 747,296 | |
3.500%, 04/01/44 | | | 195,890 | | | | 210,004 | |
3.500%, 05/01/44 | | | 750,063 | | | | 800,804 | |
3.500%, 06/01/44 | | | 202,652 | | | | 217,233 | |
3.500%, 07/01/44 | | | 150,837 | | | | 162,156 | |
3.500%, 08/01/44 | | | 689,660 | | | | 738,248 | |
3.500%, 09/01/44 | | | 1,230,047 | | | | 1,319,176 | |
3.500%, 09/01/45 | | | 249,083 | | | | 267,788 | |
3.500%, 10/01/45 | | | 14,377,598 | | | | 15,362,253 | |
3.500%, 03/01/46 | | | 80,213,768 | | | | 84,738,819 | |
3.500%, 05/01/46 | | | 6,704,628 | | | | 7,085,565 | |
3.500%, 06/01/46 | | | 6,719,000 | | | | 7,100,847 | |
4.000%, 08/01/40 | | | 518,864 | | | | 556,415 | |
4.000%, 10/01/40 | | | 209,825 | | | | 229,073 | |
4.000%, 11/01/40 | | | 986,042 | | | | 1,076,487 | |
4.000%, 04/01/41 | | | 25,971 | | | | 27,923 | |
4.000%, 10/01/41 | | | 904,811 | | | | 988,850 | |
4.000%, 09/01/43 | | | 586,546 | | | | 642,603 | |
4.000%, 04/01/44 | | | 1,278,619 | | | | 1,397,136 | |
4.000%, 08/01/44 | | | 4,736,952 | | | | 5,189,084 | |
4.000%, 01/01/45 | | | 12,807,076 | | | | 13,709,823 | |
4.000%, 02/01/45 | | | 466,042 | | | | 505,376 | |
4.000%, 09/01/45 | | | 2,047,911 | | | | 2,222,019 | |
4.000%, 10/01/45 | | | 7,023,148 | | | | 7,553,832 | |
4.000%, 12/01/45 | | | 883,703 | | | | 957,168 | |
4.000%, 01/01/46 | | | 421,965 | | | | 452,465 | |
4.000%, TBA (a) | | | 13,548,000 | | | | 14,493,001 | |
4.500%, 02/01/39 | | | 2,069,859 | | | | 2,255,627 | |
4.500%, 12/01/39 | | | 434,398 | | | | 475,317 | |
4.500%, 07/01/40 | | | 135,602 | | | | 148,467 | |
4.500%, 05/01/41 | | | 2,798,879 | | | | 3,071,659 | |
4.500%, 05/01/42 | | | 72,884 | | | | 79,886 | |
4.500%, 10/01/43 | | | 1,161,715 | | | | 1,270,421 | |
4.500%, 12/01/43 | | | 3,189,252 | | | | 3,510,679 | |
4.500%, 04/01/44 | | | 1,466,823 | | | | 1,604,076 | |
4.500%, 07/01/44 | | | 1,207,965 | | | | 1,317,040 | |
4.500%, 09/01/44 | | | 4,974,628 | | | | 5,439,796 | |
4.500%, 10/01/44 | | | 760,307 | | | | 828,631 | |
4.500%, TBA (a) | | | 2,439,000 | | | | 2,659,653 | |
5.000%, 10/01/41 | | | 1,073,139 | | | | 1,186,551 | |
5.000%, 11/01/41 | | | 9,665,572 | | | | 10,697,165 | |
5.500%, 09/01/39 | | | 334,209 | | | | 372,345 | |
5.500%, 01/01/40 | | | 398,914 | | | | 444,639 | |
5.500%, 07/01/40 | | | 418,554 | | | | 466,207 | |
5.500%, 06/01/41 | | | 4,175,466 | | | | 4,683,647 | |
5.500%, TBA (a) | | | 2,300,000 | | | | 2,563,438 | |
Freddie Mac ARM Non-Gold Pool
3.000%, 02/01/41 (b) | | | 976,386 | | | | 1,035,577 | |
Freddie Mac Multifamily Structured Pass-Through Certificates
1.369%, 03/25/26 (b) (c) | | | 10,384,507 | | | | 1,088,295 | |
2.673%, 03/25/26 | | | 1,045,000 | | | | 1,094,301 | |
3.151%, 11/25/25 | | | 895,651 | | | | 973,092 | |
3.334%, 08/25/25 (b) | | | 1,580,000 | | | | 1,741,768 | |
|
Agency Sponsored Mortgage - Backed—(Continued) | |
FREMF Mortgage Trust
3.724%, 06/25/48 (144A) (b) | | | 658,000 | | | | 628,881 | |
3.908%, 10/25/48 (144A) (b) | | | 400,000 | | | | 380,936 | |
4.189%, 02/25/26 (144A) (b) | | | 1,135,000 | | | | 1,088,075 | |
Ginnie Mae I 30 Yr. Pool
3.000%, TBA (a) | | | 7,542,000 | | | | 7,878,444 | |
3.500%, 02/15/42 | | | 296,975 | | | | 319,361 | |
3.500%, 04/15/42 | | | 506,307 | | | | 542,550 | |
3.500%, 05/15/42 | | | 441,042 | | | | 474,298 | |
3.500%, 08/15/42 | | | 690,759 | | | | 742,537 | |
3.500%, 11/15/42 | | | 543,348 | | | | 579,893 | |
3.500%, 12/15/42 | | | 1,519,750 | | | | 1,633,473 | |
3.500%, 01/15/43 | | | 641,141 | | | | 684,106 | |
3.500%, 02/15/43 | | | 980,558 | | | | 1,049,506 | |
3.500%, 03/15/43 | | | 537,262 | | | | 573,303 | |
3.500%, 04/15/43 | | | 2,059,586 | | | | 2,213,849 | |
3.500%, 05/15/43 | | | 3,615,512 | | | | 3,872,282 | |
3.500%, 06/15/43 | | | 953,630 | | | | 1,024,926 | |
3.500%, 07/15/43 | | | 3,043,182 | | | | 3,270,593 | |
4.000%, 01/15/41 | | | 2,287,149 | | | | 2,465,147 | |
4.000%, 03/15/41 | | | 1,757,639 | | | | 1,890,545 | |
4.000%, 12/15/41 | | | 26,818 | | | | 28,811 | |
4.000%, 05/15/42 | | | 148,618 | | | | 159,778 | |
4.000%, TBA (a) | | | 4,542,000 | | | | 4,879,811 | |
4.500%, 02/15/42 | | | 18,106,024 | | | | 19,981,123 | |
5.000%, 12/15/38 | | | 495,056 | | | | 555,964 | |
5.000%, 07/15/39 | | | 1,358,710 | | | | 1,525,940 | |
5.000%, 12/15/40 | | | 1,662,325 | | | | 1,862,078 | |
5.000%, TBA (a) | | | 10,400,000 | | | | 11,558,293 | |
5.500%, 04/15/33 | | | 42,503 | | | | 48,915 | |
6.500%, 04/15/33 | | | 51,445 | | | | 58,691 | |
8.500%, 01/15/17 | | | 527 | | | | 529 | |
8.500%, 05/15/17 | | | 143 | | | | 143 | |
8.500%, 05/15/22 | | | 1,021 | | | | 1,066 | |
9.000%, 10/15/16 | | | 168 | | | | 168 | |
Ginnie Mae II 30 Yr. Pool
3.000%, TBA (a) | | | 53,864,000 | | | | 56,318,389 | |
3.500%, 12/20/41 | | | 6,200,846 | | | | 6,605,284 | |
3.500%, 10/20/42 | | | 631,682 | | | | 673,276 | |
3.500%, 01/20/43 | | | 559,766 | | | | 596,625 | |
3.500%, 04/20/43 | | | 474,448 | | | | 505,690 | |
3.500%, 04/20/46 | | | 7,727,702 | | | | 8,216,138 | |
3.500%, TBA (a) | | | 86,015,000 | | | | 91,175,302 | |
4.000%, 09/20/40 | | | 168,476 | | | | 181,543 | |
4.000%, 10/20/40 | | | 316,527 | | | | 341,077 | |
4.000%, 12/20/40 | | | 4,527,662 | | | | 4,878,839 | |
4.000%, 01/20/41 | | | 3,403,065 | | | | 3,667,017 | |
4.000%, 02/20/41 | | | 60,335 | | | | 65,015 | |
4.000%, 07/20/43 | | | 309,800 | | | | 332,918 | |
4.000%, 08/20/44 | | | 1,206,529 | | | | 1,308,353 | |
4.000%, TBA (a) | | | 35,772,000 | | | | 38,225,734 | |
4.500%, 12/20/39 | | | 145,112 | | | | 158,393 | |
4.500%, 01/20/40 | | | 177,479 | | | | 193,757 | |
4.500%, 02/20/40 | | | 141,630 | | | | 154,615 | |
4.500%, 05/20/40 | | | 9,926 | | | | 10,809 | |
4.500%, 08/20/40 | | | 351,690 | | | | 383,962 | |
See accompanying notes to financial statements.
MSF-7
Metropolitan Series Fund
BlackRock Bond Income Portfolio
Schedule of Investments as of June 30, 2016
U.S. Treasury & Government Agencies—(Continued)
| | | | | | | | |
| Security Description | | Principal
Amount* | | | Value | |
|
Agency Sponsored Mortgage - Backed—(Continued) | |
Ginnie Mae II 30 Yr. Pool
4.500%, 05/20/41 | | | 18,705,995 | | | $ | 20,422,616 | |
4.500%, 06/20/41 | | | 1,828,626 | | | | 1,996,443 | |
4.500%, 07/20/41 | | | 1,134,105 | | | | 1,238,184 | |
4.500%, 11/20/41 | | | 166,068 | | | | 181,309 | |
4.500%, 11/20/44 | | | 453,900 | | | | 487,745 | |
5.000%, 10/20/33 | | | 1,407,405 | | | | 1,584,569 | |
5.000%, 10/20/39 | | | 532,203 | | | | 592,028 | |
Government National Mortgage Association
0.825%, 08/16/41 (c) | | | 6,867,465 | | | | 156,578 | |
0.904%, 02/16/53 (b) (c) | | | 24,533,446 | | | | 1,498,223 | |
1.000%, 02/16/39 (c) | | | 9,220,438 | | | | 187,214 | |
1.010%, 08/16/58 (b) (c) | | | 3,950,000 | | | | 329,129 | |
| | | | | | | | |
| | | | | | | 1,298,882,861 | |
| | | | | | | | |
| | |
U.S. Treasury—20.7% | | | | | | | | |
U.S. Treasury Bonds
2.500%, 02/15/46 | | | 5,335,000 | | | | 5,555,277 | |
2.875%, 08/15/45 (d) | | | 55,957,000 | | | | 62,833,612 | |
3.000%, 11/15/45 | | | 54,205,000 | | | | 62,327,294 | |
U.S. Treasury Inflation Indexed Notes
0.625%, 01/15/26 (e) | | | 40,178,576 | | | | 42,309,407 | |
U.S. Treasury Notes
0.750%, 04/30/18 | | | 84,600,000 | | | | 84,844,578 | |
0.750%, 02/15/19 | | | 112,406,000 | | | | 112,625,529 | |
1.125%, 02/28/21 | | | 2,640,000 | | | | 2,658,562 | |
1.250%, 03/31/21 | | | 107,378,000 | | | | 108,627,987 | |
1.375%, 04/30/21 | | | 106,858,000 | | | | 108,703,010 | |
1.500%, 03/31/23 | | | 31,510,000 | | | | 31,964,185 | |
1.625%, 04/30/23 | | | 25,023,000 | | | | 25,585,042 | |
1.625%, 02/15/26 | | | 28,326,800 | | | | 28,645,476 | |
1.625%, 05/15/26 | | | 16,000 | | | | 16,196 | |
2.000%, 08/15/25 | | | 37,229,000 | | | | 38,920,313 | |
2.250%, 11/15/25 | | | 91,835,200 | | | | 97,976,679 | |
| | | | | | | | |
| | | | | | | 813,593,147 | |
| | | | | | | | |
Total U.S. Treasury & Government Agencies
(Cost $2,072,258,499) | | | | | | | 2,112,476,008 | |
| | | | | | | | |
|
| Corporate Bonds & Notes—26.0% | |
| | |
Advertising—0.1% | | | | | | | | |
Interpublic Group of Cos., Inc. (The)
3.750%, 02/15/23 | | | 1,191,000 | | | | 1,239,908 | |
4.000%, 03/15/22 | | | 1,468,000 | | | | 1,562,516 | |
Omnicom Group, Inc.
3.650%, 11/01/24 | | | 750,000 | | | | 790,691 | |
| | | | | | | | |
| | | | | | | 3,593,115 | |
| | | | | | | | |
| | |
Aerospace/Defense—0.4% | | | | | | | | |
BAE Systems Holdings, Inc.
2.850%, 12/15/20 (144A) | | | 699,000 | | | | 714,251 | |
3.850%, 12/15/25 (144A) | | | 454,000 | | | | 481,214 | |
|
Aerospace/Defense—(Continued) | |
BAE Systems Holdings, Inc.
4.750%, 10/07/44 (144A) | | | 132,000 | | | | 144,010 | |
Boeing Co. (The)
2.200%, 10/30/22 | | | 222,000 | | | | 227,915 | |
2.350%, 10/30/21 | | | 844,000 | | | | 874,466 | |
2.600%, 10/30/25 | | | 316,000 | | | | 329,049 | |
Harris Corp.
2.700%, 04/27/20 | | | 706,000 | | | | 715,595 | |
4.854%, 04/27/35 (f) | | | 1,855,000 | | | | 2,036,378 | |
5.054%, 04/27/45 | | | 299,000 | | | | 339,136 | |
Lockheed Martin Corp.
3.100%, 01/15/23 | | | 299,000 | | | | 315,141 | |
3.550%, 01/15/26 | | | 815,000 | | | | 885,295 | |
3.600%, 03/01/35 | | | 1,121,000 | | | | 1,136,416 | |
4.070%, 12/15/42 | | | 380,000 | | | | 404,542 | |
4.500%, 05/15/36 | | | 323,000 | | | | 360,537 | |
4.700%, 05/15/46 | | | 527,000 | | | | 621,212 | |
Northrop Grumman Corp.
3.850%, 04/15/45 | | | 1,295,000 | | | | 1,348,142 | |
United Technologies Corp.
1.778%, 05/04/18 (g) | | | 3,052,000 | | | | 3,079,419 | |
4.150%, 05/15/45 (f) | | | 836,000 | | | | 918,241 | |
| | | | | | | | |
| | | | | | | 14,930,959 | |
| | | | | | | | |
| | |
Agriculture—0.5% | | | | | | | | |
Altria Group, Inc.
2.625%, 01/14/20 | | | 1,684,000 | | | | 1,750,595 | |
2.850%, 08/09/22 | | | 1,218,000 | | | | 1,275,767 | |
4.250%, 08/09/42 | | | 211,000 | | | | 230,374 | |
5.375%, 01/31/44 | | | 2,209,000 | | | | 2,832,161 | |
Philip Morris International, Inc.
1.125%, 08/21/17 (f) | | | 3,344,000 | | | | 3,350,745 | |
2.750%, 02/25/26 (f) | | | 6,002,000 | | | | 6,189,635 | |
4.125%, 03/04/43 | | | 1,129,000 | | | | 1,210,971 | |
4.875%, 11/15/43 | | | 1,032,000 | | | | 1,228,557 | |
Reynolds American, Inc.
2.300%, 06/12/18 | | | 1,321,000 | | | | 1,342,191 | |
3.250%, 06/12/20 (f) | | | 561,000 | | | | 593,023 | |
| | | | | | | | |
| | | | | | | 20,004,019 | |
| | | | | | | | |
| | |
Airlines—0.3% | | | | | | | | |
American Airlines Group, Inc.
4.625%, 03/01/20 (144A) (f) | | | 2,214,000 | | | | 2,114,370 | |
American Airlines Pass-Through Trust
3.375%, 05/01/27 | | | 3,500,179 | | | | 3,521,881 | |
Southwest Airlines Co.
2.650%, 11/05/20 | | | 1,550,000 | | | | 1,599,846 | |
2.750%, 11/06/19 (f) | | | 1,032,000 | | | | 1,066,858 | |
Turkish Airlines Pass-Through Trust
4.200%, 03/15/27 (144A) | | | 1,288,936 | | | | 1,224,489 | |
United Airlines Pass-Through Trust
4.750%, 04/11/22 | | | 379,793 | | | | 383,116 | |
| | | | | | | | |
| | | | | | | 9,910,560 | |
| | | | | | | | |
See accompanying notes to financial statements.
MSF-8
Metropolitan Series Fund
BlackRock Bond Income Portfolio
Schedule of Investments as of June 30, 2016
Corporate Bonds & Notes—(Continued)
| | | | | | | | |
| Security Description | | Principal
Amount* | | | Value | |
| | |
Apparel—0.0% | | | | | | | | |
BiSoho SAS
5.875%, 05/01/23 (EUR) | | | 100,000 | | | $ | 113,746 | |
NIKE, Inc.
3.875%, 11/01/45 | | | 1,192,000 | | | | 1,321,403 | |
| | | | | | | | |
| | | | | | | 1,435,149 | |
| | | | | | | | |
| | |
Auto Manufacturers—1.3% | | | | | | | | |
Daimler Finance North America LLC
2.450%, 05/18/20 (144A) | | | 3,587,000 | | | | 3,691,177 | |
Fiat Chrysler Finance Europe
4.750%, 03/22/21 (EUR) | | | 100,000 | | | | 119,248 | |
Ford Motor Credit Co. LLC
1.724%, 12/06/17 | | | 6,974,000 | | | | 6,988,834 | |
2.021%, 05/03/19 (f) | | | 10,222,000 | | | | 10,308,979 | |
2.145%, 01/09/18 | | | 2,592,000 | | | | 2,614,698 | |
3.336%, 03/18/21 (f) | | | 3,783,000 | | | | 3,923,451 | |
4.250%, 09/20/22 | | | 1,943,000 | | | | 2,095,310 | |
General Motors Financial Co., Inc.
2.625%, 07/10/17 | | | 2,036,000 | | | | 2,054,821 | |
3.100%, 01/15/19 | | | 814,000 | | | | 831,549 | |
3.200%, 07/06/21 | | | 8,280,000 | | | | 8,293,174 | |
3.450%, 04/10/22 | | | 1,410,000 | | | | 1,409,005 | |
3.700%, 11/24/20 | | | 1,345,000 | | | | 1,381,865 | |
4.000%, 01/15/25 | | | 1,821,000 | | | | 1,842,506 | |
4.750%, 08/15/17 | | | 3,515,000 | | | | 3,626,900 | |
Toyota Motor Credit Corp.
2.750%, 05/17/21 | | | 3,187,000 | | | | 3,340,766 | |
| | | | | | | | |
| | | | | | | 52,522,283 | |
| | | | | | | | |
| | |
Auto Parts & Equipment—0.1% | | | | | | | | |
BorgWarner, Inc.
3.375%, 03/15/25 (f) | | | 1,561,000 | | | | 1,596,152 | |
Delphi Automotive plc
4.250%, 01/15/26 | | | 1,855,000 | | | | 2,027,211 | |
Faurecia
3.625%, 06/15/23 (EUR) | | | 100,000 | | | | 112,207 | |
LKQ Italia Bondco S.p.A.
3.875%, 04/01/24 (EUR) | | | 100,000 | | | | 113,749 | |
Schaeffler Holding Finance B.V.
5.750%, 11/15/21 (EUR) (h) | | | 60,000 | | | | 71,246 | |
| | | | | | | | |
| | | | | | | 3,920,565 | |
| | | | | | | | |
| | |
Banks—4.0% | | | | | | | | |
ABN AMRO Bank NV
5.750%, 09/22/20 (EUR) (b) | | | 200,000 | | | | 206,214 | |
Banco Bilbao Vizcaya Argentaria S.A.
7.000%, 02/19/19 (EUR) (b) | | | 200,000 | | | | 190,721 | |
Banco Espirito Santo S.A.
4.000%, 01/21/19 (EUR) (b) | | | 200,000 | | | | 55,488 | |
Banco Santander S.A.
6.250%, 03/12/19 (EUR) (b) | | | 100,000 | | | | 93,774 | |
Bank of America Corp.
2.250%, 04/21/20 | | | 2,535,000 | | | | 2,549,173 | |
3.300%, 01/11/23 | | | 3,383,000 | | | | 3,481,604 | |
| | |
Banks—(Continued) | | | | | | | | |
Bank of America Corp.
3.875%, 08/01/25 | | | 5,164,000 | | | | 5,478,028 | |
4.875%, 04/01/44 | | | 494,000 | | | | 562,960 | |
Bank of Ireland
4.250%, 06/11/24 (EUR) (b) | | | 100,000 | | | | 107,681 | |
Bank of New York Mellon Corp. (The)
2.050%, 05/03/21 (f) | | | 13,331,000 | | | | 13,540,577 | |
2.100%, 01/15/19 | | | 3,085,000 | | | | 3,153,897 | |
Bankia S.A.
4.000%, 05/22/24 (EUR) (b) | | | 200,000 | | | | 209,258 | |
BB&T Corp.
2.450%, 01/15/20 | | | 2,395,000 | | | | 2,461,744 | |
Branch Banking & Trust Co.
2.300%, 10/15/18 (f) | | | 2,160,000 | | | | 2,214,037 | |
Capital One Financial Corp.
4.750%, 07/15/21 | | | 80,000 | | | | 89,051 | |
Capital One N.A.
2.400%, 09/05/19 | | | 250,000 | | | | 253,308 | |
2.950%, 07/23/21 | | | 5,963,000 | | | | 6,127,662 | |
Citigroup, Inc.
1.800%, 02/05/18 | | | 2,960,000 | | | | 2,972,136 | |
2.500%, 09/26/18 | | | 4,057,000 | | | | 4,137,410 | |
2.500%, 07/29/19 | | | 3,634,000 | | | | 3,701,701 | |
3.500%, 05/15/23 | | | 2,381,000 | | | | 2,429,851 | |
3.875%, 03/26/25 | | | 1,530,000 | | | | 1,545,468 | |
Citizens Bank N.A.
2.300%, 12/03/18 | | | 1,395,000 | | | | 1,413,255 | |
Commerzbank AG
7.750%, 03/16/21 (EUR) | | | 100,000 | | | | 132,155 | |
Cooperatieve Rabobank UA
4.375%, 08/04/25 | | | 2,756,000 | | | | 2,878,719 | |
6.625%, 06/29/21 (EUR) (b) | | | 200,000 | | | | 222,723 | |
Credit Agricole S.A.
6.500%, 06/23/21 (EUR) (b) | | | 100,000 | | | | 104,317 | |
Credit Suisse AG
3.000%, 10/29/21 | | | 2,270,000 | | | | 2,325,156 | |
Credit Suisse Group Funding Guernsey, Ltd.
2.750%, 03/26/20 | | | 3,269,000 | | | | 3,227,490 | |
4.875%, 05/15/45 | | | 753,000 | | | | 749,848 | |
Fifth Third Bank
2.250%, 06/14/21 (f) | | | 3,062,000 | | | | 3,109,761 | |
Goldman Sachs Group, Inc. (The)
2.000%, 04/25/19 (f) | | | 950,000 | | | | 959,746 | |
2.600%, 04/23/20 (f) | | | 2,774,000 | | | | 2,820,170 | |
2.625%, 01/31/19 | | | 3,624,000 | | | | 3,709,048 | |
2.625%, 04/25/21 | | | 2,055,000 | | | | 2,084,033 | |
2.750%, 09/15/20 | | | 1,326,000 | | | | 1,353,508 | |
3.500%, 01/23/25 | | | 1,683,000 | | | | 1,729,296 | |
3.750%, 05/22/25 | | | 3,281,000 | | | | 3,426,581 | |
4.750%, 10/21/45 | | | 972,000 | | | | 1,071,420 | |
4.800%, 07/08/44 | | | 994,000 | | | | 1,100,344 | |
HSH Nordbank AG
0.542%, 02/14/17 (EUR) (b) | | | 50,000 | | | | 52,160 | |
See accompanying notes to financial statements.
MSF-9
Metropolitan Series Fund
BlackRock Bond Income Portfolio
Schedule of Investments as of June 30, 2016
Corporate Bonds & Notes—(Continued)
| | | | | | | | |
| Security Description | | Principal
Amount* | | | Value | |
| | |
Banks—(Continued) | | | | | | | | |
JPMorgan Chase & Co.
1.350%, 02/15/17 | | | 5,265,000 | | | $ | 5,275,699 | |
2.200%, 10/22/19 | | | 2,326,000 | | | | 2,364,284 | |
2.550%, 10/29/20 | | | 3,260,000 | | | | 3,330,709 | |
2.750%, 06/23/20 | | | 667,000 | | | | 687,298 | |
3.200%, 06/15/26 (f) | | | 4,172,000 | | | | 4,288,098 | |
3.875%, 09/10/24 | | | 2,931,000 | | | | 3,034,573 | |
3.900%, 07/15/25 | | | 1,343,000 | | | | 1,448,505 | |
4.250%, 10/01/27 | | | 1,990,000 | | | | 2,105,486 | |
Lloyds Banking Group plc
5.300%, 12/01/45 (144A) | | | 478,000 | | | | 499,864 | |
Morgan Stanley
2.800%, 06/16/20 | | | 3,889,000 | | | | 3,984,697 | |
3.700%, 10/23/24 | | | 3,417,000 | | | | 3,575,460 | |
3.750%, 02/25/23 | | | 1,545,000 | | | | 1,636,425 | |
3.875%, 01/27/26 (f) | | | 3,069,000 | | | | 3,258,014 | |
4.000%, 07/23/25 | | | 1,425,000 | | | | 1,525,874 | |
4.300%, 01/27/45 | �� | | 2,591,000 | | | | 2,727,147 | |
Santander UK Group Holdings plc
4.750%, 09/15/25 (144A) (f) | | | 1,290,000 | | | | 1,273,256 | |
State Street Capital Trust
1.653%, 06/15/37 (b) | | | 500,000 | | | | 417,665 | |
State Street Corp.
2.650%, 05/19/26 | | | 4,226,000 | | | | 4,312,151 | |
U.S. Bancorp
2.950%, 07/15/22 | | | 3,137,000 | | | | 3,264,475 | |
3.100%, 04/27/26 | | | 1,938,000 | | | | 2,015,803 | |
UBS Group Funding Jersey, Ltd.
4.125%, 09/24/25 (144A) | | | 1,338,000 | | | | 1,386,901 | |
UniCredit S.p.A.
5.750%, 10/28/25 (EUR) (b) | | | 100,000 | | | | 114,870 | |
Wells Fargo & Co.
2.550%, 12/07/20 | | | 1,717,000 | | | | 1,767,033 | |
2.600%, 07/22/20 | | | 1,479,000 | | | | 1,519,993 | |
3.000%, 04/22/26 (f) | | | 7,560,000 | | | | 7,706,294 | |
3.550%, 09/29/25 (f) | | | 2,235,000 | | | | 2,381,929 | |
3.900%, 05/01/45 | | | 2,148,000 | | | | 2,254,586 | |
4.900%, 11/17/45 | | | 969,000 | | | | 1,060,381 | |
| | | | | | | | |
| | | | | | | 157,248,943 | |
| | | | | | | | |
| | |
Beverages—0.5% | | | | | | | | |
Anheuser-Busch InBev Finance, Inc.
2.650%, 02/01/21 | | | 3,844,000 | | | | 3,986,286 | |
3.300%, 02/01/23 | | | 3,105,000 | | | | 3,271,645 | |
3.650%, 02/01/26 | | | 2,940,000 | | | | 3,149,463 | |
4.700%, 02/01/36 | | | 1,240,000 | | | | 1,393,423 | |
4.900%, 02/01/46 | | | 1,825,000 | | | | 2,138,612 | |
Anheuser-Busch InBev Worldwide, Inc.
3.750%, 07/15/42 | | | 860,000 | | | | 860,501 | |
Molson Coors Brewing Co.
3.000%, 07/15/26 | | | 2,727,000 | | | | 2,724,311 | |
4.200%, 07/15/46 | | | 971,000 | | | | 975,152 | |
5.000%, 05/01/42 | | | 607,000 | | | | 680,293 | |
PepsiCo, Inc.
4.450%, 04/14/46 | | | 1,757,000 | | | | 2,050,384 | |
| | | | | | | | |
| | | | | | | 21,230,070 | |
| | | | | | | | |
| | |
Biotechnology—0.6% | | | | | | | | |
Amgen, Inc.
2.125%, 05/01/20 | | | 2,559,000 | | | | 2,599,412 | |
4.400%, 05/01/45 | | | 758,000 | | | | 787,456 | |
4.663%, 06/15/51 (144A) | | | 1,808,000 | | | | 1,889,022 | |
Biogen, Inc.
2.900%, 09/15/20 | | | 915,000 | | | | 953,574 | |
3.625%, 09/15/22 | | | 1,563,000 | | | | 1,659,139 | |
4.050%, 09/15/25 | | | 1,315,000 | | | | 1,415,533 | |
5.200%, 09/15/45 | | | 295,000 | | | | 331,740 | |
Celgene Corp.
2.250%, 05/15/19 (f) | | | 2,053,000 | | | | 2,087,225 | |
3.250%, 08/15/22 | | | 2,085,000 | | | | 2,153,488 | |
Gilead Sciences, Inc.
2.350%, 02/01/20 (f) | | | 589,000 | | | | 604,203 | |
3.650%, 03/01/26 | | | 496,000 | | | | 539,736 | |
4.500%, 02/01/45 | | | 547,000 | | | | 596,238 | |
4.600%, 09/01/35 | | | 564,000 | | | | 627,109 | |
4.750%, 03/01/46 | | | 1,278,000 | | | | 1,453,218 | |
4.800%, 04/01/44 | | | 3,342,000 | | | | 3,759,847 | |
| | | | | | | | |
| | | | | | | 21,456,940 | |
| | | | | | | | |
| | |
Building Materials—0.0% | | | | | | | | |
Cemex Finance LLC
9.375%, 10/12/22 (144A) | | | 461,000 | | | | 507,100 | |
HeidelbergCement AG
2.250%, 03/30/23 (EUR) | | | 50,000 | | | | 56,601 | |
Standard Industries, Inc.
6.000%, 10/15/25 (144A) | | | 690,000 | | | | 721,050 | |
| | | | | | | | |
| | | | | | | 1,284,751 | |
| | | | | | | | |
| | |
Chemicals—0.3% | | | | | | | | |
Agrium, Inc.
4.125%, 03/15/35 | | | 1,155,000 | | | | 1,115,385 | |
CF Industries, Inc.
3.450%, 06/01/23 (f) | | | 1,090,000 | | | | 1,089,028 | |
5.375%, 03/15/44 | | | 1,793,000 | | | | 1,690,898 | |
Dow Chemical Co. (The)
4.375%, 11/15/42 | | | 726,000 | | | | 741,342 | |
4.625%, 10/01/44 | | | 982,000 | | | | 1,039,907 | |
Eastman Chemical Co.
4.800%, 09/01/42 | | | 1,236,000 | | | | 1,281,132 | |
Ecolab, Inc.
2.250%, 01/12/20 | | | 1,595,000 | | | | 1,623,665 | |
Ineos Finance plc
4.000%, 05/01/23 (EUR) | | | 100,000 | | | | 106,432 | |
Monsanto Co.
3.600%, 07/15/42 | | | 1,222,000 | | | | 1,056,139 | |
Sherwin-Williams Co. (The)
4.000%, 12/15/42 | | | 565,000 | | | | 563,852 | |
| | | | | | | | |
| | | | | | | 10,307,780 | |
| | | | | | | | |
| | |
Coal—0.0% | | | | | | | | |
CONSOL Energy, Inc.
5.875%, 04/15/22 (f) | | | 1,320,000 | | | | 1,151,700 | |
| | | | | | | | |
See accompanying notes to financial statements.
MSF-10
Metropolitan Series Fund
BlackRock Bond Income Portfolio
Schedule of Investments as of June 30, 2016
Corporate Bonds & Notes—(Continued)
| | | | | | | | |
| Security Description | | Principal
Amount* | | | Value | |
| | |
Commercial Services—0.2% | | | | | | | | |
Catholic Health Initiatives
4.350%, 11/01/42 | | | 550,000 | | | $ | 554,833 | |
EC Finance plc
5.125%, 07/15/21 (EUR) | | | 100,000 | | | | 115,414 | |
Loxam SAS
3.500%, 05/03/23 (EUR) | | | 100,000 | | | | 111,807 | |
Moody’s Corp.
4.500%, 09/01/22 | | | 1,667,000 | | | | 1,853,306 | |
TMF Group Holding B.V.
9.875%, 12/01/19 (EUR) | | | 250,000 | | | | 296,026 | |
Total System Services, Inc.
4.800%, 04/01/26 | | | 3,469,000 | | | | 3,761,728 | |
Wesleyan University
4.781%, 07/01/2116 | | | 1,088,000 | | | | 1,167,046 | |
| | | | | | | | |
| | | | | | | 7,860,160 | |
| | | | | | | | |
| | |
Computers—1.0% | | | | | | | | |
Apple, Inc.
2.100%, 05/06/19 | | | 3,725,000 | | | | 3,833,442 | |
3.250%, 02/23/26 (f) | | | 6,360,000 | | | | 6,751,624 | |
3.450%, 02/09/45 | | | 1,028,000 | | | | 965,962 | |
4.650%, 02/23/46 | | | 9,293,000 | | | | 10,497,159 | |
Hewlett Packard Enterprise Co.
2.850%, 10/05/18 (144A) | | | 2,705,000 | | | | 2,770,082 | |
3.600%, 10/15/20 (144A) (f) | | | 3,456,000 | | | | 3,607,307 | |
HP, Inc.
3.750%, 12/01/20 | | | 357,000 | | | | 377,102 | |
International Business Machines Corp.
3.450%, 02/19/26 | | | 10,010,000 | | | | 10,886,876 | |
| | | | | | | | |
| | | | | | | 39,689,554 | |
| | | | | | | | |
| | |
Distribution/Wholesale—0.0% | | | | | | | | |
Rexel S.A.
3.500%, 06/15/23 (EUR) | | | 100,000 | | | | 111,835 | |
| | | | | | | | |
|
Diversified Financial Services—0.8% | |
American Express Credit Corp.
1.125%, 06/05/17 | | | 6,272,000 | | | | 6,271,141 | |
2.250%, 08/15/19 (f) | | | 1,959,000 | | | | 1,999,782 | |
Capital One Bank USA N.A.
2.300%, 06/05/19 | | | 500,000 | | | | 506,208 | |
GE Capital International Funding Co.
3.373%, 11/15/25 (144A) | | | 5,226,000 | | | | 5,671,412 | |
Intercontinental Exchange, Inc.
2.750%, 12/01/20 | | | 1,085,000 | | | | 1,139,965 | |
3.750%, 12/01/25 | | | 694,000 | | | | 752,341 | |
Jefferies Group LLC
6.500%, 01/20/43 | | | 648,000 | | | | 643,421 | |
MasterCard, Inc.
3.375%, 04/01/24 | | | 2,285,000 | | | | 2,476,042 | |
Mercury Bondco plc
8.250%, 05/30/21 (EUR) (h) | | | 100,000 | | | | 109,677 | |
Synchrony Financial
2.600%, 01/15/19 | | | 1,706,000 | | | | 1,724,669 | |
2.700%, 02/03/20 | | | 1,079,000 | | | | 1,081,953 | |
4.500%, 07/23/25 | | | 1,243,000 | | | | 1,288,865 | |
|
Diversified Financial Services—(Continued) | |
Visa, Inc.
2.800%, 12/14/22 | | | 3,556,000 | | | | 3,751,537 | |
3.150%, 12/14/25 | | | 1,603,000 | | | | 1,713,785 | |
4.150%, 12/14/35 | | | 411,000 | | | | 464,827 | |
| | | | | | | | |
| | | | | | | 29,595,625 | |
| | | | | | | | |
| | |
Electric—2.1% | | | | | | | | |
AES Gener S.A.
5.000%, 07/14/25 (144A) | | | 459,000 | | | | 471,768 | |
Alabama Power Co.
2.800%, 04/01/25 | | | 477,000 | | | | 494,122 | |
Berkshire Hathaway Energy Co.
2.400%, 02/01/20 | | | 1,104,000 | | | | 1,133,990 | |
3.500%, 02/01/25 | | | 1,060,000 | | | | 1,143,228 | |
CenterPoint Energy Houston Electric LLC
4.500%, 04/01/44 | | | 560,000 | | | | 660,669 | |
CMS Energy Corp.
3.875%, 03/01/24 | | | 1,881,000 | | | | 2,045,687 | |
Commonwealth Edison Co.
4.700%, 01/15/44 | | | 1,451,000 | | | | 1,746,077 | |
Consumers Energy Co.
3.950%, 05/15/43 (f) | | | 894,000 | | | | 968,241 | |
Dominion Resources, Inc.
1.950%, 08/15/16 | | | 2,289,000 | | | | 2,291,195 | |
2.500%, 12/01/19 | | | 2,587,000 | | | | 2,643,086 | |
DTE Electric Co.
3.950%, 06/15/42 | | | 1,109,000 | | | | 1,203,497 | |
DTE Energy Co.
2.400%, 12/01/19 | | | 791,000 | | | | 807,660 | |
3.500%, 06/01/24 | | | 2,352,000 | | | | 2,496,373 | |
Duke Energy Carolinas LLC
3.750%, 06/01/45 | | | 1,109,000 | | | | 1,170,927 | |
4.250%, 12/15/41 | | | 1,865,000 | | | | 2,089,798 | |
Duke Energy Corp.
3.050%, 08/15/22 | | | 150,000 | | | | 155,864 | |
3.750%, 04/15/24 | | | 1,582,000 | | | | 1,698,733 | |
4.800%, 12/15/45 | | | 730,000 | | | | 845,189 | |
Duke Energy Florida LLC
3.850%, 11/15/42 | | | 1,109,000 | | | | 1,171,908 | |
Emera U.S. Finance L.P.
2.150%, 06/15/19 (144A) | | | 2,058,000 | | | | 2,081,941 | |
2.700%, 06/15/21 (144A) | | | 3,096,000 | | | | 3,154,942 | |
3.550%, 06/15/26 (144A) | | | 2,441,000 | | | | 2,497,726 | |
Enel S.p.A.
5.000%, 01/15/75 (EUR) (b) | | | 100,000 | | | | 116,736 | |
Entergy Arkansas, Inc.
3.700%, 06/01/24 | | | 1,834,000 | | | | 2,010,370 | |
Exelon Corp.
2.450%, 04/15/21 | | | 549,000 | | | | 556,723 | |
2.850%, 06/15/20 | | | 3,225,000 | | | | 3,326,807 | |
Florida Power & Light Co.
3.800%, 12/15/42 | | | 627,000 | | | | 674,870 | |
NiSource Finance Corp.
3.850%, 02/15/23 | | | 1,958,000 | | | | 2,113,115 | |
Northern States Power Co.
3.600%, 05/15/46 | | | 3,821,000 | | | | 4,017,613 | |
See accompanying notes to financial statements.
MSF-11
Metropolitan Series Fund
BlackRock Bond Income Portfolio
Schedule of Investments as of June 30, 2016
Corporate Bonds & Notes—(Continued)
| | | | | | | | |
| Security Description | | Principal
Amount* | | | Value | |
| | |
Electric—(Continued) | | | | | | | | |
Pacific Gas & Electric Co.
4.300%, 03/15/45 | | | 839,000 | | | $ | 940,746 | |
4.750%, 02/15/44 | | | 545,000 | | | | 643,843 | |
PacifiCorp
3.350%, 07/01/25 | | | 3,477,000 | | | | 3,759,242 | |
3.600%, 04/01/24 | | | 4,004,000 | | | | 4,398,010 | |
PG&E Corp.
2.400%, 03/01/19 | | | 1,634,000 | | | | 1,666,046 | |
Progress Energy, Inc.
4.875%, 12/01/19 (f) | | | 409,000 | | | | 450,313 | |
Public Service Co. of Colorado
2.500%, 03/15/23 | | | 1,503,000 | | | | 1,534,085 | |
Puget Sound Energy, Inc.
4.300%, 05/20/45 | | | 1,922,000 | | | | 2,199,341 | |
Southern California Edison Co.
1.250%, 11/01/17 | | | 1,080,000 | | | | 1,085,255 | |
Southern Co. (The)
1.950%, 09/01/16 | | | 2,212,000 | | | | 2,215,384 | |
3.250%, 07/01/26 | | | 9,105,000 | | | | 9,457,573 | |
Trans-Allegheny Interstate Line Co.
3.850%, 06/01/25 (144A) | | | 3,395,000 | | | | 3,629,778 | |
Virginia Electric & Power Co.
3.450%, 02/15/24 | | | 1,744,000 | | | | 1,888,818 | |
4.200%, 05/15/45 (f) | | | 1,419,000 | | | | 1,580,433 | |
4.450%, 02/15/44 | | | 437,000 | | | | 502,283 | |
| | | | | | | | |
| | | | | | | 81,740,005 | |
| | | | | | | | |
| | |
Electronics—0.0% | | | | | | | | |
Trionista Holdco GmbH
5.000%, 04/30/20 (EUR) | | | 306,000 | | | | 347,649 | |
| | | | | | | | |
| | |
Entertainment—0.0% | | | | | | | | |
Gala Group Finance plc
8.875%, 09/01/18 (GBP) | | | 25,143 | | | | 34,275 | |
International Game Technology plc
4.750%, 02/15/23 (EUR) | | | 100,000 | | | | 114,859 | |
PortAventura Entertainment Barcelona B.V.
7.250%, 12/01/20 (EUR) | | | 140,000 | | | | 161,195 | |
Vougeot Bidco plc
7.875%, 07/15/20 (GBP) | | | 150,000 | | | | 204,180 | |
| | | | | | | | |
| | | | | | | 514,509 | |
| | | | | | | | |
| | |
Environmental Control—0.1% | | | | | | | | |
Befesa Zinc SAU Via Zinc Capital S.A.
8.875%, 05/15/18 (EUR) | | | 100,000 | | | | 110,314 | |
Bilbao Luxembourg S.A.
11.063%, 12/01/18 (EUR) (h) | | | 107,110 | | | | 114,539 | |
Republic Services, Inc.
3.200%, 03/15/25 | | | 1,798,000 | | | | 1,878,126 | |
Waste Management, Inc.
3.125%, 03/01/25 | | | 1,162,000 | | | | 1,214,982 | |
3.900%, 03/01/35 | | | 442,000 | | | | 463,163 | |
| | | | | | | | |
| | | | | | | 3,781,124 | |
| | | | | | | | |
| | |
Food—0.1% | | | | | | | | |
Casino Guichard Perrachon S.A.
3.248%, 03/07/24 (EUR) | | | 100,000 | | | | 115,787 | |
3.311%, 01/25/23 (EUR) | | | 100,000 | | | | 118,882 | |
Kraft Heinz Foods Co.
3.000%, 06/01/26 (144A) (f) | | | 1,860,000 | | | | 1,875,211 | |
6.875%, 01/26/39 | | | 678,000 | | | | 925,806 | |
Marfrig Holdings Europe B.V.
8.000%, 06/08/23 (144A) (f) | | | 313,000 | | | | 319,417 | |
Sysco Corp.
4.500%, 04/01/46 | | | 676,000 | | | | 721,108 | |
| | | | | | | | |
| | | | | | | 4,076,211 | |
| | | | | | | | |
| | |
Forest Products & Paper—0.1% | | | | | | | | |
Georgia-Pacific LLC
7.375%, 12/01/25 | | | 1,415,000 | | | | 1,885,713 | |
International Paper Co.
3.650%, 06/15/24 | | | 1,361,000 | | | | 1,439,196 | |
4.800%, 06/15/44 | | | 929,000 | | | | 944,473 | |
Smurfit Kappa Acquisitions
2.750%, 02/01/25 (EUR) | | | 100,000 | | | | 111,252 | |
| | | | | | | | |
| | | | | | | 4,380,634 | |
| | | | | | | | |
| | |
Gas—0.0% | | | | | | | | |
GNL Quintero S.A.
4.634%, 07/31/29 (144A) | | | 384,000 | | | | 391,680 | |
Sempra Energy
2.875%, 10/01/22 | | | 896,000 | | | | 916,615 | |
| | | | | | | | |
| | | | | | | 1,308,295 | |
| | | | | | | | |
| | |
Healthcare-Products—0.9% | | | | | | | | |
Abbott Laboratories
2.550%, 03/15/22 | | | 2,858,000 | | | | 2,923,191 | |
Becton Dickinson & Co.
1.450%, 05/15/17 | | | 1,820,000 | | | �� | 1,824,730 | |
1.800%, 12/15/17 | | | 845,000 | | | | 851,908 | |
2.675%, 12/15/19 | | | 2,692,000 | | | | 2,768,808 | |
3.125%, 11/08/21 | | | 1,286,000 | | | | 1,349,314 | |
4.685%, 12/15/44 | | | 367,000 | | | | 413,454 | |
Boston Scientific Corp.
2.650%, 10/01/18 | | | 1,872,000 | | | | 1,913,536 | |
2.850%, 05/15/20 | | | 2,268,000 | | | | 2,349,519 | |
3.850%, 05/15/25 | | | 1,795,000 | | | | 1,898,670 | |
Medtronic, Inc.
2.500%, 03/15/20 | | | 1,749,000 | | | | 1,813,911 | |
3.125%, 03/15/22 | | | 1,645,000 | | | | 1,743,764 | |
3.625%, 03/15/24 | | | 2,067,000 | | | | 2,274,992 | |
4.625%, 03/15/44 | | | 1,993,000 | | | | 2,327,702 | |
4.625%, 03/15/45 | | | 1,353,000 | | | | 1,590,980 | |
St. Jude Medical, Inc.
2.800%, 09/15/20 (f) | | | 1,578,000 | | | | 1,626,733 | |
3.875%, 09/15/25 (f) | | | 505,000 | | | | 537,913 | |
Stryker Corp.
3.375%, 11/01/25 | | | 703,000 | | | | 737,736 | |
3.500%, 03/15/26 (f) | | | 1,175,000 | | | | 1,246,534 | |
4.625%, 03/15/46 | | | 1,016,000 | | | | 1,141,513 | |
See accompanying notes to financial statements.
MSF-12
Metropolitan Series Fund
BlackRock Bond Income Portfolio
Schedule of Investments as of June 30, 2016
Corporate Bonds & Notes—(Continued)
| | | | | | | | |
| Security Description | | Principal
Amount* | | | Value | |
|
Healthcare-Products—(Continued) | |
Thermo Fisher Scientific, Inc.
3.300%, 02/15/22 | | | 1,695,000 | | | $ | 1,758,551 | |
3.650%, 12/15/25 | | | 550,000 | | | | 577,455 | |
Zimmer Biomet Holdings, Inc.
3.550%, 04/01/25 (f) | | | 889,000 | | | | 916,294 | |
4.250%, 08/15/35 | | | 1,145,000 | | | | 1,147,819 | |
| | | | | | | | |
| | | | | | | 35,735,027 | |
| | | | | | | | |
| | |
Healthcare-Services—1.1% | | | | | | | | |
Aetna, Inc.
2.400%, 06/15/21 | | | 3,807,000 | | | | 3,884,213 | |
3.200%, 06/15/26 | | | 4,303,000 | | | | 4,427,030 | |
4.125%, 11/15/42 | | | 786,000 | | | | 795,348 | |
4.500%, 05/15/42 | | | 881,000 | | | | 932,638 | |
Anthem, Inc.
1.875%, 01/15/18 | | | 5,068,000 | | | | 5,096,690 | |
2.300%, 07/15/18 | | | 7,006,000 | | | | 7,106,781 | |
4.650%, 08/15/44 | | | 1,036,000 | | | | 1,103,285 | |
Baylor Scott & White Holdings
4.185%, 11/15/45 | | | 775,000 | | | | 864,126 | |
Cigna Corp.
3.250%, 04/15/25 | | | 3,015,000 | | | | 3,062,311 | |
Dignity Health
5.267%, 11/01/64 | | | 985,000 | | | | 1,173,744 | |
Laboratory Corp. of America Holdings
2.625%, 02/01/20 | | | 1,583,000 | | | | 1,616,860 | |
New York and Presbyterian Hospital (The)
3.563%, 08/01/36 | | | 547,000 | | | | 575,782 | |
Ochsner Clinic Foundation
5.897%, 05/15/45 | | | 685,000 | | | | 865,330 | |
Roche Holdings, Inc.
2.875%, 09/29/21 (144A) | | | 1,820,000 | | | | 1,935,843 | |
3.000%, 11/10/25 (144A) (f) | | | 1,108,000 | | | | 1,178,679 | |
Southern Baptist Hospital of Florida, Inc.
4.857%, 07/15/45 | | | 650,000 | | | | 793,326 | |
Synlab Bondco plc
6.250%, 07/01/22 (EUR) | | | 100,000 | | | | 117,079 | |
UnitedHealth Group, Inc.
2.700%, 07/15/20 | | | 944,000 | | | | 983,194 | |
2.875%, 12/15/21 | | | 2,021,000 | | | | 2,128,630 | |
3.350%, 07/15/22 | | | 932,000 | | | | 997,074 | |
3.950%, 10/15/42 | | | 2,478,000 | | | | 2,592,605 | |
4.625%, 07/15/35 | | | 377,000 | | | | 437,847 | |
| | | | | | | | |
| | | | | | | 42,668,415 | |
| | | | | | | | |
| | |
Household Products/Wares—0.1% | | | | | | | | |
Kimberly-Clark Corp.
1.900%, 05/22/19 | | | 2,805,000 | | | | 2,877,571 | |
2.650%, 03/01/25 (f) | | | 833,000 | | | | 875,440 | |
2.750%, 02/15/26 (f) | | | 1,010,000 | | | | 1,060,253 | |
| | | | | | | | |
| | | | | | | 4,813,264 | |
| | | | | | | | |
| | |
Housewares—0.1% | | | | | | | | |
Newell Brands, Inc.
2.875%, 12/01/19 | | | 906,000 | | | | 931,087 | |
4.200%, 04/01/26 | | | 1,751,000 | | | | 1,898,173 | |
| | | | | | | | |
| | | | | | | 2,829,260 | |
| | | | | | | | |
| | |
Insurance—1.1% | | | | | | | | |
Aflac, Inc.
3.625%, 06/15/23 | | | 1,263,000 | | | | 1,351,449 | |
Allstate Corp. (The)
3.150%, 06/15/23 | | | 1,270,000 | | | | 1,350,531 | |
American International Group, Inc.
3.375%, 08/15/20 (f) | | | 2,288,000 | | | | 2,400,503 | |
3.750%, 07/10/25 | | | 1,511,000 | | | | 1,540,019 | |
3.875%, 01/15/35 | | | 673,000 | | | | 644,373 | |
3.900%, 04/01/26 | | | 12,711,000 | | | | 13,099,092 | |
4.375%, 01/15/55 | | | 1,207,000 | | | | 1,115,957 | |
4.500%, 07/16/44 | | | 1,615,000 | | | | 1,562,422 | |
Aon plc
4.750%, 05/15/45 | | | 2,004,000 | | | | 2,149,675 | |
Berkshire Hathaway, Inc.
3.125%, 03/15/26 | | | 3,702,000 | | | | 3,881,710 | |
Lincoln National Corp.
3.350%, 03/09/25 (f) | | | 656,000 | | | | 651,520 | |
Loews Corp.
2.625%, 05/15/23 | | | 1,270,000 | | | | 1,280,465 | |
Marsh & McLennan Cos., Inc.
3.750%, 03/14/26 | | | 359,000 | | | | 378,620 | |
MassMutual Global Funding
2.350%, 04/09/19 (144A) | | | 4,203,000 | | | | 4,313,215 | |
Prudential Financial, Inc.
4.600%, 05/15/44 (f) | | | 2,032,000 | | | | 2,181,588 | |
Travelers Cos., Inc. (The)
4.600%, 08/01/43 | | | 1,395,000 | | | | 1,667,406 | |
XLIT, Ltd.
2.300%, 12/15/18 | | | 2,013,000 | | | | 2,033,730 | |
| | | | | | | | |
| | | | | | | 41,602,275 | |
| | | | | | | | |
| | |
Internet—0.1% | | | | | | | | |
Amazon.com, Inc.
2.600%, 12/05/19 | | | 2,713,000 | | | | 2,829,824 | |
| | | | | | | | |
| | |
Iron/Steel—0.0% | | | | | | | | |
Nucor Corp.
5.200%, 08/01/43 | | | 901,000 | | | | 974,270 | |
| | | | | | | | |
| | |
Leisure Time—0.0% | | | | | | | | |
Cirsa Funding Luxembourg S.A.
5.875%, 05/15/23 (EUR) | | | 100,000 | | | | 111,585 | |
| | | | | | | | |
|
Machinery-Diversified—0.1% | |
John Deere Capital Corp.
3.350%, 06/12/24 (f) | | | 2,650,000 | | | | 2,853,830 | |
Rockwell Automation, Inc.
2.875%, 03/01/25 | | | 1,074,000 | | | | 1,114,416 | |
| | | | | | | | |
| | | | | | | 3,968,246 | |
| | | | | | | | |
See accompanying notes to financial statements.
MSF-13
Metropolitan Series Fund
BlackRock Bond Income Portfolio
Schedule of Investments as of June 30, 2016
Corporate Bonds & Notes—(Continued)
| | | | | | | | |
| Security Description | | Principal
Amount* | | | Value | |
| | |
Media—1.8% | | | | | | | | |
21st Century Fox America, Inc.
3.700%, 09/15/24 (f) | | | 1,130,000 | | | $ | 1,220,080 | |
3.700%, 10/15/25 (f) | | | 517,000 | | | | 560,012 | |
4.750%, 09/15/44 | | | 791,000 | | | | 876,339 | |
4.950%, 10/15/45 (f) | | | 223,000 | | | | 253,916 | |
Altice Luxembourg S.A.
6.250%, 02/15/25 (EUR) | | | 100,000 | | | | 101,542 | |
7.250%, 05/15/22 (EUR) | | | 100,000 | | | | 111,668 | |
CBS Corp.
2.300%, 08/15/19 | | | 2,077,000 | | | | 2,108,965 | |
Charter Communications Operating LLC / Charter Communications Operating Capital Corp.
3.579%, 07/23/20 (144A) | | | 2,563,000 | | | | 2,679,473 | |
4.464%, 07/23/22 (144A) | | | 1,885,000 | | | | 2,025,877 | |
4.908%, 07/23/25 (144A) | | | 7,265,000 | | | | 7,942,839 | |
6.384%, 10/23/35 (144A) | | | 1,407,000 | | | | 1,666,148 | |
Comcast Corp.
2.750%, 03/01/23 | | | 4,088,000 | | | | 4,281,187 | |
3.150%, 03/01/26 (f) | | | 8,540,000 | | | | 9,089,873 | |
3.375%, 08/15/25 | | | 1,578,000 | | | | 1,705,084 | |
4.250%, 01/15/33 | | | 665,000 | | | | 733,738 | |
4.400%, 08/15/35 | | | 2,001,000 | | | | 2,257,122 | |
4.600%, 08/15/45 | | | 1,017,000 | | | | 1,170,939 | |
Discovery Communications LLC
3.450%, 03/15/25 (f) | | | 1,396,000 | | | | 1,365,837 | |
4.875%, 04/01/43 (f) | | | 533,000 | | | | 480,844 | |
4.900%, 03/11/26 (f) | | | 4,472,000 | | | | 4,742,440 | |
NBCUniversal Enterprise, Inc.
5.250%, 03/19/21 (144A) | | | 4,585,000 | | | | 4,728,281 | |
NBCUniversal Media LLC
4.450%, 01/15/43 | | | 1,514,000 | | | | 1,694,973 | |
Numericable-SFR S.A.
5.375%, 05/15/22 (EUR) | | | 100,000 | | | | 112,484 | |
Scripps Networks Interactive, Inc.
2.750%, 11/15/19 (f) | | | 1,501,000 | | | | 1,532,311 | |
Telenet Finance Luxembourg SCA
6.750%, 08/15/24 (EUR) | | | 320,000 | | | | 389,744 | |
Time Warner Cable, Inc.
4.000%, 09/01/21 | | | 503,000 | | | | 534,674 | |
4.125%, 02/15/21 | | | 3,589,000 | | | | 3,799,455 | |
4.500%, 09/15/42 | | | 161,000 | | | | 149,963 | |
5.000%, 02/01/20 | | | 1,723,000 | | | | 1,872,806 | |
5.500%, 09/01/41 | | | 588,000 | | | | 617,626 | |
Time Warner, Inc.
2.100%, 06/01/19 (f) | | | 3,352,000 | | | | 3,397,071 | |
3.600%, 07/15/25 | | | 820,000 | | | | 867,679 | |
4.650%, 06/01/44 | | | 1,341,000 | | | | 1,409,563 | |
Unitymedia Hessen GmbH & Co. KG / Unitymedia NRW GmbH
4.000%, 01/15/25 (EUR) | | | 105,000 | | | | 117,158 | |
5.625%, 04/15/23 (EUR) | | | 80,000 | | | | 93,663 | |
UPCB Finance, Ltd.
4.000%, 01/15/27 (EUR) | | | 100,000 | | | | 107,230 | |
| | |
Media—(Continued) | | | | | | | | |
Viacom, Inc.
2.750%, 12/15/19 | | | 1,650,000 | | | | 1,673,948 | |
4.500%, 03/01/21 (f) | | | 1,779,000 | | | | 1,935,401 | |
Virgin Media Secured Finance plc
6.000%, 04/15/21 (GBP) | | | 396,000 | | | | 541,672 | |
Ziggo Bond Finance B.V.
4.625%, 01/15/25 (EUR) | | | 100,000 | | | | 105,704 | |
| | | | | | | | |
| | | | | | | 71,055,329 | |
| | | | | | | | |
| | |
Mining—0.1% | | | | | | | | |
Anglo American Capital plc
1.500%, 04/01/20 (EUR) | | | 100,000 | | | | 100,659 | |
3.500%, 03/28/22 (EUR) | | | 100,000 | | | | 104,307 | |
Barrick Gold Corp.
4.100%, 05/01/23 | | | 1,890,000 | | | | 1,993,695 | |
Glencore Finance Europe S.A.
3.375%, 09/30/20 (EUR) | | | 100,000 | | | | 113,023 | |
Newmont Mining Corp.
4.875%, 03/15/42 | | | 660,000 | | | | 652,607 | |
Rio Tinto Finance USA plc
4.125%, 08/21/42 | | | 1,510,000 | | | | 1,490,658 | |
| | | | | | | | |
| | | | | | | 4,454,949 | |
| | | | | | | | |
|
Miscellaneous Manufacturing—0.4% | |
Eaton Corp.
2.750%, 11/02/22 | | | 7,146,000 | | | | 7,325,879 | |
Gates Global LLC / Gates Global Co.
5.750%, 07/15/22 (EUR) | | | 100,000 | | | | 92,544 | |
General Electric Co.
3.100%, 01/09/23 | | | 1,404,000 | | | | 1,499,767 | |
3.150%, 09/07/22 | | | 908,000 | | | | 974,453 | |
4.500%, 03/11/44 | | | 2,960,000 | | | | 3,415,778 | |
Ingersoll-Rand Luxembourg Finance S.A.
2.625%, 05/01/20 | | | 1,538,000 | | | | 1,562,811 | |
4.650%, 11/01/44 | | | 306,000 | | | | 328,097 | |
| | | | | | | | |
| | | | | | | 15,199,329 | |
| | | | | | | | |
| | |
Oil & Gas—1.5% | | | | | | | | |
Anadarko Petroleum Corp.
4.500%, 07/15/44 | | | 1,209,000 | | | | 1,110,384 | |
7.950%, 06/15/39 | | | 614,000 | | | | 748,659 | |
Apache Corp.
4.250%, 01/15/44 | | | 1,410,000 | | | | 1,364,938 | |
BP Capital Markets plc
2.237%, 05/10/19 (f) | | | 3,701,000 | | | | 3,800,542 | |
California Resources Corp.
8.000%, 12/15/22 (144A) | | | 383,000 | | | | 271,930 | |
Chevron Corp.
1.961%, 03/03/20 | | | 3,336,000 | | | | 3,378,674 | |
2.193%, 11/15/19 (f) | | | 855,000 | | | | 878,997 | |
ConocoPhillips Co.
4.950%, 03/15/26 | | | 4,340,000 | | | | 4,921,222 | |
Continental Resources, Inc.
3.800%, 06/01/24 | | | 1,310,000 | | | | 1,142,975 | |
4.900%, 06/01/44 | | | 1,500,000 | | | | 1,237,500 | |
See accompanying notes to financial statements.
MSF-14
Metropolitan Series Fund
BlackRock Bond Income Portfolio
Schedule of Investments as of June 30, 2016
Corporate Bonds & Notes—(Continued)
| | | | | | | | |
| Security Description | | Principal
Amount* | | | Value | |
| | |
Oil & Gas—(Continued) | | | | | | | | |
Devon Energy Corp.
5.850%, 12/15/25 | | | 940,000 | | | $ | 1,036,900 | |
EOG Resources, Inc.
3.900%, 04/01/35 | | | 680,000 | | | | 681,759 | |
Exxon Mobil Corp.
1.819%, 03/15/19 (f) | | | 3,300,000 | | | | 3,362,637 | |
4.114%, 03/01/46 | | | 1,386,000 | | | | 1,563,157 | |
Gazprom OAO Via Gaz Capital S.A.
4.950%, 07/19/22 (144A) | | | 341,000 | | | | 353,194 | |
Marathon Petroleum Corp.
4.750%, 09/15/44 | | | 1,016,000 | | | | 866,371 | |
MEG Energy Corp.
6.500%, 03/15/21 (144A) | | | 448,000 | | | | 347,200 | |
7.000%, 03/31/24 (144A) | | | 3,359,000 | | | | 2,586,430 | |
Noble Energy, Inc.
5.050%, 11/15/44 | | | 940,000 | | | | 946,607 | |
Occidental Petroleum Corp.
3.400%, 04/15/26 | | | 1,700,000 | | | | 1,792,976 | |
Petrobras Global Finance B.V.
6.750%, 01/27/41 | | | 396,000 | | | | 317,790 | |
6.850%, 06/05/15 | | | 2,018,000 | | | | 1,533,680 | |
8.375%, 05/23/21 (f) | | | 5,689,000 | | | | 5,871,048 | |
Petroleos de Venezuela S.A.
6.000%, 05/16/24 (f) | | | 3,370,000 | | | | 1,191,801 | |
6.000%, 11/15/26 (f) | | | 771,000 | | | | 268,848 | |
Phillips 66
4.875%, 11/15/44 | | | 1,027,000 | | | | 1,121,034 | |
Pioneer Natural Resources Co.
4.450%, 01/15/26 | | | 660,000 | | | | 719,067 | |
Shell International Finance B.V.
2.125%, 05/11/20 | | | 3,564,000 | | | | 3,637,511 | |
3.625%, 08/21/42 | | | 1,100,000 | | | | 1,058,585 | |
4.125%, 05/11/35 | | | 2,748,000 | | | | 2,963,402 | |
Statoil ASA
2.900%, 11/08/20 (f) | | | 3,233,000 | | | | 3,367,153 | |
Transocean, Inc.
6.800%, 03/15/38 (f) | | | 582,000 | | | | 379,755 | |
Valero Energy Corp.
3.650%, 03/15/25 (f) | | | 2,548,000 | | | | 2,551,552 | |
Woodside Finance, Ltd.
3.650%, 03/05/25 (144A) | | | 353,000 | | | | 344,815 | |
YPF S.A.
8.500%, 07/28/25 (144A) | | | 552,000 | | | | 583,188 | |
8.750%, 04/04/24 (144A) | | | 119,000 | | | | 127,925 | |
| | | | | | | | |
| | | | | | | 58,430,206 | |
| | | | | | | | |
| | |
Oil & Gas Services—0.1% | | | | | | | | |
Schlumberger Holdings Corp.
3.000%, 12/21/20 (144A) (f) | | | 2,972,000 | | | | 3,099,665 | |
| | | | | | | | |
|
Packaging & Containers—0.2% | |
Ardagh Packaging Finance plc / Ardagh Holdings USA, Inc.
4.250%, 01/15/22 (EUR) | | | 100,000 | | | | 112,917 | |
6.750%, 05/15/24 (EUR) | | | 100,000 | | | | 112,640 | |
|
Packaging & Containers—(Continued) | |
Horizon Holdings SASU
7.250%, 08/01/23 (EUR) | | | 100,000 | | | | 114,887 | |
Novelis, Inc.
8.750%, 12/15/20 (f) | | | 7,985,000 | | | | 8,324,362 | |
Verallia Packaging SASU
5.125%, 08/01/22 (EUR) | | | 100,000 | | | | 113,611 | |
| | | | | | | | |
| | | | | | | 8,778,417 | |
| | | | | | | | |
| | |
Pharmaceuticals—1.4% | | | | | | | | |
AbbVie, Inc.
2.500%, 05/14/20 | | | 3,448,000 | | | | 3,524,970 | |
2.900%, 11/06/22 | | | 1,946,000 | | | | 1,984,180 | |
4.400%, 11/06/42 | | | 200,000 | | | | 203,794 | |
4.500%, 05/14/35 | | | 958,000 | | | | 1,001,266 | |
Actavis Funding SCS
2.350%, 03/12/18 (f) | | | 3,614,000 | | | | 3,663,255 | |
3.000%, 03/12/20 | | | 7,722,000 | | | | 7,963,923 | |
AmerisourceBergen Corp.
1.150%, 05/15/17 | | | 2,313,000 | | | | 2,312,403 | |
3.250%, 03/01/25 (f) | | | 602,000 | | | | 631,466 | |
4.250%, 03/01/45 (f) | | | 602,000 | | | | 636,071 | |
AstraZeneca plc
3.375%, 11/16/25 | | | 1,854,000 | | | | 1,943,632 | |
4.375%, 11/16/45 | | | 768,000 | | | | 837,609 | |
Bristol-Myers Squibb Co.
4.500%, 03/01/44 (f) | | | 729,000 | | | | 900,292 | |
Eli Lilly & Co.
3.700%, 03/01/45 | | | 979,000 | | | | 1,042,704 | |
Express Scripts Holding Co.
1.250%, 06/02/17 | | | 1,840,000 | | | | 1,838,712 | |
3.900%, 02/15/22 (f) | | | 1,286,000 | | | | 1,378,175 | |
GlaxoSmithKline Capital plc
2.850%, 05/08/22 | | | 1,818,000 | | | | 1,913,003 | |
Johnson & Johnson
2.450%, 03/01/26 | | | 4,578,000 | | | | 4,737,575 | |
Mylan, Inc.
3.125%, 01/15/23 (144A) | | | 1,298,000 | | | | 1,288,917 | |
Novartis Capital Corp.
3.000%, 11/20/25 (f) | | | 1,090,000 | | | | 1,157,801 | |
4.000%, 11/20/45 (f) | | | 348,000 | | | | 396,682 | |
4.400%, 04/24/20 | | | 2,563,000 | | | | 2,855,333 | |
Pfizer, Inc.
2.750%, 06/03/26 (f) | | | 7,135,000 | | | | 7,357,655 | |
4.300%, 06/15/43 | | | 851,000 | | | | 956,430 | |
4.400%, 05/15/44 (f) | | | 969,000 | | | | 1,104,524 | |
Teva Pharmaceutical Finance Co. B.V.
3.650%, 11/10/21 (f) | | | 841,000 | | | | 891,230 | |
Valeant Pharmaceuticals International, Inc.
4.500%, 05/15/23 (EUR) | | | 200,000 | | | | 167,572 | |
Zoetis, Inc.
3.250%, 02/01/23 | | | 1,218,000 | | | | 1,241,168 | |
| | | | | | | | |
| | | | | | | 53,930,342 | |
| | | | | | | | |
See accompanying notes to financial statements.
MSF-15
Metropolitan Series Fund
BlackRock Bond Income Portfolio
Schedule of Investments as of June 30, 2016
Corporate Bonds & Notes—(Continued)
| | | | | | | | |
| Security Description | | Principal
Amount* | | | Value | |
| | |
Pipelines—0.5% | | | | | | | | |
Enterprise Products Operating LLC
3.700%, 02/15/26 (f) | | | 2,732,000 | | | $ | 2,843,078 | |
3.900%, 02/15/24 | | | 1,366,000 | | | | 1,445,716 | |
4.450%, 02/15/43 | | | 1,896,000 | | | | 1,879,990 | |
Kinder Morgan Energy Partners L.P.
3.500%, 03/01/21 (f) | | | 3,509,000 | | | | 3,520,439 | |
3.950%, 09/01/22 (f) | | | 1,124,000 | | | | 1,143,908 | |
4.700%, 11/01/42 | | | 1,879,000 | | | | 1,692,855 | |
5.625%, 09/01/41 | | | 463,000 | | | | 443,198 | |
Kinder Morgan, Inc.
3.050%, 12/01/19 | | | 703,000 | | | | 710,342 | |
Plains All American Pipeline L.P. / PAA Finance Corp.
4.650%, 10/15/25 | | | 1,520,000 | | | | 1,534,663 | |
Sunoco Logistics Partners Operations L.P.
5.350%, 05/15/45 | | | 670,000 | | | | 663,925 | |
TransCanada PipeLines, Ltd.
1.875%, 01/12/18 | | | 1,111,000 | | | | 1,116,328 | |
2.500%, 08/01/22 | | | 1,407,000 | | | | 1,397,631 | |
4.625%, 03/01/34 | | | 1,529,000 | | | | 1,607,611 | |
| | | | | | | | |
| | | | | | | 19,999,684 | |
| | | | | | | | |
| | |
Real Estate—0.0% | | | | | | | | |
ProLogis L.P.
3.750%, 11/01/25 | | | 412,000 | | | | 439,124 | |
| | | | | | | | |
|
Real Estate Investment Trusts—0.4% | |
American Tower Corp.
3.300%, 02/15/21 | | | 1,342,000 | | | | 1,399,977 | |
3.375%, 10/15/26 | | | 2,287,000 | | | | 2,298,897 | |
3.450%, 09/15/21 | | | 1,554,000 | | | | 1,617,499 | |
3.500%, 01/31/23 | | | 397,000 | | | | 410,798 | |
4.400%, 02/15/26 | | | 264,000 | | | | 286,624 | |
5.000%, 02/15/24 | | | 391,000 | | | | 442,222 | |
AvalonBay Communities, Inc.
3.500%, 11/15/25 | | | 250,000 | | | | 263,134 | |
Crown Castle International Corp.
3.400%, 02/15/21 | | | 668,000 | | | | 697,348 | |
3.700%, 06/15/26 | | | 513,000 | | | | 529,257 | |
ERP Operating L.P.
3.375%, 06/01/25 | | | 1,153,000 | | | | 1,216,134 | |
Omega Healthcare Investors, Inc.
4.500%, 04/01/27 | | | 1,039,000 | | | | 1,034,862 | |
Simon Property Group L.P.
2.500%, 07/15/21 (f) | | | 803,000 | | | | 827,308 | |
3.375%, 10/01/24 | | | 1,717,000 | | | | 1,841,706 | |
4.250%, 10/01/44 (f) | | | 825,000 | | | | 890,224 | |
| | | | | | | | |
| | | | | | | 13,755,990 | |
| | | | | | | | |
| | |
Retail—0.6% | | | | | | | | |
CVS Health Corp.
4.000%, 12/05/23 | | | 1,757,000 | | | | 1,942,984 | |
5.300%, 12/05/43 | | | 843,000 | | | | 1,052,345 | |
Home Depot, Inc. (The)
3.350%, 09/15/25 | | | 418,000 | | | | 455,536 | |
| | |
Retail—(Continued) | | | | | | | | |
Home Depot, Inc. (The)
4.400%, 03/15/45 | | | 493,000 | | | | 571,280 | |
5.400%, 09/15/40 | | | 677,000 | | | | 880,575 | |
Lowe’s Cos., Inc.
3.375%, 09/15/25 | | | 459,000 | | | | 501,935 | |
4.250%, 09/15/44 | | | 524,000 | | | | 582,938 | |
4.375%, 09/15/45 | | | 344,000 | | | | 394,192 | |
Macy’s Retail Holdings, Inc.
4.500%, 12/15/34 | | | 1,439,000 | | | | 1,274,784 | |
McDonald’s Corp.
2.750%, 12/09/20 (f) | | | 607,000 | | | | 633,710 | |
3.700%, 01/30/26 | | | 583,000 | | | | 629,899 | |
4.600%, 05/26/45 | | | 135,000 | | | | 150,678 | |
4.700%, 12/09/35 (f) | | | 433,000 | | | | 488,443 | |
4.875%, 12/09/45 | | | 510,000 | | | | 596,333 | |
New Look Secured Issuer plc
6.500%, 07/01/22 (GBP) | | | 100,000 | | | | 122,302 | |
Punch Taverns Finance B, Ltd.
5.267%, 03/30/24 (GBP) | | | 95,230 | | | | 110,026 | |
QVC, Inc.
3.125%, 04/01/19 | | | 1,103,000 | | | | 1,132,327 | |
5.125%, 07/02/22 | | | 1,817,000 | | | | 1,958,848 | |
Target Corp.
3.500%, 07/01/24 | | | 783,000 | | | | 867,613 | |
4.000%, 07/01/42 (f) | | | 767,000 | | | | 829,048 | |
Unique Pub Finance Co. plc (The)
5.659%, 06/30/27 (GBP) | | | 171,795 | | | | 225,203 | |
Wal-Mart Stores, Inc.
2.550%, 04/11/23 | | | 1,376,000 | | | | 1,436,185 | |
4.000%, 04/11/43 | | | 708,000 | | | | 785,883 | |
Walgreens Boots Alliance, Inc.
4.650%, 06/01/46 (f) | | | 114,000 | | | | 121,583 | |
4.800%, 11/18/44 (f) | | | 5,144,000 | | | | 5,533,900 | |
| | | | | | | | |
| | | | | | | 23,278,550 | |
| | | | | | | | |
| | |
Savings & Loans—0.0% | | | | | | | | |
Washington Mutual Bank
Zero Coupon, 05/01/09 (i) | | | 2,090,000 | | | | 438,900 | |
Zero Coupon, 11/06/09 (i) | | | 1,430,000 | | | | 300,300 | |
Zero Coupon, 06/16/10 (i) | | | 1,310,000 | | | | 275,100 | |
Zero Coupon, 02/04/11 (i) | | | 1,247,000 | | | | 261,870 | |
| | | | | | | | |
| | | | | | | 1,276,170 | |
| | | | | | | | |
| | |
Semiconductors—0.2% | | | | | | | | |
Analog Devices, Inc.
3.900%, 12/15/25 | | | 347,000 | | | | 386,809 | |
5.300%, 12/15/45 | | | 353,000 | | | | 425,287 | |
Lam Research Corp.
2.800%, 06/15/21 | | | 1,643,000 | | | | 1,682,012 | |
3.900%, 06/15/26 | | | 2,399,000 | | | | 2,525,619 | |
QUALCOMM, Inc.
4.800%, 05/20/45 (f) | | | 961,000 | | | | 1,008,059 | |
| | | | | | | | |
| | | | | | | 6,027,786 | |
| | | | | | | | |
See accompanying notes to financial statements.
MSF-16
Metropolitan Series Fund
BlackRock Bond Income Portfolio
Schedule of Investments as of June 30, 2016
Corporate Bonds & Notes—(Continued)
| | | | | | | | |
| Security Description | | Principal
Amount* | | | Value | |
| | |
Software—0.5% | | | | | | | | |
Fidelity National Information Services, Inc.
3.625%, 10/15/20 | | | 259,000 | | | $ | 273,794 | |
Microsoft Corp.
3.500%, 02/12/35 | | | 2,044,000 | | | | 2,114,855 | |
4.450%, 11/03/45 | | | 204,000 | | | | 230,041 | |
Oracle Corp.
2.650%, 07/15/26 | | | 7,940,000 | | | | 7,959,922 | |
2.800%, 07/08/21 (f) | | | 3,872,000 | | | | 4,064,140 | |
3.250%, 05/15/30 (f) | | | 2,792,000 | | | | 2,886,456 | |
4.000%, 07/15/46 | | | 2,854,000 | | | | 2,877,411 | |
4.375%, 05/15/55 | | | 939,000 | | | | 986,319 | |
| | | | | | | | |
| | | | | | | 21,392,938 | |
| | | | | | | | |
|
Telecommunications—1.5% | |
America Movil S.A.B. de C.V.
2.375%, 09/08/16 | | | 7,975,000 | | | | 7,998,399 | |
AT&T, Inc.
2.300%, 03/11/19 | | | 2,035,000 | | | | 2,078,311 | |
2.375%, 11/27/18 | | | 1,683,000 | | | | 1,717,564 | |
2.450%, 06/30/20 | | | 3,043,000 | | | | 3,106,778 | |
3.000%, 06/30/22 | | | 3,744,000 | | | | 3,834,133 | |
3.400%, 05/15/25 | | | 2,803,000 | | | | 2,867,208 | |
3.875%, 08/15/21 (f) | | | 2,472,000 | | | | 2,663,152 | |
4.300%, 12/15/42 | | | 2,302,000 | | | | 2,228,829 | |
4.600%, 02/15/21 | | | 3,066,000 | | | | 3,355,081 | |
4.750%, 05/15/46 | | | 267,000 | | | | 273,641 | |
6.375%, 03/01/41 | | | 1,032,000 | | | | 1,255,906 | |
Juniper Networks, Inc.
3.300%, 06/15/20 (f) | | | 1,478,000 | | | | 1,523,935 | |
Orange S.A.
4.000%, 10/01/21 (EUR) (b) | | | 300,000 | | | | 345,480 | |
5.500%, 02/06/44 (f) | | | 1,256,000 | | | | 1,576,797 | |
OTE plc
3.500%, 07/09/20 (EUR) | | | 100,000 | | | | 108,478 | |
Rogers Communications, Inc.
3.625%, 12/15/25 | | | 447,000 | | | | 477,558 | |
5.000%, 03/15/44 | | | 394,000 | | | | 447,554 | |
Telecom Italia S.p.A.
3.250%, 01/16/23 (EUR) | | | 200,000 | | | | 235,987 | |
Telefonica Europe B.V.
5.000%, 03/31/20 (EUR) (b) | | | 100,000 | | | | 111,789 | |
Verizon Communications, Inc.
2.625%, 02/21/20 | | | 3,817,000 | | | | 3,950,080 | |
3.450%, 03/15/21 (f) | | | 3,553,000 | | | | 3,806,791 | |
3.850%, 11/01/42 | | | 3,742,000 | | | | 3,519,198 | |
4.400%, 11/01/34 | | | 3,524,000 | | | | 3,633,762 | |
4.862%, 08/21/46 | | | 5,153,000 | | | | 5,632,677 | |
5.050%, 03/15/34 | | | 1,201,000 | | | | 1,332,984 | |
Vodafone Group plc
2.500%, 09/26/22 (f) | | | 1,329,000 | | | | 1,310,783 | |
Wind Acquisition Finance S.A.
4.000%, 07/15/20 (EUR) | | | 100,000 | | | | 109,310 | |
| | | | | | | | |
| | | | | | | 59,502,165 | |
| | | | | | | | |
|
Transportation—0.6% | |
Burlington Northern Santa Fe LLC
3.000%, 03/15/23 | | | 444,000 | | | | 466,933 | |
3.450%, 09/15/21 (f) | | | 610,000 | | | | 661,060 | |
4.150%, 04/01/45 | | | 758,000 | | | | 825,483 | |
4.700%, 09/01/45 | | | 665,000 | | | | 782,007 | |
Canadian National Railway Co.
2.750%, 03/01/26 | | | 2,373,000 | | | | 2,478,423 | |
CSX Corp.
3.350%, 11/01/25 (f) | | | 782,000 | | | | 831,067 | |
4.100%, 03/15/44 | | | 623,000 | | | | 665,543 | |
FedEx Corp.
3.900%, 02/01/35 | | | 219,000 | | | | 222,624 | |
4.100%, 02/01/45 | | | 1,295,000 | | | | 1,316,689 | |
4.550%, 04/01/46 | | | 1,393,000 | | | | 1,511,537 | |
4.750%, 11/15/45 | | | 1,053,000 | | | | 1,173,480 | |
4.900%, 01/15/34 | | | 768,000 | | | | 871,715 | |
Norfolk Southern Corp.
2.900%, 06/15/26 | | | 4,406,000 | | | | 4,533,448 | |
4.450%, 06/15/45 | | | 1,195,000 | | | | 1,316,878 | |
Onorato Armatori S.p.A.
7.750%, 02/15/23 (EUR) | | | 100,000 | | | | 106,258 | |
Ryder System, Inc.
2.450%, 09/03/19 | | | 1,629,000 | | | | 1,656,525 | |
Silk Bidco A/S
7.500%, 02/01/22 (EUR) | | | 100,000 | | | | 112,223 | |
Union Pacific Corp.
3.375%, 02/01/35 | | | 668,000 | | | | 672,981 | |
3.875%, 02/01/55 | | | 1,997,000 | | | | 2,035,219 | |
4.050%, 11/15/45 (f) | | | 196,000 | | | | 212,264 | |
4.375%, 11/15/65 | | | 875,000 | | | | 935,571 | |
Union Pacific Railroad Co. Pass-Through Trust
3.227%, 05/14/26 | | | 1,716,206 | | | | 1,800,471 | |
| | | | | | | | |
| | | | | | | 25,188,399 | |
| | | | | | | | |
| | |
Trucking & Leasing—0.2% | | | | | | | | |
Aviation Capital Group Corp.
2.875%, 09/17/18 (144A) | | | 3,355,000 | | | | 3,321,450 | |
GATX Corp.
2.600%, 03/30/20 (f) | | | 1,747,000 | | | | 1,736,317 | |
Penske Truck Leasing Co. L.P. / PTL Finance Corp.
3.375%, 02/01/22 (144A) | | | 2,673,000 | | | | 2,725,907 | |
| | | | | | | | |
| | | | | | | 7,783,674 | |
| | | | | | | | |
Total Corporate Bonds & Notes
(Cost $985,628,728) | | | | | | | 1,021,527,318 | |
| | | | | | | | |
|
| Asset-Backed Securities—9.3% | |
| | |
Asset-Backed - Automobile—0.0% | | | | | | | | |
Santander Drive Auto Receivables Trust
1.430%, 04/16/19 (144A) | | | 91,760 | | | | 91,775 | |
1.430%, 06/18/19 (144A) | | | 34,256 | | | | 34,256 | |
| | | | | | | | |
| | | | | | | 126,031 | |
| | | | | | | | |
See accompanying notes to financial statements.
MSF-17
Metropolitan Series Fund
BlackRock Bond Income Portfolio
Schedule of Investments as of June 30, 2016
Asset-Backed Securities—(Continued)
| | | | | | | | |
| Security Description | | Principal
Amount* | | | Value | |
| | |
Asset-Backed - Credit Card—0.2% | | | | | | | | |
CHLUPA Trust
3.326%, 08/15/20 (144A) | | | 1,379,307 | | | $ | 1,381,928 | |
Synchrony Credit Card Master Note Trust
2.210%, 05/15/24 | | | 4,860,000 | | | | 4,950,335 | |
World Financial Network Credit Card Master Trust
4.550%, 08/15/22 | | | 1,600,000 | | | | 1,651,590 | |
| | | | | | | | |
| | | | | | | 7,983,853 | |
| | | | | | | | |
| | |
Asset-Backed - Home Equity—0.5% | | | | | | | | |
Bayview Financial Revolving Asset Trust
1.438%, 12/28/40 (144A) (b) | | | 800,073 | | | | 575,740 | |
1.449%, 05/28/39 (144A) (b) | | | 9,112,513 | | | | 6,643,965 | |
Bear Stearns Asset-Backed Securities Trust
0.593%, 11/25/36 (b) | | | 2,530,598 | | | | 2,133,700 | |
0.593%, 12/25/36 (b) | | | 2,569,293 | | | | 2,142,144 | |
1.253%, 01/25/36 (b) | | | 340,000 | | | | 319,667 | |
Citigroup Mortgage Loan Trust, Inc.
0.703%, 08/25/36 (b) | | | 1,810,000 | | | | 1,336,640 | |
Countrywide Asset-Backed Certificates
0.773%, 10/25/36 (b) | | | 2,524,176 | | | | 2,142,472 | |
Countrywide Home Equity Loan Trust
5.842%, 06/25/35 | | | 755,112 | | | | 746,054 | |
6.155%, 06/25/35 | | | 472,827 | | | | 435,522 | |
Home Equity Mortgage Loan Asset-Backed Trust
2.478%, 07/25/34 (b) | | | 356,130 | | | | 332,615 | |
Home Equity Mortgage Trust
5.867%, 07/25/36 | | | 948,000 | | | | 404,455 | |
Home Loan Mortgage Loan Trust
0.802%, 04/15/36 (b) | | | 1,299,794 | | | | 1,152,819 | |
JPMorgan Mortgage Acquisition Trust
6.000%, 07/25/36 | | | 378,116 | | | | 205,603 | |
6.410%, 07/25/36 | | | 512,732 | | | | 278,632 | |
Mastr Asset Backed Securities Trust
0.733%, 05/25/37 (b) | | | 621,846 | | | | 354,348 | |
MASTR Asset-Backed Securities Trust
0.713%, 06/25/36 (144A) (b) | | | 665,000 | | | | 427,979 | |
| | | | | | | | |
| | | | | | | 19,632,355 | |
| | | | | | | | |
|
Asset-Backed - Manufactured Housing—0.3% | |
BankAmerica Manufactured Housing Contract Trust
7.930%, 12/10/25 (b) | | | 4,000,000 | | | | 3,830,004 | |
BCMSC Trust
7.575%, 06/15/30 (b) | | | 1,275,715 | | | | 672,700 | |
7.830%, 06/15/30 (b) | | | 1,183,879 | | | | 644,550 | |
8.290%, 06/15/30 (b) | | | 2,027,535 | | | | 1,166,511 | |
Conseco Financial Corp.
6.280%, 09/01/30 | | | 794,538 | | | | 837,616 | |
7.500%, 03/01/30 (b) | | | 554,769 | | | | 457,761 | |
7.860%, 03/01/30 (b) | | | 758,730 | | | | 644,840 | |
Greenpoint Manufactured Housing
8.290%, 12/15/29 (b) | | | 440,000 | | | | 479,246 | |
9.230%, 12/15/29 (b) | | | 642,681 | | | | 563,374 | |
|
Asset-Backed - Manufactured Housing—(Continued) | |
Lehman ABS Manufactured Housing Contract Trust
6.630%, 04/15/40 (b) | | | 2,430,000 | | | | 2,603,065 | |
Oakwood Mortgage Investors, Inc.
6.930%, 09/15/31 (b) | | | 339,426 | | | | 303,221 | |
| | | | | | | | |
| | | | | | | 12,202,888 | |
| | | | | | | | |
| | |
Asset-Backed - Other—6.8% | | | | | | | | |
ACAS CLO, Ltd.
2.967%, 09/20/23 (144A) (b) | | | 2,290,000 | | | | 2,268,039 | |
Adirondack Park CLO, Ltd.
2.628%, 04/15/24 (144A) (b) | | | 500,000 | | | | 495,506 | |
ALM, Ltd.
2.064%, 07/28/26 (144A) (b) | | | 2,690,000 | | | | 2,679,033 | |
2.488%, 04/24/24 (144A) (b) | | | 2,648,000 | | | | 2,626,211 | |
2.783%, 10/18/27 (144A) (b) | | | 900,000 | | | | 899,995 | |
3.584%, 07/28/26 (144A) (b) | | | 514,000 | | | | 511,164 | |
3.883%, 04/16/27 (144A) (b) | | | 625,000 | | | | 625,964 | |
American Homes 4 Rent
1.446%, 06/17/31 (144A) (b) | | | 505,291 | | | | 499,254 | |
American Money Management Corp.
4.229%, 01/15/22 (144A) (b) | | | 1,060,000 | | | | 1,055,102 | |
AMMC CLO, Ltd.
2.530%, 05/10/25 (144A) (b) | | | 738,000 | | | | 715,029 | |
2.926%, 11/15/27 (144A) (b) | | | 620,000 | | | | 616,606 | |
Anchorage Capital CLO, Ltd.
1.820%, 07/13/25 (144A) (b) | | | 835,000 | | | | 828,540 | |
2.380%, 07/13/25 (144A) (b) | | | 550,000 | | | | 535,179 | |
3.330%, 07/13/25 (144A) (b) | | | 590,000 | | | | 573,017 | |
Apidos CLO
1.728%, 04/15/25 (144A) (b) | | | 3,204,000 | | | | 3,169,169 | |
2.023%, 01/17/23 (144A) (b) | | | 1,890,000 | | | | 1,882,759 | |
2.083%, 01/19/25 (144A) (b) | | | 600,000 | | | | 598,415 | |
2.478%, 07/15/23 (144A) (b) | | | 2,065,000 | | | | 2,026,859 | |
Atlas Senior Loan Fund IV, Ltd.
2.126%, 02/17/26 (144A) (b) | | | 2,920,000 | | | | 2,904,416 | |
B2R Mortgage Trust
2.524%, 05/15/48 (144A) | | | 651,943 | | | | 655,810 | |
3.336%, 11/15/48 (144A) | | | 1,288,669 | | | | 1,329,283 | |
Battalion CLO, Ltd.
2.035%, 10/22/25 (144A) (b) | | | 5,205,000 | | | | 5,165,463 | |
Bayview Opportunity Master Fund Trust
3.623%, 04/28/30 (144A) | | | 558,744 | | | | 556,430 | |
3.721%, 02/28/35 (144A) (b) | | | 559,454 | | | | 559,535 | |
3.844%, 11/28/29 (144A) | | | 1,097,248 | | | | 1,094,197 | |
Benefit Street Partners CLO, Ltd.
1.828%, 07/15/24 (144A) (b) | | | 2,240,000 | | | | 2,217,437 | |
2.573%, 01/20/28 (144A) (b) | | | 2,010,000 | | | | 1,977,052 | |
2.878%, 10/15/25 (144A) (b) | | | 3,000,000 | | | | 2,955,789 | |
BlueMountain CLO, Ltd.
2.128%, 04/15/25 (144A) (b) | | | 3,130,000 | | | | 3,130,078 | |
C-BASS Trust
0.563%, 11/25/36 (b) | | | 578,573 | | | | 346,615 | |
0.683%, 11/25/36 (b) | | | 97,681 | | | | 59,602 | |
3.933%, 01/25/37 | | | 2,804,788 | | | | 1,348,546 | |
See accompanying notes to financial statements.
MSF-18
Metropolitan Series Fund
BlackRock Bond Income Portfolio
Schedule of Investments as of June 30, 2016
Asset-Backed Securities—(Continued)
| | | | | | | | |
| Security Description | | Principal
Amount* | | | Value | |
|
Asset-Backed - Other—(Continued) | |
Carlyle Global Market Strategies CLO, Ltd.
2.024%, 01/20/25 (144A) (b) | | | 7,485,000 | | | $ | 7,477,021 | |
2.734%, 07/20/23 (144A) (b) | | | 1,230,000 | | | | 1,223,413 | |
Carrington Mortgage Loan Trust
0.573%, 10/25/36 (b) | | | 631,649 | | | | 360,596 | |
0.603%, 06/25/37 (b) | | | 732,142 | | | | 663,921 | |
0.613%, 10/25/36 (b) | | | 500,000 | | | | 347,720 | |
0.673%, 12/25/36 (b) | | | 730,000 | | | | 398,659 | |
0.693%, 08/25/36 (b) | | | 4,800,000 | | | | 2,743,388 | |
Cedar Funding V CLO, Ltd.
2.243%, 07/17/28 (144A) (b) | | | 410,000 | | | | 409,993 | |
Chase Funding Trust
6.333%, 04/25/32 | | | 612,072 | | | | 621,667 | |
CIFC Funding, Ltd.
1.587%, 01/19/23 (144A) (b) | | | 2,078,090 | | | | 2,078,088 | |
2.141%, 05/24/26 (144A) (b) | | | 2,780,000 | | | | 2,769,622 | |
2.213%, 01/17/27 (144A) (b) | | | 1,965,000 | | | | 1,958,924 | |
2.517%, 11/27/24 (144A) (b) | | | 1,270,000 | | | | 1,244,168 | |
Colony American Homes
1.646%, 07/17/32 (144A) (b) | | | 1,696,513 | | | | 1,681,987 | |
Countrywide Asset-Backed Certificates
0.613%, 01/25/46 (b) | | | 3,180,578 | | | | 2,878,420 | |
0.673%, 12/25/25 (b) | | | 142,802 | | | | 128,436 | |
Countrywide Revolving Home Equity Loan Resecuritization Trust
0.742%, 12/15/33 (144A) (b) | | | 983,178 | | | | 810,974 | |
Countrywide Revolving Home Equity loan Trust
0.622%, 05/15/35 (b) | | | 845,928 | | | | 710,161 | |
Credit Suisse Mortgage Capital Certificates
3.500%, 02/25/55 (144A) | | | 1,937,387 | | | | 1,858,128 | |
CT CDO, Ltd.
0.758%, 10/20/43 (144A) (b) | | | 50,229 | | | | 50,111 | |
DCP Rights LLC
5.463%, 10/25/44 (144A) | | | 6,934,385 | | | | 7,043,276 | |
Dryden Senior Loan Fund
1.726%, 08/15/25 (144A) (b) | | | 1,035,000 | | | | 1,022,265 | |
2.008%, 01/15/25 (144A) (b) | | | 660,000 | | | | 657,951 | |
First Franklin Mortgage Loan Trust
0.613%, 04/25/36 (b) | | | 662,892 | | | | 574,037 | |
0.663%, 12/25/36 (b) | | | 12,158,702 | | | | 7,245,720 | |
Fraser Sullivan CLO, Ltd.
3.134%, 04/20/23 (144A) (b) | | | 1,150,000 | | | | 1,116,814 | |
GFT Mortgage Loan Trust
3.721%, 01/25/55 (144A) | | | 126,128 | | | | 124,544 | |
GoldenTree Loan Opportunities IV, Ltd.
1.346%, 08/18/22 (144A) (b) | | | 700,000 | | | | 677,016 | |
GoldenTree Loan Opportunities VI, Ltd.
3.883%, 04/17/22 (144A) (b) | | | 830,000 | | | | 830,046 | |
GT Loan Financing, Ltd.
1.904%, 10/28/24 (144A) (b) | | | 5,670,000 | | | | 5,586,736 | |
Highbridge Loan Management, Ltd.
2.531%, 09/20/22 (144A) (b) | | | 1,720,000 | | | | 1,718,070 | |
Invitation Homes Trust
1.546%, 09/17/31 (144A) (b) | | | 2,804,051 | | | | 2,777,471 | |
1.746%, 08/17/32 (144A) (b) | | | 2,086,350 | | | | 2,073,786 | |
|
Asset-Backed - Other—(Continued) | |
KKR Financial CLO, Ltd.
1.778%, 07/15/25 (144A) (b) | | | 4,895,000 | | | | 4,816,842 | |
Knollwood CDO, Ltd.
3.831%, 01/10/39 (144A) (b) (j) | | | 802,143 | | | | 8 | |
LCM XI L.P.
2.783%, 04/19/22 (144A) (b) | | | 940,000 | | | | 935,134 | |
Long Beach Mortgage Loan Trust
0.613%, 11/25/36 (b) | | | 3,217,755 | | | | 1,340,012 | |
0.643%, 03/25/46 (b) | | | 5,987,620 | | | | 2,553,790 | |
0.673%, 02/25/36 (b) | | | 2,980,048 | | | | 2,367,619 | |
0.673%, 11/25/36 (b) | | | 946,834 | | | | 399,154 | |
0.743%, 03/25/46 (b) | | | 883,879 | | | | 390,529 | |
Madison Park Funding X, Ltd.
2.984%, 01/20/25 (144A) (b) | | | 1,660,000 | | | | 1,660,051 | |
Merrill Lynch First Franklin Mortgage Loan Trust
0.693%, 05/25/37 (b) | | | 12,579,618 | | | | 6,996,415 | |
Morgan Stanley IXIS Real Estate Capital Trust
0.563%, 11/25/36 (b) | | | 560,499 | | | | 246,425 | |
Mountain Hawk I CLO, Ltd.
2.814%, 01/20/24 (144A) (b) | | | 1,250,000 | | | | 1,211,898 | |
Neuberger Berman CLO XIII, Ltd.
2.938%, 01/23/24 (144A) (b) | | | 3,945,000 | | | | 3,858,506 | |
Northwoods Capital, Ltd.
2.053%, 01/18/24 (144A) (b) | | | 5,070,000 | | | | 5,030,966 | |
Oaktree EIF, Ltd.
2.926%, 11/15/25 (144A) (b) | | | 1,195,000 | | | | 1,162,700 | |
OCP CLO, Ltd.
2.163%, 04/17/27 (144A) (b) | | | 280,000 | | | | 276,475 | |
Octagon Investment Partners, Ltd.
1.753%, 07/17/25 (144A) (b) | | | 5,600,000 | | | | 5,530,991 | |
OHA Credit Partners, Ltd.
1.754%, 04/20/25 (144A) (b) | | | 590,000 | | | | 583,980 | |
OHA Loan Funding, Ltd.
1.924%, 08/23/24 (144A) (b) | | | 5,670,000 | | | | 5,643,243 | |
OneMain Financial Issuance Trust
2.430%, 06/18/24 (144A) | | | 2,886,580 | | | | 2,889,778 | |
4.320%, 07/18/25 (144A) (j) | | | 3,000,000 | | | | 2,885,012 | |
OZLM Funding, Ltd.
1.785%, 07/22/25 (144A) (b) | | | 9,625,000 | | | | 9,525,227 | |
2.117%, 10/30/23 (144A) (b) | | | 5,275,000 | | | | 5,266,064 | |
PFS Tax Lien Trust
1.440%, 05/15/29 (144A) | | | 2,264,453 | | | | 2,252,214 | |
Pretium Mortgage Credit Partners LLC
4.375%, 11/27/30 (144A) | | | 2,102,648 | | | | 2,108,118 | |
4.375%, 05/27/31 (144A) | | | 2,573,129 | | | | 2,581,297 | |
Progress Residential Trust
2.740%, 06/12/32 (144A) | | | 1,124,711 | | | | 1,140,700 | |
6.643%, 11/12/32 (144A) | | | 250,000 | | | | 255,697 | |
Race Point CLO, Ltd.
1.886%, 02/20/25 (144A) (b) | | | 1,635,000 | | | | 1,622,947 | |
3.187%, 12/15/22 (144A) (b) | | | 490,000 | | | | 484,387 | |
RCO Mortgage LLC
3.946%, 11/25/45 (144A) (b) | | | 1,066,094 | | | | 1,062,604 | |
See accompanying notes to financial statements.
MSF-19
Metropolitan Series Fund
BlackRock Bond Income Portfolio
Schedule of Investments as of June 30, 2016
Asset-Backed Securities—(Continued)
| | | | | | | | |
| Security Description | | Principal
Amount* | | | Value | |
|
Asset-Backed - Other—(Continued) | |
RMAT LLC
3.967%, 05/26/20 (144A) | | | 1,587,956 | | | $ | 1,579,594 | |
SG Mortgage Securities Trust
0.663%, 10/25/36 (b) | | | 570,000 | | | | 345,540 | |
Silvermore CLO, Ltd.
2.076%, 05/15/26 (144A) (b) | | | 6,462,680 | | | | 6,325,083 | |
Sound Point CLO, Ltd.
2.005%, 01/21/26 (144A) (b) | | | 2,185,000 | | | | 2,162,619 | |
Springleaf Funding Trust
3.620%, 11/15/24 (144A) | | | 2,062,000 | | | | 2,018,393 | |
Sunset Mortgage Loan Co. LLC
3.721%, 11/16/44 (144A) | | | 982,366 | | | | 977,159 | |
SWAY Residential Trust
1.746%, 01/17/32 (144A) (b) | | | 6,079,138 | | | | 6,043,272 | |
Symphony CLO L.P.
3.133%, 04/16/22 (144A) (b) | | | 500,000 | | | | 500,323 | |
Symphony CLO, Ltd.
1.928%, 10/15/25 (144A) (b) | | | 8,810,000 | | | | 8,760,990 | |
2.833%, 10/17/26 (144A) (b) | | | 6,170,000 | | | | 6,136,867 | |
3.378%, 10/15/25 (144A) (b) | | | 1,560,000 | | | | 1,533,315 | |
TICP CLO, Ltd.
2.174%, 01/20/27 (144A) (b) | | | 1,910,000 | | | | 1,881,850 | |
2.984%, 01/20/27 (144A) (b) | | | 340,000 | | | | 326,431 | |
Tricon American Homes Trust
1.693%, 05/17/32 (144A) (b) | | | 767,223 | | | | 755,665 | |
Venture CLO, Ltd.
2.228%, 01/15/27 (144A) (b) | | | 1,715,000 | | | | 1,708,687 | |
Vericrest Opportunity Loan Trust XLIV LLC
4.250%, 04/25/46 (144A) | | | 687,725 | | | | 692,177 | |
Vericrest Opportunity Loan Trust XLVI LLC
3.844%, 06/25/46 (144A) | | | 8,130,000 | | | | 8,130,000 | |
Vericrest Opportunity Loan Trust XLVII LLC
3.750%, 06/25/46 (144A) | | | 9,190,000 | | | | 9,190,000 | |
Voya CLO, Ltd.
1.788%, 04/25/25 (144A) (b) | | | 1,780,000 | | | | 1,759,779 | |
2.018%, 10/15/23 (144A) (b) | | | 1,180,000 | | | | 1,173,250 | |
2.083%, 01/18/26 (144A) (b) | | | 3,140,000 | | | | 3,118,146 | |
2.186%, 03/14/22 (144A) (b) | | | 610,000 | | | | 607,744 | |
2.433%, 01/18/26 (144A) (b) | | | 775,000 | | | | 764,169 | |
2.578%, 10/15/22 (144A) (b) | | | 1,670,000 | | | | 1,648,923 | |
Washington Mutural Asset-Backed Certificates Trust
0.633%, 09/25/36 (b) | | | 2,599,922 | | | | 1,213,581 | |
WestVue Mortgage Loan Trust
4.500%, 09/25/20 (144A) | | | 910,866 | | | | 910,009 | |
Ziggurat CLO, Ltd.
2.213%, 10/17/26 (144A) (b) | | | 12,105,000 | | | | 11,972,571 | |
| | | | | | | | |
| | | | | | | 268,084,143 | |
| | | | | | | | |
|
Asset-Backed - Student Loan—1.5% | |
Navient Private Education Loan Trust
2.142%, 11/15/30 (144A) (b) | | | 2,008,000 | | | | 1,988,938 | |
2.192%, 10/17/44 (144A) (b) | | | 4,595,000 | | | | 4,220,729 | |
3.500%, 12/16/58 (144A) | | | 970,000 | | | | 821,947 | |
|
Asset-Backed - Student Loan—(Continued) | |
Scholar Funding Trust
1.099%, 01/30/45 (144A) (b) | | | 8,089,272 | | | | 7,596,784 | |
1.534%, 10/28/43 (144A) (b) | | | 1,161,245 | | | | 1,105,572 | |
SLM Private Credit Student Loan Trust
0.823%, 03/15/23 (b) | | | 491,947 | | | | 488,589 | |
0.853%, 06/15/21 (b) | | | 1,310,380 | | | | 1,304,551 | |
0.983%, 03/15/24 (b) | | | 4,800,000 | | | | 4,487,216 | |
SLM Private Education Loan Trust
1.292%, 02/15/22 (144A) (b) | | | 1,053,635 | | | | 1,052,770 | |
1.842%, 10/15/31 (144A) (b) | | | 3,740,000 | | | | 3,716,543 | |
1.850%, 06/17/30 (144A) | | | 13,965,000 | | | | 13,948,470 | |
2.500%, 03/15/47 (144A) | | | 720,000 | | | | 698,803 | |
2.692%, 06/16/42 (144A) (b) | | | 3,271,000 | | | | 3,359,978 | |
3.000%, 05/16/44 (144A) | | | 970,000 | | | | 954,797 | |
SMB Private Education Loan Trust
1.642%, 07/15/27 (144A) (b) | | | 930,000 | | | | 920,209 | |
1.936%, 05/15/31 (144A) (b) | | | 2,440,000 | | | | 2,436,867 | |
1.942%, 02/17/32 (144A) (b) | | | 1,025,000 | | | | 1,008,923 | |
2.192%, 05/17/32 (144A) (b) | | | 3,490,000 | | | | 3,498,741 | |
2.700%, 05/15/31 (144A) | | | 1,225,000 | | | | 1,241,796 | |
3.500%, 12/17/40 (144A) | | | 2,090,000 | | | | 2,025,561 | |
| | | | | | | | |
| | | | | | | 56,877,784 | |
| | | | | | | | |
Total Asset-Backed Securities
(Cost $363,642,336) | | | | | | | 364,907,054 | |
| | | | | | | | |
|
| Mortgage-Backed Securities—7.7% | |
|
Collateralized Mortgage Obligations—2.8% | |
Adjustable Rate Mortgage Trust
3.506%, 03/25/36 (b) | | | 1,715,034 | | | | 1,233,718 | |
Ajax Mortgage Loan Trust
4.250%, 08/25/64 (144A) | | | 1,918,987 | | | | 1,899,818 | |
American Home Mortgage Assets Trust
1.357%, 11/25/46 (b) | | | 356,966 | | | | 166,394 | |
1.377%, 10/25/46 (b) | | | 701,404 | | | | 485,601 | |
Angel Oak Mortgage Trust LLC
4.500%, 11/25/45 (144A) | | | 739,066 | | | | 741,359 | |
Banc of America Alternative Loan Trust
5.500%, 10/25/35 | | | 2,072,614 | | | | 1,863,373 | |
Bear Stearns Asset-Backed Securities Trust
6.250%, 12/25/35 | | | 3,319,332 | | | | 3,219,942 | |
6.250%, 02/25/36 | | | 3,925,428 | | | | 2,990,283 | |
Bear Stearns Mortgage Funding Trust
0.613%, 01/25/37 (b) | | | 817,243 | | | | 611,993 | |
COLT Funding LLC
3.453%, 12/26/45 (144A) (b) | | | 1,347,547 | | | | 1,336,631 | |
COLT Mortgage Loan Trust
3.000%, 05/25/46 (144A) | | | 985,000 | | | | 992,122 | |
Countrywide Alternative Loan Trust
0.593%, 04/25/47 (b) | | | 1,135,173 | | | | 945,034 | |
0.593%, 05/25/47 (b) | | | 3,891,058 | | | | 3,074,219 | |
0.638%, 03/20/47 (b) | | | 2,452,897 | | | | 1,693,883 | |
0.643%, 10/25/46 (b) | | | 1,633,330 | | | | 1,373,573 | |
0.648%, 07/20/46 (b) | | | 4,511,400 | | | | 2,188,040 | |
See accompanying notes to financial statements.
MSF-20
Metropolitan Series Fund
BlackRock Bond Income Portfolio
Schedule of Investments as of June 30, 2016
Mortgage-Backed Securities—(Continued)
| | | | | | | | |
| Security Description | | Principal
Amount* | | | Value | |
|
Collateralized Mortgage Obligations—(Continued) | |
Countrywide Alternative Loan Trust
0.663%, 07/25/46 (b) | | | 2,015,803 | | | $ | 1,673,121 | |
0.753%, 01/25/36 (b) | | | 934,435 | | | | 776,621 | |
2.167%, 11/25/46 (b) | | | 4,714,134 | | | | 3,937,746 | |
5.500%, 04/25/37 | | | 1,291,966 | | | | 989,845 | |
6.000%, 02/25/36 | | | 1,650,171 | | | | 1,289,277 | |
6.000%, 05/25/37 | | | 4,532,209 | | | | 3,263,190 | |
6.500%, 09/25/37 | | | 10,453,850 | | | | 7,525,919 | |
Countrywide Home Loan Mortgage Pass-Through Trust
1.397%, 04/25/46 (b) | | | 5,415,619 | | | | 2,959,394 | |
Credit Suisse Mortgage Capital Certificates
0.626%, 03/27/36 (144A) (b) | | | 3,017,383 | | | | 1,843,459 | |
0.654%, 02/27/36 (144A) (b) | | | 895,000 | | | | 697,996 | |
2.706%, 03/27/37 (144A) (b) | | | 21,480 | | | | 21,464 | |
2.852%, 08/27/46 (144A) (b) | | | 3,439,673 | | | | 3,368,799 | |
4.750%, 07/27/37 (144A) (b) | | | 1,320,607 | | | | 1,313,014 | |
Deutsche ALT-A Securities Mortgage Loan Trust
0.603%, 12/25/36 (b) | | | 4,315,576 | | | | 3,480,691 | |
Deutsche ALT-A Securities, Inc. Alternate Loan Trust
0.953%, 01/27/37 (144A) (b) | | | 543,767 | | | | 1,227,711 | |
Fannie Mae Connecticut Avenue Securities
5.703%, 10/25/23 (b) | | | 7,415,000 | | | | 7,850,384 | |
GreenPoint Mortgage Funding Trust
2.437%, 03/25/36 (b) | | | 269,600 | | | | 219,075 | |
GSR Mortgage Loan Trust
6.000%, 07/25/37 | | | 1,340,926 | | | | 1,206,175 | |
JPMorgan Alternative Loan Trust
0.663%, 03/25/37 (b) | | | 1,959,505 | | | | 1,341,454 | |
3.037%, 05/25/37 (b) | | | 499,256 | | | | 408,735 | |
JPMorgan Mortgage Trust
6.500%, 08/25/36 | | | 482,338 | | | | 394,847 | |
Litigation Fee Residual Funding LLC
3.500%, 10/30/27 | | | 4,250,000 | | | | 4,198,741 | |
LSTAR Securities Investment Trust
2.439%, 03/01/21 (144A) (b) | | | 5,759,413 | | | | 5,633,282 | |
2.457%, 01/01/20 (144A) (b) | | | 1,648,753 | | | | 1,627,583 | |
2.457%, 03/01/20 (144A) (b) | | | 2,331,068 | | | | 2,283,292 | |
2.457%, 11/01/20 (144A) (b) | | | 1,068,217 | | | | 1,044,183 | |
3.557%, 09/01/21 (144A) (b) | | | 7,370,976 | | | | 7,297,266 | |
3.957%, 11/01/20 (144A) (b) | | | 350,000 | | | | 334,250 | |
MASTR Resecuritization Trust
0.881%, 08/25/37 (144A) (b) | | | 1,660,886 | | | | 1,156,003 | |
Merrill Lynch Mortgage Investors Trust
2.994%, 05/25/36 (b) | | | 2,596,060 | | | | 2,078,381 | |
Morgan Stanley Resecuritization Trust
1.160%, 06/26/47 (144A) (b) | | | 558,598 | | | | 493,289 | |
Mortgage Loan Resecuritization Trust
0.774%, 04/16/36 (144A) (b) | | | 4,906,919 | | | | 3,957,066 | |
New Residential Mortgage Loan Trust
3.750%, 08/25/55 (144A) (b) | | | 602,700 | | | | 612,392 | |
Nomura Resecuritization Trust
0.966%, 11/26/35 (144A) (b) | | | 710,000 | | | | 628,092 | |
|
Collateralized Mortgage Obligations—(Continued) | |
Residential Accredit Loans, Inc. Trust
0.613%, 02/25/37 (b) | | | 464,907 | | | | 375,162 | |
0.643%, 07/25/37 (b) | | | 1,194,651 | | | | 938,250 | |
Structured Adjustable Rate Mortgage Loan Trust
3.062%, 04/25/47 (b) | | | 1,819,324 | | | | 1,392,677 | |
Structured Asset Mortgage Investments Trust
0.643%, 06/25/36 (b) | | | 1,244,907 | | | | 970,891 | |
0.683%, 02/25/36 (b) | | | 2,806,256 | | | | 2,148,572 | |
Wedgewood Real Estate Trust
3.750%, 07/15/46 (144A) (b) | | | 1,040,000 | | | | 1,039,896 | |
Wells Fargo Mortgage-Backed Securities Trust
2.968%, 07/25/36 (b) | | | 678,631 | | | | 665,896 | |
| | | | | | | | |
| | | | | | | 109,480,064 | |
| | | | | | | | |
|
Commercial Mortgage-Backed Securities—4.9% | |
BAMLL Commercial Mortgage Securities Trust
3.042%, 09/15/26 (144A) (b) | | | 260,000 | | | | 258,876 | |
3.716%, 04/14/33 (144A) (b) | | | 850,000 | | | | 784,604 | |
Banc of America Commercial Mortgage Trust
5.451%, 01/15/49 | | | 960,816 | | | | 974,960 | |
5.482%, 01/15/49 (b) | | | 630,000 | | | | 622,968 | |
5.723%, 06/10/49 (b) | | | 7,810,204 | | | | 7,975,919 | |
5.772%, 02/10/51 (b) | | | 2,590,000 | | | | 2,675,294 | |
5.800%, 04/10/49 (b) | | | 470,000 | | | | 484,099 | |
Bayview Commercial Asset Trust
0.753%, 10/25/36 (144A) (b) | | | 372,884 | | | | 300,967 | |
3.203%, 07/25/38 (144A) (b) | | | 999,847 | | | | 1,023,771 | |
BB-UBS Trust
0.730%, 11/05/36 (144A) (b) (c) | | | 85,480,000 | | | | 3,946,466 | |
Bear Stearns Commercial Mortgage Securities Trust
5.317%, 02/11/44 | | | 5,332,855 | | | | 5,429,795 | |
5.910%, 06/11/40 (b) | | | 1,281,000 | | | | 1,323,977 | |
BHMS Mortgage Trust
1.963%, 07/05/33 (144A) (b) | | | 2,695,000 | | | | 2,655,356 | |
BWAY Mortgage Trust
3.446%, 03/10/33 (144A) | | | 1,495,000 | | | | 1,512,989 | |
3.454%, 03/10/33 (144A) | | | 2,120,000 | | | | 2,261,694 | |
4.058%, 03/10/33 (144A) (b) | | | 410,000 | | | | 380,381 | |
CCRESG Commercial Mortgage Trust
5.671%, 04/10/29 (144A) (b) | | | 230,000 | | | | 231,665 | |
CD Mortgage Trust
5.648%, 10/15/48 | | | 640,000 | | | | 644,749 | |
6.326%, 11/15/44 (b) | | | 2,530,500 | | | | 2,668,912 | |
CDGJ Commercial Mortgage Trust
1.842%, 12/15/27 (144A) (b) | | | 3,848,144 | | | | 3,844,621 | |
CFCRE Commercial Mortgage Trust
0.893%, 05/10/58 (b) (c) | | | 2,370,000 | | | | 137,001 | |
1.941%, 05/10/58 (b) (c) | | | 4,281,337 | | | | 534,589 | |
3.283%, 05/10/58 | | | 330,000 | | | | 347,048 | |
See accompanying notes to financial statements.
MSF-21
Metropolitan Series Fund
BlackRock Bond Income Portfolio
Schedule of Investments as of June 30, 2016
Mortgage-Backed Securities—(Continued)
| | | | | | | | |
| Security Description | | Principal
Amount* | | | Value | |
|
Commercial Mortgage-Backed Securities—(Continued) | |
CGGS Commerical Mortgage Trust
3.935%, 02/15/33 (144A) (b) | | | 1,710,000 | | | $ | 1,714,328 | |
5.192%, 02/15/33 (144A) (b) | | | 2,105,000 | | | | 2,138,124 | |
Citigroup Commercial Mortgage Trust
1.385%, 10/10/47 (144A) (b) (c) | | | 1,140,000 | | | | 89,638 | |
3.635%, 05/10/35 (144A) (b) | | | 130,000 | | | | 121,192 | |
COBALT CMBS Commercial Mortgage Trust
5.956%, 05/15/46 (b) | | | 2,457,000 | | | | 2,533,485 | |
Commercial Mortgage Pass-Through Certificates Mortgage Trust
0.168%, 02/10/35 (144A) (b) (c) | | | 60,958,000 | | | | 478,520 | |
1.624%, 03/10/46 (b) (c) | | | 38,000,514 | | | | 1,712,037 | |
1.866%, 01/10/46 (b) (c) | | | 36,599,672 | | | | 2,287,326 | |
3.400%, 10/05/30 (144A) | | | 4,845,000 | | | | 5,085,426 | |
4.405%, 02/10/48 (b) | | | 500,000 | | | | 492,110 | |
4.435%, 10/15/31 (144A) (b) | | | 2,845,000 | | | | 2,546,064 | |
4.456%, 07/10/48 (b) | | | 1,600,000 | | | | 1,456,794 | |
4.565%, 12/10/47 (b) | | | 420,000 | | | | 427,909 | |
4.699%, 08/10/48 (b) | | | 2,170,000 | | | | 2,169,598 | |
4.896%, 07/15/47 (b) | | | 1,280,000 | | | | 1,293,154 | |
5.543%, 12/11/49 (144A) (b) | | | 2,690,000 | | | | 2,727,416 | |
Core Industrial Trust
3.077%, 02/10/34 (144A) | | | 1,990,000 | | | | 2,088,660 | |
Countrywide Commercial Mortgage Trust
6.275%, 11/12/43 (144A) (b) | | | 505,420 | | | | 517,374 | |
Credit Suisse Commercial Mortgage Trust
5.448%, 01/15/49 (b) | | | 5,729 | | | | 5,718 | |
Credit Suisse First Boston Mortgage Securities Corp.
4.771%, 07/15/37 | | | 9,789 | | | | 9,785 | |
CSAIL Commercial Mortgage Trust
1.977%, 01/15/49 (b) (c) | | | 3,499,063 | | | | 436,712 | |
3.944%, 04/15/50 (144A) (b) | | | 360,000 | | | | 286,798 | |
4.256%, 08/15/48 (b) | | | 280,000 | | | | 293,438 | |
4.506%, 08/15/48 (b) | | | 840,000 | | | | 816,812 | |
DBRR Trust
1.636%, 12/18/49 (144A) (b) | | | 841,292 | | | | 836,447 | |
5.889%, 06/17/49 (144A) (b) | | | 3,160,000 | | | | 3,212,876 | |
Extended Stay America Trust
2.958%, 12/05/31 (144A) | | | 3,669,747 | | | | 3,681,546 | |
GAHR Commercial Mortgage Trust
3.495%, 12/15/34 (144A) (b) | | | 5,757,000 | | | | 5,317,820 | |
GAHR Commericial Mortgage Trust
1.742%, 12/15/34 (144A) (b) | | | 1,030,469 | | | | 1,031,129 | |
Greenwich Capital Commercial Mortgage Trust
5.867%, 12/10/49 (b) | | | 520,000 | | | | 537,915 | |
GS Mortgage Securities Corp. II
1.753%, 02/10/46 (b) (c) | | | 74,912,371 | | | | 5,887,551 | |
3.550%, 12/10/27 (144A) (b) | | | 7,062,358 | | | | 6,759,422 | |
Hilton USA Trust
Zero Coupon, 11/05/30 (144A) (b) (c) | | | 64,000,000 | | | | 640 | |
4.602%, 11/05/30 (144A) (b) | | | 1,472,000 | | | | 1,481,247 | |
|
Commercial Mortgage-Backed Securities—(Continued) | |
JPMBB Commercial Mortgage Securities Trust
1.342%, 10/15/48 (b) (c) | | | 5,085,076 | | | | 337,715 | |
3.801%, 09/15/47 | | | 2,500,000 | | | | 2,742,624 | |
4.712%, 09/15/47 (144A) (b) | | | 420,000 | | | | 328,134 | |
4.712%, 09/15/47 (b) | | | 390,000 | | | | 423,579 | |
JPMDB Commercial Mortgage Securities Trust
3.144%, 06/15/49 | | | 940,000 | | | | 988,373 | |
JPMorgan Chase Commercial Mortgage Securities Corp.
1.990%, 12/15/47 (b) (c) | | | 9,302,230 | | | | 654,805 | |
JPMorgan Chase Commercial Mortgage Securities Trust
0.723%, 04/15/46 (b) (c) | | | 4,900,000 | | | | 162,234 | |
1.692%, 01/15/32 (144A) (b) | | | 330,000 | | | | 327,722 | |
1.842%, 11/15/31 (144A) (b) | | | 3,107,409 | | | | 3,094,402 | |
1.947%, 02/12/51 (b) | | | 1,270,672 | | | | 1,227,469 | |
2.142%, 07/15/36 (144A) (b) | | | 2,263,000 | | | | 2,261,583 | |
3.429%, 06/10/27 (144A) | | | 1,140,000 | | | | 1,182,102 | |
3.742%, 01/15/32 (144A) (b) | | | 880,000 | | | | 872,823 | |
3.958%, 04/15/46 (b) | | | 2,230,000 | | | | 2,241,893 | |
4.401%, 01/15/49 (b) | | | 970,000 | | | | 859,845 | |
4.901%, 01/15/49 (b) | | | 320,000 | | | | 325,507 | |
5.431%, 06/12/47 (b) | | | 10,269,996 | | | | 10,391,107 | |
5.464%, 01/15/49 (b) | | | 57,000 | | | | 56,077 | |
5.593%, 05/12/45 | | | 1,866,000 | | | | 1,865,741 | |
5.692%, 01/15/32 (144A) (b) | | | 340,000 | | | | 334,876 | |
5.927%, 06/15/49 (b) | | | 2,670,000 | | | | 2,718,015 | |
LB-UBS Commercial Mortgage Trust
5.484%, 02/15/40 | | | 480,000 | | | | 482,634 | |
Lone Star Portfolio Trust
2.242%, 09/15/28 (144A) (b) | | | 327,630 | | | | 333,191 | |
Merrill Lynch Mortgage Trust
6.021%, 06/12/50 (b) | | | 2,853,026 | | | | 2,924,534 | |
ML-CFC Commercial Mortgage Trust
5.204%, 12/12/49 | | | 970,000 | | | | 978,992 | |
5.810%, 06/12/50 (b) | | | 1,578,293 | | | | 1,624,479 | |
Morgan Stanley Bank of America Merrill Lynch Trust
1.318%, 11/15/46 (b) (c) | | | 26,429,778 | | | | 1,529,306 | |
1.339%, 12/15/47 (144A) (b) (c) | | | 1,810,000 | | | | 123,931 | |
3.060%, 10/15/48 (144A) | | | 820,000 | | | | 566,911 | |
3.068%, 10/15/48 | | | 1,300,000 | | | | 898,914 | |
4.680%, 10/15/48 (b) | | | 2,340,000 | | | | 2,317,850 | |
Morgan Stanley Capital Trust
0.617%, 02/12/44 (b) | | | 720,000 | | | | 706,084 | |
3.192%, 08/15/26 (144A) (b) | | | 300,000 | | | | 299,478 | |
3.560%, 07/13/29 (144A) (b) | | | 540,000 | | | | 505,847 | |
5.406%, 03/15/44 | | | 3,090,000 | | | | 3,149,283 | |
5.902%, 04/12/49 (b) | | | 2,375,000 | | | | 2,391,466 | |
Morgan Stanley Re-REMIC Trust
2.000%, 07/27/49 (144A) | | | 1,192,550 | | | | 1,183,379 | |
5.988%, 08/15/45 (144A) (b) | | | 1,560,000 | | | | 1,590,546 | |
RBSCF Trust
6.147%, 02/16/51 (144A) (b) | | | 8,365,588 | | | | 8,393,377 | |
See accompanying notes to financial statements.
MSF-22
Metropolitan Series Fund
BlackRock Bond Income Portfolio
Schedule of Investments as of June 30, 2016
Mortgage-Backed Securities—(Continued)
| | | | | | | | |
| Security Description | | Principal
Amount* | | | Value | |
|
Commercial Mortgage-Backed Securities—(Continued) | |
SCG Trust
1.842%, 11/15/26 (144A) (b) | | | 5,285,000 | | | $ | 5,277,053 | |
2.392%, 11/15/26 (144A) (b) | | | 3,290,000 | | | | 3,280,698 | |
STRIPs, Ltd.
0.500%, 12/25/44 (144A) | | | 2,370,000 | | | | 2,379,196 | |
1.500%, 12/25/44 (144A) | | | 1,047,512 | | | | 1,046,203 | |
UBS-Barclays Commercial Mortgage Trust
3.635%, 02/15/28 (144A) (b) | | | 950,000 | | | | 924,108 | |
Velocity Commercial Capital Loan Trust
2.883%, 06/25/45 (144A) (b) | | | 2,595,781 | | | | 2,608,760 | |
2.896%, 04/25/46 (144A) (b) | | | 2,599,097 | | | | 2,596,659 | |
Wachovia Bank Commercial Mortgage Trust
5.339%, 11/15/48 | | | 945,000 | | | | 954,131 | |
5.632%, 10/15/48 (b) | | | 341,000 | | | | 340,299 | |
5.672%, 10/15/48 (b) | | | 50,000 | | | | 49,226 | |
Wells Fargo Commercial Mortgage Trust
1.138%, 02/15/48 (b) (c) | | | 8,841,329 | | | | 553,447 | |
3.852%, 11/15/48 | | | 1,600,000 | | | | 1,124,500 | |
Wells Fargo Resecuritization Trust
1.750%, 08/20/21 (144A) | | | 180,083 | | | | 180,060 | |
WF-RBS Commercial Mortgage Trust
1.123%, 11/15/47 (b) (c) | | | 25,691,877 | | | | 1,434,157 | |
1.354%, 05/15/47 (b) (c) | | | 12,008,838 | | | | 731,741 | |
1.537%, 03/15/48 (144A) (b) (c) | | | 41,739,275 | | | | 2,578,005 | |
3.915%, 09/15/57 (b) | | | 1,540,000 | | | | 1,441,103 | |
| | | | | | | | |
| | | | | | | 192,391,886 | |
| | | | | | | | |
Total Mortgage-Backed Securities
(Cost $319,213,021) | | | | | | | 301,871,950 | |
| | | | | | | | |
|
| Municipals—4.1% | |
Arizona Health Facilities Authority
1.229%, 01/01/37 (b) | | | 1,140,000 | | | | 1,061,488 | |
Atlanta GA Water & Wastewater Revenue
5.000%, 11/01/33 | | | 905,000 | | | | 1,125,974 | |
Bay Area Toll Bridge Authority, Build America Bonds
6.918%, 04/01/40 | | | 1,280,000 | | | | 1,866,291 | |
Series S1 7.043%, 04/01/50 | | | 460,000 | | | | 730,958 | |
California State Public Works Board
8.361%, 10/01/34 | | | 760,000 | | | | 1,194,720 | |
City of Seattle, WA Municipal Light & Power Revenue Series B
5.000%, 04/01/23 | | | 650,000 | | | | 806,988 | |
5.000%, 04/01/24 | | | 630,000 | | | | 799,426 | |
5.000%, 04/01/25 | | | 580,000 | | | | 750,566 | |
Clark County School District
5.000%, 06/15/26 | | | 675,000 | | | | 857,743 | |
5.000%, 06/15/27 | | | 675,000 | | | | 850,419 | |
5.000%, 06/15/28 | | | 720,000 | | | | 903,586 | |
Series A
5.000%, 06/15/23 | | | 1,585,000 | | | | 1,955,288 | |
5.000%, 06/15/24 | | | 1,820,000 | | | | 2,278,203 | |
| Municipals—(Continued) | |
| Security Description | | Principal
Amount* | | | Value | |
Colorado Health Facilities Authority
5.250%, 02/01/31 | | | 655,000 | | | | 744,132 | |
Energy Northwest
Series A | | | | | | | | |
5.000%, 07/01/27 | | | 665,000 | | | | 870,758 | |
5.000%, 07/01/28 | | | 325,000 | | | | 424,164 | |
Series B
2.814%, 07/01/24 | | | 1,290,000 | | | | 1,370,496 | |
Grant County Public Utility District No. 2
4.584%, 01/01/40 | | | 315,000 | | | | 350,214 | |
Hawaii State, General Obligation Unlimited
5.000%, 04/01/19 | | | 665,000 | | | | 742,353 | |
5.000%, 04/01/20 | | | 665,000 | | | | 766,266 | |
5.000%, 04/01/21 | | | 665,000 | | | | 788,411 | |
5.000%, 04/01/22 | | | 665,000 | | | | 808,773 | |
5.000%, 04/01/23 | | | 665,000 | | | | 827,067 | |
Horry County School District
5.000%, 03/01/19 | | | 360,000 | | | | 400,612 | |
5.000%, 03/01/20 | | | 360,000 | | | | 414,461 | |
5.000%, 03/01/21 | | | 360,000 | | | | 426,564 | |
5.000%, 03/01/22 | | | 530,000 | | | | 644,597 | |
5.000%, 03/01/23 | | | 590,000 | | | | 735,931 | |
5.000%, 03/01/24 | | | 625,000 | | | | 797,625 | |
5.000%, 03/01/25 | | | 355,000 | | | | 460,811 | |
Las Vegas Valley, NV Water District, General Obligation, Ltd.
5.000%, 06/01/41 | | | 300,000 | | | | 371,961 | |
Los Angeles Community College District
6.600%, 08/01/42 | | | 1,480,000 | | | | 2,330,156 | |
Los Angeles Department of Water & Power Revenue, Build America Bonds
6.603%, 07/01/50 | | | 565,000 | | | | 897,158 | |
Los Angeles, Unified School District, Build America Bonds
6.758%, 07/01/34 | | | 640,000 | | | | 922,208 | |
Massachusetts Development Finance Agency
5.000%, 07/01/44 | | | 2,685,000 | | | | 3,144,430 | |
Massachusetts Educational Financing Authority
5.000%, 01/01/22 | | | 740,000 | | | | 851,481 | |
Massachusetts State Clean Water Trust Revenue
5.000%, 02/01/25 | | | 585,000 | | | | 765,513 | |
5.000%, 02/01/26 | | | 685,000 | | | | 913,811 | |
5.000%, 02/01/27 | | | 555,000 | | | | 733,355 | |
5.000%, 02/01/28 | | | 500,000 | | | | 657,540 | |
Metropolitan Transportation Authority Build America Bonds
6.668%, 11/15/39 | | | 170,000 | | | | 248,829 | |
6.687%, 11/15/40 | | | 590,000 | | | | 851,529 | |
6.814%, 11/15/40 | | | 1,005,000 | | | | 1,465,059 | |
Metropolitan Washington Airports Authority Dulles Toll Road Revenue
7.462%, 10/01/46 | | | 560,000 | | | | 876,848 | |
See accompanying notes to financial statements.
MSF-23
Metropolitan Series Fund
BlackRock Bond Income Portfolio
Schedule of Investments as of June 30, 2016
Municipals—(Continued)
| | | | | | | | |
| Security Description | | Principal
Amount* | | | Value | |
Miami-Dade County
Series A | | | | | | | | |
5.000%, 07/01/29 | | | 330,000 | | | $ | 424,383 | |
5.000%, 07/01/30 | | | 330,000 | | | | 421,615 | |
5.000%, 07/01/31 | | | 330,000 | | | | 419,899 | |
5.000%, 07/01/32 | | | 330,000 | | | | 418,186 | |
5.000%, 07/01/34 | | | 780,000 | | | | 980,413 | |
5.000%, 07/01/35 | | | 395,000 | | | | 494,473 | |
5.000%, 07/01/36 | | | 980,000 | | | | 1,222,815 | |
5.000%, 07/01/37 | | | 705,000 | | | | 877,528 | |
5.000%, 07/01/38 | | | 650,000 | | | | 806,442 | |
Miami-Dade County, FL Aviation Revenue
5.000%, 10/01/38 | | | 1,025,000 | | | | 1,213,774 | |
Miami-Dade County, FL Educational Facilities Authority
5.073%, 04/01/50 | | | 655,000 | | | | 783,288 | |
Missouri State Health & Educational Facilities Authority Revenue
5.000%, 11/15/29 | | | 340,000 | | | | 429,454 | |
5.000%, 11/15/30 | | | 370,000 | | | | 464,716 | |
5.000%, 11/15/34 | | | 340,000 | | | | 420,213 | |
Municipal Electric Authority of Georgia, Build America Bonds
6.637%, 04/01/57 | | | 1,000,000 | | | | 1,337,190 | |
New Jersey State Educational Facility Authority Revenue
5.000%, 07/01/23 | | | 780,000 | | | | 983,416 | |
New Jersey State Turnpike Authority
5.000%, 01/01/45 | | | 325,000 | | | | 388,424 | |
New Jersey State Turnpike Authority, Build America Bonds
7.414%, 01/01/40 | | | 1,451,000 | | | | 2,276,692 | |
New York City Water & Sewer System
5.375%, 06/15/43 | | | 2,360,000 | | | | 2,784,918 | |
5.500%, 06/15/43 | | | 2,825,000 | | | | 3,350,224 | |
5.750%, 06/15/41 | | | 675,000 | | | | 951,615 | |
5.882%, 06/15/44 | | | 1,150,000 | | | | 1,666,350 | |
New York State Dormitory Authority Build America Bonds
5.389%, 03/15/40 | | | 1,075,000 | | | | 1,433,749 | |
New York State Dormitory Authority Revenue
5.000%, 03/15/32 | | | 580,000 | | | | 735,446 | |
New York State Housing Finance Agency
3.250%, 11/01/41 | | | 340,000 | | | | 341,761 | |
New York State Thruway Authority
5.000%, 01/01/31 | | | 730,000 | | | | 901,433 | |
Series A 5.000%, 05/01/19 | | | 305,000 | | | | 340,093 | |
New York State Urban Development Corp.
5.000%, 03/15/24 | | | 1,260,000 | | | | 1,599,116 | |
5.000%, 03/15/25 | | | 850,000 | | | | 1,094,766 | |
5.000%, 03/15/26 | | | 1,505,000 | | | | 1,968,961 | |
5.000%, 03/15/27 | | | 1,045,000 | | | | 1,356,243 | |
5.000%, 03/15/28 | | | 1,105,000 | | | | 1,428,389 | |
New York Transportation Development Corp. | | | | | | | | |
Series A
5.000%, 07/01/41 | | | 370,000 | | | | 426,458 | |
| Municipals—(Continued) | |
| Security Description | | Principal
Amount* | | | Value | |
New York Transportation Development Corp. | | | | | | | | |
5.000%, 07/01/46 | | | 1,710,000 | | | | 1,969,612 | |
5.250%, 01/01/50 | | | 1,375,000 | | | | 1,609,217 | |
North Carolina Department of Transportation
5.000%, 06/30/54 | | | 1,000,000 | | | | 1,133,720 | |
North Carolina State Medical Care Commission
5.000%, 06/01/40 | | | 340,000 | | | | 408,360 | |
Orange County Local Transportation Authority
6.908%, 02/15/41 | | | 1,420,000 | | | | 2,088,664 | |
Orange County Sanitation District
5.000%, 02/01/34 | | | 500,000 | | | | 623,495 | |
Pennsylvania Economic Development Financing Authority
5.000%, 12/31/38 | | | 510,000 | | | | 604,202 | |
Port Authority of New York & New Jersey
4.960%, 08/01/46 | | | 1,910,000 | | | | 2,413,743 | |
Public Power Generation Agency Revenue
5.000%, 01/01/34 | | | 5,000 | | | | 6,188 | |
Regents of the University of California Medical Center Pooled Revenue
6.583%, 05/15/49 | | | 1,455,000 | | | | 2,137,977 | |
Sacramento County, CA, Airport System Revenue
5.250%, 07/01/39 | | | 500,000 | | | | 537,270 | |
San Antonio Service Board, Build America Bonds
5.808%, 02/01/41 | | | 470,000 | | | | 646,504 | |
San Jose CA, Airport Revenue
5.000%, 03/01/37 | | | 860,000 | | | | 882,317 | |
State of California General Obligation Unlimited
5.000%, 09/01/27 | | | 1,645,000 | | | | 2,156,365 | |
5.000%, 09/01/32 | | | 345,000 | | | | 441,490 | |
State of California General Obligation Unlimited, Build America Bonds
4.988%, 04/01/39 | | | 790,000 | | | | 868,439 | |
7.350%, 11/01/39 | | | 690,000 | | | | 1,046,344 | |
7.500%, 04/01/34 | | | 1,125,000 | | | | 1,704,499 | |
7.550%, 04/01/39 | | | 1,375,000 | | | | 2,173,559 | |
7.600%, 11/01/40 | | | 3,780,000 | | | | 6,086,140 | |
State of California, Build America Bonds
7.300%, 10/01/39 | | | 345,000 | | | | 522,509 | |
State of Georgia | | | | | | | | |
Series A 5.000%, 02/01/29 | | | 395,000 | | | | 514,093 | |
Series A-1 5.000%, 02/01/26 | | | 810,000 | | | | 1,072,788 | |
Series C-1
5.000%, 07/01/23 | | | 1,735,000 | | | | 2,181,988 | |
5.000%, 07/01/24 | | | 2,535,000 | | | | 3,259,579 | |
5.000%, 07/01/26 | | | 355,000 | | | | 473,293 | |
State of Illinois, Build America Bonds
5.100%, 06/01/33 | | | 4,320,000 | | | | 4,151,822 | |
State of Maryland
5.000%, 06/01/21 | | | 680,000 | | | | 812,695 | |
5.000%, 06/01/22 | | | 680,000 | | | | 833,775 | |
5.000%, 06/01/23 | | | 680,000 | | | | 854,780 | |
See accompanying notes to financial statements.
MSF-24
Metropolitan Series Fund
BlackRock Bond Income Portfolio
Schedule of Investments as of June 30, 2016
Municipals—(Continued)
| | | | | | | | |
| Security Description | | Principal
Amount* | | | Value | |
State of Maryland
5.000%, 06/01/24 | | | 680,000 | | | $ | 874,262 | |
State of Massachusetts | | | | | | | | |
Series B
5.000%, 07/01/22 | | | 1,320,000 | | | | 1,607,972 | |
5.000%, 07/01/23 | | | 1,795,000 | | | | 2,231,580 | |
5.000%, 07/01/25 | | | 720,000 | | | | 931,046 | |
5.000%, 07/01/26 | | | 700,000 | | | | 918,792 | |
5.000%, 07/01/28 | | | 700,000 | | | | 926,289 | |
State of Nevada Highway Improvement Revenue
5.000%, 12/01/27 | | | 665,000 | | | | 862,818 | |
5.000%, 12/01/28 | | | 315,000 | | | | 407,043 | |
State of North Carolina | | | | | | | | |
Series A 5.000%, 06/01/24 | | | 880,000 | | | | 1,132,930 | |
Series B 5.000%, 06/01/25 | | | 2,505,000 | | | | 3,291,620 | |
Series A 5.000%, 06/01/26 | | | 1,500,000 | | | | 2,004,240 | |
State of Ohio
5.000%, 12/15/23 | | | 1,180,000 | | | | 1,488,723 | |
5.000%, 12/15/24 | | | 830,000 | | | | 1,068,642 | |
Series A 5.000%, 09/15/24 | | | 1,000,000 | | | | 1,281,240 | |
State of Puerto Rico
8.000%, 07/01/35 | | | 1,070,000 | | | | 712,888 | |
State of Washington General Obligation Unlimited
5.000%, 07/01/28 | | | 650,000 | | | | 817,668 | |
Series A
5.000%, 08/01/25 | | | 705,000 | | | | 910,952 | |
5.000%, 08/01/26 | | | 705,000 | | | | 924,361 | |
5.000%, 08/01/27 | | | 705,000 | | | | 916,014 | |
Series R
5.000%, 08/01/28 | | | 825,000 | | | | 1,067,525 | |
5.000%, 08/01/29 | | | 825,000 | | | | 1,063,145 | |
5.000%, 08/01/30 | | | 825,000 | | | | 1,058,780 | |
5.000%, 08/01/31 | | | 825,000 | | | | 1,054,441 | |
5.000%, 08/01/32 | | | 825,000 | | | | 1,050,118 | |
State of Wisconsin
5.000%, 05/01/34 | | | 810,000 | | | | 1,012,986 | |
Texas Private Activity Bond Surface Transportation Corp.
5.000%, 12/31/55 | | | 680,000 | | | | 787,297 | |
University of California CA, Revenue
4.858%, 05/15/2112 | | | 980,000 | | | | 1,088,868 | |
Utah Transit Authority
5.000%, 06/15/27 | | | 3,500,000 | | | | 4,518,080 | |
Virginia State Public Authority
5.000%, 08/01/25 | | | 440,000 | | | | 576,655 | |
West Virginia Hospital Finance Authority
5.000%, 06/01/19 | | | 365,000 | | | | 408,114 | |
5.000%, 06/01/20 | | | 390,000 | | | | 449,077 | |
5.000%, 06/01/21 | | | 390,000 | | | | 459,947 | |
5.000%, 06/01/22 | | | 425,000 | | | | 512,189 | |
5.000%, 06/01/23 | | | 355,000 | | | | 436,444 | |
5.000%, 06/01/24 | | | 375,000 | | | | 469,609 | |
Wisconsin Health & Educational Facilities Authority
5.000%, 08/15/39 | | | 965,000 | | | | 1,137,947 | |
| | | | | | | | |
Total Municipals
(Cost $153,199,805) | | | | | | | 161,202,935 | |
| | | | | | | | |
| Foreign Government—2.7% | |
| Security Description | | Principal
Amount* | | | Value | |
|
Sovereign—2.7% | |
Argentine Republic Government International Bonds
6.250%, 04/22/19 (144A) | | | 3,722,000 | | | | 3,880,185 | |
6.875%, 04/22/21 (144A) | | | 4,210,000 | | | | 4,489,965 | |
Brazilian Government International Bonds
5.000%, 01/27/45 | | | 426,000 | | | | 384,465 | |
7.125%, 01/20/37 (f) | | | 1,176,000 | | | | 1,323,000 | |
Colombia Government International Bond
4.000%, 02/26/24 (f) | | | 5,175,000 | | | | 5,405,287 | |
Deutsche Bundesrepublik Inflation Linked Bonds
0.100%, 04/15/26 (EUR) (e) | | | 16,231,873 | | | | 19,958,540 | |
Hellenic Republic Government Bonds
3.000%, 02/24/23 (EUR) (g) | | | 171,739 | | | | 142,178 | |
3.000%, 02/24/24 (EUR) (g) | | | 171,739 | | | | 137,690 | |
3.000%, 02/24/25 (EUR) (g) | | | 171,739 | | | | 134,795 | |
3.000%, 02/24/26 (EUR) (g) | | | 171,739 | | | | 134,376 | |
3.000%, 02/24/27 (EUR) (g) | | | 171,739 | | | | 129,262 | |
3.000%, 02/24/28 (EUR) (g) | | | 171,739 | | | | 127,510 | |
3.000%, 02/24/29 (EUR) (g) | | | 171,739 | | | | 124,723 | |
3.000%, 02/24/30 (EUR) (g) | | | 171,739 | | | | 122,729 | |
3.000%, 02/24/31 (EUR) (g) | | | 171,739 | | | | 121,694 | |
3.000%, 02/24/32 (EUR) (g) | | | 171,739 | | | | 121,708 | |
3.000%, 02/24/33 (EUR) (g) | | | 171,739 | | | | 117,611 | |
3.000%, 02/24/34 (EUR) (g) | | | 171,739 | | | | 118,183 | |
3.000%, 02/24/35 (EUR) (g) | | | 171,739 | | | | 115,774 | |
3.000%, 02/24/36 (EUR) (g) | | | 171,739 | | | | 115,420 | |
3.000%, 02/24/37 (EUR) (g) | | | 171,739 | | | | 114,749 | |
3.000%, 02/24/38 (EUR) (g) | | | 171,739 | | | | 113,967 | |
3.000%, 02/24/39 (EUR) (g) | | | 171,739 | | | | 113,207 | |
3.000%, 02/24/40 (EUR) (g) | | | 171,739 | | | | 113,495 | |
3.000%, 02/24/41 (EUR) (g) | | | 171,739 | | | | 113,473 | |
3.000%, 02/24/42 (EUR) (g) | | | 171,739 | | | | 114,352 | |
Indonesia Government International Bonds
3.375%, 04/15/23 (144A) | | | 2,016,000 | | | | 2,026,945 | |
2.625%, 06/14/23 (144A) (EUR) | | | 1,152,000 | | | | 1,289,806 | |
5.375%, 10/17/23 (144A) | | | 1,350,000 | | | | 1,519,159 | |
5.875%, 01/15/24 (144A) | | | 3,964,000 | | | | 4,584,239 | |
Indonesia Treasury Bonds
6.625%, 05/15/33 (IDR) | | | 10,707,000,000 | | | | 705,282 | |
8.250%, 05/15/36 (IDR) | | | 19,810,000,000 | | | | 1,583,151 | |
8.375%, 03/15/24 (IDR) | | | 20,667,000,000 | | | | 1,649,450 | |
8.375%, 03/15/34 (IDR) | | | 46,024,000,000 | | | | 3,692,370 | |
8.750%, 05/15/31 (IDR) | | | 21,227,000,000 | | | | 1,758,246 | |
Mexican Bonos
4.750%, 06/14/18 (MXN) | | | 75,800,000 | | | | 4,138,206 | |
Mexican Udibonos
3.500%, 12/14/17 (MXN) (e) | | | 19,683,736 | | | | 1,107,971 | |
Mexico Government International Bond
4.000%, 10/02/23 | | | 18,880,000 | | | | 20,325,264 | |
Peruvian Government International Bond
7.350%, 07/21/25 (f) | | | 2,900,000 | | | | 3,944,000 | |
Poland Government Bond
1.500%, 04/25/20 (PLN) | | | 23,920,000 | | | | 5,967,425 | |
See accompanying notes to financial statements.
MSF-25
Metropolitan Series Fund
BlackRock Bond Income Portfolio
Schedule of Investments as of June 30, 2016
Foreign Government—(Continued)
| | | | | | | | |
| Security Description | | Shares/
Principal/
Notional
Amount* | | | Value | |
|
Sovereign—(Continued) | |
Russian Federal Bond - OFZ
7.000%, 08/16/23 (RUB) | | | 19,050,000 | | | $ | 278,245 | |
Turkey Government International Bond
5.750%, 03/22/24 | | | 10,500,000 | | | | 11,708,655 | |
Venezuela Government International Bonds
7.000%, 03/31/38 (f) | | | 928,000 | | | | 368,880 | |
8.250%, 10/13/24 | | | 815,000 | | | | 340,263 | |
| | | | | | | | |
Total Foreign Government
(Cost $100,550,779) | | | | | | | 104,875,895 | |
| | | | | | | | |
|
| Preferred Stocks—0.4% | |
| | |
Banks—0.4% | | | | | | | | |
Citigroup Capital, 7.008% (b) | | | 292,339 | | | | 7,621,278 | |
GMAC Capital Trust, 6.411% (b) | | | 250,000 | | | | 6,205,000 | |
| | | | | | | | |
| | | | | | | 13,826,278 | |
| | | | | | | | |
|
Thrifts & Mortgage Finance—0.0% | |
Federal Home Loan Mortgage Corp. Series Z, 8.375% (b) (f) | | | 70,000 | | | | 311,500 | |
Federal National Mortgage Association Series S, 8.250% (b) | | | 70,000 | | | | 312,900 | |
| | | | | | | | |
| | | | | | | 624,400 | |
| | | | | | | | |
Total Preferred Stocks
(Cost $14,797,285) | | | | | | | 14,450,678 | |
| | | | | | | | |
|
| Purchased Options—0.0% | |
|
Currency Options—0.0% | |
GBP Put/USD Call, Strike Price USD 1.335, Expires 07/27/16 (Counterparty - BNP Paribas S.A.) (GBP) | | | 18,680,000 | | | | 188,995 | |
GBP Put/USD Call, Strike Price USD 1.35, Expires 07/27/16 (Counterparty - HSBC Bank plc) (GBP) | | | 1,420,000 | | | | 45,747 | |
GBP Put/USD Call, Strike Price USD 1.45, Expires 07/27/16 (Counterparty - Deutsche Bank AG) (GBP) | | | 1,420,000 | | | | 171,268 | |
USD Call/BRL Put, Strike Price BRL 3.565, Expires 07/01/16 (Counterparty - Morgan Stanley & Co. LLC) | | | 1,900,000 | | | | 0 | |
USD Call/CAD Put, Strike Price CAD 1.29, Expires 07/12/16 (Counterparty - Goldman Sachs & Co.) | | | 1,649,000 | | | | 11,873 | |
USD Call/CNH Put, Strike Price CNH 6.62, Expires 07/07/16 (Counterparty - Deutsche Bank AG) | | | 2,550,000 | | | | 19,380 | |
USD Call/CNH Put, Strike Price CNH 6.70, Expires 08/24/16 (Counterparty - Deutsche Bank AG) | | | 2,972,000 | | | | 21,696 | |
|
Currency Options—(Continued) | |
USD Call/CNH Put, Strike Price CNH 6.75, Expires 07/29/16 (Counterparty - HSBC Bank plc) | | | 51,700,000 | | | | 144,760 | |
USD Call/CNH Put, Strike Price CNH 6.75, Expires 12/15/16 (Counterparty - Deutsche Bank AG) | | | 2,869,000 | | | | 46,478 | |
USD Call/CNH Put, Strike Price CNH 7.15, Expires 08/24/16 (Counterparty - Deutsche Bank AG) | | | 2,972,000 | | | | 2,080 | |
USD Call/JPY Put, Strike Price JPY 106.00, Expires 08/05/16 (Counterparty - Deutsche Bank AG) | | | 1,832,000 | | | | 12,274 | |
USD Call/JPY Put, Strike Price JPY 110.00, Expires 07/14/16 (Counterparty - Barclays Bank plc) | | | 1,579,000 | | | | 316 | |
USD Call/MXN Put, Strike Price MXN 17.65, Expires 07/1/16 (Counterparty - Citibank N.A.) | | | 1,748,000 | | | | 62,578 | |
USD Call/MXN Put, Strike Price MXN 19.00, Expires 07/18/16 (Counterparty - UBS AG) | | | 1,092,000 | | | | 3,058 | |
USD Call/MXN Put, Strike Price MXN 19.25, Expires 07/18/16 (Counterparty - Goldman Sachs & Co.) | | | 2,548,000 | | | | 3,567 | |
USD Call/MXN Put, Strike Price MXN 19.25, Expires 07/18/16 (Counterparty - UBS AG) | | | 1,456,000 | | | | 2,038 | |
USD Call/RUB Put, Strike Price RUB 64.50, Expires 07/01/16 (Counterparty - UBS AG) | | | 2,841,282 | | | | 4,262 | |
USD Call/SAR Put, Strike Price SAR 3.778, Expires 08/16/16 (Counterparty - BNP Paribas S.A.) | | | 20,475,000 | | | | 26,618 | |
USD Call/SAR Put, Strike Price SAR 3.778, Expires 08/16/16 (Counterparty - Citibank N.A.) | | | 20,450,000 | | | | 26,585 | |
USD Call/TRY Put, Strike Price TRY 2.95, Expires 07/01/16 (Counterparty - Morgan Stanley & Co. LLC) | | | 3,386,000 | | | | 3 | |
USD Call/ZAR Put, Strike Price ZAR 15.00, Expires 07/08/16 (Counterparty - BNP Paribas S.A.) | | | 2,786,607 | | | | 15,605 | |
USD Put/MXN Call, Strike Price MXN 18.30, Expires 07/15/16 (Counterparty - JPMorgan Chase Bank N.A.) | | | 2,754,000 | | | | 31,946 | |
USD Put/MXN Call, Strike Price MXN 18.50, Expires 07/15/16 (Counterparty - JPMorgan Chase Bank N.A.) | | | 7,262,000 | | | | 129,990 | |
| | | | | | | | |
| | | | | | | 971,117 | |
| | | | | | | | |
See accompanying notes to financial statements.
MSF-26
Metropolitan Series Fund
BlackRock Bond Income Portfolio
Schedule of Investments as of June 30, 2016
Purchased Options—(Continued)
| | | | | | | | |
| Security Description | | Shares/
Principal/
Contracts | | | Value | |
|
Options on Exchange-Traded Futures Contracts—0.0% | |
Put - U.S. Treasury Note 10-Year Futures @130.50, Expires 07/22/16 | | | 452 | | | $ | 28,250 | |
Put - U.S. Treasury Note 10-Year Futures @132.00, Expires 07/22/16 | | | 536 | | | | 142,375 | |
| | | | | | | | |
| | | | | | | 170,625 | |
| | | | | | | | |
Total Purchased Options
(Cost $2,891,883) | | | | | | | 1,141,742 | |
| | | | | | | | |
|
| Short-Term Investments—6.8% | |
| | |
Mutual Fund—1.7% | | | | | | | | |
State Street Navigator Securities Lending MET Portfolio (k) | | | 68,680,138 | | | | 68,680,138 | |
| | | | | | | | |
|
Repurchase Agreement—5.1% | |
Fixed Income Clearing Corp.
Repurchase Agreement dated 06/30/16 at 0.030% to be repurchased at $198,683,555 on 07/01/16, collateralized by $200,295,000 U.S. Government Agency Obligations with rates ranging from 0.000% - 3.250%, maturity dates ranging from 09/01/16 - 07/31/20, with a value of $202,661,763. | | | 198,683,389 | | | | 198,683,389 | |
| | | | | | | | |
Total Short-Term Investments
(Cost $267,363,527) | | | | | | | 267,363,527 | |
| | | | | | | | |
Total Investments—110.8%
(Cost $4,279,545,863) (l) | | | | | | | 4,349,817,107 | |
Other assets and liabilities (net)—(10.8)% | | | | | | | (422,396,543 | ) |
| | | | | | | | |
| Net Assets—100.0% | | | | | | $ | 3,927,420,564 | |
| | | | | | | | |
| * | Principal and notional amounts stated in U.S. dollars unless otherwise noted. |
| (a) | TBA (To Be Announced) Securities are purchased on a forward commitment basis with an approximate principal amount and no defined maturity date. The actual principal and maturity date will be determined upon settlement date. |
| (b) | Variable or floating rate security. The stated rate represents the rate at June 30, 2016. Maturity date shown for callable securities reflects the earliest possible call date. |
| (c) | Interest only security. |
| (d) | All or a portion of the security was pledged as collateral against open futures contracts. As of June 30, 2016, the market value of securities pledged was $6,189,375. |
| (e) | Principal amount of security is adjusted for inflation. |
| (f) | All or a portion of the security was held on loan. As of June 30, 2016, the market value of securities loaned was $114,113,484 and the collateral received consisted of cash in the amount of $68,680,138 and non-cash collateral with a value of $48,950,738. The cash collateral is invested in a money market fund managed by an affiliate of the custodian. The non-cash collateral received consists primarily of government securities and bank letters of credit, and is held for the benefit of the Portfolio at the Portfolio’s custodian. The Portfolio cannot repledge or resell this collateral. As such, this collateral is excluded from the Statement of Assets and Liabilities. |
| (g) | Security is a “step-up” bond where coupon increases or steps up at a predetermined date. Rate shown is current coupon rate. |
| (h) | Payment-in-kind security for which part of the income earned may be paid as additional principal. |
| (i) | Non-income producing; security is in default and/or issuer is in bankruptcy. |
| (j) | Restricted securities are not registered under the Securities Act of 1933 and are subject to legal restrictions on resale. These securities generally may be resold in transactions exempt from registration or to the public if the securities are subsequently registered. Disposal of these securities may involve time-consuming negotiations and prompt sale at an acceptable price may be difficult. As of June 30, 2016, the market value of restricted securities was $2,885,020, which is 0.1% of net assets. See details shown in the Restricted Securities table that follows. |
| (k) | Represents investment of cash collateral received from securities on loan as of June 30, 2016. |
| (l) | As of June 30, 2016, the aggregate cost of investments was $4,279,545,863. The aggregate unrealized appreciation and depreciation of investments were $105,318,512 and $(35,047,268), respectively, resulting in net unrealized appreciation of $70,271,244. |
| (144A)— | Securities exempt from registration under Rule 144A of the Securities Act of 1933. These securities may be resold in transactions exempt from registration, normally to qualified institutional buyers. As of June 30, 2016, the market value of 144A securities was $535,217,864, which is 13.6% of net assets. |
| (ACES)— | Alternative Credit Enhancement Securities |
| (ARM)— | Adjustable-Rate Mortgage |
| (CDO)— | Collateralized Debt Obligation |
| (CLO)— | Collateralized Loan Obligation |
| (CMO)— | Collateralized Mortgage Obligation |
| (REMIC)— | Real Estate Mortgage Investment Conduit |
| (SAR)— | Saudi Arabian Riyal |
| (USD)— | United States Dollar |
See accompanying notes to financial statements.
MSF-27
Metropolitan Series Fund
BlackRock Bond Income Portfolio
Schedule of Investments as of June 30, 2016
| | | | | | | | | | | | | | | | | | |
Restricted Securities | | Acquisition
Date | | | Principal
Amount | | | Cost | | | Value | |
Knollwood CDO, Ltd., 3.831%, 01/10/39 | | | 02/10/04 | | | $ | 802,143 | | | $ | 802,143 | | | $ | 8 | |
OneMain Financial Issuance Trust, 4.320%, 07/18/25 | | | 05/12/15 | | | | 3,000,000 | | | | 2,999,452 | | | | 2,885,012 | |
| | | | | | | | | | | | | | | | | | |
| | | | | | | $ | 2,885,020 | |
| | | | | | | | | | | | | | | | | | |
TBA Forward Sale Commitments
| | | | | | | | | | | | | | | | | | | | |
Security Description | | Interest Rate | | | Maturity | | | Face
Amount | | | Cost | | | Value | |
Fannie Mae 15 Yr. Pool | | | 2.500 | % | | | TBA | | | | (2,491,000 | ) | | $ | (2,571,568 | ) | | $ | (2,577,162 | ) |
Fannie Mae 15 Yr. Pool | | | 2.500 | % | | | TBA | | | | (9,900,000 | ) | | | (10,184,385 | ) | | | (10,226,964 | ) |
Fannie Mae 15 Yr. Pool | | | 3.000 | % | | | TBA | | | | (13,730,000 | ) | | | (14,357,847 | ) | | | (14,393,975 | ) |
Fannie Mae 15 Yr. Pool | | | 3.500 | % | | | TBA | | | | (53,505,000 | ) | | | (56,395,693 | ) | | | (56,695,214 | ) |
Fannie Mae 15 Yr. Pool | | | 4.000 | % | | | TBA | | | | (1,822,000 | ) | | | (1,892,603 | ) | | | (1,887,763 | ) |
Fannie Mae 30 Yr. Pool | | | 3.000 | % | | | TBA | | | | (44,300,000 | ) | | | (45,551,641 | ) | | | (45,890,290 | ) |
Fannie Mae 30 Yr. Pool | | | 3.000 | % | | | TBA | | | | (44,713,500 | ) | | | (46,059,083 | ) | | | (46,402,472 | ) |
Fannie Mae 30 Yr. Pool | | | 4.500 | % | | | TBA | | | | (10,376,000 | ) | | | (11,285,964 | ) | | | (11,325,999 | ) |
Fannie Mae 30 Yr. Pool | | | 5.000 | % | | | TBA | | | | (8,700,000 | ) | | | (9,661,078 | ) | | | (9,663,519 | ) |
Fannie Mae 30 Yr. Pool | | | 5.000 | % | | | TBA | | | | (10,236,000 | ) | | | (11,336,370 | ) | | | (11,372,829 | ) |
Fannie Mae 30 Yr. Pool | | | 6.000 | % | | | TBA | | | | (279,000 | ) | | | (318,060 | ) | | | (319,057 | ) |
Fannie Mae 30 Yr. Pool | | | 6.500 | % | | | TBA | | | | (1,723,000 | ) | | | (1,976,604 | ) | | | (1,985,991 | ) |
Freddie Mac 15 Yr. Gold Pool | | | 2.500 | % | | | TBA | | | | (9,250,000 | ) | | | (9,550,203 | ) | | | (9,565,509 | ) |
Freddie Mac 30 Yr. Gold Pool | | | 3.500 | % | | | TBA | | | | (47,085,000 | ) | | | (49,235,126 | ) | | | (49,637,892 | ) |
Ginnie Mae I 30 Yr. Pool | | | 3.500 | % | | | TBA | | | | (9,297,000 | ) | | | (9,830,125 | ) | | | (9,868,620 | ) |
Ginnie Mae I 30 Yr. Pool | | | 4.500 | % | | | TBA | | | | (3,100,000 | ) | | | (3,392,563 | ) | | | (3,411,437 | ) |
Ginnie Mae II 30 Yr. Pool | | | 4.500 | % | | | TBA | | | | (9,592,000 | ) | | | (10,281,425 | ) | | | (10,293,365 | ) |
Ginnie Mae II 30 Yr. Pool | | | 5.000 | % | | | TBA | | | | (1,200,000 | ) | | | (1,295,250 | ) | | | (1,301,962 | ) |
| | | | | | | | | | | | | | | | | | | | |
Totals | | | $ | (295,175,588 | ) | | $ | (296,820,020 | ) |
| | | | | | | | | | | | | | | | | | | | |
Forward Foreign Currency Exchange Contracts
| | | | | | | | | | | | | | | | | | | | | | |
Contracts to Buy | | | Counterparty | | Settlement
Date | | | In Exchange
for | | | Unrealized
Appreciation/
(Depreciation) | |
| AUD | | | 26,150,000 | | | Bank of America N.A. | | | 09/21/16 | | | $ | | | | | 19,334,656 | | | $ | 113,275 | |
| AUD | | | 25,640,000 | | | Morgan Stanley & Co. International plc | | | 09/21/16 | | | | | | | | 18,972,318 | | | | 96,323 | |
| BRL | | | 2,214,458 | | | Goldman Sachs International | | | 07/05/16 | | | | | | | | 641,500 | | | | 47,868 | |
| BRL | | | 2,753,420 | | | Goldman Sachs International | | | 07/05/16 | | | | | | | | 857,817 | | | | (668 | ) |
| BRL | | | 3,266,093 | | | Goldman Sachs International | | | 07/05/16 | | | | | | | | 915,000 | | | | 101,746 | |
| BRL | | | 3,972,660 | | | Goldman Sachs International | | | 07/05/16 | | | | | | | | 1,095,000 | | | | 141,703 | |
| BRL | | | 4,291,635 | | | Goldman Sachs International | | | 07/05/16 | | | | | | | | 1,337,041 | | | | (1,041 | ) |
| BRL | | | 10,782,794 | | | Goldman Sachs International | | | 07/05/16 | | | | | | | | 3,359,335 | | | | (2,614 | ) |
| BRL | | | 8,493,130 | | | HSBC Bank plc | | | 07/05/16 | | | | | | | | 2,355,800 | | | | 288,141 | |
| BRL | | | 2,246,533 | | | JPMorgan Chase Bank N.A. | | | 07/05/16 | | | | | | | | 641,500 | | | | 57,853 | |
| BRL | | | 4,350,653 | | | Morgan Stanley & Co. International plc | | | 07/05/16 | | | | | | | | 1,355,428 | | | | (1,055 | ) |
| BRL | | | 4,362,200 | | | Morgan Stanley & Co. International plc | | | 07/05/16 | | | | | | | | 1,283,000 | | | | 74,968 | |
| BRL | | | 300,732 | | | Royal Bank of Scotland plc | | | 07/05/16 | | | | | | | | 83,398 | | | | 10,221 | |
| BRL | | | 3,296,880 | | | Royal Bank of Scotland plc | | | 07/05/16 | | | | | | | | 912,000 | | | | 114,330 | |
| BRL | | | 4,826,595 | | | Royal Bank of Scotland plc | | | 07/05/16 | | | | | | | | 1,503,706 | | | | (1,170 | ) |
| BRL | | | 13,597,650 | | | Goldman Sachs International | | | 07/06/16 | | | | | | | | 4,020,000 | | | | 211,725 | |
| BRL | | | 13,645,890 | | | Royal Bank of Scotland plc | | | 07/06/16 | | | | | | | | 4,020,000 | | | | 226,737 | |
| BRL | | | 4,324,865 | | | Goldman Sachs International | | | 08/02/16 | | | | | | | | 1,283,000 | | | | 51,670 | |
| BRL | | | 10,866,284 | | | Goldman Sachs International | | | 08/02/16 | | | | | | | | 3,223,556 | | | | 129,822 | |
| CAD | | | 1,070,015 | | | Deutsche Bank AG | | | 07/14/16 | | | | | | | | 824,500 | | | | 3,749 | |
| CAD | | | 1,064,336 | | | Royal Bank of Canada | | | 07/14/16 | | | | | | | | 824,500 | | | | (647 | ) |
| CAD | | | 535,599 | | | Royal Bank of Scotland plc | | | 07/14/16 | | | | | | | | 412,250 | | | | 2,332 | |
See accompanying notes to financial statements.
MSF-28
Metropolitan Series Fund
BlackRock Bond Income Portfolio
Schedule of Investments as of June 30, 2016
Forward Foreign Currency Exchange Contracts—(Continued)
| | | | | | | | | | | | | | | | | | | | | | |
Contracts to Buy | | | Counterparty | | Settlement
Date | | | In Exchange
for | | | Unrealized
Appreciation/
(Depreciation) | |
| CNY | | | 17,019,975 | | | BNP Paribas S.A. | | | 07/11/16 | | | $ | | | | | 2,550,000 | | | $ | 11,256 | |
| CNY | | | 102,218,015 | | | HSBC Bank plc | | | 07/29/16 | | | | | | | | 15,295,000 | | | | 77,656 | |
| CNY | | | 186,028,770 | | | JPMorgan Chase Bank N.A. | | | 07/29/16 | | | | | | | | 27,780,000 | | | | 197,028 | |
| CNY | | | 40,954,525 | | | Morgan Stanley & Co. International plc | | | 07/29/16 | | | | | | | | 6,230,000 | | | | (70,814 | ) |
| COP | | | 2,203,902,720 | | | Credit Suisse International | | | 07/05/16 | | | | | | | | 729,600 | | | | 24,935 | |
| COP | | | 2,292,687,744 | | | Credit Suisse International | | | 07/05/16 | | | | | | | | 785,433 | | | | (502 | ) |
| COP | | | 5,407,650,000 | | | BNP Paribas S.A. | | | 07/06/16 | | | | | | | | 1,830,000 | | | | 20,961 | |
| COP | | | 5,459,805,000 | | | BNP Paribas S.A. | | | 07/06/16 | | | | | | | | 1,830,000 | | | | 38,813 | |
| COP | | | 6,528,828,000 | | | Credit Suisse International | | | 07/06/16 | | | | | | | | 2,190,000 | | | | 44,724 | |
| COP | | | 6,473,640,000 | | | HSBC Bank plc | | | 07/06/16 | | | | | | | | 2,190,000 | | | | 25,834 | |
| COP | | | 2,707,937,500 | | | Credit Suisse International | | | 08/01/16 | | | | | | | | 925,000 | | | | (3,651 | ) |
| COP | | | 2,736,150,000 | | | Credit Suisse International | | | 08/01/16 | | | | | | | | 925,000 | | | | 5,948 | |
| COP | | | 3,778,152,000 | | | Standard Chartered Bank | | | 08/01/16 | | | | | | | | 1,290,000 | | | | (4,521 | ) |
| COP | | | 5,463,050,000 | | | Standard Chartered Bank | | | 08/01/16 | | | | | | | | 1,850,000 | | | | 8,749 | |
| EUR | | | 7,277,702 | | | Morgan Stanley & Co. International plc | | | 07/05/16 | | | | | | | | 8,040,000 | | | | 36,428 | |
| EUR | | | 8,040,000 | | | Morgan Stanley & Co. International plc | | | 07/05/16 | | | | | | | | 8,882,313 | | | | 40,076 | |
| EUR | | | 2,283,750 | | | Goldman Sachs International | | | 07/13/16 | | | | | | | | 2,614,058 | | | | (78,978 | ) |
| EUR | | | 1,316,000 | | | Royal Bank of Scotland plc | | | 07/14/16 | | | | | | | | 1,487,376 | | | | (26,494 | ) |
| EUR | | | 2,309,704 | | | Royal Bank of Scotland plc | | | 08/12/16 | | | | | | | | 2,614,342 | | | | (47,633 | ) |
| EUR | | | 1,142,208 | | | Citibank N.A. | | | 08/16/16 | | | | | | | | 1,283,414 | | | | (13,938 | ) |
| EUR | | | 1,316,000 | | | Deutsche Bank AG | | | 08/16/16 | | | | | | | | 1,491,901 | | | | (29,269 | ) |
| EUR | | | 846,450 | | | JPMorgan Chase Bank N.A. | | | 08/16/16 | | | | | | | | 939,339 | | | | 1,424 | |
| EUR | | | 364,967 | | | Morgan Stanley & Co. International plc | | | 08/16/16 | | | | | | | | 404,673 | | | | 959 | |
| EUR | | | 365,689 | | | Morgan Stanley & Co. International plc | | | 08/16/16 | | | | | | | | 405,484 | | | | 951 | |
| EUR | | | 584,741 | | | Morgan Stanley & Co. International plc | | | 08/16/16 | | | | | | | | 662,577 | | | | (12,683 | ) |
| EUR | | | 948,096 | | | Morgan Stanley & Co. International plc | | | 08/16/16 | | | | | | | | 1,069,668 | | | | (15,933 | ) |
| EUR | | | 2,283,750 | | | Royal Bank of Scotland plc | | | 08/16/16 | | | | | | | | 2,584,803 | | | | (46,593 | ) |
| GBP | | | 5,862,532 | | | JPMorgan Chase Bank N.A. | | | 07/05/16 | | | | | | | | 8,040,000 | | | | (235,507 | ) |
| IDR | | | 53,385,600,000 | | | JPMorgan Chase Bank N.A. | | | 07/11/16 | | | | | | | | 4,020,000 | | | | 17,133 | |
| IDR | | | 53,397,660,000 | | | Standard Chartered Bank | | | 07/11/16 | | | | | | | | 4,020,000 | | | | 18,045 | |
| IDR | | | 108,379,200,000 | | | Standard Chartered Bank | | | 07/11/16 | | | | | | | | 8,223,005 | | | | (27,139 | ) |
| IDR | | | 25,543,954,500 | | | BNP Paribas S.A. | | | 07/13/16 | | | | | | | | 1,905,000 | | | | 26,119 | |
| INR | | | 94,444,100 | | | JPMorgan Chase Bank N.A. | | | 07/13/16 | | | | | | | | 1,405,000 | | | | (7,676 | ) |
| INR | | | 128,995,180 | | | JPMorgan Chase Bank N.A. | | | 07/14/16 | | | | | | | | 1,919,000 | | | | (10,817 | ) |
| JPY | | | 823,388,460 | | | Goldman Sachs International | | | 07/05/16 | | | | | | | | 8,040,000 | | | | (66,452 | ) |
| JPY | | | 150,524,201 | | | Citibank N.A. | | | 07/14/16 | | | | | | | | 1,404,000 | | | | 54,036 | |
| JPY | | | 489,269,289 | | | Standard Chartered Bank | | | 07/14/16 | | | | | | | | 4,564,000 | | | | 175,252 | |
| JPY | | | 636,435,278 | | | Royal Bank of Scotland plc | | | 08/16/16 | | | | | | | | 5,968,000 | | | | 203,035 | |
| KRW | | | 2,690,719,200 | | | Morgan Stanley & Co. International plc | | | 07/14/16 | | | | | | | | 2,325,600 | | | | 10,134 | |
| KRW | | | 1,359,313,200 | | | Standard Chartered Bank | | | 07/14/16 | | | | | | | | 1,162,800 | | | | 17,180 | |
| MXN | | | 31,187,389 | | | JPMorgan Chase Bank N.A. | | | 07/05/16 | | | | | | | | 1,798,000 | | | | (92,144 | ) |
| MXN | | | 41,638,435 | | | JPMorgan Chase Bank N.A. | | | 07/05/16 | | | | | | | | 2,275,200 | | | | 2,296 | |
| MXN | | | 21,187,451 | | | Citibank N.A. | | | 07/06/16 | | | | | | | | 1,146,222 | | | | 12,559 | |
| MXN | | | 22,038,667 | | | HSBC Bank plc | | | 07/06/16 | | | | | | | | 1,221,448 | | | | (16,112 | ) |
| MXN | | | 20,427,631 | | | Morgan Stanley & Co. International plc | | | 07/06/16 | | | | | | | | 1,098,000 | | | | 19,225 | |
| MXN | | | 6,691,047 | | | State Street Bank and Trust | | | 07/06/16 | | | | | | | | 362,000 | | | | 3,946 | |
| MXN | | | 19,627,513 | | | UBS AG | | | 07/06/16 | | | | | | | | 1,053,594 | | | | 19,871 | |
| MXN | | | 20,298,858 | | | Goldman Sachs International | | | 07/07/16 | | | | | | | | 1,098,000 | | | | 12,079 | |
| MXN | | | 20,981,266 | | | Goldman Sachs International | | | 07/07/16 | | | | | | | | 1,103,000 | | | | 44,397 | |
| MXN | | | 20,154,555 | | | Royal Bank of Scotland plc | | | 07/08/16 | | | | | | | | 1,090,186 | | | | 11,899 | |
| MXN | | | 6,421,813 | | | BNP Paribas S.A. | | | 07/13/16 | | | | | | | | 347,096 | | | | 3,895 | |
| MXN | | | 23,375,895 | | | Citibank N.A. | | | 07/13/16 | | | | | | | | 1,258,057 | | | | 19,579 | |
| MXN | | | 25,496,297 | | | Citibank N.A. | | | 07/13/16 | | | | | | | | 1,372,311 | | | | 21,218 | |
| MXN | | | 34,612,288 | | | Goldman Sachs International | | | 07/13/16 | | | | | | | | 1,870,712 | | | | 21,063 | |
| MXN | | | 48,710,915 | | | Royal Bank of Scotland plc | | | 07/13/16 | | | | | | | | 2,620,557 | | | | 41,795 | |
| MXN | | | 37,473,313 | | | State Street Bank and Trust | | | 07/13/16 | | | | | | | | 2,009,289 | | | | 38,859 | |
| MXN | | | 21,115,485 | | | Goldman Sachs International | | | 07/20/16 | | | | | | | | 1,140,701 | | | | 12,642 | |
See accompanying notes to financial statements.
MSF-29
Metropolitan Series Fund
BlackRock Bond Income Portfolio
Schedule of Investments as of June 30, 2016
Forward Foreign Currency Exchange Contracts—(Continued)
| | | | | | | | | | | | | | | | | | | | | | |
Contracts to Buy | | | Counterparty | | Settlement
Date | | | In Exchange
for | | | Unrealized
Appreciation/
(Depreciation) | |
| MXN | | | 21,347,814 | | | HSBC Bank plc | | | 07/20/16 | | | $ | | | | | 1,181,876 | | | $ | (15,844 | ) |
| MXN | | | 10,349,430 | | | BNP Paribas S.A. | | | 07/28/16 | | | | | | | | 546,000 | | | | 18,874 | |
| MXN | | | 36,015,859 | | | Citibank N.A. | | | 08/16/16 | | | | | | | | 1,930,200 | | | | 31,889 | |
| MXN | | | 20,686,607 | | | Deutsche Bank AG | | | 08/16/16 | | | | | | | | 1,103,000 | | | | 23,975 | |
| MXN | | | 20,943,985 | | | Deutsche Bank AG | | | 08/16/16 | | | | | | | | 1,099,000 | | | | 41,996 | |
| MXN | | | 20,478,586 | | | Royal Bank of Scotland plc | | | 08/16/16 | | | | | | | | 1,092,000 | | | | 23,642 | |
| MYR | | | 2,863,179 | | | JPMorgan Chase Bank N.A. | | | 07/14/16 | | | | | | | | 702,500 | | | | 7,265 | |
| PLN | | | 14,555,261 | | | BNP Paribas S.A. | | | 08/16/16 | | | | | | | | 3,677,660 | | | | 7,838 | |
| PLN | | | 13,778,163 | | | JPMorgan Chase Bank N.A. | | | 08/16/16 | | | | | | | | 3,557,445 | | | | (68,714 | ) |
| PLN | | | 31,738,385 | | | Royal Bank of Scotland plc | | | 08/16/16 | | | | | | | | 7,926,917 | | | | 109,474 | |
| PLN | | | 32,180,557 | | | State Street Bank and Trust | | | 08/16/16 | | | | | | | | 8,304,660 | | | | (156,308 | ) |
| RUB | | | 75,447,800 | | | Deutsche Bank AG | | | 07/06/16 | | | | | | | | 1,132,000 | | | | 47,547 | |
| RUB | | | 76,296,800 | | | Deutsche Bank AG | | | 07/06/16 | | | | | | | | 1,132,000 | | | | 60,820 | |
| RUB | | | 61,034,220 | | | BNP Paribas S.A. | | | 07/14/16 | | | | | | | | 936,000 | | | | 16,172 | |
| RUB | | | 123,398,303 | | | BNP Paribas S.A. | | | 07/14/16 | | | | | | | | 1,881,000 | | | | 44,090 | |
| RUB | | | 123,976,710 | | | Deutsche Bank AG | | | 07/14/16 | | | | | | | | 1,881,000 | | | | 53,114 | |
| RUB | | | 88,217,640 | | | Deutsche Bank AG | | | 08/16/16 | | | | | | | | 1,323,000 | | | | 41,506 | |
| SEK | | | 68,616,584 | | | BNP Paribas S.A. | | | 07/05/16 | | | | | | | | 8,040,000 | | | | 70,036 | |
| TRY | | | 11,693,070 | | | Deutsche Bank AG | | | 07/01/16 | | | | | | | | 4,020,000 | | | | 45,034 | |
| TRY | | | 11,676,420 | | | Morgan Stanley & Co. International plc | | | 07/01/16 | | | | | | | | 4,020,000 | | | | 39,245 | |
| TRY | | | 3,328,501 | | | BNP Paribas S.A. | | | 07/08/16 | | | | | | | | 1,124,000 | | | | 30,972 | |
| TRY | | | 2,251,670 | | | Morgan Stanley & Co. International plc | | | 07/08/16 | | | | | | | | 775,000 | | | | 6,317 | |
| TRY | | | 3,969,969 | | | HSBC Bank plc | | | 07/22/16 | | | | | | | | 1,354,400 | | | | 18,683 | |
| TRY | | | 2,000,042 | | | Royal Bank of Scotland plc | | | 07/22/16 | | | | | | | | 677,200 | | | | 14,549 | |
| ZAR | | | 22,118,833 | | | BNP Paribas S.A. | | | 07/08/16 | | | | | | | | 1,444,800 | | | | 56,113 | |
| ZAR | | | 14,416,008 | | | Goldman Sachs International | | | 07/08/16 | | | | | | | | 963,200 | | | | 15,024 | |
| ZAR | | | 17,585,807 | | | Morgan Stanley & Co. International plc | | | 07/08/16 | | | | | | | | 1,157,540 | | | | 35,777 | |
| ZAR | | | 12,805,677 | | | Citibank N.A. | | | 07/13/16 | | | | | | | | 855,000 | | | | 13,076 | |
| ZAR | | | 12,948,197 | | | Goldman Sachs International | | | 07/13/16 | | | | | | | | 855,000 | | | | 22,737 | |
| | | | |
Contracts to Deliver | | | | | | | | | | | | |
| AUD | | | 51,790,000 | | | State Street Bank and Trust | | | 09/21/16 | | | | | | | | 38,063,837 | | | | (452,734 | ) |
| BRL | | | 10,782,794 | | | Goldman Sachs International | | | 07/05/16 | | | | | | | | 3,223,556 | | | | (133,165 | ) |
| BRL | | | 4,291,635 | | | Goldman Sachs International | | | 07/05/16 | | | | | | | | 1,283,000 | | | | (53,001 | ) |
| BRL | | | 3,972,660 | | | Goldman Sachs International | | | 07/05/16 | | | | | | | | 1,237,666 | | | | 963 | |
| BRL | | | 3,266,093 | | | Goldman Sachs International | | | 07/05/16 | | | | | | | | 1,017,538 | | | | 792 | |
| BRL | | | 2,214,458 | | | Goldman Sachs International | | | 07/05/16 | | | | | | | | 689,905 | | | | 537 | |
| BRL | | | 2,753,420 | | | Goldman Sachs International | | | 07/05/16 | | | | | | | | 756,642 | | | | (100,507 | ) |
| BRL | | | 8,493,130 | | | HSBC Bank plc | | | 07/05/16 | | | | | | | | 2,646,000 | | | | 2,059 | |
| BRL | | | 2,246,533 | | | JPMorgan Chase Bank N.A. | | | 07/05/16 | | | | | | | | 699,898 | | | | 545 | |
| BRL | | | 4,362,200 | | | Morgan Stanley & Co. International plc | | | 07/05/16 | | | | | | | | 1,359,025 | | | | 1,058 | |
| BRL | | | 4,350,653 | | | Morgan Stanley & Co. International plc | | | 07/05/16 | | | | | | | | 1,283,000 | | | | (71,373 | ) |
| BRL | | | 4,826,595 | | | Royal Bank of Scotland plc | | | 07/05/16 | | | | | | | | 1,381,000 | | | | (121,536 | ) |
| BRL | | | 3,296,880 | | | Royal Bank of Scotland plc | | | 07/05/16 | | | | | | | | 1,027,129 | | | | 799 | |
| BRL | | | 300,732 | | | Royal Bank of Scotland plc | | | 07/05/16 | | | | | | | | 93,692 | | | | 73 | |
| BRL | | | 27,738,000 | | | Morgan Stanley & Co. International plc | | | 07/06/16 | | | | | | | | 8,040,000 | | | | (592,343 | ) |
| CAD | | | 1,056,188 | | | Morgan Stanley & Co. International plc | | | 07/14/16 | | | | | | | | 824,500 | | | | 6,954 | |
| CNY | | | 80,424,663 | | | Bank of America N.A. | | | 07/29/16 | | | | | | | | 11,913,000 | | | | (182,135 | ) |
| CNY | | | 129,052,822 | | | Barclays Bank plc | | | 07/29/16 | | | | | | | | 19,576,000 | | | | 167,634 | |
| CNY | | | 138,751,620 | | | HSBC Bank plc | | | 07/29/16 | | | | | | | | 20,400,000 | | | | (466,976 | ) |
| CNY | | | 84,881,700 | | | Standard Chartered Bank | | | 07/29/16 | | | | | | | | 12,745,000 | | | | (20,432 | ) |
| CNY | | | 60,305,616 | | | Deutsche Bank AG | | | 11/07/16 | | | | | | | | 9,135,000 | | | | 95,258 | |
| COP | | | 2,292,687,744 | | | Credit Suisse International | | | 07/05/16 | | | | | | | | 729,600 | | | | (55,332 | ) |
| COP | | | 2,203,902,720 | | | Credit Suisse International | | | 07/05/16 | | | | | | | | 755,017 | | | | 482 | |
| COP | | | 4,238,700,000 | | | BNP Paribas S.A. | | | 07/06/16 | | | | | | | | 1,420,000 | | | | (30,846 | ) |
| COP | | | 10,670,708,400 | | | Credit Suisse International | | | 07/06/16 | | | | | | | | 3,560,000 | | | | (92,430 | ) |
See accompanying notes to financial statements.
MSF-30
Metropolitan Series Fund
BlackRock Bond Income Portfolio
Schedule of Investments as of June 30, 2016
Forward Foreign Currency Exchange Contracts—(Continued)
| | | | | | | | | | | | | | | | | | | | | | |
Contracts to Deliver | | | Counterparty | | Settlement
Date | | | In Exchange
for | | | Unrealized
Appreciation/
(Depreciation) | |
| COP | | | 4,260,750,000 | | | HSBC Bank plc | | | 07/06/16 | | | $ | | | | | 1,425,000 | | | $ | (33,394 | ) |
| COP | | | 4,880,475,000 | | | Royal Bank of Scotland plc | | | 07/06/16 | | | | | | | | 1,635,000 | | | | (35,517 | ) |
| EUR | | | 3,553,305 | | | Citibank N.A. | | | 07/05/16 | | | | | | | | 4,020,000 | | | | 76,720 | |
| EUR | | | 8,040,000 | | | Morgan Stanley & Co. International plc | | | 07/05/16 | | | | | | | | 8,903,851 | | | | (18,537 | ) |
| EUR | | | 3,560,130 | | | Morgan Stanley & Co. International plc | | | 07/05/16 | | | | | | | | 4,020,000 | | | | 69,147 | |
| EUR | | | 20,156,000 | | | Barclays Bank plc | | | 07/06/16 | | | | | | | | 22,507,601 | | | | 138,735 | |
| EUR | | | 160,000 | | | Citibank N.A. | | | 07/06/16 | | | | | | | | 179,151 | | | | 1,585 | |
| EUR | | | 670,000 | | | Morgan Stanley & Co. International plc | | | 07/06/16 | | | | | | | | 747,864 | | | �� | 4,307 | |
| EUR | | | 50,000 | | | Morgan Stanley & Co. International plc | | | 07/06/16 | | | | | | | | 56,644 | | | | 1,155 | |
| EUR | | | 100,000 | | | State Street Bank and Trust | | | 07/06/16 | | | | | | | | 113,580 | | | | 2,601 | |
| EUR | | | 70,000 | | | State Street Bank and Trust | | | 07/06/16 | | | | | | | | 78,051 | | | | 366 | |
| EUR | | | 15,000 | | | State Street Bank and Trust | | | 07/06/16 | | | | | | | | 17,119 | | | | 473 | |
| EUR | | | 2,283,750 | | | Royal Bank of Scotland plc | | | 07/13/16 | | | | | | | | 2,581,974 | | | | 46,894 | |
| EUR | | | 1,316,000 | | | Morgan Stanley & Co. International plc | | | 07/14/16 | | | | | | | | 1,497,376 | | | | 36,493 | |
| EUR | | | 21,221,000 | | | Morgan Stanley & Co. International plc | | | 08/03/16 | | | | | | | | 23,578,653 | | | | 3,684 | |
| EUR | | | 133,000 | | | Morgan Stanley & Co. International plc | | | 08/03/16 | | | | | | | | 147,661 | | | | (92 | ) |
| EUR | | | 2,309,704 | | | Royal Bank of Scotland plc | | | 08/12/16 | | | | | | | | 2,639,493 | | | | 72,783 | |
| EUR | | | 210,058 | | | Goldman Sachs International | | | 08/16/16 | | | | | | | | 232,870 | | | | (594 | ) |
| EUR | | | 397,020 | | | HSBC Bank plc | | | 08/16/16 | | | | | | | | 441,545 | | | | 288 | |
| EUR | | | 228,611 | | | Morgan Stanley & Co. International plc | | | 08/16/16 | | | | | | | | 251,387 | | | | (2,696 | ) |
| EUR | | | 2,309,704 | | | Royal Bank of Scotland plc | | | 08/16/16 | | | | | | | | 2,614,675 | | | | 47,619 | |
| EUR | | | 2,053,435 | | | Royal Bank of Scotland plc | | | 08/16/16 | | | | | | | | 2,323,381 | | | | 41,148 | |
| EUR | | | 1,639,127 | | | Royal Bank of Scotland plc | | | 08/16/16 | | | | | | | | 1,854,574 | | | | 32,812 | |
| EUR | | | 1,316,000 | | | Royal Bank of Scotland plc | | | 08/16/16 | | | | | | | | 1,488,949 | | | | 26,317 | |
| EUR | | | 846,450 | | | Royal Bank of Scotland plc | | | 08/16/16 | | | | | | | | 933,238 | | | | (7,525 | ) |
| GBP | | | 2,733,937 | | | HSBC Bank plc | | | 07/05/16 | | | | | | | | 4,020,000 | | | | 380,448 | |
| GBP | | | 2,735,414 | | | Northern Trust Company | | | 07/05/16 | | | | | | | | 4,020,000 | | | | 378,482 | |
| GBP | | | 1,869,000 | | | Barclays Bank plc | | | 07/06/16 | | | | | | | | 2,737,156 | | | | 249,040 | |
| GBP | | | 70,000 | | | Morgan Stanley & Co. International plc | | | 07/15/16 | | | | | | | | 95,830 | | | | 2,637 | |
| GBP | | | 753,000 | | | Royal Bank of Scotland plc | | | 08/03/16 | | | | | | | | 1,013,990 | | | | 11,308 | |
| GBP | | | 685,000 | | | BNP Paribas S.A. | | | 08/16/16 | | | | | | | | 925,293 | | | | 13,051 | |
| GBP | | | 685,000 | | | BNP Paribas S.A. | | | 08/16/16 | | | | | | | | 925,326 | | | | 13,084 | |
| GBP | | | 80,000 | | | Barclays Bank plc | | | 08/16/16 | | | | | | | | 107,970 | | | | 1,431 | |
| GBP | | | 913,500 | | | Citibank N.A. | | | 08/16/16 | | | | | | | | 1,212,012 | | | | (4,532 | ) |
| GBP | | | 685,000 | | | Deutsche Bank AG | | | 08/16/16 | | | | | | | | 923,179 | | | | 10,937 | |
| GBP | | | 680,000 | | | JPMorgan Chase Bank N.A. | | | 08/16/16 | | | | | | | | 919,042 | | | | 13,459 | |
| GBP | | | 600,000 | | | JPMorgan Chase Bank N.A. | | | 08/16/16 | | | | | | | | 809,954 | | | | 10,910 | |
| GBP | | | 275,000 | | | Royal Bank of Scotland plc | | | 08/16/16 | | | | | | | | 371,506 | | | | 5,277 | |
| IDR | | | 53,385,600,000 | | | JPMorgan Chase Bank N.A. | | | 07/11/16 | | | | | | | | 4,050,501 | | | | 13,368 | |
| IDR | | | 108,379,200,000 | | | Standard Chartered Bank | | | 07/11/16 | | | | | | | | 8,040,000 | | | | (155,866 | ) |
| IDR | | | 53,397,660,000 | | | Standard Chartered Bank | | | 07/11/16 | | | | | | | | 4,051,416 | | | | 13,371 | |
| IDR | | | 8,472,805,000 | | | HSBC Bank plc | | | 07/13/16 | | | | | | | | 635,000 | | | | (5,543 | ) |
| IDR | | | 16,948,150,000 | | | JPMorgan Chase Bank N.A. | | | 07/13/16 | | | | | | | | 1,270,000 | | | | (11,277 | ) |
| IDR | | | 86,269,196,895 | | | Nomura International plc | | | 08/22/16 | | | | | | | | 6,421,228 | | | | (56,122 | ) |
| INR | | | 95,863,150 | | | Standard Chartered Bank | | | 07/13/16 | | | | | | | | 1,405,000 | | | | (13,319 | ) |
| INR | | | 69,165,160 | | | Citibank N.A. | | | 07/14/16 | | | | | | | | 1,021,567 | | | | (1,571 | ) |
| INR | | | 60,756,248 | | | HSBC Bank plc | | | 07/14/16 | | | | | | | | 897,434 | | | | (1,314 | ) |
| JPY | | | 419,319,928 | | | Citibank N.A. | | | 07/05/16 | | | | | | | | 4,020,000 | | | | (40,620 | ) |
| JPY | | | 420,523,557 | | | Morgan Stanley & Co. International plc | | | 07/05/16 | | | | | | | | 4,020,000 | | | | (52,276 | ) |
| JPY | | | 637,052,966 | | | Royal Bank of Scotland plc | | | 07/14/16 | | | | | | | | 5,968,000 | | | | (202,742 | ) |
| JPY | | | 178,767,600 | | | BNP Paribas S.A. | | | 08/16/16 | | | | | | | | 1,740,000 | | | | 6,625 | |
| JPY | | | 127,967,792 | | | BNP Paribas S.A. | | | 08/16/16 | | | | | | | | 1,244,000 | | | | 3,192 | |
| JPY | | | 127,864,540 | | | Goldman Sachs International | | | 08/16/16 | | | | | | | | 1,244,000 | | | | 4,194 | |
| JPY | | | 178,976,400 | | | Morgan Stanley & Co. International plc | | | 08/16/16 | | | | | | | | 1,740,000 | | | | 4,600 | |
| KRW | | | 6,761,972,700 | | | JPMorgan Chase Bank N.A. | | | 07/14/16 | | | | | | | | 5,814,000 | | | | (55,870 | ) |
| MXN | | | 35,867,748 | | | Citibank N.A. | | | 07/05/16 | | | | | | | | 1,930,200 | | | | (31,657 | ) |
| MXN | | | 16,356,136 | | | Goldman Sachs International | | | 07/05/16 | | | | | | | | 899,000 | | | | 4,369 | |
See accompanying notes to financial statements.
MSF-31
Metropolitan Series Fund
BlackRock Bond Income Portfolio
Schedule of Investments as of June 30, 2016
Forward Foreign Currency Exchange Contracts—(Continued)
| | | | | | | | | | | | | | | | | | | | | | |
Contracts to Deliver | | | Counterparty | | Settlement
Date | | | In Exchange
for | | | Unrealized
Appreciation/
(Depreciation) | |
| MXN | | | 22,766,444 | | | JPMorgan Chase Bank N.A. | | | 07/05/16 | | | $ | | | | | 1,244,000 | | | $ | (1,255 | ) |
| MXN | | | 21,361,055 | | | BNP Paribas S.A. | | | 07/06/16 | | | | | | | | 1,191,292 | | | | 23,016 | |
| MXN | | | 21,187,451 | | | BNP Paribas S.A. | | | 07/06/16 | | | | | | | | 1,181,610 | | | | 22,829 | |
| MXN | | | 27,255,508 | | | Citibank N.A. | | | 07/06/16 | | | | | | | | 1,460,000 | | | | (30,654 | ) |
| MXN | | | 44,297,000 | | | HSBC Bank plc | | | 07/06/16 | | | | | | | | 2,366,798 | | | | (55,887 | ) |
| MXN | | | 20,305,125 | | | UBS AG | | | 07/06/16 | | | | | | | | 1,119,233 | | | | 8,708 | |
| MXN | | | 20,601,487 | | | Deutsche Bank AG | | | 07/07/16 | | | | | | | | 1,103,000 | | | | (23,628 | ) |
| MXN | | | 6,849,214 | | | Deutsche Bank AG | | | 07/07/16 | | | | | | | | 366,000 | | | | (8,561 | ) |
| MXN | | | 6,851,820 | | | Royal Bank of Scotland plc | | | 07/07/16 | | | | | | | | 366,000 | | | | (8,704 | ) |
| MXN | | | 6,847,132 | | | UBS AG | | | 07/07/16 | | | | | | | | 366,000 | | | | (8,447 | ) |
| MXN | | | 20,154,555 | | | State Street Bank and Trust | | | 07/08/16 | | | | | | | | 1,111,117 | | | | 9,033 | |
| MXN | | | 46,753,356 | | | JPMorgan Chase Bank N.A. | | | 07/13/16 | | | | | | | | 2,552,387 | | | | (2,972 | ) |
| MXN | | | 34,970,307 | | | JPMorgan Chase Bank N.A. | | | 07/13/16 | | | | | | | | 1,909,120 | | | | (2,223 | ) |
| MXN | | | 34,612,288 | | | JPMorgan Chase Bank N.A. | | | 07/13/16 | | | | | | | | 1,889,575 | | | | (2,200 | ) |
| MXN | | | 15,273,481 | | | JPMorgan Chase Bank N.A. | | | 07/13/16 | | | | | | | | 833,819 | | | | (971 | ) |
| MXN | | | 24,853,576 | | | Morgan Stanley & Co. International plc | | | 07/13/16 | | | | | | | | 1,341,511 | | | | (16,890 | ) |
| MXN | | | 19,627,513 | | | UBS AG | | | 07/13/16 | | | | | | | | 1,052,825 | | | | (19,940 | ) |
| MXN | | | 15,657,456 | | | Bank of America N.A. | | | 07/19/16 | | | | | | | | 844,560 | | | | (10,740 | ) |
| MXN | | | 14,997,006 | | | Bank of America N.A. | | | 07/19/16 | | | | | | | | 807,840 | | | | (11,383 | ) |
| MXN | | | 21,919,213 | | | State Street Bank and Trust | | | 07/20/16 | | | | | | | | 1,192,728 | | | | (4,514 | ) |
| MXN | | | 20,544,085 | | | State Street Bank and Trust | | | 07/20/16 | | | | | | | | 1,106,339 | | | | (15,793 | ) |
| MXN | | | 21,187,451 | | | Citibank N.A. | | | 08/16/16 | | | | | | | | 1,141,561 | | | | (12,699 | ) |
| MXN | | | 20,989,006 | | | Citibank N.A. | | | 08/16/16 | | | | | | | | 1,099,000 | | | | (44,449 | ) |
| MXN | | | 34,612,288 | | | Goldman Sachs International | | | 08/16/16 | | | | | | | | 1,864,439 | | | | (21,185 | ) |
| MXN | | | 21,115,485 | | | Goldman Sachs International | | | 08/16/16 | | | | | | | | 1,137,669 | | | | (12,670 | ) |
| MXN | | | 20,379,539 | | | Goldman Sachs International | | | 08/16/16 | | | | | | | | 1,098,000 | | | | (12,246 | ) |
| MXN | | | 17,197,696 | | | Goldman Sachs International | | | 08/16/16 | | | | | | | | 917,200 | | | | (19,704 | ) |
| MXN | | | 20,154,555 | | | Royal Bank of Scotland plc | | | 08/16/16 | | | | | | | | 1,085,974 | | | | (12,015 | ) |
| MXN | | | 6,718,590 | | | State Street Bank and Trust | | | 08/16/16 | | | | | | | | 362,000 | | | | (4,019 | ) |
| PLN | | | 107,714,511 | | | Royal Bank of Scotland plc | | | 08/16/16 | | | | | | | | 27,609,088 | | | | 334,987 | |
| PLN | | | 8,150,863 | | | State Street Bank and Trust | | | 08/16/16 | | | | | | | | 2,102,580 | | | | 38,722 | |
| RUB | | | 74,279,576 | | | BNP Paribas S.A. | | | 07/06/16 | | | | | | | | 1,132,000 | | | | (29,283 | ) |
| RUB | | | 73,297,000 | | | Deutsche Bank AG | | | 07/06/16 | | | | | | | | 1,132,000 | | | | (13,921 | ) |
| RUB | | | 109,208,979 | | | Deutsche Bank AG | | | 07/14/16 | | | | | | | | 1,692,900 | | | | (10,828 | ) |
| RUB | | | 62,825,400 | | | Morgan Stanley & Co. International plc | | | 07/14/16 | | | | | | | | 940,500 | | | | (39,615 | ) |
| RUB | | | 60,474,960 | | | Societe Generale | | | 07/14/16 | | | | | | | | 936,000 | | | | (7,447 | ) |
| RUB | | | 20,670,944 | | | JPMorgan Chase Bank N.A. | | | 07/20/16 | | | | | | | | 312,829 | | | | (9,142 | ) |
| RUB | | | 86,259,600 | | | JPMorgan Chase Bank N.A. | | | 08/16/16 | | | | | | | | 1,323,000 | | | | (11,220 | ) |
| SAR | | | 49,208,228 | | | BNP Paribas S.A. | | | 11/23/16 | | | | | | | | 12,902,000 | | | | (171,062 | ) |
| SAR | | | 49,930,847 | | | Citibank N.A. | | | 11/23/16 | | | | | | | | 13,098,333 | | | | (166,706 | ) |
| SAR | | | 36,807,843 | | | Citibank N.A. | | | 11/23/16 | | | | | | | | 9,685,000 | | | | (93,674 | ) |
| SEK | | | 33,279,262 | | | Barclays Bank plc | | | 07/05/16 | | | | | | | | 4,020,000 | | | | 86,607 | |
| SEK | | | 33,150,757 | | | Deutsche Bank AG | | | 07/05/16 | | | | | | | | 4,020,000 | | | | 101,795 | |
| TRY | | | 23,600,455 | | | Morgan Stanley & Co. International plc | | | 07/01/16 | | | | | | | | 8,040,000 | | | | (164,573 | ) |
| TRY | | | 2,251,453 | | | BNP Paribas S.A. | | | 07/08/16 | | | | | | | | 775,000 | | | | (6,242 | ) |
| TRY | | | 3,346,420 | | | Deutsche Bank AG | | | 07/08/16 | | | | | | | | 1,124,000 | | | | (37,189 | ) |
| TRY | | | 5,907,283 | | | Citibank N.A. | | | 07/22/16 | | | | | | | | 2,031,600 | | | | (11,537 | ) |
| TWD | | | 45,290,175 | | | JPMorgan Chase Bank N.A. | | | 07/14/16 | | | | | | | | 1,405,000 | | | | 722 | |
| ZAR | | | 15,665,712 | | | Citibank N.A. | | | 07/08/16 | | | | | | | | 987,224 | | | | (75,801 | ) |
| ZAR | | | 1,750,410 | | | Citibank N.A. | | | 07/08/16 | | | | | | | | 110,256 | | | | (8,522 | ) |
| ZAR | | | 39,157,245 | | | HSBC Bank plc | | | 07/08/16 | | | | | | | | 2,468,060 | | | | (189,026 | ) |
| ZAR | | | 12,726,675 | | | BNP Paribas S.A. | | | 07/13/16 | | | | | | | | 855,000 | | | | (7,721 | ) |
| ZAR | | | 12,600,757 | | | Morgan Stanley & Co. International plc | | | 07/13/16 | | | | | | | | 855,000 | | | | 815 | |
See accompanying notes to financial statements.
MSF-32
Metropolitan Series Fund
BlackRock Bond Income Portfolio
Schedule of Investments as of June 30, 2016
Forward Foreign Currency Exchange Contracts—(Continued)
| | | | | | | | | | | | | | | | | | | | | | |
Cross Currency
Contracts to Buy | | | Counterparty | | Settlement
Date | | | In Exchange
for | | | Unrealized
Appreciation/
(Depreciation) | |
| EUR | | | 1,129,710 | | | Deutsche Bank AG | | | 07/06/16 | | | | RUB | | | | 81,192,262 | | | $ | (15,618 | ) |
| EUR | | | 680,000 | | | Deutsche Bank AG | | | 08/16/16 | | | | RUB | | | | 49,483,600 | | | | (9,620 | ) |
| RUB | | | 85,648,968 | | | Deutsche Bank AG | | | 07/06/16 | | | | EUR | | | | 1,129,710 | | | | 85,294 | |
| RUB | | | 50,060,240 | | | Deutsche Bank AG | | | 08/16/16 | | | | EUR | | | | 680,000 | | | | 18,539 | |
| | | | | | | | | | | | | | | | | | | | | | |
| Net Unrealized Appreciation | | | $ | 1,060,071 | |
| | | | | | | | | | | | | | | | | | | | | | |
Futures Contracts
| | | | | | | | | | | | | | | | | | | | |
Futures Contracts—Long | | Expiration
Date | | | Number of
Contracts | | | Notional
Amount | | | Unrealized
Appreciation/
(Depreciation) | |
U.S. Treasury Long Bond Futures | | | 09/21/16 | | | | 178 | | | | USD | | | | 28,979,226 | | | $ | 1,697,962 | |
U.S. Treasury Note 10 Year Futures | | | 09/21/16 | | | | 374 | | | | USD | | | | 49,555,421 | | | | 180,735 | |
U.S. Treasury Note 2 Year Futures | | | 09/30/16 | | | | 815 | | | | USD | | | | 177,503,829 | | | | 1,248,594 | |
U.S. Treasury Note 5 Year Futures | | | 09/30/16 | | | | 1,787 | | | | USD | | | | 214,810,559 | | | | 3,496,622 | |
U.S. Treasury Ultra Long Bond Futures | | | 09/21/16 | | | | 319 | | | | USD | | | | 55,958,118 | | | | 3,495,507 | |
| | | |
Futures Contracts—Short | | | | | | | | | |
90 Day Eurodollar Futures | | | 12/19/16 | | | | (66 | ) | | | USD | | | | (16,339,038 | ) | | | (49,587 | ) |
Euro-BTP Futures | | | 09/08/16 | | | | (248 | ) | | | EUR | | | | (34,932,188 | ) | | | (482,843 | ) |
Euro-Bobl Futures | | | 09/08/16 | | | | (45 | ) | | | EUR | | | | (5,964,307 | ) | | | (52,927 | ) |
Euro-Bund Futures | | | 09/08/16 | | | | (359 | ) | | | EUR | | | | (59,512,909 | ) | | | (536,199 | ) |
| | | | | | | | | | | | | | | | | | | | |
Net Unrealized Appreciation | | | $ | 8,997,864 | |
| | | | | | | | | | | | | | | | | | | | |
Written Options
| | | | | | | | | | | | | | | | | | | | | | | | | | | | | | |
Foreign Currency Written
Options | | Strike
Price | | | Counterparty | | Expiration
Date | | | Notional
Amount | | | Premiums
Received | | | Market
Value | | | Unrealized
Appreciation/
(Depreciation) | |
GBP Put/USD Call | | | USD | | | | 1.350 | | | Deutsche Bank AG | | | 07/27/16 | | | | (1,420,000 | ) | | $ | (9,287 | ) | | $ | (45,747 | ) | | $ | (36,460 | ) |
GBP Put/USD Call | | | USD | | | | 1.450 | | | HSBC Bank plc | | | 07/27/16 | | | | (1,420,000 | ) | | | (184,194 | ) | | | (171,268 | ) | | | 12,926 | |
USD Call/BRL Put | | | BRL | | | | 3.565 | | | Morgan Stanley & Co. LLC | | | 07/01/16 | | | | (1,900,000 | ) | | | (55,765 | ) | | | — | | | | 55,765 | |
USD Call/CNH Put | | | CNH | | | | 6.750 | | | Deutsche Bank AG | | | 07/29/16 | | | | (51,700,000 | ) | | | (180,950 | ) | | | (144,760 | ) | | | 36,190 | |
USD Call/CNH Put | | | CNH | | | | 7.000 | | | Deutsche Bank AG | | | 08/24/16 | | | | (2,972,000 | ) | | | (7,995 | ) | | | (4,161 | ) | | | 3,834 | |
USD Call/CNH Put | | | CNH | | | | 6.850 | | | Deutsche Bank AG | | | 08/24/16 | | | | (2,972,000 | ) | | | (12,334 | ) | | | (8,619 | ) | | | 3,715 | |
USD Call/CNH Put | | | CNH | | | | 7.100 | | | Deutsche Bank AG | | | 12/15/16 | | | | (2,869,000 | ) | | | (33,280 | ) | | | (17,214 | ) | | | 16,066 | |
USD Call/JPY Put | | | JPY | | | | 114.000 | | | Barclays Bank plc | | | 07/14/16 | | | | (1,579,000 | ) | | | (7,184 | ) | | | (316 | ) | | | 6,868 | |
USD Call/MXN Put | | | MXN | | | | 19.250 | | | JPMorgan Chase Bank N.A. | | | 07/18/16 | | | | (1,456,000 | ) | | | (14,528 | ) | | | (2,038 | ) | | | 12,490 | |
USD Call/MXN Put | | | MXN | | | | 19.250 | | | JPMorgan Chase Bank N.A. | | | 07/18/16 | | | | (2,548,000 | ) | | | (17,202 | ) | | | (3,567 | ) | | | 13,635 | |
| | | | | | | | | | | | | | | | | | | | | | | | | | | | | | |
Totals | | | $ | (522,719 | ) | | $ | (397,690 | ) | | $ | 125,029 | |
| | | | | | | | | | | | | | | | | | | | | | | | | | | | | | |
| | | | | | | | | | | | | | | | | | | | | | | | |
Options on Exchange-Traded Futures Contracts | | Strike
Price | | | Expiration
Date | | | Number of
Contracts | | | Premiums
Received | | | Market
Value | | | Unrealized
Appreciation | |
Call - U.S. Treasury Note 10 Year Futures | | $ | 135.000 | | | | 07/22/16 | | | | (536 | ) | | $ | (104,343 | ) | | $ | (67,000 | ) | | $ | 37,343 | |
| | | | | | | | | | | | | | | | | | | | | | | | |
See accompanying notes to financial statements.
MSF-33
Metropolitan Series Fund
BlackRock Bond Income Portfolio
Schedule of Investments as of June 30, 2016
Swap Agreements
OTC Interest Rate Swaps
| | | | | | | | | | | | | | | | | | | | | | | | | | | | | | |
Pay/Receive
Floating Rate | | Floating
Rate Index | | Fixed
Rate | | | Maturity
Date | | Counterparty | | Notional
Amount | | | Market
Value | | | Upfront
Premium
Paid/(Received) | | | Unrealized
Appreciation/
(Depreciation) | |
Pay | | 1-Day CDI | | | 11.720 | % | | 01/04/21 | | JPMorgan Chase Bank N.A. | | | BRL | | | | 1,306,000 | | | $ | (7,730 | ) | | $ | — | | | $ | (7,730 | ) |
Pay | | 1-Day CDI | | | 12.050 | % | | 01/04/21 | | Bank of America N.A. | | | BRL | | | | 2,737,312 | | | | (7,280 | ) | | | — | | | | (7,280 | ) |
Pay | | 1-Day CDI | | | 12.240 | % | | 01/02/19 | | Bank of America N.A. | | | BRL | | | | 26,565,242 | | | | (5,506 | ) | | | — | | | | (5,506 | ) |
Pay | | 1-Day CDI | | | 12.285 | % | | 01/02/19 | | Bank of America N.A. | | | BRL | | | | 13,067,758 | | | | (2,889 | ) | | | — | | | | (2,889 | ) |
Pay | | 1-Day CDI | | | 12.305 | % | | 01/02/19 | | JPMorgan Chase Bank N.A. | | | BRL | | | | 7,249,381 | | | | 2,147 | | | | — | | | | 2,147 | |
Pay | | 1-Day CDI | | | 12.365 | % | | 01/02/23 | | Citibank N.A. | | | BRL | | | | 3,300,755 | | | | 11,307 | | | | — | | | | 11,307 | |
Pay | | 1-Day CDI | | | 12.410 | % | | 01/04/21 | | Citibank N.A. | | | BRL | | | | 1,000,000 | | | | 893 | | | | — | | | | 893 | |
Pay | | 1-Day CDI | | | 12.462 | % | | 01/02/19 | | Bank of America N.A. | | | BRL | | | | 13,095,515 | | | | 6,106 | | | | — | | | | 6,106 | |
Pay | | 1-Day CDI | | | 12.520 | % | | 01/02/19 | | JPMorgan Chase Bank N.A. | | | BRL | | | | 13,086,872 | | | | 18,800 | | | | — | | | | 18,800 | |
Pay | | 1-Day CDI | | | 12.620 | % | | 01/02/23 | | Bank of America N.A. | | | BRL | | | | 1,960,063 | | | | 10,704 | | | | — | | | | 10,704 | |
Pay | | 1-Day CDI | | | 12.730 | % | | 01/02/23 | | Bank of America N.A. | | | BRL | | | | 1,684,724 | | | | 10,766 | | | | — | | | | 10,766 | |
Pay | | 1-Day CDI | | | 12.738 | % | | 01/04/21 | | JPMorgan Chase Bank N.A. | | | BRL | | | | 5,375,000 | | | | 64,879 | | | | — | | | | 64,879 | |
Pay | | 1-Day CDI | | | 12.750 | % | | 01/04/21 | | Citibank N.A. | | | BRL | | | | 7,849,720 | | | | 46,548 | | | | — | | | | 46,548 | |
Pay | | 1-Day CDI | | | 12.750 | % | | 01/02/23 | | Citibank N.A. | | | BRL | | | | 1,715,408 | | | | 11,253 | | | | — | | | | 11,253 | |
Pay | | 1-Day CDI | | | 12.915 | % | | 01/02/23 | | Bank of America N.A. | | | BRL | | | | 7,357,770 | | | | 58,458 | | | | — | | | | 58,458 | |
Pay | | 1-Day COLIBOR | | | 6.510 | % | | 07/06/16 | | Credit Suisse International | | | COP | | | | 45,368,688,480 | | | | (8,592 | ) | | | — | | | | (8,592 | ) |
Pay | | 1-Day COLIBOR | | | 6.640 | % | | 08/22/16 | | Credit Suisse International | | | COP | | | | 20,737,220,582 | | | | (8,544 | ) | | | — | | | | (8,544 | ) |
Pay | | 28-Day TIIE | | | 6.270 | % | | 12/05/25 | | Bank of America N.A. | | | MXN | | | | 2,209,451 | | | | 2,144 | | | | — | | | | 2,144 | |
Pay | | 28-Day TIIE | | | 6.299 | % | | 06/15/26 | | Goldman Sachs International | | | MXN | | | | 109,756,243 | | | | 102,581 | | | | — | | | | 102,581 | |
Pay | | 28-Day TIIE | | | 6.320 | % | | 07/17/25 | | Morgan Stanley Capital Services, LLC | | | MXN | | | | 40,086,000 | | | | 48,952 | | | | — | | | | 48,952 | |
Pay | | 28-Day TIIE | | | 6.325 | % | | 07/17/25 | | Citibank N.A. | | | MXN | | | | 19,973,500 | | | | 26,103 | | | | — | | | | 26,103 | |
Pay | | 28-Day TIIE | | | 6.330 | % | | 08/06/25 | | Citibank N.A. | | | MXN | | | | 59,593,000 | | | | 78,251 | | | | — | | | | 78,251 | |
Pay | | 3M KLIBOR | | | 1.920 | % | | 11/10/17 | | Deutsche Bank AG | | | KRW | | | | 6,513,071,110 | | | | 52,673 | | | | — | | | | 52,673 | |
Pay | | 7-Day China Fixing Repo Rates | | | 2.725 | % | | 05/12/21 | | Bank of America N.A. | | | CNY | | | | 5,255,000 | | | | 1,298 | | | | — | | | | 1,298 | |
Pay | | 7-Day China Fixing Repo Rates | | | 2.740 | % | | 05/12/21 | | Bank of America N.A. | | | CNY | | | | 8,415,000 | | | | 3,506 | | | | — | | | | 3,506 | |
Pay | | 7-Day China Fixing Repo Rates | | | 2.750 | % | | 05/12/21 | | Bank of America N.A. | | | CNY | | | | 10,510,000 | | | | 4,401 | | | | — | | | | 4,401 | |
Pay | | 7-Day China Fixing Repo Rates | | | 2.750 | % | | 05/12/21 | | Bank of America N.A. | | | CNY | | | | 10,510,000 | | | | 4,401 | | | | — | | | | 4,401 | |
Pay | | 7-Day China Fixing Repo Rates | | | 2.750 | % | | 05/12/21 | | Bank of America N.A. | | | CNY | | | | 8,420,000 | | | | 4,103 | | | | — | | | | 4,103 | |
Pay | | 7-Day China Fixing Repo Rates | | | 2.750 | % | | 05/12/21 | | Bank of America N.A. | | | CNY | | | | 5,255,000 | | | | 2,200 | | | | — | | | | 2,200 | |
Pay | | 7-Day China Fixing Repo Rates | | | 2.772 | % | | 05/12/21 | | Bank of America N.A. | | | CNY | | | | 13,135,000 | | | | 7,485 | | | | — | | | | 7,485 | |
Receive | | 1-Day CDI | | | 11.410 | % | | 01/04/21 | | Bank of America N.A. | | | BRL | | | | 5,126,000 | | | | 47,225 | | | | — | | | | 47,225 | |
Receive | | 28-Day TIIE | | | 4.300 | % | | 12/07/17 | | Bank of America N.A. | | | MXN | | | | 12,027,855 | | | | 5,678 | | | | — | | | | 5,678 | |
Receive | | 28-Day TIIE | | | 4.550 | % | | 03/21/18 | | Barclays Bank plc | | | MXN | | | | 26,793,819 | | | | 10,308 | | | | — | | | | 10,308 | |
Receive | | 28-Day TIIE | | | 4.700 | % | | 12/06/18 | | Bank of America N.A. | | | MXN | | | | 8,147,763 | | | | 4,379 | | | | — | | | | 4,379 | |
Receive | | 28-Day TIIE | | | 4.760 | % | | 12/06/18 | | Citibank N.A. | | | MXN | | | | 8,147,763 | | | | 3,753 | | | | — | | | | 3,753 | |
Receive | | 28-Day TIIE | | | 4.770 | % | | 12/05/18 | | Citibank N.A. | | | MXN | | | | 8,147,763 | | | | 3,640 | | | | — | | | | 3,640 | |
Receive | | 28-Day TIIE | | | 4.850 | % | | 11/01/18 | | Bank of America N.A. | | | MXN | | | | 22,482,829 | | | | 6,828 | | | | — | | | | 6,828 | |
Receive | | 28-Day TIIE | | | 6.307 | % | | 08/11/25 | | Deutsche Bank AG | | | MXN | | | | 74,533,884 | | | | (85,959 | ) | | | — | | | | (85,959 | ) |
Receive | | 28-Day TIIE | | | 6.310 | % | | 08/11/25 | | Bank of America N.A. | | | MXN | | | | 20,079,000 | | | | (24,636 | ) | | | — | | | | (24,636 | ) |
Receive | | 28-Day TIIE | | | 6.310 | % | | 08/11/25 | | Bank of America N.A. | | | MXN | | | | 20,079,000 | | | | (24,636 | ) | | | — | | | | (24,636 | ) |
Receive | | 3M KLIBOR | | | 1.690 | % | | 11/10/17 | | Deutsche Bank AG | | | KRW | | | | 6,513,071,110 | | | | (34,164 | ) | | | — | | | | (34,164 | ) |
Receive | | 3M LIBOR | | | 1.758 | % | | 06/25/22 | | JPMorgan Chase Bank N.A. | | | USD | | | | 18,000,000 | | | | (723,541 | ) | | | — | | | | (723,541 | ) |
| | | | | | | | | | | | | | | | | | | | | | | | | | | | | | |
Totals | | | $ | (271,707 | ) | | $ | — | | | $ | (271,707 | ) |
| | | | | | | | | | | | | | | | | | | | | | | | | | | | | | |
See accompanying notes to financial statements.
MSF-34
Metropolitan Series Fund
BlackRock Bond Income Portfolio
Schedule of Investments as of June 30, 2016
Centrally Cleared Interest Rate Swaps
| | | | | | | | | | | | | | | | | | | | | | | | |
Pay/Receive Floating Rate | | Floating
Rate Index | | | Fixed
Rate | | | Maturity
Date | | | Notional
Amount | | | Unrealized
Appreciation/
(Depreciation) | |
Pay | | | 3M LIBOR | | | | 2.131 | % | | | 08/25/25 | | | | USD | | | | 1,285,000 | | | $ | 91,688 | |
Receive | | | 3M LIBOR | | | | 0.648 | % | | | 11/26/16 | | | | USD | | | | 14,540,000 | | | | 653 | |
Receive | | | 3M LIBOR | | | | 1.256 | % | | | 01/12/17 | | | | USD | | | | 223,619,000 | | | | (708,425 | ) |
Receive | | | 3M LIBOR | | | | 1.443 | % | | | 06/14/21 | | | | USD | | | | 206,615,000 | | | | (135,424 | ) |
Receive | | | 3M LIBOR | | | | 1.463 | % | | | 06/28/26 | | | | USD | | | | 4,033,630 | | | | (22,152 | ) |
Receive | | | 3M LIBOR | | | | 1.464 | % | | | 06/28/26 | | | | USD | | | | 1,008,185 | | | | (5,585 | ) |
Receive | | | 3M LIBOR | | | | 1.510 | % | | | 06/14/21 | | | | USD | | | | 204,730,000 | | | | (266,796 | ) |
Receive | | | 3M LIBOR | | | | 2.272 | % | | | 09/11/25 | | | | USD | | | | 955,000 | | | | (80,116 | ) |
Receive | | | 3M LIBOR | | | | 2.383 | % | | | 07/10/25 | | | | USD | | | | 72,000,000 | | | | (6,605,345 | ) |
| | | | | | | | | | | | | | | | | | | | | | | | |
Net Unrealized Depreciation | | | $ | (7,731,502 | ) |
| | | | | | | | | | | | | | | | | | | | | | | | |
Centrally Cleared Credit Default Swaps on Credit Indices—Buy Protection (a)
| | | | | | | | | | | | | | | | | | | | | | |
Reference Obligation | | Fixed Deal
(Pay) Rate | | | Maturity
Date | | | Implied Credit
Spread at
June 30,
2016(b) | | Notional
Amount(c) | | | Unrealized
Depreciation | |
ITRAXX.XO.25.V1 | | | (5.000%) | | | | 06/21/21 | | | 0.000% | | | EUR | | | | 180,000 | | | $ | (1,107) | |
| | | | | | | | | | | | | | | | | | | | | | |
Centrally Cleared Credit Default Swaps on Credit Indices—Sell Protection (d)
| | | | | | | | | | | | | | | | | | | | | | |
Reference Obligation | | Fixed Deal
Receive Rate | | | Maturity
Date | | | Implied Credit
Spread at
June 30,
2016(b) | | Notional
Amount(c) | | | Unrealized
Appreciation | |
CDX.NA.HY.26.V1 | | | 5.000% | | | | 06/20/21 | | | 4.288% | | | USD | | | | 68,371,000 | | | $ | 816,662 | |
CDX.NA.IG.26.V1 | | | 1.000% | | | | 06/20/21 | | | 0.789% | | | USD | | | | 397,308,000 | | | | 1,348,939 | |
| | | | | | | | | | | | | | | | | | | | | | |
Net Unrealized Appreciation | | | $ | 2,165,601 | |
| | | | | | | | | | | | | | | | | | | | | | |
OTC Credit Default Swaps on Corporate and Sovereign Issues—Buy Protection (a)
| | | | | | | | | | | | | | | | | | | | | | | | | | | | | | | | | | |
Reference Obligation | | Fixed Deal
(Pay) Rate | | | Maturity
Date | | | Counterparty | | Implied Credit
Spread at
June 30,
2016(b) | | | Notional
Amount(c) | | | Market
Value | | | Upfront
Premium
Paid/
(Received) | | | Unrealized
Appreciation/
(Depreciation) | |
Australia & New Zealand Banking Group, Ltd. 0.242%, due 10/28/19 | | | (1.000%) | | | | 06/20/21 | | | BNP Paribas S.A. | | | 0.820% | | | | USD | | | | 13,953,187 | | | $ | (120,746) | | | $ | 155,863 | | | $ | (276,609) | |
Australia & New Zealand Banking Group, Ltd. 0.242%, due 10/28/19 | | | (1.000%) | | | | 06/20/21 | | | Deutsche Bank AG | | | 0.820% | | | | USD | | | | 21,606,546 | | | | (186,976) | | | | 289,954 | | | | (476,930) | |
Australia & New Zealand Banking Group, Ltd. 0.242%, due 10/28/19 | | | (1.000%) | | | | 06/20/21 | | | JPMorgan Chase Bank N.A. | | | 0.820% | | | | USD | | | | 8,685,000 | | | | (75,157) | | | | 93,033 | | | | (168,190) | |
Australia & New Zealand Banking Group, Ltd. 3.750%, due 03/10/17 | | | (1.000%) | | | | 06/20/21 | | | JPMorgan Chase Bank N.A. | | | 0.820% | | | | USD | | | | 4,766,813 | | | | (41,250) | | | | 63,959 | | | | (105,209) | |
Commonwealth Bank of Australia 4.250%, due 11/10/16 | | | (1.000%) | | | | 06/20/21 | | | JPMorgan Chase Bank N.A. | | | 0.824% | | | | USD | | | | 6,337,401 | | | | (53,840) | | | | 81,969 | | | | (135,809) | |
Commonwealth Bank of Australia 4.375%, due 02/25/20 | | | (1.000%) | | | | 06/20/21 | | | Deutsche Bank AG | | | 0.824% | | | | USD | | | | 1,978,968 | | | | (16,812) | | | | 36,741 | | | | (53,553) | |
Commonwealth Bank of Australia 4.375%, due 02/25/20 | | | (1.000%) | | | | 06/20/21 | | | Deutsche Bank AG | | | 0.824% | | | | USD | | | | 7,590,000 | | | | (64,481) | | | | 77,859 | | | | (142,340) | |
Credit Agricole S.A. Zero Coupon, due 04/21/17 | | | (1.000%) | | | | 06/20/21 | | | Barclays Bank plc | | | 0.931% | | | | EUR | | | | 1,068,000 | | | | (4,049) | | | | (9,258) | | | | 5,209 | |
See accompanying notes to financial statements.
MSF-35
Metropolitan Series Fund
BlackRock Bond Income Portfolio
Schedule of Investments as of June 30, 2016
OTC Credit Default Swaps on Corporate and Sovereign Issues—Buy Protection (a)—(Continued)
| | | | | | | | | | | | | | | | | | | | | | | | | | | | | | | | | | |
Reference Obligation | | Fixed Deal
(Pay) Rate | | | Maturity
Date | | | Counterparty | | Implied Credit
Spread at
June 30,
2016(b) | | | Notional
Amount(c) | | | Market
Value | | | Upfront
Premium
Paid/
(Received) | | | Unrealized
Appreciation/
(Depreciation) | |
Federation of Malaysia 5.625%, due 03/15/16 | | | (1.000%) | | | | 06/20/21 | | | Barclays Bank plc | | | 1.538% | | | | USD | | | | 2,309,420 | | | $ | 58,664 | | | $ | 71,065 | | | $ | (12,401) | |
Federation of Malaysia, 5.625%, due 03/15/16 | | | (1.000%) | | | | 06/20/21 | | | Citibank N.A. | | | 1.538% | | | | USD | | | | 106,989 | | | | 2,718 | | | | 2,524 | | | | 194 | |
Federation of Russian, 7.5000%, due 03/31/30 | | | (1.000%) | | | | 06/20/21 | | | Bank of America N.A. | | | 2.300% | | | | USD | | | | 955,000 | | | | 57,992 | | | | 60,431 | | | | (2,439) | |
HSBC Bank Plc 3.750%, due 11/30/16 | | | (1.000%) | | | | 06/20/21 | | | Bank of America N.A. | | | 1.004% | | | | EUR | | | | 13,716,000 | | | | 3,094 | | | | (428) | | | | 3,522 | |
HSBC Bank Plc 3.750%, due 11/30/16 | | | (1.000%) | | | | 06/20/21 | | | Bank of America N.A. | | | 1.004% | | | | EUR | | | | 4,554,000 | | | | 1,027 | | | | (10,504) | | | | 11,531 | |
HSBC Bank Plc 3.750%, due 11/30/16 | | | (1.000%) | | | | 06/20/21 | | | Citibank N.A. | | | 1.004% | | | | EUR | | | | 5,000,000 | | | | 1,128 | | | | (13,047) | | | | 14,175 | |
HSBC Bank Plc 3.750%, due 11/30/16 | | | (1.000%) | | | | 06/20/21 | | | Citibank N.A. | | | 1.004% | | | | EUR | | | | 2,385,000 | | | | 538 | | | | (6,223) | | | | 6,761 | |
HSBC Bank Plc 3.750%, due 11/30/16 | | | (1.000%) | | | | 06/20/21 | | | Citibank N.A. | | | 1.004% | | | | EUR | | | | 1,720,000 | | | | 388 | | | | (4,488) | | | | 4,876 | |
HSBC Bank Plc 3.750%, due 11/30/16 | | | (1.000%) | | | | 06/20/21 | | | Citibank N.A. | | | 1.004% | | | | EUR | | | | 1,274,000 | | | | 287 | | | | (3,324) | | | | 3,611 | |
HSBC Bank Plc 3.750%, due 11/30/16 | | | (1.000%) | | | | 06/20/21 | | | Citibank N.A. | | | 1.004% | | | | EUR | | | | 1,219,000 | | | | 275 | | | | (3,181) | | | | 3,456 | |
HSBC Bank Plc 3.750%, due 11/30/16 | | | (1.000%) | | | | 06/20/21 | | | Citibank N.A. | | | 1.004% | | | | EUR | | | | 576,000 | | | | 130 | | | | (1,503) | | | | 1,633 | |
HSBC Bank Plc 3.750%, due 11/30/16 | | | (1.000%) | | | | 06/20/21 | | | Credit Suisse International | | | 1.004% | | | | EUR | | | | 9,374,000 | | | | 2,114 | | | | 42,456 | | | | (40,342) | |
HSBC Bank Plc 3.750%, due 11/30/16 | | | (1.000%) | | | | 06/20/21 | | | JPMorgan Chase Bank N.A. | | | 1.004% | | | | EUR | | | | 3,355,000 | | | | 757 | | | | (14,441) | | | | 15,198 | |
HSBC Bank Plc 3.750%, due 11/30/16 | | | (1.000%) | | | | 06/20/21 | | | JPMorgan Chase Bank N.A. | | | 1.004% | | | | EUR | | | | 1,235,000 | | | | 279 | | | | 1,738 | | | | (1,459) | |
HSBC Bank Plc 3.750%, due 11/30/16 | | | (1.000%) | | | | 06/20/21 | | | JPMorgan Chase Bank N.A. | | | 1.004% | | | | EUR | | | | 175,000 | | | | 39 | | | | (753) | | | | 792 | |
Loews Corp. 6.000%, due 02/01/35 | | | (1.000%) | | | | 12/20/20 | | | Barclays Bank plc | | | 0.336% | | | | USD | | | | 2,145,000 | | | | (62,861) | | | | (75,932) | | | | 13,071 | |
Mexico Government International Bond 5.950%, due 03/19/19 | | | (1.000%) | | | | 06/20/20 | | | JPMorgan Chase Bank N.A. | | | 1.245% | | | | USD | | | | 3,824,276 | | | | 36,150 | | | | 33,406 | | | | 2,744 | |
Mexico Government International Bond 5.950%, due 03/19/19 | | | (1.000%) | | | | 09/20/20 | | | Bank of America N.A. | | | 1.333% | | | | USD | | | | 3,824,276 | | | | 52,127 | | | | 50,241 | | | | 1,886 | |
National Australia Bank, Ltd. 3.625%, due 11/08/17 | | | (1.000%) | | | | 06/20/21 | | | JPMorgan Chase Bank N.A. | | | 0.825% | | | | USD | | | | 5,060,000 | | | | (42,623) | | | | 67,892 | | | | (110,515) | |
Prudential Financial Inc. 6.1%, due 06/15/17 | | | (1.000%) | | | | 06/20/21 | | | Citibank N.A. | | | 1.234% | | | | USD | | | | 2,145,000 | | | | 23,887 | | | | 28,836 | | | | (4,949) | |
Prudential Financial Inc. 6.100%, due 06/15/17 | | | (1.000%) | | | | 06/20/21 | | | Citibank N.A. | | | 1.234% | | | | USD | | | | 5,392,000 | | | | 60,045 | | | | 72,486 | | | | (12,441) | |
Republic of Philippines 10.625%, due 03/16/25 | | | (1.000%) | | | | 06/20/21 | | | JPMorgan Chase Bank N.A. | | | 1.133% | | | | USD | | | | 4,046,000 | | | | 25,731 | | | | 32,732 | | | | (7,001) | |
Republic of Philippines, 10.625%, due 03/16/25 | | | (1.000%) | | | | 06/20/21 | | | Bank of America N.A. | | | 1.133% | | | | USD | | | | 100,249 | | | | (638) | | | | (469) | | | | (169) | |
Republic of Philippines, 10.625%, due 03/16/25 | | | (1.000%) | | | | 06/20/21 | | | Barclays Bank plc | | | 1.133% | | | | USD | | | | 2,013,905 | | | | 12,808 | | | | 12,270 | | | | 538 | |
Republic of Philippines, 10.625%, due 03/16/25 | | | (1.000%) | | | | 06/20/21 | | | Barclays Bank plc | | | 1.133% | | | | USD | | | | 1,208,343 | | | | 7,685 | | | | 7,928 | | | | (243) | |
Republic of Philippines, 10.625%, due 03/16/25 | | | (1.000%) | | | | 06/20/21 | | | Barclays Bank plc | | | 1.133% | | | | USD | | | | 1,071,200 | | | | 6,813 | | | | 6,663 | | | | 150 | |
Republic of Philippines, 10.625%, due 03/16/25 | | | (1.000%) | | | | 06/20/21 | | | Barclays Bank plc | | | 1.133% | | | | USD | | | | 892,667 | | | | 5,677 | | | | 5,952 | | | | (275) | |
See accompanying notes to financial statements.
MSF-36
Metropolitan Series Fund
BlackRock Bond Income Portfolio
Schedule of Investments as of June 30, 2016
OTC Credit Default Swaps on Corporate and Sovereign Issues—Buy Protection (a)—(Continued)
| | | | | | | | | | | | | | | | | | | | | | | | | | | | | | | | | | |
Reference Obligation | | Fixed Deal
(Pay) Rate | | | Maturity
Date | | | Counterparty | | Implied Credit
Spread at
June 30,
2016(b) | | | Notional
Amount(c) | | | Market
Value | | | Upfront
Premium
Paid/
(Received) | | | Unrealized
Appreciation/
(Depreciation) | |
Republic of Philippines, 10.625%, due 03/16/25 | | | (1.000%) | | | | 06/20/21 | | | Barclays Bank plc | | | 1.133% | | | | USD | | | | 886,455 | | | $ | 5,638 | | | $ | 6,786 | | | $ | (1,148) | |
Republic of Philippines, 10.625%, due 03/16/25 | | | (1.000%) | | | | 06/20/21 | | | Barclays Bank plc | | | 1.133% | | | | USD | | | | 886,455 | | | | 5,638 | | | | 5,942 | | | | (304) | |
Republic of Philippines, 10.625%, due 03/16/25 | | | (1.000%) | | | | 06/20/21 | | | Barclays Bank plc | | | 1.133% | | | | USD | | | | 886,455 | | | | 5,638 | | | | 5,942 | | | | (304) | |
Republic of Philippines, 10.625%, due 03/16/25 | | | (1.000%) | | | | 06/20/21 | | | Barclays Bank plc | | | 1.133% | | | | USD | | | | 805,562 | | | | 5,123 | | | | 4,908 | | | | 215 | |
Republic of Philippines, 10.625%, due 03/16/25 | | | (1.000%) | | | | 06/20/21 | | | Barclays Bank plc | | | 1.133% | | | | USD | | | | 805,561 | | | | 5,123 | | | | 5,285 | | | | (162) | |
Republic of Philippines, 10.625%, due 03/16/25 | | | (1.000%) | | | | 06/20/21 | | | Barclays Bank plc | | | 1.133% | | | | USD | | | | 714,133 | | | | 4,542 | | | | 4,420 | | | | 122 | |
Republic of Philippines, 10.625%, due 03/16/25 | | | (1.000%) | | | | 06/20/21 | | | Citibank N.A. | | | 1.133% | | | | USD | | | | 1,095,273 | | | | 6,966 | | | | 7,186 | | | | (220) | |
Republic of Philippines, 10.625%, due 03/16/25 | | | (1.000%) | | | | 06/20/21 | | | Citibank N.A. | | | 1.133% | | | | USD | | | | 1,017,969 | | | | 6,474 | | | | 5,845 | | | | 629 | |
Republic of Philippines, 10.625%, due 03/16/25 | | | (1.000%) | | | | 06/20/21 | | | JPMorgan Chase Bank N.A. | | | 1.133% | | | | USD | | | | 1,034,689 | | | | 6,580 | | | | 5,813 | | | | 767 | |
Republic of Philippines, 10.625%, due 03/16/25 | | | (1.000%) | | | | 06/20/21 | | | JPMorgan Chase Bank N.A. | | | 1.133% | | | | USD | | | | 283,666 | | | | 1,804 | | | | 1,766 | | | | 38 | |
Republic of South Africa 5.500%, due 03/09/20 | | | (1.000%) | | | | 06/20/21 | | | BNP Paribas S.A. | | | 2.782% | | | | USD | | | | 1,115,000 | | | | 91,483 | | | | 124,650 | | | | (33,167) | |
Republic of South Africa 5.500%, due 03/09/20 | | | (1.000%) | | | | 06/20/21 | | | BNP Paribas S.A. | | | 2.782% | | | | USD | | | | 930,000 | | | | 76,305 | | | | 107,364 | | | | (31,059) | |
Republic of South Africa 5.500%, due 03/09/20 | | | (1.000%) | | | | 06/20/21 | | | Bank of America N.A. | | | 2.782% | | | | USD | | | | 1,925,000 | | | | 157,942 | | | | 215,406 | | | | (57,464) | |
Republic of South Africa 5.500%, due 03/09/20 | | | (1.000%) | | | | 06/20/21 | | | Barclays Bank plc | | | 2.782% | | | | USD | | | | 3,720,000 | | | | 305,218 | | | | 432,746 | | | | (127,528) | |
Republic of South Africa 5.500%, due 03/09/20 | | | (1.000%) | | | | 06/20/21 | | | Barclays Bank plc | | | 2.782% | | | | USD | | | | 2,245,000 | | | | 184,198 | | | | 238,571 | | | | (54,373) | |
Republic of South Africa 5.500%, due 03/09/20 | | | (1.000%) | | | | 06/20/21 | | | Citibank N.A. | | | 2.782% | | | | USD | | | | 1,224,000 | | | | 100,427 | | | | 131,635 | | | | (31,208) | |
Republic of South Africa 5.500%, due 03/09/20 | | | (1.000%) | | | | 06/20/21 | | | Citibank N.A. | | | 2.782% | | | | USD | | | | 1,134,519 | | | | 93,085 | | | | 92,733 | | | | 352 | |
Republic of South Africa 5.500%, due 03/09/20 | | | (1.000%) | | | | 06/20/21 | | | Citibank N.A. | | | 2.782% | | | | USD | | | | 40,000 | | | | 3,282 | | | | 4,421 | | | | (1,139) | |
Republic of South Africa 5.500%, due 03/09/20 | | | (1.000%) | | | | 06/20/21 | | | Goldman Sachs International | | | 2.782% | | | | USD | | | | 1,160,000 | | | | 95,176 | | | | 134,292 | | | | (39,116) | |
Republic of South Africa 5.500%, due 03/09/20 | | | (1.000%) | | | | 06/20/21 | | | JPMorgan Chase Bank N.A. | | | 2.782% | | | | USD | | | | 2,765,000 | | | | 226,862 | | | | 305,901 | | | | (79,039) | |
Standard Chartered Bank 0.525%, due 09/04/17 | | | (1.000%) | | | | 06/20/21 | | | Bank of America N.A. | | | 1.496% | | | | EUR | | | | 6,140,000 | | | | 162,472 | | | | 143,604 | | | | 18,868 | |
Standard Chartered Bank 0.525%, due 09/04/17 | | | (1.000%) | | | | 06/20/21 | | | Bank of America N.A. | | | 1.496% | | | | EUR | | | | 1,560,000 | | | | 41,279 | | | | 36,486 | | | | 4,793 | |
Standard Chartered Bank 0.525%, due 09/04/17 | | | (1.000%) | | | | 06/20/21 | | | BNP Paribas S.A. | | | 1.496% | | | | EUR | | | | 1,331,000 | | | | 35,220 | | | | 37,737 | | | | (2,517) | |
Standard Chartered Bank 0.525%, due 09/04/17 | | | (1.000%) | | | | 06/20/21 | | | BNP Paribas S.A. | | | 1.496% | | | | EUR | | | | 1,211,000 | | | | 32,044 | | | | 34,335 | | | | (2,291) | |
Standard Chartered Bank 0.525%, due 09/04/17 | | | (1.000%) | | | | 06/20/21 | | | BNP Paribas S.A. | | | 1.496% | | | | EUR | | | | 675,000 | | | | 17,861 | | | | 37,625 | | | | (19,764) | |
Standard Chartered Bank 0.525%, due 09/04/17 | | | (1.000%) | | | | 06/20/21 | | | JPMorgan Chase Bank N.A. | | | 1.496% | | | | EUR | | | | 1,319,000 | | | | 34,902 | | | | 74,013 | | | | (39,111) | |
Valero Energy Corp. 8.750%, due 06/15/30 | | | (1.000%) | | | | 12/20/20 | | | Morgan Stanley Capital Services, LLC | | | 1.513% | | | | USD | | | | 2,145,000 | | | | 47,198 | | | | 51,754 | | | | (4,556) | |
| | | | | | | | | | | | | | | | | | | | | | | | | | | | | | | | | | |
Totals | | | $ | 1,449,400 | | | $ | 3,409,613 | | | $ | (1,960,213) | |
| | | | | | | | | | | | | | | | | | | | | | | | | | | | | | | | | | |
See accompanying notes to financial statements.
MSF-37
Metropolitan Series Fund
BlackRock Bond Income Portfolio
Schedule of Investments as of June 30, 2016
OTC Credit Default Swaps on Corporate and Sovereign Issues—Sell Protection (d)
| | | | | | | | | | | | | | | | | | | | | | | | | | | | | | | | | | |
Reference Obligation | | Fixed Deal
Receive Rate | | | Maturity
Date | | | Counterparty | | Implied Credit
Spread at
June 30,
2016(b) | | | Notional
Amount(c) | | | Market
Value | | | Upfront
Premium
Paid/
(Received) | | | Unrealized
Appreciation/
(Depreciation) | |
Federative Republic of Brazil 4.250%, due 01/07/25 | | | 1.000% | | | | 06/20/21 | | | Barclays Bank plc | | | 3.078% | | | | USD | | | | 1,122,000 | | | $ | (106,951) | | | $ | (128,227) | | | $ | 21,276 | |
Fiat Chrysler Automobiles NV, 5.625%, due 06/12/19 | | | 5.000% | | | | 06/20/21 | | | Citibank N.A. | | | 4.188% | | | | EUR | | | | 17,812 | | | | 712 | | | | 1,513 | | | | (801) | |
Fiat Industrial Finance Europe S.A. 6.250%, due 03/09/18 | | | 5.000% | | | | 12/20/20 | | | BNP Paribas S.A. | | | 2.943% | | | | EUR | | | | 21,277 | | | | 2,032 | | | | 2,368 | | | | (336) | |
Mexico Government International Bond 5.950%, due 03/19/19 | | | 1.000% | | | | 06/20/20 | | | Bank of America N.A. | | | 1.245% | | | | USD | | | | 3,824,276 | | | | (36,150) | | | | (38,756) | | | | 2,606 | |
Mexico Government International Bond 5.950%, due 03/19/19 | | | 1.000% | | | | 09/20/20 | | | JPMorgan Chase Bank N.A. | | | 1.333% | | | | USD | | | | 3,824,276 | | | | (52,127) | | | | (43,741) | | | | (8,386) | |
Wind Acquisition Finance S.A., 7.000%, due 04/23/21 | | | 5.000% | | | | 06/20/21 | | | JPMorgan Chase Bank N.A. | | | 4.370% | | | | EUR | | | | 10,000 | | | | 310 | | | | 343 | | | | (33) | |
| | | | | | | | | | | | | | | | | | | | | | | | | | | | | | | | | | |
Totals | | | $ | (192,174) | | | $ | (206,500) | | | $ | 14,326 | |
| | | | | | | | | | | | | | | | | | | | | | | | | | | | | | | | | | |
OTC Credit Default Swaps on Credit Indices—Buy Protection (a)
| | | | | | | | | | | | | | | | | | | | | | | | | | | | | | | | | | |
Reference Obligation | | Fixed Deal
(Pay) Rate | | | Maturity
Date | | | Counterparty | | Implied Credit
Spread at
June 30,
2016(b) | | | Notional
Amount(c) | | | Market
Value | | | Upfront
Premium
Paid | | | Unrealized
Depreciation | |
CMBX.NA.AAA.V8 | | | (0.500%) | | | | 10/17/57 | | | Credit Suisse International | | | 0.000% | | | | USD | | | | 990,000 | | | $ | 36,961 | | | $ | 44,956 | | | $ | (7,995) | |
| | | | | | | | | | | | | | | | | | | | | | | | | | | | | | | | | | |
OTC Credit Default Swaps on Credit Indices—Sell Protection (d)
| | | | | | | | | | | | | | | | | | | | | | | | | | | | | | | | |
Reference Obligation | | Fixed Deal
Receive Rate | | | Maturity
Date | | | Counterparty | | Implied Credit
Spread at
June 30,
2016(b) | | Notional
Amount(c) | | | Market
Value | | | Upfront
Premium
(Received) | | | Unrealized
Appreciation/
(Depreciation) | |
CMBX.NA.A.9 | | | 2.000% | | | | 09/17/58 | | | Morgan Stanley Capital Services, LLC | | 0.000% | | | USD | | | | 340,000 | | | $ | (44,898) | | | $ | (37,194) | | | $ | (7,704) | |
CMBX.NA.A.8 | | | 2.000% | | | | 10/17/57 | | | Morgan Stanley Capital Services, LLC | | 0.000% | | | USD | | | | 335,000 | | | | (36,292) | | | | (31,820) | | | | (4,472) | |
CMBX.NA.A.8 | | | 2.000% | | | | 10/17/57 | | | Morgan Stanley Capital Services, LLC | | 0.000% | | | USD | | | | 335,000 | | | | (36,292) | | | | (31,596) | | | | (4,696) | |
CMBX.NA.A.8 | | | 2.000% | | | | 10/17/57 | | | Morgan Stanley Capital Services, LLC | | 0.000% | | | USD | | | | 540,000 | | | | (58,500) | | | | (66,234) | | | | 7,734 | |
CMBX.NA.A.8 | | | 2.000% | | | | 10/17/57 | | | Morgan Stanley Capital Services, LLC | | 0.000% | | | USD | | | | 1,400,000 | | | | (151,667) | | | | (162,648) | | | | 10,981 | |
CMBX.NA.A.9 | | | 2.000% | | | | 09/17/58 | | | Morgan Stanley Capital Services, LLC | | 0.000% | | | USD | | | | 900,000 | | | | (118,847) | | | | (118,125) | | | | (722) | |
CMBX.NA.A.9 | | | 2.000% | | | | 09/17/58 | | | Credit Suisse International | | 0.000% | | | USD | | | | 500,000 | | | | (66,026) | | | | (72,016) | | | | 5,990 | |
CMBX.NA.A.9 | | | 2.000% | | | | 09/17/58 | | | Morgan Stanley Capital Services, LLC | | 0.000% | | | USD | | | | 496,000 | | | | (65,498) | | | | (70,750) | | | | 5,252 | |
CMBX.NA.AAA.V7 | | | 0.500% | | | | 01/17/47 | | | Credit Suisse International | | 0.000% | | | USD | | | | 5,000,000 | | | | (129,887) | | | | (156,398) | | | | 26,511 | |
CMBX.NA.AM.V4 | | | 0.500% | | | | 02/17/51 | | | Deutsche Bank AG | | 0.000% | | | USD | | | | 2,370,000 | | | | (65,649) | | | | (359,977) | | | | 294,328 | |
| | | | | | | | | | | | | | | | | | | | | | | | | | | | | | | | |
Totals | | | $ | (773,556) | | | $ | (1,106,758) | | | $ | 333,202 | |
| | | | | | | | | | | | | | | | | | | | | | | | | | | | | | | | |
| (a) | If the Portfolio is a buyer of protection and a credit event occurs, as defined under the terms of that particular swap agreement, the Portfolio will either (i) receive from the seller of protection an amount equal to the notional amount of the swap and deliver the referenced obligation or underlying securities comprising the referenced index or (ii) receive a net settlement amount in the form of cash or securities equal to the notional amount of the swap less the recovery value of the referenced obligation or underlying securities comprising the referenced index. |
See accompanying notes to financial statements.
MSF-38
Metropolitan Series Fund
BlackRock Bond Income Portfolio
Schedule of Investments as of June 30, 2016
| (b) | Implied credit spreads, represented in absolute terms, utilized in determining the market value of credit default swap agreements on corporate issues or indices as of period end serve as an indicator of the current status of the payment/performance risk and represent the likelihood or risk of default for the credit derivative. The implied credit spread of a particular referenced entity reflects the cost of buying/selling protection and may include upfront payments required to be made to enter into the agreement. Wider credit spreads represent a deterioration of the referenced entity’s credit soundness and a greater likelihood or risk of default or other credit event occurring as defined under the terms of the agreement. A credit spread identified as “Defaulted” indicates a credit event has occurred for the referenced entity or obligation. |
| (c) | The maximum potential amount of future undiscounted payments that the Portfolio could be required to make under a credit default swap contract would be the notional amount of the contract. These potential amounts would be partially offset by any recovery values of the referenced debt obligation or net amounts received from the settlement of purchased protection credit default swap contracts entered into by the Portfolio for the same referenced debt obligation. |
| (d) | If the Portfolio is a seller of protection and a credit event occurs, as defined under the terms of that particular swap agreement, the Portfolio will either (i) pay to the buyer of protection an amount equal to the notional amount of the swap and take delivery of the referenced obligation or underlying securities comprising the referenced index or (ii) pay a net settlement amount in the form of cash or securities equal to the notional amount of the swap less the recovery value of the referenced obligation or underlying securities comprising the referenced index. |
| (SAR)— | Saudi Arabian Riyal |
| (USD)— | United States Dollar |
| (CDI)— | Brazil Interbank Deposit Rate |
| (CMBX)— | Commercial Mortgage-Backed Index |
| (CDX.NA.HY)— | Markit North America High Yield CDS Index |
| (CDX.NA.IG)— | Markit North America Investment Grade CDS Index |
| (CMBX.NA.A)— | Markit North America A Rated CMBS Index |
| (CMBX.NA.AA)— | Markit North America AA Rated CMBS Index |
| (CMBX.NA.AAA)— | Markit North America AAA Rated CMBS Index |
| (CMBX.NA.AM)— | Markit North America Mezzanine AAA Rated CMBS Index |
| (COLIBOR)— | Colombia InterBank OfferedRate |
| (ITRAXX.XO)— | Markit iTraxx Crossover Index |
| (KLIBOR)— | Kulala Lumpor InterBank OfferedRate |
| (LIBOR)— | London Interbank Offered Rate |
| (TIIE)— | Mexican Interbank Equilibrium Interest Rate |
Fair Value Hierarchy
Accounting principles generally accepted in the United States of America (“GAAP”) define fair market value as the price that the Portfolio would receive to sell an asset or pay to transfer a liability in an orderly transaction between market participants at the measurement date. It establishes a fair value hierarchy that prioritizes inputs to valuation methods and requires disclosure of the fair value hierarchy, separately for each major category of assets and liabilities, that segregates fair value measurements into three levels. Levels 1, 2 and 3 of the fair value hierarchy are defined as follows:
Level 1 - unadjusted quoted prices in active markets for identical investments
Level 2 - other significant observable inputs (including, but not limited to, quoted prices for similar assets or liabilities in markets that are either active or inactive; inputs other than quoted prices that are observable such as interest rates, yield curves, volatilities, prepayment speeds, loss severities, credit risks, default rates, or other market corroborated inputs)
Level 3 - significant unobservable inputs based on the best information available in the circumstances, to the extent observable inputs are unavailable (including the Portfolio’s own assumptions used in determining the fair value of investments and derivative financial instruments)
The inputs or methodologies used for valuing investments are not necessarily an indication of the risk associated with investing in them. Changes to the inputs or methodologies used may result in transfers between levels, which will be recognized as of the beginning of the reporting period. Information on transfers between Level 1 and Level 2, if any, will be disclosed following the fair value hierarchy table below. A reconciliation of Level 3 securities, if any, will also be disclosed following the fair value hierarchy table. For more information about the Portfolio’s policy regarding the valuation of investments, please refer to the Notes to Financial Statements.
See accompanying notes to financial statements.
MSF-39
Metropolitan Series Fund
BlackRock Bond Income Portfolio
Schedule of Investments as of June 30, 2016
The following table summarizes the fair value hierarchy of the Portfolio’s investments as of June 30, 2016:
| | | | | | | | | | | | | | | | |
| Description | | Level 1 | | | Level 2 | | | Level 3 | | | Total | |
Total U.S. Treasury & Government Agencies* | | $ | — | | | $ | 2,112,476,008 | | | $ | — | | | $ | 2,112,476,008 | |
Total Corporate Bonds & Notes* | | | — | | | | 1,021,527,318 | | | | — | | | | 1,021,527,318 | |
Total Asset-Backed Securities* | | | — | | | | 364,907,054 | | | | — | | | | 364,907,054 | |
Total Mortgage-Backed Securities* | | | — | | | | 301,871,950 | | | | — | | | | 301,871,950 | |
Total Municipals | | | — | | | | 161,202,935 | | | | — | | | | 161,202,935 | |
Total Foreign Government* | | | — | | | | 104,875,895 | | | | — | | | | 104,875,895 | |
Total Preferred Stocks* | | | 14,450,678 | | | | — | | | | — | | | | 14,450,678 | |
| Purchased Options | | | | | | | | | | | | | | | | |
Currency Options | | | — | | | | 971,117 | | | | — | | | | 971,117 | |
Options on Exchange-Traded Futures Contracts | | | 170,625 | | | | — | | | | — | | | | 170,625 | |
Total Purchased Options | | | 170,625 | | | | 971,117 | | | | — | | | | 1,141,742 | |
| Short-Term Investments | | | | | | | | | | | | | | | | |
Mutual Fund | | | 68,680,138 | | | | — | | | | — | | | | 68,680,138 | |
Repurchase Agreement | | | — | | | | 198,683,389 | | | | — | | | | 198,683,389 | |
Total Short-Term Investments | | | 68,680,138 | | | | 198,683,389 | | | | — | | | | 267,363,527 | |
Total Investments | | $ | 83,301,441 | | | $ | 4,266,515,666 | | | $ | — | | | $ | 4,349,817,107 | |
| | | | | | | | | | | | | | | | | |
Collateral for Securities Loaned (Liability) | | $ | — | | | $ | (68,680,138 | ) | | $ | — | | | $ | (68,680,138 | ) |
TBA Forward Sales Commitments | | $ | — | | | $ | (296,820,020 | ) | | $ | — | | | $ | (296,820,020 | ) |
| Forward Contracts | | | | | | | | | | | | | | | | |
Forward Foreign Currency Exchange Contracts (Unrealized Appreciation) | | $ | — | | | $ | 6,661,358 | | | $ | — | | | $ | 6,661,358 | |
Forward Foreign Currency Exchange Contracts (Unrealized Depreciation) | | | — | | | | (5,601,287 | ) | | | — | | | | (5,601,287 | ) |
Total Forward Contracts | | $ | — | | | $ | 1,060,071 | | | $ | — | | | $ | 1,060,071 | |
| Futures Contracts | | | | | | | | | | | | | | | | |
Futures Contracts (Unrealized Appreciation) | | $ | 10,119,420 | | | $ | — | | | $ | — | | | $ | 10,119,420 | |
Futures Contracts (Unrealized Depreciation) | | | (1,121,556 | ) | | | — | | | | — | | | | (1,121,556 | ) |
Total Futures Contracts | | $ | 8,997,864 | | | $ | — | | | $ | — | | | $ | 8,997,864 | |
| Written Options | | | | | | | | | | | | | | | | |
Foreign Currency Written Options at Value | | $ | — | | | $ | (397,690 | ) | | $ | — | | | $ | (397,690 | ) |
Options on Exchange-Traded Futures Contracts at Value | | | (67,000 | ) | | | — | | | | — | | | | (67,000 | ) |
Total Written Options | | $ | (67,000 | ) | | $ | (397,690 | ) | | $ | — | | | $ | (464,690 | ) |
| Centrally Cleared Swap Contracts | | | | | | | | | | | | | | | | |
Centrally Cleared Swap Contracts (Unrealized Appreciation) | | $ | — | | | $ | 2,257,942 | | | $ | — | | | $ | 2,257,942 | |
Centrally Cleared Swap Contracts (Unrealized Depreciation) | | | — | | | | (7,824,950 | ) | | | — | | | | (7,824,950 | ) |
Total Centrally Cleared Swap Contracts | | $ | — | | | $ | (5,567,008 | ) | | $ | — | | | $ | (5,567,008 | ) |
| OTC Swap Contracts | | | | | | | | | | | | | | | | |
OTC Swap Contracts at Value (Assets) | | $ | — | | | $ | 2,820,618 | | | $ | — | | | $ | 2,820,618 | |
OTC Swap Contracts at Value (Liabilities) | | | — | | | | (2,571,694 | ) | | | — | | | | (2,571,694 | ) |
Total OTC Swap Contracts | | $ | — | | | $ | 248,924 | | | $ | — | | | $ | 248,924 | |
| * | See Schedule of Investments for additional detailed categorizations. |
See accompanying notes to financial statements.
MSF-40
Metropolitan Series Fund
BlackRock Bond Income Portfolio
Statement of Assets and Liabilities
June 30, 2016
| | | | |
Assets | | | | |
Investments at value (a) (b) | | $ | 4,349,817,107 | |
Cash | | | 10,590,103 | |
Cash denominated in foreign currencies (c) | | | 8,002,773 | |
Cash collateral (d) | | | 17,368,870 | |
OTC swap contracts at market value (e) | | | 2,820,618 | |
Unrealized appreciation on forward foreign currency exchange contracts | | | 6,661,358 | |
Receivable for: | | | | |
Investments sold | | | 3,216,181 | |
Open swap contracts cash collateral | | | 1,515,000 | |
TBA securities sold (f) | | | 663,839,174 | |
Fund shares sold | | | 405,913 | |
Principal paydowns | | | 3,875 | |
Interest | | | 19,188,695 | |
Interest on OTC swap contracts | | | 39,863 | |
Variation margin on centrally cleared swap contracts | | | 2,594,167 | |
Prepaid expenses | | | 24,233 | |
Other assets | | | 8,632 | |
| | | | |
Total Assets | | | 5,086,096,562 | |
Liabilities | | | | |
Written options at value (g) | | | 464,690 | |
Forward sales commitments, at value | | | 296,820,020 | |
Cash collateral for OTC swap contracts | | | 2,480,000 | |
OTC swap contracts at market value (h) | | | 2,571,694 | |
Unrealized depreciation on forward foreign currency exchange contracts | | | 5,601,287 | |
Collateral for securities loaned | | | 68,680,138 | |
Payables for: | | | | |
Investments purchased | | | 89,369,074 | |
TBA securities purchased (f) | | | 688,746,003 | |
Fund shares redeemed | | | 606,875 | |
Foreign taxes | | | 37,527 | |
Variation margin on futures contracts | | | 563,896 | |
Interest on forward sales commitments | | | 390,287 | |
Interest on OTC swap contracts | | | 202,342 | |
Accrued Expenses: | | | | |
Management fees | | | 1,042,827 | |
Distribution and service fees | | | 122,153 | |
Deferred trustees’ fees | | | 76,702 | |
Other expenses | | | 900,483 | |
| | | | |
Total Liabilities | | | 1,158,675,998 | |
| | | | |
Net Assets | | $ | 3,927,420,564 | |
| | | | |
Net Assets Consist of: | | | | |
Paid in surplus | | $ | 3,821,287,074 | |
Undistributed net investment income | | | 55,177,312 | |
Accumulated net realized loss | | | (20,376,311 | ) |
Unrealized appreciation on investments, written options, futures contracts, swap contracts and foreign currency transactions (i) | | | 71,332,489 | |
| | | | |
Net Assets | | $ | 3,927,420,564 | |
| | | | |
Net Assets | | | | |
Class A | | $ | 3,272,801,534 | |
Class B | | | 530,715,526 | |
Class E | | | 123,903,504 | |
Capital Shares Outstanding* | | | | |
Class A | | | 30,258,906 | |
Class B | | | 4,989,068 | |
Class E | | | 1,155,236 | |
Net Asset Value, Offering Price and Redemption Price Per Share | | | | |
Class A | | $ | 108.16 | |
Class B | | | 106.38 | |
Class E | | | 107.25 | |
| * | The Portfolio is authorized to issue an unlimited number of shares. |
| (a) | Identified cost of investments was $4,279,545,863. |
| (b) | Includes securities loaned at value of $114,113,484. |
| (c) | Identified cost of cash denominated in foreign currencies was $8,048,528. |
| (d) | Includes collateral of $2,310,000 for OTC swap contracts and $15,058,870 for centrally cleared swap contracts. |
| (e) | Net premium received on OTC swap contracts was $2,677,182. |
| (f) | Included within TBA securities sold is $399,804,232 related to TBA forward sale commitments and included within TBA securities purchased is $104,665,353 related to TBA forward sale commitments. |
| (g) | Premiums received on written options were $627,062. |
| (h) | Net premium paid on OTC swap contracts was $535,871. |
| (i) | Includes foreign capital gains tax of $37,527. |
Statement of Operations
Six Months Ended June 30, 2016
| | | | |
Investment Income | |
Dividends | | $ | 487,377 | |
Interest | | | 58,569,543 | |
Securities lending income | | | 122,507 | |
| | | | |
Total investment income | | | 59,179,427 | |
Expenses | | | | |
Management fees | | | 6,179,057 | |
Administration fees | | | 48,099 | |
Custodian and accounting fees | | | 424,751 | |
Distribution and service fees—Class B | | | 637,042 | |
Distribution and service fees—Class E | | | 92,231 | |
Interest expense | | | 71,913 | |
Audit and tax services | | | 56,734 | |
Legal | | | 13,597 | |
Trustees’ fees and expenses | | | 15,990 | |
Shareholder reporting | | | 128,215 | |
Insurance | | | 13,295 | |
Miscellaneous | | | 15,287 | |
| | | | |
Total expenses | | | 7,696,211 | |
| | | | |
Net Investment Income | | | 51,483,216 | |
| | | | |
Net Realized and Unrealized Gain (Loss) | | | | |
| Net realized gain (loss) on: | | | | |
Investments (a) | | | (16,993,342 | ) |
Futures contracts | | | 18,490,545 | |
Written options | | | 4,849,514 | |
Swap contracts | | | (309,176 | ) |
Foreign currency transactions | | | (2,632,364 | ) |
| | | | |
Net realized gain | | | 3,405,177 | |
| | | | |
| Net change in unrealized appreciation (depreciation) on: | | | | |
Investments (b) | | | 129,529,022 | |
Futures contracts | | | 8,263,521 | |
Written options | | | (739,332 | ) |
Swap contracts | | | (3,122,892 | ) |
Foreign currency transactions | | | 3,758,653 | |
| | | | |
Net change in unrealized appreciation | | | 137,688,972 | |
| | | | |
Net realized and unrealized gain | | | 141,094,149 | |
| | | | |
Net Increase in Net Assets From Operations | | $ | 192,577,365 | |
| | | | |
| (a) | Net of foreign capital gains tax of $55,870. |
| (b) | Includes change in foreign capital gains tax of $(37,527). |
See accompanying notes to financial statements.
MSF-41
Metropolitan Series Fund
BlackRock Bond Income Portfolio
Statements of Changes in Net Assets
| | | | | | | | |
| | | Six Months
Ended
June 30, 2016 | | | Year Ended
December 31,
2015 | |
Increase (Decrease) in Net Assets: | | | | | | | | |
From Operations | | | | | | | | |
Net investment income | | $ | 51,483,216 | | | $ | 102,501,031 | |
Net realized gain | | | 3,405,177 | | | | 23,661,490 | |
Net change in unrealized appreciation (depreciation) | | | 137,688,972 | | | | (99,056,856 | ) |
| | | | | | | | |
Increase in net assets from operations | | | 192,577,365 | | | | 27,105,665 | |
| | | | | | | | |
From Distributions to Shareholders | | | | | | | | |
Net investment income | | | | | | | | |
Class A | | | (102,987,554 | ) | | | (133,507,891 | ) |
Class B | | | (15,546,181 | ) | | | (19,257,211 | ) |
Class E | | | (3,722,162 | ) | | | (5,052,422 | ) |
Net realized capital gains | | | | | | | | |
Class A | | | 0 | | | | (39,098,515 | ) |
Class B | | | 0 | | | | (6,006,393 | ) |
Class E | | | 0 | | | | (1,544,832 | ) |
| | | | | | | | |
Total distributions | | | (122,255,897 | ) | | | (204,467,264 | ) |
| | | | | | | | |
Increase (decrease) in net assets from capital share transactions | | | 38,771,825 | | | | (354,447,512 | ) |
| | | | | | | | |
Total increase (decrease) in net assets | | | 109,093,293 | | | | (531,809,111 | ) |
| | |
Net Assets | | | | | | | | |
Beginning of period | | | 3,818,327,271 | | | | 4,350,136,382 | |
| | | | | | | | |
End of period | | $ | 3,927,420,564 | | | $ | 3,818,327,271 | |
| | | | | | | | |
Undistributed net investment income | | | | | | | | |
End of period | | $ | 55,177,312 | | | $ | 125,949,993 | |
| | | | | | | | |
Other Information:
Capital Shares
Transactions in capital shares were as follows:
| | | | | | | | | | | | | | | | |
| | | Six Months Ended
June 30, 2016 | | | Year Ended
December 31, 2015 | |
| | | Shares | | | Value | | | Shares | | | Value | |
Class A | | | | | | | | | | | | | | | | |
Sales | | | 1,376,963 | | | $ | 151,002,952 | | | | 1,013,267 | | | $ | 112,853,439 | |
Reinvestments | | | 960,257 | | | | 102,987,554 | | | | 1,627,901 | | | | 172,606,406 | |
Redemptions | | | (2,020,288 | ) | | | (216,956,087 | ) | | | (5,922,458 | ) | | | (646,280,255 | ) |
| | | | | | | | | | | | | | | | |
Net increase (decrease) | | | 316,932 | | | $ | 37,034,419 | | | | (3,281,290 | ) | | $ | (360,820,410 | ) |
| | | | | | | | | | | | | | | | |
Class B | | | | | | | | | | | | | | | | |
Sales | | | 283,438 | | | $ | 30,237,948 | | | | 554,079 | | | $ | 59,688,701 | |
Reinvestments | | | 147,371 | | | | 15,546,181 | | | | 242,105 | | | | 25,263,604 | |
Redemptions | | | (370,243 | ) | | | (39,257,626 | ) | | | (626,260 | ) | | | (66,816,921 | ) |
| | | | | | | | | | | | | | | | |
Net increase | | | 60,566 | | | $ | 6,526,503 | | | | 169,924 | | | $ | 18,135,384 | |
| | | | | | | | | | | | | | | | |
Class E | | | | | | | | | | | | | | | | |
Sales | | | 35,279 | | | $ | 3,795,099 | | | | 57,831 | | | $ | 6,284,511 | |
Reinvestments | | | 34,996 | | | | 3,722,162 | | | | 62,736 | | | | 6,597,254 | |
Redemptions | | | (114,728 | ) | | | (12,306,358 | ) | | | (228,209 | ) | | | (24,644,251 | ) |
| | | | | | | | | | | | | | | | |
Net decrease | | | (44,453 | ) | | $ | (4,789,097 | ) | | | (107,642 | ) | | $ | (11,762,486 | ) |
| | | | | | | | | | | | | | | | |
Increase (decrease) derived from capital shares transactions | | | | | | $ | 38,771,825 | | | | | | | $ | (354,447,512 | ) |
| | | | | | | | | | | | | | | | |
See accompanying notes to financial statements.
MSF-42
Metropolitan Series Fund
BlackRock Bond Income Portfolio
Financial Highlights
| | | | | | | | | | | | | | | | | | | | | | | | |
| Selected per share data | | | | | | | | | | | | | | | | | | |
| | | Class A | |
| | | Six Months
Ended
June 30,
2016 | | | Year Ended December 31, | |
| | | | 2015 | | | 2014 | | | 2013 | | | 2012 | | | 2011 | |
Net Asset Value, Beginning of Period | | $ | 106.14 | | | $ | 110.97 | | | $ | 107.33 | | | $ | 115.27 | | | $ | 110.90 | | | $ | 108.32 | |
| | | | | | | | | | | | | | | | | | | | | | | | |
Income (Loss) from Investment Operations | | | | | | | | | | | | | | | | | | | | | | | | |
Net investment income (a) | | | 1.50 | | | | 2.73 | | | | 3.18 | | | | 3.36 | | | | 3.21 | | | | 3.69 | |
Net realized and unrealized gain (loss) on investments | | | 4.03 | | | | (2.08 | ) | | | 4.28 | | | | (4.07 | ) | | | 4.95 | | | | 3.22 | |
| | | | | | | | | | | | | | | | | | | | | | | | |
Total from investment operations | | | 5.53 | | | | 0.65 | | | | 7.46 | | | | (0.71 | ) | | | 8.16 | | | | 6.91 | |
| | | | | | | | | | | | | | | | | | | | | | | | |
Less Distributions | | | | | | | | | | | | | | | | | | | | | | | | |
Distributions from net investment income | | | (3.51 | ) | | | (4.24 | ) | | | (3.82 | ) | | | (4.49 | ) | | | (3.05 | ) | | | (4.33 | ) |
Distributions from net realized capital gains | | | 0.00 | | | | (1.24 | ) | | | 0.00 | | | | (2.74 | ) | | | (0.74 | ) | | | 0.00 | |
| | | | | | | | | | | | | | | | | | | | | | | | |
Total distributions | | | (3.51 | ) | | | (5.48 | ) | | | (3.82 | ) | | | (7.23 | ) | | | (3.79 | ) | | | (4.33 | ) |
| | | | | | | | | | | | | | | | | | | | | | | | |
Net Asset Value, End of Period | | $ | 108.16 | | | $ | 106.14 | | | $ | 110.97 | | | $ | 107.33 | | | $ | 115.27 | | | $ | 110.90 | |
| | | | | | | | | | | | | | | | | | | | | | | | |
Total Return (%) (b) | | | 5.23 | (c) | | | 0.59 | | | | 7.08 | | | | (0.77 | ) | | | 7.55 | | | | 6.56 | |
| | | | | | |
Ratios/Supplemental Data | | | | | | | | | | | | | | | | | | | | | | | | |
Gross ratio of expenses to average net assets (%) | | | 0.37 | (d) | | | 0.36 | | | | 0.35 | | | | 0.35 | | | | 0.36 | | | | 0.37 | |
Net ratio of expenses to average net assets (%) (e) | | | 0.37 | (d) | | | 0.36 | | | | 0.35 | | | | 0.35 | | | | 0.36 | | | | 0.36 | |
Ratio of net investment income to average net assets (%) | | | 2.79 | (d) | | | 2.50 | | | | 2.91 | | | | 3.07 | | | | 2.85 | | | | 3.44 | |
Portfolio turnover rate (%) | | | 291 | (c)(f) | | | 824 | (f) | | | 679 | (f) | | | 801 | (f) | | | 1,002 | (f) | | | 1,483 | |
Net assets, end of period (in millions) | | $ | 3,272.8 | | | $ | 3,178.0 | | | $ | 3,686.9 | | | $ | 3,213.0 | | | $ | 3,474.3 | | | $ | 3,123.2 | |
| |
| | | Class B | |
| | | Six Months
Ended
June 30,
2016 | | | Year Ended December 31, | |
| | | | 2015 | | | 2014 | | | 2013 | | | 2012 | | | 2011 | |
Net Asset Value, Beginning of Period | | $ | 104.31 | | | $ | 109.16 | | | $ | 105.64 | | | $ | 113.56 | | | $ | 109.31 | | | $ | 106.83 | |
| | | | | | | | | | | | | | | | | | | | | | | | |
Income (Loss) from Investment Operations | | | | | | | | | | | | | | | | | | | | | | | | |
Net investment income (a) | | | 1.34 | | | | 2.42 | | | | 2.87 | | | | 3.05 | | | | 2.89 | | | | 3.48 | |
Net realized and unrealized gain (loss) on investments | | | 3.96 | | | | (2.05 | ) | | | 4.20 | | | | (4.01 | ) | | | 4.88 | | | | 3.06 | |
| | | | | | | | | | | | | | | | | | | | | | | | |
Total from investment operations | | | 5.30 | | | | 0.37 | | | | 7.07 | | | | (0.96 | ) | | | 7.77 | | | | 6.54 | |
| | | | | | | | | | | | | | | | | | | | | | | | |
Less Distributions | | | | | | | | | | | | | | | | | | | | | | | | |
Distributions from net investment income | | | (3.23 | ) | | | (3.98 | ) | | | (3.55 | ) | | | (4.22 | ) | | | (2.78 | ) | | | (4.06 | ) |
Distributions from net realized capital gains | | | 0.00 | | | | (1.24 | ) | | | 0.00 | | | | (2.74 | ) | | | (0.74 | ) | | | 0.00 | |
| | | | | | | | | | | | | | | | | | | | | | | | |
Total distributions | | | (3.23 | ) | | | (5.22 | ) | | | (3.55 | ) | | | (6.96 | ) | | | (3.52 | ) | | | (4.06 | ) |
| | | | | | | | | | | | | | | | | | | | | | | | |
Net Asset Value, End of Period | | $ | 106.38 | | | $ | 104.31 | | | $ | 109.16 | | | $ | 105.64 | | | $ | 113.56 | | | $ | 109.31 | |
| | | | | | | | | | | | | | | | | | | | | | | | |
Total Return (%) (b) | | | 5.11 | (c) | | | 0.34 | | | | 6.81 | | | | (1.01 | ) | | | 7.28 | | | | 6.30 | |
| | | | | | |
Ratios/Supplemental Data | | | | | | | | | | | | | | | | | | | | | | | | |
Gross ratio of expenses to average net assets (%) | | | 0.62 | (d) | | | 0.61 | | | | 0.60 | | | | 0.60 | | | | 0.61 | | | | 0.62 | |
Net ratio of expenses to average net assets (%) (e) | | | 0.62 | (d) | | | 0.61 | | | | 0.60 | | | | 0.60 | | | | 0.61 | | | | 0.61 | |
Ratio of net investment income to average net assets (%) | | | 2.53 | (d) | | | 2.26 | | | | 2.67 | | | | 2.82 | | | | 2.60 | | | | 3.25 | |
Portfolio turnover rate (%) | | | 291 | (c)(f) | | | 824 | (f) | | | 679 | (f) | | | 801 | (f) | | | 1,002 | (f) | | | 1,483 | |
Net assets, end of period (in millions) | | $ | 530.7 | | | $ | 514.1 | | | $ | 519.5 | | | $ | 488.1 | | | $ | 503.6 | | | $ | 477.1 | |
Please see following page for Financial Highlights footnote legend.
See accompanying notes to financial statements.
MSF-43
Metropolitan Series Fund
BlackRock Bond Income Portfolio
Financial Highlights
| | | | | | | | | | | | | | | | | | | | | | | | |
| Selected per share data | |
| | | Class E | |
| | | Six Months
Ended
June 30,
2016 | | | Year Ended December 31, | |
| | | | 2015 | | | 2014 | | | 2013 | | | 2012 | | | 2011 | |
Net Asset Value, Beginning of Period | | $ | 105.18 | | | $ | 110.00 | | | $ | 106.41 | | | $ | 114.32 | | | $ | 110.02 | | | $ | 107.49 | |
| | | | | | | | | | | | | | | | | | | | | | | | |
Income (Loss) from Investment Operations | | | | | | | | | | | | | | | | | | | | | | | | |
Net investment income (a) | | | 1.40 | | | | 2.55 | | | | 3.00 | | | | 3.18 | | | | 3.02 | | | | 3.63 | |
Net realized and unrealized gain (loss) on investments | | | 3.99 | | | | (2.07 | ) | | | 4.23 | | | | (4.04 | ) | | | 4.91 | | | | 3.07 | |
| | | | | | | | | | | | | | | | | | | | | | | | |
Total from investment operations | | | 5.39 | | | | 0.48 | | | | 7.23 | | | | (0.86 | ) | | | 7.93 | | | | 6.70 | |
| | | | | | | | | | | | | | | | | | | | | | | | |
Less Distributions | | | | | | | | | | | | | | | | | | | | | | | | |
Distributions from net investment income | | | (3.32 | ) | | | (4.06 | ) | | | (3.64 | ) | | | (4.31 | ) | | | (2.89 | ) | | | (4.17 | ) |
Distributions from net realized capital gains | | | 0.00 | | | | (1.24 | ) | | | 0.00 | | | | (2.74 | ) | | | (0.74 | ) | | | 0.00 | |
| | | | | | | | | | | | | | | | | | | | | | | | |
Total distributions | | | (3.32 | ) | | | (5.30 | ) | | | (3.64 | ) | | | (7.05 | ) | | | (3.63 | ) | | | (4.17 | ) |
| | | | | | | | | | | | | | | | | | | | | | | | |
Net Asset Value, End of Period | | $ | 107.25 | | | $ | 105.18 | | | $ | 110.00 | | | $ | 106.41 | | | $ | 114.32 | | | $ | 110.02 | |
| | | | | | | | | | | | | | | | | | | | | | | | |
Total Return (%) (b) | | | 5.16 | (c) | | | 0.44 | | | | 6.92 | | | | (0.91 | ) | | | 7.38 | | | | 6.41 | |
| | | | | | |
Ratios/Supplemental Data | | | | | | | | | | | | | | | | | | | | | | | | |
Gross ratio of expenses to average net assets (%) | | | 0.52 | (d) | | | 0.51 | | | | 0.50 | | | | 0.50 | | | | 0.51 | | | | 0.52 | |
Net ratio of expenses to average net assets (%) (e) | | | 0.52 | (d) | | | 0.51 | | | | 0.50 | | | | 0.50 | | | | 0.51 | | | | 0.51 | |
Ratio of net investment income to average net assets (%) | | | 2.63 | (d) | | | 2.35 | | | | 2.78 | | | | 2.92 | | | | 2.70 | | | | 3.36 | |
Portfolio turnover rate (%) | | | 291 | (c)(f) | | | 824 | (f) | | | 679 | (f) | | | 801 | (f) | | | 1,002 | (f) | | | 1,483 | |
Net assets, end of period (in millions) | | $ | 123.9 | | | $ | 126.2 | | | $ | 143.8 | | | $ | 150.7 | | | $ | 176.2 | | | $ | 193.9 | |
| (a) | Per share amounts based on average shares outstanding during the period. |
| (b) | Total return does not reflect any insurance, sales, separate account or administrative charges of variable annuity or life insurance contracts or any additional expenses that contract owners may bear under their variable contracts. If these charges were included, the returns would be lower. |
| (c) | Periods less than one year are not computed on an annualized basis. |
| (d) | Computed on an annualized basis. |
| (e) | Includes the effects of management fee waivers (see Note 6 of the Notes to Financial Statements). |
| (f) | Includes mortgage dollar roll and TBA transactions; excluding these transactions the portfolio turnover rates would have been 87%, 278%, 276%, 267% and 390% for the six months ended June 30, 2016 and the years ended December 31, 2015, 2014, 2013 and 2012, respectively. |
See accompanying notes to financial statements.
MSF-44
Metropolitan Series Fund
BlackRock Bond Income Portfolio
Notes to Financial Statements—June 30, 2016
1. Organization
Metropolitan Series Fund (the “Trust”) is organized as a Delaware statutory trust and registered under the Investment Company Act of 1940, as amended (the “1940 Act”), as an open-end management investment company. The Trust, which is managed by MetLife Advisers, LLC (“MetLife Advisers” or the “Adviser”), an affiliate of MetLife, Inc., is currently comprised of thirty series, each of which operates as a distinct investment vehicle of the Trust. The portfolio included in this report is BlackRock Bond Income Portfolio (the “Portfolio”), which is diversified. Shares in the Portfolio are not offered directly to the general public and are currently available only to separate accounts established by Metropolitan Life Insurance Company (“MetLife”) and other affiliated life insurance companies.
The Portfolio has registered and offers three classes of shares: Class A, B and E shares. Shares of each Class of the Portfolio represent an equal pro rata interest in the Portfolio and generally give the shareholder the same voting, dividend, liquidation, and other rights. Investment income, realized and unrealized capital gains and losses, the common expenses of the Portfolio, and certain Portfolio-level expense reductions, if any, are allocated on a pro rata basis to each Class based on the relative net assets of each Class to the net assets of the Portfolio. Each Class of shares differs in its respective distribution plan and such distribution expenses are allocated to the corresponding Class of shares.
2. Significant Accounting Policies
The preparation of financial statements in conformity with accounting principles generally accepted in the United States of America (“GAAP”) requires management to make estimates and assumptions that affect the reported amounts of assets and liabilities and disclosure of contingent assets and liabilities as of the date of the financial statements and the reported amounts of income and expenses during the reporting period. Actual results could differ from those estimates. In the preparation of these financial statements, management has evaluated events and transactions subsequent to June 30, 2016 through the date the financial statements were issued.
The Portfolio is an investment company and follows the accounting and reporting guidance of the Financial Accounting Standards Board (“FASB”) Accounting Standards Codification Topic 946—Financial Services—Investment Companies and Topic 820—Fair Value Measurement. The following is a summary of significant accounting policies consistently followed by the Portfolio in the preparation of its financial statements.
Investment Valuation and Fair Value Measurements - Debt securities, including corporate, convertible and municipal bonds and notes; obligations of the U.S. Treasury and U.S. government agencies; foreign sovereign issues; and non-U.S. bonds, are generally valued on the basis of evaluated or composite bid quotations obtained from independent pricing services and/or brokers and dealers selected by the Adviser (each a “pricing service”), pursuant to authorization of and subject to general oversight by the Board of Trustees of the Trust (the “Board” or “Trustees”). Such pricing services may use matrix pricing, which considers observable inputs including, among other things, issuer details, maturity dates, interest rates, yield curves, rates of prepayment, credit risks/spreads, default rates, reported trades, broker dealer quotes and quoted prices for similar assets. Short-term obligations with a remaining maturity of sixty days or less may be valued at amortized cost in the absence of market quotes, so long as the amortized cost value of such short-term debt instrument is approximately the same as the fair value of the instrument as determined without the use of amortized cost valuation. Floating rate loans are generally valued on the basis of an evaluated or composite average of aggregate bid and ask quotations supplied by brokers or dealers, as obtained from the pricing service. Securities that use similar valuation techniques and inputs as described above are generally categorized as Level 2 within the fair value hierarchy.
Mortgage and asset-backed securities are generally valued on the basis of evaluated or composite bid quotations obtained from pricing services selected by the Adviser pursuant to authorization of and subject to general oversight by the Board. These securities are usually issued as separate tranches, or classes, of securities within each deal. The pricing models for these securities usually consider tranche-level attributes, current market data, estimated cash flows and market-based yield spreads for each tranche and incorporate deal collateral performance, as available. Mortgage and asset-backed securities that use similar valuation techniques and inputs as described above are generally categorized as Level 2 within the fair value hierarchy.
Domestic and foreign equity securities, such as common stock, exchange-traded funds, rights, warrants, and preferred stock, that are traded on a securities exchange on a valuation date are generally valued at their last quoted sale price or official closing price on the primary exchange for such security, or, if no sales occurred on that day, at the last reported bid price. Equity securities traded over-the-counter (“OTC”) are generally valued at the last reported bid price. In the event of a major exchange closing during the trading day, the Adviser may use other market information obtained from quotation reporting systems, established market makers, or pricing services in valuing the securities. Valuation adjustments may be applied to certain foreign equity securities that are traded solely on foreign exchanges that close before the time as of which the Portfolio determines its NAV to account for the market movement between the close of the foreign exchanges and the time as of which the Portfolio determines its NAV. The Portfolio may use a systematic fair valuation model provided by a pricing service to value securities principally traded in these foreign markets in order to adjust for possible market movements or other changes that may occur between the close of the foreign exchanges and the time as of
MSF-45
Metropolitan Series Fund
BlackRock Bond Income Portfolio
Notes to Financial Statements—June 30, 2016—(Continued)
which the Portfolio determines its NAV. Foreign equity securities valued using these valuation adjustments are generally categorized as Level 2 within the fair value hierarchy. Equity securities that are actively traded, and have no valuation adjustments applied, are categorized as Level 1 within the fair value hierarchy. Other equity securities traded on inactive markets, or valued in reference to similar instruments traded on active markets, are generally categorized as Level 2 within the fair value hierarchy.
Investments in registered open-end management investment companies are valued at reported net asset value per share on the valuation date and are categorized as Level 1 within the fair value hierarchy.
Foreign currency forward contracts are valued through an independent pricing service by interpolating between forward and spot currency rates in the London foreign exchange markets as of a designated hour on a valuation day. These contracts are generally categorized as Level 2 within the fair value hierarchy.
Options, whether on securities, indices, futures contracts, or otherwise, traded on exchanges are valued at the last sale price available as of the close of business on a valuation day or, if there is no such price available, at the last reported bid price. These types of options are categorized as Level 1 within the fair value hierarchy. Futures contracts that are traded on commodity exchanges are valued at their settlement prices established by the exchanges on which they are traded as of the close of such exchanges and are categorized as Level 1 within the fair value hierarchy.
Options, including swaptions, and futures contracts that are traded OTC are generally valued on the basis of interdealer bid and asked prices or prices provided by pricing service providers who use a series of techniques, including simulation pricing models, to determine the value of the contracts. The pricing models use inputs that are observed from actively quoted markets such as issuer details, indices, spreads, interest rates, yield curves, credit curves, measures of volatility and exchange rates. These contracts are generally categorized as Level 2 within the fair value hierarchy.
Swap contracts (other than centrally cleared swaps) are marked-to-market daily based on quotations and prices supplied by market makers, broker-dealers and other pricing services. Such quotations and prices are derived utilizing observable data, including the underlying reference securities or indices, credit spread quotations and expected default recovery rates determined by the pricing service. These contracts are generally categorized as Level 2 within the fair value hierarchy.
Centrally cleared swaps listed or traded on a multilateral or trade facility platform, such as a registered exchange, are valued at the daily settlement price determined by the respective exchange or a pricing service when the exchange price is not available. For centrally cleared credit default swaps, the clearing facility requires its members to provide actionable price levels across complete term structures. These levels along with external third party prices are used to produce daily settlement prices. These securities are categorized as Level 2 within the fair value hierarchy. Centrally cleared interest rate swaps are valued using a pricing model that references the underlying rates, including the overnight index swap rate and London Interbank Offered Rate (“LIBOR”) forward rate to produce the daily settlement price. These securities are categorized as Level 2 within the fair value hierarchy.
If no current market value quotation or other observable inputs are readily available or market value quotations are deemed to be unreliable for an investment, the fair value of the investment will be determined in accordance with procedures approved by, and under the general supervision of, the Board. In such a circumstance, the Board will be assisted in its responsibility to determine the fair value of an investment by the Valuation Committee (“Committee”) of MetLife Advisers. The Committee provides general pricing oversight and fair value pricing determinations related to portfolio securities and meets on a regular basis to review reports relating to the valuation of the securities in the Portfolio. The Board has delegated to State Street Bank and Trust Company, the Trust’s custodian (“custodian”), the responsibility for calculating the net asset values (“NAVs”) of the Trust’s Portfolios. The Committee is responsible for overseeing the calculation of the NAVs of the Portfolios by the custodian. The Committee also periodically reviews pricing services, including the pricing services providing fair value pricing for the Portfolio’s foreign securities, and is responsible for overseeing the correction of pricing errors and addressing other pricing issues that arise in the ordinary course of business, such as making real-time fair value determinations, as necessary.
No single standard for determining the fair value of an investment can be set forth because fair value depends upon the facts and circumstances with respect to each investment. Information relating to any relevant factors may be obtained by the Committee from any appropriate source, including the subadviser of the Portfolio, the custodian, a pricing service, market maker and/or broker for such security or the issuer. Appropriate methodologies for determining fair value under particular circumstances may include: matrix pricing, a discounted cash flow analysis, comparisons of securities with comparable characteristics, value based on multiples of earnings, discount from market price of similar marketable securities or a combination of these and other methods.
Investment Transactions and Related Investment Income - Portfolio security transactions are recorded on the trade date. Dividend income is recorded on the ex-dividend date or, for certain foreign securities, when notified. Interest income, which includes amortization of premium and accretion of discount on debt securities, is recorded on the accrual basis. Realized gains and losses on investments are determined on the identified cost basis, which is the same basis used for federal income tax purposes. Foreign income and foreign capital gains on some foreign securities may be subject to foreign taxes, which are accrued as applicable. These foreign taxes have been provided for in accordance with the Portfolio’s understanding of the applicable countries’ tax rules and rates.
MSF-46
Metropolitan Series Fund
BlackRock Bond Income Portfolio
Notes to Financial Statements—June 30, 2016—(Continued)
Foreign Currency Translation - The books and records of the Portfolio are maintained in U.S. dollars. The values of securities, currencies, and other assets and liabilities denominated in currencies other than the U.S. dollar are translated into U.S. dollars based upon foreign exchange rates prevailing at the end of the period. Purchases and sales of investment securities, income, and expenses are translated on the respective dates of such transactions. Because the values of investment securities are translated at the foreign exchange rates prevailing at the end of the period, that portion of the results of operations arising from changes in exchange rates and that portion of the results of operations reflecting fluctuations arising from changes in market prices of the investment securities are not separated. Such fluctuations are included in the net realized and unrealized gain or loss on investments.
Net realized foreign exchange gains or losses arise from activity in forward foreign currency exchange contracts, sales of foreign currency, currency gains or losses realized between the trade and settlement dates on securities transactions, and the difference between the amounts of dividends, interest, and foreign withholding taxes recorded by the Portfolio and the U.S. dollar equivalent of the amounts actually received or paid by the Portfolio. Net unrealized foreign exchange gains and losses arise from changes in the value of assets and liabilities, other than investment securities, resulting from changes in foreign exchange rates.
Dividends and Distributions to Shareholders - The Portfolio records dividends and distributions on the ex-dividend date. Net realized gains from securities transactions (if any) are generally distributed annually to shareholders. The timing and characterization of certain income and capital gains distributions are determined in accordance with federal tax regulations that may differ from GAAP. Permanent book and tax basis differences relating to shareholder distributions will result in reclassification between under/over distributed net investment income, accumulated net realized gains/losses, and paid-in surplus. Book-tax differences are primarily due to foreign currency transactions, amortization of debt securities, convertible preferred stock, paydown gain/loss reclasses, distribution redesignations, dollar roll transactions, and swap contract transactions. These adjustments have no impact on net assets or the results of operations.
Income Taxes - It is the Portfolio’s policy to comply with the requirements of the Internal Revenue Code of 1986, as amended, and regulations thereunder, applicable to regulated investment companies and to distribute, with respect to each taxable year, all of its taxable income to shareholders. Therefore, no federal income tax provision is required. The Portfolio files U.S. federal tax returns. No income tax returns are currently under examination. The Portfolio’s federal tax returns for the prior three fiscal years remain subject to examination by the Internal Revenue Service. As of June 30, 2016, the Portfolio had no uncertain tax positions that would require financial statement recognition, or de-recognition or disclosure.
Mortgage Dollar Rolls - The Portfolio may enter into mortgage “dollar rolls” in which a Portfolio sells to-be-announced (“TBA”) mortgage-backed securities for delivery in the current month and simultaneously contracts to repurchase substantially similar (same type, coupon, and maturity) securities on a specified future date. For the duration of the transaction, or roll period, the Portfolio foregoes principal (including prepayments of principal) and interest paid on the securities sold. Dollar rolls are accounted for as purchase and sale transactions; gain or loss is recognized at the commencement of the term of the dollar roll and each time the mortgage-backed security is rolled.
Treasury and mortgage dollar roll transactions involve the risk that the market value of the securities that the Portfolio is required to repurchase or reacquire may be less than the agreed-upon repurchase price of those securities and that the investment performance of securities purchased with proceeds from these transactions does not exceed the income, capital appreciation, and gain or loss that would have been realized on the securities transferred or sold, as applicable, as part of the treasury or mortgage dollar roll.
Mortgage-Related and Other Asset-Backed Securities - The Portfolio may invest in mortgage-related or other asset-backed securities. These securities may include mortgage pass-through securities, collateralized mortgage obligations (“CMOs”), commercial mortgage-backed securities, CMO residuals, stripped mortgage-backed securities (“SMBS”), and other securities that directly or indirectly represent a participation in, or are secured by or payable from, mortgage loans on real property or other receivables. The value of some mortgage- or asset-backed securities may be particularly sensitive to changes in prevailing interest rates. Early repayment of principal on some mortgage-related securities may expose the Portfolio to a lower rate of return upon reinvestment of principal. The value of these securities may fluctuate in response to the market’s perception of the creditworthiness of the issuers. Additionally, although mortgages and mortgage-related securities are generally supported by some form of government or private guarantee and/or insurance, there is no assurance that private guarantors or insurers will meet their obligations.
In one type of SMBS, one class receives all of the interest from the mortgage assets (the interest-only or “IO” class), while the other class will receive all of the principal (the principal-only or “PO” class). Because principal will not be received at the maturity of an IO, adjustments are made to the book value of the security until maturity. These adjustments are netted against payments received for the IOs and the net amount is included in interest income on the Statement of Operations of the Portfolio. Payments received for POs are treated as reductions to the cost and par value of the securities. Details of mortgage-related and other asset-backed securities held by the Portfolio are included in the Portfolio’s Schedule of Investments.
The Portfolio may invest a significant portion of its assets in securities of issuers that hold mortgage and asset-backed securities and direct investments in securities backed by commercial and residential mortgage loans and other financial assets. The value and
MSF-47
Metropolitan Series Fund
BlackRock Bond Income Portfolio
Notes to Financial Statements—June 30, 2016—(Continued)
related income of these securities are sensitive to changes in economic conditions, including delinquencies and/or defaults, and may be negatively impacted by increased volatility of market prices and periods of illiquidity.
TBA Purchase & Forward Sale Commitments - The Portfolio may enter into TBA commitments to purchase or sell securities for a fixed price at a future date. TBA commitments are considered securities in themselves, and involve a risk of loss if the value of the security to be purchased or sold declines or increases prior to settlement date, which is in addition to the risk of decline in the value of the Portfolio’s other assets. TBA forward sale commitments are valued at the current market value of the underlying securities, according to the procedures described under “Investment Valuation and Fair Value Measurements”.
When-Issued and Delayed-Delivery Securities - The Portfolio may purchase securities on a when-issued or delayed-delivery basis. Settlement of such transactions normally occurs within a month or more after the purchase commitment is made. The Portfolio may purchase securities under such conditions only with the intention of actually acquiring them, but may enter into a separate agreement to sell the securities before the settlement date. Since the value of securities purchased may fluctuate prior to settlement, the Portfolio may be required to pay more at settlement than the security is worth. In addition, the purchaser is not entitled to any of the interest earned prior to settlement.
Upon making a commitment to purchase a security on a when-issued or delayed-delivery basis, the Portfolio will hold liquid assets in a segregated account with the Portfolio’s custodian, or set aside liquid assets in the Portfolio’s records, worth at least the equivalent of the amount due. The liquid assets will be monitored on a daily basis and adjusted as necessary to maintain the necessary value.
High Yield Debt Securities - The Portfolio may invest in high yield debt securities, or “junk bonds,” which are securities that are rated below “investment grade” or, if not rated, are of equivalent quality. A portfolio with high yield debt securities generally will be exposed to greater market risk and credit risk than a portfolio that invests only in investment grade debt securities because issuers of high yield debt securities are generally less secure financially, are more likely to default on their obligations, and their securities are more sensitive to interest rate changes and downturns in the economy. In addition, the secondary market for lower-rated debt securities may not be as liquid as that for more highly rated debt securities. As a result, the Portfolio’s Subadviser may find it more difficult to value lower-rated debt securities or sell them and may have to sell them at prices significantly lower than the values assigned to them by the Portfolio.
Floating Rate Loans - The Portfolio may invest in loans arranged through private negotiation between one or more financial institutions. The Portfolio’s investment in any such loan may be in the form of a participation in or an assignment of the loan. In connection with purchasing participations, the Portfolio generally will have no right to enforce compliance by the borrower with the terms of the loan agreement relating to the loan, nor any rights of set-off against the borrower. The Portfolio may not benefit directly from any collateral supporting the loan in which it has purchased the participation or assignment. The purchase of assignments will typically result in the Portfolio having a direct contractual relationship with the borrower, and the Portfolio may enforce compliance by the borrower with the terms of the loan agreement.
The Portfolio may invest in multiple series or tranches of a loan, which may have varying terms and carry different associated risks. When the Portfolio purchases assignments it acquires direct rights against the borrower of the loan. These loans may include participations in bridge loans, which are loans taken out by borrowers for a short period (typically less than one year) pending arrangement of more permanent financing.
The Portfolio will assume the credit risk of both the borrower and the lender that is selling the participation. In the event of the insolvency of the lender selling the participation, the Portfolio may be treated as a general creditor of the lender and may not benefit from any set-off between the lender and the borrower.
Repurchase Agreements - The Portfolio may enter into repurchase agreements, under the terms of a Master Repurchase Agreement (“MRA”), with selected commercial banks and broker-dealers, under which the Portfolio acquires securities as collateral and agrees to resell the securities at an agreed-upon time and at an agreed-upon price. The Portfolio, through the custodian or a subcustodian, under a tri-party repurchase agreement, receives delivery of the underlying securities collateralizing any repurchase agreements. It is the Portfolio’s policy that the market value of the collateral be equal to at least 100% of the repurchase price in the case of a repurchase agreement of one-day duration and equal to at least 102% of the repurchase price in the case of all other repurchase agreements. In the event of default or failure by a party to perform an obligation in connection with any repurchase transaction, the MRA gives the non-defaulting party the right to set-off claims and to apply property held by it in connection with any repurchase transaction against obligations owed to it.
At June 30, 2016, the Portfolio had investments in repurchase agreements with a gross value of $198,683,389, which is included as part of investments at value on the Statement of Assets and Liabilities. The value of the related collateral exceeded the value of the repurchase agreements at June 30, 2016.
Securities Lending - The Portfolio may lend its portfolio securities to certain qualified brokers who borrow securities in order to complete certain securities transactions. By lending its portfolio securities, the Portfolio attempts to increase its net investment
MSF-48
Metropolitan Series Fund
BlackRock Bond Income Portfolio
Notes to Financial Statements—June 30, 2016—(Continued)
income through the receipt of income on collateral held from securities on loan. Any gain or loss in the market price of the loaned securities that might occur and any interest earned or dividends declared during the term of the loan would accrue to the account of the Portfolio.
The Trust has entered into a Securities Lending Authorization Agreement with the custodian as the lending agent. Under this agreement, the custodian is authorized to loan portfolio securities on the Portfolio’s behalf. In exchange, the Portfolio receives either cash or securities as collateral against the loaned securities. The Portfolio receives collateral equal to at least 102% of the market value of the loaned securities (105% for foreign equity securities), at each loan’s inception. Collateral representing at least 100% of the market value of the loaned securities must be maintained for the duration of the loan. Cash collateral is generally invested in the State Street Navigator Securities Lending MET Portfolio (the “Navigator Portfolio”), a series of the State Street Navigator Securities Lending Trust that is managed by an affiliate of the custodian. The Navigator Portfolio is a registered money market fund that invests in a variety of high-quality, U.S. dollar-denominated instruments. If the market value of the collateral at the close of trading on a business day is less than 100% of the market value of the loaned securities at the close of trading on that day, the borrower shall be required to deliver, by the close of business on the following business day, an additional amount of collateral, so that the total amount of posted collateral is equal to at least 100% of the market value of all the loaned securities as of such preceding day. A portion of net income (income after the deduction of expenses and fees of the Navigator Portfolio) on the collateral is rebated to the borrower of the securities and the remainder is split between the custodian and the Portfolio. On loans collateralized by U.S. Treasuries, a fee is received from the borrower and is allocated between the Portfolio and the custodian. Income received by the Portfolio in securities lending transactions during the six months ended June 30, 2016 is reflected as Securities lending income on the Statement of Operations. The values of any securities loaned by the Portfolio and the related collateral at June 30, 2016 are disclosed in the footnotes to the Schedule of Investments. The value of the related collateral received by the Portfolio exceeded the value of the securities out on loan at June 30, 2016.
The risks associated with lending portfolio securities include, but are not limited to, possible delays in receiving additional collateral or in the recovery of the loaned securities, possible loss of rights in the collateral should the borrower fail financially, as well as risk of loss in the value of the collateral or the value of the investments made with the collateral. The lending agent shall indemnify the Portfolio in the case of default of any securities borrower.
Reverse Repurchase Agreements - The Portfolio may enter into reverse repurchase agreements with qualified institutions. In a reverse repurchase agreement, the Portfolio transfers securities in exchange for cash to a financial institution or counterparty, concurrently with an agreement by the Portfolio to re-acquire the same securities at an agreed upon price and date. During the reverse repurchase agreement period, the Portfolio continues to receive principal and interest payments on these securities. The Portfolio will establish a segregated account with its custodian in which it will maintain liquid assets equal in value to its obligations in respect of reverse repurchase agreements. Reverse repurchase agreements involve the risk that the market value of the securities transferred by the Portfolio may decline below the agreed-upon reacquisition price of the securities. In the event of default or failure by a party to perform an obligation in connection with any reverse repurchase transaction, the MRA entitles the non-defaulting party with a right to set-off claims and apply property held by it in respect of any reverse repurchase transaction against obligations owed to it. Cash received in exchange for securities transferred under reverse repurchase agreements plus accrued interest payments to be made by the Portfolio to counterparties are reflected as Reverse repurchase agreements on the Statement of Assets and Liabilities.
For the six months ended June 30, 2016, the Portfolio had an outstanding reverse repurchase agreement balance for 77 days. The average amount of borrowings was $127,609,936 and the annualized weighted average interest rate was 0.25% during the 77 day period. There were no outstanding reverse repurchase agreements as of June 30, 2016.
Secured Borrowing Transactions - The Portfolio may enter into transactions consisting of a transfer of a security by the Portfolio to a financial institution or counterparty, with a simultaneous agreement to reacquire the same, or substantially the same security, at an agreed-upon price and future settlement date. Such transactions are treated as secured borrowings, and not as purchases and sales. The Portfolio receives cash from the transfer of the security to use for other investment purposes. During the term of the borrowing, the Portfolio is not entitled to receive principal and interest payments, if any, made on the security transferred to the counterparty during the term of the agreement. The difference between the transfer price and the reacquisition price, known as the “price drop”, is included in net investment income with the cost of the secured borrowing transaction being recorded as interest expense over the term of the borrowing.
MSF-49
Metropolitan Series Fund
BlackRock Bond Income Portfolio
Notes to Financial Statements—June 30, 2016—(Continued)
The following table provides a breakdown of the collateral received and the remaining contractual maturities for securities lending transactions, which are accounted for as secured borrowings.
| | | | | | | | | | | | | | | | | | | | |
| | | Remaining Contractual Maturity of the Agreements
As of June 30, 2016 | |
| | | Overnight and
Continuous | | | Up to
30 Days | | | 31 - 90
Days | | | Greater than
90 days | | | Total | |
| Securities Lending Transactions | | | | | | | | | | | | | | | | | | | | |
Corporate Bonds & Notes | | $ | (58,861,437 | ) | | $ | — | | | $ | — | | | $ | — | | | $ | (58,861,437 | ) |
Foreign Government | | | (9,502,820 | ) | | | — | | | | — | | | | — | | | | (9,502,820 | ) |
Preferred Stocks | | | (315,881 | ) | | | — | | | | — | | | | — | | | | (315,881 | ) |
Total | | $ | (68,680,138 | ) | | $ | — | | | $ | — | | | $ | — | | | $ | (68,680,138 | ) |
Total Borrowings | | $ | (68,680,138 | ) | | $ | — | | | $ | — | | | $ | — | | | $ | (68,680,138 | ) |
Gross amount of recognized liabilities for securities lending transactions | | | $ | (68,680,138 | ) |
| | | | | | | | | | | | | | | | | | | | |
3. Investments in Derivative Instruments
Forward Foreign Currency Exchange Contracts - The Portfolio may enter into forward foreign currency exchange contracts to obtain investment exposure, enhance return or hedge or protect its portfolio holdings against the risk of future movements in certain foreign currency exchange rates. When entering into these contracts, the Portfolio agrees to receive or deliver a fixed quantity of foreign currency for an agreed-upon price on an agreed-upon future date. These contracts are valued daily and the Portfolio’s net equity therein, representing unrealized gain or loss on the contracts as measured by the difference between the forward foreign exchange rates at the dates of entry into the contracts and the forward foreign exchange rates at the valuation date, is included in the Statement of Assets and Liabilities. When a contract is closed, the Portfolio recognizes a realized gain or loss equal to the difference between the value of the contract at the time it was opened and the value at the time it was closed.
Realized and unrealized gains and losses on forward foreign currency exchange contracts are included in the Statement of Operations. These contracts involve market and/or credit risk in excess of the amount recognized in the Statement of Assets and Liabilities. The use of forward foreign currency exchange contracts does not eliminate fluctuations in the underlying prices of the securities of the Portfolio, but it does establish a rate of exchange that can be achieved in the future. Although forward foreign currency exchange contracts may limit the risk of loss due to a decline in the value of the currency holdings, they also limit any potential gain that might result should the value of the currency increase. In addition, the Portfolio could be exposed to losses if the counterparties to the contracts are unable to meet the terms of the contracts. The Portfolio may also experience losses even when such contracts are used for hedging purposes. The Portfolio’s maximum potential loss from such contracts is the aggregate face value in U.S. dollars at the time the contract was opened.
Futures Contracts - The Portfolio may buy and sell futures contracts as a hedge, to maintain investment exposure to a target asset class or to enhance return. The Portfolio may be subject to fluctuations in equity prices, interest rates, commodity prices, and foreign currency exchange rates in the normal course of pursuing its investment objective. Futures contracts are standardized agreements to buy or sell a security, or deliver a final cash settlement price in connection with an index, interest rate, currency, or other asset. The Portfolio must deposit an amount (“initial margin”) equal to a certain percentage of the face value of the futures contract. The initial margin may be in the form of cash or securities, which is returned when the Portfolio’s obligations under the contract have been satisfied. If cash is deposited as the initial margin, it is shown as cash collateral on the Statement of Assets and Liabilities. Futures contracts are marked-to-market daily, and subsequent payments (“variation margin”) are made or received by the Portfolio depending on whether unrealized gains or losses are incurred. These amounts are reflected as receivables or payables on the Statement of Assets and Liabilities and as a component of net change in unrealized appreciation/depreciation on the Statement of Operations. When the contract is closed or expires, the Portfolio records a realized gain or loss equal to the difference between the value of the contract at the time it was opened and the value at the time it was closed. Risks of entering into futures contracts (and related options) include the possibility that the market for these instruments may be illiquid and that a change in the value of the contract or option may not correlate perfectly with changes in the value of the underlying instrument. If futures contracts are exchange-traded, the exchange’s clearinghouse, as counterparty to all exchange-traded futures, guarantees the futures contracts against default. For OTC futures, the Portfolio’s ability to terminate the positions may be more limited than in the case of exchange-traded positions and may also involve the risk that securities dealers participating in such transactions could fail to meet their obligations to the Portfolio.
Options Contracts - An option contract purchased by the Portfolio gives the Portfolio the right, but not the obligation, to buy (call) or sell (put) an underlying instrument at a fixed exercise price during a specified period. Call options written by the Portfolio give the holder the right to buy the underlying instrument from the Portfolio at a fixed exercise price; put options written by the Portfolio give the holder the right to sell the underlying instrument to the Portfolio at a fixed exercise price.
MSF-50
Metropolitan Series Fund
BlackRock Bond Income Portfolio
Notes to Financial Statements—June 30, 2016—(Continued)
The Portfolio may use options to hedge against changes in values of securities the Portfolio owns or expects to purchase, to maintain investment exposure to a target asset class or to enhance return. Writing puts or buying calls tends to increase the Portfolio’s exposure to the underlying instrument and writing calls or buying puts tends to decrease the Portfolio’s exposure to the underlying instrument, and can be used to hedge other Portfolio investments. For options used to hedge the Portfolio’s investments, the potential risk to the Portfolio is that the change in value of options contracts may not correspond perfectly to the change in value of the hedged instruments. The Portfolio also bears the risk of an unfavorable change in the value of the underlying instrument or the risk that the Portfolio may not be able to enter into a closing transaction due to an illiquid market. The Portfolio’s maximum risk of loss from counterparty credit risk, as opposed to investment and other types of risk, in respect of purchased options is typically the premium initially paid for the option plus any unrealized gains.
The main risk associated with purchasing an option is that the option expires without being exercised. In this case, the option is worthless when it expires and the premium paid for the option is considered a realized loss. The risk associated with writing a call option is that the Portfolio may forgo the opportunity for a profit if the market value of the underlying instrument increases and the option is exercised, requiring the Portfolio to sell the underlying instrument at a price below its market value. When the Portfolio writes a call option on a security it does not own, its exposure on such an option is theoretically unlimited. The risk in writing a put option is that the Portfolio may incur a loss if the market value of the underlying instrument decreases and the option is exercised, requiring the Portfolio to purchase the underlying instrument at a price above its market value. In addition, the Portfolio risks not being able to enter into a closing transaction for the written option as the result of an illiquid market for the option.
Purchases of put and call options are recorded as investments, the value of which are marked-to-market daily. When the Portfolio enters into a closing sale transaction, the Portfolio will realize a gain or loss depending on whether the sales proceeds from the closing sale transaction are greater or less than the premium initially paid for the option. When the Portfolio exercises a put option, it will realize a gain or loss from the sale of the underlying instrument and the proceeds from such sale will be decreased by the premium originally paid for the put option. When the Portfolio exercises a call option, the cost of the security which the Portfolio purchases upon exercise will be increased by the premium originally paid for the call option.
The premium received by the Portfolio for a written option is recorded as an asset and an equivalent liability. The liability is subsequently marked to market to reflect the current value of the option written. When a written option expires without being exercised or the Portfolio enters into a closing purchase transaction, the Portfolio realizes a gain (or loss if the cost of the closing purchase transaction exceeds the premium received when the option was sold) without regard to any unrealized gain or loss on the underlying instrument and the liability related to such option is eliminated. When a written call option is exercised, the Portfolio realizes a gain or loss, as adjusted for the premium received, from the sale of the underlying instrument. When a written put option is exercised, the premium received by the Portfolio is offset against the amount paid for the purchase of the underlying instrument.
The purpose of inflation-capped options is to protect the buyer from inflation, above a specified rate, eroding the value of investments in inflation-linked products with a given notional exposure. Inflation-capped options are used to give downside protection to investments in inflation-linked products by establishing a floor on the value of such products.
Options on swaps (“swaptions”) are similar to options on securities except that instead of selling or purchasing the right to buy or sell a security, the writer or purchaser of the swaptions is granting or buying the right to enter into a previously agreed upon interest rate or credit default swap agreement (interest rate risk and/or credit risk) at any time before the expiration of the option.
Options on Exchange-Traded Futures Contract (“Futures Option”) is an option contract in which the underlying instrument is a single futures contract.
Written Options
The Portfolio transactions in written options during the six months ended June 30, 2016:
| | | | | | | | | | | | |
Call Options | | Notional
Amount* | | | Number of
Contracts | | | Premium
Received | |
Options outstanding December 31, 2015 | | | 1,206,357,000 | | | | — | | | $ | 2,512,762 | |
Options written | | | 1,053,307,750 | | | | 3,348 | | | | 4,046,132 | |
Options bought back | | | (212,858,000 | ) | | | (2,812 | ) | | | (3,379,199 | ) |
Options exercised | | | (1,741,497,000 | ) | | | — | | | | (223,747 | ) |
Options expired | | | (237,313,750 | ) | | | — | | | | (2,522,367 | ) |
| | | | | | | | | | | | |
Options outstanding June 30, 2016 | | | 67,996,000 | | | | 536 | | | $ | 433,581 | |
| | | | | | | | | | | | |
MSF-51
Metropolitan Series Fund
BlackRock Bond Income Portfolio
Notes to Financial Statements—June 30, 2016—(Continued)
| | | | | | | | | | | | |
Put Options | | Notional
Amount* | | | Number
of
Contracts | | | Premium
Received | |
Options outstanding December 31, 2015 | | | 79,855,000 | | | | — | | | $ | 1,834,084 | |
Options written | | | 102,476,300 | | | | 198 | | | | 1,338,031 | |
Options bought back | | | (5,069,000 | ) | | | (198 | ) | | | (48,670 | ) |
Options exercised | | | (88,114,000 | ) | | | — | | | | (1,052,394 | ) |
Options expired | | | (86,308,300 | ) | | | — | | | | (1,877,570 | ) |
| | | | | | | | | | | | |
Options outstanding June 30, 2016 | | | 2,840,000 | | | | — | | | $ | 193,481 | |
| | | | | | | | | | | | |
| | * | Amount shown is in the currency in which the transaction was denominated. |
Swap Agreements - The Portfolio may enter into swap agreements in which the Portfolio and a counterparty agree to either make periodic net payments on a specified notional amount or net payment upon termination. Swap agreements are either privately negotiated in the OTC market (“OTC swaps”) or executed in a multilateral or other trade facility platform, such as a registered commodities exchange (“centrally-cleared swaps”). The Portfolio may enter into swap agreements for the purposes of managing exposure to interest rate, credit or market risk, or for other purposes. In connection with these agreements, securities or cash may be paid or received, as applicable, by the Portfolio as collateral or margin in accordance with the terms of the respective swap agreements to provide assets of value and recourse in the event of default or bankruptcy/insolvency. Securities posted by the Portfolio as collateral for swap contracts are identified in the Schedule of Investments and restricted cash, if any, is reflected on the Statement of Assets and Liabilities.
Centrally Cleared Swaps: Clearinghouses currently offer clearing derivative transactions which include interest rate and credit derivatives. In a cleared derivative transaction, a Portfolio typically enters into the transaction with a financial institution counterparty, and performance of the transaction is effectively guaranteed by a central clearinghouse, thereby reducing or eliminating the Portfolio’s exposure to the credit risk of the original counterparty. The Portfolio typically will be required to post specified levels of margin with the clearinghouse or at the instruction of the clearinghouse; the margin required by a clearinghouse may be greater than the margin the Portfolio would be required to post in an uncleared derivative transaction.
Swap agreements are marked-to-market daily. The fair value of an OTC swap is reflected on the Statement of Assets and Liabilities. The changes in value, if any, are reflected as a component of net change in unrealized appreciation/depreciation on the Statement of Operations. Daily changes in valuation of centrally cleared swaps, if any, are recorded as a receivable or payable for variation margin on the Statement of Assets and Liabilities and as a component of unrealized appreciation/depreciation on the Statement of Operations. Upfront payments paid or received upon entering into the swap agreement compensate for differences between the stated terms of the swap agreement and prevailing market conditions (such as credit spreads, currency exchange rates, interest rates, and other relevant factors). Upon termination or maturity of the swap, upfront premiums are recorded as realized gains or losses on the Statement of Operations. A liquidation payment received or made at the termination of the swap is recorded as realized gain or loss on the Statement of Operations. Net periodic payments received or paid by the Portfolio are included as part of realized gains or losses on the Statement of Operations.
Swap transactions involve, to varying degrees, elements of interest rate, credit, and market risk in excess of the amounts recognized in the Statement of Assets and Liabilities. Such risks involve the possibility that there will be no liquid market for these agreements, that the counterparty to the agreements may default on its obligation to perform, or that there may be unfavorable changes in market conditions or interest rates. In addition, entering into swap agreements involves documentation risk resulting from the possibility that the parties to a swap agreement may disagree as to the meaning of contractual terms in the agreement. The Portfolio may enter into swap transactions with counterparties in accordance with guidelines established by the Board. These guidelines provide for a minimum credit rating for each counterparty and various credit enhancement techniques (for example, collateralization of amounts due from counterparties) to limit exposure to counterparties that have lower credit ratings. A Portfolio’s maximum risk of loss from counterparty credit risk is the discounted value of the net cash flows to be received from the counterparty over the contract’s remaining life, to the extent that amount is positive, or the fair value of the contract. The risk may be mitigated by having a master netting arrangement between the Portfolio and the counterparty and by the posting of collateral by the counterparty to cover the Portfolio’s exposure to the counterparty. Counterparty risk related to centrally-cleared swaps is mitigated due to the protection against defaults provided by the exchange on which these contracts trade.
Credit Default Swaps: The Portfolio is subject to credit risk in the normal course of pursuing its investment objectives. The Portfolio may enter into credit default swaps to manage its exposure to the market or certain sectors of the market, to reduce its risk exposure to defaults of corporate and/or sovereign issuers, or to create exposure to corporate and/or sovereign issuers to which they are not otherwise exposed. Credit default swaps involve one party making a stream of payments (referred to as the buyer of protection) to another party (the seller of protection) in exchange for the right to receive a specified return if a credit event occurs for the referenced entity, obligation or index. A credit event is defined under the terms of each swap agreement and may include, but is not limited to, underlying entity default, bankruptcy, write-down, principal shortfall or interest shortfall. As the seller of protection, if an
MSF-52
Metropolitan Series Fund
BlackRock Bond Income Portfolio
Notes to Financial Statements—June 30, 2016—(Continued)
underlying credit event occurs, the Portfolio will either pay the buyer an amount equal to the notional amount of the swap and take delivery of the referenced obligation (or underlying securities comprising the referenced index), or pay a net settlement amount in the form of cash or securities equal to the notional amount of the swap less the recovery value of the referenced obligation (or underlying securities comprising the referenced index). In return, the Portfolio would receive from the counterparty an upfront or periodic stream of payments throughout the life of the credit default swap agreement provided that no credit event has occurred. As the seller of protection, the Portfolio will effectively add leverage to its portfolio because, in addition to its total net assets, the Portfolio would be subject to investment exposure on the notional amount of the credit default swap.
The Portfolio may also purchase credit default swap contracts in order to hedge against the risk of default of debt securities held in its portfolio. This would involve the risk that the investment may be worthless when it expires and would only generate income in the event of an actual default by the issuer of the underlying obligation (as opposed to a credit downgrade or other indication of financial instability). It would also involve credit risk, whereby the seller may fail to satisfy its payment obligations to the Portfolio in the event of a default. As the buyer of protection, if an underlying credit event occurs, the Portfolio will either receive from the seller of protection an amount equal to the notional amount of the swap and deliver the referenced obligation (or underlying securities comprising the referenced index), or receive a net settlement amount in the form of cash or securities equal to the notional amount of the swap less the recovery value of the referenced obligation (or underlying securities comprising the referenced index). If no credit event occurs and the Portfolio is a buyer of protection, the Portfolio will typically recover nothing under the credit default swap agreement, but it will have had to pay the required upfront payment or stream of continuing payments under the credit default swap agreement. Recovery values are at times established through the credit event auction process in which market participants are ensured that a transparent price has been set for the defaulted obligation.
Credit default swap agreements on credit indices involve one party making a stream of payments to another party in exchange for the right to receive a specified return in the event of a write-down, principal shortfall, interest shortfall or default of all or part of the referenced entities comprising the credit index. A credit index is a basket of credit instruments or exposures designed to be representative of some part of the credit market as a whole. An index credit default swap references all the names in the index, and if there is a credit event involving an entity in the index, the credit event is settled based on that entity’s weight in the index. A Portfolio may use credit default swaps on credit indices as a hedge for credit default swaps or bonds held in the portfolio, which is less expensive than it would be to buy many individual credit default swaps to achieve similar effect. Credit default swaps on indices are benchmarks for protecting investors owning bonds against default, and may be used to speculate on changes in credit quality.
Implied credit spreads, represented in absolute terms, utilized in determining the market value of credit default swap agreements on a credit index or corporate or sovereign issuer, serve as some indication of the status of the payment/performance risk and the likelihood or risk of default for the credit derivative. The implied credit spread of a particular referenced entity or index also reflects the cost of buying/selling protection and may reflect upfront payments required to be made to enter into the agreement. Wider credit spreads generally represent a deterioration of the referenced entity’s credit soundness and a greater likelihood or risk of default or other credit event occurring as defined under the terms of the particular swap agreement. When no implied credit spread is available for a credit default swap, the current unrealized appreciation/depreciation on the position may be used as an indicator of the current status of the payment/performance risk.
The maximum potential amount of future payments (undiscounted) that the Portfolio as a seller of protection could be required to make under a credit default swap agreement would be an amount equal to the notional amount of the agreement. Notional amounts of all credit default swap agreements outstanding as of June 30, 2016, for which the Portfolio is the seller of protection, are disclosed in the Schedule of Investments. These potential amounts would be partially offset by any recovery values of the respective referenced obligations, upfront payments received upon entering into the agreement or net amounts received from the settlement of buy protection credit default swap agreements entered into by the Portfolio for the same referenced entity or entities.
Interest Rate Swaps: The Portfolio may enter into interest rate swaps to manage its exposure to interest rates or to protect against currency fluctuations, to adjust the interest rate sensitivity (duration), to preserve a return or spread on a particular investment, or otherwise as a substitute for a direct investment in debt securities. The Portfolio is subject to interest rate risk exposure in the normal course of pursuing its investment objectives. Because the Portfolio holds fixed rate bonds, the value of these bonds may decrease if interest rates rise. To help hedge against this risk and to maintain its ability to generate income at prevailing market rates, the Portfolio may enter into interest rate swap agreements. Interest rate swaps are agreements in which one party pays a stream of interest payments, either fixed or floating rate, for another party’s stream of interest payments, either fixed or floating, on the same notional amount for a specified period of time. Other forms of interest rate swap agreements may include: (1) interest rate caps, under which, in return for a premium, one party agrees to make payments to the other to the extent that interest rates exceed a specified rate, or “cap”; (2) interest rate floors, under which, in return for a premium, one party agrees to make payments to the other to the extent that interest rates fall below a specified rate, or “floor”; and (3) interest rate collars, under which a party sells a cap and purchases a floor or vice versa in an attempt to protect itself against interest rate movements exceeding given minimum or maximum levels. The Portfolio’s maximum risk of loss from counterparty credit risk, as opposed to investment and other types of risk, in respect of interest rate swaps is typically the discounted net value of the cash flows to be received from the counterparty over the contract’s remaining life, to the extent that amount is positive.
MSF-53
Metropolitan Series Fund
BlackRock Bond Income Portfolio
Notes to Financial Statements—June 30, 2016—(Continued)
The following table summarizes the fair value of derivatives held by the Portfolio at June 30, 2016 by category of risk exposure:
| | | | | | | | | | | | |
| | | Asset Derivatives | | | Liability Derivatives | |
Risk Exposure | | Statement of Assets &
Liabilities Location | | Fair Value | | | Statement of Assets &
Liabilities Location | | Fair Value | |
Interest Rate | | Investments at market value (a) (b) | | $ | 170,625 | | | | | | | |
| | OTC swap contracts at market value (c) | | | 661,770 | | | OTC swap contracts at market value (c) | | | 933,477 | |
| | Unrealized appreciation on centrally cleared swap contracts (d) (e) | | | 92,341 | | | Unrealized depreciation on centrally cleared swap contracts (d) (e) | | | 7,823,843 | |
| | Unrealized appreciation on futures contracts (d) (f) | | | 10,119,420 | | | Unrealized depreciation on futures contracts (d) (f) | | | 1,121,556 | |
| | | | | | | | Written options at value (d) | | | 67,000 | |
Credit | | OTC swap contracts at market value (c) | | | 2,158,848 | | | OTC swap contracts at market value (c) | | | 1,638,217 | |
| | Unrealized appreciation on centrally cleared swap contracts (d) (e) | | | 2,165,601 | | | Unrealized depreciation on centrally cleared swap contracts (d) (e) | | | 1,107 | |
Foreign Exchange | | Investments at market value (a) | | | 971,117 | | | | | | | |
| | Unrealized appreciation on forward foreign currency exchange contracts | | | 6,661,358 | | | Unrealized depreciation on forward foreign currency exchange contracts | | | 5,601,287 | |
| | | | | | | | Written options at value | | | 397,690 | |
| | | | | | | | | | | | |
Total | | | | $ | 23,001,080 | | | | | $ | 17,584,177 | |
| | | | | | | | | | | | |
| | (a) | Represents purchased options which are part of investments as shown in the Statement of Assets and Liabilities. |
| | (b) | Includes exchange traded purchased options with a value of $170,625 that is not subject to a master netting agreement. |
| | (c) | Excludes OTC swap interest receivable of $39,863 and OTC swap interest payable of $202,342. |
| | (d) | Financial instrument not subject to a master netting agreement. |
| | (e) | Represents the unrealized appreciation/depreciation of centrally cleared swaps as reported in the Schedule of Investments. Only the variation margin is reported within the Statement of Assets and Liabilities. |
| | (f) | Includes cumulative appreciation/depreciation of futures contracts as reported in the Schedule of Investments. Only the current day’s variation margin is reported within the Statement of Assets and Liabilities. |
The Portfolio is required to disclose the impact of offsetting assets and liabilities represented in the Statement of Assets and Liabilities to enable users of the financial statements to evaluate the effect or potential effect of netting arrangements on its financial position for recognized assets and liabilities.
The following table presents the Portfolio’s derivative assets by counterparty net of amounts available for offset under a master netting agreement (“MNA”) (see Note 4), or similar agreement, and net of the related collateral received by the Portfolio as of June 30, 2016.
| | | | | | | | | | | | | | | | |
Counterparty | | Derivative Assets
subject to an MNA
by Counterparty | | | Financial
Instruments
available for offset | | | Collateral
Received† | | | Net
Amount* | |
Bank of America N.A. | | $ | 768,890 | | | $ | (305,993 | ) | | $ | (462,897 | ) | | $ | — | |
Barclays Bank plc | | | 1,266,836 | | | | (174,177 | ) | | | — | | | | 1,092,659 | |
BNP Paribas S.A. | | | 913,099 | | | | (365,900 | ) | | | (547,199 | ) | | | — | |
Citibank N.A. | | | 801,915 | | | | (536,360 | ) | | | (265,555 | ) | | | — | |
Credit Suisse International | | | 115,164 | | | | (115,164 | ) | | | — | | | | — | |
Deutsche Bank AG | | | 955,413 | | | | (823,176 | ) | | | — | | | | 132,237 | |
Goldman Sachs International | | | 1,036,528 | | | | (502,825 | ) | | | (533,703 | ) | | | — | |
HSBC Bank plc | | | 983,616 | | | | (955,364 | ) | | | — | | | | 28,252 | |
JPMorgan Chase Bank N.A. | | | 903,179 | | | | (903,179 | ) | | | — | | | | — | |
Morgan Stanley & Co. LLC | | | 3 | | | | — | | | | — | | | | 3 | |
Morgan Stanley & Co. International plc | | | 491,253 | | | | (491,253 | ) | | | — | | | | — | |
Morgan Stanley Capital Services, LLC | | | 96,150 | | | | (96,150 | ) | | | — | | | | — | |
Northern Trust Company | | | 378,482 | | | | — | | | | — | | | | 378,482 | |
Royal Bank of Scotland plc | | | 1,378,031 | | | | (509,929 | ) | | | — | | | | 868,102 | |
Standard Chartered Bank | | | 232,597 | | | | (221,277 | ) | | | — | | | | 11,320 | |
State Street Bank and Trust | | | 94,000 | | | | (94,000 | ) | | | — | | | | — | |
UBS AG | | | 37,937 | | | | (28,387 | ) | | | — | | | | 9,550 | |
| | | | | | | | | | | | | | | | |
| | $ | 10,453,093 | | | $ | (6,123,134 | ) | | $ | (1,809,354 | ) | | $ | 2,520,605 | |
| | | | | | | | | | | | | | | | |
MSF-54
Metropolitan Series Fund
BlackRock Bond Income Portfolio
Notes to Financial Statements—June 30, 2016—(Continued)
The following table presents the Portfolio’s derivative liabilities by counterparty net of amounts available for offset under an MNA, or similar agreement, and net of the related collateral pledged by the Portfolio as of June 30, 2016.
| | | | | | | | | | | | | | | | |
Counterparty | | Derivative Liabilities
subject to an MNA
by Counterparty | | | Financial
Instruments
available for offset | | | Collateral
Pledged† | | | Net
Amount** | |
Bank of America N.A. | | $ | 305,993 | | | $ | (305,993 | ) | | $ | — | | | $ | — | |
Barclays Bank plc | | | 174,177 | | | | (174,177 | ) | | | — | | | | — | |
BNP Paribas S.A. | | | 365,900 | | | | (365,900 | ) | | | — | | | | — | |
Citibank N.A. | | | 536,360 | | | | (536,360 | ) | | | — | | | | — | |
Credit Suisse International | | | 364,964 | | | | (115,164 | ) | | | (249,800 | ) | | | — | |
Deutsche Bank AG | | | 823,176 | | | | (823,176 | ) | | | — | | | | — | |
Goldman Sachs International | | | 502,825 | | | | (502,825 | ) | | | — | | | | — | |
HSBC Bank plc | | | 955,364 | | | | (955,364 | ) | | | — | | | | — | |
JPMorgan Chase Bank N.A. | | | 1,513,861 | | | | (903,179 | ) | | | (610,682 | ) | | | — | |
Morgan Stanley & Co. International plc | | | 1,058,880 | | | | (491,253 | ) | | | — | | | | 567,627 | |
Morgan Stanley Capital Services, LLC | | | 511,994 | | | | (96,150 | ) | | | (415,844 | ) | | | — | |
Nomura International plc | | | 56,122 | | | | — | | | | — | | | | 56,122 | |
Royal Bank of Canada | | | 647 | | | | — | | | | — | | | | 647 | |
Royal Bank of Scotland plc | | | 509,929 | | | | (509,929 | ) | | | — | | | | — | |
Societe Generale | | | 7,447 | | | | — | | | | — | | | | 7,447 | |
Standard Chartered Bank | | | 221,277 | | | | (221,277 | ) | | | — | | | | — | |
State Street Bank and Trust | | | 633,368 | | | | (94,000 | ) | | | — | | | | 539,368 | |
UBS AG | | | 28,387 | | | | (28,387 | ) | | | — | | | | — | |
| | | | | | | | | | | | | | | | |
| | $ | 8,570,671 | | | $ | (6,123,134 | ) | | $ | (1,276,326 | ) | | $ | 1,171,211 | |
| | | | | | | | | | | | | | | | |
| | * | Net amount represents the net amount receivable from the counterparty in the event of default. |
| | ** | Net amount represents the net amount payable due to the counterparty in the event of default. |
| | † | In some instances, the actual collateral received and/or pledged may be more than the amount shown here due to overcollateralization. |
The following tables summarize the effect of derivative instruments on the Statement of Operations, classified by derivative type and category of risk exposure, for the six months ended June 30, 2016:
| | | | | | | | | | | | | | | | |
Statement of Operations Location—Net Realized Gain (Loss) | | Interest Rate | | | Credit | | | Foreign
Exchange | | | Total | |
Investments (a) | | $ | (1,954,452 | ) | | $ | — | | | $ | (4,575,564 | ) | | $ | (6,530,016 | ) |
Forward foreign currency transactions | | | — | | | | — | | | | (3,924,472 | ) | | | (3,924,472 | ) |
Futures contracts | | | 18,490,545 | | | | — | | | | — | | | | 18,490,545 | |
Swap contracts | | | (503,601 | ) | | | 194,425 | | | | — | | | | (309,176 | ) |
Written options | | | (62,568 | ) | | | — | | | | 4,912,082 | | | | 4,849,514 | |
| | | | | | | | | | | | | | | | |
| | $ | 15,969,924 | | | $ | 194,425 | | | $ | (3,587,954 | ) | | $ | 12,576,395 | |
| | | | | | | | | | | | | | | | |
| | | | |
Statement of Operations Location—Net Change in Unrealized Appreciation
(Depreciation) | | Interest Rate | | | Credit | | | Foreign
Exchange | | | Total | |
Investments (a) | | $ | 18,527 | | | $ | — | | | $ | (857,898 | ) | | $ | (839,371 | ) |
Forward foreign currency transactions | | | — | | | | — | | | | 3,737,901 | | | | 3,737,901 | |
Futures contracts | | | 8,263,521 | | | | — | | | | — | | | | 8,263,521 | |
Swap contracts | | | (5,348,311 | ) | | | 2,225,419 | | | | — | | | | (3,122,892 | ) |
Written options | | | 37,343 | | | | — | | | | (776,675 | ) | | | (739,332 | ) |
| | | | | | | | | | | | | | | | |
| | $ | 2,971,080 | | | $ | 2,225,419 | | | $ | 2,103,328 | | | $ | 7,299,827 | |
| | | | | | | | | | | | | | | | |
MSF-55
Metropolitan Series Fund
BlackRock Bond Income Portfolio
Notes to Financial Statements—June 30, 2016—(Continued)
For the six months ended June 30, 2016, the average notional par or face amount outstanding for each derivative type was as follows:
| | | | |
Derivative Description | | Average
Notional Par or
Face Amount‡ | |
Investments (a) | | $ | 267,011,729 | |
Forward foreign currency transactions | | | 560,489,243 | |
Futures contracts long | | | 508,583,333 | |
Futures contracts short | | | (123,937,027 | ) |
Swap contracts | | | 974,280,220 | |
Written options | | | (212,030,388 | ) |
| | ‡ | Averages are based on activity levels during the period. |
| | (a) | Represents purchased options which are part of net realized gain (loss) on investments and net change in unrealized appreciation (depreciation) on investments as shown in the Statement of Operations. |
4. Certain Risks
In the normal course of business, the Portfolio invests in securities and enters into transactions where risks exist due to fluctuations in the market (“market risk”) or failure of the other party to a transaction to perform (“credit and counterparty risk”).
Market Risk: The value of securities held by the Portfolio may decline in response to certain events, including those directly involving the companies whose securities are owned by the Portfolio; conditions affecting the general economy; overall market changes; local, regional or global political, social or economic instability; and currency, interest rate, and price fluctuations.
Credit and Counterparty Risk: The Portfolio may be exposed to counterparty risk, or the risk that an entity with which the Portfolio has unsettled or open transactions may default. The potential loss could exceed the value of the financial assets and liabilities recorded in the financial statements. Financial assets that potentially expose the Portfolio to credit and counterparty risk consist principally of cash due from counterparties and investments. The Portfolio manages counterparty risk by entering into agreements only with counterparties that it believes have the financial resources to honor their obligations and by monitoring the financial stability of those counterparties. The Portfolio’s investment adviser attempts to mitigate counterparty risk by (i) periodically assessing the creditworthiness of its trading partners, (ii) monitoring and/or limiting the amount of its net exposure to each individual counterparty based on its assessment, and (iii) requiring collateral from the counterparty for certain transactions. In order to preserve certain safeguards for non-standard settlement trades, the Portfolio restricts its exposure to credit and counterparty losses by entering into master netting agreements (“Master Agreements”) with counterparties (approved brokers) with whom it undertakes a significant volume of transactions. Master Agreements govern the terms of certain transactions, and reduce the counterparty risk associated with relevant transactions by specifying credit protection mechanisms and providing standardization that improves legal certainty. Master Agreements can also help limit counterparty risk by specifying collateral posting arrangements at pre-arranged exposure levels. Collateral requirements may differ by type of derivative or investment, as applicable. Collateral or margin requirements are set by the broker or exchange clearing house for exchange-traded derivatives (e.g., futures contracts and exchange-traded options), while collateral terms are contract specific for OTC traded derivatives (e.g., forward foreign currency exchange contracts, swap agreements and OTC options).
For derivatives traded under an International Swaps and Derivatives Association, Inc. Master Agreement (“ISDA Master Agreement”) or similar master agreement, the collateral requirements are netted across all transactions traded under such agreement and one amount is posted from one party to the other to collateralize such obligations. The ISDA Master Agreement gives each party to the agreement the right to terminate all transactions traded under such agreement if there is a certain deterioration in the credit quality of the other party. The ISDA Master Agreement gives the Portfolio the right, upon an event of default by the applicable counterparty or a termination of the agreement, to close out all transactions traded under such agreement and to net amounts owed under each transaction to one net amount payable by one party to the other. This right to close out and net payments across all transactions traded under the ISDA Master Agreement could result in a reduction of the Portfolio’s credit risk to such counterparty equal to any amounts payable by the Portfolio under the applicable transactions, if any. However, absent an event of default by the counterparty or a termination of the agreement, the ISDA Master Agreement does not result in an offset of reported amounts of assets and liabilities in the Statement of Assets and Liabilities across transactions between the Portfolio and the applicable counterparty. The enforceability of the right to offset may vary by jurisdiction. Cash collateral that has been pledged to cover obligations of the Portfolio under derivative contracts, if any, will be reported separately in the Statement of Assets and Liabilities. Securities pledged as collateral, if any, for the same purpose are noted in the Schedule of Investments.
Repurchase and reverse repurchase agreements are primarily executed under Global Master Repurchase Agreements (“GMRAs”) or Master Repurchase Agreements (“MRAs”), which provide the rights to set-off. Each repurchase and reverse repurchase agreement is initially collateralized at the transaction level. In the event of default, the total market value exposure will be offset against collateral exchanged to date, which would result in a net receivable/(payable) that would be due from/to the counterparty.
MSF-56
Metropolitan Series Fund
BlackRock Bond Income Portfolio
Notes to Financial Statements—June 30, 2016—(Continued)
Master Securities Forward Transaction Agreements (“MSFTA”) govern the considerations and factors surrounding the settlement of certain forward settling transactions, such as TBA securities and delayed-delivery or secured borrowings transactions by and between the Portfolio and select counterparties. The MSFTA maintain provisions for, among other things, initiation and confirmation, payment and transfer, events of default, termination, and maintenance of collateral.
Customer Account Agreements and related addenda govern cleared derivatives transactions such as futures, options on futures, and cleared OTC derivatives. Cleared derivative transactions require posting of initial margin as determined by each relevant clearing agency, which is segregated at a broker account registered with the Commodities Futures Trading Commission (“CFTC”), or the applicable regulator. In the U.S., counterparty risk is significantly reduced as creditors of the futures broker do not have claim to Portfolio assets in the segregated account. Additionally, portability of exposure in the event of default further reduces risk to the Portfolio. Variation margin, or changes in market value, are exchanged daily, but may not be netted between futures and cleared OTC derivatives.
Foreign Investment Risk: The investments by the Portfolio in foreign securities may involve risks not present in domestic investments. Because securities may be denominated in foreign currencies, may require settlement in foreign currencies and may pay interest or dividends in foreign currencies, changes in the relationship of these foreign currencies to the U.S. dollar can significantly affect the value of the investments and earnings of the Portfolio. Foreign investments may also subject the Portfolio to foreign government exchange restrictions, expropriation, taxation or other political, social or economic developments, all of which could affect the market and/or credit risk of the investments. In addition to the risks described above, risks may arise from forward foreign currency contracts with respect to the potential inability of counterparties to meet the terms of their contracts.
Additional risks associated with each type of investment are described above within the respective security type notes. The Portfolio’s prospectus includes a discussion of the principal risks of investing in the Portfolio.
5. Investment Transactions
Aggregate cost of purchases and proceeds of sales of investment securities, including mortgage dollar roll and TBA transactions but excluding short-term securities, for the six months ended June 30, 2016 were as follows:
| | | | | | | | | | | | |
Purchases | | | Sales | |
U.S. Government | | Non U.S. Government | | | U.S. Government | | | Non U.S. Government | |
| $9,768,491,496 | | $ | 746,676,860 | | | $ | 9,734,421,636 | | | $ | 780,031,413 | |
The Portfolio engaged in security transactions with other accounts managed by BlackRock Advisors, LLC, that amounted to $4,135,976 in purchases and $11,757,711 in sales of investments, which are included above, and resulted in realized losses of $74,241.
Purchases and sales of mortgage dollar rolls and TBA transactions for the six months ended June 30, 2016 were as follows:
| | |
Purchases | | Sales |
| $7,266,258,827 | | $7,009,295,329 |
6. Investment Management Fees and Other Transactions with Affiliates
Investment Management Agreement - MetLife Advisers is the investment adviser to the Portfolio. The Trust has entered into an investment management agreement with MetLife Advisers with respect to the Portfolio. For providing investment management services to the Portfolio, MetLife Advisers receives monthly compensation at the following annual rates:
| | | | | | |
Management
Fees earned by
MetLife Advisers
for the six months ended
June 30, 2016 | | % per annum | | | Average Daily Net Assets |
| $6,179,057 | | | 0.400 | % | | Of the first $1 billion |
| | | 0.350 | % | | Of the next $1 billion |
| | | 0.300 | % | | Of the next $1 billion |
| | | 0.250 | % | | On amounts in excess of $3 billion |
MetLife Advisers has entered into an investment subadvisory agreement with respect to managing the Portfolio. BlackRock Advisors, LLC is compensated by MetLife Advisers to provide subadvisory services for the Portfolio.
MSF-57
Metropolitan Series Fund
BlackRock Bond Income Portfolio
Notes to Financial Statements—June 30, 2016—(Continued)
Management Fee Waivers - Pursuant to an expense agreement, MetLife Advisers has agreed, for the period May 1, 2016 to April 30, 2017, to reduce its advisory fees set out above under “Investment Management Agreement” for each class of the Portfolio as follows:
| | |
% per annum | | Average Daily Net Assets |
| 0.030% | | Of the first $1 billion |
| 0.025% | | Of the next $1 billion |
Any reductions in total advisory fees paid by the Portfolio due to these waivers may be reduced or eliminated by changes in the advisory fee structure at higher asset levels. MetLife Advisers will receive advisory fees equal to 0.325% of the Portfolio’s average daily net assets for amounts over $2 billion but less than $3 billion (0.025% over the contractual advisory fee rate) and 0.325% for amounts over $3 billion but less than $3.4 billion (0.075% over the contractual advisory fee rate). As a result, the dollar amount of the waiver will be reduced as assets grow beyond $2 billion up to $3.4 billion, but the advisory fee net of waivers will never exceed the contractual dollar amount that would otherwise be payable under the advisory fee.
An identical agreement was in place for the period May 1, 2015 to April 30, 2016. Amounts waived for the six months ended June 30, 2016 are shown as a management fee waiver in the Statement of Operations.
Certain officers and trustees of the Trust may also be officers of MetLife Advisers; however, such officers and trustees receive no compensation from the Trust.
On January 12, 2016, MetLife, Inc. announced its plan to pursue the separation of a substantial portion of its retail segment and is currently evaluating structural alternatives for such separation. It is anticipated that MetLife Advisers would be included in any such separation. Any separation transaction that might occur will be subject to the satisfaction of various conditions and approvals, including approval of any transaction by the MetLife, Inc. Board of Directors, satisfaction of any applicable requirements of the SEC, and receipt of insurance and other regulatory approvals and other anticipated conditions. Because the form of a separation had yet to be determined, MetLife, Inc. cannot currently provide a specific potential completion date or information about the potential impact on MetLife Advisers. No assurance can be given regarding the form that a separation transaction may take or the specific terms thereof, or that a separation will in fact occur. Depending on the form a separation takes, MetLife Advisers’ continued service as investment adviser to the Trusts could be subject to the satisfaction of various conditions and approvals, which may include obtaining approvals from the Trusts’ Board and shareholders.
Transfer Agency Agreement - MetLife serves as the transfer agent for the Trust. MetLife receives no fees for its services to the Trust under the transfer agency agreement.
Distribution and Service Fees - The Trust has a distribution agreement with MetLife Investors Distribution Company (“MIDC” or the “Distributor”) in which MIDC serves as the distributor for the Portfolio’s Class A, B and E Shares. MIDC is a wholly-owned subsidiary of MetLife Investors Group, LLC, an affiliate of the Adviser. The Trust has also adopted a Distribution and Service Plan under Rule 12b-1 of the 1940 Act for the Portfolio’s Class B and E Shares. Under the Distribution and Service Plan, the Class B and E Shares of the Portfolio pay a fee to compensate the Insurance Companies (or their affiliates) and other broker-dealers and financial intermediaries involved in the offer and sale of Portfolio shares for promoting or selling and servicing the Class B and E Shares. The fees under the Distribution and Service Plan for each class of the Portfolio’s shares are calculated as a percentage of the Portfolio’s average daily net assets that are attributable to that Class. Currently, the fee is 0.25% per year for Class B Shares and 0.15% per year for Class E Shares. Amounts incurred by the Portfolio for the six months ended June 30, 2016 are shown as Distribution and service fees in the Statement of Operations.
Deferred Trustee Compensation - Each Trustee who is not currently an employee of the Adviser or any of its affiliates receives compensation from the Trust for his or her service to the Trust. A deferred compensation plan (the “Plan”) is available to the Trustees on a voluntary basis. Deferred amounts remain in the Trust until distributed in accordance with the provisions of the Plan. The value of a participating Trustee’s deferral account is based on theoretical investments of deferred amounts on the normal payment dates in certain portfolios of the Trust or Met Investors Series Trust, an affiliate of the Trust, as designated by the participating Trustee. Changes in the value of participants’ deferral accounts are reflected as Trustees’ fees and expenses in the Statement of Operations. The portion of the accrued obligations allocated to the Portfolio under the Plan is reflected as Deferred trustees’ fees in the Statement of Assets and Liabilities.
7. Contractual Obligations
Under the Trust’s organizational documents, its officers and Trustees may be indemnified against certain liabilities and expenses arising out of the performance of their duties to the Trust. Additionally, the Trust has a variety of indemnification obligations under contracts with its service providers. The Trust’s maximum exposure under these arrangements is unknown, as this would involve future claims that may be made against the Trust that have not yet occurred.
MSF-58
Metropolitan Series Fund
BlackRock Bond Income Portfolio
Notes to Financial Statements—June 30, 2016—(Continued)
8. Income Tax Information
The tax character of distributions paid for the years ended December 31, 2015 and 2014 were as follows:
| | | | | | | | | | | | | | | | | | | | |
Ordinary Income | | | Long-Term Capital Gain | | | Total | |
2015 | | 2014 | | | 2015 | | | 2014 | | | 2015 | | | 2014 | |
| $190,475,439 | | $ | 135,238,241 | | | $ | 13,991,825 | | | $ | — | | | $ | 204,467,264 | | | $ | 135,238,241 | |
As of December 31, 2015, the components of distributable earnings (accumulated losses) on a federal income tax basis were as follows:
| | | | | | | | | | | | | | | | |
Undistributed
Ordinary
Income | | Undistributed
Long-Term
Capital Gain | | | Net
Unrealized
Depreciation | | | Other Accumulated
Capital Losses | | | Total | |
| $122,069,171 | | $ | — | | | $ | (71,996,875 | ) | | $ | (14,184,940 | ) | | $ | 35,887,356 | |
The Portfolio utilizes the provisions of the federal income tax laws that provide for the carryforward of capital losses for prior years, offsetting such losses against any future realized capital gains. Under the Regulated Investment Company Modernization Act of 2010 (the “Act”), net capital losses recognized after December 22, 2010 may be carried forward indefinitely and their character is retained as short-term and/or long-term losses. Previously, net capital losses were carried forward for up to eight years and treated as short-term losses. As a transition rule, the Act requires that post-enactment net capital losses be used before pre-enactment net capital losses.
As of December 31, 2015, the Portfolio had post-enactment accumulated long term capital losses of $14,184,940 and no pre-enactment accumulated capital loss carryforwards.
MSF-59
Metropolitan Series Fund
BlackRock Bond Income Portfolio
Report of Independent Registered Public Accounting Firm
To the Shareholders of BlackRock Bond Income Portfolio and the Board of Trustees of Metropolitan Series Fund:
We have audited the accompanying statement of assets and liabilities, including the schedule of investments, of BlackRock Bond Income Portfolio, one of the portfolios constituting Metropolitan Series Fund (the “Trust”), as of June 30, 2016, and the related statement of operations for the six months then ended, the statements of changes in net assets for the six months then ended and the year ended December 31, 2015, and the financial highlights for the six months then ended and each of the five years in the period ended December 31, 2015. These financial statements and financial highlights are the responsibility of the Trust’s management. Our responsibility is to express an opinion on these financial statements and financial highlights based on our audits.
We conducted our audits in accordance with the standards of the Public Company Accounting Oversight Board (United States). Those standards require that we plan and perform the audit to obtain reasonable assurance about whether the financial statements and financial highlights are free of material misstatement. The Trust is not required to have, nor were we engaged to perform, an audit of its internal control over financial reporting. Our audits included consideration of internal control over financial reporting as a basis for designing audit procedures that are appropriate in the circumstances, but not for the purpose of expressing an opinion on the effectiveness of the Trust’s internal control over financial reporting. Accordingly, we express no such opinion. An audit also includes examining, on a test basis, evidence supporting the amounts and disclosures in the financial statements, assessing the accounting principles used and significant estimates made by management, as well as evaluating the overall financial statement presentation. Our procedures included confirmation of securities owned as of June 30, 2016, by correspondence with the custodian and brokers; where replies were not received from brokers, we performed other auditing procedures. We believe that our audits provide a reasonable basis for our opinion.
In our opinion, such financial statements and financial highlights referred to above present fairly, in all material respects, the financial position of BlackRock Bond Income Portfolio of Metropolitan Series Fund as of June 30, 2016, the results of its operations for the six months then ended, the changes in its net assets for the six months then ended and the year ended December 31, 2015, and the financial highlights for the six months then ended and each of the five years in the period ended December 31, 2015, in conformity with accounting principles generally accepted in the United States of America.
/s/ Deloitte & Touche LLP
Boston, Massachusetts
August 25, 2016
MSF-60
Metropolitan Series Fund
BlackRock Capital Appreciation Portfolio
Managed By BlackRock Advisors, LLC
Portfolio Manager Commentary*
PERFORMANCE
For the six month period ended June 30, 2016, the Class A, B and E shares of the BlackRock Capital Appreciation Portfolio returned -4.16%, -4.31%, and -4.25%, respectively. The Portfolio’s benchmark, the Russell 1000 Growth Index1, returned 1.36%.
MARKET ENVIRONMENT / CONDITIONS
The U.S. equity market endured one of the more volatile first halves in recent years. The opening weeks of 2016 saw a double-digit decline as a familiar medley of macroeconomic concerns sparked fears of a global recession. Anxiety began to wane in February, and stocks proceeded to stage a powerful rally through the end of May, fueled by a rebound in oil prices and easing of global growth concerns. Volatility returned in June as an unexpectedly weak jobs report raised concerns about U.S. growth and, most significantly, U.K. voters elected to leave the European Union (‘Brexit’) in a surprising outcome that was at odds with polling data heading into the referendum. Equities sold off immediately following the Brexit decision, then recouped some of the losses in the final days of the reporting period.
By the numbers, the Portfolio’s benchmark, the Russell 1000 Growth Index, gained 1.36% for the six months. Telecommunication Services and Utilities were the top performers as the sectors were key beneficiaries of the flight to ‘defensive’ assets during the volatile first half. Their performance was further buoyed by investors’ desperate search for yield in the lower for longer interest rate environment. Energy was a relative leader in the period as well. Meanwhile, Health Care and Information Technology (“IT”) finished at the bottom.
PORTFOLIO REVIEW / PERIOD END POSITIONING
The Portfolio underperformed the Russell 1000 Growth Index during the six-month period.
After a strong finish to 2015, the Portfolio was not immune to the broader risk-off environment and momentum reversal that gripped markets at the start of 2016. Investors began the year favoring dividend stocks amid fears of negative interest rates, then broadly rotated to more traditional value stocks at the expense of growth/momentum names as the first quarter progressed. The rotation exacted the greatest toll on last year’s winners (regardless of sound fundamentals) and higher volatility stocks. Further challenging performance has been the resilience of safe-haven assets as the low/negative interest rate environment continued to attract domestic and foreign investors to high-dividend segments in their quest for yield. The Portfolio did rebound in the second quarter, but, unfortunately, it was not enough to offset the abovementioned weakness.
On a sector basis, Consumer Discretionary was the prime detractor from relative performance, with weakness most notable in the internet & catalog retail, media and specialty retail segments. Health care and IT also weighed on results, mainly with respect to biotechnology and IT services. Conversely, Energy and Materials were the top contributors to performance. Oil & gas holdings led in Energy, while chemicals was a standout in Materials. Financials also added value.
Looking at specific holdings, biotechnology companies Vertex Pharmaceuticals and United Therapeutics were among the top detractors. The stocks underperformed amid the broader market rotation away from volatility, momentum and growth in the first half of the reporting period, which had a particularly negative impact on the biotechnology segment. Shares of Vertex were further pressured by several near-term downward estimate revisions on the company’s newly-launched drug Orkambi (though peak sales for the drug remain constant).
Positions in Alliance Data Systems and TripAdvisor also weighed on results. Alliance Data Systems reported an in-line fourth quarter and reiterated 2016 guidance, but its guidance included slightly higher credit losses than previously forecasted due to 2015 coming in better than expected (the company is using the same end point in 2016). Given Alliance Data’s exposure to credit losses in a potential downturn and the higher increase in losses relative to 2015 (albeit the actual level of losses forecasted was the same), the stock sold off primarily on macroeconomic worries. TripAdvisor underperformed amid worries about the global economy and, specifically, global travel fundamentals regarding the terrorist attacks in Europe and fears about the Zika virus in Latin America. Adding to weakness in the shares were investor concerns about the company’s business transition to first party booking, especially in light of a challenging travel environment.
On the positive side, UnitedHealth and Amazon were the top contributors in the six-month period. UnitedHealth outperformed as its pharmacy benefit management (“PBM”) unit, which represents about 20% of profits, won the business of the California and Texas government workers retirees program, and General Electric. These wins suggest that UnitedHealth’s recent purchase of Catamaran (a smaller PBM) is being well received in the marketplace, and that the company could continue to take share if its promises of using the PBM relationship to lower overall medical costs for its customers (not just drug costs) bear out. Amazon shares outperformed after the company’s first-quarter results showed both a revenue acceleration and significant margin expansion, resulting in operating profit that beat expectations by almost 40%. Moreover, the company’s fastest-growing business, Amazon Web Services, continued to show strong revenue growth (63% year-over-year) and margin expansion.
Additional contributions came from positions in Tencent and Facebook. Tencent reported first-quarter revenue growth and margins that exceeded expectations. In addition, Weixin (a cross-platform instant messaging service developed by Tencent) user additions accelerated on a quarter-over-quarter basis, and the company’s outlook was bullish with respect to mobile games, subscriptions and advertising. Facebook outperformed earlier in the period after the company exceeded expectations for its fourth-quarter results by a wide margin. Revenues accelerated, margins topped expectations and the company’s plans for 2016 were in-line with expectations.
MSF-1
Metropolitan Series Fund
BlackRock Capital Appreciation Portfolio
Managed By BlackRock Advisors, LLC
Portfolio Manager Commentary*—(Continued)
At period end, we maintained our constructive outlook for U.S. stocks, against a backdrop of slow but durable economic growth and a likely recovery in earnings growth. Though the Brexit decision has elevated risk levels and increased fears around global growth, we believe any direct impact to the U.S. is likely to be minimal. Moreover, U.S. stocks could be the beneficiary of investment flows due to stronger growth prospects and increased earnings quality.
From a positioning standpoint, we continued to barbell the Portfolio, balancing best-in-class growth companies with low-volatility names that should perform well in a low-growth/low-interest-rate environment. The largest overweight in the Portfolio remained IT, driven by an emphasis on strong growth companies with attractive relative valuations. Industrials remained the largest Portfolio underweight as we expected orders to slow during the second quarter as large inventories were still being worked off. Instead, we remained overweight Energy, where we see better value and greater upside.
Lawrence Kemp
Portfolio Manager
BlackRock Advisors, LLC
* This commentary may include statements that constitute “forward-looking statements” under the U.S. securities laws. Forward-looking statements include, among other things, projections, estimates, and information about possible or future results related to the Portfolio, market or regulatory developments. The views expressed above are not guarantees of future performance or economic results and involve certain risks, uncertainties and assumptions that could cause actual outcomes and results to differ materially from the views expressed herein. The views expressed above are subject to change at any time based upon economic, market, or other conditions and the subadvisory firm undertakes no obligation to update the views expressed herein. Any discussions of specific securities should not be considered a recommendation to buy or sell those securities. The views expressed above (including any forward-looking statement) may not be relied upon as investment advice or as an indication of the Portfolio’s trading intent. Information about the Portfolio’s holdings, asset allocation or country diversification is historical and is not an indication of future Portfolio composition, which may vary. Direct investment in any index is not possible. The performance of any index mentioned in this commentary has not been adjusted for ongoing management, distribution and operating expenses, and sales charges applicable to mutual fund investments. In addition, the returns do not reflect additional fees charged by separate accounts or variable insurance contracts that an investor in the Portfolio may pay. If these additional fees were reflected, performance would have been lower.
MSF-2
Metropolitan Series Fund
BlackRock Capital Appreciation Portfolio
A $10,000 INVESTMENT COMPARED TO THE RUSSELL 1000 GROWTH INDEX
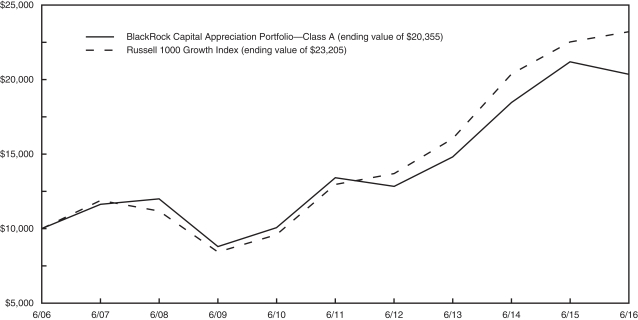
SIX MONTH RETURN & AVERAGE ANNUAL RETURNS (%) AS OF JUNE 30, 2016
| | | | | | | | | | | | | | | | |
| | | 6 Month | | | 1 Year | | | 5 Year | | | 10 Year | |
| BlackRock Capital Appreciation Portfolio | | | | | | | | | | | | | | | | |
Class A | | | -4.16 | | | | -3.95 | | | | 8.68 | | | | 7.37 | |
Class B | | | -4.31 | | | | -4.20 | | | | 8.41 | | | | 7.09 | |
Class E | | | -4.25 | | | | -4.11 | | | | 8.52 | | | | 7.20 | |
| Russell 1000 Growth Index | | | 1.36 | | | | 3.02 | | | | 12.34 | | | | 8.78 | |
1 The Russell 1000 Growth Index is an unmanaged measure of performance of the largest capitalized U.S. companies, within the Russell 1000 companies, that have higher price-to-book ratios and forecasted growth values.
Portfolio performance is calculated including reinvestment of all income and capital gain distributions. Performance numbers are net of all Portfolio expenses but do not include any insurance, sales, separate account or administrative charges of variable annuity or life insurance contracts or any additional expenses that participants may bear relating to the operations of their plans. If these charges were included, the returns would be lower. The performance of any index referenced above has not been adjusted for ongoing management, distribution and operating expenses, and sales charges applicable to mutual fund investments. Direct investment in any index is not possible. The performance of Class A shares, as set forth in the line graph above, will differ from that of other classes because of the difference in expenses paid by policyholders investing in the different share classes.
This information represents past performance and is not indicative of future results. Investment return and principal value may fluctuate so that shares, upon redemption, may be worth more or less than the original cost.
PORTFOLIO COMPOSITION AS OF JUNE 30, 2016
Top Holdings
| | | | |
| | | % of
Net Assets | |
| Alphabet, Inc. - Class A | | | 7.4 | |
| Amazon.com, Inc. | | | 6.7 | |
| Facebook, Inc. - Class A | | | 5.8 | |
| Visa, Inc. - Class A | | | 4.5 | |
| UnitedHealth Group, Inc. | | | 3.8 | |
| Anheuser-Busch InBev S.A.(ADR) | | | 3.3 | |
| Constellation Brands, Inc. - Class A | | | 3.1 | |
| Microsoft Corp. | | | 3.1 | |
| Berkshire Hathaway, Inc. - Class B | | | 2.9 | |
| Tencent Holdings, Ltd. | | | 2.8 | |
Top Sectors
| | | | |
| | | % of
Net Assets | |
| Information Technology | | | 35.8 | |
| Consumer Discretionary | | | 19.9 | |
| Health Care | | | 15.8 | |
| Consumer Staples | | | 10.4 | |
| Industrials | | | 4.7 | |
| Financials | | | 4.3 | |
| Materials | | | 2.9 | |
| Energy | | | 2.2 | |
| Telecommunication Services | | | 1.4 | |
MSF-3
Metropolitan Series Fund
BlackRock Capital Appreciation Portfolio
Understanding Your Portfolio’s Expenses (Unaudited)
Shareholder Expense Example
As a shareholder of the Portfolio, you incur ongoing costs, including management fees; distribution and service (12b-1) fees; and other Portfolio expenses. This example is intended to help you understand your ongoing costs (in dollars) (referred to as “expenses”) of investing in the Portfolio and compare these costs with the ongoing costs of investing in other mutual funds. The example is based on an investment of $1,000 invested at the beginning of the period and held for the entire period, January 1, 2016 through June 30, 2016.
Actual Expenses
The first line for each share class of the Portfolio in the table below provides information about actual account values and actual expenses. You may use the information in this line, together with the amount you invested in the particular share class of the Portfolio, to estimate the expenses that you paid over the period. Simply divide your account value by $1,000 (for example, an $8,600 account value divided by $1,000 = 8.6), then multiply the result by the number in the first line under the heading entitled “Expenses Paid During Period” to estimate the expenses you paid on your account during this period.
Hypothetical Example for Comparison Purposes
The second line for each share class of the Portfolio in the table below provides information about hypothetical account values and hypothetical expenses based on the Portfolio’s actual expense ratio and an assumed rate of return of 5% per year before expenses, which is not the Portfolio’s actual return. The hypothetical account values and expenses may not be used to estimate the actual ending account balance or expenses you paid for the period. You may use this information to compare the ongoing costs of investing in the Portfolio and other funds. To do so, compare this 5% hypothetical example with the 5% hypothetical examples that appear in the shareholder reports of the other funds.
Please note that the expenses shown in the table are meant to highlight your ongoing costs only and do not reflect any fees or charges of your variable insurance product or any additional expenses that participants in certain eligible qualified plans may bear relating to the operations of their plan. Therefore, the second line for each share class in the table is useful in comparing ongoing costs only, and will not help you determine the relative total costs of owning different funds. In addition, if these other costs were included, your costs would have been higher.
| | | | | | | | | | | | | | | | | | |
BlackRock Capital Appreciation Portfolio | | | | Annualized
Expense
Ratio | | | Beginning
Account Value
January 1,
2016 | | | Ending
Account Value
June 30,
2016 | | | Expenses Paid
During Period**
January 1, 2016
to
June 30,
2016 | |
Class A(a) | | Actual | | | 0.67 | % | | $ | 1,000.00 | | | $ | 958.40 | | | $ | 3.26 | |
| | Hypothetical* | | | 0.67 | % | | $ | 1,000.00 | | | $ | 1,021.53 | | | $ | 3.37 | |
| | | | | |
Class B(a) | | Actual | | | 0.92 | % | | $ | 1,000.00 | | | $ | 956.90 | | | $ | 4.48 | |
| | Hypothetical* | | | 0.92 | % | | $ | 1,000.00 | | | $ | 1,020.29 | | | $ | 4.62 | |
| | | | | |
Class E(a) | | Actual | | | 0.82 | % | | $ | 1,000.00 | | | $ | 957.50 | | | $ | 3.99 | |
| | Hypothetical* | | | 0.82 | % | | $ | 1,000.00 | | | $ | 1,020.79 | | | $ | 4.12 | |
* Hypothetical assumes a rate of return of 5% per year before expenses.
** Expenses paid are equal to the Portfolio’s annualized expense ratio for the most recent six month period, as shown above, multiplied by the average account value over the period, multiplied by the number of days (182 days) in the most recent fiscal half-year, divided by 366 (to reflect the one-half year period).
(a) The annualized expense ratio shown reflects the impact of the management fee waiver as described in Note 5 of the Notes to Financial Statements.
MSF-4
Metropolitan Series Fund
BlackRock Capital Appreciation Portfolio
Schedule of Investments as of June 30, 2016 (Unaudited)
Common Stocks—96.3% of Net Assets
| | | | | | | | |
| Security Description | | Shares | | | Value | |
|
Aerospace & Defense—2.0% | |
Honeywell International, Inc. | | | 131,160 | | | $ | 15,256,531 | |
TransDigm Group, Inc. (a) (b) | | | 73,719 | | | | 19,438,963 | |
| | | | | | | | |
| | | | | | | 34,695,494 | |
| | | | | | | | |
|
Beverages—6.4% | |
Anheuser-Busch InBev S.A. (ADR) | | | 439,358 | | | | 57,854,661 | |
Constellation Brands, Inc. - Class A | | | 320,674 | | | | 53,039,480 | |
| | | | | | | | |
| | | | | | | 110,894,141 | |
| | | | | | | | |
|
Biotechnology—3.6% | |
Alexion Pharmaceuticals, Inc. (a) | | | 41,885 | | | | 4,890,492 | |
Celgene Corp. (a) | | | 146,206 | | | | 14,420,298 | |
Regeneron Pharmaceuticals, Inc. (a) | | | 68,521 | | | | 23,929,589 | |
Vertex Pharmaceuticals, Inc. (a) | | | 214,486 | | | | 18,450,086 | |
| | | | | | | | |
| | | | | | | 61,690,465 | |
| | | | | | | | |
|
Chemicals—2.9% | |
Ecolab, Inc. | | | 150,492 | | | | 17,848,351 | |
Sherwin-Williams Co. (The) | | | 109,968 | | | | 32,294,303 | |
| | | | | | | | |
| | | | | | | 50,142,654 | |
| | | | | | | | |
|
Diversified Financial Services—2.9% | |
Berkshire Hathaway, Inc. - Class B (a) | | | 341,053 | | | | 49,381,064 | |
| | | | | | | | |
|
Diversified Telecommunication Services—1.4% | |
SBA Communications Corp. - Class A (a) | | | 229,660 | | | | 24,789,500 | |
| | | | | | | | |
|
Electrical Equipment—1.2% | |
Acuity Brands, Inc. (b) | | | 81,655 | | | | 20,247,174 | |
| | | | | | | | |
|
Food & Staples Retailing—3.4% | |
Costco Wholesale Corp. | | | 237,503 | | | | 37,297,471 | |
Walgreens Boots Alliance, Inc. | | | 261,731 | | | | 21,794,340 | |
| | | | | | | | |
| | | | | | | 59,091,811 | |
| | | | | | | | |
|
Food Products—0.6% | |
Mead Johnson Nutrition Co. | | | 106,005 | | | | 9,619,954 | |
| | | | | | | | |
|
Health Care Equipment & Supplies—4.1% | |
Becton Dickinson & Co. | | | 166,167 | | | | 28,180,262 | |
Boston Scientific Corp. (a) | | | 1,071,095 | | | | 25,031,490 | |
Intuitive Surgical, Inc. (a) | | | 26,859 | | | | 17,764,811 | |
| | | | | | | | |
| | | | | | | 70,976,563 | |
| | | | | | | | |
|
Health Care Providers & Services—4.6% | |
Humana, Inc. | | | 79,536 | | | | 14,306,936 | |
UnitedHealth Group, Inc. | | | 462,606 | | | | 65,319,967 | |
| | | | | | | | |
| | | | | | | 79,626,903 | |
| | | | | | | | |
|
Hotels, Restaurants & Leisure—2.6% | |
Chipotle Mexican Grill, Inc. (a) (b) | | | 51,880 | | | | 20,895,189 | |
Domino’s Pizza, Inc. | | | 109,343 | | | | 14,365,483 | |
Starbucks Corp. | | | 174,792 | | | | 9,984,119 | |
| | | | | | | | |
| | | | | | | 45,244,791 | |
| | | | | | | | |
|
Internet & Catalog Retail—12.1% | |
Amazon.com, Inc. (a) | | | 161,013 | | | | 115,224,123 | |
Netflix, Inc. (a) | | | 417,595 | | | | 38,201,591 | |
Priceline Group, Inc. (The) (a) | | | 30,422 | | | | 37,979,129 | |
TripAdvisor, Inc. (a) | | | 280,097 | | | | 18,010,237 | |
| | | | | | | | |
| | | | | | | 209,415,080 | |
| | | | | | | | |
|
Internet Software & Services—16.0% | |
Alphabet, Inc. - Class A (a) | | | 181,055 | | | | 127,377,624 | |
Facebook, Inc. - Class A (a) | | | 876,157 | | | | 100,127,222 | |
Tencent Holdings, Ltd. | | | 2,118,600 | | | | 48,320,141 | |
| | | | | | | | |
| | | | | | | 275,824,987 | |
| | | | | | | | |
|
IT Services—9.2% | |
Fiserv, Inc. (a) | | | 134,134 | | | | 14,584,390 | |
FleetCor Technologies, Inc. (a) | | | 267,597 | | | | 38,301,159 | |
Global Payments, Inc. | | | 377,795 | | | | 26,967,007 | |
Visa, Inc. - Class A (b) | | | 1,057,202 | | | | 78,412,672 | |
| | | | | | | | |
| | | | | | | 158,265,228 | |
| | | | | | | | |
|
Life Sciences Tools & Services—2.1% | |
Illumina, Inc. (a) | | | 254,094 | | | | 35,669,716 | |
| | | | | | | | |
|
Media—1.1% | |
Liberty Global plc - Class A (a) | | | 561,906 | | | | 16,328,988 | |
Liberty Global plc LiLAC - Class A (a) | | | 101,948 | | | | 3,288,839 | |
| | | | | | | | |
| | | | | | | 19,617,827 | |
| | | | | | | | |
|
Oil, Gas & Consumable Fuels—2.2% | |
Concho Resources, Inc. (a) | | | 186,911 | | | | 22,292,875 | |
EOG Resources, Inc. | | | 187,464 | | | | 15,638,247 | |
| | | | | | | | |
| | | | | | | 37,931,122 | |
| | | | | | | | |
|
Pharmaceuticals—1.4% | |
Allergan plc (a) | | | 106,054 | | | | 24,508,019 | |
| | | | | | | | |
|
Real Estate Investment Trusts—1.4% | |
Crown Castle International Corp. | | | 242,238 | | | | 24,570,200 | |
| | | | | | | | |
|
Road & Rail—1.5% | |
Norfolk Southern Corp. | | | 309,801 | | | | 26,373,359 | |
| | | | | | | | |
|
Semiconductors & Semiconductor Equipment—0.5% | |
Applied Materials, Inc. | | | 356,115 | | | | 8,536,077 | |
| | | | | | | | |
|
Software—7.8% | |
Activision Blizzard, Inc. | | | 1,071,268 | | | | 42,454,351 | |
Microsoft Corp. | | | 1,035,519 | | | | 52,987,507 | |
Salesforce.com, Inc. (a) | | | 496,494 | | | | 39,426,589 | |
| | | | | | | | |
| | | | | | | 134,868,447 | |
| | | | | | | | |
|
Specialty Retail—2.1% | |
Home Depot, Inc. (The) | | | 285,285 | | | | 36,428,042 | |
| | | | | | | | |
|
Technology Hardware, Storage & Peripherals—1.3% | |
Apple, Inc. | | | 240,004 | | | | 22,944,382 | |
| | | | | | | | |
See accompanying notes to financial statements.
MSF-5
Metropolitan Series Fund
BlackRock Capital Appreciation Portfolio
Schedule of Investments as of June 30, 2016 (Unaudited)
Common Stocks—(Continued)
| | | | | | | | |
| Security Description | | Shares/
Principal
Amount* | | | Value | |
|
Textiles, Apparel & Luxury Goods—1.9% | |
NIKE, Inc. - Class B | | | 608,431 | | | $ | 33,585,391 | |
| | | | | | | | |
Total Common Stocks
(Cost $1,454,688,998) | | | | | | | 1,664,938,391 | |
| | | | | | | | |
|
| Preferred Stock—1.0% | |
|
Software—1.0% | |
Palantir Technologies, Inc. - Series I (a) (c) (d)
(Cost $15,555,194) | | | 2,537,552 | | | | 18,244,999 | |
| | | | | | | | |
|
| Short-Term Investments—5.5% | |
|
Mutual Fund—1.2% | |
State Street Navigator Securities Lending MET Portfolio (e) | | | 20,070,039 | | | | 20,070,039 | |
| | | | | | | | |
|
Repurchase Agreement—4.3% | |
Fixed Income Clearing Corp. Repurchase Agreement dated 06/30/16 at 0.030% to be repurchased at $74,850,526 on 07/01/16, collateralized by $74,215,000 U.S. Treasury Note at 1.625% due 11/30/20 with a value of $76,348,681. | | | 74,850,463 | | | | 74,850,463 | |
| | | | | | | | |
Total Short-Term Investments
(Cost $94,920,502) | | | | | | | 94,920,502 | |
| | | | | | | | |
Total Investments—102.8%
(Cost $1,565,164,694) (f) | | | | | | | 1,778,103,892 | |
Other assets and liabilities (net)—(2.8)% | | | | | | | (49,189,572 | ) |
| | | | | | | | |
| Net Assets—100.0% | | | | | | $ | 1,728,914,320 | |
| | | | | | | | |
| * | Principal amount stated in U.S. dollars unless otherwise noted. |
| (a) | Non-income producing security. |
| (b) | All or a portion of the security was held on loan. As of June 30, 2016, the market value of securities loaned was $94,720,519 and the collateral received consisted of cash in the amount of $20,070,039 and non-cash collateral with a value of $79,568,485. The cash collateral is invested in a money market fund managed by an affiliate of the custodian. The non-cash collateral received consists primarily of government securities and bank letters of credit, and is held for the benefit of the Portfolio at the Portfolio’s custodian. The Portfolio cannot repledge or resell this collateral. As such, this collateral is excluded from the Statement of Assets and Liabilities. |
| (c) | Security was valued in good faith under procedures approved by the Board of Trustees. As of June 30, 2016, these securities represent 1.0% of net assets. |
| (d) | Restricted securities are not registered under the Securities Act of 1933 and are subject to legal restrictions on resale. These securities generally may be resold in transactions exempt from registration or to the public if the securities are subsequently registered. Disposal of these securities may involve time-consuming negotiations and prompt sale at an acceptable price may be difficult. As of June 30, 2016, the market value of restricted securities was $18,244,999, which is 1.0% of net assets. See details shown in the Restricted Securities table that follows. |
| (e) | Represents investment of cash collateral received from securities on loan as of June 30, 2016. |
| (f) | As of June 30, 2016, the aggregate cost of investments was $1,565,164,694. The aggregate unrealized appreciation and depreciation of investments were $251,941,126 and $(39,001,928), respectively, resulting in net unrealized appreciation of $212,939,198. |
| (ADR)— | An American Depositary Receipt is a certificate issued by a custodian bank representing the right to receive securities of the foreign issuer described. Trading on exchanges not located in the United States or Canada significantly influences the value of ADRs. |
| | | | | | | | | | | | | | | | |
Restricted Securities | | Acquisition
Date | | | Shares | | | Cost | | | Value | |
Palantir Technologies, Inc. - Series I | | | 02/07/14 | | | | 2,537,552 | | | $ | 15,555,194 | | | $ | 18,244,999 | |
See accompanying notes to financial statements.
MSF-6
Metropolitan Series Fund
BlackRock Capital Appreciation Portfolio
Schedule of Investments as of June 30, 2016 (Unaudited)
Fair Value Hierarchy
Accounting principles generally accepted in the United States of America (“GAAP”) define fair market value as the price that the Portfolio would receive to sell an asset or pay to transfer a liability in an orderly transaction between market participants at the measurement date. It establishes a fair value hierarchy that prioritizes inputs to valuation methods and requires disclosure of the fair value hierarchy, separately for each major category of assets and liabilities, that segregates fair value measurements into three levels. Levels 1, 2 and 3 of the fair value hierarchy are defined as follows:
Level 1 - unadjusted quoted prices in active markets for identical investments
Level 2 - other significant observable inputs (including, but not limited to, quoted prices for similar assets or liabilities in markets that are either active or inactive; inputs other than quoted prices that are observable such as interest rates, yield curves, volatilities, prepayment speeds, loss severities, credit risks, default rates, or other market corroborated inputs)
Level 3 - significant unobservable inputs based on the best information available in the circumstances, to the extent observable inputs are unavailable (including the Portfolio’s own assumptions used in determining the fair value of investments and derivative financial instruments)
The inputs or methodologies used for valuing investments are not necessarily an indication of the risk associated with investing in them. Changes to the inputs or methodologies used may result in transfers between levels, which will be recognized as of the beginning of the reporting period. Information on transfers between Level 1 and Level 2, if any, will be disclosed following the fair value hierarchy table below. A reconciliation of Level 3 securities, if any, will also be disclosed following the fair value hierarchy table. For more information about the Portfolio’s policy regarding the valuation of investments, please refer to the Notes to Financial Statements.
The following table summarizes the fair value hierarchy of the Portfolio’s investments as of June 30, 2016:
| | | | | | | | | | | | | | | | |
| Description | | Level 1 | | | Level 2 | | | Level 3 | | | Total | |
| Common Stocks | | | | | | | | | | | | | | | | |
Aerospace & Defense | | $ | 34,695,494 | | | $ | — | | | $ | — | | | $ | 34,695,494 | |
Beverages | | | 110,894,141 | | | | — | | | | — | | | | 110,894,141 | |
Biotechnology | | | 61,690,465 | | | | — | | | | — | | | | 61,690,465 | |
Chemicals | | | 50,142,654 | | | | — | | | | — | | | | 50,142,654 | |
Diversified Financial Services | | | 49,381,064 | | | | — | | | | — | | | | 49,381,064 | |
Diversified Telecommunication Services | | | 24,789,500 | | | | — | | | | — | | | | 24,789,500 | |
Electrical Equipment | | | 20,247,174 | | | | — | | | | — | | | | 20,247,174 | |
Food & Staples Retailing | | | 59,091,811 | | | | — | | | | — | | | | 59,091,811 | |
Food Products | | | 9,619,954 | | | | — | | | | — | | | | 9,619,954 | |
Health Care Equipment & Supplies | | | 70,976,563 | | | | — | | | | — | | | | 70,976,563 | |
Health Care Providers & Services | | | 79,626,903 | | | | — | | | | — | | | | 79,626,903 | |
Hotels, Restaurants & Leisure | | | 45,244,791 | | | | — | | | | — | | | | 45,244,791 | |
Internet & Catalog Retail | | | 209,415,080 | | | | — | | | | — | | | | 209,415,080 | |
Internet Software & Services | | | 227,504,846 | | | | 48,320,141 | | | | — | | | | 275,824,987 | |
IT Services | | | 158,265,228 | | | | — | | | | — | | | | 158,265,228 | |
Life Sciences Tools & Services | | | 35,669,716 | | | | — | | | | — | | | | 35,669,716 | |
Media | | | 19,617,827 | | | | — | | | | — | | | | 19,617,827 | |
Oil, Gas & Consumable Fuels | | | 37,931,122 | | | | — | | | | — | | | | 37,931,122 | |
Pharmaceuticals | | | 24,508,019 | | | | — | | | | — | | | | 24,508,019 | |
Real Estate Investment Trusts | | | 24,570,200 | | | | — | | | | — | | | | 24,570,200 | |
Road & Rail | | | 26,373,359 | | | | — | | | | — | | | | 26,373,359 | |
Semiconductors & Semiconductor Equipment | | | 8,536,077 | | | | — | | | | — | | | | 8,536,077 | |
Software | | | 134,868,447 | | | | — | | | | — | | | | 134,868,447 | |
Specialty Retail | | | 36,428,042 | | | | — | | | | — | | | | 36,428,042 | |
Technology Hardware, Storage & Peripherals | | | 22,944,382 | | | | — | | | | — | | | | 22,944,382 | |
Textiles, Apparel & Luxury Goods | | | 33,585,391 | | | | — | | | | — | | | | 33,585,391 | |
Total Common Stocks | | | 1,616,618,250 | | | | 48,320,141 | | | | — | | | | 1,664,938,391 | |
Total Preferred Stock* | | | — | | | | — | | | | 18,244,999 | | | | 18,244,999 | |
| Short-Term Investments | | | | | | | | | | | | | | | | |
Mutual Fund | | | 20,070,039 | | | | — | | | | — | | | | 20,070,039 | |
Repurchase Agreement | | | — | | | | 74,850,463 | | | | — | | | | 74,850,463 | |
Total Short-Term Investments | | | 20,070,039 | | | | 74,850,463 | | | | — | | | | 94,920,502 | |
Total Investments | | $ | 1,636,688,289 | | | $ | 123,170,604 | | | $ | 18,244,999 | | | $ | 1,778,103,892 | |
| | | | | | | | | | | | | | | | | |
Collateral for Securities Loaned (Liability) | | $ | — | | | $ | (20,070,039 | ) | | $ | — | | | $ | (20,070,039 | ) |
| * | See Schedule of Investments for additional detailed categorizations. |
See accompanying notes to financial statements.
MSF-7
Metropolitan Series Fund
BlackRock Capital Appreciation Portfolio
Schedule of Investments as of June 30, 2016 (Unaudited)
Fair Value Hierarchy—(Continued)
Following is a reconciliation of Level 3 assets for which significant unobservable inputs were used to determine fair value:
| | | | | | | | | | | | | | | | |
Investments in Securities | | Balance as of
December 31,
2015 | | | Change in
Unrealized
Depreciation | | | Balance as of
June 30,
2016 | | | Change in Unrealized
Depreciation from
Investments Still Held at
June 30, 2016 | |
Preferred Stocks Software | | $ | 19,539,151 | | | $ | (1,294,152 | ) | | $ | 18,244,999 | | | $ | (1,294,152 | ) |
| | | | | | | | | | | | | | | | |
Following is quantitative information about Level 3 fair value measurements:
| | | | | | | | | | | | | | | | | | | | | | | | |
| | | Fair Value at
June 30,
2016 | | | Valuation
Technique(s) | | Unobservable
Input | | Range | | | Weighted
Average | | | Relationship Between
Fair Value and Input;
if input value increases
then Fair Value: | |
| Preferred Stocks | | | | | | | | | | | | | | | | | | | | | | | | |
Software | | $ | 18,244,999 | | | Market Transaction Method | | Pending Transaction | | $ | 7.40 | | | $ | 7.40 | | | $ | 7.40 | | | | Increase | |
| | | | | | Discounted Cash Flow | | Weighted Average Cost of Capital | | | 16.50 | % | | | 18.50 | % | | | 17.50 | % | | | Decrease | |
| | | | | | | | Perpetual Growth Rate | | | 2.50 | % | | | 3.50 | % | | | 3.00 | % | | | Increase | |
| | | | | | Comparable Company Analysis | | Enterprise Value/Revenue | | | 14.5x | | | | 14.5x | | | | 14.5x | | | | Increase | |
| | | | | | | | Discount for Lack of Marketability | | | 20.00 | % | | | 20.00 | % | | | 20.00 | % | | | Decrease | |
See accompanying notes to financial statements.
MSF-8
Metropolitan Series Fund
BlackRock Capital Appreciation Portfolio
Statement of Assets and Liabilities
June 30, 2016 (Unaudited)
| | | | |
Assets | |
Investments at value (a) (b) | | $ | 1,778,103,892 | |
Cash denominated in foreign currencies (c) | | | 82 | |
Receivable for: | |
Investments sold | | | 608,918 | |
Fund shares sold | | | 124,684 | |
Dividends and interest | | | 180,919 | |
Prepaid expenses | | | 11,152 | |
| | | | |
Total Assets | | | 1,779,029,647 | |
Liabilities | |
Collateral for securities loaned | | | 20,070,039 | |
Payables for: | |
Investments purchased | | | 28,375,678 | |
Fund shares redeemed | | | 417,188 | |
Accrued Expenses: | |
Management fees | | | 911,481 | |
Distribution and service fees | | | 38,754 | |
Deferred trustees’ fees | | | 79,191 | |
Other expenses | | | 222,996 | |
| | | | |
Total Liabilities | | | 50,115,327 | |
| | | | |
Net Assets | | $ | 1,728,914,320 | |
| | | | |
Net Assets Consist of: | |
Paid in surplus | | $ | 1,547,820,618 | |
Undistributed net investment income | | | 809,304 | |
Accumulated net realized loss | | | (32,654,727 | ) |
Unrealized appreciation on investments and foreign currency transactions | | | 212,939,125 | |
| | | | |
Net Assets | | $ | 1,728,914,320 | |
| | | | |
Net Assets | |
Class A | | $ | 1,527,057,983 | |
Class B | | | 165,821,424 | |
Class E | | | 36,034,913 | |
Capital Shares Outstanding* | |
Class A | | | 47,992,256 | |
Class B | | | 5,374,336 | |
Class E | | | 1,150,447 | |
Net Asset Value, Offering Price and Redemption Price Per Share | | | | |
Class A | | $ | 31.82 | |
Class B | | | 30.85 | |
Class E | | | 31.32 | |
| * | The Portfolio is authorized to issue an unlimited number of shares. |
| (a) | Identified cost of investments was $1,565,164,694. |
| (b) | Includes securities loaned at value of $94,720,519. |
| (c) | Identified cost of cash denominated in foreign currencies was $82. |
Statement of Operations
Six Months Ended June 30, 2016 (Unaudited)
| | | | |
Investment Income | |
Dividends (a) | | $ | 6,531,753 | |
Interest | | | 3,036 | |
Securities lending income | | | 114,452 | |
| | | | |
Total investment income | | | 6,649,241 | |
Expenses | |
Management fees | | | 5,880,809 | |
Administration fees | | | 21,413 | |
Custodian and accounting fees | | | 71,970 | |
Distribution and service fees—Class B | | | 204,935 | |
Distribution and service fees—Class E | | | 26,841 | |
Audit and tax services | | | 20,230 | |
Legal | | | 13,766 | |
Trustees’ fees and expenses | | | 15,990 | |
Shareholder reporting | | | 61,709 | |
Insurance | | | 6,224 | |
Miscellaneous | | | 11,025 | |
| | | | |
Total expenses | | | 6,334,912 | |
Less management fee waiver | | | (456,396 | ) |
Less broker commission recapture | | | (6,045 | ) |
| | | | |
Net expenses | | | 5,872,471 | |
| | | | |
Net Investment Income | | | 776,770 | |
| | | | |
Net Realized and Unrealized Loss | |
| Net realized gain (loss) on: | |
Investments | | | (27,478,562 | ) |
Foreign currency transactions | | | 1,339 | |
| | | | |
Net realized loss | | | (27,477,223 | ) |
| | | | |
| Net change in unrealized appreciation (depreciation) on: | | | | |
Investments | | | (50,001,475 | ) |
Foreign currency transactions | | | 928 | |
| | | | |
Net change in unrealized depreciation | | | (50,000,547 | ) |
| | | | |
Net realized and unrealized loss | | | (77,477,770 | ) |
| | | | |
Net Decrease in Net Assets From Operations | | $ | (76,701,000 | ) |
| | | | |
| (a) | Net of foreign withholding taxes of $152,421. |
See accompanying notes to financial statements.
MSF-9
Metropolitan Series Fund
BlackRock Capital Appreciation Portfolio
Statements of Changes in Net Assets
| | | | | | | | |
| | | Six Months
Ended
June 30,
2016
(Unaudited) | | | Year Ended
December 31,
2015 | |
Increase (Decrease) in Net Assets: | |
From Operations | |
Net investment income | | $ | 776,770 | | | $ | 110,958 | |
Net realized gain (loss) | | | (27,477,223 | ) | | | 155,560,851 | |
Net change in unrealized depreciation | | | (50,000,547 | ) | | | (30,668,718 | ) |
| | | | | | | | |
Increase (decrease) in net assets from operations | | | (76,701,000 | ) | | | 125,003,091 | |
| | | | | | | | |
From Distributions to Shareholders | | | | | | | | |
Net realized capital gains | | | | | | | | |
Class A | | | (138,220,075 | ) | | | (293,511,316 | ) |
Class B | | | (15,502,355 | ) | | | (31,968,986 | ) |
Class E | | | (3,325,155 | ) | | | (7,090,520 | ) |
| | | | | | | | |
Total distributions | | | (157,047,585 | ) | | | (332,570,822 | ) |
| | | | | | | | |
Increase in net assets from capital share transactions | | | 134,227,220 | | | | 28,561,818 | |
| | | | | | | | |
Total decrease in net assets | | | (99,521,365 | ) | | | (179,005,913 | ) |
|
Net Assets | |
Beginning of period | | | 1,828,435,685 | | | | 2,007,441,598 | |
| | | | | | | | |
End of period | | $ | 1,728,914,320 | | | $ | 1,828,435,685 | |
| | | | | | | | |
Undistributed net investment income | |
End of period | | $ | 809,304 | | | $ | 32,534 | |
| | | | | | | | |
Other Information:
Capital Shares
Transactions in capital shares were as follows:
| | | | | | | | | | | | | | | | |
| | | Six Months Ended
June 30, 2016
(Unaudited) | | | Year Ended
December 31, 2015 | |
| | | Shares | | | Value | | | Shares | | | Value | |
Class A | |
Sales | | | 829,055 | | | $ | 28,172,756 | | | | 651,800 | | | $ | 25,300,283 | |
Reinvestments | | | 4,343,811 | | | | 138,220,075 | | | | 7,917,759 | | | | 293,511,316 | |
Redemptions | | | (1,282,259 | ) | | | (43,550,636 | ) | | | (7,709,902 | ) | | | (308,632,665 | ) |
| | | | | | | | | | | | | | | | |
Net increase | | | 3,890,607 | | | $ | 122,842,195 | | | | 859,657 | | | $ | 10,178,934 | |
| | | | | | | | | | | | | | | | |
Class B | |
Sales | | | 212,523 | | | $ | 6,935,826 | | | | 352,054 | | | $ | 13,252,400 | |
Reinvestments | | | 502,345 | | | | 15,502,355 | | | | 884,587 | | | | 31,968,986 | |
Redemptions | | | (346,193 | ) | | | (11,424,901 | ) | | | (803,053 | ) | | | (30,853,539 | ) |
| | | | | | | | | | | | | | | | |
Net increase | | | 368,675 | | | $ | 11,013,280 | | | | 433,588 | | | $ | 14,367,847 | |
| | | | | | | | | | | | | | | | |
Class E | |
Sales | | | 70,977 | | | $ | 2,399,210 | | | | 212,196 | | | $ | 8,047,330 | |
Reinvestments | | | 106,167 | | | | 3,325,155 | | | | 193,730 | | | | 7,090,520 | |
Redemptions | | | (160,730 | ) | | | (5,352,620 | ) | | | (288,592 | ) | | | (11,122,813 | ) |
| | | | | | | | | | | | | | | | |
Net increase | | | 16,414 | | | $ | 371,745 | | | | 117,334 | | | $ | 4,015,037 | |
| | | | | | | | | | | | | | | | |
Increase derived from capital shares transactions | | | | | | $ | 134,227,220 | | | | | | | $ | 28,561,818 | |
| | | | | | | | | | | | | | | | |
See accompanying notes to financial statements.
MSF-10
Metropolitan Series Fund
BlackRock Capital Appreciation Portfolio
Financial Highlights
| | | | | | | | | | | | | | | | | | | | | | | | |
| Selected per share data | | | |
| | | Class A | |
| | | Six Months
Ended
June 30,
2016
(Unaudited) | | | Year Ended December 31, | |
| | | | 2015 | | | 2014 | | | 2013 | | | 2012 | | | 2011 | |
Net Asset Value, Beginning of Period | | $ | 36.50 | | | $ | 41.19 | | | $ | 37.85 | | | $ | 28.45 | | | $ | 24.96 | | | $ | 27.45 | |
| | | | | | | | | | | | | | | | | | | | | | | | |
Income (Loss) from Investment Operations | | | | | | | | | | | | | | | | | | | | | | | | |
Net investment income (a) | | | 0.02 | | | | 0.01 | | | | 0.01 | | | | 0.03 | | | | 0.26 | | | | 0.11 | |
Net realized and unrealized gain (loss) on investments | | | (1.54 | ) | | | 2.69 | | | | 3.35 | | | | 9.63 | | | | 3.32 | | | | (2.55 | ) |
| | | | | | | | | | | | | | | | | | | | | | | | |
Total from investment operations | | | (1.52 | ) | | | 2.70 | | | | 3.36 | | | | 9.66 | | | | 3.58 | | | | (2.44 | ) |
| | | | | | | | | | | | | | | | | | | | | | | | |
Less Distributions | | | | | | | | | | | | | | | | | | | | | | | | |
Distributions from net investment income | | | 0.00 | | | | 0.00 | | | | (0.02 | ) | | | (0.26 | ) | | | (0.09 | ) | | | (0.05 | ) |
Distributions from net realized capital gains | | | (3.16 | ) | | | (7.39 | ) | | | 0.00 | | | | 0.00 | | | | 0.00 | | | | 0.00 | |
| | | | | | | | | | | | | | | | | | | | | | | | |
Total distributions | | | (3.16 | ) | | | (7.39 | ) | | | (0.02 | ) | | | (0.26 | ) | | | (0.09 | ) | | | (0.05 | ) |
| | | | | | | | | | | | | | | | | | | | | | | | |
Net Asset Value, End of Period | | $ | 31.82 | | | $ | 36.50 | | | $ | 41.19 | | | $ | 37.85 | | | $ | 28.45 | | | $ | 24.96 | |
| | | | | | | | | | | | | | | | | | | | | | | | |
Total Return (%) (b) | | | (4.16 | )(c) | | | 6.28 | | | | 8.90 | | | | 34.22 | (d) | | | 14.37 | | | | (8.95 | ) |
| | | | | | |
Ratios/Supplemental Data | | | | | | | | | | | | | | | | | | | | | | | | |
Gross ratio of expenses to average net assets (%) | | | 0.72 | (e) | | | 0.71 | | | | 0.71 | | | | 0.71 | | | | 0.73 | | | | 0.73 | |
Net ratio of expenses to average net assets (%) (f) | | | 0.67 | (e) | | | 0.66 | | | | 0.71 | | | | 0.70 | | | | 0.72 | | | | 0.72 | |
Ratio of net investment income to average net assets (%) | | | 0.12 | (e) | | | 0.03 | | | | 0.02 | | | | 0.10 | | | | 0.93 | | | | 0.41 | |
Portfolio turnover rate (%) | | | 44 | (c) | | | 70 | | | | 99 | | | | 160 | | | | 59 | | | | 83 | |
Net assets, end of period (in millions) | | $ | 1,527.1 | | | $ | 1,609.7 | | | $ | 1,781.3 | | | $ | 1,917.9 | | | $ | 1,410.4 | | | $ | 1,314.6 | |
| |
| | | Class B | |
| | | Six Months
Ended
June 30,
2016
(Unaudited) | | | Year Ended December 31, | |
| | | | 2015 | | | 2014 | | | 2013 | | | 2012 | | | 2011 | |
Net Asset Value, Beginning of Period | | $ | 35.54 | | | $ | 40.38 | | | $ | 37.17 | | | $ | 27.94 | | | $ | 24.52 | | | $ | 26.99 | |
| | | | | | | | | | | | | | | | | | | | | | | | |
Income (Loss) from Investment Operations | | | | | | | | | | | | | | | | | | | | | | | | |
Net investment income (loss) (a) | | | (0.02 | ) | | | (0.08 | ) | | | (0.09 | ) | | | (0.05 | ) | | | 0.18 | | | | 0.03 | |
Net realized and unrealized gain (loss) on investments | | | (1.51 | ) | | | 2.63 | | | | 3.30 | | | | 9.47 | | | | 3.26 | | | | (2.50 | ) |
| | | | | | | | | | | | | | | | | | | | | | | | |
Total from investment operations | | | (1.53 | ) | | | 2.55 | | | | 3.21 | | | | 9.42 | | | | 3.44 | | | | (2.47 | ) |
| | | | | | | | | | | | | | | | | | | | | | | | |
Less Distributions | | | | | | | | | | | | | | | | | | | | | | | | |
Distributions from net investment income | | | 0.00 | | | | 0.00 | | | | 0.00 | | | | (0.19 | ) | | | (0.02 | ) | | | 0.00 | |
Distributions from net realized capital gains | | | (3.16 | ) | | | (7.39 | ) | | | 0.00 | | | | 0.00 | | | | 0.00 | | | | 0.00 | |
| | | | | | | | | | | | | | | | | | | | | | | | |
Total distributions | | | (3.16 | ) | | | (7.39 | ) | | | 0.00 | | | | (0.19 | ) | | | (0.02 | ) | | | 0.00 | |
| | | | | | | | | | | | | | | | | | | | | | | | |
Net Asset Value, End of Period | | $ | 30.85 | | | $ | 35.54 | | | $ | 40.38 | | | $ | 37.17 | | | $ | 27.94 | | | $ | 24.52 | |
| | | | | | | | | | | | | | | | | | | | | | | | |
Total Return (%) (b) | | | (4.31 | )(c) | | | 6.01 | | | | 8.64 | | | | 33.90 | (d) | | | 14.07 | | | | (9.15 | ) |
| | | | | | |
Ratios/Supplemental Data | | | | | | | | | | | | | | | | | | | | | | | | |
Gross ratio of expenses to average net assets (%) | | | 0.97 | (e) | | | 0.96 | | | | 0.96 | | | | 0.96 | | | | 0.98 | | | | 0.98 | |
Net ratio of expenses to average net assets (%) (f) | | | 0.92 | (e) | | | 0.91 | | | | 0.96 | | | | 0.95 | | | | 0.97 | | | | 0.97 | |
Ratio of net investment income (loss) to average net assets (%) | | | (0.13 | )(e) | | | (0.22 | ) | | | (0.23 | ) | | | (0.16 | ) | | | 0.68 | | | | 0.12 | |
Portfolio turnover rate (%) | | | 44 | (c) | | | 70 | | | | 99 | | | | 160 | | | | 59 | | | | 83 | |
Net assets, end of period (in millions) | | $ | 165.8 | | | $ | 177.9 | | | $ | 184.6 | | | $ | 190.5 | | | $ | 165.0 | | | $ | 153.7 | |
Please see following page for Financial Highlights footnote legend.
See accompanying notes to financial statements.
MSF-11
Metropolitan Series Fund
BlackRock Capital Appreciation Portfolio
Financial Highlights
| | | | | | | | | | | | | | | | | | | | | | | | |
| Selected per share data | | | |
| | | Class E | |
| | | Six Months
Ended
June 30,
2016
(Unaudited) | | | Year Ended December 31, | |
| | | | 2015 | | | 2014 | | | 2013 | | | 2012 | | | 2011 | |
Net Asset Value, Beginning of Period | | $ | 36.01 | | | $ | 40.79 | | | $ | 37.51 | | | $ | 28.19 | | | $ | 24.73 | | | $ | 27.21 | |
| | | | | | | | | | | | | | | | | | | | | | | | |
Income (Loss) from Investment Operations | | | | | | | | | | | | | | | | | | | | | | | | |
Net investment income (loss) (a) | | | (0.01 | ) | | | (0.05 | ) | | | (0.05 | ) | | | (0.02 | ) | | | 0.21 | | | | 0.06 | |
Net realized and unrealized gain (loss) on investments | | | (1.52 | ) | | | 2.66 | | | | 3.33 | | | | 9.56 | | | | 3.30 | | | | (2.52 | ) |
| | | | | | | | | | | | | | | | | | | | | | | | |
Total from investment operations | | | (1.53 | ) | | | 2.61 | | | | 3.28 | | | | 9.54 | | | | 3.51 | | | | (2.46 | ) |
| | | | | | | | | | | | | | | | | | | | | | | | |
Less Distributions | | | | | | | | | | | | | | | | | | | | | | | | |
Distributions from net investment income | | | 0.00 | | | | 0.00 | | | | 0.00 | | | | (0.22 | ) | | | (0.05 | ) | | | (0.02 | ) |
Distributions from net realized capital gains | | | (3.16 | ) | | | (7.39 | ) | | | 0.00 | | | | 0.00 | | | | 0.00 | | | | 0.00 | |
| | | | | | | | | | | | | | | | | | | | | | | | |
Total distributions | | | (3.16 | ) | | | (7.39 | ) | | | 0.00 | | | | (0.22 | ) | | | (0.05 | ) | | | (0.02 | ) |
| | | | | | | | | | | | | | | | | | | | | | | | |
Net Asset Value, End of Period | | $ | 31.32 | | | $ | 36.01 | | | $ | 40.79 | | | $ | 37.51 | | | $ | 28.19 | | | $ | 24.73 | |
| | | | | | | | | | | | | | | | | | | | | | | | |
Total Return (%) (b) | | | (4.25 | )(c) | | | 6.11 | | | | 8.74 | | | | 34.04 | (d) | | | 14.17 | | | | (9.06 | ) |
| | | | | | |
Ratios/Supplemental Data | | | | | | | | | | | | | | | | | | | | | | | | |
Gross ratio of expenses to average net assets (%) | | | 0.87 | (e) | | | 0.86 | | | | 0.86 | | | | 0.86 | | | | 0.88 | | | | 0.88 | |
Net ratio of expenses to average net assets (%) (f) | | | 0.82 | (e) | | | 0.81 | | | | 0.86 | | | | 0.85 | | | | 0.87 | | | | 0.87 | |
Ratio of net investment income (loss) to average net assets (%) | | | (0.03 | )(e) | | | (0.12 | ) | | | (0.13 | ) | | | (0.06 | ) | | | 0.78 | | | | 0.21 | |
Portfolio turnover rate (%) | | | 44 | (c) | | | 70 | | | | 99 | | | | 160 | | | | 59 | | | | 83 | |
Net assets, end of period (in millions) | | $ | 36.0 | | | $ | 40.8 | | | $ | 41.5 | | | $ | 45.7 | | | $ | 41.9 | | | $ | 41.6 | |
| (a) | Per share amounts based on average shares outstanding during the period. |
| (b) | Total return does not reflect any insurance, sales, separate account or administrative charges of variable annuity or life insurance contracts or any additional expenses that contract owners may bear under their variable contracts. If these charges were included, the returns would be lower. |
| (c) | Periods less than one year are not computed on an annualized basis. |
| (d) | In 2013, 0.03%, 0.03% and 0.03% of the Portfolio’s total return for Class A, Class B and Class E, respectively, consists of a voluntary reimbursement by the subadvisor. Excluding this item, total return would have been 34.19%, 33.87% and 34.01% for Class A, Class B and Class E, respectively. |
| (e) | Computed on an annualized basis. |
| (f) | Includes the effects of management fee waivers (see Note 5 of the Notes to Financial Statements). |
See accompanying notes to financial statements.
MSF-12
Metropolitan Series Fund
BlackRock Capital Appreciation Portfolio
Notes to Financial Statements—June 30, 2016 (Unaudited)
1. Organization
Metropolitan Series Fund (the “Trust”) is organized as a Delaware statutory trust and registered under the Investment Company Act of 1940, as amended (the “1940 Act”), as an open-end management investment company. The Trust, which is managed by MetLife Advisers, LLC (“MetLife Advisers” or the “Adviser”), an affiliate of MetLife, Inc., is currently comprised of thirty series, each of which operates as a distinct investment vehicle of the Trust. The portfolio included in this report is BlackRock Capital Appreciation Portfolio (the “Portfolio”), which is diversified. Shares in the Portfolio are not offered directly to the general public and are currently available only to separate accounts established by Metropolitan Life Insurance Company (“MetLife”) and other affiliated life insurance companies.
The Portfolio has registered and offers three classes of shares: Class A, B and E shares. Shares of each Class of the Portfolio represent an equal pro rata interest in the Portfolio and generally give the shareholder the same voting, dividend, liquidation, and other rights. Investment income, realized and unrealized capital gains and losses, the common expenses of the Portfolio, and certain Portfolio-level expense reductions, if any, are allocated on a pro rata basis to each Class based on the relative net assets of each Class to the net assets of the Portfolio. Each Class of shares differs in its respective distribution plan and such distribution expenses are allocated to the corresponding Class of shares.
2. Significant Accounting Policies
The preparation of financial statements in conformity with accounting principles generally accepted in the United States of America (“GAAP”) requires management to make estimates and assumptions that affect the reported amounts of assets and liabilities and disclosure of contingent assets and liabilities as of the date of the financial statements and the reported amounts of income and expenses during the reporting period. Actual results could differ from those estimates. In the preparation of these financial statements, management has evaluated events and transactions subsequent to June 30, 2016 through the date the financial statements were issued.
The Portfolio is an investment company and follows the accounting and reporting guidance of the Financial Accounting Standards Board (“FASB”) Accounting Standards Codification Topic 946—Financial Services—Investment Companies and Topic 820—Fair Value Measurement. The following is a summary of significant accounting policies consistently followed by the Portfolio in the preparation of its financial statements.
Investment Valuation and Fair Value Measurements - Domestic and foreign equity securities, such as common stock, exchange-traded funds, rights, warrants, and preferred stock, that are traded on a securities exchange on a valuation date are generally valued at their last quoted sale price or official closing price on the primary exchange for such security, or, if no sales occurred on that day, at the last reported bid price. Equity securities traded over-the-counter (“OTC”) are generally valued at the last reported bid price. In the event of a major exchange closing during the trading day, the Adviser may use other market information obtained from quotation reporting systems, established market makers, or pricing services in valuing the securities. Valuation adjustments may be applied to certain foreign equity securities that are traded solely on foreign exchanges that close before the time as of which the Portfolio determines its NAV to account for the market movement between the close of the foreign exchanges and the time as of which the Portfolio determines its NAV. The Portfolio may use a systematic fair valuation model provided by a pricing service to value securities principally traded in these foreign markets in order to adjust for possible market movements or other changes that may occur between the close of the foreign exchanges and the time as of which the Portfolio determines its NAV. Foreign equity securities valued using these valuation adjustments are generally categorized as Level 2 within the fair value hierarchy. Equity securities that are actively traded, and have no valuation adjustments applied, are categorized as Level 1 within the fair value hierarchy. Other equity securities traded on inactive markets, or valued in reference to similar instruments traded on active markets, are generally categorized as Level 2 within the fair value hierarchy.
Investments in registered open-end management investment companies are valued at reported net asset value per share on the valuation date and are categorized as Level 1 within the fair value hierarchy.
Debt securities, including corporate, convertible and municipal bonds and notes; obligations of the U.S. Treasury and U.S. government agencies; foreign sovereign issues; and non-U.S. bonds, are generally valued on the basis of evaluated or composite bid quotations obtained from independent pricing services and/or brokers and dealers selected by the Adviser (each a “pricing service”), pursuant to authorization of and subject to general oversight by the Board of Trustees of the Trust (the “Board” or “Trustees”). Such pricing services may use matrix pricing, which considers observable inputs including, among other things, issuer details, maturity dates, interest rates, yield curves, rates of prepayment, credit risks/spreads, default rates, reported trades, broker dealer quotes and quoted prices for similar assets. Short-term obligations with a remaining maturity of sixty days or less may be valued at amortized cost in the absence of market quotes, so long as the amortized cost value of such short-term debt instrument is approximately the same as the fair value of the instrument as determined without the use of amortized cost valuation. Floating rate loans are generally valued on the basis of an evaluated or composite average of aggregate bid and ask quotations supplied by brokers or dealers, as obtained from the pricing service. Securities that use similar valuation techniques and inputs as described above are generally categorized as Level 2 within the fair value hierarchy.
MSF-13
Metropolitan Series Fund
BlackRock Capital Appreciation Portfolio
Notes to Financial Statements—June 30, 2016—(Continued)
Options, whether on securities, indices, futures contracts, or otherwise, traded on exchanges are valued at the last sale price available as of the close of business on a valuation day or, if there is no such price available, at the last reported bid price. These types of options are categorized as Level 1 within the fair value hierarchy. Futures contracts that are traded on commodity exchanges are valued at their settlement prices established by the exchanges on which they are traded as of the close of such exchanges and are categorized as Level 1 within the fair value hierarchy.
If no current market value quotation or other observable inputs are readily available or market value quotations are deemed to be unreliable for an investment, the fair value of the investment will be determined in accordance with procedures approved by, and under the general supervision of, the Board. In such a circumstance, the Board will be assisted in its responsibility to determine the fair value of an investment by the Valuation Committee (“Committee”) of MetLife Advisers. The Committee provides general pricing oversight and fair value pricing determinations related to portfolio securities and meets on a regular basis to review reports relating to the valuation of the securities in the Portfolio. The Board has delegated to State Street Bank and Trust Company, the Trust’s custodian (“custodian”), the responsibility for calculating the net asset values (“NAVs”) of the Trust’s Portfolios. The Committee is responsible for overseeing the calculation of the NAVs of the Portfolios by the custodian. The Committee also periodically reviews pricing services, including the pricing services providing fair value pricing for the Portfolio’s foreign securities, and is responsible for overseeing the correction of pricing errors and addressing other pricing issues that arise in the ordinary course of business, such as making real-time fair value determinations, as necessary.
No single standard for determining the fair value of an investment can be set forth because fair value depends upon the facts and circumstances with respect to each investment. Information relating to any relevant factors may be obtained by the Committee from any appropriate source, including the subadviser of the Portfolio, the custodian, a pricing service, market maker and/or broker for such security or the issuer. Appropriate methodologies for determining fair value under particular circumstances may include: matrix pricing, a discounted cash flow analysis, comparisons of securities with comparable characteristics, value based on multiples of earnings, discount from market price of similar marketable securities or a combination of these and other methods.
Investment Transactions and Related Investment Income - Portfolio security transactions are recorded on the trade date. Dividend income is recorded on the ex-dividend date or, for certain foreign securities, when notified. Interest income, which includes amortization of premium and accretion of discount on debt securities, is recorded on the accrual basis. Realized gains and losses on investments are determined on the identified cost basis, which is the same basis used for federal income tax purposes. Foreign income and foreign capital gains on some foreign securities may be subject to foreign taxes, which are accrued as applicable. These foreign taxes have been provided for in accordance with the Portfolio’s understanding of the applicable countries’ tax rules and rates.
Foreign Currency Translation - The books and records of the Portfolio are maintained in U.S. dollars. The values of securities, currencies, and other assets and liabilities denominated in currencies other than the U.S. dollar are translated into U.S. dollars based upon foreign exchange rates prevailing at the end of the period. Purchases and sales of investment securities, income, and expenses are translated on the respective dates of such transactions. Because the values of investment securities are translated at the foreign exchange rates prevailing at the end of the period, that portion of the results of operations arising from changes in exchange rates and that portion of the results of operations reflecting fluctuations arising from changes in market prices of the investment securities are not separated. Such fluctuations are included in the net realized and unrealized gain or loss on investments.
Net realized foreign exchange gains or losses arise from activity in forward foreign currency exchange contracts, sales of foreign currency, currency gains or losses realized between the trade and settlement dates on securities transactions, and the difference between the amounts of dividends, interest, and foreign withholding taxes recorded by the Portfolio and the U.S. dollar equivalent of the amounts actually received or paid by the Portfolio. Net unrealized foreign exchange gains and losses arise from changes in the value of assets and liabilities, other than investment securities, resulting from changes in foreign exchange rates.
Dividends and Distributions to Shareholders - The Portfolio records dividends and distributions on the ex-dividend date. Net realized gains from securities transactions (if any) are generally distributed annually to shareholders. The timing and characterization of certain income and capital gains distributions are determined in accordance with federal tax regulations that may differ from GAAP. Permanent book and tax basis differences relating to shareholder distributions will result in reclassification between under/over distributed net investment income, accumulated net realized gains/losses, and paid-in surplus. Book-tax differences are primarily due to broker commission recapture and foreign currency transactions. These adjustments have no impact on net assets or the results of operations.
Income Taxes - It is the Portfolio’s policy to comply with the requirements of the Internal Revenue Code of 1986, as amended, and regulations thereunder, applicable to regulated investment companies and to distribute, with respect to each taxable year, all of its taxable income to shareholders. Therefore, no federal income tax provision is required. The Portfolio files U.S. federal tax returns. No income tax returns are currently under examination. The Portfolio’s federal tax returns for the prior three fiscal years remain subject to examination by the Internal Revenue Service. As of June 30, 2016, the Portfolio had no uncertain tax positions that would require financial statement recognition, or de-recognition or disclosure.
Directed Brokerage Agreement - The Trust has entered into a directed brokerage arrangement with State Street Global Markets (“SSGM”). Under this arrangement, the Portfolio directs certain trades to SSGM in return for a recapture credit. SSGM issues a cash
MSF-14
Metropolitan Series Fund
BlackRock Capital Appreciation Portfolio
Notes to Financial Statements—June 30, 2016—(Continued)
rebate to the Portfolio. Amounts paid to the Portfolio are shown separately as broker commission recapture on the Statement of Operations of the Portfolio. Additionally, these amounts have been excluded from the calculation of the net ratio of expenses to average net assets presented in the Financial Highlights for each share class.
Repurchase Agreements - The Portfolio may enter into repurchase agreements, under the terms of a Master Repurchase Agreement (“MRA”), with selected commercial banks and broker-dealers, under which the Portfolio acquires securities as collateral and agrees to resell the securities at an agreed-upon time and at an agreed-upon price. The Portfolio, through the custodian or a subcustodian, under a tri-party repurchase agreement, receives delivery of the underlying securities collateralizing any repurchase agreements. It is the Portfolio’s policy that the market value of the collateral be equal to at least 100% of the repurchase price in the case of a repurchase agreement of one-day duration and equal to at least 102% of the repurchase price in the case of all other repurchase agreements. In the event of default or failure by a party to perform an obligation in connection with any repurchase transaction, the MRA gives the non-defaulting party the right to set-off claims and to apply property held by it in connection with any repurchase transaction against obligations owed to it.
At June 30, 2016, the Portfolio had investments in repurchase agreements with a gross value of $74,850,463, which is included as part of investments at value on the Statement of Assets and Liabilities. The value of the related collateral exceeded the value of the repurchase agreements at June 30, 2016.
Securities Lending - The Portfolio may lend its portfolio securities to certain qualified brokers who borrow securities in order to complete certain securities transactions. By lending its portfolio securities, the Portfolio attempts to increase its net investment income through the receipt of income on collateral held from securities on loan. Any gain or loss in the market price of the loaned securities that might occur and any interest earned or dividends declared during the term of the loan would accrue to the account of the Portfolio.
The Trust has entered into a Securities Lending Authorization Agreement with the custodian as the lending agent. Under this agreement, the custodian is authorized to loan portfolio securities on the Portfolio’s behalf. In exchange, the Portfolio receives either cash or securities as collateral against the loaned securities. The Portfolio receives collateral equal to at least 102% of the market value of the loaned securities (105% for foreign equity securities), at each loan’s inception. Collateral representing at least 100% of the market value of the loaned securities must be maintained for the duration of the loan. Cash collateral is generally invested in the State Street Navigator Securities Lending MET Portfolio (the “Navigator Portfolio”), a series of the State Street Navigator Securities Lending Trust that is managed by an affiliate of the custodian. The Navigator Portfolio is a registered money market fund that invests in a variety of high-quality, U.S. dollar-denominated instruments. If the market value of the collateral at the close of trading on a business day is less than 100% of the market value of the loaned securities at the close of trading on that day, the borrower shall be required to deliver, by the close of business on the following business day, an additional amount of collateral, so that the total amount of posted collateral is equal to at least 100% of the market value of all the loaned securities as of such preceding day. A portion of net income (income after the deduction of expenses and fees of the Navigator Portfolio) on the collateral is rebated to the borrower of the securities and the remainder is split between the custodian and the Portfolio. On loans collateralized by U.S. Treasuries, a fee is received from the borrower and is allocated between the Portfolio and the custodian. Income received by the Portfolio in securities lending transactions during the six months ended June 30, 2016 is reflected as Securities lending income on the Statement of Operations. The values of any securities loaned by the Portfolio and the related collateral at June 30, 2016 are disclosed in the footnotes to the Schedule of Investments. The value of the related collateral received by the Portfolio exceeded the value of the securities out on loan at June 30, 2016.
The risks associated with lending portfolio securities include, but are not limited to, possible delays in receiving additional collateral or in the recovery of the loaned securities, possible loss of rights in the collateral should the borrower fail financially, as well as risk of loss in the value of the collateral or the value of the investments made with the collateral. The lending agent shall indemnify the Portfolio in the case of default of any securities borrower.
All securities on loan are classified as Common Stocks in the Portfolio’s Schedule of Investments as of June 30, 2016, with a contractual maturity of overnight and continuous.
3. Certain Risks
In the normal course of business, the Portfolio invests in securities and enters into transactions where risks exist due to fluctuations in the market (“market risk”) or failure of the other party to a transaction to perform (“credit and counterparty risk”).
Market Risk: The value of securities held by the Portfolio may decline in response to certain events, including those directly involving the companies whose securities are owned by the Portfolio; conditions affecting the general economy; overall market changes; local, regional or global political, social or economic instability; and currency, interest rate, and price fluctuations.
Credit and Counterparty Risk: The Portfolio may be exposed to counterparty risk, or the risk that an entity with which the Portfolio has unsettled or open transactions may default. The potential loss could exceed the value of the financial assets and liabilities
MSF-15
Metropolitan Series Fund
BlackRock Capital Appreciation Portfolio
Notes to Financial Statements—June 30, 2016—(Continued)
recorded in the financial statements. Financial assets that potentially expose the Portfolio to credit and counterparty risk consist principally of cash due from counterparties and investments. The Portfolio manages counterparty risk by entering into agreements only with counterparties that it believes have the financial resources to honor their obligations and by monitoring the financial stability of those counterparties. The Portfolio’s investment adviser attempts to mitigate counterparty risk by (i) periodically assessing the creditworthiness of its trading partners, (ii) monitoring and/or limiting the amount of its net exposure to each individual counterparty based on its assessment, and (iii) requiring collateral from the counterparty for certain transactions. In order to preserve certain safeguards for non-standard settlement trades, the Portfolio restricts its exposure to credit and counterparty losses by entering into master netting agreements (“Master Agreements”) with counterparties (approved brokers) with whom it undertakes a significant volume of transactions. Master Agreements govern the terms of certain transactions, and reduce the counterparty risk associated with relevant transactions by specifying credit protection mechanisms and providing standardization that improves legal certainty. Master Agreements can also help limit counterparty risk by specifying collateral posting arrangements at pre-arranged exposure levels.
Repurchase and reverse repurchase agreements are primarily executed under Global Master Repurchase Agreements (“GMRAs”) or Master Repurchase Agreements (“MRAs”), which provide the rights to set-off. Each repurchase and reverse repurchase agreement is initially collateralized at the transaction level. In the event of default, the total market value exposure will be offset against collateral exchanged to date, which would result in a net receivable/(payable) that would be due from/to the counterparty.
Additional risks associated with each type of investment are described above within the respective security type notes. The Portfolio’s prospectus includes a discussion of the principal risks of investing in the Portfolio.
4. Investment Transactions
Aggregate cost of purchases and proceeds of sales of investment securities, excluding short-term securities, for the six months ended June 30, 2016 were as follows:
| | | | | | | | | | | | |
Purchases | | | Sales | |
U.S. Government | | Non U.S. Government | | | U.S. Government | | | Non U.S. Government | |
| $0 | | $ | 753,574,673 | | | $ | 0 | | | $ | 816,823,392 | |
5. Investment Management Fees and Other Transactions with Affiliates
Investment Management Agreement - MetLife Advisers is the investment adviser to the Portfolio. The Trust has entered into an investment management agreement with MetLife Advisers with respect to the Portfolio. For providing investment management services to the Portfolio, MetLife Advisers receives monthly compensation at the following annual rates:
| | | | | | |
Management
Fees earned by
MetLife Advisers
for the six months ended
June 30, 2016 | | % per annum | | | Average Daily Net Assets |
| $5,880,809 | | | 0.730 | % | | Of the first $1 billion |
| | | 0.650 | % | | On amounts in excess of $1 billion |
MetLife Advisers has entered into an investment subadvisory agreement with respect to managing the Portfolio. BlackRock Advisors, LLC is compensated by MetLife Advisers to provide subadvisory services for the Portfolio.
Management Fee Waivers - Pursuant to an expense agreement, MetLife Advisers has agreed, for the period May 1, 2016 to April 30, 2017, to reduce its advisory fees set out above under “Investment Management Agreement” for each class of the Portfolio as follows:
| | |
% per annum | | Average Daily Net Assets |
| 0.020% | | Of the first $500 million |
| 0.080% | | On the next $500 million |
| 0.060% | | On amounts in excess of $1 billion |
An identical expense agreement was in place for the period May 1, 2015 to April 30, 2016. Amounts waived for the six months ended June 30, 2016 are shown as management fee waivers in the Statement of Operations.
Certain officers and trustees of the Trust may also be officers of the Adviser; however, such officers and trustees receive no compensation from the Trust.
On January 12, 2016, MetLife, Inc. announced its plan to pursue the separation of a substantial portion of its retail segment and is currently evaluating structural alternatives for such separation. It is anticipated that MetLife Advisers would be included in any such
MSF-16
Metropolitan Series Fund
BlackRock Capital Appreciation Portfolio
Notes to Financial Statements—June 30, 2016—(Continued)
separation. Any separation transaction that might occur will be subject to the satisfaction of various conditions and approvals, including approval of any transaction by the MetLife, Inc. Board of Directors, satisfaction of any applicable requirements of the SEC, and receipt of insurance and other regulatory approvals and other anticipated conditions. Because the form of a separation had yet to be determined, MetLife, Inc. cannot currently provide a specific potential completion date or information about the potential impact on MetLife Advisers. No assurance can be given regarding the form that a separation transaction may take or the specific terms thereof, or that a separation will in fact occur. Depending on the form a separation takes, MetLife Advisers’ continued service as investment adviser to the Trusts could be subject to the satisfaction of various conditions and approvals, which may include obtaining approvals from the Trusts’ Board and shareholders.
Transfer Agency Agreement - MetLife serves as the transfer agent for the Trust. MetLife receives no fees for its services to the Trust under the transfer agency agreement.
Distribution and Service Fees - The Trust has a distribution agreement with MetLife Investors Distribution Company (“MIDC” or the “Distributor”) in which MIDC serves as the distributor for the Portfolio’s Class A, B and E Shares. MIDC is a wholly-owned subsidiary of MetLife Investors Group, LLC, an affiliate of the Adviser. The Trust has also adopted a Distribution and Service Plan under Rule 12b-1 of the 1940 Act for the Portfolio’s Class B and E Shares. Under the Distribution and Service Plan, the Class B and E Shares of the Portfolio pay a fee to compensate the Insurance Companies (or their affiliates) and other broker-dealers and financial intermediaries involved in the offer and sale of Portfolio shares for promoting or selling and servicing the Class B and E Shares. The fees under the Distribution and Service Plan for each class of the Portfolio’s shares are calculated as a percentage of the Portfolio’s average daily net assets that are attributable to that Class. Currently, the fee is 0.25% per year for Class B Shares and 0.15% per year for Class E Shares. Amounts incurred by the Portfolio for the six months ended June 30, 2016 are shown as Distribution and service fees in the Statement of Operations.
Deferred Trustee Compensation - Each Trustee who is not currently an employee of the Adviser or any of its affiliates receives compensation from the Trust for his or her service to the Trust. A deferred compensation plan (the “Plan”) is available to the Trustees on a voluntary basis. Deferred amounts remain in the Trust until distributed in accordance with the provisions of the Plan. The value of a participating Trustee’s deferral account is based on theoretical investments of deferred amounts on the normal payment dates in certain portfolios of the Trust or Met Investors Series Trust, an affiliate of the Trust, as designated by the participating Trustee. Changes in the value of participants’ deferral accounts are reflected as Trustees’ fees and expenses in the Statement of Operations. The portion of the accrued obligations allocated to the Portfolio under the Plan is reflected as Deferred trustees’ fees in the Statement of Assets and Liabilities.
6. Contractual Obligations
Under the Trust’s organizational documents, its officers and Trustees may be indemnified against certain liabilities and expenses arising out of the performance of their duties to the Trust. Additionally, the Trust has a variety of indemnification obligations under contracts with its service providers. The Trust’s maximum exposure under these arrangements is unknown, as this would involve future claims that may be made against the Trust that have not yet occurred.
7. Income Tax Information
The tax character of distributions paid for the years ended December 31, 2015 and 2014 were as follows:
| | | | | | | | | | | | | | | | | | | | |
Ordinary Income | | | Long-Term Capital Gain | | | Total | |
2015 | | 2014 | | | 2015 | | | 2014 | | | 2015 | | | 2014 | |
| $83,570,232 | | $ | 1,160,142 | | | $ | 249,000,590 | | | $ | — | | | $ | 332,570,822 | | | $ | 1,160,142 | |
As of December 31, 2015, the components of distributable earnings (accumulated losses) on a federal income tax basis were as follows:
| | | | | | | | | | | | | | | | |
Undistributed
Ordinary
Income | | Undistributed
Long-Term
Capital Gain | | | Net
Unrealized
Appreciation | | | Other
Accumulated
Capital Losses | | | Total | |
| $26,835,394 | | $ | 129,986,530 | | | $ | 258,099,321 | | | $ | — | | | $ | 414,921,245 | |
The Portfolio utilizes the provisions of the federal income tax laws that provide for the carryforward of capital losses for prior years, offsetting such losses against any future realized capital gains. Under the Regulated Investment Company Modernization Act of 2010 (the “Act”), net capital losses recognized after December 22, 2010 may be carried forward indefinitely and their character is retained as short-term and/or long-term losses. Previously, net capital losses were carried forward for up to eight years and treated as short-term losses. As a transition rule, the Act requires that post-enactment net capital losses be used before pre-enactment net capital losses.
As of December 31, 2015, the Portfolio had no post-enactment accumulated capital losses and no pre-enactment accumulated capital loss carryforwards.
MSF-17
Metropolitan Series Fund
BlackRock Large Cap Value Portfolio
Managed By BlackRock Advisors, LLC
Portfolio Manager Commentary*
PERFORMANCE
For the six month period ended June 30, 2016, the Class A, B and E shares of the BlackRock Large Cap Value Portfolio returned 5.26%, 5.00%, and 5.10%, respectively. The Portfolio’s benchmark, the Russell 1000 Value Index1, returned 6.30%.
MARKET ENVIRONMENT / CONDITIONS
The U.S. equity market has endured one of the more volatile first halfs in recent years, as global growth concerns dominated both the beginning and end of the period. After a double-digit correction in the first six weeks of 2016, U.S. stocks climbed sharply through the end of May, fueled by a rebound in oil prices and easing of global growth concerns. Volatility returned with the U.K.’s vote to exit from the European Union (“Brexit”) at the end of the quarter.
Although U.S. equities recovered much of their post-Brexit losses, at the end of the reporting period investors remained uncertain, looking to the remainder of 2016 with trepidation. We are mindful of these concerns and fully expect volatility to continue, but we see opportunity for value investors with a long-term time horizon and the ability to weather short-term market volatility.
PORTFOLIO REVIEW / PERIOD END POSITIONING
The Portfolio underperformed the Russell 1000 Value Index during the six-month period. Stock selection in the Financials sector and our underweight allocation to and stock selection in Consumer Staples detracted from relative performance over the period. Stock selection in Health Care and Utilities contributed to relative performance during the period as did our overweight allocation to the Telecommunication Services sector.
In Financials, our overweight positions in Capital One Financial and Discover Financial Services proved to be costly amid concerns regarding consumer credit quality, and our overweight positions in Citigroup and JPMorgan Chase & Co. detracted as falling interest rates renewed concerns about net interest margin pressure. Our underweight to real estate investment trusts also weighed on relative returns as falling interest rates continued to increase investor demand for yield.
Our underweight to Consumer Staples also detracted, as investors gravitated to its perceived safety and stability without regard for valuation. Our overweight position in Kroger Co. also dampened relative performance as the grocery-store operator lagged due in part to concerns that food inflation may dampen the company’s same-store sales.
In Health Care, our overweight positions in St. Jude Medical and Baxalta proved beneficial. St. Jude Medical shares rallied following the announcement that Abbott Laboratories was going to acquire the company, and Baxalta benefited from the closing of its merger with Shire plc. Stock selection in Utilities also added to relative performance, as our overweight positions in Exelon, AES, and Dynegy benefitted from the rebound in power prices during the period. Our overweight in Telecommunication Services, including our overweight position in Verizon Communications also added to performance.
At period end, we remained positioned in the areas of the market where we see the greatest value. Our largest absolute exposures remained in the Financials, Health Care and Energy sectors. During the period, we modestly increased the allocation to the Energy and Utilities sectors and reduced our exposure to the Financials and Telecommunication Services sectors. As of the end of June, the Portfolio was overweight the Health Care, Information Technology, and Energy sectors and underweight the Consumer Staples, Industrials, and Materials sectors, relative to the Index.
Bart Geer
Carrie King
Portfolio Managers
BlackRock Advisors, LLC
* This commentary may include statements that constitute “forward-looking statements” under the U.S. securities laws. Forward-looking statements include, among other things, projections, estimates, and information about possible or future results related to the Portfolio, market or regulatory developments. The views expressed above are not guarantees of future performance or economic results and involve certain risks, uncertainties and assumptions that could cause actual outcomes and results to differ materially from the views expressed herein. The views expressed above are subject to change at any time based upon economic, market, or other conditions and the subadvisory firm undertakes no obligation to update the views expressed herein. Any discussions of specific securities should not be considered a recommendation to buy or sell those securities. The views expressed above (including any forward-looking statement) may not be relied upon as investment advice or as an indication of the Portfolio’s trading intent. Information about the Portfolio’s holdings, asset allocation or country diversification is historical and is not an indication of future Portfolio composition, which may vary. Direct investment in any index is not possible. The performance of any index mentioned in this commentary has not been adjusted for ongoing management, distribution and operating expenses, and sales charges applicable to mutual fund investments. In addition, the returns do not reflect additional fees charged by separate accounts or variable insurance contracts that an investor in the Portfolio may pay. If these additional fees were reflected, performance would have been lower.
MSF-1
Metropolitan Series Fund
BlackRock Large Cap Value Portfolio
A $10,000 INVESTMENT COMPARED TO THE RUSSELL 1000 VALUE INDEX
SIX MONTH RETURN & AVERAGE ANNUAL RETURNS (%) AS OF JUNE 30, 2016
| | | | | | | | | | | | | | | | |
| | | 6 Month | | | 1 Year | | | 5 Year | | | 10 Year | |
| BlackRock Large Cap Value Portfolio | | | | | | | | | | | | | | | | |
Class A | | | 5.26 | | | | -3.98 | | | | 8.58 | | | | 4.51 | |
Class B | | | 5.00 | | | | -4.29 | | | | 8.30 | | | | 4.25 | |
Class E | | | 5.10 | | | | -4.16 | | | | 8.40 | | | | 4.36 | |
| Russell 1000 Value Index | | | 6.30 | | | | 2.86 | | | | 11.35 | | | | 6.13 | |
1 The Russell 1000 Value Index is an unmanaged measure of the largest capitalized U.S. domiciled companies with a less than average growth orientation. Companies in this Index generally have a low price-to-book and price-to-earnings ratio, higher dividend yields and lower forecasted growth values.
Portfolio performance is calculated including reinvestment of all income and capital gain distributions. Performance numbers are net of all Portfolio expenses but do not include any insurance, sales, separate account or administrative charges of variable annuity or life insurance contracts or any additional expenses that participants may bear relating to the operations of their plans. If these charges were included, the returns would be lower. The performance of any index referenced above has not been adjusted for ongoing management, distribution and operating expenses, and sales charges applicable to mutual fund investments. Direct investment in any index is not possible. The performance of Class A shares, as set forth in the line graph above, will differ from that of other classes because of the difference in expenses paid by policyholders investing in the different share classes.
This information represents past performance and is not indicative of future results. Investment return and principal value may fluctuate so that shares, upon redemption, may be worth more or less than the original cost.
PORTFOLIO COMPOSITION AS OF JUNE 30, 2016
Top Holdings
| | | | |
| | | % of
Net Assets | |
| Cisco Systems, Inc. | | | 5.1 | |
| JPMorgan Chase & Co. | | | 4.8 | |
| QUALCOMM, Inc. | | | 4.7 | |
| Citigroup, Inc. | | | 4.5 | |
| Pfizer, Inc. | | | 4.2 | |
| Apache Corp. | | | 3.8 | |
| Merck & Co., Inc. | | | 3.7 | |
| Discover Financial Services | | | 3.6 | |
| Exelon Corp. | | | 3.2 | |
| AES Corp. | | | 2.9 | |
Top Sectors
| | | | |
| | | % of
Net Assets | |
| Financials | | | 26.8 | |
| Health Care | | | 16.4 | |
| Energy | | | 15.3 | |
| Information Technology | | | 12.4 | |
| Utilities | | | 7.6 | |
| Consumer Discretionary | | | 6.3 | |
| Industrials | | | 5.6 | |
| Telecommunication Services | | | 4.6 | |
| Consumer Staples | | | 2.0 | |
| Materials | | | 1.8 | |
MSF-2
Metropolitan Series Fund
BlackRock Large Cap Value Portfolio
Understanding Your Portfolio’s Expenses (Unaudited)
Shareholder Expense Example
As a shareholder of the Portfolio, you incur ongoing costs, including management fees; distribution and service (12b-1) fees; and other Portfolio expenses. This example is intended to help you understand your ongoing costs (in dollars) (referred to as “expenses”) of investing in the Portfolio and compare these costs with the ongoing costs of investing in other mutual funds. The example is based on an investment of $1,000 invested at the beginning of the period and held for the entire period, January 1, 2016 through June 30, 2016.
Actual Expenses
The first line for each share class of the Portfolio in the table below provides information about actual account values and actual expenses. You may use the information in this line, together with the amount you invested in the particular share class of the Portfolio, to estimate the expenses that you paid over the period. Simply divide your account value by $1,000 (for example, an $8,600 account value divided by $1,000 = 8.6), then multiply the result by the number in the first line under the heading entitled “Expenses Paid During Period” to estimate the expenses you paid on your account during this period.
Hypothetical Example for Comparison Purposes
The second line for each share class of the Portfolio in the table below provides information about hypothetical account values and hypothetical expenses based on the Portfolio’s actual expense ratio and an assumed rate of return of 5% per year before expenses, which is not the Portfolio’s actual return. The hypothetical account values and expenses may not be used to estimate the actual ending account balance or expenses you paid for the period. You may use this information to compare the ongoing costs of investing in the Portfolio and other funds. To do so, compare this 5% hypothetical example with the 5% hypothetical examples that appear in the shareholder reports of the other funds.
Please note that the expenses shown in the table are meant to highlight your ongoing costs only and do not reflect any fees or charges of your variable insurance product or any additional expenses that participants in certain eligible qualified plans may bear relating to the operations of their plan. Therefore, the second line for each share class in the table is useful in comparing ongoing costs only, and will not help you determine the relative total costs of owning different funds. In addition, if these other costs were included, your costs would have been higher.
| | | | | | | | | | | | | | | | | | |
BlackRock Large Cap Value Portfolio | | | | Annualized
Expense
Ratio | | | Beginning
Account Value
January 1,
2016 | | | Ending
Account Value
June 30,
2016 | | | Expenses Paid
During Period**
January 1, 2016
to
June 30,
2016 | |
Class A(a) | | Actual | | | 0.64 | % | | $ | 1,000.00 | | | $ | 1,052.60 | | | $ | 3.27 | |
| | Hypothetical* | | | 0.64 | % | | $ | 1,000.00 | | | $ | 1,021.68 | | | $ | 3.22 | |
| | | | | |
Class B(a) | | Actual | | | 0.89 | % | | $ | 1,000.00 | | | $ | 1,050.00 | | | $ | 4.54 | |
| | Hypothetical* | | | 0.89 | % | | $ | 1,000.00 | | | $ | 1,020.44 | | | $ | 4.47 | |
| | | | | |
Class E(a) | | Actual | | | 0.79 | % | | $ | 1,000.00 | | | $ | 1,051.00 | | | $ | 4.03 | |
| | Hypothetical* | | | 0.79 | % | | $ | 1,000.00 | | | $ | 1,020.94 | | | $ | 3.97 | |
* Hypothetical assumes a rate of return of 5% per year before expenses.
** Expenses paid are equal to the Portfolio’s annualized expense ratio for the most recent six month period, as shown above, multiplied by the average account value over the period, multiplied by the number of days (182 days) in the most recent fiscal half-year, divided by 366 (to reflect the one-half year period).
(a) The annualized expense ratio shown reflects the impact of the management fee waiver as described in Note 5 of the Notes to Financial Statements.
MSF-3
Metropolitan Series Fund
BlackRock Large Cap Value Portfolio
Schedule of Investments as of June 30, 2016 (Unaudited)
Common Stocks—98.3% of Net Assets
| | | | | | | | |
| Security Description | | Shares | | | Value | |
|
Aerospace & Defense—2.0% | |
BE Aerospace, Inc. (a) | | | 65,960 | | | $ | 3,045,703 | |
Boeing Co. (The) | | | 86,640 | | | | 11,251,937 | |
Honeywell International, Inc. | | | 37,790 | | | | 4,395,733 | |
Huntington Ingalls Industries, Inc. | | | 36,960 | | | | 6,210,389 | |
Northrop Grumman Corp. | | | 5,900 | | | | 1,311,452 | |
Raytheon Co. | | | 15,015 | | | | 2,041,289 | |
| | | | | | | | |
| | | | | | | 28,256,503 | |
| | | | | | | | |
|
Airlines—0.5% | |
American Airlines Group, Inc. | | | 244,220 | | | | 6,913,868 | |
| | | | | | | | |
|
Auto Components—1.3% | |
Lear Corp. | | | 171,610 | | | | 17,463,033 | |
Magna International, Inc. | | | 38,180 | | | | 1,338,973 | |
| | | | | | | | |
| | | | | | | 18,802,006 | |
| | | | | | | | |
|
Automobiles—0.2% | |
Thor Industries, Inc. | | | 45,476 | | | | 2,944,116 | |
| | | | | | | | |
|
Banks—12.4% | |
Bank of America Corp. | | | 1,161,850 | | | | 15,417,749 | |
Citigroup, Inc. | | | 1,536,331 | | | | 65,125,071 | |
JPMorgan Chase & Co. | | | 1,109,677 | | | | 68,955,329 | |
KeyCorp | | | 744,550 | | | | 8,227,277 | |
Regions Financial Corp. | | | 1,099,731 | | | | 9,358,711 | |
Wells Fargo & Co. | | | 252,420 | | | | 11,947,039 | |
| | | | | | | | |
| | | | | | | 179,031,176 | |
| | | | | | | | |
|
Biotechnology—1.9% | |
Gilead Sciences, Inc. | | | 230,940 | | | | 19,265,015 | |
Shire plc (ADR) | | | 44,776 | | | | 8,242,366 | |
| | | | | | | | |
| | | | | | | 27,507,381 | |
| | | | | | | | |
|
Capital Markets—0.9% | |
Ameriprise Financial, Inc. | | | 32,760 | | | | 2,943,486 | |
KKR & Co. L.P. | | | 23,051 | | | | 284,449 | |
Morgan Stanley | | | 377,410 | | | | 9,805,112 | |
| | | | | | | | |
| | | | | | | 13,033,047 | |
| | | | | | | | |
|
Chemicals—0.4% | |
Akzo Nobel NV (ADR) (a) | | | 207,761 | | | | 4,371,292 | |
Ashland, Inc. | | | 18,260 | | | | 2,095,700 | |
| | | | | | | | |
| | | | | | | 6,466,992 | |
| | | | | | | | |
|
Communications Equipment—6.0% | |
Cisco Systems, Inc. | | | 2,552,250 | | | | 73,224,052 | |
Nokia Oyj (ADR) (a) | | | 1,241,210 | | | | 7,062,485 | |
Telefonaktiebolaget LM Ericsson (ADR) | | | 868,756 | | | | 6,672,046 | |
| | | | | | | | |
| | | | | | | 86,958,583 | |
| | | | | | | | |
|
Construction & Engineering—0.4% | |
AECOM (b) | | | 182,850 | | | | 5,809,145 | |
| | | | | | | | |
|
Consumer Finance—6.8% | |
Capital One Financial Corp. | | | 564,850 | | | | 35,873,623 | |
Discover Financial Services | | | 974,800 | | | | 52,239,532 | |
SLM Corp. (b) | | | 1,771,110 | | | | 10,945,460 | |
| | | | | | | | |
| | | | | | | 99,058,615 | |
| | | | | | | | |
|
Containers & Packaging—0.7% | |
Avery Dennison Corp. | | | 35,020 | | | | 2,617,745 | |
Bemis Co., Inc. | | | 90,710 | | | | 4,670,658 | |
Crown Holdings, Inc. (b) | | | 55,170 | | | | 2,795,464 | |
| | | | | | | | |
| | | | | | | 10,083,867 | |
| | | | | | | | |
|
Diversified Financial Services—1.2% | |
Nasdaq, Inc. | | | 258,955 | | | | 16,746,620 | |
| | | | | | | | |
|
Diversified Telecommunication Services—2.8% | |
Verizon Communications, Inc. | | | 713,560 | | | | 39,845,190 | |
| | | | | | | | |
|
Electric Utilities—3.2% | |
Exelon Corp. | | | 1,275,190 | | | | 46,365,908 | |
| | | | | | | | |
|
Energy Equipment & Services—1.0% | |
Superior Energy Services, Inc. | | | 817,969 | | | | 15,058,809 | |
| | | | | | | | |
|
Food & Staples Retailing—1.2% | |
CVS Health Corp. | | | 27,790 | | | | 2,660,615 | |
Kroger Co. (The) | | | 391,924 | | | | 14,418,884 | |
| | | | | | | | |
| | | | | | | 17,079,499 | |
| | | | | | | | |
|
Food Products—0.3% | |
Mondelez International, Inc. - Class A | | | 95,750 | | | | 4,357,583 | |
| | | | | | | | |
|
Health Care Equipment & Supplies—6.1% | |
Baxter International, Inc. (a) | | | 797,870 | | | | 36,079,681 | |
Medtronic plc | | | 210,280 | | | | 18,245,996 | |
St. Jude Medical, Inc. | | | 100,600 | | | | 7,846,800 | |
Zimmer Biomet Holdings, Inc. (a) | | | 223,540 | | | | 26,909,745 | |
| | | | | | | | |
| | | | | | | 89,082,222 | |
| | | | | | | | |
|
Hotels, Restaurants & Leisure—0.0% | |
Wyndham Worldwide Corp. (a) | | | 2,030 | | | | 144,597 | |
| | | | | | | | |
|
Household Durables—1.2% | |
Newell Brands, Inc. | | | 339,780 | | | | 16,503,115 | |
Tupperware Brands Corp. (a) | | | 28,030 | | | | 1,577,528 | |
| | | | | | | | |
| | | | | | | 18,080,643 | |
| | | | | | | | |
| | | | | | | | |
|
Independent Power and Renewable Electricity Producers—4.4% | |
AES Corp. | | | 3,418,560 | | | | 42,663,629 | |
Dynegy, Inc. (a) (b) | | | 1,242,560 | | | | 21,421,734 | |
| | | | | | | | |
| | | | | | | 64,085,363 | |
| | | | | | | | |
|
Insurance—3.9% | |
Genworth Financial, Inc. - Class A (b) | | | 1,323,040 | | | | 3,413,443 | |
Hartford Financial Services Group, Inc. (The) | | | 392,390 | | | | 17,414,268 | |
See accompanying notes to financial statements.
MSF-4
Metropolitan Series Fund
BlackRock Large Cap Value Portfolio
Schedule of Investments as of June 30, 2016 (Unaudited)
Common Stocks—(Continued)
| | | | | | | | |
| Security Description | | Shares | | | Value | |
|
Insurance—(Continued) | |
Lincoln National Corp. | | | 273,900 | | | $ | 10,619,103 | |
Prudential Financial, Inc. | | | 219,300 | | | | 15,644,862 | |
XL Group plc | | | 294,330 | | | | 9,804,133 | |
| | | | | | | | |
| | | | | | | 56,895,809 | |
| | | | | | | | |
|
Internet & Catalog Retail—0.0% | |
Priceline Group, Inc. (The) (b) | | | 330 | | | | 411,975 | |
| | | | | | | | |
|
IT Services—0.2% | |
Fidelity National Information Services, Inc. | | | 20,310 | | | | 1,496,441 | |
First Data Corp. - Class A (a) (b) | | | 159,360 | | | | 1,764,115 | |
| | | | | | | | |
| | | | | | | 3,260,556 | |
| | | | | | | | |
|
Media—2.8% | |
Comcast Corp. - Class A | | | 241,820 | | | | 15,764,246 | |
Interpublic Group of Cos., Inc. (The) | | | 298,330 | | | | 6,891,423 | |
Omnicom Group, Inc. (a) | | | 59,370 | | | | 4,838,061 | |
Scripps Networks Interactive, Inc. - Class A (a) | | | 218,920 | | | | 13,632,148 | |
| | | | | | | | |
| | | | | | | 41,125,878 | |
| | | | | | | | |
|
Metals & Mining—0.6% | |
Allegheny Technologies, Inc. (a) | | | 65,470 | | | | 834,743 | |
Reliance Steel & Aluminum Co. | | | 104,210 | | | | 8,013,749 | |
| | | | | | | | |
| | | | | | | 8,848,492 | |
| | | | | | | | |
|
Multiline Retail—0.1% | |
Dollar General Corp. | | | 7,530 | | | | 707,820 | |
| | | | | | | | |
|
Oil, Gas & Consumable Fuels—14.3% | |
Apache Corp. | | | 992,650 | | | | 55,260,826 | |
Devon Energy Corp. | | | 1,104,480 | | | | 40,037,400 | |
Gulfport Energy Corp. (b) | | | 836,320 | | | | 26,143,363 | |
Hess Corp. | | | 36,170 | | | | 2,173,817 | |
Marathon Oil Corp. | | | 2,665,370 | | | | 40,007,204 | |
Marathon Petroleum Corp. | | | 348,602 | | | | 13,232,932 | |
Parsley Energy, Inc. - Class A (b) | | | 273,790 | | | | 7,408,757 | |
Suncor Energy, Inc. | | | 54,300 | | | | 1,505,739 | |
Valero Energy Corp. | | | 420,020 | | | | 21,421,020 | |
| | | | | | | | |
| | | | | | | 207,191,058 | |
| | | | | | | | |
|
Personal Products—0.1% | |
Unilever NV | | | 30,910 | | | | 1,450,915 | |
| | | | | | | | |
|
Pharmaceuticals—8.4% | |
Merck & Co., Inc. | | | 932,520 | | | | 53,722,477 | |
Pfizer, Inc. | | | 1,720,085 | | | | 60,564,193 | |
Teva Pharmaceutical Industries, Ltd. (ADR) | | | 135,970 | | | | 6,829,773 | |
| | | | | | | | |
| | | | | | | 121,116,443 | |
| | | | | | | | |
|
Professional Services—2.6% | |
Dun & Bradstreet Corp. (The) | | | 18,460 | | | | 2,249,166 | |
Nielsen Holdings plc | | | 672,310 | | | | 34,939,951 | |
| | | | | | | | |
| | | | | | | 37,189,117 | |
| | | | | | | | |
|
Real Estate Investment Trusts—1.1% | |
Brixmor Property Group, Inc. | | | 160,540 | | | | 4,247,888 | |
Starwood Property Trust, Inc. | | | 588,490 | | | | 12,193,513 | |
| | | | | | | | |
| | | | 16,441,401 | |
| | | | | | | | |
|
Semiconductors & Semiconductor Equipment—5.1% | |
Lam Research Corp. | | | 1,790 | | | | 150,467 | |
QUALCOMM, Inc. | | | 1,281,750 | | | | 68,663,348 | |
Teradyne, Inc. | | | 260,158 | | | | 5,122,511 | |
| | | | | | | | |
| | | | 73,936,326 | |
| | | | | | | | |
|
Software—0.1% | |
Oracle Corp. | | | 17,830 | | | | 729,782 | |
| | | | | | | | |
| | |
Specialty Retail—0.6% | | | | | | | | |
GNC Holdings, Inc. - Class A (a) | | | 382,600 | | | | 9,293,354 | |
| | | | | | | | |
|
Technology Hardware, Storage & Peripherals—1.0% | |
Apple, Inc. | | | 154,390 | | | | 14,759,684 | |
| | | | | | | | |
|
Thrifts & Mortgage Finance—0.5% | |
New York Community Bancorp, Inc. | | | 492,070 | | | | 7,376,129 | |
| | | | | | | | |
|
Trading Companies & Distributors—0.1% | |
AerCap Holdings NV (a) (b) | | | 12,610 | | | | 423,570 | |
Air Lease Corp. (a) | | | 20,920 | | | | 560,238 | |
| | | | | | | | |
| | | | 983,808 | |
| | | | | | | | |
|
Wireless Telecommunication Services—1.9% | |
Telephone & Data Systems, Inc. | | | 798,816 | | | | 23,692,883 | |
United States Cellular Corp. (b) | | | 95,400 | | | | 3,746,358 | |
| | | | | | | | |
| | | | 27,439,241 | |
| | | | | | | | |
Total Common Stocks
(Cost $1,368,325,754) | | | | | | | 1,424,869,521 | |
| | | | | | | | |
|
| Convertible Preferred Stocks—0.5% | |
|
Food Products—0.4% | |
Tyson Foods, Inc.
4.750%, 07/15/17 | | | 88,627 | | | | 6,547,763 | |
| | | | | | | | |
| | |
Machinery—0.1% | | | | | | | | |
Stanley Black & Decker, Inc.
6.250%, 11/17/16 | | | 10,940 | | | | 1,270,134 | |
| | | | | | | | |
Total Convertible Preferred Stocks
(Cost $5,540,901) | | | | | | | 7,817,897 | |
| | | | | | | | |
|
| Short-Term Investments—4.5% | |
| | |
Mutual Fund—2.9% | | | | | | | | |
State Street Navigator Securities Lending MET Portfolio (c) | | | 41,934,892 | | | | 41,934,892 | |
| | | | | | | | |
See accompanying notes to financial statements.
MSF-5
Metropolitan Series Fund
BlackRock Large Cap Value Portfolio
Schedule of Investments as of June 30, 2016 (Unaudited)
Common Stocks—(Continued)
| | | | | | | | |
| Security Description | | Principal
Amount* | | | Value | |
|
Repurchase Agreement—1.6% | |
Fixed Income Clearing Corp. Repurchase Agreement dated 06/30/16 at 0.030% to be repurchased at $22,648,430 on 07/01/16, collateralized by $22,375,000 U.S. Treasury Note at 1.625% due 07/31/20 with a value of $23,102,188. | | | 22,648,411 | | | $ | 22,648,411 | |
| | | | | | | | |
Total Short-Term Investments
(Cost $64,583,303) | | | | | | | 64,583,303 | |
| | | | | | | | |
Total Investments—103.3%
(Cost $1,438,449,958) (d) | | | | | | | 1,497,270,721 | |
Other assets and liabilities (net)—(3.3)% | | | | | | | (48,095,554 | ) |
| | | | | | | | |
| Net Assets—100.0% | | | | | | $ | 1,449,175,167 | |
| | | | | | | | |
| * | Principal amount stated in U.S. dollars unless otherwise noted. |
| (a) | All or a portion of the security was held on loan. As of June 30, 2016, the market value of securities loaned was $58,451,799 and the collateral received consisted of cash in the amount of $41,934,892 and non-cash collateral with a value of $17,321,519. The cash collateral is invested in a money market fund managed by an affiliate of the custodian. The non-cash collateral received consists primarily of government securities and bank letters of credit, and is held for the benefit of the Portfolio at the Portfolio’s custodian. The Portfolio cannot repledge or resell this collateral. As such, this collateral is excluded from the Statement of Assets and Liabilities. |
| (b) | Non-income producing security. |
| (c) | Represents investment of cash collateral received from securities on loan as of June 30, 2016. |
| (d) | As of June 30, 2016, the aggregate cost of investments was $1,438,449,958. The aggregate unrealized appreciation and depreciation of investments were $157,290,713 and $(98,469,950), respectively, resulting in net unrealized appreciation of $58,820,763. |
| (ADR)— | An American Depositary Receipt is a certificate issued by a custodian bank representing the right to receive securities of the foreign issuer described. Trading on exchanges not located in the United States or Canada significantly influences the value of ADRs. |
Fair Value Hierarchy
Accounting principles generally accepted in the United States of America (“GAAP”) define fair market value as the price that the Portfolio would receive to sell an asset or pay to transfer a liability in an orderly transaction between market participants at the measurement date. It establishes a fair value hierarchy that prioritizes inputs to valuation methods and requires disclosure of the fair value hierarchy, separately for each major category of assets and liabilities, that segregates fair value measurements into three levels. Levels 1, 2 and 3 of the fair value hierarchy are defined as follows:
Level 1 - unadjusted quoted prices in active markets for identical investments
Level 2 - other significant observable inputs (including, but not limited to, quoted prices for similar assets or liabilities in markets that are either active or inactive; inputs other than quoted prices that are observable such as interest rates, yield curves, volatilities, prepayment speeds, loss severities, credit risks, default rates, or other market corroborated inputs)
Level 3 - significant unobservable inputs based on the best information available in the circumstances, to the extent observable inputs are unavailable (including the Portfolio’s own assumptions used in determining the fair value of investments and derivative financial instruments)
The inputs or methodologies used for valuing investments are not necessarily an indication of the risk associated with investing in them. Changes to the inputs or methodologies used may result in transfers between levels, which will be recognized as of the beginning of the reporting period. Information on transfers between Level 1 and Level 2, if any, will be disclosed following the fair value hierarchy table below. A reconciliation of Level 3 securities, if any, will also be disclosed following the fair value hierarchy table. For more information about the Portfolio’s policy regarding the valuation of investments, please refer to the Notes to Financial Statements.
The following table summarizes the fair value hierarchy of the Portfolio’s investments as of June 30, 2016:
| | | | | | | | | | | | | | | | |
| Description | | Level 1 | | | Level 2 | | | Level 3 | | | Total | |
Total Common Stocks* | | $ | 1,424,869,521 | | | $ | — | | | $ | — | | | $ | 1,424,869,521 | |
Total Convertible Preferred Stocks* | | | 7,817,897 | | | | — | | | | — | | | | 7,817,897 | |
| Short-Term Investments | | | | | | | | | | | | | | | | |
Mutual Fund | | | 41,934,892 | | | | — | | | | — | | | | 41,934,892 | |
Repurchase Agreement | | | — | | | | 22,648,411 | | | | — | | | | 22,648,411 | |
Total Short-Term Investments | | | 41,934,892 | | | | 22,648,411 | | | | — | | | | 64,583,303 | |
Total Investments | | $ | 1,474,622,310 | | | $ | 22,648,411 | | | $ | — | | | $ | 1,497,270,721 | |
| | | | | | | | | | | | | | | | | |
Collateral for Securities Loaned (Liability) | | $ | — | | | $ | (41,934,892 | ) | | $ | — | | | $ | (41,934,892 | ) |
| * | See Schedule of Investments for additional detailed categorizations. |
See accompanying notes to financial statements.
MSF-6
Metropolitan Series Fund
BlackRock Large Cap Value Portfolio
Statement of Assets and Liabilities
June 30, 2016 (Unaudited)
| | | | |
Assets | |
Investments at value (a) (b) | | $ | 1,497,270,721 | |
Cash | | | 60,000 | |
Receivable for: | | | | |
Investments sold | | | 3,773,875 | |
Fund shares sold | | | 6,543 | |
Dividends and interest | | | 1,612,905 | |
Prepaid expenses | | | 9,347 | |
| | | | |
Total Assets | | | 1,502,733,391 | |
Liabilities | |
Collateral for securities loaned | | | 41,934,892 | |
Payables for: | |
Investments purchased | | | 10,001,054 | |
Fund shares redeemed | | | 567,646 | |
Accrued Expenses: | |
Management fees | | | 720,037 | |
Distribution and service fees | | | 56,733 | |
Deferred trustees’ fees | | | 76,062 | |
Other expenses | | | 201,800 | |
| | | | |
Total Liabilities | | | 53,558,224 | |
| | | | |
Net Assets | | $ | 1,449,175,167 | |
| | | | |
Net assets consist of: | |
Paid in surplus | | $ | 1,410,131,797 | |
Undistributed net investment income | | | 14,676,508 | |
Accumulated net realized loss | | | (34,453,901 | ) |
Unrealized appreciation on investments | | | 58,820,763 | |
| | | | |
Net Assets | | $ | 1,449,175,167 | |
| | | | |
Net Assets | |
Class A | | $ | 1,151,965,098 | |
Class B | | | 247,082,226 | |
Class E | | | 50,127,843 | |
Capital Shares Outstanding* | |
Class A | | | 143,612,044 | |
Class B | | | 31,099,991 | |
Class E | | | 6,280,756 | |
Net Asset Value, Offering Price and Redemption Price Per Share | | | | |
Class A | | $ | 8.02 | |
Class B | | | 7.94 | |
Class E | | | 7.98 | |
| * | The Portfolio is authorized to issue an unlimited number of shares. |
| (a) | Identified cost of investments was $1,438,449,958. |
| (b) | Includes securities loaned at value of $58,451,799. |
Statement of Operations
Six Months Ended June 30, 2016 (Unaudited)
| | | | |
Investment Income | |
Dividends (a) | | $ | 18,827,632 | |
Interest | | | 950 | |
Securities lending income | | | 160,367 | |
| | | | |
Total investment income | | | 18,988,949 | |
Expenses | |
Management fees | | | 4,484,554 | |
Administration fees | | | 17,949 | |
Custodian and accounting fees | | | 72,991 | |
Distribution and service fees—Class B | | | 298,286 | |
Distribution and service fees—Class E | | | 35,812 | |
Audit and tax services | | | 20,230 | |
Legal | | | 13,588 | |
Trustees’ fees and expenses | | | 15,990 | |
Shareholder reporting | | | 34,779 | |
Insurance | | | 5,192 | |
Miscellaneous | | | 9,663 | |
| | | | |
Total expenses | | | 5,009,034 | |
Less management fee waiver | | | (191,381 | ) |
| | | | |
Net expenses | | | 4,817,653 | |
| | | | |
Net Investment Income | | | 14,171,296 | |
| | | | |
Net Realized and Unrealized Gain (Loss) | |
| Net realized gain (loss) on: | |
Investments | | | (27,806,027 | ) |
Foreign currency transactions | | | 125 | |
| | | | |
Net realized loss | | | (27,805,902 | ) |
| | | | |
Net change in unrealized appreciation on investments | | | 88,911,547 | |
| | | | |
Net realized and unrealized gain | | | 61,105,645 | |
| | | | |
Net Increase in Net Assets From Operations | | $ | 75,276,941 | |
| | | | |
| (a) | Net of foreign withholding taxes of $219,487. |
See accompanying notes to financial statements.
MSF-7
Metropolitan Series Fund
BlackRock Large Cap Value Portfolio
Statements of Changes in Net Assets
| | | | | | | | |
| | | Six Months
Ended
June 30,
2016
(Unaudited) | | | Year Ended
December 31,
2015 | |
Increase (Decrease) in Net Assets: | | | | | | | | |
From Operations | | | | | | | | |
Net investment income | | $ | 14,171,296 | | | $ | 24,989,616 | |
Net realized gain (loss) | | | (27,805,902 | ) | | | 112,151,185 | |
Net change in unrealized appreciation (depreciation) | | | 88,911,547 | | | | (227,214,620 | ) |
| | | | | | | | |
Increase (decrease) in net assets from operations | | | 75,276,941 | | | | (90,073,819 | ) |
| | | | | | | | |
From Distributions to Shareholders | | | | | | | | |
Net investment income | |
Class A | | | (19,387,735 | ) | | | (22,599,992 | ) |
Class B | | | (3,535,480 | ) | | | (4,230,425 | ) |
Class E | | | (763,362 | ) | | | (923,252 | ) |
Net realized capital gains | |
Class A | | | (88,611,057 | ) | | | (101,131,805 | ) |
Class B | | | (19,261,297 | ) | | | (22,003,704 | ) |
Class E | | | (3,879,474 | ) | | | (4,536,965 | ) |
| | | | | | | | |
Total distributions | | | (135,438,405 | ) | | | (155,426,143 | ) |
| | | | | | | | |
Increase in net assets from capital share transactions | | | 49,114,286 | | | | 20,021,122 | |
| | | | | | | | |
Total decrease in net assets | | | (11,047,178 | ) | | | (225,478,840 | ) |
|
Net Assets | |
Beginning of period | | | 1,460,222,345 | | | | 1,685,701,185 | |
| | | | | | | | |
End of period | | $ | 1,449,175,167 | | | $ | 1,460,222,345 | |
| | | | | | | | |
| | |
Undistributed net investment income | | | | | | | | |
End of period | | $ | 14,676,508 | | | $ | 24,191,789 | |
| | | | | | | | |
Other Information:
Capital Shares
Transactions in capital shares were as follows:
| | | | | | | | | | | | | | | | |
| | | Six Months Ended
June 30, 2016
(Unaudited) | | | Year Ended
December 31, 2015 | |
| | | Shares | | | Value | | | Shares | | | Value | |
Class A | | | | | | | | | | | | | | | | |
Sales | | | 907,323 | | | $ | 7,117,617 | | | | 1,384,828 | | | $ | 13,378,089 | |
Reinvestments | | | 13,670,734 | | | | 107,998,792 | | | | 13,162,957 | | | | 123,731,797 | |
Redemptions | | | (9,214,190 | ) | | | (80,152,831 | ) | | | (12,049,917 | ) | | | (120,870,123 | ) |
| | | | | | | | | | | | | | | | |
Net increase | | | 5,363,867 | | | $ | 34,963,578 | | | | 2,497,868 | | | $ | 16,239,763 | |
| | | | | | | | | | | | | | | | |
Class B | | | | | | | | | | | | | | | | |
Sales | | | 1,066,942 | | | $ | 8,601,974 | | | | 1,809,435 | | | $ | 16,514,461 | |
Reinvestments | | | 2,911,466 | | | | 22,796,777 | | | | 2,814,821 | | | | 26,234,129 | |
Redemptions | | | (2,455,833 | ) | | | (20,398,882 | ) | | | (3,981,200 | ) | | | (37,477,172 | ) |
| | | | | | | | | | | | | | | | |
Net increase | | | 1,522,575 | | | $ | 10,999,869 | | | | 643,056 | | | $ | 5,271,418 | |
| | | | | | | | | | | | | | | | |
Class E | | | | | | | | | | | | | | | | |
Sales | | | 590,880 | | | $ | 4,918,312 | | | | 618,235 | | | $ | 5,756,123 | |
Reinvestments | | | 590,692 | | | | 4,642,836 | | | | 583,357 | | | | 5,460,217 | |
Redemptions | | | (774,379 | ) | | | (6,410,309 | ) | | | (1,349,828 | ) | | | (12,706,399 | ) |
| | | | | | | | | | | | | | | | |
Net increase (decrease) | | | 407,193 | | | $ | 3,150,839 | | | | (148,236 | ) | | $ | (1,490,059 | ) |
| | | | | | | | | | | | | | | | |
Increase derived from capital shares transactions | | | | | | $ | 49,114,286 | | | | | | | $ | 20,021,122 | |
| | | | | | | | | | | | | | | | |
See accompanying notes to financial statements.
MSF-8
Metropolitan Series Fund
BlackRock Large Cap Value Portfolio
Financial Highlights
| | | | | | | | | | | | | | | | | | | | | | | | |
| Selected per share data | | | |
| | | Class A | |
| | | Six Months
Ended
June 30,
2016
(Unaudited) | | | Year Ended December 31, | |
| | | | 2015 | | | 2014 | | | 2013 | | | 2012 | | | 2011 | |
Net Asset Value, Beginning of Period | | $ | 8.42 | | | $ | 9.89 | | | $ | 12.02 | | | $ | 9.80 | | | $ | 10.36 | | | $ | 10.23 | |
| | | | | | | | | | | | | | | | | | | | | | | | |
Income (Loss) from Investment Operations | | | | | | | | | | | | | | | | | | | | | | | | |
Net investment income (a) | | | 0.08 | | | | 0.15 | | | | 0.16 | | | | 0.15 | | | | 0.17 | | | | 0.15 | |
Net realized and unrealized gain (loss) on investments | | | 0.35 | | | | (0.64 | ) | | | 0.75 | | | | 2.84 | | | | 1.21 | | | | 0.10 | |
| | | | | | | | | | | | | | | | | | | | | | | | |
Total from investment operations | | | 0.43 | | | | (0.49 | ) | | | 0.91 | | | | 2.99 | | | | 1.38 | | | | 0.25 | |
| | | | | | | | | | | | | | | | | | | | | | | | |
Less Distributions | | | | | | | | | | | | | | | | | | | | | | | | |
Distributions from net investment income | | | (0.15 | ) | | | (0.18 | ) | | | (0.16 | ) | | | (0.16 | ) | | | (0.18 | ) | | | (0.12 | ) |
Distributions from net realized capital gains | | | (0.68 | ) | | | (0.80 | ) | | | (2.88 | ) | | | (0.61 | ) | | | (1.76 | ) | | | 0.00 | |
| | | | | | | | | | | | | | | | | | | | | | | | |
Total distributions | | | (0.83 | ) | | | (0.98 | ) | | | (3.04 | ) | | | (0.77 | ) | | | (1.94 | ) | | | (0.12 | ) |
| | | | | | | | | | | | | | | | | | | | | | | | |
Net Asset Value, End of Period | | $ | 8.02 | | | $ | 8.42 | | | $ | 9.89 | | | $ | 12.02 | | | $ | 9.80 | | | $ | 10.36 | |
| | | | | | | | | | | | | | | | | | | | | | | | |
Total Return (%) (b) | | | 5.26 | (c) | | | (5.99 | ) | | | 9.92 | | | | 32.05 | (d) | | | 14.28 | | | | 2.35 | |
| | | | | | |
Ratios/Supplemental Data | | | | | | | | | | | | | | | | | | | | | | | | |
Gross ratio of expenses to average net assets (%) | | | 0.66 | (e) | | | 0.65 | | | | 0.65 | | | | 0.65 | | | | 0.66 | | | | 0.66 | |
Net ratio of expenses to average net assets (%) (f) | | | 0.64 | (e) | | | 0.63 | | | | 0.52 | (g) | | | 0.59 | | | | 0.63 | | | | 0.63 | |
Ratio of net investment income to average net assets (%) | | | 2.05 | (e) | | | 1.62 | | | | 1.61 | | | | 1.35 | | | | 1.80 | | | | 1.41 | |
Portfolio turnover rate (%) | | | 21 | (c) | | | 42 | | | | 40 | | | | 113 | | | | 107 | | | | 107 | |
Net assets, end of period (in millions) | | $ | 1,152.0 | | | $ | 1,164.4 | | | $ | 1,342.9 | | | $ | 1,666.1 | | | $ | 1,414.2 | | | $ | 941.4 | |
| |
| | | Class B | |
| | | Six Months
Ended
June 30,
2016
(Unaudited) | | | Year Ended December 31, | |
| | | | 2015 | | | 2014 | | | 2013 | | | 2012 | | | 2011 | |
Net Asset Value, Beginning of Period | | $ | 8.34 | | | $ | 9.80 | | | $ | 11.93 | | | $ | 9.73 | | | $ | 10.30 | | | $ | 10.18 | |
| | | | | | | | | | | | | | | | | | | | | | | | |
Income (Loss) from Investment Operations | | | | | | | | | | | | | | | | | | | | | | | | |
Net investment income (a) | | | 0.07 | | | | 0.13 | | | | 0.14 | | | | 0.12 | | | | 0.15 | | | | 0.14 | |
Net realized and unrealized gain (loss) on investments | | | 0.34 | | | | (0.64 | ) | | | 0.74 | | | | 2.82 | | | | 1.20 | | | | 0.08 | |
| | | | | | | | | | | | | | | | | | | | | | | | |
Total from investment operations | | | 0.41 | | | | (0.51 | ) | | | 0.88 | | | | 2.94 | | | | 1.35 | | | | 0.22 | |
| | | | | | | | | | | | | | | | | | | | | | | | |
Less Distributions | | | | | | | | | | | | | | | | | | | | | | | | |
Distributions from net investment income | | | (0.13 | ) | | | (0.15 | ) | | | (0.13 | ) | | | (0.13 | ) | | | (0.16 | ) | | | (0.10 | ) |
Distributions from net realized capital gains | | | (0.68 | ) | | | (0.80 | ) | | | (2.88 | ) | | | (0.61 | ) | | | (1.76 | ) | | | 0.00 | |
| | | | | | | | | | | | | | | | | | | | | | | | |
Total distributions | | | (0.81 | ) | | | (0.95 | ) | | | (3.01 | ) | | | (0.74 | ) | | | (1.92 | ) | | | (0.10 | ) |
| | | | | | | | | | | | | | | | | | | | | | | | |
Net Asset Value, End of Period | | $ | 7.94 | | | $ | 8.34 | | | $ | 9.80 | | | $ | 11.93 | | | $ | 9.73 | | | $ | 10.30 | |
| | | | | | | | | | | | | | | | | | | | | | | | |
Total Return (%) (b) | | | 5.00 | (c) | | | (6.18 | ) | | | 9.70 | | | | 31.74 | (d) | | | 13.97 | | | | 2.05 | |
| | | | | | |
Ratios/Supplemental Data | | | | | | | | | | | | | | | | | | | | | | | | |
Gross ratio of expenses to average net assets (%) | | | 0.91 | (e) | | | 0.90 | | | | 0.90 | | | | 0.90 | | | | 0.91 | | | | 0.91 | |
Net ratio of expenses to average net assets (%) (f) | | | 0.89 | (e) | | | 0.88 | | | | 0.77 | (g) | | | 0.84 | | | | 0.88 | | | | 0.88 | |
Ratio of net investment income to average net assets (%) | | | 1.80 | (e) | | | 1.37 | | | | 1.36 | | | | 1.10 | | | | 1.52 | | | | 1.30 | |
Portfolio turnover rate (%) | | | 21 | (c) | | | 42 | | | | 40 | | | | 113 | | | | 107 | | | | 107 | |
Net assets, end of period (in millions) | | $ | 247.1 | | | $ | 246.6 | | | $ | 283.6 | | | $ | 278.6 | | | $ | 229.5 | | | $ | 212.6 | |
Please see following page for Financial Highlights footnote legend.
See accompanying notes to financial statements.
MSF-9
Metropolitan Series Fund
BlackRock Large Cap Value Portfolio
Financial Highlights
| | | | | | | | | | | | | | | | | | | | | | | | |
| Selected per share data | | | |
| | | Class E | |
| | | Six Months
Ended
June 30,
2016
(Unaudited) | | | Year Ended December 31, | |
| | | | 2015 | | | 2014 | | | 2013 | | | 2012 | | | 2011 | |
Net Asset Value, Beginning of Period | | $ | 8.38 | | | $ | 9.84 | | | $ | 11.97 | | | $ | 9.76 | | | $ | 10.32 | | | $ | 10.20 | |
| | | | | | | | | | | | | | | | | | | | | | | | |
Income (Loss) from Investment Operations | | | | | | | | | | | | | | | | | | | | | | | | |
Net investment income (a) | | | 0.08 | | | | 0.14 | | | | 0.15 | | | | 0.13 | | | | 0.16 | | | | 0.14 | |
Net realized and unrealized gain (loss) on investments | | | 0.33 | | | | (0.64 | ) | | | 0.74 | | | | 2.83 | | | | 1.21 | | | | 0.09 | |
| | | | | | | | | | | | | | | | | | | | | | | | |
Total from investment operations | | | 0.41 | | | | (0.50 | ) | | | 0.89 | | | | 2.96 | | | | 1.37 | | | | 0.23 | |
| | | | | | | | | | | | | | | | | | | | | | | | |
Less Distributions | | | | | | | | | | | | | | | | | | | | | | | | |
Distributions from net investment income | | | (0.13 | ) | | | (0.16 | ) | | | (0.14 | ) | | | (0.14 | ) | | | (0.17 | ) | | | (0.11 | ) |
Distributions from net realized capital gains | | | (0.68 | ) | | | (0.80 | ) | | | (2.88 | ) | | | (0.61 | ) | | | (1.76 | ) | | | 0.00 | |
| | | | | | | | | | | | | | | | | | | | | | | | |
Total distributions | | | (0.81 | ) | | | (0.96 | ) | | | (3.02 | ) | | | (0.75 | ) | | | (1.93 | ) | | | (0.11 | ) |
| | | | | | | | | | | | | | | | | | | | | | | | |
Net Asset Value, End of Period | | $ | 7.98 | | | $ | 8.38 | | | $ | 9.84 | | | $ | 11.97 | | | $ | 9.76 | | | $ | 10.32 | |
| | | | | | | | | | | | | | | | | | | | | | | | |
Total Return (%) (b) | | | 5.10 | (c) | | | (6.07 | ) | | | 9.79 | | | | 31.88 | (d) | | | 14.14 | | | | 2.13 | |
| | | | | | |
Ratios/Supplemental Data | | | | | | | | | | | | | | | | | | | | | | | | |
Gross ratio of expenses to average net assets (%) | | | 0.81 | (e) | | | 0.80 | | | | 0.80 | | | | 0.80 | | | | 0.81 | | | | 0.81 | |
Net ratio of expenses to average net assets (%) (f) | | | 0.79 | (e) | | | 0.78 | | | | 0.67 | (g) | | | 0.74 | | | | 0.78 | | | | 0.78 | |
Ratio of net investment income to average net assets (%) | | | 1.90 | (e) | | | 1.47 | | | | 1.46 | | | | 1.20 | | | | 1.62 | | | | 1.37 | |
Portfolio turnover rate (%) | | | 21 | (c) | | | 42 | | | | 40 | | | | 113 | | | | 107 | | | | 107 | |
Net assets, end of period (in millions) | | $ | 50.1 | | | $ | 49.2 | | | $ | 59.3 | | | $ | 59.9 | | | $ | 47.9 | | | $ | 47.7 | |
| (a) | Per share amounts based on average shares outstanding during the period. |
| (b) | Total return does not reflect any insurance, sales, separate account or administrative charges of variable annuity or life insurance contracts or any additional expenses that contract owners may bear under their variable contracts. If these charges were included, the returns would be lower. |
| (c) | Periods less than one year are not computed on an annualized basis. |
| (d) | In 2013, 0.11%, 0.11% and 0.11% of the Portfolio’s total return for Class A, Class B and Class E, respectively, consists of a voluntary reimbursement by the subadvisor. Excluding this item, total return would have been 31.94%, 31.63% and 31.77% for Class A, Class B and Class E, respectively. |
| (e) | Computed on an annualized basis. |
| (f) | Includes the effects of management fee waivers (see Note 5 of the Notes to Financial Statements). |
| (g) | The effect of the voluntary portion of the waivers on average net assets was 0.10% for the year ended December 31, 2014. |
See accompanying notes to financial statements.
MSF-10
Metropolitan Series Fund
BlackRock Large Cap Value Portfolio
Notes to Financial Statements—June 30, 2016 (Unaudited)
1. Organization
Metropolitan Series Fund (the “Trust”) is organized as a Delaware statutory trust and registered under the Investment Company Act of 1940, as amended (the “1940 Act”), as an open-end management investment company. The Trust, which is managed by MetLife Advisers, LLC (“MetLife Advisers” or the “Adviser”), an affiliate of MetLife, Inc., is currently comprised of thirty series, each of which operates as a distinct investment vehicle of the Trust. The portfolio included in this report is BlackRock Large Cap Value Portfolio (the “Portfolio”), which is diversified. Shares in the Portfolio are not offered directly to the general public and are currently available only to separate accounts established by Metropolitan Life Insurance Company (“MetLife”) and other affiliated life insurance companies.
The Portfolio has registered and offers three classes of shares: Class A, B and E shares. Shares of each Class of the Portfolio represent an equal pro rata interest in the Portfolio and generally give the shareholder the same voting, dividend, liquidation, and other rights. Investment income, realized and unrealized capital gains and losses, the common expenses of the Portfolio, and certain Portfolio-level expense reductions, if any, are allocated on a pro rata basis to each Class based on the relative net assets of each Class to the net assets of the Portfolio. Each Class of shares differs in its respective distribution plan and such distribution expenses are allocated to the corresponding Class of shares.
2. Significant Accounting Policies
The preparation of financial statements in conformity with accounting principles generally accepted in the United States of America (“GAAP”) requires management to make estimates and assumptions that affect the reported amounts of assets and liabilities and disclosure of contingent assets and liabilities as of the date of the financial statements and the reported amounts of income and expenses during the reporting period. Actual results could differ from those estimates. In the preparation of these financial statements, management has evaluated events and transactions subsequent to June 30, 2016 through the date the financial statements were issued.
The Portfolio is an investment company and follows the accounting and reporting guidance of the Financial Accounting Standards Board (“FASB”) Accounting Standards Codification Topic 946—Financial Services—Investment Companies and Topic 820—Fair Value Measurement. The following is a summary of significant accounting policies consistently followed by the Portfolio in the preparation of its financial statements.
Investment Valuation and Fair Value Measurements - Domestic and foreign equity securities, such as common stock, exchange-traded funds, rights, warrants, and preferred stock, that are traded on a securities exchange on a valuation date are generally valued at their last quoted sale price or official closing price on the primary exchange for such security, or, if no sales occurred on that day, at the last reported bid price. Equity securities traded over-the-counter (“OTC”) are generally valued at the last reported bid price. In the event of a major exchange closing during the trading day, the Adviser may use other market information obtained from quotation reporting systems, established market makers, or pricing services in valuing the securities. Valuation adjustments may be applied to certain foreign equity securities that are traded solely on foreign exchanges that close before the time as of which the Portfolio determines its NAV to account for the market movement between the close of the foreign exchanges and the time as of which the Portfolio determines its NAV. The Portfolio may use a systematic fair valuation model provided by a pricing service to value securities principally traded in these foreign markets in order to adjust for possible market movements or other changes that may occur between the close of the foreign exchanges and the time as of which the Portfolio determines its NAV. Foreign equity securities valued using these valuation adjustments are generally categorized as Level 2 within the fair value hierarchy. Equity securities that are actively traded, and have no valuation adjustments applied, are categorized as Level 1 within the fair value hierarchy. Other equity securities traded on inactive markets, or valued in reference to similar instruments traded on active markets, are generally categorized as Level 2 within the fair value hierarchy.
Investments in registered open-end management investment companies are valued at reported net asset value per share on the valuation date and are categorized as Level 1 within the fair value hierarchy.
Debt securities, including corporate, convertible and municipal bonds and notes; obligations of the U.S. Treasury and U.S. government agencies; foreign sovereign issues; and non-U.S. bonds, are generally valued on the basis of evaluated or composite bid quotations obtained from independent pricing services and/or brokers and dealers selected by the Adviser (each a “pricing service”), pursuant to authorization of and subject to general oversight by the Board of Trustees of the Trust (the “Board” or “Trustees”). Such pricing services may use matrix pricing, which considers observable inputs including, among other things, issuer details, maturity dates, interest rates, yield curves, rates of prepayment, credit risks/spreads, default rates, reported trades, broker dealer quotes and quoted prices for similar assets. Short-term obligations with a remaining maturity of sixty days or less may be valued at amortized cost in the absence of market quotes, so long as the amortized cost value of such short-term debt instrument is approximately the same as the fair value of the instrument as determined without the use of amortized cost valuation. Floating rate loans are generally valued on the basis of an evaluated or composite average of aggregate bid and ask quotations supplied by brokers or dealers, as obtained from the pricing service. Securities that use similar valuation techniques and inputs as described above are generally categorized as Level 2 within the fair value hierarchy.
MSF-11
Metropolitan Series Fund
BlackRock Large Cap Value Portfolio
Notes to Financial Statements—June 30, 2016—(Continued)
Options, whether on securities, indices, futures contracts, or otherwise, traded on exchanges are valued at the last sale price available as of the close of business on a valuation day or, if there is no such price available, at the last reported bid price. These types of options are categorized as Level 1 within the fair value hierarchy. Futures contracts that are traded on commodity exchanges are valued at their settlement prices established by the exchanges on which they are traded as of the close of such exchanges and are categorized as Level 1 within the fair value hierarchy.
If no current market value quotation or other observable inputs are readily available or market value quotations are deemed to be unreliable for an investment, the fair value of the investment will be determined in accordance with procedures approved by, and under the general supervision of, the Board. In such a circumstance, the Board will be assisted in its responsibility to determine the fair value of an investment by the Valuation Committee (“Committee”) of MetLife Advisers. The Committee provides general pricing oversight and fair value pricing determinations related to portfolio securities and meets on a regular basis to review reports relating to the valuation of the securities in the Portfolio. The Board has delegated to State Street Bank and Trust Company, the Trust’s custodian (“custodian”), the responsibility for calculating the net asset values (“NAVs”) of the Trust’s Portfolios. The Committee is responsible for overseeing the calculation of the NAVs of the Portfolios by the custodian. The Committee also periodically reviews pricing services, including the pricing services providing fair value pricing for the Portfolio’s foreign securities, and is responsible for overseeing the correction of pricing errors and addressing other pricing issues that arise in the ordinary course of business, such as making real-time fair value determinations, as necessary.
No single standard for determining the fair value of an investment can be set forth because fair value depends upon the facts and circumstances with respect to each investment. Information relating to any relevant factors may be obtained by the Committee from any appropriate source, including the subadviser of the Portfolio, the custodian, a pricing service, market maker and/or broker for such security or the issuer. Appropriate methodologies for determining fair value under particular circumstances may include: matrix pricing, a discounted cash flow analysis, comparisons of securities with comparable characteristics, value based on multiples of earnings, discount from market price of similar marketable securities or a combination of these and other methods.
Investment Transactions and Related Investment Income - Portfolio security transactions are recorded on the trade date. Dividend income is recorded on the ex-dividend date or, for certain foreign securities, when notified. Interest income, which includes amortization of premium and accretion of discount on debt securities, is recorded on the accrual basis. Realized gains and losses on investments are determined on the identified cost basis, which is the same basis used for federal income tax purposes. Foreign income and foreign capital gains on some foreign securities may be subject to foreign taxes, which are accrued as applicable. These foreign taxes have been provided for in accordance with the Portfolio’s understanding of the applicable countries’ tax rules and rates.
Foreign Currency Translation - The books and records of the Portfolio are maintained in U.S. dollars. The values of securities, currencies, and other assets and liabilities denominated in currencies other than the U.S. dollar are translated into U.S. dollars based upon foreign exchange rates prevailing at the end of the period. Purchases and sales of investment securities, income, and expenses are translated on the respective dates of such transactions. Because the values of investment securities are translated at the foreign exchange rates prevailing at the end of the period, that portion of the results of operations arising from changes in exchange rates and that portion of the results of operations reflecting fluctuations arising from changes in market prices of the investment securities are not separated. Such fluctuations are included in the net realized and unrealized gain or loss on investments.
Net realized foreign exchange gains or losses arise from activity in forward foreign currency exchange contracts, sales of foreign currency, currency gains or losses realized between the trade and settlement dates on securities transactions, and the difference between the amounts of dividends, interest, and foreign withholding taxes recorded by the Portfolio and the U.S. dollar equivalent of the amounts actually received or paid by the Portfolio. Net unrealized foreign exchange gains and losses arise from changes in the value of assets and liabilities, other than investment securities, resulting from changes in foreign exchange rates.
Dividends and Distributions to Shareholders - The Portfolio records dividends and distributions on the ex-dividend date. Net realized gains from securities transactions (if any) are generally distributed annually to shareholders. The timing and characterization of certain income and capital gains distributions are determined in accordance with federal tax regulations that may differ from GAAP. Permanent book and tax basis differences relating to shareholder distributions will result in reclassification between under/over distributed net investment income, accumulated net realized gains/losses, and paid-in surplus. Book-tax differences are primarily due to real estate investment trust (REIT) adjustments and foreign currency transactions. These adjustments have no impact on net assets or the results of operations.
Income Taxes - It is the Portfolio’s policy to comply with the requirements of the Internal Revenue Code of 1986, as amended, and regulations thereunder, applicable to regulated investment companies and to distribute, with respect to each taxable year, all of its taxable income to shareholders. Therefore, no federal income tax provision is required. The Portfolio files U.S. federal tax returns. No income tax returns are currently under examination. The Portfolio’s federal tax returns for the prior three fiscal years remain subject to examination by the Internal Revenue Service. As of June 30, 2016, the Portfolio had no uncertain tax positions that would require financial statement recognition, or de-recognition or disclosure.
MSF-12
Metropolitan Series Fund
BlackRock Large Cap Value Portfolio
Notes to Financial Statements—June 30, 2016—(Continued)
Repurchase Agreements - The Portfolio may enter into repurchase agreements, under the terms of a Master Repurchase Agreement (“MRA”), with selected commercial banks and broker-dealers, under which the Portfolio acquires securities as collateral and agrees to resell the securities at an agreed-upon time and at an agreed-upon price. The Portfolio, through the custodian or a subcustodian, under a tri-party repurchase agreement, receives delivery of the underlying securities collateralizing any repurchase agreements. It is the Portfolio’s policy that the market value of the collateral be equal to at least 100% of the repurchase price in the case of a repurchase agreement of one-day duration and equal to at least 102% of the repurchase price in the case of all other repurchase agreements. In the event of default or failure by a party to perform an obligation in connection with any repurchase transaction, the MRA gives the non-defaulting party the right to set-off claims and to apply property held by it in connection with any repurchase transaction against obligations owed to it.
At June 30, 2016, the Portfolio had investments in repurchase agreements with a gross value of $22,648,411, which is included as part of investments at value on the Statement of Assets and Liabilities. The value of the related collateral exceeded the value of the repurchase agreements at June 30, 2016.
Securities Lending - The Portfolio may lend its portfolio securities to certain qualified brokers who borrow securities in order to complete certain securities transactions. By lending its portfolio securities, the Portfolio attempts to increase its net investment income through the receipt of income on collateral held from securities on loan. Any gain or loss in the market price of the loaned securities that might occur and any interest earned or dividends declared during the term of the loan would accrue to the account of the Portfolio.
The Trust has entered into a Securities Lending Authorization Agreement with the custodian as the lending agent. Under this agreement, the custodian is authorized to loan portfolio securities on the Portfolio’s behalf. In exchange, the Portfolio receives either cash or securities as collateral against the loaned securities. The Portfolio receives collateral equal to at least 102% of the market value of the loaned securities (105% for foreign equity securities), at each loan’s inception. Collateral representing at least 100% of the market value of the loaned securities must be maintained for the duration of the loan. Cash collateral is generally invested in the State Street Navigator Securities Lending MET Portfolio (the “Navigator Portfolio”), a series of the State Street Navigator Securities Lending Trust that is managed by an affiliate of the custodian. The Navigator Portfolio is a registered money market fund that invests in a variety of high-quality, U.S. dollar-denominated instruments. If the market value of the collateral at the close of trading on a business day is less than 100% of the market value of the loaned securities at the close of trading on that day, the borrower shall be required to deliver, by the close of business on the following business day, an additional amount of collateral, so that the total amount of posted collateral is equal to at least 100% of the market value of all the loaned securities as of such preceding day. A portion of net income (income after the deduction of expenses and fees of the Navigator Portfolio) on the collateral is rebated to the borrower of the securities and the remainder is split between the custodian and the Portfolio. On loans collateralized by U.S. Treasuries, a fee is received from the borrower and is allocated between the Portfolio and the custodian. Income received by the Portfolio in securities lending transactions during the six months ended June 30, 2016 is reflected as Securities lending income on the Statement of Operations. The values of any securities loaned by the Portfolio and the related collateral at June 30, 2016 are disclosed in the footnotes to the Schedule of Investments. The value of the related collateral received by the Portfolio exceeded the value of the securities out on loan at June 30, 2016.
The risks associated with lending portfolio securities include, but are not limited to, possible delays in receiving additional collateral or in the recovery of the loaned securities, possible loss of rights in the collateral should the borrower fail financially, as well as risk of loss in the value of the collateral or the value of the investments made with the collateral. The lending agent shall indemnify the Portfolio in the case of default of any securities borrower.
All securities on loan are classified as Common Stocks in the Portfolio’s Schedule of Investments as of June 30, 2016, with a contractual maturity of overnight and continuous.
3. Certain Risks
In the normal course of business, the Portfolio invests in securities and enters into transactions where risks exist due to fluctuations in the market (“market risk”) or failure of the other party to a transaction to perform (“credit and counterparty risk”).
Market Risk: The value of securities held by the Portfolio may decline in response to certain events, including those directly involving the companies whose securities are owned by the Portfolio; conditions affecting the general economy; overall market changes; local, regional or global political, social or economic instability; and currency, interest rate, and price fluctuations.
Credit and Counterparty Risk: The Portfolio may be exposed to counterparty risk, or the risk that an entity with which the Portfolio has unsettled or open transactions may default. The potential loss could exceed the value of the financial assets and liabilities recorded in the financial statements. Financial assets that potentially expose the Portfolio to credit and counterparty risk consist principally of cash due from counterparties and investments. The Portfolio manages counterparty risk by entering into agreements only with counterparties that it believes have the financial resources to honor their obligations and by monitoring the financial
MSF-13
Metropolitan Series Fund
BlackRock Large Cap Value Portfolio
Notes to Financial Statements—June 30, 2016—(Continued)
stability of those counterparties. The Portfolio’s investment adviser attempts to mitigate counterparty risk by (i) periodically assessing the creditworthiness of its trading partners, (ii) monitoring and/or limiting the amount of its net exposure to each individual counterparty based on its assessment, and (iii) requiring collateral from the counterparty for certain transactions. In order to preserve certain safeguards for non-standard settlement trades, the Portfolio restricts its exposure to credit and counterparty losses by entering into master netting agreements (“Master Agreements”) with counterparties (approved brokers) with whom it undertakes a significant volume of transactions. Master Agreements govern the terms of certain transactions, and reduce the counterparty risk associated with relevant transactions by specifying credit protection mechanisms and providing standardization that improves legal certainty. Master Agreements can also help limit counterparty risk by specifying collateral posting arrangements at pre-arranged exposure levels.
Repurchase and reverse repurchase agreements are primarily executed under Global Master Repurchase Agreements (“GMRAs”) or Master Repurchase Agreements (“MRAs”), which provide the rights to set-off. Each repurchase and reverse repurchase agreement is initially collateralized at the transaction level. In the event of default, the total market value exposure will be offset against collateral exchanged to date, which would result in a net receivable/(payable) that would be due from/to the counterparty.
Additional risks associated with each type of investment are described above within the respective security type notes. The Portfolio’s prospectus includes a discussion of the principal risks of investing in the Portfolio.
4. Investment Transactions
Aggregate cost of purchases and proceeds of sales of investment securities, excluding short-term securities, for the six months ended June 30, 2016 were as follows:
| | | | | | | | | | | | |
Purchases | | | Sales | |
U.S. Government | | Non U.S. Government | | | U.S. Government | | | Non U.S. Government | |
| $0 | | $ | 296,345,426 | | | $ | 0 | | | $ | 358,148,720 | |
5. Investment Management Fees and Other Transactions with Affiliates
Investment Management Agreement - MetLife Advisers is the investment adviser to the Portfolio. The Trust has entered into an investment management agreement with MetLife Advisers with respect to the Portfolio. For providing investment management services to the Portfolio, MetLife Advisers receives monthly compensation at the following annual rates:
| | | | | | |
Management
Fees earned by
MetLife Advisers
for the six months ended
June 30, 2016 | | % per annum | | | Average Daily Net Assets |
| $4,484,554 | | | 0.700 | % | | On the first $250 million |
| | | 0.650 | % | | Of the next $500 million |
| | | 0.600 | % | | On amounts in excess of $750 million |
MetLife Advisers has entered into an investment subadvisory agreement with respect to managing the Portfolio. BlackRock Advisors, LLC is compensated by MetLife Advisers to provide subadvisory services for the Portfolio.
Management Fee Waivers - Pursuant to an expense agreement, MetLife Advisers has agreed, for the period May 1, 2016 to April 30, 2017, to reduce its advisory fees set out above under “Investment Management Agreement” for each class of the Portfolio as follows:
| | |
% per annum | | Average Daily Net Assets |
| 0.020% | | Of the first $250 million |
| 0.025% | | On the next $500 million |
| 0.050% | | On amounts in excess of $1 billion |
An identical expense agreement was in place for the period May 1, 2015 to April 30, 2016. Amounts waived for the six months ended June 30, 2016 are shown as a management fee waiver in the Statement of Operations.
Certain officers and trustees of the Trust may also be officers of the Adviser; however, such officers and trustees receive no compensation from the Trust.
On January 12, 2016, MetLife, Inc. announced its plan to pursue the separation of a substantial portion of its retail segment and is currently evaluating structural alternatives for such separation. It is anticipated that MetLife Advisers would be included in any such separation. Any separation transaction that might occur will be subject to the satisfaction of various conditions and approvals, including approval of any transaction by the MetLife, Inc. Board of Directors, satisfaction of any applicable requirements of the SEC,
MSF-14
Metropolitan Series Fund
BlackRock Large Cap Value Portfolio
Notes to Financial Statements—June 30, 2016—(Continued)
and receipt of insurance and other regulatory approvals and other anticipated conditions. Because the form of a separation had yet to be determined, MetLife, Inc. cannot currently provide a specific potential completion date or information about the potential impact on MetLife Advisers. No assurance can be given regarding the form that a separation transaction may take or the specific terms thereof, or that a separation will in fact occur. Depending on the form a separation takes, MetLife Advisers’ continued service as investment adviser to the Trusts could be subject to the satisfaction of various conditions and approvals, which may include obtaining approvals from the Trusts’ Board and shareholders.
Transfer Agency Agreement - MetLife serves as the transfer agent for the Trust. MetLife receives no fees for its services to the Trust under the transfer agency agreement.
Distribution and Service Fees - The Trust has a distribution agreement with MetLife Investors Distribution Company (“MIDC” or the “Distributor”) in which MIDC serves as the distributor for the Portfolio’s Class A, B and E Shares. MIDC is a wholly-owned subsidiary of MetLife Investors Group, LLC, an affiliate of the Adviser. The Trust has also adopted a Distribution and Service Plan under Rule 12b-1 of the 1940 Act for the Portfolio’s Class B and E Shares. Under the Distribution and Service Plan, the Class B and E Shares of the Portfolio pay a fee to compensate the Insurance Companies (or their affiliates) and other broker-dealers and financial intermediaries involved in the offer and sale of Portfolio shares for promoting or selling and servicing the Class B and E Shares. The fees under the Distribution and Service Plan for each class of the Portfolio’s shares are calculated as a percentage of the Portfolio’s average daily net assets that are attributable to that Class. Currently, the fee is 0.25% per year for Class B Shares and 0.15% per year for Class E Shares. Amounts incurred by the Portfolio for the six months ended June 30, 2016 are shown as Distribution and service fees in the Statement of Operations.
Deferred Trustee Compensation - Each Trustee who is not currently an employee of the Adviser or any of its affiliates receives compensation from the Trust for his or her service to the Trust. A deferred compensation plan (the “Plan”) is available to the Trustees on a voluntary basis. Deferred amounts remain in the Trust until distributed in accordance with the provisions of the Plan. The value of a participating Trustee’s deferral account is based on theoretical investments of deferred amounts on the normal payment dates in certain portfolios of the Trust or Met Investors Series Trust, an affiliate of the Trust, as designated by the participating Trustee. Changes in the value of participants’ deferral accounts are reflected as Trustees’ fees and expenses in the Statement of Operations. The portion of the accrued obligations allocated to the Portfolio under the Plan is reflected as Deferred trustees’ fees in the Statement of Assets and Liabilities.
6. Contractual Obligations
Under the Trust’s organizational documents, its officers and Trustees may be indemnified against certain liabilities and expenses arising out of the performance of their duties to the Trust. Additionally, the Trust has a variety of indemnification obligations under contracts with its service providers. The Trust’s maximum exposure under these arrangements is unknown, as this would involve future claims that may be made against the Trust that have not yet occurred.
7. Income Tax Information
The tax character of distributions paid for the years ended December 31, 2015 and 2014 were as follows:
| | | | | | | | | | | | | | | | | | | | |
Ordinary Income | | | Long-Term Capital Gain | | | Total | |
2015 | | 2014 | | | 2015 | | | 2014 | | | 2015 | | | 2014 | |
| $91,191,427 | | $ | 169,201,125 | | | $ | 64,234,716 | | | $ | 318,762,572 | | | $ | 155,426,143 | | | $ | 487,963,697 | |
As of December 31, 2015, the components of distributable earnings (accumulated losses) on a federal income tax basis were as follows:
| | | | | | | | | | | | | | | | |
Undistributed
Ordinary
Income | | Undistributed
Long-Term
Capital Gain | | | Net
Unrealized
Depreciation | | | Other
Accumulated
Capital Losses | | | Total | |
| $45,498,292 | | $ | 89,932,605 | | | $ | (36,151,405 | ) | | $ | — | | | $ | 99,279,492 | |
The Portfolio utilizes the provisions of the federal income tax laws that provide for the carryforward of capital losses for prior years, offsetting such losses against any future realized capital gains. Under the Regulated Investment Company Modernization Act of 2010 (the “Act”), net capital losses recognized after December 22, 2010 may be carried forward indefinitely and their character is retained as short-term and/or long-term losses. Previously, net capital losses were carried forward for up to eight years and treated as short-term losses. As a transition rule, the Act requires that post-enactment net capital losses be used before pre-enactment net capital losses.
As of December 31, 2015, the Portfolio had no post-enactment accumulated capital losses and no pre-enactment accumulated capital loss carryforwards.
MSF-15
Metropolitan Series Fund
BlackRock Ultra-Short Term Bond Portfolio (formerly, BlackRock Money Market Portfolio)
Managed By BlackRock Advisors, LLC
Portfolio Manager Commentary*
Effective May 1, 2016, the BlackRock Money Market Portfolio converted from a money market portfolio to an ultra-short term bond portfolio and the Portfolio’s name changed to the BlackRock Ultra-Short Term Bond Portfolio. The Portfolio continued to maintain its investment objective, which seeks to provide a high level of current income consistent with the preservation of capital. Although the Portfolio ceased to be a money market fund subject to the requirements set forth in Rule 2a-7 under the Investment Company Act of 1940, the Portfolio intends to maintain its investment strategy of investing primarily in short-term, high quality securities. Additionally, the Portfolio ceased maintaining a stable net asset value per share and instead has a floating net asset value per share.
PERFORMANCE
For the six month period ended June 30, 2016, the Class A, B and E shares of the BlackRock Ultra-Short Term Bond Portfolio returned 0.12%, 0.01%, and 0.05%, respectively. The Portfolio’s benchmark, the Bank of America Merrill Lynch 3-month T-Bill Index1, returned 0.15%.
MARKET ENVIRONMENT/ CONDITIONS
The Federal Open Market Committee (the “Committee”) left the Federal Funds rate of 0.25% to 0.5% percent unchanged through the first half of 2016. Early in the year, many market participants were anticipating that the Committee would likely raise rates again at their June meeting, however, this sentiment peaked in mid-March as indicated by Federal Funds Futures contracts pricing, which implied a 53% probablility of a June hike. Market focus then shifted to the July 27th meeting. The probability of an increase at the July meeting increased over the period from approximately 36% at the beginning of April to a high of nearly 55% in early June, as implied by Federal Funds Futures contracts. On June 2nd, a very disappointing Non-Farm Payroll release lead to a market repricing, lowering the implied probability of a July hike to 27%. While Federal Reserve Chairwoman Janet Yellen cautioned against putting too much weight on any single indicator, the lackluster jobs report reduced the possibility of a near term increase in rates. Following the historic decision by the U.K. to leave the European Union (“Brexit”) and an attendant increase in broader market volatility and uncertainty, futures contracts for Federal Funds reflected a further reduction in the likelihood of rate increases at upcoming Committee meetings.
Assets of prime money market funds have fallen approximately $374 billion over the past nine months, while assets of government money market funds have increased about $474 billion. A large percentage of the shift continues to be attributable to conversions of funds in advance of the October 2016 compliance date for U.S. money market fund reform. A defensive posture in terms of portfolio durations and liquidity is expected to continue to be maintained in prime money market funds in anticipation of additional outflows to government funds, which may accelerate as the summer progresses.
PORTFOLIO REVIEW / PERIOD END POSITIONING
The two factors that dominated our strategy over the first half of 2016 were the timing of potential rate moves by the Committee and the market impact of money market reform. While we have not ruled out the possibility of a 25 basis point hike in rates during the balance of 2016, the bar for such an action is clearly higher in our view due to increased uncertainty about economic impacts stemming from the Brexit vote. At the very least, we believe that the Committee would need to see a resumption in at least trend employment growth and further progress toward the Committee’s inflation target of 2.0% for the removal of monetary accommodation to be back on the table. Impacts of the Brexit vote on financial conditions are also expected to influence the outlook for monetary policy.
Since January, the Weighted Average Maturity (“WAM”) of the Portfolio was decreased from 32 days to 26 days and the Weighted Average Life (“WAL”) was decreased from 63 days to 38 days as of June 30. On May 1st the Portfolio converted to an ultra-short term bond portfolio, with a minimum of 20% in weekly liquidity (previously there was a 30% minimum). While the minimum weekly liquidity level has been lowered, we have maintained relatively high levels of weekly liquidity (43% at June 30) and relatively short WAM and WAL, as framed by our expectations for the impact of 2a-7 money market fund reform. We believe that as assets are shifted from Prime Institutional Funds into Government Funds, demand for credit product, particularly in the 6 month to 1 year sector, will decrease. This will likely pressure offered yields in that sector higher and spreads to Government product wider. We believe that current positioning (higher than mandated weekly liquidity and relatively short WAM and WAL) will allow us to selectively take advantage of opportunities in the coming months. The WAM and WAL were managed down to 26 days and 38 days respectively by reinvesting the majority of maturity proceeds in commercial paper and certificates of deposit that mature in 3 months or less at yields of 0.41% to 0.77%. Selective extension trades were executed in tenors of 6 months to 1 year at yields of 0.65% to 1.02%. For the majority of the longer maturities, we focused on certificates of deposit with floating rate coupons indexed on 3 month LIBOR. At June 30, the Portfolio held 43% in weekly liquid assets comprised of 27% in overnight Repurchase Agreements collateralized by U.S. Treasuries yielding
MSF-1
Metropolitan Series Fund
BlackRock Ultra-Short Term Bond Portfolio (formerly, BlackRock Money Market Portfolio)
Managed By BlackRock Advisors, LLC
Portfolio Manager Commentary*—(Continued)
0.40% to 0.42%, commercial paper and certificates of deposit maturing in 5 business days yielding 0.45% to 0.85%, and U.S. Treasury securities yielding 0.31% to 0.59%.
Richard Mejzak
Eric Hiatt
Edward Ingold
Portfolio Managers
BlackRock Advisors, LLC
* This commentary may include statements that constitute “forward-looking statements” under the U.S. securities laws. Forward-looking statements include, among other things, projections, estimates, and information about possible or future results related to the Portfolio, market or regulatory developments. The views expressed above are not guarantees of future performance or economic results and involve certain risks, uncertainties and assumptions that could cause actual outcomes and results to differ materially from the views expressed herein. The views expressed above are subject to change at any time based upon economic, market, or other conditions and the subadvisory firm undertakes no obligation to update the views expressed herein. Any discussions of specific securities should not be considered a recommendation to buy or sell those securities. The views expressed above (including any forward-looking statement) may not be relied upon as investment advice or as an indication of the Portfolio’s trading intent. Information about the Portfolio’s holdings, asset allocation or country diversification is historical and is not an indication of future Portfolio composition, which may vary. Direct investment in any index is not possible. The performance of any index mentioned in this commentary has not been adjusted for ongoing management, distribution and operating expenses, and sales charges applicable to mutual fund investments. In addition, the returns do not reflect additional fees charged by separate accounts or variable insurance contracts that an investor in the Portfolio may pay. If these additional fees were reflected, performance would have been lower.
MSF-2
Metropolitan Series Fund
BlackRock Ultra-Short Term Bond Portfolio (formerly, BlackRock Money Market Portfolio)
A $10,000 INVESTMENT COMPARED TO THE BANK OF AMERICA/MERRILL LYNCH 3-MONTH T-BILL INDEX
SIX MONTH RETURN & AVERAGE ANNUAL RETURNS (%) AS OF JUNE 30, 2016
| | | | | | | | | | | | | | | | |
| | | 6 Month | | | 1 Year | | | 5 Year | | | 10 Year | |
| BlackRock Ultra-Short Term Bond Portfolio | | | | | | | | | | | | | | | | |
Class A | | | 0.12 | | | | 0.12 | | | | 0.02 | | | | 1.09 | |
Class B | | | 0.01 | | | | 0.01 | | | | 0.00 | | | | 1.00 | |
Class E | | | 0.05 | | | | 0.05 | | | | 0.01 | | | | 1.03 | |
| Bank of America/Merrill Lynch 3-Month T-Bill Index | | | 0.15 | | | | 0.19 | | | | 0.09 | | | | 1.04 | |
1 The Bank of America/Merrill Lynch 3-Month T-Bill Index is composed of a single 90-day Treasury Bill issue, or potentially a seasoned 6-month or 1-year Treasury Bill issue, that is replaced on a monthly basis.
Portfolio performance is calculated including reinvestment of all income and capital gain distributions. Performance numbers are net of all Portfolio expenses but do not include any insurance, sales, separate account or administrative charges of variable annuity or life insurance contracts or any additional expenses that participants may bear relating to the operations of their plans. If these charges were included, the returns would be lower. The performance of any index referenced above has not been adjusted for ongoing management, distribution and operating expenses, and sales charges applicable to mutual fund investments. Direct investment in any index is not possible. The performance of Class A shares, as set forth in the line graph above, will differ from that of other classes because of the difference in expenses paid by policyholders investing in the different share classes.
This information represents past performance and is not indicative of future results. Investment return and principal value may fluctuate so that shares, upon redemption, may be worth more or less than the original cost.
PORTFOLIO COMPOSITION AS OF JUNE 30, 2016
Top Issuers
| | | | |
| | | % of
Net Assets | |
| Bank of America Corp. | | | 17.3 | |
| JPMorgan Securities, Inc. | | | 9.4 | |
| Nieuw Amsterdam Receivables Corp. | | | 4.2 | |
| Wells Fargo Bank N.A. | | | 3.8 | |
| Sumitomo Mitsui Trust Bank, Ltd. (NY) | | | 3.3 | |
| Bank of Montreal (Chicago) | | | 3.0 | |
| Nordea Bank AB | | | 3.0 | |
| Credit Industriel et Commercial (NY) | | | 2.8 | |
| Regency Market No. 1 LLC | | | 2.8 | |
| DBS Bank, Ltd. | | | 2.8 | |
MSF-3
Metropolitan Series Fund
BlackRock Ultra-Short Term Bond Portfolio (formerly, BlackRock Money Market Portfolio)
Understanding Your Portfolio’s Expenses (Unaudited)
Shareholder Expense Example
As a shareholder of the Portfolio, you incur ongoing costs, including management fees; distribution and service (12b-1) fees; and other Portfolio expenses. This example is intended to help you understand your ongoing costs (in dollars) (referred to as “expenses”) of investing in the Portfolio and compare these costs with the ongoing costs of investing in other mutual funds. The example is based on an investment of $1,000 invested at the beginning of the period and held for the entire period, January 1, 2016 through June 30, 2016.
Actual Expenses
The first line for each share class of the Portfolio in the table below provides information about actual account values and actual expenses. You may use the information in this line, together with the amount you invested in the particular share class of the Portfolio, to estimate the expenses that you paid over the period. Simply divide your account value by $1,000 (for example, an $8,600 account value divided by $1,000 = 8.6), then multiply the result by the number in the first line under the heading entitled “Expenses Paid During Period” to estimate the expenses you paid on your account during this period.
Hypothetical Example for Comparison Purposes
The second line for each share class of the Portfolio in the table below provides information about hypothetical account values and hypothetical expenses based on the Portfolio’s actual expense ratio and an assumed rate of return of 5% per year before expenses, which is not the Portfolio’s actual return. The hypothetical account values and expenses may not be used to estimate the actual ending account balance or expenses you paid for the period. You may use this information to compare the ongoing costs of investing in the Portfolio and other funds. To do so, compare this 5% hypothetical example with the 5% hypothetical examples that appear in the shareholder reports of the other funds.
Please note that the expenses shown in the table are meant to highlight your ongoing costs only and do not reflect any fees or charges of your variable insurance product or any additional expenses that participants in certain eligible qualified plans may bear relating to the operations of their plan. Therefore, the second line for each share class in the table is useful in comparing ongoing costs only, and will not help you determine the relative total costs of owning different funds. In addition, if these other costs were included, your costs would have been higher.
| | | | | | | | | | | | | | | | | | |
BlackRock Ultra-Short Term Bond Portfolio
(formerly, BlackRock Money Market Portfolio) | | | | Annualized
Expense
Ratio | | | Beginning
Account Value
January 1,
2016 | | | Ending
Account Value
June 30,
2016 | | | Expenses Paid
During Period**
January 1, 2016
to
June 30,
2016 | |
Class A(a) | | Actual | | | 0.35 | % | | $ | 1,000.00 | | | $ | 1,001.20 | | | $ | 1.74 | |
| | Hypothetical* | | | 0.35 | % | | $ | 1,000.00 | | | $ | 1,023.12 | | | $ | 1.76 | |
| | | | | |
Class B(a) | | Actual | | | 0.57 | % | | $ | 1,000.00 | | | $ | 1,000.10 | | | $ | 2.83 | |
| | Hypothetical* | | | 0.57 | % | | $ | 1,000.00 | | | $ | 1,022.03 | | | $ | 2.87 | |
| | | | | |
Class E(a) | | Actual | | | 0.50 | % | | $ | 1,000.00 | | | $ | 1,000.50 | | | $ | 2.49 | |
| | Hypothetical* | | | 0.50 | % | | $ | 1,000.00 | | | $ | 1,022.38 | | | $ | 2.51 | |
* Hypothetical assumes a rate of return of 5% per year before expenses.
** Expenses paid are equal to the Portfolio’s annualized expense ratio for the most recent six month period, as shown above, multiplied by the average account value over the period, multiplied by the number of days (182 days) in the most recent fiscal half-year, divided by 366 (to reflect the one-half year period).
(a) The annualized expense ratio shown reflects the impact of the management fee and distribution & service fee waivers as described in Note 4 of the Notes to Financial Statements.
MSF-4
Metropolitan Series Fund
BlackRock Ultra-Short Term Bond Portfolio (formerly, BlackRock Money Market Portfolio)
Schedule of Investments as of June 30, 2016 (Unaudited)
Short-Term Investments—99.9% of Net Assets
| | | | | | | | |
| Security Description | | Principal
Amount* | | | Value | |
|
Certificate of Deposit—26.8% | |
Bank of Montreal (Chicago)
0.400%, 07/05/16 | | | 20,000,000 | | | $ | 19,999,897 | |
0.698%, 07/21/16 (a) | | | 12,000,000 | | | | 12,001,764 | |
Bank of Nova Scotia (Houston)
0.867%, 01/03/17 (a) | | | 10,000,000 | | | | 9,999,840 | |
1.031%, 04/12/17 (a) | | | 5,000,000 | | | | 5,002,610 | |
Bank of Tokyo-Mitsubishi UFJ, Ltd. (NY)
0.710%, 08/04/16 | | | 27,000,000 | | | | 27,006,486 | |
Canadian Imperial Bank of Commerce (NY)
0.778%, 09/19/16 (a) | | | 8,000,000 | | | | 8,003,424 | |
0.850%, 09/02/16 | | | 11,000,000 | | | | 11,006,692 | |
1.001%, 12/05/16 (a) | | | 8,850,000 | | | | 8,856,160 | |
Citibank N.A. (NY)
0.590%, 08/04/16 | | | 10,000,000 | | | | 10,001,913 | |
Credit Agricole CIB (NY)
0.860%, 07/07/16 | | | 7,405,000 | | | | 7,405,745 | |
Credit Industriel et Commercial (NY)
0.600%, 08/12/16 | | | 16,400,000 | | | | 16,402,635 | |
0.650%, 08/01/16 | | | 14,000,000 | | | | 14,002,668 | |
Mizuho Bank, Ltd. (NY)
0.688%, 08/18/16 (a) | | | 20,000,000 | | | | 20,004,920 | |
Norinchukin Bank (NY)
0.620%, 08/15/16 | | | 17,000,000 | | | | 17,003,616 | |
Rabobank Nederland (NY)
0.797%, 08/11/16 (a) | | | 8,000,000 | | | | 8,002,896 | |
Royal Bank of Canada (NY)
0.797%, 07/08/16 | | | 6,000,000 | | | | 6,000,510 | |
0.880%, 10/14/16 (a) | | | 5,000,000 | | | | 5,003,480 | |
State Street Bank & Trust Co.
0.938%, 03/10/17 (a) | | | 11,000,000 | | | | 10,998,339 | |
Sumitomo Mitsui Banking Corp. (NY)
0.700%, 07/08/16 | | | 15,000,000 | | | | 15,001,207 | |
UBS AG (Stamford)
0.827%, 07/11/16 | | | 10,000,000 | | | | 10,001,240 | |
Wells Fargo Bank N.A.
0.813%, 07/13/16 | | | 14,000,000 | | | | 14,001,960 | |
0.830%, 08/03/16 | | | 12,000,000 | | | | 12,002,939 | |
0.883%, 10/13/16 (a) | | | 8,000,000 | | | | 8,005,560 | |
1.060%, 02/01/17 | | | 7,000,000 | | | | 7,004,840 | |
Westpac Banking Corp. (NY)
0.994%, 02/06/17 (a) | | | 4,000,000 | | | | 4,002,340 | |
| | | | | | | | |
| | | | 286,723,681 | |
| | | | | | | | |
|
Commercial Paper—45.1% | |
Antalis S.A.
0.670%, 08/04/16 (b) | | | 15,000,000 | | | | 14,993,102 | |
Bank Nederlandse Gemeenten N.V.
0.629%, 08/31/16 (b) | | | 12,000,000 | | | | 11,990,989 | |
Caisse des Depots et Consignations
0.641%, 09/16/16 (b) | | | 12,000,000 | | | | 11,983,932 | |
Chariot Funding LLC
0.739%, 07/07/16 (b) | | | 8,575,000 | | | | 8,574,283 | |
0.784%, 07/11/16 (b) | | | 10,000,000 | | | | 9,998,671 | |
0.877%, 10/05/16 (b) | | | 6,000,000 | | | | 6,004,260 | |
Collateralized Commercial Paper II Co. LLC
0.754%, 07/08/16 (b) | | | 15,000,000 | | | | 14,998,563 | |
|
Commercial Paper—(Continued) | |
Commonwealth Bank of Australia 0.687%, 07/05/16 (b) | | | 8,000,000 | | | | 8,000,344 | |
DBS Bank, Ltd.
0.516%, 07/25/16 (b) | | | 15,000,000 | | | | 14,996,104 | |
0.601%, 09/15/16 (b) | | | 15,000,000 | | | | 14,984,568 | |
Erste Abwicklungsanstalt
0.641%, 09/13/16 (b) | | | 14,750,000 | | | | 14,735,404 | |
Jupiter Securitization Co. LLC
0.690%, 07/05/16 (b) | | | 10,000,000 | | | | 9,999,406 | |
0.958%, 10/28/16 (b) | | | 10,000,000 | | | | 9,974,667 | |
Macquarie Bank, Ltd.
0.661%, 09/14/16 (b) | | | 15,380,000 | | | | 15,360,097 | |
National Australia Bank, Ltd.
0.959%, 11/01/16 (144A) (b) | | | 6,000,000 | | | | 5,988,365 | |
0.959%, 11/02/16 (144A) (b) | | | 5,000,000 | | | | 4,990,156 | |
Nederlandse Waterschapsbank NV
0.601%, 09/14/16 (b) | | | 12,000,000 | | | | 11,987,891 | |
Nieuw Amsterdam Receivables Corp.
0.507%, 08/19/16 (b) | | | 7,000,000 | | | | 6,995,012 | |
0.570%, 08/01/16 (b) | | | 20,000,000 | | | | 19,991,733 | |
0.606%, 08/16/16 (b) | | | 18,000,000 | | | | 17,988,132 | |
Nordea Bank AB
0.000%, 07/01/16 (144A) (b) | | | 32,000,000 | | | | 31,999,704 | |
NRW Bank
0.462%, 08/16/16 (b) | | | 25,000,000 | | | | 24,984,235 | |
Old Line Funding LLC
0.805%, 08/18/16 (b) | | | 15,000,000 | | | | 14,990,180 | |
Oversea-Chinese Banking Corp., Ltd.
0.480%, 07/19/16 (b) | | | 17,000,000 | | | | 17,000,716 | |
Regency Market No. 1 LLC
0.391%, 07/07/16 (144A) (b) | | | 30,000,000 | | | | 29,997,492 | |
Sheffield Receivables Corp.
0.767%, 08/24/16 (b) | | | 15,000,000 | | | | 14,986,640 | |
Starbird Funding Corp.
0.610%, 08/02/16 (144A) (b) | | | 16,000,000 | | | | 15,993,136 | |
Sumitomo Mitsui Trust Bank, Ltd. (NY)
0.349%, 07/05/16 (b) | | | 12,500,000 | | | | 12,499,434 | |
0.703%, 08/10/16 (b) | | | 23,000,000 | | | | 22,988,291 | |
Thunder Bay Funding LLC
0.484%, 07/22/16 (b) | | | 10,000,000 | | | | 9,997,244 | |
0.805%, 07/18/16 (b) | | | 12,000,000 | | | | 11,997,330 | |
Total Capital Canada, Ltd.
0.595%, 08/12/16 (b) | | | 15,000,000 | | | | 14,992,887 | |
Toyota Motor Credit Corp.
0.649%, 08/30/16 (b) | | | 10,000,000 | | | | 9,990,477 | |
Working Capital Management Co.
0.541%, 07/21/16 (144A) (b) | | | 15,000,000 | | | | 14,996,062 | |
| | | | | | | | |
| | | | 481,949,507 | |
| | | | | | | | |
|
Repurchase Agreements—26.7% | |
Bank of America Corp. Repurchase Agreement dated 06/30/16 at 0.420% to be repurchased at $185,557,165 on 07/01/16 collateralized by $190,032,600 U.S. Treasury Note at 0.750% due 04/30/18 with a value $190,606,042. | | | 185,555,000 | | | | 185,555,000 | |
See accompanying notes to financial statements.
MSF-5
Metropolitan Series Fund
BlackRock Ultra-Short Term Bond Portfolio (formerly, BlackRock Money Market Portfolio)
Schedule of Investments as of June 30, 2016 (Unaudited)
Short-Term Investments—(Continued)
| | | | | | | | |
| Security Description | | Principal
Amount* | | | Value | |
|
Repurchase Agreements—(Continued) | |
JPMorgan Securities, Inc. Repurchase Agreement dated 06/30/16 at 0.400% to be repurchased at $100,001,111 on 07/01/16 collateralized by $99,400,000 U.S. Treasury Note at 1.625% due 05/31/23 with a value $101,640,474. | | | 100,000,000 | | | $ | 100,000,000 | |
| | | | | | | | |
| | | | 285,555,000 | |
| | | | | | | | |
|
U.S. Treasury—1.3% | |
U.S. Treasury Floating Rate Notes
0.313%, 10/31/16 (a) (b) | | | 11,760,000 | | | | 11,760,435 | |
0.428%, 10/31/17 (a) (b) | | | 2,371,000 | | | | 2,372,582 | |
| | | | | | | | |
| | | | 14,133,017 | |
| | | | | | | | |
Total Short-Term Investments
(Cost $1,068,217,223) | | | | | | | 1,068,361,205 | |
| | | | | | | | |
Total Investments—99.9%
(Cost $1,068,217,223) (c) | | | | | | | 1,068,361,205 | |
Other assets and liabilities (net)—0.1% | | | | | | | 1,125,195 | |
| | | | | | | | |
| Net Assets—100.0% | | | | | | $ | 1,069,486,400 | |
| | | | | | | | |
| * | Principal amount stated in U.S. dollars unless otherwise noted. |
| (a) | Variable or floating rate security. The stated rate represents the rate at June 30, 2016. Maturity date shown for callable securities reflects the earliest possible call date. |
| (b) | The rate shown represents current yield to maturity. |
| (c) | As of June 30, 2016, the aggregate cost of investments was $1,068,217,223. The aggregate unrealized appreciation and depreciation of investments were $147,500 and $(3,518), respectively, resulting in net unrealized appreciation of $143,982. |
| (144A)— | Securities exempt from registration under Rule 144A of the Securities Act of 1933. These securities may be resold in transactions exempt from registration, normally to qualified institutional buyers. As of June 30, 2016, the market value of 144A securities was $103,964,915, which is 9.7% of net assets. |
Fair Value Hierarchy
Accounting principles generally accepted in the United States of America (“GAAP”) define fair market value as the price that the Portfolio would receive to sell an asset or pay to transfer a liability in an orderly transaction between market participants at the measurement date. It establishes a fair value hierarchy that prioritizes inputs to valuation methods and requires disclosure of the fair value hierarchy, separately for each major category of assets and liabilities, that segregates fair value measurements into three levels. Levels 1, 2 and 3 of the fair value hierarchy are defined as follows:
Level 1 - unadjusted quoted prices in active markets for identical investments
Level 2 - other significant observable inputs (including, but not limited to, quoted prices for similar assets or liabilities in markets that are either active or inactive; inputs other than quoted prices that are observable such as interest rates, yield curves, volatilities, prepayment speeds, loss severities, credit risks, default rates, or other market corroborated inputs)
Level 3 - significant unobservable inputs based on the best information available in the circumstances, to the extent observable inputs are unavailable (including the Portfolio’s own assumptions used in determining the fair value of investments and derivative financial instruments)
The inputs or methodologies used for valuing investments are not necessarily an indication of the risk associated with investing in them. Changes to the inputs or methodologies used may result in transfers between levels, which will be recognized as of the beginning of the reporting period. Information on transfers between Level 1 and Level 2, if any, will be disclosed following the fair value hierarchy table below. A reconciliation of Level 3 securities, if any, will also be disclosed following the fair value hierarchy table. For more information about the Portfolio’s policy regarding the valuation of investments, please refer to the Notes to Financial Statements.
The following table summarizes the fair value hierarchy of the Portfolio’s investments as of June 30, 2016:
| | | | | | | | | | | | | | | | |
| Description | | Level 1 | | | Level 2 | | | Level 3 | | | Total | |
| Short-Term Investments | | | | | | | | | | | | | | | | |
Certificate of Deposit | | $ | — | | | $ | 286,723,681 | | | $ | — | | | $ | 286,723,681 | |
Commercial Paper | | | — | | | | 481,949,507 | | | | — | | | | 481,949,507 | |
Repurchase Agreements | | | — | | | | 285,555,000 | | | | — | | | | 285,555,000 | |
U.S. Treasury | | | — | | | | 14,133,017 | | | | — | | | | 14,133,017 | |
Total Short-Term Investments | | | — | | | | 1,068,361,205 | | | | — | | | | 1,068,361,205 | |
Total Investments | | $ | — | | | $ | 1,068,361,205 | | | $ | — | | | $ | 1,068,361,205 | |
| | | | | | | | | | | | | | | | | |
See accompanying notes to financial statements.
MSF-6
Metropolitan Series Fund
BlackRock Ultra-Short Term Bond Portfolio (formerly, BlackRock Money Market Portfolio)
Statement of Assets and Liabilities
June 30, 2016 (Unaudited)
| | | | |
Assets | |
Investments at value (a) | | $ | 782,806,205 | |
Repurchase Agreements | | | 285,555,000 | |
Cash | | | 1,644 | |
Receivable for: | | | | |
Fund shares sold | | | 3,962,589 | |
Interest | | | 376,931 | |
Prepaid expenses | | | 6,786 | |
| | | | |
Total Assets | | | 1,072,709,155 | |
Liabilities | | | | |
Payables for: | | | | |
Fund shares redeemed | | | 2,538,645 | |
Accrued Expenses: | | | | |
Management fees | | | 313,260 | |
Distribution and service fees | | | 125,305 | |
Deferred trustees’ fees | | | 76,694 | |
Other expenses | | | 168,851 | |
| | | | |
Total Liabilities | | | 3,222,755 | |
| | | | |
Net Assets | | $ | 1,069,486,400 | |
| | | | |
Net Assets Consist of: | | | | |
Paid in surplus | | $ | 1,069,249,004 | |
Undistributed net investment income | | | 102,811 | |
Accumulated net realized loss | | | (9,397 | ) |
Unrealized appreciation on investments | | | 143,982 | |
| | | | |
Net Assets | | $ | 1,069,486,400 | |
| | | | |
Net Assets | | | | |
Class A | | $ | 399,927,211 | |
Class B | | | 523,309,946 | |
Class E | | | 146,249,243 | |
Capital Shares Outstanding* | | | | |
Class A | | | 3,997,217 | |
Class B | | | 5,232,586 | |
Class E | | | 1,462,109 | |
Net Asset Value, Offering Price and Redemption Price Per Share | | | | |
Class A | | $ | 100.05 | |
Class B | | | 100.01 | |
Class E | | | 100.03 | |
| * | The Portfolio is authorized to issue an unlimited number of shares. |
| (a) | Identified cost of investments, excluding repurchase agreement, was $782,662,223. |
Statement of Operations
Six Months Ended June 30, 2016 (Unaudited)
| | | | |
Investment Income | |
Interest | | $ | 3,133,788 | |
| | | | |
Total investment income | | | 3,133,788 | |
Expenses | | | | |
Management fees | | | 1,904,591 | |
Administration fees | | | 20,292 | |
Custodian and accounting fees | | | 49,453 | |
Distribution and service fees—Class B | | | 683,071 | |
Distribution and service fees—Class E | | | 113,778 | |
Audit and tax services | | | 15,015 | |
Legal | | | 13,597 | |
Trustees’ fees and expenses | | | 15,990 | |
Shareholder reporting | | | 38,319 | |
Insurance | | | 3,646 | |
Miscellaneous | | | 6,717 | |
| | | | |
Total expenses | | | 2,864,469 | |
Less distribution and service fee waivers | | | (88,078 | ) |
Less management fee waiver | | | (124,317 | ) |
| | | | |
Net expenses | | | 2,652,074 | |
| | | | |
Net Investment Income | | | 481,714 | |
| | | | |
Net Realized and Unrealized Gain | | | | |
Net realized gain on investments | | | 80 | |
| | | | |
Net change in unrealized appreciation on investments | | | 143,982 | |
| | | | |
Net realized and unrealized gain | | | 144,062 | |
| | | | |
Net Increase in Net Assets From Operations | | $ | 625,776 | |
| | | | |
See accompanying notes to financial statements.
MSF-7
Metropolitan Series Fund
BlackRock Ultra-Short Term Bond Portfolio (formerly, BlackRock Money Market Portfolio)
Statements of Changes in Net Assets
| | | | | | | | |
| | | Six Months
Ended
June 30,
2016
(Unaudited) | | | Year Ended
December 31,
2015 | |
Increase (Decrease) in Net Assets: | | | | | | | | |
From Operations | | | | | | | | |
Net investment income | | $ | 481,714 | | | $ | 13,344 | |
Net realized gain | | | 80 | | | | — | |
Net change in unrealized appreciation | | | 143,982 | | | | — | |
| | | | | | | | |
Increase in net assets from operations | | | 625,776 | | | | 13,344 | |
| | | | | | | | |
From Distributions to Shareholders | | | | | | | | |
Net investment income | | | | | | | | |
Class A | | | (274,320 | ) | | | (13,344 | ) |
Class B | | | (735 | ) | | | 0 | |
Class E | | | (28,521 | ) | | | 0 | |
Net realized capital gains | | | | | | | | |
Class A | | | (7,951 | ) | | | 0 | |
Class B | | | (10,396 | ) | | | 0 | |
Class E | | | (2,977 | ) | | | 0 | |
| | | | | | | | |
Total distributions | | | (324,900 | ) | | | (13,344 | ) |
| | | | | | | | |
Decrease in net assets from capital share transactions | | | (38,875,334 | ) | | | (105,346,240 | ) |
| | | | | | | | |
Total decrease in net assets | | | (38,574,458 | ) | | | (105,346,240 | ) |
| | |
Net Assets | | | | | | | | |
Beginning of period | | | 1,108,060,858 | | | | 1,213,407,098 | |
| | | | | | | | |
End of period | | $ | 1,069,486,400 | | | $ | 1,108,060,858 | |
| | | | | | | | |
Accumulated undistributed net investment income (loss) | | | | | | | | |
End of period | | $ | 102,811 | | | $ | (75,327 | ) |
| | | | | | | | |
Other Information:
Capital Shares
Transactions in capital shares were as follows:
| | | | | | | | | | | | | | | | |
| | | Six Months Ended
June 30, 2016
(Unaudited) | | | Year Ended
December 31, 2015 | |
| | | Shares | | | Value | | | Shares | | | Value | |
Class A | | | | | | | | | | | | | | | | |
Sales | | | 1,137,165 | | | $ | 113,726,043 | | | | 2,154,944 | | | $ | 215,494,358 | |
Reinvestments | | | 2,823 | | | | 282,271 | | | | 134 | | | | 13,344 | |
Redemptions | | | (1,211,000 | ) | | | (121,111,162 | ) | | | (2,923,886 | ) | | | (292,389,732 | ) |
| | | | | | | | | | | | | | | | |
Net decrease | | | (71,012 | ) | | $ | (7,102,848 | ) | | | (768,808 | ) | | $ | (76,882,030 | ) |
| | | | | | | | | | | | | | | | |
Class B | | | | | | | | | | | | | | | | |
Sales | | | 1,554,597 | | | $ | 155,463,681 | | | | 3,068,805 | | | $ | 306,884,015 | |
Reinvestments | | | 111 | | | | 11,131 | | | | 0 | | | | 0 | |
Redemptions | | | (1,792,405 | ) | | | (179,246,509 | ) | | | (3,140,958 | ) | | | (314,095,868 | ) |
| | | | | | | | | | | | | | | | |
Net decrease | | | (237,697 | ) | | $ | (23,771,697 | ) | | | (72,153 | ) | | $ | (7,211,853 | ) |
| | | | | | | | | | | | | | | | |
Class E | | | | | | | | | | | | | | | | |
Sales | | | 278,486 | | | $ | 27,849,560 | | | | 686,634 | | | $ | 68,664,117 | |
Reinvestments | | | 315 | | | | 31,498 | | | | 0 | | | | 0 | |
Redemptions | | | (358,793 | ) | | | (35,881,847 | ) | | | (899,165 | ) | | | (89,916,474 | ) |
| | | | | | | | | | | | | | | | |
Net decrease | | | (79,992 | ) | | $ | (8,000,789 | ) | | | (212,531 | ) | | $ | (21,252,357 | ) |
| | | | | | | | | | | | | | | | |
Decrease derived from capital shares transactions | | | | | | $ | (38,875,334 | ) | | | | | | $ | (105,346,240 | ) |
| | | | | | | | | | | | | | | | |
See accompanying notes to financial statements.
MSF-8
Metropolitan Series Fund
BlackRock Ultra-Short Term Bond Portfolio (formerly, BlackRock Money Market Portfolio)
Financial Highlights
| | | | | | | | | | | | | | | | | | | | | | | | |
| Selected per share data | | | |
| | | Class A | |
| | | Six Months
Ended
June 30,
2016
(Unaudited) | | | Year Ended December 31, | |
| | | | 2015 | | | 2014 | | | 2013 | | | 2012 | | | 2011 | |
Net Asset Value, Beginning of Period | | $ | 100.00 | | | $ | 100.00 | | | $ | 100.00 | | | $ | 100.00 | | | $ | 100.00 | | | $ | 100.00 | |
| | | | | | | | | | | | | | | | | | | | | | | | |
Income (Loss) from Investment Operations | | | | | | | | | | | | | | | | | | | | | | | | |
Net investment income (a) | | | 0.11 | | | | 0.00 | (b) | | | 0.00 | | | | 0.00 | | | | 0.00 | | | | 0.00 | |
Net realized and unrealized gain on investments | | | 0.01 | | | | 0.00 | | | | 0.00 | | | | 0.00 | | | | 0.00 | | | | 0.00 | |
| | | | | | | | | | | | | | | | | | | | | | | | |
Total from investment operations | | | 0.12 | | | | 0.00 | (b) | | | 0.00 | | | | 0.00 | | | | 0.00 | | | | 0.00 | |
| | | | | | | | | | | | | | | | | | | | | | | | |
Less Distributions | | | | | | | | | | | | | | | | | | | | | | | | |
Distributions from net investment income | | | (0.07 | ) | | | (0.00 | )(c) | | | 0.00 | | | | 0.00 | | | | 0.00 | | | | 0.00 | |
Distributions from net realized capital gains | | | (0.00 | )(d) | | | 0.00 | | | | 0.00 | | | | 0.00 | | | | 0.00 | | | | 0.00 | |
| | | | | | | | | | | | | | | | | | | | | | | | |
Total distributions | | | (0.07 | ) | | | (0.00 | )(c) | | | 0.00 | | | | 0.00 | | | | 0.00 | | | | 0.00 | |
| | | | | | | | | | | | | | | | | | | | | | | | |
Net Asset Value, End of Period | | $ | 100.05 | | | $ | 100.00 | | | $ | 100.00 | | | $ | 100.00 | | | $ | 100.00 | | | $ | 100.00 | |
| | | | | | | | | | | | | | | | | | | | | | | | |
Total Return (%) (e) | | | 0.12 | (f) | | | 0.00 | | | | 0.00 | | | | 0.00 | | | | 0.00 | | | | 0.00 | |
| | | | | | |
Ratios/Supplemental Data | | | | | | | | | | | | | | | | | | | | | | | | |
Gross ratio of expenses to average net assets (%) | | | 0.37 | (g) | | | 0.37 | | | | 0.37 | | | | 0.35 | | | | 0.35 | | | | 0.35 | |
Net ratio of expenses to average net assets (%) (h) | | | 0.35 | (g) | | | 0.25 | | | | 0.20 | | | | 0.23 | | | | 0.28 | | | | 0.26 | |
Ratio of net investment income to average net assets (%) | | | 0.22 | (g) | | | 0.00 | (i) | | | 0.00 | | | | 0.00 | | | | 0.00 | | | | 0.00 | |
Portfolio turnover rate (%) | | | 0 | (f)(j) | | | N/A | | | | N/A | | | | N/A | | | | N/A | | | | N/A | |
Net assets, end of period (in millions) | | $ | 399.9 | | | $ | 406.8 | | | $ | 483.7 | | | $ | 536.4 | | | $ | 551.9 | | | $ | 707.8 | |
| |
| | | Class B | |
| | | Six Months
Ended
June 30,
2016
(Unaudited) | | | Year Ended December 31, | |
| | | | 2015 | | | 2014 | | | 2013 | | | 2012 | | | 2011 | |
Net Asset Value, Beginning of Period | | $ | 100.00 | | | $ | 100.00 | | | $ | 100.00 | | | $ | 100.00 | | | $ | 100.00 | | | $ | 100.00 | |
| | | | | | | | | | | | | | | | | | | | | | | | |
Income (Loss) from Investment Operations | | | | | | | | | | | | | | | | | | | | | | | | |
Net investment income (loss) (a) | | | (0.00 | )(b) | | | 0.00 | | | | 0.00 | | | | 0.00 | | | | 0.00 | | | | 0.00 | |
Net realized and unrealized gain on investments | | | 0.01 | | | | 0.00 | | | | 0.00 | | | | 0.00 | | | | 0.00 | | | | 0.00 | |
| | | | | | | | | | | | | | | | | | | | | | | | |
Total from investment operations | | | 0.01 | | | | 0.00 | | | | 0.00 | | | | 0.00 | | | | 0.00 | | | | 0.00 | |
| | | | | | | | | | | | | | | | | | | | | | | | |
Less Distributions | | | | | | | | | | | | | | | | | | | | | | | | |
Distributions from net investment income | | | (0.00 | )(c) | | | 0.00 | | | | 0.00 | | | | 0.00 | | | | 0.00 | | | | 0.00 | |
Distributions from net realized capital gains | | | (0.00 | )(d) | | | 0.00 | | | | 0.00 | | | | 0.00 | | | | 0.00 | | | | 0.00 | |
| | | | | | | | | | | | | | | | | | | | | | | | |
Total distributions | | | (0.00 | ) | | | 0.00 | | | | 0.00 | | | | 0.00 | | | | 0.00 | | | | 0.00 | |
| | | | | | | | | | | | | | | | | | | | | | | | |
Net Asset Value, End of Period | | $ | 100.01 | | | $ | 100.00 | | | $ | 100.00 | | | $ | 100.00 | | | $ | 100.00 | | | $ | 100.00 | |
| | | | | | | | | | | | | | | | | | | | | | | | |
Total Return (%) (e) | | | 0.01 | (f) | | | 0.00 | | | | 0.00 | | | | 0.00 | | | | 0.00 | | | | 0.00 | |
| | | | | | |
Ratios/Supplemental Data | | | | | | | | | | | | | | | | | | | | | | | | |
Gross ratio of expenses to average net assets (%) | | | 0.62 | (g) | | | 0.62 | | | | 0.62 | | | | 0.60 | | | | 0.60 | | | | 0.60 | |
Net ratio of expenses to average net assets (%) (h) | | | 0.57 | (g) | | | 0.25 | | | | 0.20 | | | | 0.23 | | | | 0.28 | | | | 0.26 | |
Ratio of net investment income (loss) to average net assets (%) | | | (0.00 | )(g)(i) | | | 0.00 | | | | 0.00 | | | | 0.00 | | | | 0.00 | | | | 0.00 | |
Portfolio turnover rate (%) | | | 0 | (f)(j) | | | N/A | | | | N/A | | | | N/A | | | | N/A | | | | N/A | |
Net assets, end of period (in millions) | | $ | 523.3 | | | $ | 547.0 | | | $ | 554.2 | | | $ | 651.3 | | | $ | 771.5 | | | $ | 864.7 | |
Please see following page for Financial Highlights footnote legend.
See accompanying notes to financial statements.
MSF-9
Metropolitan Series Fund
BlackRock Ultra-Short Term Bond Portfolio (formerly, BlackRock Money Market Portfolio)
Financial Highlights
| | | | | | | | | | | | | | | | | | | | | | | | |
| Selected per share data | | | |
| | | Class E | |
| | | Six Months
Ended
June 30,
2016
(Unaudited) | | | Year Ended December 31, | |
| | | | 2015 | | | 2014 | | | 2013 | | | 2012 | | | 2011 | |
Net Asset Value, Beginning of Period | | $ | 100.00 | | | $ | 100.00 | | | $ | 100.00 | | | $ | 100.00 | | | $ | 100.00 | | | $ | 100.00 | |
| | | | | | | | | | | | | | | | | | | | | | | | |
Income (Loss) from Investment Operations | | | | | | | | | | | | | | | | | | | | | | | | |
Net investment income (a) | | | 0.03 | | | | 0.00 | | | | 0.00 | | | | 0.00 | | | | 0.00 | | | | 0.00 | |
Net realized and unrealized gain on investments | | | 0.02 | | | | 0.00 | | | | 0.00 | | | | 0.00 | | | | 0.00 | | | | 0.00 | |
| | | | | | | | | | | | | | | | | | | | | | | | |
Total from investment operations | | | 0.05 | | | | 0.00 | | | | 0.00 | | | | 0.00 | | | | 0.00 | | | | 0.00 | |
| | | | | | | | | | | | | | | | | | | | | | | | |
Less Distributions | | | | | | | | | | | | | | | | | | | | | | | | |
Distributions from net investment income | | | (0.02 | ) | | | 0.00 | | | | 0.00 | | | | 0.00 | | | | 0.00 | | | | 0.00 | |
Distributions from net realized capital gains | | | (0.00 | )(d) | | | 0.00 | | | | 0.00 | | | | 0.00 | | | | 0.00 | | | | 0.00 | |
| | | | | | | | | | | | | | | | | | | | | | | | |
Total distributions | | | (0.02 | ) | | | 0.00 | | | | 0.00 | | | | 0.00 | | | | 0.00 | | | | 0.00 | |
| | | | | | | | | | | | | | | | | | | | | | | | |
Net Asset Value, End of Period | | $ | 100.03 | | | $ | 100.00 | | | $ | 100.00 | | | $ | 100.00 | | | $ | 100.00 | | | $ | 100.00 | |
| | | | | | | | | | | | | | | | | | | | | | | | |
Total Return (%) (e) | | | 0.05 | (f) | | | 0.00 | | | | 0.00 | | | | 0.00 | | | | 0.00 | | | | 0.00 | |
| | | | | | |
Ratios/Supplemental Data | | | | | | | | | | | | | | | | | | | | | | | | |
Gross ratio of expenses to average net assets (%) | | | 0.52 | (g) | | | 0.52 | | | | 0.52 | | | | 0.50 | | | | 0.50 | | | | 0.50 | |
Net ratio of expenses to average net assets (%) (h) | | | 0.50 | (g) | | | 0.25 | | | | 0.20 | | | | 0.23 | | | | 0.28 | | | | 0.26 | |
Ratio of net investment income to average net assets (%) | | | 0.07 | (g) | | | 0.00 | | | | 0.00 | | | | 0.00 | | | | 0.00 | | | | 0.00 | |
Portfolio turnover rate (%) | | | 0 | (f)(j) | | | N/A | | | | N/A | | | | N/A | | | | N/A | | | | N/A | |
Net assets, end of period (in millions) | | $ | 146.2 | | | $ | 154.2 | | | $ | 175.5 | | | $ | 237.1 | | | $ | 309.5 | | | $ | 373.7 | |
| (a) | Per share amounts based on average shares outstanding during the period. |
| (b) | Net investment income (loss) was less than $0.01. |
| (c) | Distributions from net investment income were less than $0.01. |
| (d) | Distributions from net realized capital gains were less than $0.01. |
| (e) | Total return does not reflect any insurance, sales, separate account or administrative charges of variable annuity or life insurance contracts or any additional expenses that contract owners may bear under their variable contracts. If these charges were included, the returns would be lower. |
| (f) | Periods less than one year are not computed on an annualized basis. |
| (g) | Computed on an annualized basis. |
| (h) | Includes the effects of the management fee waivers and voluntary distribution & service fee waiver (see Note 4 of the Notes to Financial Statements). |
| (i) | Ratio of net investment income (loss) to average net assets was less than 0.01%. |
| (j) | There were no long term transactions during the period ended June 30, 2016. |
See accompanying notes to financial statements.
MSF-10
Metropolitan Series Fund
BlackRock Ultra-Short Term Bond Portfolio (formerly, BlackRock Money Market Portfolio)
Notes to Financial Statements—June 30, 2016 (Unaudited)
1. Organization
Metropolitan Series Fund (the “Trust”) is organized as a Delaware statutory trust and registered under the Investment Company Act of 1940, as amended (the “1940 Act”), as an open-end management investment company. The Trust, which is managed by MetLife Advisers, LLC (“MetLife Advisers” or the “Adviser”), an affiliate of MetLife, Inc., is currently comprised of thirty series, each of which operates as a distinct investment vehicle of the Trust. The portfolio included in this report is BlackRock Ultra-Short Term Bond Portfolio (formerly, BlackRock Money Market Portfolio) (the “Portfolio”), which is diversified. Prior to May 1, 2016, the Portfolio was operated in accordance with investment restrictions applicable to money market funds and sought to maintain a stable net asset value using the amortized cost method to value its portfolio securities. On November 18, 2015, the Board of Trustees of the Trust approved a conversion of the Portfolio to an ultra-short term bond portfolio with a “floating” net asset value. The Portfolio’s investment strategy of investing primarily in short-term, high quality securities was not changed. As a result of this conversion, which took effect on May 1, 2016, the Portfolio is no longer subject to the investment restrictions that apply to money market funds and no longer seeks to maintain a stable net asset value. Shares in the Portfolio are not offered directly to the general public and are currently available only to separate accounts established by Metropolitan Life Insurance Company (“MetLife”) and other affiliated life insurance companies.
The Portfolio has registered and offers three classes of shares: Class A, B and E shares. Shares of each Class of the Portfolio represent an equal pro rata interest in the Portfolio and generally give the shareholder the same voting, dividend, liquidation, and other rights. Investment income, realized and unrealized capital gains and losses, the common expenses of the Portfolio, and certain Portfolio-level expense reductions, if any, are allocated on a pro rata basis to each Class based on the relative net assets of each Class to the net assets of the Portfolio. Each Class of shares differs in its respective distribution plan and such distribution expenses are allocated to the corresponding Class of shares.
2. Significant Accounting Policies
The preparation of financial statements in conformity with accounting principles generally accepted in the United States of America (“GAAP”) requires management to make estimates and assumptions that affect the reported amounts of assets and liabilities and disclosure of contingent assets and liabilities as of the date of the financial statements and the reported amounts of income and expenses during the reporting period. Actual results could differ from those estimates. In the preparation of these financial statements, management has evaluated events and transactions subsequent to June 30, 2016 through the date the financial statements were issued.
The Portfolio is an investment company and follows the accounting and reporting guidance of the Financial Accounting Standards Board (“FASB”) Accounting Standards Codification Topic 946—Financial Services—Investment Companies and Topic 820—Fair Value Measurement. The following is a summary of significant accounting policies consistently followed by the Portfolio in the preparation of its financial statements.
Investment Valuation and Fair Value Measurements - Debt securities, including corporate, convertible and municipal bonds and notes; obligations of the U.S. Treasury and U.S. government agencies; foreign sovereign issues; and non-U.S. bonds, are generally valued on the basis of evaluated or composite bid quotations obtained from independent pricing services and/or brokers and dealers selected by the Adviser (each a “pricing service”), pursuant to authorization of and subject to general oversight by the Board of Trustees of the Trust (the “Board” or “Trustees”). Such pricing services may use matrix pricing, which considers observable inputs including, among other things, issuer details, maturity dates, interest rates, yield curves, rates of prepayment, credit risks/spreads, default rates, reported trades, broker dealer quotes and quoted prices for similar assets. Short-term obligations with a remaining maturity of sixty days or less may be valued at amortized cost in the absence of market quotes, so long as the amortized cost value of such short-term debt instrument is approximately the same as the fair value of the instrument as determined without the use of amortized cost valuation. Floating rate loans are generally valued on the basis of an evaluated or composite average of aggregate bid and ask quotations supplied by brokers or dealers, as obtained from the pricing service. Securities that use similar valuation techniques and inputs as described above are generally categorized as Level 2 within the fair value hierarchy.
If no current market value quotation or other observable inputs are readily available or market value quotations are deemed to be unreliable for an investment, the fair value of the investment will be determined in accordance with procedures approved by, and under the general supervision of, the Board. In such a circumstance, the Board will be assisted in its responsibility to determine the fair value of an investment by the Valuation Committee (“Committee”) of MetLife Advisers. The Committee provides general pricing oversight and fair value pricing determinations related to portfolio securities and meets on a regular basis to review reports relating to the valuation of the securities in the Portfolio. The Board has delegated to State Street Bank and Trust Company, the Trust’s custodian (“custodian”), the responsibility for calculating the net asset values (“NAVs”) of the Trust’s Portfolios. The Committee is responsible for overseeing the calculation of the NAVs of the Portfolios by the custodian. The Committee also periodically reviews pricing services, including the pricing services providing fair value pricing for the Portfolio’s foreign securities, and is responsible for overseeing the correction of pricing errors and addressing other pricing issues that arise in the ordinary course of business, such as making real-time fair value determinations, as necessary.
MSF-11
Metropolitan Series Fund
BlackRock Ultra-Short Term Bond Portfolio (formerly, BlackRock Money Market Portfolio)
Notes to Financial Statements—June 30, 2016—(Continued)
No single standard for determining the fair value of an investment can be set forth because fair value depends upon the facts and circumstances with respect to each investment. Information relating to any relevant factors may be obtained by the Committee from any appropriate source, including the subadviser of the Portfolio, the custodian, a pricing service, market maker and/or broker for such security or the issuer. Appropriate methodologies for determining fair value under particular circumstances may include: matrix pricing, a discounted cash flow analysis, comparisons of securities with comparable characteristics, value based on multiples of earnings, discount from market price of similar marketable securities or a combination of these and other methods.
Investment Transactions and Related Investment Income - Portfolio security transactions are recorded on the trade date. Dividend income is recorded on the ex-dividend date or, for certain foreign securities, when notified. Interest income, which includes amortization of premium and accretion of discount on debt securities, is recorded on the accrual basis. Realized gains and losses on investments are determined on the identified cost basis, which is the same basis used for federal income tax purposes. Foreign income and foreign capital gains on some foreign securities may be subject to foreign taxes, which are accrued as applicable. These foreign taxes have been provided for in accordance with the Portfolio’s understanding of the applicable countries’ tax rules and rates.
Dividends and Distributions to Shareholders - The Portfolio records dividends and distributions on the ex-dividend date. Net realized gains from securities transactions (if any) are generally distributed annually to shareholders. The timing and characterization of certain income and capital gains distributions are determined in accordance with federal tax regulations that may differ from GAAP. Permanent book and tax basis differences relating to shareholder distributions will result in reclassification between under/over distributed net investment income, accumulated net realized gains/losses, and paid-in surplus. Book-tax differences are primarily due to distribution redesignations and short-term capital gains reclasses from ordinary income. These adjustments have no impact on net assets or the results of operation.
Income Taxes - It is the Portfolio’s policy to comply with the requirements of the Internal Revenue Code of 1986, as amended, and regulations thereunder, applicable to regulated investment companies and to distribute, with respect to each taxable year, all of its taxable income to shareholders. Therefore, no federal income tax provision is required. The Portfolio files U.S. federal tax returns. No income tax returns are currently under examination. The Portfolio’s federal tax returns for the prior three fiscal years remain subject to examination by the Internal Revenue Service. As of June 30, 2016, the Portfolio had no uncertain tax positions that would require financial statement recognition, or de-recognition or disclosure.
Repurchase Agreements - The Portfolio may enter into repurchase agreements, under the terms of a Master Repurchase Agreement (“MRA”), with selected commercial banks and broker-dealers, under which the Portfolio acquires securities as collateral and agrees to resell the securities at an agreed-upon time and at an agreed-upon price. The Portfolio, through the custodian or a subcustodian, under a tri-party repurchase agreement, receives delivery of the underlying securities collateralizing any repurchase agreements. It is the Portfolio’s policy that the market value of the collateral be equal to at least 100% of the repurchase price in the case of a repurchase agreement of one-day duration and equal to at least 102% of the repurchase price in the case of all other repurchase agreements. In the event of default or failure by a party to perform an obligation in connection with any repurchase transaction, the MRA gives the non-defaulting party the right to set-off claims and to apply property held by it in connection with any repurchase transaction against obligations owed to it.
At June 30, 2016, the Portfolio had investments in repurchase agreements with a gross value of $285,555,000, which is reflected as repurchase agreement on the Statement of Assets and Liabilities. The value of the related collateral exceeded the value of the repurchase agreements at June 30, 2016.
3. Certain Risks
In the normal course of business, the Portfolio invests in securities and enters into transactions where risks exist due to fluctuations in the market (“market risk”) or failure of the other party to a transaction to perform (“credit and counterparty risk”).
Market Risk: The value of securities held by the Portfolio may decline in response to certain events, including those directly involving the companies whose securities are owned by the Portfolio; conditions affecting the general economy; overall market changes; local, regional or global political, social or economic instability; and currency, interest rate, and price fluctuations.
Credit and Counterparty Risk: The Portfolio may be exposed to counterparty risk, or the risk that an entity with which the Portfolio has unsettled or open transactions may default. The potential loss could exceed the value of the financial assets and liabilities recorded in the financial statements. Financial assets that potentially expose the Portfolio to credit and counterparty risk consist principally of cash due from counterparties and investments. The Portfolio manages counterparty risk by entering into agreements only with counterparties that it believes have the financial resources to honor their obligations and by monitoring the financial stability of those counterparties. The Portfolio’s investment adviser attempts to mitigate counterparty risk by (i) periodically assessing the creditworthiness of its trading partners, (ii) monitoring and/or limiting the amount of its net exposure to each individual counterparty based on its assessment, and (iii) requiring collateral from the counterparty for certain transactions. In order to preserve certain safeguards for non-standard settlement trades, the Portfolio restricts its exposure to credit and counterparty losses by entering
MSF-12
Metropolitan Series Fund
BlackRock Ultra-Short Term Bond Portfolio (formerly, BlackRock Money Market Portfolio)
Notes to Financial Statements—June 30, 2016—(Continued)
into master netting agreements (“Master Agreements”) with counterparties (approved brokers) with whom it undertakes a significant volume of transactions. Master Agreements govern the terms of certain transactions, and reduce the counterparty risk associated with relevant transactions by specifying credit protection mechanisms and providing standardization that improves legal certainty. Master Agreements can also help limit counterparty risk by specifying collateral posting arrangements at pre-arranged exposure levels.
Repurchase and reverse repurchase agreements are primarily executed under Global Master Repurchase Agreements (“GMRAs”) or Master Repurchase Agreements (“MRAs”), which provide the rights to set-off. Each repurchase and reverse repurchase agreement is initially collateralized at the transaction level. In the event of default, the total market value exposure will be offset against collateral exchanged to date, which would result in a net receivable/(payable) that would be due from/to the counterparty.
Additional risks associated with each type of investment are described above within the respective security type notes. The Portfolio’s prospectus includes a discussion of the principal risks of investing in the Portfolio.
4. Investment Management Fees and Other Transactions with Affiliates
Investment Management Agreement - MetLife Advisers is the investment adviser to the Portfolio. The Trust has entered into an investment management agreement with MetLife Advisers with respect to the Portfolio. For providing investment management services to the Portfolio, MetLife Advisers receives monthly compensation at the following annual rates:
| | | | | | |
Management
Fees earned by
MetLife Advisers
for the six months ended
June 30, 2016 | | % per annum | | | Average Daily Net Assets |
| $1,904,591 | | | 0.350 | % | | Of the first $1 billion |
| | | 0.300 | % | | Of amount in excess of $1 billion |
MetLife Advisers has entered into an investment subadvisory agreement with respect to managing the Portfolio. BlackRock Advisors, LLC is compensated by MetLife Advisers to provide subadvisory services for the Portfolio.
Management Fee Waivers - Pursuant to an expense agreement, MetLife Advisers has agreed, for the period May 1, 2016 to April 30, 2017, to reduce its advisory fees set out above under “Investment Management Agreement” as follows:
| | |
% per annum | | Average Daily Net Assets |
| 0.025% | | Of the first $1 billion |
For the period May 1, 2015 to April 30, 2016, an identical expense agreement was in place. Pursuant to the expense agreement, $124,317 was waived for the six months ended June 30, 2016 and is included in the management fee waivers shown in the Statement of Operations.
In addition to the contractual fee waiver, MetLife Advisers and/or its affiliates had voluntarily agreed, if the yield on any share Class of the Portfolio turns negative on a given day, to waive their fees or reimburse certain Portfolio expenses to raise the yield of that share Class to 0.00% for that day. The waiver was first be applied to 12b-1 expenses. If the amount of the waiver exceeded the Class B or Class E 12b-1 expenses on a given day, MetLife Advisers and/or its affiliates would then waive fees or reimburse expenses pro rata across all share Classes. This voluntary waiver/expense reimbursement was discontinued by MetLife Advisers as of May 1, 2016. During the six months ended June 30, 2016, $88,078 of 12b-1 expenses were waived as shown on the Statement of Operations. Class B shares waived $86,482 and Class E shares waived $1,596.
Certain officers and trustees of the Trust may also be officers of MetLife Advisers; however, such officers and trustees receive no compensation from the Trust.
On January 12, 2016, MetLife, Inc. announced its plan to pursue the separation of a substantial portion of its retail segment and is currently evaluating structural alternatives for such separation. It is anticipated that MetLife Advisers would be included in any such separation. Any separation transaction that might occur will be subject to the satisfaction of various conditions and approvals, including approval of any transaction by the MetLife, Inc. Board of Directors, satisfaction of any applicable requirements of the SEC, and receipt of insurance and other regulatory approvals and other anticipated conditions. Because the form of a separation had yet to be determined, MetLife, Inc. cannot currently provide a specific potential completion date or information about the potential impact on MetLife Advisers. No assurance can be given regarding the form that a separation transaction may take or the specific terms thereof, or that a separation will in fact occur. Depending on the form a separation takes, MetLife Advisers’ continued service as investment adviser to the Trusts could be subject to the satisfaction of various conditions and approvals, which may include obtaining approvals from the Trusts’ Board and shareholders.
Transfer Agency Agreement - MetLife serves as the transfer agent for the Trust. MetLife receives no fees for its services to the Trust under the transfer agency agreement.
MSF-13
Metropolitan Series Fund
BlackRock Ultra-Short Term Bond Portfolio (formerly, BlackRock Money Market Portfolio)
Notes to Financial Statements—June 30, 2016—(Continued)
Distribution and Service Fees - The Trust has a distribution agreement with MetLife Investors Distribution Company (“MIDC” or the “Distributor”) in which MIDC serves as the distributor for the Portfolio’s Class A, B and E Shares. MIDC is a wholly-owned subsidiary of MetLife Investors Group, LLC, an affiliate of the Adviser. The Trust has also adopted a Distribution and Service Plan under Rule 12b-1 of the 1940 Act for the Portfolio’s Class B and E Shares. Under the Distribution and Service Plan, the Class B and E Shares of the Portfolio pay a fee to compensate the Insurance Companies (or their affiliates) and other broker-dealers and financial intermediaries involved in the offer and sale of Portfolio shares for promoting or selling and servicing the Class B and E Shares. The fees under the Distribution and Service Plan for each class of the Portfolio’s shares are calculated as a percentage of the Portfolio’s average daily net assets that are attributable to that Class. Currently, the fee is 0.25% per year for Class B Shares and 0.15% per year for Class E Shares. Amounts incurred by the Portfolio for the six months ended June 30, 2016 are shown as Distribution and service fees in the Statement of Operations.
Deferred Trustee Compensation - Each Trustee who is not currently an employee of the Adviser or any of its affiliates receives compensation from the Trust for his or her service to the Trust. A deferred compensation plan (the “Plan”) is available to the Trustees on a voluntary basis. Deferred amounts remain in the Trust until distributed in accordance with the provisions of the Plan. The value of a participating Trustee’s deferral account is based on theoretical investments of deferred amounts on the normal payment dates in certain portfolios of the Trust or Met Investors Series Trust, an affiliate of the Trust, as designated by the participating Trustee. Changes in the value of participants’ deferral accounts are reflected as Trustees’ fees and expenses in the Statement of Operations. The portion of the accrued obligations allocated to the Portfolio under the Plan is reflected as Deferred trustees’ fees in the Statement of Assets and Liabilities.
5. Contractual Obligations
Under the Trust’s organizational documents, its officers and Trustees may be indemnified against certain liabilities and expenses arising out of the performance of their duties to the Trust. Additionally, the Trust has a variety of indemnification obligations under contracts with its service providers. The Trust’s maximum exposure under these arrangements is unknown, as this would involve future claims that may be made against the Trust that have not yet occurred.
6. Income Tax Information
The tax character of distributions paid for the years ended December 31, 2015 and 2014 were as follows:
| | | | | | | | | | | | | | | | | | | | |
Ordinary Income | | | Long-Term Capital Gain | | | Total | |
2015 | | 2014 | | | 2015 | | �� | 2014 | | | 2015 | | | 2014 | |
| $13,344 | | $ | — | | | $ | — | | | $ | — | | | $ | 13,344 | | | $ | — | |
As of December 31, 2015, the components of distributable earnings (accumulated losses) on a federal income tax basis were as follows:
| | | | | | | | | | | | | | | | | | | | |
Undistributed
Ordinary
Income | | Undistributed
Long-Term
Capital Gain | | | Net
Unrealized
Appreciation | | | Loss Carryforwards | | | Other
Accumulated
Capital Losses | | | Total | |
| $11,847 | | $ | — | | | $ | — | | | $ | — | | | $ | — | | | $ | 11,847 | |
The Portfolio utilizes the provisions of the federal income tax laws that provide for the carryforward of capital losses for prior years, offsetting such losses against any future realized capital gains. Under the Regulated Investment Company Modernization Act of 2010 (the “Act”), net capital losses recognized after December 22, 2010 may be carried forward indefinitely and their character is retained as short-term and/or long-term losses. Previously, net capital losses were carried forward for up to eight years and treated as short-term losses. As a transition rule, the Act requires that post-enactment net capital losses be used before pre-enactment net capital losses.
As of December 31, 2015, the Portfolio had no post-enactment accumulated capital losses and no pre-enactment accumulated capital loss carryforwards.
MSF-14
Metropolitan Series Fund
Frontier Mid Cap Growth Portfolio
Managed By Frontier Capital Management Company, LLC
Portfolio Manager Commentary*
PERFORMANCE
For the six month period ended June 30, 2016, the Class A, B, D and E shares of the Frontier Mid Cap Growth Portfolio returned 1.24%, 1.11%, 1.20%, and 1.17%, respectively. The Portfolio’s benchmark, the Russell Midcap Growth Index1, returned 2.15%.
MARKET ENVIRONMENT / CONDITIONS
Despite significant volatility, most equities managed to advance during the first half of the year 2016. The year started with weak global economic readings, tepid earnings reports and plunging oil prices that sparked fears of severe dislocation for creditors and emerging markets. The subsequent sharp rally that occurred in March and beyond resulted from the U.S. Federal Reserve pushing out interest rate hikes coupled with major oil producers signaling an attempt to address excess supply. Taken together, these actions led oil and other commodities to stabilize and provided relief to credit markets and other risk asset types such as emerging markets. As the market remained close to new highs, sentiment was guarded as some investors saw signs of resiliency while others believed stocks will correct under the weight of numerous global risks. We remained optimistic that fundamentals, while challenged, showed improvement. The earnings growth of U.S. stocks appeared to have stabilized and forecasts have suggested a future turnaround.
PORTFOLIO REVIEW/ PERIOD END POSITIONING
Stock selection in Financials and an underweight to the Consumer Staples sector were the two main drivers of underperformance during the period, and offset stock selection, which was positive or neutral in six of the ten sectors.
Financials were hurt by the significant drop in global bond yields leading to drawbacks in several holdings, such as E*TRADE, Aon and Raymond James Financial given their business models are favorably positioned for eventual rate increases by the Federal Reserve, which is uncertain both in terms of magnitude and duration. Within Consumer Staples we remained underweight given our bias to investing in companies believed to offer more compelling organic growth and valuations.
Information Technology was the largest contributor to performance and was aided by investments in video game makers Activision and Electronic Arts, and in technology solution provider CDK Global. All three names benefitted after reporting robust results and guiding to strong expected future earnings. Information Technology was further helped by our investment during the period in Universal Display, a maker of OLED technology that prospered from leading consumer electronics manufacturers indicating their intent to transition displays from LED to OLED. The pace of innovation within Information Technology is attractive, and as such we remained overweight at period end.
In this persistent low growth environment, our focus remained on identifying companies with compelling secular demand characteristics and levers for above average earnings power in a market challenged for growth. At period end, the Information Technology sector provided attractive opportunities in gaming software, payments processing, infrastructure materials and business services. Within Health Care, we have limited the Portfolio’s exposures to specialty pharmaceuticals given pricing concerns and instead favored innovative device and biotechnology companies. In Financials, we have selectively reduced exposure where higher rates are required for outsized earnings leverage. At the same time, we remained wary of over-paying for typically slower growth assets (Staples, Utilities and real estate investment trusts) that have enjoyed substantial appreciation from falling interest rates but offer limited growth opportunities in our view.
Stephen M. Knightly
Christopher J. Scarpa
Portfolio Managers
Frontier Capital Management Company, LLC
* This commentary may include statements that constitute “forward-looking statements” under the U.S. securities laws. Forward-looking statements include, among other things, projections, estimates, and information about possible or future results related to the Portfolio, market or regulatory developments. The views expressed above are not guarantees of future performance or economic results and involve certain risks, uncertainties and assumptions that could cause actual outcomes and results to differ materially from the views expressed herein. The views expressed above are subject to change at any time based upon economic, market, or other conditions and the subadvisory firm undertakes no obligation to update the views expressed herein. Any discussions of specific securities should not be considered a recommendation to buy or sell those securities. The views expressed above (including any forward-looking statement) may not be relied upon as investment advice or as an indication of the Portfolio’s trading intent. Information about the Portfolio’s holdings, asset allocation or country diversification is historical and is not an indication of future Portfolio composition, which may vary. Direct investment in any index is not possible. The performance of any index mentioned in this commentary has not been adjusted for ongoing management, distribution and operating expenses, and sales charges applicable to mutual fund investments. In addition, the returns do not reflect additional fees charged by separate accounts or variable insurance contracts that an investor in the Portfolio may pay. If these additional fees were reflected, performance would have been lower.
MSF-1
Metropolitan Series Fund
Frontier Mid Cap Growth Portfolio
A $10,000 INVESTMENT COMPARED TO THE RUSSELL MIDCAP GROWTH INDEX
SIX MONTH RETURN & AVERAGE ANNUAL RETURNS (%) AS OF JUNE 30, 2016
| | | | | | | | | | | | | | | | |
| | | 6 Month | | | 1 Year | | | 5 Year | | | 10 Year | |
| Frontier Mid Cap Growth Portfolio | | | | | | | | | | | | | | | | |
Class A | | | 1.24 | | | | -5.49 | | | | 8.74 | | | | 6.93 | |
Class B | | | 1.11 | | | | -5.74 | | | | 8.48 | | | | 6.67 | |
Class D | | | 1.20 | | | | -5.57 | | | | 8.64 | | | | 6.83 | |
Class E | | | 1.17 | | | | -5.65 | | | | 8.58 | | | | 6.78 | |
| Russell Midcap Growth Index | | | 2.15 | | | | -2.14 | | | | 9.98 | | | | 8.12 | |
1 The Russell Midcap Growth Index is an unmanaged measure of performance of those Russell Midcap companies (the 800 smallest companies in the Russell 1000 Index) with higher price-to-book ratios and forecasted growth values.
Portfolio performance is calculated including reinvestment of all income and capital gain distributions. Performance numbers are net of all Portfolio expenses but do not include any insurance, sales, separate account or administrative charges of variable annuity or life insurance contracts or any additional expenses that participants may bear relating to the operations of their plans. If these charges were included, the returns would be lower. The performance of any index referenced above has not been adjusted for ongoing management, distribution and operating expenses, and sales charges applicable to mutual fund investments. Direct investment in any index is not possible. The performance of Class A shares, as set forth in the line graph above, will differ from that of other classes because of the difference in expenses paid by policyholders investing in the different share classes.
This information represents past performance and is not indicative of future results. Investment return and principal value may fluctuate so that shares, upon redemption, may be worth more or less than the original cost.
PORTFOLIO COMPOSITION AS OF JUNE 30, 2016
Top Holdings
| | | | |
| | | % of
Net Assets | |
| Electronic Arts, Inc. | | | 3.3 | |
| Equifax, Inc. | | | 2.6 | |
| Activision Blizzard, Inc. | | | 2.4 | |
| Vantiv, Inc. - Class A | | | 2.4 | |
| Ross Stores, Inc. | | | 2.3 | |
| Aon plc | | | 2.2 | |
| CDK Global, Inc. | | | 2.1 | |
| Global Payments, Inc. | | | 2.1 | |
| C.R. Bard, Inc. | | | 2.1 | |
| Aramark | | | 2.0 | |
Top Sectors
| | | | |
| | | % of
Net Assets | |
| Information Technology | | | 31.8 | |
| Consumer Discretionary | | | 19.0 | |
| Industrials | | | 16.0 | |
| Health Care | | | 15.2 | |
| Financials | | | 8.3 | |
| Materials | | | 3.7 | |
| Consumer Staples | | | 2.9 | |
| Energy | | | 1.5 | |
| Telecommunication Services | | | 1.1 | |
MSF-2
Metropolitan Series Fund
Frontier Mid Cap Growth Portfolio
Understanding Your Portfolio’s Expenses (Unaudited)
Shareholder Expense Example
As a shareholder of the Portfolio, you incur ongoing costs, including management fees; distribution and service (12b-1) fees; and other Portfolio expenses. This example is intended to help you understand your ongoing costs (in dollars) (referred to as “expenses”) of investing in the Portfolio and compare these costs with the ongoing costs of investing in other mutual funds. The example is based on an investment of $1,000 invested at the beginning of the period and held for the entire period, January 1, 2016 through June 30, 2016.
Actual Expenses
The first line for each share class of the Portfolio in the table below provides information about actual account values and actual expenses. You may use the information in this line, together with the amount you invested in the particular share class of the Portfolio, to estimate the expenses that you paid over the period. Simply divide your account value by $1,000 (for example, an $8,600 account value divided by $1,000 = 8.6), then multiply the result by the number in the first line under the heading entitled “Expenses Paid During Period” to estimate the expenses you paid on your account during this period.
Hypothetical Example for Comparison Purposes
The second line for each share class of the Portfolio in the table below provides information about hypothetical account values and hypothetical expenses based on the Portfolio’s actual expense ratio and an assumed rate of return of 5% per year before expenses, which is not the Portfolio’s actual return. The hypothetical account values and expenses may not be used to estimate the actual ending account balance or expenses you paid for the period. You may use this information to compare the ongoing costs of investing in the Portfolio and other funds. To do so, compare this 5% hypothetical example with the 5% hypothetical examples that appear in the shareholder reports of the other funds.
Please note that the expenses shown in the table are meant to highlight your ongoing costs only and do not reflect any fees or charges of your variable insurance product or any additional expenses that participants in certain eligible qualified plans may bear relating to the operations of their plan. Therefore, the second line for each share class in the table is useful in comparing ongoing costs only, and will not help you determine the relative total costs of owning different funds. In addition, if these other costs were included, your costs would have been higher.
| | | | | | | | | | | | | | | | | | |
Frontier Mid Cap Growth Portfolio | | | | Annualized
Expense
Ratio | | | Beginning
Account Value
January 1,
2016 | | | Ending
Account Value
June 30,
2016 | | | Expenses Paid
During Period**
January 1, 2016
to
June 30,
2016 | |
Class A(a) | | Actual | | | 0.73 | % | | $ | 1,000.00 | | | $ | 1,012.40 | | | $ | 3.65 | |
| | Hypothetical* | | | 0.73 | % | | $ | 1,000.00 | | | $ | 1,021.23 | | | $ | 3.67 | |
| | | | | |
Class B(a) | | Actual | | | 0.98 | % | | $ | 1,000.00 | | | $ | 1,011.10 | | | $ | 4.90 | |
| | Hypothetical* | | | 0.98 | % | | $ | 1,000.00 | | | $ | 1,019.99 | | | $ | 4.92 | |
| | | | | |
Class D(a) | | Actual | | | 0.83 | % | | $ | 1,000.00 | | | $ | 1,012.00 | | | $ | 4.15 | |
| | Hypothetical* | | | 0.83 | % | | $ | 1,000.00 | | | $ | 1,020.74 | | | $ | 4.17 | |
| | | | | |
Class E(a) | | Actual | | | 0.88 | % | | $ | 1,000.00 | | | $ | 1,011.70 | | | $ | 4.40 | |
| | Hypothetical* | | | 0.88 | % | | $ | 1,000.00 | | | $ | 1,020.49 | | | $ | 4.42 | |
* Hypothetical assumes a rate of return of 5% per year before expenses.
** Expenses paid are equal to the Portfolio’s annualized expense ratio for the most recent six month period, as shown above, multiplied by the average account value over the period, multiplied by the number of days (182 days) in the most recent fiscal half-year, divided by 366 (to reflect the one-half year period).
(a) The annualized expense ratio shown reflects the impact of the management fee waiver as described in Note 5 of the Notes to Financial Statements.
MSF-3
Metropolitan Series Fund
Frontier Mid Cap Growth Portfolio
Schedule of Investments as of June 30, 2016 (Unaudited)
Common Stocks—99.5% of Net Assets
| | | | | | | | |
| Security Description | | Shares | | | Value | |
| | |
Airlines—0.7% | | | | | | | | |
United Continental Holdings, Inc. (a) | | | 196,019 | | | $ | 8,044,620 | |
| | | | | | | | |
| | |
Banks—1.0% | | | | | | | | |
Signature Bank (a) | | | 87,813 | | | | 10,969,600 | |
| | | | | | | | |
| | |
Beverages—2.1% | | | | | | | | |
Brown-Forman Corp. - Class B | | | 101,471 | | | | 10,122,747 | |
Monster Beverage Corp. (a) | | | 81,441 | | | | 13,088,383 | |
| | | | | | | | |
| | | | | | | 23,211,130 | |
| | | | | | | | |
| | |
Biotechnology—3.3% | | | | | | | | |
Alkermes plc (a) | | | 125,175 | | | | 5,410,064 | |
BioMarin Pharmaceutical, Inc. (a) | | | 77,383 | | | | 6,020,397 | |
Incyte Corp. (a) | | | 165,188 | | | | 13,211,736 | |
Medivation, Inc. (a) | | | 204,467 | | | | 12,329,360 | |
| | | | | | | | |
| | | | | | | 36,971,557 | |
| | | | | | | | |
| | |
Building Products—0.6% | | | | | | | | |
A.O. Smith Corp. | | | 83,289 | | | | 7,338,594 | |
| | | | | | | | |
| | |
Capital Markets—2.9% | | | | | | | | |
E*Trade Financial Corp. (a) | | | 377,255 | | | | 8,861,720 | |
Raymond James Financial, Inc. | | | 376,792 | | | | 18,575,846 | |
WisdomTree Investments, Inc. (b) | | | 506,557 | | | | 4,959,193 | |
| | | | | | | | |
| | | | | | | 32,396,759 | |
| | | | | | | | |
| | |
Chemicals—1.8% | | | | | | | | |
Sherwin-Williams Co. (The) | | | 68,698 | | | | 20,174,542 | |
| | | | | | | | |
| | |
Commercial Services & Supplies—4.5% | | | | | | | | |
Cintas Corp. | | | 226,077 | | | | 22,184,936 | |
KAR Auction Services, Inc. | | | 267,417 | | | | 11,161,985 | |
Waste Connections, Inc. (a) | | | 249,432 | | | | 17,971,576 | |
| | | | | | | | |
| | | | | | | 51,318,497 | |
| | | | | | | | |
| | |
Construction Materials—1.9% | | | | | | | | |
Eagle Materials, Inc. | | | 165,611 | | | | 12,776,889 | |
Martin Marietta Materials, Inc. | | | 42,909 | | | | 8,238,528 | |
| | | | | | | | |
| | | | | | | 21,015,417 | |
| | | | | | | | |
| | |
Distributors—1.2% | | | | | | | | |
LKQ Corp. (a) | | | 445,745 | | | | 14,130,116 | |
| | | | | | | | |
| | |
Diversified Consumer Services—0.8% | | | | | | | | |
Bright Horizons Family Solutions, Inc. (a) | | | 134,792 | | | | 8,938,057 | |
| | | | | | | | |
| | |
Diversified Financial Services—2.3% | | | | | | | | |
Moody’s Corp. | | | 88,857 | | | | 8,326,789 | |
Nasdaq, Inc. | | | 273,994 | | | | 17,719,192 | |
| | | | | | | | |
| | | | | | | 26,045,981 | |
| | | | | | | | |
|
Diversified Telecommunication Services—1.1% | |
Cogent Communications Holdings, Inc. (b) | | | 315,138 | | | | 12,624,428 | |
| | | | | | | | |
|
Electronic Equipment, Instruments & Components—1.6% | |
Amphenol Corp. - Class A | | | 158,642 | | | $ | 9,094,946 | |
Universal Display Corp. (a) (b) | | | 125,302 | | | | 8,495,475 | |
| | | | | | | | |
| | | | | | | 17,590,421 | |
| | | | | | | | |
| | |
Food Products—0.9% | | | | | | | | |
Mead Johnson Nutrition Co. | | | 106,727 | | | | 9,685,475 | |
| | | | | | | | |
| |
Health Care Equipment & Supplies—7.8% | | | | | |
Align Technology, Inc. (a) | | | 78,949 | | | | 6,359,342 | |
C.R. Bard, Inc. | | | 99,276 | | | | 23,345,744 | |
Cooper Cos., Inc. (The) | | | 115,062 | | | | 19,741,187 | |
DexCom, Inc. (a) | | | 74,053 | | | | 5,874,625 | |
Edwards Lifesciences Corp. (a) | | | 65,180 | | | | 6,500,402 | |
STERIS plc (b) | | | 244,567 | | | | 16,813,981 | |
Teleflex, Inc. | | | 52,668 | | | | 9,338,563 | |
| | | | | | | | |
| | | | | | | 87,973,844 | |
| | | | | | | | |
| | |
Health Care Providers & Services—1.9% | | | | | | | | |
Humana, Inc. | | | 33,055 | | | | 5,945,933 | |
Universal Health Services, Inc. - Class B | | | 113,378 | | | | 15,203,990 | |
| | | | | | | | |
| | | | | | | 21,149,923 | |
| | | | | | | | |
| | |
Health Care Technology—0.7% | | | | | | | | |
Cerner Corp. (a) (b) | | | 129,231 | | | | 7,572,937 | |
| | | | | | | | |
| | |
Hotels, Restaurants & Leisure—3.6% | | | | | | | | |
Aramark | | | 690,519 | | | | 23,077,145 | |
MGM Resorts International (a) | | | 185,685 | | | | 4,202,052 | |
Royal Caribbean Cruises, Ltd. (b) | | | 199,200 | | | | 13,376,280 | |
| | | | | | | | |
| | | | | | | 40,655,477 | |
| | | | | | | | |
| | |
Household Durables—1.0% | | | | | | | | |
Harman International Industries, Inc. (b) | | | 156,339 | | | | 11,228,267 | |
| | | | | | | | |
| | |
Industrial Conglomerates—1.0% | | | | | | | | |
Roper Technologies, Inc. | | | 64,252 | | | | 10,958,821 | |
| | | | | | | | |
| | |
Insurance—2.2% | | | | | | | | |
Aon plc | | | 224,273 | | | | 24,497,340 | |
| | | | | | | | |
| | |
Internet & Catalog Retail—0.6% | | | | | | | | |
Expedia, Inc. (b) | | | 59,648 | | | | 6,340,582 | |
| | | | | | | | |
| | |
IT Services—10.9% | | | | | | | | |
Alliance Data Systems Corp. (a) | | | 58,374 | | | | 11,436,634 | |
Euronet Worldwide, Inc. (a) | | | 324,559 | | | | 22,456,237 | |
Gartner, Inc. (a) | | | 78,774 | | | | 7,673,375 | |
Genpact, Ltd. (a) | | | 326,344 | | | | 8,759,073 | |
Global Payments, Inc. | | | 334,666 | | | | 23,888,459 | |
Jack Henry & Associates, Inc. | | | 162,972 | | | | 14,222,567 | |
Sabre Corp. | | | 313,412 | | | | 8,396,308 | |
Vantiv, Inc. - Class A (a) | | | 469,784 | | | | 26,589,774 | |
| | | | | | | | |
| | | | | | | 123,422,427 | |
| | | | | | | | |
See accompanying notes to financial statements.
MSF-4
Metropolitan Series Fund
Frontier Mid Cap Growth Portfolio
Schedule of Investments as of June 30, 2016 (Unaudited)
Common Stocks—(Continued)
| | | | | | | | |
| Security Description | | Shares | | | Value | |
| | |
Leisure Products—1.5% | | | | | | | | |
Brunswick Corp. | | | 372,837 | | | $ | 16,896,973 | |
| | | | | | | | |
| |
Life Sciences Tools & Services—1.6% | | | | | |
Illumina, Inc. (a) | | | 34,874 | | | | 4,895,612 | |
PAREXEL International Corp. (a) | | | 216,259 | | | | 13,598,366 | |
| | | | | | | | |
| | | | | | | 18,493,978 | |
| | | | | | | | |
| | |
Machinery—1.1% | | | | | | | | |
Wabtec Corp. (b) | | | 176,820 | | | | 12,418,069 | |
| | | | | | | | |
| | |
Marine—1.1% | | | | | | | | |
Kirby Corp. (a) (b) | | | 203,307 | | | | 12,684,324 | |
| | | | | | | | |
| | |
Media—0.6% | | | | | | | | |
IMAX Corp. (a) (b) | | | 249,728 | | | | 7,361,981 | |
| | | | | | | | |
| | |
Multiline Retail—3.7% | | | | | | | | |
Dollar General Corp. | | | 242,582 | | | | 22,802,708 | |
Dollar Tree, Inc. (a) | | | 205,929 | | | | 19,406,749 | |
| | | | | | | | |
| | | | | | | 42,209,457 | |
| | | | | | | | |
| | |
Oil, Gas & Consumable Fuels—1.4% | | | | | | | | |
Carrizo Oil & Gas, Inc. (a) (b) | | | 299,641 | | | | 10,742,130 | |
Concho Resources, Inc. (a) | | | 47,525 | | | | 5,668,307 | |
| | | | | | | | |
| | | | | | | 16,410,437 | |
| | | | | | | | |
| | |
Professional Services—2.6% | | | | | | | | |
Equifax, Inc. | | | 231,638 | | | | 29,742,319 | |
| | | | | | | | |
| | |
Road & Rail—1.6% | | | | | | | | |
J.B. Hunt Transport Services, Inc. (b) | | | 217,986 | | | | 17,641,607 | |
| | | | | | | | |
|
Semiconductors & Semiconductor Equipment—4.7% | |
Analog Devices, Inc. | | | 230,979 | | | | 13,082,651 | |
Lam Research Corp. | | | 177,790 | | | | 14,945,027 | |
NXP Semiconductor NV (a) | | | 106,301 | | | | 8,327,620 | |
Qorvo, Inc. (a) | | | 298,564 | | | | 16,498,647 | |
| | | | | | | | |
| | | | | | | 52,853,945 | |
| | | | | | | | |
| | |
Software—14.6% | | | | | | | | |
Activision Blizzard, Inc. | | | 681,418 | | | | 27,004,595 | |
Cadence Design Systems, Inc. (a) | | | 901,142 | | | | 21,897,751 | |
CDK Global, Inc. | | | 435,498 | | | | 24,165,784 | |
Electronic Arts, Inc. (a) | | | 488,326 | | | | 36,995,578 | |
Fair Isaac Corp. | | | 130,918 | | | | 14,795,043 | |
Fortinet, Inc. (a) | | | 498,124 | | | | 15,735,737 | |
Mobileye NV (a) (b) | | | 163,010 | | | | 7,521,281 | |
Red Hat, Inc. (a) | | | 231,313 | | | | 16,793,324 | |
| | | | | | | | |
| | | | | | | 164,909,093 | |
| | | | | | | | |
| | |
Specialty Retail—4.3% | | | | | | | | |
Advance Auto Parts, Inc. | | | 77,632 | | | | 12,547,660 | |
O’Reilly Automotive, Inc. (a) | | | 40,352 | | | | 10,939,427 | |
Ross Stores, Inc. | | | 450,198 | | | | 25,521,725 | |
| | | | | | | | |
| | | | | | | 49,008,812 | |
| | | | | | | | |
|
Textiles, Apparel & Luxury Goods—1.6% | |
Carter’s, Inc. | | | 61,301 | | | $ | 6,526,717 | |
lululemon athletica, Inc. (a) (b) | | | 159,225 | | | | 11,760,359 | |
| | | | | | | | |
| | | | | | | 18,287,076 | |
| | | | | | | | |
|
Trading Companies & Distributors—2.7% | |
Beacon Roofing Supply, Inc. (a) | | | 223,218 | | | | 10,149,722 | |
HD Supply Holdings, Inc. (a) | | | 592,895 | | | | 20,644,604 | |
| | | | | | | | |
| | | | | | | 30,794,326 | |
| | | | | | | | |
Total Common Stocks
(Cost $980,461,079) | | | | | | | 1,123,967,209 | |
| | | | | | | | |
|
| Short-Term Investments—7.4% | |
| | |
Mutual Fund—6.3% | | | | | | | | |
State Street Navigator Securities Lending MET Portfolio (c) | | | 71,040,098 | | | | 71,040,098 | |
| | | | | | | | |
| | |
Repurchase Agreement—1.1% | | | | | | | | |
Fixed Income Clearing Corp. Repurchase Agreement dated 06/30/16 at 0.030% to be repurchased at $11,993,914 on 07/01/16, collateralized by $11,865,000 U.S. Treasury Note at 1.750% due 12/31/20 with a value of $12,235,781. | | | 11,993,904 | | | | 11,993,904 | |
| | | | | | | | |
Total Short-Term Investments
(Cost $83,034,002) | | | | | | | 83,034,002 | |
| | | | | | | | |
Total Investments—106.9%
(Cost $1,063,495,081) (d) | | | | | | | 1,207,001,211 | |
Other assets and liabilities (net)—(6.9)% | | | | | | | (77,399,773 | ) |
| | | | | | | | |
| Net Assets—100.0% | | | | | | $ | 1,129,601,438 | |
| | | | | | | | |
| * | Principal amount stated in U.S. dollars unless otherwise noted. |
| (a) | Non-income producing security. |
| (b) | All or a portion of the security was held on loan. As of June 30, 2016, the market value of securities loaned was $92,030,882 and the collateral received consisted of cash in the amount of $71,040,098 and non-cash collateral with a value of $21,593,591. The cash collateral is invested in a money market fund managed by an affiliate of the custodian. The non-cash collateral received consists primarily of government securities and bank letters of credit, and is held for the benefit of the Portfolio at the Portfolio’s custodian. The Portfolio cannot repledge or resell this collateral. As such, this collateral is excluded from the Statement of Assets and Liabilities. |
| (c) | Represents investment of cash collateral received from securities on loan as of June 30, 2016. |
| (d) | As of June 30, 2016, the aggregate cost of investments was $1,063,495,081. The aggregate unrealized appreciation and depreciation of investments were $184,876,725 and $(41,370,595), respectively, resulting in net unrealized appreciation of $143,506,130. |
See accompanying notes to financial statements.
MSF-5
Metropolitan Series Fund
Frontier Mid Cap Growth Portfolio
Schedule of Investments as of June 30, 2016 (Unaudited)
Fair Value Hierarchy
Accounting principles generally accepted in the United States of America (“GAAP”) define fair market value as the price that the Portfolio would receive to sell an asset or pay to transfer a liability in an orderly transaction between market participants at the measurement date. It establishes a fair value hierarchy that prioritizes inputs to valuation methods and requires disclosure of the fair value hierarchy, separately for each major category of assets and liabilities, that segregates fair value measurements into three levels. Levels 1, 2 and 3 of the fair value hierarchy are defined as follows:
Level 1 - unadjusted quoted prices in active markets for identical investments
Level 2 - other significant observable inputs (including, but not limited to, quoted prices for similar assets or liabilities in markets that are either active or inactive; inputs other than quoted prices that are observable such as interest rates, yield curves, volatilities, prepayment speeds, loss severities, credit risks, default rates, or other market corroborated inputs)
Level 3 - significant unobservable inputs based on the best information available in the circumstances, to the extent observable inputs are unavailable (including the Portfolio’s own assumptions used in determining the fair value of investments and derivative financial instruments)
The inputs or methodologies used for valuing investments are not necessarily an indication of the risk associated with investing in them. Changes to the inputs or methodologies used may result in transfers between levels, which will be recognized as of the beginning of the reporting period. Information on transfers between Level 1 and Level 2, if any, will be disclosed following the fair value hierarchy table below. A reconciliation of Level 3 securities, if any, will also be disclosed following the fair value hierarchy table. For more information about the Portfolio’s policy regarding the valuation of investments, please refer to the Notes to Financial Statements.
The following table summarizes the fair value hierarchy of the Portfolio’s investments as of June 30, 2016:
| | | | | | | | | | | | | | | | |
| Description | | Level 1 | | | Level 2 | | | Level 3 | | | Total | |
Total Common Stocks* | | $ | 1,123,967,209 | | | $ | — | | | $ | — | | | $ | 1,123,967,209 | |
| Short-Term Investments | | | | | | | | | | | | | | | | |
Mutual Fund | | | 71,040,098 | | | | — | | | | — | | | | 71,040,098 | |
Repurchase Agreement | | | — | | | | 11,993,904 | | | | — | | | | 11,993,904 | |
Total Short-Term Investments | | | 71,040,098 | | | | 11,993,904 | | | | — | | | | 83,034,002 | |
Total Investments | | $ | 1,195,007,307 | | | $ | 11,993,904 | | | $ | — | | | $ | 1,207,001,211 | |
| | | | | | | | | | | | | | | | | |
Collateral for Securities Loaned (Liability) | | $ | — | | | $ | (71,040,098 | ) | | $ | — | | | $ | (71,040,098 | ) |
| * | See Schedule of Investments for additional detailed categorizations. |
See accompanying notes to financial statements.
MSF-6
Metropolitan Series Fund
Frontier Mid Cap Growth Portfolio
Statement of Assets and Liabilities
June 30, 2016 (Unaudited)
| | | | |
Assets | |
Investments at value (a) (b) | | $ | 1,207,001,211 | |
Receivable for: | |
Investments sold | | | 2,713,247 | |
Fund shares sold | | | 101,117 | |
Dividends and interest | | | 291,982 | |
Prepaid expenses | | | 7,213 | |
| | | | |
Total Assets | | | 1,210,114,770 | |
Liabilities | |
Collateral for securities loaned | | | 71,040,098 | |
Payables for: | |
Investments purchased | | | 8,074,524 | |
Fund shares redeemed | | | 407,032 | |
Accrued Expenses: | |
Management fees | | | 642,188 | |
Distribution and service fees | | | 43,755 | |
Deferred trustees’ fees | | | 107,300 | |
Other expenses | | | 198,435 | |
| | | | |
Total Liabilities | | | 80,513,332 | |
| | | | |
Net Assets | | $ | 1,129,601,438 | |
| | | | |
Net Assets Consist of: | |
Paid in surplus | | $ | 985,651,988 | |
Accumulated net investment loss | | | (165,555 | ) |
Accumulated net realized gain | | | 608,875 | |
Unrealized appreciation on investments | | | 143,506,130 | |
| | | | |
Net Assets | | $ | 1,129,601,438 | |
| | | | |
Net Assets | |
Class A | | $ | 860,967,497 | |
Class B | | | 173,589,314 | |
Class D | | | 85,388,131 | |
Class E | | | 9,656,496 | |
Capital Shares Outstanding* | |
Class A | | | 28,534,772 | |
Class B | | | 6,308,902 | |
Class D | | | 2,880,191 | |
Class E | | | 327,091 | |
Net Asset Value, Offering Price and Redemption Price Per Share | | | | |
Class A | | $ | 30.17 | |
Class B | | | 27.51 | |
Class D | | | 29.65 | |
Class E | | | 29.52 | |
| * | The Portfolio is authorized to issue an unlimited number of shares. |
| (a) | Identified cost of investments was $1,063,495,081. |
| (b) | Includes securities loaned at value of $92,030,882. |
Statement of Operations
Six Months Ended June 30, 2016 (Unaudited)
| | | | |
Investment Income | |
Dividends | | $ | 4,021,696 | |
Interest | | | 3,312 | |
Securities lending income | | | 137,539 | |
| | | | |
Total investment income | | | 4,162,547 | |
Expenses | |
Management fees | | | 3,925,689 | |
Administration fees | | | 13,943 | |
Custodian and accounting fees | | | 44,432 | |
Distribution and service fees—Class B | | | 212,844 | |
Distribution and service fees—Class D | | | 41,686 | |
Distribution and service fees—Class E | | | 7,061 | |
Audit and tax services | | | 20,230 | |
Legal | | | 13,588 | |
Trustees’ fees and expenses | | | 15,990 | |
Shareholder reporting | | | 81,193 | |
Insurance | | | 4,126 | |
Miscellaneous | | | 8,233 | |
| | | | |
Total expenses | | | 4,389,015 | |
Less management fee waiver | | | (130,577 | ) |
Less broker commission recapture | | | (37,912 | ) |
| | | | |
Net expenses | | | 4,220,526 | |
| | | | |
Net Investment Loss | | | (57,979 | ) |
| | | | |
Net Realized and Unrealized Gain | |
Net realized gain on investments | | | 896,348 | |
| | | | |
Net change in unrealized appreciation on investments | | | 11,505,335 | |
| | | | |
Net realized and unrealized gain | | | 12,401,683 | |
| | | | |
Net Increase in Net Assets From Operations | | $ | 12,343,704 | |
| | | | |
See accompanying notes to financial statements.
MSF-7
Metropolitan Series Fund
Frontier Mid Cap Growth Portfolio
Statements of Changes in Net Assets
| | | | | | | | |
| | | Six Months
Ended
June 30,
2016
(Unaudited) | | | Year Ended
December 31,
2015 | |
Increase (Decrease) in Net Assets: | | | | | | | | |
From Operations | | | | | | | | |
Net investment loss | | $ | (57,979 | ) | | $ | (1,783,221 | ) |
Net realized gain | | | 896,348 | | | | 131,984,246 | |
Net change in unrealized appreciation (depreciation) | | | 11,505,335 | | | | (96,656,360 | ) |
| | | | | | | | |
Increase in net assets from operations | | | 12,343,704 | | | | 33,544,665 | |
| | | | | | | | |
From Distributions to Shareholders | | | | | | | | |
Net realized capital gains | | | | | | | | |
Class A | | | (99,260,079 | ) | | | (120,148,007 | ) |
Class B | | | (21,703,876 | ) | | | (27,320,274 | ) |
Class D | | | (10,011,075 | ) | | | (12,958,013 | ) |
Class E | | | (1,135,232 | ) | | | (1,448,339 | ) |
| | | | | | | | |
Total distributions | | | (132,110,262 | ) | | | (161,874,633 | ) |
| | | | | | | | |
Increase in net assets from capital share transactions | | | 88,963,688 | | | | 146,475,892 | |
| | | | | | | | |
Total increase (decrease) in net assets | | | (30,802,870 | ) | | | 18,145,924 | |
| | |
Net Assets | | | | | | | | |
Beginning of period | | | 1,160,404,308 | | | | 1,142,258,384 | |
| | | | | | | | |
End of period | | $ | 1,129,601,438 | | | $ | 1,160,404,308 | |
| | | | | | | | |
Accumulated net investment loss | | | | | | | | |
End of period | | $ | (165,555 | ) | | $ | (107,576 | ) |
| | | | | | | | |
Other Information:
Capital Shares
Transactions in capital shares were as follows:
| | | | | | | | | | | | | | | | |
| | | Six Months Ended
June 30, 2016
(Unaudited) | | | Year Ended
December 31, 2015 | |
| | | Shares | | | Value | | | Shares | | | Value | |
Class A | | | | | | | | | | | | | | | | |
Sales | | | 191,702 | | | $ | 6,061,823 | | | | 2,865,002 | | | $ | 113,108,885 | |
Reinvestments | | | 3,306,465 | | | | 99,260,079 | | | | 3,289,923 | | | | 120,148,007 | |
Redemptions | | | (1,032,213 | ) | | | (33,327,588 | ) | | | (2,380,338 | ) | | | (89,072,962 | ) |
| | | | | | | | | | | | | | | | |
Net increase | | | 2,465,954 | | | $ | 71,994,314 | | | | 3,774,587 | | | $ | 144,183,930 | |
| | | | | | | | | | | | | | | | |
Class B | | | | | | | | | | | | | | | | |
Sales | | | 172,861 | | | $ | 5,018,289 | | | | 695,096 | | | $ | 23,571,724 | |
Reinvestments | | | 792,691 | | | | 21,703,876 | | | | 809,249 | | | | 27,320,274 | |
Redemptions | | | (497,684 | ) | | | (14,895,819 | ) | | | (1,363,306 | ) | | | (47,105,593 | ) |
| | | | | | | | | | | | | | | | |
Net increase | | | 467,868 | | | $ | 11,826,346 | | | | 141,039 | | | $ | 3,786,405 | |
| | | | | | | | | | | | | | | | |
Class D | | | | | | | | | | | | | | | | |
Sales | | | 63,847 | | | $ | 2,001,031 | | | | 126,941 | | | $ | 4,666,476 | |
Reinvestments | | | 339,358 | | | | 10,011,075 | | | | 360,045 | | | | 12,958,013 | |
Redemptions | | | (229,617 | ) | | | (7,255,362 | ) | | | (530,932 | ) | | | (19,358,357 | ) |
| | | | | | | | | | | | | | | | |
Net increase (decrease) | | | 173,588 | | | $ | 4,756,744 | | | | (43,946 | ) | | $ | (1,733,868 | ) |
| | | | | | | | | | | | | | | | |
Class E | | | | | | | | | | | | | | | | |
Sales | | | 6,987 | | | $ | 213,275 | | | | 28,565 | | | $ | 1,025,425 | |
Reinvestments | | | 38,639 | | | | 1,135,232 | | | | 40,366 | | | | 1,448,339 | |
Redemptions | | | (30,797 | ) | | | (962,223 | ) | | | (61,036 | ) | | | (2,234,339 | ) |
| | | | | | | | | | | | | | | | |
Net increase | | | 14,829 | | | $ | 386,284 | | | | 7,895 | | | $ | 239,425 | |
| | | | | | | | | | | | | | | | |
Increase derived from capital shares transactions | | | | | | $ | 88,963,688 | | | | | | | $ | 146,475,892 | |
| | | | | | | | | | | | | | | | |
See accompanying notes to financial statements.
MSF-8
Metropolitan Series Fund
Frontier Mid Cap Growth Portfolio
Financial Highlights
| | | | | | | | | | | | | | | | | | | | | | | | |
| Selected per share data | | | | | | | | | | | | | | | | | | |
| | | Class A | |
| | | Six Months
Ended
June 30,
2016
(Unaudited) | | | Year Ended December 31, | |
| | | | 2015 | | | 2014 | | | 2013 | | | 2012 | | | 2011 | |
Net Asset Value, Beginning of Period | | $ | 33.70 | | | $ | 37.28 | | | $ | 36.90 | | | $ | 28.92 | | | $ | 26.06 | | | $ | 26.94 | |
| | | | | | | | | | | | | | | | | | | | | | | | |
Income (Loss) from Investment Operations | | | | | | | | | | | | | | | | | | | | | | | | |
Net investment income (loss) (a) | | | 0.01 | | | | (0.03 | ) | | | (0.05 | ) | | | (0.00 | )(b) | | | 0.34 | | | | 0.02 | |
Net realized and unrealized gain (loss) on investments | | | 0.38 | | | | 1.51 | | | | 3.78 | | | | 9.18 | | | | 2.52 | | | | (0.82 | ) |
| | | | | | | | | | | | | | | | | | | | | | | | |
Total from investment operations | | | 0.39 | | | | 1.48 | | | | 3.73 | | | | 9.18 | | | | 2.86 | | | | (0.80 | ) |
| | | | | | | | | | | | | | | | | | | | | | | | |
Less Distributions | | | | | | | | | | | | | | | | | | | | | | | | |
Distributions from net investment income | | | 0.00 | | | | 0.00 | | | | 0.00 | | | | (0.42 | ) | | | 0.00 | | | | (0.08 | ) |
Distributions from net realized capital gains | | | (3.92 | ) | | | (5.06 | ) | | | (3.35 | ) | | | (0.78 | ) | | | 0.00 | | | | 0.00 | |
| | | | | | | | | | | | | | | | | | | | | | | | |
Total distributions | | | (3.92 | ) | | | (5.06 | ) | | | (3.35 | ) | | | (1.20 | ) | | | 0.00 | | | | (0.08 | ) |
| | | | | | | | | | | | | | | | | | | | | | | | |
Net Asset Value, End of Period | | $ | 30.17 | | | $ | 33.70 | | | $ | 37.28 | | | $ | 36.90 | | | $ | 28.92 | | | $ | 26.06 | |
| | | | | | | | | | | | | | | | | | | | | | | | |
Total Return (%) (c) | | | 1.24 | (d) | | | 2.88 | | | | 11.14 | | | | 32.77 | | | | 10.97 | | | | (3.00 | ) |
| | | | | | |
Ratios/Supplemental Data | | | | | | | | | | | | | | | | | | | | | | | | |
Gross ratio of expenses to average net assets (%) | | | 0.76 | (e) | | | 0.74 | | | | 0.76 | | | | 0.75 | | | | 0.78 | | | | 0.77 | |
Net ratio of expenses to average net assets (%) (f) | | | 0.73 | (e) | | | 0.73 | | | | 0.75 | | | | 0.74 | | | | 0.78 | | | | 0.77 | |
Ratio of net investment income (loss) to average net assets (%) | | | 0.04 | (e) | | | (0.09 | ) | | | (0.13 | ) | | | (0.01 | ) | | | 1.21 | | | | 0.09 | |
Portfolio turnover rate (%) | | | 17 | (d) | | | 60 | | | | 48 | | | | 120 | | | | 78 | | | | 111 | |
Net assets, end of period (in millions) | | $ | 861.0 | | | $ | 878.5 | | | $ | 831.2 | | | $ | 982.6 | | | $ | 571.6 | | | $ | 568.2 | |
| |
| | | Class B | |
| | | Six Months
Ended
June 30,
2016
(Unaudited) | | | Year Ended December 31, | |
| | | | 2015 | | | 2014 | | | 2013 | | | 2012 | | | 2011 | |
Net Asset Value, Beginning of Period | | $ | 31.11 | | | $ | 34.85 | | | $ | 34.79 | | | $ | 27.33 | | | $ | 24.69 | | | $ | 25.54 | |
| | | | | | | | | | | | | | | | | | | | | | | | |
Income (Loss) from Investment Operations | | | | | | | | | | | | | | | | | | | | | | | | |
Net investment income (loss) (a) | | | (0.03 | ) | | | (0.12 | ) | | | (0.13 | ) | | | (0.08 | ) | | | 0.26 | | | | (0.04 | ) |
Net realized and unrealized gain (loss) on investments | | | 0.35 | | | | 1.44 | | | | 3.54 | | | | 8.66 | | | | 2.38 | | | | (0.79 | ) |
| | | | | | | | | | | | | | | | | | | | | | | | |
Total from investment operations | | | 0.32 | | | | 1.32 | | | | 3.41 | | | | 8.58 | | | | 2.64 | | | | (0.83 | ) |
| | | | | | | | | | | | | | | | | | | | | | | | |
Less Distributions | | | | | | | | | | | | | | | | | | | | | | | | |
Distributions from net investment income | | | 0.00 | | | | 0.00 | | | | 0.00 | | | | (0.34 | ) | | | 0.00 | | | | (0.02 | ) |
Distributions from net realized capital gains | | | (3.92 | ) | | | (5.06 | ) | | | (3.35 | ) | | | (0.78 | ) | | | 0.00 | | | | 0.00 | |
| | | | | | | | | | | | | | | | | | | | | | | | |
Total distributions | | | (3.92 | ) | | | (5.06 | ) | | | (3.35 | ) | | | (1.12 | ) | | | 0.00 | | | | (0.02 | ) |
| | | | | | | | | | | | | | | | | | | | | | | | |
Net Asset Value, End of Period | | $ | 27.51 | | | $ | 31.11 | | | $ | 34.85 | | | $ | 34.79 | | | $ | 27.33 | | | $ | 24.69 | |
| | | | | | | | | | | | | | | | | | | | | | | | |
Total Return (%) (c) | | | 1.11 | (d) | | | 2.60 | | | | 10.88 | | | | 32.43 | | | | 10.69 | | | | (3.24 | ) |
| | | | | | |
Ratios/Supplemental Data | | | | | | | | | | | | | | | | | | | | | | | | |
Gross ratio of expenses to average net assets (%) | | | 1.01 | (e) | | | 0.99 | | | | 1.01 | | | | 1.00 | | | | 1.03 | | | | 1.02 | |
Net ratio of expenses to average net assets (%) (f) | | | 0.98 | (e) | | | 0.98 | | | | 1.00 | | | | 0.99 | | | | 1.03 | | | | 1.02 | |
Ratio of net investment income (loss) to average net assets (%) | | | (0.21 | )(e) | | | (0.35 | ) | | | (0.37 | ) | | | (0.25 | ) | | | 0.98 | | | | (0.15 | ) |
Portfolio turnover rate (%) | | | 17 | (d) | | | 60 | | | | 48 | | | | 120 | | | | 78 | | | | 111 | |
Net assets, end of period (in millions) | | $ | 173.6 | | | $ | 181.7 | | | $ | 198.6 | | | $ | 201.9 | | | $ | 84.1 | | | $ | 81.1 | |
Please see following page for Financial Highlights footnote legend.
See accompanying notes to financial statements.
MSF-9
Metropolitan Series Fund
Frontier Mid Cap Growth Portfolio
Financial Highlights
| | | | | | | | | | | | | | | | | | | | | | | | |
| Selected per share data | | | | | | | | | | | | | | | | | | |
| | | Class D | |
| | | Six Months
Ended
June 30,
2016
(Unaudited) | | | Year Ended December 31, | |
| | | | 2015 | | | 2014 | | | 2013 | | | 2012 | | | 2011 | |
Net Asset Value, Beginning of Period | | $ | 33.20 | | | $ | 36.83 | | | $ | 36.52 | | | $ | 28.63 | | | $ | 25.82 | | | $ | 26.71 | |
| | | | | | | | | | | | | | | | | | | | | | | | |
Income (Loss) from Investment Operations | | | | | | | | | | | | | | | | | | | | | | | | |
Net investment income (loss) (a) | | | (0.01 | ) | | | (0.07 | ) | | | (0.08 | ) | | | (0.04 | ) | | | 0.30 | | | | (0.01 | ) |
Net realized and unrealized gain (loss) on investments | | | 0.38 | | | | 1.50 | | | | 3.74 | | | | 9.09 | | | | 2.51 | | | | (0.82 | ) |
| | | | | | | | | | | | | | | | | | | | | | | | |
Total from investment operations | | | 0.37 | | | | 1.43 | | | | 3.66 | | | | 9.05 | | | | 2.81 | | | | (0.83 | ) |
| | | | | | | | | | | | | | | | | | | | | | | | |
Less Distributions | | | | | | | | | | | | | | | | | | | | | | | | |
Distributions from net investment income | | | 0.00 | | | | 0.00 | | | | 0.00 | | | | (0.38 | ) | | | 0.00 | | | | (0.06 | ) |
Distributions from net realized capital gains | | | (3.92 | ) | | | (5.06 | ) | | | (3.35 | ) | | | (0.78 | ) | | | 0.00 | | | | 0.00 | |
| | | | | | | | | | | | | | | | | | | | | | | | |
Total distributions | | | (3.92 | ) | | | (5.06 | ) | | | (3.35 | ) | | | (1.16 | ) | | | 0.00 | | | | (0.06 | ) |
| | | | | | | | | | | | | | | | | | | | | | | | |
Net Asset Value, End of Period | | $ | 29.65 | | | $ | 33.20 | | | $ | 36.83 | | | $ | 36.52 | | | $ | 28.63 | | | $ | 25.82 | |
| | | | | | | | | | | | | | | | | | | | | | | | |
Total Return (%) (c) | | | 1.20 | (d) | | | 2.78 | | | | 11.06 | | | | 32.63 | | | | 10.88 | | | | (3.14 | ) |
| | | | | | |
Ratios/Supplemental Data | | | | | | | | | | | | | | | | | | | | | | | | |
Gross ratio of expenses to average net assets (%) | | | 0.86 | (e) | | | 0.84 | | | | 0.86 | | | | 0.85 | | | | 0.88 | | | | 0.87 | |
Net ratio of expenses to average net assets (%) (f) | | | 0.83 | (e) | | | 0.83 | | | | 0.85 | | | | 0.84 | | | | 0.88 | | | | 0.87 | |
Ratio of net investment income (loss) to average net assets (%) | | | (0.06 | )(e) | | | (0.20 | ) | | | (0.22 | ) | | | (0.13 | ) | | | 1.06 | | | | (0.03 | ) |
Portfolio turnover rate (%) | | | 17 | (d) | | | 60 | | | | 48 | | | | 120 | | | | 78 | | | | 111 | |
Net assets, end of period (in millions) | | $ | 85.4 | | | $ | 89.8 | | | $ | 101.3 | | | $ | 107.1 | | | $ | 99.9 | | | $ | 113.9 | |
| |
| | | Class E | |
| | | Six Months
Ended
June 30,
2016
(Unaudited) | | | Year Ended December 31, | |
| | | | 2015 | | | 2014 | | | 2013 | | | 2012 | | | 2011 | |
Net Asset Value, Beginning of Period | | $ | 33.08 | | | $ | 36.73 | | | $ | 36.46 | | | $ | 28.58 | | | $ | 25.79 | | | $ | 26.68 | |
| | | | | | | | | | | | | | | | | | | | | | | | |
Income (Loss) from Investment Operations | | | | | | | | | | | | | | | | | | | | | | | | |
Net investment income (loss) (a) | | | (0.02 | ) | | | (0.09 | ) | | | (0.10 | ) | | | (0.06 | ) | | | 0.29 | | | | (0.02 | ) |
Net realized and unrealized gain (loss) on investments | | | 0.38 | | | | 1.50 | | | | 3.72 | | | | 9.09 | | | | 2.50 | | | | (0.82 | ) |
| | | | | | | | | | | | | | | | | | | | | | | | |
Total from investment operations | | | 0.36 | | | | 1.41 | | | | 3.62 | | | | 9.03 | | | | 2.79 | | | | (0.84 | ) |
| | | | | | | | | | | | | | | | | | | | | | | | |
Less Distributions | | | | | | | | | | | | | | | | | | | | | | | | |
Distributions from net investment income | | | 0.00 | | | | 0.00 | | | | 0.00 | | | | (0.37 | ) | | | 0.00 | | | | (0.05 | ) |
Distributions from net realized capital gains | | | (3.92 | ) | | | (5.06 | ) | | | (3.35 | ) | | | (0.78 | ) | | | 0.00 | | | | 0.00 | |
| | | | | | | | | | | | | | | | | | | | | | | | |
Total distributions | | | (3.92 | ) | | | (5.06 | ) | | | (3.35 | ) | | | (1.15 | ) | | | 0.00 | | | | (0.05 | ) |
| | | | | | | | | | | | | | | | | | | | | | | | |
Net Asset Value, End of Period | | $ | 29.52 | | | $ | 33.08 | | | $ | 36.73 | | | $ | 36.46 | | | $ | 28.58 | | | $ | 25.79 | |
| | | | | | | | | | | | | | | | | | | | | | | | |
Total Return (%) (c) | | | 1.17 | (d) | | | 2.72 | | | | 10.96 | | | | 32.59 | | | | 10.82 | | | | (3.19 | ) |
| | | | | | |
Ratios/Supplemental Data | | | | | | | | | | | | | | | | | | | | | | | | |
Gross ratio of expenses to average net assets (%) | | | 0.91 | (e) | | | 0.89 | | | | 0.91 | | | | 0.90 | | | | 0.93 | | | | 0.92 | |
Net ratio of expenses to average net assets (%) (f) | | | 0.88 | (e) | | | 0.88 | | | | 0.90 | | | | 0.89 | | | | 0.93 | | | | 0.92 | |
Ratio of net investment income (loss) to average net assets (%) | | | (0.11 | )(e) | | | (0.25 | ) | | | (0.28 | ) | | | (0.17 | ) | | | 1.04 | | | | (0.07 | ) |
Portfolio turnover rate (%) | | | 17 | (d) | | | 60 | | | | 48 | | | | 120 | | | | 78 | | | | 111 | |
Net assets, end of period (in millions) | | $ | 9.7 | | | $ | 10.3 | | | $ | 11.2 | | | $ | 11.7 | | | $ | 10.3 | | | $ | 10.9 | |
| (a) | Per share amounts based on average shares outstanding during the period. |
| (b) | Net investment loss was less than $0.01. |
| (c) | Total return does not reflect any insurance, sales, separate account or administrative charges of variable annuity or life insurance contracts or any additional expenses that contract owners may bear under their variable contracts. If these charges were included, the returns would be lower. |
| (d) | Periods less than one year are not computed on an annualized basis. |
| (e) | Computed on an annualized basis. |
| (f) | Includes the effects of management fee waivers (see Note 5 of the Notes to Financial Statements). |
See accompanying notes to financial statements.
MSF-10
Metropolitan Series Fund
Frontier Mid Cap Growth Portfolio
Notes to Financial Statements—June 30, 2016 (Unaudited)
1. Organization
Metropolitan Series Fund (the “Trust”) is organized as a Delaware statutory trust and registered under the Investment Company Act of 1940, as amended (the “1940 Act”), as an open-end management investment company. The Trust, which is managed by MetLife Advisers, LLC (“MetLife Advisers” or the “Adviser”), an affiliate of MetLife, Inc., is currently comprised of thirty series, each of which operates as a distinct investment vehicle of the Trust. The portfolio included in this report is Frontier Mid Cap Growth Portfolio (the “Portfolio”), which is diversified. Shares in the Portfolio are not offered directly to the general public and are currently available only to separate accounts established by Metropolitan Life Insurance Company (“MetLife”) and other affiliated life insurance companies.
The Portfolio has registered and offers four classes of shares: Class A, B, D and E shares. Shares of each Class of the Portfolio represent an equal pro rata interest in the Portfolio and generally give the shareholder the same voting, dividend, liquidation, and other rights. Investment income, realized and unrealized capital gains and losses, the common expenses of the Portfolio, and certain Portfolio-level expense reductions, if any, are allocated on a pro rata basis to each Class based on the relative net assets of each Class to the net assets of the Portfolio. Each Class of shares differs in its respective distribution plan and such distribution expenses are allocated to the corresponding Class of shares.
2. Significant Accounting Policies
The preparation of financial statements in conformity with accounting principles generally accepted in the United States of America (“GAAP”) requires management to make estimates and assumptions that affect the reported amounts of assets and liabilities and disclosure of contingent assets and liabilities as of the date of the financial statements and the reported amounts of income and expenses during the reporting period. Actual results could differ from those estimates. In the preparation of these financial statements, management has evaluated events and transactions subsequent to June 30, 2016 through the date the financial statements were issued.
The Portfolio is an investment company and follows the accounting and reporting guidance of the Financial Accounting Standards Board (“FASB”) Accounting Standards Codification Topic 946—Financial Services—Investment Companies and Topic 820—Fair Value Measurement. The following is a summary of significant accounting policies consistently followed by the Portfolio in the preparation of its financial statements.
Investment Valuation and Fair Value Measurements - Domestic and foreign equity securities, such as common stock, exchange-traded funds, rights, warrants, and preferred stock, that are traded on a securities exchange on a valuation date are generally valued at their last quoted sale price or official closing price on the primary exchange for such security, or, if no sales occurred on that day, at the last reported bid price. Equity securities traded over-the-counter (“OTC”) are generally valued at the last reported bid price. In the event of a major exchange closing during the trading day, the Adviser may use other market information obtained from quotation reporting systems, established market makers, or pricing services in valuing the securities. Valuation adjustments may be applied to certain foreign equity securities that are traded solely on foreign exchanges that close before the time as of which the Portfolio determines its NAV to account for the market movement between the close of the foreign exchanges and the time as of which the Portfolio determines its NAV. The Portfolio may use a systematic fair valuation model provided by a pricing service to value securities principally traded in these foreign markets in order to adjust for possible market movements or other changes that may occur between the close of the foreign exchanges and the time as of which the Portfolio determines its NAV. Foreign equity securities valued using these valuation adjustments are generally categorized as Level 2 within the fair value hierarchy. Equity securities that are actively traded, and have no valuation adjustments applied, are categorized as Level 1 within the fair value hierarchy. Other equity securities traded on inactive markets, or valued in reference to similar instruments traded on active markets, are generally categorized as Level 2 within the fair value hierarchy.
Investments in registered open-end management investment companies are valued at reported net asset value per share on the valuation date and are categorized as Level 1 within the fair value hierarchy.
Debt securities, including corporate, convertible and municipal bonds and notes; obligations of the U.S. Treasury and U.S. government agencies; foreign sovereign issues; and non-U.S. bonds, are generally valued on the basis of evaluated or composite bid quotations obtained from independent pricing services and/or brokers and dealers selected by the Adviser (each a “pricing service”), pursuant to authorization of and subject to general oversight by the Board of Trustees of the Trust (the “Board” or “Trustees”). Such pricing services may use matrix pricing, which considers observable inputs including, among other things, issuer details, maturity dates, interest rates, yield curves, rates of prepayment, credit risks/spreads, default rates, reported trades, broker dealer quotes and quoted prices for similar assets. Short-term obligations with a remaining maturity of sixty days or less may be valued at amortized cost in the absence of market quotes, so long as the amortized cost value of such short-term debt instrument is approximately the same as the fair value of the instrument as determined without the use of amortized cost valuation. Floating rate loans are generally valued on the basis of an evaluated or composite average of aggregate bid and ask quotations supplied by brokers or dealers, as obtained from the pricing service. Securities that use similar valuation techniques and inputs as described above are generally categorized as Level 2 within the fair value hierarchy.
MSF-11
Metropolitan Series Fund
Frontier Mid Cap Growth Portfolio
Notes to Financial Statements—June 30, 2016—(Continued)
Options, whether on securities, indices, futures contracts, or otherwise, traded on exchanges are valued at the last sale price available as of the close of business on a valuation day or, if there is no such price available, at the last reported bid price. These types of options are categorized as Level 1 within the fair value hierarchy. Futures contracts that are traded on commodity exchanges are valued at their settlement prices established by the exchanges on which they are traded as of the close of such exchanges and are categorized as Level 1 within the fair value hierarchy.
If no current market value quotation or other observable inputs are readily available or market value quotations are deemed to be unreliable for an investment, the fair value of the investment will be determined in accordance with procedures approved by, and under the general supervision of, the Board. In such a circumstance, the Board will be assisted in its responsibility to determine the fair value of an investment by the Valuation Committee (“Committee”) of MetLife Advisers. The Committee provides general pricing oversight and fair value pricing determinations related to portfolio securities and meets on a regular basis to review reports relating to the valuation of the securities in the Portfolio. The Board has delegated to State Street Bank and Trust Company, the Trust’s custodian (“custodian”), the responsibility for calculating the net asset values (“NAVs”) of the Trust’s Portfolios. The Committee is responsible for overseeing the calculation of the NAVs of the Portfolios by the custodian. The Committee also periodically reviews pricing services, including the pricing services providing fair value pricing for the Portfolio’s foreign securities, and is responsible for overseeing the correction of pricing errors and addressing other pricing issues that arise in the ordinary course of business, such as making real-time fair value determinations, as necessary.
No single standard for determining the fair value of an investment can be set forth because fair value depends upon the facts and circumstances with respect to each investment. Information relating to any relevant factors may be obtained by the Committee from any appropriate source, including the subadviser of the Portfolio, the custodian, a pricing service, market maker and/or broker for such security or the issuer. Appropriate methodologies for determining fair value under particular circumstances may include: matrix pricing, a discounted cash flow analysis, comparisons of securities with comparable characteristics, value based on multiples of earnings, discount from market price of similar marketable securities or a combination of these and other methods.
Investment Transactions and Related Investment Income - Portfolio security transactions are recorded on the trade date. Dividend income is recorded on the ex-dividend date or, for certain foreign securities, when notified. Interest income, which includes amortization of premium and accretion of discount on debt securities, is recorded on the accrual basis. Realized gains and losses on investments are determined on the identified cost basis, which is the same basis used for federal income tax purposes. Foreign income and foreign capital gains on some foreign securities may be subject to foreign taxes, which are accrued as applicable. These foreign taxes have been provided for in accordance with the Portfolio’s understanding of the applicable countries’ tax rules and rates.
Foreign Currency Translation - The books and records of the Portfolio are maintained in U.S. dollars. The values of securities, currencies, and other assets and liabilities denominated in currencies other than the U.S. dollar are translated into U.S. dollars based upon foreign exchange rates prevailing at the end of the period. Purchases and sales of investment securities, income, and expenses are translated on the respective dates of such transactions. Because the values of investment securities are translated at the foreign exchange rates prevailing at the end of the period, that portion of the results of operations arising from changes in exchange rates and that portion of the results of operations reflecting fluctuations arising from changes in market prices of the investment securities are not separated. Such fluctuations are included in the net realized and unrealized gain or loss on investments.
Net realized foreign exchange gains or losses arise from activity in forward foreign currency exchange contracts, sales of foreign currency, currency gains or losses realized between the trade and settlement dates on securities transactions, and the difference between the amounts of dividends, interest, and foreign withholding taxes recorded by the Portfolio and the U.S. dollar equivalent of the amounts actually received or paid by the Portfolio. Net unrealized foreign exchange gains and losses arise from changes in the value of assets and liabilities, other than investment securities, resulting from changes in foreign exchange rates.
Dividends and Distributions to Shareholders - The Portfolio records dividends and distributions on the ex-dividend date. Net realized gains from securities transactions (if any) are generally distributed annually to shareholders. The timing and characterization of certain income and capital gains distributions are determined in accordance with federal tax regulations that may differ from GAAP. Permanent book and tax basis differences relating to shareholder distributions will result in reclassification between under/over distributed net investment income, accumulated net realized gains/losses, and paid-in surplus. Book-tax differences are primarily due to broker commission recapture and net operating losses. These adjustments have no impact on net assets or the results of operations.
Income Taxes - It is the Portfolio’s policy to comply with the requirements of the Internal Revenue Code of 1986, as amended, and regulations thereunder, applicable to regulated investment companies and to distribute, with respect to each taxable year, all of its taxable income to shareholders. Therefore, no federal income tax provision is required. The Portfolio files U.S. federal tax returns. No income tax returns are currently under examination. The Portfolio’s federal tax returns for the prior three fiscal years remain subject to examination by the Internal Revenue Service. As of June 30, 2016, the Portfolio had no uncertain tax positions that would require financial statement recognition, or de-recognition or disclosure.
MSF-12
Metropolitan Series Fund
Frontier Mid Cap Growth Portfolio
Notes to Financial Statements—June 30, 2016—(Continued)
Directed Brokerage Agreement - The Trust has entered into a directed brokerage arrangement with State Street Global Markets (“SSGM”). Under this arrangement, the Portfolio directs certain trades to SSGM in return for a recapture credit. SSGM issues a cash rebate to the Portfolio. Amounts paid to the Portfolio are shown separately as broker commission recapture on the Statement of Operations of the Portfolio. Additionally, these amounts have been excluded from the calculation of the net ratio of expenses to average net assets presented in the Financial Highlights for each share class.
Repurchase Agreements - The Portfolio may enter into repurchase agreements, under the terms of a Master Repurchase Agreement (“MRA”), with selected commercial banks and broker-dealers, under which the Portfolio acquires securities as collateral and agrees to resell the securities at an agreed-upon time and at an agreed-upon price. The Portfolio, through the custodian or a subcustodian, under a tri-party repurchase agreement, receives delivery of the underlying securities collateralizing any repurchase agreements. It is the Portfolio’s policy that the market value of the collateral be equal to at least 100% of the repurchase price in the case of a repurchase agreement of one-day duration and equal to at least 102% of the repurchase price in the case of all other repurchase agreements. In the event of default or failure by a party to perform an obligation in connection with any repurchase transaction, the MRA gives the non-defaulting party the right to set-off claims and to apply property held by it in connection with any repurchase transaction against obligations owed to it.
At June 30, 2016, the Portfolio had investments in repurchase agreements with a gross value of $11,993,904, which is included as part of investments at value on the Statement of Assets and Liabilities. The value of the related collateral exceeded the value of the repurchase agreements at June 30, 2016.
Securities Lending - The Portfolio may lend its portfolio securities to certain qualified brokers who borrow securities in order to complete certain securities transactions. By lending its portfolio securities, the Portfolio attempts to increase its net investment income through the receipt of income on collateral held from securities on loan. Any gain or loss in the market price of the loaned securities that might occur and any interest earned or dividends declared during the term of the loan would accrue to the account of the Portfolio.
The Trust has entered into a Securities Lending Authorization Agreement with the custodian as the lending agent. Under this agreement, the custodian is authorized to loan portfolio securities on the Portfolio’s behalf. In exchange, the Portfolio receives either cash or securities as collateral against the loaned securities. The Portfolio receives collateral equal to at least 102% of the market value of the loaned securities (105% for foreign equity securities), at each loan’s inception. Collateral representing at least 100% of the market value of the loaned securities must be maintained for the duration of the loan. Cash collateral is generally invested in the State Street Navigator Securities Lending MET Portfolio (the “Navigator Portfolio”), a series of the State Street Navigator Securities Lending Trust that is managed by an affiliate of the custodian. The Navigator Portfolio is a registered money market fund that invests in a variety of high-quality, U.S. dollar-denominated instruments. If the market value of the collateral at the close of trading on a business day is less than 100% of the market value of the loaned securities at the close of trading on that day, the borrower shall be required to deliver, by the close of business on the following business day, an additional amount of collateral, so that the total amount of posted collateral is equal to at least 100% of the market value of all the loaned securities as of such preceding day. A portion of net income (income after the deduction of expenses and fees of the Navigator Portfolio) on the collateral is rebated to the borrower of the securities and the remainder is split between the custodian and the Portfolio. On loans collateralized by U.S. Treasuries, a fee is received from the borrower and is allocated between the Portfolio and the custodian. Income received by the Portfolio in securities lending transactions during the six months ended June 30, 2016 is reflected as Securities lending income on the Statement of Operations. The values of any securities loaned by the Portfolio and the related collateral at June 30, 2016 are disclosed in the footnotes to the Schedule of Investments. The value of the related collateral received by the Portfolio exceeded the value of the securities out on loan at June 30, 2016.
The risks associated with lending portfolio securities include, but are not limited to, possible delays in receiving additional collateral or in the recovery of the loaned securities, possible loss of rights in the collateral should the borrower fail financially, as well as risk of loss in the value of the collateral or the value of the investments made with the collateral. The lending agent shall indemnify the Portfolio in the case of default of any securities borrower.
All securities on loan are classified as Common Stocks in the Portfolio’s Schedule of Investments as of June 30, 2016, with a contractual maturity of overnight and continuous.
3. Certain Risks
In the normal course of business, the Portfolio invests in securities and enters into transactions where risks exist due to fluctuations in the market (“market risk”) or failure of the other party to a transaction to perform (“credit and counterparty risk”).
Market Risk: The value of securities held by the Portfolio may decline in response to certain events, including those directly involving the companies whose securities are owned by the Portfolio; conditions affecting the general economy; overall market changes; local, regional or global political, social or economic instability; and currency, interest rate, and price fluctuations.
MSF-13
Metropolitan Series Fund
Frontier Mid Cap Growth Portfolio
Notes to Financial Statements—June 30, 2016—(Continued)
Credit and Counterparty Risk: The Portfolio may be exposed to counterparty risk, or the risk that an entity with which the Portfolio has unsettled or open transactions may default. The potential loss could exceed the value of the financial assets and liabilities recorded in the financial statements. Financial assets that potentially expose the Portfolio to credit and counterparty risk consist principally of cash due from counterparties and investments. The Portfolio manages counterparty risk by entering into agreements only with counterparties that it believes have the financial resources to honor their obligations and by monitoring the financial stability of those counterparties. The Portfolio’s investment adviser attempts to mitigate counterparty risk by (i) periodically assessing the creditworthiness of its trading partners, (ii) monitoring and/or limiting the amount of its net exposure to each individual counterparty based on its assessment, and (iii) requiring collateral from the counterparty for certain transactions. In order to preserve certain safeguards for non-standard settlement trades, the Portfolio restricts its exposure to credit and counterparty losses by entering into master netting agreements (“Master Agreements”) with counterparties (approved brokers) with whom it undertakes a significant volume of transactions. Master Agreements govern the terms of certain transactions, and reduce the counterparty risk associated with relevant transactions by specifying credit protection mechanisms and providing standardization that improves legal certainty. Master Agreements can also help limit counterparty risk by specifying collateral posting arrangements at pre-arranged exposure levels.
Repurchase and reverse repurchase agreements are primarily executed under Global Master Repurchase Agreements (“GMRAs”) or Master Repurchase Agreements (“MRAs”), which provide the rights to set-off. Each repurchase and reverse repurchase agreement is initially collateralized at the transaction level. In the event of default, the total market value exposure will be offset against collateral exchanged to date, which would result in a net receivable/(payable) that would be due from/to the counterparty.
Additional risks associated with each type of investment are described above within the respective security type notes. The Portfolio’s prospectus includes a discussion of the principal risks of investing in the Portfolio.
4. Investment Transactions
Aggregate cost of purchases and proceeds of sales of investment securities, excluding short-term securities, for the six months ended June 30, 2016 were as follows:
| | | | | | | | | | | | |
Purchases | | | Sales | |
U.S. Government | | Non U.S. Government | | | U.S. Government | | | Non U.S. Government | |
| $0 | | $ | 187,462,555 | | | $ | 0 | | | $ | 221,488,019 | |
5. Investment Management Fees and Other Transactions with Affiliates
Investment Management Agreement - MetLife Advisers is the investment adviser to the Portfolio. The Trust has entered into an investment management agreement with MetLife Advisers with respect to the Portfolio. For providing investment management services to the Portfolio, MetLife Advisers receives monthly compensation at the following annual rates:
| | | | | | |
Management
Fees earned by MetLife Advisers
for the six months ended
June 30, 2016 | | % per annum | | | Average daily net assets |
| $3,925,689 | | | 0.750 | % | | Of the first $500 million |
| | | 0.700 | % | | Of the next $500 million |
| | | 0.650 | % | | On amounts in excess of $1 billion |
MetLife Advisers has entered into an investment subadvisory agreement with respect to managing the Portfolio. Frontier Capital Management Company, LLC is compensated by MetLife Advisers to provide subadvisory services for the Portfolio.
Management Fee Waiver - Pursuant to a management fee waiver agreement, the Adviser has agreed, for the period May 1, 2016 to April 30, 2017, to reduce its advisory fees set out above under “Investment Management Agreement” for each class of the Portfolio as follows:
| | |
% per annum reduction | | Average Daily Net Assets |
| 0.050% | | On the first $500 million |
| 0.025% | | Over $850 million and less than $1 billion |
| (0.025)% | | On the next $250 million |
An identical agreement was in place for the period January 1, 2016 to April 30, 2016.
MSF-14
Metropolitan Series Fund
Frontier Mid Cap Growth Portfolio
Notes to Financial Statements—June 30, 2016—(Continued)
Amounts waived for the six months ended June 30, 2016 are shown as a management fee waiver in the Statement of Operations.
Certain officers and trustees of the Trust may also be officers of MetLife Advisers; however, such officers and trustees receive no compensation from the Trust.
On January 12, 2016, MetLife, Inc. announced its plan to pursue the separation of a substantial portion of its retail segment and is currently evaluating structural alternatives for such separation. It is anticipated that MetLife Advisers would be included in any such separation. Any separation transaction that might occur will be subject to the satisfaction of various conditions and approvals, including approval of any transaction by the MetLife, Inc. Board of Directors, satisfaction of any applicable requirements of the SEC, and receipt of insurance and other regulatory approvals and other anticipated conditions. Because the form of a separation had yet to be determined, MetLife, Inc. cannot currently provide a specific potential completion date or information about the potential impact on MetLife Advisers. No assurance can be given regarding the form that a separation transaction may take or the specific terms thereof, or that a separation will in fact occur. Depending on the form a separation takes, MetLife Advisers’ continued service as investment adviser to the Trusts could be subject to the satisfaction of various conditions and approvals, which may include obtaining approvals from the Trusts’ Board and shareholders.
Transfer Agency Agreement - MetLife serves as the transfer agent for the Trust. MetLife receives no fees for its services to the Trust under the transfer agency agreement.
Distribution and Service Fees - The Trust has a distribution agreement with MetLife Investors Distribution Company (“MIDC” or the “Distributor”) in which MIDC serves as the distributor for the Portfolio’s Class A, B, D, and E Shares. MIDC is a wholly-owned subsidiary of MetLife Investors Group, LLC, an affiliate of the Adviser. The Trust has also adopted a Distribution and Service Plan under Rule 12b-1 of the 1940 Act for the Portfolio’s Class B, D, and E Shares. Under the Distribution and Service Plan, the Class B, D, and E Shares of the Portfolio pay a fee to compensate the Insurance Companies (or their affiliates) and other broker-dealers and financial intermediaries involved in the offer and sale of Portfolio shares for promoting or selling and servicing the Class B, D, and E Shares. The fees under the Distribution and Service Plan for each class of the Portfolio’s shares are calculated as a percentage of the Portfolio’s average daily net assets that are attributable to that Class. Currently, the fee is 0.25% per year for Class B Shares, 0.10% per year for Class D Shares, and 0.15% per year for Class E Shares. Amounts incurred by the Portfolio for the six months ended June 30, 2016 are shown as Distribution and service fees in the Statement of Operations.
Deferred Trustee Compensation - Each Trustee who is not currently an employee of the Adviser or any of its affiliates receives compensation from the Trust for his or her service to the Trust. A deferred compensation plan (the “Plan”) is available to the Trustees on a voluntary basis. Deferred amounts remain in the Trust until distributed in accordance with the provisions of the Plan. The value of a participating Trustee’s deferral account is based on theoretical investments of deferred amounts on the normal payment dates in certain portfolios of the Trust or Met Investors Series Trust, an affiliate of the Trust, as designated by the participating Trustee. Changes in the value of participants’ deferral accounts are reflected as Trustees’ fees and expenses in the Statement of Operations. The portion of the accrued obligations allocated to the Portfolio under the Plan is reflected as Deferred trustees’ fees in the Statement of Assets and Liabilities.
6. Contractual Obligations
Under the Trust’s organizational documents, its officers and Trustees may be indemnified against certain liabilities and expenses arising out of the performance of their duties to the Trust. Additionally, the Trust has a variety of indemnification obligations under contracts with its service providers. The Trust’s maximum exposure under these arrangements is unknown, as this would involve future claims that may be made against the Trust that have not yet occurred.
7. Income Tax Information
The tax character of distributions paid for the years ended December 31, 2015 and 2014 were as follows:
| | | | | | | | | | | | | | | | | | | | |
Ordinary Income | | | Long-Term Capital Gain | | | Total | |
2015 | | 2014 | | | 2015 | | | 2014 | | | 2015 | | | 2014 | |
| $25,138,144 | | $ | 65,476,941 | | | $ | 136,736,489 | | | $ | 50,255,365 | | | $ | 161,874,633 | | | $ | 115,732,306 | |
As of December 31, 2015, the components of distributable earnings (accumulated losses) on a federal income tax basis were as follows:
| | | | | | | | | | | | | | | | |
Undistributed
Ordinary Income | | Undistributed
Long-Term
Capital Gain | | | Net
Unrealized
Appreciation | | | Other
Accumulated
Capital Losses | | | Total | |
| $— | | $ | 131,994,602 | | | $ | 131,828,981 | | | $ | — | | | $ | 263,823,583 | |
MSF-15
Metropolitan Series Fund
Frontier Mid Cap Growth Portfolio
Notes to Financial Statements—June 30, 2016—(Continued)
The Portfolio utilizes the provisions of the federal income tax laws that provide for the carryforward of capital losses for prior years, offsetting such losses against any future realized capital gains. Under the Regulated Investment Company Modernization Act of 2010 (the “Act”), net capital losses recognized after December 22, 2010 may be carried forward indefinitely and their character is retained as short-term and/or long-term losses. Previously, net capital losses were carried forward for up to eight years and treated as short-term losses. As a transition rule, the Act requires that post-enactment net capital losses be used before pre-enactment net capital losses.
As of December 31, 2015, the Portfolio had no post-enactment accumulated capital losses and no pre-enactment accumulated capital loss carryforwards.
MSF-16
Metropolitan Series Fund
Jennison Growth Portfolio
Managed by Jennison Associates LLC
Portfolio Manager Commentary*
PERFORMANCE
For the six month period ended June 30, 2016, the Class A, B and E shares of the Jennison Growth Portfolio returned -6.71%, -6.86%, and -6.77%, respectively. The Portfolio’s benchmark, the Russell 1000 Growth Index1, returned 1.36%.
MARKET ENVIRONMENT / CONDITIONS
Investor risk aversion in a volatile global market had a major impact on equity returns in the six-month period ended June 30, 2016. Contributors to market volatility included decelerating economic growth in China, concerns that emerging economies might face balance sheet risks, reduced energy sector activity due to lower energy prices, fears of slowing economic growth in the U.S., uncertainty about the course of future Federal Reserve monetary tightening, and the United Kingdom’s vote to leave the European Union.
During the reporting period, each of the Russell 1000 Growth benchmark’s three smallest sectors—Utilities, Energy, and Telecommunication Services—posted double-digit advances. Two of the benchmark’s largest sectors, Health Care and Information Technology, lost ground.
PORTFOLIO REVIEW / PERIOD END POSITIONING
The Portfolio underperformed its Russell 1000 Growth benchmark during the reporting period. Positions in Health Care, Information Technology, and Consumer Discretionary—sectors that contributed strongly to Portfolio outperformance in calendar year 2015—detracted from return in the period. In Health Care, Bristol-Myers Squibb advanced on the promise of its oncology active immune therapies. However, many higher-growth, and therefore higher-valuation, Health Care stocks were hurt by growing concerns about drug pricing. Companies that sell innovative, high-priced drugs sold off, among them Alexion Pharmaceuticals (blood and metabolic disorders), Regeneron Pharmaceuticals (eye diseases, high cholesterol), and Celgene (cancer and blood disorders). We believe that the long-term fundamentals of the Portfolio’s biotechnology holdings remain intact and that current valuations underestimate the potential of pipeline drugs. In addition, companies where acquired growth plays a greater role, such as Allergan, declined as regulatory changes threatened to remove many of the tax benefits of mergers between U.S. and offshore companies. We believe the proposed sale of Allergan’s generics business to Teva should result in close to $40 billion in cash, providing Allergan with significant flexibility to pursue other acquisitions (at substantially lower than peak prices), pay down debt, and repurchase stock. We trimmed holdings in Health Care in the period after having reduced them more materially in the prior six months.
In Information Technology, LinkedIn’s decline reflected signs of significant deceleration in recent high growth rates. We eliminated the position. Apple fell on a lull in major product cycles, though we maintained the position. Many other holdings in the sector made strong gains including Facebook, which rose on impressive revenue and margins, accelerating advertising revenue growth, and solid user growth and engagement. Tencent, China’s largest and most visited Internet service portal, continued to perform well, fundamentally driven by its dominant position in China’s online gaming and instant messaging markets and its growing advertising and payment service efforts.
In Consumer Discretionary, on-demand streaming media network Netflix declined even though international subscriber growth exceeded forecasts, reflecting the power of the company’s global launch and original content. We believe several factors have strengthened the company’s long-term competitive positioning, including a shift to exclusive deals and original content, increasing pricing power, international expansion, and scale advantage, which enables it to fund content costs with a global subscriber base. Amazon advanced solidly on continued strong execution, margin expansion, and growth in its Amazon Web Services cloud business. The company continues to invest to drive unit growth in its core retail business and through the proliferation of digital commerce via the mobile market.
In Energy, Concho Resources rose on a series of deals that consolidate its core acreage and shed noncore positions, improving its balance sheet and efficiency. Concho has attractive assets in the West Texas Permian Basin, one of the most prolific oil plays in the U.S. We also like the company’s management, execution, and balance sheet.
The Portfolio is constructed through individual stock selection, based on the fundamentals of individual companies. Sector weights over the course of 2016’s first six months were largely stable, with exposure to Health Care decreasing modestly and exposure to
MSF-1
Metropolitan Series Fund
Jennison Growth Portfolio
Managed by Jennison Associates LLC
Portfolio Manager Commentary*—(Continued)
Information Technology increasing slightly. Relative to the Russell 1000 Growth benchmark, the Portfolio remained overweight Information Technology and Consumer Discretionary, and underweight Industrials and Consumer Staples at period end.
Kathleen A. McCarragher
Spiros “Sig” Segalas
Michael A. Del Balso
Portfolio Managers
Jennison Associates LLC
* This commentary may include statements that constitute “forward-looking statements” under the U.S. securities laws. Forward-looking statements include, among other things, projections, estimates, and information about possible or future results related to the Portfolio, market or regulatory developments. The views expressed above are not guarantees of future performance or economic results and involve certain risks, uncertainties and assumptions that could cause actual outcomes and results to differ materially from the views expressed herein. The views expressed above are subject to change at any time based upon economic, market, or other conditions and the subadvisory firm undertakes no obligation to update the views expressed herein. Any discussions of specific securities should not be considered a recommendation to buy or sell those securities. The views expressed above (including any forward-looking statement) may not be relied upon as investment advice or as an indication of the Portfolio’s trading intent. Information about the Portfolio’s holdings, asset allocation or country diversification is historical and is not an indication of future Portfolio composition, which may vary. Direct investment in any index is not possible. The performance of any index mentioned in this commentary has not been adjusted for ongoing management, distribution and operating expenses, and sales charges applicable to mutual fund investments. In addition, the returns do not reflect additional fees charged by separate accounts or variable insurance contracts that an investor in the Portfolio may pay. If these additional fees were reflected, performance would have been lower.
MSF-2
Metropolitan Series Fund
Jennison Growth Portfolio
A $10,000 INVESTMENT COMPARED TO THE RUSSELL 1000 GROWTH INDEX
SIX MONTH RETURN & AVERAGE ANNUAL RETURNS (%) AS OF JUNE 30, 2016
| | | | | | | | | | | | | | | | |
| | | 6 Month | | | 1 Year | | | 5 Year | | | 10 Year | |
| Jennison Growth Portfolio | | | | | | | | | | | | | | | | |
Class A | | | -6.71 | | | | -4.46 | | | | 10.73 | | | | 8.13 | |
Class B | | | -6.86 | | | | -4.72 | | | | 10.44 | | | | 7.86 | |
Class E | | | -6.77 | | | | -4.58 | | | | 10.57 | | | | 7.96 | |
| Russell 1000 Growth Index | | | 1.36 | | | | 3.02 | | | | 12.34 | | | | 8.78 | |
1 The Russell 1000 Growth Index is an unmanaged measure of performance of the largest capitalized U.S. companies, within the Russell 1000 companies, that have higher price-to-book ratios and forecasted growth values.
Portfolio performance is calculated including reinvestment of all income and capital gain distributions. Performance numbers are net of all Portfolio expenses but do not include any insurance, sales, separate account or administrative charges of variable annuity or life insurance contracts or any additional expenses that participants may bear relating to the operations of their plans. If these charges were included, the returns would be lower. The performance of any index referenced above has not been adjusted for ongoing management, distribution and operating expenses, and sales charges applicable to mutual fund investments. Direct investment in any index is not possible. The performance of Class A shares, as set forth in the line graph above, will differ from that of other classes because of the difference in expenses paid by policyholders investing in the different share classes.
This information represents past performance and is not indicative of future results. Investment return and principal value may fluctuate so that shares, upon redemption, may be worth more or less than the original cost.
PORTFOLIO COMPOSITION AS OF JUNE 30, 2016
Top Holdings
| | | | |
| | | % of
Net Assets | |
| Amazon.com, Inc. | | | 5.8 | |
| Apple, Inc. | | | 4.9 | |
| Facebook, Inc. - Class A | | | 4.4 | |
| Visa, Inc. - Class A | | | 3.4 | |
| Alphabet, Inc. - Class C | | | 2.8 | |
| Alphabet, Inc. - Class A | | | 2.8 | |
| MasterCard, Inc. - Class A | | | 2.7 | |
| Tencent Holdings, Ltd. | | | 2.7 | |
| Bristol-Myers Squibb Co. | | | 2.5 | |
| Salesforce.com, Inc. | | | 2.4 | |
Top Sectors
| | | | |
| | | % of
Net Assets | |
| Information Technology | | | 40.4 | |
| Consumer Discretionary | | | 29.3 | |
| Health Care | | | 14.4 | |
| Consumer Staples | | | 4.9 | |
| Financials | | | 3.3 | |
| Industrials | | | 3.0 | |
| Energy | | | 1.8 | |
| Materials | | | 0.2 | |
MSF-3
Metropolitan Series Fund
Jennison Growth Portfolio
Understanding Your Portfolio’s Expenses (Unaudited)
Shareholder Expense Example
As a shareholder of the Portfolio, you incur ongoing costs, including management fees; distribution and service (12b-1) fees; and other Portfolio expenses. This example is intended to help you understand your ongoing costs (in dollars) (referred to as “expenses”) of investing in the Portfolio and compare these costs with the ongoing costs of investing in other mutual funds. The example is based on an investment of $1,000 invested at the beginning of the period and held for the entire period, January 1, 2016 through June 30, 2016.
Actual Expenses
The first line for each share class of the Portfolio in the table below provides information about actual account values and actual expenses. You may use the information in this line, together with the amount you invested in the particular share class of the Portfolio, to estimate the expenses that you paid over the period. Simply divide your account value by $1,000 (for example, an $8,600 account value divided by $1,000 = 8.6), then multiply the result by the number in the first line under the heading entitled “Expenses Paid During Period” to estimate the expenses you paid on your account during this period.
Hypothetical Example for Comparison Purposes
The second line for each share class of the Portfolio in the table below provides information about hypothetical account values and hypothetical expenses based on the Portfolio’s actual expense ratio and an assumed rate of return of 5% per year before expenses, which is not the Portfolio’s actual return. The hypothetical account values and expenses may not be used to estimate the actual ending account balance or expenses you paid for the period. You may use this information to compare the ongoing costs of investing in the Portfolio and other funds. To do so, compare this 5% hypothetical example with the 5% hypothetical examples that appear in the shareholder reports of the other funds.
Please note that the expenses shown in the table are meant to highlight your ongoing costs only and do not reflect any fees or charges of your variable insurance product or any additional expenses that participants in certain eligible qualified plans may bear relating to the operations of their plan. Therefore, the second line for each share class in the table is useful in comparing ongoing costs only, and will not help you determine the relative total costs of owning different funds. In addition, if these other costs were included, your costs would have been higher.
| | | | | | | | | | | | | | | | | | |
Jennison Growth Portfolio | | | | Annualized
Expense
Ratio | | | Beginning
Account Value
January 1,
2016 | | | Ending
Account Value
June 30,
2016 | | | Expenses Paid
During Period**
January 1, 2016
to
June 30,
2016 | |
Class A(a) | | Actual | | | 0.55 | % | | $ | 1,000.00 | | | $ | 932.90 | | | $ | 2.64 | |
| | Hypothetical* | | | 0.55 | % | | $ | 1,000.00 | | | $ | 1,022.13 | | | $ | 2.77 | |
| | | | | |
Class B(a) | | Actual | | | 0.80 | % | | $ | 1,000.00 | | | $ | 931.40 | | | $ | 3.84 | |
| | Hypothetical* | | | 0.80 | % | | $ | 1,000.00 | | | $ | 1,020.89 | | | $ | 4.02 | |
| | | | | |
Class E(a) | | Actual | | | 0.70 | % | | $ | 1,000.00 | | | $ | 932.30 | | | $ | 3.36 | |
| | Hypothetical* | | | 0.70 | % | | $ | 1,000.00 | | | $ | 1,021.38 | | | $ | 3.52 | |
* Hypothetical assumes a rate of return of 5% per year before expenses.
** Expenses paid are equal to the Portfolio’s annualized expense ratio for the most recent six month period, as shown above, multiplied by the average account value over the period, multiplied by the number of days (182 days) in the most recent fiscal half-year, divided by 366 (to reflect the one-half year period).
(a) The annualized expense ratio shown reflects the impact of the management fee waiver as described in Note 5 of the Notes to Financial Statements.
MSF-4
Metropolitan Series Fund
Jennison Growth Portfolio
Schedule of Investments as of June 30, 2016 (Unaudited)
Common Stocks—97.3% of Net Assets
| | | | | | | | |
| Security Description | | Shares | | | Value | |
| | |
Aerospace & Defense—1.8% | | | | | | | | |
Boeing Co. (The) (a) | | | 363,717 | | | $ | 47,235,927 | |
| | | | | | | | |
| | |
Automobiles—1.2% | | | | | | | | |
Tesla Motors, Inc. (a) (b) | | | 145,998 | | | | 30,992,455 | |
| | | | | | | | |
| | |
Beverages—1.7% | | | | | | | | |
Constellation Brands, Inc. - Class A | | | 84,769 | | | | 14,020,792 | |
Monster Beverage Corp. (b) | | | 176,090 | | | | 28,299,424 | |
| | | | | | | | |
| | | | | | | 42,320,216 | |
| | | | | | | | |
| | |
Biotechnology—7.7% | | | | | | | | |
Alexion Pharmaceuticals, Inc. (b) | | | 266,232 | | | | 31,085,248 | |
Biogen, Inc. (b) | | | 72,528 | | | | 17,538,721 | |
BioMarin Pharmaceutical, Inc. (b) | | | 134,368 | | | | 10,453,830 | |
Celgene Corp. (b) | | | 501,685 | | | | 49,481,192 | |
Regeneron Pharmaceuticals, Inc. (b) | | | 75,621 | | | | 26,409,122 | |
Shire plc (ADR) | | | 277,012 | | | | 50,992,369 | |
Vertex Pharmaceuticals, Inc. (b) | | | 138,025 | | | | 11,872,910 | |
| | | | | | | | |
| | | | | | | 197,833,392 | |
| | | | | | | | |
| | |
Capital Markets—0.8% | | | | | | | | |
Morgan Stanley | | | 777,663 | | | | 20,203,685 | |
| | | | | | | | |
| | |
Chemicals—0.2% | | | | | | | | |
Albemarle Corp. | | | 57,151 | | | | 4,532,646 | |
| | | | | | | | |
| | |
Communications Equipment—0.8% | | | | | | | | |
Palo Alto Networks, Inc. (a) (b) | | | 168,081 | | | | 20,613,454 | |
| | | | | | | | |
| | |
Diversified Financial Services—1.1% | | | | | | | | |
S&P Global, Inc. | | | 270,481 | | | | 29,011,792 | |
| | | | | | | | |
| | |
Energy Equipment & Services—0.6% | | | | | | | | |
Halliburton Co. | | | 49,244 | | | | 2,230,261 | |
Schlumberger, Ltd. | | | 163,776 | | | | 12,951,406 | |
| | | | | | | | |
| | | | | | | 15,181,667 | |
| | | | | | | | |
| | |
Food & Staples Retailing—3.2% | | | | | | | | |
Costco Wholesale Corp. | | | 278,178 | | | | 43,685,073 | |
Kroger Co. (The) | | | 1,064,950 | | | | 39,179,511 | |
| | | | | | | | |
| | | | | | | 82,864,584 | |
| | | | | | | | |
| | |
Hotels, Restaurants & Leisure—4.5% | | | | | | | | |
Marriott International, Inc. - Class A (a) | | | 651,824 | | | | 43,320,223 | |
McDonald’s Corp. | | | 252,298 | | | | 30,361,541 | |
Starbucks Corp. | | | 729,528 | | | | 41,670,640 | |
| | | | | | | | |
| | | | | | | 115,352,404 | |
| | | | | | | | |
| | |
Industrial Conglomerates—1.2% | | | | | | | | |
General Electric Co. | | | 979,841 | | | | 30,845,395 | |
| | | | | | | | |
| | |
Internet & Catalog Retail—9.5% | | | | | | | | |
Amazon.com, Inc. (b) | | | 208,606 | | | | 149,282,626 | |
Netflix, Inc. (a) (b) | | | 515,801 | | | | 47,185,475 | |
Priceline Group, Inc. (The) (b) | | | 36,551 | | | | 45,630,634 | |
| | | | | | | | |
| | | | | | | 242,098,735 | |
| | | | | | | | |
| | |
Internet Software & Services—14.7% | | | | | | | | |
Alibaba Group Holding, Ltd. (ADR) (a) (b) | | | 671,344 | | | | 53,391,988 | |
Alphabet, Inc. - Class A (b) | | | 100,578 | | | | 70,759,640 | |
Alphabet, Inc. - Class C (b) | | | 102,460 | | | | 70,912,566 | |
Facebook, Inc. - Class A (b) | | | 984,611 | | | | 112,521,345 | |
Tencent Holdings, Ltd. | | | 2,974,550 | | | | 67,842,291 | |
| | | | | | | | |
| | | | | | | 375,427,830 | |
| | | | | | | | |
| | |
IT Services—6.0% | | | | | | | | |
MasterCard, Inc. - Class A | | | 773,376 | | | | 68,103,491 | |
Visa, Inc. - Class A (a) | | | 1,158,702 | | | | 85,940,927 | |
| | | | | | | | |
| | | | | | | 154,044,418 | |
| | | | | | | | |
| | |
Life Sciences Tools & Services—0.8% | | | | | | | | |
Illumina, Inc. (b) | | | 147,495 | | | | 20,705,348 | |
| | | | | | | | |
| | |
Media—2.9% | | | | | | | | |
Time Warner, Inc. | | | 386,885 | | | | 28,451,523 | |
Walt Disney Co. (The) | | | 457,566 | | | | 44,759,106 | |
| | | | | | | | |
| | | | | | | 73,210,629 | |
| | | | | | | | |
| | |
Oil, Gas & Consumable Fuels—1.2% | | | | | | | | |
Concho Resources, Inc. (a) (b) | | | 155,760 | | | | 18,577,495 | |
EOG Resources, Inc. | | | 140,585 | | | | 11,727,601 | |
| | | | | | | | |
| | | | | | | 30,305,096 | |
| | | | | | | | |
| | |
Pharmaceuticals—5.8% | | | | | | | | |
Allergan plc (b) | | | 190,926 | | | | 44,121,089 | |
Bristol-Myers Squibb Co. | | | 879,374 | | | | 64,677,958 | |
Novo Nordisk A/S (ADR) | | | 743,245 | | | | 39,971,716 | |
| | | | | | | | |
| | | | | | | 148,770,763 | |
| | | | | | | | |
| | |
Real Estate Investment Trusts—1.4% | | | | | | | | |
American Tower Corp. | | | 310,015 | | | | 35,220,804 | |
| | | | | | | | |
|
Semiconductors & Semiconductor Equipment—3.4% | |
ARM Holdings plc (ADR) (a) | | | 559,515 | | | | 25,463,528 | |
NVIDIA Corp. (a) | | | 366,683 | | | | 17,237,768 | |
NXP Semiconductors NV (b) | | | 369,324 | | | | 28,932,842 | |
QUALCOMM, Inc. | | | 285,873 | | | | 15,314,216 | |
| | | | | | | | |
| | | | | | | 86,948,354 | |
| | | | | | | | |
| | |
Software—10.6% | | | | | | | | |
Adobe Systems, Inc. (b) | | | 628,253 | | | | 60,180,355 | |
Microsoft Corp. | | | 1,080,445 | | | | 55,286,371 | |
Red Hat, Inc. (b) | | | 554,404 | | | | 40,249,730 | |
Salesforce.com, Inc. (b) | | | 774,330 | | | | 61,489,545 | |
Splunk, Inc. (a) (b) | | | 462,253 | | | | 25,044,868 | |
Workday, Inc. - Class A (a) (b) | | | 391,706 | | | | 29,248,687 | |
| | | | | | | | |
| | | | | | | 271,499,556 | |
| | | | | | | | |
| | |
Specialty Retail—7.4% | | | | | | | | |
Home Depot, Inc. (The) | | | 302,589 | | | | 38,637,589 | |
Industria de Diseno Textil S.A. | | | 1,768,566 | | | | 58,977,185 | |
O’Reilly Automotive, Inc. (b) | | | 194,273 | | | | 52,667,410 | |
TJX Cos., Inc. (The) | | | 490,341 | | | | 37,869,036 | |
| | | | | | | | |
| | | | | | | 188,151,220 | |
| | | | | | | | |
See accompanying notes to financial statements.
MSF-5
Metropolitan Series Fund
Jennison Growth Portfolio
Schedule of Investments as of June 30, 2016 (Unaudited)
Common Stocks—(Continued)
| | | | | | | | |
| Security Description | | Shares/
Principal
Amount* | | | Value | |
|
Technology Hardware, Storage & Peripherals—4.9% | |
Apple, Inc. | | | 1,299,293 | | | $ | 124,212,411 | |
| | | | | | | | |
|
Textiles, Apparel & Luxury Goods—3.9% | |
adidas AG | | | 145,420 | | | | 20,737,571 | |
lululemon athletica, Inc. (b) | | | 271,047 | | | | 20,019,531 | |
NIKE, Inc. - Class B | | | 1,088,175 | | | | 60,067,260 | |
| | | | | | | | |
| | | | | | | 100,824,362 | |
| | | | | | | | |
Total Common Stocks
(Cost $1,868,468,320) | | | | | | | 2,488,407,143 | |
| | | | | | | | |
|
| Short-Term Investments—10.9% | |
| | |
Mutual Fund—8.7% | | | | | | | | |
State Street Navigator Securities Lending MET Portfolio (c) | | | 221,767,227 | | | | 221,767,227 | |
| | | | | | | | |
| | |
Repurchase Agreement—2.2% | | | | | | | | |
Fixed Income Clearing Corp. Repurchase Agreement dated 06/30/16 at 0.030% to be repurchased at $55,749,385 on 07/01/16, collateralized by $55,145,000 U.S. Treasury Note at 1.750% due 12/31/20 with a value of $56,868,281. | | | 55,749,339 | | | | 55,749,339 | |
| | | | | | | | |
Total Short-Term Investments
(Cost $277,516,566) | | | | | | | 277,516,566 | |
| | | | | | | | |
Total Investments—108.2%
(Cost $2,145,984,886) (d) | | | | | | | 2,765,923,709 | |
Other assets and liabilities (net)—(8.2)% | | | | | | | (209,689,325 | ) |
| | | | | | | | |
| Net Assets—100.0% | | | | | | $ | 2,556,234,384 | |
| | | | | | | | |
| * | Principal amount stated in U.S. dollars unless otherwise noted. |
| (a) | All or a portion of the security was held on loan. As of June 30, 2016, the market value of securities loaned was $319,696,215 and the collateral received consisted of cash in the amount of $221,767,227 and non-cash collateral with a value of $105,256,098. The cash collateral is invested in a money market fund managed by an affiliate of the custodian. The non-cash collateral received consists primarily of government securities and bank letters of credit, and is held for the benefit of the Portfolio at the Portfolio’s custodian. The Portfolio cannot repledge or resell this collateral. As such, this collateral is excluded from the Statement of Assets and Liabilities. |
| (b) | Non-income producing security. |
| (c) | Represents investment of cash collateral received from securities on loan as of June 30, 2016. |
| (d) | As of June 30, 2016, the aggregate cost of investments was $2,145,984,886. The aggregate unrealized appreciation and depreciation of investments were $683,201,146 and $(63,262,323), respectively, resulting in net unrealized appreciation of $619,938,823. |
| (ADR)— | An American Depositary Receipt is a certificate issued by a custodian bank representing the right to receive securities of the foreign issuer described. Trading on exchanges not located in the United States or Canada significantly influences the value of ADRs. |
See accompanying notes to financial statements.
MSF-6
Metropolitan Series Fund
Jennison Growth Portfolio
Schedule of Investments as of June 30, 2016 (Unaudited)
Fair Value Hierarchy
Accounting principles generally accepted in the United States of America (“GAAP”) define fair market value as the price that the Portfolio would receive to sell an asset or pay to transfer a liability in an orderly transaction between market participants at the measurement date. It establishes a fair value hierarchy that prioritizes inputs to valuation methods and requires disclosure of the fair value hierarchy, separately for each major category of assets and liabilities, that segregates fair value measurements into three levels. Levels 1, 2 and 3 of the fair value hierarchy are defined as follows:
Level 1 - unadjusted quoted prices in active markets for identical investments
Level 2 - other significant observable inputs (including, but not limited to, quoted prices for similar assets or liabilities in markets that are either active or inactive; inputs other than quoted prices that are observable such as interest rates, yield curves, volatilities, prepayment speeds, loss severities, credit risks, default rates, or other market corroborated inputs)
Level 3 - significant unobservable inputs based on the best information available in the circumstances, to the extent observable inputs are unavailable (including the Portfolio’s own assumptions used in determining the fair value of investments and derivative financial instruments)
The inputs or methodologies used for valuing investments are not necessarily an indication of the risk associated with investing in them. Changes to the inputs or methodologies used may result in transfers between levels, which will be recognized as of the beginning of the reporting period. Information on transfers between Level 1 and Level 2, if any, will be disclosed following the fair value hierarchy table below. A reconciliation of Level 3 securities, if any, will also be disclosed following the fair value hierarchy table. For more information about the Portfolio’s policy regarding the valuation of investments, please refer to the Notes to Financial Statements.
The following table summarizes the fair value hierarchy of the Portfolio’s investments as of June 30, 2016:
| | | | | | | | | | | | | | | | |
| Description | | Level 1 | | | Level 2 | | | Level 3 | | | Total | |
| Common Stocks | | | | | | | | | | | | | | | | |
Aerospace & Defense | | $ | 47,235,927 | | | $ | — | | | $ | — | | | $ | 47,235,927 | |
Automobiles | | | 30,992,455 | | | | — | | | | — | | | | 30,992,455 | |
Beverages | | | 42,320,216 | | | | — | | | | — | | | | 42,320,216 | |
Biotechnology | | | 197,833,392 | | | | — | | | | — | | | | 197,833,392 | |
Capital Markets | | | 20,203,685 | | | | — | | | | — | | | | 20,203,685 | |
Chemicals | | | 4,532,646 | | | | — | | | | — | | | | 4,532,646 | |
Communications Equipment | | | 20,613,454 | | | | — | | | | — | | | | 20,613,454 | |
Diversified Financial Services | | | 29,011,792 | | | | — | | | | — | | | | 29,011,792 | |
Energy Equipment & Services | | | 15,181,667 | | | | — | | | | — | | | | 15,181,667 | |
Food & Staples Retailing | | | 82,864,584 | | | | — | | | | — | | | | 82,864,584 | |
Hotels, Restaurants & Leisure | | | 115,352,404 | | | | — | | | | — | | | | 115,352,404 | |
Industrial Conglomerates | | | 30,845,395 | | | | — | | | | — | | | | 30,845,395 | |
Internet & Catalog Retail | | | 242,098,735 | | | | — | | | | — | | | | 242,098,735 | |
Internet Software & Services | | | 307,585,539 | | | | 67,842,291 | | | | — | | | | 375,427,830 | |
IT Services | | | 154,044,418 | | | | — | | | | — | | | | 154,044,418 | |
Life Sciences Tools & Services | | | 20,705,348 | | | | — | | | | — | | | | 20,705,348 | |
Media | | | 73,210,629 | | | | — | | | | — | | | | 73,210,629 | |
Oil, Gas & Consumable Fuels | | | 30,305,096 | | | | — | | | | — | | | | 30,305,096 | |
Pharmaceuticals | | | 148,770,763 | | | | — | | | | — | | | | 148,770,763 | |
Real Estate Investment Trusts | | | 35,220,804 | | | | — | | | | — | | | | 35,220,804 | |
Semiconductors & Semiconductor Equipment | | | 86,948,354 | | | | — | | | | — | | | | 86,948,354 | |
Software | | | 271,499,556 | | | | — | | | | — | | | | 271,499,556 | |
Specialty Retail | | | 129,174,035 | | | | 58,977,185 | | | | — | | | | 188,151,220 | |
Technology Hardware, Storage & Peripherals | | | 124,212,411 | | | | — | | | | — | | | | 124,212,411 | |
Textiles, Apparel & Luxury Goods | | | 80,086,791 | | | | 20,737,571 | | | | — | | | | 100,824,362 | |
Total Common Stocks | | | 2,340,850,096 | | | | 147,557,047 | | | | — | | | | 2,488,407,143 | |
| Short-Term Investments | | | | | | | | | | | | | | | | |
Mutual Fund | | | 221,767,227 | | | | — | | | | — | | | | 221,767,227 | |
Repurchase Agreement | | | — | | | | 55,749,339 | | | | — | | | | 55,749,339 | |
Total Short-Term Investments | | | 221,767,227 | | | | 55,749,339 | | | | — | | | | 277,516,566 | |
Total Investments | | $ | 2,562,617,323 | | | $ | 203,306,386 | | | $ | — | | | $ | 2,765,923,709 | |
| | | | | | | | | | | | | | | | | |
Collateral for Securities Loaned (Liability) | | $ | — | | | $ | (221,767,227 | ) | | $ | — | | | $ | (221,767,227 | ) |
See accompanying notes to financial statements.
MSF-7
Metropolitan Series Fund
Jennison Growth Portfolio
Statement of Assets and Liabilities
June 30, 2016 (Unaudited)
| | | | |
Assets | | | | |
Investments at value (a) (b) | | $ | 2,765,923,709 | |
Receivable for: | | | | |
Investments sold | | | 23,551,177 | |
Fund shares sold | | | 342,096 | |
Dividends and interest | | | 1,123,905 | |
Prepaid expenses | | | 16,634 | |
| | | | |
Total Assets | | | 2,790,957,521 | |
Liabilities | | | | |
Collateral for securities loaned | | | 221,767,227 | |
Payables for: | | | | |
Investments purchased | | | 10,657,261 | |
Fund shares redeemed | | | 607,753 | |
Accrued Expenses: | | | | |
Management fees | | | 1,113,608 | |
Distribution and service fees | | | 162,452 | |
Deferred trustees’ fees | | | 132,807 | |
Other expenses | | | 282,029 | |
| | | | |
Total Liabilities | | | 234,723,137 | |
| | | | |
Net Assets | | $ | 2,556,234,384 | |
| | | | |
Net Assets Consist of: | | | | |
Paid in surplus | | $ | 1,872,831,401 | |
Undistributed net investment income | | | 3,728,151 | |
Accumulated net realized gain | | | 59,729,477 | |
Unrealized appreciation on investments and foreign currency transactions | | | 619,945,355 | |
| | | | |
Net Assets | | $ | 2,556,234,384 | |
| | | | |
Net Assets | | | | |
Class A | | $ | 1,765,246,669 | |
Class B | | | 780,173,497 | |
Class E | | | 10,814,218 | |
Capital Shares Outstanding* | | | | |
Class A | | | 143,026,855 | |
Class B | | | 64,035,844 | |
Class E | | | 880,682 | |
Net Asset Value, Offering Price and Redemption Price Per Share | | | | |
Class A | | $ | 12.34 | |
Class B | | | 12.18 | |
Class E | | | 12.28 | |
| * | The Portfolio is authorized to issue an unlimited number of shares. |
| (a) | Identified cost of investments was $2,145,984,886. |
| (b) | Includes securities loaned at value of $319,696,215. |
Statement of Operations
Six Months Ended June 30, 2016 (Unaudited)
| | | | |
Investment Income | | | | |
Dividends (a) | | $ | 11,020,512 | |
Interest | | | 2,125 | |
Securities lending income | | | 867,920 | |
| | | | |
Total investment income | | | 11,890,557 | |
Expenses | | | | |
Management fees | | | 7,652,156 | |
Administration fees | | | 32,119 | |
Custodian and accounting fees | | | 90,498 | |
Distribution and service fees—Class B | | | 983,273 | |
Distribution and service fees—Class E | | | 8,390 | |
Audit and tax services | | | 20,230 | |
Legal | | | 13,597 | |
Trustees’ fees and expenses | | | 15,987 | |
Shareholder reporting | | | 73,032 | |
Insurance | | | 9,312 | |
Miscellaneous | | | 13,624 | |
| | | | |
Total expenses | | | 8,912,218 | |
Less management fee waiver | | | (940,805 | ) |
Less broker commission recapture | | | (52,890 | ) |
| | | | |
Net expenses | | | 7,918,523 | |
| | | | |
Net Investment Income | | | 3,972,034 | |
| | | | |
Net Realized and Unrealized Gain (Loss) | | | | |
| Net realized gain on: | | | | |
Investments | | | 60,908,707 | |
Foreign currency transactions | | | 3,752 | |
| | | | |
Net realized gain | | | 60,912,459 | |
| | | | |
| Net change in unrealized appreciation (depreciation) on: | | | | |
Investments | | | (250,937,834 | ) |
Foreign currency transactions | | | 15,843 | |
| | | | |
Net change in unrealized depreciation | | | (250,921,991 | ) |
| | | | |
Net realized and unrealized loss | | | (190,009,532 | ) |
| | | | |
Net Decrease in Net Assets From Operations | | $ | (186,037,498 | ) |
| | | | |
| (a) | Net of foreign withholding taxes of $161,626. |
See accompanying notes to financial statements.
MSF-8
Metropolitan Series Fund
Jennison Growth Portfolio
Statements of Changes in Net Assets
| | | | | | | | |
| | | Six Months
Ended
June 30, 2016
(Unaudited) | | | Year Ended
December 31,
2015 | |
Increase (Decrease) in Net Assets: | | | | | | | | |
From Operations | | | | | | | | |
Net investment income | | $ | 3,972,034 | | | $ | 5,701,355 | |
Net realized gain | | | 60,912,459 | | | | 342,440,611 | |
Net change in unrealized depreciation | | | (250,921,991 | ) | | | (42,791,930 | ) |
| | | | | | | | |
Increase (decrease) in net assets from operations | | | (186,037,498 | ) | | | 305,350,036 | |
| | | | | | | | |
From Distributions to Shareholders | | | | | | | | |
Net investment income | | | | | | | | |
Class A | | | (5,320,506 | ) | | | (5,448,743 | ) |
Class B | | | (166,514 | ) | | | (104,756 | ) |
Class E | | | (14,444 | ) | | | (14,860 | ) |
Net realized capital gains | | | | | | | | |
Class A | | | (235,463,323 | ) | | | (300,608,310 | ) |
Class B | | | (105,625,369 | ) | | | (135,816,086 | ) |
Class E | | | (1,446,696 | ) | | | (1,834,915 | ) |
| | | | | | | | |
Total distributions | | | (348,036,852 | ) | | | (443,827,670 | ) |
| | | | | | | | |
Increase (decrease) in net assets from capital share transactions | | | 313,013,185 | | | | (50,769,618 | ) |
| | | | | | | | |
Total decrease in net assets | | | (221,061,165 | ) | | | (189,247,252 | ) |
| | |
Net Assets | | | | | | | | |
Beginning of period | | | 2,777,295,549 | | | | 2,966,542,801 | |
| | | | | | | | |
End of period | | $ | 2,556,234,384 | | | $ | 2,777,295,549 | |
| | | | | | | | |
Undistributed net investment income | | | | | | | | |
End of period | | $ | 3,728,151 | | | $ | 5,257,581 | |
| | | | | | | | |
Other Information:
Capital Shares
Transactions in capital shares were as follows:
| | | | | | | | | | | | | | | | |
| | | Six Months Ended
June 30, 2016
(Unaudited) | | | Year Ended
December 31, 2015 | |
| | | Shares | | | Value | | | Shares | | | Value | |
Class A | | | | | | | | | | | | | | | | |
Sales | | | 2,392,457 | | | $ | 33,581,778 | | | | 2,496,304 | | | $ | 39,015,071 | |
Reinvestments | | | 19,386,782 | | | | 240,783,829 | | | | 20,309,028 | | | | 306,057,053 | |
Redemptions | | | (2,756,173 | ) | | | (38,688,160 | ) | | | (24,963,162 | ) | | | (402,493,935 | ) |
| | | | | | | | | | | | | | | | |
Net increase (decrease) | | | 19,023,066 | | | $ | 235,677,447 | | | | (2,157,830 | ) | | $ | (57,421,811 | ) |
| | | | | | | | | | | | | | | | |
Class B | | | | | | | | | | | | | | | | |
Sales | | | 2,401,869 | | | $ | 32,627,436 | | | | 3,851,187 | | | $ | 59,630,822 | |
Reinvestments | | | 8,629,028 | | | | 105,791,883 | | | | 9,122,204 | | | | 135,920,842 | |
Redemptions | | | (4,432,251 | ) | | | (61,671,053 | ) | | | (12,052,008 | ) | | | (190,034,059 | ) |
| | | | | | | | | | | | | | | | |
Net increase | | | 6,598,646 | | | $ | 76,748,266 | | | | 921,383 | | | $ | 5,517,605 | |
| | | | | | | | | | | | | | | | |
Class E | | | | | | | | | | | | | | | | |
Sales | | | 79,592 | | | $ | 1,087,445 | | | | 190,203 | | | $ | 2,929,755 | |
Reinvestments | | | 118,215 | | | | 1,461,140 | | | | 123,318 | | | | 1,849,775 | |
Redemptions | | | (141,943 | ) | | | (1,961,113 | ) | | | (230,752 | ) | | | (3,644,942 | ) |
| | | | | | | | | | | | | | | | |
Net increase | | | 55,864 | | | $ | 587,472 | | | | 82,769 | | | $ | 1,134,588 | |
| | | | | | | | | | | | | | | | |
Increase (decrease) derived from capital shares transactions | | | | | | $ | 313,013,185 | | | | | | | $ | (50,769,618 | ) |
| | | | | | | | | | | | | | | | |
See accompanying notes to financial statements.
MSF-9
Metropolitan Series Fund
Jennison Growth Portfolio
Financial Highlights
| | | | | | | | | | | | | | | | | | | | | | | | |
| Selected per share data | | | | | | | | | | | | | | | | | | |
| | | Class A | |
| | | Six Months
Ended
June 30,
2016
(Unaudited) | | | Year Ended December 31, | |
| | | | 2015 | | | 2014 | | | 2013 | | | 2012 | | | 2011 | |
Net Asset Value, Beginning of Period | | $ | 15.30 | | | $ | 16.23 | | | $ | 15.82 | | | $ | 11.73 | | | $ | 12.14 | | | $ | 12.11 | |
| | | | | | | | | | | | | | | | | | | | | | | | |
Income (Loss) from Investment Operations | | | | | | | | | | | | | | | | | | | | | | | | |
Net investment income (a) | | | 0.03 | | | | 0.04 | | | | 0.04 | | | | 0.04 | | | | 0.07 | | | | 0.03 | |
Net realized and unrealized gain (loss) on investments | | | (1.05 | ) | | | 1.67 | | | | 1.26 | | | | 4.25 | | | | 1.88 | | | | 0.03 | |
| | | | | | | | | | | | | | | | | | | | | | | | |
Total from investment operations | | | (1.02 | ) | | | 1.71 | | | | 1.30 | | | | 4.29 | | | | 1.95 | | | | 0.06 | |
| | | | | | | | | | | | | | | | | | | | | | | | |
Less Distributions | | | | | | | | | | | | | | | | | | | | | | | | |
Distributions from net investment income | | | (0.04 | ) | | | (0.05 | ) | | | (0.04 | ) | | | (0.06 | ) | | | (0.03 | ) | | | (0.03 | ) |
Distributions from net realized capital gains | | | (1.90 | ) | | | (2.59 | ) | | | (0.85 | ) | | | (0.14 | ) | | | (2.33 | ) | | | 0.00 | |
| | | | | | | | | | | | | | | | | | | | | | | | |
Total distributions | | | (1.94 | ) | | | (2.64 | ) | | | (0.89 | ) | | | (0.20 | ) | | | (2.36 | ) | | | (0.03 | ) |
| | | | | | | | | | | | | | | | | | | | | | | | |
Net Asset Value, End of Period | | $ | 12.34 | | | $ | 15.30 | | | $ | 16.23 | | | $ | 15.82 | | | $ | 11.73 | | | $ | 12.14 | |
| | | | | | | | | | | | | | | | | | | | | | | | |
Total Return (%) (b) | | | (6.71 | )(c) | | | 10.78 | | | | 9.06 | | | | 37.00 | | | | 15.78 | | | | 0.51 | |
| | | | | | |
Ratios/Supplemental Data | | | | | | | | | | | | | | | | | | | | | | | | |
Gross ratio of expenses to average net assets (%) | | | 0.62 | (d) | | | 0.62 | | | | 0.62 | | | | 0.62 | | | | 0.64 | | | | 0.64 | |
Net ratio of expenses to average net assets (%) (e) | | | 0.55 | (d) | | | 0.54 | | | | 0.54 | | | | 0.55 | | | | 0.57 | | | | 0.57 | |
Ratio of net investment income to average net assets (%) | | | 0.39 | (d) | | | 0.27 | | | | 0.26 | | | | 0.31 | | | | 0.58 | | | | 0.22 | |
Portfolio turnover rate (%) | | | 10 | (c) | | | 28 | | | | 25 | | | | 36 | | | | 41 | | | | 47 | |
Net assets, end of period (in millions) | | $ | 1,765.2 | | | $ | 1,897.1 | | | $ | 2,047.5 | | | $ | 2,332.0 | | | $ | 1,744.7 | | | $ | 997.2 | |
| |
| | | Class B | |
| | | Six Months
Ended
June 30,
2016
(Unaudited) | | | Year Ended December 31, | |
| | | | 2015 | | | 2014 | | | 2013 | | | 2012 | | | 2011 | |
Net Asset Value, Beginning of Period | | $ | 15.11 | | | $ | 16.05 | | | $ | 15.66 | | | $ | 11.61 | | | $ | 12.03 | | | $ | 12.01 | |
| | | | | | | | | | | | | | | | | | | | | | | | |
Income (Loss) from Investment Operations | | | | | | | | | | | | | | | | | | | | | | | | |
Net investment income (a) | | | 0.01 | | | | 0.00 | (f) | | | 0.00 | (f) | | | 0.01 | | | | 0.03 | | | | 0.00 | (f) |
Net realized and unrealized gain (loss) on investments | | | (1.04 | ) | | | 1.65 | | | | 1.25 | | | | 4.21 | | | | 1.88 | | | | 0.03 | |
| | | | | | | | | | | | | | | | | | | | | | | | |
Total from investment operations | | | (1.03 | ) | | | 1.65 | | | | 1.25 | | | | 4.22 | | | | 1.91 | | | | 0.03 | |
| | | | | | | | | | | | | | | | | | | | | | | | |
Less Distributions | | | | | | | | | | | | | | | | | | | | | | | | |
Distributions from net investment income | | | (0.00 | )(g) | | | (0.00 | )(g) | | | (0.01 | ) | | | (0.03 | ) | | | (0.00 | )(g) | | | (0.01 | ) |
Distributions from net realized capital gains | | | (1.90 | ) | | | (2.59 | ) | | | (0.85 | ) | | | (0.14 | ) | | | (2.33 | ) | | | 0.00 | |
| | | | | | | | | | | | | | | | | | | | | | | | |
Total distributions | | | (1.90 | ) | | | (2.59 | ) | | | (0.86 | ) | | | (0.17 | ) | | | (2.33 | ) | | | (0.01 | ) |
| | | | | | | | | | | | | | | | | | | | | | | | |
Net Asset Value, End of Period | | $ | 12.18 | | | $ | 15.11 | | | $ | 16.05 | | | $ | 15.66 | | | $ | 11.61 | | | $ | 12.03 | |
| | | | | | | | | | | | | | | | | | | | | | | | |
Total Return (%) (b) | | | (6.86 | )(c) | | | 10.54 | | | | 8.74 | | | | 36.73 | | | | 15.56 | | | | 0.22 | |
| | | | | | |
Ratios/Supplemental Data | | | | | | | | | | | | | | | | | | | | | | | | |
Gross ratio of expenses to average net assets (%) | | | 0.87 | (d) | | | 0.87 | | | | 0.87 | | | | 0.87 | | | | 0.89 | | | | 0.89 | |
Net ratio of expenses to average net assets (%) (e) | | | 0.80 | (d) | | | 0.79 | | | | 0.79 | | | | 0.80 | | | | 0.82 | | | | 0.82 | |
Ratio of net investment income to average net assets (%) | | | 0.14 | (d) | | | 0.02 | | | | 0.01 | | | | 0.06 | | | | 0.30 | | | | 0.02 | |
Portfolio turnover rate (%) | | | 10 | (c) | | | 28 | | | | 25 | | | | 36 | | | | 41 | | | | 47 | |
Net assets, end of period (in millions) | | $ | 780.2 | | | $ | 867.6 | | | $ | 907.1 | | | $ | 976.7 | | | $ | 804.2 | | | $ | 429.9 | |
Please see following page for Financial Highlights footnote legend.
See accompanying notes to financial statements.
MSF-10
Metropolitan Series Fund
Jennison Growth Portfolio
Financial Highlights
| | | | | | | | | | | | | | | | | | | | | | | | |
| Selected per share data | | | | | | | | | | | | | | | | | | |
| | | Class E | |
| | | Six Months
Ended
June 30,
2016
(Unaudited) | | | Year Ended December 31, | |
| | | | 2015 | | | 2014 | | | 2013 | | | 2012 | | | 2011 | |
Net Asset Value, Beginning of Period | | $ | 15.22 | | | $ | 16.15 | | | $ | 15.75 | | | $ | 11.67 | | | $ | 12.09 | | | $ | 12.07 | |
| | | | | | | | | | | | | | | | | | | | | | | | |
Income (Loss) from Investment Operations | | | | | | | | | | | | | | | | | | | | | | | | |
Net investment income (a) | | | 0.02 | | | | 0.02 | | | | 0.02 | | | | 0.02 | | | | 0.04 | | | | 0.01 | |
Net realized and unrealized gain (loss) on investments | | | (1.04 | ) | | | 1.66 | | | | 1.25 | | | | 4.24 | | | | 1.88 | | | | 0.03 | |
| | | | | | | | | | | | | | | | | | | | | | | | |
Total from investment operations | | | (1.02 | ) | | | 1.68 | | | | 1.27 | | | | 4.26 | | | | 1.92 | | | | 0.04 | |
| | | | | | | | | | | | | | | | | | | | | | | | |
Less Distributions | | | | | | | | | | | | | | | | | | | | | | | | |
Distributions from net investment income | | | (0.02 | ) | | | (0.02 | ) | | | (0.02 | ) | | | (0.04 | ) | | | (0.01 | ) | | | (0.02 | ) |
Distributions from net realized capital gains | | | (1.90 | ) | | | (2.59 | ) | | | (0.85 | ) | | | (0.14 | ) | | | (2.33 | ) | | | 0.00 | |
| | | | | | | | | | | | | | | | | | | | | | | | |
Total distributions | | | (1.92 | ) | | | (2.61 | ) | | | (0.87 | ) | | | (0.18 | ) | | | (2.34 | ) | | | (0.02 | ) |
| | | | | | | | | | | | | | | | | | | | | | | | |
Net Asset Value, End of Period | | $ | 12.28 | | | $ | 15.22 | | | $ | 16.15 | | | $ | 15.75 | | | $ | 11.67 | | | $ | 12.09 | |
| | | | | | | | | | | | | | | | | | | | | | | | |
Total Return (%) (b) | | | (6.77 | )(c) | | | 10.66 | | | | 8.86 | | | | 36.90 | | | | 15.58 | | | | 0.31 | |
| | | | | | |
Ratios/Supplemental Data | | | | | | | | | | | | | | | | | | | | | | | | |
Gross ratio of expenses to average net assets (%) | | | 0.77 | (d) | | | 0.77 | | | | 0.77 | | | | 0.77 | | | | 0.79 | | | | 0.79 | |
Net ratio of expenses to average net assets (%) (e) | | | 0.70 | (d) | | | 0.69 | | | | 0.69 | | | | 0.70 | | | | 0.72 | | | | 0.72 | |
Ratio of net investment income to average net assets (%) | | | 0.24 | (d) | | | 0.12 | | | | 0.11 | | | | 0.16 | | | | 0.38 | | | | 0.12 | |
Portfolio turnover rate (%) | | | 10 | (c) | | | 28 | | | | 25 | | | | 36 | | | | 41 | | | | 47 | |
Net assets, end of period (in millions) | | $ | 10.8 | | | $ | 12.6 | | | $ | 12.0 | | | $ | 12.5 | | | $ | 11.8 | | | $ | 8.9 | |
| (a) | Per share amounts based on average shares outstanding during the period. |
| (b) | Total return does not reflect any insurance, sales, separate account or administrative charges of variable annuity or life insurance contracts or any additional expenses that contract owners may bear under their variable contracts. If these charges were included, the returns would be lower. |
| (c) | Periods less than one year are not computed on an annualized basis. |
| (d) | Computed on an annualized basis. |
| (e) | Includes the effects of management fee waivers (see Note 5 of the Notes to Financial Statements). |
| (f) | Net investment income was less than $0.01. |
| (g) | Distributions from net investment income were less than $0.01. |
See accompanying notes to financial statements.
MSF-11
Metropolitan Series Fund
Jennison Growth Portfolio
Notes to Financial Statements—June 30, 2016 (Unaudited)
1. Organization
Metropolitan Series Fund (the “Trust”) is organized as a Delaware statutory trust and registered under the Investment Company Act of 1940, as amended (the “1940 Act”), as an open-end management investment company. The Trust, which is managed by MetLife Advisers, LLC (“MetLife Advisers” or the “Adviser”), an affiliate of MetLife, Inc., is currently comprised of thirty series, each of which operates as a distinct investment vehicle of the Trust. The portfolio included in this report is Jennison Growth Portfolio (the “Portfolio”), which is diversified. Shares in the Portfolio are not offered directly to the general public and are currently available only to separate accounts established by Metropolitan Life Insurance Company (“MetLife”) and other affiliated life insurance companies.
The Portfolio has registered and offers three classes of shares: Class A, B and E shares. Shares of each Class of the Portfolio represent an equal pro rata interest in the Portfolio and generally give the shareholder the same voting, dividend, liquidation, and other rights. Investment income, realized and unrealized capital gains and losses, the common expenses of the Portfolio, and certain Portfolio-level expense reductions, if any, are allocated on a pro rata basis to each Class based on the relative net assets of each Class to the net assets of the Portfolio. Each Class of shares differs in its respective distribution plan and such distribution expenses are allocated to the corresponding Class of shares.
2. Significant Accounting Policies
The preparation of financial statements in conformity with accounting principles generally accepted in the United States of America (“GAAP”) requires management to make estimates and assumptions that affect the reported amounts of assets and liabilities and disclosure of contingent assets and liabilities as of the date of the financial statements and the reported amounts of income and expenses during the reporting period. Actual results could differ from those estimates. In the preparation of these financial statements, management has evaluated events and transactions subsequent to June 30, 2016 through the date the financial statements were issued.
The Portfolio is an investment company and follows the accounting and reporting guidance of the Financial Accounting Standards Board (“FASB”) Accounting Standards Codification Topic 946—Financial Services—Investment Companies and Topic 820—Fair Value Measurement. The following is a summary of significant accounting policies consistently followed by the Portfolio in the preparation of its financial statements.
Investment Valuation and Fair Value Measurements - Domestic and foreign equity securities, such as common stock, exchange-traded funds, rights, warrants, and preferred stock, that are traded on a securities exchange on a valuation date are generally valued at their last quoted sale price or official closing price on the primary exchange for such security, or, if no sales occurred on that day, at the last reported bid price. Equity securities traded over-the-counter (“OTC”) are generally valued at the last reported bid price. In the event of a major exchange closing during the trading day, the Adviser may use other market information obtained from quotation reporting systems, established market makers, or pricing services in valuing the securities. Valuation adjustments may be applied to certain foreign equity securities that are traded solely on foreign exchanges that close before the time as of which the Portfolio determines its NAV to account for the market movement between the close of the foreign exchanges and the time as of which the Portfolio determines its NAV. The Portfolio may use a systematic fair valuation model provided by a pricing service to value securities principally traded in these foreign markets in order to adjust for possible market movements or other changes that may occur between the close of the foreign exchanges and the time as of which the Portfolio determines its NAV. Foreign equity securities valued using these valuation adjustments are generally categorized as Level 2 within the fair value hierarchy. Equity securities that are actively traded, and have no valuation adjustments applied, are categorized as Level 1 within the fair value hierarchy. Other equity securities traded on inactive markets, or valued in reference to similar instruments traded on active markets, are generally categorized as Level 2 within the fair value hierarchy.
Investments in registered open-end management investment companies are valued at reported net asset value per share on the valuation date and are categorized as Level 1 within the fair value hierarchy.
Debt securities, including corporate, convertible and municipal bonds and notes; obligations of the U.S. Treasury and U.S. government agencies; foreign sovereign issues; and non-U.S. bonds, are generally valued on the basis of evaluated or composite bid quotations obtained from independent pricing services and/or brokers and dealers selected by the Adviser (each a “pricing service”), pursuant to authorization of and subject to general oversight by the Board of Trustees of the Trust (the “Board” or “Trustees”). Such pricing services may use matrix pricing, which considers observable inputs including, among other things, issuer details, maturity dates, interest rates, yield curves, rates of prepayment, credit risks/spreads, default rates, reported trades, broker dealer quotes and quoted prices for similar assets. Short-term obligations with a remaining maturity of sixty days or less may be valued at amortized cost in the absence of market quotes, so long as the amortized cost value of such short-term debt instrument is approximately the same as the fair value of the instrument as determined without the use of amortized cost valuation. Floating rate loans are generally valued on the basis of an evaluated or composite average of aggregate bid and ask quotations supplied by brokers or dealers, as obtained from the pricing service. Securities that use similar valuation techniques and inputs as described above are generally categorized as Level 2 within the fair value hierarchy.
MSF-12
Metropolitan Series Fund
Jennison Growth Portfolio
Notes to Financial Statements—June 30, 2016—(Continued)
Options, whether on securities, indices, futures contracts, or otherwise, traded on exchanges are valued at the last sale price available as of the close of business on a valuation day or, if there is no such price available, at the last reported bid price. These types of options are categorized as Level 1 within the fair value hierarchy. Futures contracts that are traded on commodity exchanges are valued at their settlement prices established by the exchanges on which they are traded as of the close of such exchanges and are categorized as Level 1 within the fair value hierarchy.
If no current market value quotation or other observable inputs are readily available or market value quotations are deemed to be unreliable for an investment, the fair value of the investment will be determined in accordance with procedures approved by and under the general supervision of the Board. In such a circumstance, the Board will be assisted in its responsibility to determine the fair value of an investment by the Valuation Committee (“Committee”) of MetLife Advisers. The Committee provides general pricing oversight and fair value pricing determinations related to portfolio securities and meets on a regular basis to review reports relating to the valuation of the securities in the Portfolio. The Board has delegated to State Street Bank and Trust Company, the Trust’s custodian (“custodian”), the responsibility for calculating the net asset values (“NAVs”) of the Trust’s Portfolios. The Committee is responsible for overseeing the calculation of the NAVs of the Portfolios by the custodian. The Committee also periodically reviews pricing vendors, including the vendor providing fair value pricing for the Portfolio’s foreign securities, and is responsible for overseeing the correction of pricing errors and addressing other pricing issues that arise in the ordinary course of business, such as making real-time fair value determinations, as necessary.
No single standard for determining the fair value of an investment can be set forth because fair value depends upon the facts and circumstances with respect to each investment. Information relating to any relevant factors may be obtained by the Committee from any appropriate source, including the subadviser of the Portfolio, the custodian, a pricing service, market maker and/or broker for such security or the issuer. Appropriate methodologies for determining fair value under particular circumstances may include: matrix pricing, a discounted cash flow analysis, comparisons of securities with comparable characteristics, value based on multiples of earnings, discount from market price of similar marketable securities or a combination of these and other methods.
Investment Transactions and Related Investment Income - Portfolio security transactions are recorded on the trade date. Dividend income is recorded on the ex-dividend date or, for certain foreign securities, when notified. Interest income, which includes amortization of premium and accretion of discount on debt securities, is recorded on the accrual basis. Realized gains and losses on investments are determined on the identified cost basis, which is the same basis used for federal income tax purposes. Foreign income and foreign capital gains on some foreign securities may be subject to foreign taxes, which are accrued as applicable. These foreign taxes have been provided for in accordance with the Portfolio’s understanding of the applicable countries’ tax rules and rates.
Foreign Currency Translation - The books and records of the Portfolio are maintained in U.S. dollars. The values of securities, currencies, and other assets and liabilities denominated in currencies other than the U.S. dollar are translated into U.S. dollars based upon foreign exchange rates prevailing at the end of the period. Purchases and sales of investment securities, income, and expenses are translated on the respective dates of such transactions. Because the values of investment securities are translated at the foreign exchange rates prevailing at the end of the period, that portion of the results of operations arising from changes in exchange rates and that portion of the results of operations reflecting fluctuations arising from changes in market prices of the investment securities are not separated. Such fluctuations are included in the net realized and unrealized gain or loss on investments.
Net realized foreign exchange gains or losses arise from activity in forward foreign currency exchange contracts, sales of foreign currency, currency gains or losses realized between the trade and settlement dates on securities transactions, and the difference between the amounts of dividends, interest, and foreign withholding taxes recorded by the Portfolio and the U.S. dollar equivalent of the amounts actually received or paid by the Portfolio. Net unrealized foreign exchange gains and losses arise from changes in the value of assets and liabilities, other than investment securities, resulting from changes in foreign exchange rates.
Dividends and Distributions to Shareholders - The Portfolio records dividends and distributions on the ex-dividend date. Net realized gains from securities transactions (if any) are generally distributed annually to shareholders. The timing and characterization of certain income and capital gains distributions are determined in accordance with federal tax regulations that may differ from GAAP. Permanent book and tax basis differences relating to shareholder distributions will result in reclassification between under/over distributed net investment income, accumulated net realized gains/losses, and paid-in surplus. Book-tax differences are primarily due to foreign currency transactions, distribution redesignations and broker commission recapture. These adjustments have no impact on net assets or the results of operations.
Income Taxes - It is the Portfolio’s policy to comply with the requirements of the Internal Revenue Code of 1986, as amended, and regulations thereunder, applicable to regulated investment companies and to distribute, with respect to each taxable year, all of its taxable income to shareholders. Therefore, no federal income tax provision is required. The Portfolio files U.S. federal tax returns. No income tax returns are currently under examination. The Portfolio’s federal tax returns for the prior three fiscal years remain subject to examination by the Internal Revenue Service. As of June 30, 2016, the Portfolio had no uncertain tax positions that would require financial statement recognition, or de-recognition or disclosure.
MSF-13
Metropolitan Series Fund
Jennison Growth Portfolio
Notes to Financial Statements—June 30, 2016—(Continued)
Directed Brokerage Agreement - The Trust has entered into a directed brokerage arrangement with State Street Global Markets (“SSGM”). Under this arrangement, the Portfolio directs certain trades to SSGM in return for a recapture credit. SSGM issues a cash rebate to the Portfolio. Amounts paid to the Portfolio are shown separately as broker commission recapture on the Statement of Operations of the Portfolio. Additionally, these amounts have been excluded from the calculation of the net ratio of expenses to average net assets presented in the Financial Highlights for each share class.
Repurchase Agreements - The Portfolio may enter into repurchase agreements, under the terms of a Master Repurchase Agreement (“MRA”), with selected commercial banks and broker-dealers, under which the Portfolio acquires securities as collateral and agrees to resell the securities at an agreed-upon time and at an agreed-upon price. The Portfolio, through the custodian or a subcustodian, under a tri-party repurchase agreement, receives delivery of the underlying securities collateralizing any repurchase agreements. It is the Portfolio’s policy that the market value of the collateral be equal to at least 100% of the repurchase price in the case of a repurchase agreement of one-day duration and equal to at least 102% of the repurchase price in the case of all other repurchase agreements. In the event of default or failure by a party to perform an obligation in connection with any repurchase transaction, the MRA gives the non-defaulting party the right to set-off claims and to apply property held by it in connection with any repurchase transaction against obligations owed to it.
At June 30, 2016, the Portfolio had investments in repurchase agreements with a gross value of $55,749,339, which is included as part of investments at value on the Statement of Assets and Liabilities. The value of the related collateral exceeded the value of the repurchase agreements at June 30, 2016.
Securities Lending - The Portfolio may lend its portfolio securities to certain qualified brokers who borrow securities in order to complete certain securities transactions. By lending its portfolio securities, the Portfolio attempts to increase its net investment income through the receipt of income on collateral held from securities on loan. Any gain or loss in the market price of the loaned securities that might occur and any interest earned or dividends declared during the term of the loan would accrue to the account of the Portfolio.
The Trust has entered into a Securities Lending Authorization Agreement with the custodian as the lending agent. Under this agreement, the custodian is authorized to loan portfolio securities on the Portfolio’s behalf. In exchange, the Portfolio receives either cash or securities as collateral against the loaned securities. The Portfolio receives collateral equal to at least 102% of the market value of the loaned securities (105% for foreign equity securities), at each loan’s inception. Collateral representing at least 100% of the market value of the loaned securities must be maintained for the duration of the loan. Cash collateral is generally invested in the State Street Navigator Securities Lending MET Portfolio (the “Navigator Portfolio”), a series of the State Street Navigator Securities Lending Trust that is managed by an affiliate of the custodian. The Navigator Portfolio is a registered money market fund that invests in a variety of high-quality, U.S. dollar-denominated instruments. If the market value of the collateral at the close of trading on a business day is less than 100% of the market value of the loaned securities at the close of trading on that day, the borrower shall be required to deliver, by the close of business on the following business day, an additional amount of collateral, so that the total amount of posted collateral is equal to at least 100% of the market value of all the loaned securities as of such preceding day. A portion of net income (income after the deduction of expenses and fees of the Navigator Portfolio) on the collateral is rebated to the borrower of the securities and the remainder is split between the custodian and the Portfolio. On loans collateralized by U.S. Treasuries, a fee is received from the borrower and is allocated between the Portfolio and the custodian. Income received by the Portfolio in securities lending transactions during the six months ended June 30, 2016 is reflected as Securities lending income on the Statement of Operations. The values of any securities loaned by the Portfolio and the related collateral at June 30, 2016 are disclosed in the footnotes to the Schedule of Investments. The value of the related collateral received by the Portfolio exceeded the value of the securities out on loan at June 30, 2016.
The risks associated with lending portfolio securities include, but are not limited to, possible delays in receiving additional collateral or in the recovery of the loaned securities, possible loss of rights in the collateral should the borrower fail financially, as well as risk of loss in the value of the collateral or the value of the investments made with the collateral. The lending agent shall indemnify the Portfolio in the case of default of any securities borrower.
All securities on loan are classified as Common Stocks in the Portfolio’s Schedule of Investments as of June 30, 2016, with a contractual maturity of overnight and continuous.
3. Certain Risks
In the normal course of business, the Portfolio invests in securities and enters into transactions where risks exist due to fluctuations in the market (“market risk”) or failure of the other party to a transaction to perform (“credit and counterparty risk”).
Market Risk: The value of securities held by the Portfolio may decline in response to certain events, including those directly involving the companies whose securities are owned by the Portfolio; conditions affecting the general economy; overall market changes; local, regional or global political, social or economic instability; and currency, interest rate, and price fluctuations.
MSF-14
Metropolitan Series Fund
Jennison Growth Portfolio
Notes to Financial Statements—June 30, 2016—(Continued)
Credit and Counterparty Risk: The Portfolio may be exposed to counterparty risk, or the risk that an entity with which the Portfolio has unsettled or open transactions may default. The potential loss could exceed the value of the financial assets and liabilities recorded in the financial statements. Financial assets that potentially expose the Portfolio to credit and counterparty risk consist principally of cash due from counterparties and investments. The Portfolio manages counterparty risk by entering into agreements only with counterparties that it believes have the financial resources to honor their obligations and by monitoring the financial stability of those counterparties. The Portfolio’s investment adviser attempts to mitigate counterparty risk by (i) periodically assessing the creditworthiness of its trading partners, (ii) monitoring and/or limiting the amount of its net exposure to each individual counterparty based on its assessment, and (iii) requiring collateral from the counterparty for certain transactions. In order to preserve certain safeguards for non-standard settlement trades, the Portfolio restricts its exposure to credit and counterparty losses by entering into master netting agreements (“Master Agreements”) with counterparties (approved brokers) with whom it undertakes a significant volume of transactions. Master Agreements govern the terms of certain transactions, and reduce the counterparty risk associated with relevant transactions by specifying credit protection mechanisms and providing standardization that improves legal certainty. Master Agreements can also help limit counterparty risk by specifying collateral posting arrangements at pre-arranged exposure levels.
Repurchase and reverse repurchase agreements are primarily executed under Global Master Repurchase Agreements (“GMRAs”) or Master Repurchase Agreements (“MRAs”), which provide the rights to set-off. Each repurchase and reverse repurchase agreement is initially collateralized at the transaction level. In the event of default, the total market value exposure will be offset against collateral exchanged to date, which would result in a net receivable/(payable) that would be due from/to the counterparty.
Additional risks associated with each type of investment are described above within the respective security type notes. The Portfolio’s prospectus includes a discussion of the principal risks of investing in the Portfolio.
4. Investment Transactions
Aggregate cost of purchases and proceeds of sales of investment securities, excluding short-term securities, for the six months ended June 30, 2016 were as follows:
| | | | | | | | | | | | | | |
| Purchases | | | Sales | |
| U.S. Government | | | Non U.S. Government | | | U.S. Government | | | Non U.S. Government | |
| $ | 0 | | | $ | 264,744,545 | | | $ | 0 | | | $ | 347,988,866 | |
5. Investment Management Fees and Other Transactions with Affiliates
Investment Management Agreement - MetLife Advisers is the investment adviser to the Portfolio. The Trust has entered into an investment management agreement with MetLife Advisers with respect to the Portfolio. For providing investment management services to the Portfolio, MetLife Advisers receives monthly compensation at the following annual rates:
| | | | | | |
Management
Fees earned by
MetLife Advisers for
the six months ended
June 30, 2016 | | % per annum | | | Average Daily Net Assets |
| $7,652,156 | | | 0.700 | % | | Of the first $200 million |
| | | 0.650 | % | | Of the next $300 million |
| | | 0.600 | % | | Of the next $1.5 billion |
| | | 0.550 | % | | On amounts in excess of $2 billion |
MetLife Advisers has entered into an investment subadvisory agreement with respect to managing the Portfolio. Jennison Associates LLC is compensated by MetLife Advisers to provide subadvisory services for the Portfolio.
Management Fee Waivers - Pursuant to an expense agreement, MetLife Advisers has agreed, for the period May 1, 2016 to April 30, 2017, to reduce its advisory fees set out above under “Investment Management Agreement” for each class of the Portfolio as follows:
| | |
| % per annum | | Average Daily Net Assets |
| 0.050% | | Of the first $200 million |
| 0.050% | | Over $300 million and less than $1 billion |
| 0.100% | | On the next $1 billion |
| 0.080% | | On amounts in excess of $2 billion |
An identical expense agreement was in place for the period May 1, 2015 to April 30, 2016. Amounts waived for the six months ended June 30, 2016 are shown as a management fee waiver in the Statement of Operations.
MSF-15
Metropolitan Series Fund
Jennison Growth Portfolio
Notes to Financial Statements—June 30, 2016—(Continued)
Certain officers and trustees of the Trust may also be officers of MetLife Advisers; however, such officers and trustees receive no compensation from the Trust.
On January 12, 2016, MetLife, Inc. announced its plan to pursue the separation of a substantial portion of its retail segment and is currently evaluating structural alternatives for such separation. It is anticipated that MetLife Advisers would be included in any such separation. Any separation transaction that might occur will be subject to the satisfaction of various conditions and approvals, including approval of any transaction by the MetLife, Inc. Board of Directors, satisfaction of any applicable requirements of the SEC, and receipt of insurance and other regulatory approvals and other anticipated conditions. Because the form of a separation had yet to be determined, MetLife, Inc. cannot currently provide a specific potential completion date or information about the potential impact on MetLife Advisers. No assurance can be given regarding the form that a separation transaction may take or the specific terms thereof, or that a separation will in fact occur. Depending on the form a separation takes, MetLife Advisers’ continued service as investment adviser to the Trusts could be subject to the satisfaction of various conditions and approvals, which may include obtaining approvals from the Trusts’ Board and shareholders.
Transfer Agency Agreement - MetLife serves as the transfer agent for the Trust. MetLife receives no fees for its services to the Trust under the transfer agency agreement.
Distribution and Service Fees - The Trust has a distribution agreement with MetLife Investors Distribution Company (“MIDC” or the “Distributor”) in which MIDC serves as the distributor for the Portfolio’s Class A, B and E Shares. MIDC is a wholly-owned subsidiary of MetLife Investors Group, LLC, an affiliate of the Adviser. The Trust has also adopted a Distribution and Service Plan under Rule 12b-1 of the 1940 Act for the Portfolio’s Class B and E Shares. Under the Distribution and Service Plan, the Class B and E Shares of the Portfolio pay a fee to compensate the Insurance Companies (or their affiliates) and other broker-dealers and financial intermediaries involved in the offer and sale of Portfolio shares for promoting or selling and servicing the Class B and E Shares. The fees under the Distribution and Service Plan for each class of the Portfolio’s shares are calculated as a percentage of the Portfolio’s average daily net assets that are attributable to that Class. Currently, the fee is 0.25% per year for Class B Shares and 0.15% per year for Class E Shares. Amounts incurred by the Portfolio for the six months ended June 30, 2016 are shown as Distribution and service fees in the Statement of Operations.
Deferred Trustee Compensation - Each Trustee who is not currently an employee of the Adviser or any of its affiliates receives compensation from the Trust for his or her service to the Trust. A deferred compensation plan (the “Plan”) is available to the Trustees on a voluntary basis. Deferred amounts remain in the Trust until distributed in accordance with the provisions of the Plan. The value of a participating Trustee’s deferral account is based on theoretical investments of deferred amounts on the normal payment dates in certain portfolios of the Trust or Met Investors Series Trust, an affiliate of the Trust, as designated by the participating Trustee. Changes in the value of participants’ deferral accounts are reflected as Trustees’ fees and expenses in the Statement of Operations. The portion of the accrued obligations allocated to the Portfolio under the Plan is reflected as Deferred trustees’ fees in the Statement of Assets and Liabilities.
6. Contractual Obligations
Under the Trust’s organizational documents, its officers and Trustees may be indemnified against certain liabilities and expenses arising out of the performance of their duties to the Trust. Additionally, the Trust has a variety of indemnification obligations under contracts with its service providers. The Trust’s maximum exposure under these arrangements is unknown, as this would involve future claims that may be made against the Trust that have not yet occurred.
7. Income Tax Information
The tax character of distributions paid for the years ended December 31, 2015 and 2014 were as follows:
| | | | | | | | | | | | | | | | | | | | | | |
| Ordinary Income | | | Long-Term Capital Gain | | | Total | |
| 2015 | | | 2014 | | | 2015 | | | 2014 | | | 2015 | | | 2014 | |
| $ | 8,272,620 | | | $ | 6,247,925 | | | $ | 435,555,050 | | | $ | 171,974,709 | | | $ | 443,827,670 | | | $ | 178,222,634 | |
As of December 31, 2015, the components of distributable earnings (accumulated losses) on a federal income tax basis were as follows:
| | | | | | | | | | | | | | | | | | |
Undistributed
Ordinary
Income | | | Undistributed
Long-Term
Capital Gain | | | Net
Unrealized
Appreciation | | | Other
Accumulated
Capital Losses | | | Total | |
| $ | 5,392,033 | | | $ | 342,072,437 | | | $ | 870,147,316 | | | $ | — | | | $ | 1,217,611,786 | |
The Portfolio utilizes the provisions of the federal income tax laws that provide for the carryforward of capital losses for prior years, offsetting such losses against any future realized capital gains. Under the Regulated Investment Company Modernization Act of 2010
MSF-16
Metropolitan Series Fund
Jennison Growth Portfolio
Notes to Financial Statements—June 30, 2016—(Continued)
(the “Act”), net capital losses recognized after December 22, 2010 may be carried forward indefinitely and their character is retained as short-term and/or long-term losses. Previously, net capital losses were carried forward for up to eight years and treated as short-term losses. As a transition rule, the Act requires that post-enactment net capital losses be used before pre-enactment net capital losses.
As of December 31, 2015, the Portfolio had no post-enactment accumulated capital losses and no pre-enactment accumulated capital loss carryforwards.
MSF-17
Metropolitan Series Fund
Loomis Sayles Small Cap Core Portfolio
Managed By Loomis, Sayles & Company L.P.
Portfolio Manager Commentary*
PERFORMANCE
For the six month period ended June 30, 2016, the Class A, B and E shares of the Loomis Sayles Small Cap Core Portfolio returned 3.11%, 2.98%, and 3.03%, respectively. The Portfolio’s benchmark, the Russell 2000 Index1, returned 2.22%.
MARKET ENVIRONMENT / CONDITIONS
2016 began on a sour note as investors dealt with concerns over global economic trends, a potential hard landing in China, geopolitical events and collapsing commodity prices. By February 11, the S&P 500 Index had lost 10.5% and the Russell 2000 Index had declined 15.9%. After oil prices began to recover off multi-year lows and as fears about excessive tightening of monetary policy from the Federal Reserve abated, U.S. equity markets reversed course and eliminated all of their losses. Supporting factors for U.S. stocks during the period included an expected return to positive earnings growth during the second half of 2016, reduced deflation fears, and the diminishing likelihood of central bank interest rate increases in the near future. In fact, interest rates trended steadily lower during the second quarter, further supporting stock prices and highlighting the relatively attractive yields of certain equity market sectors. These factors offset various negative issues, including weaker labor data points, political uncertainty, terrorism threats, and finally, the implications of the U.K.‘s planned exit from the European Union. Small cap stocks underperformed large caps across most economic sectors, with the Russell 2000 Index advancing 2.2% and the S&P 500 Index returning 3.8%. Market leadership was pronounced, with the Utilities, Materials, Telecommunication Services, Consumer Staples and Financials sectors outperforming, and the Information Technology, Consumer Discretionary, Energy and Health Care sectors lagging. Given the composition of market leadership, small cap value outperformed small cap growth. After a protracted period of decline, a rebound in certain commodity prices drove the Materials sector’s outperformance. The remaining leading sectors represent highly defensive and more domestically-focused sectors, many of which offer higher dividend yields. Lagging sectors included the more economically-sensitive and global Consumer Discretionary and Information Technology stocks. While Energy stocks posted a strong rally in the latter half of the period after a difficult start to the year, the sector still finished the period with a negative return. The Russell 2000 Value Index gained 6.1% during the six months, while the Russell 2000 Growth Index declined 1.6%.
PORTFOLIO REVIEW / PERIOD END POSITIONING
During the period, strong stock selection more than offset slightly negative sector allocation and the Portfolio outperformed its benchmark. The Health Care sector was the top-contributing sector to relative performance, followed by the Industrials sector. Underweighting the poor-performing biotechnology industry and overweighting the outperforming Industrials sector aided results, as did stock selection in both sectors. An underweight to the Materials sector was the biggest detractor from relative performance due to strong performance in the sector’s metal & mining stocks.
The Portfolio’s top contributors were Post Holdings, MarketAxess Holdings and U.S. Silica Holdings. Post Holdings markets and sells branded and private label ready-to-eat cereals, egg products, active nutrition products and a variety of other private label food lines. The stock performed very well after the company reported strong earnings. Post Holdings also has certain defensive characteristics that are in high demand when the macroeconomic outlook is uncertain. MarketAxess Holdings, an electronic trading platform provider for fixed income markets, reported strong results. Though many fixed income markets are facing headwinds, the company’s trading volumes have increased and they continue to expand their offerings. U.S. Silica, a new addition to the Portfolio during the reporting period, is a leading supplier of raw fracturing sand to the energy industry, with significant scale advantages, a strong balance sheet and an industrial supply business that helped the company navigate through the severe energy downturn. The stock gained over 96% from February 3, 2016, through June 30, 2016, as oil and gas prices recovered and expectations for a rebound in drilling and production have increased.
The largest detractors were Signature Bank, ARRIS International and Demandware. Shares in New York-based Signature Bank declined due to asset-sensitive stocks falling out of favor and credit concerns about the company’s modest taxi medallion portfolio. That said, we believe Signature Bank continues to be a high-quality business with a high-quality management team. ARRIS International is a leading supplier of broadband customer premises equipment, broadband data over cable networks, integrated voice cable modems and cable modem termination systems (CMTS) to support voice over Internet protocol (VoIP). Despite the recent completion of a highly accretive acquisition and solid 2015 earnings, the stock declined on lower first quarter prospects and uncertainty over the spending patterns of key customers. Software company Demandware reported a mixed quarter at a time when software stocks were selling off dramatically, which exacerbated the decline in the company’s stock price. We subsequently sold the holding.
During the reporting period we added new stocks with attractive investment potential and eliminated holdings where valuation had exceeded our target levels or where fundamental trends strayed from our investment thesis. New positions included Akorn, a developer of branded and generic pharmaceuticals; Albany Molecular Research, a contract research and manufacturing organization focused on pharmaceutical and biologics; IAC/InterActiveCorp., a collection of media, e-commerce, and internet related businesses; and II-VI Incorporated, which designs, manufactures and markets optical and optoelectronic devices used in industrial lasers and fiber-optic communications. Eliminations included Jarden Corporation and Krispy Kreme Doughnuts, which were acquisition targets. Other eliminations included Fred’s, Libby, Credit Acceptance Corporation, Diodes, and RPX Corporation.
MSF-1
Metropolitan Series Fund
Loomis Sayles Small Cap Core Portfolio
Managed By Loomis, Sayles & Company L.P.
Portfolio Manager Commentary*—(Continued)
While we do not make major adjustments to the Portfolio based on near-term macroeconomic expectations, they are part of the mosaic of inputs. We also adjust position sizes to reflect our fundamental level of conviction and the risk/reward outlook. Sector weight changes during the period were modest, resulting in slight changes to the Portfolio’s positioning. As a result of individual stock selection, we reduced our weight in the Consumer Discretionary and Information Technology sectors and increased our weight to the Industrials, Consumer Staples and Energy sectors.
Market behavior in recent quarters has challenged stock selection-based portfolios such as ours, as investors react to global macro trends and events and cause dramatic shifts in market leadership. In 2015, growth stocks, biotechnology stocks, and price momentum stocks all took turns leading performance. In the first half of 2016, value stocks, high-yielding real estate investment trusts (REITs), Utilities and lower-quality basic materials companies have led performance. While such dramatic shifts may feel uncomfortable, our commitment and confidence in our investment philosophy is unwavering. Our mission and focus remains on thorough fundamental research with a long-term perspective, seeking strong and improving businesses where stock prices do not properly reflect intrinsic value.
Mark Burns
John Slavik
Joe Gatz
Jeff Schwartz
Portfolio Managers
Loomis, Sayles & Company, L.P.
* This commentary may include statements that constitute “forward-looking statements” under the U.S. securities laws. Forward-looking statements include, among other things, projections, estimates, and information about possible or future results related to the Portfolio, market or regulatory developments. The views expressed above are not guarantees of future performance or economic results and involve certain risks, uncertainties and assumptions that could cause actual outcomes and results to differ materially from the views expressed herein. The views expressed above are subject to change at any time based upon economic, market, or other conditions and the subadvisory firm undertakes no obligation to update the views expressed herein. Any discussions of specific securities should not be considered a recommendation to buy or sell those securities. The views expressed above (including any forward-looking statement) may not be relied upon as investment advice or as an indication of the Portfolio’s trading intent. Information about the Portfolio’s holdings, asset allocation or country diversification is historical and is not an indication of future Portfolio composition, which may vary. Direct investment in any index is not possible. The performance of any index mentioned in this commentary has not been adjusted for ongoing management, distribution and operating expenses, and sales charges applicable to mutual fund investments. In addition, the returns do not reflect additional fees charged by separate accounts or variable insurance contracts that an investor in the Portfolio may pay. If these additional fees were reflected, performance would have been lower.
MSF-2
Metropolitan Series Fund
Loomis Sayles Small Cap Core Portfolio
A $10,000 INVESTMENT COMPARED TO THE RUSSELL 2000 INDEX
SIX MONTH RETURN & AVERAGE ANNUAL RETURNS (%) AS OF JUNE 30, 2016
| | | | | | | | | | | | | | | | |
| | | 6 Month | | | 1 Year | | | 5 Year | | | 10 Year | |
| Loomis Sayles Small Cap Core Portfolio | | | | | | | | | | | | | | | | |
Class A | | | 3.11 | | | | -4.74 | | | | 9.19 | | | | 8.09 | |
Class B | | | 2.98 | | | | -4.98 | | | | 8.92 | | | | 7.82 | |
Class E | | | 3.03 | | | | -4.88 | | | | 9.03 | | | | 7.92 | |
| Russell 2000 Index | | | 2.22 | | | | -6.73 | | | | 8.35 | | | | 6.20 | |
1 The Russell 2000 Index is an unmanaged measure of performance of the 2,000 smallest companies in the Russell 3000 Index.
Portfolio performance is calculated including reinvestment of all income and capital gain distributions. Performance numbers are net of all Portfolio expenses but do not include any insurance, sales, separate account or administrative charges of variable annuity or life insurance contracts or any additional expenses that participants may bear relating to the operations of their plans. If these charges were included, the returns would be lower. The performance of any index referenced above has not been adjusted for ongoing management, distribution and operating expenses, and sales charges applicable to mutual fund investments. Direct investment in any index is not possible. The performance of Class A shares, as set forth in the line graph above, will differ from that of other classes because of the difference in expenses paid by policyholders investing in the different share classes.
This information represents past performance and is not indicative of future results. Investment return and principal value may fluctuate so that shares, upon redemption, may be worth more or less than the original cost.
PORTFOLIO COMPOSITION AS OF JUNE 30, 2016
Top Holdings
| | | | |
| | | % of
Net Assets | |
| Euronet Worldwide, Inc. | | | 1.1 | |
| Talmer Bancorp, Inc. - Class A | | | 1.1 | |
| Post Holdings, Inc. | | | 1.1 | |
| MarketAxess Holdings, Inc. | | | 1.0 | |
| Littelfuse, Inc. | | | 1.0 | |
| Pinnacle Financial Partners, Inc. | | | 1.0 | |
| RBC Bearings, Inc. | | | 0.9 | |
| Retail Opportunity Investments Corp. | | | 0.9 | |
| Signature Bank | | | 0.9 | |
| KAR Auction Services, Inc. | | | 0.9 | |
Top Sectors
| | | | |
| | | % of
Net Assets | |
| Financials | | | 23.5 | |
| Information Technology | | | 18.5 | |
| Industrials | | | 16.9 | |
| Consumer Discretionary | | | 16.3 | |
| Health Care | | | 11.9 | |
| Consumer Staples | | | 3.7 | |
| Energy | | | 3.4 | |
| Materials | | | 2.0 | |
| Utilities | | | 1.6 | |
| Telecommunication Services | | | 0.7 | |
MSF-3
Metropolitan Series Fund
Loomis Sayles Small Cap Core Portfolio
Understanding Your Portfolio’s Expenses (Unaudited)
Shareholder Expense Example
As a shareholder of the Portfolio, you incur ongoing costs, including management fees; distribution and service (12b-1) fees; and other Portfolio expenses. This example is intended to help you understand your ongoing costs (in dollars) (referred to as “expenses”) of investing in the Portfolio and compare these costs with the ongoing costs of investing in other mutual funds. The example is based on an investment of $1,000 invested at the beginning of the period and held for the entire period, January 1, 2016 through June 30, 2016.
Actual Expenses
The first line for each share class of the Portfolio in the table below provides information about actual account values and actual expenses. You may use the information in this line, together with the amount you invested in the particular share class of the Portfolio, to estimate the expenses that you paid over the period. Simply divide your account value by $1,000 (for example, an $8,600 account value divided by $1,000 = 8.6), then multiply the result by the number in the first line under the heading entitled “Expenses Paid During Period” to estimate the expenses you paid on your account during this period.
Hypothetical Example for Comparison Purposes
The second line for each share class of the Portfolio in the table below provides information about hypothetical account values and hypothetical expenses based on the Portfolio’s actual expense ratio and an assumed rate of return of 5% per year before expenses, which is not the Portfolio’s actual return. The hypothetical account values and expenses may not be used to estimate the actual ending account balance or expenses you paid for the period. You may use this information to compare the ongoing costs of investing in the Portfolio and other funds. To do so, compare this 5% hypothetical example with the 5% hypothetical examples that appear in the shareholder reports of the other funds.
Please note that the expenses shown in the table are meant to highlight your ongoing costs only and do not reflect any fees or charges of your variable insurance product or any additional expenses that participants in certain eligible qualified plans may bear relating to the operations of their plan. Therefore, the second line for each share class in the table is useful in comparing ongoing costs only, and will not help you determine the relative total costs of owning different funds. In addition, if these other costs were included, your costs would have been higher.
| | | | | | | | | | | | | | | | | | |
Loomis Sayles Small Cap Core Portfolio | | | | Annualized
Expense
Ratio | | | Beginning
Account Value
January 1,
2016 | | | Ending
Account Value
June 30,
2016 | | | Expenses Paid
During Period**
January 1, 2016
to
June 30,
2016 | |
Class A(a) | | Actual | | | 0.89 | % | | $ | 1,000.00 | | | $ | 1,031.10 | | | $ | 4.49 | |
| | Hypothetical* | | | 0.89 | % | | $ | 1,000.00 | | | $ | 1,020.44 | | | $ | 4.47 | |
| | | | | |
Class B(a) | | Actual | | | 1.14 | % | | $ | 1,000.00 | | | $ | 1,029.80 | | | $ | 5.75 | |
| | Hypothetical* | | | 1.14 | % | | $ | 1,000.00 | | | $ | 1,019.20 | | | $ | 5.72 | |
| | | | | |
Class E(a) | | Actual | | | 1.04 | % | | $ | 1,000.00 | | | $ | 1,030.30 | | | $ | 5.25 | |
| | Hypothetical* | | | 1.04 | % | | $ | 1,000.00 | | | $ | 1,019.69 | | | $ | 5.22 | |
* Hypothetical assumes a rate of return of 5% per year before expenses.
** Expenses paid are equal to the Portfolio’s annualized expense ratio for the most recent six month period, as shown above, multiplied by the average account value over the period, multiplied by the number of days (182 days) in the most recent fiscal half-year, divided by 366 (to reflect the one-half year period).
(a) The annualized expense ratio shown reflects the impact of the management fee waiver as described in Note 5 of the Notes to Financial Statements.
MSF-4
Metropolitan Series Fund
Loomis Sayles Small Cap Core Portfolio
Schedule of Investments as of June 30, 2016 (Unaudited)
Common Stocks—98.5% of Net Assets
| | | | | | | | |
| Security Description | | Shares | | | Value | |
|
Aerospace & Defense—1.9% | |
Aerojet Rocketdyne Holdings, Inc. (a) (b) | | | 72,189 | | | $ | 1,319,615 | |
BWX Technologies, Inc. | | | 80,726 | | | | 2,887,569 | |
DigitalGlobe, Inc. (a) | | | 99,753 | | | | 2,133,717 | |
Hexcel Corp. | | | 36,352 | | | | 1,513,697 | |
| | | | | | | | |
| | | | | | | 7,854,598 | |
| | | | | | | | |
|
Auto Components—1.4% | |
Drew Industries, Inc. | | | 11,455 | | | | 971,842 | |
Fox Factory Holding Corp. (a) (b) | | | 112,076 | | | | 1,946,760 | |
Gentherm, Inc. (a) | | | 32,760 | | | | 1,122,030 | |
Horizon Global Corp. (a) | | | 86,870 | | | | 985,974 | |
Tenneco, Inc. (a) | | | 17,896 | | | | 834,133 | |
| | | | | | | | |
| | | | | | | 5,860,739 | |
| | | | | | | | |
|
Banks—12.8% | |
BancorpSouth, Inc. | | | 125,361 | | | | 2,844,441 | |
Bank of the Ozarks, Inc. (b) | | | 77,489 | | | | 2,907,387 | |
Bryn Mawr Bank Corp. | | | 71,718 | | | | 2,094,166 | |
Cathay General Bancorp | | | 125,984 | | | �� | 3,552,749 | |
CVB Financial Corp. (b) | | | 142,216 | | | | 2,330,920 | |
First Financial Bancorp | | | 144,502 | | | | 2,810,564 | |
First Financial Bankshares, Inc. | | | 66,811 | | | | 2,190,733 | |
Home BancShares, Inc. (b) | | | 109,626 | | | | 2,169,499 | |
Iberiabank Corp. | | | 46,332 | | | | 2,767,410 | |
LegacyTexas Financial Group, Inc. | | | 44,495 | | | | 1,197,360 | |
PacWest Bancorp (b) | | | 65,575 | | | | 2,608,574 | |
Pinnacle Financial Partners, Inc. | | | 82,128 | | | | 4,011,953 | |
Popular, Inc. | | | 75,510 | | | | 2,212,443 | |
PrivateBancorp, Inc. | | | 40,251 | | | | 1,772,252 | |
Prosperity Bancshares, Inc. | | | 61,971 | | | | 3,159,901 | |
Renasant Corp. | | | 21,840 | | | | 706,087 | |
Signature Bank (a) | | | 29,196 | | | | 3,647,164 | |
Talmer Bancorp, Inc. - Class A | | | 242,777 | | | | 4,654,035 | |
Texas Capital Bancshares, Inc. (a) | | | 38,371 | | | | 1,794,228 | |
Triumph Bancorp, Inc. (a) | | | 71,247 | | | | 1,139,952 | |
Wintrust Financial Corp. (b) | | | 61,820 | | | | 3,152,820 | |
| | | | | | | | |
| | | | | | | 53,724,638 | |
| | | | | | | | |
|
Beverages—0.6% | |
Cott Corp. (b) | | | 185,654 | | | | 2,591,730 | |
| | | | | | | | |
|
Biotechnology—1.1% | |
Genomic Health, Inc. (a) (b) | | | 45,547 | | | | 1,179,440 | |
Ironwood Pharmaceuticals, Inc. (a) (b) | | | 109,311 | | | | 1,429,241 | |
Lexicon Pharmaceuticals, Inc. (a) (b) | | | 79,333 | | | | 1,138,428 | |
Ophthotech Corp. (a) (b) | | | 21,435 | | | | 1,093,828 | |
| | | | | | | | |
| | | | | | | 4,840,937 | |
| | | | | | | | |
|
Building Products—2.1% | |
Apogee Enterprises, Inc. | | | 46,804 | | | | 2,169,365 | |
Armstrong Flooring, Inc. (a) (b) | | | 7,906 | | | | 134,007 | |
Armstrong World Industries, Inc. (a) (b) | | | 43,018 | | | | 1,684,155 | |
Masonite International Corp. (a) | | | 29,564 | | | | 1,955,363 | |
Patrick Industries, Inc. (a) | | | 20,701 | | | | 1,248,063 | |
|
Building Products—(Continued) | |
Trex Co., Inc. (a) (b) | | | 36,276 | | | | 1,629,518 | |
| | | | | | | | |
| | | | | | | 8,820,471 | |
| | | | | | | | |
|
Capital Markets—1.2% | |
Artisan Partners Asset Management, Inc. - Class A (b) | | | 40,535 | | | | 1,122,009 | |
Financial Engines, Inc. (b) | | | 35,642 | | | | 922,058 | |
Hercules Capital, Inc. (b) | | | 122,023 | | | | 1,515,526 | |
Stifel Financial Corp. (a) | | | 53,544 | | | | 1,683,959 | |
| | | | | | | | |
| | | | | | | 5,243,552 | |
| | | | | | | | |
|
Chemicals—0.9% | |
Cabot Corp. | | | 33,522 | | | | 1,530,614 | |
Minerals Technologies, Inc. | | | 36,581 | | | | 2,077,801 | |
| | | | | | | | |
| | | | | | | 3,608,415 | |
| | | | | | | | |
|
Commercial Services & Supplies—3.0% | |
Clean Harbors, Inc. (a) (b) | | | 26,285 | | | | 1,369,711 | |
Healthcare Services Group, Inc. (b) | | | 59,088 | | | | 2,445,062 | |
KAR Auction Services, Inc. | | | 86,743 | | | | 3,620,653 | |
Kimball International, Inc. - Class B | | | 81,822 | | | | 931,134 | |
Knoll, Inc. | | | 28,418 | | | | 689,989 | |
Viad Corp. | | | 66,814 | | | | 2,071,234 | |
West Corp. | | | 81,213 | | | | 1,596,648 | |
| | | | | | | | |
| | | | | | | 12,724,431 | |
| | | | | | | | |
|
Communications Equipment—1.0% | |
ARRIS International plc (a) | | | 64,351 | | | | 1,348,797 | |
Calix, Inc. (a) | | | 100,843 | | | | 696,825 | |
Digi International, Inc. (a) | | | 95,393 | | | | 1,023,567 | |
Viavi Solutions, Inc. (a) | | | 197,588 | | | | 1,310,008 | |
| | | | | | | | |
| | | | | | | 4,379,197 | |
| | | | | | | | |
|
Construction & Engineering—1.4% | |
Argan, Inc. | | | 37,151 | | | | 1,549,940 | |
Granite Construction, Inc. | | | 41,900 | | | | 1,908,545 | |
MYR Group, Inc. (a) | | | 55,750 | | | | 1,342,460 | |
Primoris Services Corp. (b) | | | 65,727 | | | | 1,244,212 | |
| | | | | | | | |
| | | | | | | 6,045,157 | |
| | | | | | | | |
|
Construction Materials—0.5% | |
Summit Materials, Inc. - Class A (a) | | | 61,836 | | | | 1,265,165 | |
U.S. Concrete, Inc. (a) (b) | | | 16,655 | | | | 1,014,456 | |
| | | | | | | | |
| | | | | | | 2,279,621 | |
| | | | | | | | |
|
Consumer Finance—0.2% | |
PRA Group, Inc. (a) (b) | | | 27,746 | | | | 669,788 | |
| | | | | | | | |
|
Distributors—1.1% | |
Core-Mark Holding Co., Inc. | | | 53,656 | | | | 2,514,320 | |
Pool Corp. | | | 23,827 | | | | 2,240,453 | |
| | | | | | | | |
| | | | | | | 4,754,773 | |
| | | | | | | | |
See accompanying notes to financial statements.
MSF-5
Metropolitan Series Fund
Loomis Sayles Small Cap Core Portfolio
Schedule of Investments as of June 30, 2016 (Unaudited)
Common Stocks—(Continued)
| | | | | | | | |
| Security Description | | Shares | | | Value | |
|
Diversified Consumer Services—1.5% | |
Bright Horizons Family Solutions, Inc. (a) | | | 34,179 | | | $ | 2,266,410 | |
Grand Canyon Education, Inc. (a) | | | 34,949 | | | | 1,395,164 | |
Houghton Mifflin Harcourt Co. (a) | | | 77,103 | | | | 1,205,120 | |
Nord Anglia Education, Inc. (a) (b) | | | 68,282 | | | | 1,443,481 | |
| | | | | | | | |
| | | | | | | 6,310,175 | |
| | | | | | | | |
|
Diversified Financial Services—1.4% | |
FNFV Group (a) (b) | | | 160,467 | | | | 1,840,556 | |
MarketAxess Holdings, Inc. | | | 28,489 | | | | 4,142,301 | |
| | | | | | | | |
| | | | | | | 5,982,857 | |
| | | | | | | | |
|
Diversified Telecommunication Services—0.7% | |
Cogent Communications Holdings, Inc. (b) | | | 47,414 | | | | 1,899,405 | |
ORBCOMM, Inc. (a) | | | 97,536 | | | | 970,483 | |
| | | | | | | | |
| | | | | | | 2,869,888 | |
| | | | | | | | |
|
Electric Utilities—0.9% | |
ALLETE, Inc. | | | 55,503 | | | | 3,587,159 | |
| | | | | | | | |
|
Electrical Equipment—1.1% | |
AZZ, Inc. | | | 15,920 | | | | 954,882 | |
Babcock & Wilcox Enterprises, Inc. (a) | | | 79,227 | | | | 1,163,845 | |
EnerSys | | | 17,088 | | | | 1,016,223 | |
Generac Holdings, Inc. (a) | | | 41,394 | | | | 1,447,134 | |
| | | | | | | | |
| | | | | | | 4,582,084 | |
| | | | | | | | |
|
Electronic Equipment, Instruments & Components—4.0% | |
Belden, Inc. | | | 33,738 | | | | 2,036,763 | |
FEI Co. | | | 10,104 | | | | 1,079,915 | |
II-VI, Inc. (a) | | | 72,501 | | | | 1,360,119 | |
IPG Photonics Corp. (a) (b) | | | 18,225 | | | | 1,458,000 | |
Kimball Electronics, Inc. (a) | | | 23,162 | | | | 288,367 | |
Littelfuse, Inc. | | | 34,223 | | | | 4,044,816 | |
Methode Electronics, Inc. | | | 59,503 | | | | 2,036,788 | |
Rogers Corp. (a) | | | 33,449 | | | | 2,043,734 | |
VeriFone Systems, Inc. (a) | | | 38,737 | | | | 718,184 | |
Vishay Intertechnology, Inc. (b) | | | 82,858 | | | | 1,026,611 | |
Zebra Technologies Corp. - Class A (a) (b) | | | 12,128 | | | | 607,613 | |
| | | | | | | | |
| | | | | | | 16,700,910 | |
| | | | | | | | |
|
Energy Equipment & Services—1.7% | |
Bristow Group, Inc. (b) | | | 39,764 | | | | 453,707 | |
Dril-Quip, Inc. (a) | | | 20,049 | | | | 1,171,463 | |
Natural Gas Services Group, Inc. (a) | | | 67,192 | | | | 1,538,697 | |
RPC, Inc. (a) (b) | | | 91,061 | | | | 1,414,177 | |
U.S. Silica Holdings, Inc. (b) | | | 77,389 | | | | 2,667,599 | |
| | | | | | | | |
| | | | | | | 7,245,643 | |
| | | | | | | | |
|
Food & Staples Retailing—0.6% | |
SpartanNash Co. | | | 81,622 | | | | 2,496,001 | |
| | | | | | | | |
|
Food Products—2.2% | |
Amplify Snack Brands, Inc. (a) (b) | | | 86,536 | | | | 1,276,406 | |
Darling Ingredients, Inc. (a) | | | 104,943 | | | | 1,563,651 | |
|
Food Products—(Continued) | |
J&J Snack Foods Corp. | | | 6,991 | | | | 833,816 | |
Post Holdings, Inc. (a) (b) | | | 55,007 | | | | 4,548,529 | |
Snyder’s-Lance, Inc. | | | 33,427 | | | | 1,132,841 | |
| | | | | | | | |
| | | | | | | 9,355,243 | |
| | | | | | | | |
|
Health Care Equipment & Supplies—3.9% | |
Cynosure, Inc. - Class A (a) | | | 60,450 | | | | 2,940,590 | |
Globus Medical, Inc. - Class A (a) (b) | | | 49,991 | | | | 1,191,286 | |
Halyard Health, Inc. (a) | | | 55,540 | | | | 1,806,161 | |
Inogen, Inc. (a) | | | 31,176 | | | | 1,562,229 | |
Insulet Corp. (a) (b) | | | 46,803 | | | | 1,415,323 | |
Integra LifeSciences Holdings Corp. (a) (b) | | | 22,905 | | | | 1,827,361 | |
Neogen Corp. (a) | | | 29,757 | | | | 1,673,831 | |
Nevro Corp. (a) | | | 14,998 | | | | 1,106,252 | |
SurModics, Inc. (a) | | | 42,270 | | | | 992,500 | |
Teleflex, Inc. | | | 9,397 | | | | 1,666,182 | |
Wright Medical Group NV (a) | | | 5,337 | | | | 82,286 | |
| | | | | | | | |
| | | | | | | 16,264,001 | |
| | | | | | | | |
|
Health Care Providers & Services—2.8% | |
Acadia Healthcare Co., Inc. (a) (b) | | | 26,808 | | | | 1,485,163 | |
Aceto Corp. (b) | | | 49,904 | | | | 1,092,399 | |
AMN Healthcare Services, Inc. (a) | | | 49,500 | | | | 1,978,515 | |
Amsurg Corp. (a) | | | 19,284 | | | | 1,495,281 | |
Ensign Group, Inc. (The) | | | 55,860 | | | | 1,173,619 | |
HealthEquity, Inc. (a) (b) | | | 34,414 | | | | 1,045,669 | |
PharMerica Corp. (a) | | | 73,609 | | | | 1,815,198 | |
WellCare Health Plans, Inc. (a) | | | 15,710 | | | | 1,685,369 | |
| | | | | | | | |
| | | | | | | 11,771,213 | |
| | | | | | | | |
|
Health Care Technology—1.1% | |
Inovalon Holdings, Inc. - Class A (a) (b) | | | 59,069 | | | | 1,063,833 | |
Medidata Solutions, Inc. (a) (b) | | | 35,642 | | | | 1,670,540 | |
Press Ganey Holdings, Inc. (a) | | | 43,778 | | | | 1,722,664 | |
| | | | | | | | |
| | | | | | | 4,457,037 | |
| | | | | | | | |
|
Hotels, Restaurants & Leisure—4.8% | |
Carrols Restaurant Group, Inc. (a) | | | 91,367 | | | | 1,087,267 | |
Churchill Downs, Inc. | | | 21,073 | | | | 2,662,784 | |
Chuy’s Holdings, Inc. (a) (b) | | | 48,179 | | | | 1,667,475 | |
Cracker Barrel Old Country Store, Inc. (b) | | | 6,635 | | | | 1,137,704 | |
Del Frisco’s Restaurant Group, Inc. (a) (b) | | | 43,302 | | | | 620,085 | |
Diamond Resorts International, Inc. (a) (b) | | | 46,933 | | | | 1,406,113 | |
J. Alexander’s Holdings, Inc. (a) | | | 37,861 | | | | 375,960 | |
Marriott Vacations Worldwide Corp. (b) | | | 34,539 | | | | 2,365,576 | |
Popeyes Louisiana Kitchen, Inc. (a) | | | 21,563 | | | | 1,178,202 | |
Six Flags Entertainment Corp. | | | 49,199 | | | | 2,851,082 | |
Texas Roadhouse, Inc. (b) | | | 33,174 | | | | 1,512,734 | |
Vail Resorts, Inc. (b) | | | 12,918 | | | | 1,785,655 | |
Zoe’s Kitchen, Inc. (a) | | | 38,599 | | | | 1,399,986 | |
| | | | | | | | |
| | | | | | | 20,050,623 | |
| | | | | | | | |
|
Household Durables—0.8% | |
Helen of Troy, Ltd. (a) | | | 21,016 | | | | 2,161,286 | |
See accompanying notes to financial statements.
MSF-6
Metropolitan Series Fund
Loomis Sayles Small Cap Core Portfolio
Schedule of Investments as of June 30, 2016 (Unaudited)
Common Stocks—(Continued)
| | | | | | | | |
| Security Description | | Shares | | | Value | |
|
Household Durables—(Continued) | |
Universal Electronics, Inc. (a) | | | 17,879 | | | $ | 1,292,294 | |
| | | | | | | | |
| | | | | | | 3,453,580 | |
| | | | | | | | |
|
Household Products—0.2% | |
HRG Group, Inc. (a) | | | 71,260 | | | | 978,400 | |
| | | | | | | | |
|
Industrial Conglomerates—0.4% | |
Raven Industries, Inc. (b) | | | 86,486 | | | | 1,638,045 | |
| | | | | | | | |
|
Insurance—2.1% | |
Atlas Financial Holdings, Inc. (a) | | | 34,991 | | | | 602,545 | |
Employers Holdings, Inc. | | | 103,942 | | | | 3,016,397 | |
ProAssurance Corp. | | | 45,299 | | | | 2,425,761 | |
Reinsurance Group of America, Inc. | | | 27,885 | | | | 2,704,566 | |
| | | | | | | | |
| | | | | | | 8,749,269 | |
| | | | | | | | |
|
Internet & Catalog Retail—1.4% | |
1-800-Flowers.com, Inc. - Class A (a) | | | 145,517 | | | | 1,312,563 | |
HSN, Inc. | | | 31,016 | | | | 1,517,613 | |
Liberty Ventures - Series A (a) | | | 56,123 | | | | 2,080,480 | |
Wayfair, Inc. - Class A (a) (b) | | | 24,646 | | | | 961,194 | |
| | | | | | | | |
| | | | | | | 5,871,850 | |
| | | | | | | | |
|
Internet Software & Services—1.7% | |
Criteo S.A. (ADR) (a) | | | 40,567 | | | | 1,862,837 | |
IAC/InterActiveCorp | | | 14,843 | | | | 835,661 | |
LogMeIn, Inc. (a) | | | 20,015 | | | | 1,269,551 | |
Q2 Holdings, Inc. (a) | | | 55,211 | | | | 1,547,012 | |
Wix.com, Ltd. (a) | | | 60,158 | | | | 1,825,795 | |
| | | | | | | | |
| | | | | | | 7,340,856 | |
| | | | | | | | |
|
IT Services—5.1% | |
Blackhawk Network Holdings, Inc. (a) | | | 40,120 | | | | 1,343,619 | |
Booz Allen Hamilton Holding Corp. | | | 80,913 | | | | 2,398,261 | |
CSG Systems International, Inc. | | | 33,079 | | | | 1,333,415 | |
DST Systems, Inc. | | | 24,972 | | | | 2,907,490 | |
EPAM Systems, Inc. (a) | | | 21,665 | | | | 1,393,276 | |
Euronet Worldwide, Inc. (a) | | | 69,252 | | | | 4,791,546 | |
ExlService Holdings, Inc. (a) | | | 24,061 | | | | 1,261,037 | |
InterXion Holding NV (a) | | | 50,941 | | | | 1,878,704 | |
Perficient, Inc. (a) | | | 84,986 | | | | 1,726,066 | |
WEX, Inc. (a) | | | 26,084 | | | | 2,312,868 | |
| | | | | | | | |
| | | | | | | 21,346,282 | |
| | | | | | | | |
|
Leisure Products—0.4% | |
Vista Outdoor, Inc. (a) | | | 36,691 | | | | 1,751,261 | |
| | | | | | | | |
|
Life Sciences Tools & Services—1.7% | |
Accelerate Diagnostics, Inc. (a) | | | 5,613 | | | | 80,771 | |
Albany Molecular Research, Inc. (a) | | | 94,016 | | | | 1,263,575 | |
Cambrex Corp. (a) | | | 30,707 | | | | 1,588,473 | |
INC Research Holdings, Inc. - Class A (a) | | | 28,624 | | | | 1,091,433 | |
PRA Health Sciences, Inc. (a) | | | 22,803 | | | | 952,254 | |
|
Life Sciences Tools & Services—(Continued) | |
VWR Corp. (a) | | | 81,539 | | | | 2,356,477 | |
| | | | | | | | |
| | | | | | | 7,332,983 | |
| | | | | | | | |
|
Machinery—3.5% | |
Alamo Group, Inc. | | | 18,612 | | | | 1,227,834 | |
Albany International Corp. - Class A | | | 51,129 | | | | 2,041,581 | |
Altra Industrial Motion Corp. | | | 25,124 | | | | 677,846 | |
Astec Industries, Inc. | | | 24,043 | | | | 1,350,014 | |
John Bean Technologies Corp. | | | 46,234 | | | | 2,830,445 | |
Middleby Corp. (The) (a) | | | 13,573 | | | | 1,564,288 | |
RBC Bearings, Inc. (a) (b) | | | 54,214 | | | | 3,930,515 | |
TriMas Corp. (a) | | | 67,251 | | | | 1,210,518 | |
| | | | | | | | |
| | | | | | | 14,833,041 | |
| | | | | | | | |
|
Marine—0.3% | |
Kirby Corp. (a) (b) | | | 21,828 | | | | 1,361,849 | |
| | | | | | | | |
|
Media—2.2% | |
Carmike Cinemas, Inc. (a) | | | 22,376 | | | | 673,965 | |
EW Scripps Co. (The) - Class A (a) | | | 135,084 | | | | 2,139,731 | |
John Wiley & Sons, Inc. - Class A | | | 40,041 | | | | 2,089,339 | |
National CineMedia, Inc. | | | 137,768 | | | | 2,132,649 | |
New Media Investment Group, Inc. (b) | | | 120,402 | | | | 2,175,664 | |
| | | | | | | | |
| | | | | | | 9,211,348 | |
| | | | | | | | |
|
Metals & Mining—0.6% | |
Ferroglobe plc | | | 141,548 | | | | 1,218,728 | |
Haynes International, Inc. (b) | | | 42,162 | | | | 1,352,557 | |
| | | | | | | | |
| | | | | | | 2,571,285 | |
| | | | | | | | |
|
Multi-Utilities—0.7% | |
NorthWestern Corp. | | | 50,004 | | | | 3,153,752 | |
| | | | | | | | |
|
Oil, Gas & Consumable Fuels—1.7% | |
Delek U.S. Holdings, Inc. | | | 65,318 | | | | 862,851 | |
Diamondback Energy, Inc. (a) | | | 18,021 | | | | 1,643,695 | |
PDC Energy, Inc. (a) | | | 22,211 | | | | 1,279,576 | |
QEP Resources, Inc. | | | 95,244 | | | | 1,679,152 | |
Synergy Resources Corp. (a) (b) | | | 278,959 | | | | 1,857,867 | |
| | | | | | | | |
| | | | | | | 7,323,141 | |
| | | | | | | | |
|
Pharmaceuticals—1.3% | |
Akorn, Inc. (a) (b) | | | 38,859 | | | | 1,106,899 | |
Catalent, Inc. (a) (b) | | | 58,046 | | | | 1,334,477 | |
Dermira, Inc. (a) (b) | | | 26,789 | | | | 783,578 | |
Impax Laboratories, Inc. (a) | | | 39,093 | | | | 1,126,660 | |
Supernus Pharmaceuticals, Inc. (a) | | | 56,086 | | | | 1,142,472 | |
| | | | | | | | |
| | | | | | | 5,494,086 | |
| | | | | | | | |
|
Professional Services—1.2% | |
FTI Consulting, Inc. (a) | | | 38,294 | | | | 1,557,800 | |
Insperity, Inc. | | | 21,433 | | | | 1,655,270 | |
WageWorks, Inc. (a) | | | 32,585 | | | | 1,948,909 | |
| | | | | | | | |
| | | | | | | 5,161,979 | |
| | | | | | | | |
See accompanying notes to financial statements.
MSF-7
Metropolitan Series Fund
Loomis Sayles Small Cap Core Portfolio
Schedule of Investments as of June 30, 2016 (Unaudited)
Common Stocks—(Continued)
| | | | | | | | |
| Security Description | |
Shares | | | Value | |
|
Real Estate Investment Trusts—5.0% | |
American Campus Communities, Inc. | | | 50,208 | | | $ | 2,654,497 | |
CubeSmart | | | 106,311 | | | | 3,282,884 | |
Hersha Hospitality Trust (b) | | | 75,629 | | | | 1,297,037 | |
Mid-America Apartment Communities, Inc. | | | 32,704 | | | | 3,479,706 | |
National Retail Properties, Inc. | | | 42,345 | | | | 2,190,083 | |
Omega Healthcare Investors, Inc. | | | 22,037 | | | | 748,156 | |
Retail Opportunity Investments Corp. | | | 177,486 | | | | 3,846,122 | |
Sabra Health Care REIT, Inc. (b) | | | 47,990 | | | | 990,274 | |
Sovran Self Storage, Inc. | | | 24,148 | | | | 2,533,608 | |
| | | | | | | | |
| | | | | | | 21,022,367 | |
| | | | | | | | |
|
Real Estate Management & Development—0.3% | |
HFF, Inc. - Class A | | | 45,154 | | | | 1,304,047 | |
| | | | | | | | |
|
Road & Rail—1.0% | |
Avis Budget Group, Inc. (a) | | | 27,857 | | | | 897,831 | |
Genesee & Wyoming, Inc. - Class A (a) | | | 24,991 | | | | 1,473,220 | |
Old Dominion Freight Line, Inc. (a) | | | 28,758 | | | | 1,734,395 | |
| | | | | | | | |
| | | | | | | 4,105,446 | |
| | | | | | | | |
|
Semiconductors & Semiconductor Equipment—3.3% | |
Advanced Energy Industries, Inc. (a) | | | 66,677 | | | | 2,531,059 | |
Inphi Corp. (a) | | | 48,462 | | | | 1,552,238 | |
Intersil Corp. - Class A | | | 110,816 | | | | 1,500,449 | |
MKS Instruments, Inc. | | | 44,575 | | | | 1,919,399 | |
Monolithic Power Systems, Inc. | | | 27,190 | | | | 1,857,621 | |
Semtech Corp. (a) | | | 37,087 | | | | 884,896 | |
Silicon Laboratories, Inc. (a) | | | 31,886 | | | | 1,554,124 | |
Teradyne, Inc. | | | 98,211 | | | | 1,933,774 | |
| | | | | | | | |
| | | | | | | 13,733,560 | |
| | | | | | | | |
|
Software—3.4% | |
Blackbaud, Inc. | | | 26,251 | | | | 1,782,443 | |
Callidus Software, Inc. (a) | | | 73,207 | | | | 1,462,676 | |
FleetMatics Group plc (a) | | | 34,092 | | | | 1,477,206 | |
Guidewire Software, Inc. (a) | | | 40,611 | | | | 2,508,135 | |
RingCentral, Inc. - Class A (a) | | | 52,033 | | | | 1,026,091 | |
Synchronoss Technologies, Inc. (a) (b) | | | 61,108 | | | | 1,946,901 | |
Ultimate Software Group, Inc.
(The) (a) (b) | | | 12,426 | | | | 2,613,064 | |
Verint Systems, Inc. (a) | | | 43,631 | | | | 1,445,495 | |
| | | | | | | | |
| | | | | | | 14,262,011 | |
| | | | | | | | |
|
Specialty Retail—2.1% | |
Barnes & Noble, Inc. (b) | | | 105,789 | | | | 1,200,705 | |
Genesco, Inc. (a) (b) | | | 38,244 | | | | 2,459,472 | |
MarineMax, Inc. (a) | | | 46,048 | | | | 781,434 | |
Monro Muffler Brake, Inc. (b) | | | 24,743 | | | | 1,572,665 | |
Sally Beauty Holdings, Inc. (a) (b) | | | 50,164 | | | | 1,475,323 | |
Tile Shop Holdings, Inc. (a) | | | 66,295 | | | | 1,317,945 | |
| | | | | | | | |
| | | | | | | 8,807,544 | |
| | | | | | | | |
|
Textiles, Apparel & Luxury Goods—0.6% | |
Columbia Sportswear Co. | | | 18,684 | | | | 1,075,077 | |
| Security Description | | Shares/
Principal
Amount* | | | Value | |
|
Textiles, Apparel & Luxury Goods—(Continued) | |
Steven Madden, Ltd. (a) | | | 41,102 | | | | 1,404,867 | |
| | | | | | | | |
| | | | | | | 2,479,944 | |
| | | | | | | | |
|
Thrifts & Mortgage Finance—0.6% | |
Essent Group, Ltd. (a) | | | 60,180 | | | | 1,312,526 | |
Federal Agricultural Mortgage Corp. - Class C | | | 33,757 | | | | 1,175,419 | |
| | | | | | | | |
| | | | | | | 2,487,945 | |
| | | | | | | | |
|
Trading Companies & Distributors—0.5% | |
Beacon Roofing Supply, Inc. (a) | | | 27,952 | | | | 1,270,977 | |
SiteOne Landscape Supply, Inc. (a) | | | 25,736 | | | | 874,767 | |
| | | | | | | | |
| | | | | | | 2,145,744 | |
| | | | | | | | |
|
Transportation Infrastructure—0.5% | |
Macquarie Infrastructure Corp. | | | 25,989 | | | | 1,924,485 | |
| | | | | | | | |
Total Common Stocks
(Cost $317,886,351) | | | | | | | 414,916,981 | |
| | | | | | | | |
|
| Short-Term Investments—17.5% | |
| |
Mutual Fund—15.7% | | | | |
State Street Navigator Securities Lending MET Portfolio (c) | | | 66,387,466 | | | | 66,387,466 | |
| | | | | | | | |
| |
Repurchase Agreement—1.8% | | | | |
Fixed Income Clearing Corp. Repurchase Agreement dated 06/30/16 at 0.030% to be repurchased at $7,444,646 on 07/01/16, collateralized by $7,385,000 U.S. Treasury Note at 1.625% due 11/30/20 with a value of $7,597,319. | | | 7,444,640 | | | | 7,444,640 | |
| | | | | | | | |
Total Short-Term Investments
(Cost $73,832,106) | | | | | | | 73,832,106 | |
| | | | | | | | |
Total Investments—116.0%
(Cost $391,718,457) (d) | | | | | | | 488,749,087 | |
Other assets and liabilities
(net)—(16.0)% | | | | | | | (67,459,687 | ) |
| | | | | | | | |
| Net Assets—100.0% | | | | | | $ | 421,289,400 | |
| | | | | | | | |
| * | Principal amount stated in U.S. dollars unless otherwise noted. |
| (a) | Non-income producing security. |
| (b) | All or a portion of the security was held on loan. As of June 30, 2016, the market value of securities loaned was $74,676,266 and the collateral received consisted of cash in the amount of $66,387,466 and non-cash collateral with a value of $9,406,370. The cash collateral is invested in a money market fund managed by an affiliate of the custodian. The non-cash collateral received consists primarily of government securities and bank letters of credit, and is held for the benefit of the Portfolio at the Portfolio’s custodian. The Portfolio cannot repledge or resell this collateral. As such, this collateral is excluded from the Statement of Assets and Liabilities. |
See accompanying notes to financial statements.
MSF-8
Metropolitan Series Fund
Loomis Sayles Small Cap Core Portfolio
Schedule of Investments as of June 30, 2016 (Unaudited)
| (c) | Represents investment of cash collateral received from securities on loan as of June 30, 2016. |
| (d) | As of June 30, 2016, the aggregate cost of investments was $391,718,457. The aggregate unrealized appreciation and depreciation of investments were $112,245,690 and $(15,215,060), respectively, resulting in net unrealized appreciation of $97,030,630. |
| (ADR)— | An American Depositary Receipt is a certificate issued by a custodian bank representing the right to receive securities of the foreign issuer described. Trading on exchanges not located in the United States or Canada significantly influences the value of ADRs. |
Fair Value Hierarchy
Accounting principles generally accepted in the United States of America (“GAAP”) define fair market value as the price that the Portfolio would receive to sell an asset or pay to transfer a liability in an orderly transaction between market participants at the measurement date. It establishes a fair value hierarchy that prioritizes inputs to valuation methods and requires disclosure of the fair value hierarchy, separately for each major category of assets and liabilities, that segregates fair value measurements into three levels. Levels 1, 2 and 3 of the fair value hierarchy are defined as follows:
Level 1 - unadjusted quoted prices in active markets for identical investments
Level 2 - other significant observable inputs (including, but not limited to, quoted prices for similar assets or liabilities in markets that are either active or inactive; inputs other than quoted prices that are observable such as interest rates, yield curves, volatilities, prepayment speeds, loss severities, credit risks, default rates, or other market corroborated inputs)
Level 3 - significant unobservable inputs based on the best information available in the circumstances, to the extent observable inputs are unavailable (including the Portfolio’s own assumptions used in determining the fair value of investments and derivative financial instruments)
The inputs or methodologies used for valuing investments are not necessarily an indication of the risk associated with investing in them. Changes to the inputs or methodologies used may result in transfers between levels, which will be recognized as of the beginning of the reporting period. Information on transfers between Level 1 and Level 2, if any, will be disclosed following the fair value hierarchy table below. A reconciliation of Level 3 securities, if any, will also be disclosed following the fair value hierarchy table. For more information about the Portfolio’s policy regarding the valuation of investments, please refer to the Notes to Financial Statements.
The following table summarizes the fair value hierarchy of the Portfolio’s investments as of June 30, 2016:
| | | | | | | | | | | | | | | | |
| Description | | Level 1 | | | Level 2 | | | Level 3 | | | Total | |
Total Common Stocks* | | $ | 414,916,981 | | | $ | — | | | $ | — | | | $ | 414,916,981 | |
| Short-Term Investments | | | | | | | | | | | | | | | | |
Mutual Fund | | | 66,387,466 | | | | — | | | | — | | | | 66,387,466 | |
Repurchase Agreement | | | — | | | | 7,444,640 | | | | — | | | | 7,444,640 | |
Total Short-Term Investments | | | 66,387,466 | | | | 7,444,640 | | | | — | | | | 73,832,106 | |
Total Investments | | $ | 481,304,447 | | | $ | 7,444,640 | | | $ | — | | | $ | 488,749,087 | |
| | | | | | | | | | | | | | | | | |
Collateral for Securities Loaned (Liability) | | $ | — | | | $ | (66,387,466 | ) | | $ | — | | | $ | (66,387,466 | ) |
| * | See Schedule of Investments for additional detailed categorizations. |
See accompanying notes to financial statements.
MSF-9
Metropolitan Series Fund
Loomis Sayles Small Cap Core Portfolio
Statement of Assets and Liabilities
June 30, 2016 (Unaudited)
| | | | |
Assets | | | | |
Investments at value (a) (b) | �� | $ | 488,749,087 | |
Receivable for: | | | | |
Investments sold | | | 1,503,902 | |
Fund shares sold | | | 34,364 | |
Dividends and interest | | | 247,374 | |
Prepaid expenses | | | 2,658 | |
| | | | |
Total Assets | | | 490,537,385 | |
Liabilities | | | | |
Collateral for securities loaned | | | 66,387,466 | |
Payables for: | | | | |
Investments purchased | | | 2,086,477 | |
Fund shares redeemed | | | 246,103 | |
Accrued Expenses: | | | | |
Management fees | | | 284,907 | |
Distribution and service fees | | | 35,397 | |
Deferred trustees’ fees | | | 76,696 | |
Other expenses | | | 130,939 | |
| | | | |
Total Liabilities | | | 69,247,985 | |
| | | | |
Net Assets | | $ | 421,289,400 | |
| | | | |
Net Assets Consist of: | | | | |
Paid in surplus | | $ | 316,871,321 | |
Undistributed net investment income | | | 1,021,063 | |
Accumulated net realized gain | | | 6,366,386 | |
Unrealized appreciation on investments | | | 97,030,630 | |
| | | | |
Net Assets | | $ | 421,289,400 | |
| | | | |
Net Assets | | | | |
Class A | | $ | 237,450,413 | |
Class B | | | 155,533,615 | |
Class E | | | 28,305,372 | |
Capital Shares Outstanding* | | | | |
Class A | | | 1,014,459 | |
Class B | | | 694,291 | |
Class E | | | 124,021 | |
Net Asset Value, Offering Price and Redemption Price Per Share | | | | |
Class A | | $ | 234.07 | |
Class B | | | 224.02 | |
Class E | | | 228.23 | |
| * | The Portfolio is authorized to issue an unlimited number of shares. |
| (a) | Identified cost of investments was $391,718,457. |
| (b) | Includes securities loaned at value of $74,676,266. |
Statement of Operations
Six Months Ended June 30, 2016 (Unaudited)
| | | | |
Investment Income | |
Dividends (a) | | $ | 2,465,059 | |
Interest | | | 1,585 | |
Securities lending income | | | 343,193 | |
| | | | |
Total investment income | | | 2,809,837 | |
Expenses | | | | |
Management fees | | | 1,824,047 | |
Administration fees | | | 5,294 | |
Custodian and accounting fees | | | 30,105 | |
Distribution and service fees—Class B | | | 187,430 | |
Distribution and service fees—Class E | | | 20,441 | |
Audit and tax services | | | 20,230 | |
Legal | | | 13,597 | |
Trustees’ fees and expenses | | | 15,990 | |
Shareholder reporting | | | 37,424 | |
Insurance | | | 1,497 | |
Miscellaneous | | | 6,246 | |
| | | | |
Total expenses | | | 2,162,301 | |
Less management fee waiver | | | (152,945 | ) |
Less broker commission recapture | | | (18,617 | ) |
| | | | |
Net expenses | | | 1,990,739 | |
| | | | |
Net Investment Income | | | 819,098 | |
| | | | |
Net Realized and Unrealized Gain | | | | |
Net realized gain on investments | | | 6,514,188 | |
| | | | |
Net change in unrealized appreciation on investments | | | 4,826,007 | |
| | | | |
Net realized and unrealized gain | | | 11,340,195 | |
| | | | |
Net Increase in Net Assets From Operations | | $ | 12,159,293 | |
| | | | |
| (a) | Net of foreign withholding taxes of $5,784. |
See accompanying notes to financial statements.
MSF-10
Metropolitan Series Fund
Loomis Sayles Small Cap Core Portfolio
Statements of Changes in Net Assets
| | | | | | | | |
| | | Six Months
Ended
June 30,
2016
(Unaudited) | | | Year Ended
December 31,
2015 | |
Increase (Decrease) in Net Assets: | | | | | | | | |
From Operations | | | | | | | | |
Net investment income | | $ | 819,098 | | | $ | 1,527,197 | |
Net realized gain | | | 6,514,188 | | | | 38,574,497 | |
Net change in unrealized appreciation (depreciation) | | | 4,826,007 | | | | (45,754,988 | ) |
| | | | | | | | |
Increase (decrease) in net assets from operations | | | 12,159,293 | | | | (5,653,294 | ) |
| | | | | | | | |
From Distributions to Shareholders | | | | | | | | |
Net investment income | | | | | | | | |
Class A | | | (785,353 | ) | | | (410,528 | ) |
Class B | | | (107,250 | ) | | | 0 | |
Class E | | | (47,516 | ) | | | 0 | |
Net realized capital gains | | | | | | | | |
Class A | | | (21,737,937 | ) | | | (33,473,512 | ) |
Class B | | | (14,860,492 | ) | | | (22,594,510 | ) |
Class E | | | (2,652,217 | ) | | | (4,206,020 | ) |
| | | | | | | | |
Total distributions | | | (40,190,765 | ) | | | (60,684,570 | ) |
| | | | | | | | |
Increase in net assets from capital share transactions | | | 20,852,876 | | | | 12,317,502 | |
| | | | | | | | |
Total decrease in net assets | | | (7,178,596 | ) | | | (54,020,362 | ) |
| | |
Net Assets | | | | | | | | |
Beginning of period | | | 428,467,996 | | | | 482,488,358 | |
| | | | | | | | |
End of period | | $ | 421,289,400 | | | $ | 428,467,996 | |
| | | | | | | | |
Undistributed net investment income | | | | | | | | |
End of period | | $ | 1,021,063 | | | $ | 1,142,084 | |
| | | | | | | | |
Other Information:
Capital Shares
Transactions in capital shares were as follows:
| | | | | | | | | | | | | | | | |
| | | Six Months Ended
June 30, 2016
(Unaudited) | | | Year Ended
December 31, 2015 | |
| | | Shares | | | Value | | | Shares | | | Value | |
Class A | | | | | | | | | | | | | | | | |
Sales | | | 10,075 | | | $ | 2,446,909 | | | | 20,619 | | | $ | 5,635,743 | |
Reinvestments | | | 96,584 | | | | 22,523,290 | | | | 123,750 | | | | 33,884,040 | |
Redemptions | | | (54,999 | ) | | | (13,302,444 | ) | | | (109,032 | ) | | | (30,222,315 | ) |
| | | | | | | | | | | | | | | | |
Net increase | | | 51,660 | | | $ | 11,667,755 | | | | 35,337 | | | $ | 9,297,468 | |
| | | | | | | | | | | | | | | | |
Class B | | | | | | | | | | | | | | | | |
Sales | | | 17,157 | | | $ | 3,877,324 | | | | 27,469 | | | $ | 7,213,722 | |
Reinvestments | | | 67,057 | | | | 14,967,742 | | | | 85,871 | | | | 22,594,510 | |
Redemptions | | | (46,042 | ) | | | (10,779,157 | ) | | | (98,258 | ) | | | (26,602,537 | ) |
| | | | | | | | | | | | | | | | |
Net increase | | | 38,172 | | | $ | 8,065,909 | | | | 15,082 | | | $ | 3,205,695 | |
| | | | | | | | | | | | | | | | |
Class E | | | | | | | | | | | | | | | | |
Sales | | | 825 | | | $ | 193,306 | | | | 3,749 | | | $ | 993,154 | |
Reinvestments | | | 11,872 | | | | 2,699,733 | | | | 15,718 | | | | 4,206,020 | |
Redemptions | | | (7,533 | ) | | | (1,773,827 | ) | | | (19,817 | ) | | | (5,384,835 | ) |
| | | | | | | | | | | | | | | | |
Net increase (decrease) | | | 5,164 | | | $ | 1,119,212 | | | | (350 | ) | | $ | (185,661 | ) |
| | | | | | | | | | | | | | | | |
Increase derived from capital shares transactions | | | | | | $ | 20,852,876 | | | | | | | $ | 12,317,502 | |
| | | | | | | | | | | | | | | | |
See accompanying notes to financial statements.
MSF-11
Metropolitan Series Fund
Loomis Sayles Small Cap Core Portfolio
Financial Highlights
| | | | | | | | | | | | | | | | | | | | | | | | |
| Selected per share data | | | | | | | | | | | | | | | | | | |
| | | Class A | |
| | | Six Months
Ended
June 30,
2016
(Unaudited) | | | Year Ended December 31, | |
| | | | 2015 | | | 2014 | | | 2013 | | | 2012 | | | 2011 | |
Net Asset Value, Beginning of Period | | $ | 250.78 | | | $ | 290.12 | | | $ | 322.61 | | | $ | 250.37 | | | $ | 224.06 | | | $ | 222.98 | |
| | | | | | | | | | | | | | | | | | | | | | | | |
Income (Loss) from Investment Operations | | | | | | | | | | | | | | | | | | | | | | | | |
Net investment income (a) | | | 0.61 | | | | 1.19 | | | | 0.91 | | | | 0.53 | | | | 1.56 | | | | 0.13 | |
Net realized and unrealized gain (loss) on investments | | | 7.09 | | | | (2.32 | ) | | | 8.06 | | | | 94.94 | | | | 30.73 | | | | 1.20 | |
| | | | | | | | | | | | | | | | | | | | | | | | |
Total from investment operations | | | 7.70 | | | | (1.13 | ) | | | 8.97 | | | | 95.47 | | | | 32.29 | | | | 1.33 | |
| | | | | | | | | | | | | | | | | | | | | | | | |
Less Distributions | | | | | | | | | | | | | | | | | | | | | | | | |
Distributions from net investment income | | | (0.85 | ) | | | (0.46 | ) | | | (0.14 | ) | | | (1.29 | ) | | | 0.00 | | | | (0.25 | ) |
Distributions from net realized capital gains | | | (23.56 | ) | | | (37.75 | ) | | | (41.32 | ) | | | (21.94 | ) | | | (5.98 | ) | | | 0.00 | |
| | | | | | | | | | | | | | | | | | | | | | | | |
Total distributions | | | (24.41 | ) | | | (38.21 | ) | | | (41.46 | ) | | | (23.23 | ) | | | (5.98 | ) | | | (0.25 | ) |
| | | | | | | | | | | | | | | | | | | | | | | | |
Net Asset Value, End of Period | | $ | 234.07 | | | $ | 250.78 | | | $ | 290.12 | | | $ | 322.61 | | | $ | 250.37 | | | $ | 224.06 | |
| | | | | | | | | | | | | | | | | | | | | | | | |
Total Return (%) (b) | | | 3.11 | (c) | | | (1.50 | ) | | | 3.76 | | | | 41.04 | | | | 14.55 | | | | 0.59 | |
| | | | | | |
Ratios/Supplemental Data | | | | | | | | | | | | | | | | | | | | | | | | |
Gross ratio of expenses to average net assets (%) | | | 0.96 | (d) | | | 0.96 | | | | 0.96 | | | | 0.95 | | | | 0.97 | | | | 0.96 | |
Net ratio of expenses to average net assets (%) (e) | | | 0.89 | (d) | | | 0.88 | | | | 0.88 | | | | 0.88 | | | | 0.89 | | | | 0.91 | |
Ratio of net investment income to average net assets (%) | | | 0.51 | (d) | | | 0.43 | | | | 0.31 | | | | 0.19 | | | | 0.65 | | | | 0.06 | |
Portfolio turnover rate (%) | | | 17 | (c) | | | 36 | | | | 35 | | | | 36 | | | | 38 | | | | 49 | |
Net assets, end of period (in millions) | | $ | 237.5 | | | $ | 241.5 | | | $ | 269.1 | | | $ | 286.0 | | | $ | 222.5 | | | $ | 219.9 | |
| |
| | | Class B | |
| | | Six Months
Ended
June 30,
2016
(Unaudited) | | | Year Ended December 31, | |
| | | | 2015
| | | 2014
| | | 2013
| | | 2012
| | | 2011
| |
Net Asset Value, Beginning of Period | | $ | 240.67 | | | $ | 280.08 | | | $ | 313.49 | | | $ | 243.89 | | | $ | 218.94 | | | $ | 218.20 | |
| | | | | | | | | | | | | | | | | | | | | | | | |
Income (Loss) from Investment Operations | | | | | | | | | | | | | | | | | | | | | | | | |
Net investment income (loss) (a) | | | 0.30 | | | | 0.48 | | | | 0.18 | | | | (0.18 | ) | | | 0.96 | | | | (0.41 | ) |
Net realized and unrealized gain (loss) on investments | | | 6.78 | | | | (2.14 | ) | | | 7.73 | | | | 92.38 | | | | 29.97 | | | | 1.15 | |
| | | | | | | | | | | | | | | | | | | | | | | | |
Total from investment operations | | | 7.08 | | | | (1.66 | ) | | | 7.91 | | | | 92.20 | | | | 30.93 | | | | 0.74 | |
| | | | | | | | | | | | | | | | | | | | | | | | |
Less Distributions | | | | | | | | | | | | | | | | | | | | | | | | |
Distributions from net investment income | | | (0.17 | ) | | | 0.00 | | | | 0.00 | | | | (0.66 | ) | | | 0.00 | | | | 0.00 | |
Distributions from net realized capital gains | | | (23.56 | ) | | | (37.75 | ) | | | (41.32 | ) | | | (21.94 | ) | | | (5.98 | ) | | | 0.00 | |
| | | | | | | | | | | | | | | | | | | | | | | | |
Total distributions | | | (23.73 | ) | | | (37.75 | ) | | | (41.32 | ) | | | (22.60 | ) | | | (5.98 | ) | | | 0.00 | |
| | | | | | | | | | | | | | | | | | | | | | | | |
Net Asset Value, End of Period | | $ | 224.02 | | | $ | 240.67 | | | $ | 280.08 | | | $ | 313.49 | | | $ | 243.89 | | | $ | 218.94 | |
| | | | | | | | | | | | | | | | | | | | | | | | |
Total Return (%) (b) | | | 2.98 | (c) | | | (1.74 | ) | | | 3.50 | | | | 40.68 | | | | 14.27 | | | | 0.34 | |
| | | | | | |
Ratios/Supplemental Data | | | | | | | | | | | | | | | | | | | | | | | | |
Gross ratio of expenses to average net assets (%) | | | 1.21 | (d) | | | 1.21 | | | | 1.21 | | | | 1.20 | | | | 1.22 | | | | 1.21 | |
Net ratio of expenses to average net assets (%) (e) | | | 1.14 | (d) | | | 1.13 | | | | 1.13 | | | | 1.13 | | | | 1.14 | | | | 1.16 | |
Ratio of net investment income (loss) to average net assets (%) | | | 0.26 | (d) | | | 0.18 | | | | 0.06 | | | | (0.07 | ) | | | 0.41 | | | | (0.19 | ) |
Portfolio turnover rate (%) | | | 17 | (c) | | | 36 | | | | 35 | | | | 36 | | | | 38 | | | | 49 | |
Net assets, end of period (in millions) | | $ | 155.5 | | | $ | 157.9 | | | $ | 179.5 | | | $ | 190.1 | | | $ | 151.2 | | | $ | 142.6 | |
Please see following page for Financial Highlights footnote legend.
See accompanying notes to financial statements.
MSF-12
Metropolitan Series Fund
Loomis Sayles Small Cap Core Portfolio
Financial Highlights
| | | | | | | | | | | | | | | | | | | | | | | | |
| Selected per share data | | | | | | | | | | | | | | | | | | |
| | | Class E | |
| | | Six Months
Ended
June 30,
2016
(Unaudited) | | | Year Ended December 31, | |
| | | | 2015
| | | 2014
| | | 2013
| | | 2012
| | | 2011
| |
Net Asset Value, Beginning of Period | | $ | 244.89 | | | $ | 284.11 | | | $ | 317.10 | | | $ | 246.44 | | | $ | 220.96 | | | $ | 219.99 | |
| | | | | | | | | | | | | | | | | | | | | | | | |
Income (Loss) from Investment Operations | | | | | | | | | | | | | | | | | | | | | | | | |
Net investment income (loss) (a) | | | 0.42 | | | | 0.76 | | | | 0.46 | | | | 0.09 | | | | 1.18 | | | | (0.22 | ) |
Net realized and unrealized gain (loss) on investments | | | 6.90 | | | | (2.23 | ) | | | 7.87 | | | | 93.41 | | | | 30.28 | | | | 1.19 | |
| | | | | | | | | | | | | | | | | | | | | | | | |
Total from investment operations | | | 7.32 | | | | (1.47 | ) | | | 8.33 | | | | 93.50 | | | | 31.46 | | | | 0.97 | |
| | | | | | | | | | | | | | | | | | | | | | | | |
Less Distributions | | | | | | | | | | | | | | | | | | | | | | | | |
Distributions from net investment income | | | (0.42 | ) | | | 0.00 | | | | 0.00 | | | | (0.90 | ) | | | 0.00 | | | | 0.00 | |
Distributions from net realized capital gains | | | (23.56 | ) | | | (37.75 | ) | | | (41.32 | ) | | | (21.94 | ) | | | (5.98 | ) | | | 0.00 | |
| | | | | | | | | | | | | | | | | | | | | | | | |
Total distributions | | | (23.98 | ) | | | (37.75 | ) | | | (41.32 | ) | | | (22.84 | ) | | | (5.98 | ) | | | 0.00 | |
| | | | | | | | | | | | | | | | | | | | | | | | |
Net Asset Value, End of Period | | $ | 228.23 | | | $ | 244.89 | | | $ | 284.11 | | | $ | 317.10 | | | $ | 246.44 | | | $ | 220.96 | |
| | | | | | | | | | | | | | | | | | | | | | | | |
Total Return (%) (b) | | | 3.03 | (c) | | | (1.64 | ) | | | 3.60 | | | | 40.83 | | | | 14.38 | | | | 0.44 | |
| | | | | | |
Ratios/Supplemental Data | | | | | | | | | | | | | | | | | | | | | | | | |
Gross ratio of expenses to average net assets (%) | | | 1.11 | (d) | | | 1.11 | | | | 1.11 | | | | 1.10 | | | | 1.12 | | | | 1.11 | |
Net ratio of expenses to average net assets (%) (e) | | | 1.04 | (d) | | | 1.03 | | | | 1.03 | | | | 1.03 | | | | 1.04 | | | | 1.06 | |
Ratio of net investment income (loss) to average net assets (%) | | | 0.36 | (d) | | | 0.28 | | | | 0.16 | | | | 0.03 | | | | 0.50 | | | | (0.10 | ) |
Portfolio turnover rate (%) | | | 17 | (c) | | | 36 | | | | 35 | | | | 36 | | | | 38 | | | | 49 | |
Net assets, end of period (in millions) | | $ | 28.3 | | | $ | 29.1 | | | $ | 33.9 | | | $ | 38.3 | | | $ | 33.1 | | | $ | 33.9 | |
| (a) | Per share amounts based on average shares outstanding during the period. |
| (b) | Total return does not reflect any insurance, sales, separate account or administrative charges of variable annuity or life insurance contracts or any additional expenses that contract owners may bear under their variable contracts. If these charges were included, the returns would be lower. |
| (c) | Periods less than one year are not computed on an annualized basis. |
| (d) | Computed on an annualized basis. |
| (e) | Includes the effects of management fee waivers (see Note 5 of the Notes to Financial Statements). |
See accompanying notes to financial statements.
MSF-13
Metropolitan Series Fund
Loomis Sayles Small Cap Core Portfolio
Notes to Financial Statements—June 30, 2016 (Unaudited)
1. Organization
Metropolitan Series Fund (the “Trust”) is organized as a Delaware statutory trust and registered under the Investment Company Act of 1940, as amended (the “1940 Act”), as an open-end management investment company. The Trust, which is managed by MetLife Advisers, LLC (“MetLife Advisers” or the “Adviser”), an affiliate of MetLife, Inc., is currently comprised of thirty series, each of which operates as a distinct investment vehicle of the Trust. The portfolio included in this report is Loomis Sayles Small Cap Core Portfolio (the “Portfolio”), which is diversified. Shares in the Portfolio are not offered directly to the general public and are currently available only to separate accounts established by Metropolitan Life Insurance Company (“MetLife”) and other affiliated life insurance companies.
The Portfolio has registered and offers three classes of shares: Class A, B and E shares. Shares of each Class of the Portfolio represent an equal pro rata interest in the Portfolio and generally give the shareholder the same voting, dividend, liquidation, and other rights. Investment income, realized and unrealized capital gains and losses, the common expenses of the Portfolio, and certain Portfolio-level expense reductions, if any, are allocated on a pro rata basis to each Class based on the relative net assets of each Class to the net assets of the Portfolio. Each Class of shares differs in its respective distribution plan and such distribution expenses are allocated to the corresponding Class of shares.
2. Significant Accounting Policies
The preparation of financial statements in conformity with accounting principles generally accepted in the United States of America (“GAAP”) requires management to make estimates and assumptions that affect the reported amounts of assets and liabilities and disclosure of contingent assets and liabilities as of the date of the financial statements and the reported amounts of income and expenses during the reporting period. Actual results could differ from those estimates. In the preparation of these financial statements, management has evaluated events and transactions subsequent to June 30, 2016 through the date the financial statements were issued.
The Portfolio is an investment company and follows the accounting and reporting guidance of the Financial Accounting Standards Board (“FASB”) Accounting Standards Codification Topic 946—Financial Services—Investment Companies and Topic 820—Fair Value Measurement. The following is a summary of significant accounting policies consistently followed by the Portfolio in the preparation of its financial statements.
Investment Valuation and Fair Value Measurements - Domestic and foreign equity securities, such as common stock, exchange-traded funds, rights, warrants, and preferred stock, that are traded on a securities exchange on a valuation date are generally valued at their last quoted sale price or official closing price on the primary exchange for such security, or, if no sales occurred on that day, at the last reported bid price. Equity securities traded over-the-counter (“OTC”) are generally valued at the last reported bid price. In the event of a major exchange closing during the trading day, the Adviser may use other market information obtained from quotation reporting systems, established market makers, or pricing services in valuing the securities. Valuation adjustments may be applied to certain foreign equity securities that are traded solely on foreign exchanges that close before the time as of which the Portfolio determines its NAV to account for the market movement between the close of the foreign exchanges and the time as of which the Portfolio determines its NAV. The Portfolio may use a systematic fair valuation model provided by a pricing service to value securities principally traded in these foreign markets in order to adjust for possible market movements or other changes that may occur between the close of the foreign exchanges and the time as of which the Portfolio determines its NAV. Foreign equity securities valued using these valuation adjustments are generally categorized as Level 2 within the fair value hierarchy. Equity securities that are actively traded, and have no valuation adjustments applied, are categorized as Level 1 within the fair value hierarchy. Other equity securities traded on inactive markets, or valued in reference to similar instruments traded on active markets, are generally categorized as Level 2 within the fair value hierarchy.
Investments in registered open-end management investment companies are valued at reported net asset value per share on the valuation date and are categorized as Level 1 within the fair value hierarchy.
Debt securities, including corporate, convertible and municipal bonds and notes; obligations of the U.S. Treasury and U.S. government agencies; foreign sovereign issues; and non-U.S. bonds, are generally valued on the basis of evaluated or composite bid quotations obtained from independent pricing services and/or brokers and dealers selected by the Adviser (each a “pricing service”), pursuant to authorization of and subject to general oversight by the Board of Trustees of the Trust (the “Board” or “Trustees”). Such pricing services may use matrix pricing, which considers observable inputs including, among other things, issuer details, maturity dates, interest rates, yield curves, rates of prepayment, credit risks/spreads, default rates, reported trades, broker dealer quotes and quoted prices for similar assets. Short-term obligations with a remaining maturity of sixty days or less may be valued at amortized cost in the absence of market quotes, so long as the amortized cost value of such short-term debt instrument is approximately the same as the fair value of the instrument as determined without the use of amortized cost valuation. Floating rate loans are generally valued on the basis of an evaluated or composite average of aggregate bid and ask quotations supplied by brokers or dealers, as obtained from the pricing service. Securities that use similar valuation techniques and inputs as described above are generally categorized as Level 2 within the fair value hierarchy.
MSF-14
Metropolitan Series Fund
Loomis Sayles Small Cap Core Portfolio
Notes to Financial Statements—June 30, 2016—(Continued)
Options, whether on securities, indices, futures contracts, or otherwise, traded on exchanges are valued at the last sale price available as of the close of business on a valuation day or, if there is no such price available, at the last reported bid price. These types of options are categorized as Level 1 within the fair value hierarchy. Futures contracts that are traded on commodity exchanges are valued at their settlement prices established by the exchanges on which they are traded as of the close of such exchanges and are categorized as Level 1 within the fair value hierarchy.
If no current market value quotation or other observable inputs are readily available or market value quotations are deemed to be unreliable for an investment, the fair value of the investment will be determined in accordance with procedures approved by, and under the general supervision of, the Board. In such a circumstance, the Board will be assisted in its responsibility to determine the fair value of an investment by the Valuation Committee (“Committee”) of MetLife Advisers. The Committee provides general pricing oversight and fair value pricing determinations related to portfolio securities and meets on a regular basis to review reports relating to the valuation of the securities in the Portfolio. The Board has delegated to State Street Bank and Trust Company, the Trust’s custodian (“custodian”), the responsibility for calculating the net asset values (“NAVs”) of the Trust’s Portfolios. The Committee is responsible for overseeing the calculation of the NAVs of the Portfolios by the custodian. The Committee also periodically reviews pricing services, including the pricing services providing fair value pricing for the Portfolio’s foreign securities, and is responsible for overseeing the correction of pricing errors and addressing other pricing issues that arise in the ordinary course of business, such as making real-time fair value determinations, as necessary.
No single standard for determining the fair value of an investment can be set forth because fair value depends upon the facts and circumstances with respect to each investment. Information relating to any relevant factors may be obtained by the Committee from any appropriate source, including the subadviser of the Portfolio, the custodian, a pricing service, market maker and/or broker for such security or the issuer. Appropriate methodologies for determining fair value under particular circumstances may include: matrix pricing, a discounted cash flow analysis, comparisons of securities with comparable characteristics, value based on multiples of earnings, discount from market price of similar marketable securities or a combination of these and other methods.
Investment Transactions and Related Investment Income - Portfolio security transactions are recorded on the trade date. Dividend income is recorded on the ex-dividend date or, for certain foreign securities, when notified. Interest income, which includes amortization of premium and accretion of discount on debt securities, is recorded on the accrual basis. Realized gains and losses on investments are determined on the identified cost basis, which is the same basis used for federal income tax purposes. Foreign income and foreign capital gains on some foreign securities may be subject to foreign taxes, which are accrued as applicable. These foreign taxes have been provided for in accordance with the Portfolio’s understanding of the applicable countries’ tax rules and rates.
Dividends and Distributions to Shareholders - The Portfolio records dividends and distributions on the ex-dividend date. Net realized gains from securities transactions (if any) are generally distributed annually to shareholders. The timing and characterization of certain income and capital gains distributions are determined in accordance with federal tax regulations that may differ from GAAP. Permanent book and tax basis differences relating to shareholder distributions will result in reclassification between under/over distributed net investment income, accumulated net realized gains/losses, and paid-in surplus. Book-tax differences are primarily due to broker commission recapture and real estate investment trust (REIT) adjustments. These adjustments have no impact on net assets or the results of operations.
Income Taxes - It is the Portfolio’s policy to comply with the requirements of the Internal Revenue Code of 1986, as amended, and regulations thereunder, applicable to regulated investment companies and to distribute, with respect to each taxable year, all of its taxable income to shareholders. Therefore, no federal income tax provision is required. The Portfolio files U.S. federal tax returns. No income tax returns are currently under examination. The Portfolio’s federal tax returns for the prior three fiscal years remain subject to examination by the Internal Revenue Service. As of June 30, 2016, the Portfolio had no uncertain tax positions that would require financial statement recognition, or de-recognition or disclosure.
Directed Brokerage Agreement - The Trust has entered into a directed brokerage arrangement with State Street Global Markets (“SSGM”). Under this arrangement, the Portfolio directs certain trades to SSGM in return for a recapture credit. SSGM issues a cash rebate to the Portfolio. Amounts paid to the Portfolio are shown separately as broker commission recapture on the Statement of Operations of the Portfolio. Additionally, these amounts have been excluded from the calculation of the net ratio of expenses to average net assets presented in the Financial Highlights for each share class.
Repurchase Agreements - The Portfolio may enter into repurchase agreements, under the terms of a Master Repurchase Agreement (“MRA”), with selected commercial banks and broker-dealers, under which the Portfolio acquires securities as collateral and agrees to resell the securities at an agreed-upon time and at an agreed-upon price. The Portfolio, through the custodian or a subcustodian, under a tri-party repurchase agreement, receives delivery of the underlying securities collateralizing any repurchase agreements. It is the Portfolio’s policy that the market value of the collateral be equal to at least 100% of the repurchase price in the case of a repurchase agreement of one-day duration and equal to at least 102% of the repurchase price in the case of all other repurchase agreements. In the event of default or failure by a party to perform an obligation in connection with any repurchase transaction, the MRA gives the non-defaulting party the right to set-off claims and to apply property held by it in connection with any repurchase transaction against obligations owed to it.
MSF-15
Metropolitan Series Fund
Loomis Sayles Small Cap Core Portfolio
Notes to Financial Statements—June 30, 2016—(Continued)
At June 30, 2016, the Portfolio had investments in repurchase agreements with a gross value of $7,444,640, which is included as part of investments at value on the Statement of Assets and Liabilities. The value of the related collateral exceeded the value of the repurchase agreements at June 30, 2016.
Securities Lending - The Portfolio may lend its portfolio securities to certain qualified brokers who borrow securities in order to complete certain securities transactions. By lending its portfolio securities, the Portfolio attempts to increase its net investment income through the receipt of income on collateral held from securities on loan. Any gain or loss in the market price of the loaned securities that might occur and any interest earned or dividends declared during the term of the loan would accrue to the account of the Portfolio.
The Trust has entered into a Securities Lending Authorization Agreement with the custodian as the lending agent. Under this agreement, the custodian is authorized to loan portfolio securities on the Portfolio’s behalf. In exchange, the Portfolio receives either cash or securities as collateral against the loaned securities. The Portfolio receives collateral equal to at least 102% of the market value of the loaned securities (105% for foreign equity securities), at each loan’s inception. Collateral representing at least 100% of the market value of the loaned securities must be maintained for the duration of the loan. Cash collateral is generally invested in the State Street Navigator Securities Lending MET Portfolio (the “Navigator Portfolio”), a series of the State Street Navigator Securities Lending Trust that is managed by an affiliate of the custodian. The Navigator Portfolio is a registered money market fund that invests in a variety of high-quality, U.S. dollar-denominated instruments. If the market value of the collateral at the close of trading on a business day is less than 100% of the market value of the loaned securities at the close of trading on that day, the borrower shall be required to deliver, by the close of business on the following business day, an additional amount of collateral, so that the total amount of posted collateral is equal to at least 100% of the market value of all the loaned securities as of such preceding day. A portion of net income (income after the deduction of expenses and fees of the Navigator Portfolio) on the collateral is rebated to the borrower of the securities and the remainder is split between the custodian and the Portfolio. On loans collateralized by U.S. Treasuries, a fee is received from the borrower and is allocated between the Portfolio and the custodian. Income received by the Portfolio in securities lending transactions during the six months ended June 30, 2016 is reflected as Securities lending income on the Statement of Operations. The values of any securities loaned by the Portfolio and the related collateral at June 30, 2016 are disclosed in the footnotes to the Schedule of Investments. The value of the related collateral received by the Portfolio exceeded the value of the securities out on loan at June 30, 2016.
The risks associated with lending portfolio securities include, but are not limited to, possible delays in receiving additional collateral or in the recovery of the loaned securities, possible loss of rights in the collateral should the borrower fail financially, as well as risk of loss in the value of the collateral or the value of the investments made with the collateral. The lending agent shall indemnify the Portfolio in the case of default of any securities borrower.
All securities on loan are classified as Common Stocks in the Portfolio’s Schedule of Investments as of June 30, 2016, with a contractual maturity of overnight and continuous.
3. Certain Risks
In the normal course of business, the Portfolio invests in securities and enters into transactions where risks exist due to fluctuations in the market (“market risk”) or failure of the other party to a transaction to perform (“credit and counterparty risk”).
Market Risk: The value of securities held by the Portfolio may decline in response to certain events, including those directly involving the companies whose securities are owned by the Portfolio; conditions affecting the general economy; overall market changes; local, regional or global political, social or economic instability; and currency, interest rate, and price fluctuations.
Credit and Counterparty Risk: The Portfolio may be exposed to counterparty risk, or the risk that an entity with which the Portfolio has unsettled or open transactions may default. The potential loss could exceed the value of the financial assets and liabilities recorded in the financial statements. Financial assets that potentially expose the Portfolio to credit and counterparty risk consist principally of cash due from counterparties and investments. The Portfolio manages counterparty risk by entering into agreements only with counterparties that it believes have the financial resources to honor their obligations and by monitoring the financial stability of those counterparties. The Portfolio’s investment adviser attempts to mitigate counterparty risk by (i) periodically assessing the creditworthiness of its trading partners, (ii) monitoring and/or limiting the amount of its net exposure to each individual counterparty based on its assessment, and (iii) requiring collateral from the counterparty for certain transactions. In order to preserve certain safeguards for non-standard settlement trades, the Portfolio restricts its exposure to credit and counterparty losses by entering into master netting agreements (“Master Agreements”) with counterparties (approved brokers) with whom it undertakes a significant volume of transactions. Master Agreements govern the terms of certain transactions, and reduce the counterparty risk associated with relevant transactions by specifying credit protection mechanisms and providing standardization that improves legal certainty. Master Agreements can also help limit counterparty risk by specifying collateral posting arrangements at pre-arranged exposure levels.
MSF-16
Metropolitan Series Fund
Loomis Sayles Small Cap Core Portfolio
Notes to Financial Statements—June 30, 2016—(Continued)
Repurchase and reverse repurchase agreements are primarily executed under Global Master Repurchase Agreements (“GMRAs”) or Master Repurchase Agreements (“MRAs”), which provide the rights to set-off. Each repurchase and reverse repurchase agreement is initially collateralized at the transaction level. In the event of default, the total market value exposure will be offset against collateral exchanged to date, which would result in a net receivable/(payable) that would be due from/to the counterparty.
Additional risks associated with each type of investment are described above within the respective security type notes. The Portfolio’s prospectus includes a discussion of the principal risks of investing in the Portfolio.
4. Investment Transactions
Aggregate cost of purchases and proceeds of sales of investment securities, excluding short-term securities, for the six months ended June 30, 2016 were as follows:
| | | | | | | | | | | | |
Purchases | | | Sales | |
U.S. Government | | Non U.S. Government | | | U.S. Government | | | Non U.S. Government | |
| $0 | | $ | 69,526,072 | | | $ | 0 | | | $ | 87,199,229 | |
5. Investment Management Fees and Other Transactions with Affiliates
Investment Management Agreement - MetLife Advisers is the investment adviser to the Portfolio. The Trust has entered into an investment management agreement with MetLife Advisers with respect to the Portfolio. For providing investment management services to the Portfolio, MetLife Advisers receives monthly compensation at the following annual rates:
| | | | | | |
Management
Fees earned by
MetLife Advisers
for the six months ended
June 30, 2016 | | % per annum | | | Average Daily Net Assets |
| $1,824,047 | | | 0.900 | % | | Of the first $500 million |
| | | 0.850 | % | | On amounts in excess of $500 million |
MetLife Advisers has entered into an investment subadvisory agreement with respect to managing the Portfolio. Loomis, Sayles & Company, L.P. is compensated by MetLife Advisers to provide subadvisory services for the Portfolio.
Management Fee Waivers - Pursuant to an expense agreement, MetLife Advisers has agreed, for the period May 1, 2016 to April 30, 2017, to reduce its advisory fees set out above under “Investment Management Agreement” for each class of the Portfolio as follows:
| | |
% per annum | | Average Daily Net Assets |
| 0.050% | | Of the first $200 million |
| 0.100% | | On the next $300 million |
| 0.050% | | On amounts in excess of $500 million |
An identical expense agreement was in place for the period May 1, 2015 to April 30, 2016. Amounts waived for the six months ended June 30, 2016 are shown as management fee waivers in the Statement of Operations.
Certain officers and trustees of the Trust may also be officers of MetLife Advisers; however, such officers and trustees receive no compensation from the Trust.
On January 12, 2016, MetLife, Inc. announced its plan to pursue the separation of a substantial portion of its retail segment and is currently evaluating structural alternatives for such separation. It is anticipated that MetLife Advisers would be included in any such separation. Any separation transaction that might occur will be subject to the satisfaction of various conditions and approvals, including approval of any transaction by the MetLife, Inc. Board of Directors, satisfaction of any applicable requirements of the SEC, and receipt of insurance and other regulatory approvals and other anticipated conditions. Because the form of a separation had yet to be determined, MetLife, Inc. cannot currently provide a specific potential completion date or information about the potential impact on MetLife Advisers. No assurance can be given regarding the form that a separation transaction may take or the specific terms thereof, or that a separation will in fact occur. Depending on the form a separation takes, MetLife Advisers’ continued service as investment adviser to the Trusts could be subject to the satisfaction of various conditions and approvals, which may include obtaining approvals from the Trusts’ Board and shareholders.
Transfer Agency Agreement - MetLife serves as the transfer agent for the Trust. MetLife receives no fees for its services to the Trust under the transfer agency agreement.
MSF-17
Metropolitan Series Fund
Loomis Sayles Small Cap Core Portfolio
Notes to Financial Statements—June 30, 2016—(Continued)
Distribution and Service Fees - The Trust has a distribution agreement with MetLife Investors Distribution Company (“MIDC” or the “Distributor”) in which MIDC serves as the distributor for the Portfolio’s Class A, B and E Shares. MIDC is a wholly-owned subsidiary of MetLife Investors Group, LLC, an affiliate of the Adviser. The Trust has also adopted a Distribution and Service Plan under Rule 12b-1 of the 1940 Act for the Portfolio’s Class B and E Shares. Under the Distribution and Service Plan, the Class B and E Shares of the Portfolio pay a fee to compensate the Insurance Companies (or their affiliates) and other broker-dealers and financial intermediaries involved in the offer and sale of Portfolio shares for promoting or selling and servicing the Class B and E Shares. The fees under the Distribution and Service Plan for each class of the Portfolio’s shares are calculated as a percentage of the Portfolio’s average daily net assets that are attributable to that Class. Currently, the fee is 0.25% per year for Class B Shares and 0.15% per year for Class E Shares. Amounts incurred by the Portfolio for the six months ended June 30, 2016 are shown as Distribution and service fees in the Statement of Operations.
Deferred Trustee Compensation - Each Trustee who is not currently an employee of the Adviser or any of its affiliates receives compensation from the Trust for his or her service to the Trust. A deferred compensation plan (the “Plan”) is available to the Trustees on a voluntary basis. Deferred amounts remain in the Trust until distributed in accordance with the provisions of the Plan. The value of a participating Trustee’s deferral account is based on theoretical investments of deferred amounts on the normal payment dates in certain portfolios of the Trust or Met Investors Series Trust, an affiliate of the Trust, as designated by the participating Trustee. Changes in the value of participants’ deferral accounts are reflected as Trustees’ fees and expenses in the Statement of Operations. The portion of the accrued obligations allocated to the Portfolio under the Plan is reflected as Deferred trustees’ fees in the Statement of Assets and Liabilities.
6. Contractual Obligations
Under the Trust’s organizational documents, its officers and Trustees may be indemnified against certain liabilities and expenses arising out of the performance of their duties to the Trust. Additionally, the Trust has a variety of indemnification obligations under contracts with its service providers. The Trust’s maximum exposure under these arrangements is unknown, as this would involve future claims that may be made against the Trust that have not yet occurred.
7. Income Tax Information
The tax character of distributions paid for the years ended December 31, 2015 and 2014 were as follows:
| | | | | | | | | | | | | | | | | | | | |
Ordinary Income | | | Long-Term Capital Gain | | | Total | |
2015 | | 2014 | | | 2015 | | | 2014 | | | 2015 | | | 2014 | |
| $410,528 | | $ | 4,891,539 | | | $ | 60,274,042 | | | $ | 60,270,034 | | | $ | 60,684,570 | | | $ | 65,161,573 | |
As of December 31, 2015, the components of distributable earnings (accumulated losses) on a federal income tax basis were as follows:
| | | | | | | | | | | | | | | | |
Undistributed
Ordinary
Income | | Undistributed
Long-Term
Capital Gain | | | Net
Unrealized
Appreciation | | | Other
Accumulated
Capital Losses | | | Total | |
| $1,345,980 | | $ | 38,932,878 | | | $ | 92,246,019 | | | $ | — | | | $ | 132,524,877 | |
The Portfolio utilizes the provisions of the federal income tax laws that provide for the carryforward of capital losses for prior years, offsetting such losses against any future realized capital gains. Under the Regulated Investment Company Modernization Act of 2010 (the “Act”), net capital losses recognized after December 22, 2010 may be carried forward indefinitely and their character is retained as short-term and/or long-term losses. Previously, net capital losses were carried forward for up to eight years and treated as short-term losses. As a transition rule, the Act requires that post-enactment net capital losses be used before pre-enactment net capital losses.
As of December 31, 2015, the Portfolio had no post-enactment accumulated capital losses and no pre-enactment accumulated capital loss carryforwards.
MSF-18
Metropolitan Series Fund
Loomis Sayles Small Cap Growth Portfolio
Managed By Loomis, Sayles & Company L.P.
Portfolio Manager Commentary*
PERFORMANCE
For the six month period ended June 30, 2016, the Class A, B and E shares of the Loomis Sayles Small Cap Growth Portfolio returned -1.86%, -1.96%, and -1.91%, respectively. The Portfolio’s benchmark, the Russell 2000 Growth Index1, returned -1.59%.
MARKET ENVIRONMENT / CONDITIONS
2016 began on a sour note as investors dealt with concerns over global economic trends, a potential hard landing in China, geopolitical events and collapsing commodity prices. By February 11, the S&P 500 Index had lost 10.5% and the Russell 2000 Index had declined 15.9%. After oil prices began to recover off multi-year lows and as fears about excessive tightening of monetary policy from the Federal Reserve abated, U.S. equity markets reversed course and eliminated all of their losses. Supporting factors for U.S. stocks during the period included an expected return to positive earnings growth during the second half of 2016, reduced deflation fears, and the diminishing likelihood of central bank interest rate increases in the near future. In fact, interest rates trended steadily lower during the second quarter, further supporting stock prices and highlighting the relatively attractive yields of certain equity market sectors. These factors offset various negative issues, including weaker labor data points, political uncertainty, terrorism threats, and finally, the implications of the U.K.‘s planned exit from the European Union. Small cap stocks underperformed large caps across most economic sectors, with the Russell 2000 Index advancing 2.2% and the S&P 500 Index returning 3.8%. Market leadership was pronounced, with the Utilities, Materials, Telecommunication Services, Consumer Staples and Financials sectors outperforming, and the Information Technology, Consumer Discretionary, Energy and Health Care sectors lagging. Given the composition of market leadership, small cap value outperformed small cap growth. After a protracted period of decline, a rebound in certain commodity prices drove the Materials sector’s outperformance. The remaining leading sectors represent highly defensive and more domestically-focused sectors, many of which offer higher dividend yields. Lagging sectors included the more economically-sensitive and global Consumer Discretionary and Information Technology stocks. While Energy stocks posted a strong rally in the latter half of the period after a difficult start to the year, the sector still finished the period with a negative return. The Russell 2000 Value Index gained 6.1% during the six months, while the Russell 2000 Growth Index declined 1.6%.
PORTFOLIO REVIEW / PERIOD END POSITIONING
The Portfolio’s underperformance during the period was primarily due to stock selection within the Industrials and Information Technology sectors, as well as an underweight to the Materials sector, which dramatically outperformed. Stock selection in the Health Care and Energy sectors contributed positively to relative performance.
The Portfolio’s largest detractors were Demandware, Acorda Therapeutics and Intra-Cellular Therapies. Software company Demandware reported a mixed quarter at a time when software stocks were selling off dramatically, which exacerbated the decline in the company’s stock price. Shares of biotechnology company Acorda were also down during the period due to renewed patent concerns. After gaining over 200% in 2015, shares of Intra-Cellular Therapies sold off significantly in the biotechnology industry’s broad downturn. In general, the strongest performers of 2015 suffered the largest losses during the dramatic selloff in 2016.
The Portfolio’s top contributors were FEI Company, MarketAxess and Diamondback Energy. FEI Company, which designs, manufactures and supports microscope technology, announced it would be acquired at an attractive premium by Thermo Fisher. MarketAxess, an electronic trading platform provider for fixed income markets, reported strong results. Though many fixed income markets are facing headwinds, the company’s trading volumes have increased and they continue to expand their offerings. Diamondback Energy was a strong performer despite pressures on energy markets during part of the period. The company was able to weather volatility in the commodity markets due to its higher-quality profile as a low-cost producer with a healthy balance sheet and alternative access to capital.
Sector weights during the six-month period did change in a few sectors on both an absolute and relative basis. The absolute changes were the result of individual stock decisions. The significant changes in our relative weights were due to Russell’s rebalancing of the Index, which caused changes to the Index’s sector weightings. Our weight in the Industrials sector increased during the period. Over the course of 2015 and even early into 2016, many Industrial-oriented names sold off significantly, often for reasons other than fundamental issues. We added selectively to our Industrials exposure when we found companies with solid fundamentals and good growth prospects that had sold off with the group in sympathy. Our Health Care and Information Technology weights decreased during the period. Some of the decrease in our Health Care exposure was purely due to market action; it was the worst-performing group in the small cap growth market (as measured by the Russell 2000 Growth Index) for the period. The downward pressure on many Health Care names, particularly biotechnology names, triggered our stop-loss risk management mechanism and we sold selected holdings from the Portfolio. Within Information Technology, we began to reduce our software and software-related exposure at the beginning of the period.
No strategy is built to weather all market environments, which has been clear to us for over a decade. Our simple view is that if we focus on buying the best growth companies that have yet to be exploited by the market and manage risk accordingly, we will positively serve our
MSF-1
Metropolitan Series Fund
Loomis Sayles Small Cap Growth Portfolio
Managed By Loomis, Sayles & Company L.P.
Portfolio Manager Commentary*—(Continued)
clients in most market environments. As we look around us, we see a number of macroeconomic and market challenges. We will not attempt to trade our way through these challenges or alter our process given the observations above. Our goal, as always, is to deliver a compelling level of positive risk-adjusted returns that compound over time.
Mark Burns
John Slavik
Portfolio Managers
Loomis, Sayles & Company L.P.
* This commentary may include statements that constitute “forward-looking statements” under the U.S. securities laws. Forward-looking statements include, among other things, projections, estimates, and information about possible or future results related to the Portfolio, market or regulatory developments. The views expressed above are not guarantees of future performance or economic results and involve certain risks, uncertainties and assumptions that could cause actual outcomes and results to differ materially from the views expressed herein. The views expressed above are subject to change at any time based upon economic, market, or other conditions and the subadvisory firm undertakes no obligation to update the views expressed herein. Any discussions of specific securities should not be considered a recommendation to buy or sell those securities. The views expressed above (including any forward-looking statement) may not be relied upon as investment advice or as an indication of the Portfolio’s trading intent. Information about the Portfolio’s holdings, asset allocation or country diversification is historical and is not an indication of future Portfolio composition, which may vary. Direct investment in any index is not possible. The performance of any index mentioned in this commentary has not been adjusted for ongoing management, distribution and operating expenses, and sales charges applicable to mutual fund investments. In addition, the returns do not reflect additional fees charged by separate accounts or variable insurance contracts that an investor in the Portfolio may pay. If these additional fees were reflected, performance would have been lower.
MSF-2
Metropolitan Series Fund
Loomis Sayles Small Cap Growth Portfolio
A $10,000 INVESTMENT COMPARED TO THE RUSSELL 2000 GROWTH INDEX
SIX MONTH RETURN & AVERAGE ANNUAL RETURNS (%) AS OF JUNE 30, 2016
| | | | | | | | | | | | | | | | |
| | | 6 Month | | | 1 Year | | | 5 Year | | | 10 Year | |
| Loomis Sayles Small Cap Growth Portfolio | | | | | | | | | | | | | | | | |
Class A | | | -1.86 | | | | -10.24 | | | | 8.60 | | | | 6.58 | |
Class B | | | -1.96 | | | | -10.52 | | | | 8.33 | | | | 6.32 | |
Class E | | | -1.91 | | | | -10.44 | | | | 8.43 | | | | 6.43 | |
| Russell 2000 Growth Index | | | -1.59 | | | | -10.75 | | | | 8.51 | | | | 7.14 | |
1 The Russell 2000 Growth Index is an unmanaged measure of performance of those Russell 2000 companies (small capitalization companies) that have higher price-to book ratios and higher forecasted growth values.
Portfolio performance is calculated including reinvestment of all income and capital gain distributions. Performance numbers are net of all Portfolio expenses but do not include any insurance, sales, separate account or administrative charges of variable annuity or life insurance contracts or any additional expenses that participants may bear relating to the operations of their plans. If these charges were included, the returns would be lower. The performance of any index referenced above has not been adjusted for ongoing management, distribution and operating expenses, and sales charges applicable to mutual fund investments. Direct investment in any index is not possible. The performance of Class A shares, as set forth in the line graph above, will differ from that of other classes because of the difference in expenses paid by policyholders investing in the different share classes.
This information represents past performance and is not indicative of future results. Investment return and principal value may fluctuate so that shares, upon redemption, may be worth more or less than the original cost.
PORTFOLIO COMPOSITION AS OF JUNE 30, 2016
Top Holdings
| | | | |
| | | % of
Net Assets | |
| MarketAxess Holdings, Inc. | | | 1.9 | |
| Ultimate Software Group, Inc. (The) | | | 1.8 | |
| Guidewire Software, Inc. | | | 1.7 | |
| Healthcare Services Group, Inc. | | | 1.7 | |
| Bright Horizons Family Solutions, Inc. | | | 1.6 | |
| Pool Corp. | | | 1.6 | |
| AMN Healthcare Services, Inc. | | | 1.4 | |
| Cynosure, Inc. - Class A | | | 1.4 | |
| WageWorks, Inc. | | | 1.4 | |
| MKS Instruments, Inc. | | | 1.3 | |
Top Sectors
| | | | |
| | | % of
Net Assets | |
| Information Technology | | | 25.1 | |
| Health Care | | | 24.5 | |
| Consumer Discretionary | | | 18.4 | |
| Industrials | | | 13.9 | |
| Financials | | | 9.8 | |
| Energy | | | 2.9 | |
| Telecommunication Services | | | 2.0 | |
| Consumer Staples | | | 1.7 | |
MSF-3
Metropolitan Series Fund
Loomis Sayles Small Cap Growth Portfolio
Understanding Your Portfolio’s Expenses (Unaudited)
Shareholder Expense Example
As a shareholder of the Portfolio, you incur ongoing costs, including management fees; distribution and service (12b-1) fees; and other Portfolio expenses. This example is intended to help you understand your ongoing costs (in dollars) (referred to as “expenses”) of investing in the Portfolio and compare these costs with the ongoing costs of investing in other mutual funds. The example is based on an investment of $1,000 invested at the beginning of the period and held for the entire period, January 1, 2016 through June 30, 2016.
Actual Expenses
The first line for each share class of the Portfolio in the table below provides information about actual account values and actual expenses. You may use the information in this line, together with the amount you invested in the particular share class of the Portfolio, to estimate the expenses that you paid over the period. Simply divide your account value by $1,000 (for example, an $8,600 account value divided by $1,000 = 8.6), then multiply the result by the number in the first line under the heading entitled “Expenses Paid During Period” to estimate the expenses you paid on your account during this period.
Hypothetical Example for Comparison Purposes
The second line for each share class of the Portfolio in the table below provides information about hypothetical account values and hypothetical expenses based on the Portfolio’s actual expense ratio and an assumed rate of return of 5% per year before expenses, which is not the Portfolio’s actual return. The hypothetical account values and expenses may not be used to estimate the actual ending account balance or expenses you paid for the period. You may use this information to compare the ongoing costs of investing in the Portfolio and other funds. To do so, compare this 5% hypothetical example with the 5% hypothetical examples that appear in the shareholder reports of the other funds.
Please note that the expenses shown in the table are meant to highlight your ongoing costs only and do not reflect any fees or charges of your variable insurance product or any additional expenses that participants in certain eligible qualified plans may bear relating to the operations of their plan. Therefore, the second line for each share class in the table is useful in comparing ongoing costs only, and will not help you determine the relative total costs of owning different funds. In addition, if these other costs were included, your costs would have been higher.
| | | | | | | | | | | | | | | | | | |
Loomis Sayles Small Cap Growth Portfolio | | | | Annualized
Expense
Ratio | | | Beginning
Account Value
January 1,
2016 | | | Ending
Account Value
June 30,
2016 | | | Expenses Paid
During Period**
January 1, 2016
to
June 30,
2016 | |
Class A(a) | | Actual | | | 0.87 | % | | $ | 1,000.00 | | | $ | 981.40 | | | $ | 4.29 | |
| | Hypothetical* | | | 0.87 | % | | $ | 1,000.00 | | | $ | 1,020.54 | | | $ | 4.37 | |
| | | | | |
Class B(a) | | Actual | | | 1.12 | % | | $ | 1,000.00 | | | $ | 980.40 | | | $ | 5.51 | |
| | Hypothetical* | | | 1.12 | % | | $ | 1,000.00 | | | $ | 1,019.29 | | | $ | 5.62 | |
| | | | | |
Class E(a) | | Actual | | | 1.02 | % | | $ | 1,000.00 | | | $ | 980.90 | | | $ | 5.02 | |
| | Hypothetical* | | | 1.02 | % | | $ | 1,000.00 | | | $ | 1,019.79 | | | $ | 5.12 | |
* Hypothetical assumes a rate of return of 5% per year before expenses.
** Expenses paid are equal to the Portfolio’s annualized expense ratio for the most recent six month period, as shown above, multiplied by the average account value over the period, multiplied by the number of days (182 days) in the most recent fiscal half-year, divided by 366 (to reflect the one-half year period).
(a) The annualized expense ratio shown reflects the impact of the management fee waiver as described in Note 5 of the Notes to Financial Statements.
MSF-4
Metropolitan Series Fund
Loomis Sayles Small Cap Growth Portfolio
Schedule of Investments as of June 30, 2016 (Unaudited)
Common Stocks—98.2% of Net Assets
| | | | | | | | |
| Security Description | | Shares | | | Value | |
|
Aerospace & Defense—1.0% | |
Hexcel Corp. (a) | | | 87,056 | | | $ | 3,625,012 | |
| | | | | | | | |
| | |
Auto Components—1.5% | | | | | | | | |
Drew Industries, Inc. | | | 27,432 | | | | 2,327,331 | |
Gentherm, Inc. (b) | | | 78,452 | | | | 2,686,981 | |
| | | | | | | | |
| | | | | | | 5,014,312 | |
| | | | | | | | |
| | |
Banks—4.7% | | | | | | | | |
Bank of the Ozarks, Inc. (a) | | | 78,217 | | | | 2,934,702 | |
Pinnacle Financial Partners, Inc. | | | 70,999 | | | | 3,468,301 | |
PrivateBancorp, Inc. | | | 96,392 | | | | 4,244,140 | |
Renasant Corp. | | | 52,301 | | | | 1,690,891 | |
Talmer Bancorp, Inc. - Class A | | | 201,257 | | | | 3,858,097 | |
| | | | | | | | |
| | | | | | | 16,196,131 | |
| | | | | | | | |
| | |
Biotechnology—3.4% | | | | | | | | |
Genomic Health, Inc. (a) (b) | | | 109,075 | | | | 2,824,497 | |
Ironwood Pharmaceuticals, Inc. (a) (b) | | | 260,761 | | | | 3,409,450 | |
Lexicon Pharmaceuticals, Inc. (a) (b) | | | 189,986 | | | | 2,726,299 | |
Ophthotech Corp. (a) (b) | | | 51,334 | | | | 2,619,574 | |
| | | | | | | | |
| | | | | | | 11,579,820 | |
| | | | | | | | |
| | |
Building Products—2.2% | | | | | | | | |
Apogee Enterprises, Inc. | | | 80,989 | | | | 3,753,840 | |
Trex Co., Inc. (a) (b) | | | 86,873 | | | | 3,902,335 | |
| | | | | | | | |
| | | | | | | 7,656,175 | |
| | | | | | | | |
|
Capital Markets—1.4% | |
Artisan Partners Asset Management, Inc. - Class A (a) | | | 97,072 | | | | 2,686,953 | |
Financial Engines, Inc. (a) | | | 85,356 | | | | 2,208,160 | |
| | | | | | | | |
| | | | | | | 4,895,113 | |
| | | | | | | | |
| | |
Commercial Services & Supplies—1.7% | | | | | | | | |
Healthcare Services Group, Inc. (a) | | | 141,502 | | | | 5,855,353 | |
| | | | | | | | |
|
Construction & Engineering—2.2% | |
Granite Construction, Inc. | | | 100,341 | | | | 4,570,532 | |
Primoris Services Corp. (a) | | | 157,402 | | | | 2,979,620 | |
| | | | | | | | |
| | | | | | | 7,550,152 | |
| | | | | | | | |
| | |
Distributors—1.6% | | | | | | | | |
Pool Corp. | | | 57,061 | | | | 5,365,446 | |
| | | | | | | | |
|
Diversified Consumer Services—3.6% | |
Bright Horizons Family Solutions, Inc. (b) | | | 81,852 | | | | 5,427,606 | |
Grand Canyon Education, Inc. (b) | | | 83,331 | | | | 3,326,574 | |
Nord Anglia Education, Inc. (a) (b) | | | 163,522 | | | | 3,456,855 | |
| | | | | | | | |
| | | | | | | 12,211,035 | |
| | | | | | | | |
|
Diversified Financial Services—1.8% | |
MarketAxess Holdings, Inc. | | | 43,750 | | | | 6,361,250 | |
| | | | | | | | |
|
Diversified Telecommunication Services—2.0% | |
Cogent Communications Holdings, Inc. (a) | | | 113,547 | | | | 4,548,693 | |
ORBCOMM, Inc. (b) | | | 232,220 | | | | 2,310,589 | |
| | | | | | | | |
| | | | | | | 6,859,282 | |
| | | | | | | | |
|
Electrical Equipment—1.0% | |
Generac Holdings, Inc. (a) (b) | | | 98,747 | | | | 3,452,195 | |
| | | | | | | | |
|
Electronic Equipment, Instruments & Components—1.8% | |
FEI Co. | | | 24,191 | | | | 2,585,534 | |
IPG Photonics Corp. (a) (b) | | | 43,645 | | | | 3,491,600 | |
| | | | | | | | |
| | | | | | | 6,077,134 | |
| | | | | | | | |
|
Energy Equipment & Services—0.8% | |
Dril-Quip, Inc. (b) | | | 48,013 | | | | 2,805,400 | |
| | | | | | | | |
| | |
Food Products—1.7% | | | | | | | | |
Amplify Snack Brands, Inc. (a) (b) | | | 207,875 | | | | 3,066,156 | |
Snyder’s-Lance, Inc. (a) | | | 79,703 | | | | 2,701,135 | |
| | | | | | | | |
| | | | | | | 5,767,291 | |
| | | | | | | | |
|
Health Care Equipment & Supplies—7.5% | |
Cynosure, Inc. - Class A (b) | | | 96,680 | | | | 4,702,998 | |
Globus Medical, Inc. - Class A (a) (b) | | | 119,719 | | | | 2,852,904 | |
Inogen, Inc. (a) (b) | | | 74,661 | | | | 3,741,263 | |
Insulet Corp. (a) (b) | | | 112,083 | | | | 3,389,390 | |
Integra LifeSciences Holdings Corp. (a) (b) | | | 54,615 | | | | 4,357,185 | |
Neogen Corp. (b) | | | 71,261 | | | | 4,008,431 | |
Nevro Corp. (b) | | | 35,707 | | | | 2,633,748 | |
Wright Medical Group NV (b) | | | 12,732 | | | | 221,155 | |
| | | | | | | | |
| | | | | | | 25,907,074 | |
| | | | | | | | |
|
Health Care Providers & Services—5.8% | |
Acadia Healthcare Co., Inc. (a) (b) | | | 64,200 | | | | 3,556,680 | |
Aceto Corp. (a) | | | 119,509 | | | | 2,616,052 | |
AMN Healthcare Services, Inc. (b) | | | 118,542 | | | | 4,738,124 | |
Amsurg Corp. (b) | | | 46,182 | | | | 3,580,952 | |
Ensign Group, Inc. (The) (a) | | | 132,995 | | | | 2,794,225 | |
HealthEquity, Inc. (a) (b) | | | 82,085 | | | | 2,494,153 | |
| | | | | | | | |
| | | | | | | 19,780,186 | |
| | | | | | | | |
| | |
Health Care Technology—3.1% | | | | | | | | |
Inovalon Holdings, Inc. - Class A (a) (b) | | | 140,635 | | | | 2,532,836 | |
Medidata Solutions, Inc. (a) (b) | | | 85,356 | | | | 4,000,636 | |
Press Ganey Holdings, Inc. (b) | | | 104,839 | | | | 4,125,415 | |
| | | | | | | | |
| | | | | | | 10,658,887 | |
| | | | | | | | |
|
Hotels, Restaurants & Leisure—5.3% | |
Chuy’s Holdings, Inc. (a) (b) | | | 115,378 | | | | 3,993,233 | |
Popeyes Louisiana Kitchen, Inc. (b) | | | 51,789 | | | | 2,829,751 | |
Texas Roadhouse, Inc. (a) | | | 79,446 | | | | 3,622,738 | |
Vail Resorts, Inc. (a) | | | 30,936 | | | | 4,276,283 | |
Zoe’s Kitchen, Inc. (a) (b) | | | 92,079 | | | | 3,339,705 | |
| | | | | | | | |
| | | | | | | 18,061,710 | |
| | | | | | | | |
See accompanying notes to financial statements.
MSF-5
Metropolitan Series Fund
Loomis Sayles Small Cap Growth Portfolio
Schedule of Investments as of June 30, 2016 (Unaudited)
Common Stocks—(Continued)
| | | | | | | | |
| Security Description | | Shares | | | Value | |
|
Household Durables—0.9% | |
Universal Electronics, Inc. (b) | | | 42,631 | | | $ | 3,081,369 | |
| | | | | | | | |
|
Internet & Catalog Retail—0.7% | |
Wayfair, Inc. - Class A (a) (b) | | | 59,022 | | | | 2,301,858 | |
| | | | | | | | |
|
Internet Software & Services—4.5% | |
Criteo S.A. (ADR) (b) | | | 97,150 | | | | 4,461,128 | |
LogMeIn, Inc. (b) | | | 47,722 | | | | 3,027,006 | |
Q2 Holdings, Inc. (a) (b) | | | 132,219 | | | | 3,704,776 | |
Wix.com, Ltd. (b) | | | 144,065 | | | | 4,372,373 | |
| | | | | | | | |
| | | | | | | 15,565,283 | |
| | | | | | | | |
| | |
IT Services—5.4% | | | | | | | | |
Blackhawk Network Holdings, Inc. (b) | | | 96,078 | | | | 3,217,652 | |
EPAM Systems, Inc. (a) (b) | | | 51,883 | | | | 3,336,596 | |
Euronet Worldwide, Inc. (b) | | | 65,822 | | | | 4,554,224 | |
ExlService Holdings, Inc. (b) | | | 57,285 | | | | 3,002,307 | |
InterXion Holding NV (b) | | | 121,994 | | | | 4,499,139 | |
| | | | | | | | |
| | | | | | | 18,609,918 | |
| | | | | | | | |
| | |
Leisure Products—1.2% | | | | | | | | |
Vista Outdoor, Inc. (b) | | | 87,867 | | | | 4,193,892 | |
| | | | | | | | |
|
Life Sciences Tools & Services—2.6% | |
Accelerate Diagnostics, Inc. (b) | | | 13,389 | | | | 192,668 | |
Cambrex Corp. (b) | | | 73,536 | | | | 3,804,017 | |
INC Research Holdings, Inc. - Class A (b) | | | 68,151 | | | | 2,598,598 | |
PRA Health Sciences, Inc. (a) (b) | | | 54,804 | | | | 2,288,615 | |
| | | | | | | | |
| | | | | | | 8,883,898 | |
| | | | | | | | |
| | |
Machinery—2.9% | | | | | | | | |
Astec Industries, Inc. | | | 57,326 | | | | 3,218,855 | |
Middleby Corp. (The) (b) | | | 32,505 | | | | 3,746,201 | |
RBC Bearings, Inc. (b) | | | 39,226 | | | | 2,843,885 | |
| | | | | | | | |
| | | | | | | 9,808,941 | |
| | | | | | | | |
|
Oil, Gas & Consumable Fuels—2.0% | |
Diamondback Energy, Inc. (b) | | | 42,970 | | | | 3,919,294 | |
PDC Energy, Inc. (b) | | | 53,191 | | | | 3,064,333 | |
| | | | | | | | |
| | | | | | | 6,983,627 | |
| | | | | | | | |
| | |
Pharmaceuticals—2.1% | | | | | | | | |
Dermira, Inc. (a) (b) | | | 63,878 | | | | 1,868,432 | |
Impax Laboratories, Inc. (b) | | | 93,620 | | | | 2,698,128 | |
Supernus Pharmaceuticals, Inc. (a) (b) | | | 133,532 | | | | 2,720,047 | |
| | | | | | | | |
| | | | | | | 7,286,607 | |
| | | | | | | | |
|
Professional Services—1.4% | |
WageWorks, Inc. (b) | | | 78,034 | | | | 4,667,213 | |
| | | | | | | | |
|
Real Estate Management & Development—0.9% | |
HFF, Inc. - Class A | | | 108,134 | | | | 3,122,910 | |
| | | | | | | | |
|
Semiconductors & Semiconductor Equipment—5.8% | |
Inphi Corp. (a) (b) | | | 116,058 | | | | 3,717,338 | |
Intersil Corp. - Class A | | | 265,380 | | | | 3,593,245 | |
MKS Instruments, Inc. | | | 106,748 | | | | 4,596,569 | |
Monolithic Power Systems, Inc. | | | 65,115 | | | | 4,448,657 | |
Silicon Laboratories, Inc. (b) | | | 76,360 | | | | 3,721,786 | |
| | | | | | | | |
| | | | | | | 20,077,595 | |
| | | | | | | | |
|
Software—7.6% | |
Blackbaud, Inc. | | | 62,866 | | | | 4,268,601 | |
Callidus Software, Inc. (a) (b) | | | 175,316 | | | | 3,502,814 | |
FleetMatics Group plc (b) | | | 81,643 | | | | 3,537,591 | |
Guidewire Software, Inc. (b) | | | 97,255 | | | | 6,006,469 | |
RingCentral, Inc. - Class A (a) (b) | | | 123,883 | | | | 2,442,973 | |
Ultimate Software Group, Inc. (The) (a) (b) | | | 29,759 | | | | 6,258,020 | |
| | | | | | | | |
| | | | | | | 26,016,468 | |
| | | | | | | | |
| | |
Specialty Retail—2.0% | | | | | | | | |
Monro Muffler Brake, Inc. (a) | | | 59,425 | | | | 3,777,053 | |
Tile Shop Holdings, Inc. (b) | | | 158,762 | | | | 3,156,188 | |
| | | | | | | | |
| | | | | | | 6,933,241 | |
| | | | | | | | |
|
Textiles, Apparel & Luxury Goods—1.7% | |
Columbia Sportswear Co. | | | 44,744 | | | | 2,574,570 | |
Steven Madden, Ltd. (b) | | | 98,432 | | | | 3,364,405 | |
| | | | | | | | |
| | | | | | | 5,938,975 | |
| | | | | | | | |
|
Thrifts & Mortgage Finance—0.9% | |
Essent Group, Ltd. (b) | | | 144,118 | | | | 3,143,213 | |
| | | | | | | | |
|
Trading Companies & Distributors—1.5% | |
Beacon Roofing Supply, Inc. (b) | | | 67,178 | | | | 3,054,584 | |
SiteOne Landscape Supply, Inc. (b) | | | 61,273 | | | | 2,082,669 | |
| | | | | | | | |
| | | | | | | 5,137,253 | |
| | | | | | | | |
Total Common Stocks
(Cost $278,420,450) | | | | | | | 337,431,219 | |
| | | | | | | | |
|
| Short-Term Investments—25.7% | |
| | |
Mutual Fund—23.7% | | | | | | | | |
State Street Navigator Securities Lending MET Portfolio (c) | | | 81,280,626 | | | | 81,280,626 | |
| | | | | | | | |
See accompanying notes to financial statements.
MSF-6
Metropolitan Series Fund
Loomis Sayles Small Cap Growth Portfolio
Schedule of Investments as of June 30, 2016 (Unaudited)
Short-Term Investments—(Continued)
| | | | | | | | |
| Security Description | | Principal
Amount* | | | Value | |
|
Repurchase Agreement—2.0% | |
Fixed Income Clearing Corp. Repurchase Agreement dated 06/30/16 at 0.030% to be repurchased at $6,810,759 on 07/01/16, collateralized by $6,740,000 U.S. Treasury Note at 1.750% due 12/31/20 with a value of $6,950,625. | | | 6,810,753 | | | $ | 6,810,753 | |
| | | | | | | | |
Total Short-Term Investments
(Cost $88,091,379) | | | | | | | 88,091,379 | |
| | | | | | | | |
Total Investments—123.9%
(Cost $366,511,829) (d) | | | | | | | 425,522,598 | |
Other assets and liabilities (net)—(23.9)% | | | | | | | (82,136,021 | ) |
| | | | | | | | |
| Net Assets—100.0% | | | | | | $ | 343,386,577 | |
| | | | | | | | |
| * | Principal amount stated in U.S. dollars unless otherwise noted. |
| (a) | All or a portion of the security was held on loan. As of June 30, 2016, the market value of securities loaned was $87,060,968 and the collateral received consisted of cash in the amount of $81,280,626 and non-cash collateral with a value of $6,712,537. The cash collateral is invested in a money market fund managed by an affiliate of the custodian. The non-cash collateral received consists primarily of government securities and bank letters of credit, and is held for the benefit of the Portfolio at the Portfolio’s custodian. The Portfolio cannot repledge or resell this collateral. As such, this collateral is excluded from the Statement of Assets and Liabilities. |
| (b) | Non-income producing security. |
| (c) | Represents investment of cash collateral received from securities on loan as of June 30, 2016. |
| (d) | As of June 30, 2016, the aggregate cost of investments was $366,511,829. The aggregate unrealized appreciation and depreciation of investments were $69,353,015 and $(10,342,246), respectively, resulting in net unrealized appreciation of $59,010,769. |
| (ADR)— | An American Depositary Receipt is a certificate issued by a custodian bank representing the right to receive securities of the foreign issuer described. Trading on exchanges not located in the United States or Canada significantly influences the value of ADRs. |
Fair Value Hierarchy
Accounting principles generally accepted in the United States of America (“GAAP”) define fair market value as the price that the Portfolio would receive to sell an asset or pay to transfer a liability in an orderly transaction between market participants at the measurement date. It establishes a fair value hierarchy that prioritizes inputs to valuation methods and requires disclosure of the fair value hierarchy, separately for each major category of assets and liabilities, that segregates fair value measurements into three levels. Levels 1, 2 and 3 of the fair value hierarchy are defined as follows:
Level 1 - unadjusted quoted prices in active markets for identical investments
Level 2 - other significant observable inputs (including, but not limited to, quoted prices for similar assets or liabilities in markets that are either active or inactive; inputs other than quoted prices that are observable such as interest rates, yield curves, volatilities, prepayment speeds, loss severities, credit risks, default rates, or other market corroborated inputs)
Level 3 - significant unobservable inputs based on the best information available in the circumstances, to the extent observable inputs are unavailable (including the Portfolio’s own assumptions used in determining the fair value of investments and derivative financial instruments)
The inputs or methodologies used for valuing investments are not necessarily an indication of the risk associated with investing in them. Changes to the inputs or methodologies used may result in transfers between levels, which will be recognized as of the beginning of the reporting period. Information on transfers between Level 1 and Level 2, if any, will be disclosed following the fair value hierarchy table below. A reconciliation of Level 3 securities, if any, will also be disclosed following the fair value hierarchy table. For more information about the Portfolio’s policy regarding the valuation of investments, please refer to the Notes to Financial Statements.
The following table summarizes the fair value hierarchy of the Portfolio’s investments as of June 30, 2016:
| | | | | | | | | | | | | | | | |
| Description | | Level 1 | | | Level 2 | | | Level 3 | | | Total | |
Total Common Stocks* | | $ | 337,431,219 | | | $ | — | | | $ | — | | | $ | 337,431,219 | |
| Short-Term Investments | | | | | | | | | | | | | | | | |
Mutual Fund | | | 81,280,626 | | | | — | | | | — | | | | 81,280,626 | |
Repurchase Agreement | | | — | | | | 6,810,753 | | | | — | | | | 6,810,753 | |
Total Short-Term Investments | | | 81,280,626 | | | | 6,810,753 | | | | — | | | | 88,091,379 | |
Total Investments | | $ | 418,711,845 | | | $ | 6,810,753 | | | $ | — | | | $ | 425,522,598 | |
| | | | | | | | | | | | | | | | | |
Collateral for Securities Loaned (Liability) | | $ | — | | | $ | (81,280,626 | ) | | $ | — | | | $ | (81,280,626 | ) |
| * | See Schedule of Investments for additional detailed categorizations. |
See accompanying notes to financial statements.
MSF-7
Metropolitan Series Fund
Loomis Sayles Small Cap Growth Portfolio
Statement of Assets and Liabilities
June 30, 2016 (Unaudited)
| | | | |
Assets | | | | |
Investments at value (a) (b) | | $ | 425,522,598 | |
Receivable for: | | | | |
Investments sold | | | 840,622 | |
Fund shares sold | | | 58,976 | |
Dividends and interest | | | 86,178 | |
Prepaid expenses | | | 2,217 | |
| | | | |
Total Assets | | | 426,510,591 | |
Liabilities | | | | |
Collateral for securities loaned | | | 81,280,626 | |
Payables for: | | | | |
Investments purchased | | | 1,143,611 | |
Fund shares redeemed | | | 280,785 | |
Accrued Expenses: | | | | |
Management fees | | | 229,358 | |
Distribution and service fees | | | 12,954 | |
Deferred trustees’ fees | | | 77,020 | |
Other expenses | | | 99,660 | |
| | | | |
Total Liabilities | | | 83,124,014 | |
| | | | |
Net Assets | | $ | 343,386,577 | |
| | | | |
Net Assets Consist of: | | | | |
Paid in surplus | | $ | 283,460,459 | |
Undistributed net investment income | | | 93,983 | |
Accumulated net realized gain | | | 821,366 | |
Unrealized appreciation on investments | | | 59,010,769 | |
| | | | |
Net Assets | | $ | 343,386,577 | |
| | | | |
Net Assets | | | | |
Class A | | $ | 277,538,557 | |
Class B | | | 59,502,659 | |
Class E | | | 6,345,361 | |
Capital Shares Outstanding* | | | | |
Class A | | | 24,312,340 | |
Class B | | | 5,521,187 | |
Class E | | | 573,874 | |
Net Asset Value, Offering Price and Redemption Price Per Share | | | | |
Class A | | $ | 11.42 | |
Class B | | | 10.78 | |
Class E | | | 11.06 | |
| * | The Portfolio is authorized to issue an unlimited number of shares. |
| (a) | Identified cost of investments was $366,511,829. |
| (b) | Includes securities loaned at value of $87,060,968. |
Statement of Operations
Six Months Ended June 30, 2016 (Unaudited)
| | | | |
Investment Income | | | | |
Dividends | | $ | 1,154,404 | |
Interest | | | 1,879 | |
Securities lending income | | | 584,877 | |
| | | | |
Total investment income | | | 1,741,160 | |
Expenses | | | | |
Management fees | | | 1,551,598 | |
Administration fees | | | 4,534 | |
Custodian and accounting fees | | | 22,817 | |
Distribution and service fees—Class B | | | 72,231 | |
Distribution and service fees—Class E | | | 4,561 | |
Audit and tax services | | | 20,230 | |
Legal | | | 13,588 | |
Trustees’ fees and expenses | | | 15,990 | |
Shareholder reporting | | | 18,190 | |
Insurance | | | 1,311 | |
Miscellaneous | | | 6,043 | |
| | | | |
Total expenses | | | 1,731,093 | |
Less management fee waiver | | | (147,536 | ) |
Less broker commission recapture | | | (12,050 | ) |
| | | | |
Net expenses | | | 1,571,507 | |
| | | | |
Net Investment Income | | | 169,653 | |
| | | | |
Net Realized and Unrealized Gain (Loss) | | | | |
Net realized gain on investments | | | 1,133,055 | |
| | | | |
Net change in unrealized depreciation on investments | | | (9,537,442 | ) |
| | | | |
Net realized and unrealized loss | | | (8,404,387 | ) |
| | | | |
Net Decrease in Net Assets From Operations | | $ | (8,234,734 | ) |
| | | | |
See accompanying notes to financial statements.
MSF-8
Metropolitan Series Fund
Loomis Sayles Small Cap Growth Portfolio
Statements of Changes in Net Assets
| | | | | | | | |
| | | Six Months
Ended
June 30, 2016
(Unaudited) | | | Year Ended
December 31,
2015 | |
Increase (Decrease) in Net Assets: | | | | | | | | |
From Operations | | | | | | | | |
Net investment income (loss) | | $ | 169,653 | | | $ | (1,260,982 | ) |
Net realized gain | | | 1,133,055 | | | | 37,917,212 | |
Net change in unrealized depreciation | | | (9,537,442 | ) | | | (26,535,612 | ) |
| | | | | | | | |
Increase (decrease) in net assets from operations | | | (8,234,734 | ) | | | 10,120,618 | |
| | | | | | | | |
From Distributions to Shareholders | | | | | | | | |
Net realized capital gains | | | | | | | | |
Class A | | | (30,426,236 | ) | | | (44,382,310 | ) |
Class B | | | (6,865,485 | ) | | | (9,707,264 | ) |
Class E | | | (718,244 | ) | | | (989,641 | ) |
| | | | | | | | |
Total distributions | | | (38,009,965 | ) | | | (55,079,215 | ) |
| | | | | | | | |
Increase (decrease) in net assets from capital share transactions | | | 8,054,839 | | | | (8,519,617 | ) |
| | | | | | | | |
Total decrease in net assets | | | (38,189,860 | ) | | | (53,478,214 | ) |
| | |
Net Assets | | | | | | | | |
Beginning of period | | | 381,576,437 | | | | 435,054,651 | |
| | | | | | | | |
End of period | | $ | 343,386,577 | | | $ | 381,576,437 | |
| | | | | | | | |
Accumulated undistributed net investment income (loss) | | | | | | | | |
End of period | | $ | 93,983 | | | $ | (75,670 | ) |
| | | | | | | | |
Other Information:
Capital Shares
Transactions in capital shares were as follows:
| | | | | | | | | | | | | | | | |
| | | Six Months Ended
June 30, 2016
(Unaudited) | | | Year Ended
December 31, 2015 | |
| | | Shares | | | Value | | | Shares | | | Value | |
Class A | | | | | | | | | | | | | | | | |
Sales | | | 289,106 | | | $ | 3,504,483 | | | | 645,881 | | | $ | 9,161,574 | |
Reinvestments | | | 2,678,366 | | | | 30,426,236 | | | | 3,105,830 | | | | 44,382,310 | |
Redemptions | | | (2,427,195 | ) | | | (29,990,938 | ) | | | (4,186,056 | ) | | | (62,909,035 | ) |
| | | | | | | | | | | | | | | | |
Net increase (decrease) | | | 540,277 | | | $ | 3,939,781 | | | | (434,345 | ) | | $ | (9,365,151 | ) |
| | | | | | | | | | | | | | | | |
Class B | | | | | | | | | | | | | | | | |
Sales | | | 205,848 | | | $ | 2,299,949 | | | | 404,722 | | | $ | 5,444,875 | |
Reinvestments | | | 640,437 | | | | 6,865,485 | | | | 713,245 | | | | 9,707,264 | |
Redemptions | | | (485,303 | ) | | | (5,521,240 | ) | | | (1,051,110 | ) | | | (14,562,399 | ) |
| | | | | | | | | | | | | | | | |
Net increase | | | 360,982 | | | $ | 3,644,194 | | | | 66,857 | | | $ | 589,740 | |
| | | | | | | | | | | | | | | | |
Class E | | | | | | | | | | | | | | | | |
Sales | | | 14,224 | | | $ | 173,158 | | | | 52,679 | | | $ | 746,067 | |
Reinvestments | | | 65,295 | | | | 718,244 | | | | 71,146 | | | | 989,641 | |
Redemptions | | | (35,824 | ) | | | (420,538 | ) | | | (106,077 | ) | | | (1,479,914 | ) |
| | | | | | | | | | | | | | | | |
Net increase | | | 43,695 | | | $ | 470,864 | | | | 17,748 | | | $ | 255,794 | |
| | | | | | | | | | | | | | | | |
Increase (decrease) derived from capital shares transactions | | | | | | $ | 8,054,839 | | | | | | | $ | (8,519,617 | ) |
| | | | | | | | | | | | | | | | |
See accompanying notes to financial statements.
MSF-9
Metropolitan Series Fund
Loomis Sayles Small Cap Growth Portfolio
Financial Highlights
| | | | | | | | | | | | | | | | | | | | | | | | |
| Selected per share data | | | | | | | | | | | | | | | | | | |
| | | Class A | |
| | | Six Months
Ended
June 30,
2016
(Unaudited) | | | Year Ended December 31, | |
| | | | 2015 | | | 2014 | | | 2013 | | | 2012 | | | 2011 | |
Net Asset Value, Beginning of Period | | $ | 13.07 | | | $ | 14.70 | | | $ | 16.55 | | | $ | 11.13 | | | $ | 10.01 | | | $ | 9.72 | |
| | | | | | | | | | | | | | | | | | | | | | | | |
Income (Loss) from Investment Operations | | | | | | | | | | | | | | | | | | | | | | | | |
Net investment income (loss) (a) | | | 0.01 | | | | (0.04 | ) | | | (0.06 | ) | | | (0.07 | ) | | | (0.03 | ) | | | (0.06 | ) |
Net realized and unrealized gain (loss) on investments | | | (0.26 | ) | | | 0.47 | | | | 0.11 | | | | 5.49 | | | | 1.15 | | | | 0.35 | |
| | | | | | | | | | | | | | | | | | | | | | | | |
Total from investment operations | | | (0.25 | ) | | | 0.43 | | | | 0.05 | | | | 5.42 | | | | 1.12 | | | | 0.29 | |
| | | | | | | | | | | | | | | | | | | | | | | | |
Less Distributions | | | | | | | | | | | | | | | | | | | | | | | | |
Distributions from net realized capital gains | | | (1.40 | ) | | | (2.06 | ) | | | (1.90 | ) | | | 0.00 | | | | 0.00 | | | | 0.00 | |
| | | | | | | | | | | | | | | | | | | | | | | | |
Total distributions | | | (1.40 | ) | | | (2.06 | ) | | | (1.90 | ) | | | 0.00 | | | | 0.00 | | | | 0.00 | |
| | | | | | | | | | | | | | | | | | | | | | | | |
Net Asset Value, End of Period | | $ | 11.42 | | | $ | 13.07 | | | $ | 14.70 | | | $ | 16.55 | | | $ | 11.13 | | | $ | 10.01 | |
| | | | | | | | | | | | | | | | | | | | | | | | |
Total Return (%) (b) | | | (1.86 | )(c) | | | 1.73 | | | | 1.22 | | | | 48.70 | | | | 11.19 | | | | 2.98 | |
| | | | | | |
Ratios/Supplemental Data | | | | | | | | | | | | | | | | | | | | | | | | |
Gross ratio of expenses to average net assets (%) | | | 0.96 | (d) | | | 0.95 | | | | 0.95 | | | | 0.95 | | | | 0.96 | | | | 0.96 | |
Net ratio of expenses to average net assets (%) (e) | | | 0.87 | (d) | | | 0.86 | | | | 0.86 | | | | 0.86 | | | | 0.87 | | | | 0.88 | |
Ratio of net investment income (loss) to average net assets (%) | | | 0.14 | (d) | | | (0.26 | ) | | | (0.40 | ) | | | (0.53 | ) | | | (0.26 | ) | | | (0.58 | ) |
Portfolio turnover rate (%) | | | 25 | (c) | | | 64 | | | | 56 | | | | 58 | | | | 74 | | | | 74 | |
Net assets, end of period (in millions) | | $ | 277.5 | | | $ | 310.7 | | | $ | 355.8 | | | $ | 402.4 | | | $ | 311.0 | | | $ | 354.8 | |
| |
| | | Class B | |
| | | Six Months
Ended
June 30,
2016
(Unaudited) | | | Year Ended December 31, | |
| | | | 2015 | | | 2014 | | | 2013 | | | 2012 | | | 2011 | |
Net Asset Value, Beginning of Period | | $ | 12.43 | | | $ | 14.11 | | | $ | 16.01 | | | $ | 10.79 | | | $ | 9.73 | | | $ | 9.47 | |
| | | | | | | | | | | | | | | | | | | | | | | | |
Income (Loss) from Investment Operations | | | | | | | | | | | | | | | | | | | | | | | | |
Net investment loss (a) | | | (0.01 | ) | | | (0.07 | ) | | | (0.09 | ) | | | (0.10 | ) | | | (0.05 | ) | | | (0.09 | ) |
Net realized and unrealized gain (loss) on investments | | | (0.24 | ) | | | 0.45 | | | | 0.09 | | | | 5.32 | | | | 1.11 | | | | 0.35 | |
| | | | | | | | | | | | | | | | | | | | | | | | |
Total from investment operations | | | (0.25 | ) | | | 0.38 | | | | 0.00 | | | | 5.22 | | | | 1.06 | | | | 0.26 | |
| | | | | | | | | | | | | | | | | | | | | | | | |
Less Distributions | | | | | | | | | | | | | | | | | | | | | | | | |
Distributions from net realized capital gains | | | (1.40 | ) | | | (2.06 | ) | | | (1.90 | ) | | | 0.00 | | | | 0.00 | | | | 0.00 | |
| | | | | | | | | | | | | | | | | | | | | | | | |
Total distributions | | | (1.40 | ) | | | (2.06 | ) | | | (1.90 | ) | | | 0.00 | | | | 0.00 | | | | 0.00 | |
| | | | | | | | | | | | | | | | | | | | | | | | |
Net Asset Value, End of Period | | $ | 10.78 | | | $ | 12.43 | | | $ | 14.11 | | | $ | 16.01 | | | $ | 10.79 | | | $ | 9.73 | |
| | | | | | | | | | | | | | | | | | | | | | | | |
Total Return (%) (b) | | | (1.96 | )(c) | | | 1.43 | | | | 0.94 | | | | 48.38 | | | | 10.89 | | | | 2.75 | |
| | | | | | |
Ratios/Supplemental Data | | | | | | | | | | | | | | | | | | | | | | | | |
Gross ratio of expenses to average net assets (%) | | | 1.21 | (d) | | | 1.20 | | | | 1.20 | | | | 1.20 | | | | 1.21 | | | | 1.21 | |
Net ratio of expenses to average net assets (%) (e) | | | 1.12 | (d) | | | 1.11 | | | | 1.11 | | | | 1.11 | | | | 1.12 | | | | 1.13 | |
Ratio of net investment loss to average net assets (%) | | | (0.10 | )(d) | | | (0.51 | ) | | | (0.65 | ) | | | (0.77 | ) | | | (0.51 | ) | | | (0.86 | ) |
Portfolio turnover rate (%) | | | 25 | (c) | | | 64 | | | | 56 | | | | 58 | | | | 74 | | | | 74 | |
Net assets, end of period (in millions) | | $ | 59.5 | | | $ | 64.2 | | | $ | 71.9 | | | $ | 80.7 | | | $ | 60.4 | | | $ | 61.8 | |
Please see following page for Financial Highlights footnote legend.
See accompanying notes to financial statements.
MSF-10
Metropolitan Series Fund
Loomis Sayles Small Cap Growth Portfolio
Financial Highlights
| | | | | | | | | | | | | | | | | | | | | | | | |
| Selected per share data | | | | | | | | | | | | | | | | | | |
| | | Class E | |
| | | Six Months
Ended
June 30,
2016
(Unaudited) | | | Year Ended December 31, | |
| | | | 2015 | | | 2014 | | | 2013 | | | 2012 | | | 2011 | |
Net Asset Value, Beginning of Period | | $ | 12.71 | | | $ | 14.37 | | | $ | 16.25 | | | $ | 10.94 | | | $ | 9.86 | | | $ | 9.58 | |
| | | | | | | | | | | | | | | | | | | | | | | | |
Income (Loss) from Investment Operations | | | | | | | | | | | | | | | | | | | | | | | | |
Net investment income (loss) (a) | | | (0.00 | )(f) | | | (0.06 | ) | | | (0.08 | ) | | | (0.09 | ) | | | (0.04 | ) | | | (0.08 | ) |
Net realized and unrealized gain (loss) on investments | | | (0.25 | ) | | | 0.46 | | | | 0.10 | | | | 5.40 | | | | 1.12 | | | | 0.36 | |
| | | | | | | | | | | | | | | | | | | | | | | | |
Total from investment operations | | | (0.25 | ) | | | 0.40 | | | | 0.02 | | | | 5.31 | | | | 1.08 | | | | 0.28 | |
| | | | | | | | | | | | | | | | | | | | | | | | |
Less Distributions | | | | | | | | | | | | | | | | | | | | | | | | |
Distributions from net realized capital gains | | | (1.40 | ) | | | (2.06 | ) | | | (1.90 | ) | | | 0.00 | | | | 0.00 | | | | 0.00 | |
| | | | | | | | | | | | | | | | | | | | | | | | |
Total distributions | | | (1.40 | ) | | | (2.06 | ) | | | (1.90 | ) | | | 0.00 | | | | 0.00 | | | | 0.00 | |
| | | | | | | | | | | | | | | | | | | | | | | | |
Net Asset Value, End of Period | | $ | 11.06 | | | $ | 12.71 | | | $ | 14.37 | | | $ | 16.25 | | | $ | 10.94 | | | $ | 9.86 | |
| | | | | | | | | | | | | | | | | | | | | | | | |
Total Return (%) (b) | | | (1.91 | )(c) | | | 1.55 | | | | 1.05 | | | | 48.54 | | | | 10.95 | | | | 2.92 | |
| | | | | | |
Ratios/Supplemental Data | | | | | | | | | | | | | | | | | | | | | | | | |
Gross ratio of expenses to average net assets (%) | | | 1.11 | (d) | | | 1.10 | | | | 1.10 | | | | 1.10 | | | | 1.11 | | | | 1.11 | |
Net ratio of expenses to average net assets (%) (e) | | | 1.02 | (d) | | | 1.01 | | | | 1.01 | | | | 1.01 | | | | 1.02 | | | | 1.03 | |
Ratio of net investment loss to average net assets (%) | | | (0.01 | )(d) | | | (0.41 | ) | | | (0.55 | ) | | | (0.67 | ) | | | (0.41 | ) | | | (0.76 | ) |
Portfolio turnover rate (%) | | | 25 | (c) | | | 64 | | | | 56 | | | | 58 | | | | 74 | | | | 74 | |
Net assets, end of period (in millions) | | $ | 6.3 | | | $ | 6.7 | | | $ | 7.4 | | | $ | 8.7 | | | $ | 6.3 | | | $ | 6.9 | |
| (a) | Per share amounts based on average shares outstanding during the period. |
| (b) | Total return does not reflect any insurance, sales, separate account or administrative charges of variable annuity or life insurance contracts or any additional expenses that contract owners may bear under their variable contracts. If these charges were included, the returns would be lower. |
| (c) | Periods less than one year are not computed on an annualized basis. |
| (d) | Computed on an annualized basis. |
| (e) | Includes the effects of management fee waivers (see Note 5 of the Notes to Financial Statements). |
| (f) | Net investment loss was less than $0.01. |
See accompanying notes to financial statements.
MSF-11
Metropolitan Series Fund
Loomis Sayles Small Cap Growth Portfolio
Notes to Financial Statements—June 30, 2016 (Unaudited)
1. Organization
Metropolitan Series Fund (the “Trust”) is organized as a Delaware statutory trust and registered under the Investment Company Act of 1940, as amended (the “1940 Act”), as an open-end management investment company. The Trust, which is managed by MetLife Advisers, LLC (“MetLife Advisers” or the “Adviser”), an affiliate of MetLife, Inc., is currently comprised of thirty series, each of which operates as a distinct investment vehicle of the Trust. The portfolio included in this report is Loomis Sayles Small Cap Growth Portfolio (the “Portfolio”), which is diversified. Shares in the Portfolio are not offered directly to the general public and are currently available only to separate accounts established by Metropolitan Life Insurance Company (“MetLife”) and other affiliated life insurance companies.
The Portfolio has registered and offers three classes of shares: Class A, B and E shares. Shares of each Class of the Portfolio represent an equal pro rata interest in the Portfolio and generally give the shareholder the same voting, dividend, liquidation, and other rights. Investment income, realized and unrealized capital gains and losses, the common expenses of the Portfolio, and certain Portfolio-level expense reductions, if any, are allocated on a pro rata basis to each Class based on the relative net assets of each Class to the net assets of the Portfolio. Each Class of shares differs in its respective distribution plan and such distribution expenses are allocated to the corresponding Class of shares.
2. Significant Accounting Policies
The preparation of financial statements in conformity with accounting principles generally accepted in the United States of America (“GAAP”) requires management to make estimates and assumptions that affect the reported amounts of assets and liabilities and disclosure of contingent assets and liabilities as of the date of the financial statements and the reported amounts of income and expenses during the reporting period. Actual results could differ from those estimates. In the preparation of these financial statements, management has evaluated events and transactions subsequent to June 30, 2016 through the date the financial statements were issued.
The Portfolio is an investment company and follows the accounting and reporting guidance of the Financial Accounting Standards Board (“FASB”) Accounting Standards Codification Topic 946—Financial Services—Investment Companies and Topic 820—Fair Value Measurement. The following is a summary of significant accounting policies consistently followed by the Portfolio in the preparation of its financial statements.
Investment Valuation and Fair Value Measurements - Domestic and foreign equity securities, such as common stock, exchange-traded funds, rights, warrants, and preferred stock, that are traded on a securities exchange on a valuation date are generally valued at their last quoted sale price or official closing price on the primary exchange for such security, or, if no sales occurred on that day, at the last reported bid price. Equity securities traded over-the-counter (“OTC”) are generally valued at the last reported bid price. In the event of a major exchange closing during the trading day, the Adviser may use other market information obtained from quotation reporting systems, established market makers, or pricing services in valuing the securities. Valuation adjustments may be applied to certain foreign equity securities that are traded solely on foreign exchanges that close before the time as of which the Portfolio determines its NAV to account for the market movement between the close of the foreign exchanges and the time as of which the Portfolio determines its NAV. The Portfolio may use a systematic fair valuation model provided by a pricing service to value securities principally traded in these foreign markets in order to adjust for possible market movements or other changes that may occur between the close of the foreign exchanges and the time as of which the Portfolio determines its NAV. Foreign equity securities valued using these valuation adjustments are generally categorized as Level 2 within the fair value hierarchy. Equity securities that are actively traded, and have no valuation adjustments applied, are categorized as Level 1 within the fair value hierarchy. Other equity securities traded on inactive markets, or valued in reference to similar instruments traded on active markets, are generally categorized as Level 2 within the fair value hierarchy.
Investments in registered open-end management investment companies are valued at reported net asset value per share on the valuation date and are categorized as Level 1 within the fair value hierarchy.
Debt securities, including corporate, convertible and municipal bonds and notes; obligations of the U.S. Treasury and U.S. government agencies; foreign sovereign issues; and non-U.S. bonds, are generally valued on the basis of evaluated or composite bid quotations obtained from independent pricing services and/or brokers and dealers selected by the Adviser (each a “pricing service”), pursuant to authorization of and subject to general oversight by the Board of Trustees of the Trust (the “Board” or “Trustees”). Such pricing services may use matrix pricing, which considers observable inputs including, among other things, issuer details, maturity dates, interest rates, yield curves, rates of prepayment, credit risks/spreads, default rates, reported trades, broker dealer quotes and quoted prices for similar assets. Short-term obligations with a remaining maturity of sixty days or less may be valued at amortized cost in the absence of market quotes, so long as the amortized cost value of such short-term debt instrument is approximately the same as the fair value of the instrument as determined without the use of amortized cost valuation. Floating rate loans are generally valued on the basis of an evaluated or composite average of aggregate bid and ask quotations supplied by brokers or dealers, as obtained from the pricing service. Securities that use similar valuation techniques and inputs as described above are generally categorized as Level 2 within the fair value hierarchy.
MSF-12
Metropolitan Series Fund
Loomis Sayles Small Cap Growth Portfolio
Notes to Financial Statements—June 30, 2016—(Continued)
Options, whether on securities, indices, futures contracts, or otherwise, traded on exchanges are valued at the last sale price available as of the close of business on a valuation day or, if there is no such price available, at the last reported bid price. These types of options are categorized as Level 1 within the fair value hierarchy. Futures contracts that are traded on commodity exchanges are valued at their settlement prices established by the exchanges on which they are traded as of the close of such exchanges and are categorized as Level 1 within the fair value hierarchy.
If no current market value quotation or other observable inputs are readily available or market value quotations are deemed to be unreliable for an investment, the fair value of the investment will be determined in accordance with procedures approved by, and under the general supervision of, the Board. In such a circumstance, the Board will be assisted in its responsibility to determine the fair value of an investment by the Valuation Committee (“Committee”) of MetLife Advisers. The Committee provides general pricing oversight and fair value pricing determinations related to portfolio securities and meets on a regular basis to review reports relating to the valuation of the securities in the Portfolio. The Board has delegated to State Street Bank and Trust Company, the Trust’s custodian (“custodian”), the responsibility for calculating the net asset values (“NAVs”) of the Trust’s Portfolios. The Committee is responsible for overseeing the calculation of the NAVs of the Portfolios by the custodian. The Committee also periodically reviews pricing services, including the pricing services providing fair value pricing for the Portfolio’s foreign securities, and is responsible for overseeing the correction of pricing errors and addressing other pricing issues that arise in the ordinary course of business, such as making real-time fair value determinations, as necessary.
No single standard for determining the fair value of an investment can be set forth because fair value depends upon the facts and circumstances with respect to each investment. Information relating to any relevant factors may be obtained by the Committee from any appropriate source, including the subadviser of the Portfolio, the custodian, a pricing service, market maker and/or broker for such security or the issuer. Appropriate methodologies for determining fair value under particular circumstances may include: matrix pricing, a discounted cash flow analysis, comparisons of securities with comparable characteristics, value based on multiples of earnings, discount from market price of similar marketable securities or a combination of these and other methods.
Investment Transactions and Related Investment Income - Portfolio security transactions are recorded on the trade date. Dividend income is recorded on the ex-dividend date or, for certain foreign securities, when notified. Interest income, which includes amortization of premium and accretion of discount on debt securities, is recorded on the accrual basis. Realized gains and losses on investments are determined on the identified cost basis, which is the same basis used for federal income tax purposes. Foreign income and foreign capital gains on some foreign securities may be subject to foreign taxes, which are accrued as applicable. These foreign taxes have been provided for in accordance with the Portfolio’s understanding of the applicable countries’ tax rules and rates.
Dividends and Distributions to Shareholders - The Portfolio records dividends and distributions on the ex-dividend date. Net realized gains from securities transactions (if any) are generally distributed annually to shareholders. The timing and characterization of certain income and capital gains distributions are determined in accordance with federal tax regulations that may differ from GAAP. Permanent book and tax basis differences relating to shareholder distributions will result in reclassification between under/over distributed net investment income, accumulated net realized gains/losses, and paid-in surplus. Book-tax differences are primarily due to net operating losses and broker commission recapture. These adjustments have no impact on net assets or the results of operations.
Income Taxes - It is the Portfolio’s policy to comply with the requirements of the Internal Revenue Code of 1986, as amended, and regulations thereunder, applicable to regulated investment companies and to distribute, with respect to each taxable year, all of its taxable income to shareholders. Therefore, no federal income tax provision is required. The Portfolio files U.S. federal tax returns. No income tax returns are currently under examination. The Portfolio’s federal tax returns for the prior three fiscal years remain subject to examination by the Internal Revenue Service. As of June 30, 2016, the Portfolio had no uncertain tax positions that would require financial statement recognition, or de-recognition or disclosure.
Directed Brokerage Agreement - The Trust has entered into a directed brokerage arrangement with State Street Global Markets (“SSGM”). Under this arrangement, the Portfolio directs certain trades to SSGM in return for a recapture credit. SSGM issues a cash rebate to the Portfolio. Amounts paid to the Portfolio are shown separately as broker commission recapture on the Statement of Operations of the Portfolio. Additionally, these amounts have been excluded from the calculation of the net ratio of expenses to average net assets presented in the Financial Highlights for each share class.
Repurchase Agreements - The Portfolio may enter into repurchase agreements, under the terms of a Master Repurchase Agreement (“MRA”), with selected commercial banks and broker-dealers, under which the Portfolio acquires securities as collateral and agrees to resell the securities at an agreed-upon time and at an agreed-upon price. The Portfolio, through the custodian or a subcustodian, under a tri-party repurchase agreement, receives delivery of the underlying securities collateralizing any repurchase agreements. It is the Portfolio’s policy that the market value of the collateral be equal to at least 100% of the repurchase price in the case of a repurchase agreement of one-day duration and equal to at least 102% of the repurchase price in the case of all other repurchase agreements. In the event of default or failure by a party to perform an obligation in connection with any repurchase transaction, the MRA gives the non-defaulting party the right to set-off claims and to apply property held by it in connection with any repurchase transaction against obligations owed to it.
MSF-13
Metropolitan Series Fund
Loomis Sayles Small Cap Growth Portfolio
Notes to Financial Statements—June 30, 2016—(Continued)
At June 30, 2016, the Portfolio had investments in repurchase agreements with a gross value of $6,810,753, which is included as part of investments at value on the Statement of Assets and Liabilities. The value of the related collateral exceeded the value of the repurchase agreements at June 30, 2016.
Securities Lending - The Portfolio may lend its portfolio securities to certain qualified brokers who borrow securities in order to complete certain securities transactions. By lending its portfolio securities, the Portfolio attempts to increase its net investment income through the receipt of income on collateral held from securities on loan. Any gain or loss in the market price of the loaned securities that might occur and any interest earned or dividends declared during the term of the loan would accrue to the account of the Portfolio.
The Trust has entered into a Securities Lending Authorization Agreement with the custodian as the lending agent. Under this agreement, the custodian is authorized to loan portfolio securities on the Portfolio’s behalf. In exchange, the Portfolio receives either cash or securities as collateral against the loaned securities. The Portfolio receives collateral equal to at least 102% of the market value of the loaned securities (105% for foreign equity securities), at each loan’s inception. Collateral representing at least 100% of the market value of the loaned securities must be maintained for the duration of the loan. Cash collateral is generally invested in the State Street Navigator Securities Lending MET Portfolio (the “Navigator Portfolio”), a series of the State Street Navigator Securities Lending Trust that is managed by an affiliate of the custodian. The Navigator Portfolio is a registered money market fund that invests in a variety of high-quality, U.S. dollar-denominated instruments. If the market value of the collateral at the close of trading on a business day is less than 100% of the market value of the loaned securities at the close of trading on that day, the borrower shall be required to deliver, by the close of business on the following business day, an additional amount of collateral, so that the total amount of posted collateral is equal to at least 100% of the market value of all the loaned securities as of such preceding day. A portion of net income (income after the deduction of expenses and fees of the Navigator Portfolio) on the collateral is rebated to the borrower of the securities and the remainder is split between the custodian and the Portfolio. On loans collateralized by U.S. Treasuries, a fee is received from the borrower and is allocated between the Portfolio and the custodian. Income received by the Portfolio in securities lending transactions during the six months ended June 30, 2016 is reflected as Securities lending income on the Statement of Operations. The values of any securities loaned by the Portfolio and the related collateral at June 30, 2016 are disclosed in the footnotes to the Schedule of Investments. The value of the related collateral received by the Portfolio exceeded the value of the securities out on loan at June 30, 2016.
The risks associated with lending portfolio securities include, but are not limited to, possible delays in receiving additional collateral or in the recovery of the loaned securities, possible loss of rights in the collateral should the borrower fail financially, as well as risk of loss in the value of the collateral or the value of the investments made with the collateral. The lending agent shall indemnify the Portfolio in the case of default of any securities borrower.
All securities on loan are classified as Common Stocks in the Portfolio’s Schedule of Investments as of June 30, 2016, with a contractual maturity of overnight and continuous.
3. Certain Risks
In the normal course of business, the Portfolio invests in securities and enters into transactions where risks exist due to fluctuations in the market (“market risk”) or failure of the other party to a transaction to perform (“credit and counterparty risk”).
Market Risk: The value of securities held by the Portfolio may decline in response to certain events, including those directly involving the companies whose securities are owned by the Portfolio; conditions affecting the general economy; overall market changes; local, regional or global political, social or economic instability; and currency, interest rate, and price fluctuations.
Credit and Counterparty Risk: The Portfolio may be exposed to counterparty risk, or the risk that an entity with which the Portfolio has unsettled or open transactions may default. The potential loss could exceed the value of the financial assets and liabilities recorded in the financial statements. Financial assets that potentially expose the Portfolio to credit and counterparty risk consist principally of cash due from counterparties and investments. The Portfolio manages counterparty risk by entering into agreements only with counterparties that it believes have the financial resources to honor their obligations and by monitoring the financial stability of those counterparties. The Portfolio’s investment adviser attempts to mitigate counterparty risk by (i) periodically assessing the creditworthiness of its trading partners, (ii) monitoring and/or limiting the amount of its net exposure to each individual counterparty based on its assessment, and (iii) requiring collateral from the counterparty for certain transactions. In order to preserve certain safeguards for non-standard settlement trades, the Portfolio restricts its exposure to credit and counterparty losses by entering into master netting agreements (“Master Agreements”) with counterparties (approved brokers) with whom it undertakes a significant volume of transactions. Master Agreements govern the terms of certain transactions, and reduce the counterparty risk associated with relevant transactions by specifying credit protection mechanisms and providing standardization that improves legal certainty. Master Agreements can also help limit counterparty risk by specifying collateral posting arrangements at pre-arranged exposure levels.
Repurchase and reverse repurchase agreements are primarily executed under Global Master Repurchase Agreements (“GMRAs”) or Master Repurchase Agreements (“MRAs”), which provide the rights to set-off. Each repurchase and reverse repurchase agreement is
MSF-14
Metropolitan Series Fund
Loomis Sayles Small Cap Growth Portfolio
Notes to Financial Statements—June 30, 2016—(Continued)
initially collateralized at the transaction level. In the event of default, the total market value exposure will be offset against collateral exchanged to date, which would result in a net receivable/(payable) that would be due from/to the counterparty.
Additional risks associated with each type of investment are described above within the respective security type notes. The Portfolio’s prospectus includes a discussion of the principal risks of investing in the Portfolio.
4. Investment Transactions
Aggregate cost of purchases and proceeds of sales of investment securities, excluding short-term securities, for the six months ended June 30, 2016 were as follows:
| | | | | | | | | | | | |
Purchases | | | Sales | |
U.S. Government | | Non U.S. Government | | | U.S. Government | | | Non U.S. Government | |
| $0 | | $ | 85,465,947 | | | $ | 0 | | | $ | 111,805,000 | |
5. Investment Management Fees and Other Transactions with Affiliates
Investment Management Agreement - MetLife Advisers is the investment adviser to the Portfolio. The Trust has entered into an investment management agreement with MetLife Advisers with respect to the Portfolio. For providing investment management services to the Portfolio, MetLife Advisers receives monthly compensation at the following annual rates:
| | | | | | |
Management
Fees earned by
MetLife Advisers
for the six months ended
June 30, 2016 | | % per annum | | | Average Daily Net Assets |
| $1,551,598 | | | 0.900 | % | | Of the first $500 million |
| | | 0.850 | % | | On amounts in excess of $500 million |
MetLife Advisers has entered into an investment subadvisory agreement with respect to managing the Portfolio. Loomis, Sayles & Company, L.P. is compensated by MetLife Advisers to provide subadvisory services for the Portfolio.
Management Fee Waivers - Pursuant to an expense agreement, MetLife Advisers has agreed, for the period May 1, 2016 to April 30, 2017, to reduce its advisory fees set out above under “Investment Management Agreement” for each class of the Portfolio as follows:
| | |
% per annum | | Average Daily Net Assets |
| 0.050% | | On the first $100 million |
| 0.100% | | On the next $400 million |
| 0.050% | | On amounts in excess of $500 million |
An identical expense agreement was in place for the period May 1, 2015 to April 30, 2016. Amounts waived for the six months ended June 30, 2016 are shown as management fee waivers in the Statement of Operations.
Certain officers and trustees of the Trust may also be officers of MetLife Advisers; however, such officers and trustees receive no compensation from the Trust.
On January 12, 2016, MetLife, Inc. announced its plan to pursue the separation of a substantial portion of its retail segment and is currently evaluating structural alternatives for such separation. It is anticipated that MetLife Advisers would be included in any such separation. Any separation transaction that might occur will be subject to the satisfaction of various conditions and approvals, including approval of any transaction by the MetLife, Inc. Board of Directors, satisfaction of any applicable requirements of the SEC, and receipt of insurance and other regulatory approvals and other anticipated conditions. Because the form of a separation had yet to be determined, MetLife, Inc. cannot currently provide a specific potential completion date or information about the potential impact on MetLife Advisers. No assurance can be given regarding the form that a separation transaction may take or the specific terms thereof, or that a separation will in fact occur. Depending on the form a separation takes, MetLife Advisers’ continued service as investment adviser to the Trusts could be subject to the satisfaction of various conditions and approvals, which may include obtaining approvals from the Trusts’ Board and shareholders.
Transfer Agency Agreement - MetLife serves as the transfer agent for the Trust. MetLife receives no fees for its services to the Trust under the transfer agency agreement.
Distribution and Service Fees - The Trust has a distribution agreement with MetLife Investors Distribution Company (“MIDC” or the “Distributor”) in which MIDC serves as the distributor for the Portfolio’s Class A, B and E Shares. MIDC is a wholly-owned subsidiary of MetLife Investors Group, LLC, an affiliate of the Adviser. The Trust has also adopted a Distribution and Service Plan under Rule 12b-1
MSF-15
Metropolitan Series Fund
Loomis Sayles Small Cap Growth Portfolio
Notes to Financial Statements—June 30, 2016—(Continued)
of the 1940 Act for the Portfolio’s Class B and E Shares. Under the Distribution and Service Plan, the Class B and E Shares of the Portfolio pay a fee to compensate the Insurance Companies (or their affiliates) and other broker-dealers and financial intermediaries involved in the offer and sale of Portfolio shares for promoting or selling and servicing the Class B and E Shares. The fees under the Distribution and Service Plan for each class of the Portfolio’s shares are calculated as a percentage of the Portfolio’s average daily net assets that are attributable to that Class. Currently, the fee is 0.25% per year for Class B Shares and 0.15% per year for Class E Shares. Amounts incurred by the Portfolio for the six months ended June 30, 2016 are shown as Distribution and service fees in the Statement of Operations.
Deferred Trustee Compensation - Each Trustee who is not currently an employee of the Adviser or any of its affiliates receives compensation from the Trust for his or her service to the Trust. A deferred compensation plan (the “Plan”) is available to the Trustees on a voluntary basis. Deferred amounts remain in the Trust until distributed in accordance with the provisions of the Plan. The value of a participating Trustee’s deferral account is based on theoretical investments of deferred amounts on the normal payment dates in certain portfolios of the Trust or Met Investors Series Trust, an affiliate of the Trust, as designated by the participating Trustee. Changes in the value of participants’ deferral accounts are reflected as Trustees’ fees and expenses in the Statement of Operations. The portion of the accrued obligations allocated to the Portfolio under the Plan is reflected as Deferred trustees’ fees in the Statement of Assets and Liabilities.
6. Contractual Obligations
Under the Trust’s organizational documents, its officers and Trustees may be indemnified against certain liabilities and expenses arising out of the performance of their duties to the Trust. Additionally, the Trust has a variety of indemnification obligations under contracts with its service providers. The Trust’s maximum exposure under these arrangements is unknown, as this would involve future claims that may be made against the Trust that have not yet occurred.
7. Income Tax Information
The tax character of distributions paid for the years ended December 31, 2015 and 2014 were as follows:
| | | | | | | | | | | | | | | | | | | | |
Ordinary Income | | | Long-Term Capital Gain | | | Total | |
2015 | | 2014 | | | 2015 | | | 2014 | | | 2015 | | | 2014 | |
| $— | | $ | — | | | $ | 55,079,215 | | | $ | 54,710,352 | | | $ | 55,079,215 | | | $ | 54,710,352 | |
As of December 31, 2015, the components of distributable earnings (accumulated losses) on a federal income tax basis were as follows:
| | | | | | | | | | | | | | | | |
Undistributed
Ordinary
Income | | Undistributed
Long-Term
Capital Gain | | | Net
Unrealized
Appreciation | | | Other
Accumulated
Capital Losses | | | Total | |
| $— | | $ | 37,894,857 | | | $ | 68,351,631 | | | $ | — | | | $ | 106,246,488 | |
The Portfolio utilizes the provisions of the federal income tax laws that provide for the carryforward of capital losses for prior years, offsetting such losses against any future realized capital gains. Under the Regulated Investment Company Modernization Act of 2010 (the “Act”), net capital losses recognized after December 22, 2010 may be carried forward indefinitely and their character is retained as short-term and/or long-term losses. Previously, net capital losses were carried forward for up to eight years and treated as short-term losses. As a transition rule, the Act requires that post-enactment net capital losses be used before pre-enactment net capital losses.
As of December 31, 2015, the Portfolio had no post-enactment accumulated capital losses and no pre-enactment accumulated capital loss carryforwards.
MSF-16
Metropolitan Series Fund
Met/Artisan Mid Cap Value Portfolio
Managed By Artisan Partners Limited Partnership
Portfolio Manager Commentary*
PERFORMANCE
For the six month period ended June 30, 2016, the Class A, B and E shares of the Met/Artisan Mid Cap Value Portfolio returned 9.85%, 9.71%, and 9.77%, respectively. The Portfolio’s benchmark, the Russell Midcap Value Index1, returned 8.87%.
MARKET ENVIRONMENT / CONDITIONS
The year started on a turbulent note as stocks moved largely in lockstep with crude oil prices, which plummeted before rallying off February lows. Areas of the market (e.g., Industrials, Energy, and Materials) that had been unloved for some time seemed to find their footing, as the strong momentum factors that have been a headwind over the last few years briefly abated. Markets had become increasingly bifurcated in recent quarters, with growing differentials between sectors and styles. In first of quarter of 2016, a number of those factors showed signs of reversing, with value outperforming growth, and cyclical sectors with greater global exposure (e.g. Industrials, Energy, Materials) outperforming non-cyclical sectors with greater U.S. exposure (e.g. Health Care, Financials). However, following the surprising news of the U.K. decision to leave the European Union (“Brexit”) in June, investors gravitated towards more stable, U.S.-centric areas of the market.
U.S. stocks advanced across the market-cap spectrum during the second quarter of 2016. The Russell Midcap Value Index was among the best performing areas, outperforming the Russell Midcap Growth Index. Gold prices extended their rally, and oil prices sustained their rebound off February lows, buoying the Energy and Materials sectors. The low-interest rate environment continued, which benefitted broadly Utilities, Consumer Staples and real estate investment trusts (“REITs), driven by investors motivated for yield and stability.
PORTFOLIO REVIEW / PERIOD END POSITIONING
The Portfolio outpaced the Russell Midcap Value Index during the period. Strong stock selection and a rebound in a number of our more cyclical exposed holdings has driven results. The uptick in gold prices boosted shares of gold miners Kinross Gold (Canada) and Goldcorp (Canada), putting them among our top performing stocks. More recently, gold price weakness made a handful of quality gold mining companies look cheap in our view. Further, both Goldcorp and Kinross have low-cost reserves and are controlling their below-industry costs.
The Portfolio’s Energy holdings as a whole were strong, with particular strength in Devon, Apache and Hess. Our process is geared toward investing in low expectation situations, which often occur in areas of the market where high levels of fear and anxiety exist. Over the past few years, fear and anxiety in energy stocks have been palpable, leading us to invest in a number of quality energy companies selling at attractive valuations. To that end, we used the dip in commodity prices in the first quarter of 2016 to build on our positions in these names. As fundamental supply and demand pressures in oil markets show signs of rebalancing, oil prices have rebounded, benefiting a number of our holdings.
Conversely, the Portfolio’s above-benchmark exposure to the index-lagging Consumer Discretionary sector was a headwind. Global macro concerns resulted in broad-based selling in the sector, and the Portfolio’s above-benchmark positioning was a headwind. In addition, some of our holdings had company-specific setbacks, putting them among our bottom individual performers.
Shares of global aircraft leasing company Air Lease also weighed on results. Concerns surrounding over-building in the industry and slowing growth in emerging markets (China in particular) have weighed on shares. The stock looks very cheap to us—it’s trading near previous trough levels—despite solid fundamentals. We believe the company is one of the best operators in the leasing space with one of the best management teams. Further, it has an investment-grade credit rating, helping mitigate financing risks while providing a competitive advantage.
During the six months ended June 30, 2016, we initiated a position in drug distribution company AmerisourceBergen, the Portfolio’s sole Health Care holding. We believe it’s an above-average business that has managed to compound value well over time. The company returns a good deal of cash flow to shareholders via dividends and share repurchases, and it has a management team financially aligned from a ROIC basis. We also increased the Portfolio’s exposure to the Consumer Discretionary sector over the period, in part through the purchase of AutoNation, a North American auto retailer. The company has a diversified portfolio of original equipment manufacturer (OEM) dealers spanning the domestic, import and luxury segments.
We were fairly active in the Energy sector during the period. We took advantage of the rebound in stock prices to exit positions in exploration and production companies Denbury Resources, SM Energy and Southwestern Energy due to concerns over their long-term financial positions.
We exited the Portfolio’s lone Consumer Staples holding Kroger during the period. The Portfolio’s exposure to the Utilities sector was reduced during the period with the sale of Edison International and SCANA Corp. In both cases, we sold on as the stock prices hit our target selling range.
As of June 30, 2016, the Portfolio was overweight the Consumer Discretionary, Information Technology, Industrials, Materials and Energy sectors. We construct our portfolios from the bottom-up without regard to the construction of the benchmark. Accordingly, we are going to be heavier in areas where we are finding more opportunities that meet our investment criteria. Conversely, the Portfolio
MSF-1
Metropolitan Series Fund
Met/Artisan Mid Cap Value Portfolio
Managed By Artisan Partners Limited Partnership
Portfolio Manager Commentary*—(Continued)
was underweight the Utilities, Financials, Consumer Staples, Health Care and Telecommunication Services sectors, as valuations in these areas of the market have broadly appeared stretched.
James C. Kieffer
Scott C. Satterwhite
George O. Sertl
Daniel L. Kane
Portfolio Managers
Artisan Partners Limited Partnership
* This commentary may include statements that constitute “forward-looking statements” under the U.S. securities laws. Forward-looking statements include, among other things, projections, estimates, and information about possible or future results related to the Portfolio, market or regulatory developments. The views expressed above are not guarantees of future performance or economic results and involve certain risks, uncertainties and assumptions that could cause actual outcomes and results to differ materially from the views expressed herein. The views expressed above are subject to change at any time based upon economic, market, or other conditions and the subadvisory firm undertakes no obligation to update the views expressed herein. Any discussions of specific securities should not be considered a recommendation to buy or sell those securities. The views expressed above (including any forward-looking statement) may not be relied upon as investment advice or as an indication of the Portfolio’s trading intent. Information about the Portfolio’s holdings, asset allocation or country diversification is historical and is not an indication of future Portfolio composition, which may vary. Direct investment in any index is not possible. The performance of any index mentioned in this commentary has not been adjusted for ongoing management, distribution and operating expenses, and sales charges applicable to mutual fund investments. In addition, the returns do not reflect additional fees charged by separate accounts or variable insurance contracts that an investor in the Portfolio may pay. If these additional fees were reflected, performance would have been lower.
MSF-2
Metropolitan Series Fund
Met/Artisan Mid Cap Value Portfolio
A $10,000 INVESTMENT COMPARED TO THE RUSSELL MIDCAP VALUE INDEX
SIX MONTH RETURN & AVERAGE ANNUAL RETURNS (%) AS OF JUNE 30, 2016
| | | | | | | | | | | | | | | | |
| | | 6 Month | | | 1 Year | | | 5 Year | | | 10 Year | |
| Met/Artisan Mid Cap Value Portfolio | | | | | | | | | | | | | | | | |
Class A | | | 9.85 | | | | -0.91 | | | | 8.40 | | | | 4.28 | |
Class B | | | 9.71 | | | | -1.16 | | | | 8.13 | | | | 4.02 | |
Class E | | | 9.77 | | | | -1.05 | | | | 8.24 | | | | 4.12 | |
| Russell Midcap Value Index | | | 8.87 | | | | 3.25 | | | | 11.70 | | | | 7.79 | |
1 The Russell Midcap Value Index is an unmanaged measure of performance of those Russell Midcap companies (the 800 smallest companies in the Russell 1000 Index) with lower price-to-book ratios and forecasted growth values.
Portfolio performance is calculated including reinvestment of all income and capital gain distributions. Performance numbers are net of all Portfolio expenses but do not include any insurance, sales, separate account or administrative charges of variable annuity or life insurance contracts or any additional expenses that participants may bear relating to the operations of their plans. If these charges were included, the returns would be lower. The performance of any index referenced above has not been adjusted for ongoing management, distribution and operating expenses, and sales charges applicable to mutual fund investments. Direct investment in any index is not possible. The performance of Class A shares, as set forth in the line graph above, will differ from that of other classes because of the difference in expenses paid by policyholders investing in the different share classes.
This information represents past performance and is not indicative of future results. Investment return and principal value may fluctuate so that shares, upon redemption, may be worth more or less than the original cost.
PORTFOLIO COMPOSITION AS OF JUNE 30, 2016
Top Holdings
| | | | |
| | | % of
Net Assets | |
| Devon Energy Corp. | | | 3.6 | |
| Alleghany Corp. | | | 3.2 | |
| Apache Corp. | | | 3.1 | |
| Arrow Electronics, Inc. | | | 3.0 | |
| Hess Corp. | | | 2.9 | |
| Avnet, Inc. | | | 2.8 | |
| Air Lease Corp. | | | 2.7 | |
| Mosaic Co. (The) | | | 2.6 | |
| Jacobs Engineering Group, Inc. | | | 2.6 | |
| Goldcorp, Inc. | | | 2.5 | |
Top Sectors
| | | | |
| | | % of
Net Assets | |
| Financials | | | 22.5 | |
| Consumer Discretionary | | | 16.9 | |
| Industrials | | | 15.3 | |
| Information Technology | | | 14.1 | |
| Energy | | | 11.4 | |
| Materials | | | 10.6 | |
| Health Care | | | 1.7 | |
| Utilities | | | 1.6 | |
MSF-3
Metropolitan Series Fund
Met/Artisan Mid Cap Value Portfolio
Understanding Your Portfolio’s Expenses (Unaudited)
Shareholder Expense Example
As a shareholder of the Portfolio, you incur ongoing costs, including management fees; distribution and service (12b-1) fees; and other Portfolio expenses. This example is intended to help you understand your ongoing costs (in dollars) (referred to as “expenses”) of investing in the Portfolio and compare these costs with the ongoing costs of investing in other mutual funds. The example is based on an investment of $1,000 invested at the beginning of the period and held for the entire period, January 1, 2016 through June 30, 2016.
Actual Expenses
The first line for each share class of the Portfolio in the table below provides information about actual account values and actual expenses. You may use the information in this line, together with the amount you invested in the particular share class of the Portfolio, to estimate the expenses that you paid over the period. Simply divide your account value by $1,000 (for example, an $8,600 account value divided by $1,000 = 8.6), then multiply the result by the number in the first line under the heading entitled “Expenses Paid During Period” to estimate the expenses you paid on your account during this period.
Hypothetical Example for Comparison Purposes
The second line for each share class of the Portfolio in the table below provides information about hypothetical account values and hypothetical expenses based on the Portfolio’s actual expense ratio and an assumed rate of return of 5% per year before expenses, which is not the Portfolio’s actual return. The hypothetical account values and expenses may not be used to estimate the actual ending account balance or expenses you paid for the period. You may use this information to compare the ongoing costs of investing in the Portfolio and other funds. To do so, compare this 5% hypothetical example with the 5% hypothetical examples that appear in the shareholder reports of the other funds.
Please note that the expenses shown in the table are meant to highlight your ongoing costs only and do not reflect any fees or charges of your variable insurance product or any additional expenses that participants in certain eligible qualified plans may bear relating to the operations of their plan. Therefore, the second line for each share class in the table is useful in comparing ongoing costs only, and will not help you determine the relative total costs of owning different funds. In addition, if these other costs were included, your costs would have been higher.
| | | | | | | | | | | | | | | | | | |
Met/Artisan Mid Cap Value Portfolio | | | | Annualized
Expense
Ratio | | | Beginning
Account Value
January 1,
2016 | | | Ending
Account Value
June 30,
2016 | | | Expenses Paid
During Period**
January 1, 2016
to
June 30,
2016 | |
Class A | | Actual | | | 0.85 | % | | $ | 1,000.00 | | | $ | 1,098.50 | | | $ | 4.43 | |
| | Hypothetical* | | | 0.85 | % | | $ | 1,000.00 | | | $ | 1,020.64 | | | $ | 4.27 | |
| | | | | |
Class B | | Actual | | | 1.10 | % | | $ | 1,000.00 | | | $ | 1,097.10 | | | $ | 5.74 | |
| | Hypothetical* | | | 1.10 | % | | $ | 1,000.00 | | | $ | 1,019.39 | | | $ | 5.52 | |
| | | | | |
Class E | | Actual | | | 1.00 | % | | $ | 1,000.00 | | | $ | 1,097.70 | | | $ | 5.22 | |
| | Hypothetical* | | | 1.00 | % | | $ | 1,000.00 | | | $ | 1,019.89 | | | $ | 5.02 | |
* Hypothetical assumes a rate of return of 5% per year before expenses.
** Expenses paid are equal to the Portfolio’s annualized expense ratio for the most recent six month period, as shown above, multiplied by the average account value over the period, multiplied by the number of days (182 days) in the most recent fiscal half-year, divided by 366 (to reflect the one-half year period).
MSF-4
Metropolitan Series Fund
Met/Artisan Mid Cap Value Portfolio
Schedule of Investments as of June 30, 2016 (Unaudited)
Common Stocks—94.2% of Net Assets
| | | | | | | | |
| Security Description | | Shares | | | Value | |
|
Aerospace & Defense—1.9% | |
Rockwell Collins, Inc. (a) | | | 235,723 | | | $ | 20,069,456 | |
| | | | | | | | |
|
Auto Components—1.8% | |
Gentex Corp. (a) | | | 1,234,706 | | | | 19,076,208 | |
| | | | | | | | |
|
Automobiles—1.6% | |
Harley-Davidson, Inc. (a) | | | 376,361 | | | | 17,049,153 | |
| | | | | | | | |
|
Banks—4.1% | |
Fifth Third Bancorp | | | 1,385,289 | | | | 24,367,233 | |
M&T Bank Corp. (a) | | | 169,852 | | | | 20,081,602 | |
| | | | | | | | |
| | | | | | | 44,448,835 | |
| | | | | | | | |
|
Chemicals—4.9% | |
Celanese Corp. - Series A | | | 378,272 | | | | 24,757,903 | |
Mosaic Co. (The) (a) | | | 1,073,184 | | | | 28,095,957 | |
| | | | | | | | |
| | | | | | | 52,853,860 | |
| | | | | | | | |
|
Construction & Engineering—5.4% | |
Fluor Corp. | | | 447,918 | | | | 22,073,399 | |
Jacobs Engineering Group, Inc. (b) | | | 549,305 | | | | 27,360,882 | |
Quanta Services, Inc. (b) | | | 370,851 | | | | 8,574,075 | |
| | | | | | | | |
| | | | | | | 58,008,356 | |
| | | | | | | | |
|
Diversified Consumer Services—1.5% | |
H&R Block, Inc. (a) | | | 699,154 | | | | 16,080,542 | |
| | | | | | | | |
|
Diversified Financial Services—1.3% | |
Intercontinental Exchange, Inc. | | | 53,773 | | | | 13,763,737 | |
| | | | | | | | |
|
Electric Utilities—1.6% | |
OGE Energy Corp. | | | 529,190 | | | | 17,330,973 | |
| | | | | | | | |
|
Electrical Equipment—0.5% | |
Hubbell, Inc. | | | 52,941 | | | | 5,583,687 | |
| | | | | | | | |
|
Electronic Equipment, Instruments & Components—8.8% | |
Arrow Electronics, Inc. (b) | | | 517,194 | | | | 32,014,309 | |
Avnet, Inc. | | | 749,642 | | | | 30,367,997 | |
FLIR Systems, Inc. | | | 395,269 | | | | 12,233,575 | |
Keysight Technologies, Inc. (b) | | | 661,430 | | | | 19,240,999 | |
| | | | | | | | |
| | | | | | | 93,856,880 | |
| | | | | | | | |
|
Energy Equipment & Services—1.9% | |
Helmerich & Payne, Inc. (a) | | | 210,257 | | | | 14,114,552 | |
McDermott International, Inc. (b) | | | 1,294,253 | | | | 6,393,610 | |
| | | | | | | | |
| | | | | | | 20,508,162 | |
| | | | | | | | |
|
Health Care Providers & Services—1.7% | |
AmerisourceBergen Corp. | | | 227,154 | | | | 18,017,855 | |
| | | | | | | | |
|
Insurance—15.4% | |
Alleghany Corp. (b) | | | 63,320 | | | | 34,799,406 | |
Allied World Assurance Co. Holdings AG | | | 425,861 | | | | 14,964,755 | |
Allstate Corp. (The) | | | 303,990 | | | | 21,264,100 | |
|
Insurance—(Continued) | |
Aon plc | | | 191,736 | | | | 20,943,323 | |
Arch Capital Group, Ltd. (b) | | | 314,480 | | | | 22,642,560 | |
Loews Corp. | | | 382,342 | | | | 15,710,433 | |
Progressive Corp. (The) | | | 294,666 | | | | 9,871,311 | |
Torchmark Corp. | | | 394,379 | | | | 24,380,510 | |
| | | | | | | | |
| | | | | | | 164,576,398 | |
| | | | | | | | |
|
Internet & Catalog Retail—4.1% | |
Liberty Interactive Corp. - Class A (b) | | | 948,008 | | | | 24,050,963 | |
Liberty Ventures - Series A (b) | | | 543,532 | | | | 20,148,731 | |
| | | | | | | | |
| | | | | | | 44,199,694 | |
| | | | | | | | |
|
Internet Software & Services—1.8% | |
IAC/InterActiveCorp | | | 351,436 | | | | 19,785,847 | |
| | | | | | | | |
|
Machinery—2.4% | |
Joy Global, Inc. (a) | | | 639,643 | | | | 13,522,053 | |
Kennametal, Inc. | | | 547,596 | | | | 12,107,348 | |
| | | | | | | | |
| | | | | | | 25,629,401 | |
| | | | | | | | |
|
Media—3.3% | |
Omnicom Group, Inc. (a) | | | 300,893 | | | | 24,519,770 | |
TEGNA, Inc. | | | 473,322 | | | | 10,966,871 | |
| | | | | | | | |
| | | | | | | 35,486,641 | |
| | | | | | | | |
|
Metals & Mining—5.6% | |
Goldcorp, Inc. | | | 1,413,986 | | | | 27,049,552 | |
Kinross Gold Corp. (b) | | | 2,988,216 | | | | 14,612,377 | |
Nucor Corp. | | | 380,359 | | | | 18,793,538 | |
| | | | | | | | |
| | | | | | | 60,455,467 | |
| | | | | | | | |
|
Multiline Retail—0.4% | |
Nordstrom, Inc. (a) | | | 109,763 | | | | 4,176,482 | |
| | | | | | | | |
|
Oil, Gas & Consumable Fuels—9.5% | |
Apache Corp. | | | 594,759 | | | | 33,110,234 | |
Devon Energy Corp. | | | 1,051,912 | | | | 38,131,810 | |
Hess Corp. | | | 511,872 | | | | 30,763,507 | |
| | | | | | | | |
| | | | | | | 102,005,551 | |
| | | | | | | | |
|
Professional Services—0.7% | |
ManpowerGroup, Inc. | | | 114,361 | | | | 7,357,987 | |
| | | | | | | | |
|
Real Estate Investment Trusts—1.8% | |
American Capital Agency Corp. | | | 946,341 | | | | 18,756,479 | |
| | | | | | | | |
|
Road & Rail—1.7% | |
Ryder System, Inc. | | | 302,184 | | | | 18,475,530 | |
| | | | | | | | |
|
Semiconductors & Semiconductor Equipment—1.8% | |
Analog Devices, Inc. | | | 336,125 | | | | 19,038,120 | |
| | | | | | | | |
|
Software—1.7% | |
Synopsys, Inc. (b) | | | 331,422 | | | | 17,923,302 | |
| | | | | | | | |
See accompanying notes to financial statements.
MSF-5
Metropolitan Series Fund
Met/Artisan Mid Cap Value Portfolio
Schedule of Investments as of June 30, 2016 (Unaudited)
Common Stocks—(Continued)
| | | | | | | | |
| Security Description | | Shares/
Principal
Amount* | | | Value | |
|
Specialty Retail—2.7% | |
AutoNation, Inc. (a) (b) | | | 373,975 | | | $ | 17,569,345 | |
Bed Bath & Beyond, Inc. (a) | | | 250,513 | | | | 10,827,172 | |
| | | | | | | | |
| | | | | | | 28,396,517 | |
| | | | | | | | |
|
Textiles, Apparel & Luxury Goods—1.6% | |
Coach, Inc. | | | 414,466 | | | | 16,885,345 | |
| | | | | | | | |
|
Trading Companies & Distributors—2.7% | |
Air Lease Corp. (a) | | | 1,081,751 | | | | 28,969,292 | |
| | | | | | | | |
Total Common Stocks
(Cost $854,945,814) | | | | | | | 1,008,765,757 | |
| | | | | | | | |
|
| Short-Term Investments—18.4% | |
|
Mutual Fund—11.9% | |
State Street Navigator Securities Lending MET Portfolio (c) | | | 127,609,448 | | | | 127,609,448 | |
| | | | | | | | |
|
Repurchase Agreement—6.5% | |
Fixed Income Clearing Corp. Repurchase Agreement dated 06/30/16 at 0.030% to be repurchased at $70,065,263 on 07/01/16, collateralized by $69,305,000 U.S. Treasury Note at 1.750% due 12/31/20 with a value of $71,470,781. | | | 70,065,204 | | | | 70,065,204 | |
| | | | | | | | |
Total Short-Term Investments
(Cost $197,674,652) | | | | | | | 197,674,652 | |
| | | | | | | | |
Total Investments—112.6%
(Cost $1,052,620,466) (d) | | | | | | | 1,206,440,409 | |
Other assets and liabilities
(net)—(12.6)% | | | | | | | (134,948,011 | ) |
| | | | | | | | |
| Net Assets—100.0% | | | | | | $ | 1,071,492,398 | |
| | | | | | | | |
| * | Principal amount stated in U.S. dollars unless otherwise noted. |
| (a) | All or a portion of the security was held on loan. As of June 30, 2016, the market value of securities loaned was $156,515,958 and the collateral received consisted of cash in the amount of $127,609,448 and non-cash collateral with a value of $30,962,834. The cash collateral is invested in a money market fund managed by an affiliate of the custodian. The non-cash collateral received consists primarily of government securities and bank letters of credit, and is held for the benefit of the Portfolio at the Portfolio’s custodian. The Portfolio cannot repledge or resell this collateral. As such, this collateral is excluded from the Statement of Assets and Liabilities. |
| (b) | Non-income producing security. |
| (c) | Represents investment of cash collateral received from securities on loan as of June 30, 2016. |
| (d) | As of June 30, 2016, the aggregate cost of investments was $1,052,620,466. The aggregate unrealized appreciation and depreciation of investments were $211,161,664 and $(57,341,721), respectively, resulting in net unrealized appreciation of $153,819,943. |
See accompanying notes to financial statements.
MSF-6
Metropolitan Series Fund
Met/Artisan Mid Cap Value Portfolio
Schedule of Investments as of June 30, 2016 (Unaudited)
Fair Value Hierarchy
Accounting principles generally accepted in the United States of America (“GAAP”) define fair market value as the price that the Portfolio would receive to sell an asset or pay to transfer a liability in an orderly transaction between market participants at the measurement date. It establishes a fair value hierarchy that prioritizes inputs to valuation methods and requires disclosure of the fair value hierarchy, separately for each major category of assets and liabilities, that segregates fair value measurements into three levels. Levels 1, 2 and 3 of the fair value hierarchy are defined as follows:
Level 1 - unadjusted quoted prices in active markets for identical investments
Level 2 - other significant observable inputs (including, but not limited to, quoted prices for similar assets or liabilities in markets that are either active or inactive; inputs other than quoted prices that are observable such as interest rates, yield curves, volatilities, prepayment speeds, loss severities, credit risks, default rates, or other market corroborated inputs)
Level 3 - significant unobservable inputs based on the best information available in the circumstances, to the extent observable inputs are unavailable (including the Portfolio’s own assumptions used in determining the fair value of investments and derivative financial instruments)
The inputs or methodologies used for valuing investments are not necessarily an indication of the risk associated with investing in them. Changes to the inputs or methodologies used may result in transfers between levels, which will be recognized as of the beginning of the reporting period. Information on transfers between Level 1 and Level 2, if any, will be disclosed following the fair value hierarchy table below. A reconciliation of Level 3 securities, if any, will also be disclosed following the fair value hierarchy table. For more information about the Portfolio’s policy regarding the valuation of investments, please refer to the Notes to Financial Statements.
The following table summarizes the fair value hierarchy of the Portfolio’s investments as of June 30, 2016:
| | | | | | | | | | | | | | | | |
| Description | | Level 1 | | | Level 2 | | | Level 3 | | | Total | |
Total Common Stocks* | | $ | 1,008,765,757 | | | $ | — | | | $ | — | | | $ | 1,008,765,757 | |
| Short-Term Investments | | | | | | | | | | | | | | | | |
Mutual Fund | | | 127,609,448 | | | | — | | | | — | | | | 127,609,448 | |
Repurchase Agreement | | | — | | | | 70,065,204 | | | | — | | | | 70,065,204 | |
Total Short-Term Investments | | | 127,609,448 | | | | 70,065,204 | | | | — | | | | 197,674,652 | |
Total Investments | | $ | 1,136,375,205 | | | $ | 70,065,204 | | | $ | — | | | $ | 1,206,440,409 | |
| | | | | | | | | | | | | | | | | |
Collateral for Securities Loaned (Liability) | | $ | — | | | $ | (127,609,448 | ) | | $ | — | | | $ | (127,609,448 | ) |
| * | See Schedule of Investments for additional detailed categorizations. |
See accompanying notes to financial statements.
MSF-7
Metropolitan Series Fund
Met/Artisan Mid Cap Value Portfolio
Statement of Assets and Liabilities
June 30, 2016 (Unaudited)
| | | | |
Assets | |
Investments at value (a) (b) | | $ | 1,206,440,409 | |
Cash | | | 38,753 | |
Receivable for: | | | | |
Investments sold | | | 501,623 | |
Fund shares sold | | | 43,077 | |
Dividends and interest | | | 1,603,742 | |
Prepaid expenses | | | 6,780 | |
| | | | |
Total Assets | | | 1,208,634,384 | |
Liabilities | | | | |
Collateral for securities loaned | | | 127,609,448 | |
Payables for: | | | | |
Investments purchased | | | 7,778,916 | |
Fund shares redeemed | | | 679,159 | |
Accrued Expenses: | | | | |
Management fees | | | 718,991 | |
Distribution and service fees | | | 87,052 | |
Deferred trustees’ fees | | | 76,766 | |
Other expenses | | | 191,654 | |
| | | | |
Total Liabilities | | | 137,141,986 | |
| | | | |
Net Assets | | $ | 1,071,492,398 | |
| | | | |
Net Assets Consist of: | | | | |
Paid in surplus | | $ | 931,825,422 | |
Undistributed net investment income | | | 5,094,114 | |
Accumulated net realized loss | | | (19,247,081 | ) |
Unrealized appreciation on investments | | | 153,819,943 | |
| | | | |
Net Assets | | $ | 1,071,492,398 | |
| | | | |
Net Assets | | | | |
Class A | | $ | 616,219,203 | |
Class B | | | 377,362,976 | |
Class E | | | 77,910,219 | |
Capital Shares Outstanding* | | | | |
Class A | | | 2,982,545 | |
Class B | | | 1,888,452 | |
Class E | | | 383,547 | |
Net Asset Value, Offering Price and Redemption Price Per Share | | | | |
Class A | | $ | 206.61 | |
Class B | | | 199.83 | |
Class E | | | 203.13 | |
| * | The Portfolio is authorized to issue an unlimited number of shares. |
| (a) | Identified cost of investments was $1,052,620,466. |
| (b) | Includes securities loaned at value of $156,515,958. |
Statement of Operations
Six Months Ended June 30, 2016 (Unaudited)
| | | | |
Investment Income | |
Dividends (a) | | $ | 10,141,170 | |
Interest | | | 11,349 | |
Securities lending income | | | 279,030 | |
| | | | |
Total investment income | | | 10,431,549 | |
Expenses | | | | |
Management fees | | | 4,627,736 | |
Administration fees | | | 14,479 | |
Custodian and accounting fees | | | 47,267 | |
Distribution and service fees—Class B | | | 450,671 | |
Distribution and service fees—Class E | | | 56,365 | |
Audit and tax services | | | 20,230 | |
Legal | | | 13,597 | |
Trustees’ fees and expenses | | | 15,990 | |
Shareholder reporting | | | 65,037 | |
Insurance | | | 4,303 | |
Miscellaneous | | | 8,716 | |
| | | | |
Total expenses | | | 5,324,391 | |
Less broker commission recapture | | | (15,436 | ) |
| | | | |
Net expenses | | | 5,308,955 | |
| | | | |
Net Investment Income | | | 5,122,594 | |
| | | | |
Net Realized and Unrealized Gain (Loss) | | | | |
| Net realized gain (loss) on: | | | | |
Investments | | | (17,708,915 | ) |
Futures contracts | | | 10,119 | |
| | | | |
Net realized loss | | | (17,698,796 | ) |
| | | | |
Net change in unrealized appreciation on investments | | | 122,120,956 | |
| | | | |
Net realized and unrealized gain | | | 104,422,160 | |
| | | | |
Net Increase in Net Assets From Operations | | $ | 109,544,754 | |
| | | | |
| (a) | Net of foreign withholding taxes of $49,982. |
See accompanying notes to financial statements.
MSF-8
Metropolitan Series Fund
Met/Artisan Mid Cap Value Portfolio
Statements of Changes in Net Assets
| | | | | | | | |
| | | Six Months
Ended
June 30,
2016
(Unaudited) | | | Year Ended
December 31,
2015 | |
Increase (Decrease) in Net Assets: | | | | | | | | |
From Operations | | | | | | | | |
Net investment income | | $ | 5,122,594 | | | $ | 10,844,836 | |
Net realized gain (loss) | | | (17,698,796 | ) | | | 117,687,418 | |
Net change in unrealized appreciation (depreciation) | | | 122,120,956 | | | | (252,078,349 | ) |
| | | | | | | | |
Increase (decrease) in net assets from operations | | | 109,544,754 | | | | (123,546,095 | ) |
| | | | | | | | |
From Distributions to Shareholders | | | | | | | | |
Net investment income | | | | | | | | |
Class A | | | (6,747,382 | ) | | | (9,675,237 | ) |
Class B | | | (3,238,393 | ) | | | (3,803,715 | ) |
Class E | | | (738,422 | ) | | | (883,807 | ) |
Net realized capital gains | | | | | | | | |
Class A | | | (67,236,609 | ) | | | (102,096,957 | ) |
Class B | | | (42,539,350 | ) | | | (52,740,847 | ) |
Class E | | | (8,652,798 | ) | | | (10,950,952 | ) |
| | | | | | | | |
Total distributions | | | (129,152,954 | ) | | | (180,151,515 | ) |
| | | | | | | | |
Increase (decrease) in net assets from capital share transactions | | | (82,440,597 | ) | | | 82,141,327 | |
| | | | | | | | |
Total decrease in net assets | | | (102,048,797 | ) | | | (221,556,283 | ) |
| | |
Net Assets | | | | | | | | |
Beginning of period | | | 1,173,541,195 | | | | 1,395,097,478 | |
| | | | | | | | |
End of period | | $ | 1,071,492,398 | | | $ | 1,173,541,195 | |
| | | | | | | | |
Undistributed net investment income | | | | | | | | |
End of period | | $ | 5,094,114 | | | $ | 10,695,717 | |
| | | | | | | | |
Other Information:
Capital Shares
Transactions in capital shares were as follows:
| | | | | | | | | | | | | | | | |
| | | Six Months Ended
June 30, 2016
(Unaudited) | | | Year Ended
December 31, 2015 | |
| | | Shares | | | Value | | | Shares | | | Value | |
Class A | | | | | | | | | | | | | | | | |
Sales | | | 71,910 | | | $ | 14,903,637 | | | | 62,290 | | | $ | 15,437,823 | |
Reinvestments | | | 360,055 | | | | 73,983,991 | | | | 462,136 | | | | 111,772,194 | |
Redemptions | | | (906,493 | ) | | | (206,185,713 | ) | | | (208,385 | ) | | | (53,210,768 | ) |
| | | | | | | | | | | | | | | | |
Net increase (decrease) | | | (474,528 | ) | | $ | (117,298,085 | ) | | | 316,041 | | | $ | 73,999,249 | |
| | | | | | | | | | | | | | | | |
Class B | | | | | | | | | | | | | | | | |
Sales | | | 69,529 | | | $ | 14,946,651 | | | | 68,298 | | | $ | 16,299,581 | |
Reinvestments | | | 230,328 | | | | 45,777,743 | | | | 240,779 | | | | 56,544,562 | |
Redemptions | | | (141,516 | ) | | | (30,312,763 | ) | | | (266,358 | ) | | | (65,296,326 | ) |
| | | | | | | | | | | | | | | | |
Net increase | | | 158,341 | | | $ | 30,411,631 | | | | 42,719 | | | $ | 7,547,817 | |
| | | | | | | | | | | | | | | | |
Class E | | | | | | | | | | | | | | | | |
Sales | | | 5,874 | | | $ | 1,291,044 | | | | 11,486 | | | $ | 2,567,719 | |
Reinvestments | | | 46,484 | | | | 9,391,220 | | | | 49,674 | | | | 11,834,759 | |
Redemptions | | | (29,061 | ) | | | (6,236,407 | ) | | | (55,681 | ) | | | (13,808,217 | ) |
| | | | | | | | | | | | | | | | |
Net increase | | | 23,297 | | | $ | 4,445,857 | | | | 5,479 | | | $ | 594,261 | |
| | | | | | | | | | | | | | | | |
Increase (decrease) derived from capital shares transactions | | | | | | $ | (82,440,597 | ) | | | | | | $ | 82,141,327 | |
| | | | | | | | | | | | | | | | |
See accompanying notes to financial statements.
MSF-9
Metropolitan Series Fund
Met/Artisan Mid Cap Value Portfolio
Financial Highlights
| | | | | | | | | | | | | | | | | | | | | | | | |
| Selected per share data | | | | | | | | | | | | | | | | | | |
| | | Class A | |
| | | Six Months
Ended
June 30,
2016
(Unaudited) | | | Year Ended December 31, | |
| | | | 2015
| | | 2014
| | | 2013
| | | 2012
| | | 2011
| |
Net Asset Value, Beginning of Period | | $ | 213.79 | | | $ | 271.79 | | | $ | 268.60 | | | $ | 198.30 | | | $ | 179.02 | | | $ | 169.21 | |
| | | | | | | | | | | | | | | | | | | | | | | | |
Income (Loss) from Investment Operations | | | | | | | | | | | | | | | | | | | | | | | | |
Net investment income (a) | | | 1.06 | | | | 2.26 | | | | 2.89 | | | | 1.98 | | | | 2.22 | | | | 1.73 | |
Net realized and unrealized gain (loss) on investments | | | 19.83 | | | | (23.66 | ) | | | 2.25 | | | | 70.60 | | | | 18.92 | | | | 9.78 | |
| | | | | | | | | | | | | | | | | | | | | | | | |
Total from investment operations | | | 20.89 | | | | (21.40 | ) | | | 5.14 | | | | 72.58 | | | | 21.14 | | | | 11.51 | |
| | | | | | | | | | | | | | | | | | | | | | | | |
Less Distributions | | | | | | | | | | | | | | | | | | | | | | | | |
Distributions from net investment income | | | (2.56 | ) | | | (3.17 | ) | | | (1.95 | ) | | | (2.28 | ) | | | (1.86 | ) | | | (1.70 | ) |
Distributions from net realized capital gains | | | (25.51 | ) | | | (33.43 | ) | | | 0.00 | | | | 0.00 | | | | 0.00 | | | | 0.00 | |
| | | | | | | | | | | | | | | | | | | | | | | | |
Total distributions | | | (28.07 | ) | | | (36.60 | ) | | | (1.95 | ) | | | (2.28 | ) | | | (1.86 | ) | | | (1.70 | ) |
| | | | | | | | | | | | | | | | | | | | | | | | |
Net Asset Value, End of Period | | $ | 206.61 | | | $ | 213.79 | | | $ | 271.79 | | | $ | 268.60 | | | $ | 198.30 | | | $ | 179.02 | |
| | | | | | | | | | | | | | | | | | | | | | | | |
Total Return (%) (b) | | | 9.85 | (c) | | | (9.44 | ) | | | 1.93 | | | | 36.85 | | | | 11.86 | | | | 6.76 | |
| | | | | | |
Ratios/Supplemental Data | | | | | | | | | | | | | | | | | | | | | | | | |
Ratio of expenses to average net assets (%) | | | 0.85 | (d) | | | 0.84 | | | | 0.84 | | | | 0.83 | | | | 0.85 | | | | 0.84 | |
Ratio of net investment income to average net assets (%) | | | 0.98 | (d) | | | 0.91 | | | | 1.07 | | | | 0.84 | | | | 1.17 | | | | 0.97 | |
Portfolio turnover rate (%) | | | 18 | (c) | | | 31 | | | | 25 | | | | 22 | | | | 23 | | | | 30 | |
Net assets, end of period (in millions) | | $ | 616.2 | | | $ | 739.1 | | | $ | 853.7 | | | $ | 970.0 | | | $ | 769.4 | | | $ | 731.8 | |
| |
| | | Class B | |
| | | Six Months
Ended
June 30,
2016
(Unaudited) | | | Year Ended December 31, | |
| | | | 2015 | | | 2014 | | | 2013 | | | 2012 | | | 2011 | |
Net Asset Value, Beginning of Period | | $ | 207.30 | | | $ | 264.50 | | | $ | 261.50 | | | $ | 193.14 | | | $ | 174.44 | | | $ | 164.99 | |
| | | | | | | | | | | | | | | | | | | | | | | | |
Income (Loss) from Investment Operations | | | | | | | | | | | | | | | | | | | | | | | | |
Net investment income (a) | | | 0.80 | | | | 1.59 | | | | 2.15 | | | | 1.36 | | | | 1.69 | | | | 1.30 | |
Net realized and unrealized gain (loss) on investments | | | 19.18 | | | | (22.95 | ) | | | 2.21 | | | | 68.77 | | | | 18.44 | | | | 9.47 | |
| | | | | | | | | | | | | | | | | | | | | | | | |
Total from investment operations | | | 19.98 | | | | (21.36 | ) | | | 4.36 | | | | 70.13 | | | | 20.13 | | | | 10.77 | |
| | | | | | | | | | | | | | | | | | | | | | | | |
Less Distributions | | | | | | | | | | | | | | | | | | | | | | | | |
Distributions from net investment income | | | (1.94 | ) | | | (2.41 | ) | | | (1.36 | ) | | | (1.77 | ) | | | (1.43 | ) | | | (1.32 | ) |
Distributions from net realized capital gains | | | (25.51 | ) | | | (33.43 | ) | | | 0.00 | | | | 0.00 | | | | 0.00 | | | | 0.00 | |
| | | | | | | | | | | | | | | | | | | | | | | | |
Total distributions | | | (27.45 | ) | | | (35.84 | ) | | | (1.36 | ) | | | (1.77 | ) | | | (1.43 | ) | | | (1.32 | ) |
| | | | | | | | | | | | | | | | | | | | | | | | |
Net Asset Value, End of Period | | $ | 199.83 | | | $ | 207.30 | | | $ | 264.50 | | | $ | 261.50 | | | $ | 193.14 | | | $ | 174.44 | |
| | | | | | | | | | | | | | | | | | | | | | | | |
Total Return (%) (b) | | | 9.71 | (c) | | | (9.66 | ) | | | 1.67 | | | | 36.51 | | | | 11.58 | | | | 6.49 | |
| | | | | | |
Ratios/Supplemental Data | | | | | | | | | | | | | | | | | | | | | | | | |
Ratio of expenses to average net assets (%) | | | 1.10 | (d) | | | 1.09 | | | | 1.09 | | | | 1.08 | | | | 1.10 | | | | 1.09 | |
Ratio of net investment income to average net assets (%) | | | 0.76 | (d) | | | 0.66 | | | | 0.82 | | | | 0.59 | | | | 0.92 | | | | 0.75 | |
Portfolio turnover rate (%) | | | 18 | (c) | | | 31 | | | | 25 | | | | 22 | | | | 23 | | | | 30 | |
Net assets, end of period (in millions) | | $ | 377.4 | | | $ | 358.7 | | | $ | 446.3 | | | $ | 505.0 | | | $ | 389.2 | | | $ | 383.8 | |
Please see following page for Financial Highlights footnote legend.
See accompanying notes to financial statements.
MSF-10
Metropolitan Series Fund
Met/Artisan Mid Cap Value Portfolio
Financial Highlights
| | | | | | | | | | | | | | | | | | | | | | | | |
| Selected per share data | | | | | | | | | | | | | | | | | | |
| | | Class E | |
| | | Six Months
Ended
June 30,
2016
(Unaudited) | | | Year Ended December 31, | |
| | | | 2015 | | | 2014 | | | 2013 | | | 2012
| | | 2011
| |
Net Asset Value, Beginning of Period | | $ | 210.43 | | | $ | 267.99 | | | $ | 264.86 | | | $ | 195.57 | | | $ | 176.60 | | | $ | 166.99 | |
| | | | | | | | | | | | | | | | | | | | | | | | |
Income (Loss) from Investment Operations | | | | | | | | | | | | | | | | | | | | | | | | |
Net investment income (a) | | | 0.92 | | | | 1.85 | | | | 2.43 | | | | 1.60 | | | | 1.89 | | | | 1.46 | |
Net realized and unrealized gain (loss) on investments | | | 19.47 | | | | (23.28 | ) | | | 2.25 | | | | 69.65 | | | | 18.68 | | | | 9.62 | |
| | | | | | | | | | | | | | | | | | | | | | | | |
Total from investment operations | | | 20.39 | | | | (21.43 | ) | | | 4.68 | | | | 71.25 | | | | 20.57 | | | | 11.08 | |
| | | | | | | | | | | | | | | | | | | | | | | | |
Less Distributions | | | | | | | | | | | | | | | | | | | | | | | | |
Distributions from net investment income | | | (2.18 | ) | | | (2.70 | ) | | | (1.55 | ) | | | (1.96 | ) | | | (1.60 | ) | | | (1.47 | ) |
Distributions from net realized capital gains | | | (25.51 | ) | | | (33.43 | ) | | | 0.00 | | | | 0.00 | | | | 0.00 | | | | 0.00 | |
| | | | | | | | | | | | | | | | | | | | | | | | |
Total distributions | | | (27.69 | ) | | | (36.13 | ) | | | (1.55 | ) | | | (1.96 | ) | | | (1.60 | ) | | | (1.47 | ) |
| | | | | | | | | | | | | | | | | | | | | | | | |
Net Asset Value, End of Period | | $ | 203.13 | | | $ | 210.43 | | | $ | 267.99 | | | $ | 264.86 | | | $ | 195.57 | | | $ | 176.60 | |
| | | | | | | | | | | | | | | | | | | | | | | | |
Total Return (%) (b) | | | 9.77 | (c) | | | (9.58 | ) | | | 1.78 | | | | 36.65 | | | | 11.69 | | | | 6.60 | |
| | | | | | |
Ratios/Supplemental Data | | | | | | | | | | | | | | | | | | | | | | | | |
Ratio of expenses to average net assets (%) | | | 1.00 | (d) | | | 0.99 | | | | 0.99 | | | | 0.98 | | | | 1.00 | | | | 0.99 | |
Ratio of net investment income to average net assets (%) | | | 0.86 | (d) | | | 0.76 | | | | 0.91 | | | | 0.68 | | | | 1.01 | | | | 0.83 | |
Portfolio turnover rate (%) | | | 18 | (c) | | | 31 | | | | 25 | | | | 22 | | | | 23 | | | | 30 | |
Net assets, end of period (in millions) | | $ | 77.9 | | | $ | 75.8 | | | $ | 95.1 | | | $ | 110.8 | | | $ | 98.8 | | | $ | 104.4 | |
| (a) | Per share amounts based on average shares outstanding during the period. |
| (b) | Total return does not reflect any insurance, sales, separate account or administrative charges of variable annuity or life insurance contracts or any additional expenses that contract owners may bear under their variable contracts. If these charges were included, the returns would be lower. |
| (c) | Periods less than one year are not computed on an annualized basis. |
| (d) | Computed on an annualized basis. |
See accompanying notes to financial statements.
MSF-11
Metropolitan Series Fund
Met/Artisan Mid Cap Value Portfolio
Notes to Financial Statements—June 30, 2016 (Unaudited)
1. Organization
Metropolitan Series Fund (the “Trust”) is organized as a Delaware statutory trust and registered under the Investment Company Act of 1940, as amended (the “1940 Act”), as an open-end management investment company. The Trust, which is managed by MetLife Advisers, LLC (“MetLife Advisers” or the “Adviser”), an affiliate of MetLife, Inc., is currently comprised of thirty series, each of which operates as a distinct investment vehicle of the Trust. The portfolio included in this report is Met/Artisan Mid Cap Value Portfolio (the “Portfolio”), which is diversified. Shares in the Portfolio are not offered directly to the general public and are currently available only to separate accounts established by Metropolitan Life Insurance Company (“MetLife”) and other affiliated life insurance companies.
The Portfolio has registered and offers three classes of shares: Class A, B and E shares. Shares of each Class of the Portfolio represent an equal pro rata interest in the Portfolio and generally give the shareholder the same voting, dividend, liquidation, and other rights. Investment income, realized and unrealized capital gains and losses, the common expenses of the Portfolio, and certain Portfolio-level expense reductions, if any, are allocated on a pro rata basis to each Class based on the relative net assets of each Class to the net assets of the Portfolio. Each Class of shares differs in its respective distribution plan and such distribution expenses are allocated to the corresponding Class of shares.
2. Significant Accounting Policies
The preparation of financial statements in conformity with accounting principles generally accepted in the United States of America (“GAAP”) requires management to make estimates and assumptions that affect the reported amounts of assets and liabilities and disclosure of contingent assets and liabilities as of the date of the financial statements and the reported amounts of income and expenses during the reporting period. Actual results could differ from those estimates. In the preparation of these financial statements, management has evaluated events and transactions subsequent to June 30, 2016 through the date the financial statements were issued.
The Portfolio is an investment company and follows the accounting and reporting guidance of the Financial Accounting Standards Board (“FASB”) Accounting Standards Codification Topic 946—Financial Services—Investment Companies and Topic 820—Fair Value Measurement. The following is a summary of significant accounting policies consistently followed by the Portfolio in the preparation of its financial statements.
Investment Valuation and Fair Value Measurements - Domestic and foreign equity securities, such as common stock, exchange-traded funds, rights, warrants, and preferred stock, that are traded on a securities exchange on a valuation date are generally valued at their last quoted sale price or official closing price on the primary exchange for such security, or, if no sales occurred on that day, at the last reported bid price. Equity securities traded over-the-counter (“OTC”) are generally valued at the last reported bid price. In the event of a major exchange closing during the trading day, the Adviser may use other market information obtained from quotation reporting systems, established market makers, or pricing services in valuing the securities. Valuation adjustments may be applied to certain foreign equity securities that are traded solely on foreign exchanges that close before the time as of which the Portfolio determines its NAV to account for the market movement between the close of the foreign exchanges and the time as of which the Portfolio determines its NAV. The Portfolio may use a systematic fair valuation model provided by a pricing service to value securities principally traded in these foreign markets in order to adjust for possible market movements or other changes that may occur between the close of the foreign exchanges and the time as of which the Portfolio determines its NAV. Foreign equity securities valued using these valuation adjustments are generally categorized as Level 2 within the fair value hierarchy. Equity securities that are actively traded, and have no valuation adjustments applied, are categorized as Level 1 within the fair value hierarchy. Other equity securities traded on inactive markets, or valued in reference to similar instruments traded on active markets, are generally categorized as Level 2 within the fair value hierarchy.
Investments in registered open-end management investment companies are valued at reported net asset value per share on the valuation date and are categorized as Level 1 within the fair value hierarchy.
Debt securities, including corporate, convertible and municipal bonds and notes; obligations of the U.S. Treasury and U.S. government agencies; foreign sovereign issues; and non-U.S. bonds, are generally valued on the basis of evaluated or composite bid quotations obtained from independent pricing services and/or brokers and dealers selected by the Adviser (each a “pricing service”), pursuant to authorization of and subject to general oversight by the Board of Trustees of the Trust (the “Board” or “Trustees”). Such pricing services may use matrix pricing, which considers observable inputs including, among other things, issuer details, maturity dates, interest rates, yield curves, rates of prepayment, credit risks/spreads, default rates, reported trades, broker dealer quotes and quoted prices for similar assets. Short-term obligations with a remaining maturity of sixty days or less may be valued at amortized cost in the absence of market quotes, so long as the amortized cost value of such short-term debt instrument is approximately the same as the fair value of the instrument as determined without the use of amortized cost valuation. Floating rate loans are generally valued on the basis of an evaluated or composite average of aggregate bid and ask quotations supplied by brokers or dealers, as obtained from the pricing service. Securities that use similar valuation techniques and inputs as described above are generally categorized as Level 2 within the fair value hierarchy.
MSF-12
Metropolitan Series Fund
Met/Artisan Mid Cap Value Portfolio
Notes to Financial Statements—June 30, 2016—(Continued)
Options, whether on securities, indices, futures contracts, or otherwise, traded on exchanges are valued at the last sale price available as of the close of business on a valuation day or, if there is no such price available, at the last reported bid price. These types of options are categorized as Level 1 within the fair value hierarchy. Futures contracts that are traded on commodity exchanges are valued at their settlement prices established by the exchanges on which they are traded as of the close of such exchanges and are categorized as Level 1 within the fair value hierarchy.
If no current market value quotation or other observable inputs are readily available or market value quotations are deemed to be unreliable for an investment, the fair value of the investment will be determined in accordance with procedures approved by, and under the general supervision of, the Board. In such a circumstance, the Board will be assisted in its responsibility to determine the fair value of an investment by the Valuation Committee (“Committee”) of MetLife Advisers. The Committee provides general pricing oversight and fair value pricing determinations related to portfolio securities and meets on a regular basis to review reports relating to the valuation of the securities in the Portfolio. The Board has delegated to State Street Bank and Trust Company, the Trust’s custodian (“custodian”), the responsibility for calculating the net asset values (“NAVs”) of the Trust’s Portfolios. The Committee is responsible for overseeing the calculation of the NAVs of the Portfolios by the custodian. The Committee also periodically reviews pricing services, including the pricing services providing fair value pricing for the Portfolio’s foreign securities, and is responsible for overseeing the correction of pricing errors and addressing other pricing issues that arise in the ordinary course of business, such as making real-time fair value determinations, as necessary.
No single standard for determining the fair value of an investment can be set forth because fair value depends upon the facts and circumstances with respect to each investment. Information relating to any relevant factors may be obtained by the Committee from any appropriate source, including the subadviser of the Portfolio, the custodian, a pricing service, market maker and/or broker for such security or the issuer. Appropriate methodologies for determining fair value under particular circumstances may include: matrix pricing, a discounted cash flow analysis, comparisons of securities with comparable characteristics, value based on multiples of earnings, discount from market price of similar marketable securities or a combination of these and other methods.
Investment Transactions and Related Investment Income - Portfolio security transactions are recorded on the trade date. Dividend income is recorded on the ex-dividend date or, for certain foreign securities, when notified. Interest income, which includes amortization of premium and accretion of discount on debt securities, is recorded on the accrual basis. Realized gains and losses on investments are determined on the identified cost basis, which is the same basis used for federal income tax purposes. Foreign income and foreign capital gains on some foreign securities may be subject to foreign taxes, which are accrued as applicable. These foreign taxes have been provided for in accordance with the Portfolio’s understanding of the applicable countries’ tax rules and rates.
Foreign Currency Translation - The books and records of the Portfolio are maintained in U.S. dollars. The values of securities, currencies, and other assets and liabilities denominated in currencies other than the U.S. dollar are translated into U.S. dollars based upon foreign exchange rates prevailing at the end of the period. Purchases and sales of investment securities, income, and expenses are translated on the respective dates of such transactions. Because the values of investment securities are translated at the foreign exchange rates prevailing at the end of the period, that portion of the results of operations arising from changes in exchange rates and that portion of the results of operations reflecting fluctuations arising from changes in market prices of the investment securities are not separated. Such fluctuations are included in the net realized and unrealized gain or loss on investments.
Net realized foreign exchange gains or losses arise from activity in forward foreign currency exchange contracts, sales of foreign currency, currency gains or losses realized between the trade and settlement dates on securities transactions, and the difference between the amounts of dividends, interest, and foreign withholding taxes recorded by the Portfolio and the U.S. dollar equivalent of the amounts actually received or paid by the Portfolio. Net unrealized foreign exchange gains and losses arise from changes in the value of assets and liabilities, other than investment securities, resulting from changes in foreign exchange rates.
Dividends and Distributions to Shareholders - The Portfolio records dividends and distributions on the ex-dividend date. Net realized gains from securities transactions (if any) are generally distributed annually to shareholders. The timing and characterization of certain income and capital gains distributions are determined in accordance with federal tax regulations that may differ from GAAP. Permanent book and tax basis differences relating to shareholder distributions will result in reclassification between under/over distributed net investment income, accumulated net realized gains/losses, and paid-in surplus. Book-tax differences are primarily due to broker commission recapture. These adjustments have no impact on net assets or the results of operations.
Income Taxes - It is the Portfolio’s policy to comply with the requirements of the Internal Revenue Code of 1986, as amended, and regulations thereunder, applicable to regulated investment companies and to distribute, with respect to each taxable year, all of its taxable income to shareholders. Therefore, no federal income tax provision is required. The Portfolio files U.S. federal tax returns. No income tax returns are currently under examination. The Portfolio’s federal tax returns for the prior three fiscal years remain subject to examination by the Internal Revenue Service. As of June 30, 2016, the Portfolio had no uncertain tax positions that would require financial statement recognition, or de-recognition or disclosure.
MSF-13
Metropolitan Series Fund
Met/Artisan Mid Cap Value Portfolio
Notes to Financial Statements—June 30, 2016—(Continued)
Directed Brokerage Agreement - The Trust has entered into a directed brokerage arrangement with State Street Global Markets (“SSGM”). Under this arrangement, the Portfolio directs certain trades to SSGM in return for a recapture credit. SSGM issues a cash rebate to the Portfolio. Amounts paid to the Portfolio are shown separately as broker commission recapture on the Statement of Operations of the Portfolio. Additionally, these amounts have been excluded from the calculation of the net ratio of expenses to average net assets presented in the Financial Highlights for each share class.
Repurchase Agreements - The Portfolio may enter into repurchase agreements, under the terms of a Master Repurchase Agreement (“MRA”), with selected commercial banks and broker-dealers, under which the Portfolio acquires securities as collateral and agrees to resell the securities at an agreed-upon time and at an agreed-upon price. The Portfolio, through the custodian or a subcustodian, under a tri-party repurchase agreement, receives delivery of the underlying securities collateralizing any repurchase agreements. It is the Portfolio’s policy that the market value of the collateral be equal to at least 100% of the repurchase price in the case of a repurchase agreement of one-day duration and equal to at least 102% of the repurchase price in the case of all other repurchase agreements. In the event of default or failure by a party to perform an obligation in connection with any repurchase transaction, the MRA gives the non-defaulting party the right to set-off claims and to apply property held by it in connection with any repurchase transaction against obligations owed to it.
At June 30, 2016, the Portfolio had investments in repurchase agreements with a gross value of $70,065,204, which is included as part of investments at value on the Statement of Assets and Liabilities. The value of the related collateral exceeded the value of the repurchase agreements at June 30, 2016.
Securities Lending - The Portfolio may lend its portfolio securities to certain qualified brokers who borrow securities in order to complete certain securities transactions. By lending its portfolio securities, the Portfolio attempts to increase its net investment income through the receipt of income on collateral held from securities on loan. Any gain or loss in the market price of the loaned securities that might occur and any interest earned or dividends declared during the term of the loan would accrue to the account of the Portfolio.
The Trust has entered into a Securities Lending Authorization Agreement with the custodian as the lending agent. Under this agreement, the custodian is authorized to loan portfolio securities on the Portfolio’s behalf. In exchange, the Portfolio receives either cash or securities as collateral against the loaned securities. The Portfolio receives collateral equal to at least 102% of the market value of the loaned securities (105% for foreign equity securities), at each loan’s inception. Collateral representing at least 100% of the market value of the loaned securities must be maintained for the duration of the loan. Cash collateral is generally invested in the State Street Navigator Securities Lending MET Portfolio (the “Navigator Portfolio”), a series of the State Street Navigator Securities Lending Trust that is managed by an affiliate of the custodian. The Navigator Portfolio is a registered money market fund that invests in a variety of high-quality, U.S. dollar-denominated instruments. If the market value of the collateral at the close of trading on a business day is less than 100% of the market value of the loaned securities at the close of trading on that day, the borrower shall be required to deliver, by the close of business on the following business day, an additional amount of collateral, so that the total amount of posted collateral is equal to at least 100% of the market value of all the loaned securities as of such preceding day. A portion of net income (income after the deduction of expenses and fees of the Navigator Portfolio) on the collateral is rebated to the borrower of the securities and the remainder is split between the custodian and the Portfolio. On loans collateralized by U.S. Treasuries, a fee is received from the borrower and is allocated between the Portfolio and the custodian. Income received by the Portfolio in securities lending transactions during the six months ended June 30, 2016 is reflected as Securities lending income on the Statement of Operations. The values of any securities loaned by the Portfolio and the related collateral at June 30, 2016 are disclosed in the footnotes to the Schedule of Investments. The value of the related collateral received by the Portfolio exceeded the value of the securities out on loan at June 30, 2016.
The risks associated with lending portfolio securities include, but are not limited to, possible delays in receiving additional collateral or in the recovery of the loaned securities, possible loss of rights in the collateral should the borrower fail financially, as well as risk of loss in the value of the collateral or the value of the investments made with the collateral. The lending agent shall indemnify the Portfolio in the case of default of any securities borrower.
All securities on loan are classified as Common Stocks in the Portfolio’s Schedule of Investments as of June 30, 2016, with a contractual maturity of overnight and continuous.
3. Investments in Derivative Instruments
Futures Contracts - The Portfolio may buy and sell futures contracts as a hedge, to maintain investment exposure to a target asset class or to enhance return. The Portfolio may be subject to fluctuations in equity prices, interest rates, commodity prices, and foreign currency exchange rates in the normal course of pursuing its investment objective. Futures contracts are standardized agreements to buy or sell a security, or deliver a final cash settlement price in connection with an index, interest rate, currency, or other asset. The Portfolio must deposit an amount (“initial margin”) equal to a certain percentage of the face value of the futures contract. The initial margin may be in the form of cash or securities, which is returned when the Portfolio’s obligations under the contract have been
MSF-14
Metropolitan Series Fund
Met/Artisan Mid Cap Value Portfolio
Notes to Financial Statements—June 30, 2016—(Continued)
satisfied. If cash is deposited as the initial margin, it is shown as cash collateral on the Statement of Assets and Liabilities. Futures contracts are marked-to-market daily, and subsequent payments (“variation margin”) are made or received by the Portfolio depending on whether unrealized gains or losses are incurred. These amounts are reflected as receivables or payables on the Statement of Assets and Liabilities and as a component of net change in unrealized appreciation/depreciation on the Statement of Operations. When the contract is closed or expires, the Portfolio records a realized gain or loss equal to the difference between the value of the contract at the time it was opened and the value at the time it was closed. Risks of entering into futures contracts (and related options) include the possibility that the market for these instruments may be illiquid and that a change in the value of the contract or option may not correlate perfectly with changes in the value of the underlying instrument. If futures contracts are exchange-traded, the exchange’s clearinghouse, as counterparty to all exchange-traded futures, guarantees the futures contracts against default. For OTC futures, the Portfolio’s ability to terminate the positions may be more limited than in the case of exchange-traded positions and may also involve the risk that securities dealers participating in such transactions would fail to meet their obligations to the Portfolio.
During the six months ended June 30, 2016, the Portfolio entered into equity index futures contracts which were subject to equity price risk. During the period May 6, 2016 through May 9, 2016, the Portfolio had bought and sold $8,747,878 in notional cost on equity index futures contracts. At June 30, 2016, the Portfolio did not have any open futures contracts. For the six months ended June 30, 2016, the Portfolio had realized gains in the amount of $10,119 which are shown under Net realized gain on futures contracts in the Statement of Operations.
4. Certain Risks
In the normal course of business, the Portfolio invests in securities and enters into transactions where risks exist due to fluctuations in the market (“market risk”) or failure of the other party to a transaction to perform (“credit and counterparty risk”).
Market Risk: The value of securities held by the Portfolio may decline in response to certain events, including those directly involving the companies whose securities are owned by the Portfolio; conditions affecting the general economy; overall market changes; local, regional or global political, social or economic instability; and currency, interest rate, and price fluctuations.
Credit and Counterparty Risk: The Portfolio may be exposed to counterparty risk, or the risk that an entity with which the Portfolio has unsettled or open transactions may default. The potential loss could exceed the value of the financial assets and liabilities recorded in the financial statements. Financial assets that potentially expose the Portfolio to credit and counterparty risk consist principally of cash due from counterparties and investments. The Portfolio manages counterparty risk by entering into agreements only with counterparties that it believes have the financial resources to honor their obligations and by monitoring the financial stability of those counterparties. The Portfolio’s investment adviser attempts to mitigate counterparty risk by (i) periodically assessing the creditworthiness of its trading partners, (ii) monitoring and/or limiting the amount of its net exposure to each individual counterparty based on its assessment, and (iii) requiring collateral from the counterparty for certain transactions. In order to preserve certain safeguards for non-standard settlement trades, the Portfolio restricts its exposure to credit and counterparty losses by entering into master netting agreements (“Master Agreements”) with counterparties (approved brokers) with whom it undertakes a significant volume of transactions. Master Agreements govern the terms of certain transactions, and reduce the counterparty risk associated with relevant transactions by specifying credit protection mechanisms and providing standardization that improves legal certainty. Master Agreements can also help limit counterparty risk by specifying collateral posting arrangements at pre-arranged exposure levels.
Repurchase and reverse repurchase agreements are primarily executed under Global Master Repurchase Agreements (“GMRAs”) or Master Repurchase Agreements (“MRAs”), which provide the rights to set-off. Each repurchase and reverse repurchase agreement is initially collateralized at the transaction level. In the event of default, the total market value exposure will be offset against collateral exchanged to date, which would result in a net receivable/(payable) that would be due from/to the counterparty.
Additional risks associated with each type of investment are described above within the respective security type notes. The Portfolio’s prospectus includes a discussion of the principal risks of investing in the Portfolio.
5. Investment Transactions
Aggregate cost of purchases and proceeds of sales of investment securities, excluding short-term securities, for the six months ended June 30, 2016 were as follows:
| | | | | | | | | | | | |
Purchases | | | Sales | |
U.S. Government | | Non U.S. Government | | | U.S. Government | | | Non U.S. Government | |
| $0 | | $ | 189,690,165 | | | $ | 0 | | | $ | 370,773,487 | |
MSF-15
Metropolitan Series Fund
Met/Artisan Mid Cap Value Portfolio
Notes to Financial Statements—June 30, 2016—(Continued)
6. Investment Management Fees and Other Transactions with Affiliates
Investment Management Agreement - MetLife Advisers is the investment adviser to the Portfolio. The Trust has entered into an investment management agreement with MetLife Advisers with respect to the Portfolio. For providing investment management services to the Portfolio, MetLife Advisers receives monthly compensation at the following annual rates:
| | | | | | |
Management
Fees earned by
MetLife Advisers
for the six months ended
June 30, 2016 | | % per annum | | | Average Daily Net Assets |
| $4,627,736 | | | 0.820 | % | | Of the first $1 billion |
| | | 0.780 | % | | On amounts in excess of $1 billion |
MetLife Advisers has entered into an investment subadvisory agreement with respect to managing the Portfolio. Artisan Partners Limited Partnership is compensated by MetLife Advisers to provide subadvisory services for the Portfolio.
Certain officers and trustees of the Trust may also be officers of MetLife Advisers; however, such officers and trustees receive no compensation from the Trust.
On January 12, 2016, MetLife, Inc. announced its plan to pursue the separation of a substantial portion of its retail segment and is currently evaluating structural alternatives for such separation. It is anticipated that MetLife Advisers would be included in any such separation. Any separation transaction that might occur will be subject to the satisfaction of various conditions and approvals, including approval of any transaction by the MetLife, Inc. Board of Directors, satisfaction of any applicable requirements of the SEC, and receipt of insurance and other regulatory approvals and other anticipated conditions. Because the form of a separation had yet to be determined, MetLife, Inc. cannot currently provide a specific potential completion date or information about the potential impact on MetLife Advisers. No assurance can be given regarding the form that a separation transaction may take or the specific terms thereof, or that a separation will in fact occur. Depending on the form a separation takes, MetLife Advisers’ continued service as investment adviser to the Trusts could be subject to the satisfaction of various conditions and approvals, which may include obtaining approvals from the Trusts’ Board and shareholders.
Transfer Agency Agreement - MetLife serves as the transfer agent for the Trust. MetLife receives no fees for its services to the Trust under the transfer agency agreement.
Distribution and Service Fees - The Trust has a distribution agreement with MetLife Investors Distribution Company (“MIDC” or the “Distributor”) in which MIDC serves as the distributor for the Portfolio’s Class A, B and E Shares. MIDC is a wholly-owned subsidiary of MetLife Investors Group, LLC, an affiliate of the Adviser. The Trust has also adopted a Distribution and Service Plan under Rule 12b-1 of the 1940 Act for the Portfolio’s Class B and E Shares. Under the Distribution and Service Plan, the Class B and E Shares of the Portfolio pay a fee to compensate the Insurance Companies (or their affiliates) and other broker-dealers and financial intermediaries involved in the offer and sale of Portfolio shares for promoting or selling and servicing the Class B and E Shares. The fees under the Distribution and Service Plan for each class of the Portfolio’s shares are calculated as a percentage of the Portfolio’s average daily net assets that are attributable to that Class. Currently, the fee is 0.25% per year for Class B Shares and 0.15% per year for Class E Shares. Amounts incurred by the Portfolio for the six months ended June 30, 2016 are shown as Distribution and service fees in the Statement of Operations.
Deferred Trustee Compensation - Each Trustee who is not currently an employee of the Adviser or any of its affiliates receives compensation from the Trust for his or her service to the Trust. A deferred compensation plan (the “Plan”) is available to the Trustees on a voluntary basis. Deferred amounts remain in the Trust until distributed in accordance with the provisions of the Plan. The value of a participating Trustee’s deferral account is based on theoretical investments of deferred amounts on the normal payment dates in certain portfolios of the Trust or Met Investors Series Trust, an affiliate of the Trust, as designated by the participating Trustee. Changes in the value of participants’ deferral accounts are reflected as Trustees’ fees and expenses in the Statement of Operations. The portion of the accrued obligations allocated to the Portfolio under the Plan is reflected as Deferred trustees’ fees in the Statement of Assets and Liabilities.
7. Contractual Obligations
Under the Trust’s organizational documents, its officers and Trustees may be indemnified against certain liabilities and expenses arising out of the performance of their duties to the Trust. Additionally, the Trust has a variety of indemnification obligations under contracts with its service providers. The Trust’s maximum exposure under these arrangements is unknown, as this would involve future claims that may be made against the Trust that have not yet occurred.
MSF-16
Metropolitan Series Fund
Met/Artisan Mid Cap Value Portfolio
Notes to Financial Statements—June 30, 2016—(Continued)
8. Income Tax Information
The tax character of distributions paid for the years ended December 31, 2015 and 2014 were as follows:
| | | | | | | | | | | | | | | | | | | | |
Ordinary Income | | | Long-Term Capital Gain | | | Total | |
2015 | | 2014 | | | 2015 | | | 2014 | | | 2015 | | | 2014 | |
| $14,362,758 | | $ | 10,076,272 | | | $ | 165,788,757 | | | $ | — | | | $ | 180,151,515 | | | $ | 10,076,272 | |
As of December 31, 2015, the components of distributable earnings (accumulated losses) on a federal income tax basis were as follows:
| | | | | | | | | | | | | | | | | | |
Undistributed
Ordinary
Income | | Undistributed
Long-Term
Capital Gain | | | Net
Unrealized
Appreciation | | | Other
Accumulated
Capital Losses | | | Total | |
| $10,771,120 | | $ | 118,196,618 | | | $ | 30,382,841 | | | $ | — | | | $ | 159,350,579 | |
The Portfolio utilizes the provisions of the federal income tax laws that provide for the carryforward of capital losses for prior years, offsetting such losses against any future realized capital gains. Under the Regulated Investment Company Modernization Act of 2010 (the “Act”), net capital losses recognized after December 22, 2010 may be carried forward indefinitely and their character is retained as short-term and/or long-term losses. Previously, net capital losses were carried forward for up to eight years and treated as short-term losses. As a transition rule, the Act requires that post-enactment net capital losses be used before pre-enactment net capital losses.
As of December 31, 2015, the Portfolio had no post-enactment accumulated capital losses and no pre-enactment accumulated capital loss carryforwards.
MSF-17
Metropolitan Series Fund
Met/Dimensional International Small Company Portfolio
Managed by Dimensional Fund Advisors LP
Portfolio Manager Commentary*
PERFORMANCE
For the six month period ended June 30, 2016, the Class A and B shares of the Met/Dimensional International Small Company Portfolio returned -0.84% and -0.95%, respectively. The Portfolio’s benchmark, the MSCI World ex-U.S. Small Cap Index1, returned -0.69%.
MARKET ENVIRONMENT / CONDITIONS
In U.S. dollar terms, developed ex-U.S. markets posted negative returns in the six-month period ending June 30, 2016, trailing both the U.S. and emerging markets. Using the MSCI World ex-U.S. Investable Market Index (IMI) (net dividends) as a proxy, developed ex-U.S. markets returned -2.7%, as compared to +3.6% for the Russell 3000 Index and +5.7% for the MSCI Emerging Markets IMI (net dividends).
The U.S. dollar appreciated against the British pound, but depreciated against most of the major developed market currencies, particularly the Japanese yen. Overall, currency fluctuations had a positive impact on U.S. dollar-denominated returns of developed ex-U.S. equities during the period.
Along the market capitalization dimension, small caps (MSCI World ex-U.S. Small Cap Index) outperformed large caps (MSCI World ex-U.S. Index) by 2.3% for the six-month period. Within the MSCI World ex-U.S. IMI, Financials and Consumer Discretionary were the weakest-performing sectors, while Energy and Materials were the strongest performers.
Along the profitability dimension, the top quartile of most profitable stocks outperformed the bottom quartile of least profitable stocks among large caps and small caps (MSCI World ex-U.S. excluding Real Estate Investment Trusts (“REITs”) and Utilities) and outperformed among small caps (MSCI World ex-U.S. Small Cap, excluding REITs and Utilities).
PORTFOLIO REVIEW / PERIOD END POSITIONING
For the six months ended June 30, 2016, the Portfolio underperformed its benchmark, the MSCI World ex-U.S. Small Cap Index (net dividends), by 0.15%. The country allocation differences in Canada and Japan detracted from relative performance, as both countries outperformed the broader index. The Portfolio’s exclusion of REITs detracted from relative performance as REITs outperformed many other sectors. Dimensional defines the small cap universe differently than does MSCI, and as a result the Portfolio had lesser allocations to Canada and Japan. The Portfolio’s greater emphasis on small cap securities, which outperformed, contributed to relative performance. The Portfolio’s greater allocations to outperforming countries Australia and Finland also contributed to relative performance. As of June 30, 2016, the Portfolio held over 3,500 securities and was diversified across both countries and sectors.
Joseph Chi
Jed Fogdall
Henry Gray
Arun Keswani
Bhanu Singh
Portfolio Managers
Dimensional Fund Advisors LP
* This commentary may include statements that constitute “forward-looking statements” under the U.S. securities laws. Forward-looking statements include, among other things, projections, estimates, and information about possible or future results related to the Portfolio, market or regulatory developments. The views expressed above are not guarantees of future performance or economic results and involve certain risks, uncertainties and assumptions that could cause actual outcomes and results to differ materially from the views expressed herein. The views expressed above are subject to change at any time based upon economic, market, or other conditions and the subadvisory firm undertakes no obligation to update the views expressed herein. Any discussions of specific securities should not be considered a recommendation to buy or sell those securities. The views expressed above (including any forward-looking statement) may not be relied upon as investment advice or as an indication of the Portfolio’s trading intent. Information about the Portfolio’s holdings, asset allocation or country diversification is historical and is not an indication of future Portfolio composition, which may vary. Direct investment in any index is not possible. The performance of any index mentioned in this commentary has not been adjusted for ongoing management, distribution and operating expenses, and sales charges applicable to mutual fund investments. In addition, the returns do not reflect additional fees charged by separate accounts or variable insurance contracts that an investor in the Portfolio may pay. If these additional fees were reflected, performance would have been lower.
MSF-1
Metropolitan Series Fund
Met/Dimensional International Small Company Portfolio
A $10,000 INVESTMENT COMPARED TO THE MSCI WORLD EX-U.S. SMALL CAP INDEX
SIX MONTH RETURN & AVERAGE ANNUAL RETURNS (%) AS OF JUNE 30, 2016
| | | | | | | | | | | | | | | | |
| | | 6 Month | | | 1 Year | | | 5 Year | | | Since Inception2 | |
| Met/Dimensional International Small Company Portfolio | | | | | | | | | | | | | | | | |
Class A | | | -0.84 | | | | -3.66 | | | | 3.89 | | | | 11.04 | |
Class B | | | -0.95 | | | | -3.93 | | | | 3.63 | | | | 10.76 | |
| MSCI World ex-U.S. Small Cap Index | | | -0.69 | | | | -3.35 | | | | 3.60 | | | | 11.80 | |
1 The MSCI World ex-U.S. Small Cap Index is an unmanaged index that measures the performance of stocks with market capitalizations between US $200 million and $800 million across 23 developed markets, excluding the United States. The index returns shown above were calculated with net dividends: they reflect the reinvestment of dividends after the deduction of the maximum possible withholding taxes.
2 Inception date of the Class A and Class B shares is 10/31/08. Index since inception return is based on the Portfolio’s inception date.
Portfolio performance is calculated including reinvestment of all income and capital gain distributions. Performance numbers are net of all Portfolio expenses but do not include any insurance, sales, separate account or administrative charges of variable annuity or life insurance contracts or any additional expenses that participants may bear relating to the operations of their plans. If these charges were included, the returns would be lower. The performance of any index referenced above has not been adjusted for ongoing management, distribution and operating expenses, and sales charges applicable to mutual fund investments. Direct investment in any index is not possible. The performance of Class A shares, as set forth in the line graph above, will differ from that of other classes because of the difference in expenses paid by policyholders investing in the different share classes.
This information represents past performance and is not indicative of future results. Investment return and principal value may fluctuate so that shares, upon redemption, may be worth more or less than the original cost.
PORTFOLIO COMPOSITION AS OF JUNE 30, 2016
Top Holdings
| | | | |
| | | % of
Net Assets | |
| Teleperformance SE | | | 0.3 | |
| Genmab A/S | | | 0.3 | |
| Halma plc | | | 0.3 | |
| Pennon Group plc | | | 0.3 | |
| DS Smith plc | | | 0.3 | |
| Prysmian S.p.A. | | | 0.3 | |
| Huhtamaki Oyj | | | 0.3 | |
| Fisher & Paykel Healthcare Corp., Ltd. | | | 0.2 | |
| UBISOFT Entertainment S.A. | | | 0.2 | |
| Rightmove plc | | | 0.2 | |
Top Countries
| | | | |
| | | % of
Net Assets | |
| Japan | | | 24.5 | |
| United Kingdom | | | 15.3 | |
| Canada | | | 8.4 | |
| Australia | | | 6.7 | |
| Germany | | | 6.4 | |
| Switzerland | | | 5.4 | |
| France | | | 5.0 | |
| Italy | | | 3.4 | |
| Sweden | | | 3.3 | |
| Hong Kong | | | 3.0 | |
MSF-2
Metropolitan Series Fund
Met/Dimensional International Small Company Portfolio
Understanding Your Portfolio’s Expenses (Unaudited)
Shareholder Expense Example
As a shareholder of the Portfolio, you incur ongoing costs, including management fees; distribution and service (12b-1) fees; and other Portfolio expenses. This example is intended to help you understand your ongoing costs (in dollars) (referred to as “expenses”) of investing in the Portfolio and compare these costs with the ongoing costs of investing in other mutual funds. The example is based on an investment of $1,000 invested at the beginning of the period and held for the entire period, January 1, 2016 through June 30, 2016.
Actual Expenses
The first line for each share class of the Portfolio in the table below provides information about actual account values and actual expenses. You may use the information in this line, together with the amount you invested in the particular share class of the Portfolio, to estimate the expenses that you paid over the period. Simply divide your account value by $1,000 (for example, an $8,600 account value divided by $1,000 = 8.6), then multiply the result by the number in the first line under the heading entitled “Expenses Paid During Period” to estimate the expenses you paid on your account during this period.
Hypothetical Example for Comparison Purposes
The second line for each share class of the Portfolio in the table below provides information about hypothetical account values and hypothetical expenses based on the Portfolio’s actual expense ratio and an assumed rate of return of 5% per year before expenses, which is not the Portfolio’s actual return. The hypothetical account values and expenses may not be used to estimate the actual ending account balance or expenses you paid for the period. You may use this information to compare the ongoing costs of investing in the Portfolio and other funds. To do so, compare this 5% hypothetical example with the 5% hypothetical examples that appear in the shareholder reports of the other funds.
Please note that the expenses shown in the table are meant to highlight your ongoing costs only and do not reflect any fees or charges of your variable insurance product or any additional expenses that participants in certain eligible qualified plans may bear relating to the operations of their plan. Therefore, the second line for each share class in the table is useful in comparing ongoing costs only, and will not help you determine the relative total costs of owning different funds. In addition, if these other costs were included, your costs would have been higher.
| | | | | | | | | | | | | | | | | | |
Met/Dimensional International
Small Company Portfolio | | | | Annualized
Expense
Ratio | | | Beginning
Account Value
January 1,
2016 | | | Ending
Account Value
June 30,
2016 | | | Expenses Paid
During Period**
January 1, 2016
to
June 30,
2016 | |
Class A(a) | | Actual | | | 0.92 | % | | $ | 1,000.00 | | | $ | 991.60 | | | $ | 4.56 | |
| | Hypothetical* | | | 0.92 | % | | $ | 1,000.00 | | | $ | 1,020.29 | | | $ | 4.62 | |
| | | | | |
Class B(a) | | Actual | | | 1.17 | % | | $ | 1,000.00 | | | $ | 990.50 | | | $ | 5.79 | |
| | Hypothetical* | | | 1.17 | % | | $ | 1,000.00 | | | $ | 1,019.05 | | | $ | 5.87 | |
* Hypothetical assumes a rate of return of 5% per year before expenses.
** Expenses paid are equal to the Portfolio’s annualized expense ratio for the most recent six month period, as shown above, multiplied by the average account value over the period, multiplied by the number of days (182 days) in the most recent fiscal half-year, divided by 366 (to reflect the one-half year period).
(a) The annualized expense ratio shown reflects the impact of the management fee waiver as described in Note 5 of the Notes to Financial Statements.
MSF-3
Metropolitan Series Fund
Met/Dimensional International Small Company Portfolio
Schedule of Investments as of June 30, 2016 (Unaudited)
Common Stocks—99.1% of Net Assets
| | | | | | | | |
| Security Description | | Shares | | | Value | |
|
Australia—6.7% | |
Acrux, Ltd. | | | 41,605 | | | $ | 22,366 | |
Adelaide Brighton, Ltd. (a) | | | 197,116 | | | | 823,561 | |
AED Oil, Ltd. (b) (c) (d) | | | 93,946 | | | | 0 | |
Ainsworth Game Technology, Ltd. (a) | | | 51,616 | | | | 83,474 | |
Alkane Resources, Ltd. (c) | | | 120,355 | | | | 17,850 | |
ALS, Ltd. | | | 76,663 | | | | 283,303 | |
Altium, Ltd. | | | 31,832 | | | | 154,164 | |
Altona Mining, Ltd. (c) | | | 67,875 | | | | 6,581 | |
Alumina, Ltd. (a) | | | 473,623 | | | | 463,122 | |
AMA Group, Ltd. | | | 111,029 | | | | 66,610 | |
Ansell, Ltd. | | | 39,937 | | | | 545,826 | |
AP Eagers, Ltd. (a) | | | 7,774 | | | | 69,430 | |
APN News & Media, Ltd. (c) | | | 71,247 | | | | 215,095 | |
ARB Corp., Ltd. (a) | | | 30,444 | | | | 381,627 | |
Ardent Leisure Group | | | 50,226 | | | | 70,835 | |
Arrium, Ltd. (b) (c) (d) | | | 972,288 | | | | 15,953 | |
ASG Group, Ltd. (c) | | | 91,207 | | | | 61,995 | |
AUB Group, Ltd. | | | 25,969 | | | | 195,679 | |
Ausdrill, Ltd. (c) | | | 110,321 | | | | 60,208 | |
Austal, Ltd. | | | 81,889 | | | | 77,295 | |
Australian Agricultural Co., Ltd. (a) (c) | | | 192,359 | | | | 255,514 | |
Australian Pharmaceutical Industries, Ltd. | | | 174,311 | | | | 219,566 | |
Auswide Bank, Ltd. | | | 9,275 | | | | 35,151 | |
Automotive Holdings Group, Ltd. | | | 95,539 | | | | 269,459 | |
Aveo Group | | | 44,138 | | | | 104,924 | |
AVJennings, Ltd. | | | 10,332 | | | | 4,339 | |
AWE, Ltd. (c) | | | 335,940 | | | | 211,783 | |
Bandanna Energy, Ltd. (a) (b) (c) (d) | | | 179,193 | | | | 0 | |
Bank of Queensland, Ltd. | | | 24,268 | | | | 193,320 | |
Beach Energy, Ltd. | | | 950,434 | | | | 439,525 | |
Beadell Resources, Ltd. (c) | | | 102,327 | | | | 29,100 | |
Bega Cheese, Ltd. | | | 58,513 | | | | 247,839 | |
Bellamy’s Australia, Ltd. (a) | | | 9,613 | | | | 73,761 | |
Bendigo and Adelaide Bank, Ltd. | | | 10,665 | | | | 77,355 | |
Billabong International, Ltd. (c) | | | 56,120 | | | | 50,728 | |
Blackmores, Ltd. (a) | | | 5,495 | | | | 542,943 | |
Blue Sky Alternative Investments, Ltd. | | | 5,962 | | | | 36,011 | |
BlueScope Steel, Ltd. | | | 84,045 | | | | 403,005 | |
Bradken, Ltd. (c) | | | 48,239 | | | | 36,609 | |
Breville Group, Ltd. | | | 42,107 | | | | 236,697 | |
Brickworks, Ltd. | | | 5,923 | | | | 63,746 | |
BT Investment Management, Ltd. | | | 25,960 | | | | 154,541 | |
Burson Group, Ltd. | | | 5,252 | | | | 21,719 | |
Buru Energy, Ltd. (c) | | | 23,457 | | | | 4,417 | |
Cabcharge Australia, Ltd. (a) | | | 55,813 | | | | 133,584 | |
Capral, Ltd. (c) | | | 136,176 | | | | 16,327 | |
Cardno, Ltd. (a) | | | 69,333 | | | | 28,246 | |
Carnarvon Petroleum, Ltd. (c) | | | 251,902 | | | | 18,981 | |
carsales.com, Ltd. (a) | | | 83,570 | | | | 771,900 | |
Cash Converters International, Ltd. (a) | | | 152,939 | | | | 50,553 | |
Cedar Woods Properties, Ltd. | | | 27,273 | | | | 88,628 | |
Challenger, Ltd. | | | 122,977 | | | | 798,329 | |
Cleanaway Waste Management, Ltd. | | | 693,108 | | | | 417,052 | |
Coal of Africa, Ltd. (c) | | | 133,534 | | | | 5,776 | |
Collection House, Ltd. | | | 19,217 | | | | 15,817 | |
Collins Foods, Ltd. | | | 4,975 | | | | 15,814 | |
Cooper Energy, Ltd. (c) | | | 154,883 | | | | 24,921 | |
|
Australia—(Continued) | |
Corporate Travel Management, Ltd. (a) | | | 20,836 | | | | 220,457 | |
Credit Corp. Group, Ltd. | | | 13,415 | | | | 120,626 | |
CSG, Ltd. (a) | | | 66,837 | | | | 74,302 | |
CSR, Ltd. | | | 282,278 | | | | 773,501 | |
Cudeco, Ltd. (c) | | | 51,210 | | | | 17,759 | |
Cue Energy Resources, Ltd. (c) | | | 171,183 | | | | 10,390 | |
Data #3, Ltd. | | | 55,471 | | | | 43,560 | |
Decmil Group, Ltd. | | | 56,744 | | | | 30,501 | |
Domino’s Pizza Enterprises, Ltd. | | | 756 | | | | 38,648 | |
Downer EDI, Ltd. | | | 238,347 | | | | 684,113 | |
DSHE Holdings, Ltd. (a) (b) (d) | | | 85,716 | | | | 0 | |
DuluxGroup, Ltd. | | | 165,477 | | | | 782,266 | |
DWS, Ltd. | | | 36,847 | | | | 30,808 | |
Emeco Holdings, Ltd. (c) | | | 314,914 | | | | 7,188 | |
Energy Resources of Australia, Ltd. (a) (c) | | | 51,910 | | | | 13,605 | |
Energy World Corp., Ltd. (a) (c) | | | 325,379 | | | | 45,034 | |
EQT Holdings, Ltd. | | | 3,062 | | | | 37,570 | |
ERM Power, Ltd. | | | 49,991 | | | | 31,430 | |
eServGlobal, Ltd. (c) | | | 43,068 | | | | 2,500 | |
Euroz, Ltd. | | | 23,559 | | | | 13,915 | |
Event Hospitality and Entertainment, Ltd. | | | 38,556 | | | | 418,327 | |
Evolution Mining, Ltd. | | | 157,414 | | | | 274,415 | |
Fairfax Media, Ltd. | | | 967,464 | | | | 677,747 | |
Fantastic Holdings, Ltd. | | | 1,151 | | | | 1,937 | |
Finbar Group, Ltd. | | | 6,909 | | | | 4,290 | |
Fleetwood Corp., Ltd. (a) (c) | | | 22,683 | | | | 31,912 | |
FlexiGroup, Ltd. | | | 49,133 | | | | 64,132 | |
Flight Centre Travel Group, Ltd. (a) | | | 14,871 | | | | 352,780 | |
G8 Education, Ltd. (a) | | | 128,831 | | | | 367,410 | |
Global Construction Services, Ltd. (c) | | | 9,380 | | | | 2,658 | |
GrainCorp, Ltd. - Class A | | | 83,590 | | | | 541,103 | |
Grange Resources, Ltd. (c) | | | 120,000 | | | | 8,252 | |
Greencross, Ltd. | | | 21,334 | | | | 108,170 | |
GUD Holdings, Ltd. (a) | | | 39,734 | | | | 271,822 | |
GWA Group, Ltd. (a) | | | 104,458 | | | | 163,973 | |
Hansen Technologies, Ltd. | | | 47,406 | | | | 120,137 | |
Harvey Norman Holdings, Ltd. | | | 82,493 | | | | 286,003 | |
HFA Holdings, Ltd. | | | 45,623 | | | | 78,293 | |
Hills, Ltd. (a) (c) | | | 80,453 | | | | 14,755 | |
Horizon Oil, Ltd. (c) | | | 652,736 | | | | 23,058 | |
IDM International, Ltd. (b) (c) (d) | | | 49,237 | | | | 0 | |
Iluka Resources, Ltd. (a) | | | 160,998 | | | | 787,613 | |
Imdex, Ltd. (c) | | | 77,362 | | | | 12,068 | |
IMF Bentham, Ltd. (a) | | | 49,173 | | | | 55,978 | |
Independence Group NL | | | 99,103 | | | | 244,957 | |
Infigen Energy, Ltd. (a) (c) | | | 282,132 | | | | 212,575 | |
Infomedia, Ltd. | | | 131,353 | | | | 56,874 | |
Integrated Research, Ltd. | | | 28,972 | | | | 48,786 | |
International Ferro Metals, Ltd. (b) (c) (d) | | | 82,765 | | | | 375 | |
Invocare, Ltd. | | | 38,500 | | | | 379,215 | |
IOOF Holdings, Ltd. (a) | | | 103,265 | | | | 607,972 | |
Iress, Ltd. | | | 55,170 | | | | 451,502 | |
iSelect, Ltd. | | | 46,213 | | | | 43,069 | |
JB Hi-Fi, Ltd. | | | 44,079 | | | | 796,988 | |
Jupiter Mines, Ltd. (b) (c) (d) | | | 63,164 | | | | 3,462 | |
K&S Corp., Ltd. | | | 1,802 | | | | 1,792 | |
Karoon Gas Australia, Ltd. (a) (c) | | | 75,600 | | | | 73,321 | |
See accompanying notes to financial statements.
MSF-4
Metropolitan Series Fund
Met/Dimensional International Small Company Portfolio
Schedule of Investments as of June 30, 2016 (Unaudited)
Common Stocks—(Continued)
| | | | | | | | |
| Security Description | | Shares | | | Value | |
|
Australia—(Continued) | |
Kingsgate Consolidated, Ltd. (a) (b) (c) (d) | | | 121,238 | | | $ | 37,072 | |
Kingsrose Mining, Ltd. (c) | | | 83,494 | | | | 9,019 | |
MACA, Ltd. | | | 56,351 | | | | 53,192 | |
Macmahon Holdings, Ltd. (c) | | | 380,170 | | | | 25,008 | |
Macquarie Atlas Roads Group | | | 181,433 | | | | 704,379 | |
Magellan Financial Group, Ltd. (a) | | | 27,343 | | | | 458,381 | |
MaxiTRANS Industries, Ltd. | | | 59,013 | | | | 19,982 | |
Mayne Pharma Group, Ltd. (a) (c) (d) | | | 351,767 | | | | 499,773 | |
McMillan Shakespeare, Ltd. | | | 29,453 | | | | 302,747 | |
McPherson’s, Ltd. | | | 34,460 | | | | 22,480 | |
Medusa Mining, Ltd. (c) | | | 60,972 | | | | 29,182 | |
Melbourne IT, Ltd. | | | 36,135 | | | | 47,985 | |
Metals X, Ltd. | | | 75,358 | | | | 78,498 | |
Metcash, Ltd. (a) (c) | | | 369,266 | | | | 527,189 | |
Mincor Resources NL (c) | | | 105,687 | | | | 23,988 | |
Mineral Deposits, Ltd. (c) | | | 45,217 | | | | 6,991 | |
Mineral Resources, Ltd. (a) | | | 41,091 | | | | 258,392 | |
MMA Offshore, Ltd. (a) | | | 100,235 | | | | 23,116 | |
Monadelphous Group, Ltd. (a) | | | 40,177 | | | | 225,417 | |
Morning Star Gold NL (b) (c) (d) | | | 33,455 | | | | 17 | |
Mortgage Choice, Ltd. | | | 48,689 | | | | 70,860 | |
Mount Gibson Iron, Ltd. (a) (c) | | | 439,215 | | | | 85,297 | |
Myer Holdings, Ltd. (a) | | | 355,143 | | | | 298,704 | |
MyState, Ltd. | | | 3,899 | | | | 12,025 | |
Navitas, Ltd. (a) | | | 96,272 | | | | 397,345 | |
New Hope Corp., Ltd. | | | 6,285 | | | | 6,699 | |
nib holdings, Ltd. | | | 208,017 | | | | 656,578 | |
Nick Scali, Ltd. | | | 16,348 | | | | 60,841 | |
Nine Entertainment Co. Holdings, Ltd. (a) | | | 18,490 | | | | 14,588 | |
Northern Star Resources, Ltd. | | | 220,636 | | | | 814,712 | |
Nufarm, Ltd. | | | 79,335 | | | | 440,134 | |
Orocobre, Ltd. (a) (c) | | | 49,318 | | | | 178,178 | |
Orora, Ltd. | | | 225,473 | | | | 466,902 | |
OrotonGroup, Ltd. | | | 8,647 | | | | 13,516 | |
OZ Minerals, Ltd. | | | 149,299 | | | | 634,894 | |
OzForex Group, Ltd. (a) | | | 99,303 | | | | 174,062 | |
Pacific Brands, Ltd. (b) | | | 472,799 | | | | 408,402 | |
Pacific Current Group, Ltd. | | | 1,159 | | | | 3,745 | |
Pact Group Holdings, Ltd. | | | 4,623 | | | | 21,004 | |
Paladin Energy, Ltd. (a) (c) | | | 612,137 | | | | 84,901 | |
Panoramic Resources, Ltd. (c) | | | 146,618 | | | | 14,874 | |
Patties Foods, Ltd. | | | 16,945 | | | | 21,672 | |
Peet, Ltd. | | | 88,199 | | | | 61,321 | |
Peninsula Energy, Ltd. (c) | | | 11,352 | | | | 4,137 | |
Perpetual, Ltd. | | | 19,256 | | | | 595,877 | |
Perseus Mining, Ltd. (c) (d) | | | 231,401 | | | | 89,438 | |
Platinum Asset Management, Ltd. | | | 21,691 | | | | 93,997 | |
Pluton Resources, Ltd. (b) (c) (d) | | | 48,332 | | | | 94 | |
PMP, Ltd. | | | 158,703 | | | | 63,877 | |
Premier Investments, Ltd. | | | 44,992 | | | | 481,015 | |
Primary Health Care, Ltd. | | | 244,279 | | | | 723,830 | |
Prime Media Group, Ltd. | | | 93,371 | | | | 22,004 | |
Programmed Maintenance Services, Ltd. | | | 95,504 | | | | 126,741 | |
Qube Holdings, Ltd. (a) | | | 281,810 | | | | 466,540 | |
RCG Corp., Ltd. (a) | | | 90,942 | | | | 100,615 | |
RCR Tomlinson, Ltd. | | | 61,564 | | | | 78,496 | |
Reckon, Ltd. | | | 36,898 | | | | 40,328 | |
|
Australia—(Continued) | |
Regis Resources, Ltd. | | | 180,703 | | | | 461,751 | |
Reject Shop, Ltd. (The) | | | 12,421 | | | | 113,349 | |
Resolute Mining, Ltd. (c) | | | 248,330 | | | | 238,775 | |
Retail Food Group, Ltd. (a) | | | 58,516 | | | | 243,065 | |
Ridley Corp., Ltd. | | | 123,003 | | | | 128,766 | |
RungePincockMinarco, Ltd. (c) | | | 4,190 | | | | 1,282 | |
Ruralco Holdings, Ltd. | | | 7,095 | | | | 18,037 | |
SAI Global, Ltd. | | | 62,244 | | | | 170,487 | |
Salmat, Ltd. (c) | | | 45,807 | | | | 14,976 | |
Sandfire Resources NL | | | 40,717 | | | | 160,819 | |
Saracen Mineral Holdings, Ltd. (c) | | | 390,479 | | | | 419,064 | |
Select Harvests, Ltd. (a) | | | 30,640 | | | | 155,735 | |
Senex Energy, Ltd. (c) | | | 248,220 | | | | 48,164 | |
Servcorp, Ltd. | | | 26,561 | | | | 136,881 | |
Service Stream, Ltd. | | | 62,705 | | | | 36,928 | |
Seven Group Holdings, Ltd. (a) | | | 15,634 | | | | 70,779 | |
Seven West Media, Ltd. | | | 460,617 | | | | 367,673 | |
Sigma Pharmaceuticals, Ltd. | | | 621,692 | | | | 526,958 | |
Silex Systems, Ltd. (c) | | | 28,112 | | | | 6,516 | |
Silver Chef, Ltd. | | | 8,241 | | | | 66,034 | |
Silver Lake Resources, Ltd. (a) (c) | | | 112,092 | | | | 43,207 | |
Sims Metal Management, Ltd. | | | 86,197 | | | | 508,843 | |
Sirtex Medical, Ltd. | | | 22,520 | | | | 431,165 | |
Slater & Gordon, Ltd. (a) | | | 116,238 | | | | 34,073 | |
SMS Management & Technology, Ltd. | | | 35,576 | | | | 43,217 | |
Southern Cross Media Group, Ltd. | | | 229,061 | | | | 214,711 | |
Spark Infrastructure Group | | | 742,738 | | | | 1,356,691 | |
Specialty Fashion Group, Ltd. (c) | | | 34,701 | | | | 14,023 | |
Spotless Group Holdings, Ltd. | | | 23,095 | | | | 19,493 | |
St. Barbara, Ltd. (a) (c) | | | 192,892 | | | | 425,373 | |
Star Entertainment Group, Ltd. (The) | | | 210,220 | | | | 850,146 | |
Steadfast Group, Ltd. | | | 71,948 | | | | 106,643 | |
Strike Energy, Ltd. (c) | | | 182,555 | | | | 15,615 | |
Sundance Energy Australia, Ltd. (c) | | | 197,698 | | | | 15,057 | |
Sunland Group, Ltd. (a) | | | 40,150 | | | | 42,438 | |
Super Retail Group, Ltd. (a) | | | 69,714 | | | | 458,913 | |
Tabcorp Holdings, Ltd. | | | 236,852 | | | | 809,812 | |
Tassal Group, Ltd. | | | 72,156 | | | | 215,849 | |
Technology One, Ltd. | | | 85,252 | | | | 331,186 | |
Ten Network Holdings, Ltd. (c) | | | 109,315 | | | | 74,342 | |
TFS Corp., Ltd. (a) | | | 106,522 | | | | 112,135 | |
Thorn Group, Ltd. | | | 58,154 | | | | 60,524 | |
Tiger Resources, Ltd. (a) (c) | | | 591,241 | | | | 17,774 | |
Toro Energy, Ltd. (c) | | | 75,052 | | | | 2,524 | |
Tox Free Solutions, Ltd. | | | 71,737 | | | | 139,209 | |
Treasury Wine Estates, Ltd. | | | 76,917 | | | | 532,077 | |
Troy Resources, Ltd. (c) | | | 80,795 | | | | 32,631 | |
UGL, Ltd. (c) | | | 29,320 | | | | 47,102 | |
Villa World, Ltd. | | | 14,787 | | | | 22,970 | |
Village Roadshow, Ltd. | | | 32,709 | | | | 128,267 | |
Virgin Australia Holdings, Ltd. (c) | | | 442,369 | | | | 67,907 | |
Virgin Australia International Holding, Ltd. (b) (c) (d) | | | 968,773 | | | | 1 | |
Virtus Health, Ltd. | | | 37,091 | | | | 191,120 | |
Vita Group, Ltd. | | | 18,112 | | | | 55,780 | |
Watpac, Ltd. (c) | | | 37,999 | | | | 23,311 | |
Webjet, Ltd. | | | 25,862 | | | | 137,896 | |
See accompanying notes to financial statements.
MSF-5
Metropolitan Series Fund
Met/Dimensional International Small Company Portfolio
Schedule of Investments as of June 30, 2016 (Unaudited)
Common Stocks—(Continued)
| | | | | | | | |
| Security Description | | Shares | | | Value | |
|
Australia—(Continued) | |
Western Areas, Ltd. (a) | | | 118,029 | | | $ | 192,735 | |
Whitehaven Coal, Ltd. (a) (c) | | | 121,287 | | | | 99,107 | |
WorleyParsons, Ltd. | | | 29,059 | | | | 160,166 | |
WPP AUNZ, Ltd. | | | 131,382 | | | | 103,869 | |
| | | | | | | | |
| | | | | | | 42,983,840 | |
| | | | | | | | |
|
Austria—1.0% | |
A-TEC Industries AG (a) (b) (d) | | | 1,312 | | | | 164 | |
Agrana Beteiligungs AG (a) | | | 1,574 | | | | 163,444 | |
ams AG (a) | | | 29,130 | | | | 806,382 | |
Andritz AG | | | 5,479 | | | | 260,339 | |
Austria Technologie & Systemtechnik AG | | | 14,133 | | | | 170,359 | |
BUWOG AG (c) | | | 12,013 | | | | 277,396 | |
CA Immobilien Anlagen AG (c) | | | 16,824 | | | | 281,379 | |
Conwert Immobilien Invest SE (c) | | | 20,619 | | | | 330,077 | |
DO & Co. AG | | | 1,857 | | | | 162,769 | |
EVN AG | | | 12,657 | | | | 143,868 | |
IMMOFINANZ AG (c) | | | 125,781 | | | | 269,246 | |
Kapsch TrafficCom AG | | | 2,222 | | | | 83,733 | |
Lenzing AG | | | 3,209 | | | | 296,186 | |
Mayr Melnhof Karton AG | | | 3,412 | | | | 371,803 | |
Oberbank AG | | | 182 | | | | 11,310 | |
Oesterreichische Post AG (a) (c) | | | 10,867 | | | | 350,922 | |
Palfinger AG | | | 5,947 | | | | 171,176 | |
POLYTEC Holding AG | | | 10,783 | | | | 88,038 | |
Porr AG | | | 1,436 | | | | 38,972 | |
Raiffeisen Bank International AG (c) | | | 10,194 | | | | 128,304 | |
RHI AG (a) | | | 8,926 | | | | 172,141 | |
Rosenbauer International AG (a) | | | 1,615 | | | | 94,733 | |
S IMMO AG (c) | | | 35,979 | | | | 335,946 | |
S&T AG | | | 2,389 | | | | 19,316 | |
Schoeller-Bleckmann Oilfield Equipment AG (a) | | | 3,509 | | | | 212,374 | |
Semperit AG Holding | | | 6,041 | | | | 200,989 | |
Strabag SE (a) | | | 6,827 | | | | 205,793 | |
Telekom Austria AG (c) | | | 14,924 | | | | 86,607 | |
UBM Development AG | | | 78 | | | | 2,556 | |
UNIQA Insurance Group AG | | | 14,804 | | | | 89,183 | |
Wienerberger AG | | | 39,101 | | | | 548,313 | |
Zumtobel Group AG | | | 14,277 | | | | 173,272 | |
| | | | | | | | |
| | | | | | | 6,547,090 | |
| | | | | | | | |
|
Belgium—1.9% | |
Ablynx NV (a) (c) | | | 15,614 | | | | 205,088 | |
Ackermans & van Haaren NV | | | 8,887 | | | | 1,088,906 | |
AGFA-Gevaert NV (c) | | | 125,762 | | | | 411,544 | |
Atenor | | | 1,089 | | | | 54,709 | |
Banque Nationale de Belgique | | | 104 | | | | 328,406 | |
Barco NV | | | 5,609 | | | | 366,505 | |
Bekaert S.A. (a) | | | 11,685 | | | | 504,415 | |
bpost S.A. | | | 6,013 | | | | 153,069 | |
Cie d’Entreprises CFE | | | 5,563 | | | | 507,097 | |
Cie Immobiliere de Belgique S.A. (c) | | | 1,276 | | | | 67,179 | |
D’ieteren S.A. | | | 8,787 | | | | 381,349 | |
Dalenys (c) | | | 1,352 | | | | 12,329 | |
Deceuninck NV (d) | | | 49,164 | | | | 121,869 | |
Econocom Group S.A. (c) | | | 27,496 | | | | 316,672 | |
|
Belgium—(Continued) | |
Elia System Operator S.A. | | | 12,209 | | | | 682,718 | |
Euronav NV | | | 30,049 | | | | 277,228 | |
EVS Broadcast Equipment S.A. | | | 4,761 | | | | 154,643 | |
Exmar NV | | | 10,339 | | | | 73,928 | |
Fagron (a) (c) | | | 13,446 | | | | 118,771 | |
Galapagos NV (c) | | | 16,401 | | | | 900,131 | |
GIMV NV | | | 250 | | | | 14,103 | |
Ion Beam Applications | | | 11,487 | | | | 541,581 | |
Jensen-Group NV | | | 738 | | | | 21,583 | |
Kinepolis Group NV | | | 8,460 | | | | 377,782 | |
Lotus Bakeries NV | | | 118 | | | | 220,282 | |
MDxHealth (c) | | | 5,915 | | | | 24,911 | |
Melexis NV | | | 9,084 | | | | 569,324 | |
Nyrstar NV (a) (c) (d) | | | 26,926 | | | | 255,681 | |
Ontex Group NV | | | 2,421 | | | | 76,528 | |
Orange Belgium S.A. (c) | | | 13,209 | | | | 304,889 | |
Picanol | | | 1,699 | | | | 111,067 | |
RealDolmen NV | | | 1,200 | | | | 27,387 | |
Recticel S.A. | | | 24,409 | | | | 138,234 | |
Resilux NV | | | 229 | | | | 35,500 | |
Roularta Media Group NV | | | 1,629 | | | | 46,171 | |
Sioen Industries NV | | | 4,097 | | | | 86,011 | |
Sipef S.A. | | | 3,346 | | | | 182,845 | |
Tessenderlo Chemie NV (c) | | | 19,032 | | | | 648,293 | |
ThromboGenics NV (a) (c) | | | 9,279 | | | | 32,999 | |
Umicore S.A. | | | 26,112 | | | | 1,345,488 | |
Van de Velde NV | | | 2,850 | | | | 189,964 | |
Viohalco S.A. (c) | | | 45,397 | | | | 59,885 | |
| | | | | | | | |
| | | | | | | 12,037,064 | |
| | | | | | | | |
| | |
Cambodia—0.1% | | | | | | | | |
NagaCorp, Ltd. | | | 458,000 | | | | 305,120 | |
| | | | | | | | |
| | |
Canada—8.4% | | | | | | | | |
5N Plus, Inc. (c) | | | 33,732 | | | | 53,002 | |
Absolute Software Corp. | | | 18,754 | | | | 100,306 | |
Acadian Timber Corp. (a) | | | 3,800 | | | | 48,767 | |
Advantage Oil & Gas, Ltd. (c) | | | 113,630 | | | | 635,016 | |
Aecon Group, Inc. (a) | | | 33,422 | | | | 454,784 | |
AG Growth International, Inc. (a) | | | 5,820 | | | | 184,472 | |
AGF Management, Ltd. - Class B (a) | | | 32,280 | | | | 124,927 | |
AGT Food & Ingredients, Inc. (a) | | | 7,901 | | | | 217,041 | |
Aimia, Inc. | | | 29,471 | | | | 180,209 | |
AirBoss of America Corp. | | | 3,761 | | | | 40,988 | |
AKITA Drilling, Ltd. - Class A | | | 2,003 | | | | 12,977 | |
Alacer Gold Corp. (c) | | | 102,778 | | | | 245,022 | |
Alamos Gold, Inc. - Class A | | | 95,845 | | | | 824,210 | |
Alaris Royalty Corp. (a) | | | 8,954 | | | | 198,701 | |
Algoma Central Corp. | | | 4,410 | | | | 38,401 | |
Algonquin Power & Utilities Corp. (a) | | | 77,093 | | | | 709,498 | |
Alterra Power Corp. (c) | | | 150,766 | | | | 57,765 | |
Altius Minerals Corp. (a) | | | 9,660 | | | | 80,752 | |
Altus Group, Ltd. (a) | | | 14,488 | | | | 249,737 | |
Andrew Peller, Ltd. - Class A | | | 1,139 | | | | 24,562 | |
Argonaut Gold, Inc. (c) | | | 52,825 | | | | 155,374 | |
See accompanying notes to financial statements.
MSF-6
Metropolitan Series Fund
Met/Dimensional International Small Company Portfolio
Schedule of Investments as of June 30, 2016 (Unaudited)
Common Stocks—(Continued)
| | | | | | | | |
| Security Description | | Shares | | | Value | |
|
Canada—(Continued) | |
Asanko Gold, Inc. (c) | | | 23,027 | | | $ | 88,048 | |
Athabasca Oil Corp. (a) (c) | | | 66,624 | | | | 73,743 | |
ATS Automation Tooling Systems, Inc. (c) | | | 36,533 | | | | 274,856 | |
AuRico Metals, Inc. (a) (c) | | | 42,144 | | | | 33,273 | |
AutoCanada, Inc. (a) | | | 8,428 | | | | 144,495 | |
Avigilon Corp. (a) (c) | | | 14,381 | | | | 147,711 | |
Axia NetMedia Corp. | | | 22,633 | | | | 73,052 | |
B2Gold Corp. (c) | | | 313,368 | | | | 785,876 | |
Badger Daylighting, Ltd. (a) | | | 9,562 | | | | 166,527 | |
Ballard Power Systems, Inc. (a) (c) | | | 5,735 | | | | 7,147 | |
Bankers Petroleum, Ltd. (c) | | | 141,893 | | | | 226,247 | |
Baytex Energy Corp. | | | 7,300 | | | | 42,378 | |
Bellatrix Exploration, Ltd. (a) (c) | | | 60,265 | | | | 59,241 | |
Birchcliff Energy, Ltd. (a) (c) | | | 58,552 | | | | 311,806 | |
Bird Construction, Inc. (a) | | | 18,612 | | | | 192,610 | |
Black Diamond Group, Ltd. | | | 19,812 | | | | 82,655 | |
BlackPearl Resources, Inc. (c) | | | 117,817 | | | | 94,841 | |
BMTC Group, Inc. | | | 5,387 | | | | 52,788 | |
Bonavista Energy Corp. | | | 15,300 | | | | 39,080 | |
Bonterra Energy Corp. (a) | | | 12,499 | | | | 257,439 | |
Boralex, Inc. - Class A (a) | | | 11,154 | | | | 168,093 | |
Brookfield Real Estate Services, Inc. | | | 800 | | | | 9,276 | |
BRP, Inc. (a) (c) | | | 10,168 | | | | 162,679 | |
Calfrac Well Services, Ltd. (a) | | | 22,893 | | | | 68,753 | |
Calian Group, Ltd. | | | 2,846 | | | | 43,507 | |
Calvalley Petroleums, Inc. - Class A (c) | | | 19,422 | | | | 0 | |
Canaccord Genuity Group, Inc. | | | 54,653 | | | | 208,129 | |
Canacol Energy, Ltd. (c) | | | 32,061 | | | | 107,949 | |
Canadian Energy Services & Technology Corp. (a) | | | 70,437 | | | | 221,896 | |
Canadian Western Bank (a) | | | 32,028 | | | | 611,084 | |
Canam Group, Inc. | | | 22,324 | | | | 225,149 | |
Canexus Corp. | | | 56,579 | | | | 55,618 | |
Canfor Corp. (c) | | | 17,141 | | | | 173,141 | |
Canfor Pulp Products, Inc. (a) | | | 15,297 | | | | 122,310 | |
CanWel Building Materials Group, Ltd. | | | 9,304 | | | | 39,752 | |
Canyon Services Group, Inc. (a) | | | 27,085 | | | | 118,449 | |
Capital Power Corp. (a) | | | 43,408 | | | | 647,785 | |
Capstone Mining Corp. (c) | | | 95,339 | | | | 62,725 | |
Cascades, Inc. | | | 46,236 | | | | 327,458 | |
Celestica, Inc. (c) | | | 36,485 | | | | 339,448 | |
Celestica, Inc. (U.S. Listed Shares) (c) | | | 223 | | | | 2,074 | |
Centerra Gold, Inc. | | | 51,685 | | | | 308,042 | |
Cequence Energy, Ltd. (c) | | | 86,636 | | | | 21,459 | |
Cervus Equipment Corp. | | | 2,998 | | | | 26,129 | |
China Gold International Resources Corp., Ltd. (a) (c) | | | 54,113 | | | | 98,010 | |
Chinook Energy, Inc. (c) | | | 27,917 | | | | 11,236 | |
Cineplex, Inc. (a) | | | 18,036 | | | | 720,072 | |
Clairvest Group, Inc. | | | 200 | | | | 4,508 | |
Clarke, Inc. (a) | | | 1,614 | | | | 11,368 | |
Clearwater Seafoods, Inc. | | | 7,044 | | | | 76,222 | |
Cogeco Communications, Inc. | | | 1,120 | | | | 58,776 | |
Cogeco, Inc. | | | 2,309 | | | | 99,781 | |
Colliers International Group, Inc. | | | 12,580 | | | | 429,606 | |
Computer Modelling Group, Ltd. (a) | | | 21,620 | | | | 173,034 | |
|
Canada—(Continued) | |
Copper Mountain Mining Corp. (a) (c) | | | 57,011 | | | | 21,623 | |
Corby Spirit and Wine, Ltd. | | | 3,957 | | | | 62,175 | |
Corridor Resources, Inc. (a) (c) | | | 21,385 | | | | 7,449 | |
Corus Entertainment, Inc. - B Shares (a) | | | 31,990 | | | | 329,817 | |
Cott Corp. (a) | | | 2,000 | | | | 27,920 | |
Cott Corp. (Toronto Exchange) | | | 38,179 | | | | 533,699 | |
Crew Energy, Inc. (a) (c) | | | 69,029 | | | | 310,429 | |
Delphi Energy Corp. (a) (c) | | | 95,850 | | | | 80,867 | |
Denison Mines Corp. (c) | | | 247,548 | | | | 136,042 | |
Descartes Systems Group, Inc. (The) (c) | | | 28,586 | | | | 546,739 | |
Detour Gold Corp. (c) | | | 47,995 | | | | 1,200,664 | |
DirectCash Payments, Inc. | | | 4,974 | | | | 50,435 | |
Dominion Diamond Corp. | | | 23,880 | | | | 211,269 | |
Dominion Diamond Corp. (U.S. Listed Shares) (c) | | | 9,238 | | | | 81,664 | |
Dorel Industries, Inc. - Class B | | | 12,134 | | | | 322,897 | |
Dundee Precious Metals, Inc. (a) (c) | | | 40,545 | | | | 96,659 | |
E-L Financial Corp., Ltd. | | | 177 | | | | 93,984 | |
Eastern Platinum, Ltd. (a) (c) | | | 42,003 | | | | 34,462 | |
Echelon Financial Holdings, Inc. (a) | | | 900 | | | | 8,297 | |
EcoSynthetix, Inc. (c) | | | 800 | | | | 929 | |
Eldorado Gold Corp. | | | 15,555 | | | | 69,952 | |
Enbridge Income Fund Holdings, Inc. (a) | | | 18,118 | | | | 449,602 | |
Endeavour Mining Corp. (a) (c) | | | 16,215 | | | | 275,239 | |
Endeavour Silver Corp. (c) | | | 37,334 | | | | 146,799 | |
EnerCare, Inc. (a) | | | 25,125 | | | | 332,550 | |
Enerflex, Ltd. | | | 29,289 | | | | 242,120 | |
Energy Fuels, Inc. (c) | | | 4,125 | | | | 9,291 | |
Enghouse Systems, Ltd. | | | 7,089 | | | | 300,636 | |
Ensign Energy Services, Inc. | | | 51,526 | | | | 289,147 | |
Epsilon Energy, Ltd. (a) (c) | | | 18,214 | | | | 45,819 | |
Equitable Group, Inc. (a) | | | 3,909 | | | | 169,407 | |
Equity Financial Holdings, Inc. (c) | | | 1,100 | | | | 8,897 | |
Essential Energy Services Trust (c) | | | 53,526 | | | | 26,930 | |
Evertz Technologies, Ltd. | | | 9,149 | | | | 129,592 | |
exactEarth, Ltd. (c) | | | 7,612 | | | | 8,190 | |
Exchange Income Corp. | | | 6,151 | | | | 148,639 | |
Exco Technologies, Ltd. | | | 13,332 | | | | 125,895 | |
Exeter Resource Corp. (c) | | | 11,335 | | | | 14,301 | |
EXFO, Inc. (c) | | | 85 | | | | 294 | |
Extendicare, Inc. (a) | | | 41,356 | | | | 260,566 | |
Fiera Capital Corp. | | | 8,019 | | | | 79,572 | |
Firm Capital Mortgage Investment Corp. (a) | | | 5,574 | | | | 59,366 | |
First Majestic Silver Corp. (a) (c) | | | 51,360 | | | | 697,680 | |
First National Financial Corp. (a) | | | 4,107 | | | | 95,272 | |
FirstService Corp. (a) | | | 12,580 | | | | 575,372 | |
Fortress Paper, Ltd. - Class A (a) (c) | | | 7,338 | | | | 23,571 | |
Fortuna Silver Mines, Inc. (c) | | | 60,121 | | | | 420,212 | |
Freehold Royalties, Ltd. | | | 1,412 | | | | 13,017 | |
Gamehost, Inc. (a) | | | 4,952 | | | | 38,330 | |
Genesis Land Development Corp. | | | 14,348 | | | | 30,652 | |
Genworth MI Canada, Inc. (a) | | | 10,076 | | | | 258,461 | |
Gibson Energy, Inc. (a) | | | 40,344 | | | | 468,096 | |
Glacier Media, Inc. (a) (c) | | | 9,600 | | | | 4,830 | |
Gluskin Sheff & Associates, Inc. | | | 10,533 | | | | 135,907 | |
GMP Capital, Inc. | | | 28,336 | | | | 115,366 | |
Goeasy, Ltd. | | | 2,000 | | | | 28,469 | |
See accompanying notes to financial statements.
MSF-7
Metropolitan Series Fund
Met/Dimensional International Small Company Portfolio
Schedule of Investments as of June 30, 2016 (Unaudited)
Common Stocks—(Continued)
| | | | | | | | |
| Security Description | | Shares | | | Value | |
|
Canada—(Continued) | |
Golden Star Resources, Ltd. (a) (c) | | | 73,133 | | | $ | 46,984 | |
Gran Tierra Energy, Inc. (c) | | | 99,813 | | | | 335,298 | |
Granite Oil Corp. | | | 10,252 | | | | 63,086 | |
Great Canadian Gaming Corp. (c) | | | 11,594 | | | | 161,263 | |
Great Panther Silver, Ltd. (a) (c) | | | 67,206 | | | | 111,321 | |
Guyana Goldfields, Inc. (c) | | | 37,547 | | | | 269,117 | |
Hanfeng Evergreen, Inc. (b) (c) (d) | | | 12,100 | | | | 12 | |
Heroux-Devtek, Inc. (c) | | | 14,606 | | | | 169,581 | |
High Liner Foods, Inc. (a) | | | 4,107 | | | | 59,923 | |
HNZ Group, Inc. | | | 3,031 | | | | 30,499 | |
Home Capital Group, Inc. (a) | | | 20,814 | | | | 515,859 | |
Horizon North Logistics, Inc. | | | 30,612 | | | | 38,385 | |
HudBay Minerals, Inc. | | | 103,103 | | | | 492,392 | |
IAMGOLD Corp. (a) (c) | | | 152,782 | | | | 632,674 | |
IMAX Corp. (a) (c) | | | 21,475 | | | | 633,083 | |
Imperial Metals Corp. (c) | | | 15,126 | | | | 74,579 | |
Indigo Books & Music, Inc. (c) | | | 1,986 | | | | 25,979 | |
Innergex Renewable Energy, Inc. (a) | | | 38,391 | | | | 430,578 | |
Interfor Corp. (c) | | | 33,292 | | | | 285,261 | |
International Tower Hill Mines, Ltd. (c) | | | 21,604 | | | | 19,230 | |
Intertape Polymer Group, Inc. | | | 15,813 | | | | 258,012 | |
Ithaca Energy, Inc. (c) | | | 123,116 | | | | 119,118 | |
Just Energy Group, Inc. (a) | | | 71,937 | | | | 436,539 | |
K-Bro Linen, Inc. (a) | | | 2,319 | | | | 75,352 | |
Katanga Mining, Ltd. (c) | | | 26,500 | | | | 3,077 | |
Kelt Exploration, Ltd. (a) (c) | | | 21,351 | | | | 78,169 | |
Killam Apartment Real Estate Investment Trust | | | 2,034 | | | | 19,979 | |
Kingsway Financial Services, Inc. (a) (c) | | | 8,765 | | | | 46,812 | |
Kinross Gold Corp. (c) | | | 109,503 | | | | 537,365 | |
Kirkland Lake Gold, Inc. (c) | | | 42,041 | | | | 346,233 | |
Klondex Mines, Ltd. (c) | | | 17,647 | | | | 64,062 | |
Knight Therapeutics, Inc. (c) | | | 4,998 | | | | 32,109 | |
Labrador Iron Ore Royalty Corp. (a) | | | 10,800 | | | | 103,741 | |
Laurentian Bank of Canada (a) | | | 13,206 | | | | 493,098 | |
Leon’s Furniture, Ltd. | | | 9,639 | | | | 112,882 | |
Lightstream Resources, Ltd. (c) | | | 108,373 | | | | 15,938 | |
Liquor Stores N.A., Ltd. (a) | | | 12,660 | | | | 89,466 | |
Long Run Exploration, Ltd. (c) | | | 45,123 | | | | 18,162 | |
Lucara Diamond Corp. | | | 110,136 | | | | 296,663 | |
Lundin Mining Corp. (c) | | | 7,972 | | | | 26,903 | |
MacDonald Dettwiler & Associates, Ltd. (a) | | | 4,268 | | | | 278,389 | |
Magellan Aerospace Corp. | | | 5,794 | | | | 80,769 | |
Mainstreet Equity Corp. (a) (c) | | | 2,561 | | | | 70,668 | |
Major Drilling Group International, Inc. (a) | | | 36,670 | | | | 221,959 | |
Mandalay Resources Corp. | | | 87,627 | | | | 80,712 | |
Manitoba Telecom Services, Inc. (a) | | | 9,487 | | | | 278,526 | |
Maple Leaf Foods, Inc. | | | 34,605 | | | | 739,001 | |
Martinrea International, Inc. (a) | | | 32,289 | | | | 199,940 | |
Maxim Power Corp. (c) | | | 2,800 | | | | 6,263 | |
McCoy Global, Inc. (c) | | | 4,388 | | | | 6,148 | |
Mediagrif Interactive Technologies, Inc. (a) | | | 4,176 | | | | 56,307 | |
Medical Facilities Corp. (a) | | | 12,861 | | | | 188,941 | |
Melcor Developments, Ltd. | | | 3,120 | | | | 34,993 | |
Mitel Networks Corp. (c) | | | 23,670 | | | | 148,584 | |
Morneau Shepell, Inc. (a) | | | 13,185 | | | | 181,046 | |
MTY Food Group, Inc. (a) | | | 5,004 | | | | 168,136 | |
Mullen Group, Ltd. (a) | | | 37,792 | | | | 412,452 | |
|
Canada—(Continued) | |
Nautilus Minerals, Inc. (c) | | | 134,471 | | | | 11,449 | |
Nevsun Resources, Ltd. | | | 81,011 | | | | 237,650 | |
New Flyer Industries, Inc. (a) | | | 17,136 | | | | 533,597 | |
New Gold, Inc. (c) | | | 52,013 | | | | 227,465 | |
Newalta Corp. | | | 23,919 | | | | 39,805 | |
Norbord, Inc. (a) | | | 7,018 | | | | 137,215 | |
North American Energy Partners, Inc. | | | 14,743 | | | | 41,309 | |
North West Co., Inc. (The) (a) | | | 17,071 | | | | 389,266 | |
Northern Dynasty Minerals, Ltd. (c) | | | 27,464 | | | | 8,503 | |
Northland Power, Inc. (a) | | | 33,879 | | | | 582,154 | |
NuVista Energy, Ltd. (c) | | | 59,117 | | | | 285,987 | |
OceanaGold Corp. | | | 150,911 | | | | 575,867 | |
Osisko Gold Royalties, Ltd. | | | 18,606 | | | | 243,241 | |
Ovivo, Inc. - Class A (c) | | | 12,735 | | | | 28,586 | |
Painted Pony Petroleum, Ltd. (c) | | | 38,738 | | | | 227,280 | |
Pan American Silver Corp. | | | 55,071 | | | | 907,087 | |
Paramount Resources, Ltd. - Class A (c) | | | 5,000 | | | | 41,488 | |
Parex Resources, Inc. (c) | | | 55,359 | | | | 536,043 | |
Parkland Fuel Corp. (a) | | | 26,463 | | | | 460,662 | |
Pason Systems, Inc. | | | 22,516 | | | | 311,263 | |
Pengrowth Energy Corp. (a) | | | 183,295 | | | | 334,824 | |
Petrus Resources, Ltd. (c) | | | 1,290 | | | | 1,857 | |
PHX Energy Services Corp. (a) | | | 12,350 | | | | 25,714 | |
Pizza Pizza Royalty Corp. (a) | | | 6,998 | | | | 79,733 | |
Platinum Group Metals, Ltd. (a) (c) | | | 3,208 | | | | 10,777 | |
Points International, Ltd. (c) | | | 5,320 | | | | 47,972 | |
Polymet Mining Corp. (a) (c) | | | 38,355 | | | | 29,985 | |
Precision Drilling Corp. (a) | | | 82,898 | | | | 439,530 | |
Premium Brands Holdings Corp. (a) | | | 7,879 | | | | 331,760 | |
Pretium Resources, Inc. (c) | | | 3,500 | | | | 39,173 | |
Primero Mining Corp. (c) | | | 70,253 | | | | 146,275 | |
Pulse Seismic, Inc. (a) | | | 15,720 | | | | 31,028 | |
QLT, Inc. (c) | | | 25,500 | | | | 36,712 | |
Questerre Energy Corp. - Class A (c) | | | 83,569 | | | | 12,613 | |
Raging River Exploration, Inc. (c) | | | 23,000 | | | | 183,010 | |
RB Energy, Inc. (c) (d) | | | 76,741 | | | | 100 | |
Reitmans Canada, Ltd. - Class A | | | 20,566 | | | | 70,042 | |
Richelieu Hardware, Ltd. | | | 18,390 | | | | 360,839 | |
Richmont Mines, Inc. (c) | | | 20,415 | | | | 189,462 | |
RMP Energy, Inc. (a) (c) | | | 72,808 | | | | 69,880 | |
Rock Energy, Inc. (c) | | | 14,187 | | | | 9,004 | |
Rocky Mountain Dealerships, Inc. (a) | | | 3,738 | | | | 20,369 | |
Rogers Sugar, Inc. (a) | | | 35,106 | | | | 160,592 | |
Russel Metals, Inc. | | | 25,722 | | | | 455,528 | |
Sabina Gold & Silver Corp. (c) | | | 45,006 | | | | 38,668 | |
Sandstorm Gold, Ltd. (c) | | | 48,383 | | | | 217,582 | |
Sandvine Corp. | | | 44,900 | | | | 92,445 | |
Savanna Energy Services Corp. (c) | | | 34,913 | | | | 44,319 | |
Sears Canada, Inc. (c) | | | 5,768 | | | | 17,412 | |
Secure Energy Services, Inc. (a) | | | 55,376 | | | | 378,474 | |
SEMAFO, Inc. (c) | | | 123,983 | | | | 594,988 | |
ShawCor, Ltd. | | | 22,391 | | | | 555,117 | |
Sherritt International Corp. (c) | | | 132,332 | | | | 81,942 | |
Sienna Senior Living, Inc. (a) | | | 13,276 | | | | 176,027 | |
Sierra Wireless, Inc. (a) (c) | | | 18,510 | | | | 313,622 | |
Silver Standard Resources, Inc. (c) | | | 37,551 | | | | 487,426 | |
Solium Capital, Inc. (a) (c) | | | 11,317 | | | | 52,032 | |
See accompanying notes to financial statements.
MSF-8
Metropolitan Series Fund
Met/Dimensional International Small Company Portfolio
Schedule of Investments as of June 30, 2016 (Unaudited)
Common Stocks—(Continued)
| | | | | | | | |
| Security Description | | Shares | | | Value | |
|
Canada—(Continued) | |
Spartan Energy Corp. (c) | | | 21,800 | | | $ | 57,202 | |
Sprott Resource Corp. (c) | | | 40,405 | | | | 18,765 | |
Sprott, Inc. (a) | | | 56,027 | | | | 111,451 | |
Stantec, Inc. (a) | | | 15,382 | | | | 373,016 | |
Stella-Jones, Inc. (a) | | | 10,990 | | | | 409,249 | |
Stornoway Diamond Corp. (c) | | | 33,687 | | | | 24,771 | |
Strad Energy Services, Ltd. | | | 10,641 | | | | 12,519 | |
Street Capital Group, Inc. (a) (c) | | | 5,900 | | | | 5,708 | |
Stuart Olson, Inc. | | | 11,157 | | | | 51,124 | |
Student Transportation, Inc. (a) | | | 27,425 | | | | 140,951 | |
SunOpta, Inc. (a) (c) | | | 26,392 | | | | 110,720 | |
Superior Plus Corp. (a) | | | 39,949 | | | | 329,623 | |
Surge Energy, Inc. (a) | | | 74,075 | | | | 146,206 | |
Taseko Mines, Ltd. (c) | | | 108,786 | | | | 53,048 | |
Tembec, Inc. (c) | | | 32,111 | | | | 26,843 | |
Teranga Gold Corp. (c) | | | 122,593 | | | | 109,123 | |
Teranga Gold Corp. (c) | | | 26,882 | | | | 23,016 | |
Thompson Creek Metals Co., Inc. (c) | | | 107,292 | | | | 44,845 | |
Timmins Gold Corp. (c) | | | 59,665 | | | | 21,937 | |
TMX Group, Ltd. | | | 2,627 | | | | 109,293 | |
TORC Oil & Gas, Ltd. (a) | | | 40,624 | | | | 257,840 | |
Torex Gold Resources, Inc. (c) | | | 29,900 | | | | 53,461 | |
Toromont Industries, Ltd. | | | 22,483 | | | | 655,025 | |
Torstar Corp. - Class B (a) | | | 21,453 | | | | 27,232 | |
Total Energy Services, Inc. | | | 13,248 | | | | 132,895 | |
TransAlta Corp. | | | 39,239 | | | | 204,099 | |
TransAlta Renewables, Inc. (a) | | | 10,414 | | | | 107,691 | |
Transcontinental, Inc. - Class A (a) | | | 26,130 | | | | 354,144 | |
TransForce, Inc. (a) | | | 25,364 | | | | 470,980 | |
TransGlobe Energy Corp. | | | 36,372 | | | | 67,004 | |
Trican Well Service, Ltd. (c) | | | 55,663 | | | | 106,419 | |
Trilogy Energy Corp. (c) | | | 11,476 | | | | 48,588 | |
Trinidad Drilling, Ltd. | | | 68,873 | | | | 135,406 | |
Uni-Select, Inc. (a) | | | 10,171 | | | | 257,906 | |
Valener, Inc. (a) | | | 16,303 | | | | 276,606 | |
Vecima Networks, Inc. | | | 2,500 | | | | 19,699 | |
Veresen, Inc. | | | 46,438 | | | | 393,588 | |
Wajax Corp. (a) | | | 7,885 | | | | 91,426 | |
Wesdome Gold Mines, Ltd. (c) | | | 38,107 | | | | 58,402 | |
Western Energy Services Corp. | | | 17,973 | | | | 45,491 | |
Western Forest Products, Inc. | | | 145,247 | | | | 229,346 | |
WestJet Airlines, Ltd. | | | 861 | | | | 14,048 | |
Westshore Terminals Investment Corp. (a) | | | 23,388 | | | | 338,705 | |
Whistler Blackcomb Holdings, Inc. | | | 12,342 | | | | 229,272 | |
Wi-Lan, Inc. | | | 58,061 | | | | 147,405 | |
Winpak, Ltd. (a) | | | 9,102 | | | | 334,434 | |
Xtreme Drilling & Coil Services Corp. (c) | | | 11,600 | | | | 23,434 | |
Yamana Gold, Inc. | | | 23,815 | | | | 123,872 | |
Yellow Pages, Ltd. (c) | | | 6,975 | | | | 98,906 | |
ZCL Composites, Inc. | | | 9,681 | | | | 67,215 | |
Zenith Epigenetics Corp. (b) (c) (d) | | | 12,830 | | | | 804 | |
| | | | | | | | |
| | | | | | | 54,035,022 | |
| | | | | | | | |
|
China—0.0% | |
Bund Center Investment, Ltd. | | | 138,000 | | | | 68,563 | |
China Chuanglian Education Group, Ltd. (c) | | | 336,000 | | | | 9,503 | |
|
China—(Continued) | |
China Everbright Water, Ltd. | | | 41,800 | | | | 19,795 | |
| | | | | | | | |
| | | | | | | 97,861 | |
| | | | | | | | |
|
Denmark—2.1% | |
ALK-Abello A/S | | | 1,476 | | | | 259,815 | |
Alm Brand A/S | | | 41,706 | | | | 280,906 | |
Ambu A/S - Class B (a) | | | 9,548 | | | | 397,253 | |
Bakkafrost P/F | | | 8,908 | | | | 336,105 | |
Bang & Olufsen A/S (a) (c) | | | 9,221 | | | | 80,901 | |
Bavarian Nordic A/S (a) (c) | | | 10,666 | | | | 373,008 | |
Brodrene Hartmann A/S | | | 663 | | | | 26,990 | |
D/S Norden A/S (a) (c) | | | 5,328 | | | | 74,284 | |
DFDS A/S | | | 11,185 | | | | 486,708 | |
FLSmidth & Co. A/S (a) | | | 19,649 | | | | 699,702 | |
Genmab A/S (c) | | | 10,677 | | | | 1,944,918 | |
GN Store Nord A/S | | | 52,383 | | | | 946,456 | |
Gronlandsbanken A/S | | | 17 | | | | 1,474 | |
H+H International A/S - Class B (c) | | | 1,737 | | | | 17,620 | |
Harboes Bryggeri A/S - Class B | | | 1,454 | | | | 28,019 | |
IC Group A/S | | | 3,209 | | | | 82,626 | |
Jeudan A/S (c) | | | 201 | | | | 21,081 | |
Jyske Bank A/S | | | 14,672 | | | | 559,817 | |
Matas A/S | | | 972 | | | | 16,445 | |
NKT Holding A/S | | | 6,820 | | | | 345,641 | |
Nordjyske Bank A/S | | | 185 | | | | 2,432 | |
Parken Sport & Entertainment A/S (c) | | | 2,351 | | | | 21,768 | |
PER Aarsleff Holding A/S - Class B | | | 9,620 | | | | 209,175 | |
Ringkjoebing Landbobank A/S | | | 2,258 | | | | 462,972 | |
Rockwool International A/S - B Shares | | | 3,675 | | | | 665,308 | |
Royal Unibrew A/S | | | 17,828 | | | | 795,972 | |
RTX A/S | | | 2,568 | | | | 42,404 | |
Santa Fe Group A/S (c) | | | 7,121 | | | | 58,083 | |
Schouw & Co. | | | 7,785 | | | | 431,004 | |
SimCorp A/S | | | 16,061 | | | | 788,108 | |
Solar A/S - B Shares | | | 3,176 | | | | 148,031 | |
Spar Nord Bank A/S | | | 32,428 | | | | 261,086 | |
Sydbank A/S (a) | | | 26,018 | | | | 655,760 | |
TDC A/S | | | 35,077 | | | | 171,693 | |
TK Development A/S (c) | | | 55,316 | | | | 58,062 | |
Topdanmark A/S (c) | | | 35,138 | | | | 838,157 | |
Tryg A/S | | | 18,564 | | | | 331,333 | |
United International Enterprises | | | 1,090 | | | | 189,581 | |
Vestjysk Bank A/S (c) | | | 3,300 | | | | 3,943 | |
William Demant Holding A/S (c) | | | 13,600 | | | | 264,487 | |
Zealand Pharma A/S (a) (c) | | | 2,949 | | | | 52,874 | |
| | | | | | | | |
| | | | | | | 13,432,002 | |
| | | | | | | | |
| | |
Finland—2.8% | | | | | | | | |
Ahlstrom Oyj (a) | | | 11,406 | | | | 93,348 | |
Aktia Bank Oyj | | | 3,139 | | | | 28,549 | |
Alma Media Oyj (c) | | | 22,695 | | | | 95,214 | |
Amer Sports Oyj | | | 47,651 | | | | 1,308,685 | |
Apetit Oyj | | | 1,205 | | | | 16,579 | |
Aspo Oyj | | | 8,414 | | | | 59,993 | |
Atria Oyj | | | 2,604 | | | | 25,861 | |
BasWare Oyj (a) (c) | | | 3,525 | | | | 135,364 | |
See accompanying notes to financial statements.
MSF-9
Metropolitan Series Fund
Met/Dimensional International Small Company Portfolio
Schedule of Investments as of June 30, 2016 (Unaudited)
Common Stocks—(Continued)
| | | | | | | | |
| Security Description | | Shares | | | Value | |
|
Finland—(Continued) | |
Cargotec Oyj - B Shares (a) | | | 12,591 | | | $ | 509,359 | |
Caverion Corp. (a) | | | 40,680 | | | | 260,635 | |
Citycon Oyj | | | 146,997 | | | | 334,515 | |
Comptel Oyj | | | 30,187 | | | | 60,044 | |
Cramo Oyj | | | 9,503 | | | | 196,857 | |
Elisa Oyj | | | 38,934 | | | | 1,495,847 | |
F-Secure Oyj (a) | | | 35,820 | | | | 106,885 | |
Finnair Oyj (c) | | | 35,859 | | | | 166,343 | |
Fiskars Oyj Abp (a) | | | 17,515 | | | | 317,874 | |
HKScan Oyj - A Shares | | | 6,704 | | | | 23,061 | |
Huhtamaki Oyj | | | 39,536 | | | | 1,643,329 | |
Ilkka-Yhtyma Oyj | | | 2,976 | | | | 6,408 | |
Kemira Oyj (a) | | | 41,153 | | | | 491,704 | |
Kesko Oyj - A Shares | | | 494 | | | | 19,474 | |
Kesko Oyj - B Shares (a) | | | 24,862 | | | | 1,058,213 | |
Konecranes Oyj (a) | | | 16,662 | | | | 419,932 | |
Lassila & Tikanoja Oyj (a) | | | 14,630 | | | | 270,086 | |
Lemminkainen Oyj | | | 5,098 | | | | 73,554 | |
Metsa Board Oyj | | | 122,603 | | | | 621,420 | |
Metso Oyj (a) | | | 23,954 | | | | 566,004 | |
Munksjo Oyj (c) | | | 6,311 | | | | 66,568 | |
Nokian Renkaat Oyj | | | 40,917 | | | | 1,461,569 | |
Olvi Oyj - A Shares | | | 6,303 | | | | 176,782 | |
Oriola-KD Oyj - B Shares (a) | | | 70,822 | | | | 320,512 | |
Orion Oyj - Class A | | | 14,181 | | | | 532,785 | |
Orion Oyj - Class B | | | 32,754 | | | | 1,272,370 | |
Outokumpu Oyj (a) (c) | | | 102,277 | | | | 428,711 | |
Outotec Oyj (a) (c) | | | 52,402 | | | | 236,919 | |
PKC Group Oyj (a) | | | 7,624 | | | | 143,738 | |
Ponsse Oyj | | | 3,208 | | | | 81,578 | |
Poyry Oyj (a) (c) | | | 14,295 | | | | 47,730 | |
Raisio Oyj - V Shares | | | 58,833 | | | | 252,742 | |
Ramirent Oyj | | | 41,687 | | | | 319,727 | |
Rapala VMC Oyj | | | 8,902 | | | | 43,353 | |
Saga Furs Oyj | | | 70 | | | | 1,091 | |
Sanoma Oyj (a) | | | 31,912 | | | | 187,649 | |
Sponda Oyj | | | 6,864 | | | | 29,764 | |
Stockmann Oyj Abp - B Shares (a) (c) | | | 11,956 | | | | 68,999 | |
Talvivaara Mining Co. plc (a) (b) (c) (d) | | | 286,881 | | | | 1,815 | |
Technopolis Oyj | | | 44,123 | | | | 173,912 | |
Teleste Oyj | | | 772 | | | | 7,276 | |
Tieto Oyj | | | 21,736 | | | | 595,814 | |
Tikkurila Oyj | | | 14,683 | | | | 266,254 | |
Uponor Oyj | | | 19,661 | | | | 309,590 | |
Vaisala Oyj - A Shares | | | 4,116 | | | | 129,515 | |
Valmet Oyj | | | 12,429 | | | | 165,447 | |
YIT Oyj (a) | | | 33,084 | | | | 237,680 | |
| | | | | | | | |
| | | | | | | 17,965,027 | |
| | | | | | | | |
|
France—5.0% | |
ABC Arbitrage | | | 4,710 | | | | 32,803 | |
Actia Group | | | 5,737 | | | | 33,681 | |
Air France-KLM (a) (c) | | | 74,648 | | | | 478,196 | |
Akka Technologies S.A. | | | 3,864 | | | | 119,343 | |
Albioma S.A. | | | 12,855 | | | | 198,020 | |
Altamir Amboise | | | 9,152 | | | | 102,387 | |
|
France—(Continued) | |
Alten S.A. | | | 9,511 | | | | 562,191 | |
Altran Technologies S.A. (c) | | | 70,704 | | | | 948,748 | |
APRIL S.A. | | | 9,077 | | | | 116,492 | |
Arkema S.A. | | | 13,227 | | | | 1,020,718 | |
Assystem | | | 5,996 | | | | 151,212 | |
Aubay | | | 1,785 | | | | 40,807 | |
Axway Software S.A. | | | 2,132 | | | | 48,984 | |
Bastide le Confort Medical | | | 590 | | | | 12,604 | |
Beneteau S.A. (a) | | | 17,061 | | | | 163,478 | |
BioMerieux | | | 4,066 | | | | 552,229 | |
Boiron S.A. | | | 2,738 | | | | 214,077 | |
Bonduelle SCA | | | 7,722 | | | | 185,967 | |
Burelle S.A. | | | 184 | | | | 158,256 | |
Catering International Services | | | 541 | | | | 8,032 | |
Cegedim S.A. (c) | | | 2,929 | | | | 89,405 | |
Cegid Group S.A. | | | 3,132 | | | | 210,757 | |
Chargeurs S.A. | | | 7,816 | | | | 86,446 | |
Cie des Alpes | | | 3,241 | | | | 67,043 | |
Derichebourg S.A. | | | 31,305 | | | | 80,214 | |
Devoteam S.A. | | | 4,902 | | | | 233,525 | |
Edenred | | | 22,732 | | | | 469,030 | |
Electricite de Strasbourg S.A. | | | 88 | | | | 8,572 | |
Elior Participations SCA | | | 561 | | | | 12,258 | |
Eramet (c) | | | 1,499 | | | | 49,493 | |
Esso S.A. Francaise (c) | | | 1,341 | | | | 59,420 | |
Etablissements Maurel et Prom (a) (c) | | | 26,859 | | | | 86,881 | |
Euler Hermes Group | | | 2,457 | | | | 206,684 | |
Eurofins Scientific SE | | | 3,384 | | | | 1,257,967 | |
Exel Industries - A Shares | | | 618 | | | | 54,412 | |
Faiveley Transport S.A. | | | 3,418 | | | | 334,171 | |
Faurecia | | | 31,687 | | | | 1,017,631 | |
Fimalac | | | 59 | | | | 6,489 | |
Fleury Michon S.A. | | | 461 | | | | 29,667 | |
Futuren S.A. (c) | | | 38,489 | | | | 30,309 | |
Gaztransport Et Technigaz S.A. (a) | | | 3,026 | | | | 92,989 | |
GEA | | | 165 | | | | 14,631 | |
GL Events | | | 3,648 | | | | 60,879 | |
Groupe Crit | | | 1,538 | | | | 102,602 | |
Groupe Flo (c) | | | 5,857 | | | | 5,988 | |
Groupe Fnac S.A. (c) | | | 2,761 | | | | 149,921 | |
Groupe Gorge (a) | | | 1,266 | | | | 28,823 | |
Groupe Open | | | 722 | | | | 13,976 | |
Guerbet | | | 2,652 | | | | 162,385 | |
Haulotte Group S.A. | | | 7,115 | | | | 108,535 | |
Havas S.A. | | | 6,455 | | | | 50,113 | |
HERIGE SADCS | | | 235 | | | | 5,544 | |
HiPay Group S.A. (c) | | | 1,527 | | | | 20,164 | |
Imerys S.A. | | | 2,714 | | | | 173,401 | |
Interparfums S.A. | | | 4,802 | | | | 120,557 | |
Ipsen S.A. | | | 13,044 | | | | 804,061 | |
IPSOS | | | 12,134 | | | | 344,777 | |
Jacquet Metal Service | | | 7,386 | | | | 97,566 | |
Korian S.A. | | | 23,784 | | | | 770,173 | |
Lagardere SCA | | | 51,526 | | | | 1,130,917 | |
Lanson-BCC | | | 15 | | | | 499 | |
Laurent-Perrier | | | 1,367 | | | | 100,721 | |
See accompanying notes to financial statements.
MSF-10
Metropolitan Series Fund
Met/Dimensional International Small Company Portfolio
Schedule of Investments as of June 30, 2016 (Unaudited)
Common Stocks—(Continued)
| | | | | | | | |
| Security Description | | Shares | | | Value | |
|
France—(Continued) | |
Le Noble Age (c) | | | 1,488 | | | $ | 47,912 | |
Lectra | | | 8,395 | | | | 129,088 | |
Linedata Services | | | 341 | | | | 15,514 | |
LISI | | | 11,625 | | | | 295,769 | |
Maisons France Confort S.A. | | | 1,754 | | | | 78,570 | |
Manitou BF S.A. | | | 4,534 | | | | 69,336 | |
Manutan International | | | 589 | | | | 31,843 | |
Mersen | | | 8,985 | | | | 136,792 | |
METabolic EXplorer S.A. (c) | | | 6,035 | | | | 11,169 | |
Metropole Television S.A. | | | 21,233 | | | | 354,329 | |
MGI Coutier | | | 4,744 | | | | 108,029 | |
Mr. Bricolage | | | 601 | | | | 9,019 | |
Naturex (c) | | | 2,358 | | | | 187,577 | |
Neopost S.A. | | | 12,528 | | | | 290,228 | |
Nexans S.A. (c) | | | 10,974 | | | | 462,338 | |
Nexity S.A. (c) | | | 12,502 | | | | 637,248 | |
NRJ Group (c) | | | 12,040 | | | | 127,056 | |
Oeneo S.A. | | | 1,467 | | | | 12,375 | |
Onxeo S.A. (c) | | | 4,566 | | | | 13,028 | |
Orpea | | | 15,896 | | | | 1,308,695 | |
Parrot S.A. (a) (c) | | | 2,647 | | | | 36,996 | |
Pierre & Vacances S.A. (c) | | | 3,103 | | | | 133,317 | |
Plastic Omnium S.A. | | | 34,713 | | | | 975,981 | |
Rallye S.A. (a) | | | 8,372 | | | | 145,073 | |
Recylex S.A. (c) | | | 8,543 | | | | 21,449 | |
Rexel S.A. | | | 33,040 | | | | 417,131 | |
Robertet S.A. | | | 14 | | | | 4,353 | |
Rubis SCA | | | 16,453 | | | | 1,261,575 | |
Saft Groupe S.A. | | | 16,451 | | | | 666,581 | |
Samse S.A. | | | 107 | | | | 14,606 | |
Sartorius Stedim Biotech | | | 8,628 | | | | 585,502 | |
Savencia S.A. | | | 3,042 | | | | 185,774 | |
SEB S.A. | | | 6,523 | | | | 786,386 | |
Seche Environnement S.A. | | | 1,555 | | | | 48,097 | |
Sequana S.A. (c) | | | 10,224 | | | | 23,767 | |
Societe des Bains de Mer et du Cercle des Etrangers a Monaco (c) | | | 16 | | | | 536 | |
Societe Marseillaise du Tunnel Prado-Carenage S.A. | | | 293 | | | | 9,430 | |
Societe Television Francaise 1 | | | 52,277 | | | | 559,477 | |
Soitec (a) (c) | | | 137,549 | | | | 83,281 | |
Solocal Group (a) (c) | | | 16,327 | | | | 39,760 | |
Somfy S.A. | | | 202 | | | | 71,743 | |
Sopra Steria Group (a) | | | 6,938 | | | | 720,070 | |
Spir Communication S.A. (c) | | | 848 | | | | 5,003 | |
Ste Industrielle d’Aviation Latecoere S.A. (c) | | | 26,469 | | | | 100,464 | |
STEF S.A. | | | 1,145 | | | | 81,027 | |
Store Electronic (c) | | | 715 | | | | 17,160 | |
Sword Group | | | 3,419 | | | | 92,340 | |
Synergie S.A. | | | 4,419 | | | | 126,249 | |
Technicolor S.A. | | | 88,305 | | | | 547,839 | |
Technip S.A. | | | 19,522 | | | | 1,061,748 | |
Teleperformance SE | | | 23,996 | | | | 2,070,329 | |
Tessi S.A. | | | 895 | | | | 133,365 | |
TFF Group | | | 308 | | | | 30,874 | |
Thermador Groupe | | | 1,043 | | | | 90,158 | |
Total Gabon | | | 324 | | | | 47,859 | |
|
France—(Continued) | |
Touax S.A. (c) | | | 1,463 | | | | 16,919 | |
Trigano S.A. | | | 5,078 | | | | 293,841 | |
UBISOFT Entertainment S.A. (c) | | | 41,482 | | | | 1,526,369 | |
Union Financiere de France BQE S.A. | | | 1,659 | | | | 43,168 | |
Valneva SE (a) (c) | | | 15,386 | | | | 35,800 | |
Vetoquinol S.A. | | | 1,341 | | | | 54,673 | |
Vicat S.A. (a) | | | 5,373 | | | | 304,629 | |
VIEL & Cie S.A. | | | 4,205 | | | | 16,122 | |
Vilmorin & Cie S.A. | | | 2,684 | | | | 173,935 | |
Virbac S.A. (a) (c) | | | 1,586 | | | | 288,578 | |
Vranken-Pommery Monopole S.A. | | | 958 | | | | 24,120 | |
| | | | | | | | |
| | | | | | | 32,197,190 | |
| | | | | | | | |
| | |
Germany—6.2% | | | | | | | | |
Aareal Bank AG | | | 32,420 | | | | 1,021,959 | |
Adler Modemaerkte AG | | | 2,828 | | | | 22,642 | |
ADVA Optical Networking SE (c) | | | 13,833 | | | | 118,335 | |
Air Berlin plc (a) (c) | | | 15,003 | | | | 11,672 | |
AIXTRON SE (a) (c) | | | 30,799 | | | | 186,953 | |
Allgeier SE | | | 2,942 | | | | 53,911 | |
Amadeus Fire AG | | | 2,298 | | | | 145,924 | |
Aurubis AG | | | 14,317 | | | | 648,815 | |
Axel Springer SE | | | 10,274 | | | | 538,406 | |
Basler AG | | | 236 | | | | 12,811 | |
Bauer AG | | | 4,696 | | | | 64,591 | |
BayWa AG (a) | | | 5,731 | | | | 172,031 | |
BayWa AG | | | 305 | | | | 10,318 | |
Bechtle AG | | | 9,570 | | | | 1,005,148 | |
Bertrandt AG (a) | | | 1,677 | | | | 164,124 | |
Bijou Brigitte AG | | | 1,603 | | | | 105,834 | |
Bilfinger SE (c) | | | 3,381 | | | | 99,094 | |
Biotest AG (a) | | | 4,221 | | | | 78,640 | |
Borussia Dortmund GmbH & Co. KGaA (Xetra Exchange) | | | 30,779 | | | | 138,307 | |
CANCOM SE | | | 7,824 | | | | 388,735 | |
Carl Zeiss Meditec AG | | | 10,600 | | | | 428,655 | |
CENIT AG | | | 5,981 | | | | 125,611 | |
CENTROTEC Sustainable AG | | | 3,158 | | | | 46,162 | |
Cewe Stiftung & Co. KGaA | | | 3,145 | | | | 227,903 | |
Clere AG | | | 1,425 | | | | 39,889 | |
Comdirect Bank AG | | | 13,399 | | | | 136,897 | |
CompuGroup Medical SE | | | 8,932 | | | | 371,426 | |
Constantin Medien AG (c) | | | 15,941 | | | | 49,632 | |
CropEnergies AG (c) | | | 9,235 | | | | 52,239 | |
CTS Eventim AG & Co. KGaA | | | 18,228 | | | | 554,546 | |
Data Modul AG | | | 138 | | | | 6,562 | |
DEAG Deutsche Entertainment AG (c) | | | 2,049 | | | | 7,300 | |
Delticom AG | | | 1,562 | | | | 26,971 | |
Deutsche Beteiligungs AG | | | 2,815 | | | | 82,572 | |
Deutsche Euroshop AG (a) | | | 6,047 | | | | 276,473 | |
Deutz AG | | | 35,346 | | | | 145,462 | |
Dialog Semiconductor plc (a) (c) | | | 22,851 | | | | 687,777 | |
DIC Asset AG | | | 7,859 | | | | 73,806 | |
DMG Mori AG | | | 19,092 | | | | 897,170 | |
Dr. Hoenle AG | | | 2,084 | | | | 52,502 | |
Draegerwerk AG & Co. KGaA | | | 1,062 | | | | 58,813 | �� |
See accompanying notes to financial statements.
MSF-11
Metropolitan Series Fund
Met/Dimensional International Small Company Portfolio
Schedule of Investments as of June 30, 2016 (Unaudited)
Common Stocks—(Continued)
| | | | | | | | |
| Security Description | | Shares | | | Value | |
|
Germany—(Continued) | |
Drillisch AG (a) | | | 19,029 | | | $ | 729,593 | |
Duerr AG | | | 8,529 | | | | 648,241 | |
Eckert & Ziegler AG | | | 1,629 | | | | 35,805 | |
Elmos Semiconductor AG | | | 7,336 | | | | 90,351 | |
ElringKlinger AG (a) | | | 11,206 | | | | 219,387 | |
Euromicron AG (c) | | | 2,048 | | | | 20,277 | |
Evotec AG (c) | | | 24,706 | | | | 104,445 | |
Fielmann AG | | | 4,101 | | | | 299,757 | |
Francotyp-Postalia Holding AG | | | 3,300 | | | | 14,234 | |
Fraport AG Frankfurt Airport Services Worldwide (a) | | | 3,441 | | | | 183,839 | |
Freenet AG | | | 53,475 | | | | 1,376,096 | |
FUCHS Petrolub SE | | | 5,665 | | | | 203,883 | |
Gerresheimer AG | | | 9,821 | | | | 754,396 | |
Gerry Weber International AG (a) | | | 9,842 | | | | 114,669 | |
Gesco AG | | | 1,521 | | | | 121,005 | |
GFK SE | | | 7,937 | | | | 317,138 | |
GFT Technologies SE | | | 9,142 | | | | 181,665 | |
Grammer AG | | | 7,596 | | | | 305,918 | |
GRENKE AG | | | 2,621 | | | | 458,567 | |
H&R AG (c) | | | 4,113 | | | | 55,703 | |
Hamburger Hafen und Logistik AG | | | 8,624 | | | | 128,770 | |
Heidelberger Druckmaschinen AG (a) (c) | | | 153,682 | | | | 424,994 | |
Hella KGaA Hueck & Co. | | | 940 | | | | 30,087 | |
HOCHTIEF AG | | | 1,291 | | | | 166,301 | |
HolidayCheck Group AG (c) | | | 1,815 | | | | 4,749 | |
Hornbach Baumarkt AG | | | 1,543 | | | | 42,008 | |
Indus Holding AG | | | 13,812 | | | | 641,340 | |
Init Innovation In Traffic Systems AG | | | 1,794 | | | | 26,024 | |
Isra Vision AG | | | 2,083 | | | | 169,130 | |
Jenoptik AG | | | 19,047 | | | | 313,446 | |
K&S AG (a) | | | 15,831 | | | | 324,811 | |
KION Group AG | | | 16,541 | | | | 800,085 | |
Kloeckner & Co. SE (c) | | | 38,909 | | | | 429,721 | |
Koenig & Bauer AG (c) | | | 4,373 | | | | 222,258 | |
Kontron AG (a) (c) | | | 21,842 | | | | 68,189 | |
Krones AG | | | 5,091 | | | | 538,446 | |
KSB AG | | | 103 | | | | 36,047 | |
KUKA AG | | | 8,843 | | | | 1,047,216 | |
KWS Saat SE | | | 949 | | | | 313,781 | |
LANXESS AG | | | 31,725 | | | | 1,386,335 | |
LEG Immobilien AG (c) | | | 15,885 | | | | 1,484,665 | |
Leifheit AG | | | 945 | | | | 57,266 | |
Leoni AG (a) | | | 12,471 | | | | 340,194 | |
LPKF Laser & Electronics AG (a) (c) | | | 5,852 | | | | 41,711 | |
Manz AG (a) (c) | | | 1,272 | | | | 47,101 | |
Medigene AG (c) | | | 3,423 | | | | 25,281 | |
MLP AG | | | 20,985 | | | | 74,878 | |
MTU Aero Engines AG | | | 14,899 | | | | 1,393,778 | |
MVV Energie AG | | | 1,668 | | | | 36,865 | |
Nemetschek SE | | | 12,828 | | | | 690,960 | |
Nexus AG | | | 2,764 | | | | 52,444 | |
Nordex SE (c) | | | 23,261 | | | | 656,659 | |
Norma Group SE | | | 10,781 | | | | 508,941 | |
OHB SE | | | 2,315 | | | | 46,033 | |
OSRAM Licht AG | | | 21,899 | | | | 1,131,735 | |
Paion AG (c) | | | 12,581 | | | | 29,504 | |
|
Germany—(Continued) | |
Patrizia Immobilien AG (c) | | | 15,957 | | | | 382,944 | |
Pfeiffer Vacuum Technology AG | | | 4,085 | | | | 382,475 | |
PNE Wind AG (a) | | | 24,548 | | | | 57,799 | |
Progress-Werk Oberkirch AG | | | 822 | | | | 30,791 | |
PSI AG Gesellschaft Fuer Produkte und Systeme der Informationstechnologie | | | 2,118 | | | | 29,742 | |
Puma SE (a) | | | 549 | | | | 122,747 | |
PVA TePla AG (c) | | | 3,358 | | | | 9,400 | |
QSC AG (a) | | | 26,632 | | | | 33,632 | |
R Stahl AG | | | 1,594 | | | | 55,187 | |
Rational AG | | | 1,017 | | | | 469,349 | |
Rheinmetall AG | | | 12,940 | | | | 764,215 | |
Rhoen Klinikum AG | | | 32,246 | | | | 946,268 | |
RIB Software AG (a) | | | 1,026 | | | | 9,960 | |
SAF-Holland S.A. | | | 31,896 | | | | 352,613 | |
Salzgitter AG | | | 12,083 | | | | 318,387 | |
Schaltbau Holding AG | | | 2,118 | | | | 108,208 | |
SGL Carbon SE (a) (c) | | | 18,022 | | | | 196,791 | |
SHW AG | | | 2,013 | | | | 59,961 | |
Sixt SE (a) | | | 9,652 | | | | 497,387 | |
SMA Solar Technology AG (a) | | | 3,992 | | | | 195,923 | |
SMT Scharf AG (c) | | | 831 | | | | 9,723 | |
Softing AG | | | 1,971 | | | | 23,379 | |
Software AG | | | 20,357 | | | | 690,645 | |
Solarworld AG (c) | | | 348 | | | | 2,511 | |
Stada Arzneimittel AG | | | 19,797 | | | | 1,020,535 | |
STRATEC Biomedical AG | | | 1,697 | | | | 98,007 | |
Stroeer SE & Co. KGaA (a) | | | 8,451 | | | | 386,795 | |
Suedzucker AG | | | 26,310 | | | | 578,796 | |
Surteco SE | | | 1,501 | | | | 34,194 | |
Suss Microtec AG (c) | | | 6,216 | | | | 46,792 | |
TAG Immobilien AG (a) | | | 39,448 | | | | 517,459 | |
Takkt AG | | | 11,656 | | | | 229,419 | |
Technotrans AG | | | 3,008 | | | | 57,752 | |
TLG Immobilien AG | | | 2,015 | | | | 42,313 | |
Tom Tailor Holding AG (c) | | | 6,389 | | | | 24,321 | |
VERBIO Vereinigte BioEnergie AG | | | 2,621 | | | | 15,489 | |
Vossloh AG (a) (c) | | | 4,905 | | | | 302,733 | |
VTG AG (a) | | | 5,545 | | | | 160,164 | |
Wacker Chemie AG | | | 2,424 | | | | 211,768 | |
Wacker Neuson SE | | | 10,071 | | | | 155,508 | |
Washtec AG | | | 3,397 | | | | 118,610 | |
Wincor Nixdorf AG (c) | | | 10,359 | | | | 554,218 | |
XING AG | | | 1,097 | | | | 208,392 | |
| | | | | | | | |
| | | | | | | 39,816,642 | |
| | | | | | | | |
| | |
Hong Kong—3.0% | | | | | | | | |
Agritrade Resources, Ltd. | | | 135,000 | | | | 26,462 | |
Alco Holdings, Ltd. | | | 136,000 | | | | 64,252 | |
Allan International Holdings | | | 70,000 | | | | 20,211 | |
Allied Group, Ltd. (a) | | | 22,000 | | | | 112,863 | |
Allied Properties HK, Ltd. | | | 1,466,024 | | | | 274,399 | |
Anxian Yuan China Holdings, Ltd. (c) | | | 420,000 | | | | 7,253 | |
Apac Resources, Ltd. (c) | | | 472,173 | | | | 7,262 | |
APT Satellite Holdings, Ltd. | | | 164,250 | | | | 115,004 | |
Arts Optical International Holdings, Ltd. | | | 16,000 | | | | 6,228 | |
See accompanying notes to financial statements.
MSF-12
Metropolitan Series Fund
Met/Dimensional International Small Company Portfolio
Schedule of Investments as of June 30, 2016 (Unaudited)
Common Stocks—(Continued)
| | | | | | | | |
| Security Description | | Shares | | | Value | |
|
Hong Kong—(Continued) | |
Asia Financial Holdings, Ltd. | | | 300,000 | | | $ | 182,204 | |
Asia Satellite Telecommunications Holdings, Ltd. | | | 58,500 | | | | 83,699 | |
Asia Standard International Group, Ltd. | | | 370,000 | | | | 68,841 | |
ASM Pacific Technology, Ltd. | | | 26,600 | | | | 191,568 | |
Associated International Hotels, Ltd. | | | 14,000 | | | | 37,896 | |
Aupu Group Holding Co., Ltd. | | | 198,000 | | | | 66,275 | |
Auto Italia Holdings (a) (c) | | | 175,000 | | | | 3,643 | |
Bel Global Resources Holdings, Ltd. (b) (c) (d) | | | 520,000 | | | | 0 | |
Bonjour Holdings, Ltd. | | | 615,000 | | | | 27,022 | |
Bossini International Holdings, Ltd. | | | 302,000 | | | | 19,090 | |
Bright Smart Securities & Commodities Group, Ltd. | | | 96,000 | | | | 28,259 | |
Brockman Mining, Ltd. (a) (c) | | | 2,516,770 | | | | 29,008 | |
Burwill Holdings, Ltd. (c) | | | 1,566,000 | | | | 50,187 | |
Cafe de Coral Holdings, Ltd. | | | 134,000 | | | | 419,896 | |
Century City International Holdings, Ltd. | | | 616,000 | | | | 36,848 | |
Champion Technology Holdings, Ltd. (c) | | | 1,233,093 | | | | 16,904 | |
Chen Hsong Holdings | | | 150,000 | | | | 29,002 | |
Cheuk Nang Holdings, Ltd. | | | 91,630 | | | | 70,275 | |
Chevalier International Holdings, Ltd. | | | 75,139 | | | | 120,564 | |
China Billion Resources, Ltd. (c) | | | 238,000 | | | | 1,074 | |
China Energy Development Holdings, Ltd. (c) | | | 3,670,000 | | | | 49,134 | |
China Flavors & Fragrances Co., Ltd. | | | 71,446 | | | | 24,346 | |
China Infrastructure Investment, Ltd. (c) | | | 626,000 | | | | 5,317 | |
China Metal International Holdings, Inc. | | | 198,000 | | | | 63,897 | |
China Public Procurement, Ltd. (a) (c) | | | 1,260,000 | | | | 18,044 | |
China Smarter Energy Group Holdings, Ltd. (a) (c) | | | 168,000 | | | | 12,165 | |
China Solar Energy Holdings, Ltd. (b) (c) (d) | | | 162,000 | | | | 705 | |
China Star Entertainment, Ltd. (c) | | | 126,000 | | | | 11,052 | |
China Strategic Holdings, Ltd. (c) | | | 2,032,500 | | | | 53,187 | |
China Ting Group Holdings, Ltd. (c) | | | 318,550 | | | | 14,604 | |
Chinney Investment, Ltd. | | | 8,000 | | | | 1,819 | |
Chow Sang Sang Holdings International, Ltd. | | | 119,000 | | | | 211,020 | |
Chu Kong Shipping Enterprises Group Co., Ltd. | | | 154,000 | | | | 39,767 | |
Chuang’s China Investments, Ltd. | | | 511,500 | | | | 23,426 | |
Chuang’s Consortium International, Ltd. | | | 446,357 | | | | 86,860 | |
CITIC Telecom International Holdings, Ltd. | | | 467,000 | | | | 176,840 | |
CK Life Sciences International Holdings, Inc. | | | 1,594,000 | | | | 144,403 | |
CNQC International Holdings, Ltd. | | | 12,500 | | | | 5,016 | |
CNT Group, Ltd. | | | 246,000 | | | | 14,325 | |
Continental Holdings, Ltd. (c) | | | 220,000 | | | | 3,117 | |
CP Lotus Corp. (c) | | | 1,750,000 | | | | 31,129 | |
Crocodile Garments (c) | | | 216,000 | | | | 19,857 | |
Cross-Harbour Holdings, Ltd. (The) (a) | | | 119,000 | | | | 162,101 | |
CSI Properties, Ltd. | | | 3,194,023 | | | | 115,518 | |
Dah Sing Banking Group, Ltd. | | | 172,671 | | | | 321,113 | |
Dah Sing Financial Holdings, Ltd. | | | 66,260 | | | | 408,876 | |
Dan Form Holdings Co., Ltd. | | | 287,000 | | | | 74,579 | |
Dickson Concepts International, Ltd. | | | 131,000 | | | | 45,173 | |
Eagle Nice International Holdings, Ltd. | | | 120,000 | | | | 28,306 | |
EcoGreen International Group, Ltd. | | | 118,800 | | | | 22,595 | |
Emperor Capital Group, Ltd. | | | 540,000 | | | | 48,264 | |
Emperor Entertainment Hotel, Ltd. | | | 235,000 | | | | 56,570 | |
Emperor International Holdings, Ltd. | | | 565,250 | | | | 113,874 | |
|
Hong Kong—(Continued) | |
Emperor Watch & Jewellery, Ltd. (c) | | | 1,520,000 | | | | 33,303 | |
ENM Holdings, Ltd. (c) | | | 556,000 | | | | 31,360 | |
EPI Holdings, Ltd. (c) | | | 586,800 | | | | 11,022 | |
Esprit Holdings, Ltd. (a) (c) | | | 833,950 | | | | 622,777 | |
eSun Holdings, Ltd. (c) | | | 400,000 | | | | 29,971 | |
Fairwood Holdings, Ltd. | | | 34,500 | | | | 133,377 | |
Far East Consortium International, Ltd. | | | 654,356 | | | | 207,576 | |
First Pacific Co., Ltd. | | | 18,000 | | | | 13,037 | |
Fountain SET Holdings, Ltd. | | | 422,000 | | | | 49,620 | |
Future Bright Holdings, Ltd. | | | 156,000 | | | | 15,120 | |
G-Resources Group, Ltd. | | | 11,842,800 | | | | 223,023 | |
GCL New Energy Holdings, Ltd. (a) (c) | | | 1,146,000 | | | | 49,646 | |
Get Nice Financial Group, Ltd. (c) | | | 64,350 | | | | 9,099 | |
Get Nice Holdings, Ltd. | | | 2,574,000 | | | | 88,334 | |
Giordano International, Ltd. | | | 536,000 | | | | 248,712 | |
Global Brands Group Holding, Ltd. (c) | | | 466,000 | | | | 41,526 | |
Glorious Sun Enterprises, Ltd. | | | 393,000 | | | | 48,802 | |
Gold Peak Industries Holdings, Ltd. | | | 277,714 | | | | 27,281 | |
Golden Resources Development International, Ltd. | | | 370,000 | | | | 19,550 | |
Great Eagle Holdings, Ltd. | | | 10,000 | | | | 40,136 | |
Guangnan Holdings, Ltd. | | | 264,000 | | | | 28,990 | |
Guotai Junan International Holdings, Ltd. (a) | | | 503,600 | | | | 172,762 | |
Haitong International Securities Group, Ltd. (a) | | | 421,969 | | | | 256,258 | |
Hanison Construction Holdings, Ltd. (a) | | | 148,009 | | | | 23,511 | |
Hao Tian Development Group, Ltd. (c) | | | 858,000 | | | | 55,092 | |
Harbour Centre Development, Ltd. | | | 88,000 | | | | 151,263 | |
Hi-Level Technology Holdings, Ltd. | | | 10,080 | | | | 546 | |
HKR International, Ltd. | | | 405,600 | | | | 167,007 | |
Hon Kwok Land Investment Co., Ltd. | | | 140,000 | | | | 53,838 | |
Hong Kong Aircraft Engineering Co., Ltd. (a) | | | 8,800 | | | | 56,319 | |
Hong Kong Ferry Holdings Co., Ltd. | | | 22,000 | | | | 24,679 | |
Hong Kong Television Network, Ltd. (c) | | | 165,000 | | | | 29,288 | |
Hongkong & Shanghai Hotels (The) | | | 21,000 | | | | 21,463 | |
Hongkong Chinese, Ltd. | | | 866,000 | | | | 156,956 | |
Hopewell Holdings, Ltd. | | | 51,500 | | | | 163,822 | |
Hsin Chong Construction Group, Ltd. (a) | | | 918,000 | | | | 87,731 | |
Hung Hing Printing Group, Ltd. | | | 252,000 | | | | 30,533 | |
Hutchison Telecommunications Hong Kong Holdings, Ltd. | | | 526,000 | | | | 176,252 | |
I-CABLE Communications, Ltd. (c) | | | 177,000 | | | | 14,136 | |
Imagi International Holdings, Ltd. (c) | | | 480,600 | | | | 14,955 | |
International Standard Resources Holdings, Ltd. (c) | | | 1,782,000 | | | | 28,038 | |
iOne Holdings, Ltd. (c) | | | 960,000 | | | | 22,343 | |
IPE Group, Ltd. | | | 285,000 | | | | 62,560 | |
IRC, Ltd. (c) | | | 760,000 | | | | 12,268 | |
IT, Ltd. | | | 278,000 | | | | 82,701 | |
ITC Properties Group, Ltd. | | | 99,556 | | | | 40,090 | |
Jinhui Holdings Co., Ltd. (c) | | | 70,000 | | | | 8,121 | |
Johnson Electric Holdings, Ltd. | | | 106,875 | | | | 238,862 | |
K Wah International Holdings, Ltd. (a) | | | 617,788 | | | | 308,153 | |
Kader Holdings Co., Ltd. | | | 264,000 | | | | 22,510 | |
Kam Hing International Holdings, Ltd. | | | 196,000 | | | | 13,702 | |
Kantone Holdings, Ltd. (c) | | | 93,000 | | | | 8,151 | |
Keck Seng Investments | | | 72,000 | | | | 57,838 | |
Kerry Logistics Network, Ltd. | | | 33,500 | | | | 43,283 | |
See accompanying notes to financial statements.
MSF-13
Metropolitan Series Fund
Met/Dimensional International Small Company Portfolio
Schedule of Investments as of June 30, 2016 (Unaudited)
Common Stocks—(Continued)
| | | | | | | | |
| Security Description | | Shares | | | Value | |
|
Hong Kong—(Continued) | |
Kingmaker Footwear Holdings, Ltd. | | | 102,000 | | | $ | 22,836 | |
Kowloon Development Co., Ltd. | | | 159,000 | | | | 151,991 | |
L’sea Resources International Holdings, Ltd. (c) | | | 360,000 | | | | 7,219 | |
Lai Sun Development Co., Ltd. | | | 6,835,666 | | | | 106,076 | |
Lai Sun Garment International, Ltd. | | | 498,800 | | | | 64,294 | |
Lam Soon Hong Kong, Ltd. | | | 15,000 | | | | 14,993 | |
Landsea Green Properties Co., Ltd. | | | 120,000 | | | | 9,753 | |
Lifestyle International Holdings, Ltd. | | | 161,500 | | | | 271,708 | |
Lippo China Resources, Ltd. | | | 2,106,000 | | | | 58,040 | |
Lippo, Ltd. | | | 122,000 | | | | 71,076 | |
Lisi Group Holdings, Ltd. (c) | | | 562,000 | | | | 45,713 | |
Liu Chong Hing Investment, Ltd. | | | 86,000 | | | | 101,601 | |
Luen Thai Holdings, Ltd. | | | 116,000 | | | | 16,886 | |
Luk Fook Holdings International, Ltd. (a) | | | 135,000 | | | | 300,519 | |
Luks Group Vietnam Holdings Co., Ltd. | | | 68,000 | | | | 23,329 | |
Lung Kee Bermuda Holdings | | | 116,000 | | | | 29,992 | |
Magnificent Hotel Investment, Ltd. | | | 1,310,000 | | | | 29,852 | |
Man Wah Holdings, Ltd. | | | 291,600 | | | | 419,810 | |
Mason Financial Holdings, Ltd. (c) | | | 2,250,000 | | | | 87,554 | |
Matrix Holdings, Ltd. | | | 36,000 | | | | 14,385 | |
Melco International Development, Ltd. (a) | | | 114,000 | | | | 107,595 | |
Midland Holdings, Ltd. (c) | | | 302,000 | | | | 83,292 | |
Ming Fai International Holdings, Ltd. | | | 145,000 | | | | 16,805 | |
Miramar Hotel & Investment | | | 12,000 | | | | 20,224 | |
National Electronic Holdings, Ltd. | | | 182,600 | | | | 21,294 | |
Neo-Neon Holdings, Ltd. (c) | | | 322,500 | | | | 43,750 | |
NetMind Financial Holdings, Ltd. (c) | | | 8,984,000 | | | | 98,262 | |
New Century Group Hong Kong, Ltd. | | | 912,000 | | | | 14,508 | |
New Times Energy Corp., Ltd. (c) | | | 306,300 | | | | 6,401 | |
Newocean Energy Holdings, Ltd. (a) | | | 488,000 | | | | 160,707 | |
Next Digital, Ltd. | | | 414,000 | | | | 21,360 | |
Nine Express, Ltd. (c) | | | 216,000 | | | | 12,111 | |
Noble Group, Ltd. (a) (c) | | | 588,600 | | | | 88,524 | |
O Luxe Holdings, Ltd. (c) | | | 648,000 | | | | 49,721 | |
Orange Sky Golden Harvest Entertainment Holdings, Ltd. (c) | | | 375,882 | | | | 22,081 | |
Orient Overseas International, Ltd. | | | 33,000 | | | | 113,815 | |
Oriental Watch Holdings (a) | | | 271,600 | | | | 32,365 | |
Pacific Andes International Holdings, Ltd. (b) (c) (d) | | | 1,819,984 | | | | 25,688 | |
Pacific Basin Sh
ipping, Ltd. (a) (c) | | | 656,000 | | | | 62,829 | |
Pacific Textiles Holdings, Ltd. | | | 187,000 | | | | 234,001 | |
Paliburg Holdings, Ltd. | | | 328,000 | | | | 92,199 | |
Paradise Entertainment, Ltd. (a) (c) | | | 168,000 | | | | 25,964 | |
Pearl Oriental Oil, Ltd. (c) | | | 404,000 | | | | 15,679 | |
Perfect Shape Beauty Technology, Ltd. | | | 108,000 | | | | 10,546 | |
Pico Far East Holdings, Ltd. | | | 468,000 | | | | 132,376 | |
Playmates Holdings, Ltd. | | | 56,000 | | | | 72,976 | |
Playmates Toys, Ltd. | | | 236,000 | | | | 44,367 | |
Polytec Asset Holdings, Ltd. | | | 565,000 | | | | 37,158 | |
Public Financial Holdings, Ltd. | | | 166,000 | | | | 71,675 | |
PYI Corp., Ltd. | | | 2,140,366 | | | | 43,420 | |
Regal Hotels International Holdings, Ltd. | | | 424,000 | | | | 208,737 | |
Rivera Holdings, Ltd. | | | 20,000 | | | | 1,125 | |
Sa Sa International Holdings, Ltd. (a) | | | 410,666 | | | | 162,628 | |
SAS Dragon Holdings, Ltd. | | | 140,000 | | | | 22,039 | |
|
Hong Kong—(Continued) | |
SEA Holdings, Ltd. | | | 94,000 | | | | 227,591 | |
Shangri-La Asia, Ltd. | | | 42,000 | | | | 42,349 | |
Shenwan Hongyuan HK, Ltd. | | | 172,500 | | | | 88,448 | |
Shun Ho Technology Holdings, Ltd. | | | 21,615 | | | | 7,406 | |
Shun Tak Holdings, Ltd. | | | 701,500 | | | | 222,399 | |
Silver Base Group Holdings, Ltd. (c) | | | 422,000 | | | | 59,062 | |
Sing Tao News Corp., Ltd. | | | 276,000 | | | | 35,048 | |
Singamas Container Holdings, Ltd. | | | 786,000 | | | | 75,196 | |
SIS International Holdings | | | 16,000 | | | | 8,043 | |
Sitoy Group Holdings, Ltd. | | | 111,000 | | | | 44,152 | |
Skyway Securities Group, Ltd. (c) | | | 750,000 | | | | 22,815 | |
SmarTone Telecommunications Holdings, Ltd. | | | 142,388 | | | | 255,084 | |
SOCAM Development, Ltd. (c) | | | 179,876 | | | | 83,980 | |
Solomon Systech International, Ltd. (c) | | | 920,000 | | | | 38,653 | |
Soundwill Holdings, Ltd. | | | 50,000 | | | | 81,941 | |
South China Holdings Co., Ltd. (c) (d) | | | 992,000 | | | | 67,769 | |
Stella International Holdings, Ltd. (a) | | | 161,500 | | | | 285,006 | |
Stelux Holdings International, Ltd. | | | 260,500 | | | | 19,866 | |
Success Universe Group, Ltd. (c) | | | 240,000 | | | | 4,959 | |
Sun Hing Vision Group Holdings, Ltd. | | | 42,000 | | | | 14,888 | |
Sun Hung Kai & Co., Ltd. | | | 322,440 | | | | 189,968 | |
Sunwah Kingsway Capital Holdings, Ltd. | | | 310,000 | | | | 5,308 | |
TAI Cheung Holdings, Ltd. | | | 232,000 | | | | 191,425 | |
Tan Chong International, Ltd. | | | 63,000 | | | | 19,895 | |
Tao Heung Holdings, Ltd. (a) | | | 204,000 | | | | 48,322 | |
Taung Gold International, Ltd. (b) (c) | | | 700,000 | | | | 6,137 | |
Television Broadcasts, Ltd. | | | 123,500 | | | | 424,122 | |
Texwinca Holdings, Ltd. | | | 300,000 | | | | 222,927 | |
Titan Petrochemicals Group, Ltd. (b) (c) (d) | | | 1,000,000 | | | | 64 | |
Tradelink Electronic Commerce, Ltd. | | | 256,000 | | | | 51,776 | |
Transport International Holdings, Ltd. | | | 132,000 | | | | 346,079 | |
Trinity, Ltd. (c) | | | 466,000 | | | | 33,097 | |
TSC Group Holdings, Ltd. (c) | | | 216,000 | | | | 30,634 | |
Tsui Wah Holdings, Ltd. | | | 40,000 | | | | 6,568 | |
United Laboratories International Holdings, Ltd. (The) (c) | | | 241,000 | | | | 95,421 | |
Universal Technologies Holdings, Ltd. (c) | | | 120,000 | | | | 5,632 | |
Up Energy Development Group, Ltd. (b) (c) | | | 92,000 | | | | 1,491 | |
Upbest Group, Ltd. | | | 8,000 | | | | 2,258 | |
Value Convergence Holdings, Ltd. (c) | | | 104,000 | | | | 14,723 | |
Value Partners Group, Ltd. (a) | | | 189,000 | | | | 175,361 | |
Varitronix International, Ltd. | | | 137,000 | | | | 72,415 | |
Vedan International Holdings, Ltd. | | | 296,000 | | | | 23,473 | |
Victory City International Holdings, Ltd. (a) | | | 813,270 | | | | 40,987 | |
Vitasoy International Holdings, Ltd. (a) | | | 358,000 | | | | 650,849 | |
VS International Group, Ltd. (c) | | | 160,000 | | | | 8,491 | |
VST Holdings, Ltd. | | | 487,200 | | | | 139,405 | |
VTech Holdings, Ltd. | | | 35,300 | | | | 372,836 | |
Wai Kee Holdings, Ltd. | | | 54,000 | | | | 16,079 | |
Win Hanverky Holdings, Ltd. | | | 332,000 | | | | 57,591 | |
Winfull Group Holdings, Ltd. (c) | | | 528,000 | | | | 12,972 | |
Wing On Co. International, Ltd. | | | 46,000 | | | | 133,281 | |
Wing Tai Properties, Ltd. | | | 280,000 | | | | 154,348 | |
Xinyi Automobile Glass Hong Kong Enterprises, Ltd. (c) (d) | | | 103,250 | | | | 36,200 | |
Xinyi Glass Holdings, Ltd. | | | 826,000 | | | | 608,992 | |
Yeebo International Holdings, Ltd. | | | 158,000 | | | | 43,135 | |
See accompanying notes to financial statements.
MSF-14
Metropolitan Series Fund
Met/Dimensional International Small Company Portfolio
Schedule of Investments as of June 30, 2016 (Unaudited)
Common Stocks—(Continued)
| | | | | | | | |
| Security Description | | Shares | | | Value | |
|
Hong Kong—(Continued) | |
YGM Trading, Ltd. | | | 46,000 | | | $ | 23,836 | |
Yugang International, Ltd. | | | 1,466,000 | | | | 24,275 | |
| | | | | | | | |
| | | | | | | 19,099,358 | |
| | | | | | | | |
| | |
Ireland—0.8% | | | | | | | | |
C&C Group plc | | | 149,205 | | | | 584,529 | |
FBD Holdings plc (c) | | | 10,350 | | | | 66,075 | |
Glanbia plc | | | 37,294 | | | | 703,729 | |
Grafton Group plc | | | 88,160 | | | | 584,237 | |
Greencore Group plc | | | 238,369 | | | | 978,052 | |
IFG Group plc | | | 44,002 | | | | 104,343 | |
Independent News & Media plc (c) | | | 35,056 | | | | 5,471 | |
Irish Continental Group plc | | | 22,664 | | | | 106,045 | |
Kingspan Group plc | | | 54,781 | | | | 1,185,434 | |
Paddy Power Betfair plc | | | 397 | | | | 41,757 | |
Smurfit Kappa Group plc | | | 11,491 | | | | 254,710 | |
UDG Healthcare plc | | | 104,367 | | | | 821,895 | |
| | | | | | | | |
| | | | | | | 5,436,277 | |
| | | | | | | | |
| | |
Isle of Man—0.1% | | | | | | | | |
GVC Holdings plc | | | 61,038 | | | | 459,812 | |
| | | | | | | | |
| | |
Israel—0.8% | | | | | | | | |
ADO Group, Ltd. (c) | | | 855 | | | | 11,507 | |
Africa Israel Investments, Ltd. (c) | | | 64,935 | | | | 17,533 | |
Africa Israel Properties, Ltd. | | | 4,653 | | | | 71,849 | |
Africa Israel Residences, Ltd. | | | 880 | | | | 14,841 | |
Airport City, Ltd. (c) | | | 25,014 | | | | 245,069 | |
Allot Communications, Ltd. (c) | | | 10,216 | | | | 49,542 | |
Alrov Properties and Lodgings, Ltd. | | | 5,057 | | | | 101,107 | |
Amot Investments, Ltd. | | | 25,066 | | | | 102,358 | |
Ashtrom Properties, Ltd. | | | 3,392 | | | | 10,536 | |
AudioCodes, Ltd. (c) | | | 13,306 | | | | 55,387 | |
Avgol Industries 1953, Ltd. | | | 9,099 | | | | 10,124 | |
Azorim-Investment Development & Construction Co., Ltd. (c) | | | 23,712 | | | | 20,796 | |
Bayside Land Corp. | | | 205 | | | | 69,932 | |
Big Shopping Centers, Ltd. | | | 1,031 | | | | 60,272 | |
BioLine RX, Ltd. (c) | | | 2,565 | | | | 2,059 | |
Blue Square Real Estate, Ltd. | | | 738 | | | | 24,235 | |
Cellcom Israel, Ltd. (c) | | | 13,058 | | | | 87,524 | |
Ceragon Networks, Ltd. (c) | | | 14,799 | | | | 23,724 | |
Clal Biotechnology Industries, Ltd. (c) | | | 17,579 | | | | 12,754 | |
Clal Insurance Enterprises Holdings, Ltd. (c) | | | 7,114 | | | | 71,853 | |
Cohen Development & Industrial Buildings, Ltd. (c) | | | 305 | | | | 6,345 | |
Compugen, Ltd. (c) | | | 14,846 | | | | 94,184 | |
Delek Automotive Systems, Ltd. | | | 10,535 | | | | 88,364 | |
Delta-Galil Industries, Ltd. | | | 4,030 | | | | 107,929 | |
Direct Insurance Financial Investments, Ltd. | | | 5,783 | | | | 41,458 | |
El Al Israel Airlines | | | 37,740 | | | | 25,019 | |
Electra Consumer Products 1970, Ltd. (c) | | | 1,236 | | | | 12,182 | |
Electra, Ltd. | | | 652 | | | | 80,403 | |
Elron Electronic Industries, Ltd. (c) | | | 7,585 | | | | 33,350 | |
Energix-Renewable Energies, Ltd. | | | 13,559 | | | | 9,351 | |
Equital, Ltd. (c) | | | 550 | | | | 9,110 | |
|
Israel—(Continued) | |
Evogene, Ltd. (c) | | | 5,090 | | | | 31,809 | |
First International Bank of Israel, Ltd. | | | 8,900 | | | | 109,194 | |
FMS Enterprises Migun, Ltd. | | | 910 | | | | 19,632 | |
Formula Systems 1985, Ltd. | | | 2,591 | | | | 84,170 | |
Fox Wizel, Ltd. | | | 1,475 | | | | 18,604 | |
Frutarom Industries, Ltd. | | | 3,004 | | | | 138,980 | |
Gilat Satellite Networks, Ltd. (c) | | | 4,881 | | | | 20,755 | |
Hadera Paper, Ltd. (c) | | | 1,104 | | | | 32,204 | |
Harel Insurance Investments & Financial Services, Ltd. | | | 43,597 | | | | 152,576 | |
Hilan, Ltd. | | | 1,413 | | | | 18,869 | |
IDI Insurance Co., Ltd. | | | 441 | | | | 20,799 | |
Industrial Buildings Corp., Ltd. | | | 39,465 | | | | 39,805 | |
Israel Discount Bank, Ltd. - Class A (c) | | | 134,749 | | | | 232,462 | |
Israel Land Development Co., Ltd. (The) | | | 3,950 | | | | 18,938 | |
Jerusalem Oil Exploration (c) | | | 4,736 | | | | 184,332 | |
Kamada, Ltd. (c) | | | 11,729 | | | | 43,232 | |
Kerur Holdings, Ltd. | | | 931 | | | | 17,540 | |
Maabarot Products, Ltd. | | | 3,435 | | | | 50,632 | |
Magic Software Enterprises, Ltd. | | | 9,462 | | | | 62,272 | |
Matrix IT, Ltd. | | | 14,215 | | | | 90,393 | |
Maytronics, Ltd. | | | 7,834 | | | | 23,158 | |
Mazor Robotics, Ltd. (c) | | | 10,502 | | | | 93,889 | |
Meitav DS Investments, Ltd. | | | 5,193 | | | | 15,146 | |
Melisron, Ltd. | | | 4,351 | | | | 175,061 | |
Menorah Mivtachim Holdings, Ltd. (c) | | | 11,310 | | | | 88,113 | |
Migdal Insurance & Financial Holding, Ltd. (c) | | | 55,471 | | | | 31,814 | |
Mivtach Shamir Holdings, Ltd. | | | 1,401 | | | | 27,847 | |
Naphtha Israel Petroleum Corp., Ltd. (c) | | | 14,775 | | | | 72,270 | |
Neto ME Holdings, Ltd. | | | 963 | | | | 70,675 | |
Nova Measuring Instruments, Ltd. (c) | | | 9,293 | | | | 101,018 | |
Oil Refineries, Ltd. (c) | | | 418,554 | | | | 148,193 | |
Ormat Technologies, Inc. | | | 1 | | | | 24 | |
Partner Communications Co., Ltd. (c) | | | 21,648 | | | | 99,670 | |
Paz Oil Co., Ltd. | | | 1,481 | | | | 238,460 | |
Perion Network, Ltd. (c) | | | 3,246 | | | | 3,865 | |
Phoenix Holdings, Ltd. (The) (c) | | | 20,176 | | | | 46,284 | |
Plasson Industries, Ltd. | | | 1,729 | | | | 41,292 | |
Rami Levi Chain Stores Hashikma Marketing, Ltd. | | | 1,803 | | | | 67,957 | |
Sapiens International Corp. NV | | | 6,702 | | | | 77,648 | |
Shikun & Binui, Ltd. | | | 73,332 | | | | 125,297 | |
Shufersal, Ltd. | | | 23,137 | | | | 77,855 | |
Space Communication, Ltd. (c) | | | 2,951 | | | | 26,484 | |
Strauss Group, Ltd. | | | 4,554 | | | | 71,756 | |
Summit Real Estate Holdings, Ltd. (c) | | | 2,798 | | | | 14,265 | |
Tower Semiconductor, Ltd. (c) | | | 12,319 | | | | 149,193 | |
Tower Semiconductor, Ltd. (U.S. Listed Shares) (a) (c) | | | 1,303 | | | | 16,183 | |
Union Bank of Israel (c) | | | 7,545 | | | | 25,174 | |
| | | | | | | | |
| | | | | | | 4,886,486 | |
| | | | | | | | |
| | |
Italy—3.4% | | | | | | | | |
A2A S.p.A. (a) | | | 481,411 | | | | 636,055 | |
ACEA S.p.A. | | | 23,394 | | | | 285,946 | |
Aeffe S.p.A. (a) (c) | | | 11,359 | | | | 12,775 | |
See accompanying notes to financial statements.
MSF-15
Metropolitan Series Fund
Met/Dimensional International Small Company Portfolio
Schedule of Investments as of June 30, 2016 (Unaudited)
Common Stocks—(Continued)
| | | | | | | | |
| Security Description | | Shares | | | Value | |
|
Italy—(Continued) | |
Alerion Cleanpower S.p.A. | | | 5,771 | | | $ | 10,193 | |
Amplifon S.p.A. (a) | | | 36,377 | | | | 340,750 | |
Anima Holding S.p.A. | | | 10,612 | | | | 50,351 | |
Ansaldo STS S.p.A. | | | 39,015 | | | | 444,209 | |
Arnoldo Mondadori Editore S.p.A. (c) | | | 63,913 | | | | 68,082 | |
Ascopiave S.p.A. | | | 28,294 | | | | 84,957 | |
Astaldi S.p.A. (a) | | | 20,559 | | | | 83,924 | |
Autogrill S.p.A. | | | 44,414 | | | | 359,057 | |
Azimut Holding S.p.A. | | | 40,582 | | | | 661,355 | |
Banca Carige S.p.A. (a) (c) | | | 156,432 | | | | 64,032 | |
Banca Finnat Euramerica S.p.A. | | | 50,851 | | | | 18,060 | |
Banca Generali S.p.A. | | | 19,591 | | | | 392,194 | |
Banca IFIS S.p.A. | | | 7,714 | | | | 156,155 | |
Banca Mediolanum S.p.A. (a) | | | 1,773 | | | | 12,147 | |
Banca Popolare dell’Emilia Romagna SC | | | 202,667 | | | | 744,543 | |
Banca Popolare dell’Etruria e del Lazio SC (a) (b) (c) (d) | | | 91,952 | | | | 0 | |
Banca Popolare di Milano Scarl | | | 1,819,630 | | | | 760,128 | |
Banca Popolare di Sondrio Scarl | | | 173,614 | | | | 447,470 | |
Banca Profilo S.p.A. (a) | | | 117,883 | | | | 23,335 | |
Banco di Desio e della Brianza S.p.A. | | | 20,306 | | | | 38,478 | |
Banco Popolare SC (a) | | | 105,436 | | | | 257,229 | |
BasicNet S.p.A. | | | 13,493 | | | | 42,022 | |
Biesse S.p.A. | | | 6,021 | | | | 75,526 | |
Brembo S.p.A. | | | 9,033 | | | | 496,741 | |
Brunello Cucinelli S.p.A. (a) | | | 8,151 | | | | 146,244 | |
Buzzi Unicem S.p.A. | | | 30,820 | | | | 539,141 | |
Cairo Communication S.p.A. (a) | | | 10,087 | | | | 50,503 | |
Caltagirone Editore S.p.A. (c) | | | 6,273 | | | | 5,565 | |
Carraro S.p.A. (c) | | | 5,504 | | | | 7,413 | |
Cementir Holding S.p.A. | | | 31,117 | | | | 124,521 | |
CIR-Compagnie Industriali Riunite S.p.A. | | | 201,871 | | | | 217,588 | |
Credito Emiliano S.p.A. | | | 44,882 | | | | 273,812 | |
Credito Valtellinese SC | | | 463,264 | | | | 212,625 | |
Danieli & C Officine Meccaniche S.p.A. | | | 4,846 | | | | 86,566 | |
Datalogic S.p.A. | | | 9,916 | | | | 159,903 | |
Davide Campari-Milano S.p.A. | | | 106,679 | | | | 1,056,951 | |
De’Longhi S.p.A. | | | 16,896 | | | | 402,275 | |
DeA Capital S.p.A. | | | 18,071 | | | | 21,399 | |
DiaSorin S.p.A. | | | 6,863 | | | | 421,130 | |
Ei Towers S.p.A. | | | 7,035 | | | | 356,788 | |
El.En. S.p.A. | | | 5,028 | | | | 76,482 | |
ERG S.p.A. | | | 21,603 | | | | 246,165 | |
Esprinet S.p.A. | | | 18,719 | | | | 107,671 | |
Eurotech S.p.A. (c) | | | 13,076 | | | | 19,716 | |
Falck Renewables S.p.A. | | | 34,815 | | | | 27,011 | |
FNM S.p.A. | | | 55,327 | | | | 27,329 | |
Geox S.p.A. | | | 42,620 | | | | 132,520 | |
Gruppo Editoriale L’Espresso S.p.A. (c) | | | 75,580 | | | | 62,365 | |
Gruppo MutuiOnline S.p.A. | | | 5,404 | | | | 47,226 | |
Hera S.p.A. | | | 231,619 | | | | 633,587 | |
IMMSI S.p.A. | | | 100,436 | | | | 44,705 | |
Industria Macchine Automatiche S.p.A. | | | 5,461 | | | | 328,484 | |
Intek Group S.p.A. (c) | | | 80,757 | | | | 18,365 | |
Interpump Group S.p.A. | | | 28,206 | | | | 443,354 | |
Iren S.p.A. | | | 231,134 | | | | 357,579 | |
Italcementi S.p.A. (c) | | | 64,343 | | | | 754,477 | |
|
Italy—(Continued) | |
Italmobiliare S.p.A. | | | 4,262 | | | | 150,083 | |
Juventus Football Club S.p.A. (c) | | | 147,435 | | | | 41,603 | |
La Doria S.p.A. | | | 3,877 | | | | 48,801 | |
Landi Renzo S.p.A. (c) | | | 5,877 | | | | 2,857 | |
Maire Tecnimont S.p.A. | | | 35,567 | | | | 89,464 | |
MARR S.p.A. | | | 13,428 | | | | 254,168 | |
Mediaset S.p.A. | | | 192,042 | | | | 675,984 | |
Moncler S.p.A. | | | 10,344 | | | | 163,620 | |
Nice S.p.A. | | | 9,890 | | | | 23,969 | |
Parmalat S.p.A. | | | 18,078 | | | | 46,998 | |
Piaggio & C S.p.A. (a) | | | 71,430 | | | | 125,421 | |
Prelios S.p.A. (a) (c) | | | 54,976 | | | | 4,493 | |
Prima Industrie S.p.A. | | | 1,853 | | | | 24,818 | |
Prysmian S.p.A. | | | 75,002 | | | | 1,644,165 | |
Recordati S.p.A. | | | 33,633 | | | | 1,011,219 | |
Reno de Medici S.p.A. | | | 29,538 | | | | 9,740 | |
Reply S.p.A. | | | 1,999 | | | | 254,833 | |
Retelit S.p.A. (c) | | | 36,769 | | | | 25,763 | |
Rizzoli Corriere Della Sera Mediagroup S.p.A. (a) (c) | | | 79,933 | | | | 71,486 | |
Sabaf S.p.A. | | | 3,059 | | | | 32,170 | |
SAES Getters S.p.A. | | | 1,416 | | | | 17,716 | |
Safilo Group S.p.A. (a) (c) | | | 10,142 | | | | 76,855 | |
Saipem S.p.A. (c) | | | 605,130 | | | | 244,163 | |
Salini Impregilo S.p.A. (a) | | | 70,140 | | | | 198,424 | |
Salvatore Ferragamo S.p.A. (a) | | | 16,352 | | | | 332,255 | |
Saras S.p.A. (a) | | | 134,526 | | | | 233,086 | |
SAVE S.p.A. | | | 5,376 | | | | 77,383 | |
Snai S.p.A. (c) | | | 21,135 | | | | 14,994 | |
Societa Cattolica di Assicurazioni S.c.r.l. | | | 63,558 | | | | 403,536 | |
Societa Iniziative Autostradali e Servizi S.p.A. | | | 25,981 | | | | 223,921 | |
Sogefi S.p.A. (c) | | | 24,822 | | | | 36,283 | |
SOL S.p.A. | | | 11,001 | | | | 111,071 | |
Tamburi Investment Partners S.p.A. | | | 14,397 | | | | 53,838 | |
Tiscali S.p.A. (c) | | | 802,477 | | | | 38,287 | |
Tod’s S.p.A. (a) | | | 3,954 | | | | 212,073 | |
Trevi Finanziaria Industriale S.p.A. (a) | | | 31,414 | | | | 43,656 | |
TXT e-solutions S.p.A. | | | 1,815 | | | | 14,287 | |
Uni Land S.p.A. (b) (c) (d) | | | 4,937 | | | | 0 | |
Unipol Gruppo Finanziario S.p.A. | | | 126,457 | | | | 297,407 | |
UnipolSai S.p.A. | | | 34,177 | | | | 51,374 | |
Vittoria Assicurazioni S.p.A. | | | 12,164 | | | | 117,656 | |
Yoox Net-A-Porter Group S.p.A. (c) | | | 21,096 | | | | 489,708 | |
Zignago Vetro S.p.A. | | | 11,476 | | | | 69,948 | |
| | | | | | | | |
| | | | | | | 22,034,750 | |
| | | | | | | | |
| | |
Japan—24.5% | | | | | | | | |
A&A Material Corp. | | | 12,000 | | | | 9,594 | |
A&D Co., Ltd. | | | 3,000 | | | | 10,861 | |
A/S One Corp. | | | 4,700 | | | | 188,341 | |
Accordia Golf Co., Ltd. | | | 19,200 | | | | 200,296 | |
Achilles Corp. | | | 65,000 | | | | 79,100 | |
Adastria Co., Ltd. | | | 9,240 | | | | 363,879 | |
ADEKA Corp. | | | 34,600 | | | | 417,605 | |
Aderans Co., Ltd. | | | 8,700 | | | | 42,669 | |
Advan Co., Ltd. | | | 8,300 | | | | 91,456 | |
Advanex, Inc. | | | 900 | | | | 10,479 | |
Advantest Corp. (a) | | | 7,400 | | | | 82,161 | |
See accompanying notes to financial statements.
MSF-16
Metropolitan Series Fund
Met/Dimensional International Small Company Portfolio
Schedule of Investments as of June 30, 2016 (Unaudited)
Common Stocks—(Continued)
| | | | | | | | |
| Security Description | | Shares | | | Value | |
|
Japan—(Continued) | |
Aeon Delight Co., Ltd. (a) | | | 3,900 | | | $ | 105,647 | |
Aeon Fantasy Co., Ltd. (a) | | | 2,400 | | | | 66,434 | |
Aeon Hokkaido Corp. (a) | | | 2,600 | | | | 12,827 | |
AGORA Hospitality Group Co., Ltd. (c) | | | 27,000 | | | | 9,188 | |
Agro-Kanesho Co., Ltd. | | | 3,500 | | | | 34,143 | |
Ahresty Corp. | | | 9,200 | | | | 62,317 | |
Ai Holdings Corp. (a) | | | 12,200 | | | | 283,467 | |
Aica Kogyo Co., Ltd. | | | 17,200 | | | | 391,214 | |
Aichi Bank, Ltd. (The) | | | 4,500 | | | | 189,856 | |
Aichi Corp. | | | 10,800 | | | | 76,562 | |
Aichi Steel Corp. | | | 43,000 | | | | 189,693 | |
Aichi Tokei Denki Co., Ltd. | | | 19,000 | | | | 55,357 | |
Aida Engineering, Ltd. | | | 20,700 | | | | 169,211 | |
Aigan Co., Ltd. | | | 6,600 | | | | 12,898 | |
Ain Holdings, Inc. | | | 6,000 | | | | 464,347 | |
Aiphone Co., Ltd. | | | 6,800 | | | | 112,460 | |
Airport Facilities Co., Ltd. | | | 7,500 | | | | 36,482 | |
Aisan Industry Co., Ltd. | | | 10,400 | | | | 66,765 | |
Aizawa Securities Co., Ltd. | | | 13,800 | | | | 69,416 | |
Akebono Brake Industry Co., Ltd. (a) (c) | | | 32,600 | | | | 63,505 | |
Akita Bank, Ltd. (The) | | | 86,000 | | | | 245,699 | |
Alconix Corp. | | | 3,200 | | | | 45,983 | |
Alinco, Inc. | | | 5,800 | | | | 54,391 | |
Alpen Co., Ltd. (a) | | | 7,000 | | | | 114,179 | |
Alpha Corp. | | | 2,200 | | | | 19,838 | |
Alpha Systems, Inc. | | | 3,940 | | | | 62,959 | |
Alpine Electronics, Inc. | | | 16,600 | | | | 161,518 | |
Alps Logistics Co., Ltd. | | | 8,200 | | | | 42,052 | |
Altech Corp. | | | 2,600 | | | | 51,981 | |
Amano Corp. | | | 21,000 | | | | 363,080 | |
Amiyaki Tei Co., Ltd. | | | 1,100 | | | | 46,680 | |
Amuse, Inc. (a) | | | 3,600 | | | | 66,994 | |
Anabuki Kosan, Inc. | | | 4,000 | | | | 9,400 | |
Anest Iwata Corp. | | | 10,400 | | | | 89,273 | |
Anritsu Corp. | | | 48,800 | | | | 280,435 | |
AOI Electronics Co., Ltd. | | | 1,100 | | | | 21,004 | |
AOI Pro, Inc. | | | 4,700 | | | | 42,470 | |
AOKI Holdings, Inc. (a) | | | 17,700 | | | | 182,266 | |
Aomori Bank, Ltd. (The) | | | 94,000 | | | | 260,486 | |
Aoyama Trading Co., Ltd. | | | 17,900 | | | | 655,299 | |
Arakawa Chemical Industries, Ltd. | | | 7,200 | | | | 66,105 | |
Arata Corp. | | | 4,600 | | | | 99,832 | |
Araya Industrial Co., Ltd. | | | 26,000 | | | | 32,421 | |
Arcland Sakamoto Co., Ltd. | | | 12,800 | | | | 141,963 | |
Arcs Co., Ltd. | | | 13,364 | | | | 316,826 | |
Ardepro Co., Ltd. | | | 15,000 | | | | 16,967 | |
Argo Graphics, Inc. | | | 2,800 | | | | 43,318 | |
Ariake Japan Co., Ltd. | | | 5,700 | | | | 337,026 | |
Arisawa Manufacturing Co., Ltd. (a) | | | 14,300 | | | | 72,615 | |
Arrk Corp. (c) | | | 22,600 | | | | 15,851 | |
Artnature, Inc. | | | 5,000 | | | | 39,516 | |
Asahi Broadcasting Corp. | | | 2,400 | | | | 14,485 | |
Asahi Co., Ltd. | | | 4,500 | | | | 64,443 | |
Asahi Diamond Industrial Co., Ltd. | | | 21,200 | | | | 163,358 | |
Asahi Holdings, Inc. | | | 9,000 | | | | 129,954 | |
Asahi Kogyosha Co., Ltd. | | | 16,000 | | | | 76,517 | |
Asahi Net, Inc. | | | 5,000 | | | | 21,821 | |
|
Japan—(Continued) | |
Asahi Printing Co., Ltd. | | | 200 | | | | 4,780 | |
ASAHI YUKIZAI Corp. | | | 34,000 | | | | 63,620 | |
Asahipen Corp. | | | 4,000 | | | | 6,273 | |
Asanuma Corp. | | | 24,000 | | | | 49,398 | |
Asatsu-DK, Inc. | | | 13,300 | | | | 313,256 | |
Asax Co., Ltd. | | | 1,800 | | | | 23,271 | |
Ashimori Industry Co., Ltd. | | | 24,000 | | | | 37,029 | |
Asia Growth Capital, Ltd. (a) (c) | | | 21,000 | | | | 16,198 | |
ASKA Pharmaceutical Co., Ltd. | | | 9,000 | | | | 150,329 | |
ASKUL Corp. (a) | | | 4,800 | | | | 176,231 | |
Asunaro Aoki Construction Co., Ltd. | | | 8,000 | | | | 53,375 | |
Atom Corp. (a) | | | 11,100 | | | | 73,542 | |
Atsugi Co., Ltd. | | | 88,000 | | | | 91,524 | |
Autobacs Seven Co., Ltd. | | | 22,700 | | | | 320,563 | |
Avex Group Holdings, Inc. | | | 12,000 | | | | 135,320 | |
Awa Bank, Ltd. (The) | | | 82,000 | | | | 427,110 | |
Axell Corp. | | | 3,800 | | | | 24,888 | |
Axial Retailing, Inc. | | | 5,500 | | | | 189,846 | |
Azbil Corp. | | | 3,900 | | | | 114,438 | |
Bando Chemical Industries, Ltd. | | | 39,000 | | | | 187,757 | |
Bank of Iwate, Ltd. (The) (a) | | | 7,200 | | | | 271,280 | |
Bank of Kochi, Ltd. (The) | | | 16,000 | | | | 15,615 | |
Bank of Nagoya, Ltd. (The) (a) | | | 78,000 | | | | 242,438 | |
Bank of Okinawa, Ltd. (The) | | | 10,560 | | | | 308,861 | |
Bank of Saga, Ltd. (The) | | | 67,000 | | | | 144,985 | |
Bank of the Ryukyus, Ltd. | | | 15,800 | | | | 157,068 | |
Belc Co., Ltd. | | | 2,800 | | | | 116,118 | |
Belluna Co., Ltd. | | | 21,900 | | | | 121,999 | |
Benefit One, Inc. | | | 5,400 | | | | 159,502 | |
Best Denki Co., Ltd. | | | 40,000 | | | | 40,859 | |
Bic Camera, Inc. | | | 23,500 | | | | 215,506 | |
Biofermin Pharmaceutical Co., Ltd. | | | 500 | | | | 13,150 | |
BML, Inc. | | | 3,800 | | | | 173,425 | |
Bookoff Corp. (a) | | | 4,700 | | | | 37,847 | |
BP Castrol KK (a) | | | 2,600 | | | | 29,875 | |
Broadleaf Co., Ltd. | | | 5,100 | | | | 46,705 | |
BRONCO BILLY Co., Ltd. (a) | | | 2,400 | | | | 76,371 | |
Bull-Dog Sauce Co., Ltd. | | | 6,000 | | | | 11,697 | |
Bunka Shutter Co., Ltd. | | | 19,000 | | | | 152,062 | |
C Uyemura & Co., Ltd. (a) | | | 2,800 | | | | 112,229 | |
CAC Holdings Corp. | | | 6,200 | | | | 47,421 | |
Calsonic Kansei Corp. | | | 55,000 | | | | 416,840 | |
Can Do Co., Ltd. (a) | | | 3,500 | | | | 55,706 | |
Canare Electric Co., Ltd. | | | 800 | | | | 14,128 | |
Canon Electronics, Inc. | | | 7,400 | | | | 101,872 | |
Capcom Co., Ltd. | | | 15,400 | | | | 353,958 | |
Carlit Holdings Co., Ltd. | | | 7,300 | | | | 31,926 | |
Cawachi, Ltd. | | | 5,700 | | | | 135,541 | |
Central Glass Co., Ltd. | | | 75,000 | | | | 321,440 | |
Central Security Patrols Co., Ltd. | | | 3,300 | | | | 67,995 | |
Central Sports Co., Ltd. | | | 3,200 | | | | 73,932 | |
Chiba Kogyo Bank, Ltd. (The) | | | 16,000 | | | | 57,715 | |
Chilled & Frozen Logistics Holdings Co., Ltd. | | | 2,800 | | | | 29,180 | |
CHIMNEY Co., Ltd. | | | 1,400 | | | | 37,113 | |
Chino Corp. | | | 4,000 | | | | 38,119 | |
Chiyoda Co., Ltd. | | | 8,900 | | | | 195,717 | |
Chiyoda Corp. | | | 6,000 | | | | 39,374 | |
See accompanying notes to financial statements.
MSF-17
Metropolitan Series Fund
Met/Dimensional International Small Company Portfolio
Schedule of Investments as of June 30, 2016 (Unaudited)
Common Stocks—(Continued)
| | | | | | | | |
| Security Description | | Shares | | | Value | |
|
Japan—(Continued) | |
Chiyoda Integre Co., Ltd. | | | 5,300 | | | $ | 98,110 | |
Chofu Seisakusho Co., Ltd. (a) | | | 5,700 | | | | 137,919 | |
Chori Co., Ltd. | | | 5,000 | | | | 64,573 | |
Chubu Shiryo Co., Ltd. | | | 10,400 | | | | 73,455 | |
Chudenko Corp. | | | 8,600 | | | | 172,638 | |
Chuetsu Pulp & Paper Co., Ltd. (a) | | | 35,000 | | | | 69,579 | |
Chugai Mining Co., Ltd. (c) | | | 68,200 | | | | 13,209 | |
Chugai Ro Co., Ltd. | | | 36,000 | | | | 75,670 | |
Chugoku Marine Paints, Ltd. | | | 22,000 | | | | 134,769 | |
Chukyo Bank, Ltd. (The) | | | 64,000 | | | | 149,806 | |
Chuo Gyorui Co., Ltd. | | | 2,000 | | | | 4,984 | |
Chuo Spring Co., Ltd. | | | 19,000 | | | | 48,580 | |
Ci:z Holdings Co., Ltd. (a) | | | 7,500 | | | | 163,282 | |
CKD Corp. | | | 20,900 | | | | 155,154 | |
Clarion Co., Ltd. | | | 34,000 | | | | 82,944 | |
Cleanup Corp. | | | 9,700 | | | | 71,105 | |
CMIC Holdings Co., Ltd. (a) | | | 3,900 | | | | 60,058 | |
CMK Corp. (c) | | | 24,300 | | | | 97,754 | |
Cocokara fine, Inc. | | | 5,700 | | | | 293,049 | |
Colowide Co., Ltd. (a) | | | 17,000 | | | | 305,880 | |
Computer Engineering & Consulting, Ltd. | | | 5,900 | | | | 78,894 | |
Computer Institute of Japan, Ltd. | | | 2,000 | | | | 8,794 | |
COMSYS Holdings Corp. | | | 3,700 | | | | 59,675 | |
Concordia Financial Group, Ltd. (c) | | | 17,288 | | | | 67,648 | |
CONEXIO Corp. | | | 7,900 | | | | 98,444 | |
COOKPAD, Inc. | | | 12,600 | | | | 152,910 | |
Corona Corp. | | | 8,500 | | | | 83,818 | |
Cosel Co., Ltd. (a) | | | 9,900 | | | | 101,092 | |
Cosmo Energy Holdings Co., Ltd. | | | 21,800 | | | | 265,879 | |
Cosmos Initia Co., Ltd. (a) | | | 3,500 | | | | 13,110 | |
Create Medic Co., Ltd. | | | 1,800 | | | | 14,178 | |
Create SD Holdings Co., Ltd. | | | 10,900 | | | | 307,312 | |
Cresco, Ltd. | | | 2,000 | | | | 45,205 | |
CROOZ, Inc. (a) | | | 1,400 | | | | 27,208 | |
CTI Engineering Co., Ltd. | | | 5,900 | | | | 47,337 | |
Cybernet Systems Co., Ltd. (a) | | | 3,900 | | | | 27,697 | |
DA Consortium, Inc. (a) | | | 7,600 | | | | 84,305 | |
Dai Nippon Toryo Co., Ltd. | | | 53,000 | | | | 97,893 | |
Dai-Dan Co., Ltd. | | | 14,000 | | | | 103,110 | |
Dai-ichi Seiko Co., Ltd. (a) | | | 4,000 | | | | 37,824 | |
Daibiru Corp. | | | 19,800 | | | | 169,414 | |
Daido Kogyo Co., Ltd. | | | 10,000 | | | | 18,402 | |
Daido Metal Co., Ltd. | | | 11,200 | | | | 106,961 | |
Daido Steel Co., Ltd. | | | 36,000 | | | | 122,739 | |
Daidoh, Ltd. (a) | | | 13,700 | | | | 58,461 | |
Daifuku Co., Ltd. | | | 23,000 | | | | 408,302 | |
Daihatsu Diesel Manufacturing Co., Ltd. (a) | | | 9,000 | | | | 51,088 | |
Daihen Corp. (a) | | | 40,000 | | | | 173,983 | |
Daiho Corp. | | | 25,000 | | | | 111,111 | |
Daiichi Jitsugyo Co., Ltd. | | | 20,000 | | | | 86,125 | |
Daiichi Kigenso Kagaku-Kogyo Co., Ltd. | | | 1,000 | | | | 26,424 | |
Daiichikosho Co., Ltd. | | | 3,900 | | | | 163,260 | |
Daiken Corp. | | | 24,000 | | | | 75,932 | |
Daiken Medical Co., Ltd. (a) | | | 4,400 | | | | 33,412 | |
Daiki Aluminium Industry Co., Ltd. | | | 9,000 | | | | 25,262 | |
Daikoku Denki Co., Ltd. (a) | | | 2,700 | | | | 37,924 | |
Daikokutenbussan Co., Ltd. | | | 1,900 | | | | 89,556 | |
|
Japan—(Continued) | |
Daikyo, Inc. | | | 115,000 | | | | 165,917 | |
Dainichi Co., Ltd. (a) | | | 4,100 | | | | 24,029 | |
Dainichiseika Color & Chemicals Manufacturing Co., Ltd. | | | 31,000 | | | | 123,818 | |
Daio Paper Corp. (a) | | | 30,000 | | | | 325,341 | |
Daisan Bank, Ltd. (The) | | | 92,000 | | | | 136,067 | |
Daiseki Co., Ltd. | | | 12,300 | | | | 237,050 | |
Daiseki Eco. Solution Co., Ltd. | | | 2,000 | | | | 21,376 | |
Daishi Bank, Ltd. (The) | | | 143,000 | | | | 454,552 | |
Daishinku Corp. | | | 18,000 | | | | 45,940 | |
Daisue Construction Co., Ltd. | | | 2,300 | | | | 21,145 | |
Daisyo Corp. (a) | | | 5,100 | | | | 75,106 | |
Daito Bank, Ltd. (The) (a) | | | 59,000 | | | | 98,727 | |
Daito Electron Co., Ltd. | | | 800 | | | | 4,483 | |
Daito Pharmaceutical Co., Ltd. | | | 3,960 | | | | 108,563 | |
Daiwa Industries, Ltd. | | | 11,000 | | | | 94,018 | |
Daiwabo Holdings Co., Ltd. | | | 84,000 | | | | 177,604 | |
DC Co., Ltd. | | | 9,700 | | | | 31,141 | |
DCM Holdings Co., Ltd. (a) | | | 37,900 | | | | 322,850 | |
Denka Co., Ltd. | | | 24,000 | | | | 96,498 | |
Denki Kogyo Co., Ltd. | | | 21,000 | | | | 90,950 | |
Denyo Co., Ltd. | | | 4,800 | | | | 49,758 | |
Descente, Ltd. | | | 13,700 | | | | 147,307 | |
DKK-Toa Corp. | | | 2,200 | | | | 9,483 | |
DKS Co., Ltd. | | | 18,000 | | | | 55,376 | |
DMG Mori Co., Ltd. (a) | | | 23,500 | | | | 224,601 | |
DMW Corp. | | | 700 | | | | 12,148 | |
Doshisha Co., Ltd. | | | 8,200 | | | | 156,957 | |
Doutor Nichires Holdings Co., Ltd. | | | 11,500 | | | | 199,579 | |
DSB Co., Ltd. (a) | | | 5,300 | | | | 30,296 | |
DTS Corp. | | | 6,600 | | | | 122,563 | |
Dunlop Sports Co., Ltd. (a) | | | 4,900 | | | | 43,983 | |
Duskin Co., Ltd. | | | 14,900 | | | | 250,347 | |
Dydo Drinco, Inc. | | | 2,700 | | | | 144,141 | |
Dynic Corp. | | | 16,000 | | | | 23,544 | |
Eagle Industry Co., Ltd. | | | 7,800 | | | | 90,328 | |
Earth Chemical Co., Ltd. | | | 2,700 | | | | 129,593 | |
Ebara Jitsugyo Co., Ltd. | | | 3,500 | | | | 40,949 | |
EDION Corp. (a) | | | 34,100 | | | | 279,937 | |
eGuarantee, Inc. | | | 400 | | | | 12,662 | |
Ehime Bank, Ltd. (The) (a) | | | 76,000 | | | | 167,932 | |
Eidai Co., Ltd. | | | 14,000 | | | | 53,892 | |
Eighteenth Bank, Ltd. (The) | | | 70,000 | | | | 170,624 | |
Eiken Chemical Co., Ltd. | | | 4,600 | | | | 100,153 | |
Eizo Corp. | | | 6,300 | | | | 167,631 | |
Elecom Co., Ltd. | | | 5,100 | | | | 105,702 | |
Elematec Corp. | | | 4,000 | | | | 80,210 | |
EM Systems Co., Ltd. | | | 1,800 | | | | 21,241 | |
en-japan, Inc. | | | 6,800 | | | | 125,813 | |
Endo Lighting Corp. | | | 2,600 | | | | 23,312 | |
Enplas Corp. | | | 3,400 | | | | 89,564 | |
Enshu, Ltd. (c) | | | 23,000 | | | | 12,546 | |
EPS Holdings, Inc. | | | 7,900 | | | | 98,927 | |
ESPEC Corp. | | | 9,100 | | | | 112,384 | |
Excel Co., Ltd. (a) | | | 2,500 | | | | 32,038 | |
Exedy Corp. | | | 12,400 | | | | 264,663 | |
F-Tech, Inc. | | | 3,600 | | | | 31,818 | |
See accompanying notes to financial statements.
MSF-18
Metropolitan Series Fund
Met/Dimensional International Small Company Portfolio
Schedule of Investments as of June 30, 2016 (Unaudited)
Common Stocks—(Continued)
| | | | | | | | |
| Security Description | | Shares | | | Value | |
|
Japan—(Continued) | |
F@N Communications, Inc. (a) | | | 9,600 | | | $ | 74,023 | |
Faith, Inc. (a) | | | 2,680 | | | | 28,178 | |
FALCO HOLDINGS Co., Ltd. | | | 3,100 | | | | 40,460 | |
Fancl Corp. (a) | | | 11,100 | | | | 153,129 | |
FCC Co., Ltd. | | | 12,600 | | | | 204,033 | |
FDK Corp. (c) | | | 25,000 | | | | 18,965 | |
Feed One Co., Ltd. | | | 65,080 | | | | 72,165 | |
Ferrotec Corp. | | | 12,700 | | | | 178,145 | |
FIDEA Holdings Co., Ltd. | | | 62,510 | | | | 81,945 | |
Fields Corp. | | | 6,000 | | | | 73,692 | |
Financial Products Group Co., Ltd. (a) | | | 20,000 | | | | 204,954 | |
FINDEX, Inc. | | | 3,900 | | | | 50,658 | |
First Juken Co., Ltd. | | | 3,400 | | | | 38,781 | |
Foster Electric Co., Ltd. | | | 8,800 | | | | 138,224 | |
FP Corp. | | | 7,200 | | | | 347,577 | |
France Bed Holdings Co., Ltd. | | | 13,000 | | | | 118,575 | |
Freund Corp. | | | 2,400 | | | | 33,897 | |
FTGroup Co., Ltd. | | | 1,500 | | | | 11,417 | |
Fudo Tetra Corp. (a) | | | 60,300 | | | | 90,396 | |
Fuji Co., Ltd. | | | 7,300 | | | | 175,767 | |
Fuji Corp., Ltd. (a) | | | 8,600 | | | | 54,423 | |
Fuji Kiko Co., Ltd. | | | 7,600 | | | | 24,387 | |
Fuji Kosan Co., Ltd. | | | 4,600 | | | | 17,558 | |
Fuji Kyuko Co., Ltd. | | | 13,000 | | | | 181,384 | |
Fuji Oil Co., Ltd. (c) | | | 21,100 | | | | 69,732 | |
Fuji Oil Holdings, Inc. | | | 24,000 | | | | 444,045 | |
Fuji Pharma Co., Ltd. | | | 2,800 | | | | 61,736 | |
Fuji Seal International, Inc. | | | 7,000 | | | | 245,988 | |
Fuji Soft, Inc. (a) | | | 7,300 | | | | 171,925 | |
Fujibo Holdings, Inc. | | | 37,000 | | | | 88,719 | |
Fujicco Co., Ltd. | | | 8,500 | | | | 244,704 | |
Fujikura Kasei Co., Ltd. | | | 9,500 | | | | 50,875 | |
Fujikura Rubber, Ltd. | | | 5,800 | | | | 22,117 | |
Fujikura, Ltd. | | | 115,000 | | | | 527,469 | |
Fujimi, Inc. | | | 7,000 | | | | 102,592 | |
Fujimori Kogyo Co., Ltd. | | | 4,800 | | | | 90,463 | |
Fujisash Co., Ltd. | | | 24,500 | | | | 20,589 | |
Fujishoji Co., Ltd. | | | 1,300 | | | | 13,196 | |
Fujita Kanko, Inc. (a) | | | 8,000 | | | | 29,434 | |
Fujitec Co., Ltd. | | | 24,700 | | | | 212,128 | |
Fujitsu Frontech, Ltd. | | | 4,500 | | | | 41,713 | |
Fujitsu General, Ltd. | | | 19,000 | | | | 420,114 | |
Fujiya Co., Ltd. (c) | | | 5,000 | | | | 9,422 | |
FuKoKu Co., Ltd. | | | 5,100 | | | | 35,658 | |
Fukuda Corp. | | | 10,000 | | | | 101,344 | |
Fukui Bank, Ltd. (The) (a) | | | 109,000 | | | | 240,434 | |
Fukushima Bank, Ltd. (The) (a) | | | 112,000 | | | | 94,875 | |
Fukushima Industries Corp. | | | 4,600 | | | | 134,669 | |
Fukuyama Transporting Co., Ltd. (a) | | | 53,000 | | | | 278,614 | |
FULLCAST Holdings Co., Ltd. | | | 4,300 | | | | 35,478 | |
Fumakilla, Ltd. | | | 5,000 | | | | 31,585 | |
Funai Electric Co., Ltd. (a) | | | 7,900 | | | | 69,243 | |
Funai Soken Holdings, Inc. | | | 7,780 | | | | 105,007 | |
Furukawa Battery Co., Ltd. | | | 5,000 | | | | 30,300 | |
Furukawa Co., Ltd. (a) | | | 105,000 | | | | 146,919 | |
Furukawa Electric Co., Ltd. | | | 275,000 | | | | 634,041 | |
Furuno Electric Co., Ltd. | | | 10,500 | | | | 53,761 | |
|
Japan—(Continued) | |
Furusato Industries, Ltd. | | | 4,600 | | | | 55,438 | |
Furuya Metal Co., Ltd. | | | 1,700 | | | | 23,741 | |
Fuso Chemical Co., Ltd. | | | 4,000 | | | | 57,424 | |
Fuso Pharmaceutical Industries, Ltd. | | | 31,000 | | | | 82,617 | |
Futaba Corp. | | | 10,200 | | | | 193,346 | |
Futaba Industrial Co., Ltd. | | | 23,600 | | | | 110,776 | |
Future Corp. | | | 8,400 | | | | 61,170 | |
Fuyo General Lease Co., Ltd. | | | 8,000 | | | | 323,164 | |
G-Tekt Corp. | | | 7,700 | | | | 93,524 | |
Gakken Holdings Co., Ltd. | | | 28,000 | | | | 68,229 | |
GCA Savvian Corp. | | | 4,900 | | | | 41,388 | |
Gecoss Corp. | | | 6,400 | | | | 62,046 | |
Genki Sushi Co., Ltd. | | | 1,600 | | | | 32,730 | |
Genky Stores, Inc. (a) | | | 1,200 | | | | 43,938 | |
Geo Holdings Corp. (a) | | | 13,500 | | | | 180,809 | |
GLOBERIDE, Inc. | | | 3,500 | | | | 57,204 | |
Glory, Ltd. | | | 9,500 | | | | 256,512 | |
GMO Click Holdings, Inc. (a) | | | 1,800 | | | | 12,135 | |
GMO internet, Inc. (a) | | | 20,400 | | | | 211,317 | |
GMO Payment Gateway, Inc. (a) | | | 2,600 | | | | 148,060 | |
Godo Steel, Ltd. | | | 50,000 | | | | 73,758 | |
Goldcrest Co., Ltd. | | | 8,230 | | | | 129,441 | |
Grandy House Corp. | | | 3,600 | | | | 10,963 | |
Gree, Inc. (a) | | | 26,400 | | | | 148,802 | |
GSI Creos Corp. | | | 28,000 | | | | 25,337 | |
Gulliver International Co., Ltd. (a) | | | 20,400 | | | | 165,841 | |
Gun-Ei Chemical Industry Co., Ltd. | | | 24,000 | | | | 65,076 | |
Gunze, Ltd. | | | 69,000 | | | | 192,647 | |
Gurunavi, Inc. | | | 8,500 | | | | 244,576 | |
H-One Co., Ltd. | | | 6,000 | | | | 28,185 | |
Hagihara Industries, Inc. | | | 2,900 | | | | 70,931 | |
Hakudo Co., Ltd. | | | 500 | | | | 5,150 | |
Hakuto Co., Ltd. | | | 7,100 | | | | 59,159 | |
Hakuyosha Co., Ltd. (a) | | | 800 | | | | 19,328 | |
Hamakyorex Co., Ltd. | | | 5,600 | | | | 103,159 | |
Hanwa Co., Ltd. | | | 84,000 | | | | 435,567 | |
Happinet Corp. | | | 5,000 | | | | 41,657 | |
Hard Off Corp. Co., Ltd. | | | 4,900 | | | | 59,191 | |
Harima Chemicals Group, Inc. | | | 7,100 | | | | 34,884 | |
Harmonic Drive Systems, Inc. (a) | | | 4,500 | | | | 127,038 | |
Haruyama Trading Co., Ltd. | | | 5,400 | | | | 38,213 | |
Hazama Ando Corp. (a) | | | 54,490 | | | | 300,611 | |
Heiwa Corp. | | | 200 | | | | 4,035 | |
Heiwa Real Estate Co., Ltd. | | | 16,900 | | | | 213,558 | |
Heiwado Co., Ltd. | | | 11,200 | | | | 216,923 | |
HI-LEX Corp. | | | 7,700 | | | | 180,400 | |
Hibiya Engineering, Ltd. | | | 8,700 | | | | 128,376 | |
Hiday Hidaka Corp. | | | 4,039 | | | | 97,776 | |
Himaraya Co., Ltd. | | | 2,600 | | | | 23,680 | |
Hioki EE Corp. (a) | | | 2,300 | | | | 43,441 | |
Hiramatsu, Inc. | | | 8,300 | | | | 51,718 | |
Hirano Tecseed Co., Ltd. | | | 500 | | | | 4,136 | |
Hisaka Works, Ltd. | | | 11,000 | | | | 90,412 | |
Hitachi Koki Co., Ltd. | | | 21,200 | | | | 126,355 | |
Hitachi Kokusai Electric, Inc. (a) | | | 18,000 | | | | 298,943 | |
Hitachi Transport System, Ltd. | | | 10,800 | | | | 176,656 | |
Hitachi Zosen Corp. | | | 61,600 | | | | 295,951 | |
See accompanying notes to financial statements.
MSF-19
Metropolitan Series Fund
Met/Dimensional International Small Company Portfolio
Schedule of Investments as of June 30, 2016 (Unaudited)
Common Stocks—(Continued)
| | | | | | | | |
| Security Description | | Shares | | | Value | |
|
Japan—(Continued) | |
Hochiki Corp. (a) | | | 10,000 | | | $ | 109,670 | |
Hodogaya Chemical Co., Ltd. (a) | | | 28,000 | | | | 74,542 | |
Hogy Medical Co., Ltd. (a) | | | 5,100 | | | | 354,072 | |
Hokkaido Electric Power Co., Inc. | | | 20,900 | | | | 168,340 | |
Hokkaido Gas Co., Ltd. | | | 27,000 | | | | 72,261 | |
Hokkan Holdings, Ltd. | | | 25,000 | | | | 72,812 | |
Hokko Chemical Industry Co., Ltd. | | | 8,000 | | | | 21,996 | |
Hokkoku Bank, Ltd. (The) | | | 109,000 | | | | 293,620 | |
Hokuetsu Bank, Ltd. (The) | | | 96,000 | | | | 162,459 | |
Hokuetsu Industries Co., Ltd. (a) | | | 7,000 | | | | 39,059 | |
Hokuetsu Kishu Paper Co., Ltd. | | | 58,300 | | | | 400,192 | |
Hokuriku Electric Industry Co., Ltd. | | | 28,000 | | | | 29,553 | |
Hokuriku Electrical Construction Co., Ltd. | | | 3,000 | | | | 20,744 | |
Hokuriku Gas Co., Ltd. | | | 10,000 | | | | 25,096 | |
Hokuto Corp. | | | 7,100 | | | | 130,254 | |
Honeys Co., Ltd. | | | 6,930 | | | | 75,611 | |
Hoosiers Holdings Co., Ltd. | | | 12,700 | | | | 67,318 | |
Horiba, Ltd. (a) | | | 12,200 | | | | 533,439 | |
Hosiden Corp. | | | 20,000 | | | | 123,777 | |
Hosokawa Micron Corp. | | | 11,000 | | | | 56,428 | |
House Foods Group, Inc. | | | 3,300 | | | | 76,161 | |
Howa Machinery, Ltd. | | | 5,700 | | | | 28,689 | |
Hurxley Corp. | | | 800 | | | | 7,378 | |
Hyakugo Bank, Ltd. (The) | | | 94,000 | | | | 323,589 | |
Hyakujushi Bank, Ltd. (The) | | | 107,000 | | | | 310,781 | |
I-Net Corp. | | | 3,200 | | | | 32,716 | |
Ibiden Co., Ltd. | | | 5,700 | | | | 64,055 | |
IBJ Leasing Co., Ltd. | | | 7,200 | | | | 123,899 | |
Ichibanya Co., Ltd. (a) | | | 1,000 | | | | 34,636 | |
Ichiken Co., Ltd. | | | 12,000 | | | | 30,656 | |
Ichikoh Industries, Ltd. | | | 16,000 | | | | 40,969 | |
ICHINEN HOLDINGS Co., Ltd. | | | 7,400 | | | | 66,187 | |
Ichiyoshi Securities Co., Ltd. (a) | | | 12,600 | | | | 89,885 | |
Icom, Inc. | | | 3,800 | | | | 74,260 | |
Idec Corp. | | | 11,300 | | | | 99,395 | |
Ihara Chemical Industry Co., Ltd. | | | 15,900 | | | | 164,468 | |
Iino Kaiun Kaisha, Ltd. (a) | | | 32,200 | | | | 118,557 | |
IJT Technology Holdings Co., Ltd. (a) | | | 9,000 | | | | 25,347 | |
Ikegami Tsushinki Co., Ltd. (a) | | | 30,000 | | | | 33,700 | |
Imagica Robot Holdings, Inc. (a) | | | 4,500 | | | | 19,733 | |
Imasen Electric Industrial | | | 7,200 | | | | 59,285 | |
Imperial Hotel, Ltd. | | | 1,300 | | | | 28,119 | |
Inaba Denki Sangyo Co., Ltd. (a) | | | 8,100 | | | | 276,203 | |
Inaba Seisakusho Co., Ltd. | | | 2,100 | | | | 27,292 | |
Inabata & Co., Ltd. | | | 17,700 | | | | 159,899 | |
Inageya Co., Ltd. (a) | | | 12,200 | | | | 160,781 | |
Ines Corp. | | | 13,900 | | | | 136,413 | |
Infocom Corp. | | | 4,000 | | | | 60,883 | |
Information Services International-Dentsu, Ltd. | | | 4,300 | | | | 66,777 | |
Innotech Corp. | | | 10,300 | | | | 42,537 | |
Intage Holdings, Inc. | | | 6,700 | | | | 101,031 | |
Internet Initiative Japan, Inc. | | | 9,800 | | | | 199,312 | |
Inui Global Logistics Co., Ltd. (a) | | | 5,355 | | | | 48,050 | |
Iriso Electronics Co., Ltd. (a) | | | 2,500 | | | | 139,218 | |
Ise Chemicals Corp. (a) | | | 8,000 | | | | 33,901 | |
Iseki & Co., Ltd. (a) | | | 84,000 | | | | 182,805 | |
|
Japan—(Continued) | |
Ishihara Sangyo Kaisha, Ltd. (c) | | | 122,000 | | | | 71,320 | |
Ishii Iron Works Co., Ltd. | | | 9,000 | | | | 12,475 | |
Ishizuka Glass Co., Ltd. | | | 5,000 | | | | 7,410 | |
IT Holdings Corp. | | | 30,500 | | | | 700,285 | |
Itfor, Inc. | | | 10,300 | | | | 49,416 | |
Itochu Enex Co., Ltd. | | | 19,400 | | | | 170,990 | |
Itochu-Shokuhin Co., Ltd. | | | 2,400 | | | | 96,066 | |
Itoham Yonekyu Holdings, Inc. (c) | | | 55,936 | | | | 574,648 | |
Itoki Corp. | | | 17,500 | | | | 96,439 | |
IwaiCosmo Holdings, Inc. | | | 7,900 | | | | 65,254 | |
Iwaki & Co., Ltd. | | | 14,000 | | | | 24,569 | |
Iwasaki Electric Co., Ltd. | | | 25,000 | | | | 32,767 | |
Iwatani Corp. (a) | | | 58,000 | | | | 327,823 | |
Iwatsuka Confectionery Co., Ltd. | | | 500 | | | | 17,176 | |
Izutsuya Co., Ltd. (c) | | | 47,000 | | | | 19,687 | |
J-Oil Mills, Inc. | | | 40,000 | | | | 132,150 | |
Jafco Co., Ltd. | | | 3,500 | | | | 86,399 | |
Jalux, Inc. | | | 2,400 | | | | 39,896 | |
Jamco Corp. (a) | | | 3,400 | | | | 61,391 | |
Janome Sewing Machine Co., Ltd. (c) | | | 7,099 | | | | 39,144 | |
Japan Aviation Electronics Industry, Ltd. | | | 7,000 | | | | 95,069 | |
Japan Communications, Inc. (a) (c) | | | 6,200 | | | | 14,006 | |
Japan Digital Laboratory Co., Ltd. | | | 8,200 | | | | 110,814 | |
Japan Display, Inc. (a) (c) | | | 60,000 | | | | 96,947 | |
Japan Drilling Co., Ltd. (a) | | | 2,100 | | | | 44,898 | |
Japan Foundation Engineering Co., Ltd. | | | 14,100 | | | | 47,010 | |
Japan Medical Dynamic Marketing, Inc. | | | 3,000 | | | | 20,207 | |
Japan Oil Transportation Co., Ltd. | | | 1,000 | | | | 2,128 | |
Japan Petroleum Exploration Co., Ltd. | | | 3,500 | | | | 70,192 | |
Japan Property Management Center Co., Ltd. | | | 1,000 | | | | 13,278 | |
Japan Pulp & Paper Co., Ltd. (a) | | | 46,000 | | | | 147,242 | |
Japan Radio Co., Ltd. | | | 20,000 | | | | 50,272 | |
Japan Steel Works, Ltd. (The) | | | 119,000 | | | | 539,926 | |
Japan Transcity Corp. | | | 29,000 | | | | 96,144 | |
Japan Wool Textile Co., Ltd. (The) | | | 23,000 | | | | 158,668 | |
Jastec Co., Ltd. (a) | | | 5,100 | | | | 47,604 | |
JBCC Holdings, Inc. | | | 7,000 | | | | 44,938 | |
JCU Corp. (a) | | | 1,600 | | | | 49,060 | |
Jeol, Ltd. | | | 26,000 | | | | 99,220 | |
Jimoto Holdings, Inc. | | | 67,900 | | | | 93,507 | |
Jin Co., Ltd. (a) | | | 4,200 | | | | 163,803 | |
JK Holdings Co., Ltd. | | | 5,600 | | | | 24,616 | |
JMS Co., Ltd. | | | 15,000 | | | | 41,243 | |
Joban Kosan Co., Ltd. (a) | | | 17,000 | | | | 24,423 | |
Joshin Denki Co., Ltd. | | | 23,000 | | | | 192,695 | |
JP-Holdings, Inc. (a) | | | 17,900 | | | | 48,753 | |
JSP Corp. | | | 5,100 | | | | 101,103 | |
Juki Corp. | | | 11,200 | | | | 99,723 | |
Juroku Bank, Ltd. (The) | | | 131,000 | | | | 346,187 | |
Justsystems Corp. | | | 9,700 | | | | 80,280 | |
JVC Kenwood Corp. (a) | | | 53,300 | | | | 108,923 | |
K&O Energy Group, Inc. | | | 6,700 | | | | 84,934 | |
K’s Holdings Corp. (a) | | | 9,600 | | | | 178,461 | |
kabu.com Securities Co., Ltd. | | | 52,100 | | | | 167,580 | |
Kadokawa Dwango (c) | | | 12,508 | | | | 163,829 | |
Kaga Electronics Co., Ltd. | | | 7,200 | | | | 81,252 | |
See accompanying notes to financial statements.
MSF-20
Metropolitan Series Fund
Met/Dimensional International Small Company Portfolio
Schedule of Investments as of June 30, 2016 (Unaudited)
Common Stocks—(Continued)
| | | | | | | | |
| Security Description | | Shares | | | Value | |
|
Japan—(Continued) | |
Kakiyasu Honten Co., Ltd. (a) | | | 3,800 | | | $ | 67,731 | |
Kameda Seika Co., Ltd. | | | 4,100 | | | | 233,405 | |
Kamei Corp. | | | 13,900 | | | | 110,729 | |
Kanaden Corp. | | | 9,700 | | | | 81,748 | |
Kanagawa Chuo Kotsu Co., Ltd. | | | 18,000 | | | | 101,400 | |
Kanamoto Co., Ltd. | | | 8,800 | | | | 170,803 | |
Kandenko Co., Ltd. | | | 41,000 | | | | 333,381 | |
Kanematsu Corp. | | | 149,000 | | | | 234,269 | |
Kanematsu Electronics, Ltd. | | | 4,300 | | | | 75,515 | |
Kanemi Co., Ltd. | | | 100 | | | | 3,344 | |
Kansai Urban Banking Corp. | | | 11,000 | | | | 95,765 | |
Kanto Denka Kogyo Co., Ltd. (a) | | | 15,000 | | | | 146,629 | |
Kasai Kogyo Co., Ltd. | | | 8,600 | | | | 77,571 | |
Katakura & Co-op Agri Corp. (a) | | | 8,000 | | | | 15,340 | |
Katakura Industries Co., Ltd. | | | 11,500 | | | | 127,293 | |
Kato Sangyo Co., Ltd. | | | 7,100 | | | | 166,293 | |
Kato Works Co., Ltd. | | | 19,000 | | | | 72,840 | |
Kawada Technologies, Inc. | | | 1,500 | | | | 49,311 | |
Kawai Musical Instruments Manufacturing Co., Ltd. | | | 2,600 | | | | 49,550 | |
Kawasaki Kinkai Kisen Kaisha, Ltd. | | | 7,000 | | | | 19,113 | |
Kawasaki Kisen Kaisha, Ltd. (a) | | | 122,000 | | | | 286,482 | |
Kawasumi Laboratories, Inc. | | | 4,900 | | | | 27,629 | |
Keihanshin Building Co., Ltd. | | | 14,500 | | | | 71,803 | |
Keihin Co. Ltd/Minato-Ku Tokyo Japan | | | 23,000 | | | | 28,917 | |
Keihin Corp. | | | 17,200 | | | | 264,249 | |
Keiyo Bank, Ltd. (The) | | | 113,000 | | | | 422,923 | |
Keiyo Co., Ltd. (a) | | | 17,200 | | | | 87,239 | |
Kenko Mayonnaise Co., Ltd. | | | 3,600 | | | | 99,834 | |
KEY Coffee, Inc. (a) | | | 7,500 | | | | 138,043 | |
KFC Holdings Japan, Ltd. | | | 4,000 | | | | 71,910 | |
Kimoto Co., Ltd. (a) | | | 14,900 | | | | 21,781 | |
Kimura Chemical Plants Co., Ltd. | | | 3,300 | | | | 9,487 | |
King Jim Co., Ltd. (a) | | | 5,800 | | | | 46,067 | |
Kinki Sharyo Co., Ltd. (The) | | | 12,000 | | | | 29,145 | |
Kintetsu Department Store Co., Ltd. (c) | | | 19,000 | | | | 62,851 | |
Kintetsu World Express, Inc. | | | 10,800 | | | | 130,279 | |
Kinugawa Rubber Industrial Co., Ltd. | | | 17,000 | | | | 127,919 | |
Kissei Pharmaceutical Co., Ltd. | | | 8,100 | | | | 162,000 | |
Kita-Nippon Bank, Ltd. (The) (a) | | | 4,000 | | | | 97,525 | |
Kitagawa Iron Works Co., Ltd. | | | 31,000 | | | | 50,548 | |
Kitamura Co., Ltd. | | | 3,700 | | | | 27,927 | |
Kitano Construction Corp. | | | 22,000 | | | | 54,280 | |
Kito Corp. | | | 8,200 | | | | 64,690 | |
Kitz Corp. | | | 39,200 | | | | 186,117 | |
Kiyo Bank, Ltd. (The) | | | 33,500 | | | | 413,904 | |
KLab, Inc. (a) (c) | | | 10,600 | | | | 66,876 | |
KNT-CT Holdings Co., Ltd. (c) | | | 33,000 | | | | 45,762 | |
Koa Corp. | | | 13,800 | | | | 97,463 | |
Koatsu Gas Kogyo Co., Ltd. | | | 13,000 | | | | 76,698 | |
Kobe Bussan Co., Ltd. (a) | | | 3,600 | | | | 73,964 | |
Kobe Electric Railway Co., Ltd. (c) | | | 5,000 | | | | 17,661 | |
Kobelco Eco-Solutions Co., Ltd. (a) | | | 6,000 | | | | 22,234 | |
Kohnan Shoji Co., Ltd. | | | 13,000 | | | | 239,968 | |
Kohsoku Corp. | | | 5,400 | | | | 44,125 | |
Koike Sanso Kogyo Co., Ltd. | | | 7,000 | | | | 14,915 | |
Kojima Co., Ltd. (c) | | | 12,000 | | | | 27,807 | |
|
Japan—(Continued) | |
Kokusai Co., Ltd. (a) | | | 3,400 | | | | 27,889 | |
Kokuyo Co., Ltd. | | | 33,800 | | | | 478,802 | |
KOMAIHALTEC, Inc. | | | 24,000 | | | | 45,996 | |
Komatsu Seiren Co., Ltd. (a) | | | 16,300 | | | | 96,361 | |
Komatsu Wall Industry Co., Ltd. | | | 2,700 | | | | 39,534 | |
Komeri Co., Ltd. (a) | | | 12,300 | | | | 319,560 | |
Komori Corp. | | | 20,000 | | | | 222,138 | |
Konaka Co., Ltd. | | | 7,300 | | | | 34,478 | |
Kondotec, Inc. | | | 9,400 | | | | 68,214 | |
Konishi Co., Ltd. | | | 13,200 | | | | 169,446 | |
Konoike Transport Co., Ltd. | | | 3,200 | | | | 33,172 | |
Kosaido Co., Ltd. (c) | | | 3,700 | | | | 10,880 | |
Koshidaka Holdings Co., Ltd. | | | 2,500 | | | | 51,936 | |
Kotobuki Spirits Co., Ltd. | | | 6,700 | | | | 221,059 | |
Kourakuen Holdings Corp. | | | 2,900 | | | | 43,176 | |
Krosaki Harima Corp. | | | 24,000 | | | | 55,532 | |
KRS Corp. | | | 2,200 | | | | 56,689 | |
KU Holdings Co., Ltd. | | | 8,000 | | | | 54,882 | |
Kumagai Gumi Co., Ltd. | | | 91,000 | | | | 256,146 | |
Kura Corp. | | | 3,300 | | | | 193,124 | |
Kurabo Industries, Ltd. | | | 93,000 | | | | 164,549 | |
Kureha Corp. (a) | | | 52,000 | | | | 181,787 | |
Kurimoto, Ltd. | | | 35,000 | | | | 53,116 | |
Kuroda Electric Co., Ltd. (a) | | | 13,800 | | | | 235,654 | |
Kusuri No. Aoki Co., Ltd. (a) | | | 4,900 | | | | 317,270 | |
KYB Corp. | | | 74,000 | | | | 238,130 | |
Kyodo Printing Co., Ltd. (a) | | | 51,000 | | | | 156,239 | |
Kyoei Steel, Ltd. | | | 6,100 | | | | 92,783 | |
Kyokuto Boeki Kaisha, Ltd. | | | 9,000 | | | | 15,975 | |
Kyokuto Kaihatsu Kogyo Co., Ltd. | | | 11,400 | | | | 106,600 | |
Kyokuto Securities Co., Ltd. (a) | | | 7,600 | | | | 80,005 | |
Kyokuyo Co., Ltd. (a) | | | 35,000 | | | | 88,395 | |
KYORIN Holdings, Inc. | | | 16,100 | | | | 314,228 | |
Kyoritsu Maintenance Co., Ltd. (a) | | | 3,259 | | | | 216,432 | |
Kyoritsu Printing Co., Ltd. | | | 6,800 | | | | 19,399 | |
Kyosan Electric Manufacturing Co., Ltd. (a) | | | 29,000 | | | | 93,989 | |
Kyowa Electronic Instruments Co., Ltd. | | | 8,000 | | | | 25,272 | |
Kyowa Exeo Corp. | | | 32,300 | | | | 401,071 | |
Kyowa Leather Cloth Co., Ltd. | | | 3,300 | | | | 25,806 | |
Kyudenko Corp. (a) | | | 12,500 | | | | 368,358 | |
Kyushu Financial Group, Inc. | | | 124,300 | | | | 616,360 | |
LAC Co., Ltd. (a) | | | 5,900 | | | | 52,151 | |
Land Business Co., Ltd. | | | 7,100 | | | | 17,183 | |
Lasertec Corp. (a) | | | 6,100 | | | | 74,154 | |
LEC, Inc. | | | 3,400 | | | | 59,236 | |
Leopalace21 Corp. | | | 82,400 | | | | 575,605 | |
Life Corp. | | | 9,200 | | | | 247,135 | |
Link And Motivation, Inc. (a) | | | 8,900 | | | | 18,471 | |
Lintec Corp. | | | 17,100 | | | | 334,221 | |
Livesense, Inc. (a) (c) | | | 3,500 | | | | 14,865 | |
Look, Inc. | | | 11,000 | | | | 13,938 | |
M&A Capital Partners Co., Ltd. (c) | | | 700 | | | | 16,163 | |
Macnica Fuji Electronics Holdings, Inc. | | | 16,350 | | | | 168,345 | |
Maeda Corp. | | | 40,000 | | | | 311,358 | |
Maeda Kosen Co., Ltd. | | | 5,700 | | | | 53,279 | |
Maeda Road Construction Co., Ltd. | | | 21,000 | | | | 356,322 | |
Maezawa Kasei Industries Co., Ltd. | | | 6,800 | | | | 66,613 | |
See accompanying notes to financial statements.
MSF-21
Metropolitan Series Fund
Met/Dimensional International Small Company Portfolio
Schedule of Investments as of June 30, 2016 (Unaudited)
Common Stocks—(Continued)
| | | | | | | | |
| Security Description | | Shares | | | Value | |
|
Japan—(Continued) | |
Maezawa Kyuso Industries Co., Ltd. | | | 5,600 | | | $ | 71,614 | |
Makino Milling Machine Co., Ltd. | | | 40,000 | | | | 202,795 | |
Mamiya-Op Co., Ltd. | | | 19,000 | | | | 20,583 | |
Mandom Corp. | | | 5,200 | | | | 238,093 | |
Mani, Inc. (a) | | | 5,700 | | | | 96,877 | |
Mars Engineering Corp. | | | 3,600 | | | | 74,060 | |
Marubun Corp. | | | 8,200 | | | | 46,476 | |
Marudai Food Co., Ltd. | | | 51,000 | | | | 242,364 | |
Maruei Department Store Co., Ltd. (c) | | | 8,000 | | | | 6,317 | |
Marufuji Sheet Piling Co., Ltd. | | | 13,000 | | | | 27,653 | |
Maruha Nichiro Corp. | | | 16,700 | | | | 452,483 | |
Maruka Machinery Co., Ltd. | | | 2,900 | | | | 31,708 | |
Marusan Securities Co., Ltd. (a) | | | 7,600 | | | | 64,990 | |
Maruwa Co., Ltd. | | | 3,700 | | | | 108,135 | |
Maruyama Manufacturing Co., Inc. | | | 15,000 | | | | 23,832 | |
Maruzen CHI Holdings Co., Ltd. (c) | | | 15,500 | | | | 57,407 | |
Maruzen Showa Unyu Co., Ltd. | | | 28,000 | | | | 102,443 | |
Marvelous, Inc. (a) | | | 9,500 | | | | 77,433 | |
Matsuda Sangyo Co., Ltd. | | | 7,000 | | | | 86,225 | |
Matsui Construction Co., Ltd. | | | 9,000 | | | | 94,523 | |
Matsuya Foods Co., Ltd. | | | 2,500 | | | | 65,817 | |
Max Co., Ltd. | | | 17,000 | | | | 192,876 | |
Maxvalu Nishinihon Co., Ltd. | | | 2,400 | | | | 35,969 | |
Maxvalu Tokai Co., Ltd. (a) | | | 5,000 | | | | 82,558 | |
MEC Co., Ltd. | | | 7,300 | | | | 65,283 | |
Medical System Network Co., Ltd. | | | 5,300 | | | | 25,260 | |
Megachips Corp. (a) | | | 7,600 | | | | 83,611 | |
Megmilk Snow Brand Co., Ltd. | | | 13,500 | | | | 468,998 | |
Meidensha Corp. | | | 58,000 | | | | 187,400 | |
Meiji Shipping Co., Ltd. | | | 8,500 | | | | 25,582 | |
Meiko Electronics Co., Ltd. (a) (c) | | | 7,500 | | | | 26,285 | |
Meiko Network Japan Co., Ltd. | | | 7,200 | | | | 87,341 | |
Meisei Industrial Co., Ltd. | | | 17,000 | | | | 73,010 | |
Meitec Corp. | | | 9,500 | | | | 321,043 | |
Meito Sangyo Co., Ltd. | | | 4,500 | | | | 56,641 | |
Meiwa Corp. | | | 10,900 | | | | 32,168 | |
Meiwa Estate Co., Ltd. | | | 5,200 | | | | 28,202 | |
Melco Holdings, Inc. | | | 4,500 | | | | 91,834 | |
Michinoku Bank, Ltd. (The) (a) | | | 69,000 | | | | 120,189 | |
Micronics Japan Co., Ltd. (a) | | | 8,600 | | | | 75,750 | |
Mie Bank, Ltd. (The) | | | 43,000 | | | | 74,172 | |
Mikuni Corp. | | | 3,000 | | | | 8,512 | |
Milbon Co., Ltd. | | | 3,660 | | | | 164,227 | |
Mimasu Semiconductor Industry Co., Ltd. | | | 8,200 | | | | 76,650 | |
Minato Bank, Ltd. (The) | | | 63,000 | | | | 93,372 | |
Ministop Co., Ltd. | | | 5,400 | | | | 87,328 | |
Miraial Co., Ltd. | | | 2,900 | | | | 20,217 | |
Mirait Holdings Corp. | | | 24,400 | | | | 239,374 | |
Miroku Jyoho Service Co., Ltd. | | | 5,900 | | | | 83,618 | |
Misawa Homes Co., Ltd. | | | 11,400 | | | | 76,793 | |
Mitani Corp. | | | 9,100 | | | | 245,978 | |
Mitani Sekisan Co., Ltd. | | | 4,100 | | | | 83,204 | |
Mito Securities Co., Ltd. | | | 24,000 | | | | 54,079 | |
Mitsuba Corp. | | | 13,200 | | | | 141,342 | |
Mitsubishi Nichiyu Forklift Co., Ltd. | | | 8,000 | | | | 44,825 | |
Mitsubishi Paper Mills, Ltd. (c) | | | 144,000 | | | | 99,414 | |
Mitsubishi Pencil Co., Ltd. | | | 5,900 | | | | 275,637 | |
|
Japan—(Continued) | |
Mitsubishi Research Institute, Inc. | | | 2,700 | | | | 82,215 | |
Mitsubishi Shokuhin Co., Ltd. | | | 4,800 | | | | 125,595 | |
Mitsubishi Steel Manufacturing Co., Ltd. | | | 65,000 | | | | 97,729 | |
Mitsuboshi Belting, Ltd. | | | 22,000 | | | | 170,867 | |
Mitsui Engineering & Shipbuilding Co., Ltd. | | | 300,000 | | | | 411,770 | |
Mitsui High-Tec, Inc. | | | 11,600 | | | | 70,680 | |
Mitsui Home Co., Ltd. (a) | | | 14,000 | | | | 59,047 | |
Mitsui Matsushima Co., Ltd. | | | 66,000 | | | | 65,506 | |
Mitsui Mining & Smelting Co., Ltd. | | | 242,000 | | | | 400,663 | |
Mitsui Sugar Co., Ltd. | | | 36,000 | | | | 170,055 | |
Mitsui-Soko Holdings Co., Ltd. (a) | | | 47,000 | | | | 125,331 | |
Mitsumi Electric Co., Ltd. (a) (c) | | | 33,000 | | | | 132,727 | |
Mitsumura Printing Co., Ltd. | | | 5,000 | | | | 8,884 | |
Mitsuuroko Group Holdings Co., Ltd. | | | 12,900 | | | | 62,004 | |
Miyaji Engineering Group, Inc. (a) | | | 27,000 | | | | 34,857 | |
Miyazaki Bank, Ltd. (The) | | | 73,000 | | | | 181,184 | |
Miyoshi Oil & Fat Co., Ltd. | | | 40,000 | | | | 45,996 | |
Mizuno Corp. (a) | | | 37,000 | | | | 172,940 | |
Mochida Pharmaceutical Co., Ltd. | | | 3,500 | | | | 281,534 | |
Modec, Inc. | | | 3,000 | | | | 45,927 | |
Monex Group, Inc. (a) | | | 73,600 | | | | 165,427 | |
Money Partners Group Co., Ltd. (a) | | | 7,100 | | | | 34,853 | |
Monogatari Corp. (The) | | | 1,700 | | | | 86,251 | |
MORESCO Corp. | | | 2,500 | | | | 26,671 | |
Morinaga & Co., Ltd. | | | 60,000 | | | | 374,808 | |
Morinaga Milk Industry Co., Ltd. | | | 70,000 | | | | 485,198 | |
Morita Holdings Corp. | | | 12,500 | | | | 164,110 | |
Morozoff, Ltd. | | | 13,000 | | | | 54,033 | |
Mory Industries, Inc. | | | 14,000 | | | | 40,332 | |
Mr Max Corp. | | | 10,500 | | | | 27,737 | |
MTI, Ltd. | | | 9,200 | | | | 58,521 | |
Mugen Estate Co., Ltd. | | | 400 | | | | 3,821 | |
Murakami Corp. (a) | | | 3,000 | | | | 42,335 | |
Musashi Seimitsu Industry Co., Ltd. | | | 7,900 | | | | 154,267 | |
Musashino Bank, Ltd. (The) | | | 12,600 | | | | 284,854 | |
Mutoh Holdings Co., Ltd. | | | 9,000 | | | | 19,283 | |
NAC Co., Ltd. | | | 3,600 | | | | 29,461 | |
Nachi-Fujikoshi Corp. (a) | | | 60,000 | | | | 182,058 | |
Nafco Co., Ltd. | | | 1,400 | | | | 21,173 | |
Nagaileben Co., Ltd. | | | 5,600 | | | | 134,592 | |
Nagano Bank, Ltd. (The) | | | 43,000 | | | | 79,989 | |
Nagano Keiki Co., Ltd. | | | 4,200 | | | | 23,314 | |
Nagase & Co., Ltd. | | | 2,600 | | | | 28,610 | |
Nagatanien Holdings Co., Ltd. | | | 12,000 | | | | 142,673 | |
Nagawa Co., Ltd. (a) | | | 2,800 | | | | 91,460 | |
Nakabayashi Co., Ltd. | | | 24,000 | | | | 55,710 | |
Nakamuraya Co., Ltd. | | | 19,000 | | | | 84,309 | |
Nakanishi, Inc. | | | 4,100 | | | | 120,579 | |
Nakano Corp. | | | 4,000 | | | | 16,242 | |
Nakayama Steel Works, Ltd. (c) | | | 63,000 | | | | 30,673 | |
Nakayamafuku Co., Ltd. | | | 2,000 | | | | 15,098 | |
Namura Shipbuilding Co., Ltd. | | | 18,956 | | | | 103,865 | |
Nanto Bank, Ltd. (The) | | | 97,000 | | | | 308,710 | |
Narasaki Sangyo Co., Ltd. | | | 4,000 | | | | 9,560 | |
Natori Co., Ltd. | | | 2,600 | | | | 38,823 | |
NDS Co., Ltd. | | | 27,000 | | | | 66,240 | |
NEC Capital Solutions, Ltd. | | | 3,800 | | | | 51,962 | |
See accompanying notes to financial statements.
MSF-22
Metropolitan Series Fund
Met/Dimensional International Small Company Portfolio
Schedule of Investments as of June 30, 2016 (Unaudited)
Common Stocks—(Continued)
| | | | | | | | |
| Security Description | | Shares | | | Value | |
|
Japan—(Continued) | |
NEC Networks & System Integration Corp. | | | 9,100 | | | $ | 160,210 | |
NET One Systems Co., Ltd. | | | 31,600 | | | | 181,549 | |
Neturen Co., Ltd. | | | 9,800 | | | | 68,870 | |
New Japan Chemical Co., Ltd. (a) (c) | | | 9,900 | | | | 13,573 | |
New Japan Radio Co., Ltd. (c) | | | 6,000 | | | | 21,623 | |
Next Co., Ltd. (a) | | | 17,000 | | | | 151,425 | |
Nexyz Group Corp. | | | 1,300 | | | | 18,340 | |
Nice Holdings, Inc. (a) | | | 40,000 | | | | 53,891 | |
Nichi-iko Pharmaceutical Co., Ltd. | | | 13,200 | | | | 267,549 | |
Nichia Steel Works, Ltd. | | | 13,000 | | | | 27,352 | |
Nichias Corp. | | | 33,000 | | | | 251,267 | |
Nichiban Co., Ltd. | | | 8,000 | | | | 59,836 | |
Nichicon Corp. | | | 23,900 | | | | 154,544 | |
Nichiden Corp. | | | 3,100 | | | | 94,684 | |
Nichiha Corp. | | | 9,600 | | | | 151,077 | |
NichiiGakkan Co., Ltd. (a) | | | 17,500 | | | | 118,089 | |
Nichimo Co., Ltd. | | | 16,000 | | | | 24,572 | |
Nichirei Corp. | | | 68,000 | | | | 621,447 | |
Nichireki Co., Ltd. | | | 9,000 | | | | 55,834 | |
Nifco, Inc. (a) | | | 5,300 | | | | 275,905 | |
Nihon Chouzai Co., Ltd. (a) | | | 1,660 | | | | 82,175 | |
Nihon Dempa Kogyo Co., Ltd. (a) | | | 7,600 | | | | 63,114 | |
Nihon Eslead Corp. | | | 2,700 | | | | 26,231 | |
Nihon House Holdings Co., Ltd. (a) | | | 15,000 | | | | 45,988 | |
Nihon Kagaku Sangyo Co., Ltd. | | | 3,000 | | | | 21,754 | |
Nihon Kohden Corp. | | | 600 | | | | 16,812 | |
Nihon M&A Center, Inc. (a) | | | 6,900 | | | | 445,032 | |
Nihon Nohyaku Co., Ltd. (a) | | | 14,000 | | | | 62,673 | |
Nihon Parkerizing Co., Ltd. | | | 31,600 | | | | 330,907 | |
Nihon Plast Co., Ltd. | | | 2,500 | | | | 20,356 | |
Nihon Tokushu Toryo Co., Ltd. | | | 2,200 | | | | 22,562 | |
Nihon Trim Co., Ltd. | | | 1,300 | | | | 89,570 | |
Nihon Unisys, Ltd. | | | 16,900 | | | | 207,923 | |
Nihon Yamamura Glass Co., Ltd. | | | 45,000 | | | | 66,572 | |
Nikkato Corp. | | | 300 | | | | 1,064 | |
Nikkiso Co., Ltd. | | | 21,500 | | | | 138,305 | |
Nikko Co., Ltd. | | | 9,000 | | | | 26,063 | |
Nikkon Holdings Co., Ltd. | | | 22,600 | | | | 404,124 | |
Nippon Air Conditioning Services Co., Ltd. | | | 9,600 | | | | 48,054 | |
Nippon Beet Sugar Manufacturing Co., Ltd. | | | 50,000 | | | | 89,020 | |
Nippon Carbide Industries Co., Inc. (a) | | | 23,000 | | | | 31,149 | |
Nippon Carbon Co., Ltd. (a) | | | 39,000 | | | | 73,454 | |
Nippon Ceramic Co., Ltd. (a) | | | 5,200 | | | | 97,372 | |
Nippon Chemi-Con Corp. | | | 59,000 | | | | 71,568 | |
Nippon Chemical Industrial Co., Ltd. | | | 30,000 | | | | 57,495 | |
Nippon Chemiphar Co., Ltd. | | | 8,000 | | | | 35,791 | |
Nippon Coke & Engineering Co., Ltd. | | | 71,000 | | | | 42,912 | |
Nippon Commercial Development Co., Ltd. | | | 400 | | | | 5,856 | |
Nippon Concrete Industries Co., Ltd. | | | 14,000 | | | | 38,667 | |
Nippon Denko Co., Ltd. (a) | | | 56,465 | | | | 86,032 | |
Nippon Densetsu Kogyo Co., Ltd. | | | 14,100 | | | | 236,557 | |
Nippon Felt Co., Ltd. | | | 8,600 | | | | 39,122 | |
Nippon Filcon Co., Ltd. | | | 5,200 | | | | 20,825 | |
Nippon Fine Chemical Co., Ltd. | | | 5,800 | | | | 40,827 | |
Nippon Flour Mills Co., Ltd. | | | 45,000 | | | | 350,297 | |
Nippon Gas Co., Ltd. | | | 9,600 | | | | 207,439 | |
Nippon Hume Corp. | | | 8,200 | | | | 42,907 | |
|
Japan—(Continued) | |
Nippon Kanzai Co., Ltd. | | | 4,800 | | | | 75,791 | |
Nippon Kasei Chemical Co., Ltd. | | | 18,000 | | | | 18,389 | |
Nippon Kayaku Co., Ltd. (a) | | | 13,000 | | | | 128,195 | |
Nippon Kinzoku Co., Ltd. (c) | | | 19,000 | | | | 16,684 | |
Nippon Kodoshi Corp. | | | 1,600 | | | | 11,659 | |
Nippon Koei Co., Ltd. (a) | | | 31,000 | | | | 93,887 | |
Nippon Koshuha Steel Co., Ltd. (a) | | | 31,000 | | | | 19,934 | |
Nippon Light Metal Holdings Co., Ltd. (a) | | | 198,000 | | | | 436,927 | |
Nippon Paper Industries Co., Ltd. | | | 7,000 | | | | 121,985 | |
Nippon Parking Development Co., Ltd. (a) | | | 65,100 | | | | 78,130 | |
Nippon Pillar Packing Co., Ltd. | | | 9,600 | | | | 85,917 | |
Nippon Piston Ring Co., Ltd. | | | 3,200 | | | | 42,899 | |
Nippon Rietec Co., Ltd. | | | 7,000 | | | | 60,192 | |
Nippon Road Co., Ltd. (The) | | | 27,000 | | | | 103,343 | |
Nippon Seiki Co., Ltd. | | | 15,000 | | | | 243,802 | |
Nippon Seisen Co., Ltd. | | | 10,000 | | | | 39,381 | |
Nippon Sharyo, Ltd. (a) (c) | | | 26,000 | | | | 68,059 | |
Nippon Sheet Glass Co., Ltd. (a) (c) | | | 330,000 | | | | 206,413 | |
Nippon Signal Co., Ltd. | | | 20,700 | | | | 161,023 | |
Nippon Soda Co., Ltd. (a) | | | 50,000 | | | | 200,324 | |
Nippon Steel & Sumikin Bussan Corp. | | | 51,960 | | | | 167,039 | |
Nippon Suisan Kaisha, Ltd. | | | 80,500 | | | | 411,235 | |
Nippon Synthetic Chemical Industry Co., Ltd. (The) | | | 18,000 | | | | 91,091 | |
Nippon Systemware Co., Ltd. | | | 1,300 | | | | 13,245 | |
Nippon Thompson Co., Ltd. | | | 27,000 | | | | 81,747 | |
Nippon Valqua Industries, Ltd. | | | 30,000 | | | | 76,273 | |
Nippon Yakin Kogyo Co., Ltd. | | | 54,000 | | | | 62,423 | |
Nipro Corp. (a) | | | 38,800 | | | | 479,569 | |
Nishi-Nippon Railroad Co., Ltd. | | | 47,000 | | | | 243,400 | |
Nishikawa Rubber Co., Ltd. (a) | | | 1,200 | | | | 18,927 | |
Nishimatsu Construction Co., Ltd. | | | 104,000 | | | | 482,353 | |
Nishimatsuya Chain Co., Ltd. | | | 16,100 | | | | 227,365 | |
Nishio Rent All Co., Ltd. | | | 4,400 | | | | 90,475 | |
Nissan Shatai Co., Ltd. | | | 1,300 | | | | 12,974 | |
Nissan Tokyo Sales Holdings Co., Ltd. | | | 11,000 | | | | 23,046 | |
Nissei ASB Machine Co., Ltd. (a) | | | 2,100 | | | | 34,872 | |
Nissei Build Kogyo Co., Ltd. | | | 18,000 | | | | 92,538 | |
Nissei Corp. | | | 3,700 | | | | 34,358 | |
Nissei Plastic Industrial Co., Ltd. | | | 7,100 | | | | 42,965 | |
Nissha Printing Co., Ltd. (a) | | | 8,700 | | | | 160,054 | |
Nisshin Fudosan Co. | | | 15,200 | | | | 52,829 | |
Nisshin Oillio Group, Ltd. (The) | | | 51,000 | | | | 234,055 | |
Nisshin Steel Co., Ltd. | | | 35,596 | | | | 452,025 | |
Nisshinbo Holdings, Inc. | | | 47,000 | | | | 424,205 | |
Nissin Corp. | | | 30,000 | | | | 89,341 | |
Nissin Electric Co., Ltd. | | | 14,800 | | | | 218,554 | |
Nissin Kogyo Co., Ltd. | | | 16,400 | | | | 209,439 | |
Nissui Pharmaceutical Co., Ltd. (a) | | | 6,000 | | | | 65,726 | |
Nitta Corp. | | | 6,800 | | | | 153,322 | |
Nitta Gelatin, Inc. | | | 4,500 | | | | 32,950 | |
Nittan Valve Co., Ltd. | | | 6,300 | | | | 19,046 | |
Nittetsu Mining Co., Ltd. | | | 25,000 | | | | 80,366 | |
Nitto Boseki Co., Ltd. | | | 49,000 | | | | 164,708 | |
Nitto FC Co., Ltd. | | | 4,500 | | | | 36,235 | |
Nitto Fuji Flour Milling Co., Ltd. | | | 4,000 | | | | 13,072 | |
Nitto Kogyo Corp. | | | 9,000 | | | | 111,122 | |
See accompanying notes to financial statements.
MSF-23
Metropolitan Series Fund
Met/Dimensional International Small Company Portfolio
Schedule of Investments as of June 30, 2016 (Unaudited)
Common Stocks—(Continued)
| | | | | | | | |
| Security Description | | Shares | | | Value | |
|
Japan—(Continued) | |
Nitto Kohki Co., Ltd. | | | 4,700 | | | $ | 99,482 | |
Nitto Seiko Co., Ltd. | | | 15,000 | | | | 40,058 | |
Nittoc Construction Co., Ltd. (a) | | | 13,550 | | | | 51,837 | |
Nittoku Engineering Co., Ltd. | | | 5,200 | | | | 66,838 | |
NJS Co., Ltd. | | | 3,300 | | | | 36,255 | |
Noevir Holdings Co., Ltd. | | | 4,800 | | | | 145,917 | |
NOF Corp. | | | 52,000 | | | | 429,402 | |
Nohmi Bosai, Ltd. | | | 7,000 | | | | 92,969 | |
Nojima Corp. | | | 4,200 | | | | 68,733 | |
Nomura Co., Ltd. | | | 12,000 | | | | 180,280 | |
Noritake Co., Ltd. | | | 56,000 | | | | 127,112 | |
Noritsu Koki Co., Ltd. | | | 4,000 | | | | 27,815 | |
Noritz Corp. | | | 12,400 | | | | 220,441 | |
North Pacific Bank, Ltd. | | | 122,400 | | | | 331,648 | |
NS Solutions Corp. | | | 10,200 | | | | 156,940 | |
NS United Kaiun Kaisha, Ltd. | | | 41,000 | | | | 51,764 | |
NSD Co., Ltd. | | | 10,670 | | | | 169,146 | |
NTN Corp. | | | 14,000 | | | | 37,448 | |
Nuflare Technology, Inc. (a) | | | 800 | | | | 37,883 | |
Obara Group, Inc. | | | 4,400 | | | | 163,450 | |
Obayashi Road Corp. | | | 10,000 | | | | 61,972 | |
Odelic Co., Ltd. | | | 1,000 | | | | 34,049 | |
Oenon Holdings, Inc. | | | 21,000 | | | | 40,579 | |
Ogaki Kyoritsu Bank, Ltd. (The) | | | 140,000 | | | | 386,461 | |
Ohara, Inc. | | | 4,700 | | | | 22,525 | |
Ohashi Technica, Inc. | | | 4,600 | | | | 54,528 | |
Ohsho Food Service Corp. (a) | | | 3,600 | | | | 129,252 | |
Oiles Corp. | | | 9,100 | | | | 142,795 | |
Oita Bank, Ltd. (The) | | | 75,000 | | | | 215,197 | |
Oizumi Corp. | | | 2,900 | | | | 10,662 | |
Okabe Co., Ltd. (a) | | | 16,000 | | | | 113,537 | |
Okamoto Industries, Inc. | | | 22,000 | | | | 237,504 | |
Okamoto Machine Tool Works, Ltd. | | | 14,000 | | | | 15,015 | |
Okamura Corp. | | | 26,300 | | | | 260,687 | |
Okaya Electric Industries Co., Ltd. | | | 8,900 | | | | 31,109 | |
Oki Electric Industry Co., Ltd. | | | 227,000 | | | | 301,923 | |
Okinawa Cellular Telephone Co. | | | 4,900 | | | | 144,168 | |
Okinawa Electric Power Co., Inc. (The) | | | 12,825 | | | | 268,209 | |
OKK Corp. | | | 41,000 | | | | 38,852 | |
OKUMA Corp. | | | 50,000 | | | | 326,655 | |
Okumura Corp. | | | 63,000 | | | | 346,745 | |
Okura Industrial Co., Ltd. | | | 26,000 | | | | 70,622 | |
Okuwa Co., Ltd. | | | 10,000 | | | | 103,815 | |
Olympic Group Corp. | | | 4,900 | | | | 23,110 | |
ONO Sokki Co., Ltd. | | | 4,200 | | | | 32,391 | |
Onoken Co., Ltd. | | | 7,400 | | | | 82,980 | |
Onward Holdings Co., Ltd. | | | 49,000 | | | | 303,591 | |
Open House Co., Ltd. | | | 4,200 | | | | 114,008 | |
OPT Holding, Inc. | | | 4,700 | | | | 35,218 | |
Optex Co., Ltd. | | | 4,700 | | | | 120,072 | |
Organo Corp. | | | 18,000 | | | | 67,507 | |
Origin Electric Co., Ltd. | | | 17,000 | | | | 42,748 | |
Osaka Organic Chemical Industry, Ltd. | | | 5,900 | | | | 30,872 | |
Osaka Soda Co., Ltd. | | | 30,000 | | | | 120,037 | |
Osaka Steel Co., Ltd. (a) | | | 5,900 | | | | 102,454 | |
OSAKA Titanium Technologies Co., Ltd. (a) | | | 5,600 | | | | 67,982 | |
Osaki Electric Co., Ltd. | | | 11,000 | | | | 84,458 | |
|
Japan—(Continued) | |
OSG Corp. (a) | | | 22,700 | | | | 375,810 | |
Otsuka Kagu, Ltd. (a) | | | 5,500 | | | | 57,482 | |
OUG Holdings, Inc. | | | 7,000 | | | | 15,927 | |
Outsourcing, Inc. | | | 3,100 | | | | 141,564 | |
Oyo Corp. | | | 7,400 | | | | 81,270 | |
Pacific Industrial Co., Ltd. (a) | | | 17,600 | | | | 160,261 | |
Pacific Metals Co., Ltd. (a) (c) | | | 72,000 | | | | 194,706 | |
Pack Corp. (The) | | | 5,600 | | | | 143,347 | |
Pal Co., Ltd. (a) | | | 3,800 | | | | 89,172 | |
Paltac Corp. | | | 12,650 | | | | 256,000 | |
PanaHome Corp. (a) | | | 32,000 | | | | 251,191 | |
Panasonic Industrial Devices SUNX Co., Ltd. | | | 6,800 | | | | 41,149 | |
Paramount Bed Holdings Co., Ltd. | | | 6,000 | | | | 303,862 | |
Parco Co., Ltd. (a) | | | 8,100 | | | | 64,692 | |
Paris Miki Holdings, Inc. (a) | | | 17,000 | | | | 70,807 | |
Pasco Corp. (a) | | | 6,000 | | | | 17,979 | |
Pasona Group, Inc. (a) | | | 7,700 | | | | 52,823 | |
Penta-Ocean Construction Co., Ltd. | | | 90,500 | | | | 475,782 | |
PIA Corp. | | | 300 | | | | 6,183 | |
Pilot Corp. | | | 10,800 | | | | 464,895 | |
Piolax, Inc. | | | 3,500 | | | | 162,776 | |
Pioneer Corp. (a) (c) | | | 117,700 | | | | 204,575 | |
Plenus Co., Ltd. (a) | | | 7,800 | | | | 126,180 | |
Press Kogyo Co., Ltd. | | | 37,000 | | | | 122,449 | |
Pressance Corp. (a) | | | 2,600 | | | | 97,815 | |
Prestige International, Inc. | | | 6,700 | | | | 99,366 | |
Prima Meat Packers, Ltd. | | | 48,000 | | | | 144,627 | |
Pronexus, Inc. | | | 9,000 | | | | 87,841 | |
Proto Corp. | | | 5,300 | | | | 61,435 | |
PS Mitsubishi Construction Co., Ltd. | | | 8,800 | | | | 31,478 | |
Qol Co., Ltd. | | | 3,400 | | | | 44,417 | |
Raito Kogyo Co., Ltd. | | | 16,900 | | | | 175,314 | |
Rasa Industries, Ltd. (c) | | | 26,000 | | | | 24,375 | |
Relo Holdings, Inc. | | | 3,000 | | | | 525,782 | |
Renaissance, Inc. | | | 5,100 | | | | 57,169 | |
Rengo Co., Ltd. | | | 81,000 | | | | 523,594 | |
Renown, Inc. (c) | | | 29,200 | | | | 29,313 | |
Resort Solution Co., Ltd. | | | 4,000 | | | | 11,385 | |
Retail Partners Co., Ltd. | | | 1,300 | | | | 13,052 | |
Rheon Automatic Machinery Co., Ltd. (a) | | | 5,000 | | | | 26,473 | |
Rhythm Watch Co., Ltd. | | | 30,000 | | | | 49,515 | |
Riberesute Corp. | | | 4,300 | | | | 29,689 | |
Ricoh Leasing Co., Ltd. | | | 6,400 | | | | 162,554 | |
Right On Co., Ltd. (a) | | | 5,900 | | | | 76,659 | |
Riken Corp. | | | 35,000 | | | | 107,230 | |
Riken Keiki Co., Ltd. | | | 6,000 | | | | 61,945 | |
Riken Technos Corp. | | | 15,000 | | | | 62,198 | |
Riken Vitamin Co., Ltd. | | | 2,700 | | | | 125,288 | |
Ringer Hut Co., Ltd. (a) | | | 4,200 | | | | 96,571 | |
Rion Co., Ltd. | | | 2,200 | | | | 30,022 | |
Riso Kagaku Corp. | | | 9,458 | | | | 124,264 | |
Riso Kyoiku Co., Ltd. | | | 11,590 | | | | 45,255 | |
Rock Field Co., Ltd. | | | 6,600 | | | | 97,544 | |
Rohto Pharmaceutical Co., Ltd. | | | 23,000 | | | | 348,659 | |
Rokko Butter Co., Ltd. | | | 3,600 | | | | 79,373 | |
Roland DG Corp. | | | 3,000 | | | | 53,275 | |
Round One Corp. | | | 28,300 | | | | 226,479 | |
See accompanying notes to financial statements.
MSF-24
Metropolitan Series Fund
Met/Dimensional International Small Company Portfolio
Schedule of Investments as of June 30, 2016 (Unaudited)
Common Stocks—(Continued)
| | | | | | | | |
| Security Description | | Shares | | | Value | |
|
Japan—(Continued) | |
Royal Holdings Co., Ltd. (a) | | | 9,000 | | | $ | 159,764 | |
Ryobi, Ltd. | | | 47,000 | | | | 194,242 | |
Ryoden Corp. | | | 16,000 | | | | 97,854 | |
Ryosan Co., Ltd. | | | 14,000 | | | | 333,488 | |
Ryoyo Electro Corp. (a) | | | 8,600 | | | | 112,666 | |
S Foods, Inc. (a) | | | 4,100 | | | | 109,540 | |
S&B Foods, Inc. | | | 600 | | | | 26,856 | |
Sac’s Bar Holdings, Inc. | | | 6,850 | | | | 66,988 | |
Saibu Gas Co., Ltd. (a) | | | 136,000 | | | | 329,600 | |
Saizeriya Co., Ltd. | | | 10,300 | | | | 183,419 | |
Sakai Chemical Industry Co., Ltd. | | | 42,000 | | | | 113,068 | |
Sakai Heavy Industries, Ltd. | | | 14,000 | | | | 22,728 | |
Sakai Moving Service Co., Ltd. | | | 2,600 | | | | 70,804 | |
Sakai Ovex Co., Ltd. | | | 16,000 | | | | 22,307 | |
Sakata INX Corp. | | | 11,800 | | | | 134,944 | |
Sakata Seed Corp. (a) | | | 9,300 | | | | 201,035 | |
Sala Corp. (a) | | | 12,900 | | | | 73,453 | |
SAMTY Co., Ltd. | | | 2,600 | | | | 24,208 | |
San Holdings, Inc. | | | 2,500 | | | | 33,163 | |
San-A Co., Ltd. | | | 5,700 | | | | 279,881 | |
San-Ai Oil Co., Ltd. | | | 25,000 | | | | 141,689 | |
San-In Godo Bank, Ltd. (The) | | | 59,000 | | | | 383,498 | |
Sanden Holdings Corp. | | | 42,000 | | | | 113,091 | |
Sanei Architecture Planning Co., Ltd. (a) | | | 4,300 | | | | 46,841 | |
Sangetsu Co., Ltd. | | | 21,200 | | | | 395,948 | |
Sanken Electric Co., Ltd. (a) | | | 37,000 | | | | 114,041 | |
Sanki Engineering Co., Ltd. | | | 23,700 | | | | 187,556 | |
Sanko Marketing Foods Co., Ltd. | | | 3,100 | | | | 27,008 | |
Sanko Metal Industrial Co., Ltd. | | | 10,000 | | | | 27,887 | |
Sankyo Frontier Co., Ltd. | | | 2,000 | | | | 17,066 | |
Sankyo Seiko Co., Ltd. | | | 16,300 | | | | 53,015 | |
Sankyo Tateyama, Inc. | | | 11,200 | | | | 156,651 | |
Sankyu, Inc. | | | 96,000 | | | | 513,081 | |
Sanoh Industrial Co., Ltd. | | | 10,100 | | | | 53,764 | |
Sanshin Electronics Co., Ltd. | | | 12,800 | | | | 103,463 | |
Sanwa Holdings Corp. | | | 62,200 | | | | 562,149 | |
Sanyo Chemical Industries, Ltd. | | | 21,000 | | | | 163,105 | |
Sanyo Denki Co., Ltd. | | | 16,000 | | | | 72,427 | |
Sanyo Electric Railway Co., Ltd. | | | 20,000 | | | | 97,695 | |
Sanyo Housing Nagoya Co., Ltd. (a) | | | 3,000 | | | | 27,274 | |
Sanyo Industries, Ltd. | | | 13,000 | | | | 20,639 | |
Sanyo Shokai, Ltd. (a) | | | 51,000 | | | | 95,510 | |
Sanyo Special Steel Co., Ltd. | | | 47,000 | | | | 208,563 | |
Sapporo Holdings, Ltd. | | | 21,000 | | | | 605,831 | |
Sata Construction Co., Ltd. | | | 2,600 | | | | 8,997 | |
Sato Holdings Corp. | | | 6,900 | | | | 128,543 | |
Sato Restaurant Systems Co., Ltd. (a) | | | 4,800 | | | | 38,154 | |
Sato Shoji Corp. | | | 6,500 | | | | 37,899 | |
Satori Electric Co., Ltd. (a) | | | 7,100 | | | | 46,045 | |
Sawada Holdings Co., Ltd. | | | 10,300 | | | | 90,630 | |
Saxa Holdings, Inc. | | | 24,000 | | | | 44,445 | |
SBS Holdings, Inc. | | | 6,900 | | | | 49,284 | |
SCREEN Holdings Co., Ltd. | | | 48,000 | | | | 520,634 | |
Scroll Corp. | | | 13,100 | | | | 48,038 | |
SEC Carbon, Ltd. | | | 7,000 | | | | 15,639 | |
Secom Joshinetsu Co., Ltd. | | | 900 | | | | 30,220 | |
Seibu Electric Industry Co., Ltd. | | | 12,000 | | | | 45,654 | |
|
Japan—(Continued) | |
Seika Corp. | | | 28,000 | | | | 66,139 | |
Seikitokyu Kogyo Co., Ltd. | | | 12,500 | | | | 58,722 | |
Seiko Holdings Corp. | | | 44,000 | | | | 131,538 | |
Seino Holdings Co., Ltd. | | | 13,100 | | | | 119,692 | |
Seiren Co., Ltd. | | | 19,100 | | | | 179,791 | |
Sekisui Jushi Corp. | | | 12,900 | | | | 183,310 | |
Sekisui Plastics Co., Ltd. | | | 24,000 | | | | 74,681 | |
Senko Co., Ltd. | | | 31,000 | | | | 186,153 | |
Senshu Electric Co., Ltd. | | | 2,400 | | | | 36,943 | |
Senshu Ikeda Holdings, Inc. | | | 84,000 | | | | 312,824 | |
Senshukai Co., Ltd. (a) | | | 13,800 | | | | 90,887 | |
Septeni Holdings Co., Ltd. | | | 5,500 | | | | 200,224 | |
Seria Co., Ltd. | | | 3,500 | | | | 287,817 | |
Shibaura Electronics Co., Ltd. | | | 2,800 | | | | 45,769 | |
Shibaura Mechatronics Corp. | | | 18,000 | | | | 33,733 | |
Shibusawa Warehouse Co., Ltd. (The) | | | 25,000 | | | | 66,674 | |
Shibuya Corp. | | | 6,500 | | | | 108,842 | |
Shidax Corp. (a) | | | 9,600 | | | | 43,932 | |
Shiga Bank, Ltd. (The) (a) | | | 89,000 | | | | 379,924 | |
Shikibo, Ltd. | | | 56,000 | | | | 56,646 | |
Shikoku Bank, Ltd. (The) | | | 95,000 | | | | 185,455 | |
Shikoku Chemicals Corp. | | | 16,000 | | | | 124,612 | |
Shima Seiki Manufacturing, Ltd. (a) | | | 11,900 | | | | 229,175 | |
Shimachu Co., Ltd. | | | 20,500 | | | | 445,078 | |
Shimane Bank, Ltd. (The) | | | 2,500 | | | | 29,001 | |
Shimizu Bank, Ltd. (The) | | | 4,900 | | | | 106,592 | |
Shimojima Co., Ltd. | | | 6,300 | | | | 62,769 | |
Shin Nippon Air Technologies Co., Ltd. | | | 7,300 | | | | 70,295 | |
Shin-Etsu Polymer Co., Ltd. | | | 22,600 | | | | 131,523 | |
Shin-Keisei Electric Railway Co., Ltd. | | | 23,000 | | | | 85,743 | |
Shinagawa Refractories Co., Ltd. | | | 20,000 | | | | 37,193 | |
Shindengen Electric Manufacturing Co., Ltd. | | | 28,000 | | | | 88,384 | |
Shinkawa, Ltd. (c) | | | 5,300 | | | | 23,623 | |
Shinko Electric Industries Co., Ltd. | | | 27,600 | | | | 134,243 | |
Shinko Plantech Co., Ltd. | | | 16,100 | | | | 119,924 | |
Shinko Shoji Co., Ltd. (a) | | | 7,700 | | | | 73,292 | |
Shinko Wire Co., Ltd. | | | 12,000 | | | | 14,465 | |
Shinmaywa Industries, Ltd. | | | 34,000 | | | | 209,982 | |
Shinnihon Corp. | | | 11,800 | | | | 76,967 | |
Shinoken Group Co., Ltd. | | | 900 | | | | 24,138 | |
Shinsho Corp. | | | 14,000 | | | | 22,639 | |
Shinwa Co., Ltd. | | | 3,900 | | | | 51,340 | |
Ship Healthcare Holdings, Inc. | | | 14,200 | | | | 438,312 | |
Shizuki Electric Co., Inc. | | | 8,000 | | | | 43,615 | |
Shizuoka Gas Co., Ltd. | | | 21,300 | | | | 149,163 | |
Shobunsha Publications, Inc. | | | 6,700 | | | | 35,349 | |
Shochiku Co., Ltd. (a) | | | 3,000 | | | | 31,104 | |
Shoei Foods Corp. | | | 4,300 | | | | 55,316 | |
Shofu, Inc. | | | 3,900 | | | | 49,476 | |
Shoko Co., Ltd. (c) | | | 19,000 | | | | 13,140 | |
Showa Aircraft Industry Co., Ltd. | | | 4,000 | | | | 35,180 | |
Showa Corp. | | | 17,600 | | | | 98,482 | |
Showa Denko KK (a) | | | 10,600 | | | | 99,491 | |
Showa Sangyo Co., Ltd. | | | 33,000 | | | | 139,449 | |
Siix Corp. | | | 4,800 | | | | 164,534 | |
Sinanen Holdings Co., Ltd. | | | 18,000 | | | | 69,026 | |
Sinfonia Technology Co., Ltd. | | | 42,000 | | | | 68,038 | |
See accompanying notes to financial statements.
MSF-25
Metropolitan Series Fund
Met/Dimensional International Small Company Portfolio
Schedule of Investments as of June 30, 2016 (Unaudited)
Common Stocks—(Continued)
| | | | | | | | |
| Security Description | | Shares | | | Value | |
|
Japan—(Continued) | |
Sinko Industries, Ltd. | | | 6,400 | | | $ | 71,467 | |
Sintokogio, Ltd. | | | 21,100 | | | | 157,342 | |
SKY Perfect JSAT Holdings, Inc. | | | 29,800 | | | | 137,056 | |
SMK Corp. | | | 23,000 | | | | 78,625 | |
SMS Co., Ltd. | | | 7,300 | | | | 161,377 | |
SNT Corp. (a) | | | 7,800 | | | | 41,546 | |
Soda Nikka Co., Ltd. | | | 7,000 | | | | 30,903 | |
Sodick Co., Ltd. | | | 16,800 | | | | 129,786 | |
Soft99 Corp. | | | 5,100 | | | | 33,995 | |
Softbank Technology Corp. | | | 1,600 | | | | 30,539 | |
Software Service, Inc. (a) | | | 1,200 | | | | 49,543 | |
Sogo Medical Co., Ltd. | | | 2,400 | | | | 88,890 | |
Sotoh Co., Ltd. (a) | | | 4,300 | | | | 45,809 | |
Space Co., Ltd. | | | 5,800 | | | | 66,908 | |
Sparx Group Co., Ltd. | | | 35,900 | | | | 63,968 | |
SPK Corp. | | | 2,500 | | | | 47,513 | |
SRA Holdings | | | 3,100 | | | | 59,400 | |
Srg Takamiya Co., Ltd. | | | 5,200 | | | | 21,524 | |
ST Corp. | | | 6,900 | | | | 74,691 | |
St. Marc Holdings Co., Ltd. (a) | | | 5,100 | | | | 153,911 | |
Star Micronics Co., Ltd. (a) | | | 12,600 | | | | 132,726 | |
Starts Corp., Inc. | | | 5,800 | | | | 114,649 | |
Starzen Co., Ltd. | | | 2,800 | | | | 102,677 | |
Stella Chemifa Corp. | | | 5,400 | | | | 184,369 | |
Step Co., Ltd. | | | 4,100 | | | | 42,474 | |
Studio Alice Co., Ltd. | | | 2,900 | | | | 67,883 | |
Subaru Enterprise Co., Ltd. | | | 1,000 | | | | 3,755 | |
Sugimoto & Co., Ltd. | | | 3,800 | | | | 41,569 | |
Sumco Corp. | | | 2,200 | | | | 13,992 | |
Sumida Corp. | | | 6,300 | | | | 41,601 | |
Suminoe Textile Co., Ltd. | | | 23,000 | | | | 42,992 | |
Sumitomo Bakelite Co., Ltd. | | | 84,000 | | | | 388,676 | |
Sumitomo Densetsu Co., Ltd. | | | 7,700 | | | | 83,473 | |
Sumitomo Mitsui Construction Co., Ltd. | | | 260,300 | | | | 218,835 | |
Sumitomo Osaka Cement Co., Ltd. | | | 150,000 | | | | 641,474 | |
Sumitomo Precision Products Co., Ltd. | | | 12,000 | | | | 35,991 | |
Sumitomo Real Estate Sales Co., Ltd. | | | 5,960 | | | | 116,633 | |
Sumitomo Riko Co., Ltd. | | | 16,700 | | | | 133,047 | |
Sumitomo Seika Chemicals Co., Ltd. | | | 18,000 | | | | 99,630 | |
Sumitomo Warehouse Co., Ltd. (The) | | | 53,000 | | | | 262,705 | |
Sun Frontier Fudousan Co., Ltd. | | | 7,600 | | | | 77,206 | |
Sun-Wa Technos Corp. | | | 3,900 | | | | 26,955 | |
Suncall Corp. | | | 11,000 | | | | 48,187 | |
SWCC Showa Holdings Co., Ltd. (a) (c) | | | 116,000 | | | | 63,247 | |
Systena Corp. | | | 6,700 | | | | 90,716 | |
T Hasegawa Co., Ltd. | | | 9,100 | | | | 161,046 | |
T RAD Co., Ltd. | | | 36,000 | | | | 61,778 | |
T&K Toka Co., Ltd. (a) | | | 10,000 | | | | 72,871 | |
T-Gaia Corp. | | | 8,400 | | | | 117,309 | |
Tabuchi Electric Co., Ltd. | | | 8,900 | | | | 30,698 | |
Tachi-S Co., Ltd. | | | 10,300 | | | | 150,600 | |
Tachibana Eletech Co., Ltd. | | | 5,640 | | | | 58,839 | |
Tadano, Ltd. | | | 38,000 | | | | 315,997 | |
Taihei Dengyo Kaisha, Ltd. | | | 12,000 | | | | 121,237 | |
Taiheiyo Kouhatsu, Inc. | | | 21,000 | | | | 13,866 | |
Taiho Kogyo Co., Ltd. | | | 7,800 | | | | 80,153 | |
Taikisha, Ltd. | | | 9,800 | | | | 242,447 | |
|
Japan—(Continued) | |
Taiko Bank, Ltd. (The) | | | 41,000 | | | | 72,420 | |
Taiko Pharmaceutical Co., Ltd. (a) | | | 2,300 | | | | 35,446 | |
Taisei Lamick Co., Ltd. (a) | | | 2,200 | | | | 59,717 | |
Taiyo Holdings Co., Ltd. (a) | | | 5,300 | | | | 163,306 | |
Taiyo Yuden Co., Ltd. | | | 26,600 | | | | 231,446 | |
Takachiho Koheki Co., Ltd. | | | 400 | | | | 3,469 | |
Takagi Securities Co., Ltd. | | | 18,000 | | | | 22,045 | |
Takamatsu Construction Group Co., Ltd. | | | 5,400 | | | | 125,806 | |
Takano Co., Ltd. | | | 6,000 | | | | 35,232 | |
Takaoka Toko Co., Ltd. (a) | | | 5,365 | | | | 86,626 | |
Takara Holdings, Inc. | | | 34,300 | | | | 314,163 | |
Takara Leben Co., Ltd. (a) | | | 28,600 | | | | 217,903 | |
Takara Printing Co., Ltd. | | | 3,100 | | | | 38,699 | |
Takara Standard Co., Ltd. | | | 39,000 | | | | 352,340 | |
Takasago International Corp. | | | 6,400 | | | | 171,801 | |
Takasago Thermal Engineering Co., Ltd. | | | 20,900 | | | | 246,208 | |
Takashima & Co., Ltd. | | | 25,000 | | | | 37,724 | |
Takata Corp. (a) (c) | | | 14,300 | | | | 55,419 | |
Take And Give Needs Co., Ltd. | | | 4,010 | | | | 15,496 | |
Takeei Corp. (a) | | | 8,200 | | | | 74,226 | |
Takeuchi Manufacturing Co., Ltd. (a) | | | 10,000 | | | | 128,764 | |
Takihyo Co., Ltd. | | | 13,000 | | | | 53,867 | |
Takiron Co., Ltd. (a) | | | 21,000 | | | | 93,371 | |
Takisawa Machine Tool Co., Ltd. | | | 22,000 | | | | 26,186 | |
Takuma Co., Ltd. | | | 25,000 | | | | 220,896 | |
Tama Home Co., Ltd. (a) | | | 8,500 | | | | 34,346 | |
Tamron Co., Ltd. (a) | | | 6,000 | | | | 80,267 | |
Tamura Corp. | | | 26,000 | | | | 74,375 | |
Tanseisha Co., Ltd. | | | 11,750 | | | | 86,670 | |
TASAKI & Co., Ltd. (a) | | | 800 | | | | 10,340 | |
Tatsuta Electric Wire and Cable Co., Ltd. | | | 17,000 | | | | 47,595 | |
Tayca Corp. | | | 12,000 | | | | 57,038 | |
TBK Co., Ltd. (a) | | | 8,000 | | | | 27,196 | |
Teac Corp. (c) | | | 40,000 | | | | 13,233 | |
TECHNO ASSOCIE Co., Ltd. | | | 300 | | | | 2,789 | |
Techno Medica Co., Ltd. | | | 2,400 | | | | 34,954 | |
Techno Ryowa, Ltd. | | | 4,800 | | | | 26,218 | |
Teikoku Electric Manufacturing Co., Ltd. | | | 6,800 | | | | 51,518 | |
Teikoku Sen-I Co., Ltd. (a) | | | 6,900 | | | | 86,446 | |
Teikoku Tsushin Kogyo Co., Ltd. | | | 24,000 | | | | 33,012 | |
Tenma Corp. | | | 6,200 | | | | 92,336 | |
Teraoka Seisakusho Co., Ltd. | | | 200 | | | | 609 | |
Tigers Polymer Corp. | | | 2,200 | | | | 11,228 | |
TKC Corp. | | | 7,600 | | | | 198,589 | |
Toa Corp. (a) | | | 9,600 | | | | 85,753 | |
Toa Corp. | | | 82,000 | | | | 129,502 | |
Toa Oil Co., Ltd. | | | 32,000 | | | | 35,126 | |
TOA ROAD Corp. | | | 18,000 | | | | 46,829 | |
Toabo Corp. | | | 3,400 | | | | 15,193 | |
Toagosei Co., Ltd. (a) | | | 37,000 | | | | 339,365 | |
Tobishima Corp. (a) | | | 55,600 | | | | 93,072 | |
Tobu Store Co., Ltd. | | | 11,000 | | | | 31,068 | |
TOC Co., Ltd. | | | 15,800 | | | | 128,979 | |
Tocalo Co., Ltd. | | | 4,800 | | | | 77,330 | |
Tochigi Bank, Ltd. (The) | | | 45,000 | | | | 154,843 | |
Toda Corp. | | | 81,000 | | | | 348,073 | |
Toda Kogyo Corp. (a) | | | 11,000 | | | | 29,596 | |
See accompanying notes to financial statements.
MSF-26
Metropolitan Series Fund
Met/Dimensional International Small Company Portfolio
Schedule of Investments as of June 30, 2016 (Unaudited)
Common Stocks—(Continued)
| | | | | | | | |
| Security Description | | Shares | | | Value | |
|
Japan—(Continued) | |
Toei Animation Co., Ltd. (a) | | | 1,800 | | | $ | 90,836 | |
Toei Co., Ltd. | | | 28,000 | | | | 262,476 | |
Toenec Corp. | | | 16,000 | | | | 81,366 | |
Toho Bank, Ltd. (The) | | | 83,000 | | | | 256,154 | |
Toho Co., Ltd. (a) | | | 4,000 | | | | 93,472 | |
Toho Holdings Co., Ltd. (a) | | | 20,600 | | | | 494,732 | |
Toho Zinc Co., Ltd. | | | 50,000 | | | | 150,587 | |
Tohoku Bank, Ltd. (The) | | | 56,000 | | | | 75,785 | |
Tohokushinsha Film Corp. | | | 4,800 | | | | 24,039 | |
Tohto Suisan Co., Ltd. | | | 14,000 | | | | 21,080 | |
Tokai Carbon Co., Ltd. (a) | | | 68,000 | | | | 169,744 | |
Tokai Corp. | | | 3,900 | | | | 117,574 | |
TOKAI Holdings Corp. | | | 23,700 | | | | 150,484 | |
Tokai Lease Co., Ltd. | | | 16,000 | | | | 30,104 | |
Tokai Rika Co., Ltd. | | | 8,800 | | | | 129,363 | |
Tokai Tokyo Financial Holdings, Inc. | | | 20,300 | | | | 86,123 | |
Token Corp. | | | 2,960 | | | | 231,234 | |
Tokushu Tokai Paper Co., Ltd. | | | 39,000 | | | | 132,030 | |
Tokuyama Corp. (a) (c) | | | 106,000 | | | | 288,917 | |
Tokyo Dome Corp. | | | 62,000 | | | | 279,310 | |
Tokyo Electron Device, Ltd. (a) | | | 2,400 | | | | 34,773 | |
Tokyo Energy & Systems, Inc. | | | 10,000 | | | | 101,052 | |
Tokyo Individualized Educational Institute, Inc. | | | 5,000 | | | | 32,973 | |
Tokyo Keiki, Inc. | | | 21,000 | | | | 31,767 | |
Tokyo Ohka Kogyo Co., Ltd. | | | 13,100 | | | | 321,120 | |
Tokyo Rakutenchi Co., Ltd. | | | 17,000 | | | | 77,845 | |
Tokyo Rope Manufacturing Co., Ltd. | | | 46,000 | | | | 66,060 | |
Tokyo Sangyo Co., Ltd. | | | 12,000 | | | | 40,217 | |
Tokyo Seimitsu Co., Ltd. | | | 13,800 | | | | 319,734 | |
Tokyo Steel Manufacturing Co., Ltd. | | | 36,800 | | | | 200,670 | |
Tokyo Tekko Co., Ltd. | | | 17,000 | | | | 60,187 | |
Tokyo Theatres Co., Inc. | | | 42,000 | | | | 46,529 | |
Tokyo TY Financial Group, Inc. | | | 9,724 | | | | 224,915 | |
Tokyotokeiba Co., Ltd. (a) | | | 31,000 | | | | 60,690 | |
Tokyu Recreation Co., Ltd. | | | 6,000 | | | | 44,176 | |
Toli Corp. | | | 20,000 | | | | 56,172 | |
Tomato Bank, Ltd. | | | 55,000 | | | | 73,989 | |
Tomen Devices Corp. | | | 1,500 | | | | 26,815 | |
Tomoe Corp. | | | 12,500 | | | | 39,435 | |
Tomoe Engineering Co., Ltd. | | | 2,100 | | | | 30,315 | |
Tomoegawa Co., Ltd. | | | 12,000 | | | | 19,761 | |
Tomoku Co., Ltd. | | | 31,000 | | | | 86,430 | |
TOMONY Holdings, Inc. | | | 69,000 | | | | 207,119 | |
Tomy Co., Ltd. | | | 22,400 | | | | 187,333 | |
Tonami Holdings Co., Ltd. | | | 22,000 | | | | 55,946 | |
Toppan Forms Co., Ltd. | | | 19,800 | | | | 203,755 | |
Topre Corp. | | | 14,800 | | | | 313,988 | |
Topy Industries, Ltd. | | | 91,000 | | | | 186,161 | |
Toridoll.corp | | | 6,900 | | | | 183,518 | |
Torigoe Co., Ltd. (The) | | | 9,200 | | | | 58,123 | |
Torii Pharmaceutical Co., Ltd. | | | 3,600 | | | | 83,556 | |
Torishima Pump Manufacturing Co., Ltd. (a) | | | 9,700 | | | | 95,839 | |
Tosei Corp. (a) | | | 13,200 | | | | 94,403 | |
Toshiba Machine Co., Ltd. | | | 42,000 | | | | 126,698 | |
Toshiba Plant Systems & Services Corp. | | | 14,100 | | | | 228,778 | |
Toshiba TEC Corp. (c) | | | 13,000 | | | | 45,990 | |
Tosho Co., Ltd. | | | 2,400 | | | | 108,121 | |
|
Japan—(Continued) | |
Tosho Printing Co., Ltd. | | | 14,000 | | | | 67,917 | |
Totetsu Kogyo Co., Ltd. (a) | | | 8,400 | | | | 230,666 | |
Tottori Bank, Ltd. (The) | | | 37,000 | | | | 59,234 | |
Toukei Computer Co., Ltd. | | | 1,400 | | | | 24,327 | |
Tow Co., Ltd. (a) | | | 3,600 | | | | 21,238 | |
Towa Bank, Ltd. (The) | | | 115,000 | | | | 88,707 | |
Towa Corp. | | | 8,000 | | | | 70,100 | |
Towa Pharmaceutical Co., Ltd. | | | 2,800 | | | | 145,324 | |
Toyo Construction Co., Ltd. | | | 25,499 | | | | 114,929 | |
Toyo Corp. | | | 9,600 | | | | 91,318 | |
Toyo Denki Seizo KK (a) | | | 16,000 | | | | 40,961 | |
Toyo Engineering Corp. | | | 38,000 | | | | 125,348 | |
Toyo Ink SC Holdings Co., Ltd. | | | 76,000 | | | | 317,588 | |
Toyo Kanetsu KK | | | 48,000 | | | | 93,013 | |
Toyo Kohan Co., Ltd. | | | 16,000 | | | | 38,030 | |
Toyo Machinery & Metal Co., Ltd. | | | 7,800 | | | | 26,711 | |
Toyo Securities Co., Ltd. | | | 23,000 | | | | 42,941 | |
Toyo Sugar Refining Co., Ltd. | | | 9,000 | | | | 8,827 | |
Toyo Tanso Co., Ltd. | | | 5,300 | | | | 67,712 | |
Toyo Tire & Rubber Co., Ltd. | | | 2,900 | | | | 31,543 | |
Toyo Wharf & Warehouse Co., Ltd. | | | 25,000 | | | | 34,132 | |
Toyobo Co., Ltd. | | | 332,000 | | | | 625,504 | |
TPR Co., Ltd. | | | 7,300 | | | | 140,315 | |
Trancom Co., Ltd. | | | 2,300 | | | | 151,400 | |
Transcosmos, Inc. | | | 7,700 | | | | 218,293 | |
Trusco Nakayama Corp. | | | 6,900 | | | | 346,727 | |
Trust Tech, Inc. | | | 3,000 | | | | 39,430 | |
TS Tech Co., Ltd. | | | 2,600 | | | | 63,319 | |
TSI Holdings Co., Ltd. | | | 28,205 | | | | 152,998 | |
Tsubakimoto Chain Co. | | | 47,000 | | | | 288,341 | |
Tsubakimoto Kogyo Co., Ltd. | | | 8,000 | | | | 20,197 | |
Tsudakoma Corp. (c) | | | 16,000 | | | | 15,627 | |
Tsugami Corp. (a) | | | 25,000 | | | | 94,294 | |
Tsukada Global Holdings, Inc. | | | 7,200 | | | | 46,426 | |
Tsukamoto Corp. Co., Ltd. | | | 21,000 | | | | 20,423 | |
Tsukishima Kikai Co., Ltd. | | | 8,600 | | | | 80,311 | |
Tsukuba Bank, Ltd. | | | 34,500 | | | | 91,758 | |
Tsukui Corp. | | | 9,400 | | | | 165,436 | |
Tsumura & Co. (a) | | | 6,600 | | | | 178,153 | |
Tsurumi Manufacturing Co., Ltd. | | | 6,100 | | | | 73,298 | |
Tsutsumi Jewelry Co., Ltd. | | | 3,800 | | | | 74,075 | |
TTK Co., Ltd. (a) | | | 4,000 | | | | 18,239 | |
TV Tokyo Holdings Corp. | | | 3,700 | | | | 72,481 | |
TYK Corp. | | | 6,000 | | | | 8,840 | |
Tyo, Inc. | | | 9,600 | | | | 15,329 | |
U-Shin, Ltd. (a) | | | 10,600 | | | | 69,209 | |
UACJ Corp. (a) | | | 110,850 | | | | 261,284 | |
Ube Industries, Ltd. | | | 229,000 | | | | 376,689 | |
Uchida Yoko Co., Ltd. | | | 21,000 | | | | 92,971 | |
Ueki Corp. | | | 11,000 | | | | 21,657 | |
UKC Holdings Corp. (a) | | | 5,000 | | | | 76,133 | |
Ulvac, Inc. | | | 13,900 | | | | 423,357 | |
Uniden Holdings Corp. (a) (c) | | | 25,000 | | | | 28,756 | |
Union Tool Co. (a) | | | 3,400 | | | | 92,789 | |
Unipres Corp. | | | 13,900 | | | | 222,893 | |
United Arrows, Ltd. | | | 6,000 | | | | 173,600 | |
United Super Markets Holdings, Inc. | | | 22,300 | | | | 227,168 | |
See accompanying notes to financial statements.
MSF-27
Metropolitan Series Fund
Met/Dimensional International Small Company Portfolio
Schedule of Investments as of June 30, 2016 (Unaudited)
Common Stocks—(Continued)
| | | | | | | | |
| Security Description | | Shares | | | Value | |
|
Japan—(Continued) | |
Unitika, Ltd. (c) | | | 156,000 | | | $ | 83,605 | |
Universal Entertainment Corp. (a) (c) | | | 8,600 | | | | 180,344 | |
Unizo Holdings Co., Ltd. (a) | | | 3,800 | | | | 150,153 | |
UNY Group Holdings Co., Ltd. | | | 81,900 | | | | 686,698 | |
Usen Corp. (c) | | | 40,800 | | | | 120,105 | |
Ushio, Inc. | | | 39,000 | | | | 455,295 | |
UT Group Co., Ltd. (c) | | | 9,800 | | | | 39,437 | |
Utoc Corp. | | | 5,100 | | | | 15,009 | |
Valor Holdings Co., Ltd. | | | 11,800 | | | | 312,746 | |
Village Vanguard Co., Ltd. (a) | | | 2,300 | | | | 37,387 | |
Vital KSK Holdings, Inc. | | | 14,200 | | | | 133,978 | |
Vitec Holdings Co., Ltd. (a) | | | 3,700 | | | | 37,724 | |
VT Holdings Co., Ltd. | | | 24,300 | | | | 110,751 | |
Wacoal Holdings Corp. | | | 29,000 | | | | 285,135 | |
Wacom Co., Ltd. (a) | | | 46,700 | | | | 180,974 | |
Wakachiku Construction Co., Ltd. | | | 46,000 | | | | 66,364 | |
Wakamoto Pharmaceutical Co., Ltd. | | | 9,000 | | | | 20,454 | |
Wakita & Co., Ltd. | | | 15,300 | | | | 100,347 | |
Warabeya Nichiyo Co., Ltd. | | | 5,000 | | | | 91,716 | |
WATAMI Co., Ltd. (a) | | | 7,600 | | | | 77,420 | |
Weathernews, Inc. | | | 2,100 | | | | 73,456 | |
Wellnet Corp. (a) | | | 4,600 | | | | 87,080 | |
West Holdings Corp. | | | 7,200 | | | | 43,639 | |
Wood One Co., Ltd. | | | 19,000 | | | | 42,105 | |
Wowow, Inc. | | | 2,200 | | | | 50,979 | |
Xebio Holdings Co., Ltd. (a) | | | 8,700 | | | | 122,349 | |
Y. A. C. Co., Ltd. | | | 4,900 | | | | 59,225 | |
Yachiyo Industry Co., Ltd. | | | 3,900 | | | | 31,721 | |
Yahagi Construction Co., Ltd. (a) | | | 10,900 | | | | 87,361 | |
Yaizu Suisankagaku Industry Co., Ltd. (a) | | | 4,400 | | | | 42,020 | |
YAMABIKO Corp. | | | 12,800 | | | | 92,332 | |
Yamagata Bank, Ltd. (The) (a) | | | 52,000 | | | | 202,980 | |
Yamaichi Electronics Co., Ltd. (a) | | | 8,200 | | | | 48,822 | |
Yamanashi Chuo Bank, Ltd. (The) | | | 71,000 | | | | 249,155 | |
Yamatane Corp. | | | 34,000 | | | | 45,750 | |
Yamato Corp. | | | 9,000 | | | | 45,594 | |
Yamato International, Inc. | | | 6,700 | | | | 24,875 | |
Yamato Kogyo Co., Ltd. | | | 1,800 | | | | 40,736 | |
Yamaya Corp. | | | 1,150 | | | | 18,342 | |
Yamazawa Co., Ltd. | | | 1,000 | | | | 16,653 | |
Yamazen Corp. | | | 19,500 | | | | 154,959 | |
Yaoko Co., Ltd. | | | 5,200 | | | | 234,925 | |
Yashima Denki Co., Ltd. (a) | | | 7,500 | | | | 38,284 | |
Yasuda Logistics Corp. | | | 7,400 | | | | 44,062 | |
Yellow Hat, Ltd. | | | 5,800 | | | | 128,007 | |
Yodogawa Steel Works, Ltd. | | | 7,600 | | | | 184,223 | |
Yokogawa Bridge Holdings Corp. | | | 12,800 | | | | 127,214 | |
Yokohama Reito Co., Ltd. (a) | | | 18,600 | | | | 185,628 | |
Yokowo Co., Ltd. | | | 7,900 | | | | 36,716 | |
Yomeishu Seizo Co., Ltd. | | | 3,000 | | | | 50,651 | |
Yomiuri Land Co., Ltd. | | | 13,000 | | | | 56,098 | |
Yondenko Corp. | | | 8,000 | | | | 30,452 | |
Yondoshi Holdings, Inc. (a) | | | 4,600 | | | | 92,445 | |
Yorozu Corp. | | | 7,900 | | | | 110,364 | |
Yoshinoya Holdings Co., Ltd. (a) | | | 17,300 | | | | 235,422 | |
Yuasa Funashoku Co., Ltd. (a) | | | 13,000 | | | | 36,313 | |
Yuasa Trading Co., Ltd. | | | 6,700 | | | | 137,545 | |
|
Japan—(Continued) | |
Yuken Kogyo Co., Ltd. | | | 17,000 | | | | 27,107 | |
Yuki Gosei Kogyo Co., Ltd. | | | 6,000 | | | | 13,035 | |
Yumeshin Holdings Co., Ltd. (a) | | | 10,100 | | | | 65,203 | |
Yurtec Corp. | | | 17,000 | | | | 115,504 | |
Yusen Logistics Co., Ltd. | | | 7,100 | | | | 70,402 | |
Yushiro Chemical Industry Co., Ltd. | | | 3,700 | | | | 46,301 | |
Yutaka Giken Co., Ltd. | | | 600 | | | | 13,084 | |
Zappallas, Inc. (c) | | | 4,900 | | | | 17,459 | |
Zenrin Co., Ltd. | | | 7,900 | | | | 153,453 | |
Zensho Holdings Co., Ltd. | | | 31,700 | | | | 462,336 | |
ZERIA Pharmaceutical Co., Ltd. | | | 9,200 | | | | 132,846 | |
Zojirushi Corp. (a) | | | 9,800 | | | | 186,177 | |
Zuiko Corp. | | | 1,000 | | | | 42,621 | |
Zuken, Inc. (a) | | | 7,200 | | | | 63,159 | |
| | | | | | | | |
| | | | | | | 157,471,836 | |
| | | | | | | | |
| | |
Liechtenstein—0.0% | | | | | | | | |
VP Bank AG | | | 358 | | | | 32,781 | |
| | | | | | | | |
| | |
Luxembourg—0.0% | | | | | | | | |
B&M European Value Retail S.A. | | | 2,609 | | | | 8,840 | |
d’Amico International Shipping S.A. (c) | | | 60,320 | | | | 25,154 | |
L’Occitane International S.A. | | | 53,500 | | | | 109,386 | |
| | | | | | | | |
| | | | | | | 143,380 | |
| | | | | | | | |
| | |
Macau—0.0% | | | | | | | | |
Macau Legend Development, Ltd. (c) | | | 359,000 | | | | 46,707 | |
| | | | | | | | |
| | |
Malta—0.1% | | | | | | | | |
Unibet Group plc | | | 85,856 | | | | 785,415 | |
| | | | | | | | |
| | |
Netherlands—2.1% | | | | | | | | |
Aalberts Industries NV | | | 34,547 | | | | 1,042,095 | |
Accell Group | | | 11,551 | | | | 239,538 | |
AMG Advanced Metallurgical Group NV | | | 12,258 | | | | 169,797 | |
Amsterdam Commodities NV | | | 6,535 | | | | 159,424 | |
APERAM S.A. (a) | | | 33,328 | | | | 1,174,588 | |
Arcadis NV (a) | | | 33,193 | | | | 504,956 | |
ASM International NV | | | 19,662 | | | | 767,241 | |
BE Semiconductor Industries NV | | | 23,461 | | | | 639,439 | |
Beter Bed Holding NV | | | 5,373 | | | | 118,469 | |
BinckBank NV (a) | | | 28,201 | | | | 141,367 | |
Boskalis Westminster | | | 6,347 | | | | 218,923 | |
Brack Capital Properties NV | | | 442 | | | | 35,605 | |
Brunel International NV | | | 10,850 | | | | 200,766 | |
Corbion NV | | | 20,382 | | | | 491,186 | |
Delta Lloyd NV | | | 175,084 | | | | 621,901 | |
Euronext NV | | | 1,079 | | | | 39,970 | |
Fugro NV (a) (c) | | | 12,513 | | | | 220,661 | |
Gemalto NV (a) | | | 9,032 | | | | 553,182 | |
Heijmans NV (c) | | | 14,562 | | | | 123,678 | |
Hunter Douglas NV | | | 2,423 | | | | 115,015 | |
IMCD Group NV | | | 712 | | | | 28,188 | |
KAS Bank NV | | | 6,580 | | | | 65,945 | |
Kendrion NV | | | 3,947 | | | | 101,493 | |
Koninklijke BAM Groep NV (a) | | | 119,230 | | | | 436,273 | |
See accompanying notes to financial statements.
MSF-28
Metropolitan Series Fund
Met/Dimensional International Small Company Portfolio
Schedule of Investments as of June 30, 2016 (Unaudited)
Common Stocks—(Continued)
| | | | | | | | |
| Security Description | | Shares | | | Value | |
|
Netherlands—(Continued) | |
Koninklijke Vopak NV | | | 6,562 | | | $ | 328,678 | |
Nederland Apparatenfabriek | | | 2,241 | | | | 71,475 | |
Ordina NV (c) | | | 44,115 | | | | 76,078 | |
PostNL NV (c) | | | 162,817 | | | | 670,204 | |
QIAGEN NV (c) | | | 51,378 | | | | 1,112,830 | |
SBM Offshore NV (a) | | | 72,035 | | | | 839,327 | |
Sligro Food Group NV | | | 10,629 | | | | 409,174 | |
SNS REAAL NV (a) (b) (c) (d) | | | 105,329 | | | | 0 | |
STMicroelectronics NV (a) | | | 37,151 | | | | 218,927 | |
Telegraaf Media Groep NV | | | 13,542 | | | | 54,361 | |
TKH Group NV | | | 13,932 | | | | 471,244 | |
TomTom NV (a) (c) | | | 51,405 | | | | 398,957 | |
Van Lanschot NV | | | 45 | | | | 814 | |
Wessanen | | | 35,515 | | | | 375,151 | |
| | | | | | | | |
| | | | | | | 13,236,920 | |
| | | | | | | | |
| | |
New Zealand—1.6% | | | | | | | | |
a2 Milk Co., Ltd. (c) | | | 134,580 | | | | 176,240 | |
Abano Healthcare Group, Ltd. | | | 880 | | | | 4,777 | |
Air New Zealand, Ltd. (a) | | | 205,023 | | | | 308,127 | |
Briscoe Group, Ltd. | | | 13,123 | | | | 29,209 | |
Chorus, Ltd. | | | 125,657 | | | | 378,706 | |
Contact Energy, Ltd. | | | 94,206 | | | | 349,108 | |
Ebos Group, Ltd. | | | 46,233 | | | | 540,404 | |
Fisher & Paykel Healthcare Corp., Ltd. | | | 222,816 | | | | 1,599,369 | |
Freightways, Ltd. | | | 74,043 | | | | 342,480 | |
Genesis Energy, Ltd. | | | 6,811 | | | | 10,413 | |
Hallenstein Glasson Holdings, Ltd. | | | 19,012 | | | | 35,962 | |
Heartland Bank, Ltd. (a) | | | 72,313 | | | | 61,004 | |
Hellaby Holdings, Ltd. | | | 13,986 | | | | 25,982 | |
Infratil, Ltd. | | | 290,106 | | | | 663,156 | |
Kathmandu Holdings, Ltd. | | | 23,984 | | | | 26,197 | |
Mainfreight, Ltd. | | | 37,244 | | | | 442,680 | |
Methven, Ltd. | | | 19,898 | | | | 18,193 | |
Metlifecare, Ltd. | | | 34,148 | | | | 134,819 | |
Michael Hill International, Ltd. (b) | | | 82,929 | | | | 68,663 | |
Mighty River Power, Ltd. | | | 67,775 | | | | 146,028 | |
New Zealand Oil & Gas, Ltd. (c) | | | 131,264 | | | | 43,114 | |
New Zealand Refining Co., Ltd. (The) (a) | | | 27,432 | | | | 47,632 | |
Nuplex Industries, Ltd. | | | 105,582 | | | | 396,126 | |
NZME, Ltd. (c) | | | 71,247 | | | | 38,789 | |
NZX, Ltd. (a) | | | 114,554 | | | | 82,009 | |
Opus International Consultants, Ltd. | | | 4,000 | | | | 3,230 | |
Pacific Edge, Ltd. (c) | | | 17,353 | | | | 6,820 | |
PGG Wrightson, Ltd. | | | 58,545 | | | | 17,346 | |
Pike River Coal, Ltd. (b) (c) (d) | | | 82,575 | | | | 0 | |
Port of Tauranga, Ltd. (a) | | | 30,898 | | | | 431,246 | |
Restaurant Brands New Zealand, Ltd. | | | 51,556 | | | | 199,055 | |
Rubicon, Ltd. (c) | | | 9,922 | | | | 1,732 | |
Ryman Healthcare, Ltd. | | | 99,305 | | | | 661,682 | |
Sanford, Ltd. | | | 314 | | | | 1,256 | |
Scales Corp., Ltd. | | | 7,570 | | | | 16,078 | |
Skellerup Holdings, Ltd. (a) | | | 29,759 | | | | 26,756 | |
SKY Network Television, Ltd. (a) | | | 114,579 | | | | 390,151 | |
SKYCITY Entertainment Group, Ltd. | | | 328,488 | | | | 1,074,049 | |
Summerset Group Holdings, Ltd. | | | 25,600 | | | | 80,214 | |
|
New Zealand—(Continued) | |
TOWER, Ltd. | | | 59,836 | | | | 58,669 | |
Trade Me Group, Ltd. | | | 132,253 | | | | 438,020 | |
TrustPower, Ltd. | | | 13,980 | | | | 76,861 | |
Vector, Ltd. | | | 151,308 | | | | 356,827 | |
Warehouse Group, Ltd. (The) | | | 54,373 | | | | 107,587 | |
Xero, Ltd. (a) (c) | | | 20,773 | | | | 271,043 | |
Z Energy, Ltd. | | | 12,443 | | | | 71,877 | |
| | | | | | | | |
| | | | | | | 10,259,686 | |
| | | | | | | | |
| | |
Norway—0.8% | | | | | | | | |
ABG Sundal Collier Holding ASA | | | 112,462 | | | | 72,717 | |
AF Gruppen ASA | | | 945 | | | | 16,507 | |
Akastor ASA (a) (c) | | | 13,919 | | | | 15,539 | |
Aker ASA - A Shares | | | 3,036 | | | | 77,518 | |
American Shipping Co. ASA (c) | | | 12,027 | | | | 34,956 | |
Atea ASA | | | 22,644 | | | | 216,035 | |
Austevoll Seafood ASA | | | 29,238 | | | | 244,267 | |
Biotec Pharmacon ASA (c) | | | 10,494 | | | | 13,919 | |
Bonheur ASA | | | 10,311 | | | | 66,082 | |
Borregaard ASA | | | 10,433 | | | | 78,285 | |
BW LPG, Ltd. (a) | | | 6,290 | | | | 23,907 | |
BW Offshore, Ltd. (a) | | | 108,665 | | | | 2,358 | |
Deep Sea Supply plc (c) | | | 40,102 | | | | 6,713 | |
Det Norske Oljeselskap ASA (c) | | | 34,725 | | | | 422,744 | |
DNO ASA (c) | | | 109,545 | | | | 123,122 | |
Ekornes ASA | | | 11,636 | | | | 126,897 | |
Farstad Shipping ASA (c) | | | 6,040 | | | | 8,610 | |
Fred Olsen Energy ASA (c) | | | 4,442 | | | | 13,511 | |
Frontline, Ltd. (a) | | | 7,321 | | | | 56,926 | |
Grieg Seafood ASA | | | 11,731 | | | | 75,871 | |
Hexagon Composites ASA (a) (c) | | | 24,991 | | | | 77,590 | |
Hoegh LNG Holdings, Ltd. (a) | | | 13,626 | | | | 134,824 | |
Kongsberg Automotive ASA (c) | | | 185,093 | | | | 121,188 | |
Kvaerner ASA | | | 92,750 | | | | 84,494 | |
Nordic Semiconductor ASA (a) (c) | | | 49,630 | | | | 203,245 | |
Norske Skogindustrier ASA (c) | | | 121,097 | | | | 36,236 | |
Norwegian Air Shuttle ASA (a) (c) | | | 8,166 | | | | 282,100 | |
Ocean Yield ASA (a) | | | 3,896 | | | | 28,577 | |
Odfjell SE - A Shares (c) | | | 1,949 | | | | 6,198 | |
Opera Software ASA (a) | | | 21,316 | | | | 171,193 | |
Petroleum Geo-Services ASA (a) (c) | | | 55,241 | | | | 131,426 | |
PhotoCure ASA (c) | | | 5,477 | | | | 25,197 | |
ProSafe SE (a) | | | 76,897 | | | | 7,723 | |
Q-Free ASA (c) | | | 24,256 | | | | 25,960 | |
REC Silicon ASA (c) | | | 643,607 | | | | 115,140 | |
Salmar ASA | | | 8,438 | | | | 251,977 | |
Sevan Marine ASA (c) | | | 16,466 | | | | 45,182 | |
Solstad Offshore ASA (c) | | | 5,178 | | | | 8,307 | |
Songa Offshore (a) (c) | | | 318,078 | | | | 5,761 | |
SpareBank 1 SMN | | | 40,946 | | | | 228,886 | |
SpareBank 1 SR Bank ASA | | | 4,926 | | | | 24,431 | |
Stolt-Nielsen, Ltd. | | | 5,818 | | | | 70,813 | |
Tomra Systems ASA (a) | | | 42,052 | | | | 448,922 | |
Treasure ASA (c) | | | 21,003 | | | | 39,904 | |
Veidekke ASA (a) | | | 56,370 | | | | 677,829 | |
Wilh Wilhelmsen ASA | | | 21,003 | | | | 52,809 | |
See accompanying notes to financial statements.
MSF-29
Metropolitan Series Fund
Met/Dimensional International Small Company Portfolio
Schedule of Investments as of June 30, 2016 (Unaudited)
Common Stocks—(Continued)
| | | | | | | | |
| Security Description | | Shares | | | Value | |
|
Norway—(Continued) | |
Wilh Wilhelmsen Holding ASA - Class A | | | 4,777 | | | $ | 84,875 | |
| | | | | | | | |
| | | | | | | 5,087,271 | |
| | | | | | | | |
| | |
Philippines—0.0% | | | | | | | | |
Del Monte Pacific, Ltd. (c) | | | 77,636 | | | | 19,640 | |
| | | | | | | | |
| | |
Portugal—0.3% | | | | | | | | |
Altri SGPS S.A. | | | 49,174 | | | | 159,187 | |
Banco BPI S.A. (c) | | | 181,563 | | | | 224,719 | |
Banco Comercial Portugues S.A. - Class R (a) (c) | | | 10,046,492 | | | | 207,752 | |
Banco Espirito Santo S.A. (b) (c) (d) | | | 89,078 | | | | 0 | |
CTT-Correios de Portugal S.A. | | | 5,621 | | | | 44,540 | |
Mota-Engil SGPS S.A. (a) | | | 40,942 | | | | 67,906 | |
Navigator Co. S.A. (The) | | | 138,044 | | | | 385,905 | |
NOS SGPS S.A. | | | 73,113 | | | | 445,440 | |
Novabase SGPS S.A. | | | 7,827 | | | | 17,220 | |
REN - Redes Energeticas Nacionais SGPS S.A. (a) | | | 94,602 | | | | 267,468 | |
Semapa-Sociedade de Investimento e Gestao | | | 873 | | | | 9,621 | |
Sonae SGPS S.A. | | | 280,308 | | | | 220,637 | |
Teixeira Duarte S.A. | | | 59,382 | | | | 13,291 | |
| | | | | | | | |
| | | | | | | 2,063,686 | |
| | | | | | | | |
| | |
Singapore—1.3% | | | | | | | | |
Abterra, Ltd. (c) (d) | | | 51,720 | | | | 13,438 | |
ASL Marine Holdings, Ltd. | | | 105,000 | | | | 21,247 | |
Ausgroup, Ltd. (a) (c) | | | 143,000 | | | | 7,216 | |
Baker Technology, Ltd. | | | 33,200 | | | | 16,693 | |
Banyan Tree Holdings, Ltd. (c) | | | 155,000 | | | | 48,809 | |
Bonvests Holdings, Ltd. | | | 18,000 | | | | 16,369 | |
Boustead Projects, Ltd. (c) | | | 24,607 | | | | 10,889 | |
Boustead Singapore, Ltd. | | | 82,025 | | | | 48,698 | |
Breadtalk Group, Ltd. | | | 37,000 | | | | 30,738 | |
Broadway Industrial Group, Ltd. (c) | | | 156,399 | | | | 12,655 | |
Bukit Sembawang Estates, Ltd. | | | 72,000 | | | | 242,243 | |
Centurion Corp., Ltd. | | | 38,000 | | | | 10,850 | |
China Aviation Oil Singapore Corp., Ltd. | | | 153,600 | | | | 140,493 | |
China Merchants Holdings Pacific, Ltd. | | | 117,600 | | | | 89,452 | |
Chip Eng Seng Corp., Ltd. | | | 157,000 | | | | 74,138 | |
Chuan Hup Holdings, Ltd. | | | 125,000 | | | | 25,300 | |
Cordlife Group, Ltd. (a) | | | 39,000 | | | | 36,703 | |
Cosco Corp. Singapore, Ltd. (a) (c) | | | 477,000 | | | | 107,316 | |
Creative Technology, Ltd. (c) | | | 22,600 | | | | 16,806 | |
CSE Global, Ltd. | | | 197,000 | | | | 64,277 | |
CW Group Holdings, Ltd. | | | 106,000 | | | | 25,892 | |
CWT, Ltd. (a) | | | 81,000 | | | | 129,467 | |
Delfi, Ltd. | | | 66,000 | | | | 142,662 | |
DMX Technologies Group, Ltd. (b) (c) (d) | | | 186,000 | | | | 11,288 | |
Dyna-Mac Holdings, Ltd. | | | 98,000 | | | | 10,072 | |
Elec & Eltek International Co., Ltd. | | | 23,000 | | | | 19,447 | |
Eu Yan Sang International, Ltd. | | | 90,000 | | | | 40,728 | |
Ezion Holdings, Ltd. (a) (c) | | | 397,100 | | | | 153,894 | |
Ezra Holdings, Ltd. (a) (c) | | | 1,000,703 | | | | 54,780 | |
Far East Orchard, Ltd. | | | 74,044 | | | | 85,919 | |
First Resources, Ltd. (a) | | | 86,700 | | | | 101,178 | |
|
Singapore—(Continued) | |
First Sponsor Group, Ltd. | | | 8,628 | | | | 7,682 | |
FJ Benjamin Holdings, Ltd. (c) | | | 106,000 | | | | 5,744 | |
Food Empire Holdings, Ltd. (c) | | | 54,000 | | | | 12,533 | |
Fragrance Group, Ltd. | | | 752,800 | | | | 95,524 | |
Frasers Centrepoint, Ltd. | | | 17,300 | | | | 19,328 | |
Gallant Venture, Ltd. (c) | | | 126,000 | | | | 19,682 | |
Geo Energy Resources, Ltd. (a) (c) | | | 155,000 | | | | 13,034 | |
GK Goh Holdings, Ltd. | | | 12,000 | | | | 7,367 | |
GL, Ltd. | | | 188,000 | | | | 116,088 | |
Global Premium Hotels, Ltd. (c) | | | 73,200 | | | | 15,566 | |
GMG Global, Ltd. (c) | | | 202,200 | | | | 82,885 | |
Golden Agri-Resources, Ltd. | | | 193,600 | | | | 50,760 | |
Golden Energy & Resources, Ltd. (b) (c) (d) | | | 8,539 | | | | 951 | |
GuocoLand, Ltd. | | | 28,000 | | | | 38,476 | |
Hanwell Holdings, Ltd. (c) | | | 19,000 | | | | 3,245 | |
Haw Par Corp., Ltd. | | | 3,700 | | | | 24,727 | |
Hi-P International, Ltd. | | | 99,500 | | | | 29,844 | |
Hiap Hoe, Ltd. | | | 58,000 | | | | 31,215 | |
HLH Group, Ltd. (c) | | | 1,066,000 | | | | 5,378 | |
Ho Bee Land, Ltd. (a) | | | 87,000 | | | | 137,297 | |
Hong Fok Corp., Ltd. | | | 146,740 | | | | 73,249 | |
Hong Leong Asia, Ltd. | | | 41,000 | | | | 22,718 | |
Hotel Grand Central, Ltd. | | | 1,000 | | | | 967 | |
Hour Glass, Ltd. (The) | | | 129,000 | | | | 76,174 | |
HTL International Holdings, Ltd. (c) | | | 69,000 | | | | 47,813 | |
Hwa Hong Corp., Ltd. | | | 138,000 | | | | 30,751 | |
Hyflux, Ltd. (a) | | | 179,500 | | | | 80,408 | |
Indofood Agri Resources, Ltd. | | | 152,000 | | | | 54,432 | |
Innovalues, Ltd. | | | 64,000 | | | | 48,508 | |
k1 Ventures, Ltd. | | | 80,800 | | | | 51,112 | |
Keppel Infrastructure Trust (a) | | | 549,659 | | | | 202,346 | |
Keppel Telecommunications & Transportation, Ltd. | | | 44,000 | | | | 45,745 | |
Koh Brothers Group, Ltd. | | | 97,000 | | | | 20,118 | |
Lian Beng Group, Ltd. | | | 157,000 | | | | 51,555 | |
Low Keng Huat Singapore, Ltd. | | | 122,600 | | | | 48,182 | |
Lum Chang Holdings, Ltd. | | | 115,000 | | | | 30,731 | |
M1, Ltd. | | | 64,400 | | | | 130,692 | |
Marco Polo Marine, Ltd. (c) | | | 51,000 | | | | 6,587 | |
Metro Holdings, Ltd. | | | 141,600 | | | | 106,212 | |
Mewah International, Inc. | | | 110,000 | | | | 21,322 | |
Midas Holdings, Ltd. (a) | | | 452,000 | | | | 87,854 | |
Nam Cheong, Ltd. (a) (c) | | | 321,000 | | | | 18,576 | |
Neptune Orient Lines, Ltd. (a) (c) | | | 216,300 | | | | 208,684 | |
NSL, Ltd. | | | 15,000 | | | | 15,821 | |
Olam International, Ltd. | | | 45,700 | | | | 63,090 | |
Overseas Union Enterprise, Ltd. (a) | | | 174,000 | | | | 199,271 | |
Oxley Holdings, Ltd. (a) | | | 155,000 | | | | 47,943 | |
Pan-United Corp., Ltd. | | | 43,000 | | | | 18,714 | |
Penguin International, Ltd. | | | 64,333 | | | | 14,436 | |
QAF, Ltd. | | | 86,667 | | | | 68,350 | |
Raffles Education Corp., Ltd. | | | 384,774 | | | | 57,030 | |
Raffles Medical Group, Ltd. | | | 147,006 | | | | 165,054 | |
Rickmers Maritime | | | 110,000 | | | | 6,619 | |
Riverstone Holdings, Ltd. | | | 40,000 | | | | 26,983 | |
Rotary Engineering, Ltd. | | | 85,000 | | | | 23,624 | |
Roxy-Pacific Holdings, Ltd. | | | 85,750 | | | | 28,327 | |
See accompanying notes to financial statements.
MSF-30
Metropolitan Series Fund
Met/Dimensional International Small Company Portfolio
Schedule of Investments as of June 30, 2016 (Unaudited)
Common Stocks—(Continued)
| | | | | | | | |
| Security Description | | Shares | | | Value | |
|
Singapore—(Continued) | |
SATS, Ltd. | | | 100,500 | | | $ | 307,037 | |
SBS Transit, Ltd. | | | 40,500 | | | | 72,423 | |
Sembcorp Industries, Ltd. (a) | | | 15,300 | | | | 32,225 | |
Sembcorp Marine, Ltd. (a) | | | 39,300 | | | | 45,878 | |
Sheng Siong Group, Ltd. | | | 133,900 | | | | 88,101 | |
SHS Holdings, Ltd. | | | 47,000 | | | | 6,598 | |
SIIC Environment Holdings, Ltd. (c) | | | 91,600 | | | | 42,234 | |
Sim Lian Group, Ltd. | | | 121,500 | | | | 79,707 | |
Sinarmas Land, Ltd. | | | 694,000 | | | | 239,864 | |
Sing Holdings, Ltd. | | | 82,000 | | | | 18,283 | |
Singapore Post, Ltd. (a) | | | 239,600 | | | | 262,172 | |
Singapore Reinsurance Corp., Ltd. | | | 1,000 | | | | 226 | |
Sino Grandness Food Industry Group, Ltd. (a) | | | 137,000 | | | | 62,985 | |
SMRT Corp., Ltd. | | | 175,000 | | | | 195,786 | |
Stamford Land Corp., Ltd. | | | 278,000 | | | | 99,621 | |
Sunningdale Tech, Ltd. | | | 60,600 | | | | 47,806 | |
Super Group, Ltd. | | | 143,000 | | | | 88,082 | |
Swiber Holdings, Ltd. (a) (c) | | | 117,749 | | | | 16,015 | |
Tuan Sing Holdings, Ltd. | | | 169,000 | | | | 36,998 | |
UMS Holdings, Ltd. | | | 93,000 | | | | 40,402 | |
United Engineers, Ltd. | | | 138,000 | | | | 225,065 | |
United Industrial Corp., Ltd. | | | 5,900 | | | | 12,090 | |
United Overseas Insurance, Ltd. | | | 4,000 | | | | 13,659 | |
UOB-Kay Hian Holdings, Ltd. | | | 131,440 | | | | 128,330 | |
UOL Group, Ltd. | | | 34,300 | | | | 139,919 | |
UPP Holdings, Ltd. | | | 46,000 | | | | 6,723 | |
Vard Holdings, Ltd. (a) (c) | | | 203,000 | | | | 25,680 | |
Venture Corp., Ltd. | | | 97,000 | | | | 596,071 | |
Vibrant Group, Ltd. | | | 47,600 | | | | 11,991 | |
Vicom, Ltd. | | | 2,000 | | | | 8,539 | |
Wee Hur Holdings, Ltd. | | | 85,000 | | | | 16,095 | |
Wheelock Properties Singapore, Ltd. | | | 58,000 | | | | 62,550 | |
Wing Tai Holdings, Ltd. (a) | | | 159,621 | | | | 193,758 | |
Yeo Hiap Seng, Ltd. | | | 19,712 | | | | 20,337 | |
YHI International, Ltd. | | | 39,000 | | | | 8,685 | |
Yongnam Holdings, Ltd. (c) | | | 241,875 | | | | 38,783 | |
| | | | | | | | |
| | | | | | | 8,017,699 | |
| | | | | | | | |
| | |
Spain—2.1% | | | | | | | | |
Acciona S.A. (a) | | | 7,188 | | | | 522,303 | |
Acerinox S.A. (a) | | | 66,969 | | | | 741,854 | |
Adveo Group International S.A. | | | 6,292 | | | | 23,559 | |
Almirall S.A. | | | 20,336 | | | | 303,210 | |
Amper S.A. (c) | | | 12,087 | | | | 1,101 | |
Atresmedia Corp. de Medios de Comunicacion S.A. (a) | | | 21,362 | | | | 207,725 | |
Azkoyen S.A. | | | 1,608 | | | | 7,373 | |
Baron de Ley (c) | | | 1,139 | | | | 125,881 | |
Bolsas y Mercados Espanoles S.A. (a) | | | 27,936 | | | | 780,800 | |
Caja de Ahorros del Mediterraneo (a) (b) (c) (d) | | | 14,621 | | | | 0 | |
Cementos Portland Valderrivas S.A. (c) | | | 4,058 | | | | 26,905 | |
Cie Automotive S.A. | | | 17,266 | | | | 288,738 | |
Construcciones y Auxiliar de Ferrocarriles S.A. | | | 588 | | | | 200,805 | |
Distribuidora Internacional de Alimentacion S.A. (a) | | | 184,598 | | | | 1,084,311 | |
|
Spain—(Continued) | |
Duro Felguera S.A. (a) | | | 27,756 | | | | 34,202 | |
Ebro Foods S.A. (a) | | | 25,801 | | | | 593,012 | |
Elecnor S.A. (a) | | | 11,262 | | | | 89,159 | |
Ence Energia y Celulosa S.A | | | 61,968 | | | | 148,605 | |
Ercros S.A. (c) | | | 60,314 | | | | 72,087 | |
Faes Farma S.A. | | | 168,810 | | | | 552,581 | |
Fluidra S.A. | | | 12,850 | | | | 48,584 | |
Fomento de Construcciones y Contratas S.A. (a) (c) | | | 51,569 | | | | 434,105 | |
Gamesa Corp. Tecnologica S.A. | | | 69,346 | | | | 1,369,496 | |
Grupo Catalana Occidente S.A. | | | 21,149 | | | | 588,599 | |
Grupo Ezentis S.A. (c) | | | 39,717 | | | | 17,250 | |
Iberpapel Gestion S.A. | | | 600 | | | | 11,671 | |
Indra Sistemas S.A. (a) (c) | | | 39,802 | | | | 419,384 | |
Inmobiliaria Colonial S.A. | | | 256,889 | | | | 186,155 | |
Laboratorios Farmaceuticos Rovi S.A. | | | 6,104 | | | | 94,661 | |
Liberbank S.A. (a) (c) | | | 9,453 | | | | 6,272 | |
Mediaset Espana Comunicacion S.A. | | | 49,361 | | | | 552,718 | |
Melia Hotels International S.A. | | | 21,300 | | | | 229,006 | |
Miquel y Costas & Miquel S.A. | | | 4,480 | | | | 177,744 | |
NH Hotel Group S.A. (a) (c) | | | 69,951 | | | | 297,557 | |
Nmas1 Dinamia S.A. | | | 3,678 | | | | 30,809 | |
Obrascon Huarte Lain S.A. (a) | | | 35,775 | | | | 125,456 | |
Papeles y Cartones de Europa S.A. | | | 20,612 | | | | 109,245 | |
Pescanova S.A. (a) (b) (c) (d) | | | 7,446 | | | | 0 | |
Pharma Mar S.A. (a) (c) | | | 72,263 | | | | 173,523 | |
Prim S.A. | | | 3,013 | | | | 29,552 | |
Promotora de Informaciones S.A. - Class A (a) (c) | | | 13,933 | | | | 78,473 | |
Prosegur Cia de Seguridad S.A. | | | 54,905 | | | | 332,424 | |
Quabit Inmobiliaria S.A. (a) (c) | | | 8,507 | | | | 15,485 | |
Realia Business S.A. (c) | | | 112,366 | | | | 123,035 | |
Sacyr S.A. (a) | | | 107,800 | | | | 178,023 | |
Solaria Energia y Medio Ambiente S.A. (a) (c) | | | 19,439 | | | | 12,114 | |
Tecnicas Reunidas S.A. (a) | | | 11,115 | | | | 331,968 | |
Tecnocom Telecomunicaciones y Energia S.A. | | | 13,592 | | | | 26,595 | |
Tubacex S.A. | | | 28,250 | | | | 68,631 | |
Tubos Reunidos S.A. (a) | | | 21,752 | | | | 13,979 | |
Urbas Grupo Financiero S.A. (c) | | | 887,506 | | | | 9,927 | |
Vidrala S.A. (a) | | | 7,952 | | | | 461,658 | |
Viscofan S.A. | | | 14,797 | | | | 819,491 | |
Vocento S.A. (c) | | | 10,923 | | | | 14,191 | |
Zardoya Otis S.A. (a) | | | 9,386 | | | | 87,957 | |
| | | | | | | | |
| | | | | | | 13,279,949 | |
| | | | | | | | |
| | |
Sweden—3.3% | | | | | | | | |
AAK AB | | | 11,380 | | | | 808,350 | |
Acando AB | | | 32,705 | | | | 61,129 | |
AddLife AB (c) | | | 8,096 | | | | 97,918 | |
AddNode Group AB | | | 1,849 | | | | 11,203 | |
AddTech AB - B Shares (a) | | | 25,912 | | | | 325,158 | |
AF AB - B Shares | | | 24,002 | | | | 397,747 | |
Arise AB (c) | | | 4,852 | | | | 8,779 | |
Atrium Ljungberg AB - B Shares | | | 5,167 | | | | 83,470 | |
Avanza Bank Holding AB (a) | | | 7,660 | | | | 293,266 | |
Axactor AB (a) (c) | | | 49,626 | | | | 10,301 | |
See accompanying notes to financial statements.
MSF-31
Metropolitan Series Fund
Met/Dimensional International Small Company Portfolio
Schedule of Investments as of June 30, 2016 (Unaudited)
Common Stocks—(Continued)
| | | | | | | | |
| Security Description | | Shares | | | Value | |
|
Sweden—(Continued) | |
B&B Tools AB - B Shares | | | 12,796 | | | $ | 257,238 | |
BE Group AB (c) | | | 1,962 | | | | 6,762 | |
Beijer Alma AB | | | 9,404 | | | | 211,355 | |
Beijer Electronics AB | | | 5,229 | | | | 29,038 | |
Beijer Ref AB | | | 6,405 | | | | 148,178 | |
Betsson AB (c) | | | 27,465 | | | | 228,555 | |
Bilia AB - A Shares | | | 18,736 | | | | 459,831 | |
BillerudKorsnas AB (a) | | | 55,214 | | | | 821,627 | |
BioGaia AB - B Shares | | | 5,094 | | | | 137,885 | |
Biotage AB | | | 15,339 | | | | 53,471 | |
Bjorn Borg AB (c) | | | 9,936 | | | | 38,323 | |
Bonava AB - B Shares (c) | | | 684 | | | | 8,246 | |
Bulten AB (a) | | | 2,144 | | | | 20,717 | |
Bure Equity AB | | | 17,448 | | | | 147,742 | |
Byggmax Group AB | | | 18,326 | | | | 139,269 | |
Castellum AB | | | 75,500 | | | | 1,074,702 | |
Clas Ohlson AB - B Shares | | | 16,271 | | | | 278,535 | |
Cloetta AB - B Shares | | | 92,493 | | | | 317,704 | |
Concentric AB | | | 24,084 | | | | 274,877 | |
Concordia Maritime AB - B Shares | | | 4,217 | | | | 7,875 | |
Dios Fastigheter AB | | | 17,696 | | | | 125,929 | |
Doro AB (c) | | | 3,391 | | | | 24,582 | |
Duni AB | | | 15,028 | | | | 192,426 | |
East Capital Explorer AB | | | 7,088 | | | | 49,800 | |
Elekta AB - B Shares (a) | | | 9,189 | | | | 74,146 | |
Eniro AB (a) (c) | | | 223,372 | | | | 14,852 | |
Fabege AB | | | 48,889 | | | | 827,127 | |
Fagerhult AB | | | 6,390 | | | | 139,536 | |
Fastighets AB Balder - B Shares (c) | | | 9,233 | | | | 232,933 | |
Gunnebo AB | | | 12,816 | | | | 63,923 | |
Haldex AB | | | 17,698 | | | | 168,981 | |
Hemfosa Fastigheter AB | | | 14,975 | | | | 153,664 | |
HIQ International AB (c) | | | 25,890 | | | | 150,035 | |
HMS Networks AB | | | 709 | | | | 18,482 | |
Holmen AB - B Shares | | | 15,352 | | | | 490,775 | |
Hufvudstaden AB - A Shares | | | 15,492 | | | | 242,596 | |
Indutrade AB | | | 26,721 | | | | 527,145 | |
Intrum Justitia AB (a) | | | 21,993 | | | | 687,238 | |
Inwido AB | | | 3,779 | | | | 42,153 | |
JM AB (a) | | | 23,748 | | | | 594,961 | |
KappAhl AB | | | 29,980 | | | | 131,670 | |
Karolinska Development AB - Class B (c) | | | 7,514 | | | | 6,483 | |
Klovern AB - B Shares | | | 114,185 | | | | 131,185 | |
Know It AB | | | 9,489 | | | | 68,206 | |
Kungsleden AB | | | 47,047 | | | | 305,090 | |
Lagercrantz Group AB - B Shares (a) | | | 24,681 | | | | 232,990 | |
Lindab International AB | | | 21,316 | | | | 162,969 | |
Loomis AB - Class B | | | 25,196 | | | | 612,548 | |
Medivir AB - B Shares (c) | | | 10,470 | | | | 68,619 | |
Mekonomen AB (a) | | | 9,225 | | | | 198,401 | |
Modern Times Group MTG AB - B Shares (a) | | | 9,830 | | | | 259,783 | |
MQ Holding AB | | | 9,112 | | | | 34,605 | |
Mycronic AB (a) | | | 38,874 | | | | 289,607 | |
NCC AB - B Shares | | | 5,397 | | | | 124,961 | |
Nederman Holding AB | | | 932 | | | | 22,019 | |
Net Insight AB - Class B (a) (c) | | | 143,837 | | | | 102,350 | |
NetEnt AB (c) | | | 45,991 | | | | 454,903 | |
|
Sweden—(Continued) | |
New Wave Group AB - B Shares (a) | | | 15,773 | | | | 70,071 | |
Nibe Industrier AB - B Shares | | | 82,807 | | | | 685,512 | |
Nobia AB | | | 51,796 | | | | 449,532 | |
Nolato AB - B Shares | | | 9,452 | | | | 247,536 | |
Nordnet AB - B Shares (a) | | | 33,249 | | | | 102,326 | |
OEM International AB - B Shares | | | 498 | | | | 7,356 | |
Peab AB | | | 53,219 | | | | 402,761 | |
Pricer AB - B Shares | | | 32,212 | | | | 29,969 | |
Proact IT Group AB | | | 4,203 | | | | 54,188 | |
Ratos AB - B Shares | | | 40,725 | | | | 197,847 | |
Rezidor Hotel Group AB | | | 37,700 | | | | 155,931 | |
Saab AB - Class B | | | 22,997 | | | | 715,546 | |
Sagax AB - Class B | | | 14,540 | | | | 129,779 | |
SAS AB (a) (c) | | | 41,924 | | | | 79,729 | |
Scandi Standard AB | | | 2,894 | | | | 20,707 | |
Sectra AB - B Shares (c) | | | 4,644 | | | | 66,446 | |
Semcon AB | | | 5,540 | | | | 23,083 | |
SkiStar AB | | | 9,076 | | | | 131,992 | |
SSAB AB (a) (c) | | | 67,676 | | | | 127,182 | |
SSAB AB (a) (c) | | | 85,953 | | | | 161,966 | |
SSAB AB (Helsinki Exchange) - A Shares (c) | | | 27,650 | | | | 63,729 | |
SSAB AB (Helsinki Exchange) - B Shares (a) (c) | | | 70,586 | | | | 135,570 | |
SSAB AB (Stockholm Exchange) - A Shares (a) (c) | | | 54,482 | | | | 126,272 | |
SSAB AB (Stockholm Exchange) - B Shares (a) (c) | | | 45,069 | | | | 85,674 | |
Sweco AB - B Shares (a) | | | 29,847 | | | | 516,676 | |
Systemair AB | | | 4,286 | | | | 50,675 | |
Transcom Worldwide AB | | | 1,837 | | | | 11,681 | |
Victoria Park AB - A Shares | | | 6,554 | | | | 14,729 | |
Victoria Park AB - B Shares | | | 4,080 | | | | 9,236 | |
Vitrolife AB | | | 4,321 | | | | 237,392 | |
Wallenstam AB - B Shares | | | 64,604 | | | | 524,889 | |
Wihlborgs Fastigheter AB | | | 31,241 | | | | 636,407 | |
| | | | | | | | |
| | | | | | | 21,059,313 | |
| | | | | | | | |
| | |
Switzerland—5.4% | | | | | | | | |
AFG Arbonia-Forster Holding AG (c) | | | 10,560 | | | | 150,577 | |
Allreal Holding AG (a) (c) | | | 3,866 | | | | 534,831 | |
Alpiq Holding AG (c) | | | 156 | | | | 11,010 | |
APG SGA S.A. | | | 494 | | | | 202,301 | |
Aryzta AG (a) (c) | | | 1,533 | | | | 56,332 | |
Ascom Holding AG | | | 17,704 | | | | 281,202 | |
Autoneum Holding AG | | | 1,585 | | | | 370,390 | |
Bachem Holding AG - Class B | | | 1,074 | | | | 87,288 | |
Baloise Holding AG | | | 10,261 | | | | 1,144,319 | |
Bank Coop AG | | | 2,772 | | | | 121,045 | |
Banque Cantonale de Geneve | | | 375 | | | | 111,886 | |
Banque Cantonale Vaudoise | | | 739 | | | | 494,316 | |
Basler Kantonalbank | | | 130 | | | | 8,847 | |
Belimo Holding AG | | | 215 | | | | 640,097 | |
Bell AG | | | 560 | | | | 211,024 | |
Bellevue Group AG | | | 3,322 | | | | 47,010 | |
Berner Kantonalbank AG (a) | | | 1,950 | | | | 374,502 | |
BFW Liegenschaften AG (c) | | | 528 | | | | 20,252 | |
BKW AG (a) | | | 4,798 | | | | 213,083 | |
See accompanying notes to financial statements.
MSF-32
Metropolitan Series Fund
Met/Dimensional International Small Company Portfolio
Schedule of Investments as of June 30, 2016 (Unaudited)
Common Stocks—(Continued)
| | | | | | | | |
| Security Description | | Shares | | | Value | |
|
Switzerland—(Continued) | |
Bobst Group S.A. | | | 5,636 | | | $ | 282,100 | |
Bossard Holding AG - Class A (a) (c) | | | 2,245 | | | | 238,320 | |
Bucher Industries AG | | | 3,346 | | | | 784,434 | |
Burckhardt Compression Holding AG (a) | | | 1,329 | | | | 413,386 | |
Burkhalter Holding AG | | | 1,441 | | | | 177,280 | |
Calida Holding AG (c) | | | 2,002 | | | | 62,779 | |
Carlo Gavazzi Holding AG | | | 48 | | | | 11,181 | |
Cembra Money Bank AG (c) | | | 1,885 | | | | 132,083 | |
Cham Paper Holding AG (c) | | | 113 | | | | 32,442 | |
Charles Voegele Holding AG (c) | | | 4,263 | | | | 25,773 | |
Cicor Technologies (c) | | | 644 | | | | 13,100 | |
Cie Financiere Tradition S.A. | | | 557 | | | | 37,880 | |
Clariant AG (c) | | | 41,461 | | | | 700,851 | |
Coltene Holding AG | | | 1,326 | | | | 93,401 | |
Conzzeta AG | | | 292 | | | | 186,650 | |
Daetwyler Holding AG | | | 3,176 | | | | 423,837 | |
DKSH Holding AG | | | 745 | | | | 48,770 | |
dorma+kaba Holding AG - Class B | | | 1,194 | | | | 833,029 | |
Edmond de Rothschild Suisse S.A. | | | 3 | | | | 43,134 | |
EFG International AG (c) | | | 20,307 | | | | 77,465 | |
Emmi AG (c) | | | 1,190 | | | | 724,852 | |
Energiedienst Holding AG | | | 3,017 | | | | 70,201 | |
Feintool International Holding AG (c) | | | 684 | | | | 64,570 | |
Fenix Outdoor International AG | | | 384 | | | | 19,885 | |
FIH Mobile, Ltd. | | | 110,000 | | | | 35,693 | |
Flughafen Zuerich AG | | | 7,945 | | | | 1,405,848 | |
Forbo Holding AG (c) | | | 549 | | | | 652,135 | |
GAM Holding AG (c) | | | 68,723 | | | | 734,678 | |
Gategroup Holding AG (c) | | | 10,889 | | | | 573,534 | |
Georg Fischer AG | | | 1,730 | | | | 1,380,113 | |
Gurit Holding AG (c) | | | 292 | | | | 183,470 | |
Helvetia Holding AG | | | 2,402 | | | | 1,253,388 | |
Highlight Communications AG (c) | | | 7,829 | | | | 51,262 | |
HOCHDORF Holding AG (c) | | | 117 | | | | 21,988 | |
Huber & Suhner AG | | | 5,559 | | | | 299,272 | |
Implenia AG (a) | | | 8,148 | | | | 537,672 | |
Inficon Holding AG (c) | | | 688 | | | | 233,868 | |
Interroll Holding AG | | | 253 | | | | 236,642 | |
Intershop Holding AG | | | 586 | | | | 269,660 | |
Jungfraubahn Holding AG | | | 85 | | | | 9,133 | |
Kardex AG (c) | | | 2,548 | | | | 227,282 | |
Komax Holding AG | | | 1,485 | | | | 306,505 | |
Kudelski S.A. (c) | | | 13,221 | | | | 263,660 | |
LEM Holding S.A. | | | 279 | | | | 251,140 | |
Liechtensteinische Landesbank AG | | | 2,973 | | | | 109,469 | |
LifeWatch AG (c) | | | 1,912 | | | | 24,126 | |
Logitech International S.A. (a) | | | 59,506 | | | | 968,579 | |
Luzerner Kantonalbank AG (c) | | | 1,489 | | | | 628,754 | |
MCH Group AG | | | 831 | | | | 55,130 | |
Metall Zug AG - B Shares | | | 66 | | | | 188,718 | |
Meyer Burger Technology AG (a) (c) | | | 24,493 | | | | 88,190 | |
Mikron Holding AG (c) | | | 474 | | | | 2,884 | |
Mobilezone Holding AG (a) | | | 10,014 | | | | 130,135 | |
Mobimo Holding AG (a) (c) | | | 3,098 | | | | 705,364 | |
OC Oerlikon Corp. AG (c) | | | 74,629 | | | | 654,200 | |
Orascom Development Holding AG (c) | | | 5,250 | | | | 40,159 | |
Orell Fuessli Holding AG | | | 428 | | | | 53,801 | |
|
Switzerland—(Continued) | |
Oriflame Holding AG (a) (c) | | | 4,387 | | | | 111,527 | |
Orior AG (c) | | | 2,240 | | | | 151,305 | |
Panalpina Welttransport Holding AG (a) | | | 2,641 | | | | 315,698 | |
Phoenix Mecano AG | | | 337 | | | | 163,671 | |
Plazza AG - Class A | | | 292 | | | | 67,985 | |
PSP Swiss Property AG | | | 9,560 | | | | 926,248 | |
Rieter Holding AG (c) | | | 1,437 | | | | 293,702 | |
Romande Energie Holding S.A. | | | 111 | | | | 118,271 | |
Schaffner Holding AG (c) | | | 238 | | | | 54,841 | |
Schmolz & Bickenbach AG (c) | | | 161,565 | | | | 113,543 | |
Schweiter Technologies AG | | | 381 | | | | 363,211 | |
Siegfried Holding AG (a) (c) | | | 1,665 | | | | 320,003 | |
St. Galler Kantonalbank AG (a) | | | 1,175 | | | | 453,357 | |
Straumann Holding AG | | | 3,757 | | | | 1,484,557 | |
Sulzer AG (a) | | | 2,848 | | | | 247,572 | |
Swiss Prime Site AG (c) | | | 12,982 | | | | 1,174,119 | |
Swissquote Group Holding S.A. (a) (c) | | | 3,968 | | | | 92,749 | |
Tamedia AG | | | 904 | | | | 152,307 | |
Tecan Group AG | | | 2,995 | | | | 466,451 | |
Temenos Group AG (c) | | | 22,137 | | | | 1,102,706 | |
U-Blox AG (c) | | | 2,581 | | | | 554,011 | |
Valiant Holding AG | | | 5,102 | | | | 488,379 | |
Valora Holding AG | | | 1,316 | | | | 366,549 | |
Vaudoise Assurances Holding S.A. | | | 531 | | | | 270,760 | |
Vetropack Holding AG | | | 88 | | | | 131,802 | |
Von Roll Holding AG (c) | | | 7,038 | | | | 4,198 | |
Vontobel Holding AG | | | 10,466 | | | | 450,203 | |
VZ Holding AG | | | 86 | | | | 25,658 | |
Walliser Kantonalbank | | | 1,160 | | | | 91,268 | |
Walter Meier AG (a) | | | 872 | | | | 28,700 | |
Warteck Invest AG | | | 15 | | | | 28,502 | |
Ypsomed Holding AG (a) (c) | | | 1,609 | | | | 303,821 | |
Zehnder Group AG (c) | | | 4,642 | | | | 179,928 | |
Zug Estates Holding AG - B Shares (c) | | | 83 | | | | 135,531 | |
Zuger Kantonalbank AG | | | 68 | | | | 341,126 | |
| | | | | | | | |
| | | | | | | 34,728,426 | |
| | | | | | | | |
| | |
United Arab Emirates—0.0% | | | | | | | | |
Lamprell plc (c) | | | 100,553 | | | | 95,604 | |
| | | | | | | | |
| | |
United Kingdom—15.3% | | | | | | | | |
4imprint Group plc | | | 6,953 | | | | 120,415 | |
888 Holdings plc | | | 43,367 | | | | 117,117 | |
A.G.Barr plc | | | 43,047 | | | | 278,194 | |
AA plc | | | 5,850 | | | | 18,691 | |
Aberdeen Asset Management plc | | | 24,859 | | | | 96,067 | |
Acacia Mining plc | | | 56,954 | | | | 341,761 | |
Acal plc | | | 10,523 | | | | 31,982 | |
Afren plc (a) (b) (c) (d) | | | 251,096 | | | | 100 | |
Aggreko plc | | | 26,887 | | | | 461,781 | |
Air Partner plc | | | 992 | | | | 5,055 | |
Amec Foster Wheeler plc | | | 59,960 | | | | 392,436 | |
Anglo Pacific Group plc | | | 35,633 | | | | 38,501 | |
Anglo-Eastern Plantations plc | | | 4,252 | | | | 22,395 | |
Arrow Global Group plc | | | 8,180 | | | | 21,713 | |
Ashmore Group plc (a) | | | 105,606 | | | | 427,551 | |
See accompanying notes to financial statements.
MSF-33
Metropolitan Series Fund
Met/Dimensional International Small Company Portfolio
Schedule of Investments as of June 30, 2016 (Unaudited)
Common Stocks—(Continued)
| | | | | | | | |
| Security Description | | Shares | | | Value | |
|
United Kingdom—(Continued) | |
Atrium European Real Estate, Ltd. (c) | | | 114,274 | | | $ | 491,403 | |
Auto Trader Group plc (144A) | | | 94,890 | | | | 448,687 | |
AVEVA Group plc | | | 4,501 | | | | 101,603 | |
Avon Rubber plc | | | 10,973 | | | | 124,308 | |
Balfour Beatty plc (c) | | | 272,534 | | | | 783,521 | |
BBA Aviation plc | | | 419,362 | | | | 1,242,214 | |
Beazley plc | | | 227,019 | | | | 1,102,938 | |
Bellway plc | | | 55,252 | | | | 1,396,941 | |
Berendsen plc | | | 63,707 | | | | 1,037,886 | |
BGEO Group plc | | | 6,261 | | | | 221,540 | |
Bioquell plc (c) | | | 2,500 | | | | 4,442 | |
Bloomsbury Publishing plc | | | 25,349 | | | | 54,315 | |
Bodycote plc | | | 101,186 | | | | 696,431 | |
Booker Group plc | | | 440,978 | | | | 1,020,297 | |
Bovis Homes Group plc | | | 60,601 | | | | 597,694 | |
Braemar Shipping Services plc | | | 7,120 | | | | 38,931 | |
Brammer plc (a) | | | 36,027 | | | | 28,545 | |
Brewin Dolphin Holdings plc | | | 136,293 | | | | 437,880 | |
British Polythene Industries plc | | | 10,947 | | | | 135,784 | |
Britvic plc | | | 71,540 | | | | 559,301 | |
BTG plc (c) | | | 51,257 | | | | 494,093 | |
Cairn Energy plc (c) | | | 205,028 | | | | 569,021 | |
Cape plc | | | 51,292 | | | | 131,711 | |
Capital & Counties Properties plc | | | 46,906 | | | | 186,601 | |
Carclo plc | | | 16,990 | | | | 34,767 | |
Carillion plc (a) | | | 158,126 | | | | 498,394 | |
Carr’s Group plc | | | 15,540 | | | | 29,108 | |
Castings plc | | | 1,484 | | | | 8,547 | |
Centamin plc | | | 342,133 | | | | 601,859 | |
Centaur Media plc | | | 92,526 | | | | 49,445 | |
Chemring Group plc | | | 123,138 | | | | 209,183 | |
Chesnara plc | | | 56,561 | | | | 205,106 | |
Cineworld Group plc | | | 70,599 | | | | 514,855 | |
Clarkson plc (a) | | | 4,101 | | | | 121,538 | |
Close Brothers Group plc | | | 58,401 | | | | 882,748 | |
CLS Holdings plc (a) (c) | | | 578 | | | | 10,530 | |
Cobham plc | | | 545,934 | | | | 1,145,332 | |
Communisis plc | | | 57,478 | | | | 26,818 | |
Computacenter plc | | | 33,426 | | | | 331,416 | |
Connect Group plc | | | 113,354 | | | | 223,497 | |
Consort Medical plc | | | 23,287 | | | | 324,959 | |
Costain Group plc | | | 21,151 | | | | 89,278 | |
Countrywide plc | | | 2,910 | | | | 9,546 | |
Cranswick plc | | | 21,978 | | | | 612,308 | |
Crest Nicholson Holdings plc | | | 18,352 | | | | 87,334 | |
Creston plc | | | 5,272 | | | | 6,076 | |
Daejan Holdings plc | | | 670 | | | | 45,147 | |
Daily Mail & General Trust plc - Class A | | | 83,431 | | | | 665,040 | |
Dairy Crest Group plc | | | 61,577 | | | | 441,030 | |
Darty plc | | | 135,252 | | | | 303,171 | |
De La Rue plc | | | 27,894 | | | | 190,271 | |
Debenhams plc | | | 392,003 | | | | 290,921 | |
Dechra Pharmaceuticals plc | | | 29,807 | | | | 465,626 | |
Devro plc | | | 61,396 | | | | 211,931 | |
Dialight plc (c) | | | 3,360 | | | | 22,567 | |
Dignity plc | | | 22,395 | | | | 769,750 | |
Diploma plc | | | 38,305 | | | | 426,499 | |
|
United Kingdom—(Continued) | |
Domino’s Pizza Group plc | | | 147,744 | | | | 657,593 | |
Drax Group plc (a) | | | 137,597 | | | | 599,657 | |
DS Smith plc | | | 336,909 | | | | 1,739,780 | |
Dunelm Group plc | | | 12,749 | | | | 134,593 | |
E2V Technologies plc | | | 74,152 | | | | 201,117 | |
Electrocomponents plc | | | 174,930 | | | | 608,049 | |
Elementis plc | | | 171,004 | | | | 455,843 | |
EnQuest plc (c) | | | 429,925 | | | | 183,759 | |
Enterprise Inns plc (c) | | | 256,620 | | | | 276,325 | |
Essentra plc | | | 78,989 | | | | 542,203 | |
Euromoney Institutional Investor plc (a) | | | 14,736 | | | | 185,359 | |
Evraz plc (c) | | | 60,200 | | | | 109,698 | |
Fenner plc | | | 78,996 | | | | 165,394 | |
Ferrexpo plc (a) | | | 36,701 | | | | 15,926 | |
Fidessa Group plc | | | 14,501 | | | | 383,868 | |
Findel plc (c) | | | 17,439 | | | | 40,614 | |
Firstgroup plc (c) | | | 412,049 | | | | 556,131 | |
Foxtons Group plc | | | 51,116 | | | | 75,394 | |
Fuller Smith & Turner plc - Class A | | | 7,667 | | | | 95,775 | |
G4S plc | | | 27,804 | | | | 68,827 | |
Galliford Try plc | | | 39,495 | | | | 480,421 | |
Gem Diamonds, Ltd. | | | 35,552 | | | | 59,753 | |
Genus plc | | | 26,031 | | | | 545,626 | |
Go-Ahead Group plc | | | 12,021 | | | | 314,850 | |
Grainger plc | | | 15,144 | | | | 42,518 | |
Greene King plc | | | 121,167 | | | | 1,264,813 | |
Greggs plc | | | 41,552 | | | | 538,669 | |
Halfords Group plc | | | 99,977 | | | | 437,212 | |
Halma plc | | | 135,194 | | | | 1,834,839 | |
Hansard Global plc | | | 2,566 | | | | 3,529 | |
Hays plc | | | 439,356 | | | | 573,145 | |
Headlam Group plc | | | 56,817 | | | | 327,206 | |
Helical Bar plc | | | 63,391 | | | | 240,838 | |
Henderson Group plc | | | 414,124 | | | | 1,180,556 | |
Henry Boot plc | | | 1,476 | | | | 3,754 | |
Hill & Smith Holdings plc | | | 46,114 | | | | 547,034 | |
Hilton Food Group plc | | | 1,888 | | | | 13,883 | |
Hiscox, Ltd. | | | 106,215 | | | | 1,464,692 | |
Hochschild Mining plc (c) | | | 74,658 | | | | 179,123 | |
Hogg Robinson Group plc | | | 72,262 | | | | 68,181 | |
Home Retail Group plc | | | 295,917 | | | | 600,954 | |
HomeServe plc | | | 112,845 | | | | 798,759 | |
Howden Joinery Group plc | | | 194,200 | | | | 1,012,887 | |
Hunting plc | | | 34,598 | | | | 222,079 | |
Huntsworth plc | | | 31,310 | | | | 16,366 | |
ICAP plc | | | 200,242 | | | | 1,125,573 | |
IG Group Holdings plc | | | 127,101 | | | | 1,374,366 | |
Imagination Technologies Group plc (a) (c) | | | 46,403 | | | | 121,023 | |
IMI plc | | | 16,795 | | | | 217,025 | |
Inchcape plc | | | 161,511 | | | | 1,355,689 | |
Indivior plc | | | 4,713 | | | | 15,862 | |
Informa plc | | | 122,049 | | | | 1,195,266 | |
Intermediate Capital Group plc | | | 29,783 | | | | 195,235 | |
International Personal Finance plc | | | 79,366 | | | | 303,370 | |
Interserve plc | | | 69,361 | | | | 241,024 | |
IP Group plc (c) | | | 139,902 | | | | 263,125 | |
ITE Group plc | | | 58,016 | | | | 110,587 | |
See accompanying notes to financial statements.
MSF-34
Metropolitan Series Fund
Met/Dimensional International Small Company Portfolio
Schedule of Investments as of June 30, 2016 (Unaudited)
Common Stocks—(Continued)
| | | | | | | | |
| Security Description | | Shares | | | Value | |
|
United Kingdom—(Continued) | |
James Fisher & Sons plc | | | 20,005 | | | $ | 370,456 | |
Jardine Lloyd Thompson Group plc | | | 46,166 | | | | 580,717 | |
JD Sports Fashion plc | | | 33,766 | | | | 520,292 | |
JD Wetherspoon plc (a) | | | 38,521 | | | | 364,597 | |
John Menzies plc | | | 14,551 | | | | 106,111 | |
John Wood Group plc | | | 122,821 | | | | 1,126,048 | |
Johnston Press plc (c) | | | 4,425 | | | | 1,053 | |
Jupiter Fund Management plc | | | 111,316 | | | | 548,799 | |
KAZ Minerals plc (a) (c) | | | 44,157 | | | | 80,340 | |
Kcom Group plc | | | 240,465 | | | | 337,997 | |
Keller Group plc | | | 25,571 | | | | 309,336 | |
Kier Group plc | | | 26,579 | | | | 374,131 | |
Ladbrokes plc | | | 312,983 | | | | 468,769 | |
Laird plc | | | 150,399 | | | | 656,284 | |
Lancashire Holdings, Ltd. (a) | | | 58,171 | | | | 455,668 | |
Laura Ashley Holdings plc | | | 25,157 | | | | 7,369 | |
Lavendon Group plc | | | 44,306 | | | | 65,818 | |
Lookers plc | | | 131,372 | | | | 190,798 | |
Low & Bonar plc | | | 37,972 | | | | 29,844 | |
LSL Property Services plc | | | 7,542 | | | | 24,559 | |
Man Group plc | | | 598,620 | | | | 927,746 | |
Marshalls plc | | | 63,336 | | | | 203,146 | |
Marston’s plc (a) | | | 328,476 | | | | 590,844 | |
McBride plc (c) | | | 87,417 | | | | 181,617 | |
Mears Group plc | | | 41,542 | | | | 218,335 | |
Meggitt plc | | | 11,991 | | | | 65,047 | |
Melrose Industries plc (a) | | | 55,295 | | | | 313,901 | |
Micro Focus International plc | | | 55,820 | | | | 1,207,433 | |
Millennium & Copthorne Hotels plc | | | 72,551 | | | | 385,276 | |
Mitchells & Butlers plc | | | 67,625 | | | | 210,356 | |
Mitie Group plc (a) | | | 137,149 | | | | 458,854 | |
Moneysupermarket.com Group plc | | | 143,669 | | | | 519,473 | |
Morgan Advanced Materials plc | | | 113,848 | | | | 353,239 | |
Morgan Sindall Group plc | | | 17,569 | | | | 152,945 | |
Mothercare plc (a) (c) | | | 51,119 | | | | 93,259 | |
N Brown Group plc (a) | | | 73,957 | | | | 174,615 | |
National Express Group plc | | | 225,819 | | | | 890,394 | |
NCC Group plc (a) | | | 76,130 | | | | 266,295 | |
New World Resources plc - A Shares (b) (c) (d) | | | 11,898 | | | | 34 | |
Northgate plc | | | 48,315 | | | | 210,210 | |
Novae Group plc | | | 22,502 | | | | 226,240 | |
OneSavings Bank plc | | | 6,910 | | | | 19,474 | |
Ophir Energy plc (c) | | | 82,608 | | | | 86,960 | |
Oxford Instruments plc | | | 13,946 | | | | 132,310 | |
Pagegroup plc | | | 84,971 | | | | 341,953 | |
PayPoint plc | | | 19,490 | | | | 235,798 | |
Pendragon plc | | | 345,188 | | | | 129,818 | |
Pennon Group plc | | | 139,688 | | | | 1,763,668 | |
Petra Diamonds, Ltd. | | | 172,115 | | | | 267,469 | |
Petrofac, Ltd. (a) | | | 30,916 | | | | 321,308 | |
Petropavlovsk plc (c) | | | 68,962 | | | | 6,745 | |
Phoenix Group Holdings | | | 51,559 | | | | 554,765 | |
Photo-Me International plc | | | 27,274 | | | | 50,144 | |
Playtech plc | | | 58,243 | | | | 619,225 | |
Porvair plc | | | 2,554 | | | | 11,961 | |
Premier Farnell plc | | | 101,808 | | | | 223,360 | |
Premier Foods plc (c) | | | 334,879 | | | | 184,534 | |
|
United Kingdom—(Continued) | |
Premier Oil plc (c) | | | 172,107 | | | | 174,322 | |
Provident Financial plc | | | 9,022 | | | | 278,870 | |
Punch Taverns plc (c) | | | 16,132 | | | | 19,901 | |
PZ Cussons plc (a) | | | 102,110 | | | | 448,711 | |
QinetiQ Group plc | | | 183,469 | | | | 549,583 | |
Rank Group plc | | | 29,633 | | | | 85,384 | |
Rathbone Brothers plc | | | 21,429 | | | | 503,508 | |
Raven Russia, Ltd. (c) | | | 80,649 | | | | 40,069 | |
REA Holdings plc | | | 1,120 | | | | 3,616 | |
Redrow plc | | | 150,678 | | | | 646,032 | |
Regus plc | | | 206,169 | | | | 795,285 | |
Renishaw plc | | | 17,538 | | | | 518,169 | |
Renold plc (c) | | | 64,766 | | | | 29,422 | |
Rentokil Initial plc | | | 576,032 | | | | 1,485,574 | |
Restaurant Group plc (The) | | | 58,755 | | | | 226,473 | |
Ricardo plc | | | 13,452 | | | | 132,600 | |
Rightmove plc | | | 30,801 | | | | 1,501,548 | |
RM plc (a) | | | 43,283 | | | | 67,488 | |
Robert Walters plc | | | 14,599 | | | | 50,651 | |
Rotork plc | | | 286,300 | | | | 821,913 | |
RPC Group plc | | | 135,702 | | | | 1,421,523 | |
RPS Group plc | | | 100,537 | | | | 231,610 | |
Savills plc | | | 62,765 | | | | 513,564 | |
SDL plc | | | 33,826 | | | | 174,167 | |
Senior plc | | | 166,890 | | | | 458,432 | |
Sepura plc | | | 11,245 | | | | 6,030 | |
Sepura plc | | | 3,746 | | | | 262 | |
Serco Group plc (c) | | | 29,745 | | | | 44,279 | |
Severfield plc | | | 98,696 | | | | 64,899 | |
Shanks Group plc (b) (d) | | | 160,917 | | | | 172,448 | |
SIG plc | | | 252,797 | | | | 380,081 | |
Soco International plc | | | 50,968 | | | | 96,551 | |
Spectris plc | | | 44,465 | | | | 1,082,645 | |
Speedy Hire plc | | | 205,988 | | | | 91,853 | |
Spirax-Sarco Engineering plc | | | 22,020 | | | | 1,099,193 | |
Spirent Communications plc | | | 240,086 | | | | 261,236 | |
Sportech plc (c) | | | 20,264 | | | | 16,001 | |
St. Ives plc | | | 36,663 | | | | 40,370 | |
St. Modwen Properties plc | | | 94,644 | | | | 339,698 | |
Stagecoach Group plc | | | 127,734 | | | | 393,748 | |
Stallergenes Greer plc (a) (c) | | | 569 | | | | 13,968 | |
SThree plc | | | 33,106 | | | | 110,686 | |
Stobart Group, Ltd. (a) | | | 12,441 | | | | 26,538 | |
SuperGroup plc | | | 18,185 | | | | 307,439 | |
Synthomer plc | | | 102,899 | | | | 442,203 | |
TalkTalk Telecom Group plc (a) | | | 151,305 | | | | 443,440 | |
Tate & Lyle plc | | | 139,162 | | | | 1,240,851 | |
Ted Baker plc | | | 8,336 | | | | 269,995 | |
Telecom Plus plc (a) | | | 21,749 | | | | 303,502 | |
Thomas Cook Group plc (a) (c) | | | 438,591 | | | | 369,750 | |
Topps Tiles plc | | | 83,374 | | | | 116,895 | |
Tribal Group plc | | | 21,793 | | | | 14,798 | |
Trifast plc | | | 6,100 | | | | 11,183 | |
Trinity Mirror plc | | | 174,518 | | | | 205,011 | |
TT electronics plc | | | 79,682 | | | | 137,762 | |
Tullett Prebon plc | | | 109,940 | | | | 443,042 | |
Tullow Oil plc (a) (c) | | | 153,578 | | | | 537,343 | |
See accompanying notes to financial statements.
MSF-35
Metropolitan Series Fund
Met/Dimensional International Small Company Portfolio
Schedule of Investments as of June 30, 2016 (Unaudited)
Common Stocks—(Continued)
| | | | | | | | |
| Security Description | |
Shares | | | Value | |
|
United Kingdom—(Continued) | |
U & I Group plc | | | 54,856 | | | $ | 115,499 | |
UBM plc | | | 98,172 | | | | 840,463 | |
Ultra Electronics Holdings plc | | | 27,882 | | | | 648,518 | |
UNITE Group plc (The) | | | 97,058 | | | | 804,450 | |
Vectura Group plc (c) | | | 245,376 | | | | 529,060 | |
Vedanta Resources plc (a) | | | 28,343 | | | | 157,709 | |
Vesuvius plc | | | 97,752 | | | | 377,099 | |
Victrex plc | | | 29,970 | | | | 604,451 | |
Vitec Group plc (The) | | | 10,351 | | | | 72,607 | |
Volex plc (c) | | | 20,438 | | | | 8,379 | |
Vp plc | | | 1,199 | | | | 10,076 | |
Weir Group plc (The) | | | 18,886 | | | | 364,679 | |
WH Smith plc | | | 53,179 | | | | 1,128,304 | |
William Hill plc | | | 315,264 | | | | 1,091,970 | |
Wincanton plc (c) | | | 37,122 | | | | 91,941 | |
Wireless Group plc | | | 38,815 | | | | 160,515 | |
WS Atkins plc | | | 34,945 | | | | 621,410 | |
Xaar plc | | | 18,088 | | | | 100,895 | |
XP Power, Ltd. (a) | | | 3,554 | | | | 73,716 | |
Zeal Network SE (a) | | | 1,934 | | | | 67,460 | |
| | | | | | | | |
| | | | | | | 97,869,233 | |
| | | | | | | | |
|
United States—0.0% | |
Performance Sports Group, Ltd. (a) (c) | | | 1,854 | | | | 5,568 | |
| | | | | | | | |
Total Common Stocks
(Cost $575,490,008) | | | | | | | 635,536,655 | |
| | | | | | | | |
|
| Preferred Stocks—0.2% | |
|
Germany—0.2% | |
Biotest AG | | | 2,864 | | | | 43,592 | |
FUCHS Petrolub SE | | | 12,409 | | | | 487,360 | |
Jungheinrich AG | | | 13,710 | | | | 413,513 | |
Sartorius AG | | | 3,540 | | | | 259,479 | |
Sto SE & Co. KGaA | | | 102 | | | | 11,684 | |
| | | | | | | | |
Total Preferred Stocks
(Cost $1,056,334) | | | | | | | 1,215,628 | |
| | | | | | | | |
|
| Rights—0.0% | |
|
Australia—0.0% | |
Centrebet International, Ltd. (Litigation Units), Expires 07/29/16 (c) (d) | | | 9,600 | | | | 0 | |
eServGlobal, Ltd., Expires 07/29/16 (c) (d) | | | 10,767 | | | | 0 | |
| | | | | | | | |
| | | | | | | 0 | |
| | | | | | | | |
|
Austria—0.0% | |
Intercell AG (b) (c) (d) | | | 24,163 | | | | 0 | |
| | | | | | | | |
|
Belgium—0.0% | |
Fagron, Expires 07/01/16 (c) | | | 13,446 | | | | 12,892 | |
| | | | | | | | |
|
Hong Kong—0.0% | |
Noble Group, Ltd., Expires 07/20/16 (c) (d) | | | 588,600 | | | | 39,325 | |
Titan Petrochemicals Group, Ltd., Expires 06/23/16 (c) | | | 333,333 | | | | 0 | |
| | | | | | | | |
| | | | | | | 39,325 | |
| | | | | | | | |
|
Norway—0.0% | |
BW Offshore, Ltd., Expires 07/15/16 (c) | | | 1,356,860 | | | | 12,971 | |
| | | | | | | | |
|
Spain—0.0% | |
Acerinox S.A., Expires 07/13/16 (a) (c) | | | 66,969 | | | | 33,741 | |
Adveo Group International S.A., Expires 06/24/16 (c) | | | 6,292 | | | | 1,361 | |
| | | | | | | | |
| | | | | | | 35,102 | |
| | | | | | | | |
|
United Kingdom—0.0% | |
Fortune Oil CVR (b) (c) | | | 575,627 | | | | 0 | |
| | | | | | | | |
Total Rights
(Cost $187,226) | | | | | | | 100,290 | |
| | | | | | | | |
|
| Warrants—0.0% | |
|
Hong Kong—0.0% | |
Cheuk Nang Holdings, Ltd. (c) | | | 2,584 | | | | 550 | |
| | | | | | | | |
|
Singapore—0.0% | |
Ezion Holdings, Ltd. (a) (c) | | | 79,419 | | | | 8,961 | |
| | | | | | | | |
Total Warrants
(Cost $0) | | | | | | | 9,511 | |
| | | | | | | | |
|
| Short-Term Investments—15.4% | |
|
Mutual Fund—14.9% | |
State Street Navigator Securities Lending MET Portfolio (e) | | | 95,762,769 | | | | 95,762,769 | |
| | | | | | | | |
|
Repurchase Agreement—0.5% | |
Fixed Income Clearing Corp. Repurchase Agreement dated 06/30/16 at 0.030% to be repurchased at $3,194,688 on 07/01/16, collateralized by $3,235,000 Federal National Mortgage Association at 2.020% due 09/30/21 with a value of $3,263,306. | | | 3,194,685 | | | | 3,194,685 | |
| | | | | | | | |
Total Short-Term Investments
(Cost $98,957,454) | | | | | | | 98,957,454 | |
| | | | | | | | |
Total Investments—114.7%
(Cost $675,691,022) (f) | | | | | | | 735,819,538 | |
Other assets and liabilities (net)—(14.7)% | | | | | | | (94,237,002 | ) |
| | | | | | | | |
| Net Assets—100.0% | | | | | | $ | 641,582,536 | |
| | | | | | | | |
| * | Principal amount stated in U.S. dollars unless otherwise noted. |
See accompanying notes to financial statements.
MSF-36
Metropolitan Series Fund
Met/Dimensional International Small Company Portfolio
Schedule of Investments as of June 30, 2016 (Unaudited)
| (a) | All or a portion of the security was held on loan. As of June 30, 2016, the market value of securities loaned was $96,908,931 and the collateral received consisted of cash in the amount of $95,762,769 and non-cash collateral with a value of $6,054,716. The cash collateral is invested in a money market fund managed by an affiliate of the custodian. The non-cash collateral received consists primarily of government securities and bank letters of credit, and is held for the benefit of the Portfolio at the Portfolio’s custodian. The Portfolio cannot repledge or resell this collateral. As such, this collateral is excluded from the Statement of Assets and Liabilities. |
| (b) | Security was valued in good faith under procedures approved by the Board of Trustees. As of June 30, 2016, these securities represent 0.1% of net assets. |
| (c) | Non-income producing security. |
| (d) | Illiquid security. As of June 30, 2016, these securities represent 0.2% of net assets. |
| (e) | Represents investment of cash collateral received from securities on loan as of June 30, 2016. |
| (f) | As of June 30, 2016, the aggregate cost of investments was $675,691,022. The aggregate unrealized appreciation and depreciation of investments were $172,996,131 and $(112,867,615), respectively, resulting in net unrealized appreciation of $60,128,516. |
| | | | |
Ten Largest Industries as of
June 30, 2016 (Unaudited) | | % of
Net Assets | |
Machinery | | | 5.9 | |
Metals & Mining | | | 5.2 | |
Real Estate Management & Development | | | 4.3 | |
Food Products | | | 4.1 | |
Banks | | | 3.8 | |
Chemicals | | | 3.6 | |
Construction & Engineering | | | 3.5 | |
Hotels, Restaurants & Leisure | | | 3.4 | |
Media | | | 3.3 | |
Commercial Services & Supplies | | | 2.9 | |
See accompanying notes to financial statements.
MSF-37
Metropolitan Series Fund
Met/Dimensional International Small Company Portfolio
Schedule of Investments as of June 30, 2016 (Unaudited)
Fair Value Hierarchy
Accounting principles generally accepted in the United States of America (“GAAP”) define fair market value as the price that the Portfolio would receive to sell an asset or pay to transfer a liability in an orderly transaction between market participants at the measurement date. It establishes a fair value hierarchy that prioritizes inputs to valuation methods and requires disclosure of the fair value hierarchy, separately for each major category of assets and liabilities, that segregates fair value measurements into three levels. Levels 1, 2 and 3 of the fair value hierarchy are defined as follows:
Level 1 - unadjusted quoted prices in active markets for identical investments
Level 2 - other significant observable inputs (including, but not limited to, quoted prices for similar assets or liabilities in markets that are either active or inactive; inputs other than quoted prices that are observable such as interest rates, yield curves, volatilities, prepayment speeds, loss severities, credit risks, default rates, or other market corroborated inputs)
Level 3 - significant unobservable inputs based on the best information available in the circumstances, to the extent observable inputs are unavailable (including the Portfolio’s own assumptions used in determining the fair value of investments and derivative financial instruments)
The inputs or methodologies used for valuing investments are not necessarily an indication of the risk associated with investing in them. Changes to the inputs or methodologies used may result in transfers between levels, which will be recognized as of the beginning of the reporting period. Information on transfers between Level 1 and Level 2, if any, will be disclosed following the fair value hierarchy table below. A reconciliation of Level 3 securities, if any, will also be disclosed following the fair value hierarchy table. For more information about the Portfolio’s policy regarding the valuation of investments, please refer to the Notes to Financial Statements.
The following table summarizes the fair value hierarchy of the Portfolio’s investments as of June 30, 2016:
| | | | | | | | | | | | | | | | |
| Description | | Level 1 | | | Level 2 | | | Level 3 | | | Total | |
| Common Stocks | | | | | | | | | | | | | | | | |
Australia | | $ | 26,193 | | | $ | 42,492,271 | | | $ | 465,376 | | | $ | 42,983,840 | |
Austria | | | — | | | | 6,546,926 | | | | 164 | | | | 6,547,090 | |
Belgium | | | 900,131 | | | | 11,136,933 | | | | — | | | | 12,037,064 | |
Cambodia | | | — | | | | 305,120 | | | | — | | | | 305,120 | |
Canada | | | 54,011,190 | | | | 23,016 | | | | 816 | | | | 54,035,022 | |
China | | | — | | | | 97,861 | | | | — | | | | 97,861 | |
Denmark | | | — | | | | 13,432,002 | | | | — | | | | 13,432,002 | |
Finland | | | — | | | | 17,963,212 | | | | 1,815 | | | | 17,965,027 | |
France | | | — | | | | 32,197,190 | | | | — | | | | 32,197,190 | |
Germany | | | — | | | | 39,816,642 | | | | — | | | | 39,816,642 | |
Hong Kong | | | 624,832 | | | | 18,440,441 | | | | 34,085 | | | | 19,099,358 | |
Ireland | | | — | | | | 5,436,277 | | | | — | | | | 5,436,277 | |
Isle of Man | | | — | | | | 459,812 | | | | — | | | | 459,812 | |
Israel | | | 16,183 | | | | 4,870,303 | | | | — | | | | 4,886,486 | |
Italy | | | — | | | | 22,034,750 | | | | 0 | | | | 22,034,750 | |
Japan | | | — | | | | 157,471,836 | | | | — | | | | 157,471,836 | |
Liechtenstein | | | — | | | | 32,781 | | | | — | | | | 32,781 | |
Luxembourg | | | — | | | | 143,380 | | | | — | | | | 143,380 | |
Macau | | | — | | | | 46,707 | | | | — | | | | 46,707 | |
Malta | | | — | | | | 785,415 | | | | — | | | | 785,415 | |
Netherlands | | | — | | | | 13,236,920 | | | | 0 | | | | 13,236,920 | |
New Zealand | | | 40,045 | | | | 10,150,978 | | | | 68,663 | | | | 10,259,686 | |
Norway | | | 39,904 | | | | 5,047,367 | | | | — | | | | 5,087,271 | |
Philippines | | | — | | | | 19,640 | | | | — | | | | 19,640 | |
Portugal | | | — | | | | 2,063,686 | | | | 0 | | | | 2,063,686 | |
Singapore | | | 139,864 | | | | 7,865,596 | | | | 12,239 | | | | 8,017,699 | |
Spain | | | — | | | | 13,279,949 | | | | 0 | | | | 13,279,949 | |
Sweden | | | 297,394 | | | | 20,761,919 | | | | — | | | | 21,059,313 | |
Switzerland | | | 43,134 | | | | 34,685,292 | | | | — | | | | 34,728,426 | |
United Arab Emirates | | | — | | | | 95,604 | | | | — | | | | 95,604 | |
United Kingdom | | | 19,736 | | | | 97,676,915 | | | | 172,582 | | | | 97,869,233 | |
United States | | | 5,568 | | | | — | | | | — | | | | 5,568 | |
Total Common Stocks | | | 56,164,174 | | | | 578,616,741 | | | | 755,740 | | | | 635,536,655 | |
Total Preferred Stocks* | | | — | | | | 1,215,628 | | | | — | | | | 1,215,628 | |
See accompanying notes to financial statements.
MSF-38
Metropolitan Series Fund
Met/Dimensional International Small Company Portfolio
Schedule of Investments as of June 30, 2016 (Unaudited)
Fair Value Hierarchy—(Continued)
| | | | | | | | | | | | | | | | |
| Description | | Level 1 | | | Level 2 | | | Level 3 | | | Total | |
| Rights | | | | | | | | | | | | | | | | |
Australia | | $ | 0 | | | $ | — | | | $ | — | | | $ | 0 | |
Austria | | | — | | | | — | | | | 0 | | | | 0 | |
Belgium | | | 12,892 | | | | — | | | | — | | | | 12,892 | |
Hong Kong | | | 39,325 | | | | — | | | | — | | | | 39,325 | |
Norway | | | 12,971 | | | | — | | | | — | | | | 12,971 | |
Spain | | | 35,102 | | | | — | | | | — | | | | 35,102 | |
United Kingdom | | | — | | | | — | | | | 0 | | | | 0 | |
Total Rights | | | 100,290 | | | | — | | | | 0 | | | | 100,290 | |
Total Warrants* | | | 9,511 | | | | — | | | | — | | | | 9,511 | |
| Short-Term Investments | | | | | | | | | | | | | | | | |
Mutual Fund | | | 95,762,769 | | | | — | | | | — | | | | 95,762,769 | |
Repurchase Agreement | | | — | | | | 3,194,685 | | | | — | | | | 3,194,685 | |
Total Short-Term Investments | | | 95,762,769 | | | | 3,194,685 | | | | — | | | | 98,957,454 | |
Total Investments | | $ | 152,036,744 | | | $ | 583,027,054 | | | $ | 755,740 | | | $ | 735,819,538 | |
| | | | | | | | | | | | | | | | | |
Collateral for Securities Loaned (Liability) | | $ | — | | | $ | (95,762,769 | ) | | $ | — | | | $ | (95,762,769 | ) |
| * | See Schedule of Investments for additional detailed categorizations. |
Transfers from Level 2 to Level 1 in the amount of $320,556 were due to the discontinuation of a systematic fair valuation model factor. Transfers from Level 1 to Level 2 in the amount of $668,505 were due to the application of a systematic fair valuation model factor.
Following is a reconciliation of Level 3 assets for which significant unobservable inputs were used to determine fair value:
| | | | | | | | | | | | | | | | | | | | | | | | | | | | | | | | |
Investments in Securities | | Balance as of
December 31,
2015 | | | Realized
Gain/
(Loss) | | | Change in
Unrealized
Appreciation/
(Depreciation) | | | Sales | | | Transfers
into
Level 3 | | | Transfers
out of
Level 3 | | | Balance
as of
June 30,
2016 | | | Change in
Unrealized
Appreciation/
(Depreciation)
from Investments
Still Held at
June 30,
2016 | |
| Common Stocks | | | | | | | | | | | | | | | | | | | | | | | | | | | | | | | | |
Australia | | $ | 48,048 | | | $ | (537,713 | ) | | $ | 622,060 | | | $ | (2,805 | ) | | $ | 365,639 | | | $ | (29,853 | ) | | $ | 465,376 | | | $ | 116,836 | |
Austria | | | 428 | | | | — | | | | (264 | ) | | | — | | | | — | | | | — | | | | 164 | | | | (17,655 | ) |
Canada | | | 1,883 | | | | — | | | | (1,067 | ) | | | — | | | | — | | | | — | | | | 816 | | | | (1,067 | ) |
Finland | | | 1,777 | | | | — | | | | 38 | | | | — | | | | — | | | | — | | | | 1,815 | | | | 38 | |
France | | | 0 | | | | (37,056 | ) | | | 39,028 | | | | (1,972 | ) | | | — | | | | 0 | | | | — | | | | — | |
Hong Kong | | | 50,660 | | | | (10,673 | ) | | | 22,401 | | | | (34,712 | ) | | | 6,409 | | | | 0 | | | | 34,085 | | | | (12,707 | ) |
Italy | | | 10,922 | | | | — | | | | (10,922 | ) | | | — | | | | — | | | | — | | | | 0 | | | | (10,922 | ) |
Netherlands | | | 0 | | | | — | | | | 0 | | | | — | | | | — | | | | — | | | | 0 | | | | 0 | |
New Zealand | | | 0 | | | | — | | | | 12,516 | | | | — | | | | 56,147 | | | | — | | | | 68,663 | | | | 12,516 | |
Portugal | | | 0 | | | | — | | | | 0 | | | | — | | | | — | | | | — | | | | 0 | | | | 0 | |
Singapore | | | 49,232 | | | | — | | | | (3,867 | ) | | | — | | | | — | | | | (33,126 | ) | | | 12,239 | | | | (3,867 | ) |
Spain | | | 0 | | | | — | | | | 0 | | | | — | | | | — | | | | — | | | | 0 | | | | 0 | |
United Kingdom | | | 1,047,126 | | | | 621,288 | | | | (628,412 | ) | | | (1,095,186 | ) | | | 227,766 | | | | — | | | | 172,582 | | | | (55,209 | ) |
| Rights | | | | | | | | | | | | | | | | | | | | | | | | | | | | | | | | |
Austria | | | 0 | | | | — | | | | 0 | | | | — | | | | — | | | | — | | | | 0 | | | | 0 | |
United Kingdom | | | 764 | | | | — | | | | (764 | ) | | | — | | | | — | | | | — | | | | 0 | | | | (764 | ) |
| | | | | | | | | | | | | | | | | | | | | | | | | | | | | | | | |
Total | | $ | 1,210,840 | | | $ | 35,846 | | | $ | 50,747 | | | $ | (1,134,675 | ) | | $ | 655,961 | | | $ | (62,979 | ) | | $ | 755,740 | | | $ | 27,199 | |
| | | | | | | | | | | | | | | | | | | | | | | | | | | | | | | | |
Common stocks in the amount of $655,961 were transferred into Level 3 due to trading halts on the securities’ respective exchanges which resulted in the lack of observable inputs.
Common stocks in the amount of $62,979 were transferred out of Level 3 due to the resumption of trading activity which resulted in the availability of significant observable inputs.
See accompanying notes to financial statements.
MSF-39
Metropolitan Series Fund
Met/Dimensional International Small Company Portfolio
Statement of Assets and Liabilities
June 30, 2016 (Unaudited)
| | | | |
Assets | |
Investments at value (a) (b) | | $ | 735,819,538 | |
Cash denominated in foreign currencies (c) | | | 2,173,599 | |
Receivable for: | | | | |
Investments sold | | | 733,069 | |
Fund shares sold | | | 27,452 | |
Dividends and interest | | | 1,465,597 | |
Prepaid expenses | | | 4,212 | |
| | | | |
Total Assets | | | 740,223,467 | |
Liabilities | | | | |
Collateral for securities loaned | | | 95,762,769 | |
Payables for: | | | | |
Investments purchased | | | 1,687,591 | |
Fund shares redeemed | | | 173,806 | |
Accrued Expenses: | | | | |
Management fees | | | 431,894 | |
Distribution and service fees | | | 15,620 | |
Deferred trustees’ fees | | | 77,020 | |
Other expenses | | | 492,231 | |
| | | | |
Total Liabilities | | | 98,640,931 | |
| | | | |
Net Assets | | $ | 641,582,536 | |
| | | | |
Net Assets Consist of: | | | | |
Paid in surplus | | $ | 563,055,014 | |
Undistributed net investment income | | | 1,606,796 | |
Accumulated net realized gain | | | 16,829,232 | |
Unrealized appreciation on investments and foreign currency transactions | | | 60,091,494 | |
| | | | |
Net Assets | | $ | 641,582,536 | |
| | | | |
Net Assets | | | | |
Class A | | $ | 567,776,240 | |
Class B | | | 73,806,296 | |
Capital Shares Outstanding* | | | | |
Class A | | | 48,281,843 | |
Class B | | | 6,306,062 | |
Net Asset Value, Offering Price and Redemption Price Per Share | | | | |
Class A | | $ | 11.76 | |
Class B | | | 11.70 | |
| * | The Portfolio is authorized to issue an unlimited number of shares. |
| (a) | Identified cost of investments was $675,691,022. |
| (b) | Includes securities loaned at value of $96,908,931. |
| (c) | Identified cost of cash denominated in foreign currencies was $2,184,672. |
Statement of Operations
Six Months Ended June 30, 2016 (Unaudited)
| | | | |
Investment Income | |
Dividends (a) | | $ | 12,220,975 | |
Interest | | | 343 | |
Securities lending income | | | 801,662 | |
| | | | |
Total investment income | | | 13,022,980 | |
Expenses | | | | |
Management fees | | | 2,621,996 | |
Administration fees | | | 8,362 | |
Custodian and accounting fees | | | 228,347 | |
Distribution and service fees—Class B | | | 93,994 | |
Audit and tax services | | | 32,639 | |
Legal | | | 13,588 | |
Trustees’ fees and expenses | | | 15,990 | |
Shareholder reporting | | | 18,269 | |
Insurance | | | 2,294 | |
Miscellaneous | | | 85,166 | |
| | | | |
Total expenses | | | 3,120,645 | |
Less management fee waiver | | | (24,863 | ) |
| | | | |
Net expenses | | | 3,095,782 | |
| | | | |
Net Investment Income | | | 9,927,198 | |
| | | | |
Net Realized and Unrealized Gain (Loss) | | | | |
| Net realized gain on: | | | | |
Investments | | | 16,951,139 | |
Foreign currency transactions | | | 239,630 | |
| | | | |
Net realized gain | | | 17,190,769 | |
| | | | |
| Net change in unrealized depreciation on: | | | | |
Investments | | | (32,755,974 | ) |
Foreign currency transactions | | | (5,754 | ) |
| | | | |
Net change in unrealized depreciation | | | (32,761,728 | ) |
| | | | |
Net realized and unrealized loss | | | (15,570,959 | ) |
| | | | |
Net Decrease in Net Assets From Operations | | $ | (5,643,761 | ) |
| | | | |
| (a) | Net of foreign withholding taxes of $1,082,029. |
See accompanying notes to financial statements.
MSF-40
Metropolitan Series Fund
Met/Dimensional International Small Company Portfolio
Statements of Changes in Net Assets
| | | | | | | | |
| | | Six Months
Ended
June 30,
2016
(Unaudited) | | | Year Ended
December 31,
2015 | |
Increase (Decrease) in Net Assets: | | | | | | | | |
From Operations | | | | | | | | |
Net investment income | | $ | 9,927,198 | | | $ | 12,455,986 | |
Net realized gain | | | 17,190,769 | | | | 43,422,897 | |
Net change in unrealized depreciation | | | (32,761,728 | ) | | | (11,511,915 | ) |
| | | | | | | | |
Increase (decrease) in net assets from operations | | | (5,643,761 | ) | | | 44,366,968 | |
| | | | | | | | |
From Distributions to Shareholders | | | | | | | | |
Net investment income | | | | | | | | |
Class A | | | (12,648,546 | ) | | | (12,147,392 | ) |
Class B | | | (1,467,138 | ) | | | (1,324,201 | ) |
Net realized capital gains | | | | | | | | |
Class A | | | (36,530,415 | ) | | | (102,736,764 | ) |
Class B | | | (4,808,951 | ) | | | (12,835,328 | ) |
| | | | | | | | |
Total distributions | | | (55,455,050 | ) | | | (129,043,685 | ) |
| | | | | | | | |
Increase in net assets from capital share transactions | | | 17,299,877 | | | | 89,136,085 | |
| | | | | | | | |
Total increase (decrease) in net assets | | | (43,798,934 | ) | | | 4,459,368 | |
| | |
Net Assets | | | | | | | | |
Beginning of period | | | 685,381,470 | | | | 680,922,102 | |
| | | | | | | | |
End of period | | $ | 641,582,536 | | | $ | 685,381,470 | |
| | | | | | | | |
Undistributed net investment income | | | | | | | | |
End of period | | $ | 1,606,796 | | | $ | 5,795,282 | |
| | | | | | | | |
Other Information:
Capital Shares
Transactions in capital shares were as follows:
| | | | | | | | | | | | | | | | |
| | | Six Months Ended
June 30, 2016
(Unaudited) | | | Year Ended
December 31, 2015 | |
| | | Shares | | | Value | | | Shares | | | Value | |
Class A | | | | | | | | | | | | | | | | |
Sales | | | 11,166 | | | $ | 131,379 | | | | 1,577,058 | | | $ | 23,277,000 | |
Reinvestments | | | 4,143,131 | | | | 49,178,961 | | | | 8,484,797 | | | | 114,884,156 | |
Redemptions | | | (2,472,030 | ) | | | (31,893,784 | ) | | | (4,336,404 | ) | | | (65,559,909 | ) |
| | | | | | | | | | | | | | | | |
Net increase | | | 1,682,267 | | | $ | 17,416,556 | | | | 5,725,451 | | | $ | 72,601,247 | |
| | | | | | | | | | | | | | | | |
Class B | | | | | | | | | | | | | | | | |
Sales | | | 357,450 | | | $ | 4,446,998 | | | | 1,224,134 | | | $ | 16,756,624 | |
Reinvestments | | | 531,421 | | | | 6,276,089 | | | | 1,050,410 | | | | 14,159,529 | |
Redemptions | | | (882,332 | ) | | | (10,839,766 | ) | | | (1,020,649 | ) | | | (14,381,315 | ) |
| | | | | | | | | | | | | | | | |
Net increase | | | 6,539 | | | $ | (116,679 | ) | | | 1,253,895 | | | $ | 16,534,838 | |
| | | | | | | | | | | | | | | | |
Increase derived from capital shares transactions | | | | | | $ | 17,299,877 | | | | | | | $ | 89,136,085 | |
| | | | | | | | | | | | | | | | |
See accompanying notes to financial statements.
MSF-41
Metropolitan Series Fund
Met/Dimensional International Small Company Portfolio
Financial Highlights
| | | | | | | | | | | | | | | | | | | | | | | | |
| Selected per share data | | | | | | | | | | | | | | | | | | |
| | | Class A | |
| | | Six Months
Ended
June 30,
2016
(Unaudited) | | | Year Ended December 31, | |
| | | | 2015 | | | 2014 | | | 2013 | | | 2012 | | | 2011 | |
Net Asset Value, Beginning of Period | | $ | 12.97 | | | $ | 14.84 | | | $ | 16.83 | | | $ | 13.85 | | | $ | 13.25 | | | $ | 16.68 | |
| | | | | | | | | | | | | | | | | | | | | | | | |
Income (Loss) from Investment Operations | | | | | | | | | | | | | | | | | | | | | | | | |
Net investment income (a) | | | 0.19 | | | | 0.25 | | | | 0.26 | | | | 0.28 | | | | 0.27 | | | | 0.29 | |
Net realized and unrealized gain (loss) on investments | | | (0.28 | ) | | | 0.78 | | | | (1.28 | ) | | | 3.42 | | | | 2.04 | | | | (2.77 | ) |
| | | | | | | | | | | | | | | | | | | | | | | | |
Total from investment operations | | | (0.09 | ) | | | 1.03 | | | | (1.02 | ) | | | 3.70 | | | | 2.31 | | | | (2.48 | ) |
| | | | | | | | | | | | | | | | | | | | | | | | |
Less Distributions | | | | | | | | | | | | | | | | | | | | | | | | |
Distributions from net investment income | | | (0.29 | ) | | | (0.31 | ) | | | (0.38 | ) | | | (0.30 | ) | | | (0.36 | ) | | | (0.35 | ) |
Distributions from net realized capital gains | | | (0.83 | ) | | | (2.59 | ) | | | (0.59 | ) | | | (0.42 | ) | | | (1.35 | ) | | | (0.60 | ) |
| | | | | | | | | | | | | | | | | | | | | | | | |
Total distributions | | | (1.12 | ) | | | (2.90 | ) | | | (0.97 | ) | | | (0.72 | ) | | | (1.71 | ) | | | (0.95 | ) |
| | | | | | | | | | | | | | | | | | | | | | | | |
Net Asset Value, End of Period | | $ | 11.76 | | | $ | 12.97 | | | $ | 14.84 | | | $ | 16.83 | | | $ | 13.85 | | | $ | 13.25 | |
| | | | | | | | | | | | | | | | | | | | | | | | |
Total Return (%) (b) | | | (0.84 | )(c) | | | 6.08 | | | | (6.50 | ) | | | 27.94 | | | | 18.25 | | | | (16.08 | ) |
| | | | | | |
Ratios/Supplemental Data | | | | | | | | | | | | | | | | | | | | | | | | |
Gross ratio of expenses to average net assets (%) | | | 0.93 | (d) | | | 0.95 | | | | 0.98 | | | | 0.95 | | | | 0.98 | | | | 1.02 | |
Net ratio of expenses to average net assets (%) (e) | | | 0.92 | (d) | | | 0.94 | | | | 0.97 | | | | 0.94 | | | | 0.98 | | | | 1.02 | |
Ratio of net investment income to average net assets (%) | | | 3.09 | (d) | | | 1.78 | | | | 1.58 | | | | 1.86 | | | | 2.06 | | | | 1.86 | |
Portfolio turnover rate (%) | | | 3 | (c) | | | 12 | | | | 10 | | | | 12 | | | | 12 | | | | 25 | |
Net assets, end of period (in millions) | | $ | 567.8 | | | $ | 604.2 | | | $ | 606.4 | | | $ | 913.3 | | | $ | 713.4 | | | $ | 578.9 | |
| |
| | | Class B | |
| | | Six Months
Ended
June 30,
2016
(Unaudited) | | | Year Ended December 31, | |
| | | | 2015 | | | 2014 | | | 2013 | | | 2012 | | | 2011 | |
Net Asset Value, Beginning of Period | | $ | 12.89 | | | $ | 14.77 | | | $ | 16.75 | | | $ | 13.79 | | | $ | 13.20 | | | $ | 16.62 | |
| | | | | | | | | | | | | | | | | | | | | | | | |
Income (Loss) from Investment Operations | | | | | | | | | | | | | | | | | | | | | | | | |
Net investment income (a) | | | 0.18 | | | | 0.21 | | | | 0.21 | | | | 0.24 | | | | 0.24 | | | | 0.26 | |
Net realized and unrealized gain (loss) on investments | | | (0.29 | ) | | | 0.77 | | | | (1.26 | ) | | | 3.41 | | | | 2.02 | | | | (2.77 | ) |
| | | | | | | | | | | | | | | | | | | | | | | | |
Total from investment operations | | | (0.11 | ) | | | 0.98 | | | | (1.05 | ) | | | 3.65 | | | | 2.26 | | | | (2.51 | ) |
| | | | | | | | | | | | | | | | | | | | | | | | |
Less Distributions | | | | | | | | | | | | | | | | | | | | | | | | |
Distributions from net investment income | | | (0.25 | ) | | | (0.27 | ) | | | (0.34 | ) | | | (0.27 | ) | | | (0.32 | ) | | | (0.31 | ) |
Distributions from net realized capital gains | | | (0.83 | ) | | | (2.59 | ) | | | (0.59 | ) | | | (0.42 | ) | | | (1.35 | ) | | | (0.60 | ) |
| | | | | | | | | | | | | | | | | | | | | | | | |
Total distributions | | | (1.08 | ) | | | (2.86 | ) | | | (0.93 | ) | | | (0.69 | ) | | | (1.67 | ) | | | (0.91 | ) |
| | | | | | | | | | | | | | | | | | | | | | | | |
Net Asset Value, End of Period | | $ | 11.70 | | | $ | 12.89 | | | $ | 14.77 | | | $ | 16.75 | | | $ | 13.79 | | | $ | 13.20 | |
| | | | | | | | | | | | | | | | | | | | | | | | |
Total Return (%) (b) | | | (0.95 | )(c) | | | 5.76 | | | | (6.69 | ) | | | 27.60 | | | | 17.90 | | | | (16.25 | ) |
| | | | | | |
Ratios/Supplemental Data | | | | | | | | | | | | | | | | | | | | | | | | |
Gross ratio of expenses to average net assets (%) | | | 1.18 | (d) | | | 1.20 | | | | 1.23 | | | | 1.20 | | | | 1.23 | | | | 1.27 | |
Net ratio of expenses to average net assets (%) (e) | | | 1.17 | (d) | | | 1.19 | | | | 1.22 | | | | 1.19 | | | | 1.23 | | | | 1.27 | |
Ratio of net investment income to average net assets (%) | | | 2.83 | (d) | | | 1.50 | | | | 1.32 | | | | 1.58 | | | | 1.81 | | | | 1.69 | |
Portfolio turnover rate (%) | | | 3 | (c) | | | 12 | | | | 10 | | | | 12 | | | | 12 | | | | 25 | |
Net assets, end of period (in millions) | | $ | 73.8 | | | $ | 81.2 | | | $ | 74.5 | | | $ | 81.1 | | | $ | 63.5 | | | $ | 56.7 | |
| (a) | Per share amounts based on average shares outstanding during the period. |
| (b) | Total return does not reflect any insurance, sales, separate account or administrative charges of variable annuity or life insurance contracts or any additional expenses that contract owners may bear under their variable contracts. If these charges were included, the returns would be lower. |
| (c) | Periods less than one year are not computed on an annualized basis. |
| (d) | Computed on an annualized basis. |
| (e) | Includes the effects of management fee waivers (see Note 5 of the Notes to Financial Statements). |
See accompanying notes to financial statements.
MSF-42
Metropolitan Series Fund
Met/Dimensional International Small Company Portfolio
Notes to Financial Statements—June 30, 2016 (Unaudited)
1. Organization
Metropolitan Series Fund (the “Trust”) is organized as a Delaware statutory trust and registered under the Investment Company Act of 1940, as amended (the “1940 Act”), as an open-end management investment company. The Trust, which is managed by MetLife Advisers, LLC (“MetLife Advisers” or the “Adviser”), an affiliate of MetLife, Inc., is currently comprised of thirty series, each of which operates as a distinct investment vehicle of the Trust. The portfolio included in this report is Met/Dimensional International Small Company Portfolio (the “Portfolio”), which is diversified. Shares in the Portfolio are not offered directly to the general public and are currently available only to separate accounts established by Metropolitan Life Insurance Company (“MetLife”) and other affiliated life insurance companies.
The Portfolio has registered and offers two classes of shares: Class A and B shares. Shares of each Class of the Portfolio represent an equal pro rata interest in the Portfolio and generally give the shareholder the same voting, dividend, liquidation, and other rights. Investment income, realized and unrealized capital gains and losses, the common expenses of the Portfolio, and certain Portfolio-level expense reductions, if any, are allocated on a pro rata basis to each Class based on the relative net assets of each Class to the net assets of the Portfolio. Each Class of shares differs in its respective distribution plan and such distribution expenses are allocated to the corresponding Class of shares.
2. Significant Accounting Policies
The preparation of financial statements in conformity with accounting principles generally accepted in the United States of America (“GAAP”) requires management to make estimates and assumptions that affect the reported amounts of assets and liabilities and disclosure of contingent assets and liabilities as of the date of the financial statements and the reported amounts of income and expenses during the reporting period. Actual results could differ from those estimates. In the preparation of these financial statements, management has evaluated events and transactions subsequent to June 30, 2016 through the date the financial statements were issued.
The Portfolio is an investment company and follows the accounting and reporting guidance of the Financial Accounting Standards Board (“FASB”) Accounting Standards Codification Topic 946—Financial Services—Investment Companies and Topic 820—Fair Value Measurement. The following is a summary of significant accounting policies consistently followed by the Portfolio in the preparation of its financial statements.
Investment Valuation and Fair Value Measurements - Domestic and foreign equity securities, such as common stock, exchange-traded funds, rights, warrants, and preferred stock, that are traded on a securities exchange on a valuation date are generally valued at their last quoted sale price or official closing price on the primary exchange for such security, or, if no sales occurred on that day, at the last reported bid price. Equity securities traded over-the-counter (“OTC”) are generally valued at the last reported bid price. In the event of a major exchange closing during the trading day, the Adviser may use other market information obtained from quotation reporting systems, established market makers, or pricing services in valuing the securities. Valuation adjustments may be applied to certain foreign equity securities that are traded solely on foreign exchanges that close before the time as of which the Portfolio determines its NAV to account for the market movement between the close of the foreign exchanges and the time as of which the Portfolio determines its NAV. The Portfolio may use a systematic fair valuation model provided by a pricing service to value securities principally traded in these foreign markets in order to adjust for possible market movements or other changes that may occur between the close of the foreign exchanges and the time as of which the Portfolio determines its NAV. Foreign equity securities valued using these valuation adjustments are generally categorized as Level 2 within the fair value hierarchy. Equity securities that are actively traded, and have no valuation adjustments applied, are categorized as Level 1 within the fair value hierarchy. Other equity securities traded on inactive markets, or valued in reference to similar instruments traded on active markets, are generally categorized as Level 2 within the fair value hierarchy.
Investments in registered open-end management investment companies are valued at reported net asset value per share on the valuation date and are categorized as Level 1 within the fair value hierarchy.
Debt securities, including corporate, convertible and municipal bonds and notes; obligations of the U.S. Treasury and U.S. government agencies; foreign sovereign issues; and non-U.S. bonds, are generally valued on the basis of evaluated or composite bid quotations obtained from independent pricing services and/or brokers and dealers selected by the Adviser (each a “pricing service”), pursuant to authorization of and subject to general oversight by the Board of Trustees of the Trust (the “Board” or “Trustees”). Such pricing services may use matrix pricing, which considers observable inputs including, among other things, issuer details, maturity dates, interest rates, yield curves, rates of prepayment, credit risks/spreads, default rates, reported trades, broker dealer quotes and quoted prices for similar assets. Short-term obligations with a remaining maturity of sixty days or less may be valued at amortized cost in the absence of market quotes, so long as the amortized cost value of such short-term debt instrument is approximately the same as the fair value of the instrument as determined without the use of amortized cost valuation. Floating rate loans are generally valued on the
MSF-43
Metropolitan Series Fund
Met/Dimensional International Small Company Portfolio
Notes to Financial Statements—June 30, 2016—(Continued)
basis of an evaluated or composite average of aggregate bid and ask quotations supplied by brokers or dealers, as obtained from the pricing service. Securities that use similar valuation techniques and inputs as described above are generally categorized as Level 2 within the fair value hierarchy.
Options, whether on securities, indices, futures contracts, or otherwise, traded on exchanges are valued at the last sale price available as of the close of business on a valuation day or, if there is no such price available, at the last reported bid price. These types of options are categorized as Level 1 within the fair value hierarchy. Futures contracts that are traded on commodity exchanges are valued at their settlement prices established by the exchanges on which they are traded as of the close of such exchanges and are categorized as Level 1 within the fair value hierarchy.
If no current market value quotation or other observable inputs are readily available or market value quotations are deemed to be unreliable for an investment, the fair value of the investment will be determined in accordance with procedures approved by, and under the general supervision of, the Board. In such a circumstance, the Board will be assisted in its responsibility to determine the fair value of an investment by the Valuation Committee (“Committee”) of MetLife Advisers. The Committee provides general pricing oversight and fair value pricing determinations related to portfolio securities and meets on a regular basis to review reports relating to the valuation of the securities in the Portfolio. The Board has delegated to State Street Bank and Trust Company, the Trust’s custodian (“custodian”), the responsibility for calculating the net asset values (“NAVs”) of the Trust’s Portfolios. The Committee is responsible for overseeing the calculation of the NAVs of the Portfolios by the custodian. The Committee also periodically reviews pricing services, including the pricing services providing fair value pricing for the Portfolio’s foreign securities, and is responsible for overseeing the correction of pricing errors and addressing other pricing issues that arise in the ordinary course of business, such as making real-time fair value determinations, as necessary.
No single standard for determining the fair value of an investment can be set forth because fair value depends upon the facts and circumstances with respect to each investment. Information relating to any relevant factors may be obtained by the Committee from any appropriate source, including the subadviser of the Portfolio, the custodian, a pricing service, market maker and/or broker for such security or the issuer. Appropriate methodologies for determining fair value under particular circumstances may include: matrix pricing, a discounted cash flow analysis, comparisons of securities with comparable characteristics, value based on multiples of earnings, discount from market price of similar marketable securities or a combination of these and other methods.
Investment Transactions and Related Investment Income - Portfolio security transactions are recorded on the trade date. Dividend income is recorded on the ex-dividend date or, for certain foreign securities, when notified. Interest income, which includes amortization of premium and accretion of discount on debt securities, is recorded on the accrual basis. Realized gains and losses on investments are determined on the identified cost basis, which is the same basis used for federal income tax purposes. Foreign income and foreign capital gains on some foreign securities may be subject to foreign taxes, which are accrued as applicable. These foreign taxes have been provided for in accordance with the Portfolio’s understanding of the applicable countries’ tax rules and rates.
Foreign Currency Translation - The books and records of the Portfolio are maintained in U.S. dollars. The values of securities, currencies, and other assets and liabilities denominated in currencies other than the U.S. dollar are translated into U.S. dollars based upon foreign exchange rates prevailing at the end of the period. Purchases and sales of investment securities, income, and expenses are translated on the respective dates of such transactions. Because the values of investment securities are translated at the foreign exchange rates prevailing at the end of the period, that portion of the results of operations arising from changes in exchange rates and that portion of the results of operations reflecting fluctuations arising from changes in market prices of the investment securities are not separated. Such fluctuations are included in the net realized and unrealized gain or loss on investments.
Net realized foreign exchange gains or losses arise from activity in forward foreign currency exchange contracts, sales of foreign currency, currency gains or losses realized between the trade and settlement dates on securities transactions, and the difference between the amounts of dividends, interest, and foreign withholding taxes recorded by the Portfolio and the U.S. dollar equivalent of the amounts actually received or paid by the Portfolio. Net unrealized foreign exchange gains and losses arise from changes in the value of assets and liabilities, other than investment securities, resulting from changes in foreign exchange rates.
Dividends and Distributions to Shareholders - The Portfolio records dividends and distributions on the ex-dividend date. Net realized gains from securities transactions (if any) are generally distributed annually to shareholders. The timing and characterization of certain income and capital gains distributions are determined in accordance with federal tax regulations that may differ from GAAP. Permanent book and tax basis differences relating to shareholder distributions will result in reclassification between under/over distributed net investment income, accumulated net realized gains/losses, and paid-in surplus. Book-tax differences are primarily due to foreign currency transactions and passive foreign investment companies (PFICs). These adjustments have no impact on net assets or the results of operations.
Income Taxes - It is the Portfolio’s policy to comply with the requirements of the Internal Revenue Code of 1986, as amended, and regulations thereunder, applicable to regulated investment companies and to distribute, with respect to each taxable year, all of its taxable income to shareholders. Therefore, no federal income tax provision is required. The Portfolio files U.S. federal tax returns. No
MSF-44
Metropolitan Series Fund
Met/Dimensional International Small Company Portfolio
Notes to Financial Statements—June 30, 2016—(Continued)
income tax returns are currently under examination. The Portfolio’s federal tax returns for the prior three fiscal years remain subject to examination by the Internal Revenue Service. As of June 30, 2016, the Portfolio had no uncertain tax positions that would require financial statement recognition, or de-recognition or disclosure.
Repurchase Agreements - The Portfolio may enter into repurchase agreements, under the terms of a Master Repurchase Agreement (“MRA”), with selected commercial banks and broker-dealers, under which the Portfolio acquires securities as collateral and agrees to resell the securities at an agreed-upon time and at an agreed-upon price. The Portfolio, through the custodian or a subcustodian, under a tri-party repurchase agreement, receives delivery of the underlying securities collateralizing any repurchase agreements. It is the Portfolio’s policy that the market value of the collateral be equal to at least 100% of the repurchase price in the case of a repurchase agreement of one-day duration and equal to at least 102% of the repurchase price in the case of all other repurchase agreements. In the event of default or failure by a party to perform an obligation in connection with any repurchase transaction, the MRA gives the non-defaulting party the right to set-off claims and to apply property held by it in connection with any repurchase transaction against obligations owed to it.
At June 30, 2016, the Portfolio had investments in repurchase agreements with a gross value of $3,194,685, which is included as part of investments at value on the Statement of Assets and Liabilities. The value of the related collateral exceeded the value of the repurchase agreements at June 30, 2016.
Securities Lending - The Portfolio may lend its portfolio securities to certain qualified brokers who borrow securities in order to complete certain securities transactions. By lending its portfolio securities, the Portfolio attempts to increase its net investment income through the receipt of income on collateral held from securities on loan. Any gain or loss in the market price of the loaned securities that might occur and any interest earned or dividends declared during the term of the loan would accrue to the account of the Portfolio.
The Trust has entered into a Securities Lending Authorization Agreement with the custodian as the lending agent. Under this agreement, the custodian is authorized to loan portfolio securities on the Portfolio’s behalf. In exchange, the Portfolio receives either cash or securities as collateral against the loaned securities. The Portfolio receives collateral equal to at least 102% of the market value of the loaned securities (105% for foreign equity securities), at each loan’s inception. Collateral representing at least 100% of the market value of the loaned securities must be maintained for the duration of the loan. Cash collateral is generally invested in the State Street Navigator Securities Lending MET Portfolio (the “Navigator Portfolio”), a series of the State Street Navigator Securities Lending Trust that is managed by an affiliate of the custodian. The Navigator Portfolio is a registered money market fund that invests in a variety of high-quality, U.S. dollar-denominated instruments. If the market value of the collateral at the close of trading on a business day is less than 100% of the market value of the loaned securities at the close of trading on that day, the borrower shall be required to deliver, by the close of business on the following business day, an additional amount of collateral, so that the total amount of posted collateral is equal to at least 100% of the market value of all the loaned securities as of such preceding day. A portion of net income (income after the deduction of expenses and fees of the Navigator Portfolio) on the collateral is rebated to the borrower of the securities and the remainder is split between the custodian and the Portfolio. On loans collateralized by U.S. Treasuries, a fee is received from the borrower and is allocated between the Portfolio and the custodian. Income received by the Portfolio in securities lending transactions during the six months ended June 30, 2016 is reflected as Securities lending income on the Statement of Operations. The values of any securities loaned by the Portfolio and the related collateral at June 30, 2016 are disclosed in the footnotes to the Schedule of Investments. The value of the related collateral received by the Portfolio exceeded the value of the securities out on loan at June 30, 2016.
The risks associated with lending portfolio securities include, but are not limited to, possible delays in receiving additional collateral or in the recovery of the loaned securities, possible loss of rights in the collateral should the borrower fail financially, as well as risk of loss in the value of the collateral or the value of the investments made with the collateral. The lending agent shall indemnify the Portfolio in the case of default of any securities borrower.
The following table provides a breakdown of the collateral received and the remaining contractual maturities for securities lending transactions, which are accounted for as secured borrowings.
| | | | | | | | | | | | | | | | | | | | |
| | | Remaining Contractual Maturity of the Agreements
As of June 30, 2016 | |
| | | Overnight and
Continuous | | | Up to
30 Days | | | 31- 90
Days | | | Greater than
90 days | | | Total | |
| Securities Lending Transactions | | | | | | | | | | | | | | | | | | | | |
Common Stocks | | $ | (95,745,077 | ) | | $ | — | | | $ | — | | | $ | — | | | $ | (95,745,077 | ) |
Rights | | | (17,692 | ) | | | — | | | | — | | | | — | | | | (17,692 | ) |
Total | | $ | (95,762,769 | ) | | $ | — | | | $ | — | | | $ | — | | | $ | (95,762,769 | ) |
Total Borrowings | | $ | (95,762,769 | ) | | $ | — | | | $ | — | | | $ | — | | | $ | (95,762,769 | ) |
Gross amount of recognized liabilities for securities lending transactions | | | $ | (95,762,769 | ) |
| | | | | | | | | | | | | | | | | | | | |
MSF-45
Metropolitan Series Fund
Met/Dimensional International Small Company Portfolio
Notes to Financial Statements—June 30, 2016—(Continued)
3. Certain Risks
In the normal course of business, the Portfolio invests in securities and enters into transactions where risks exist due to fluctuations in the market (“market risk”) or failure of the other party to a transaction to perform (“credit and counterparty risk”).
Market Risk: The value of securities held by the Portfolio may decline in response to certain events, including those directly involving the companies whose securities are owned by the Portfolio; conditions affecting the general economy; overall market changes; local, regional or global political, social or economic instability; and currency, interest rate, and price fluctuations.
Credit and Counterparty Risk: The Portfolio may be exposed to counterparty risk, or the risk that an entity with which the Portfolio has unsettled or open transactions may default. The potential loss could exceed the value of the financial assets and liabilities recorded in the financial statements. Financial assets that potentially expose the Portfolio to credit and counterparty risk consist principally of cash due from counterparties and investments. The Portfolio manages counterparty risk by entering into agreements only with counterparties that it believes have the financial resources to honor their obligations and by monitoring the financial stability of those counterparties. The Portfolio’s investment adviser attempts to mitigate counterparty risk by (i) periodically assessing the creditworthiness of its trading partners, (ii) monitoring and/or limiting the amount of its net exposure to each individual counterparty based on its assessment, and (iii) requiring collateral from the counterparty for certain transactions. In order to preserve certain safeguards for non-standard settlement trades, the Portfolio restricts its exposure to credit and counterparty losses by entering into master netting agreements (“Master Agreements”) with counterparties (approved brokers) with whom it undertakes a significant volume of transactions. Master Agreements govern the terms of certain transactions, and reduce the counterparty risk associated with relevant transactions by specifying credit protection mechanisms and providing standardization that improves legal certainty. Master Agreements can also help limit counterparty risk by specifying collateral posting arrangements at pre-arranged exposure levels.
Repurchase and reverse repurchase agreements are primarily executed under Global Master Repurchase Agreements (“GMRAs”) or Master Repurchase Agreements (“MRAs”), which provide the rights to set-off. Each repurchase and reverse repurchase agreement is initially collateralized at the transaction level. In the event of default, the total market value exposure will be offset against collateral exchanged to date, which would result in a net receivable/(payable) that would be due from/to the counterparty.
Foreign Investment Risk: The investments by the Portfolio in foreign securities may involve risks not present in domestic investments. Because securities may be denominated in foreign currencies, may require settlement in foreign currencies and may pay interest or dividends in foreign currencies, changes in the relationship of these foreign currencies to the U.S. dollar can significantly affect the value of the investments and earnings of the Portfolio. Foreign investments may also subject the Portfolio to foreign government exchange restrictions, expropriation, taxation or other political, social or economic developments, all of which could affect the market and/or credit risk of the investments. In addition to the risks described above, risks may arise from forward foreign currency contracts with respect to the potential inability of counterparties to meet the terms of their contracts.
Additional risks associated with each type of investment are described above within the respective security type notes. The Portfolio’s prospectus includes a discussion of the principal risks of investing in the Portfolio.
4. Investment Transactions
Aggregate cost of purchases and proceeds of sales of investment securities, excluding short-term securities, for the six months ended June 30, 2016 were as follows:
| | | | | | | | | | | | |
Purchases | | | Sales | |
U.S. Government | | Non U.S. Government | | | U.S. Government | | | Non U.S. Government | |
| $0 | | $ | 17,769,719 | | | $ | 0 | | | $ | 47,116,360 | |
5. Investment Management Fees and Other Transactions with Affiliates
Investment Management Agreement - MetLife Advisers is the investment adviser to the Portfolio. The Trust has entered into an investment management agreement with MetLife Advisers with respect to the Portfolio. For providing investment management services to the Portfolio, MetLife Advisers receives monthly compensation at the following annual rates:
| | | | | | |
Management
Fees earned by
MetLife Advisers
for the six months ended
June 30, 2016 | | % per annum | | | Average Daily Net Assets |
| $2,621,996 | | | 0.850 | % | | Of the first $100 million |
| | | 0.800 | % | | On amounts in excess of $100 million |
MetLife Advisers has entered into an investment subadvisory agreement with respect to managing the Portfolio. Dimensional Fund Advisors LP is compensated by MetLife Advisers to provide subadvisory services for the Portfolio.
MSF-46
Metropolitan Series Fund
Met/Dimensional International Small Company Portfolio
Notes to Financial Statements—June 30, 2016—(Continued)
Management Fee Waivers - Pursuant to an expense agreement, MetLife Advisers has agreed, for the period May 1, 2016 to April 30, 2017, to reduce its advisory fees set out above under “Investment Management Agreement” for each class of the Portfolio as follows:
| | |
% per annum | | Average Daily Net Assets |
| 0.050% | | Of the first $100 million |
An identical expense agreement was in place for the period May 1, 2015 to April 30, 2016. Amounts waived for the six months ended June 30, 2016 are shown as management fee waivers in the Statement of Operations.
Certain officers and trustees of the Trust may also be officers of MetLife Advisers; however, such officers and trustees receive no compensation from the Trust.
On January 12, 2016, MetLife, Inc. announced its plan to pursue the separation of a substantial portion of its retail segment and is currently evaluating structural alternatives for such separation. It is anticipated that MetLife Advisers would be included in any such separation. Any separation transaction that might occur will be subject to the satisfaction of various conditions and approvals, including approval of any transaction by the MetLife, Inc. Board of Directors, satisfaction of any applicable requirements of the SEC, and receipt of insurance and other regulatory approvals and other anticipated conditions. Because the form of a separation had yet to be determined, MetLife, Inc. cannot currently provide a specific potential completion date or information about the potential impact on MetLife Advisers. No assurance can be given regarding the form that a separation transaction may take or the specific terms thereof, or that a separation will in fact occur. Depending on the form a separation takes, MetLife Advisers’ continued service as investment adviser to the Trusts could be subject to the satisfaction of various conditions and approvals, which may include obtaining approvals from the Trusts’ Board and shareholders.
Transfer Agency Agreement - MetLife serves as the transfer agent for the Trust. MetLife receives no fees for its services to the Trust under the transfer agency agreement.
Distribution and Service Fees - The Trust has a distribution agreement with MetLife Investors Distribution Company (“MIDC” or the “Distributor”) in which MIDC serves as the distributor for the Portfolio’s Class A and B Shares. MIDC is a wholly-owned subsidiary of MetLife Investors Group, LLC, an affiliate of the Adviser. The Trust has also adopted a Distribution and Service Plan under Rule 12b-1 of the 1940 Act for the Portfolio’s Class B Shares. Under the Distribution and Service Plan, the Class B Shares of the Portfolio pay a fee to compensate the Insurance Companies (or their affiliates) and other broker-dealers and financial intermediaries involved in the offer and sale of Portfolio shares for promoting or selling and servicing the Class B Shares. The fees under the Distribution and Service Plan for each class of the Portfolio’s shares are calculated as a percentage of the Portfolio’s average daily net assets that are attributable to that Class. Currently, the fee is 0.25% per year for Class B Shares. Amounts incurred by the Portfolio for the six months ended June 30, 2016 are shown as Distribution and service fees in the Statement of Operations.
Deferred Trustee Compensation - Each Trustee who is not currently an employee of the Adviser or any of its affiliates receives compensation from the Trust for his or her service to the Trust. A deferred compensation plan (the “Plan”) is available to the Trustees on a voluntary basis. Deferred amounts remain in the Trust until distributed in accordance with the provisions of the Plan. The value of a participating Trustee’s deferral account is based on theoretical investments of deferred amounts on the normal payment dates in certain portfolios of the Trust or Met Investors Series Trust, an affiliate of the Trust, as designated by the participating Trustee. Changes in the value of participants’ deferral accounts are reflected as Trustees’ fees and expenses in the Statement of Operations. The portion of the accrued obligations allocated to the Portfolio under the Plan is reflected as Deferred trustees’ fees in the Statement of Assets and Liabilities.
6. Contractual Obligations
Under the Trust’s organizational documents, its officers and Trustees may be indemnified against certain liabilities and expenses arising out of the performance of their duties to the Trust. Additionally, the Trust has a variety of indemnification obligations under contracts with its service providers. The Trust’s maximum exposure under these arrangements is unknown, as this would involve future claims that may be made against the Trust that have not yet occurred.
7. Income Tax Information
The tax character of distributions paid for the years ended December 31, 2015 and 2014 were as follows:
| | | | | | | | | | | | | | | | | | | | |
Ordinary Income | | | Long-Term Capital Gain | | | Total | |
2015 | | 2014 | | | 2015 | | | 2014 | | | 2015 | | | 2014 | |
| $14,989,927 | | $ | 25,651,476 | | | $ | 114,053,758 | | | $ | 28,812,881 | | | $ | 129,043,685 | | | $ | 54,464,357 | |
MSF-47
Metropolitan Series Fund
Met/Dimensional International Small Company Portfolio
Notes to Financial Statements—June 30, 2016—(Continued)
As of December 31, 2015, the components of distributable earnings (accumulated losses) on a federal income tax basis were as follows:
| | | | | | | | | | | | | | | | | | |
Undistributed
Ordinary
Income | | Undistributed
Long-Term
Capital Gain | | | Net
Unrealized
Appreciation | | | Other
Accumulated
Capital Losses | | | Total | |
| $14,660,895 | | $ | 40,564,605 | | | $ | 84,476,503 | | | $ | — | | | $ | 139,702,003 | |
The Portfolio utilizes the provisions of the federal income tax laws that provide for the carryforward of capital losses for prior years, offsetting such losses against any future realized capital gains. Under the Regulated Investment Company Modernization Act of 2010 (the “Act”), net capital losses recognized after December 22, 2010 may be carried forward indefinitely and their character is retained as short-term and/or long-term losses. Previously, net capital losses were carried forward for up to eight years and treated as short-term losses. As a transition rule, the Act requires that post-enactment net capital losses be used before pre-enactment net capital losses.
As of December 31, 2015, the Portfolio had no post-enactment accumulated capital losses and no pre-enactment accumulated capital loss carryforwards.
MSF-48
Metropolitan Series Fund
Met/Wellington Balanced Portfolio (formerly, WMC Balanced Portfolio)
Managed by Wellington Management Company LLP
Portfolio Manager Commentary*
PERFORMANCE
For the six month period ended June 30, 2016, the Class A, B and E shares of the Met/Wellington Balanced Portfolio returned 3.29%, 3.20%, and 3.23%, respectively. The Portfolio’s benchmarks, the Standard & Poor’s (“S&P”) 500 Index1 and the Barclays U.S. Aggregate Bond Index3, returned 3.84% and 5.31%, respectively. A blend of the S&P 500 Index (60%) and the Barclays U.S. Aggregate Bond Index (40%) returned 4.52%.
MARKET ENVIRONMENT / CONDITIONS
U.S. equities rose during the first half of 2016, notwithstanding significant volatility during the period. Early in the first quarter of 2016, stocks plunged and moved in virtual lockstep with the price of oil as fears of a recession and weakness in China weighed on investors’ minds. However, equities surged in the second half of the quarter as solid economic data, a stabilization in oil prices, and accommodative commentary from the Federal Reserve (the “Fed”) helped to calm the market’s early year jitters. The Federal Open Market Committee’s (the “FOMC”) March statement surprised many market participants with its dovish tone. The FOMC lowered its inflation forecast for 2016 and suggested only two rate hikes this year, down from four, implied back in December 2015. The policy statement also removed reference to the balance of risks, noting that “global economic and financial developments continue to pose risks.”
Stocks continued to climb during the second quarter of 2016, ending June with a 3.8% year-to-date gain, as measured by the S&P 500 Index. A better-than-expected U.S. corporate earnings season and an encouraging economic backdrop helped sustain the rally. The continued rebound of oil prices buoyed equities to start off April but performance tapered off towards the end of the month amid mixed economic data and corporate earnings reports. The Fed remained a focal point as firm U.S. inflation data and hawkish commentary from several FOMC members during May raised market expectations of a summer rate hike. However, the U.K.’s vote to leave the European Union (“Brexit”) took center stage late in the quarter, overshadowing the lower probability of a near-term interest rate hike by the Fed following the disappointing payroll report in early June. At its June meeting, the Fed left rates unchanged and reduced its U.S. growth and long-run policy rate forecasts, citing mixed U.S. economic data and uncertainty about global economic and financial developments. Fed chair Janet Yellen also explicitly mentioned the uncertainty surrounding the U.K.’s European Union referendum as a factor in the decision. After plunging 5.3% in the two trading days following the Brexit, U.S. stocks staged an impressive 4.9% comeback in the final three days of the quarter, further evidence that the 7-year-old bull market remains intact.
Returns varied noticeably by market-cap, as mid- and large-cap stocks outperformed small-cap stocks, as measured by the S&P Midcap 400 Index, the S&P 500 Index, and the Russell 2000 Index, respectively, though all three groups posted positive returns during the six-month period.
Global fixed income markets were influenced by global economic growth concerns, central bank monetary policies, oil prices, and the U.K.’s vote to leave the European Union. During the first quarter, falling oil prices, concerns over slowing growth in China, and questions about the efficacy of central bank monetary policies sparked a broad sell-off in credit markets, while government bond prices benefitted from their safe-haven status. Following the lead of European central banks, the Bank of Japan introduced negative interest rates for the first time as the volatility and instability in financial markets threatened to tip Japan back into deflation. Markets reversed course in mid-February as the major central banks adopted more dovish stances in an effort to ease market risk.
Absolute returns in the major fixed income spread sectors were positive, aided by the decline in government bond yields. On an excess return basis, most spread sectors posted positive returns over the full six-month period, including U.S. High Yield, Emerging Market Debt, and Investment Grade Corporates, as spreads tightened over the period. However, this masked considerable volatility in spread sector returns within the period, including a drawdown in many spread sectors in the first part of 2016 and in the aftermath of Brexit.
PORTFOLIO REVIEW / PERIOD END POSITIONING
The Portfolio underperformed its custom benchmark, consisting of 60% S&P 500 Index / 40% Barclays U.S. Aggregate Bond Index, for the period ended June 30, 2016.
The Equity Portfolio underperformed its benchmark, the S&P 500 Index, for the six month period. Given the industry-neutral structure of the Portfolio, stock selection was the primary driver of the relative performance. In particular, selection within the Financials, Information Technology, and Consumer Staples sectors detracted most from relative results. This was partially offset by stronger stock selection within the Industrials, Consumer Discretionary, and Health Care sectors.
The Portfolio’s exposure to Santander Consumer and Bank of America weighed on relative results, as did not owning several large benchmark constituents including Exxon Mobil and AT&T. The Portfolio’s holdings in Newfield Exploration and Marsh & McLennan were among the stocks that contributed most to relative performance during the period. Not holding benchmark constituent Citigroup also aided relative results.
The Fixed Income Portfolio outperformed its benchmark, the Barclay’s U.S. Aggregate Bond Index, for the period. Sector allocation contributed positively to relative performance; however this was partially offset by negative security selection. The Portfolio’s exposure to Bank Loans and Collateralized Loan Obligations (“CLOs”) as well as positioning within agency Mortgage-Backed Securities (“MBS”) contributed to relative performance. Security selection within Investment Grade industrials also benefitted results. High Yield was a negative contributor overall; positive results from an allocation to
MSF-1
Metropolitan Series Fund
Met/Wellington Balanced Portfolio (formerly, WMC Balanced Portfolio)
Managed by Wellington Management Company LLP
Portfolio Manager Commentary*—(Continued)
BB rated issuers were outweighed by the Portfolio’s High Yield index hedges, which reduced overall exposure to the strong performing sector. Exposure to European financials also detracted. The Portfolio’s underweight to Emerging Markets Debt and positioning within Commercial Mortgage Backed Securities (“CMBS”) was also a headwind. Additionally, the Portfolio had been positioned for rising inflation expectations as we believed the TIPS market was pricing in unrealistically low inflation assumptions over the longer-term. Inflation expectations instead declined amid heightened global growth concerns. As a result, our inflation positioning detracted from relative performance.
During the period, the Fixed Income Portfolio used Treasury futures, swaps, and options to manage duration and yield curve positioning. The Portfolio also used currency forwards, futures, and options to implement non-US rate and currency positions. Credit Default Swaps (“CDS”) were used to manage credit exposure, and Investment Grade and High Yield CDS index positions were used as a source of liquidity and to manage overall portfolio risk.
The Equity Portfolio is generally industry-neutral relative to the benchmark. On an absolute basis, the Portfolio’s largest exposures were to the Software & Services, Health Care Equipment & Services, Capital Goods, and Food, Beverage & Tobacco industries at the end of the period. The Portfolio increased its exposure modestly to the Health Care Equipment & Services, Utilities, and Food, Beverage & Tobacco industries, with marginal decreases in its exposure to the Banks and Consumer Services industries. The Portfolio had no exposure to the Telecommunication Services sector as the analyst covering these stocks prefers the broadband cable companies he also covers which are categorized within the Consumer Discretionary sector.
At the end of the period, the Fixed Income Portfolio was tactically long duration however the team has a neutral to short duration bias and continues to be positioned for rising inflation expectations. The Portfolio was underweight Credit, but continued to favor Financials and Communications issuers. The Portfolio was overweight agency MBS and CMBS. The Portfolio continued to hold allocations to non-agency MBS, CLOs, Bank Loans, and BB rated high yield as of the end of the period.
Cheryl M. Duckworth
Mark D. Mandel
Joseph F. Marvan
Robert D. Burn
Campe Goodman
Portfolio Managers
Wellington Management Company LLP
* This commentary may include statements that constitute “forward-looking statements” under the U.S. securities laws. Forward-looking statements include, among other things, projections, estimates, and information about possible or future results related to the Portfolio, market or regulatory developments. The views expressed above are not guarantees of future performance or economic results and involve certain risks, uncertainties and assumptions that could cause actual outcomes and results to differ materially from the views expressed herein. The views expressed above are subject to change at any time based upon economic, market, or other conditions and the subadvisory firm undertakes no obligation to update the views expressed herein. Any discussions of specific securities should not be considered a recommendation to buy or sell those securities. The views expressed above (including any forward-looking statement) may not be relied upon as investment advice or as an indication of the Portfolio’s trading intent. Information about the Portfolio’s holdings, asset allocation or country diversification is historical and is not an indication of future Portfolio composition, which may vary. Direct investment in any index is not possible. The performance of any index mentioned in this commentary has not been adjusted for ongoing management, distribution and operating expenses, and sales charges applicable to mutual fund investments. In addition, the returns do not reflect additional fees charged by separate accounts or variable insurance contracts that an investor in the Portfolio may pay. If these additional fees were reflected, performance would have been lower.
MSF-2
Metropolitan Series Fund
Met/Wellington Balanced Portfolio (formerly, WMC Balanced Portfolio)
A $10,000 INVESTMENT COMPARED TO THE S&P 500 INDEX, THE BARCLAYS U.S. AGGREGATE BOND INDEX & THE RUSSELL 1000 INDEX
SIX MONTH RETURN & AVERAGE ANNUAL RETURNS (%) AS OF JUNE 30, 2016
| | | | | | | | | | | | | | | | |
| | | 6 Month | | | 1 Year | | | 5 Year | | | 10 Year | |
| Met/Wellington Balanced Portfolio | | | | | | | | | | | | | | | | |
Class A | | | 3.29 | | | | 3.51 | | | | 8.90 | | | | 6.34 | |
Class B | | | 3.20 | | | | 3.31 | | | | 8.63 | | | | 6.08 | |
Class E | | | 3.23 | | | | 3.40 | | | | 8.74 | | | | 6.18 | |
| S&P 500 Index | | | 3.84 | | | | 3.99 | | | | 12.09 | | | | 7.42 | |
| Russell 1000 Index2 | | | 3.74 | | | | 2.93 | | | | 11.88 | | | | 7.51 | |
| Barclays U.S. Aggregate Bond Index | | | 5.31 | | | | 6.00 | | | | 3.76 | | | | 5.13 | |
1 The Standard & Poor’s (S&P) 500 Index is an unmanaged index consisting of 500 stocks chosen for market size, liquidity, and industry group representation. It is a market-weighted index (stock price times number of shares outstanding) with each stock’s weight in the Index proportionate to its market value.
2 The Russell 1000 Index is an unmanaged measure of the 1,000 largest companies in the Russell 3000 Index, which represents approximately 90% of the investable U.S. equity market.
3 Barclays U.S. Aggregate Bond Index is a broad based benchmark that measures the investment grade, U.S. dollar-denominated, fixed-rate taxable bond market, including Treasuries, government-related and corporate securities, mortgage-backed securities, asset-backed securities, and commercial mortgage-backed securities.
Portfolio performance is calculated including reinvestment of all income and capital gain distributions. Performance numbers are net of all Portfolio expenses but do not include any insurance, sales, separate account or administrative charges of variable annuity or life insurance contracts or any additional expenses that participants may bear relating to the operations of their plans. If these charges were included, the returns would be lower. The performance of any index referenced above has not been adjusted for ongoing management, distribution and operating expenses, and sales charges applicable to mutual fund investments. Direct investment in any index is not possible. The performance of Class A shares, as set forth in the line graph above, will differ from that of other classes because of the difference in expenses paid by policyholders investing in the different share classes.
This information represents past performance and is not indicative of future results. Investment return and principal value may fluctuate so that shares, upon redemption, may be worth more or less than the original cost.
PORTFOLIO COMPOSITION AS OF JUNE 30, 2016
Top Equity Holdings
| | | | |
| | | % of
Net Assets | |
| Alphabet, Inc. | | | 1.6 | |
| Amazon.com, Inc. | | | 1.5 | |
| Medtronic plc | | | 1.2 | |
| Apple, Inc. | | | 1.2 | |
| Wells Fargo & Co. | | | 1.1 | |
Top Fixed Income Issuers
| | | | |
| | | % of
Net Assets | |
| Fannie Mae 30 Yr. Pool | | | 7.0 | |
| Freddie Mac 30 Yr. Gold Pool | | | 6.0 | |
| Fannie Mae 15 Yr. Pool | | | 2.5 | |
| Ginnie Mae II 30 Yr. Pool | | | 2.2 | |
| Ginnie Mae I 30 Yr. Pool | | | 1.0 | |
Top Equity Sectors
| | | | |
| | | % of
Net Assets | |
| Information Technology | | | 10.4 | |
| Financials | | | 9.9 | |
| Health Care | | | 9.6 | |
| Consumer Discretionary | | | 7.2 | |
| Consumer Staples | | | 6.7 | |
Top Fixed Income Sectors
| | | | |
| | | % of
Net Assets | |
| U.S. Treasury & Government Agencies | | | 21.3 | |
| Corporate Bonds & Notes | | | 13.8 | |
| Asset-Backed Securities | | | 6.8 | |
| Mortgage-Backed Securities | | | 6.0 | |
| Floating Rate Loans | | | 2.2 | |
MSF-3
Metropolitan Series Fund
Met/Wellington Balanced Portfolio (formerly, WMC Balanced Portfolio)
Understanding Your Portfolio’s Expenses (Unaudited)
Shareholder Expense Example
As a shareholder of the Portfolio, you incur ongoing costs, including management fees; distribution and service (12b-1) fees; and other Portfolio expenses. This example is intended to help you understand your ongoing costs (in dollars) (referred to as “expenses”) of investing in the Portfolio and compare these costs with the ongoing costs of investing in other mutual funds. The example is based on an investment of $1,000 invested at the beginning of the period and held for the entire period, January 1, 2016 through June 30, 2016.
Actual Expenses
The first line for each share class of the Portfolio in the table below provides information about actual account values and actual expenses. You may use the information in this line, together with the amount you invested in the particular share class of the Portfolio, to estimate the expenses that you paid over the period. Simply divide your account value by $1,000 (for example, an $8,600 account value divided by $1,000 = 8.6), then multiply the result by the number in the first line under the heading entitled “Expenses Paid During Period” to estimate the expenses you paid on your account during this period.
Hypothetical Example for Comparison Purposes
The second line for each share class of the Portfolio in the table below provides information about hypothetical account values and hypothetical expenses based on the Portfolio’s actual expense ratio and an assumed rate of return of 5% per year before expenses, which is not the Portfolio’s actual return. The hypothetical account values and expenses may not be used to estimate the actual ending account balance or expenses you paid for the period. You may use this information to compare the ongoing costs of investing in the Portfolio and other funds. To do so, compare this 5% hypothetical example with the 5% hypothetical examples that appear in the shareholder reports of the other funds.
Please note that the expenses shown in the table are meant to highlight your ongoing costs only and do not reflect any fees or charges of your variable insurance product or any additional expenses that participants in certain eligible qualified plans may bear relating to the operations of their plan. Therefore, the second line for each share class in the table is useful in comparing ongoing costs only, and will not help you determine the relative total costs of owning different funds. In addition, if these other costs were included, your costs would have been higher.
| | | | | | | | | | | | | | | | | | |
Met/Wellington Balanced Portfolio
(formerly, WMC Balanced Portfolio) | | | | Annualized
Expense
Ratio | | | Beginning
Account Value
January 1,
2016 | | | Ending
Account Value
June 30,
2016 | | | Expenses Paid
During Period**
January 1, 2016
to
June 30,
2016 | |
Class A(a) | | Actual | | | 0.52 | % | | $ | 1,000.00 | | | $ | 1,032.90 | | | $ | 2.63 | |
| | Hypothetical* | | | 0.52 | % | | $ | 1,000.00 | | | $ | 1,022.28 | | | $ | 2.61 | |
| | | | | |
Class B(a) | | Actual | | | 0.77 | % | | $ | 1,000.00 | | | $ | 1,032.00 | | | $ | 3.89 | |
| | Hypothetical* | | | 0.77 | % | | $ | 1,000.00 | | | $ | 1,021.03 | | | $ | 3.87 | |
| | | | | |
Class E(a) | | Actual | | | 0.67 | % | | $ | 1,000.00 | | | $ | 1,032.30 | | | $ | 3.39 | |
| | Hypothetical* | | | 0.67 | % | | $ | 1,000.00 | | | $ | 1,021.53 | | | $ | 3.37 | |
* Hypothetical assumes a rate of return of 5% per year before expenses.
** Expenses paid are equal to the Portfolio’s annualized expense ratio for the most recent six month period, as shown above, multiplied by the average account value over the period, multiplied by the number of days (182 days) in the most recent fiscal half-year, divided by 366 (to reflect the one-half year period).
(a) The annualized expense ratio shown reflects the impact of the management fee waiver as described in Note 6 of the Notes to Financial Statements.
MSF-4
Metropolitan Series Fund
Met/Wellington Balanced Portfolio (formerly, WMC Balanced Portfolio)
Schedule of Investments as of June 30, 2016 (Unaudited)
Common Stocks—58.1% of Net Assets
| | | | | | | | |
| Security Description | | Shares | | | Value | |
| | |
Aerospace & Defense—2.3% | | | | | | | | |
Boeing Co. (The) | | | 30,890 | | | $ | 4,011,684 | |
General Dynamics Corp. | | | 27,540 | | | | 3,834,670 | |
Honeywell International, Inc. | | | 85,271 | | | | 9,918,723 | |
Lockheed Martin Corp. | | | 27,396 | | | | 6,798,865 | |
Northrop Grumman Corp. | | | 17,652 | | | | 3,923,686 | |
| | | | | | | | |
| | | | | | | 28,487,628 | |
| | | | | | | | |
| | |
Air Freight & Logistics—0.3% | | | | | | | | |
FedEx Corp. | | | 15,536 | | | | 2,358,054 | |
XPO Logistics, Inc. (a) (b) | | | 40,880 | | | | 1,073,509 | |
| | | | | | | | |
| | | | | | | 3,431,563 | |
| | | | | | | | |
| | |
Airlines—0.1% | | | | | | | | |
American Airlines Group, Inc. | | | 18,445 | | | | 522,178 | |
Southwest Airlines Co. | | | 18,150 | | | | 711,661 | |
| | | | | | | | |
| | | | | | | 1,233,839 | |
| | | | | | | | |
| | |
Banks—2.5% | | | | | | | | |
Bank of America Corp. | | | 846,450 | | | | 11,232,392 | |
PNC Financial Services Group, Inc. (The) | | | 81,692 | | | | 6,648,912 | |
Wells Fargo & Co. | | | 283,689 | | | | 13,427,000 | |
| | | | | | | | |
| | | | | | | 31,308,304 | |
| | | | | | | | |
| | |
Beverages—2.8% | | | | | | | | |
Anheuser-Busch InBev S.A. (ADR) | | | 16,427 | | | | 2,163,108 | |
Coca-Cola Co. (The) | | | 53,901 | | | | 2,443,332 | |
Constellation Brands, Inc. - Class A | | | 18,760 | | | | 3,102,904 | |
Dr Pepper Snapple Group, Inc. | | | 35,278 | | | | 3,408,913 | |
Molson Coors Brewing Co. - Class B | | | 36,223 | | | | 3,663,232 | |
Monster Beverage Corp. (a) | | | 49,575 | | | | 7,967,198 | |
PepsiCo, Inc. | | | 111,714 | | | | 11,834,981 | |
| | | | | | | | |
| | | | | | | 34,583,668 | |
| | | | | | | | |
| | |
Biotechnology—0.9% | | | | | | | | |
Aduro Biotech, Inc. (a) (b) | | | 8,200 | | | | 92,742 | |
Alkermes plc (a) | | | 30,115 | | | | 1,301,570 | |
Alnylam Pharmaceuticals, Inc. (a) (b) | | | 4,677 | | | | 259,527 | |
Bluebird Bio, Inc. (a) (b) | | | 7,380 | | | | 319,480 | |
Celgene Corp. (a) | | | 20,960 | | | | 2,067,285 | |
Chiasma, Inc. (a) (b) | | | 20,570 | | | | 59,447 | |
Dicerna Pharmaceuticals, Inc. (a) (b) | | | 5,610 | | | | 16,830 | |
GlycoMimetics, Inc. (a) (b) | | | 55,683 | | | | 404,815 | |
Incyte Corp. (a) | | | 18,180 | | | | 1,454,036 | |
Ironwood Pharmaceuticals, Inc. (a) (b) | | | 74,300 | | | | 971,472 | |
Karyopharm Therapeutics, Inc. (a) | | | 35,087 | | | | 235,434 | |
Nivalis Therapeutics, Inc. (a) | | | 28,240 | | | | 129,904 | |
Novavax, Inc. (a) (b) | | | 76,050 | | | | 552,884 | |
Otonomy, Inc. (a) (b) | | | 21,612 | | | | 343,199 | |
PTC Therapeutics, Inc. (a) (b) | | | 23,090 | | | | 162,092 | |
Regeneron Pharmaceuticals, Inc. (a) | | | 4,644 | | | | 1,621,824 | |
Regulus Therapeutics, Inc. (a) (b) | | | 25,920 | | | | 74,909 | |
Syndax Pharmaceuticals, Inc. (a) (b) | | | 20,000 | | | | 197,000 | |
TESARO, Inc. (a) (b) | | | 10,800 | | | | 907,740 | |
Trevena, Inc. (a) (b) | | | 58,243 | | | | 366,931 | |
| | | | | | | | |
| | | | | | | 11,539,121 | |
| | | | | | | | |
| | |
Building Products—0.1% | | | | | | | | |
Fortune Brands Home & Security, Inc. (b) | | | 14,550 | | | | 843,463 | |
| | | | | | | | |
| | |
Capital Markets—0.5% | | | | | | | | |
BlackRock, Inc. | | | 4,455 | | | | 1,525,971 | |
Evercore Partners, Inc. - Class A | | | 15,540 | | | | 686,713 | |
Invesco, Ltd. | | | 42,202 | | | | 1,077,839 | |
Legg Mason, Inc. | | | 26,650 | | | | 785,908 | |
Northern Trust Corp. | | | 25,095 | | | | 1,662,795 | |
WisdomTree Investments, Inc. (b) | | | 51,390 | | | | 503,108 | |
| | | | | | | | |
| | | | | | | 6,242,334 | |
| | | | | | | | |
| | |
Chemicals—1.0% | | | | | | | | |
Cabot Corp. | | | 39,420 | | | | 1,799,917 | |
Celanese Corp. - Series A | | | 44,251 | | | | 2,896,228 | |
Dow Chemical Co. (The) | | | 66,310 | | | | 3,296,270 | |
Monsanto Co. | | | 15,990 | | | | 1,653,526 | |
Mosaic Co. (The) (b) | | | 32,520 | | | | 851,374 | |
Sherwin-Williams Co. (The) | | | 6,596 | | | | 1,937,047 | |
| | | | | | | | |
| | | | | | | 12,434,362 | |
| | | | | | | | |
| | |
Communications Equipment—0.2% | | | | | | | | |
Arista Networks, Inc. (a) | | | 34,190 | | | | 2,201,152 | |
| | | | | | | | |
| | |
Construction Materials—0.4% | | | | | | | | |
CRH plc (ADR) | | | 47,510 | | | | 1,405,346 | |
Martin Marietta Materials, Inc. (b) | | | 7,230 | | | | 1,388,160 | |
Summit Materials, Inc. - Class A (a) | | | 46,689 | | | | 955,257 | |
Vulcan Materials Co. | | | 15,410 | | | | 1,854,747 | |
| | | | | | | | |
| | | | | | | 5,603,510 | |
| | | | | | | | |
| | |
Consumer Finance—1.2% | | | | | | | | |
American Express Co. | | | 108,596 | | | | 6,598,293 | |
Capital One Financial Corp. | | | 54,790 | | | | 3,479,713 | |
Santander Consumer USA Holdings, Inc. (a) (b) | | | 478,765 | | | | 4,945,642 | |
| | | | | | | | |
| | | | | | | 15,023,648 | |
| | | | | | | | |
| | |
Containers & Packaging—0.5% | | | | | | | | |
Ball Corp. (b) | | | 43,979 | | | | 3,179,242 | |
International Paper Co. | | | 58,355 | | | | 2,473,085 | |
Owens-Illinois, Inc. (a) | | | 44,920 | | | | 809,009 | |
| | | | | | | | |
| | | | | | | 6,461,336 | |
| | | | | | | | |
| | |
Diversified Financial Services—0.5% | | | | | | | | |
Bats Global Markets, Inc. (a) | | | 12,400 | | | | 318,556 | |
Intercontinental Exchange, Inc. | | | 6,692 | | | | 1,712,884 | |
MarketAxess Holdings, Inc. | | | 4,930 | | | | 716,822 | |
Markit, Ltd. (a) | | | 23,647 | | | | 770,892 | |
MSCI, Inc. | | | 8,995 | | | | 693,695 | |
S&P Global, Inc. | | | 17,150 | | | | 1,839,509 | |
| | | | | | | | |
| | | | | | | 6,052,358 | |
| | | | | | | | |
| | |
Electric Utilities—2.1% | | | | | | | | |
Avangrid, Inc. (b) | | | 73,300 | | | | 3,376,198 | |
See accompanying notes to financial statements.
MSF-5
Metropolitan Series Fund
Met/Wellington Balanced Portfolio (formerly, WMC Balanced Portfolio)
Schedule of Investments as of June 30, 2016 (Unaudited)
Common Stocks—(Continued)
| | | | | | | | |
| Security Description | | Shares | | | Value | |
|
Electric Utilities—(Continued) | |
Duke Energy Corp. (b) | | | 32,899 | | | $ | 2,822,405 | |
Edison International | | | 36,101 | | | | 2,803,965 | |
Eversource Energy | | | 26,200 | | | | 1,569,380 | |
Exelon Corp. | | | 69,070 | | | | 2,511,385 | |
NextEra Energy, Inc. | | | 60,702 | | | | 7,915,541 | |
PG&E Corp. | | | 58,190 | | | | 3,719,505 | |
Pinnacle West Capital Corp. | | | 16,971 | | | | 1,375,669 | |
| | | | | | | | |
| | | | | | | 26,094,048 | |
| | | | | | | | |
|
Electrical Equipment—0.4% | |
AMETEK, Inc. | | | 48,690 | | | | 2,250,938 | |
Eaton Corp. plc | | | 44,360 | | | | 2,649,623 | |
| | | | | | | | |
| | | | | | | 4,900,561 | |
| | | | | | | | |
|
Electronic Equipment, Instruments & Components—0.1% | |
National Instruments Corp. | | | 37,770 | | | | 1,034,898 | |
| | | | | | | | |
|
Energy Equipment & Services—0.5% | |
Baker Hughes, Inc. | | | 34,060 | | | | 1,537,128 | |
Ensco plc - Class A | | | 22,113 | | | | 214,717 | |
Forum Energy Technologies, Inc. (a) | | | 33,350 | | | | 577,288 | |
Halliburton Co. | | | 12,816 | | | | 580,437 | |
Patterson-UTI Energy, Inc. (b) | | | 39,522 | | | | 842,609 | |
Tenaris S.A. (ADR) | | | 23,750 | | | | 684,950 | |
Tesco Corp. (b) | | | 73,560 | | | | 492,116 | |
Weatherford International plc (a) (b) | | | 147,358 | | | | 817,837 | |
| | | | | | | | |
| | | | | | | 5,747,082 | |
| | | | | | | | |
|
Food & Staples Retailing—0.7% | |
Costco Wholesale Corp. | | | 34,277 | | | | 5,382,860 | |
Walgreens Boots Alliance, Inc. | | | 46,989 | | | | 3,912,774 | |
| | | | | | | | |
| | | | | | | 9,295,634 | |
| | | | | | | | |
|
Food Products—0.9% | |
Mondelez International, Inc. - Class A | | | 184,244 | | | | 8,384,944 | |
Post Holdings, Inc. (a) (b) | | | 36,545 | | | | 3,021,906 | |
| | | | | | | | |
| | | | | | | 11,406,850 | |
| | | | | | | | |
|
Gas Utilities—0.1% | |
UGI Corp. | | | 39,758 | | | | 1,799,049 | |
| | | | | | | | |
|
Health Care Equipment & Supplies—2.9% | |
Abbott Laboratories | | | 30,431 | | | | 1,196,243 | |
Baxter International, Inc. | | | 65,556 | | | | 2,964,442 | |
Becton Dickinson & Co. | | | 19,666 | | | | 3,335,157 | |
Boston Scientific Corp. (a) | | | 206,150 | | | | 4,817,726 | |
ConforMIS, Inc. (a) (b) | | | 45,600 | | | | 320,112 | |
Medtronic plc | | | 173,547 | | | | 15,058,673 | |
St. Jude Medical, Inc. | | | 50,580 | | | | 3,945,240 | |
Stryker Corp. | | | 41,970 | | | | 5,029,265 | |
| | | | | | | | |
| | | | | | | 36,666,858 | |
| | | | | | | | |
|
Health Care Providers & Services—2.3% | |
Aetna, Inc. | | | 33,790 | | | | 4,126,773 | |
|
Health Care Providers & Services—(Continued) | |
Cardinal Health, Inc. | | | 26,224 | | | | 2,045,734 | |
HCA Holdings, Inc. (a) | | | 54,150 | | | | 4,170,091 | |
McKesson Corp. | | | 41,180 | | | | 7,686,247 | |
UnitedHealth Group, Inc. | | | 75,508 | | | | 10,661,730 | |
| | | | | | | | |
| | | | | | | 28,690,575 | |
| | | | | | | | |
|
Hotels, Restaurants & Leisure—0.6% | |
Las Vegas Sands Corp. | | | 14,110 | | | | 613,644 | |
McDonald’s Corp. | | | 25,332 | | | | 3,048,453 | |
Starbucks Corp. | | | 48,511 | | | | 2,770,948 | |
Wingstop, Inc. (a) | | | 1,800 | | | | 49,050 | |
Wyndham Worldwide Corp. (b) | | | 7,016 | | | | 499,750 | |
| | | | | | | | |
| | | | | | | 6,981,845 | |
| | | | | | | | |
|
Household Durables—0.5% | |
Mohawk Industries, Inc. (a) | | | 30,442 | | | | 5,776,674 | |
| | | | | | | | |
|
Household Products—0.7% | |
Colgate-Palmolive Co. | | | 121,950 | | | | 8,926,740 | |
| | | | | | | | |
|
Industrial Conglomerates—1.1% | |
Danaher Corp. | | | 108,340 | | | | 10,942,340 | |
General Electric Co. | | | 77,494 | | | | 2,439,511 | |
| | | | | | | | |
| | | | | | | 13,381,851 | |
| | | | | | | | |
|
Insurance—3.0% | |
Allstate Corp. (The) | | | 32,620 | | | | 2,281,769 | |
American International Group, Inc. | | | 154,840 | | | | 8,189,488 | |
Assured Guaranty, Ltd. | | | 142,028 | | | | 3,603,250 | |
Chubb, Ltd. | | | 13,500 | | | | 1,764,585 | |
Hartford Financial Services Group, Inc. (The) | | | 108,598 | | | | 4,819,579 | |
Marsh & McLennan Cos., Inc. | | | 108,280 | | | | 7,412,849 | |
Principal Financial Group, Inc. | | | 42,192 | | | | 1,734,513 | |
Prudential Financial, Inc. | | | 49,744 | | | | 3,548,737 | |
XL Group plc | | | 137,660 | | | | 4,585,455 | |
| | | | | | | | |
| | | | | | | 37,940,225 | |
| | | | | | | | |
|
Internet & Catalog Retail—1.7% | |
Amazon.com, Inc. (a) | | | 25,524 | | | | 18,265,485 | |
Expedia, Inc. (b) | | | 32,456 | | | | 3,450,073 | |
| | | | | | | | |
| | | | | | | 21,715,558 | |
| | | | | | | | |
|
Internet Software & Services—2.4% | |
Alphabet, Inc. - Class A (a) | | | 27,705 | | | | 19,491,299 | |
Envestnet, Inc. (a) | | | 11,390 | | | | 379,401 | |
Facebook, Inc. - Class A (a) | | | 92,250 | | | | 10,542,330 | |
| | | | | | | | |
| | | | | | | 30,413,030 | |
| | | | | | | | |
|
IT Services—2.4% | |
Accenture plc - Class A | | | 34,541 | | | | 3,913,150 | |
Alliance Data Systems Corp. (a) | | | 9,888 | | | | 1,937,257 | |
Automatic Data Processing, Inc. | | | 37,431 | | | | 3,438,786 | |
Cognizant Technology Solutions Corp. - Class A (a) | | | 34,337 | | | | 1,965,450 | |
See accompanying notes to financial statements.
MSF-6
Metropolitan Series Fund
Met/Wellington Balanced Portfolio (formerly, WMC Balanced Portfolio)
Schedule of Investments as of June 30, 2016 (Unaudited)
Common Stocks—(Continued)
| | | | | | | | |
| Security Description | | Shares | | | Value | |
|
IT Services—(Continued) | |
Genpact, Ltd. (a) | | | 130,819 | | | $ | 3,511,182 | |
Global Payments, Inc. | | | 60,546 | | | | 4,321,774 | |
Visa, Inc. - Class A (b) | | | 117,584 | | | | 8,721,205 | |
WEX, Inc. (a) | | | 19,366 | | | | 1,717,183 | |
| | | | | | | | |
| | | | | | | 29,525,987 | |
| | | | | | | | |
|
Leisure Products—0.2% | |
Polaris Industries, Inc. (b) | | | 24,087 | | | | 1,969,353 | |
| | | | | | | | |
|
Life Sciences Tools & Services—0.3% | |
Thermo Fisher Scientific, Inc. | | | 21,589 | | | | 3,189,991 | |
| | | | | | | | |
| | |
Machinery—0.7% | | | | | | | | |
Illinois Tool Works, Inc. | | | 59,140 | | | | 6,160,022 | |
Pentair plc | | | 48,143 | | | | 2,806,256 | |
| | | | | | | | |
| | | | | | | 8,966,278 | |
| | | | | | | | |
| | |
Marine—0.0% | | | | | | | | |
Kirby Corp. (a) (b) | | | 2,630 | | | | 164,086 | |
| | | | | | | | |
| | |
Media—2.5% | | | | | | | | |
Charter Communications, Inc. - Class A (a) | | | 44,841 | | | | 10,252,446 | |
Comcast Corp. - Class A | | | 197,010 | | | | 12,843,082 | |
DreamWorks Animation SKG, Inc. - Class A (a) (b) | | | 8,829 | | | | 360,841 | |
Interpublic Group of Cos., Inc. (The) | | | 88,126 | | | | 2,035,711 | |
Twenty-First Century Fox, Inc. - Class A | | | 192,293 | | | | 5,201,526 | |
| | | | | | | | |
| | | | | | | 30,693,606 | |
| | | | | | | | |
|
Metals & Mining—0.1% | |
Reliance Steel & Aluminum Co. | | | 5,548 | | | | 426,641 | |
Steel Dynamics, Inc. | | | 18,590 | | | | 455,455 | |
| | | | | | | | |
| | | | | | | 882,096 | |
| | | | | | | | |
|
Multi-Utilities—0.8% | |
Ameren Corp. | | | 31,364 | | | | 1,680,483 | |
Dominion Resources, Inc. | | | 57,535 | | | | 4,483,703 | |
Sempra Energy | | | 35,669 | | | | 4,066,979 | |
| | | | | | | | |
| | | | | | | 10,231,165 | |
| | | | | | | | |
|
Oil, Gas & Consumable Fuels—2.6% | |
Anadarko Petroleum Corp. | | | 14,643 | | | | 779,740 | |
Cobalt International Energy, Inc. (a) (b) | | | 367,747 | | | | 492,781 | |
ConocoPhillips | | | 19,410 | | | | 846,276 | |
Energen Corp. | | | 22,010 | | | | 1,061,102 | |
Hess Corp. | | | 11,730 | | | | 704,973 | |
Marathon Petroleum Corp. | | | 40,760 | | | | 1,547,250 | |
Newfield Exploration Co. (a) | | | 137,689 | | | | 6,083,100 | |
ONEOK, Inc. | | | 19,968 | | | | 947,482 | |
PBF Energy, Inc. - Class A | | | 76,787 | | | | 1,825,995 | |
Pioneer Natural Resources Co. | | | 64,636 | | | | 9,773,609 | |
QEP Resources, Inc. | | | 54,290 | | | | 957,133 | |
Spectra Energy Corp. | | | 62,430 | | | | 2,286,811 | |
TransCanada Corp. (b) | | | 35,980 | | | | 1,627,015 | |
|
Oil, Gas & Consumable Fuels—(Continued) | |
Valero Energy Corp. | | | 32,570 | | | | 1,661,070 | |
WPX Energy, Inc. (a) | | | 139,026 | | | | 1,294,332 | |
| | | | | | | | |
| | | | | | | 31,888,669 | |
| | | | | | | | |
|
Paper & Forest Products—0.2% | |
Boise Cascade Co. (a) | | | 83,603 | | | | 1,918,689 | |
| | | | | | | | |
|
Personal Products—0.6% | |
Coty, Inc. - Class A (b) | | | 93,307 | | | | 2,425,049 | |
Estee Lauder Cos., Inc. (The) - Class A | | | 60,832 | | | | 5,536,929 | |
| | | | | | | | |
| | | | | | | 7,961,978 | |
| | | | | | | | |
|
Pharmaceuticals—3.1% | |
Aerie Pharmaceuticals, Inc. (a) (b) | | | 16,870 | | | | 296,912 | |
Allergan plc (a) | | | 30,350 | | | | 7,013,582 | |
AstraZeneca plc (ADR) (b) | | | 98,081 | | | | 2,961,065 | |
Bristol-Myers Squibb Co. | | | 118,260 | | | | 8,698,023 | |
Eli Lilly & Co. | | | 44,640 | | | | 3,515,400 | |
Johnson & Johnson | | | 53,960 | | | | 6,545,348 | |
Merck & Co., Inc. | | | 125,771 | | | | 7,245,667 | |
Mylan NV (a) | | | 58,530 | | | | 2,530,837 | |
MyoKardia, Inc. (a) (b) | | | 25,300 | | | | 313,720 | |
| | | | | | | | |
| | | | | | | 39,120,554 | |
| | | | | | | | |
|
Professional Services—0.8% | |
Equifax, Inc. | | | 19,661 | | | | 2,524,473 | |
Nielsen Holdings plc | | | 61,096 | | | | 3,175,159 | |
TransUnion (a) | | | 111,450 | | | | 3,726,888 | |
| | | | | | | | |
| | | | | | | 9,426,520 | |
| | | | | | | | |
|
Real Estate Investment Trusts—2.1% | |
American Tower Corp. | | | 77,432 | | | | 8,797,050 | |
AvalonBay Communities, Inc. | | | 17,778 | | | | 3,206,973 | |
Equinix, Inc. | | | 6,940 | | | | 2,690,846 | |
Outfront Media, Inc. (b) | | | 101,631 | | | | 2,456,421 | |
Public Storage | | | 8,904 | | | | 2,275,773 | |
Regency Centers Corp. | | | 18,220 | | | | 1,525,561 | |
Simon Property Group, Inc. | | | 25,251 | | | | 5,476,942 | |
| | | | | | | | |
| | | | | | | 26,429,566 | |
| | | | | | | | |
|
Road & Rail—0.3% | |
Genesee & Wyoming, Inc. - Class A (a) (b) | | | 15,912 | | | | 938,012 | |
J.B. Hunt Transport Services, Inc. | | | 6,560 | | | | 530,901 | |
Kansas City Southern | | | 4,338 | | | | 390,810 | |
Knight Transportation, Inc. (b) | | | 32,356 | | | | 860,023 | |
Norfolk Southern Corp. | | | 8,790 | | | | 748,293 | |
Swift Transportation Co. (a) (b) | | | 22,240 | | | | 342,718 | |
| | | | | | | | |
| | | | | | | 3,810,757 | |
| | | | | | | | |
|
Semiconductors & Semiconductor Equipment—1.3% | |
Applied Materials, Inc. | | | 88,100 | | | | 2,111,757 | |
Broadcom, Ltd. | | | 19,810 | | | | 3,078,474 | |
Cavium, Inc. (a) (b) | | | 2,289 | | | | 88,355 | |
First Solar, Inc. (a) (b) | | | 6,436 | | | | 312,017 | |
See accompanying notes to financial statements.
MSF-7
Metropolitan Series Fund
Met/Wellington Balanced Portfolio (formerly, WMC Balanced Portfolio)
Schedule of Investments as of June 30, 2016 (Unaudited)
Common Stocks—(Continued)
| | | | | | | | |
| Security Description | | Shares/
Principal
Amount* | | | Value | |
|
Semiconductors & Semiconductor Equipment—(Continued) | |
Lam Research Corp. (b) | | | 18,930 | | | $ | 1,591,256 | |
Linear Technology Corp. (b) | | | 66,760 | | | | 3,106,343 | |
MACOM Technology Solutions Holdings, Inc. (a) | | | 9,270 | | | | 305,725 | |
Microchip Technology, Inc. (b) | | | 53,370 | | | | 2,709,061 | |
NXP Semiconductors NV (a) | | | 13,975 | | | | 1,094,802 | |
ON Semiconductor Corp. (a) | | | 54,000 | | | | 476,280 | |
Skyworks Solutions, Inc. (b) | | | 19,086 | | | | 1,207,762 | |
SunEdison Semiconductor, Ltd. (a) (b) | | | 33,900 | | | | 201,027 | |
SunPower Corp. (a) (b) | | | 6,525 | | | | 101,072 | |
| | | | | | | | |
| | | | | | | 16,383,931 | |
| | | | | | | | |
| | |
Software—2.3% | | | | | | | | |
Adobe Systems, Inc. (a) | | | 31,170 | | | | 2,985,774 | |
Electronic Arts, Inc. (a) | | | 65,897 | | | | 4,992,357 | |
Microsoft Corp. | | | 225,388 | | | | 11,533,104 | |
Salesforce.com, Inc. (a) | | | 44,500 | | | | 3,533,745 | |
ServiceNow, Inc. (a) | | | 58,930 | | | | 3,912,952 | |
SS&C Technologies Holdings, Inc. (b) | | | 37,260 | | | | 1,046,261 | |
| | | | | | | | |
| | | | | | | 28,004,193 | |
| | | | | | | | |
|
Specialty Retail—0.9% | |
Advance Auto Parts, Inc. | | | 47,742 | | | | 7,716,540 | |
L Brands, Inc. | | | 25,949 | | | | 1,741,956 | |
Ross Stores, Inc. | | | 8,324 | | | | 471,888 | |
Signet Jewelers, Ltd. (b) | | | 14,740 | | | | 1,214,723 | |
| | | | | | | | |
| | | | | | | 11,145,107 | |
| | | | | | | | |
|
Technology Hardware, Storage & Peripherals—1.8% | |
Apple, Inc. | | | 156,357 | | | | 14,947,729 | |
Pure Storage, Inc. - Class A (a) (b) | | | 238,061 | | | | 2,594,865 | |
Seagate Technology plc (b) | | | 207,742 | | | | 5,060,595 | |
| | | | | | | | |
| | | | | | | 22,603,189 | |
| | | | | | | | |
|
Textiles, Apparel & Luxury Goods—0.9% | |
NIKE, Inc. - Class B | | | 126,473 | | | | 6,981,310 | |
Under Armour, Inc. - Class A (a) (b) | | | 34,258 | | | | 1,374,774 | |
Under Armour, Inc. - Class C (a) | | | 34,501 | | | | 1,255,842 | |
VF Corp. | | | 23,990 | | | | 1,475,145 | |
| | | | | | | | |
| | | | | | | 11,087,071 | |
| | | | | | | | |
|
Tobacco—0.9% | |
Altria Group, Inc. | | | 160,685 | | | | 11,080,838 | |
| | | | | | | | |
Total Common Stocks
(Cost $654,292,676) | | | | | | | 722,701,388 | |
| | | | | | | | |
|
| U.S. Treasury & Government Agencies—21.3% | |
|
Agency Sponsored Mortgage - Backed—20.2% | |
Fannie Mae 15 Yr. Pool
2.500%, TBA (c) | | | 9,150,000 | | | | 9,466,491 | |
3.000%, 07/01/28 | | | 2,457,100 | | | | 2,592,071 | |
3.000%, 02/01/31 | | | 279,351 | | | | 293,021 | |
|
Agency Sponsored Mortgage - Backed—(Continued) | |
Fannie Mae 15 Yr. Pool
3.000%, 03/01/31 | | | 1,605,373 | | | | 1,683,933 | |
3.000%, TBA (c) | | | 11,278,000 | | | | 11,823,397 | |
3.500%, 07/01/28 | | | 356,699 | | | | 382,652 | |
4.000%, 04/01/26 | | | 64,116 | | | | 68,462 | |
4.000%, 02/01/29 | | | 1,668,575 | | | | 1,777,572 | |
4.500%, 06/01/24 | | | 348,062 | | | | 368,242 | |
4.500%, 02/01/25 | | | 111,495 | | | | 118,866 | |
4.500%, 04/01/25 | | | 17,350 | | | | 18,720 | |
4.500%, 07/01/25 | | | 84,308 | | | | 90,773 | |
4.500%, 06/01/26 | | | 1,651,369 | | | | 1,774,733 | |
5.000%, TBA (c) | | | 500,000 | | | | 513,066 | |
Fannie Mae 30 Yr. Pool
3.000%, 02/01/43 | | | 990,170 | | | | 1,040,485 | |
3.000%, 03/01/43 | | | 2,910,160 | | | | 3,038,711 | |
3.000%, 04/01/43 | | | 2,247,059 | | | | 2,348,035 | |
3.000%, 05/01/43 | | | 3,708,831 | | | | 3,884,567 | |
3.000%, 06/01/43 | | | 375,739 | | | | 395,473 | |
3.000%, TBA (c) | | | 600,000 | | | | 622,289 | |
3.500%, 03/01/43 | | | 74,823 | | | | 79,391 | |
3.500%, 05/01/43 | | | 142,282 | | | | 150,968 | |
3.500%, 06/01/43 | | | 554,125 | | | | 592,676 | |
3.500%, 07/01/43 | | | 865,919 | | | | 923,238 | |
3.500%, 08/01/43 | | | 1,396,584 | | | | 1,489,765 | |
3.500%, 01/01/46 | | | 1,186,205 | | | | 1,253,825 | |
3.500%, 02/01/46 | | | 1,476,364 | | | | 1,560,527 | |
3.500%, TBA (c) | | | 39,700,000 | | | | 41,858,076 | |
4.000%, 10/01/40 | | | 1,332,787 | | | | 1,433,975 | |
4.000%, 11/01/40 | | | 545,961 | | | | 587,461 | |
4.000%, 12/01/40 | | | 401,926 | | | | 432,307 | |
4.000%, 02/01/41 | | | 198,353 | | | | 213,357 | |
4.000%, 03/01/41 | | | 476,019 | | | | 511,815 | |
4.000%, 08/01/42 | | | 241,107 | | | | 259,728 | |
4.000%, 09/01/42 | | | 436,865 | | | | 470,605 | |
4.000%, 02/01/46 | | | 787,416 | | | | 848,087 | |
4.000%, 05/01/46 | | | 803,040 | | | | 864,116 | |
4.000%, 06/01/46 | | | 314,036 | | | | 337,044 | |
4.000%, TBA (c) | | | 7,375,000 | | | | 7,900,421 | |
4.500%, 10/01/40 | | | 1,247,937 | | | | 1,367,272 | |
4.500%, 09/01/41 | | | 121,438 | | | | 133,155 | |
4.500%, 10/01/41 | | | 568,793 | | | | 622,768 | |
4.500%, 08/01/42 | | | 171,239 | | | | 187,498 | |
4.500%, 09/01/43 | | | 2,949,336 | | | | 3,221,074 | |
4.500%, 10/01/43 | | | 384,054 | | | | 419,792 | |
4.500%, 12/01/43 | | | 363,425 | | | | 397,177 | |
4.500%, 01/01/44 | | | 857,326 | | | | 947,637 | |
5.000%, 04/01/33 | | | 6,029 | | | | 6,731 | |
5.000%, 07/01/33 | | | 17,835 | | | | 19,900 | |
5.000%, 09/01/33 | | | 275,914 | | | | 308,039 | |
5.000%, 11/01/33 | | | 69,660 | | | | 77,767 | |
5.000%, 12/01/33 | | | 27,896 | | | | 31,145 | |
5.000%, 02/01/34 | | | 12,282 | | | | 13,712 | |
5.000%, 03/01/34 | | | 5,915 | | | | 6,603 | |
5.000%, 04/01/34 | | | 5,683 | | | | 6,344 | |
5.000%, 06/01/34 | | | 4,999 | | | | 5,569 | |
See accompanying notes to financial statements.
MSF-8
Metropolitan Series Fund
Met/Wellington Balanced Portfolio (formerly, WMC Balanced Portfolio)
Schedule of Investments as of June 30, 2016 (Unaudited)
U.S. Treasury & Government Agencies—(Continued)
| | | | | | | | |
| Security Description | | Principal
Amount* | | | Value | |
|
Agency Sponsored Mortgage - Backed—(Continued) | |
Fannie Mae 30 Yr. Pool
5.000%, 07/01/34 | | | 82,803 | | | $ | 92,315 | |
5.000%, 10/01/34 | | | 216,993 | | | | 242,267 | |
5.000%, 07/01/35 | | | 143,796 | | | | 160,486 | |
5.000%, 10/01/35 | | | 160,830 | | | | 179,542 | |
5.000%, 12/01/35 | | | 126,139 | | | | 140,733 | |
5.000%, 08/01/36 | | | 114,219 | | | | 127,424 | |
5.000%, 07/01/37 | | | 62,303 | | | | 69,563 | |
5.000%, 07/01/41 | | | 116,208 | | | | 129,560 | |
5.000%, 08/01/41 | | | 72,930 | | | | 81,313 | |
5.500%, 08/01/28 | | | 29,392 | | | | 32,985 | |
5.500%, 04/01/33 | | | 72,965 | | | | 82,758 | |
5.500%, 08/01/37 | | | 443,773 | | | | 503,771 | |
5.500%, 04/01/41 | | | 40,398 | | | | 45,638 | |
6.000%, 03/01/28 | | | 3,000 | | | | 3,426 | |
6.000%, 05/01/28 | | | 10,745 | | | | 12,270 | |
6.000%, 02/01/34 | | | 294,043 | | | | 341,424 | |
6.000%, 08/01/34 | | | 157,903 | | | | 182,880 | |
6.000%, 04/01/35 | | | 1,326,562 | | | | 1,540,305 | |
6.000%, 02/01/38 | | | 99,755 | | | | 114,982 | |
6.000%, 03/01/38 | | | 37,457 | | | | 43,382 | |
6.000%, 05/01/38 | | | 122,324 | | | | 141,992 | |
6.000%, 10/01/38 | | | 35,561 | | | | 41,064 | |
6.000%, 12/01/38 | | | 42,993 | | | | 49,623 | |
6.000%, TBA (c) | | | 1,000,000 | | | | 1,143,573 | |
6.500%, 05/01/40 | | | 870,550 | | | | 1,011,359 | |
Fannie Mae ARM Pool
2.814%, 03/01/41 (d) | | | 144,756 | | | | 153,316 | |
2.945%, 03/01/41 (d) | | | 83,974 | | | | 88,749 | |
3.157%, 12/01/40 (d) | | | 220,826 | | | | 232,494 | |
3.369%, 06/01/41 (d) | | | 261,686 | | | | 272,313 | |
3.518%, 09/01/41 (d) | | | 188,945 | | | | 198,884 | |
Fannie Mae Pool
2.440%, 01/01/23 | | | 20,000 | | | | 20,827 | |
2.690%, 04/01/25 | | | 200,000 | | | | 209,042 | |
2.780%, 02/01/27 | | | 695,782 | | | | 731,758 | |
3.160%, 12/01/26 | | | 90,000 | | | | 97,537 | |
3.210%, 05/01/23 | | | 165,000 | | | | 178,214 | |
3.240%, 12/01/26 | | | 84,563 | | | | 92,143 | |
3.340%, 04/01/24 | | | 84,794 | | | | 92,621 | |
3.355%, 01/01/27 | | | 1,355,498 | | | | 1,481,013 | |
3.450%, 01/01/24 | | | 34,260 | | | | 37,545 | |
3.470%, 01/01/24 | | | 33,871 | | | | 37,252 | |
3.650%, 08/01/23 | | | 1,827,427 | | | | 2,023,683 | |
3.670%, 08/01/23 | | | 81,937 | | | | 90,842 | |
3.700%, 10/01/23 | | | 25,000 | | | | 27,881 | |
3.760%, 03/01/24 | | | 30,000 | | | | 33,643 | |
3.780%, 10/01/23 | | | 2,171,500 | | | | 2,425,982 | |
3.855%, 12/01/25 | | | 45,000 | | | | 51,067 | |
3.860%, 11/01/23 | | | 25,000 | | | | 28,165 | |
3.870%, 10/01/25 | | | 76,939 | | | | 86,966 | |
3.890%, 05/01/30 | | | 102,856 | | | | 115,637 | |
3.930%, 10/01/23 | | | 110,000 | | | | 123,941 | |
3.960%, 05/01/34 | | | 43,734 | | | | 49,025 | |
3.970%, 05/01/29 | | | 29,969 | | | | 34,274 | |
4.060%, 10/01/28 | | | 66,138 | | | | 77,303 | |
|
Agency Sponsored Mortgage - Backed—(Continued) | |
Fannie Mae REMICS (CMO)
1.689%, 05/25/46 (e) (f) | | | 1,546,890 | | | | 96,595 | |
1.951%, 08/25/44 (d) (e) (f) | | | 1,387,698 | | | | 95,239 | |
2.500%, 06/25/28 (e) (f) | | | 296,940 | | | | 25,901 | |
3.000%, 09/25/27 (e) (f) | | | 270,794 | | | | 25,466 | |
3.000%, 01/25/28 (e) (f) | | | 1,918,061 | | | | 174,943 | |
3.000%, 04/25/28 (e) (f) | | | 847,899 | | | | 87,051 | |
3.500%, 05/25/30 (e) (f) | | | 450,643 | | | | 53,303 | |
4.000%, 05/25/42 (e) (f) | | | 1,195,504 | | | | 192,731 | |
5.500%, 04/25/35 (f) | | | 503,217 | | | | 569,706 | |
5.500%, 04/25/37 (f) | | | 215,034 | | | | 244,271 | |
Fannie Mae-ACES
2.433%, 01/25/22 (d) (e) | | | 1,605,796 | | | | 140,582 | |
3.329%, 10/25/23 (d) | | | 505,000 | | | | 551,591 | |
Freddie Mac 15 Yr. Gold Pool
3.000%, 07/01/28 | | | 889,118 | | | | 933,905 | |
3.000%, 08/01/29 | | | 616,230 | | | | 651,885 | |
3.000%, TBA (c) | | | 200,000 | | | | 209,805 | |
3.500%, TBA (c) | | | 1,500,000 | | | | 1,587,483 | |
Freddie Mac 20 Yr. Gold Pool
3.500%, 08/01/34 | | | 1,260,978 | | | | 1,341,929 | |
Freddie Mac 30 Yr. Gold Pool
3.000%, 03/01/43 | | | 470,463 | | | | 488,756 | |
3.000%, 04/01/43 | | | 2,522,871 | | | | 2,620,966 | |
3.000%, 08/01/43 | | | 1,117,629 | | | | 1,161,173 | |
3.000%, TBA (c) | | | 18,900,000 | | | | 19,567,825 | |
3.500%, 04/01/42 | | | 306,461 | | | | 328,099 | |
3.500%, 08/01/42 | | | 241,592 | | | | 259,328 | |
3.500%, 09/01/42 | | | 142,969 | | | | 152,777 | |
3.500%, 11/01/42 | | | 268,646 | | | | 285,659 | |
3.500%, 04/01/43 | | | 891,385 | | | | 953,783 | |
3.500%, 12/01/43 | | | 849,630 | | | | 908,573 | |
3.500%, 05/01/46 | | | 6,785,455 | | | | 7,170,984 | |
3.500%, TBA (c) | | | 17,300,000 | | | | 18,223,735 | |
4.000%, 05/01/42 | | | 1,251,072 | | | | 1,344,008 | |
4.000%, 08/01/42 | | | 313,484 | | | | 337,319 | |
4.000%, 09/01/42 | | | 486,545 | | | | 521,876 | |
4.000%, 07/01/44 | | | 137,439 | | | | 147,919 | |
4.000%, 01/01/46 | | | 725,926 | | | | 778,540 | |
4.000%, 02/01/46 | | | 411,644 | | | | 440,849 | |
4.000%, TBA (c) | | | 13,550,000 | | | | 14,492,329 | |
4.500%, 09/01/43 | | | 216,565 | | | | 236,883 | |
4.500%, 11/01/43 | | | 2,249,173 | | | | 2,455,898 | |
4.500%, TBA (c) | | | 1,350,000 | | | | 1,472,133 | |
5.500%, 07/01/33 | | | 198,915 | | | | 225,145 | |
5.500%, 04/01/39 | | | 87,399 | | | | 98,063 | |
5.500%, 06/01/41 | | | 330,730 | | | | 370,982 | |
Freddie Mac ARM Non-Gold Pool
2.998%, 02/01/41 (d) | | | 227,067 | | | | 240,832 | |
Freddie Mac Multifamily Structured Pass-Through Certificates
1.620%, 06/25/22 (d) (e) | | | 1,894,087 | | | | 135,947 | |
1.670%, 12/25/18 (d) (e) | | | 3,113,059 | | | | 99,007 | |
1.840%, 03/25/22 (d) (e) | | | 1,433,248 | | | | 113,656 | |
1.894%, 05/25/19 (d) (e) | | | 2,395,834 | | | | 101,053 | |
See accompanying notes to financial statements.
MSF-9
Metropolitan Series Fund
Met/Wellington Balanced Portfolio (formerly, WMC Balanced Portfolio)
Schedule of Investments as of June 30, 2016 (Unaudited)
U.S. Treasury & Government Agencies—(Continued)
| | | | | | | | |
| Security Description | | Principal
Amount* | | | Value | |
|
Agency Sponsored Mortgage - Backed—(Continued) | |
Freddie Mac REMICS (CMO)
4.500%, 03/15/41 | | | 290,076 | | | $ | 355,017 | |
6.500%, 07/15/36 (f) | | | 327,427 | | | | 374,160 | |
FREMF Mortgage Trust
3.080%, 10/25/47 (144A) (d) | | | 770,000 | | | | 779,833 | |
Ginnie Mae I 30 Yr. Pool
3.000%, 12/15/44 | | | 27,287 | | | | 28,592 | |
3.000%, 02/15/45 | | | 95,292 | | | | 99,633 | |
3.000%, 04/15/45 | | | 1,356,631 | | | | 1,418,429 | |
3.000%, 05/15/45 | | | 1,892,358 | | | | 1,978,559 | |
3.000%, 07/15/45 | | | 43,889 | | | | 45,888 | |
4.000%, 09/15/42 | | | 1,346,913 | | | | 1,451,724 | |
4.500%, 04/15/41 | | | 1,123,424 | | | | 1,239,754 | |
4.500%, 02/15/42 | | | 2,259,580 | | | | 2,493,587 | |
5.000%, 12/15/38 | | | 75,746 | | | | 85,066 | |
5.000%, 04/15/39 | | | 1,592,820 | | | | 1,784,192 | |
5.000%, 07/15/39 | | | 160,478 | | | | 180,229 | |
5.000%, 12/15/40 | | | 214,956 | | | | 240,786 | |
5.500%, 12/15/40 | | | 702,153 | | | | 791,263 | |
9.000%, 11/15/19 | | | 2,011 | | | | 2,020 | |
Ginnie Mae II 30 Yr. Pool
3.000%, TBA (c) | | | 10,625,000 | | | | 11,098,783 | |
3.500%, TBA (c) | | | 14,200,000 | | | | 15,069,867 | |
4.500%, TBA (c) | | | 600,000 | | | | 643,872 | |
5.000%, 10/20/39 | | | 37,254 | | | | 41,442 | |
Government National Mortgage Association
0.904%, 02/16/53 (d) (e) (g) | | | 2,950,714 | | | | 180,196 | |
Government National Mortgage Association (CMO)
4.000%, 05/16/42 (e) (f) | | | 147,282 | | | | 20,686 | |
4.000%, 01/20/44 (e) (f) | | | 102,891 | | | | 21,976 | |
4.000%, 11/20/44 (e) (f) | | | 1,531,833 | | | | 294,132 | |
5.000%, 10/16/41 (e) (f) | | | 630,236 | | | | 107,262 | |
| | | | | | | | |
| | | | | | | 250,991,307 | |
| | | | | | | | |
|
U.S. Treasury—1.1% | |
U.S. Treasury Bonds
2.750%, 08/15/42 (h) (i) | | | 350,000 | | | | 385,629 | |
3.000%, 11/15/44 (h) (i) | | | 595,000 | | | | 684,111 | |
4.500%, 02/15/36 | | | 1,199,000 | | | | 1,727,029 | |
U.S. Treasury Floating Rate Notes
0.330%, 07/31/16 (d) (h) (i) | | | 1,250,000 | | | | 1,250,036 | |
U.S. Treasury Inflation Indexed Notes
0.250%, 01/15/25 (i) (j) | | | 9,096,060 | | | | 9,234,630 | |
U.S. Treasury Notes
0.625%, 12/31/16 (h) | | | 250,000 | | | | 250,244 | |
| | | | | | | | |
| | | | | | | 13,531,679 | |
| | | | | | | | |
Total U.S. Treasury & Government Agencies
(Cost $262,307,268) | | | | | | | 264,522,986 | |
| | | | | | | | |
|
| Corporate Bonds & Notes—13.8% | |
|
Advertising—0.0% | |
Lamar Media Corp.
5.750%, 02/01/26 (144A) | | | 20,000 | | | | 20,813 | |
| | | | | | | | |
|
Aerospace/Defense—0.1% | |
BAE Systems Holdings, Inc.
2.850%, 12/15/20 (144A) | | | 130,000 | | | | 132,836 | |
BAE Systems plc
4.750%, 10/11/21 (144A) | | | 135,000 | | | | 150,726 | |
Lockheed Martin Corp.
2.500%, 11/23/20 | | | 265,000 | | | | 273,445 | |
4.700%, 05/15/46 | | | 380,000 | | | | 447,933 | |
| | | | | | | | |
| | | | | | | 1,004,940 | |
| | | | | | | | |
|
Agriculture—0.2% | |
BAT International Finance plc
2.750%, 06/15/20 (144A) | | | 490,000 | | | | 508,106 | |
Imperial Brands Finance plc
2.050%, 07/20/18 (144A) | | | 200,000 | | | | 202,242 | |
2.950%, 07/21/20 (144A) | | | 550,000 | | | | 566,380 | |
3.750%, 07/21/22 (144A) | | | 310,000 | | | | 327,142 | |
Reynolds American, Inc.
3.250%, 06/12/20 | | | 517,000 | | | | 546,512 | |
| | | | | | | | |
| | | | | | | 2,150,382 | |
| | | | | | | | |
|
Apparel—0.0% | |
Hanesbrands, Inc.
4.875%, 05/15/26 (144A) | | | 100,000 | | | | 100,360 | |
William Carter Co. (The)
5.250%, 08/15/21 | | | 290,000 | | | | 300,150 | |
| | | | | | | | |
| | | | | | | 400,510 | |
| | | | | | | | |
|
Auto Manufacturers—0.7% | |
Daimler Finance North America LLC
1.650%, 03/02/18 (144A) (b) | | | 1,445,000 | | | | 1,452,958 | |
Ford Motor Credit Co. LLC
1.461%, 03/27/17 | | | 1,560,000 | | | | 1,562,764 | |
2.240%, 06/15/18 | | | 535,000 | | | | 540,394 | |
3.200%, 01/15/21 | | | 375,000 | | | | 386,281 | |
4.250%, 02/03/17 | | | 400,000 | | | | 406,392 | |
General Motors Co.
6.600%, 04/01/36 | | | 375,000 | | | | 430,015 | |
6.750%, 04/01/46 | | | 85,000 | | | | 100,826 | |
General Motors Financial Co., Inc.
2.400%, 04/10/18 | | | 575,000 | | | | 579,517 | |
3.500%, 07/10/19 | | | 925,000 | | | | 957,139 | |
3.700%, 05/09/23 | | | 300,000 | | | | 301,559 | |
4.750%, 08/15/17 | | | 1,215,000 | | | | 1,253,680 | |
5.250%, 03/01/26 | | | 375,000 | | | | 407,657 | |
| | | | | | | | |
| | | | | | | 8,379,182 | |
| | | | | | | | |
|
Banks—4.2% | �� |
Banco Bilbao Vizcaya Argentaria S.A.
7.000%, 02/19/19 (EUR) (d) (g) | | | 800,000 | | | | 762,883 | |
9.000%, 05/09/18 (d) (f) | | | 800,000 | | | | 796,626 | |
Banco Santander S.A.
6.250%, 03/12/19 (EUR) (d) (g) | | | 500,000 | | | | 468,869 | |
Bank of America Corp.
2.625%, 04/19/21 | | | 500,000 | | | | 507,668 | |
See accompanying notes to financial statements.
MSF-10
Metropolitan Series Fund
Met/Wellington Balanced Portfolio (formerly, WMC Balanced Portfolio)
Schedule of Investments as of June 30, 2016 (Unaudited)
Corporate Bonds & Notes—(Continued)
| | | | | | | | |
| Security Description | | Principal
Amount* | | | Value | |
|
Banks—(Continued) | |
Bank of America Corp.
3.500%, 04/19/26 | | | 255,000 | | | $ | 263,514 | |
3.950%, 04/21/25 | | | 350,000 | | | | 356,421 | |
4.000%, 04/01/24 | | | 545,000 | | | | 581,675 | |
4.000%, 01/22/25 | | | 1,410,000 | | | | 1,437,229 | |
4.125%, 01/22/24 | | | 265,000 | | | | 285,028 | |
7.750%, 05/14/38 | | | 630,000 | | | | 887,100 | |
Bank of Ireland
7.375%, 06/18/20 (EUR) (d) (f) | | | 450,000 | | | | 461,814 | |
Bank of Nova Scotia (The)
4.500%, 12/16/25 (b) | | | 1,270,000 | | | | 1,319,487 | |
Barclays Bank plc
6.050%, 12/04/17 (144A) | | | 1,200,000 | | | | 1,256,678 | |
8.000%, 12/15/20 (EUR) (d) (g) | | | 550,000 | | | | 568,621 | |
BNP Paribas S.A.
7.625%, 03/30/21 (144A) (d) | | | 390,000 | | | | 390,000 | |
BPCE S.A.
5.150%, 07/21/24 (144A) | | | 1,000,000 | | | | 1,040,605 | |
Capital One Financial Corp.
6.150%, 09/01/16 | | | 1,185,000 | | | | 1,194,217 | |
Capital One N.A.
1.650%, 02/05/18 | | | 925,000 | | | | 925,779 | |
2.350%, 08/17/18 | | | 580,000 | | | | 588,105 | |
CIT Group, Inc.
5.500%, 02/15/19 (144A) | | | 485,000 | | | | 507,431 | |
Citigroup, Inc.
2.700%, 03/30/21 | | | 295,000 | | | | 300,249 | |
4.300%, 11/20/26 | | | 675,000 | | | | 695,425 | |
4.400%, 06/10/25 | | | 500,000 | | | | 522,804 | |
4.450%, 09/29/27 | | | 2,140,000 | | | | 2,204,438 | |
4.600%, 03/09/26 | | | 215,000 | | | | 227,939 | |
4.650%, 07/30/45 | | | 80,000 | | | | 87,914 | |
5.500%, 09/13/25 | | | 490,000 | | | | 549,261 | |
Cooperatieve Rabobank UA
5.500%, 06/29/20 (EUR) (d) | | | 200,000 | | | | 211,407 | |
Credit Agricole S.A.
7.500%, 06/23/26 (GBP) (d) (g) | | | 100,000 | | | | 119,180 | |
8.125%, 12/23/25 (144A) (d) | | | 725,000 | | | | 720,044 | |
8.125%, 09/19/33 (144A) (d) | | | 225,000 | | | | 240,750 | |
Credit Suisse Group AG
6.250%, 12/18/24 (144A) (d) | | | 1,695,000 | | | | 1,595,127 | |
Credit Suisse Group Funding Guernsey, Ltd.
3.125%, 12/10/20 (144A) | | | 1,080,000 | | | | 1,078,357 | |
Credit Suisse Group Guernsey, Ltd.
7.875%, 02/24/41 (d) | | | 250,000 | | | | 250,313 | |
Goldman Sachs Group, Inc. (The)
2.000%, 04/25/19 (b) | | | 140,000 | | | | 141,436 | |
2.600%, 04/23/20 | | | 1,605,000 | | | | 1,631,714 | |
2.750%, 09/15/20 | | | 440,000 | | | | 449,128 | |
2.875%, 02/25/21 | | | 520,000 | | | | 533,113 | |
4.750%, 10/21/45 | | | 215,000 | | | | 236,991 | |
5.150%, 05/22/45 | | | 640,000 | | | | 667,687 | |
6.250%, 02/01/41 | | | 430,000 | | | | 556,465 | |
6.750%, 10/01/37 | | | 1,375,000 | | | | 1,696,109 | |
|
Banks—(Continued) | |
HSBC Holdings plc
2.950%, 05/25/21 | | | 255,000 | | | | 257,642 | |
3.400%, 03/08/21 | | | 765,000 | | | | 788,274 | |
3.600%, 05/25/23 | | | 255,000 | | | | 260,602 | |
4.250%, 08/18/25 | | | 1,100,000 | | | | 1,110,035 | |
5.250%, 09/16/22 (EUR) (d) | | | 225,000 | | | | 224,599 | |
5.250%, 03/14/44 | | | 280,000 | | | | 295,826 | |
6.800%, 06/01/38 | | | 160,000 | | | | 199,300 | |
HSBC USA, Inc.
2.750%, 08/07/20 | | | 375,000 | | | | 377,949 | |
Intesa Sanpaolo S.p.A.
7.700%, 09/17/25 (144A) (b) (d) | | | 650,000 | | | | 560,625 | |
JPMorgan Chase & Co.
2.400%, 06/07/21 | | | 565,000 | | | | 572,896 | |
2.550%, 10/29/20 | | | 530,000 | | | | 541,496 | |
2.700%, 05/18/23 | | | 655,000 | | | | 661,661 | |
2.750%, 06/23/20 | | | 830,000 | | | | 855,259 | |
4.250%, 10/01/27 | | | 1,055,000 | | | | 1,116,225 | |
5.600%, 07/15/41 | | | 125,000 | | | | 158,502 | |
6.000%, 01/15/18 | | | 455,000 | | | | 486,610 | |
LBI HF
6.100%, 08/25/11 (144A) (k) | | | 320,000 | | | | 31,200 | |
Lloyds Banking Group plc
7.000%, 06/27/19 (GBP) (b) (d) | | | 280,000 | | | | 350,385 | |
Morgan Stanley
2.500%, 01/24/19 | | | 455,000 | | | | 464,195 | |
2.500%, 04/21/21 | | | 1,190,000 | | | | 1,202,447 | |
3.950%, 04/23/27 | | | 315,000 | | | | 318,559 | |
4.000%, 07/23/25 | | | 280,000 | | | | 299,821 | |
4.350%, 09/08/26 | | | 95,000 | | | | 99,381 | |
5.000%, 11/24/25 | | | 707,000 | | | | 774,017 | |
5.550%, 04/27/17 | | | 1,350,000 | | | | 1,396,968 | |
6.250%, 08/28/17 | | | 555,000 | | | | 585,024 | |
Royal Bank of Scotland Group plc
6.125%, 12/15/22 | | | 180,000 | | | | 188,768 | |
7.500%, 08/10/20 (d) | | | 720,000 | | | | 658,800 | |
Santander Issuances S.A.U.
5.179%, 11/19/25 | | | 2,200,000 | | | | 2,197,873 | |
Societe Generale S.A.
8.250%, 11/29/18 (d) | | | 635,000 | | | | 628,650 | |
SunTrust Banks, Inc.
3.500%, 01/20/17 | | | 270,000 | | | | 273,006 | |
UBS Group AG
5.750%, 02/19/22 (EUR) (d) | | | 250,000 | | | | 278,825 | |
6.875%, 03/22/21 (d) | | | 450,000 | | | | 439,875 | |
7.000%, 02/19/25 (d) | | | 200,000 | | | | 202,500 | |
7.125%, 02/19/20 (d) | | | 470,000 | | | | 466,475 | |
Wells Fargo & Co.
3.000%, 04/22/26 | | | 310,000 | | | | 315,999 | |
4.400%, 06/14/46 | | | 640,000 | | | | 652,042 | |
4.900%, 11/17/45 | | | 980,000 | | | | 1,072,418 | |
5.606%, 01/15/44 | | | 675,000 | | | | 807,468 | |
| | | | | | | | |
| | | | | | | 51,487,798 | |
| | | | | | | | |
See accompanying notes to financial statements.
MSF-11
Metropolitan Series Fund
Met/Wellington Balanced Portfolio (formerly, WMC Balanced Portfolio)
Schedule of Investments as of June 30, 2016 (Unaudited)
Corporate Bonds & Notes—(Continued)
| | | | | | | | |
| Security Description | | Principal
Amount* | | | Value | |
|
Beverages—0.8% | |
Anheuser-Busch InBev Finance, Inc.
1.900%, 02/01/19 | | | 840,000 | | | $ | 854,263 | |
2.150%, 02/01/19 | | | 175,000 | | | | 178,737 | |
3.300%, 02/01/23 | | | 2,620,000 | | | | 2,760,615 | |
4.700%, 02/01/36 | | | 815,000 | | | | 915,838 | |
4.900%, 02/01/46 | | | 2,655,000 | | | | 3,111,240 | |
Anheuser-Busch InBev Worldwide, Inc.
2.500%, 07/15/22 | | | 290,000 | | | | 295,034 | |
3.750%, 07/15/42 | | | 405,000 | | | | 405,236 | |
Molson Coors Brewing Co.
2.100%, 07/15/21 | | | 175,000 | | | | 175,532 | |
4.200%, 07/15/46 | | | 285,000 | | | | 286,219 | |
Pernod Ricard S.A.
3.250%, 06/08/26 (144A) | | | 505,000 | | | | 516,859 | |
| | | | | | | | |
| | | | | | | 9,499,573 | |
| | | | | | | | |
|
Biotechnology—0.0% | |
Celgene Corp.
4.625%, 05/15/44 | | | 195,000 | | | | 202,821 | |
Gilead Sciences, Inc.
3.250%, 09/01/22 | | | 205,000 | | | | 218,304 | |
| | | | | | | | |
| | | | | | | 421,125 | |
| | | | | | | | |
|
Building Materials—0.1% | |
CRH America, Inc.
5.125%, 05/18/45 (144A) | | | 500,000 | | | | 531,282 | |
Norbord, Inc.
6.250%, 04/15/23 (144A) | | | 220,000 | | | | 225,500 | |
Standard Industries, Inc.
5.375%, 11/15/24 (144A) | | | 145,000 | | | | 147,537 | |
6.000%, 10/15/25 (144A) | | | 220,000 | | | | 229,900 | |
| | | | | | | | |
| | | | | | | 1,134,219 | |
| | | | | | | | |
|
Commercial Services—0.1% | |
Cardtronics, Inc.
5.125%, 08/01/22 | | | 220,000 | | | | 217,800 | |
ERAC USA Finance LLC
2.600%, 12/01/21 (144A) | | | 550,000 | | | | 558,963 | |
United Rentals North America, Inc.
4.625%, 07/15/23 | | | 105,000 | | | | 105,919 | |
5.500%, 07/15/25 (b) | | | 135,000 | | | | 132,975 | |
| | | | | | | | |
| | | | | | | 1,015,657 | |
| | | | | | | | |
|
Computers—0.1% | |
Apple, Inc.
3.450%, 02/09/45 | | | 550,000 | | | | 516,809 | |
Diamond 1 Finance Corp. / Diamond 2 Finance Corp.
3.480%, 06/01/19 (144A) | | | 250,000 | | | | 256,102 | |
4.420%, 06/15/21 (144A) | | | 195,000 | | | | 200,708 | |
8.350%, 07/15/46 (144A) | | | 235,000 | | | | 252,651 | |
NCR Corp.
4.625%, 02/15/21 | | | 240,000 | | | | 237,600 | |
| | | | | | | | |
| | | | | | | 1,463,870 | |
| | | | | | | | |
|
Diversified Financial Services—0.3% | |
Aircastle, Ltd.
5.000%, 04/01/23 | | | 25,000 | | | | 25,405 | |
5.500%, 02/15/22 | | | 50,000 | | | | 52,000 | |
Intercontinental Exchange, Inc.
2.750%, 12/01/20 | | | 435,000 | | | | 457,036 | |
International Lease Finance Corp.
5.875%, 04/01/19 | | | 615,000 | | | | 655,744 | |
Nasdaq, Inc.
3.850%, 06/30/26 | | | 110,000 | | | | 111,762 | |
Navient Corp.
5.500%, 01/15/19 | | | 520,000 | | | | 520,988 | |
Synchrony Financial
2.600%, 01/15/19 | | | 740,000 | | | | 748,098 | |
Visa, Inc.
2.800%, 12/14/22 | | | 510,000 | | | | 538,044 | |
4.300%, 12/14/45 | | | 590,000 | | | | 683,069 | |
| | | | | | | | |
| | | | | | | 3,792,146 | |
| | | | | | | | |
|
Electric—0.3% | |
AES Corp.
4.875%, 05/15/23 | | | 245,000 | | | | 241,937 | |
5.500%, 03/15/24 | | | 325,000 | | | | 332,719 | |
Duke Energy Carolinas LLC
4.250%, 12/15/41 | | | 435,000 | | | | 487,433 | |
Duke Energy Progress LLC
4.375%, 03/30/44 | | | 320,000 | | | | 366,265 | |
Electricite de France S.A.
4.950%, 10/13/45 (144A) | | | 650,000 | | | | 718,312 | |
Emera U.S. Finance L.P.
2.700%, 06/15/21 (144A) | | | 80,000 | | | | 81,523 | |
4.750%, 06/15/46 (144A) | | | 90,000 | | | | 91,343 | |
Exelon Corp.
2.450%, 04/15/21 | | | 80,000 | | | | 81,125 | |
2.850%, 06/15/20 | | | 565,000 | | | | 582,836 | |
NRG Energy, Inc.
6.250%, 07/15/22 | | | 200,000 | | | | 194,000 | |
Oncor Electric Delivery Co. LLC
7.000%, 09/01/22 | | | 130,000 | | | | 165,547 | |
Southern Co. (The)
1.850%, 07/01/19 (b) | | | 315,000 | | | | 318,985 | |
2.950%, 07/01/23 | | | 130,000 | | | | 134,758 | |
4.400%, 07/01/46 | | | 155,000 | | | | 166,613 | |
| | | | | | | | |
| | | | | | | 3,963,396 | |
| | | | | | | | |
|
Electrical Components & Equipment—0.0% | |
EnerSys
5.000%, 04/30/23 (144A) | | | 215,000 | | | | 212,312 | |
| | | | | | | | |
|
Electronics—0.0% | |
Fortive Corp.
2.350%, 06/15/21 (144A) | | | 295,000 | | | | 299,327 | |
| | | | | | | | |
|
Entertainment—0.0% | |
GLP Capital L.P. / GLP Financing II, Inc.
5.375%, 04/15/26 | | | 50,000 | | | | 51,500 | |
| | | | | | | | |
See accompanying notes to financial statements.
MSF-12
Metropolitan Series Fund
Met/Wellington Balanced Portfolio (formerly, WMC Balanced Portfolio)
Schedule of Investments as of June 30, 2016 (Unaudited)
Corporate Bonds & Notes—(Continued)
| | | | | | | | |
| Security Description | | Principal
Amount* | | | Value | |
|
Environmental Control—0.0% | |
Clean Harbors, Inc.
5.250%, 08/01/20 | | | 210,000 | | | $ | 214,987 | |
| | | | | | | | |
|
Food—0.1% | |
Kraft Heinz Foods Co.
2.000%, 07/02/18 (144A) | | | 325,000 | | | | 329,085 | |
2.800%, 07/02/20 (144A) | | | 205,000 | | | | 212,880 | |
4.375%, 06/01/46 (144A) | | | 125,000 | | | | 132,190 | |
Sigma Alimentos S.A. de C.V.
4.125%, 05/02/26 (144A) | | | 430,000 | | | | 434,838 | |
Sysco Corp.
2.500%, 07/15/21 | | | 430,000 | | | | 439,403 | |
| | | | | | | | |
| | | | | | | 1,548,396 | |
| | | | | | | | |
|
Forest Products & Paper—0.0% | |
Cascades, Inc.
5.500%, 07/15/22 (144A) | | | 70,000 | | | | 67,987 | |
5.750%, 07/15/23 (144A) | | | 120,000 | | | | 115,500 | |
Clearwater Paper Corp.
5.375%, 02/01/25 (144A) | | | 220,000 | | | | 220,000 | |
| | | | | | | | |
| | | | | | | 403,487 | |
| | | | | | | | |
|
Gas—0.0% | |
AmeriGas Partners L.P. / AmeriGas Finance Corp.
5.625%, 05/20/24 | | | 70,000 | | | | 70,525 | |
5.875%, 08/20/26 | | | 95,000 | | | | 95,237 | |
Southern Star Central Corp.
5.125%, 07/15/22 (144A) | | | 25,000 | | | | 24,375 | |
| | | | | | | | |
| | | | | | | 190,137 | |
| | | | | | | | |
|
Healthcare-Products—0.1% | |
Hologic, Inc.
5.250%, 07/15/22 (144A) | | | 60,000 | | | | 62,700 | |
Kinetic Concepts, Inc. / KCI USA, Inc.
7.875%, 02/15/21 (144A) | | | 190,000 | | | | 201,993 | |
Medtronic, Inc.
4.375%, 03/15/35 | | | 398,000 | | | | 450,193 | |
Thermo Fisher Scientific, Inc.
3.000%, 04/15/23 | | | 455,000 | | | | 464,497 | |
Zimmer Biomet Holdings, Inc.
1.450%, 04/01/17 | | | 555,000 | | | | 555,354 | |
| | | | | | | | |
| | | | | | | 1,734,737 | |
| | | | | | | | |
|
Healthcare-Services—0.5% | |
Aetna, Inc.
2.800%, 06/15/23 | | | 175,000 | | | | 178,763 | |
4.250%, 06/15/36 | | | 80,000 | | | | 82,654 | |
4.375%, 06/15/46 | | | 115,000 | | | | 119,427 | |
Anthem, Inc.
2.300%, 07/15/18 | | | 202,000 | | | | 204,906 | |
3.500%, 08/15/24 | | | 900,000 | | | | 931,791 | |
4.625%, 05/15/42 | | | 400,000 | | | | 419,581 | |
|
Healthcare-Services—(Continued) | |
CHS/Community Health Systems, Inc.
5.125%, 08/01/21 | | | 250,000 | | | | 248,125 | |
HCA, Inc.
4.750%, 05/01/23 | | | 60,000 | | | | 61,500 | |
6.500%, 02/15/20 | | | 535,000 | | | | 591,844 | |
MEDNAX, Inc.
5.250%, 12/01/23 (144A) | | | 40,000 | | | | 40,500 | |
Tenet Healthcare Corp.
6.000%, 10/01/20 | | | 535,000 | | | | 564,425 | |
UnitedHealth Group, Inc.
1.700%, 02/15/19 | | | 465,000 | | | | 469,904 | |
2.125%, 03/15/21 | | | 895,000 | | | | 911,843 | |
3.350%, 07/15/22 | | | 460,000 | | | | 492,118 | |
3.750%, 07/15/25 | | | 475,000 | | | | 521,131 | |
4.750%, 07/15/45 | | | 175,000 | | | | 210,823 | |
| | | | | | | | |
| | | | | | | 6,049,335 | |
| | | | | | | | |
|
Holding Companies-Diversified—0.1% | |
Hutchison Whampoa International, Ltd.
2.000%, 11/08/17 (144A) | | | 850,000 | | | | 858,290 | |
| | | | | | | | |
|
Home Builders—0.0% | |
CalAtlantic Group, Inc.
5.375%, 10/01/22 | | | 240,000 | | | | 244,200 | |
Meritage Homes Corp.
6.000%, 06/01/25 | | | 220,000 | | | | 221,100 | |
PulteGroup, Inc.
4.250%, 03/01/21 | | | 20,000 | | | | 20,620 | |
| | | | | | | | |
| | | | | | | 485,920 | |
| | | | | | | | |
|
Insurance—0.1% | |
American International Group, Inc.
4.700%, 07/10/35 | | | 295,000 | | | | 305,002 | |
CNO Financial Group, Inc.
4.500%, 05/30/20 | | | 10,000 | | | | 10,350 | |
5.250%, 05/30/25 | | | 50,000 | | | | 51,500 | |
Marsh & McLennan Cos., Inc.
3.500%, 03/10/25 | | | 370,000 | | | | 384,471 | |
Massachusetts Mutual Life Insurance Co.
8.875%, 06/01/39 (144A) | | | 325,000 | | | | 486,343 | |
Radian Group, Inc.
7.000%, 03/15/21 | | | 80,000 | | | | 85,550 | |
| | | | | | | | |
| | | | | | | 1,323,216 | |
| | | | | | | | |
|
Iron/Steel—0.1% | |
ArcelorMittal
6.250%, 08/05/20 (b) | | | 400,000 | | | | 420,000 | |
Steel Dynamics, Inc.
5.125%, 10/01/21 | | | 95,000 | | | | 97,256 | |
5.500%, 10/01/24 | | | 105,000 | | | | 107,362 | |
United States Steel Corp.
6.875%, 04/01/21 | | | 21,000 | | | | 18,218 | |
7.375%, 04/01/20 (b) | | | 21,000 | | | | 19,760 | |
| | | | | | | | |
| | | | | | | 662,596 | |
| | | | | | | | |
See accompanying notes to financial statements.
MSF-13
Metropolitan Series Fund
Met/Wellington Balanced Portfolio (formerly, WMC Balanced Portfolio)
Schedule of Investments as of June 30, 2016 (Unaudited)
Corporate Bonds & Notes—(Continued)
| | | | | | | | |
| Security Description | | Principal
Amount* | | | Value | |
|
Lodging—0.0% | |
Wynn Las Vegas LLC / Wynn Las Vegas Capital Corp.
5.375%, 03/15/22 (b) | | | 296,000 | | | $ | 297,850 | |
| | | | | | | | |
|
Machinery-Construction & Mining—0.0% | |
Oshkosh Corp.
5.375%, 03/01/25 | | | 120,000 | | | | 123,300 | |
| | | | | | | | |
|
Machinery-Diversified—0.0% | |
Case New Holland Industrial, Inc.
7.875%, 12/01/17 | | | 335,000 | | | | 360,125 | |
CNH Industrial Capital LLC
3.375%, 07/15/19 | | | 15,000 | | | | 14,662 | |
| | | | | | | | |
| | | | | | | 374,787 | |
| | | | | | | | |
|
Media—1.2% | |
21st Century Fox America, Inc.
3.700%, 10/15/25 (b) | | | 245,000 | | | | 265,383 | |
6.150%, 03/01/37 | | | 685,000 | | | | 850,246 | |
CBS Corp.
4.000%, 01/15/26 | | | 150,000 | | | | 160,105 | |
CCO Holdings LLC / CCO Holdings Capital Corp.
5.125%, 02/15/23 | | | 10,000 | | | | 10,155 | |
5.250%, 09/30/22 | | | 290,000 | | | | 297,613 | |
5.750%, 09/01/23 | | | 60,000 | | | | 62,100 | |
5.750%, 02/15/26 (144A) | | | 30,000 | | | | 30,900 | |
Charter Communications Operating LLC / Charter Communications Operating Capital Corp.
3.579%, 07/23/20 (144A) | | | 620,000 | | | | 648,175 | |
4.464%, 07/23/22 (144A) | | | 815,000 | | | | 875,910 | |
4.908%, 07/23/25 (144A) | | | 890,000 | | | | 973,039 | |
6.484%, 10/23/45 (144A) | | | 1,140,000 | | | | 1,361,184 | |
Comcast Corp.
2.750%, 03/01/23 | | | 655,000 | | | | 685,953 | |
3.150%, 03/01/26 | | | 995,000 | | | | 1,059,066 | |
4.750%, 03/01/44 | | | 240,000 | | | | 279,846 | |
COX Communications, Inc.
3.250%, 12/15/22 (144A) | | | 190,000 | | | | 189,471 | |
3.850%, 02/01/25 (144A) (b) | | | 355,000 | | | | 357,561 | |
DISH DBS Corp.
7.875%, 09/01/19 | | | 490,000 | | | | 540,225 | |
Grupo Televisa S.A.B.
6.125%, 01/31/46 | | | 360,000 | | | | 397,537 | |
Liberty Interactive LLC
8.250%, 02/01/30 | | | 385,000 | | | | 399,437 | |
NBCUniversal Media LLC
5.150%, 04/30/20 | | | 86,000 | | | | 97,477 | |
Sky plc
2.625%, 09/16/19 (144A) | | | 480,000 | | | | 488,394 | |
TEGNA, Inc.
4.875%, 09/15/21 (144A) | | | 225,000 | | | | 230,625 | |
5.125%, 10/15/19 | | | 360,000 | | | | 370,350 | |
6.375%, 10/15/23 | | | 55,000 | | | | 58,438 | |
|
Media—(Continued) | |
Time Warner Cable, Inc.
4.500%, 09/15/42 | | | 325,000 | | | | 302,720 | |
7.300%, 07/01/38 | | | 500,000 | | | | 626,122 | |
8.250%, 04/01/19 | | | 626,000 | | | | 726,912 | |
8.750%, 02/14/19 | | | 759,000 | | | | 886,215 | |
Time Warner, Inc.
3.600%, 07/15/25 | | | 350,000 | | | | 370,351 | |
4.850%, 07/15/45 | | | 275,000 | | | | 298,999 | |
6.500%, 11/15/36 | | | 535,000 | | | | 678,458 | |
Videotron, Ltd.
5.375%, 06/15/24 (144A) | | | 195,000 | | | | 197,925 | |
| | | | | | | | |
| | | | | | | 14,776,892 | |
| | | | | | | | |
|
Mining—0.0% | |
Freeport-McMoRan, Inc.
3.875%, 03/15/23 (b) | | | 25,000 | | | | 21,875 | |
4.550%, 11/14/24 (b) | | | 65,000 | | | | 56,875 | |
5.400%, 11/14/34 | | | 80,000 | | | | 63,600 | |
5.450%, 03/15/43 | | | 145,000 | | | | 116,362 | |
Kaiser Aluminum Corp.
5.875%, 05/15/24 (144A) | | | 45,000 | | | | 46,238 | |
Rio Tinto Finance USA, Ltd.
3.750%, 06/15/25 (b) | | | 180,000 | | | | 188,302 | |
Teck Resources, Ltd.
8.500%, 06/01/24 (144A) | | | 30,000 | | | | 31,125 | |
| | | | | | | | |
| | | | | | | 524,377 | |
| | | | | | | | |
|
Oil & Gas—1.4% | |
Anadarko Petroleum Corp.
4.850%, 03/15/21 | | | 145,000 | | | | 153,789 | |
5.550%, 03/15/26 (b) | | | 635,000 | | | | 701,218 | |
6.375%, 09/15/17 | | | 54,000 | | | | 56,838 | |
6.600%, 03/15/46 | | | 640,000 | | | | 772,803 | |
6.950%, 06/15/19 | | | 75,000 | | | | 83,111 | |
Antero Resources Corp.
5.625%, 06/01/23 | | | 50,000 | | | | 48,500 | |
BP Capital Markets plc
2.750%, 05/10/23 | | | 500,000 | | | | 503,816 | |
3.062%, 03/17/22 | | | 125,000 | | | | 129,158 | |
Cenovus Energy, Inc.
3.000%, 08/15/22 | | | 1,060,000 | | | | 967,632 | |
3.800%, 09/15/23 | | | 120,000 | | | | 112,934 | |
5.200%, 09/15/43 | | | 455,000 | | | | 390,915 | |
5.700%, 10/15/19 | | | 247,000 | | | | 261,255 | |
Concho Resources, Inc.
5.500%, 04/01/23 | | | 75,000 | | | | 75,187 | |
6.500%, 01/15/22 | | | 65,000 | | | | 66,544 | |
ConocoPhillips Co.
4.200%, 03/15/21 | | | 500,000 | | | | 541,370 | |
4.950%, 03/15/26 (b) | | | 720,000 | | | | 816,424 | |
Continental Resources, Inc.
3.800%, 06/01/24 | | | 5,000 | | | | 4,363 | |
4.500%, 04/15/23 | | | 10,000 | | | | 9,325 | |
4.900%, 06/01/44 | | | 10,000 | �� | | | 8,250 | |
5.000%, 09/15/22 (b) | | | 100,000 | | | | 97,750 | |
See accompanying notes to financial statements.
MSF-14
Metropolitan Series Fund
Met/Wellington Balanced Portfolio (formerly, WMC Balanced Portfolio)
Schedule of Investments as of June 30, 2016 (Unaudited)
Corporate Bonds & Notes—(Continued)
| | | | | | | | |
| Security Description | | Principal
Amount* | | | Value | |
|
Oil & Gas—(Continued) | |
Devon Energy Corp.
3.250%, 05/15/22 (b) | | | 895,000 | | | $ | 867,967 | |
6.300%, 01/15/19 | | | 200,000 | | | | 216,669 | |
Devon Financing Co. LLC
7.875%, 09/30/31 | | | 100,000 | | | | 116,367 | |
Ecopetrol S.A.
5.875%, 05/28/45 | | | 585,000 | | | | 508,365 | |
EOG Resources, Inc.
4.150%, 01/15/26 (b) | | | 225,000 | | | | 246,323 | |
Exxon Mobil Corp.
2.222%, 03/01/21 | | | 565,000 | | | | 582,541 | |
2.726%, 03/01/23 | | | 475,000 | | | | 495,904 | |
3.043%, 03/01/26 | | | 230,000 | | | | 244,148 | |
Hess Corp.
5.600%, 02/15/41 | | | 210,000 | | | | 211,755 | |
6.000%, 01/15/40 | | | 260,000 | | | | 268,873 | |
Kerr-McGee Corp.
6.950%, 07/01/24 | | | 480,000 | | | | 554,988 | |
Marathon Oil Corp.
2.700%, 06/01/20 | | | 595,000 | | | | 560,306 | |
2.800%, 11/01/22 | | | 35,000 | | | | 31,742 | |
3.850%, 06/01/25 (b) | | | 65,000 | | | | 59,717 | |
5.200%, 06/01/45 | | | 30,000 | | | | 26,116 | |
6.600%, 10/01/37 | | | 15,000 | | | | 15,164 | |
6.800%, 03/15/32 | | | 15,000 | | | | 15,227 | |
MEG Energy Corp.
7.000%, 03/31/24 (144A) | | | 136,000 | | | | 104,720 | |
Noble Energy, Inc.
4.150%, 12/15/21 | | | 320,000 | | | | 336,472 | |
Petrobras Global Finance B.V.
8.375%, 05/23/21 | | | 1,005,000 | | | | 1,037,160 | |
Petroleos Mexicanos
3.500%, 07/23/20 | | | 180,000 | | | | 179,840 | |
5.500%, 02/04/19 (144A) | | | 380,000 | | | | 399,380 | |
5.500%, 06/27/44 | | | 905,000 | | | | 817,713 | |
5.750%, 03/01/18 | | | 970,000 | | | | 1,014,290 | |
6.375%, 02/04/21 (144A) | | | 195,000 | | | | 212,023 | |
Pioneer Natural Resources Co.
3.450%, 01/15/21 | | | 65,000 | | | | 67,118 | |
3.950%, 07/15/22 | | | 120,000 | | | | 125,552 | |
4.450%, 01/15/26 | | | 580,000 | | | | 631,908 | |
QEP Resources, Inc.
5.375%, 10/01/22 | | | 5,000 | | | | 4,663 | |
6.800%, 03/01/20 | | | 15,000 | | | | 15,112 | |
SM Energy Co.
6.125%, 11/15/22 (b) | | | 55,000 | | | | 50,531 | |
Statoil ASA
3.700%, 03/01/24 (b) | | | 90,000 | | | | 97,214 | |
3.950%, 05/15/43 | | | 525,000 | | | | 542,640 | |
Tesoro Corp.
5.125%, 04/01/24 | | | 150,000 | | | | 150,750 | |
Valero Energy Corp.
4.900%, 03/15/45 | | | 325,000 | | | | 301,027 | |
| | | | | | | | |
| | | | | | | 16,911,467 | |
| | | | | | | | |
|
Packaging & Containers—0.0% | |
Graphic Packaging International, Inc.
4.875%, 11/15/22 | | | 220,000 | | | | 228,800 | |
Owens-Brockway Glass Container, Inc.
5.875%, 08/15/23 (144A) (b) | | | 95,000 | | | | 99,790 | |
Reynolds Group Issuer, Inc. / Reynolds Group Issuer LLC
5.125%, 07/15/23 (144A) | | | 130,000 | | | | 131,625 | |
| | | | | | | | |
| | | | | | | 460,215 | |
| | | | | | | | |
|
Pharmaceuticals—0.5% | |
AbbVie, Inc.
3.200%, 05/14/26 | | | 250,000 | | | | 253,244 | |
Actavis Funding SCS
2.350%, 03/12/18 | | | 1,545,000 | | | | 1,566,057 | |
3.000%, 03/12/20 | | | 1,020,000 | | | | 1,051,956 | |
3.450%, 03/15/22 | | | 485,000 | | | | 503,702 | |
Baxalta, Inc.
3.600%, 06/23/22 | | | 55,000 | | | | 56,764 | |
Cardinal Health, Inc.
1.950%, 06/15/18 | | | 265,000 | | | | 268,071 | |
EMD Finance LLC
2.950%, 03/19/22 (144A) | | | 600,000 | | | | 614,732 | |
Mylan NV
3.000%, 12/15/18 (144A) | | | 280,000 | | | | 286,665 | |
3.150%, 06/15/21 (144A) | | | 255,000 | | | | 258,659 | |
3.750%, 12/15/20 (144A) | | | 325,000 | | | | 338,837 | |
Perrigo Co. plc
1.300%, 11/08/16 | | | 335,000 | | | | 334,647 | |
Quintiles Transnational Corp.
4.875%, 05/15/23 (144A) | | | 85,000 | | | | 86,275 | |
| | | | | | | | |
| | | | | | | 5,619,609 | |
| | | | | | | | |
|
Pipelines—0.5% | |
DCP Midstream LLC
5.350%, 03/15/20 (144A) | | | 25,000 | | | | 24,500 | |
9.750%, 03/15/19 (144A) | | | 30,000 | | | | 32,850 | |
DCP Midstream Operating L.P.
2.700%, 04/01/19 | | | 30,000 | | | | 28,746 | |
3.875%, 03/15/23 | | | 20,000 | | | | 18,200 | |
4.950%, 04/01/22 | | | 66,000 | | | | 64,845 | |
5.600%, 04/01/44 | | | 50,000 | | | | 42,750 | |
Energy Transfer Equity L.P.
7.500%, 10/15/20 | | | 540,000 | | | | 572,400 | |
Energy Transfer Partners L.P.
5.950%, 10/01/43 | | | 120,000 | | | | 115,961 | |
Enterprise Products Operating LLC
3.950%, 02/15/27 | | | 240,000 | | | | 254,551 | |
Kinder Morgan Energy Partners L.P.
5.300%, 09/15/20 | | | 135,000 | | | | 144,448 | |
6.500%, 04/01/20 | | | 50,000 | | | | 55,136 | |
6.850%, 02/15/20 | | | 95,000 | | | | 106,317 | |
Kinder Morgan, Inc.
5.050%, 02/15/46 (b) | | | 620,000 | | | | 589,321 | |
Magellan Midstream Partners L.P.
5.000%, 03/01/26 | | | 145,000 | | | | 164,029 | |
See accompanying notes to financial statements.
MSF-15
Metropolitan Series Fund
Met/Wellington Balanced Portfolio (formerly, WMC Balanced Portfolio)
Schedule of Investments as of June 30, 2016 (Unaudited)
Corporate Bonds & Notes—(Continued)
| | | | | | | | |
| Security Description | | Principal
Amount* | | | Value | |
|
Pipelines—(Continued) | |
MPLX L.P.
4.875%, 12/01/24 (144A) | | | 105,000 | | | $ | 102,287 | |
4.875%, 06/01/25 (144A) | | | 100,000 | | | | 97,732 | |
Plains All American Pipeline L.P. / PAA Finance Corp.
2.850%, 01/31/23 | | | 470,000 | | | | 432,609 | |
3.650%, 06/01/22 | | | 470,000 | | | | 460,919 | |
Regency Energy Partners L.P. / Regency Energy Finance Corp.
5.500%, 04/15/23 | | | 175,000 | | | | 176,556 | |
5.875%, 03/01/22 | | | 275,000 | | | | 294,152 | |
Sunoco Logistics Partners Operations L.P.
4.250%, 04/01/24 | | | 300,000 | | | | 303,040 | |
Tesoro Logistics L.P. / Tesoro Logistics Finance Corp.
5.500%, 10/15/19 | | | 130,000 | | | | 135,850 | |
6.250%, 10/15/22 (b) | | | 200,000 | | | | 208,500 | |
Texas Eastern Transmission L.P.
2.800%, 10/15/22 (144A) | | | 420,000 | | | | 411,658 | |
Western Gas Partners L.P.
4.650%, 07/01/26 | | | 235,000 | | | | 237,443 | |
Williams Partners L.P.
3.600%, 03/15/22 | | | 1,075,000 | | | | 1,018,403 | |
4.300%, 03/04/24 | | | 260,000 | | | | 244,595 | |
| | | | | | | | |
| | | | | | | 6,337,798 | |
| | | | | | | | |
|
Real Estate—0.1% | |
Prologis L.P.
3.350%, 02/01/21 | | | 975,000 | | | | 1,031,586 | |
| | | | | | | | |
|
Real Estate Investment Trusts—0.4% | |
American Tower Corp.
3.400%, 02/15/19 | | | 385,000 | | | | 400,912 | |
4.500%, 01/15/18 | | | 425,000 | | | | 443,394 | |
Brandywine Operating Partnership L.P.
3.950%, 02/15/23 | | | 775,000 | | | | 783,111 | |
Crown Castle International Corp.
3.400%, 02/15/21 | | | 65,000 | | | | 67,856 | |
3.700%, 06/15/26 | | | 245,000 | | | | 252,764 | |
HCP, Inc.
4.000%, 06/01/25 | | | 500,000 | | | | 503,859 | |
Kimco Realty Corp.
3.125%, 06/01/23 | | | 605,000 | | | | 616,318 | |
3.400%, 11/01/22 | | | 200,000 | | | | 209,639 | |
Liberty Property L.P.
4.125%, 06/15/22 | | | 525,000 | | | | 555,067 | |
Ventas Realty L.P. / Ventas Capital Corp.
2.700%, 04/01/20 | | | 465,000 | | | | 474,565 | |
VEREIT Operating Partnership L.P.
4.125%, 06/01/21 | | | 295,000 | | | | 307,720 | |
Welltower, Inc.
4.500%, 01/15/24 | | | 310,000 | | | | 336,156 | |
| | | | | | | | |
| | | | | | | 4,951,361 | |
| | | | | | | | |
|
Retail—0.4% | |
AutoZone, Inc.
1.625%, 04/21/19 | | | 140,000 | | | | 140,728 | |
CVS Health Corp.
2.125%, 06/01/21 | | | 80,000 | | | | 80,984 | |
2.800%, 07/20/20 | | | 750,000 | | | | 780,952 | |
3.875%, 07/20/25 | | | 324,000 | | | | 356,393 | |
5.125%, 07/20/45 | | | 710,000 | | | | 880,809 | |
Group 1 Automotive, Inc.
5.000%, 06/01/22 (b) | | | 205,000 | | | | 201,925 | |
KFC Holding Co. / Pizza Hut Holdings LLC / Taco Bell of America LLC
5.250%, 06/01/26 (144A) | | | 110,000 | | | | 112,750 | |
Lowe’s Cos., Inc.
2.500%, 04/15/26 | | | 700,000 | | | | 712,953 | |
3.700%, 04/15/46 | | | 575,000 | | | | 591,205 | |
McDonald’s Corp.
2.750%, 12/09/20 | | | 230,000 | | | | 240,121 | |
Walgreens Boots Alliance, Inc.
2.600%, 06/01/21 | | | 195,000 | | | | 198,638 | |
3.100%, 06/01/23 | | | 160,000 | | | | 162,962 | |
| | | | | | | | |
| | | | | | | 4,460,420 | |
| | | | | | | | |
|
Savings & Loans—0.1% | |
Nationwide Building Society
6.875%, 06/20/19 (GBP) (b) (d) | | | 555,000 | | | | 690,353 | |
| | | | | | | | |
|
Semiconductors—0.1% | |
Intel Corp.
4.100%, 05/19/46 | | | 235,000 | | | | 244,331 | |
Lam Research Corp.
2.800%, 06/15/21 | | | 410,000 | | | | 419,735 | |
NXP B.V. / NXP Funding LLC
4.625%, 06/15/22 (144A) | | | 200,000 | | | | 203,000 | |
Sensata Technologies B.V.
5.000%, 10/01/25 (144A) | | | 180,000 | | | | 180,790 | |
5.625%, 11/01/24 (144A) | | | 20,000 | | | | 20,763 | |
| | | | | | | | |
| | | | | | | 1,068,619 | |
| | | | | | | | |
|
Shipbuilding—0.0% | |
Huntington Ingalls Industries, Inc.
5.000%, 11/15/25 (144A) | | | 25,000 | | | | 26,437 | |
| | | | | | | | |
|
Software—0.1% | |
First Data Corp.
5.000%, 01/15/24 (144A) | | | 40,000 | | | | 40,100 | |
5.375%, 08/15/23 (144A) | | | 215,000 | | | | 218,335 | |
MSCI, Inc.
5.250%, 11/15/24 (144A) | | | 75,000 | | | | 76,687 | |
5.750%, 08/15/25 (144A) | | | 65,000 | | | | 67,438 | |
Open Text Corp.
5.625%, 01/15/23 (144A) | | | 80,000 | | | | 80,800 | |
Oracle Corp.
1.900%, 09/15/21 | | | 875,000 | | | | 878,214 | |
| | | | | | | | |
| | | | | | | 1,361,574 | |
| | | | | | | | |
See accompanying notes to financial statements.
MSF-16
Metropolitan Series Fund
Met/Wellington Balanced Portfolio (formerly, WMC Balanced Portfolio)
Schedule of Investments as of June 30, 2016 (Unaudited)
Corporate Bonds & Notes—(Continued)
| | | | | | | | |
| Security Description | | Principal
Amount* | | | Value | |
|
Telecommunications—0.8% | |
AT&T, Inc.
3.600%, 02/17/23 | | | 955,000 | | | $ | 996,236 | |
4.500%, 05/15/35 | | | 195,000 | | | | 199,484 | |
4.750%, 05/15/46 | | | 960,000 | | | | 983,878 | |
5.150%, 03/15/42 | | | 439,000 | | | | 473,664 | |
Cisco Systems, Inc.
2.200%, 02/28/21 | | | 610,000 | | | | 628,676 | |
CommScope, Inc.
4.375%, 06/15/20 (144A) | | | 135,000 | | | | 139,050 | |
Digicel Group, Ltd.
7.125%, 04/01/22 | | | 530,000 | | | | 394,187 | |
Frontier Communications Corp.
10.500%, 09/15/22 | | | 65,000 | | | | 68,778 | |
GTP Acquisition Partners LLC
3.482%, 06/15/50 (144A) | | | 1,355,000 | | | | 1,369,065 | |
Inmarsat Finance plc
4.875%, 05/15/22 (144A) | | | 130,000 | | | | 118,625 | |
Nokia Oyj
6.625%, 05/15/39 | | | 200,000 | | | | 211,500 | |
Sprint Communications, Inc.
7.000%, 03/01/20 (144A) (b) | | | 630,000 | | | | 659,604 | |
T-Mobile USA, Inc.
6.731%, 04/28/22 | | | 175,000 | | | | 184,021 | |
Telecom Italia Capital S.A.
6.000%, 09/30/34 | | | 45,000 | | | | 42,975 | |
6.375%, 11/15/33 | | | 10,000 | | | | 9,938 | |
7.721%, 06/04/38 | | | 50,000 | | | | 52,000 | |
Verizon Communications, Inc.
4.400%, 11/01/34 | | | 535,000 | | | | 551,664 | |
4.672%, 03/15/55 | | | 2,128,000 | | | | 2,152,344 | |
5.012%, 08/21/54 | | | 523,000 | | | | 553,100 | |
Wind Acquisition Finance S.A.
4.750%, 07/15/20 (144A) | | | 200,000 | | | | 196,000 | |
| | | | | | | | |
| | | | | | | 9,984,789 | |
| | | | | | | | |
|
Transportation—0.2% | |
FedEx Corp.
3.250%, 04/01/26 (b) | | | 160,000 | | | | 167,366 | |
4.550%, 04/01/46 | | | 315,000 | | | | 341,805 | |
Kansas City Southern
3.000%, 05/15/23 (144A) | | | 1,015,000 | | | | 1,031,956 | |
Norfolk Southern Corp.
2.900%, 06/15/26 | | | 400,000 | | | | 411,570 | |
Ryder System, Inc.
2.550%, 06/01/19 | | | 260,000 | | | | 264,973 | |
| | | | | | | | |
| | | | | | | 2,217,670 | |
| | | | | | | | |
|
Trucking & Leasing—0.1% | |
Penske Truck Leasing Co. L.P. / PTL Finance Corp.
4.875%, 07/11/22 (144A) | | | 1,180,000 | | | | 1,286,835 | |
| | | | | | | | |
Total Corporate Bonds & Notes
(Cost $168,837,956) | | | | 171,273,790 | |
| | | | | | | | |
| Asset-Backed Securities—6.8% | |
| Security Description | | Principal
Amount* | | | Value | |
|
Asset-Backed - Automobile—0.4% | |
AmeriCredit Automobile Receivables Trust
2.290%, 11/08/19 | | | 100,000 | | | | 101,082 | |
2.720%, 09/09/19 | | | 620,000 | | | | 626,672 | |
3.310%, 10/08/19 | | | 245,000 | | | | 249,218 | |
Credit Acceptance Auto Loan Trust
1.550%, 10/15/21 (144A) | | | 532,351 | | | | 532,373 | |
First Investors Auto Owner Trust
1.810%, 10/15/18 (144A) | | | 125,915 | | | | 125,931 | |
2.390%, 11/16/20 (144A) | | | 285,000 | | | | 284,352 | |
Flagship Credit Auto Trust
1.210%, 04/15/19 (144A) | | | 83,597 | | | | 83,354 | |
GM Financial Automobile Leasing Trust
1.960%, 03/20/18 (144A) | | | 200,000 | | | | 200,402 | |
Santander Drive Auto Receivables Trust
2.360%, 04/15/20 | | | 785,000 | | | | 789,522 | |
3.120%, 10/15/19 (144A) | | | 300,000 | | | | 303,628 | |
3.780%, 10/15/19 (144A) | | | 195,000 | | | | 199,579 | |
4.670%, 01/15/20 (144A) | | | 1,085,000 | | | | 1,110,440 | |
Westlake Automobile Receivables Trust
1.580%, 04/15/20 (144A) | | | 1,335,000 | | | | 1,334,615 | |
| | | | | | | | |
| | | | | | | 5,941,168 | |
| | | | | | | | |
|
Asset-Backed - Home Equity—0.3% | |
GSAA Home Equity Trust
0.503%, 12/25/46 (d) (g) | | | 124,354 | | | | 77,242 | |
0.523%, 12/25/46 (d) (f) | | | 394,643 | | | | 205,348 | |
0.553%, 03/25/37 (d) (f) | | | 863,048 | | | | 440,219 | |
0.673%, 05/25/47 (d) (f) | | | 29,110 | | | | 20,391 | |
0.683%, 04/25/47 (d) (f) | | | 278,476 | | | | 183,670 | |
0.693%, 11/25/36 (d) (f) | | | 362,705 | | | | 205,727 | |
0.753%, 03/25/36 (d) (f) | | | 1,601,642 | | | | 1,060,304 | |
5.876%, 09/25/36 (f) | | | 170,647 | | | | 87,428 | |
5.985%, 06/25/36 (d) (f) | | | 658,680 | | | | 332,063 | |
Morgan Stanley ABS Capital I, Inc. Trust
0.603%, 06/25/36 (d) (f) | | | 70,911 | | | | 63,261 | |
Renaissance Home Equity Loan Trust
5.909%, 04/25/37 (f) | | | 680,738 | | | | 347,178 | |
6.120%, 11/25/36 (f) | | | 265,322 | | | | 157,292 | |
Soundview Home Loan Trust
0.703%, 11/25/36 (d) (f) | | | 595,000 | | | | 394,247 | |
| | | | | | | | |
| | | | | | | 3,574,370 | |
| | | | | | | | |
|
Asset-Backed - Other—6.1% | |
AMMC CLO, Ltd.
2.088%, 07/27/26 (144A) (d) | | | 1,340,000 | | | | 1,333,134 | |
Apidos CLO
2.083%, 01/19/25 (144A) (d) | | | 895,000 | | | | 892,635 | |
2.133%, 04/17/26 (144A) (d) | | | 1,595,000 | | | | 1,592,496 | |
2.183%, 01/16/27 (144A) (d) | | | 480,000 | | | | 480,024 | |
2.478%, 07/15/23 (144A) (d) | | | 465,000 | | | | 456,411 | |
Ares CLO, Ltd.
1.484%, 04/20/23 (144A) (d) | | | 965,237 | | | | 955,410 | |
2.153%, 04/17/26 (144A) (d) | | | 1,475,000 | | | | 1,461,526 | |
See accompanying notes to financial statements.
MSF-17
Metropolitan Series Fund
Met/Wellington Balanced Portfolio (formerly, WMC Balanced Portfolio)
Schedule of Investments as of June 30, 2016 (Unaudited)
Asset-Backed Securities—(Continued)
| | | | | | | | |
| Security Description | | Principal
Amount* | | | Value | |
|
Asset-Backed - Other—(Continued) | |
Atlas Senior Loan Fund, Ltd.
2.168%, 10/15/26 (144A) (d) | | | 1,190,000 | | | $ | 1,184,874 | |
2.183%, 07/16/26 (144A) (d) | | | 615,000 | | | | 612,256 | |
Atrium CDO Corp.
2.071%, 11/16/22 (144A) (d) | | | 550,000 | | | | 545,621 | |
Avery Point CLO, Ltd.
2.158%, 04/25/26 (144A) (d) | | | 1,460,000 | | | | 1,455,357 | |
Babson CLO, Ltd.
2.124%, 07/20/25 (144A) (d) | | | 340,000 | | | | 338,288 | |
Battalion CLO, Ltd.
2.035%, 10/22/25 (144A) (d) | | | 615,000 | | | | 610,328 | |
Benefit Street Partners CLO, Ltd.
1.828%, 07/15/24 (144A) (d) | | | 320,000 | | | | 316,777 | |
Carlyle Global Market Strategies CLO, Ltd.
2.104%, 04/27/27 (144A) (d) | | | 1,425,000 | | | | 1,420,829 | |
Cent CLO, Ltd.
1.937%, 01/30/25 (144A) (d) | | | 1,135,000 | | | | 1,127,862 | |
2.112%, 11/07/26 (144A) (d) | | | 760,000 | | | | 753,159 | |
2.123%, 04/17/26 (144A) (d) | | | 1,345,000 | | | | 1,342,852 | |
2.124%, 07/27/26 (144A) (d) | | | 940,000 | | | | 929,546 | |
2.683%, 04/17/26 (144A) (d) | | | 530,000 | | | | 522,548 | |
CIFC Funding, Ltd.
2.133%, 04/18/25 (144A) (d) | | | 1,585,000 | | | | 1,576,942 | |
2.141%, 05/24/26 (144A) (d) | | | 1,580,000 | | | | 1,574,102 | |
2.409%, 08/14/24 (144A) (d) | | | 985,000 | | | | 976,563 | |
3.380%, 12/05/24 (144A) (d) | | | 950,000 | | | | 921,286 | |
Consumer Credit Origination Loan Trust
2.820%, 03/15/21 (144A) (g) | | | 107,442 | | | | 107,440 | |
Dryden Senior Loan Fund
2.058%, 07/15/27 (144A) (d) | | | 1,215,000 | | | | 1,205,747 | |
2.108%, 07/15/26 (144A) (d) | | | 1,605,000 | | | | 1,601,179 | |
Finance America Mortgage Loan Trust
1.503%, 09/25/33 (d) (f) | | | 102,950 | | | | 95,032 | |
Flatiron CLO, Ltd.
2.533%, 07/17/26 (144A) (d) | | | 330,000 | | | | 319,379 | |
Ford Credit Floorplan Master Owner Trust
1.400%, 02/15/19 | | | 230,000 | | | | 229,336 | |
2.860%, 01/15/19 | | | 139,000 | | | | 139,996 | |
3.500%, 01/15/19 | | | 265,000 | | | | 267,464 | |
Fremont Home Loan Trust
1.503%, 12/25/33 (d) (f) | | | 96,431 | | | | 91,942 | |
Galaxy XV CLO, Ltd.
1.878%, 04/15/25 (144A) (d) | | | 400,000 | | | | 396,477 | |
GMACM Home Equity Loan Trust
0.946%, 10/25/34 (144A) (d) | | | 102,946 | | | | 95,206 | |
Green Tree Agency Advance Funding Trust
3.095%, 10/15/48 (144A) | | | 705,000 | | | | 707,968 | |
Highbridge Loan Management, Ltd.
2.083%, 05/05/27 (144A) (d) | | | 895,000 | | | | 888,296 | |
KKR Financial CLO, Ltd.
1.778%, 07/15/25 (144A) (d) | | | 565,000 | | | | 555,979 | |
Knollwood CDO, Ltd.
3.831%, 01/10/39 (144A) (d) | | | 588,623 | | | | 6 | |
Lehman XS Trust
0.713%, 11/25/35 (d) (g) | | | 246,480 | | | | 161,485 | |
|
Asset-Backed - Other—(Continued) | |
Limerock CLO, Ltd.
2.133%, 04/18/26 (144A) (d) | | | 1,590,000 | | | | 1,578,962 | |
Madison Park Funding, Ltd.
1.918%, 10/23/25 (144A) (d) | | | 1,341,165 | | | | 1,333,873 | |
2.134%, 07/20/26 (144A) (d) | | | 1,485,000 | | | | 1,482,464 | |
Magnetite CLO, Ltd.
5.128%, 01/15/25 (144A) (d) (g) | | | 1,125,000 | | | | 1,120,551 | |
Magnetite, Ltd.
2.058%, 07/25/26 (144A) (d) | | | 1,255,000 | | | | 1,251,466 | |
2.108%, 04/15/26 (144A) (d) | | | 970,000 | | | | 967,513 | |
2.128%, 04/15/27 (144A) (d) | | | 955,000 | | | | 952,658 | |
2.588%, 07/25/26 (144A) (d) | | | 1,010,000 | | | | 1,004,641 | |
Nationstar HECM Loan Trust
2.239%, 06/25/26 (144A) | | | 225,000 | | | | 225,000 | |
2.981%, 02/25/26 (144A) | | | 634,549 | | | | 635,335 | |
Neuberger Berman CLO, Ltd.
2.098%, 04/15/26 (144A) (d) | | | 1,170,000 | | | | 1,166,688 | |
2.107%, 08/04/25 (144A) (d) | | | 1,230,000 | | | | 1,225,763 | |
NRZ Advance Receivables Trust Advance Receivables Backed
3.302%, 08/17/48 (144A) | | | 3,710,000 | | | | 3,745,138 | |
Oak Hill Credit Partners, Ltd.
2.104%, 07/20/26 (144A) (d) | | | 455,000 | | | | 454,205 | |
Oaktree EIF, Ltd.
2.176%, 02/15/26 (144A) (d) | | | 1,345,000 | | | | 1,332,887 | |
OCP CLO, Ltd.
2.163%, 04/17/27 (144A) (d) | | | 1,230,000 | | | | 1,214,513 | |
Octagon Investment Partners, Ltd.
1.753%, 07/17/25 (144A) (d) | | | 720,000 | | | | 711,127 | |
Ocwen Master Advance Receivables Trust
2.537%, 09/17/46 (144A) | | | 1,125,000 | | | | 1,125,074 | |
OHA Credit Partners, Ltd.
1.754%, 04/20/25 (144A) (d) | | | 1,612,000 | | | | 1,595,551 | |
OHA Loan Funding, Ltd.
1.924%, 08/23/24 (144A) (d) | | | 695,000 | | | | 691,720 | |
2.126%, 02/15/27 (144A) (d) | | | 1,575,000 | | | | 1,571,855 | |
OneMain Financial Issuance Trust
4.100%, 03/20/28 (144A) | | | 1,650,000 | | | | 1,701,309 | |
OZLM Funding, Ltd.
1.785%, 07/22/25 (144A) (d) | | | 1,205,000 | | | | 1,192,509 | |
OZLM XII, Ltd.
2.087%, 04/30/27 (144A) (d) | | | 1,360,000 | | | | 1,343,399 | |
Race Point CLO, Ltd
2.138%, 04/15/27 (144A) (d) | | | 1,610,000 | | | | 1,603,562 | |
SBA Tower Trust
2.898%, 10/15/44 (144A) | | | 845,000 | | | | 856,733 | |
Securitized Asset-Backed Receivables LLC Trust
0.543%, 07/25/36 (d) (f) | | | 565,280 | | | | 261,909 | |
Seneca Park CLO, Ltd.
2.113%, 07/17/26 (144A) (d) | | | 1,095,000 | | | | 1,092,356 | |
Shackleton CLO
2.113%, 07/17/26 (144A) (d) | | | 1,105,000 | | | | 1,094,501 | |
Sound Point CLO, Ltd.
2.005%, 01/21/26 (144A) (d) | | | 1,415,000 | | | | 1,400,506 | |
2.158%, 04/15/27 (144A) (d) | | | 1,315,000 | | | | 1,301,989 | |
See accompanying notes to financial statements.
MSF-18
Metropolitan Series Fund
Met/Wellington Balanced Portfolio (formerly, WMC Balanced Portfolio)
Schedule of Investments as of June 30, 2016 (Unaudited)
Asset-Backed Securities—(Continued)
| | | | | | | | |
| Security Description | | Principal
Amount* | | | Value | |
|
Asset-Backed - Other—(Continued) | |
SpringCastle America Funding LLC
2.700%, 05/25/23 (144A) (g) | | | 636,897 | | | $ | 639,063 | |
Springleaf Funding Trust
2.410%, 12/15/22 (144A) | | | 806,665 | | | | 807,152 | |
SPS Servicer Advance Receivables Trust
2.920%, 07/15/47 (144A) | | | 1,185,000 | | | | 1,190,187 | |
Symphony CLO, Ltd.
2.110%, 07/14/26 (144A) (d) | | | 1,295,000 | | | | 1,294,925 | |
2.187%, 01/09/23 (144A) (d) | | | 1,280,000 | | | | 1,265,568 | |
Treman Park CLO LLC
2.134%, 04/20/27 (144A) (d) | | | 1,350,000 | | | | 1,347,181 | |
Voya CLO, Ltd.
2.113%, 04/18/27 (144A) (d) | | | 1,265,000 | | | | 1,261,905 | |
2.733%, 04/18/27 (144A) (d) | | | 440,000 | | | | 428,751 | |
| | | | | | | | |
| | | | | | | 75,714,247 | |
| | | | | | | | |
Total Asset-Backed Securities
(Cost $84,944,043) | | | | | | | 85,229,785 | |
| | | | | | | | |
|
| Mortgage-Backed Securities—6.0% | |
|
Collateralized Mortgage Obligations—3.0% | |
Adjustable Rate Mortgage Trust
0.713%, 01/25/36 (d) | | | 72,260 | | | | 59,902 | |
0.723%, 11/25/35 (d) | | | 445,726 | | | | 409,875 | |
0.953%, 01/25/36 (d) | | | 333,818 | | | | 286,253 | |
Banc of America Funding Trust
0.678%, 02/20/47 (d) | | | 1,538,840 | | | | 1,263,664 | |
Bear Stearns Adjustable Rate Mortgage Trust
3.193%, 07/25/36 (d) | | | 675,666 | | | | 582,312 | |
Bear Stearns ALT-A Trust
0.933%, 02/25/36 (d) | | | 920,107 | | | | 749,952 | |
Bear Stearns Mortgage Funding Trust
0.633%, 10/25/36 (d) | | | 491,239 | | | | 377,648 | |
0.653%, 02/25/37 (d) | | | 1,010,894 | | | | 793,407 | |
CHL Mortgage Pass-Through Trust
2.718%, 03/20/36 (d) | | | 97,281 | | | | 74,346 | |
Countrywide Alternative Loan Trust
0.723%, 01/25/36 (d) | | | 353,808 | | | | 287,381 | |
0.773%, 11/25/35 (d) | | | 179,624 | | | | 142,074 | |
0.853%, 10/25/36 (d) | | | 50,515 | | | | 29,284 | |
1.253%, 12/25/35 (d) | | | 277,008 | | | | 213,728 | |
5.500%, 11/25/35 | | | 1,138,411 | | | | 989,511 | |
5.500%, 12/25/35 | | | 140,387 | | | | 116,070 | |
5.750%, 05/25/36 | | | 84,260 | | | | 61,436 | |
6.000%, 12/25/36 | | | 214,667 | | | | 143,303 | |
Countrywide Home Loan Mortgage Pass-Through Trust
0.653%, 04/25/46 (d) | | | 430,152 | | | | 313,837 | |
1.133%, 02/25/35 (d) | | | 208,529 | | | | 175,214 | |
1.133%, 03/25/35 (d) | | | 216,162 | | | | 165,769 | |
2.774%, 09/25/47 (d) | | | 926,114 | | | | 795,824 | |
2.895%, 06/20/35 (d) | | | 32,824 | | | | 30,378 | |
Deutsche ALT-A Securities Mortgage Loan Trust
0.603%, 12/25/36 (d) | | | 518,959 | | | | 418,562 | |
|
Collateralized Mortgage Obligations—(Continued) | |
DSLA Mortgage Loan Trust
1.330%, 03/19/46 (d) | | | 153,038 | | | | 117,159 | |
Fannie Mae REMICS (CMO)
Zero Coupon, 03/25/36 (l) | | | 45,554 | | | | 40,504 | |
Zero Coupon, 06/25/36 (f) (l) | | | 400,148 | | | | 352,809 | |
1.835%, 04/25/55 (d) (e) | | | 1,464,447 | | | | 90,439 | |
4.000%, 03/25/42 (e) (f) | | | 205,132 | | | | 30,551 | |
4.000%, 11/25/42 (e) (f) | | | 117,845 | | | | 17,462 | |
4.500%, 07/25/27 (e) (f) | | | 304,191 | | | | 29,815 | |
5.455%, 05/25/42 (d) (e) | | | 182,349 | | | | 20,827 | |
Freddie Mac REMICS (CMO)
Zero Coupon, 11/15/36 (l) | | | 52,956 | | | | 48,227 | |
3.000%, 03/15/33 (e) (f) | | | 268,280 | | | | 32,726 | |
4.000%, 07/15/27 (e) (f) | | | 1,139,701 | | | | 116,370 | |
4.750%, 07/15/39 (f) | | | 946,573 | | | | 1,042,663 | |
5.500%, 08/15/33 | | | 108,824 | | | | 122,028 | |
Freddie Mac Structured Agency Credit Risk Debt Notes
2.103%, 04/25/24 (d) | | | 845,000 | | | | 845,000 | |
2.303%, 10/25/27 (d) | | | 370,000 | | | | 369,648 | |
2.446%, 12/25/28 (d) | | | 325,000 | | | | 327,165 | |
2.953%, 08/25/24 (d) | | | 650,000 | | | | 660,604 | |
3.046%, 12/25/27 (d) | | | 1,870,000 | | | | 1,905,821 | |
3.103%, 03/25/28 (d) | | | 1,986,000 | | | | 2,032,081 | |
3.303%, 04/25/28 (d) | | | 2,462,000 | | | | 2,531,020 | |
3.353%, 07/25/28 (d) | | | 987,000 | | | | 1,017,773 | |
GSR Mortgage Loan Trust
0.753%, 01/25/37 (d) | | | 1,000,802 | | | | 579,287 | |
0.953%, 11/25/35 (d) | | | 669,159 | | | | 442,649 | |
2.944%, 01/25/36 (d) | | | 967,488 | | | | 884,219 | |
6.000%, 07/25/37 | | | 492,988 | | | | 443,447 | |
HarborView Mortgage Loan Trust
1.148%, 01/19/35 (d) (f) | | | 108,693 | | | | 71,273 | |
IndyMac INDX Mortgage Loan Trust
0.643%, 04/25/37 (d) | | | 60,353 | | | | 43,178 | |
2.956%, 10/25/35 (d) | | | 90,071 | | | | 76,321 | |
JPMorgan Mortgage Trust
3.033%, 05/25/36 (d) | | | 59,747 | | | | 52,862 | |
Lehman XS Trust
0.643%, 11/25/46 (d) (f) | | | 1,027,138 | | | | 797,620 | |
0.693%, 06/25/47 (d) | | | 932,713 | | | | 626,107 | |
LSTAR Securities Investment Trust
2.457%, 01/01/20 (144A) (d) | | | 1,251,868 | | | | 1,235,794 | |
2.457%, 04/01/20 (144A) (d) | | | 1,715,040 | | | | 1,680,739 | |
2.457%, 10/01/20 (144A) (d) | | | 1,457,459 | | | | 1,430,702 | |
Luminent Mortgage Trust
0.653%, 10/25/46 (d) | | | 159,705 | | | | 134,878 | |
0.713%, 11/25/35 (d) | | | 83,271 | | | | 74,319 | |
MASTR Adjustable Rate Mortgages Trust
0.693%, 05/25/37 (d) | | | 162,601 | | | | 99,581 | |
2.384%, 09/25/33 (d) | | | 155,837 | | | | 147,729 | |
Morgan Stanley Mortgage Loan Trust
2.995%, 05/25/36 (d) | | | 546,554 | | | | 387,136 | |
New Residential Mortgage Loan Trust
3.750%, 11/25/35 (144A) (d) | | | 1,541,264 | | | | 1,611,313 | |
See accompanying notes to financial statements.
MSF-19
Metropolitan Series Fund
Met/Wellington Balanced Portfolio (formerly, WMC Balanced Portfolio)
Schedule of Investments as of June 30, 2016 (Unaudited)
Mortgage-Backed Securities—(Continued)
| | | | | | | | |
| Security Description | | Principal
Amount* | | | Value | |
|
Collateralized Mortgage Obligations—(Continued) | |
Nomura Asset Acceptance Corp. Alternative Loan Trust
3.881%, 06/25/36 (d) | | | 82,604 | | | $ | 61,860 | |
Residential Accredit Loans, Inc. Trust
0.673%, 02/25/46 (d) | | | 476,588 | | | | 206,725 | |
0.753%, 04/25/36 (d) | | | 809,627 | | | | 578,256 | |
1.237%, 09/25/46 (d) | | | 641,784 | | | | 445,623 | |
6.000%, 12/25/35 | | | 450,237 | | | | 384,477 | |
Residential Asset Securitization Trust
0.903%, 03/25/35 (d) | | | 354,641 | | | | 273,545 | |
RFMSI Trust
3.080%, 08/25/35 (d) | | | 133,870 | | | | 99,743 | |
Structured Adjustable Rate Mortgage Loan Trust
0.753%, 09/25/34 (d) | | | 106,275 | | | | 91,518 | |
Structured Asset Mortgage Investments Trust
0.683%, 02/25/36 (d) | | | 181,653 | | | | 144,218 | |
Towd Point Mortgage Trust
2.750%, 02/25/55 (144A) (d) | | | 371,267 | | | | 376,169 | |
2.750%, 08/25/55 (144A) (d) | | | 1,100,548 | | | | 1,115,412 | |
3.000%, 03/25/54 (144A) (d) | | | 91,967 | | | | 93,759 | |
WaMu Mortgage Pass-Through Certificates Trust
0.873%, 06/25/44 (d) | | | 178,590 | | | | 158,939 | |
1.230%, 12/25/46 (d) | | | 132,056 | | | | 102,233 | |
1.417%, 07/25/46 (d) | | | 112,797 | | | | 90,200 | |
2.178%, 11/25/46 (d) | | | 114,729 | | | | 101,492 | |
2.511%, 06/25/37 (d) | | | 216,424 | | | | 184,017 | |
Washington Mutual Mortgage Pass-Through Certificates
1.053%, 07/25/36 (d) | | | 164,309 | | | | 90,907 | |
Wells Fargo Alternative Loan Trust
2.794%, 12/28/37 (d) | | | 35,455 | | | | 30,588 | |
Wells Fargo Mortgage-Backed Securities Trust
2.762%, 10/25/36 (d) | | | 464,478 | | | | 425,995 | |
2.952%, 10/25/35 (d) | | | 1,541,000 | | | | 1,467,092 | |
| | | | | | | | |
| | | | | | | 37,572,344 | |
| | | | | | | | |
|
Commercial Mortgage-Backed Securities—3.0% | |
Banc of America Commercial Mortgage Trust
3.262%, 09/15/48 (144A) (d) (g) | | | 548,000 | | | | 291,529 | |
3.705%, 09/15/48 | | | 95,000 | | | | 104,260 | |
5.492%, 02/10/51 | | | 618,413 | | | | 636,501 | |
BB-UBS Trust
3.430%, 11/05/36 (144A) | | | 2,520,000 | | | | 2,681,723 | |
Bear Stearns Commercial Mortgage Securities Trust
5.296%, 10/12/42 (d) | | | 145,000 | | | | 143,788 | |
CD Mortgage Trust
6.326%, 11/15/44 (d) | | | 80,000 | | | | 84,376 | |
Citigroup Commercial Mortgage Trust
1.275%, 07/10/47 (d) (e) | | | 4,604,881 | | | | 293,625 | |
1.310%, 04/10/48 (d) (e) | | | 5,052,283 | | | | 356,812 | |
2.935%, 04/10/48 | | | 85,000 | | | | 88,072 | |
3.110%, 04/10/48 (144A) | | | 245,000 | | | | 163,411 | |
|
Commercial Mortgage-Backed Securities—(Continued) | |
Citigroup Commercial Mortgage Trust
3.192%, 04/10/48 | | | 125,000 | | | | 131,903 | |
3.762%, 06/10/48 | | | 295,000 | | | | 324,645 | |
3.818%, 11/10/48 | | | 220,000 | | | | 242,758 | |
3.855%, 05/10/47 | | | 25,000 | | | | 27,611 | |
4.563%, 03/10/47 (144A) (d) (g) | | | 130,000 | | | | 80,929 | |
COBALT CMBS Commercial Mortgage Trust
5.254%, 08/15/48 | | | 140,000 | | | | 140,082 | |
Commercial Mortgage Pass-Through Certificates Mortgage Trust
0.857%, 02/10/47 (d) (e) | | | 3,873,548 | | | | 141,289 | |
2.072%, 10/15/45 (d) (e) | | | 454,356 | | | | 35,987 | |
2.853%, 10/15/45 | | | 160,000 | | | | 167,744 | |
3.101%, 03/10/46 | | | 145,000 | | | | 153,729 | |
3.183%, 02/10/48 | | | 145,000 | | | | 153,349 | |
3.213%, 03/10/46 | | | 280,000 | | | | 298,663 | |
3.288%, 12/10/44 | | | 80,000 | | | | 85,589 | |
3.350%, 02/10/48 | | | 320,000 | | | | 340,254 | |
3.424%, 03/10/31 (144A) | | | 1,065,000 | | | | 1,138,848 | |
3.612%, 06/10/46 (d) | | | 245,000 | | | | 266,524 | |
3.620%, 07/10/50 | | | 130,000 | | | | 140,120 | |
3.694%, 08/10/47 | | | 395,000 | | | | 426,814 | |
3.796%, 08/10/47 | | | 85,000 | | | | 93,538 | |
3.961%, 03/10/47 | | | 95,125 | | | | 104,793 | |
4.074%, 02/10/47 (d) | | | 115,000 | | | | 128,638 | |
4.205%, 08/10/46 | | | 100,035 | | | | 112,728 | |
4.236%, 02/10/47 (d) | | | 100,000 | | | | 113,118 | |
4.725%, 10/15/45 (144A) (d) (g) | | | 165,000 | | | | 109,225 | |
4.750%, 10/15/45 (144A) (d) (g) | | | 220,000 | | | | 159,003 | |
6.297%, 12/10/49 (d) | | | 424,665 | | | | 440,501 | |
Commercial Mortgage Trust
3.902%, 07/10/50 | | | 210,000 | | | | 230,754 | |
4.210%, 08/10/46 (d) | | | 175,000 | | | | 197,181 | |
Credit Suisse Commercial Mortgage Trust
5.890%, 06/15/39 (d) | | | 232,760 | | | | 236,791 | |
Credit Suisse First Boston Mortgage Securities Corp.
4.771%, 07/15/37 | | | 3,772 | | | | 3,770 | |
4.877%, 04/15/37 | | | 43,469 | | | | 39,629 | |
CSAIL Commercial Mortgage Trust
1.033%, 06/15/57 (d) (e) | | | 13,358,064 | | | | 726,375 | |
1.214%, 11/15/48 (d) (e) | | | 1,163,174 | | | | 79,737 | |
3.506%, 08/15/48 (d) | | | 175,000 | | | | 124,118 | |
3.718%, 08/15/48 | | | 1,333,000 | | | | 1,456,585 | |
FREMF Mortgage Trust
5.416%, 09/25/43 (144A) (d) | | | 855,000 | | | | 945,933 | |
GE Commercial Mortgage Corp. Trust
5.606%, 12/10/49 (d) | | | 65,000 | | | | 62,879 | |
GS Mortgage Securities Corp.
2.954%, 11/05/34 (144A) | | | 1,200,000 | | | | 1,253,490 | |
GS Mortgage Securities Corp. II
2.943%, 02/10/46 | | | 20,000 | | | | 21,060 | |
GS Mortgage Securities Corp. Trust
3.633%, 06/05/31 (144A) | | | 130,000 | | | | 133,390 | |
GS Mortgage Securities Trust
0.306%, 07/10/46 (d) (e) | | | 12,760,643 | | | | 93,311 | |
See accompanying notes to financial statements.
MSF-20
Metropolitan Series Fund
Met/Wellington Balanced Portfolio (formerly, WMC Balanced Portfolio)
Schedule of Investments as of June 30, 2016 (Unaudited)
Mortgage-Backed Securities—(Continued)
| | | | | | | | |
| Security Description | | Principal
Amount* | | | Value | |
|
Commercial Mortgage-Backed Securities—(Continued) | |
GS Mortgage Securities Trust
1.590%, 08/10/44 (144A) (d) (e) | | | 1,112,321 | | | $ | 57,278 | |
3.582%, 06/10/47 (144A) (g) | | | 195,000 | | | | 111,821 | |
3.674%, 04/10/47 (144A) (g) | | | 235,000 | | | | 121,974 | |
4.661%, 11/10/47 (144A) (d) (g) | | | 205,000 | | | | 158,215 | |
5.029%, 04/10/47 (144A) (d) (g) | | | 585,000 | | | | 438,462 | |
Hilton USA Trust
2.662%, 11/05/30 (144A) | | | 1,055,000 | | | | 1,059,505 | |
3.213%, 11/05/30 (144A) (d) | | | 231,212 | | | | 231,063 | |
JPMBB Commercial Mortgage Securities Trust
1.016%, 09/15/47 (d) (e) | | | 4,785,562 | | | | 189,726 | |
3.611%, 05/15/48 | | | 150,000 | | | | 162,664 | |
3.775%, 08/15/47 | | | 80,000 | | | | 87,938 | |
3.881%, 10/15/48 (144A) (d) | | | 220,000 | | | | 156,495 | |
JPMorgan Chase Commercial Mortgage Securities Corp.
4.564%, 12/15/47 (144A) (d) (g) | | | 245,000 | | | | 193,581 | |
JPMorgan Chase Commercial Mortgage Securities Trust
1.947%, 02/12/51 (d) | | | 1,689,523 | | | | 1,632,079 | |
2.733%, 10/15/45 (144A) (d) (g) | | | 400,000 | | | | 242,698 | |
3.905%, 05/05/30 (144A) | | | 886,247 | | | | 952,123 | |
4.000%, 08/15/46 (144A) (d) (g) | | | 105,000 | | | | 84,466 | |
4.813%, 10/15/45 (144A) (d) | | | 180,000 | | | | 168,478 | |
5.336%, 05/15/47 | | | 1,336,968 | | | | 1,348,802 | |
5.399%, 05/15/45 | | | 69,349 | | | | 69,256 | |
5.716%, 02/15/51 | | | 240,684 | | | | 248,496 | |
6.068%, 02/12/51 | | | 202,366 | | | | 209,911 | |
LB-UBS Commercial Mortgage Trust
6.248%, 04/15/41 (d) | | | 397,068 | | | | 418,555 | |
ML-CFC Commercial Mortgage Trust
5.419%, 08/12/48 | | | 190,000 | | | | 193,300 | |
Morgan Stanley Bank of America Merrill Lynch Trust
1.274%, 10/15/48 (d) (e) | | | 916,506 | | | | 69,245 | |
1.302%, 12/15/47 (d) (e) | | | 2,951,320 | | | | 179,673 | |
2.918%, 02/15/46 | | | 130,000 | | | | 136,221 | |
3.060%, 10/15/48 (144A) | | | 180,000 | | | | 124,444 | |
3.134%, 12/15/48 | | | 315,000 | | | | 333,600 | |
3.176%, 08/15/45 | | | 245,000 | | | | 260,991 | |
4.064%, 02/15/47 | | | 85,000 | | | | 94,998 | |
4.259%, 10/15/46 (d) | | | 115,000 | | | | 129,942 | |
4.500%, 08/15/45 (144A) (g) | | | 250,000 | | | | 176,553 | |
Morgan Stanley Capital Trust
5.348%, 07/15/49 (144A) (d) (g) | | | 265,000 | | | | 205,180 | |
5.401%, 10/12/52 (144A) (d) | | | 135,000 | | | | 128,407 | |
5.569%, 12/15/44 | | | 469,244 | | | | 485,371 | |
5.692%, 04/15/49 (d) | | | 1,845,000 | | | | 1,879,647 | |
6.477%, 01/11/43 (144A) (d) | | | 100,000 | | | | 99,486 | |
Morgan Stanley Re-REMIC Trust
5.988%, 08/12/45 (144A) (d) | | | 197,146 | | | | 200,667 | |
6.245%, 08/15/45 (144A) (d) | | | 127,279 | | | | 129,840 | |
SFAVE Commercial Mortgage Securities Trust
3.872%, 01/05/43 (144A) (d) | | | 250,000 | | | | 246,869 | |
UBS-Barclays Commercial Mortgage Trust
3.091%, 08/10/49 | | | 355,000 | | | | 376,087 | |
|
Commercial Mortgage-Backed Securities—(Continued) | |
UBS-Barclays Commercial Mortgage Trust
3.185%, 03/10/46 | | | 155,000 | | | | 164,152 | |
3.244%, 04/10/46 | | | 220,119 | | | | 233,895 | |
4.224%, 03/10/46 (144A) (d) (g) | | | 155,000 | | | | 105,983 | |
VNDO Mortgage Trust
2.996%, 11/15/30 (144A) | | | 1,105,000 | | | | 1,160,128 | |
Wells Fargo Commercial Mortgage Trust
1.337%, 05/15/48 (d) (e) | | | 3,939,447 | | | | 282,505 | |
1.339%, 09/15/57 (d) (e) | | | 8,483,352 | | | | 587,658 | |
2.881%, 05/15/48 (144A) (d) (g) | | | 510,000 | | | | 251,969 | |
2.918%, 10/15/45 | | | 320,000 | | | | 336,505 | |
3.356%, 09/15/58 (144A) (g) | | | 245,000 | | | | 135,143 | |
3.839%, 09/15/58 | | | 185,000 | | | | 204,371 | |
3.957%, 12/15/47 (144A) (d) | | | 72,000 | | | | 52,103 | |
4.241%, 05/15/48 (d) | | | 80,000 | | | | 61,724 | |
4.366%, 06/15/48 (d) | | | 150,000 | | | | 112,219 | |
WF-RBS Commercial Mortgage Trust
1.572%, 03/15/47 (d) (e) | | | 2,424,810 | | | | 162,040 | |
2.870%, 11/15/45 | | | 400,000 | | | | 418,912 | |
2.875%, 12/15/45 | | | 175,000 | | | | 183,426 | |
3.016%, 11/15/47 (144A) (g) | | | 550,000 | | | | 264,346 | |
3.071%, 03/15/45 | | | 185,000 | | | | 195,346 | |
3.678%, 08/15/47 | | | 780,000 | | | | 851,028 | |
3.995%, 05/15/47 | | | 160,281 | | | | 178,415 | |
4.101%, 03/15/47 | | | 335,000 | | | | 375,228 | |
4.493%, 03/15/48 (144A) (d) | | | 55,000 | | | | 50,096 | |
4.902%, 06/15/44 (144A) (d) | | | 145,000 | | | | 164,329 | |
5.000%, 06/15/44 (144A) (d) (g) | | | 105,000 | | | | 89,949 | |
5.000%, 04/15/45 (144A) (d) (g) | | | 130,000 | | | | 88,856 | |
5.756%, 04/15/45 (144A) (d) | | | 255,000 | | | | 257,634 | |
| | | | | | | | |
| | | | | | | 36,769,549 | |
| | | | | | | | |
Total Mortgage-Backed Securities
(Cost $74,945,283) | | | | | | | 74,341,893 | |
| | | | | | | | |
|
| Floating Rate Loans (m)—2.2% | |
|
Aerospace/Defense—0.0% | |
Transdigm, Inc. Term Loan E,
3.750%, 05/14/22 | | | 395,240 | | | | 390,893 | |
| | | | | | | | |
|
Agriculture—0.0% | |
American Rock Salt Holdings LLC
1st Lien Term Loan, 4.750%, 05/20/21 | | | 284,200 | | | | 266,437 | |
Incremental Term Loan, 4.750%, 05/20/21 | | | 123,426 | | | | 115,866 | |
| | | | | | | | |
| | | | | | | 382,303 | |
| | | | | | | | |
|
Airlines—0.0% | |
American Airlines, Inc.
Term Loan B, 3.500%, 04/28/23 | | | 100,000 | | | | 99,138 | |
| | | | | | | | |
|
Auto Manufacturers—0.0% | |
FCA U.S. LLC
Term Loan B, 3.250%, 12/31/18 | | | 512,322 | | | | 512,963 | |
| | | | | | | | |
See accompanying notes to financial statements.
MSF-21
Metropolitan Series Fund
Met/Wellington Balanced Portfolio (formerly, WMC Balanced Portfolio)
Schedule of Investments as of June 30, 2016 (Unaudited)
Floating Rate Loans (m)—(Continued)
| | | | | | | | |
| Security Description | | Principal
Amount* | | | Value | |
|
Chemicals—0.1% | |
Chemours Co. (The)
Term Loan B, 3.750%, 05/12/22 | | | 257,751 | | | $ | 249,589 | |
Ineos U.S. Finance LLC
Term Loan, 3.750%, 05/04/18 | | | 1,030,181 | | | | 1,022,841 | |
Nexeo Solutions LLC
Term Loan, 06/09/23 (n) | | | 170,000 | | | | 169,788 | |
| | | | | | | | |
| | | | | | | 1,442,218 | |
| | | | | | | | |
|
Coal—0.0% | |
Arch Coal, Inc.
Delayed Draw Term Loan, 5.000%, 01/31/17 (o) | | | 75,000 | | | | 74,625 | |
Term Loan B, 7.500%, 05/16/18 | | | 318,416 | | | | 150,054 | |
| | | | | | | | |
| | | | | | | 224,679 | |
| | | | | | | | |
|
Commercial Services—0.1% | |
Acosta Holdco, Inc.
Term Loan, 4.250%, 09/26/21 | | | 182,234 | | | | 175,856 | |
Jaguar Holding Co. II
Term Loan B, 4.250%, 08/18/22 | | | 133,362 | | | | 132,478 | |
Moneygram International, Inc.
Term Loan B, 4.250%, 03/27/20 | | | 102,838 | | | | 97,889 | |
ON Assignment, Inc.
Term Loan, 3.750%, 06/03/22 | | | 116,073 | | | | 116,266 | |
WEX, Inc.
Term Loan B, 06/21/23 (n) | | | 420,000 | | | | 418,950 | |
| | | | | | | | |
| | | | | | | 941,439 | |
| | | | | | | | |
|
Computers—0.0% | |
Dell, Inc.
Term Loan B, 05/24/23 (n) | | | 165,000 | | | | 164,656 | |
| | | | | | | | |
|
Cosmetics/Personal Care—0.1% | |
Coty, Inc.
Term Loan B, 3.750%, 10/27/22 | | | 44,888 | | | | 44,906 | |
Galleria Co.
Term Loan B, 3.750%, 01/26/23 | | | 90,000 | | | | 90,055 | |
Revlon Consumer Products Corp.
Term Loan B, 3.250%, 11/20/17 | | | 916,723 | | | | 917,439 | |
| | | | | | | | |
| | | | | | | 1,052,400 | |
| | | | | | | | |
|
Diversified Financial Services—0.0% | |
Russell Investment Group
Term Loan B, 6.750%, 06/01/23 | | | 135,000 | | | | 127,406 | |
| | | | | | | | |
|
Diversified Telecommunication Services—0.1% | |
Level 3 Financing, Inc.
Term Loan B2, 3.500%, 05/31/22 | | | 565,000 | | | | 563,658 | |
| | | | | | | | |
|
Electric—0.1% | |
Calpine Construction Finance Co. L.P.
Term Loan B2, 3.250%, 01/31/22 | | | 838,125 | | | | 824,156 | |
Energy Future Intermediate Holding Co. LLC
Term Loan, 4.250%, 12/19/16 | | | 100,000 | | | | 99,969 | |
|
Electric—(Continued) | |
NRG Energy, Inc.
Term Loan B, 06/08/23 (n) | | | 250,000 | | | | 248,125 | |
| | | | | | | | |
| | | | | | | 1,172,250 | |
| | | | | | | | |
|
Electronics—0.0% | |
Sensus USA, Inc.
Term Loan, 6.500%, 03/16/23 | | | 130,000 | | | | 129,025 | |
| | | | | | | | |
|
Energy Equipment & Services—0.0% | |
Chief Exploration & Development LLC
2nd Lien Term Loan, 7.500%, 05/16/21 | | | 105,000 | | | | 95,255 | |
Seadrill Partners Finco LLC
Term Loan B, 4.000%, 02/21/21 | | | 424,026 | | | | 190,281 | |
| | | | | | | | |
| | | | | | | 285,536 | |
| | | | | | | | |
|
Food—0.1% | |
Albertson’s LLC
Term Loan B4, 4.500%, 08/25/21 | | | 191,577 | | | | 191,637 | |
Aramark Services, Inc.
Term Loan F, 3.250%, 02/24/21 | | | 484,840 | | | | 485,218 | |
Hostess Brands LLC 1st Lien
Term Loan, 4.500%, 08/03/22 | | | 99,250 | | | | 99,374 | |
JBS USA LLC
Incremental Term Loan, 3.750%, 09/18/20 | | | 567,198 | | | | 568,616 | |
Term Loan B, 4.000%, 10/30/22 | | | 218,900 | | | | 218,695 | |
| | | | | | | | |
| | | | | | | 1,563,540 | |
| | | | | | | | |
|
Healthcare-Products—0.0% | |
Mallinckrodt International Finance S.A.
Term Loan B, 3.250%, 03/19/21 | | | 513,088 | | | | 507,155 | |
| | | | | | | | |
|
Healthcare-Services—0.2% | |
Community Health Systems, Inc.
Term Loan H, 4.000%, 01/27/21 | | | 138,600 | | | | 135,308 | |
Envision Healthcare Corp.
Term Loan B2, 4.500%, 10/28/22 | | | 159,200 | | | | 159,470 | |
IMS Health, Inc.
Term Loan, 3.500%, 03/17/21 | | | 938,400 | | | | 932,829 | |
Medpace Holdings, Inc.
1st Lien Term Loan, 4.750%, 04/01/21 | | | 205,189 | | | | 204,932 | |
MPH Acquisition Holdings LLC
Term Loan B, 5.000%, 06/07/23 | | | 180,000 | | | | 180,739 | |
Ortho-Clinical Diagnostics, Inc.
Term Loan B, 4.750%, 06/30/21 | | | 135,800 | | | | 128,558 | |
U.S. Renal Care, Inc.
Term Loan B, 5.250%, 12/31/22 | | | 258,700 | | | | 258,754 | |
| | | | | | | | |
| | | | | | | 2,000,590 | |
| | | | | | | | |
|
Hotels, Restaurants & Leisure—0.0% | |
Aristocrat Leisure, Ltd.
Term Loan B, 4.750%, 10/20/21 | | | 211,154 | | | | 211,863 | |
| | | | | | | | |
See accompanying notes to financial statements.
MSF-22
Metropolitan Series Fund
Met/Wellington Balanced Portfolio (formerly, WMC Balanced Portfolio)
Schedule of Investments as of June 30, 2016 (Unaudited)
Floating Rate Loans (m)—(Continued)
| | | | | | | | |
| Security Description | | Principal
Amount* | | | Value | |
|
Insurance—0.2% | |
Asurion LLC
2nd Lien Term Loan, 8.500%, 03/03/21 | | | 385,000 | | | $ | 372,487 | |
Term Loan B1, 5.000%, 05/24/19 | | | 107,864 | | | | 107,662 | |
Term Loan B2, 4.250%, 07/08/20 | | | 289,070 | | | | 283,921 | |
Term Loan B4, 5.000%, 08/04/22 | | | 330,221 | | | | 326,231 | |
Hub International, Ltd.
Term Loan B, 4.000%, 10/02/20 | | | 340,897 | | | | 336,281 | |
Sedgwick Claims Management Services, Inc.
1st Lien Term Loan, 3.750%, 03/01/21 | | | 793,224 | | | | 778,682 | |
2nd Lien Term Loan, 6.750%, 02/28/22 | | | 205,000 | | | | 197,825 | |
| | | | | | | | |
| | | | | | | 2,403,089 | |
| | | | | | | | |
|
Internet & Catalog Retail—0.0% | |
Lands’ End, Inc.
Term Loan B, 4.250%, 04/04/21 | | | 209,965 | | | | 164,823 | |
| | | | | | | | |
|
Leisure Time—0.1% | |
Delta 2 (LUX) S.a.r.l.
2nd Lien Term Loan, 7.750%, 07/31/22 | | | 165,000 | | | | 157,025 | |
Term Loan B3, 4.750%, 07/30/21 | | | 500,000 | | | | 483,125 | |
| | | | | | | | |
| | | | | | | 640,150 | |
| | | | | | | | |
|
Lodging—0.1% | |
La Quinta Intermediate Holdings LLC
Term Loan B, 3.750%, 04/14/21 | | | 520,172 | | | | 509,119 | |
MGM Growth Properties Operating Partnership L.P.
Term Loan B, 4.000%, 04/25/23 | | | 224,438 | | | | 225,174 | |
| | | | | | | | |
| | | | | | | 734,293 | |
| | | | | | | | |
|
Machinery-Diversified—0.1% | |
Gardner Denver, Inc.
Term Loan, 4.250%, 07/30/20 | | | 560,589 | | | | 516,268 | |
PRA Holdings, Inc.
1st Lien Term Loan, 4.500%, 09/23/20 | | | 252,232 | | | | 252,757 | |
| | | | | | | | |
| | | | | | | 769,025 | |
| | | | | | | | |
|
Media—0.0% | |
Advantage Sales & Marketing, Inc.
1st Lien Term Loan, 4.250%, 07/23/21 | | | 201,733 | | | | 197,446 | |
Charter Communications Operating LLC
Term Loan I, 3.500%, 01/24/23 | | | 239,400 | | | | 239,785 | |
| | | | | | | | |
| | | | | | | 437,231 | |
| | | | | | | | |
|
Oil & Gas—0.1% | |
Calpine Corp.
Term Loan B7, 3.640%, 05/02/23 | | | 155,000 | | | | 153,514 | |
Fieldwood Energy LLC
1st Lien Term Loan, 3.875%, 10/01/18 | | | 499,780 | | | | 434,184 | |
Paragon Offshore Finance Co.
Term Loan B, 5.250%, 07/18/21 | | | 98,750 | | | | 28,144 | |
Templar Energy LLC
2nd Lien Term Loan, 8.500%, 11/25/20 | | | 100,000 | | | | 26,750 | |
| | | | | | | | |
| | | | | | | 642,592 | |
| | | | | | | | |
|
Packaging & Containers—0.1% | |
Berry Plastics Holding Corp.
Term Loan D, 3.500%, 02/08/20 | | | 292,443 | | | | 291,480 | |
Caesars Growth Properties Holdings LLC
Term Loan, 6.250%, 05/08/21 | | | 210,700 | | | | 198,585 | |
Signode Industrial Group U.S., Inc.
Term Loan B, 3.750%, 05/01/21 | | | 231,593 | | | | 230,434 | |
| | | | | | | | |
| | | | | | | 720,499 | |
| | | | | | | | |
|
Pharmaceuticals—0.1% | |
Endo Luxembourg Finance Co. I S.a.r.l.
Term Loan B, 3.750%, 09/26/22 | | | 323,375 | | | | 318,957 | |
Grifols Worldwide Operations USA, Inc.
Term Loan B, 3.460%, 02/27/21 | | | 635,375 | | | | 636,025 | |
Valeant Pharmaceuticals International, Inc.
Term Loan B F1, 5.000%, 04/01/22 | | | 151,256 | | | | 147,307 | |
Vizient, Inc.
1st Lien Term Loan, 6.250%, 02/13/23 | | | 99,750 | | | | 100,373 | |
| | | | | | | | |
| | | | | | | 1,202,662 | |
| | | | | | | | |
|
Pipelines—0.0% | |
Energy Transfer Equity L.P.
Term Loan, 3.250%, 12/02/19 | | | 325,000 | | | | 314,925 | |
| | | | | | | | |
|
Professional Services—0.0% | |
TransUnion LLC
Term Loan B2, 3.500%, 04/09/21 | | | 429,472 | | | | 426,251 | |
| | | | | | | | |
|
Real Estate—0.0% | |
DTZ U.S. Borrower LLC
1st Lien Term Loan, 4.250%, 11/04/21 | | | 148,500 | | | | 147,164 | |
| | | | | | | | |
|
Retail—0.1% | |
J Crew Group, Inc.
Term Loan B, 4.000%, 03/05/21 | | | 315,668 | | | | 216,909 | |
Michaels Stores, Inc.
Incremental Term Loan B2, 4.000%, 01/28/20 | | | 100,754 | | | | 100,827 | |
Neiman Marcus Group, Inc. (The)
Term Loan, 4.250%, 10/25/20 | | | 630,488 | | | | 567,931 | |
Party City Holdings, Inc.
Term Loan B, 4.250%, 08/19/22 | | | 615,862 | | �� | | 612,013 | |
PetSmart, Inc.
Term Loan B1, 4.250%, 03/11/22 | | | 141,081 | | | | 140,737 | |
Yum! Brands, Inc.
1st Lien Term Loan B, 3.192%, 06/16/23 | | | 110,000 | | | | 110,378 | |
| | | | | | | | |
| | | | | | | 1,748,795 | |
| | | | | | | | |
|
Semiconductors—0.1% | |
Avago Technologies Cayman, Ltd.
Term Loan B1, 4.250%, 02/01/23 | | | 289,275 | | | | 289,617 | |
Entegris, Inc.
Term Loan B, 3.500%, 04/30/21 | | | 302,362 | | | | 302,110 | |
NXP B.V.
Term Loan B, 3.750%, 12/07/20 | | | 103,974 | | | | 104,315 | |
See accompanying notes to financial statements.
MSF-23
Metropolitan Series Fund
Met/Wellington Balanced Portfolio (formerly, WMC Balanced Portfolio)
Schedule of Investments as of June 30, 2016 (Unaudited)
Floating Rate Loans (m)—(Continued)
| | | | | | | | |
| Security Description | | Principal
Amount* | | | Value | |
|
Semiconductors—(Continued) | |
ON Semiconductor Corp.
Term Loan B, 5.250%, 03/31/23 | | | 110,000 | | | $ | 110,766 | |
| | | | | | | | |
| | | | | | | 806,808 | |
| | | | | | | | |
|
Software—0.2% | |
First Data Corp.
Term Loan, 4.202%, 07/08/22 | | | 820,000 | | | | 813,508 | |
Infor (U.S.), Inc.
Term Loan B5, 3.750%, 06/03/20 | | | 334,553 | | | | 326,468 | |
Kronos, Inc.
2nd Lien Term Loan, 9.750%, 04/30/20 | | | 154,834 | | | | 156,254 | |
Incremental Term Loan, 4.500%, 10/30/19 | | | 398,363 | | | | 398,031 | |
SS&C Technologies, Inc.
Term Loan B1, 4.000%, 07/08/22 | | | 202,766 | | | | 203,038 | |
Term Loan B2, 4.000%, 07/08/22 | | | 26,774 | | | | 26,810 | |
| | | | | | | | |
| | | | | | | 1,924,109 | |
| | | | | | | | |
|
Telecommunications—0.2% | |
Neptune Finco Corp.
Term Loan B, 5.000%, 10/09/22 | | | 165,000 | | | | 165,660 | |
West Corp.
Term Loan B10, 3.250%, 06/30/18 | | | 6,478 | | | | 6,473 | |
XO Communications LLC
Term Loan, 4.250%, 03/17/21 | | | 366,563 | | | | 366,287 | |
Ziggo Financing Partnership
Term Loan B1, 3.652%, 01/15/22 | | | 536,191 | | | | 524,686 | |
Term Loan B2A, 3.648%, 01/15/22 | | | 345,532 | | | | 338,117 | |
Term Loan B3, 3.601%, 01/15/22 | | | 568,277 | | | | 556,083 | |
| | | | | | | | |
| | | | | | | 1,957,306 | |
| | | | | | | | |
|
Trading Companies & Distributors—0.0% | |
Neff Rental LLC
2nd Lien Term Loan, 7.250%, 06/09/21 (g) | | | 103,402 | | | | 98,620 | |
| | | | | | | | |
|
Transportation—0.0% | |
Kenan Advantage Group, Inc.
Strip Delayed Draw
Term Loan, 1.500%, 01/31/17 (o) | | | 9,533 | | | | 9,498 | |
Term Loan, 4.000%, 07/31/22 | | | 79,400 | | | | 79,102 | |
Term Loan B, 4.000%, 07/31/22 | | | 31,137 | | | | 31,020 | |
| | | | | | | | |
| | | | | | | 119,620 | |
| | | | | | | | |
Total Floating Rate Loans
(Cost $28,066,935) | | | | | | | 27,029,674 | |
| | | | | | | | |
|
| Foreign Government—0.9% | |
|
Banks—0.2% | |
Bank of Thailand
1.490%, 02/23/18 (THB) | | | 44,465,000 | | | | 1,263,579 | |
|
Banks—(Continued) | |
Banque Centrale de Tunisie International Bonds
5.750%, 01/30/25 | | | 550,000 | | | | 496,375 | |
| | | | | | | | |
| | | | | | | 1,759,954 | |
| | | | | | | | |
|
Sovereign—0.7% | |
Abu Dhabi Government International Bond
2.125%, 05/03/21 (144A) | | | 770,000 | | | | 778,817 | |
Argentine Republic Government International Bond
2.260%, 12/31/38 (EUR) (d) (j) | | | 765,000 | | | | 515,615 | |
Brazil Notas do Tesouro Nacional
6.000%, 08/15/16 (BRL) (j) | | | 3,108,000 | | | | 2,795,465 | |
6.000%, 08/15/22 (BRL) (j) | | | 1,119,000 | | | | 991,141 | |
Colombian TES
3.000%, 03/25/33 (COP) (j) | | | 1,341,772,998 | | | | 401,004 | |
Mexico Government International Bond
5.750%, 10/12/2110 | | | 660,000 | | | | 729,300 | |
Qatar Government International Bond
4.625%, 06/02/46 (144A) | | | 285,000 | | | | 309,845 | |
Slovenia Government International Bond
5.500%, 10/26/22 | | | 865,000 | | | | 982,034 | |
South Africa Government Bonds
8.500%, 01/31/37 (ZAR) | | | 4,170,000 | | | | 257,078 | |
8.750%, 01/31/44 (ZAR) | | | 9,420,000 | | | | 585,834 | |
Uruguay Government International Bond
3.700%, 06/26/37 (UYU) (j) | | | 18,964,647 | | | | 492,079 | |
Venezuela Government International Bond
6.000%, 12/09/20 | | | 350,000 | | | | 142,188 | |
| | | | | | | | |
| | | | | | | 8,980,400 | |
| | | | | | | | |
Total Foreign Government
(Cost $10,369,638) | | | | | | | 10,740,354 | |
| | | | | | | | |
|
| Municipals—0.4% | |
Chicago Transit Authority Transfer Tax Receipts Revenue
6.899%, 12/01/40 | | | 805,000 | | | | 1,042,171 | |
Puerto Rico Commonwealth Government Employees Retirement System
6.150%, 07/01/38 (f) | | | 1,990,000 | | | | 776,100 | |
6.200%, 07/01/39 (g) | | | 955,000 | | | | 372,450 | |
6.550%, 07/01/58 (g) | | | 315,000 | | | | 122,850 | |
State of California General Obligation Unlimited, Build America Bonds
7.350%, 11/01/39 | | | 1,525,000 | | | | 2,312,571 | |
7.600%, 11/01/40 | | | 180,000 | | | | 289,816 | |
State of Illinois General Obligation Unlimited
5.665%, 03/01/18 | | | 300,000 | | | | 316,113 | |
State of Illinois, Build America Bonds
5.100%, 06/01/33 | | | 190,000 | | | | 182,603 | |
| | | | | | | | |
Total Municipals
(Cost $5,464,575) | | | | | | | 5,414,674 | |
| | | | | | | | |
See accompanying notes to financial statements.
MSF-24
Metropolitan Series Fund
Met/Wellington Balanced Portfolio (formerly, WMC Balanced Portfolio)
Schedule of Investments as of June 30, 2016 (Unaudited)
Short-Term Investments—7.7%
| | | | | | | | |
| Security Description | | Shares/
Principal
Amount* | | | Value | |
|
Mutual Fund—4.3% | |
State Street Navigator Securities Lending MET Portfolio (p) | | | 53,669,445 | | | $ | 53,669,445 | |
| | | | | | | | |
|
Repurchase Agreement—3.4% | |
Fixed Income Clearing Corp.
Repurchase Agreement dated 06/30/16 at 0.030% to be repurchased at $42,163,746 on 07/01/16, collateralized by $41,705,000 U.S. Treasury Note at 1.750% due 12/31/20 with a value of $43,008,281. | | | 42,163,711 | | | | 42,163,711 | |
| | | | | | | | |
Total Short-Term Investments
(Cost $95,833,156) | | | | | | | 95,833,156 | |
| | | | | | | | |
Total Investments—117.2%
(Cost $1,385,061,530) | | | | | | | 1,457,087,700 | |
Unfunded Loan Commitments—(0.0)%
(Cost $(84,533)) | | | | | | | (84,533 | ) |
Net Investments—117.2%
(Cost $1,384,976,997) (q) | | | | | | | 1,457,003,167 | |
Other assets and liabilities (net)—(17.2)% | | | | | | | (214,095,858 | ) |
| | | | | | | | |
| Net Assets—100.0% | | | | | | $ | 1,242,907,309 | |
| | | | | | | | |
| * | Principal amount stated in U.S. dollars unless otherwise noted. |
| (a) | Non-income producing security. |
| (b) | All or a portion of the security was held on loan. As of June 30, 2016, the market value of securities loaned was $69,292,878 and the collateral received consisted of cash in the amount of $53,669,445 and non-cash collateral with a value of $17,377,999. The cash collateral is invested in a money market fund managed by an affiliate of the custodian. The non-cash collateral received consists primarily of government securities and bank letters of credit, and is held for the benefit of the Portfolio at the Portfolio’s custodian. The Portfolio cannot repledge or resell this collateral. As such, this collateral is excluded from the Statement of Assets and Liabilities. |
| (c) | TBA (To Be Announced) Securities are purchased on a forward commitment basis with an approximate principal amount and no defined maturity date. The actual principal and maturity date will be determined upon settlement date. |
| (d) | Variable or floating rate security. The stated rate represents the rate at June 30, 2016. Maturity date shown for callable securities reflects the earliest possible call date. |
| (e) | Interest only security. |
| (f) | Illiquid security. As of June 30, 2016, these securities represent 0.9% of net assets. |
| (g) | Restricted securities are not registered under the Securities Act of 1933 and are subject to legal restrictions on resale. These securities generally may be resold in transactions exempt from registration or to the public if the securities are subsequently registered. Disposal of these securities may involve time-consuming negotiations and prompt sale at an acceptable price may be difficult. As of June 30, 2016, the market value of restricted securities was $8,109,332, which is 0.7% of net assets. See details shown in the Restricted Securities table that follows. |
| (h) | All or a portion of the security was pledged as collateral against open centrally cleared swap contracts. As of June 30, 2016, the market value of securities pledged was $1,220,973. |
| (i) | All or a portion of the security was pledged as collateral against open swap contracts. As of June 30, 2016, the market value of securities pledged was $1,152,633. |
| (j) | Principal amount of security is adjusted for inflation. |
| (k) | Non-income producing; security is in default and/or issuer is in bankruptcy. |
| (l) | Principal only security. |
| (m) | Floating rate loans (Senior Loans) often require prepayments from excess cash flows or permit the borrowers to repay at their election. The degree to which borrowers repay, whether as a contractual requirement or at their election, cannot be predicted with accuracy. As a result, the actual remaining maturity may be substantially less than the stated maturities shown. However, Senior Loans will have an expected average life of approximately two to four years. The stated interest rate represents the weighted average interest rate of all contracts within the senior loan facility and includes commitment fees on unfunded loan commitments, if any. Senior Loans typically have rates of interest which are determined either daily, monthly, quarterly or semi-annually by reference to a base lending rate, plus a premium. These base rates are primarily the London Interbank Offered Rate (“LIBOR”) and secondarily, the prime rate offered by one or more major United States banks (the “Prime Rate”) and the certificate of deposit (“CD”) rate or other base lending rates used by commercial lenders. |
| (n) | This loan will settle after June 30, 2016, at which time the interest rate will be determined. |
| (o) | Unfunded or partially unfunded loan commitments. The Portfolio may enter into certain credit agreements for which all or a portion may be unfunded. The Portfolio is obligated to fund these commitments at the borrower’s discretion. |
| (p) | Represents investment of cash collateral received from securities on loan as of June 30, 2016. |
| (q) | As of June 30, 2016, the aggregate cost of investments was $1,384,976,997. The aggregate unrealized appreciation and depreciation of investments were $115,752,731 and $(43,726,561), respectively, resulting in net unrealized appreciation of $72,026,170. |
| (144A)— | Securities exempt from registration under Rule 144A of the Securities Act of 1933. These securities may be resold in transactions exempt from registration, normally to qualified institutional buyers. As of June 30, 2016, the market value of 144A securities was $135,771,657, which is 10.9% of net assets. |
| (ACES)— | Alternative Credit Enhancement Securities |
| (ADR)— | An American Depositary Receipt is a certificate issued by a custodian bank representing the right to receive securities of the foreign issuer described. Trading on exchanges not located in the United States or Canada significantly influences the value of ADRs. |
| (ARM)— | Adjustable-Rate Mortgage |
| (CDO)— | Collateralized Debt Obligation |
| (CLO)— | Collateralized Loan Obligation |
| (CMO)— | Collateralized Mortgage Obligation |
| (REMIC)— | Real Estate Mortgage Investment Conduit |
See accompanying notes to financial statements.
MSF-25
Metropolitan Series Fund
Met/Wellington Balanced Portfolio (formerly, WMC Balanced Portfolio)
Schedule of Investments as of June 30, 2016 (Unaudited)
| | | | | | | | | | | | | | | | |
Restricted Securities | | Acquisition
Date | | | Principal
Amount | | | Cost | | | Value | |
Banc of America Commercial Mortgage Trust Series 2015-UBS7 Class E, 3.262%, 09/15/48 | | | 01/22/16 | | | $ | 548,000 | | | $ | 293,680 | | | $ | 291,529 | |
Banco Bilbao Vizcaya Argentaria S.A., 7.000%, 02/19/19 | | | 07/18/14 | | | | 800,000 | | | | 1,116,827 | | | | 762,883 | |
Banco Santander S.A., 6.250%, 03/12/19 | | | 08/08/14 | | | | 500,000 | | | | 658,086 | | | | 468,869 | |
Barclays Bank plc, 8.000%, 12/15/20 | | | 07/18/14 | | | | 550,000 | | | | 754,261 | | | | 568,621 | |
Citigroup Commercial Mortgage Trust Series 2014-GC19 Class E, 4.563%, 03/10/47 | | | 01/15/15 | | | | 130,000 | | | | 107,367 | | | | 80,929 | |
Commercial Mortgage Pass-Through Certificates Mortgage Trust Series 2012-CR3 Class G, 4.750%, 10/15/45 | | | 02/18/15 | | | | 220,000 | | | | 175,716 | | | | 159,003 | |
Commercial Mortgage Pass-Through Certificates Mortgage Trust Series 2012-CR4 Class F, 4.725%, 10/15/45 | | | 12/05/14 | | | | 165,000 | | | | 129,274 | | | | 109,225 | |
Consumer Credit Origination Loan Trust Series 2015-1 Class A, 2.820%, 03/15/21 | | | 02/03/15 | | | | 107,442 | | | | 107,436 | | | | 107,440 | |
Credit Agricole S.A., 7.500%, 06/23/26 | | | 04/20/16 | | | | 100,000 | | | | 130,134 | | | | 119,180 | |
GS Mortgage Securities Trust Series 2014-GC20 Class D, 5.029%, 04/10/47 | | | 03/27/14 | | | | 585,000 | | | | 534,065 | | | | 438,462 | |
GS Mortgage Securities Trust Series 2014-GC20 Class F, 3.674%, 04/10/47 | | | 04/04/14 | | | | 235,000 | | | | 147,173 | | | | 121,974 | |
GS Mortgage Securities Trust Series 2014-GC22 Class E, 3.582%, 06/10/47 | | | 04/24/15 | | | | 195,000 | | | | 149,282 | | | | 111,821 | |
GS Mortgage Securities Trust Series 2014-GC26 Class D, 4.661%, 11/10/47 | | | 10/29/15 | | | | 205,000 | | | | 175,371 | | | | 158,215 | |
GSAA Home Equity Trust Series 2006-20 Class 2A1A, 0.503%, 12/25/46 | | | 12/01/15 | | | | 124,354 | | | | 81,840 | | | | 77,242 | |
Government National Mortgage Association Series 2012-120 Class IO, 0.904%, 02/16/53 | | | 10/30/12 | | | | 2,950,714 | | | | 252,655 | | | | 180,196 | |
JPMorgan Chase Commercial Mortgage Securities Corp. Series 2012-LC9 Class F, 4.564%, 12/15/47 | | | 03/27/14 | | | | 245,000 | | | | 198,450 | | | | 193,581 | |
JPMorgan Chase Commercial Mortgage Securities Trust Series 2011-C5 Class E, 4.000%, 08/15/46 | | | 05/19/15 | | | | 105,000 | | | | 94,959 | | | | 84,466 | |
JPMorgan Chase Commercial Mortgage Securities Trust Series 2012-C8 Class G, 2.733%, 10/15/45 | | | 03/17/14 | | | | 400,000 | | | | 269,984 | | | | 242,698 | |
Lehman XS Trust Series 2005-6 Class 1A1, 0.713%, 11/25/35 | | | 05/20/14 | | | | 246,480 | | | | 180,393 | | | | 161,485 | |
Magnetite CLO, Ltd. Series 2012-7A Class C, 5.128%, 01/15/25 | | | 11/17/15 | | | | 1,125,000 | | | | 1,126,125 | | | | 1,120,551 | |
Morgan Stanley Bank of America Merrill Lynch Trust Series 2012-C5 Class H, 4.500%, 08/15/45 | | | 07/10/14 | | | | 250,000 | | | | 197,031 | | | | 176,553 | |
Morgan Stanley Capital Trust Series 20011-C3 Class G, 5.348%, 07/15/49 | | | 03/13/15 | | | | 265,000 | | | | 242,868 | | | | 205,180 | |
Neff Rental LLC 2nd Lien Term Loan, 7.250%, 06/09/21 | | | 07/10/14 | | | | 103,402 | | | | 103,037 | | | | 98,620 | |
Puerto Rico Commonwealth Government Employees Retirement System, 6.200%, 07/01/39 | | | 08/12/14 | | | | 955,000 | | | | 478,867 | | | | 372,450 | |
Puerto Rico Commonwealth Government Employees Retirement System, 6.550%, 07/01/58 | | | 07/14/14 | | | | 315,000 | | | | 156,898 | | | | 122,850 | |
SpringCastle America Funding LLC Series 2014-AA Class A, 2.700%, 05/25/23 | | | 09/18/14 | | | | 636,897 | | | | 636,855 | | | | 639,063 | |
UBS-Barclays Commercial Mortgage Trust Series 2013-C5 Class E, 4.224%, 03/10/46 | | | 07/10/14 | | | | 155,000 | | | | 130,182 | | | | 105,983 | |
WF-RBS Commercial Mortgage Trust Series 2011-C4 Class F, 5.000%, 06/15/44 | | | 03/28/14 | | | | 105,000 | | | | 94,365 | | | | 89,949 | |
WF-RBS Commercial Mortgage Trust Series 2012-C6 Class F, 5.000%, 04/15/45 | | | 08/13/14 | | | | 130,000 | | | | 103,594 | | | | 88,856 | |
WF-RBS Commercial Mortgage Trust Series 2014-C24 Class E, 3.016%, 11/15/47 | | | 11/05/14 | | | | 550,000 | | | | 362,270 | | | | 264,346 | |
Wells Fargo Commercial Mortgage Trust Series 2015-LC22 Class E, 3.356%, 09/15/58 | | | 09/24/15 | | | | 245,000 | | | | 147,153 | | | | 135,143 | |
Wells Fargo Commercial Mortgage Trust Series 2015-NXS1 Class E, 2.881%, 05/15/48 | | | 09/16/15 | | | | 510,000 | | | | 315,702 | | | | 251,969 | |
| | | | | | | | | | | | | | | | |
| | | | | | | | | | | | | | $ | 8,109,332 | |
| | | | | | | | | | | | | | | | |
TBA Forward Sale Commitments
| | | | | | | | | | | | | | | | | | | | |
Security Description | | Interest Rate | | | Maturity | | | Face
Amount | | | Cost | | | Value | |
Fannie Mae 15 Yr. Pool | | | 3.500 | % | | | TBA | | | | (1,200,000 | ) | | $ | (1,270,290 | ) | | $ | (1,271,551 | ) |
Fannie Mae 15 Yr. Pool | | | 4.500 | % | | | TBA | | | | (3,500,000 | ) | | | (3,584,219 | ) | | | (3,588,183 | ) |
Fannie Mae 30 Yr. Pool | | | 3.000 | % | | | TBA | | | | (6,900,000 | ) | | | (7,147,969 | ) | | | (7,147,697 | ) |
Fannie Mae 30 Yr. Pool | | | 4.500 | % | | | TBA | | | | (2,900,000 | ) | | | (3,163,718 | ) | | | (3,163,945 | ) |
Fannie Mae 30 Yr. Pool | | | 4.500 | % | | | TBA | | | | (3,025,000 | ) | | | (3,299,137 | ) | | | (3,301,961 | ) |
Fannie Mae 30 Yr. Pool | | | 5.000 | % | | | TBA | | | | (2,200,000 | ) | | | (2,436,500 | ) | | | (2,444,336 | ) |
Freddie Mac 30 Yr. Gold Pool | | | 5.000 | % | | | TBA | | | | (400,000 | ) | | | (439,000 | ) | | | (441,549 | ) |
Freddie Mac 30 Yr. Gold Pool | | | 5.500 | % | | | TBA | | | | (200,000 | ) | | | (221,875 | ) | | | (222,908 | ) |
Ginnie Mae II 30 Yr. Pool | | | 4.000 | % | | | TBA | | | | (1,623,000 | ) | | | (1,736,387 | ) | | | (1,734,834 | ) |
| | | | | | | | | | | | | | | | | | | | |
Totals | | | $ | (23,299,095 | ) | | $ | (23,316,964 | ) |
| | | | | | | | | | | | | | | | | | | | |
See accompanying notes to financial statements.
MSF-26
Metropolitan Series Fund
Met/Wellington Balanced Portfolio (formerly, WMC Balanced Portfolio)
Schedule of Investments as of June 30, 2016 (Unaudited)
Forward Foreign Currency Exchange Contracts
| | | | | | | | | | | | | | | | | | |
Contracts to Buy | | | Counterparty | | Settlement
Date | | | In Exchange
for | | | Unrealized
Appreciation/
(Depreciation) | |
| BRL | | | 1,545,000 | | | Credit Agricole S.A. | | | 07/05/16 | | | $ | 460,507 | | | $ | 20,457 | |
| BRL | | | 2,370,000 | | | Goldman Sachs International | | | 07/05/16 | | | | 738,364 | | | | (575 | ) |
| BRL | | | 825,000 | | | Morgan Stanley & Co. International plc | | | 07/05/16 | | | | 232,965 | | | | 23,860 | |
| CNY | | | 3,080,000 | | | JPMorgan Chase Bank N.A. | | | 07/28/16 | | | | 491,306 | | | | (28,087 | ) |
| EUR | | | 150,000 | | | JPMorgan Chase Bank N.A. | | | 07/29/16 | | | | 165,483 | | | | 1,125 | |
| EUR | | | 413,000 | | | Royal Bank of Canada | | | 07/29/16 | | | | 457,108 | | | | 1,619 | |
| EUR | | | 155,000 | | | Bank of America N.A. | | | 03/15/17 | | | | 177,515 | | | | (3,822 | ) |
| EUR | | | 205,000 | | | Bank of America N.A. | | | 03/15/17 | | | | 234,910 | | | | (5,188 | ) |
| EUR | | | 375,000 | | | Citibank N.A. | | | 03/15/17 | | | | 416,250 | | | | 3,974 | |
| EUR | | | 270,000 | | | UBS AG | | | 03/15/17 | | | | 309,587 | | | | (7,026 | ) |
| GBP | | | 35,000 | | | JPMorgan Chase Bank N.A. | | | 07/29/16 | | | | 46,223 | | | | 380 | |
| IDR | | | 19,188,000,000 | | | Goldman Sachs International | | | 09/21/16 | | | | 1,416,611 | | | | 15,919 | |
| MXN | | | 43,110,000 | | | Royal Bank of Canada | | | 07/20/16 | | | | 2,302,516 | | | | 52,182 | |
| THB | | | 30,120,000 | | | Barclays Bank plc | | | 09/21/16 | | | | 854,226 | | | | 1,827 | |
| | | |
Contracts to Deliver | | | | | | | | | |
| BRL | | | 1,545,000 | | | Credit Agricole S.A. | | | 07/05/16 | | | $ | 481,338 | | | $ | 375 | |
| BRL | | | 2,370,000 | | | Goldman Sachs International | | | 07/05/16 | | | | 626,785 | | | | (111,004 | ) |
| BRL | | | 825,000 | | | Morgan Stanley & Co. International plc | | | 07/05/16 | | | | 257,025 | | | | 200 | |
| BRL | | | 1,545,000 | | | Credit Agricole S.A. | | | 08/02/16 | | | | 456,993 | | | | (19,800 | ) |
| BRL | | | 2,000,000 | | | BNP Paribas S.A. | | | 08/17/16 | | | | 579,290 | | | | (35,167 | ) |
| BRL | | | 7,075,000 | | | Morgan Stanley & Co. International plc | | | 08/17/16 | | | | 1,911,491 | | | | (262,151 | ) |
| BRL | | | 1,800,000 | | | Morgan Stanley & Co. International plc | | | 08/17/16 | | | | 477,226 | | | | (75,786 | ) |
| CNY | | | 2,435,000 | | | Deutsche Bank AG | | | 07/28/16 | | | | 369,499 | | | | 3,285 | |
| CNY | | | 645,000 | | | Goldman Sachs International | | | 07/28/16 | | | | 98,099 | | | | 1,093 | |
| COP | | | 1,171,300,000 | | | State Street Bank and Trust | | �� | 07/21/16 | | | | 390,824 | | | | (8,716 | ) |
| EUR | | | 75,000 | | | Bank of Montreal | | | 07/29/16 | | | | 84,518 | | | | 1,214 | |
| EUR | | | 3,177,000 | | | JPMorgan Chase Bank N.A. | | | 07/29/16 | | | | 3,505,280 | | | | (23,472 | ) |
| EUR | | | 460,000 | | | UBS AG | | | 09/21/16 | | | | 522,635 | | | | 10,705 | |
| EUR | | | 1,005,000 | | | Bank of America N.A. | | | 03/15/17 | | | | 1,080,446 | | | | (45,753 | ) |
| GBP | | | 905,000 | | | BNP Paribas S.A. | | | 07/29/16 | | | | 1,192,202 | | | | (12,820 | ) |
| IDR | | | 4,797,000,000 | | | Deutsche Bank AG | | | 09/21/16 | | | | 351,429 | | | | (6,704 | ) |
| IDR | | | 9,594,000,000 | | | HSBC Bank USA | | | 09/21/16 | | | | 706,740 | | | | (9,525 | ) |
| IDR | | | 4,797,000,000 | | | Standard Chartered Bank | | | 09/21/16 | | | | 351,944 | | | | (6,188 | ) |
| MXN | | | 43,110,000 | | | Bank of America N.A. | | | 07/20/16 | | | | 2,445,694 | | | | 90,996 | |
| THB | | | 30,180,000 | | | Bank of America N.A. | | | 09/21/16 | | | | 857,021 | | | | (737 | ) |
| THB | | | 44,521,000 | | | Citibank N.A. | | | 09/21/16 | | | | 1,259,791 | | | | (5,559 | ) |
| UYU | | | 15,256,000 | | | HSBC Bank USA | | | 09/28/16 | | | | 482,403 | | | | (1,147 | ) |
| ZAR | | | 2,890,000 | | | Bank of America N.A. | | | 07/20/16 | | | | 193,667 | | | | (1,964 | ) |
| ZAR | | | 9,770,000 | | | JPMorgan Chase Bank N.A. | | | 07/20/16 | | | | 630,378 | | | | (30,976 | ) |
| | | | | | | | | | | | | | | | | | |
Net Unrealized Depreciation | | | $ | (472,956 | ) |
| | | | | | | | | | | | | | | | | | |
Futures Contracts
| | | | | | | | | | | | | | | | | | | | |
Futures Contracts—Long | | Expiration
Date | | | Number of
Contracts | | | Notional
Amount | | | Unrealized
Appreciation/
(Depreciation) | |
S&P 500 E-Mini Index Futures | | | 09/16/16 | | | | 102 | | | | USD | | | | 10,496,686 | | | $ | 163,334 | |
U.S. Treasury Note 2 Year Futures | | | 09/30/16 | | | | 91 | | | | USD | | | | 19,818,176 | | | | 140,683 | |
U.S. Treasury Note 5 Year Futures | | | 09/30/16 | | | | 546 | | | | USD | | | | 65,672,728 | | | | 1,028,851 | |
U.S. Treasury Ultra Long Bond Futures | | | 09/21/16 | | | | 169 | | | | USD | | | | 29,775,800 | | | | 1,721,575 | |
See accompanying notes to financial statements.
MSF-27
Metropolitan Series Fund
Met/Wellington Balanced Portfolio (formerly, WMC Balanced Portfolio)
Schedule of Investments as of June 30, 2016 (Unaudited)
Futures Contracts—(Continued)
| | | | | | | | | | | | | | | | | | | | |
Futures Contracts—Short | | Expiration
Date | | | Number of
Contracts | | | Notional
Amount | | | Unrealized
Appreciation/
(Depreciation) | |
Euro-Bund Futures | | | 09/08/16 | | | | (31 | ) | | | EUR | | | | (5,038,775 | ) | | $ | (157,523 | ) |
U.S. Treasury Long Bond Futures | | | 09/21/16 | | | | (12 | ) | | | USD | | | | (1,975,002 | ) | | | (93,123 | ) |
U.S. Treasury Note 10 Year Futures | | | 09/21/16 | | | | (172 | ) | | | USD | | | | (22,337,910 | ) | | | (535,403 | ) |
U.S. Treasury Note Ultra 10 Year Futures | | | 09/21/16 | | | | (5 | ) | | | USD | | | | (701,993 | ) | | | (26,366 | ) |
| | | | | | | | | | | | | | | | | | | | |
Net Unrealized Appreciation | | | $ | 2,242,028 | |
| | | | | | | | | | | | | | | | | | | | |
Written Options
| | | | | | | | | | | | | | | | | | | | | | | | | | | | | | | | | | |
Credit Default
Swaptions | | Strike
Rate | | Counterparty | | Reference
Obligation | | Buy/Sell
Protection | | | Expiration
Date | | | Notional
Amount | | | Premiums
Received | | | Market
Value | | | Unrealized
Appreciation/
(Depreciation) | |
Put - 5 Yr. CDS | | 82.500% | | Goldman Sachs
International | | CDX.NA.IG.26 | | | Sell | | | | 07/20/16 | | | | USD | | | | (37,979,000 | ) | | $ | (86,022 | ) | | $ | (36,878 | ) | | $ | 49,144 | |
Call - 5 Yr. CDS | | 82.500% | | Goldman Sachs
International | | CDX.NA.IG.26 | | | Buy | | | | 07/20/16 | | | | USD | | | | (37,979,000 | ) | | | (87,732 | ) | | | (96,922 | ) | | | (9,190 | ) |
| | | | | | | | | | | | | | | | | | | | | | | | | | | | | | | | | | |
Totals | | | $ | (173,754 | ) | | $ | (133,800 | ) | | $ | 39,954 | |
| | | | | | | | | | | | | | | | | | | | | | | | | | | | | | | | | | |
Swap Agreements
OTC Interest Rate Swaps
| | | | | | | | | | | | | | | | | | | | | | | | | | | | | | |
Pay/Receive
Floating Rate | | Floating
Rate Index | | Fixed
Rate | | | Maturity
Date | | Counterparty | | Notional
Amount | | | Market
Value | | | Upfront
Premium
Paid/(Received) | | | Unrealized
Depreciation | |
Receive | | CPI-U | | | 1.810 | % | | 09/04/25 | | Bank of America N.A. | | | USD | | | | 13,235,000 | | | $ | (323,129 | ) | | $ | — | | | $ | (323,129 | ) |
Receive | | CPI-U | | | 1.820 | % | | 09/22/25 | | Bank of America N.A. | | | USD | | | | 10,320,000 | | | | (263,037 | ) | | | — | | | | (263,037 | ) |
| | | | | | | | | | | | | | | | | | | | | | | | | | | | | | |
Totals | | | $ | (586,166 | ) | | $ | — | | | $ | (586,166 | ) |
| | | | | | | | | | | | | | | | | | | | | | | | | | | | | | |
Centrally Cleared Interest Rate Swaps
| | | | | | | | | | | | | | | | | | | | | | | | |
Pay/Receive Floating Rate | | Floating
Rate Index | | | Fixed
Rate | | | Maturity
Date | | | Notional
Amount | | | Unrealized
Depreciation | |
Receive | | | 3M LIBOR | | | | 1.634 | % | | | 06/15/26 | | | | USD | | | | 8,901,000 | | | $ | (221,100 | ) |
| | | | | | | | | | | | | | | | | | | | | | | | |
Centrally Cleared Credit Default Swaps on Credit Indices—Buy Protection (a)
| | | | | | | | | | | | | | | | | | | | | | |
Reference Obligation | | Fixed Deal
(Pay) Rate | | | Maturity
Date | | | Implied Credit
Spread at
June 30,
2016(b) | | Notional
Amount(c) | | | Unrealized
Depreciation | |
CDX.NA.HY.25.V2 | | | (5.000%) | | | | 12/20/20 | | | 3.989% | | | USD | | | | 767,250 | | | $ | (2,997) | |
CDX.NA.HY.26.V1 | | | (5.000%) | | | | 06/20/21 | | | 4.288% | | | USD | | | | 8,555,000 | | | | (107,728) | |
CDX.NA.HY.26.V1 | | | (5.000%) | | | | 06/20/21 | | | 4.288% | | | USD | | | | 23,829,000 | | | | (320,893) | |
CDX.NA.IG.26.V1 | | | (1.000%) | | | | 06/20/21 | | | 0.789% | | | USD | | | | 7,444,000 | | | | (7,108) | |
ITRAXX.EUROPE.25.V1 | | | (1.000%) | | | | 06/20/21 | | | 0.839% | | | EUR | | | | 5,527,000 | | | | (6,219) | |
ITRAXX.XOVER.25.V1 | | | (5.000%) | | | | 06/20/21 | | | 3.658% | | | EUR | | | | 2,363,000 | | | | (8,429) | |
| | | | | | | | | | | | | | | | | | | | | | |
Net Unrealized Depreciation | | | $ | (453,374) | |
| | | | | | | | | | | | | | | | | | | | | | |
See accompanying notes to financial statements.
MSF-28
Metropolitan Series Fund
Met/Wellington Balanced Portfolio (formerly, WMC Balanced Portfolio)
Schedule of Investments as of June 30, 2016 (Unaudited)
OTC Credit Default Swaps on Corporate and Sovereign Issues—Buy Protection (a)
| | | | | | | | | | | | | | | | | | | | | | | | | | | | | | | | | | |
Reference Obligation | | Fixed Deal
(Pay) Rate | | | Maturity
Date | | | Counterparty | | Implied Credit
Spread at
June 30,
2016(b) | | | Notional
Amount(c) | | | Market
Value | | | Upfront
Premium Paid/
(Received) | | | Unrealized
Depreciation | |
Federative Republic of Brazil | | | (1.000%) | | | | 06/20/21 | | | Goldman Sachs International | | | 3.078% | | | | USD | | | | 425,000 | | | $ | 40,512 | | | $ | 48,491 | | | $ | (7,979) | |
Marathon Oil Corp. | | | (1.000%) | | | | 06/20/20 | | | JPMorgan Chase Bank N.A. | | | 3.186% | | | | USD | | | | 45,000 | | | | 3,588 | | | | 10,463 | | | | (6,875) | |
Republic of Colombia | | | (1.000%) | | | | 06/20/21 | | | Goldman Sachs International | | | 2.019% | | | | USD | | | | 375,000 | | | | 17,952 | | | | 23,241 | | | | (5,289) | |
United Mexican States | | | (1.000%) | | | | 06/20/18 | | | Barclays Bank plc | | | 0.713% | | | | USD | | | | 600,000 | | | | (3,379) | | | | (2,069) | | | | (1,310) | |
United Mexican States | | | (1.000%) | | | | 06/20/18 | | | Goldman Sachs International | | | 0.713% | | | | USD | | | | 420,000 | | | | (2,366) | | | | (1,702) | | | | (664) | |
| | | | | | | | | | | | | | | | | | | | | | | | | | | | | | | | | | |
Totals | | | $ | 56,307 | | | $ | 78,424 | | | $ | (22,117) | |
| | | | | | | | | | | | | | | | | | | | | | | | | | | | | | | | | | |
OTC Credit Default Swaps on Sovereign Issues—Sell Protection (d)
| | | | | | | | | | | | | | | | | | | | | | | | | | | | | | | | | | |
Reference Obligation | | Fixed Deal
Receive Rate | | | Maturity
Date | | | Counterparty | | Implied Credit
Spread at
June 30,
2016(b) | | | Notional
Amount(c) | | | Market
Value | | | Upfront
Premium
(Received) | | | Unrealized
Appreciation | |
Russian Federation | | | 1.000% | | | | 06/20/21 | | | JPMorgan Chase Bank N.A. | | | 2.300% | | | | USD | | | | 1,350,000 | | | $ | (81,979) | | | $ | (95,944) | | | $ | 13,965 | |
| | | | | | | | | | | | | | | | | | | | | | | | | | | | | | | | | | |
OTC Credit Default Swaps on Credit Indices—Buy Protection (a)
| | | | | | | | | | | | | | | | | | | | | | | | | | | | | | | | | | |
Reference Obligation | | Fixed Deal
(Pay) Rate | | | Maturity
Date | | | Counterparty | | Implied Credit
Spread at
June 30,
2016(b) | | | Notional
Amount(c) | | | Market
Value | | | Upfront
Premium
Paid/(Received) | | | Unrealized
Appreciation/
(Depreciation) | |
ABX.HE.AAA.6-1 | | | (0.180%) | | | | 07/25/45 | | | JPMorgan Chase Bank N.A. | | | 0.000% | | | | USD | | | | 53,564 | | | $ | 1,205 | | | $ | 1,348 | | | $ | (143) | |
ABX.HE.AAA.6-1 | | | (0.180%) | | | | 07/25/45 | | | JPMorgan Chase Bank N.A. | | | 0.000% | | | | USD | | | | 16,623 | | | | 374 | | | | — | | | | 374 | |
ABX.HE.AAA.7-1 | | | (0.090%) | | | | 08/25/37 | | | JPMorgan Chase Bank N.A. | | | 0.000% | | | | USD | | | | 358,210 | | | | 88,358 | | | | 91,344 | | | | (2,986) | |
ABX.HE.AAA.7-1 | | | (0.090%) | | | | 08/25/37 | | | JPMorgan Chase Bank N.A. | | | 0.000% | | | | USD | | | | 154,596 | | | | 38,134 | | | | 39,422 | | | | (1,288) | |
ABX.HE.AAA.7-1 | | | (0.090%) | | | | 08/25/37 | | | JPMorgan Chase Bank N.A. | | | 0.000% | | | | USD | | | | 105,578 | | | | 26,042 | | | | 27,450 | | | | (1,408) | |
ABX.HE.PEN.AAA.6-2 | | | (0.110%) | | | | 05/25/46 | | | JPMorgan Chase Bank N.A. | | | 0.000% | | | | USD | | | | 326,821 | | | | 39,763 | | | | 45,807 | | | | (6,044) | |
CDX.EM.25 | | | (1.000%) | | | | 06/20/21 | | | Bank of America N.A. | | | 2.673% | | | | USD | | | | 799,000 | | | | 60,339 | | | | 69,753 | | | | (9,414) | |
CDX.EM.25 | | | (1.000%) | | | | 06/20/21 | | | Barclays Bank plc | | | 2.673% | | | | USD | | | | 10,408,000 | | | | 785,991 | | | | 881,037 | | | | (95,046) | |
CDX.EM.25 | | | (1.000%) | | | | 06/20/21 | | | Goldman Sachs International | | | 2.673% | | | | USD | | | | 7,869,000 | | | | 594,251 | | | | 700,341 | | | | (106,090) | |
CMBX.NA.A.7 | | | (2.000%) | | | | 01/17/47 | | | Barclays Bank plc | | | 0.000% | | | | USD | | | | 105,000 | | | | 7,244 | | | | (612) | | | | 7,856 | |
CMBX.NA.A.7 | | | (2.000%) | | | | 01/17/47 | | | JPMorgan Chase Bank N.A. | | | 0.000% | | | | USD | | | | 480,000 | | | | 33,114 | | | | (10,238) | | | | 43,352 | |
CMBX.NA.AA.2 | | | (0.150%) | | | | 03/15/49 | | | Credit Suisse International | | | 0.000% | | | | USD | | | | 451,549 | | | | 189,651 | | | | 133,201 | | | | 56,450 | |
CMBX.NA.AA.2 | | | (0.150%) | | | | 03/15/49 | | | Goldman Sachs International | | | 0.000% | | | | USD | | | | 66,282 | | | | 27,839 | | | | 20,724 | | | | 7,115 | |
CMBX.NA.AA.7 | | | (1.500%) | | | | 01/17/47 | | | Credit Suisse International | | | 0.000% | | | | USD | | | | 920,000 | | | | 38,386 | | | | (4,790) | | | | 43,176 | |
CMBX.NA.AA.7 | | | (1.500%) | | | | 01/17/47 | | | Credit Suisse International | | | 0.000% | | | | USD | | | | 400,000 | | | | 16,690 | | | | 1,649 | | | | 15,041 | |
CMBX.NA.AA.7 | | | (1.500%) | | | | 01/17/47 | | | Credit Suisse International | | | 0.000% | | | | USD | | | | 395,000 | | | | 16,481 | | | | (3,703) | | | | 20,184 | |
CMBX.NA.AA.7 | | | (1.500%) | | | | 01/17/47 | | | Credit Suisse International | | | 0.000% | | | | USD | | | | 385,000 | | | | 16,064 | | | | 2,154 | | | | 13,910 | |
CMBX.NA.AA.7 | | | (1.500%) | | | | 01/17/47 | | | Credit Suisse International | | | 0.000% | | | | USD | | | | 385,000 | | | | 16,064 | | | | 1,853 | | | | 14,211 | |
CMBX.NA.AA.7 | | | (1.500%) | | | | 01/17/47 | | | Credit Suisse International | | | 0.000% | | | | USD | | | | 370,000 | | | | 15,438 | | | | (3,280) | | | | 18,718 | |
CMBX.NA.AA.7 | | | (1.500%) | | | | 01/17/47 | | | Credit Suisse International | | | 0.000% | | | | USD | | | | 245,000 | | | | 10,222 | | | | (2,774) | | | | 12,996 | |
CMBX.NA.AA.7 | | | (1.500%) | | | | 01/17/47 | | | Morgan Stanley & Co. International plc | | | 0.000% | | | | USD | | | | 245,000 | | | | 10,222 | | | | 17,197 | | | | (6,975) | |
CMBX.NA.AA.8 | | | (1.500%) | | | | 10/17/57 | | | Barclays Bank plc | | | 0.000% | | | | USD | | | | 265,000 | | | | 19,234 | | | | 19,621 | | | | (387) | |
CMBX.NA.AJ.2 | | | (1.090%) | | | | 03/15/49 | | | Credit Suisse International | | | 0.000% | | | | USD | | | | 1,004,217 | | | | 139,963 | | | | 76,558 | | | | 63,405 | |
CMBX.NA.AJ.2 | | | (1.090%) | | | | 03/15/49 | | | Credit Suisse International | | | 0.000% | | | | USD | | | | 419,673 | | | | 58,492 | | | | 31,458 | | | | 27,034 | |
CMBX.NA.AJ.2 | | | (1.090%) | | | | 03/15/49 | | | Deutsche Bank AG | | | 0.000% | | | | USD | | | | 119,906 | | | | 16,712 | | | | 9,139 | | | | 7,573 | |
CMBX.NA.AJ.2 | | | (1.090%) | | | | 03/15/49 | | | Goldman Sachs International | | | 0.000% | | | | USD | | | | 198,595 | | | | 27,679 | | | | 17,099 | | | | 10,580 | |
CMBX.NA.AJ.4 | | | (0.960%) | | | | 02/17/51 | | | Bank of America N.A. | | | 0.000% | | | | USD | | | | 675,973 | | | | 189,642 | | | | 119,869 | | | | 69,773 | |
CMBX.NA.AJ.4 | | | (0.960%) | | | | 02/17/51 | | | Credit Suisse International | | | 0.000% | | | | USD | | | | 740,115 | | | | 207,637 | | | | 150,691 | | | | 56,946 | |
CMBX.NA.AJ.4 | | | (0.960%) | | | | 02/17/51 | | | Credit Suisse International | | | 0.000% | | | | USD | | | | 577,291 | | | | 161,957 | | | | 111,103 | | | | 50,854 | |
CMBX.NA.AJ.4 | | | (0.960%) | | | | 02/17/51 | | | Credit Suisse International | | | 0.000% | | | | USD | | | | 458,872 | | | | 128,735 | | | | 86,604 | | | | 42,131 | |
CMBX.NA.AJ.4 | | | (0.960%) | | | | 02/17/51 | | | Credit Suisse International | | | 0.000% | | | | USD | | | | 128,287 | | | | 35,990 | | | | 25,641 | | | | 10,349 | |
CMBX.NA.AJ.4 | | | (0.960%) | | | | 02/17/51 | | | Morgan Stanley & Co. International plc | | | 0.000% | | | | USD | | | | 1,263,132 | | | | 354,368 | | | | 233,264 | | | | 121,104 | |
See accompanying notes to financial statements.
MSF-29
Metropolitan Series Fund
Met/Wellington Balanced Portfolio (formerly, WMC Balanced Portfolio)
Schedule of Investments as of June 30, 2016 (Unaudited)
OTC Credit Default Swaps on Credit Indices—Buy Protection (a)—(Continued)
| | | | | | | | | | | | | | | | | | | | | | | | | | | | | | | | | | |
Reference Obligation | | Fixed Deal
(Pay) Rate | | | Maturity
Date | | | Counterparty | | Implied Credit
Spread at
June 30,
2016(b) | | | Notional
Amount(c) | | | Market
Value | | | Upfront
Premium
Paid/(Received) | | | Unrealized
Appreciation/
(Depreciation) | |
CMBX.NA.AM.2 | | | (0.500%) | | | | 03/15/49 | | | Credit Suisse International | | | 0.000% | | | | USD | | | | 1,182,084 | | | $ | 6,950 | | | $ | 17,105 | | | $ | (10,155) | |
CMBX.NA.AM.2 | | | (0.500%) | | | | 03/15/49 | | | Morgan Stanley & Co. International plc | | | 0.000% | | | | USD | | | | 371,296 | | | | 2,183 | | | | 1,862 | | | | 321 | |
CMBX.NA.AM.4 | | | (0.500%) | | | | 02/17/51 | | | Credit Suisse International | | | 0.000% | | | | USD | | | | 435,000 | | | | 12,050 | | | | 23,564 | | | | (11,514) | |
CMBX.NA.AM.4 | | | (0.500%) | | | | 02/17/51 | | | Goldman Sachs International | | | 0.000% | | | | USD | | | | 125,000 | | | | 3,463 | | | | 2,873 | | | | 590 | |
CMBX.NA.AS.6 | | | (1.000%) | | | | 05/11/63 | | | Credit Suisse International | | | 0.000% | | | | USD | | | | 1,080,000 | | | | 19,426 | | | | 11,647 | | | | 7,779 | |
CMBX.NA.AS.6 | | | (1.000%) | | | | 05/11/63 | | | Credit Suisse International | | | 0.000% | | | | USD | | | | 330,000 | | | | 5,936 | | | | (657) | | | | 6,593 | |
CMBX.NA.AS.7 | | | (1.000%) | | | | 01/17/47 | | | Credit Suisse International | | | 0.000% | | | | USD | | | | 535,000 | | | | 14,488 | | | | 8,498 | | | | 5,990 | |
CMBX.NA.AS.7 | | | (1.000%) | | | | 01/17/47 | | | Credit Suisse International | | | 0.000% | | | | USD | | | | 485,000 | | | | 13,134 | | | | 11,679 | | | | 1,455 | |
CMBX.NA.AS.7 | | | (1.000%) | | | | 01/17/47 | | | Credit Suisse International | | | 0.000% | | | | USD | | | | 210,000 | | | | 5,687 | | | | 1,123 | | | | 4,564 | |
CMBX.NA.AS.7 | | | (1.000%) | | | | 01/17/47 | | | Credit Suisse International | | | 0.000% | | | | USD | | | | 140,000 | | | | 3,791 | | | | 2,463 | | | | 1,328 | |
CMBX.NA.AS.7 | | | (1.000%) | | | | 01/17/47 | | | Credit Suisse International | | | 0.000% | | | | USD | | | | 5,000 | | | | 135 | | | | 46 | | | | 89 | |
CMBX.NA.AS.7 | | | (1.000%) | | | | 01/17/47 | | | Goldman Sachs International | | | 0.000% | | | | USD | | | | 500,000 | | | | 13,540 | | | | 14,481 | | | | (941) | |
CMBX.NA.AS.8 | | | (1.000%) | | | | 10/17/57 | | | Deutsche Bank AG | | | 0.000% | | | | USD | | | | 210,000 | | | | 10,112 | | | | 15,785 | | | | (5,673) | |
CMBX.NA.BBB.7 | | | (3.000%) | | | | 01/17/47 | | | Goldman Sachs International | | | 0.000% | | | | USD | | | | 1,020,000 | | | | 103,648 | | | | 98,003 | | | | 5,645 | |
CMBX.NA.BBB.6 | | | (3.000%) | | | | 05/11/63 | | | Goldman Sachs International | | | 0.000% | | | | USD | | | | 365,000 | | | | 26,994 | | | | 23,488 | | | | 3,506 | |
CMBX.NA.BBB.7 | | | (3.000%) | | | | 01/17/47 | | | Credit Suisse International | | | 0.000% | | | | USD | | | | 375,000 | | | | 38,106 | | | | 34,662 | | | | 3,444 | |
CMBX.NA.BBB.7 | | | (3.000%) | | | | 01/17/47 | | | Credit Suisse International | | | 0.000% | | | | USD | | | | 330,000 | | | | 33,533 | | | | 27,377 | | | | 6,156 | |
CMBX.NA.BBB.7 | | | (3.000%) | | | | 01/17/47 | | | Credit Suisse International | | | 0.000% | | | | USD | | | | 170,000 | | | | 17,275 | | | | 13,333 | | | | 3,942 | |
CMBX.NA.BBB.7 | | | (3.000%) | | | | 01/17/47 | | | Deutsche Bank AG | | | 0.000% | | | | USD | | | | 175,000 | | | | 17,783 | | | | 22,550 | | | | (4,767) | |
CMBX.NA.BBB.7 | | | (3.000%) | | | | 01/17/47 | | | Deutsche Bank AG | | | 0.000% | | | | USD | | | | 170,000 | | | | 17,275 | | | | 16,725 | | | | 550 | |
CMBX.NA.BBB.7 | | | (3.000%) | | | | 01/17/47 | | | Deutsche Bank AG | | | 0.000% | | | | USD | | | | 170,000 | | | | 17,275 | | | | 12,815 | | | | 4,460 | |
CMBX.NA.BBB.7 | | | (3.000%) | | | | 01/17/47 | | | Goldman Sachs International | | | 0.000% | | | | USD | | | | 260,000 | | | | 26,420 | | | | 25,513 | | | | 907 | |
CMBX.NA.BBB.7 | | | (3.000%) | | | | 01/17/47 | | | Goldman Sachs International | | | 0.000% | | | | USD | | | | 175,000 | | | | 17,783 | | | | 25,231 | | | | (7,448) | |
CMBX.NA.BBB.7 | | | (3.000%) | | | | 01/17/47 | | | Goldman Sachs International | | | 0.000% | | | | USD | | | | 130,000 | | | | 13,210 | | | | 12,000 | | | | 1,210 | |
CMBX.NA.BBB.7 | | | (3.000%) | | | | 01/17/47 | | | Morgan Stanley & Co. International plc | | | 0.000% | | | | USD | | | | 350,000 | | | | 35,566 | | | | 32,013 | | | | 3,553 | |
CMBX.NA.BBB.7 | | | (3.000%) | | | | 01/17/47 | | | Morgan Stanley & Co. International plc | | | 0.000% | | | | USD | | | | 150,000 | | | | 15,242 | | | | 15,085 | | | | 157 | |
CMBX.NA.BBB.7 | | | (3.000%) | | | | 01/17/47 | | | Morgan Stanley & Co. International plc | | | 0.000% | | | | USD | | | | 250,000 | | | | 25,404 | | | | 31,378 | | | | (5,974) | |
| | | | | | | | | | | | | | | | | | | | | | | | | | | | | | | | | | |
Totals | | | $ | 3,888,690 | | | $ | 3,389,572 | | | $ | 499,118 | |
| | | | | | | | | | | | | | | | | | | | | | | | | | | | | | | | | | |
OTC Credit Default Swaps on Credit Indices—Sell Protection (d)
| | | | | | | | | | | | | | | | | | | | | | | | | | | | | | | | | | |
Reference Obligation | | Fixed Deal
Receive Rate | | | Maturity
Date | | | Counterparty | | Implied Credit
Spread at
June 30,
2016(b) | | | Notional
Amount(c) | | | Market
Value | | | Upfront
Premium
Paid/(Received) | | | Unrealized
Appreciation/
(Depreciation) | |
CMBX.NA.A.2 | | | 0.250% | | | | 03/15/49 | | | Bank of America N.A. | | | 0.000% | | | | USD | | | | 252,949 | | | $ | (168,474) | | | $ | (147,474) | | | $ | (21,000) | |
CMBX.NA.A.2 | | | 0.250% | | | | 03/15/49 | | | Credit Suisse International | | | 0.000% | | | | USD | | | | 293,867 | | | | (195,728) | | | | (185,084) | | | | (10,644) | |
CMBX.NA.A.2 | | | 0.250% | | | | 03/15/49 | | | Goldman Sachs International | | | 0.000% | | | | USD | | | | 70,677 | | | | (47,074) | | | | (44,505) | | | | (2,569) | |
CMBX.NA.A.2 | | | 0.250% | | | | 03/15/49 | | | Goldman Sachs International | | | 0.000% | | | | USD | | | | 189,712 | | | | (126,356) | | | | (118,536) | | | | (7,820) | |
CMBX.NA.A.2 | | | 0.250% | | | | 03/15/49 | | | Goldman Sachs International | | | 0.000% | | | | USD | | | | 215,750 | | | | (143,699) | | | | (135,613) | | | | (8,086) | |
CMBX.NA.A.2 | | | 0.250% | | | | 03/15/49 | | | Morgan Stanley & Co. International plc | | | 0.000% | | | | USD | | | | 132,426 | | | | (88,201) | | | | (83,469) | | | | (4,732) | |
CMBX.NA.A.6. | | | 2.000% | | | | 05/11/63 | | | Goldman Sachs International | | | 0.000% | | | | USD | | | | 355,000 | | | | (18,066) | | | | 4,634 | | | | (22,700) | |
CMBX.NA.AAA.6 | | | 0.500% | | | | 05/11/63 | | | Credit Suisse International | | | 0.000% | | | | USD | | | | 550,000 | | | | (8,676) | | | | (13,165) | | | | 4,489 | |
CMBX.NA.AAA.6 | | | 0.500% | | | | 05/11/63 | | | Credit Suisse International | | | 0.000% | | | | USD | | | | 555,000 | | | | (8,755) | | | | (13,268) | | | | 4,513 | |
CMBX.NA.AAA.6 | | | 0.500% | | | | 05/11/63 | | | Credit Suisse International | | | 0.000% | | | | USD | | | | 775,000 | | | | (12,225) | | | | (28,868) | | | | 16,643 | |
CMBX.NA.AAA.6 | | | 0.500% | | | | 05/11/63 | | | Credit Suisse International | | | 0.000% | | | | USD | | | | 6,260,000 | | | | (98,747) | | | | (131,821) | | | | 33,074 | |
CMBX.NA.AAA.6 | | | 0.500% | | | | 05/11/63 | | | Deutsche Bank AG | | | 0.000% | | | | USD | | | | 730,000 | | | | (11,515) | | | | (25,022) | | | | 13,507 | |
CMBX.NA.AAA.6 | | | 0.500% | | | | 05/11/63 | | | Deutsche Bank AG | | | 0.000% | | | | USD | | | | 1,069,000 | | | | (16,863) | | | | (25,555) | | | | 8,692 | |
CMBX.NA.AAA.6 | | | 0.500% | | | | 05/11/63 | | | Goldman Sachs International | | | 0.000% | | | | USD | | | | 85,000 | | | | (1,341) | | | | (1,018) | | | | (323) | |
CMBX.NA.AAA.6 | | | 0.500% | | | | 05/11/63 | | | Goldman Sachs International | | | 0.000% | | | | USD | | | | 370,000 | | | | (5,836) | | | | (12,024) | | | | 6,188 | |
CMBX.NA.AAA.6 | | | 0.500% | | | | 05/11/63 | | | Goldman Sachs International | | | 0.000% | | | | USD | | | | 440,000 | | | | (6,941) | | | | (15,071) | | | | 8,130 | |
See accompanying notes to financial statements.
MSF-30
Metropolitan Series Fund
Met/Wellington Balanced Portfolio (formerly, WMC Balanced Portfolio)
Schedule of Investments as of June 30, 2016 (Unaudited)
OTC Credit Default Swaps on Credit Indices—Sell Protection (d)—(Continued)
| | | | | | | | | | | | | | | | | | | | | | | | | | | | | | | | | | |
Reference Obligation | | Fixed Deal
Receive Rate | | | Maturity
Date | | | Counterparty | | Implied Credit
Spread at
June 30,
2016(b) | | | Notional
Amount(c) | | | Market
Value | | | Upfront
Premium
Paid/(Received) | | | Unrealized
Appreciation/
(Depreciation) | |
CMBX.NA.AAA.6 | | | 0.500% | | | | 05/11/63 | | | Goldman Sachs International | | | 0.000% | | | | USD | | | | 465,000 | | | $ | (7,335) | | | $ | (15,591) | | | $ | 8,256 | |
CMBX.NA.AAA.6 | | | 0.500% | | | | 05/11/63 | | | Morgan Stanley & Co. International plc | | | 0.000% | | | | USD | | | | 530,000 | | | | (8,360) | | | | (12,530) | | | | 4,170 | |
CMBX.NA.AAA.6 | | | 0.500% | | | | 05/11/63 | | | Morgan Stanley & Co. International plc | | | 0.000% | | | | USD | | | | 625,000 | | | | (9,859) | | | | (21,423) | | | | 11,564 | |
CMBX.NA.AAA.6 | | | 0.500% | | | | 05/11/63 | | | Morgan Stanley & Co. International plc | | | 0.000% | | | | USD | | | | 660,000 | | | | (10,411) | | | | (15,778) | | | | 5,367 | |
CMBX.NA.AAA.6 | | | 0.500% | | | | 05/11/63 | | | Morgan Stanley & Co. International plc | | | 0.000% | | | | USD | | | | 755,000 | | | | (11,910) | | | | (25,537) | | | | 13,627 | |
CMBX.NA.AAA.6 | | | 0.500% | | | | 05/11/63 | | | Morgan Stanley & Co. International plc | | | 0.000% | | | | USD | | | | 8,997,000 | | | | (141,921) | | | | (294,866) | | | | 152,945 | |
CMBX.NA.BB.6 | | | 5.000% | | | | 05/11/63 | | | Credit Suisse International | | | 0.000% | | | | USD | | | | 1,081,000 | | | | (148,397) | | | | (11,224) | | | | (137,173) | |
CMBX.NA.BB.6 | | | 5.000% | | | | 05/11/63 | | | Goldman Sachs International | | | 0.000% | | | | USD | | | | 304,000 | | | | (41,732) | | | | (50,355) | | | | 8,623 | |
CMBX.NA.BB.8 | | | 5.000% | | | | 10/17/57 | | | Bank of America N.A. | | | 0.000% | | | | USD | | | | 335,000 | | | | (89,440) | | | | (24,355) | | | | (65,085) | |
CMBX.NA.BB.8 | | | 5.000% | | | | 10/17/57 | | | Barclays Bank plc | | | 0.000% | | | | USD | | | | 250,000 | | | | (66,746) | | | | (29,346) | | | | (37,400) | |
CMBX.NA.BB.8 | | | 5.000% | | | | 10/17/57 | | | Barclays Bank plc | | | 0.000% | | | | USD | | | | 280,000 | | | | (74,756) | | | | (33,928) | | | | (40,828) | |
CMBX.NA.BB.8 | | | 5.000% | | | | 10/17/57 | | | Barclays Bank plc | | | 0.000% | | | | USD | | | | 345,000 | | | | (92,110) | | | | (18,843) | | | | (73,267) | |
CMBX.NA.BB.8 | | | 5.000% | | | | 10/17/57 | | | Barclays Bank plc | | | 0.000% | | | | USD | | | | 380,000 | | | | (101,454) | | | | (23,613) | | | | (77,841) | |
CMBX.NA.BB.8 | | | 5.000% | | | | 10/17/57 | | | Barclays Bank plc | | | 0.000% | | | | USD | | | | 790,000 | | | | (210,918) | | | | (90,424) | | | | (120,494) | |
CMBX.NA.BB.8 | | | 5.000% | | | | 10/17/57 | | | Credit Suisse International | | | 0.000% | | | | USD | | | | 160,000 | | | | (42,718) | | | | (19,714) | | | | (23,004) | |
CMBX.NA.BB.8 | | | 5.000% | | | | 10/17/57 | | | Credit Suisse International | | | 0.000% | | | | USD | | | | 170,000 | | | | (45,387) | | | | (25,118) | | | | (20,269) | |
CMBX.NA.BB.8 | | | 5.000% | | | | 10/17/57 | | | Credit Suisse International | | | 0.000% | | | | USD | | | | 170,000 | | | | (45,387) | | | | (30,531) | | | | (14,856) | |
CMBX.NA.BB.8 | | | 5.000% | | | | 10/17/57 | | | Credit Suisse International | | | 0.000% | | | | USD | | | | 235,000 | | | | (62,741) | | | | (28,269) | | | | (34,472) | |
CMBX.NA.BB.8 | | | 5.000% | | | | 10/17/57 | | | Credit Suisse International | | | 0.000% | | | | USD | | | | 250,000 | | | | (66,746) | | | | (32,560) | | | | (34,186) | |
CMBX.NA.BB.8 | | | 5.000% | | | | 10/17/57 | | | Credit Suisse International | | | 0.000% | | | | USD | | | | 275,000 | | | | (73,421) | | | | (25,852) | | | | (47,569) | |
CMBX.NA.BB.8 | | | 5.000% | | | | 10/17/57 | | | Credit Suisse International | | | 0.000% | | | | USD | | | | 280,000 | | | | (74,756) | | | | (23,907) | | | | (50,849) | |
CMBX.NA.BB.8 | | | 5.000% | | | | 10/17/57 | | | Credit Suisse International | | | 0.000% | | | | USD | | | | 280,000 | | | | (74,756) | | | | (33,427) | | | | (41,329) | |
CMBX.NA.BB.8 | | | 5.000% | | | | 10/17/57 | | | Credit Suisse International | | | 0.000% | | | | USD | | | | 355,000 | | | | (94,779) | | | | (42,966) | | | | (51,813) | |
CMBX.NA.BB.8 | | | 5.000% | | | | 10/17/57 | | | Credit Suisse International | | | 0.000% | | | | USD | | | | 560,000 | | | | (149,511) | | | | (68,443) | | | | (81,068) | |
CMBX.NA.BB.8 | | | 5.000% | | | | 10/17/57 | | | Goldman Sachs International | | | 0.000% | | | | USD | | | | 140,000 | | | | (37,378) | | | | (14,640) | | | | (22,738) | |
CMBX.NA.BB.8 | | | 5.000% | | | | 10/17/57 | | | Goldman Sachs International | | | 0.000% | | | | USD | | | | 170,000 | | | | (45,387) | | | | (27,682) | | | | (17,705) | |
CMBX.NA.BB.8 | | | 5.000% | | | | 10/17/57 | | | Goldman Sachs International | | | 0.000% | | | | USD | | | | 250,000 | | | | (66,746) | | | | (29,976) | | | | (36,770) | |
CMBX.NA.BB.8 | | | 5.000% | | | | 10/17/57 | | | Goldman Sachs International | | | 0.000% | | | | USD | | | | 320,000 | | | | (85,435) | | | | (109,053) | | | | 23,618 | |
CMBX.NA.BB.8 | | | 5.000% | | | | 10/17/57 | | | Goldman Sachs International | | | 0.000% | | | | USD | | | | 325,000 | | | | (86,770) | | | | (98,903) | | | | 12,133 | |
CMBX.NA.BB.8 | | | 5.000% | | | | 10/17/57 | | | Goldman Sachs International | | | 0.000% | | | | USD | | | | 580,000 | | | | (154,851) | | | | (181,510) | | | | 26,659 | |
CMBX.NA.BB.8 | | | 5.000% | | | | 10/17/57 | | | JPMorgan Chase Bank N.A. | | | 0.000% | | | | USD | | | | 80,000 | | | | (21,359) | | | | (6,005) | | | | (15,354) | |
CMBX.NA.BB.8 | | | 5.000% | | | | 10/17/57 | | | Morgan Stanley & Co. International plc | | | 0.000% | | | | USD | | | | 260,000 | | | | (69,416) | | | | (30,509) | | | | (38,907) | |
CMBX.NA.BB.8 | | | 5.000% | | | | 10/17/57 | | | Morgan Stanley & Co. International plc | | | 0.000% | | | | USD | | | | 325,000 | | | | (86,770) | | | | (101,130) | | | | 14,360 | |
CMBX.NA.BB.9 | | | 5.000% | | | | 09/15/58 | | | Goldman Sachs International | | | 0.000% | | | | USD | | | | 125,000 | | | | (36,654) | | | | (35,383) | | | | (1,271) | |
CMBX.NA.BB.9 | | | 5.000% | | | | 09/15/58 | | | Goldman Sachs International | | | 0.000% | | | | USD | | | | 130,000 | | | | (38,120) | | | | (36,481) | | | | (1,639) | |
CMBX.NA.BB.9 | | | 5.000% | | | | 09/15/58 | | | Goldman Sachs International | | | 0.000% | | | | USD | | | | 250,000 | | | | (73,308) | | | | (70,766) | | | | (2,542) | |
CMBX.NA.BB.9 | | | 5.000% | | | | 09/17/58 | | | Goldman Sachs International | | | 0.000% | | | | USD | | | | 125,000 | | | | (36,654) | | | | (35,733) | | | | (921) | |
CMBX.NA.BB.9 | | | 5.000% | | | | 09/17/58 | | | Morgan Stanley & Co. International plc | | | 0.000% | | | | USD | | | | 255,000 | | | | (74,774) | | | | (80,525) | | | | 5,751 | |
PRIMEX.ARM.2 | | | 4.580% | | | | 12/25/37 | | | JPMorgan Chase Bank N.A. | | | 0.000% | | | | USD | | | | 618,873 | | | | 23,208 | | | | 18,584 | | | | 4,624 | |
| | | | | | | | | | | | | | | | | | | | | | | | | | | | | | | | | | |
Totals | | | $ | (3,594,462) | | | $ | (2,814,171) | | | $ | (780,291) | |
| | | | | | | | | | | | | | | | | | | | | | | | | | | | | | | | | | |
| (a) | If the Portfolio is a buyer of protection and a credit event occurs, as defined under the terms of that particular swap agreement, the Portfolio will either (i) receive from the seller of protection an amount equal to the notional amount of the swap and deliver the referenced obligation or underlying securities comprising the referenced index or (ii) receive a net settlement amount in the form of cash or securities equal to the notional amount of the swap less the recovery value of the referenced obligation or underlying securities comprising the referenced index. |
| (b) | Implied credit spreads, represented in absolute terms, utilized in determining the market value of credit default swap agreements on corporate issues or indices as of period end serve as an indicator of the current status of the payment/performance risk and represent the likelihood or risk of default for the |
See accompanying notes to financial statements.
MSF-31
Metropolitan Series Fund
Met/Wellington Balanced Portfolio (formerly, WMC Balanced Portfolio)
Schedule of Investments as of June 30, 2016 (Unaudited)
| | credit derivative. The implied credit spread of a particular referenced entity reflects the cost of buying/selling protection and may include upfront payments required to be made to enter into the agreement. Wider credit spreads represent a deterioration of the referenced entity’s credit soundness and a greater likelihood or risk of default or other credit event occurring as defined under the terms of the agreement. A credit spread identified as “Defaulted” indicates a credit event has occurred for the referenced entity or obligation. |
| (c) | The maximum potential amount of future undiscounted payments that the Portfolio could be required to make under a credit default swap contract would be the notional amount of the contract. These potential amounts would be partially offset by any recovery values of the referenced debt obligation or net amounts received from the settlement of purchased protection credit default swap contracts entered into by the Portfolio for the same referenced debt obligation. |
| (d) | If the Portfolio is a seller of protection and a credit event occurs, as defined under the terms of that particular swap agreement, the Portfolio will either (i) pay to the buyer of protection an amount equal to the notional amount of the swap and take delivery of the referenced obligation or underlying securities comprising the referenced index or (ii) pay a net settlement amount in the form of cash or securities equal to the notional amount of the swap less the recovery value of the referenced obligation or underlying securities comprising the referenced index. |
| (USD)— | United States Dollar |
| (CMBX)— | Commercial Mortgage-Backed Index |
| (CDX.NA.HY)— | Markit North America High Yield CDS Index |
| (CDX.NA.IG)— | Markit North America Investment Grade CDS Index |
| (CMBX.NA.A)— | Markit North America A Rated CMBS Index |
| (CMBX.NA.AA)— | Markit North America AA Rated CMBS Index |
| (CMBX.NA.AAA)— | Markit North America AAA Rated CMBS Index |
| (CMBX.NA.AJ)— | Markit North America Junior AAA Rated CMBS Index |
| (CMBX.NA.AM)— | Markit North America Mezzanine AAA Rated CMBS Index |
| (CMBX.NA.AS)— | Markit North America Junior AAA Rated CMBS Index |
| (CMBX.NA.BB)— | Markit North America BB Rated CMBS Index |
| (CMBX.NA.BBB-)— | Markit North America BBB- Rated CMBS Index |
| (CPI-U)— | USA-Non-Revised Consumer Price Index-Urban |
| (ITRAXX.EUROPE)— | Markit iTraxx Europe Index |
| (ITRAXX.XOVER)— | Markit iTraxx Crossover Index |
| (LIBOR)— | London Interbank Offered Rate |
| (PRIMEX.ARM)— | Markit PrimeX Adjustable Rate Mortgage Index |
See accompanying notes to financial statements.
MSF-32
Metropolitan Series Fund
Met/Wellington Balanced Portfolio (formerly, WMC Balanced Portfolio)
Schedule of Investments as of June 30, 2016 (Unaudited)
Fair Value Hierarchy
Accounting principles generally accepted in the United States of America (“GAAP”) define fair market value as the price that the Portfolio would receive to sell an asset or pay to transfer a liability in an orderly transaction between market participants at the measurement date. It establishes a fair value hierarchy that prioritizes inputs to valuation methods and requires disclosure of the fair value hierarchy, separately for each major category of assets and liabilities, that segregates fair value measurements into three levels. Levels 1, 2 and 3 of the fair value hierarchy are defined as follows:
Level 1 - unadjusted quoted prices in active markets for identical investments
Level 2 - other significant observable inputs (including, but not limited to, quoted prices for similar assets or liabilities in markets that are either active or inactive; inputs other than quoted prices that are observable such as interest rates, yield curves, volatilities, prepayment speeds, loss severities, credit risks, default rates, or other market corroborated inputs)
Level 3 - significant unobservable inputs based on the best information available in the circumstances, to the extent observable inputs are unavailable (including the Portfolio’s own assumptions used in determining the fair value of investments and derivative financial instruments)
The inputs or methodologies used for valuing investments are not necessarily an indication of the risk associated with investing in them. Changes to the inputs or methodologies used may result in transfers between levels, which will be recognized as of the beginning of the reporting period. Information on transfers between Level 1 and Level 2, if any, will be disclosed following the fair value hierarchy table below. A reconciliation of Level 3 securities, if any, will also be disclosed following the fair value hierarchy table. For more information about the Portfolio’s policy regarding the valuation of investments, please refer to the Notes to Financial Statements.
The following table summarizes the fair value hierarchy of the Portfolio’s investments as of June 30, 2016:
| | | | | | | | | | | | | | | | |
| Description | | Level 1 | | | Level 2 | | | Level 3 | | | Total | |
Total Common Stocks* | | $ | 722,701,388 | | | $ | — | | | $ | — | | | $ | 722,701,388 | |
Total U.S. Treasury & Government Agencies* | | | — | | | | 264,522,986 | | | | — | | | | 264,522,986 | |
Total Corporate Bonds & Notes* | | | — | | | | 171,273,790 | | | | — | | | | 171,273,790 | |
Total Asset-Backed Securities* | | | — | | | | 85,229,785 | | | | — | | | | 85,229,785 | |
Total Mortgage-Backed Securities* | | | — | | | | 74,341,893 | | | | — | | | | 74,341,893 | |
Total Floating Rate Loans (Less Unfunded Loan Commitments)* | | | — | | | | 26,945,141 | | | | — | | | | 26,945,141 | |
Total Foreign Government* | | | — | | | | 10,740,354 | | | | — | | | | 10,740,354 | |
Total Municipals | | | — | | | | 5,414,674 | | | | — | | | | 5,414,674 | |
| Short-Term Investments | | | | | | | | | | | | | | | | |
Mutual Fund | | | 53,669,445 | | | | — | | | | — | | | | 53,669,445 | |
Repurchase Agreement | | | — | | | | 42,163,711 | | | | — | | | | 42,163,711 | |
Total Short-Term Investments | | | 53,669,445 | | | | 42,163,711 | | | | — | | | | 95,833,156 | |
Total Net Investments | | $ | 776,370,833 | | | $ | 680,632,334 | | | $ | — | | | $ | 1,457,003,167 | |
| | | | | | | | | | | | | | | | | |
Collateral for Securities Loaned (Liability) | | $ | — | | | $ | (53,669,445 | ) | | $ | — | | | $ | (53,669,445 | ) |
TBA Forward Sales Commitments | | $ | — | | | $ | (23,316,964 | ) | | $ | — | | | $ | (23,316,964 | ) |
| Forward Contracts | | | | | | | | | | | | | | | | |
Forward Foreign Currency Exchange Contracts (Unrealized Appreciation) | | $ | — | | | $ | 229,211 | | | $ | — | | | $ | 229,211 | |
Forward Foreign Currency Exchange Contracts (Unrealized Depreciation) | | | — | | | | (702,167 | ) | | | — | | | | (702,167 | ) |
Total Forward Contracts | | $ | — | | | $ | (472,956 | ) | | $ | — | | | $ | (472,956 | ) |
| Futures Contracts | | | | | | | | | | | | | | | | |
Futures Contracts (Unrealized Appreciation) | | $ | 3,054,443 | | | $ | — | | | $ | — | | | $ | 3,054,443 | |
Futures Contracts (Unrealized Depreciation) | | | (812,415 | ) | | | — | | | | — | | | | (812,415 | ) |
Total Futures Contracts | | $ | 2,242,028 | | | $ | — | | | $ | — | | | $ | 2,242,028 | |
Written Options at Value | | $ | — | | | $ | (133,800 | ) | | $ | — | | | $ | (133,800 | ) |
| Centrally Cleared Swap Contracts | | | | | | | | | | | | | | | | |
Centrally Cleared Swap Contracts (Unrealized Depreciation) | | $ | — | | | $ | (674,474 | ) | | $ | — | | | $ | (674,474 | ) |
| OTC Swap Contracts | | | | | | | | | | | | | | | | |
OTC Swap Contracts at Value (Assets) | | $ | — | | | $ | 3,973,950 | | | $ | — | | | $ | 3,973,950 | |
OTC Swap Contracts at Value (Liabilities) | | | — | | | | (4,291,560 | ) | | | — | | | | (4,291,560 | ) |
Total OTC Swap Contracts | | $ | — | | | $ | (317,610 | ) | | $ | — | | | $ | (317,610 | ) |
| * | See Schedule of Investments for additional detailed categorizations. |
See accompanying notes to financial statements.
MSF-33
Metropolitan Series Fund
Met/Wellington Balanced Portfolio (formerly, WMC Balanced Portfolio)
Statement of Assets and Liabilities
June 30, 2016 (Unaudited)
| | | | |
Assets | |
Investments at value (a) (b) | | $ | 1,457,003,167 | |
Cash | | | 772 | |
Cash denominated in foreign currencies (c) | | | 922 | |
Cash collateral (d) | | | 2,233,791 | |
OTC swap contracts at market value (e) | | | 3,973,950 | |
Unrealized appreciation on forward foreign currency exchange contracts | | | 229,211 | |
Receivable for: | | | | |
Investments sold | | | 3,252,828 | |
TBA securities sold (f) | | | 276,223,999 | |
Fund shares sold | | | 55,090 | |
Principal paydowns | | | 1,532 | |
Dividends and interest | | | 3,915,223 | |
Variation margin on futures contracts | | | 322,046 | |
Interest on OTC swap contracts | | | 13,642 | |
Prepaid expenses | | | 7,822 | |
| | | | |
Total Assets | | | 1,747,233,995 | |
Liabilities | | | | |
Written options at value (g) | | | 133,800 | |
Forward sales commitments, at value | | | 23,316,964 | |
Cash collateral for OTC swap contracts | | | 705,000 | |
OTC swap contracts at market value (h) | | | 4,291,560 | |
Unrealized depreciation on forward foreign currency exchange contracts | | | 702,167 | |
Collateral for securities loaned | | | 53,669,445 | |
Payables for: | | | | |
Investments purchased | | | 5,317,381 | |
TBA securities purchased (f) | | | 414,253,097 | |
Fund shares redeemed | | | 609,364 | |
Variation margin on centrally cleared swap contracts | | | 99,967 | |
Interest on OTC swap contracts | | | 11,199 | |
Accrued Expenses: | | | | |
Management fees | | | 436,180 | |
Distribution and service fees | | | 17,139 | |
Deferred trustees’ fees | | | 78,394 | |
Other expenses | | | 685,029 | |
| | | | |
Total Liabilities | | | 504,326,686 | |
| | | | |
Net Assets | | $ | 1,242,907,309 | |
| | | | |
Net Assets Consist of: | | | | |
Paid in surplus | | $ | 1,156,939,628 | |
Undistributed net investment income | | | 12,463,750 | |
Accumulated net realized gain | | | 1,236,180 | |
Unrealized appreciation on investments, written options, futures contracts, swap contracts and foreign currency transactions | | | 72,267,751 | |
| | | | |
Net Assets | | $ | 1,242,907,309 | |
| | | | |
Net Assets | | | | |
Class A | | $ | 1,145,978,115 | |
Class B | | | 65,661,036 | |
Class E | | | 31,268,158 | |
Capital Shares Outstanding* | | | | |
Class A | | | 64,209,599 | |
Class B | | | 3,697,959 | |
Class E | | | 1,755,099 | |
Net Asset Value, Offering Price and Redemption Price Per Share | | | | |
Class A | | $ | 17.85 | |
Class B | | | 17.76 | |
Class E | | | 17.82 | |
| * | The Portfolio is authorized to issue an unlimited number of shares. |
| (a) | Identified cost of investments was $1,384,976,997. |
| (b) | Includes securities loaned at value of $69,292,878. |
| (c) | Identified cost of cash denominated in foreign currencies was $1,322. |
| (d) | Includes collateral of $1,795,260 for futures contracts and $438,531 for centrally cleared swap contracts. |
| (e) | Net premium paid on OTC swap contracts was $3,490,351. |
| (f) | Included within TBA securities sold is $32,843,677 related to TBA forward sale commitments and included within TBA securities purchased is $9,546,799 related to TBA forward sale commitments. |
| (g) | Premiums received on written options were $173,754. |
| (h) | Net premium received on OTC swap contracts was $2,932,470. |
Statement of Operations
Six Months Ended June 30, 2016 (Unaudited)
| | | | |
Investment Income | |
Dividends (a) | | $ | 6,080,591 | |
Interest (b) | | | 9,495,616 | |
Securities lending income | | | 259,703 | |
| | | | |
Total investment income | | | 15,835,910 | |
Expenses | | | | |
Management fees | | | 2,810,045 | |
Administration fees | | | 15,524 | |
Custodian and accounting fees | | | 311,644 | |
Distribution and service fees—Class B | | | 79,568 | |
Distribution and service fees—Class E | | | 23,102 | |
Audit and tax services | | | 47,469 | |
Legal | | | 13,588 | |
Trustees’ fees and expenses | | | 15,990 | |
Shareholder reporting | | | 125,153 | |
Insurance | | | 4,260 | |
Miscellaneous | | | 9,270 | |
| | | | |
Total expenses | | | 3,455,613 | |
Less management fee waiver | | | (176,054 | ) |
Less broker commission recapture | | | (6,757 | ) |
| | | | |
Net expenses | | | 3,272,802 | |
| | | | |
Net Investment Income | | | 12,563,108 | |
| | | | |
Net Realized and Unrealized Gain | | | | |
| Net realized gain (loss) on: | | | | |
Investments (c) | | | 5,102,579 | |
Futures contracts | | | 1,950,347 | |
Written options | | | 560,052 | |
Swap contracts | | | (2,367,122 | ) |
Foreign currency transactions | | | (311,235 | ) |
| | | | |
Net realized gain | | | 4,934,621 | |
| | | | |
| Net change in unrealized appreciation (depreciation) on: | | | | |
Investments (d) | | | 21,103,363 | |
Futures contracts | | | 2,265,197 | |
Written options | | | 39,666 | |
Swap contracts | | | (1,273,908 | ) |
Foreign currency transactions | | | (549,490 | ) |
| | | | |
Net change in unrealized appreciation | | | 21,584,828 | |
| | | | |
Net realized and unrealized gain | | | 26,519,449 | |
| | | | |
Net Increase in Net Assets From Operations | | $ | 39,082,557 | |
| | | | |
| (a) | Net of foreign withholding taxes of $9,999. |
| (b) | Net of foreign withholding taxes of $5,512. |
| (c) | Net of foreign capital gains tax of $18,540. |
| (d) | Includes change in foreign capital gains tax of $842. |
See accompanying notes to financial statements.
MSF-34
Metropolitan Series Fund
Met/Wellington Balanced Portfolio (formerly, WMC Balanced Portfolio)
Statements of Changes in Net Assets
| | | | | | | | |
| | | Six Months
Ended
June 30,
2016
(Unaudited) | | | Year Ended
December 31,
2015 | |
Increase (Decrease) in Net Assets: | | | | | | | | |
From Operations | | | | | | | | |
Net investment income | | $ | 12,563,108 | | | $ | 24,677,644 | |
Net realized gain | | | 4,934,621 | | | | 59,530,052 | |
Net change in unrealized appreciation (depreciation) | | | 21,584,828 | | | | (49,574,711 | ) |
| | | | | | | | |
Increase in net assets from operations | | | 39,082,557 | | | | 34,632,985 | |
| | | | | | | | |
From Distributions to Shareholders | | | | | | | | |
Net investment income | | | | | | | | |
Class A | | | (31,406,742 | ) | | | (23,978,812 | ) |
Class B | | | (1,622,094 | ) | | | (1,187,739 | ) |
Class E | | | (809,717 | ) | | | (625,351 | ) |
Net realized capital gains | | | | | | | | |
Class A | | | (52,901,850 | ) | | | (204,816,772 | ) |
Class B | | | (3,025,631 | ) | | | (11,695,847 | ) |
Class E | | | (1,452,246 | ) | | | (5,811,632 | ) |
| | | | | | | | |
Total distributions | | | (91,218,280 | ) | | | (248,116,153 | ) |
| | | | | | | | |
Increase in net assets from capital share transactions | | | 27,775,208 | | | | 122,384,240 | |
| | | | | | | | |
Total decrease in net assets | | | (24,360,515 | ) | | | (91,098,928 | ) |
| | |
Net Assets | | | | | | | | |
Beginning of period | | | 1,267,267,824 | | | | 1,358,366,752 | |
| | | | | | | | |
End of period | | $ | 1,242,907,309 | | | $ | 1,267,267,824 | |
| | | | | | | | |
| | |
Undistributed net investment income | | | | | | | | |
End of period | | $ | 12,463,750 | | | $ | 33,739,195 | |
| | | | | | | | |
Other Information:
Capital Shares
Transactions in capital shares were as follows:
| | | | | | | | | | | | | | | | |
| | | Six Months Ended
June 30, 2016
(Unaudited) | | | Year Ended
December 31, 2015 | |
| | | Shares | | | Value | | | Shares | | | Value | |
Class A | | | | | | | | | | | | | | | | |
Sales | | | 357,610 | | | $ | 6,585,834 | | | | 661,786 | | | $ | 13,589,496 | |
Reinvestments | | | 4,763,197 | | | | 84,308,592 | | | | 12,169,978 | | | | 228,795,584 | |
Redemptions | | | (3,534,208 | ) | | | (65,037,844 | ) | | | (6,304,527 | ) | | | (128,069,858 | ) |
| | | | | | | | | | | | | | | | |
Net increase | | | 1,586,599 | | | $ | 25,856,582 | | | | 6,527,237 | | | $ | 114,315,222 | |
| | | | | | | | | | | | | | | | |
Class B | | | | | | | | | | | | | | | | |
Sales | | | 144,038 | | | $ | 2,622,010 | | | | 251,656 | | | $ | 5,041,729 | |
Reinvestments | | | 263,925 | | | | 4,647,725 | | | | 688,593 | | | | 12,883,586 | |
Redemptions | | | (302,379 | ) | | | (5,502,058 | ) | | | (577,769 | ) | | | (11,738,448 | ) |
| | | | | | | | | | | | | | | | |
Net increase | | | 105,584 | | | $ | 1,767,677 | | | | 362,480 | | | $ | 6,186,867 | |
| | | | | | | | | | | | | | | | |
Class E | | | | | | | | | | | | | | | | |
Sales | | | 8,262 | | | $ | 153,857 | | | | 28,593 | | | $ | 578,068 | |
Reinvestments | | | 128,012 | | | | 2,261,963 | | | | 343,123 | | | | 6,436,983 | |
Redemptions | | | (124,278 | ) | | | (2,264,871 | ) | | | (252,306 | ) | | | (5,132,900 | ) |
| | | | | | | | | | | | | | | | |
Net increase | | | 11,996 | | | $ | 150,949 | | | | 119,410 | | | $ | 1,882,151 | |
| | | | | | | | | | | | | | | | |
Increase derived from capital shares transactions | | | | | | $ | 27,775,208 | | | | | | | $ | 122,384,240 | |
| | | | | | | | | | | | | | | | |
See accompanying notes to financial statements.
MSF-35
Metropolitan Series Fund
Met/Wellington Balanced Portfolio (formerly, WMC Balanced Portfolio)
Financial Highlights
| | | | | | | | | | | | | | | | | | | | | | | | |
| Selected per share data | | | | | | | | | | | | | | | | | | |
| | | Class A | |
| | | Six Months
Ended
June 30,
2016
(Unaudited) | | | Year Ended December 31, | |
| | | | 2015
| | | 2014
| | | 2013
| | | 2012
| | | 2011
| |
Net Asset Value, Beginning of Period | | $ | 18.66 | | | $ | 22.29 | | | $ | 20.59 | | | $ | 17.52 | | | $ | 15.95 | | | $ | 15.72 | |
| | | | | | | | | | | | | | | | | | | | | | | | |
Income (Loss) from Investment Operations | | | | | | | | | | | | | | | | | | | | | | | | |
Net investment income (a) | | | 0.19 | | | | 0.38 | | | | 0.39 | | | | 0.36 | | | | 0.38 | | | | 0.36 | |
Net realized and unrealized gain on investments | | | 0.42 | | | | 0.24 | | | | 1.73 | | | | 3.18 | | | | 1.58 | | | | 0.26 | |
| | | | | | | | | | | | | | | | | | | | | | | | |
Total from investment operations | | | 0.61 | | | | 0.62 | | | | 2.12 | | | | 3.54 | | | | 1.96 | | | | 0.62 | |
| | | | | | | | | | | | | | | | | | | | | | | | |
Less Distributions | | | | | | | | | | | | | | | | | | | | | | | | |
Distributions from net investment income | | | (0.53 | ) | | | (0.45 | ) | | | (0.42 | ) | | | (0.47 | ) | | | (0.39 | ) | | | (0.39 | ) |
Distributions from net realized capital gains | | | (0.89 | ) | | | (3.80 | ) | | | 0.00 | | | | 0.00 | | | | 0.00 | | | | 0.00 | |
| | | | | | | | | | | | | | | | | | | | | | | | |
Total distributions | | | (1.42 | ) | | | (4.25 | ) | | | (0.42 | ) | | | (0.47 | ) | | | (0.39 | ) | | | (0.39 | ) |
| | | | | | | | | | | | | | | | | | | | | | | | |
Net Asset Value, End of Period | | $ | 17.85 | | | $ | 18.66 | | | $ | 22.29 | | | $ | 20.59 | | | $ | 17.52 | | | $ | 15.95 | |
| | | | | | | | | | | | | | | | | | | | | | | | |
Total Return (%) (b) | | | 3.29 | (c) | | | 2.58 | | | | 10.55 | | | | 20.59 | (d) | | | 12.38 | | | | 3.80 | |
| | | | | | |
Ratios/Supplemental Data | | | | | | | | | | | | | | | | | | | | | | | | |
Gross ratio of expenses to average net assets (%) | | | 0.55 | (e) | | | 0.54 | | | | 0.53 | | | | 0.51 | | | | 0.52 | | | | 0.51 | |
Gross ratio of expenses to average net assets excluding interest expense (%) | | | 0.55 | (e) | | | 0.54 | | | | 0.53 | | | | 0.51 | | | | 0.52 | | | | 0.51 | |
Net ratio of expenses to average net assets (%) (f) | | | 0.52 | (e) | | | 0.51 | | | | 0.50 | | | | 0.51 | | | | 0.52 | | | | 0.51 | |
Net ratio of expenses to average net assets excluding interest expense (%) (f) | | | 0.52 | (e) | | | 0.51 | | | | 0.50 | | | | 0.51 | | | | 0.52 | | | | 0.51 | |
Ratio of net investment income to average net assets (%) | | | 2.08 | (e) | | | 1.87 | | | | 1.81 | | | | 1.89 | | | | 2.23 | | | | 2.23 | |
Portfolio turnover rate (%) | | | 202 | (c)(g) | | | 299 | (g) | | | 413 | (g) | | | 340 | (g) | | | 494 | (g) | | | 942 | |
Net assets, end of period (in millions) | | $ | 1,146.0 | | | $ | 1,168.2 | | | $ | 1,250.6 | | | $ | 1,249.1 | | | $ | 1,137.3 | | | $ | 1,126.6 | |
| |
| | | Class B | |
| | | Six Months
Ended
June 30,
2016
(Unaudited) | | | Year Ended December 31, | |
| | | | 2015
| | | 2014
| | | 2013
| | | 2012
| | | 2011
| |
Net Asset Value, Beginning of Period | | $ | 18.54 | | | $ | 22.17 | | | $ | 20.48 | | | $ | 17.43 | | | $ | 15.88 | | | $ | 15.65 | |
| | | | | | | | | | | | | | | | | | | | | | | | |
Income (Loss) from Investment Operations | | | | | | | | | | | | | | | | | | | | | | | | |
Net investment income (a) | | | 0.17 | | | | 0.33 | | | | 0.33 | | | | 0.31 | | | | 0.33 | | | | 0.32 | |
Net realized and unrealized gain on investments | | | 0.42 | | | | 0.23 | | | | 1.73 | | | | 3.16 | | | | 1.57 | | | | 0.26 | |
| | | | | | | | | | | | | | | | | | | | | | | | |
Total from investment operations | | | 0.59 | | | | 0.56 | | | | 2.06 | | | | 3.47 | | | | 1.90 | | | | 0.58 | |
| | | | | | | | | | | | | | | | | | | | | | | | |
Less Distributions | | | | | | | | | | | | | | | | | | | | | | | | |
Distributions from net investment income | | | (0.48 | ) | | | (0.39 | ) | | | (0.37 | ) | | | (0.42 | ) | | | (0.35 | ) | | | (0.35 | ) |
Distributions from net realized capital gains | | | (0.89 | ) | | | (3.80 | ) | | | 0.00 | | | | 0.00 | | | | 0.00 | | | | 0.00 | |
| | | | | | | | | | | | | | | | | | | | | | | | |
Total distributions | | | (1.37 | ) | | | (4.19 | ) | | | (0.37 | ) | | | (0.42 | ) | | | (0.35 | ) | | | (0.35 | ) |
| | | | | | | | | | | | | | | | | | | | | | | | |
Net Asset Value, End of Period | | $ | 17.76 | | | $ | 18.54 | | | $ | 22.17 | | | $ | 20.48 | | | $ | 17.43 | | | $ | 15.88 | |
| | | | | | | | | | | | | | | | | | | | | | | | |
Total Return (%) (b) | | | 3.20 | (c) | | | 2.29 | | | | 10.28 | | | | 20.28 | (d) | | | 12.11 | | | | 3.59 | |
| | | | | | |
Ratios/Supplemental Data | | | | | | | | | | | | | | | | | | | | | | | | |
Gross ratio of expenses to average net assets (%) | | | 0.80 | (e) | | | 0.79 | | | | 0.78 | | | | 0.76 | | | | 0.77 | | | | 0.76 | |
Gross ratio of expenses to average net assets excluding interest expense (%) | | | 0.80 | (e) | | | 0.79 | | | | 0.78 | | | | 0.76 | | | | 0.77 | | | | 0.76 | |
Net ratio of expenses to average net assets (%) (f) | | | 0.77 | (e) | | | 0.76 | | | | 0.75 | | | | 0.76 | | | | 0.77 | | | | 0.76 | |
Net ratio of expenses to average net assets excluding interest expense (%) (f) | | | 0.77 | (e) | | | 0.76 | | | | 0.75 | | | | 0.76 | | | | 0.77 | | | | 0.76 | |
Ratio of net investment income to average net assets (%) | | | 1.83 | (e) | | | 1.62 | | | | 1.56 | | | | 1.64 | | | | 1.98 | | | | 1.98 | |
Portfolio turnover rate (%) | | | 202 | (c)(g) | | | 299 | (g) | | | 413 | (g) | | | 340 | (g) | | | 494 | (g) | | | 942 | |
Net assets, end of period (in millions) | | $ | 65.7 | | | $ | 66.6 | | | $ | 71.6 | | | $ | 75.0 | | | $ | 68.7 | | | $ | 67.8 | |
Please see following page for Financial Highlights footnote legend.
See accompanying notes to financial statements.
MSF-36
Metropolitan Series Fund
Met/Wellington Balanced Portfolio (formerly, WMC Balanced Portfolio)
Financial Highlights
| | | | | | | | | | | | | | | | | | | | | | | | |
| Selected per share data | | | | | | | | | | | | | | | | | | |
| | | Class E | |
| | | Six Months
Ended
June 30,
2016
(Unaudited) | | | Year Ended December 31, | |
| | | | 2015 | | | 2014 | | | 2013 | | | 2012 | | | 2011 | |
Net Asset Value, Beginning of Period | | $ | 18.61 | | | $ | 22.24 | | | $ | 20.54 | | | $ | 17.48 | | | $ | 15.92 | | | $ | 15.70 | |
| | | | | | | | | | | | | | | | | | | | | | | | |
Income (Loss) from Investment Operations | | | | | | | | | | | | | | | | | | | | | | | | |
Net investment income (a) | | | 0.18 | | | | 0.35 | | | | 0.35 | | | | 0.33 | | | | 0.35 | | | | 0.33 | |
Net realized and unrealized gain on investments | | | 0.41 | | | | 0.23 | | | | 1.74 | | | | 3.17 | | | | 1.57 | | | | 0.26 | |
| | | | | | | | | | | | | | | | | | | | | | | | |
Total from investment operations | | | 0.59 | | | | 0.58 | | | | 2.09 | | | | 3.50 | | | | 1.92 | | | | 0.59 | |
| | | | | | | | | | | | | | | | | | | | | | | | |
Less Distributions | | | | | | | | | | | | | | | | | | | | | | | | |
Distributions from net investment income | | | (0.49 | ) | | | (0.41 | ) | | | (0.39 | ) | | | (0.44 | ) | | | (0.36 | ) | | | (0.37 | ) |
Distributions from net realized capital gains | | | (0.89 | ) | | | (3.80 | ) | | | 0.00 | | | | 0.00 | | | | 0.00 | | | | 0.00 | |
| | | | | | | | | | | | | | | | | | | | | | | | |
Total distributions | | | (1.38 | ) | | | (4.21 | ) | | | (0.39 | ) | | | (0.44 | ) | | | (0.36 | ) | | | (0.37 | ) |
| | | | | | | | | | | | | | | | | | | | | | | | |
Net Asset Value, End of Period | | $ | 17.82 | | | $ | 18.61 | | | $ | 22.24 | | | $ | 20.54 | | | $ | 17.48 | | | $ | 15.92 | |
| | | | | | | | | | | | | | | | | | | | | | | | |
Total Return (%) (b) | | | 3.23 | (c) | | | 2.41 | | | | 10.41 | | | | 20.39 | (d) | | | 12.18 | | | | 3.67 | |
| | | | | | |
Ratios/Supplemental Data | | | | | | | | | | | | | | | | | | | | | | | | |
Gross ratio of expenses to average net assets (%) | | | 0.70 | (e) | | | 0.69 | | | | 0.68 | | | | 0.66 | | | | 0.67 | | | | 0.66 | |
Gross ratio of expenses to average net assets excluding interest expense (%) | | | 0.70 | (e) | | | 0.69 | | | | 0.68 | | | | 0.66 | | | | 0.67 | | | | 0.66 | |
Net ratio of expenses to average net assets (%) (f) | | | 0.67 | (e) | | | 0.66 | | | | 0.65 | | | | 0.66 | | | | 0.67 | | | | 0.66 | |
Net ratio of expenses to average net assets excluding interest expense (%) (f) | | | 0.67 | (e) | | | 0.66 | | | | 0.65 | | | | 0.66 | | | | 0.67 | | | | 0.66 | |
Ratio of net investment income to average net assets (%) | | | 1.93 | (e) | | | 1.72 | | | | 1.66 | | | | 1.74 | | | | 2.08 | | | | 2.07 | |
Portfolio turnover rate (%) | | | 202 | (c)(g) | | | 299 | (g) | | | 413 | (g) | | | 340 | (g) | | | 494 | (g) | | | 942 | |
Net assets, end of period (in millions) | | $ | 31.3 | | | $ | 32.4 | | | $ | 36.1 | | | $ | 36.9 | | | $ | 35.0 | | | $ | 35.4 | |
| (a) | Per share amounts based on average shares outstanding during the period. |
| (b) | Total return does not reflect any insurance, sales, separate account or administrative charges of variable annuity or life insurance contracts or any additional expenses that contract owners may bear under their variable contracts. If these charges were included, the returns would be lower. |
| (c) | Periods less than one year are not computed on an annualized basis. |
| (d) | In 2013, 0.04%, 0.04% and 0.04% of the Portfolio’s total return for Class A, Class B and Class E, respectively, consists of a voluntary reimbursement by the subadvisor for a realized loss. Excluding this item, total return would have been 20.55%, 20.24% and 20.35% for Class A, Class B and Class E, respectively. |
| (e) | Computed on an annualized basis. |
| (f) | Includes the effects of management fee waivers (see Note 6 of the Notes to Financial Statements). |
| (g) | Includes mortgage dollar roll and TBA transactions; excluding these transactions the portfolio turnover rates would have been 30%, 71%, 163%, 139% and 243% for the six months ended June 30, 2016 and the years ended December 31, 2015, 2014, 2013 and 2012, respectively. |
See accompanying notes to financial statements.
MSF-37
Metropolitan Series Fund
Met/Wellington Balanced Portfolio (formerly, WMC Balanced Portfolio)
Notes to Financial Statements—June 30, 2016 (Unaudited)
1. Organization
Metropolitan Series Fund (the “Trust”) is organized as a Delaware statutory trust and registered under the Investment Company Act of 1940, as amended (the “1940 Act”), as an open-end management investment company. The Trust, which is managed by MetLife Advisers, LLC (“MetLife Advisers” or the “Adviser”), an affiliate of MetLife, Inc., is currently comprised of thirty series, each of which operates as a distinct investment vehicle of the Trust. The portfolio included in this report is Met/Wellington Balanced Portfolio (formerly, WMC Balanced Portfolio) (the “Portfolio”), which is diversified. Shares in the Portfolio are not offered directly to the general public and are currently available only to separate accounts established by Metropolitan Life Insurance Company (“MetLife”) and other affiliated life insurance companies.
The Portfolio has registered and offers three classes of shares: Class A, B and E shares. Shares of each Class of the Portfolio represent an equal pro rata interest in the Portfolio and generally give the shareholder the same voting, dividend, liquidation, and other rights. Investment income, realized and unrealized capital gains and losses, the common expenses of the Portfolio, and certain Portfolio-level expense reductions, if any, are allocated on a pro rata basis to each Class based on the relative net assets of each Class to the net assets of the Portfolio. Each Class of shares differs in its respective distribution plan and such distribution expenses are allocated to the corresponding Class of shares.
2. Significant Accounting Policies
The preparation of financial statements in conformity with accounting principles generally accepted in the United States of America (“GAAP”) requires management to make estimates and assumptions that affect the reported amounts of assets and liabilities and disclosure of contingent assets and liabilities as of the date of the financial statements and the reported amounts of income and expenses during the reporting period. Actual results could differ from those estimates. In the preparation of these financial statements, management has evaluated events and transactions subsequent to June 30, 2016 through the date the financial statements were issued.
The Portfolio is an investment company and follows the accounting and reporting guidance of the Financial Accounting Standards Board (“FASB”) Accounting Standards Codification Topic 946—Financial Services—Investment Companies and Topic 820—Fair Value Measurement. The following is a summary of significant accounting policies consistently followed by the Portfolio in the preparation of its financial statements.
Investment Valuation and Fair Value Measurements - Debt securities, including corporate, convertible and municipal bonds and notes; obligations of the U.S. Treasury and U.S. government agencies; foreign sovereign issues; and non-U.S. bonds, are generally valued on the basis of evaluated or composite bid quotations obtained from independent pricing services and/or brokers and dealers selected by the Adviser (each a “pricing service”), pursuant to authorization of and subject to general oversight by the Board of Trustees of the Trust (the “Board” or “Trustees”). Such pricing services may use matrix pricing, which considers observable inputs including, among other things, issuer details, maturity dates, interest rates, yield curves, rates of prepayment, credit risks/spreads, default rates, reported trades, broker dealer quotes and quoted prices for similar assets. Short-term obligations with a remaining maturity of sixty days or less may be valued at amortized cost in the absence of market quotes, so long as the amortized cost value of such short-term debt instrument is approximately the same as the fair value of the instrument as determined without the use of amortized cost valuation. Floating rate loans are generally valued on the basis of an evaluated or composite average of aggregate bid and ask quotations supplied by brokers or dealers, as obtained from the pricing service. Securities that use similar valuation techniques and inputs as described above are generally categorized as Level 2 within the fair value hierarchy.
Mortgage and asset-backed securities are generally valued on the basis of evaluated or composite bid quotations obtained from pricing services selected by the Adviser pursuant to authorization of and subject to general oversight by the Board. These securities are usually issued as separate tranches, or classes, of securities within each deal. The pricing models for these securities usually consider tranche-level attributes, current market data, estimated cash flows and market-based yield spreads for each tranche and incorporate deal collateral performance, as available. Mortgage and asset-backed securities that use similar valuation techniques and inputs as described above are generally categorized as Level 2 within the fair value hierarchy.
Domestic and foreign equity securities, such as common stock, exchange-traded funds, rights, warrants, and preferred stock, that are traded on a securities exchange on a valuation date are generally valued at their last quoted sale price or official closing price on the primary exchange for such security, or, if no sales occurred on that day, at the last reported bid price. Equity securities traded over-the-counter (“OTC”) are generally valued at the last reported bid price. In the event of a major exchange closing during the trading day, the Adviser may use other market information obtained from quotation reporting systems, established market makers, or pricing services in valuing the securities. Valuation adjustments may be applied to certain foreign equity securities that are traded solely on foreign exchanges that close before the time as of which the Portfolio determines its NAV to account for the market movement between the close of the foreign exchanges and the time as of which the Portfolio determines its NAV. The Portfolio may use a systematic fair valuation model provided by a pricing service to value securities principally traded in these foreign markets in order to adjust for possible market movements or other changes that may occur between the close of the foreign exchanges and the time as of
MSF-38
Metropolitan Series Fund
Met/Wellington Balanced Portfolio (formerly, WMC Balanced Portfolio)
Notes to Financial Statements—June 30, 2016—(Continued)
which the Portfolio determines its NAV. Foreign equity securities valued using these valuation adjustments are generally categorized as Level 2 within the fair value hierarchy. Equity securities that are actively traded, and have no valuation adjustments applied, are categorized as Level 1 within the fair value hierarchy. Other equity securities traded on inactive markets, or valued in reference to similar instruments traded on active markets, are generally categorized as Level 2 within the fair value hierarchy.
Investments in registered open-end management investment companies are valued at reported net asset value per share on the valuation date and are categorized as Level 1 within the fair value hierarchy.
Foreign currency forward contracts are valued through an independent pricing service by interpolating between forward and spot currency rates in the London foreign exchange markets as of a designated hour on a valuation day. These contracts are generally categorized as Level 2 within the fair value hierarchy.
Options, whether on securities, indices, futures contracts, or otherwise, traded on exchanges are valued at the last sale price available as of the close of business on a valuation day or, if there is no such price available, at the last reported bid price. These types of options are categorized as Level 1 within the fair value hierarchy. Futures contracts that are traded on commodity exchanges are valued at their settlement prices established by the exchanges on which they are traded as of the close of such exchanges and are categorized as Level 1 within the fair value hierarchy.
Options, including swaptions, and futures contracts that are traded OTC are generally valued on the basis of interdealer bid and asked prices or prices provided by pricing service providers who use a series of techniques, including simulation pricing models, to determine the value of the contracts. The pricing models use inputs that are observed from actively quoted markets such as issuer details, indices, spreads, interest rates, yield curves, credit curves, measures of volatility and exchange rates. These contracts are generally categorized as Level 2 within the fair value hierarchy.
Swap contracts (other than centrally cleared swaps) are marked-to-market daily based on quotations and prices supplied by market makers, broker-dealers and other pricing services. Such quotations and prices are derived utilizing observable data, including the underlying reference securities or indices, credit spread quotations and expected default recovery rates determined by the pricing service. These contracts are generally categorized as Level 2 within the fair value hierarchy.
Centrally cleared swaps listed or traded on a multilateral or trade facility platform, such as a registered exchange, are valued at the daily settlement price determined by the respective exchange or a pricing service when the exchange price is not available. For centrally cleared credit default swaps, the clearing facility requires its members to provide actionable price levels across complete term structures. These levels along with external third party prices are used to produce daily settlement prices. These securities are categorized as Level 2 within the fair value hierarchy. Centrally cleared interest rate swaps are valued using a pricing model that references the underlying rates, including the overnight index swap rate and London Interbank Offered Rate (“LIBOR”) forward rate to produce the daily settlement price. These securities are categorized as Level 2 within the fair value hierarchy.
If no current market value quotation or other observable inputs are readily available or market value quotations are deemed to be unreliable for an investment, the fair value of the investment will be determined in accordance with procedures approved by, and under the general supervision of, the Board. In such a circumstance, the Board will be assisted in its responsibility to determine the fair value of an investment by the Valuation Committee (“Committee”) of MetLife Advisers. The Committee provides general pricing oversight and fair value pricing determinations related to portfolio securities and meets on a regular basis to review reports relating to the valuation of the securities in the Portfolio. The Board has delegated to State Street Bank and Trust Company, the Trust’s custodian (“custodian”), the responsibility for calculating the net asset values (“NAVs”) of the Trust’s Portfolios. The Committee is responsible for overseeing the calculation of the NAVs of the Portfolios by the custodian. The Committee also periodically reviews pricing services, including the pricing services providing fair value pricing for the Portfolio’s foreign securities, and is responsible for overseeing the correction of pricing errors and addressing other pricing issues that arise in the ordinary course of business, such as making real-time fair value determinations, as necessary.
No single standard for determining the fair value of an investment can be set forth because fair value depends upon the facts and circumstances with respect to each investment. Information relating to any relevant factors may be obtained by the Committee from any appropriate source, including the subadviser of the Portfolio, the custodian, a pricing service, market maker and/or broker for such security or the issuer. Appropriate methodologies for determining fair value under particular circumstances may include: matrix pricing, a discounted cash flow analysis, comparisons of securities with comparable characteristics, value based on multiples of earnings, discount from market price of similar marketable securities or a combination of these and other methods.
Investment Transactions and Related Investment Income - Portfolio security transactions are recorded on the trade date. Dividend income is recorded on the ex-dividend date or, for certain foreign securities, when notified. Interest income, which includes amortization of premium and accretion of discount on debt securities, is recorded on the accrual basis. Realized gains and losses on investments are determined on the identified cost basis, which is the same basis used for federal income tax purposes. Foreign income and foreign capital gains on some foreign securities may be subject to foreign taxes, which are accrued as applicable. These foreign taxes have been provided for in accordance with the Portfolio’s understanding of the applicable countries’ tax rules and rates.
MSF-39
Metropolitan Series Fund
Met/Wellington Balanced Portfolio (formerly, WMC Balanced Portfolio)
Notes to Financial Statements—June 30, 2016—(Continued)
Foreign Currency Translation - The books and records of the Portfolio are maintained in U.S. dollars. The values of securities, currencies, and other assets and liabilities denominated in currencies other than the U.S. dollar are translated into U.S. dollars based upon foreign exchange rates prevailing at the end of the period. Purchases and sales of investment securities, income, and expenses are translated on the respective dates of such transactions. Because the values of investment securities are translated at the foreign exchange rates prevailing at the end of the period, that portion of the results of operations arising from changes in exchange rates and that portion of the results of operations reflecting fluctuations arising from changes in market prices of the investment securities are not separated. Such fluctuations are included in the net realized and unrealized gain or loss on investments.
Net realized foreign exchange gains or losses arise from activity in forward foreign currency exchange contracts, sales of foreign currency, currency gains or losses realized between the trade and settlement dates on securities transactions, and the difference between the amounts of dividends, interest, and foreign withholding taxes recorded by the Portfolio and the U.S. dollar equivalent of the amounts actually received or paid by the Portfolio. Net unrealized foreign exchange gains and losses arise from changes in the value of assets and liabilities, other than investment securities, resulting from changes in foreign exchange rates.
Dividends and Distributions to Shareholders - The Portfolio records dividends and distributions on the ex-dividend date. Net realized gains from securities transactions (if any) are generally distributed annually to shareholders. The timing and characterization of certain income and capital gains distributions are determined in accordance with federal tax regulations that may differ from GAAP. Permanent book and tax basis differences relating to shareholder distributions will result in reclassification between under/over distributed net investment income, accumulated net realized gains/losses, and paid-in surplus. Book-tax differences are primarily due to foreign currency transactions, paydown gain/loss reclasses, broker commission recapture, amortization and accretion of debt securities, distribution redesignations, real estate investment trust (REIT) adjustments, return of capital adjustments and swap contract transactions. These adjustments have no impact on net assets or the results of operations.
Income Taxes - It is the Portfolio’s policy to comply with the requirements of the Internal Revenue Code of 1986, as amended, and regulations thereunder, applicable to regulated investment companies and to distribute, with respect to each taxable year, all of its taxable income to shareholders. Therefore, no federal income tax provision is required. The Portfolio files U.S. federal tax returns. No income tax returns are currently under examination. The Portfolio’s federal tax returns for the prior three fiscal years remain subject to examination by the Internal Revenue Service. As of June 30, 2016, the Portfolio had no uncertain tax positions that would require financial statement recognition, or de-recognition or disclosure.
Mortgage Dollar Rolls - The Portfolio may enter into mortgage “dollar rolls” in which a Portfolio sells to-be-announced (“TBA”) mortgage-backed securities for delivery in the current month and simultaneously contracts to repurchase substantially similar (same type, coupon, and maturity) securities on a specified future date. For the duration of the transaction, or roll period, the Portfolio foregoes principal (including prepayments of principal) and interest paid on the securities sold. Dollar rolls are accounted for as purchase and sale transactions; gain or loss is recognized at the commencement of the term of the dollar roll and each time the mortgage-backed security is rolled.
Treasury and mortgage dollar roll transactions involve the risk that the market value of the securities that the Portfolio is required to repurchase or reacquire may be less than the agreed-upon repurchase price of those securities and that the investment performance of securities purchased with proceeds from these transactions does not exceed the income, capital appreciation, and gain or loss that would have been realized on the securities transferred or sold, as applicable, as part of the treasury or mortgage dollar roll.
Mortgage-Related and Other Asset-Backed Securities - The Portfolio may invest in mortgage-related or other asset-backed securities. These securities may include mortgage pass-through securities, collateralized mortgage obligations (“CMOs”), commercial mortgage-backed securities, CMO residuals, stripped mortgage-backed securities (“SMBS”), and other securities that directly or indirectly represent a participation in, or are secured by or payable from, mortgage loans on real property or other receivables. The value of some mortgage- or asset-backed securities may be particularly sensitive to changes in prevailing interest rates. Early repayment of principal on some mortgage-related securities may expose the Portfolio to a lower rate of return upon reinvestment of principal. The value of these securities may fluctuate in response to the market’s perception of the creditworthiness of the issuers. Additionally, although mortgages and mortgage-related securities are generally supported by some form of government or private guarantee and/or insurance, there is no assurance that private guarantors or insurers will meet their obligations.
In one type of SMBS, one class receives all of the interest from the mortgage assets (the interest-only or “IO” class), while the other class will receive all of the principal (the principal-only or “PO” class). Because principal will not be received at the maturity of an IO, adjustments are made to the book value of the security until maturity. These adjustments are netted against payments received for the IOs and the net amount is included in interest income on the Statement of Operations of the Portfolio. Payments received for POs are treated as reductions to the cost and par value of the securities. Details of mortgage-related and other asset-backed securities held by the Portfolio are included in the Portfolio’s Schedule of Investments.
The Portfolio may invest a significant portion of its assets in securities of issuers that hold mortgage and asset-backed securities and direct investments in securities backed by commercial and residential mortgage loans and other financial assets. The value and
MSF-40
Metropolitan Series Fund
Met/Wellington Balanced Portfolio (formerly, WMC Balanced Portfolio)
Notes to Financial Statements—June 30, 2016—(Continued)
related income of these securities are sensitive to changes in economic conditions, including delinquencies and/or defaults, and may be negatively impacted by increased volatility of market prices and periods of illiquidity.
TBA Purchase & Forward Sale Commitments - The Portfolio may enter into TBA commitments to purchase or sell securities for a fixed price at a future date. TBA commitments are considered securities in themselves, and involve a risk of loss if the value of the security to be purchased or sold declines or increases prior to settlement date, which is in addition to the risk of decline in the value of the Portfolio’s other assets. TBA forward sale commitments are valued at the current market value of the underlying securities, according to the procedures described under “Investment Valuation and Fair Value Measurements”.
When-Issued and Delayed-Delivery Securities - The Portfolio may purchase securities on a when-issued or delayed-delivery basis. Settlement of such transactions normally occurs within a month or more after the purchase commitment is made. The Portfolio may purchase securities under such conditions only with the intention of actually acquiring them, but may enter into a separate agreement to sell the securities before the settlement date. Since the value of securities purchased may fluctuate prior to settlement, the Portfolio may be required to pay more at settlement than the security is worth. In addition, the purchaser is not entitled to any of the interest earned prior to settlement.
Upon making a commitment to purchase a security on a when-issued or delayed-delivery basis, the Portfolio will hold liquid assets in a segregated account with the Portfolio’s custodian, or set aside liquid assets in the Portfolio’s records, worth at least the equivalent of the amount due. The liquid assets will be monitored on a daily basis and adjusted as necessary to maintain the necessary value.
High Yield Debt Securities - The Portfolio may invest in high yield debt securities, or “junk bonds,” which are securities that are rated below “investment grade” or, if not rated, are of equivalent quality. A portfolio with high yield debt securities generally will be exposed to greater market risk and credit risk than a portfolio that invests only in investment grade debt securities because issuers of high yield debt securities are generally less secure financially, are more likely to default on their obligations, and their securities are more sensitive to interest rate changes and downturns in the economy. In addition, the secondary market for lower-rated debt securities may not be as liquid as that for more highly rated debt securities. As a result, the Portfolio’s Subadviser may find it more difficult to value lower-rated debt securities or sell them and may have to sell them at prices significantly lower than the values assigned to them by the Portfolio.
Floating Rate Loans - The Portfolio may invest in loans arranged through private negotiation between one or more financial institutions. The Portfolio’s investment in any such loan may be in the form of a participation in or an assignment of the loan. In connection with purchasing participations, the Portfolio generally will have no right to enforce compliance by the borrower with the terms of the loan agreement relating to the loan, nor any rights of set-off against the borrower. The Portfolio may not benefit directly from any collateral supporting the loan in which it has purchased the participation or assignment. The purchase of assignments will typically result in the Portfolio having a direct contractual relationship with the borrower, and the Portfolio may enforce compliance by the borrower with the terms of the loan agreement.
The Portfolio may invest in multiple series or tranches of a loan, which may have varying terms and carry different associated risks. When the Portfolio purchases assignments it acquires direct rights against the borrower of the loan. These loans may include participations in bridge loans, which are loans taken out by borrowers for a short period (typically less than one year) pending arrangement of more permanent financing.
The Portfolio will assume the credit risk of both the borrower and the lender that is selling the participation. In the event of the insolvency of the lender selling the participation, the Portfolio may be treated as a general creditor of the lender and may not benefit from any set-off between the lender and the borrower.
Directed Brokerage Agreement - The Trust has entered into a directed brokerage arrangement with State Street Global Markets (“SSGM”). Under this arrangement, the Portfolio directs certain trades to SSGM in return for a recapture credit. SSGM issues a cash rebate to the Portfolio. Amounts paid to the Portfolio are shown separately as broker commission recapture on the Statement of Operations of the Portfolio. Additionally, these amounts have been excluded from the calculation of the net ratio of expenses to average net assets presented in the Financial Highlights for each share class.
Repurchase Agreements - The Portfolio may enter into repurchase agreements, under the terms of a Master Repurchase Agreement (“MRA”), with selected commercial banks and broker-dealers, under which the Portfolio acquires securities as collateral and agrees to resell the securities at an agreed-upon time and at an agreed-upon price. The Portfolio, through the custodian or a subcustodian, under a tri-party repurchase agreement, receives delivery of the underlying securities collateralizing any repurchase agreements. It is the Portfolio’s policy that the market value of the collateral be equal to at least 100% of the repurchase price in the case of a repurchase agreement of one-day duration and equal to at least 102% of the repurchase price in the case of all other repurchase agreements. In the event of default or failure by a party to perform an obligation in connection with any repurchase transaction, the MRA gives the non-defaulting party the right to set-off claims and to apply property held by it in connection with any repurchase transaction against obligations owed to it.
MSF-41
Metropolitan Series Fund
Met/Wellington Balanced Portfolio (formerly, WMC Balanced Portfolio)
Notes to Financial Statements—June 30, 2016—(Continued)
At June 30, 2016, the Portfolio had investments in repurchase agreements with a gross value of $42,163,711, which is included as part of investments at value on the Statement of Assets and Liabilities. The value of the related collateral exceeded the value of the repurchase agreements at June 30, 2016.
Securities Lending - The Portfolio may lend its portfolio securities to certain qualified brokers who borrow securities in order to complete certain securities transactions. By lending its portfolio securities, the Portfolio attempts to increase its net investment income through the receipt of income on collateral held from securities on loan. Any gain or loss in the market price of the loaned securities that might occur and any interest earned or dividends declared during the term of the loan would accrue to the account of the Portfolio.
The Trust has entered into a Securities Lending Authorization Agreement with the custodian as the lending agent. Under this agreement, the custodian is authorized to loan portfolio securities on the Portfolio’s behalf. In exchange, the Portfolio receives either cash or securities as collateral against the loaned securities. The Portfolio receives collateral equal to at least 102% of the market value of the loaned securities (105% for foreign equity securities), at each loan’s inception. Collateral representing at least 100% of the market value of the loaned securities must be maintained for the duration of the loan. Cash collateral is generally invested in the State Street Navigator Securities Lending MET Portfolio (the “Navigator Portfolio”), a series of the State Street Navigator Securities Lending Trust that is managed by an affiliate of the custodian. The Navigator Portfolio is a registered money market fund that invests in a variety of high-quality, U.S. dollar-denominated instruments. If the market value of the collateral at the close of trading on a business day is less than 100% of the market value of the loaned securities at the close of trading on that day, the borrower shall be required to deliver, by the close of business on the following business day, an additional amount of collateral, so that the total amount of posted collateral is equal to at least 100% of the market value of all the loaned securities as of such preceding day. A portion of net income (income after the deduction of expenses and fees of the Navigator Portfolio) on the collateral is rebated to the borrower of the securities and the remainder is split between the custodian and the Portfolio. On loans collateralized by U.S. Treasuries, a fee is received from the borrower and is allocated between the Portfolio and the custodian. Income received by the Portfolio in securities lending transactions during the six months ended June 30, 2016 is reflected as Securities lending income on the Statement of Operations. The values of any securities loaned by the Portfolio and the related collateral at June 30, 2016 are disclosed in the footnotes to the Schedule of Investments. The value of the related collateral received by the Portfolio exceeded the value of the securities out on loan at June 30, 2016.
The risks associated with lending portfolio securities include, but are not limited to, possible delays in receiving additional collateral or in the recovery of the loaned securities, possible loss of rights in the collateral should the borrower fail financially, as well as risk of loss in the value of the collateral or the value of the investments made with the collateral. The lending agent shall indemnify the Portfolio in the case of default of any securities borrower.
Reverse Repurchase Agreements - The Portfolio may enter into reverse repurchase agreements with qualified institutions. In a reverse repurchase agreement, the Portfolio transfers securities in exchange for cash to a financial institution or counterparty, concurrently with an agreement by the Portfolio to re-acquire the same securities at an agreed upon price and date. During the reverse repurchase agreement period, the Portfolio continues to receive principal and interest payments on these securities. The Portfolio will establish a segregated account with its custodian in which it will maintain liquid assets equal in value to its obligations in respect of reverse repurchase agreements. Reverse repurchase agreements involve the risk that the market value of the securities transferred by the Portfolio may decline below the agreed-upon reacquisition price of the securities. In the event of default or failure by a party to perform an obligation in connection with any reverse repurchase transaction, the MRA entitles the non-defaulting party with a right to set-off claims and apply property held by it in respect of any reverse repurchase transaction against obligations owed to it. Cash received in exchange for securities transferred under reverse repurchase agreements plus accrued interest payments to be made by the Portfolio to counterparties are reflected as Reverse repurchase agreements on the Statement of Assets and Liabilities.
Secured Borrowing Transactions - The Portfolio may enter into transactions consisting of a transfer of a security by the Portfolio to a financial institution or counterparty, with a simultaneous agreement to reacquire the same, or substantially the same security, at an agreed-upon price and future settlement date. Such transactions are treated as secured borrowings, and not as purchases and sales. The Portfolio receives cash from the transfer of the security to use for other investment purposes. During the six months ended June 30, 2016, the Portfolio held a U.S. Treasury security purchased through secured borrowing transactions. During the term of the borrowing, the Portfolio is not entitled to receive principal and interest payments, if any, made on the security transferred to the counterparty during the term of the agreement. The difference between the transfer price and the reacquisition price, known as the “price drop”, is included in net investment income with the cost of the secured borrowing transaction being recorded as interest expense over the term of the borrowing.
MSF-42
Metropolitan Series Fund
Met/Wellington Balanced Portfolio (formerly, WMC Balanced Portfolio)
Notes to Financial Statements—June 30, 2016—(Continued)
The following table provides a breakdown of the collateral received and the remaining contractual maturities for securities lending transactions, which are accounted for as secured borrowings.
| | | | | | | | | | | | | | | | | | | | |
| | | Remaining Contractual Maturity of the Agreements
As of June 30, 2016 | |
| | | Overnight and
Continuous | | | Up to
30 Days | | | 31 - 90
Days | | | Greater than
90 days | | | Total | |
| Securities Lending Transactions | | | | | | | | | | | | | | | | | | | | |
Common Stocks | | $ | (47,860,188 | ) | | $ | — | | | $ | — | | | $ | — | | | $ | (47,860,188 | ) |
Corporate Bonds & Notes | | | (5,809,257 | ) | | | — | | | | — | | | | — | | | | (5,809,257 | ) |
Total | | $ | (53,669,445 | ) | | $ | — | | | $ | — | | | $ | — | | | $ | (53,669,445 | ) |
Total Borrowings | | $ | (53,669,445 | ) | | $ | — | | | $ | — | | | $ | — | | | $ | (53,669,445 | ) |
Gross amount of recognized liabilities for securities lending transactions | | | $ | (53,669,445 | ) |
| | | | | | | | | | | | | | | | | | | | |
3. Investments in Derivative Instruments
Forward Foreign Currency Exchange Contracts - The Portfolio may enter into forward foreign currency exchange contracts to obtain investment exposure, enhance return or hedge or protect its portfolio holdings against the risk of future movements in certain foreign currency exchange rates. When entering into these contracts, the Portfolio agrees to receive or deliver a fixed quantity of foreign currency for an agreed-upon price on an agreed-upon future date. These contracts are valued daily and the Portfolio’s net equity therein, representing unrealized gain or loss on the contracts as measured by the difference between the forward foreign exchange rates at the dates of entry into the contracts and the forward foreign exchange rates at the valuation date, is included in the Statement of Assets and Liabilities. When a contract is closed, the Portfolio recognizes a realized gain or loss equal to the difference between the value of the contract at the time it was opened and the value at the time it was closed.
Realized and unrealized gains and losses on forward foreign currency exchange contracts are included in the Statement of Operations. These contracts involve market and/or credit risk in excess of the amount recognized in the Statement of Assets and Liabilities. The use of forward foreign currency exchange contracts does not eliminate fluctuations in the underlying prices of the securities of the Portfolio, but it does establish a rate of exchange that can be achieved in the future. Although forward foreign currency exchange contracts may limit the risk of loss due to a decline in the value of the currency holdings, they also limit any potential gain that might result should the value of the currency increase. In addition, the Portfolio could be exposed to losses if the counterparties to the contracts are unable to meet the terms of the contracts. The Portfolio may also experience losses even when such contracts are used for hedging purposes. The Portfolio’s maximum potential loss from such contracts is the aggregate face value in U.S. dollars at the time the contract was opened.
Futures Contracts - The Portfolio may buy and sell futures contracts as a hedge, to maintain investment exposure to a target asset class or to enhance return. The Portfolio may be subject to fluctuations in equity prices, interest rates, commodity prices, and foreign currency exchange rates in the normal course of pursuing its investment objective. Futures contracts are standardized agreements to buy or sell a security, or deliver a final cash settlement price in connection with an index, interest rate, currency, or other asset. The Portfolio must deposit an amount (“initial margin”) equal to a certain percentage of the face value of the futures contract. The initial margin may be in the form of cash or securities, which is returned when the Portfolio’s obligations under the contract have been satisfied. If cash is deposited as the initial margin, it is shown as cash collateral on the Statement of Assets and Liabilities. Futures contracts are marked-to-market daily, and subsequent payments (“variation margin”) are made or received by the Portfolio depending on whether unrealized gains or losses are incurred. These amounts are reflected as receivables or payables on the Statement of Assets and Liabilities and as a component of net change in unrealized appreciation/depreciation on the Statement of Operations. When the contract is closed or expires, the Portfolio records a realized gain or loss equal to the difference between the value of the contract at the time it was opened and the value at the time it was closed. Risks of entering into futures contracts (and related options) include the possibility that the market for these instruments may be illiquid and that a change in the value of the contract or option may not correlate perfectly with changes in the value of the underlying instrument. If futures contracts are exchange-traded, the exchange’s clearinghouse, as counterparty to all exchange-traded futures, guarantees the futures contracts against default. For OTC futures, the Portfolio’s ability to terminate the positions may be more limited than in the case of exchange-traded positions and may also involve the risk that securities dealers participating in such transactions would fail to meet their obligations to the Portfolio.
Options Contracts - An option contract purchased by the Portfolio gives the Portfolio the right, but not the obligation, to buy (call) or sell (put) an underlying instrument at a fixed exercise price during a specified period. Call options written by the Portfolio give the holder the right to buy the underlying instrument from the Portfolio at a fixed exercise price; put options written by the Portfolio give the holder the right to sell the underlying instrument to the Portfolio at a fixed exercise price.
The Portfolio may use options to hedge against changes in values of securities the Portfolio owns or expects to purchase, to maintain investment exposure to a target asset class or to enhance return. Writing puts or buying calls tends to increase the Portfolio’s exposure
MSF-43
Metropolitan Series Fund
Met/Wellington Balanced Portfolio (formerly, WMC Balanced Portfolio)
Notes to Financial Statements—June 30, 2016—(Continued)
to the underlying instrument and writing calls or buying puts tends to decrease the Portfolio’s exposure to the underlying instrument, and can be used to hedge other Portfolio investments. For options used to hedge the Portfolio’s investments, the potential risk to the Portfolio is that the change in value of options contracts may not correspond perfectly to the change in value of the hedged instruments. The Portfolio also bears the risk of an unfavorable change in the value of the underlying instrument or the risk that the Portfolio may not be able to enter into a closing transaction due to an illiquid market. The Portfolio’s maximum risk of loss from counterparty credit risk, as opposed to investment and other types of risk, in respect of purchased options is typically the premium initially paid for the option plus any unrealized gains.
The main risk associated with purchasing an option is that the option expires without being exercised. In this case, the option is worthless when it expires and the premium paid for the option is considered a realized loss. The risk associated with writing a call option is that the Portfolio may forgo the opportunity for a profit if the market value of the underlying instrument increases and the option is exercised, requiring the Portfolio to sell the underlying instrument at a price below its market value. When the Portfolio writes a call option on a security it does not own, its exposure on such an option is theoretically unlimited. The risk in writing a put option is that the Portfolio may incur a loss if the market value of the underlying instrument decreases and the option is exercised, requiring the Portfolio to purchase the underlying instrument at a price above its market value. In addition, the Portfolio risks not being able to enter into a closing transaction for the written option as the result of an illiquid market for the option.
Purchases of put and call options are recorded as investments, the value of which are marked-to-market daily. When the Portfolio enters into a closing sale transaction, the Portfolio will realize a gain or loss depending on whether the sales proceeds from the closing sale transaction are greater or less than the premium initially paid for the option. When the Portfolio exercises a put option, it will realize a gain or loss from the sale of the underlying instrument and the proceeds from such sale will be decreased by the premium originally paid for the put option. When the Portfolio exercises a call option, the cost of the security which the Portfolio purchases upon exercise will be increased by the premium originally paid for the call option.
The premium received by the Portfolio for a written option is recorded as an asset and an equivalent liability. The liability is subsequently marked to market to reflect the current value of the option written. When a written option expires without being exercised or the Portfolio enters into a closing purchase transaction, the Portfolio realizes a gain (or loss if the cost of the closing purchase transaction exceeds the premium received when the option was sold) without regard to any unrealized gain or loss on the underlying instrument and the liability related to such option is eliminated. When a written call option is exercised, the Portfolio realizes a gain or loss, as adjusted for the premium received, from the sale of the underlying instrument. When a written put option is exercised, the premium received by the Portfolio is offset against the amount paid for the purchase of the underlying instrument.
The purpose of inflation-capped options is to protect the buyer from inflation, above a specified rate, eroding the value of investments in inflation-linked products with a given notional exposure. Inflation-capped options are used to give downside protection to investments in inflation-linked products by establishing a floor on the value of such products.
Options on swaps (“swaptions”) are similar to options on securities except that instead of selling or purchasing the right to buy or sell a security, the writer or purchaser of the swaptions is granting or buying the right to enter into a previously agreed upon interest rate or credit default swap agreement (interest rate risk and/or credit risk) at any time before the expiration of the option.
Swap Agreements - The Portfolio may enter into swap agreements in which the Portfolio and a counterparty agree to either make periodic net payments on a specified notional amount or net payment upon termination. Swap agreements are either privately negotiated in the OTC market (“OTC swaps”) or executed in a multilateral or other trade facility platform, such as a registered commodities exchange (“centrally-cleared swaps”). The Portfolio may enter into swap agreements for the purposes of managing exposure to interest rate, credit or market risk, or for other purposes. In connection with these agreements, securities or cash may be paid or received, as applicable, by the Portfolio as collateral or margin in accordance with the terms of the respective swap agreements to provide assets of value and recourse in the event of default or bankruptcy/insolvency. Securities posted by the Portfolio as collateral for swap contracts are identified in the Schedule of Investments and restricted cash, if any, is reflected on the Statement of Assets and Liabilities.
Centrally Cleared Swaps: Clearinghouses currently offer clearing derivative transactions which include interest rate and credit derivatives. In a cleared derivative transaction, a Portfolio typically enters into the transaction with a financial institution counterparty, and performance of the transaction is effectively guaranteed by a central clearinghouse, thereby reducing or eliminating the Portfolio’s exposure to the credit risk of the original counterparty. The Portfolio typically will be required to post specified levels of margin with the clearinghouse or at the instruction of the clearinghouse; the margin required by a clearinghouse may be greater than the margin the Portfolio would be required to post in an uncleared derivative transaction.
Swap agreements are marked-to-market daily. The fair value of an OTC swap is reflected on the Statement of Assets and Liabilities. The changes in value, if any, are reflected as a component of net change in unrealized appreciation/depreciation on the Statement of Operations. Daily changes in valuation of centrally cleared swaps, if any, are recorded as a receivable or payable for variation margin on the Statement of Assets and Liabilities and as a component of unrealized appreciation/depreciation on the Statement of
MSF-44
Metropolitan Series Fund
Met/Wellington Balanced Portfolio (formerly, WMC Balanced Portfolio)
Notes to Financial Statements—June 30, 2016—(Continued)
Operations. Upfront payments paid or received upon entering into the swap agreement compensate for differences between the stated terms of the swap agreement and prevailing market conditions (such as credit spreads, currency exchange rates, interest rates, and other relevant factors). Upon termination or maturity of the swap, upfront premiums are recorded as realized gains or losses on the Statement of Operations. A liquidation payment received or made at the termination of the swap is recorded as realized gain or loss on the Statement of Operations. Net periodic payments received or paid by the Portfolio are included as part of realized gains or losses on the Statement of Operations.
Swap transactions involve, to varying degrees, elements of interest rate, credit, and market risk in excess of the amounts recognized in the Statement of Assets and Liabilities. Such risks involve the possibility that there will be no liquid market for these agreements, that the counterparty to the agreements may default on its obligation to perform, or that there may be unfavorable changes in market conditions or interest rates. In addition, entering into swap agreements involves documentation risk resulting from the possibility that the parties to a swap agreement may disagree as to the meaning of contractual terms in the agreement. The Portfolio may enter into swap transactions with counterparties in accordance with guidelines established by the Board. These guidelines provide for a minimum credit rating for each counterparty and various credit enhancement techniques (for example, collateralization of amounts due from counterparties) to limit exposure to counterparties that have lower credit ratings. A Portfolio’s maximum risk of loss from counterparty credit risk is the discounted value of the net cash flows to be received from the counterparty over the contract’s remaining life, to the extent that amount is positive, or the fair value of the contract. The risk may be mitigated by having a master netting arrangement between the Portfolio and the counterparty and by the posting of collateral by the counterparty to cover the Portfolio’s exposure to the counterparty. Counterparty risk related to centrally-cleared swaps is mitigated due to the protection against defaults provided by the exchange on which these contracts trade.
Credit Default Swaps: The Portfolio is subject to credit risk in the normal course of pursuing its investment objectives. The Portfolio may enter into credit default swaps to manage its exposure to the market or certain sectors of the market, to reduce its risk exposure to defaults of corporate and/or sovereign issuers, or to create exposure to corporate and/or sovereign issuers to which they are not otherwise exposed. Credit default swaps involve one party making a stream of payments (referred to as the buyer of protection) to another party (the seller of protection) in exchange for the right to receive a specified return if a credit event occurs for the referenced entity, obligation or index. A credit event is defined under the terms of each swap agreement and may include, but is not limited to, underlying entity default, bankruptcy, write-down, principal shortfall or interest shortfall. As the seller of protection, if an underlying credit event occurs, the Portfolio will either pay the buyer an amount equal to the notional amount of the swap and take delivery of the referenced obligation (or underlying securities comprising the referenced index), or pay a net settlement amount in the form of cash or securities equal to the notional amount of the swap less the recovery value of the referenced obligation (or underlying securities comprising the referenced index). In return, the Portfolio would receive from the counterparty an upfront or periodic stream of payments throughout the life of the credit default swap agreement provided that no credit event has occurred. As the seller of protection, the Portfolio will effectively add leverage to its portfolio because, in addition to its total net assets, the Portfolio would be subject to investment exposure on the notional amount of the credit default swap.
The Portfolio may also purchase credit default swap contracts in order to hedge against the risk of default of debt securities held in its portfolio. This would involve the risk that the investment may be worthless when it expires and would only generate income in the event of an actual default by the issuer of the underlying obligation (as opposed to a credit downgrade or other indication of financial instability). It would also involve credit risk, whereby the seller may fail to satisfy its payment obligations to the Portfolio in the event of a default. As the buyer of protection, if an underlying credit event occurs, the Portfolio will either receive from the seller of protection an amount equal to the notional amount of the swap and deliver the referenced obligation (or underlying securities comprising the referenced index), or receive a net settlement amount in the form of cash or securities equal to the notional amount of the swap less the recovery value of the referenced obligation (or underlying securities comprising the referenced index). If no credit event occurs and the Portfolio is a buyer of protection, the Portfolio will typically recover nothing under the credit default swap agreement, but it will have had to pay the required upfront payment or stream of continuing payments under the credit default swap agreement. Recovery values are at times established through the credit event auction process in which market participants are ensured that a transparent price has been set for the defaulted obligation.
Credit default swap agreements on credit indices involve one party making a stream of payments to another party in exchange for the right to receive a specified return in the event of a write-down, principal shortfall, interest shortfall or default of all or part of the referenced entities comprising the credit index. A credit index is a basket of credit instruments or exposures designed to be representative of some part of the credit market as a whole. An index credit default swap references all the names in the index, and if there is a credit event involving an entity in the index, the credit event is settled based on that entity’s weight in the index. A Portfolio may use credit default swaps on credit indices as a hedge for credit default swaps or bonds held in the portfolio, which is less expensive than it would be to buy many individual credit default swaps to achieve similar effect. Credit default swaps on indices are benchmarks for protecting investors owning bonds against default, and may be used to speculate on changes in credit quality.
Implied credit spreads, represented in absolute terms, utilized in determining the market value of credit default swap agreements on a credit index or corporate or sovereign issuer, serve as some indication of the status of the payment/performance risk and the likelihood
MSF-45
Metropolitan Series Fund
Met/Wellington Balanced Portfolio (formerly, WMC Balanced Portfolio)
Notes to Financial Statements—June 30, 2016—(Continued)
or risk of default for the credit derivative. The implied credit spread of a particular referenced entity or index also reflects the cost of buying/selling protection and may reflect upfront payments required to be made to enter into the agreement. Wider credit spreads generally represent a deterioration of the referenced entity’s credit soundness and a greater likelihood or risk of default or other credit event occurring as defined under the terms of the particular swap agreement. When no implied credit spread is available for a credit default swap, the current unrealized appreciation/depreciation on the position may be used as an indicator of the current status of the payment/performance risk.
The maximum potential amount of future payments (undiscounted) that the Portfolio as a seller of protection could be required to make under a credit default swap agreement would be an amount equal to the notional amount of the agreement. Notional amounts of all credit default swap agreements outstanding as of June 30, 2016, for which the Portfolio is the seller of protection, are disclosed in the Schedule of Investments. These potential amounts would be partially offset by any recovery values of the respective referenced obligations, upfront payments received upon entering into the agreement or net amounts received from the settlement of buy protection credit default swap agreements entered into by the Portfolio for the same referenced entity or entities.
Interest Rate Swaps: The Portfolio may enter into interest rate swaps to manage its exposure to interest rates or to protect against currency fluctuations, to adjust the interest rate sensitivity (duration), to preserve a return or spread on a particular investment, or otherwise as a substitute for a direct investment in debt securities. The Portfolio is subject to interest rate risk exposure in the normal course of pursuing its investment objectives. Because the Portfolio holds fixed rate bonds, the value of these bonds may decrease if interest rates rise. To help hedge against this risk and to maintain its ability to generate income at prevailing market rates, the Portfolio may enter into interest rate swap agreements. Interest rate swaps are agreements in which one party pays a stream of interest payments, either fixed or floating rate, for another party’s stream of interest payments, either fixed or floating, on the same notional amount for a specified period of time. Other forms of interest rate swap agreements may include: (1) interest rate caps, under which, in return for a premium, one party agrees to make payments to the other to the extent that interest rates exceed a specified rate, or “cap”; (2) interest rate floors, under which, in return for a premium, one party agrees to make payments to the other to the extent that interest rates fall below a specified rate, or “floor”; and (3) interest rate collars, under which a party sells a cap and purchases a floor or vice versa in an attempt to protect itself against interest rate movements exceeding given minimum or maximum levels. The Portfolio’s maximum risk of loss from counterparty credit risk, as opposed to investment and other types of risk, in respect of interest rate swaps is typically the discounted net value of the cash flows to be received from the counterparty over the contract’s remaining life, to the extent that amount is positive.
Spreadlock Swap Contracts - The Portfolio may invest in spreadlock swap contracts. These contracts involve commitments to pay or receive a settlement amount calculated as the spread difference between two interest rate curves and a fixed spread at a specific forward date determined at the beginning of the contract. Settlement amounts paid or received are recorded as a realized gain or loss on the Statements of Operations at the determination date.
The following table summarizes the fair value of derivatives held by the Portfolio at June 30, 2016 by category of risk exposure:
| | | | | | | | | | | | |
| | | Asset Derivatives | | | Liability Derivatives | |
Risk Exposure | | Statement of Assets &
Liabilities Location | | Fair Value | | | Statement of Assets &
Liabilities Location | | Fair Value | |
| Interest Rate | | | | | | | | OTC swap contracts at market value (a) | | $ | 586,166 | |
| | | | | | | | Unrealized depreciation on centrally cleared swap contracts (b) (c) | | | 221,100 | |
| | Unrealized appreciation on futures contracts (b) (d) | | $ | 2,891,109 | | | Unrealized depreciation on futures contracts (b) (d) | | | 812,415 | |
| Credit | | OTC swap contracts at market value (a) | | | 3,973,950 | | | OTC swap contracts at market value (a) | | | 3,705,394 | |
| | | | | | | | Unrealized depreciation on centrally cleared swap contracts (b) (c) | | | 453,374 | |
| | | | | | | | Written options at value | | | 133,800 | |
| Equity | | Unrealized appreciation on futures contracts (b) (d) | | | 163,334 | | | | | | | |
| Foreign Exchange | | Unrealized appreciation on forward foreign currency exchange contracts | | | 229,211 | | | Unrealized depreciation on forward foreign currency exchange contracts | | | 702,167 | |
| | | | | | | | | | | | |
| Total | | | | $ | 7,257,604 | | | | | $ | 6,614,416 | |
| | | | | | | | | | | | |
| | (a) | Excludes OTC swap interest receivable of $13,642 and OTC swap interest payable of $11,199. |
| | (b) | Financial instrument not subject to a master netting agreement. |
| | (c) | Represents the unrealized appreciation/depreciation of centrally cleared swaps as reported in the Schedule of Investments. Only the variation margin is reported within the Statement of Assets and Liabilities. |
| | (d) | Includes cumulative appreciation/depreciation of futures contracts as reported in the Schedule of Investments. Only the current day’s variation margin is reported within the Statement of Assets and Liabilities. |
MSF-46
Metropolitan Series Fund
Met/Wellington Balanced Portfolio (formerly, WMC Balanced Portfolio)
Notes to Financial Statements—June 30, 2016—(Continued)
The Portfolio is required to disclose the impact of offsetting assets and liabilities represented in the Statement of Assets and Liabilities to enable users of the financial statements to evaluate the effect or potential effect of netting arrangements on its financial position for recognized assets and liabilities.
The following table presents the Portfolio’s derivative assets by counterparty net of amounts available for offset under a master netting agreement (“MNA”)(see Note 4), or similar agreement, and net of the related collateral received by the Portfolio as of June 30, 2016.
| | | | | | | | | | | | | | | | |
Counterparty | | Derivative Assets
subject to an MNA
by Counterparty | | | Financial
Instruments
available for offset | | | Collateral
Received† | | | Net
Amount* | |
Bank of America N.A. | | $ | 340,977 | | | $ | (340,977 | ) | | $ | — | | | $ | — | |
Bank of Montreal | | | 1,214 | | | | — | | | | — | | | | 1,214 | |
Barclays Bank plc | | | 814,296 | | | | (549,363 | ) | | | (264,933 | ) | | | — | |
Citibank N.A. | | | 3,974 | | | | (3,974 | ) | | | — | | | | — | |
Credit Agricole S.A. | | | 20,832 | | | | (19,800 | ) | | | — | | | | 1,032 | |
Credit Suisse International | | | 1,222,281 | | | | (1,202,730 | ) | | | (19,551 | ) | | | — | |
Deutsche Bank AG | | | 82,442 | | | | (35,082 | ) | | | — | | | | 47,360 | |
Goldman Sachs International | | | 930,303 | | | | (930,303 | ) | | | — | | | | — | |
JPMorgan Chase Bank N.A. | | | 255,291 | | | | (185,873 | ) | | | (69,418 | ) | | | — | |
Morgan Stanley & Co. International plc | | | 467,045 | | | | (467,045 | ) | | | — | | | | — | |
Royal Bank of Canada | | | 53,801 | | | | — | | | | — | | | | 53,801 | |
UBS AG | | | 10,705 | | | | (7,026 | ) | | | — | | | | 3,679 | |
| | | | | | | | | | | | | | | | |
| | $ | 4,203,161 | | | $ | (3,742,173 | ) | | $ | (353,902 | ) | | $ | 107,086 | |
| | | | | | | | | | | | | | | | |
The following table presents the Portfolio’s derivative liabilities by counterparty net of amounts available for offset under an MNA, or similar agreement, and net of the related collateral pledged by the Portfolio as of June 30, 2016.
| | | | | | | | | | | | | | | | |
Counterparty | | Derivative Liabilities
subject to an MNA
by Counterparty | | | Financial
Instruments
available for offset | | | Collateral
Pledged† | | | Net
Amount** | |
Bank of America N.A. | | $ | 901,544 | | | $ | (340,977 | ) | | $ | (528,486 | ) | | $ | 32,081 | |
Barclays Bank plc | | | 549,363 | | | | (549,363 | ) | | | — | | | | — | |
BNP Paribas S.A. | | | 47,987 | | | | — | | | | — | | | | 47,987 | |
Citibank N.A. | | | 5,559 | | | | (3,974 | ) | | | — | | | | 1,585 | |
Credit Agricole S.A. | | | 19,800 | | | | (19,800 | ) | | | — | | | | — | |
Credit Suisse International | | | 1,202,730 | | | | (1,202,730 | ) | | | — | | | | — | |
Deutsche Bank AG | | | 35,082 | | | | (35,082 | ) | | | — | | | | — | |
Goldman Sachs International | | | 1,307,428 | | | | (930,303 | ) | | | (255,007 | ) | | | 122,118 | |
HSBC Bank USA | | | 10,672 | | | | — | | | | — | | | | 10,672 | |
JPMorgan Chase Bank N.A. | | | 185,873 | | | | (185,873 | ) | | | — | | | | — | |
Morgan Stanley & Co. International plc | | | 839,559 | | | | (467,045 | ) | | | (369,139 | ) | | | 3,375 | |
Standard Chartered Bank | | | 6,188 | | | | — | | | | — | | | | 6,188 | |
State Street Bank and Trust | | | 8,716 | | | | — | | | | — | | | | 8,716 | |
UBS AG | | | 7,026 | | | | (7,026 | ) | | | — | | | | — | |
| | | | | | | | | | | | | | | | |
| | $ | 5,127,527 | | | $ | (3,742,173 | ) | | $ | (1,152,632 | ) | | $ | 232,722 | |
| | | | | | | | | | | | | | | | |
| | * | Net amount represents the net amount receivable from the counterparty in the event of default. |
| | ** | Net amount represents the net amount payable due to the counterparty in the event of default. |
| | † | In some instances, the actual collateral received and/or pledged may be more than the amount shown here due to overcollateralization. |
The following tables summarize the effect of derivative instruments on the Statement of Operations, classified by derivative type and category of risk exposure, for the six months ended June 30, 2016:
| | | | | | | | | | | | | | | | | | | | |
Statement of Operations Location—Net Realized Gain (Loss) | | Interest Rate | | | Credit | | | Equity | | | Foreign
Exchange | | | Total | |
Investments (a) | | $ | — | | | $ | — | | | $ | — | | | $ | 40,756 | | | $ | 40,756 | |
Forward foreign currency transactions | | | — | | | | — | | | | — | | | | (242,592 | ) | | | (242,592 | ) |
Futures contracts | | | 1,920,570 | | | | — | | | | 29,777 | | | | — | | | | 1,950,347 | |
Swap contracts | | | (373,697 | ) | | | (1,993,425 | ) | | | — | | | | — | | | | (2,367,122 | ) |
Written options | | | — | | | | 551,091 | | | | — | | | | 8,961 | | | | 560,052 | |
| | | | | | | | | | | | | | | | | | | | |
| | $ | 1,546,873 | | | $ | (1,442,334 | ) | | $ | 29,777 | | | $ | (192,875 | ) | | $ | (58,559 | ) |
| | | | | | | | | | | | | | | | | | | | |
MSF-47
Metropolitan Series Fund
Met/Wellington Balanced Portfolio (formerly, WMC Balanced Portfolio)
Notes to Financial Statements—June 30, 2016—(Continued)
| | | | | | | | | | | | | | | | | | | | |
Statement of Operations Location—Net Change in Unrealized Appreciation
(Depreciation) | | Interest
Rate | | | Credit | | | Equity | | | Foreign
Exchange | | | Total | |
Investments (a) | | $ | — | | | $ | — | | | $ | — | | | $ | (17,329 | ) | | $ | (17,329 | ) |
Forward foreign currency transactions | | | — | | | | — | | | | — | | | | (557,596 | ) | | | (557,596 | ) |
Futures contracts | | | 1,947,116 | | | | — | | | | 318,081 | | | | — | | | | 2,265,197 | |
Swap contracts | | | (825,220 | ) | | | (448,688 | ) | | | — | | | | — | | | | (1,273,908 | ) |
Written options | | | — | | | | 39,666 | | | | — | | | | — | | | | 39,666 | |
| | | | | | | | | | | | | | | | | | | | |
| | $ | 1,121,896 | | | $ | (409,022 | ) | | $ | 318,081 | | | $ | (574,925 | ) | | $ | 456,030 | |
| | | | | | | | | | | | | | | | | | | | |
For the six months ended June 30, 2016, the average notional par or face amount outstanding for each derivative type was as follows:
| | | | |
Derivative Description | | Average
Notional Par or
Face Amount‡ | |
Investments (a) | | $ | 6,104,135 | |
Forward foreign currency transactions | | | 32,753,362 | |
Futures contracts long | | | 99,537,217 | |
Futures contracts short | | | (53,681,573 | ) |
Swap contracts | | | 155,603,761 | |
Written options | | | (91,193,200 | ) |
| | ‡ | Averages are based on activity levels during the period. |
| | (a) | Represents purchased options which are part of net realized gain (loss) on investments and net change in unrealized appreciation (depreciation) on investments as shown in the Statement of Operations. |
Written Options
The Portfolio transactions in written options during the six months ended June 30, 2016:
| | | | | | | | |
Call Options | | Notional
Amount | | | Premium
Received | |
Options outstanding December 31, 2015 | | | 13,365,000 | | | $ | 39,761 | |
Options written | | | 227,468,000 | | | | 703,396 | |
Options exercised | | | (111,275,000 | ) | | | (386,835 | ) |
Options expired | | | (91,579,000 | ) | | | (268,590 | ) |
| | | | | | | | |
Options outstanding June 30, 2016 | | | 37,979,000 | | | $ | 87,732 | |
| | | | | | | | |
| | |
Put Options | | Notional
Amount | | | Premium
Received | |
Options outstanding December 31, 2015 | | | 13,370,000 | | | $ | 26,406 | |
Options written | | | 231,177,000 | | | | 632,932 | |
Options bought back | | | (2,679,000 | ) | | | (74,289 | ) |
Options exercised | | | (91,584,000 | ) | | | (214,332 | ) |
Options expired | | | (112,305,000 | ) | | | (284,695 | ) |
| | | | | | | | |
Options outstanding June 30, 2016 | | | 37,979,000 | | | $ | 86,022 | |
| | | | | | | | |
4. Certain Risks
In the normal course of business, the Portfolio invests in securities and enters into transactions where risks exist due to fluctuations in the market (“market risk”) or failure of the other party to a transaction to perform (“credit and counterparty risk”).
Market Risk: The value of securities held by the Portfolio may decline in response to certain events, including those directly involving the companies whose securities are owned by the Portfolio; conditions affecting the general economy; overall market changes; local, regional or global political, social or economic instability; and currency, interest rate, and price fluctuations.
MSF-48
Metropolitan Series Fund
Met/Wellington Balanced Portfolio (formerly, WMC Balanced Portfolio)
Notes to Financial Statements—June 30, 2016—(Continued)
Credit and Counterparty Risk: The Portfolio may be exposed to counterparty risk, or the risk that an entity with which the Portfolio has unsettled or open transactions may default. The potential loss could exceed the value of the financial assets and liabilities recorded in the financial statements. Financial assets that potentially expose the Portfolio to credit and counterparty risk consist principally of cash due from counterparties and investments. The Portfolio manages counterparty risk by entering into agreements only with counterparties that it believes have the financial resources to honor their obligations and by monitoring the financial stability of those counterparties. The Portfolio’s investment adviser attempts to mitigate counterparty risk by (i) periodically assessing the creditworthiness of its trading partners, (ii) monitoring and/or limiting the amount of its net exposure to each individual counterparty based on its assessment, and (iii) requiring collateral from the counterparty for certain transactions. In order to preserve certain safeguards for non-standard settlement trades, the Portfolio restricts its exposure to credit and counterparty losses by entering into master netting agreements (“Master Agreements”) with counterparties (approved brokers) with whom it undertakes a significant volume of transactions. Master Agreements govern the terms of certain transactions, and reduce the counterparty risk associated with relevant transactions by specifying credit protection mechanisms and providing standardization that improves legal certainty. Master Agreements can also help limit counterparty risk by specifying collateral posting arrangements at pre-arranged exposure levels. Collateral requirements may differ by type of derivative or investment, as applicable. Collateral or margin requirements are set by the broker or exchange clearing house for exchange-traded derivatives (e.g., futures contracts and exchange-traded options), while collateral terms are contract specific for OTC traded derivatives (e.g., forward foreign currency exchange contracts, swap agreements and OTC options).
For derivatives traded under an International Swaps and Derivatives Association, Inc. Master Agreement (“ISDA Master Agreement”) or similar master agreement, the collateral requirements are netted across all transactions traded under such agreement and one amount is posted from one party to the other to collateralize such obligations. The ISDA Master Agreement gives each party to the agreement the right to terminate all transactions traded under such agreement if there is a certain deterioration in the credit quality of the other party. The ISDA Master Agreement gives the Portfolio the right, upon an event of default by the applicable counterparty or a termination of the agreement, to close out all transactions traded under such agreement and to net amounts owed under each transaction to one net amount payable by one party to the other. This right to close out and net payments across all transactions traded under the ISDA Master Agreement could result in a reduction of the Portfolio’s credit risk to such counterparty equal to any amounts payable by the Portfolio under the applicable transactions, if any. However, absent an event of default by the counterparty or a termination of the agreement, the ISDA Master Agreement does not result in an offset of reported amounts of assets and liabilities in the Statement of Assets and Liabilities across transactions between the Portfolio and the applicable counterparty. The enforceability of the right to offset may vary by jurisdiction. Cash collateral that has been pledged to cover obligations of the Portfolio under derivative contracts, if any, will be reported separately in the Statement of Assets and Liabilities. Securities pledged as collateral, if any, for the same purpose are noted in the Schedule of Investments.
Master Securities Forward Transaction Agreements (“MSFTA”) govern the considerations and factors surrounding the settlement of certain forward settling transactions, such as TBA securities and delayed-delivery or secured borrowings transactions by and between the Portfolio and select counterparties. The MSFTA maintain provisions for, among other things, initiation and confirmation, payment and transfer, events of default, termination, and maintenance of collateral.
Customer Account Agreements and related addenda govern cleared derivatives transactions such as futures, options on futures, and cleared OTC derivatives. Cleared derivative transactions require posting of initial margin as determined by each relevant clearing agency, which is segregated at a broker account registered with the Commodities Futures Trading Commission (“CFTC”), or the applicable regulator. In the U.S., counterparty risk is significantly reduced as creditors of the futures broker do not have claim to Portfolio assets in the segregated account. Additionally, portability of exposure in the event of default further reduces risk to the Portfolio. Variation margin, or changes in market value, are exchanged daily, but may not be netted between futures and cleared OTC derivatives.
Foreign Investment Risk: The investments by the Portfolio in foreign securities may involve risks not present in domestic investments. Because securities may be denominated in foreign currencies, may require settlement in foreign currencies and may pay interest or dividends in foreign currencies, changes in the relationship of these foreign currencies to the U.S. dollar can significantly affect the value of the investments and earnings of the Portfolio. Foreign investments may also subject the Portfolio to foreign government exchange restrictions, expropriation, taxation or other political, social or economic developments, all of which could affect the market and/or credit risk of the investments. In addition to the risks described above, risks may arise from forward foreign currency contracts with respect to the potential inability of counterparties to meet the terms of their contracts.
Additional risks associated with each type of investment are described above within the respective security type notes. The Portfolio’s prospectus includes a discussion of the principal risks of investing in the Portfolio.
MSF-49
Metropolitan Series Fund
Met/Wellington Balanced Portfolio (formerly, WMC Balanced Portfolio)
Notes to Financial Statements—June 30, 2016—(Continued)
5. Investment Transactions
Aggregate cost of purchases and proceeds of sales of investment securities, including mortgage dollar roll and TBA transactions but excluding short-term securities, for the six months ended June 30, 2016 were as follows:
| | | | | | | | | | | | |
Purchases | | | Sales | |
U.S. Government | | Non U.S. Government | | | U.S. Government | | | Non U.S. Government | |
| $2,328,151,046 | | $ | 327,605,857 | | | $ | 2,274,648,055 | | | $ | 372,471,830 | |
Purchases and sales of mortgage dollar rolls and TBA transactions for the six months ended June 30, 2016 were as follows:
| | | | |
Purchases | | Sales | |
| $2,306,271,750 | | $ | 2,249,015,433 | |
6. Investment Management Fees and Other Transactions with Affiliates
Investment Management Agreement - MetLife Advisers is the investment adviser to the Portfolio. The Trust has entered into an investment management agreement with MetLife Advisers with respect to the Portfolio. For providing investment management services to the Portfolio, MetLife Advisers receives monthly compensation at the following annual rates:
| | | | | | |
Management
Fees earned by
MetLife Advisers
for the six months ended
June 30, 2016 | | % per annum | | | Average Daily Net Assets |
| $2,810,045 | | | 0.500 | % | | Of the first $500 million |
| | | 0.450 | % | | Of the next $500 million |
| | | 0.400 | % | | On amounts in excess of $1 billion |
MetLife Advisers has entered into an investment subadvisory agreement with respect to managing the Portfolio. Wellington Management Company LLP is compensated by MetLife Advisers to provide subadvisory services for the Portfolio.
Management Fee Waiver - Pursuant to a management fee waiver agreement, the Adviser has agreed, for the period May 1, 2016 to April 30, 2017, to reduce its advisory fees set out above under “Investment Management Agreement” for each class of the Portfolio as follows:
| | |
% per annum reduction | | Average Daily Net Assets |
| 0.020% | | On the first $500 million |
Any reductions in total advisory fees paid by the Portfolio due to these waivers may be reduced or eliminated by changes in the advisory fee structure at higher asset levels. MetLife Advisers will receive advisory fees equal to 0.480% of the Portfolio’s average daily net assets for amounts over $500 million but less than $750 million (0.030% over the contractual advisory fee rate) and 0.460% for amounts over $750 million but less than $1 billion (0.010% over the contractual advisory fee rate). As a result, the dollar amount of the waiver will be reduced as assets grow beyond $500 million up to $1 billion, but the advisory fee net of waivers will never exceed the contractual dollar amount that would otherwise be payable under the advisory fee. An identical agreement was in place for the period May 1, 2015 to April 30, 2016.
The Subadviser has voluntarily agreed to waive a portion of its subadvisory fees payable by the Adviser to the Subadviser for managing the Portfolio. In addition to the above advisory fee agreement, the Adviser has agreed to reduce its advisory fee reflecting a portion of the amount waived by the Subadviser for managing the Portfolio pursuant to the voluntary subadvisory fee waiver. $176,054 was waived in the aggregate for the six months ended June 30, 2016 and is reflected in the total amount shown as a management fee waiver in the Statement of Operations.
Certain officers and trustees of the Trust may also be officers of the Adviser; however, such officers and trustees receive no compensation from the Trust.
On January 12, 2016, MetLife, Inc. announced its plan to pursue the separation of a substantial portion of its retail segment and is currently evaluating structural alternatives for such separation. It is anticipated that MetLife Advisers would be included in any such separation. Any separation transaction that might occur will be subject to the satisfaction of various conditions and approvals, including approval of any transaction by the MetLife, Inc. Board of Directors, satisfaction of any applicable requirements of the SEC, and receipt of insurance and other regulatory approvals and other anticipated conditions. Because the form of a separation had yet to be determined, MetLife, Inc. cannot currently provide a specific potential completion date or information about the potential impact on MetLife Advisers. No assurance can be given regarding the form that a separation transaction may take or the specific terms
MSF-50
Metropolitan Series Fund
Met/Wellington Balanced Portfolio (formerly, WMC Balanced Portfolio)
Notes to Financial Statements—June 30, 2016—(Continued)
thereof, or that a separation will in fact occur. Depending on the form a separation takes, MetLife Advisers’ continued service as investment adviser to the Trusts could be subject to the satisfaction of various conditions and approvals, which may include obtaining approvals from the Trusts’ Board and shareholders.
Transfer Agency Agreement - MetLife serves as the transfer agent for the Trust. MetLife receives no fees for its services to the Trust under the transfer agency agreement.
Distribution and Service Fees - The Trust has a distribution agreement with MetLife Investors Distribution Company (“MIDC” or the “Distributor”) in which MIDC serves as the distributor for the Portfolio’s Class A, B and E Shares. MIDC is a wholly-owned subsidiary of MetLife Investors Group, LLC, an affiliate of the Adviser. The Trust has also adopted a Distribution and Service Plan under Rule 12b-1 of the 1940 Act for the Portfolio’s Class B and E Shares. Under the Distribution and Service Plan, the Class B and E Shares of the Portfolio pay a fee to compensate the Insurance Companies (or their affiliates) and other broker-dealers and financial intermediaries involved in the offer and sale of Portfolio shares for promoting or selling and servicing the Class B and E Shares. The fees under the Distribution and Service Plan for each class of the Portfolio’s shares are calculated as a percentage of the Portfolio’s average daily net assets that are attributable to that Class. Currently, the fee is 0.25% per year for Class B Shares and 0.15% per year for Class E Shares. Amounts incurred by the Portfolio for the six months ended June 30, 2016 are shown as Distribution and service fees in the Statement of Operations.
Deferred Trustee Compensation - Each Trustee who is not currently an active employee of MetLife or its affiliates receives compensation from the Trust for his or her service to the Trust. A deferred compensation plan (the “Plan”) is available to the Trustees on a voluntary basis. Deferred amounts remain in the Trust until distributed in accordance with the provisions of the Plan. The value of a participating Trustee’s deferral account is based on theoretical investments of deferred amounts on the normal payment dates in certain portfolios of the Trust or Met Investors Series Trust, an affiliate of the Trust, as designated by the participating Trustee. Changes in the value of participants’ deferral accounts are reflected as Trustees’ fees and expenses in the Statement of Operations. The portion of the accrued obligations allocated to the Portfolio under the Plan is reflected as Deferred trustees’ fees in the Statement of Assets and Liabilities.
7. Contractual Obligations
Under the Trust’s organizational documents, its officers and Trustees may be indemnified against certain liabilities and expenses arising out of the performance of their duties to the Trust. Additionally, the Trust has a variety of indemnification obligations under contracts with its service providers. The Trust’s maximum exposure under these arrangements is unknown, as this would involve future claims that may be made against the Trust that have not yet occurred.
8. Income Tax Information
The tax character of distributions paid for the years ended December 31, 2015 and 2014 were as follows:
| | | | | | | | | | | | | | | | | | | | |
Ordinary Income | | | Long-Term Capital Gain | | | Total | |
2015 | | 2014 | | | 2015 | | | 2014 | | | 2015 | | | 2014 | |
| $68,197,869 | | $ | 26,916,743 | | | $ | 179,918,284 | | | $ | — | | | $ | 248,116,153 | | | $ | 26,916,743 | |
As of December 31, 2015, the components of distributable earnings (accumulated losses) on a federal income tax basis were as follows:
| | | | | | | | | | | | | | | | |
Undistributed
Ordinary
Income | | Undistributed
Long-Term
Capital Gain | | | Net
Unrealized
Appreciation | | | Other
Accumulated
Capital Losses | | | Total | |
| $33,975,287 | | $ | 57,190,637 | | | $ | 47,014,599 | | | $ | — | | | $ | 138,180,523 | |
The Portfolio utilizes the provisions of the federal income tax laws that provide for the carryforward of capital losses for prior years, offsetting such losses against any future realized capital gains. Under the Regulated Investment Company Modernization Act of 2010 (the “Act”), net capital losses recognized after December 22, 2010 may be carried forward indefinitely and their character is retained as short-term and/or long-term losses. Previously, net capital losses were carried forward for up to eight years and treated as short-term losses. As a transition rule, the Act requires that post-enactment net capital losses be used before pre-enactment net capital losses.
As of December 31, 2015, the Portfolio had no post-enactment accumulated capital losses and no pre-enactment accumulated capital loss carryforwards.
MSF-51
Metropolitan Series Fund
Met/Wellington Core Equity Opportunities Portfolio (formerly, WMC Core Equity Opportunities Portfolio)
Managed by Wellington Management Company LLP
Portfolio Manager Commentary*
PERFORMANCE
For the six month period ended June 30, 2016, the Class A, B and E shares of the Met/Wellington Core Equity Opportunities Portfolio returned 5.58%, 5.46%, and 5.49%, respectively. The Portfolio’s benchmark, the Russell 1000 Index1, returned 3.74%.
MARKET ENVIRONMENT / CONDITIONS
U.S. equities rose during the first half of 2016, notwithstanding significant volatility during the period. Early in the first quarter of 2016, stocks plunged and moved in virtual lockstep with the price of oil as fears of a recession and weakness in China weighed on investors’ minds. However, equities surged in the second half of the quarter as solid economic data, a stabilization in oil prices, and accommodative commentary from the Federal Reserve (the “Fed”) helped to calm the market’s early year jitters. The Federal Open Market Committee’s (the “FOMC”) March statement surprised many market participants with its dovish tone. The FOMC lowered its inflation forecast for 2016 and suggested only two rate hikes this year, down from four, implied back in December 2015. The policy statement also removed reference to the balance of risks, noting that “global economic and financial developments continue to pose risks.”
Stocks continued to climb during the second quarter of 2016, ending June with a 3.8% year-to-date gain, as measured by the S&P 500 Index. A better-than-expected U.S. corporate earnings season and an encouraging economic backdrop helped sustain the rally. The continued rebound of oil prices buoyed equities to start off April but performance tapered off towards the end of the month amid mixed economic data and corporate earnings reports. The Fed remained a focal point as firm U.S. inflation data and hawkish commentary from several FOMC members during May raised market expectations of a summer rate hike. However, the U.K.s vote to leave the European Union (“Brexit”) took center stage late in the quarter, overshadowing the lower probability of a near-term interest rate hike by the Fed following the disappointing payroll report in early June. At its June meeting, the Fed left rates unchanged and reduced its U.S. growth and long-run policy rate forecasts, citing mixed U.S. economic data and uncertainty about global economic and financial developments. Fed chair Janet Yellen also explicitly mentioned the uncertainty surrounding the U.K.’s European Union referendum as a factor in the decision. After plunging 5.3% in the two trading days following the Brexit, U.S. stocks staged an impressive 4.9% comeback in the final three days of the quarter, further evidence that the 7-year-old bull market remains intact.
Returns varied noticeably by market-cap, as mid- and large-cap stocks outperformed small-cap stocks, as measured by the S&P Midcap 400 Index, the S&P 500 Index, and the Russell 2000 Index, respectively, though all three groups posted positive returns during the six-month period.
PORTFOLIO REVIEW / PERIOD END POSITIONING
The Portfolio outpaced its benchmark, the Russell 1000 Index, for the period ended June 30, 2016. Strong stock selection in the Health Care, Industrials, Financials, Information Technology, and Energy sectors more than offset weaker security selection in Consumer Staples. Sector positioning, a result of the bottom-up stock selection process, was modestly negative driven largely by the Portfolio’s underweight allocations to the Utilities, Telecommunication Services, and Energy sectors.
Our holdings in Marsh & McLennan, UnitedHealth Group, and United Parcel Services (“UPS”) were among the top relative contributors during the period. Our avoidance of benchmark constituents Apple and Alphabet also aided relative results. UPS is a global package delivery and supply chain management company. Part of our recent thesis on UPS was that the company had learned from its missteps during the past two holiday seasons and was well positioned to handle the 2015 holiday surge. As we anticipated, the company posted a strong fourth quarter 2015 earnings beat due to solid execution, causing the stock to move higher. Additionally, UPS posted robust domestic and international margins and management increased its earnings guidance for the full fiscal year. We continued to hold the stock as of the end of the period as we view UPS as a strong free cash flow generator and dividend growth story, with an e-commerce secular tailwind that should persist as a source of growth.
The Portfolio’s exposure to Nike, Cardinal Health, and PNC Financial Services detracted from performance, as did our decision not to hold benchmark constituent AT&T. Nike is a provider of athletic footwear, apparel, equipment, and accessories. The company’s shares struggled during the period, but in our opinion, investors were overly concerned about basketball-related sales slowing in the U.S. (it only represents about 3% of total sales). Basketball gets a lot of press but it’s not that meaningful to Nike’s overall business. Additionally, during the second quarter of 2016, some backed up inventory that they were dealing with (due to the Sports Authority bankruptcy) weighed on the company. We believe Nike is already working through the inventory issues and that it is a short-term, temporary issue. The company’s growth appears healthy in our view and we used the weakness in the stock to add to the Portfolio’s position over the period.
MSF-1
Metropolitan Series Fund
Met/Wellington Core Equity Opportunities Portfolio (formerly, WMC Core Equity Opportunities Portfolio)
Managed by Wellington Management Company LLP
Portfolio Manager Commentary*—(Continued)
As of the end of the period, the Portfolio was most overweight the Consumer Staples, Industrials, and Health Care sectors, and most underweight the Information Technology, Energy, and Utilities sectors.
Donald J. Kilbride
Portfolio Manager
Wellington Management Company LLP
* This commentary may include statements that constitute “forward-looking statements” under the U.S. securities laws. Forward-looking statements include, among other things, projections, estimates, and information about possible or future results related to the Portfolio, market or regulatory developments. The views expressed above are not guarantees of future performance or economic results and involve certain risks, uncertainties and assumptions that could cause actual outcomes and results to differ materially from the views expressed herein. The views expressed above are subject to change at any time based upon economic, market, or other conditions and the subadvisory firm undertakes no obligation to update the views expressed herein. Any discussions of specific securities should not be considered a recommendation to buy or sell those securities. The views expressed above (including any forward-looking statement) may not be relied upon as investment advice or as an indication of the Portfolio’s trading intent. Information about the Portfolio’s holdings, asset allocation or country diversification is historical and is not an indication of future Portfolio composition, which may vary. Direct investment in any index is not possible. The performance of any index mentioned in this commentary has not been adjusted for ongoing management, distribution and operating expenses, and sales charges applicable to mutual fund investments. In addition, the returns do not reflect additional fees charged by separate accounts or variable insurance contracts that an investor in the Portfolio may pay. If these additional fees were reflected, performance would have been lower.
MSF-2
Metropolitan Series Fund
Met/Wellington Core Equity Opportunities Portfolio (formerly, WMC Core Equity Opportunities Portfolio)
A $10,000 INVESTMENT COMPARED TO THE RUSSELL 1000 INDEX & THE S&P 500 INDEX
SIX MONTH RETURN & AVERAGE ANNUAL RETURNS (%) AS OF JUNE 30, 2016
| | | | | | | | | | | | | | | | |
| | | 6 Month | | | 1 Year | | | 5 Year | | | 10 Year | |
| Met/Wellington Core Equity Opportunities Portfolio | | | | | | | | | | | | | | | | |
Class A | | | 5.58 | | | | 9.08 | | | | 11.06 | | | | 6.10 | |
Class B | | | 5.46 | | | | 8.84 | | | | 10.78 | | | | 5.84 | |
Class E | | | 5.49 | | | | 8.94 | | | | 10.89 | | | | 5.94 | |
| Russell 1000 Index | | | 3.74 | | | | 2.93 | | | | 11.88 | | | | 7.51 | |
| S&P 500 Index2 | | | 3.84 | | | | 3.99 | | | | 12.09 | | | | 7.42 | |
1 The Russell 1000 Index is an unmanaged measure of the 1,000 largest companies in the Russell 3000 Index, which represents approximately 90% of the investable U.S. equity market.
2 The Standard & Poor’s (S&P) 500 Index is an unmanaged index consisting of 500 stocks chosen for market size, liquidity, and industry group representation. It is a market-weighted index (stock price times number of shares outstanding) with each stock’s weight in the Index proportionate to its market value.
Portfolio performance is calculated including reinvestment of all income and capital gain distributions. Performance numbers are net of all Portfolio expenses but do not include any insurance, sales, separate account or administrative charges of variable annuity or life insurance contracts or any additional expenses that participants may bear relating to the operations of their plans. If these charges were included, the returns would be lower. The performance of any index referenced above has not been adjusted for ongoing management, distribution and operating expenses, and sales charges applicable to mutual fund investments. Direct investment in any index is not possible. The performance of Class A shares, as set forth in the line graph above, will differ from that of other classes because of the difference in expenses paid by policyholders investing in the different share classes.
This information represents past performance and is not indicative of future results. Investment return and principal value may fluctuate so that shares, upon redemption, may be worth more or less than the original cost.
PORTFOLIO COMPOSITION AS OF JUNE 30, 2016
Top Holdings
| | | | |
| | | % of
Net Assets | |
| Microsoft Corp. | | | 3.3 | |
| Costco Wholesale Corp. | | | 3.1 | |
| Medtronic plc | | | 3.1 | |
| United Parcel Service, Inc. - Class B | | | 3.0 | |
| Chubb, Ltd. | | | 3.0 | |
| NIKE, Inc. - Class B | | | 3.0 | |
| Marsh & McLennan Cos., Inc. | | | 2.9 | |
| Colgate-Palmolive Co. | | | 2.8 | |
| Honeywell International, Inc. | | | 2.8 | |
| Johnson & Johnson | | | 2.7 | |
Top Sectors
| | | | |
| | | % of
Net Assets | |
| Consumer Staples | | | 18.8 | |
| Health Care | | | 18.2 | |
| Industrials | | | 18.0 | |
| Financials | | | 14.7 | |
| Consumer Discretionary | | | 11.7 | |
| Information Technology | | | 10.3 | |
| Materials | | | 3.4 | |
| Energy | | | 3.0 | |
MSF-3
Metropolitan Series Fund
Met/Wellington Core Equity Opportunities Portfolio (formerly, WMC Core Equity Opportunities Portfolio)
Understanding Your Portfolio’s Expenses (Unaudited)
Shareholder Expense Example
As a shareholder of the Portfolio, you incur ongoing costs, including management fees; distribution and service (12b-1) fees; and other Portfolio expenses. This example is intended to help you understand your ongoing costs (in dollars) (referred to as “expenses”) of investing in the Portfolio and compare these costs with the ongoing costs of investing in other mutual funds. The example is based on an investment of $1,000 invested at the beginning of the period and held for the entire period, January 1, 2016 through June 30, 2016.
Actual Expenses
The first line for each share class of the Portfolio in the table below provides information about actual account values and actual expenses. You may use the information in this line, together with the amount you invested in the particular share class of the Portfolio, to estimate the expenses that you paid over the period. Simply divide your account value by $1,000 (for example, an $8,600 account value divided by $1,000 = 8.6), then multiply the result by the number in the first line under the heading entitled “Expenses Paid During Period” to estimate the expenses you paid on your account during this period.
Hypothetical Example for Comparison Purposes
The second line for each share class of the Portfolio in the table below provides information about hypothetical account values and hypothetical expenses based on the Portfolio’s actual expense ratio and an assumed rate of return of 5% per year before expenses, which is not the Portfolio’s actual return. The hypothetical account values and expenses may not be used to estimate the actual ending account balance or expenses you paid for the period. You may use this information to compare the ongoing costs of investing in the Portfolio and other funds. To do so, compare this 5% hypothetical example with the 5% hypothetical examples that appear in the shareholder reports of the other funds.
Please note that the expenses shown in the table are meant to highlight your ongoing costs only and do not reflect any fees or charges of your variable insurance product or any additional expenses that participants in certain eligible qualified plans may bear relating to the operations of their plan. Therefore, the second line for each share class in the table is useful in comparing ongoing costs only, and will not help you determine the relative total costs of owning different funds. In addition, if these other costs were included, your costs would have been higher.
| | | | | | | | | | | | | | | | | | |
Met/Wellington Core Equity Opportunities Portfolio
(formerly, WMC Core Equity Opportunities Portfolio) | | | | Annualized
Expense
Ratio | | | Beginning
Account Value
January 1,
2016 | | | Ending
Account Value
June 30,
2016 | | | Expenses Paid
During Period**
January 1, 2016
to
June 30,
2016 | |
Class A(a) | | Actual | | | 0.58 | % | | $ | 1,000.00 | | | $ | 1,055.80 | | | $ | 2.96 | |
| | Hypothetical* | | | 0.58 | % | | $ | 1,000.00 | | | $ | 1,021.98 | | | $ | 2.92 | |
| | | | | |
Class B(a) | | Actual | | | 0.83 | % | | $ | 1,000.00 | | | $ | 1,054.60 | | | $ | 4.24 | |
| | Hypothetical* | | | 0.83 | % | | $ | 1,000.00 | | | $ | 1,020.74 | | | $ | 4.17 | |
| | | | | |
Class E(a) | | Actual | | | 0.73 | % | | $ | 1,000.00 | | | $ | 1,054.90 | | | $ | 3.73 | |
| | Hypothetical* | | | 0.73 | % | | $ | 1,000.00 | | | $ | 1,021.23 | | | $ | 3.67 | |
* Hypothetical assumes a rate of return of 5% per year before expenses.
** Expenses paid are equal to the Portfolio’s annualized expense ratio for the most recent six month period, as shown above, multiplied by the average account value over the period, multiplied by the number of days (182 days) in the most recent fiscal half-year, divided by 366 (to reflect the one-half year period).
(a) The annualized expense ratio shown reflects the impact of the management fee waiver as described in Note 5 of the Notes to Financial Statements.
MSF-4
Metropolitan Series Fund
Met/Wellington Core Equity Opportunities Portfolio (formerly, WMC Core Equity Opportunities Portfolio)
Schedule of Investments as of June 30, 2016 (Unaudited)
Common Stocks—98.1% of Net Assets
| | | | | | | | |
| Security Description | | Shares | | | Value | |
|
Aerospace & Defense—10.1% | |
General Dynamics Corp. | | | 353,386 | | | $ | 49,205,467 | |
Honeywell International, Inc. | | | 967,433 | | | | 112,531,807 | |
Lockheed Martin Corp. | | | 431,155 | | | | 106,999,736 | |
Northrop Grumman Corp. | | | 292,491 | | | | 65,014,899 | |
United Technologies Corp. | | | 773,848 | | | | 79,358,112 | |
| | | | | | | | |
| | | | | | | 413,110,021 | |
| | | | | | | | |
|
Air Freight & Logistics—3.0% | |
United Parcel Service, Inc. - Class B | | | 1,144,792 | | | | 123,316,994 | |
| | | | | | | | |
|
Banks—3.7% | |
PNC Financial Services Group, Inc. (The) | | | 912,782 | | | | 74,291,327 | |
Wells Fargo & Co. | | | 1,595,961 | | | | 75,536,834 | |
| | | | | | | | |
| | | | | | | 149,828,161 | |
| | | | | | | | |
|
Beverages—6.8% | |
Coca-Cola Co. (The) | | | 2,229,158 | | | | 101,047,732 | |
Diageo plc | | | 3,335,197 | | | | 93,322,833 | |
PepsiCo, Inc. | | | 775,717 | | | | 82,179,459 | |
| | | | | | | | |
| | | | | | | 276,550,024 | |
| | | | | | | | |
|
Biotechnology—1.9% | |
Amgen, Inc. | | | 504,656 | | | | 76,783,410 | |
| | | | | | | | |
|
Capital Markets—1.7% | |
BlackRock, Inc. | | | 197,198 | | | | 67,546,231 | |
| | | | | | | | |
|
Chemicals—3.4% | |
Ecolab, Inc. | | | 437,216 | | | | 51,853,817 | |
Praxair, Inc. | | | 766,892 | | | | 86,190,992 | |
| | | | | | | | |
| | | | | | | 138,044,809 | |
| | | | | | | | |
|
Consumer Finance—1.6% | |
American Express Co. | | | 1,074,943 | | | | 65,313,537 | |
| | | | | | | | |
|
Energy Equipment & Services—1.5% | |
Schlumberger, Ltd. | | | 758,593 | | | | 59,989,534 | |
| | | | | | | | |
|
Food & Staples Retailing—7.1% | |
Costco Wholesale Corp. | | | 814,152 | | | | 127,854,430 | |
CVS Health Corp. | | | 799,886 | | | | 76,581,086 | |
Walgreens Boots Alliance, Inc. | | | 1,012,050 | | | | 84,273,403 | |
| | | | | | | | |
| | | | | | | 288,708,919 | |
| | | | | | | | |
|
Health Care Equipment & Supplies—3.1% | |
Medtronic plc | | | 1,452,449 | | | | 126,029,000 | |
| | | | | | | | |
|
Health Care Providers & Services—6.2% | |
Cardinal Health, Inc. | | | 1,280,051 | | | | 99,856,778 | |
McKesson Corp. | | | 240,201 | | | | 44,833,517 | |
UnitedHealth Group, Inc. | | | 762,918 | | | | 107,724,022 | |
| | | | | | | | |
| | | | | | | 252,414,317 | |
| | | | | | | | |
|
Hotels, Restaurants & Leisure—1.9% | |
McDonald’s Corp. | | | 630,346 | | | | 75,855,838 | |
| | | | | | | | |
|
Household Products—4.8% | |
Colgate-Palmolive Co. | | | 1,539,939 | | | | 112,723,535 | |
Procter & Gamble Co. (The) | | | 997,106 | | | | 84,424,965 | |
| | | | | | | | |
| | | | | | | 197,148,500 | |
| | | | | | | | |
|
Insurance—5.9% | |
Chubb, Ltd. | | | 932,565 | | | | 121,895,571 | |
Marsh & McLennan Cos., Inc. | | | 1,735,121 | | | | 118,786,384 | |
| | | | | | | | |
| | | | | | | 240,681,955 | |
| | | | | | | | |
|
IT Services—5.0% | |
Accenture plc - Class A | | | 887,174 | | | | 100,507,943 | |
Automatic Data Processing, Inc. | | | 1,129,492 | | | | 103,766,430 | |
| | | | | | | | |
| | | | | | | 204,274,373 | |
| | | | | | | | |
|
Media—1.2% | |
Walt Disney Co. (The) | | | 486,466 | | | | 47,586,104 | |
| | | | | | | | |
|
Oil, Gas & Consumable Fuels—1.6% | |
Exxon Mobil Corp. | | | 678,323 | | | | 63,585,998 | |
| | | | | | | | |
|
Pharmaceuticals—7.0% | |
Johnson & Johnson | | | 891,978 | | | | 108,196,931 | |
Merck & Co., Inc. | | | 1,827,338 | | | | 105,272,942 | |
Roche Holding AG (a) | | | 276,458 | | | | 72,993,365 | |
| | | | | | | | |
| | | | | | | 286,463,238 | |
| | | | | | | | |
|
Real Estate Investment Trusts—1.8% | |
Public Storage | | | 283,058 | | | | 72,346,794 | |
| | | | | | | | |
|
Road & Rail—4.8% | |
Canadian National Railway Co. (a) | | | 1,631,674 | | | | 96,350,795 | |
Union Pacific Corp. | | | 1,153,226 | | | | 100,618,968 | |
| | | | | | | | |
| | | | | | | 196,969,763 | |
| | | | | | | | |
|
Software—5.3% | |
Microsoft Corp. | | | 2,614,730 | | | | 133,795,734 | |
Oracle Corp. | | | 2,012,437 | | | | 82,369,047 | |
| | | | | | | | |
| | | | | | | 216,164,781 | |
| | | | | | | | |
|
Specialty Retail—4.3% | |
Lowe’s Cos., Inc. | | | 1,053,857 | | | | 83,433,859 | |
TJX Cos., Inc. (The) | | | 1,161,452 | | | | 89,698,938 | |
| | | | | | | | |
| | | | | | | 173,132,797 | |
| | | | | | | | |
|
Textiles, Apparel & Luxury Goods—4.4% | |
NIKE, Inc. - Class B | | | 2,204,616 | | | | 121,694,803 | |
VF Corp. | | | 954,205 | | | | 58,674,065 | |
| | | | | | | | |
| | | | | | | 180,368,868 | |
| | | | | | | | |
Total Common Stocks
(Cost $3,479,992,967) | | | | | | | 3,992,213,966 | |
| | | | | | | | |
See accompanying notes to financial statements.
MSF-5
Metropolitan Series Fund
Met/Wellington Core Equity Opportunities Portfolio (formerly, WMC Core Equity Opportunities Portfolio)
Schedule of Investments as of June 30, 2016 (Unaudited)
Escrow Shares—0.0%
| | | | | | | | |
| Security Description | | Shares/
Principal
Amount* | | | Value | |
|
Forest Products & Paper—0.0% | |
Sino-Forest Corp. (b)
(Cost $0) | | | 5,844,000 | | | $ | 0 | |
| | | | | | | | |
|
| Short-Term Investments—2.9% | |
|
Mutual Fund—1.0% | |
State Street Navigator Securities Lending MET Portfolio (c) | | | 41,414,626 | | | | 41,414,626 | |
| | | | | | | | |
|
Repurchase Agreement—1.9% | |
Fixed Income Clearing Corp. Repurchase Agreement dated 06/30/16 at 0.030% to be repurchased at $75,171,905 on 07/01/16, collateralized by $74,535,000 U.S. Treasury Note at 1.625% due 11/30/20 with a value of $76,677,881. | | | 75,171,843 | | | | 75,171,843 | |
| | | | | | | | |
Total Short-Term Investments
(Cost $116,586,469) | | | | | | | 116,586,469 | |
| | | | | | | | |
Total Investments—101.0%
(Cost $3,596,579,436) (d) | | | | | | | 4,108,800,435 | |
Other assets and liabilities (net)—(1.0)% | | | | | | | (40,072,294 | ) |
| | | | | | | | |
| Net Assets—100.0% | | | | | | $ | 4,068,728,141 | |
| | | | | | | | |
| * | Principal amount stated in U.S. dollars unless otherwise noted. |
| (a) | All or a portion of the security was held on loan. As of June 30, 2016, the market value of securities loaned was $39,790,250 and the collateral received consisted of cash in the amount of $41,414,626. The cash collateral is invested in a money market fund managed by an affiliate of the custodian. |
| (b) | Security was valued in good faith under procedures approved by the Board of Trustees. As of June 30, 2016, these securities represent less than 0.05% of net assets. |
| (c) | Represents investment of cash collateral received from securities on loan as of June 30, 2016. |
| (d) | As of June 30, 2016, the aggregate cost of investments was $3,596,579,436. The aggregate unrealized appreciation and depreciation of investments were $552,160,211 and $(39,939,212), respectively, resulting in net unrealized appreciation of $512,220,999. |
Fair Value Hierarchy
Accounting principles generally accepted in the United States of America (“GAAP”) define fair market value as the price that the Portfolio would receive to sell an asset or pay to transfer a liability in an orderly transaction between market participants at the measurement date. It establishes a fair value hierarchy that prioritizes inputs to valuation methods and requires disclosure of the fair value hierarchy, separately for each major category of assets and liabilities, that segregates fair value measurements into three levels. Levels 1, 2 and 3 of the fair value hierarchy are defined as follows:
Level 1 - unadjusted quoted prices in active markets for identical investments
Level 2 - other significant observable inputs (including, but not limited to, quoted prices for similar assets or liabilities in markets that are either active or inactive; inputs other than quoted prices that are observable such as interest rates, yield curves, volatilities, prepayment speeds, loss severities, credit risks, default rates, or other market corroborated inputs)
Level 3 - significant unobservable inputs based on the best information available in the circumstances, to the extent observable inputs are unavailable (including the Portfolio’s own assumptions used in determining the fair value of investments and derivative financial instruments)
The inputs or methodologies used for valuing investments are not necessarily an indication of the risk associated with investing in them. Changes to the inputs or methodologies used may result in transfers between levels, which will be recognized as of the beginning of the reporting period. Information on transfers between Level 1 and Level 2, if any, will be disclosed following the fair value hierarchy table below. A reconciliation of Level 3 securities, if any, will also be disclosed following the fair value hierarchy table. For more information about the Portfolio’s policy regarding the valuation of investments, please refer to the Notes to Financial Statements.
See accompanying notes to financial statements.
MSF-6
Metropolitan Series Fund
Met/Wellington Core Equity Opportunities Portfolio (formerly, WMC Core Equity Opportunities Portfolio)
Schedule of Investments as of June 30, 2016 (Unaudited)
Fair Value Hierarchy—(Continued)
The following table summarizes the fair value hierarchy of the Portfolio’s investments as of June 30, 2016:
| | | | | | | | | | | | | | | | |
| Description | | Level 1 | | | Level 2 | | | Level 3 | | | Total | |
| Common Stocks | | | | | | | | | | | | | | | | |
Aerospace & Defense | | $ | 413,110,021 | | | $ | — | | | $ | — | | | $ | 413,110,021 | |
Air Freight & Logistics | | | 123,316,994 | | | | — | | | | — | | | | 123,316,994 | |
Banks | | | 149,828,161 | | | | — | | | | — | | | | 149,828,161 | |
Beverages | | | 183,227,191 | | | | 93,322,833 | | | | — | | | | 276,550,024 | |
Biotechnology | | | 76,783,410 | | | | — | | | | — | | | | 76,783,410 | |
Capital Markets | | | 67,546,231 | | | | — | | | | — | | | | 67,546,231 | |
Chemicals | | | 138,044,809 | | | | — | | | | — | | | | 138,044,809 | |
Consumer Finance | | | 65,313,537 | | | | — | | | | — | | | | 65,313,537 | |
Energy Equipment & Services | | | 59,989,534 | | | | — | | | | — | | | | 59,989,534 | |
Food & Staples Retailing | | | 288,708,919 | | | | — | | | | — | | | | 288,708,919 | |
Health Care Equipment & Supplies | | | 126,029,000 | | | | — | | | | — | | | | 126,029,000 | |
Health Care Providers & Services | | | 252,414,317 | | | | — | | | | — | | | | 252,414,317 | |
Hotels, Restaurants & Leisure | | | 75,855,838 | | | | — | | | | — | | | | 75,855,838 | |
Household Products | | | 197,148,500 | | | | — | | | | — | | | | 197,148,500 | |
Insurance | | | 240,681,955 | | | | — | | | | — | | | | 240,681,955 | |
IT Services | | | 204,274,373 | | | | — | | | | — | | | | 204,274,373 | |
Media | | | 47,586,104 | | | | — | | | | — | | | | 47,586,104 | |
Oil, Gas & Consumable Fuels | | | 63,585,998 | | | | — | | | | — | | | | 63,585,998 | |
Pharmaceuticals | | | 213,469,873 | | | | 72,993,365 | | | | — | | | | 286,463,238 | |
Real Estate Investment Trusts | | | 72,346,794 | | | | — | | | | — | | | | 72,346,794 | |
Road & Rail | | | 196,969,763 | | | | — | | | | — | | | | 196,969,763 | |
Software | | | 216,164,781 | | | | — | | | | — | | | | 216,164,781 | |
Specialty Retail | | | 173,132,797 | | | | — | | | | — | | | | 173,132,797 | |
Textiles, Apparel & Luxury Goods | | | 180,368,868 | | | | — | | | | — | | | | 180,368,868 | |
Total Common Stocks | | | 3,825,897,768 | | | | 166,316,198 | | | | — | | | | 3,992,213,966 | |
Total Escrow Shares* | | | — | | | | — | | | | 0 | | | | 0 | |
| Short-Term Investments | | | | | | | | | | | | | | | | |
Mutual Fund | | | 41,414,626 | | | | — | | | | — | | | | 41,414,626 | |
Repurchase Agreement | | | — | | | | 75,171,843 | | | | — | | | | 75,171,843 | |
Total Short-Term Investments | | | 41,414,626 | | | | 75,171,843 | | | | — | | | | 116,586,469 | |
Total Investments | | $ | 3,867,312,394 | | | $ | 241,488,041 | | | $ | 0 | | | $ | 4,108,800,435 | |
| | | | | | | | | | | | | | | | | |
Collateral for Securities Loaned (Liability) | | $ | — | | | $ | (41,414,626 | ) | | $ | — | | | $ | (41,414,626 | ) |
| * | See Schedule of Investments for additional detailed categorizations. |
As of June 30, 2016, the security designated as Level 3 was fair valued using significant unobservable inputs under procedures adopted by the Board. Such valuations were based on a review of inputs such as, but not limited to, similar securities, company specific financial information, and company specific news. For this security there was no change in the valuation techniques used since the December 31, 2015 annual report. The Level 3 security comprised 0.0% of net assets of the Portfolio. As such, the Level 3 roll forward and change in unrealized appreciation (depreciation) of the Level 3 security held at June 30, 2016 have not been presented.
See accompanying notes to financial statements.
MSF-7
Metropolitan Series Fund
Met/Wellington Core Equity Opportunities Portfolio (formerly, WMC Core Equity Opportunities Portfolio)
Statement of Assets and Liabilities
June 30, 2016 (Unaudited)
| | | | |
Assets | | | | |
Investments at value (a) (b) | | $ | 4,108,800,435 | |
Cash denominated in foreign currencies (c) | | | 402,567 | |
Receivable for: | | | | |
Fund shares sold | | | 523,430 | |
Dividends and interest | | | 6,557,579 | |
Prepaid expenses | | | 25,632 | |
| | | | |
Total Assets | | | 4,116,309,643 | |
Liabilities | | | | |
Due to custodian | | | 4,931 | |
Collateral for securities loaned | | | 41,414,626 | |
Payables for: | | | | |
Investments purchased | | | 1,776,334 | |
Fund shares redeemed | | | 1,707,879 | |
Accrued Expenses: | | | | |
Management fees | | | 1,821,680 | |
Distribution and service fees | | | 239,887 | |
Deferred trustees’ fees | | | 162,565 | |
Other expenses | | | 453,600 | |
| | | | |
Total Liabilities | | | 47,581,502 | |
| | | | |
Net Assets | | $ | 4,068,728,141 | |
| | | | |
Net Assets Consist of: | | | | |
Paid in surplus | | $ | 3,511,699,274 | |
Undistributed net investment income | | | 29,007,672 | |
Accumulated net realized gain | | | 15,861,170 | |
Unrealized appreciation on investments and foreign currency transactions | | | 512,160,025 | |
| | | | |
Net Assets | | $ | 4,068,728,141 | |
| | | | |
Net Assets | | | | |
Class A | | $ | 2,554,811,137 | |
Class B | | | 700,318,097 | |
Class E | | | 813,598,907 | |
Capital Shares Outstanding* | | | | |
Class A | | | 90,774,317 | |
Class B | | | 25,153,588 | |
Class E | | | 29,147,171 | |
Net Asset Value, Offering Price and Redemption Price Per Share | | | | |
Class A | | $ | 28.14 | |
Class B | | | 27.84 | |
Class E | | | 27.91 | |
| * | The Portfolio is authorized to issue an unlimited number of shares. |
| (a) | Includes securities loaned at value of $39,790,250. |
| (b) | Identified cost of investments was $3,596,579,436. |
| (c) | Identified cost of cash denominated in foreign currencies was $402,567. |
Statement of Operations
Six Months Ended June 30, 2016 (Unaudited)
| | | | |
Investment Income | |
Dividends (a) | | $ | 41,066,930 | |
Interest | | | 10,815 | |
Securities lending income | | | 103,801 | |
| | | | |
Total investment income | | | 41,181,546 | |
Expenses | | | | |
Management fees | | | 12,694,554 | |
Administration fees | | | 45,451 | |
Custodian and accounting fees | | | 104,182 | |
Distribution and service fees—Class B | | | 772,023 | |
Distribution and service fees—Class E | | | 599,851 | |
Audit and tax services | | | 21,854 | |
Legal | | | 13,597 | |
Trustees’ fees and expenses | | | 15,990 | |
Shareholder reporting | | | 115,700 | |
Insurance | | | 12,070 | |
Miscellaneous | | | 15,466 | |
| | | | |
Total expenses | | | 14,410,738 | |
Less management fee waiver | | | (2,651,073 | ) |
Less broker commission recapture | | | (1,009 | ) |
| | | | |
Net expenses | | | 11,758,656 | |
| | | | |
Net Investment Income | | | 29,422,890 | |
| | | | |
Net Realized and Unrealized Gain | | | | |
| Net realized gain on: | | | | |
Investments | | | 24,584,041 | |
Foreign currency transactions | | | 24,205 | |
| | | | |
Net realized gain | | | 24,608,246 | |
| | | | |
| Net change in unrealized appreciation on: | | | | |
Investments | | | 141,096,393 | |
Foreign currency transactions | | | 36,051 | |
| | | | |
Net change in unrealized appreciation | | | 141,132,444 | |
| | | | |
Net realized and unrealized gain | | | 165,740,690 | |
| | | | |
Net Increase in Net Assets From Operations | | $ | 195,163,580 | |
| | | | |
| (a) | Net of foreign withholding taxes of $550,636. |
See accompanying notes to financial statements.
MSF-8
Metropolitan Series Fund
Met/Wellington Core Equity Opportunities Portfolio (formerly, WMC Core Equity Opportunities Portfolio)
Statements of Changes in Net Assets
| | | | | | | | |
| | | Six Months
Ended
June 30,
2016
(Unaudited) | | | Year Ended
December 31,
2015 | |
Increase (Decrease) in Net Assets: | | | | | | | | |
From Operations | | | | | | | | |
Net investment income | | $ | 29,422,890 | | | $ | 62,073,611 | |
Net realized gain | | | 24,608,246 | | | | 170,115,385 | |
Net change in unrealized appreciation (depreciation) | | | 141,132,444 | | | | (144,588,195 | ) |
| | | | | | | | |
Increase in net assets from operations | | | 195,163,580 | | | | 87,600,801 | |
| | | | | | | | |
From Distributions to Shareholders | | | | | | | | |
Net investment income | | | | | | | | |
Class A | | | (40,649,104 | ) | | | (40,437,981 | ) |
Class B | | | (9,626,450 | ) | | | (10,031,844 | ) |
Class E | | | (11,830,071 | ) | | | (14,494,701 | ) |
Net realized capital gains | | | | | | | | |
Class A | | | (111,016,460 | ) | | | (777,894,919 | ) |
Class B | | | (30,747,876 | ) | | | (226,707,477 | ) |
Class E | | | (35,932,458 | ) | | | (307,031,634 | ) |
| | | | | | | | |
Total distributions | | | (239,802,419 | ) | | | (1,376,598,556 | ) |
| | | | | | | | |
Increase in net assets from capital share transactions | | | 559,657,801 | | | | 844,497,747 | |
| | | | | | | | |
Total increase (decrease) in net assets | | | 515,018,962 | | | | (444,500,008 | ) |
| | |
Net Assets | | | | | | | | |
Beginning of period | | | 3,553,709,179 | | | | 3,998,209,187 | |
| | | | | | | | |
End of period | | $ | 4,068,728,141 | | | $ | 3,553,709,179 | |
| | | | | | | | |
Undistributed net investment income | | | | | | | | |
End of period | | $ | 29,007,672 | | | $ | 61,690,407 | |
| | | | | | | | |
Other Information:
Capital Shares
Transactions in capital shares were as follows:
| | | | | | | | | | | | | | | | |
| | | Six Months Ended
June 30, 2016
(Unaudited) | | | Year Ended
December 31, 2015 | |
| | | Shares | | | Value | | | Shares | | | Value | |
Class A | | | | | | | | | | | | | | | | |
Sales | | | 3,819,048 | | | $ | 111,923,052 | | | | 401,489 | | | $ | 13,704,699 | |
Shares issued through acquisition (a) | | | 11,681,896 | | | | 342,746,988 | | | | 0 | | | | 0 | |
Reinvestments | | | 5,503,105 | | | | 151,665,564 | | | | 29,122,167 | | | | 818,332,900 | |
Redemptions | | | (4,709,250 | ) | | | (132,994,569 | ) | | | (9,579,161 | ) | | | (306,647,027 | ) |
| | | | | | | | | | | | | | | | |
Net increase | | | 16,294,799 | | | $ | 473,341,035 | | | | 19,944,495 | | | $ | 525,390,572 | |
| | | | | | | | | | | | | | | | |
Class B | | | | | | | | | | | | | | | | |
Sales | | | 622,312 | | | $ | 17,817,705 | | | | 328,723 | | | $ | 11,328,433 | |
Shares issued through acquisition (a) | | | 2,998,245 | | | | 86,919,323 | | | | 0 | | | | 0 | |
Reinvestments | | | 1,480,540 | | | | 40,374,326 | | | | 8,509,681 | | | | 236,739,321 | |
Redemptions | | | (1,722,589 | ) | | | (48,298,322 | ) | | | (3,274,950 | ) | | | (107,903,847 | ) |
| | | | | | | | | | | | | | | | |
Net increase | | | 3,378,508 | | | $ | 96,813,032 | | | | 5,563,454 | | | $ | 140,163,907 | |
| | | | | | | | | | | | | | | | |
Class E | | | | | | | | | | | | | | | | |
Sales | | | 301,882 | | | $ | 8,493,922 | | | | 350,956 | | | $ | 11,476,908 | |
Reinvestments | | | 1,746,984 | | | | 47,762,529 | | | | 11,532,509 | | | | 321,526,335 | |
Redemptions | | | (2,377,469 | ) | | | (66,752,717 | ) | | | (4,621,898 | ) | | | (154,059,975 | ) |
| | | | | | | | | | | | | | | | |
Net increase (decrease) | | | (328,603 | ) | | $ | (10,496,266 | ) | | | 7,261,567 | | | $ | 178,943,268 | |
| | | | | | | | | | | | | | | | |
Increase derived from capital shares transactions | | | | | | $ | 559,657,801 | | | | | | | $ | 844,497,747 | |
| | | | | | | | | | | | | | | | |
| (a) | See Note 8 of Notes to Financial Statements. |
See accompanying notes to financial statements.
MSF-9
Metropolitan Series Fund
Met/Wellington Core Equity Opportunities Portfolio (formerly, WMC Core Equity Opportunities Portfolio)
Financial Highlights
| | | | | | | | | | | | | | | | | | | | | | | | |
| Selected per share data | | | | | | | | | | | | | | | | | | |
| | | Class A | |
| | | Six Months
Ended
June 30,
2016
(Unaudited) | | | Year Ended December 31, | |
| | | | 2015 | | | 2014 | | | 2013 | | | 2012 | | | 2011 | |
Net Asset Value, Beginning of Period | | $ | 28.38 | | | $ | 43.13 | | | $ | 42.97 | | | $ | 33.21 | | | $ | 29.67 | | | $ | 31.25 | |
| | | | | | | | | | | | | | | | | | | | | | | | |
Income (Loss) from Investment Operations | | | | | | | | | | | | | | | | | | | | | | | | |
Net investment income (a) | | | 0.24 | | | | 0.58 | | | | 0.72 | | | | 0.28 | | | | 0.48 | | | | 0.33 | |
Net realized and unrealized gain (loss) on investments | | | 1.30 | | | | 0.31 | | | | 3.41 | | | | 10.64 | | | | 3.33 | | | | (1.56 | ) |
| | | | | | | | | | | | | | | | | | | | | | | | |
Total from investment operations | | | 1.54 | | | | 0.89 | | | | 4.13 | | | | 10.92 | | | | 3.81 | | | | (1.23 | ) |
| | | | | | | | | | | | | | | | | | | | | | | | |
Less Distributions | | | | | | | | | | | | | | | | | | | | | | | | |
Distributions from net investment income | | | (0.48 | ) | | | (0.77 | ) | | | (0.31 | ) | | | (0.53 | ) | | | (0.27 | ) | | | (0.35 | ) |
Distributions from net realized capital gains | | | (1.30 | ) | | | (14.87 | ) | | | (3.66 | ) | | | (0.63 | ) | | | 0.00 | | | | 0.00 | |
| | | | | | | | | | | | | | | | | | | | | | | | |
Total distributions | | | (1.78 | ) | | | (15.64 | ) | | | (3.97 | ) | | | (1.16 | ) | | | (0.27 | ) | | | (0.35 | ) |
| | | | | | | | | | | | | | | | | | | | | | | | |
Net Asset Value, End of Period | | $ | 28.14 | | | $ | 28.38 | | | $ | 43.13 | | | $ | 42.97 | | | $ | 33.21 | | | $ | 29.67 | |
| | | | | | | | | | | | | | | | | | | | | | | | |
Total Return (%) (b) | | | 5.58 | (c) | | | 2.40 | | | | 10.63 | | | | 33.70 | | | | 12.86 | | | | (4.03 | ) |
| | | | | | |
Ratios/Supplemental Data | | | | | | | | | | | | | | | | | | | | | | | | |
Gross ratio of expenses to average net assets (%) | | | 0.72 | (d) | | | 0.72 | | | | 0.73 | | | | 0.72 | | | | 0.73 | | | | 0.73 | |
Net ratio of expenses to average net assets (%) (e) (f) | | | 0.58 | (d) | | | 0.58 | | | | 0.59 | | | | 0.67 | | | | 0.68 | | | | 0.68 | |
Ratio of net investment income to average net assets (%) | | | 1.72 | (d) | | | 1.72 | | | | 1.74 | | | | 0.74 | | | | 1.50 | | | | 1.06 | |
Portfolio turnover rate (%) | | | 17 | (c) | | | 25 | | | | 105 | | | | 11 | | | | 16 | | | | 19 | |
Net assets, end of period (in millions) | | $ | 2,554.8 | | | $ | 2,113.5 | | | $ | 2,352.1 | | | $ | 2,391.0 | | | $ | 2,098.2 | | | $ | 2,040.4 | |
| |
| | | Class B | |
| | | Six Months
Ended
June 30,
2016
(Unaudited) | | | Year Ended December 31, | |
| | | | 2015 | | | 2014 | | | 2013 | | | 2012 | | | 2011 | |
Net Asset Value, Beginning of Period | | $ | 28.06 | | | $ | 42.79 | | | $ | 42.66 | | | $ | 32.98 | | | $ | 29.46 | | | $ | 31.04 | |
| | | | | | | | | | | | | | | | | | | | | | | | |
Income (Loss) from Investment Operations | | | | | | | | | | | | | | | | | | | | | | | | |
Net investment income (a) | | | 0.20 | | | | 0.49 | | | | 0.61 | | | | 0.18 | | | | 0.40 | | | | 0.24 | |
Net realized and unrealized gain (loss) on investments | | | 1.29 | | | | 0.31 | | | | 3.38 | | | | 10.57 | | | | 3.31 | | | | (1.54 | ) |
| | | | | | | | | | | | | | | | | | | | | | | | |
Total from investment operations | | | 1.49 | | | | 0.80 | | | | 3.99 | | | | 10.75 | | | | 3.71 | | | | (1.30 | ) |
| | | | | | | | | | | | | | | | | | | | | | | | |
Less Distributions | | | | | | | | | | | | | | | | | | | | | | | | |
Distributions from net investment income | | | (0.41 | ) | | | (0.66 | ) | | | (0.20 | ) | | | (0.44 | ) | | | (0.19 | ) | | | (0.28 | ) |
Distributions from net realized capital gains | | | (1.30 | ) | | | (14.87 | ) | | | (3.66 | ) | | | (0.63 | ) | | | 0.00 | | | | 0.00 | |
| | | | | | | | | | | | | | | | | | | | | | | | |
Total distributions | | | (1.71 | ) | | | (15.53 | ) | | | (3.86 | ) | | | (1.07 | ) | | | (0.19 | ) | | | (0.28 | ) |
| | | | | | | | | | | | | | | | | | | | | | | | |
Net Asset Value, End of Period | | $ | 27.84 | | | $ | 28.06 | | | $ | 42.79 | | | $ | 42.66 | | | $ | 32.98 | | | $ | 29.46 | |
| | | | | | | | | | | | | | | | | | | | | | | | |
Total Return (%) (b) | | | 5.46 | (c) | | | 2.14 | | | | 10.35 | | | | 33.36 | | | | 12.62 | | | | (4.27 | ) |
| | | | | | |
Ratios/Supplemental Data | | | | | | | | | | | | | | | | | | | | | | | | |
Gross ratio of expenses to average net assets (%) | | | 0.97 | (d) | | | 0.97 | | | | 0.98 | | | | 0.97 | | | | 0.98 | | | | 0.98 | |
Net ratio of expenses to average net assets (%) (e) (f) | | | 0.83 | (d) | | | 0.83 | | | | 0.84 | | | | 0.92 | | | | 0.93 | | | | 0.93 | |
Ratio of net investment income to average net assets (%) | | | 1.46 | (d) | | | 1.47 | | | | 1.49 | | | | 0.49 | | | | 1.25 | | | | 0.80 | |
Portfolio turnover rate (%) | | | 17 | (c) | | | 25 | | | | 105 | | | | 11 | | | | 16 | | | | 19 | |
Net assets, end of period (in millions) | | $ | 700.3 | | | $ | 611.0 | | | $ | 693.7 | | | $ | 738.0 | | | $ | 638.2 | | | $ | 631.4 | |
Please see following page for Financial Highlights footnote legend.
See accompanying notes to financial statements.
MSF-10
Metropolitan Series Fund
Met/Wellington Core Equity Opportunities Portfolio (formerly, WMC Core Equity Opportunities Portfolio)
Financial Highlights
| | | | | | | | | | | | | | | | | | | | | | | | |
| Selected per share data | | | | | | | | | | | | | | | | | | |
| | | Class E | |
| | | Six Months
Ended
June 30,
2016
(Unaudited) | | | Year Ended December 31, | |
| | | | 2015 | | | 2014 | | | 2013 | | | 2012 | | | 2011 | |
Net Asset Value, Beginning of Period | | $ | 28.13 | | | $ | 42.87 | | | $ | 42.74 | | | $ | 33.03 | | | $ | 29.51 | | | $ | 31.09 | |
| | | | | | | | | | | | | | | | | | | | | | | | |
Income (Loss) from Investment Operations | | | | | | | | | | | | | | | | | | | | | | | | |
Net investment income (a) | | | 0.22 | | | | 0.53 | | | | 0.65 | | | | 0.22 | | | | 0.43 | | | | 0.28 | |
Net realized and unrealized gain (loss) on investments | | | 1.29 | | | | 0.30 | | | | 3.38 | | | | 10.60 | | | | 3.31 | | | | (1.55 | ) |
| | | | | | | | | | | | | | | | | | | | | | | | |
Total from investment operations | | | 1.51 | | | | 0.83 | | | | 4.03 | | | | 10.82 | | | | 3.74 | | | | (1.27 | ) |
| | | | | | | | | | | | | | | | | | | | | | | | |
Less Distributions | | | | | | | | | | | | | | | | | | | | | | | | |
Distributions from net investment income | | | (0.43 | ) | | | (0.70 | ) | | | (0.24 | ) | | | (0.48 | ) | | | (0.22 | ) | | | (0.31 | ) |
Distributions from net realized capital gains | | | (1.30 | ) | | | (14.87 | ) | | | (3.66 | ) | | | (0.63 | ) | | | 0.00 | | | | 0.00 | |
| | | | | | | | | | | | | | | | | | | | | | | | |
Total distributions | | | (1.73 | ) | | | (15.57 | ) | | | (3.90 | ) | | | (1.11 | ) | | | (0.22 | ) | | | (0.31 | ) |
| | | | | | | | | | | | | | | | | | | | | | | | |
Net Asset Value, End of Period | | $ | 27.91 | | | $ | 28.13 | | | $ | 42.87 | | | $ | 42.74 | | | $ | 33.03 | | | $ | 29.51 | |
| | | | | | | | | | | | | | | | | | | | | | | | |
Total Return (%) (b) | | | 5.49 | (c) | | | 2.27 | | | | 10.45 | | | | 33.53 | | | | 12.70 | | | | (4.18 | ) |
| | | | | | |
Ratios/Supplemental Data | | | | | | | | | | | | | | | | | | | | | | | | |
Gross ratio of expenses to average net assets (%) | | | 0.87 | (d) | | | 0.87 | | | | 0.88 | | | | 0.87 | | | | 0.88 | | | | 0.88 | |
Net ratio of expenses to average net assets (%) (e) (f) | | | 0.73 | (d) | | | 0.73 | | | | 0.74 | | | | 0.82 | | | | 0.83 | | | | 0.83 | |
Ratio of net investment income to average net assets (%) | | | 1.55 | (d) | | | 1.57 | | | | 1.59 | | | | 0.59 | | | | 1.34 | | | | 0.90 | |
Portfolio turnover rate (%) | | | 17 | (c) | | | 25 | | | | 105 | | | | 11 | | | | 16 | | | | 19 | |
Net assets, end of period (in millions) | | $ | 813.6 | | | $ | 829.2 | | | $ | 952.4 | | | $ | 1,032.7 | | | $ | 900.7 | | | $ | 935.4 | |
| (a) | Per share amounts based on average shares outstanding during the period. |
| (b) | Total return does not reflect any insurance, sales, separate account or administrative charges of variable annuity or life insurance contracts or any additional expenses that contract owners may bear under their variable contracts. If these charges were included, the returns would be lower. |
| (c) | Periods less than one year are not computed on an annualized basis. |
| (d) | Computed on an annualized basis. |
| (e) | The effect of the voluntary portion of the waivers on the net ratio of expenses to average net assets was 0.03%, 0.03% and 0.03% for the six months ended June 30, 2016 and the years ended December 31, 2015 and December 31, 2014, respectively. (see Note 5 of the Notes to Financial Statements). |
| (f) | Includes the effects of management fee waivers (see Note 5 of the Notes to Financial Statements). |
See accompanying notes to financial statements.
MSF-11
Metropolitan Series Fund
Met/Wellington Core Equity Opportunities Portfolio (formerly, WMC Core Equity Opportunities Portfolio)
Notes to Financial Statements—June 30, 2016 (Unaudited)
1. Organization
Metropolitan Series Fund (the “Trust”) is organized as a Delaware statutory trust and registered under the Investment Company Act of 1940, as amended (the “1940 Act”), as an open-end management investment company. The Trust, which is managed by MetLife Advisers, LLC (“MetLife Advisers” or the “Adviser”), an affiliate of MetLife, Inc., is currently comprised of thirty series, each of which operates as a distinct investment vehicle of the Trust. The portfolio included in this report is Met/Wellington Core Equity Opportunities Portfolio (formerly, WMC Core Equity Opportunities Portfolio) (the “Portfolio”), which is diversified. Shares in the Portfolio are not offered directly to the general public and are currently available only to separate accounts established by Metropolitan Life Insurance Company (“MetLife”) and other affiliated life insurance companies.
The Portfolio has registered and offers three classes of shares: Class A, B and E shares. Shares of each Class of the Portfolio represent an equal pro rata interest in the Portfolio and generally give the shareholder the same voting, dividend, liquidation, and other rights. Investment income, realized and unrealized capital gains and losses, the common expenses of the Portfolio, and certain Portfolio-level expense reductions, if any, are allocated on a pro rata basis to each Class based on the relative net assets of each Class to the net assets of the Portfolio. Each Class of shares differs in its respective distribution plan and such distribution expenses are allocated to the corresponding Class of shares.
2. Significant Accounting Policies
The preparation of financial statements in conformity with accounting principles generally accepted in the United States of America (“GAAP”) requires management to make estimates and assumptions that affect the reported amounts of assets and liabilities and disclosure of contingent assets and liabilities as of the date of the financial statements and the reported amounts of income and expenses during the reporting period. Actual results could differ from those estimates. In the preparation of these financial statements, management has evaluated events and transactions subsequent to June 30, 2016 through the date the financial statements were issued.
The Portfolio is an investment company and follows the accounting and reporting guidance of the Financial Accounting Standards Board (“FASB”) Accounting Standards Codification Topic 946—Financial Services—Investment Companies and Topic 820—Fair Value Measurement. The following is a summary of significant accounting policies consistently followed by the Portfolio in the preparation of its financial statements.
Investment Valuation and Fair Value Measurements - Domestic and foreign equity securities, such as common stock, exchange-traded funds, rights, warrants, and preferred stock, that are traded on a securities exchange on a valuation date are generally valued at their last quoted sale price or official closing price on the primary exchange for such security, or, if no sales occurred on that day, at the last reported bid price. Equity securities traded over-the-counter (“OTC”) are generally valued at the last reported bid price. In the event of a major exchange closing during the trading day, the Adviser may use other market information obtained from quotation reporting systems, established market makers, or pricing services in valuing the securities. Valuation adjustments may be applied to certain foreign equity securities that are traded solely on foreign exchanges that close before the time as of which the Portfolio determines its NAV to account for the market movement between the close of the foreign exchanges and the time as of which the Portfolio determines its NAV. The Portfolio may use a systematic fair valuation model provided by a pricing service to value securities principally traded in these foreign markets in order to adjust for possible market movements or other changes that may occur between the close of the foreign exchanges and the time as of which the Portfolio determines its NAV. Foreign equity securities valued using these valuation adjustments are generally categorized as Level 2 within the fair value hierarchy. Equity securities that are actively traded, and have no valuation adjustments applied, are categorized as Level 1 within the fair value hierarchy. Other equity securities traded on inactive markets, or valued in reference to similar instruments traded on active markets, are generally categorized as Level 2 within the fair value hierarchy.
Investments in registered open-end management investment companies are valued at reported net asset value per share on the valuation date and are categorized as Level 1 within the fair value hierarchy.
Debt securities, including corporate, convertible and municipal bonds and notes; obligations of the U.S. Treasury and U.S. government agencies; foreign sovereign issues; and non-U.S. bonds, are generally valued on the basis of evaluated or composite bid quotations obtained from independent pricing services and/or brokers and dealers selected by the Adviser (each a “pricing service”), pursuant to authorization of and subject to general oversight by the Board of Trustees of the Trust (the “Board” or “Trustees”). Such pricing services may use matrix pricing, which considers observable inputs including, among other things, issuer details, maturity dates, interest rates, yield curves, rates of prepayment, credit risks/spreads, default rates, reported trades, broker dealer quotes and quoted prices for similar assets. Short-term obligations with a remaining maturity of sixty days or less may be valued at amortized cost in the absence of market quotes, so long as the amortized cost value of such short-term debt instrument is approximately the same as the fair value of the instrument as determined without the use of amortized cost valuation. Floating rate loans are generally valued on the basis of an evaluated or composite average of aggregate bid and ask quotations supplied by brokers or dealers, as obtained from the pricing service. Securities that use similar valuation techniques and inputs as described above are generally categorized as Level 2 within the fair value hierarchy.
MSF-12
Metropolitan Series Fund
Met/Wellington Core Equity Opportunities Portfolio (formerly, WMC Core Equity Opportunities Portfolio)
Notes to Financial Statements—June 30, 2016—(Continued)
Options, whether on securities, indices, futures contracts, or otherwise, traded on exchanges are valued at the last sale price available as of the close of business on a valuation day or, if there is no such price available, at the last reported bid price. These types of options are categorized as Level 1 within the fair value hierarchy. Futures contracts that are traded on commodity exchanges are valued at their settlement prices established by the exchanges on which they are traded as of the close of such exchanges and are categorized as Level 1 within the fair value hierarchy.
If no current market value quotation or other observable inputs are readily available or market value quotations are deemed to be unreliable for an investment, the fair value of the investment will be determined in accordance with procedures approved by, and under the general supervision of, the Board. In such a circumstance, the Board will be assisted in its responsibility to determine the fair value of an investment by the Valuation Committee (“Committee”) of MetLife Advisers. The Committee provides general pricing oversight and fair value pricing determinations related to portfolio securities and meets on a regular basis to review reports relating to the valuation of the securities in the Portfolio. The Board has delegated to State Street Bank and Trust Company, the Trust’s custodian (“custodian”), the responsibility for calculating the net asset values (“NAVs”) of the Trust’s Portfolios. The Committee is responsible for overseeing the calculation of the NAVs of the Portfolios by the custodian. The Committee also periodically reviews pricing services, including the pricing services providing fair value pricing for the Portfolio’s foreign securities, and is responsible for overseeing the correction of pricing errors and addressing other pricing issues that arise in the ordinary course of business, such as making real-time fair value determinations, as necessary.
No single standard for determining the fair value of an investment can be set forth because fair value depends upon the facts and circumstances with respect to each investment. Information relating to any relevant factors may be obtained by the Committee from any appropriate source, including the subadviser of the Portfolio, the custodian, a pricing service, market maker and/or broker for such security or the issuer. Appropriate methodologies for determining fair value under particular circumstances may include: matrix pricing, a discounted cash flow analysis, comparisons of securities with comparable characteristics, value based on multiples of earnings, discount from market price of similar marketable securities or a combination of these and other methods.
Investment Transactions and Related Investment Income - Portfolio security transactions are recorded on the trade date. Dividend income is recorded on the ex-dividend date or, for certain foreign securities, when notified. Interest income, which includes amortization of premium and accretion of discount on debt securities, is recorded on the accrual basis. Realized gains and losses on investments are determined on the identified cost basis, which is the same basis used for federal income tax purposes. Foreign income and foreign capital gains on some foreign securities may be subject to foreign taxes, which are accrued as applicable. These foreign taxes have been provided for in accordance with the Portfolio’s understanding of the applicable countries’ tax rules and rates.
Foreign Currency Translation - The books and records of the Portfolio are maintained in U.S. dollars. The values of securities, currencies, and other assets and liabilities denominated in currencies other than the U.S. dollar are translated into U.S. dollars based upon foreign exchange rates prevailing at the end of the period. Purchases and sales of investment securities, income, and expenses are translated on the respective dates of such transactions. Because the values of investment securities are translated at the foreign exchange rates prevailing at the end of the period, that portion of the results of operations arising from changes in exchange rates and that portion of the results of operations reflecting fluctuations arising from changes in market prices of the investment securities are not separated. Such fluctuations are included in the net realized and unrealized gain or loss on investments.
Net realized foreign exchange gains or losses arise from activity in forward foreign currency exchange contracts, sales of foreign currency, currency gains or losses realized between the trade and settlement dates on securities transactions, and the difference between the amounts of dividends, interest, and foreign withholding taxes recorded by the Portfolio and the U.S. dollar equivalent of the amounts actually received or paid by the Portfolio. Net unrealized foreign exchange gains and losses arise from changes in the value of assets and liabilities, other than investment securities, resulting from changes in foreign exchange rates.
Dividends and Distributions to Shareholders - The Portfolio records dividends and distributions on the ex-dividend date. Net realized gains from securities transactions (if any) are generally distributed annually to shareholders. The timing and characterization of certain income and capital gains distributions are determined in accordance with federal tax regulations that may differ from GAAP. Permanent book and tax basis differences relating to shareholder distributions will result in reclassification between under/over distributed net investment income, accumulated net realized gains/losses, and paid-in surplus. Book-tax differences are primarily due to foreign currency transactions, real estate investment in trust (REIT) adjustments and broker commission recapture. These adjustments have no impact on net assets or the results of operations.
Income Taxes - It is the Portfolio’s policy to comply with the requirements of the Internal Revenue Code of 1986, as amended, and regulations thereunder, applicable to regulated investment companies and to distribute, with respect to each taxable year, all of its taxable income to shareholders. Therefore, no federal income tax provision is required. The Portfolio files U.S. federal tax returns. No income tax returns are currently under examination. The Portfolio’s federal tax returns for the prior three fiscal years remain subject to examination by the Internal Revenue Service. As of June 30, 2016, the Portfolio had no uncertain tax positions that would require financial statement recognition, or de-recognition or disclosure.
MSF-13
Metropolitan Series Fund
Met/Wellington Core Equity Opportunities Portfolio (formerly, WMC Core Equity Opportunities Portfolio)
Notes to Financial Statements—June 30, 2016—(Continued)
Directed Brokerage Agreement - The Trust has entered into a directed brokerage arrangement with State Street Global Markets (“SSGM”). Under this arrangement, the Portfolio directs certain trades to SSGM in return for a recapture credit. SSGM issues a cash rebate to the Portfolio. Amounts paid to the Portfolio are shown separately as broker commission recapture on the Statement of Operations of the Portfolio. Additionally, these amounts have been excluded from the calculation of the net ratio of expenses to average net assets presented in the Financial Highlights for each share class.
Repurchase Agreements - The Portfolio may enter into repurchase agreements, under the terms of a Master Repurchase Agreement (“MRA”), with selected commercial banks and broker-dealers, under which the Portfolio acquires securities as collateral and agrees to resell the securities at an agreed-upon time and at an agreed-upon price. The Portfolio, through the custodian or a subcustodian, under a tri-party repurchase agreement, receives delivery of the underlying securities collateralizing any repurchase agreements. It is the Portfolio’s policy that the market value of the collateral be equal to at least 100% of the repurchase price in the case of a repurchase agreement of one-day duration and equal to at least 102% of the repurchase price in the case of all other repurchase agreements. In the event of default or failure by a party to perform an obligation in connection with any repurchase transaction, the MRA gives the non-defaulting party the right to set-off claims and to apply property held by it in connection with any repurchase transaction against obligations owed to it.
At June 30, 2016, the Portfolio had investments in repurchase agreements with a gross value of $75,171,843, which is included as part of investments at value on the Statement of Assets and Liabilities. The value of the related collateral exceeded the value of the repurchase agreements at June 30, 2016.
Securities Lending - The Portfolio may lend its portfolio securities to certain qualified brokers who borrow securities in order to complete certain securities transactions. By lending its portfolio securities, the Portfolio attempts to increase its net investment income through the receipt of income on collateral held from securities on loan. Any gain or loss in the market price of the loaned securities that might occur and any interest earned or dividends declared during the term of the loan would accrue to the account of the Portfolio.
The Trust has entered into a Securities Lending Authorization Agreement with the custodian as the lending agent. Under this agreement, the custodian is authorized to loan portfolio securities on the Portfolio’s behalf. In exchange, the Portfolio receives either cash or securities as collateral against the loaned securities. The Portfolio receives collateral equal to at least 102% of the market value of the loaned securities (105% for foreign equity securities), at each loan’s inception. Collateral representing at least 100% of the market value of the loaned securities must be maintained for the duration of the loan. Cash collateral is generally invested in the State Street Navigator Securities Lending MET Portfolio (the “Navigator Portfolio”), a series of the State Street Navigator Securities Lending Trust that is managed by an affiliate of the custodian. The Navigator Portfolio is a registered money market fund that invests in a variety of high-quality, U.S. dollar-denominated instruments. If the market value of the collateral at the close of trading on a business day is less than 100% of the market value of the loaned securities at the close of trading on that day, the borrower shall be required to deliver, by the close of business on the following business day, an additional amount of collateral, so that the total amount of posted collateral is equal to at least 100% of the market value of all the loaned securities as of such preceding day. A portion of net income (income after the deduction of expenses and fees of the Navigator Portfolio) on the collateral is rebated to the borrower of the securities and the remainder is split between the custodian and the Portfolio. On loans collateralized by U.S. Treasuries, a fee is received from the borrower and is allocated between the Portfolio and the custodian. Income received by the Portfolio in securities lending transactions during the six months ended June 30, 2016 is reflected as Securities lending income on the Statement of Operations. The values of any securities loaned by the Portfolio and the related collateral at June 30, 2016 are disclosed in the footnotes to the Schedule of Investments. The value of the related collateral received by the Portfolio exceeded the value of the securities out on loan at June 30, 2016.
The risks associated with lending portfolio securities include, but are not limited to, possible delays in receiving additional collateral or in the recovery of the loaned securities, possible loss of rights in the collateral should the borrower fail financially, as well as risk of loss in the value of the collateral or the value of the investments made with the collateral. The lending agent shall indemnify the Portfolio in the case of default of any securities borrower.
All securities on loan are classified as Common Stocks in the Portfolio’s Schedule of Investments as of June 30, 2016, with a contractual maturity of overnight and continuous.
3. Certain Risks
In the normal course of business, the Portfolio invests in securities and enters into transactions where risks exist due to fluctuations in the market (“market risk”) or failure of the other party to a transaction to perform (“credit and counterparty risk”).
Market Risk: The value of securities held by the Portfolio may decline in response to certain events, including those directly involving the companies whose securities are owned by the Portfolio; conditions affecting the general economy; overall market changes; local, regional or global political, social or economic instability; and currency, interest rate, and price fluctuations.
MSF-14
Metropolitan Series Fund
Met/Wellington Core Equity Opportunities Portfolio (formerly, WMC Core Equity Opportunities Portfolio)
Notes to Financial Statements—June 30, 2016—(Continued)
Credit and Counterparty Risk: The Portfolio may be exposed to counterparty risk, or the risk that an entity with which the Portfolio has unsettled or open transactions may default. The potential loss could exceed the value of the financial assets and liabilities recorded in the financial statements. Financial assets that potentially expose the Portfolio to credit and counterparty risk consist principally of cash due from counterparties and investments. The Portfolio manages counterparty risk by entering into agreements only with counterparties that it believes have the financial resources to honor their obligations and by monitoring the financial stability of those counterparties. The Portfolio’s investment adviser attempts to mitigate counterparty risk by (i) periodically assessing the creditworthiness of its trading partners, (ii) monitoring and/or limiting the amount of its net exposure to each individual counterparty based on its assessment, and (iii) requiring collateral from the counterparty for certain transactions. In order to preserve certain safeguards for non-standard settlement trades, the Portfolio restricts its exposure to credit and counterparty losses by entering into master netting agreements (“Master Agreements”) with counterparties (approved brokers) with whom it undertakes a significant volume of transactions. Master Agreements govern the terms of certain transactions, and reduce the counterparty risk associated with relevant transactions by specifying credit protection mechanisms and providing standardization that improves legal certainty. Master Agreements can also help limit counterparty risk by specifying collateral posting arrangements at pre-arranged exposure levels.
Repurchase and reverse repurchase agreements are primarily executed under Global Master Repurchase Agreements (“GMRAs”) or Master Repurchase Agreements (“MRAs”), which provide the rights to set-off. Each repurchase and reverse repurchase agreement is initially collateralized at the transaction level. In the event of default, the total market value exposure will be offset against collateral exchanged to date, which would result in a net receivable/(payable) that would be due from/to the counterparty.
Additional risks associated with each type of investment are described above within the respective security type notes. The Portfolio’s prospectus includes a discussion of the principal risks of investing in the Portfolio.
4. Investment Transactions
Aggregate cost of purchases and proceeds of sales of investment securities, excluding short-term securities, for the six months ended June 30, 2016 were as follows:
| | | | | | | | | | | | |
Purchases | | | Sales | |
U.S. Government | | Non U.S. Government | | | U.S. Government | | | Non U.S. Government | |
| $0 | | $ | 606,223,637 | | | $ | 0 | | | $ | 637,468,527 | |
With respect to the Portfolio’s merger with Pioneer Fund Portfolio (see Note 8) on April 29, 2016, the Portfolio acquired long-term securities with a cost of $379,709,359 that are not included in the above non-U.S. Government purchases value.
5. Investment Management Fees and Other Transactions with Affiliates
Investment Management Agreement - MetLife Advisers is the investment adviser to the Portfolio. The Trust has entered into an investment management agreement with MetLife Advisers with respect to the Portfolio. For providing investment management services to the Portfolio, MetLife Advisers receives monthly compensation at the following annual rates:
| | | | | | |
Management
Fees earned by
MetLife Advisers
for the six months ended
June 30, 2016 | | % per annum | | | Average Daily Net Assets |
| $12,694,554 | | | 0.750 | % | | Of the first $1 billion |
| | | 0.700 | % | | On the next $2 billion |
| | | 0.650 | % | | On amounts in excess of $3 billion |
MetLife Advisers has entered into an investment subadvisory agreement with respect to managing the Portfolio. Wellington Management Company LLP is compensated by MetLife Advisers to provide subadvisory services for the Portfolio.
Management Fee Waivers - Pursuant to an expense agreement, MetLife Advisers has agreed, for the period May 1, 2016 to April 30, 2017, to reduce its advisory fees set out above under “Investment Management Agreement” for each class of the Portfolio as follows:
| | |
% per annum | | Average Daily Net Assets |
| 0.120% | | First $500 million |
| 0.145% | | $500 million to $1 billion |
| 0.120% | | $1 billion to $3 billion |
| 0.080% | | $3 billion to $4.5 billion |
| 0.105% | | Over $4.5 billion |
MSF-15
Metropolitan Series Fund
Met/Wellington Core Equity Opportunities Portfolio (formerly, WMC Core Equity Opportunities Portfolio)
Notes to Financial Statements—June 30, 2016—(Continued)
An identical agreement was in place for the period December 1, 2015 through April 30, 2016. Amounts waived for the six months ended June 30, 2016 amounted to $2,098,882 and are included in the total amount shown as management fee waivers in the Statement of Operations.
The Subadviser has voluntarily agreed to waive a portion of its subadvisory fees payable by the Adviser to the Subadviser for managing the Portfolio. In addition to the above advisory fee waiver, the Adviser has agreed to reduce its advisory fee reflecting a portion of the amount waived by the Subadviser for managing the Portfolio pursuant to the voluntary subadvisory fee waiver. $552,191 was waived in the aggregate for the six months ended June 30, 2016 and is reflected in the total amount shown as a management fee waiver in the Statement of Operations.
Certain officers and trustees of the Trust may also be officers of MetLife Advisers; however, such officers and trustees receive no compensation from the Trust.
On January 12, 2016, MetLife, Inc. announced its plan to pursue the separation of a substantial portion of its retail segment and is currently evaluating structural alternatives for such separation. It is anticipated that MetLife Advisers would be included in any such separation. Any separation transaction that might occur will be subject to the satisfaction of various conditions and approvals, including approval of any transaction by the MetLife, Inc. Board of Directors, satisfaction of any applicable requirements of the SEC, and receipt of insurance and other regulatory approvals and other anticipated conditions. Because the form of a separation had yet to be determined, MetLife, Inc. cannot currently provide a specific potential completion date or information about the potential impact on MetLife Advisers. No assurance can be given regarding the form that a separation transaction may take or the specific terms thereof, or that a separation will in fact occur. Depending on the form a separation takes, MetLife Advisers’ continued service as investment adviser to the Trusts could be subject to the satisfaction of various conditions and approvals, which may include obtaining approvals from the Trusts’ Board and shareholders.
Transfer Agency Agreement - MetLife serves as the transfer agent for the Trust. MetLife receives no fees for its services to the Trust under the transfer agency agreement.
Distribution and Service Fees - The Trust has a distribution agreement with MetLife Investors Distribution Company (“MIDC” or the “Distributor”) in which MIDC serves as the distributor for the Portfolio’s Class A, B and E Shares. MIDC is a wholly-owned subsidiary of MetLife Investors Group, LLC, an affiliate of the Adviser. The Trust has also adopted a Distribution and Service Plan under Rule 12b-1 of the 1940 Act for the Portfolio’s Class B and E Shares. Under the Distribution and Service Plan, the Class B and E Shares of the Portfolio pay a fee to compensate the Insurance Companies (or their affiliates) and other broker-dealers and financial intermediaries involved in the offer and sale of Portfolio shares for promoting or selling and servicing the Class B and E Shares. The fees under the Distribution and Service Plan for each class of the Portfolio’s shares are calculated as a percentage of the Portfolio’s average daily net assets that are attributable to that Class. Currently, the fee is 0.25% per year for Class B Shares and 0.15% per year for Class E Shares. Amounts incurred by the Portfolio for the six months ended June 30, 2016 are shown as Distribution and service fees in the Statement of Operations.
Deferred Trustee Compensation - Each Trustee who is not currently an employee of the Adviser or any of its affiliates receives compensation from the Trust for his or her service to the Trust. A deferred compensation plan (the “Plan”) is available to the Trustees on a voluntary basis. Deferred amounts remain in the Trust until distributed in accordance with the provisions of the Plan. The value of a participating Trustee’s deferral account is based on theoretical investments of deferred amounts on the normal payment dates in certain portfolios of the Trust or Met Investors Series Trust, an affiliate of the Trust, as designated by the participating Trustee. Changes in the value of participants’ deferral accounts are reflected as Trustees’ fees and expenses in the Statement of Operations. The portion of the accrued obligations allocated to the Portfolio under the Plan is reflected as Deferred trustees’ fees in the Statement of Assets and Liabilities.
6. Contractual Obligations
Under the Trust’s organizational documents, its officers and Trustees may be indemnified against certain liabilities and expenses arising out of the performance of their duties to the Trust. Additionally, the Trust has a variety of indemnification obligations under contracts with its service providers. The Trust’s maximum exposure under these arrangements is unknown, as this would involve future claims that may be made against the Trust that have not yet occurred.
7. Income Tax Information
The tax character of distributions paid for the years ended December 31, 2015 and 2014 were as follows:
| | | | | | | | | | | | | | | | | | | | |
Ordinary Income | | | Long-Term Capital Gain | | | Total | |
2015 | | 2014 | | | 2015 | | | 2014 | | | 2015 | | | 2014 | |
| $141,263,345 | | $ | 39,349,902 | | | $ | 1,235,335,211 | | | $ | 329,631,159 | | | $ | 1,376,598,556 | | | $ | 368,981,061 | |
MSF-16
Metropolitan Series Fund
Met/Wellington Core Equity Opportunities Portfolio (formerly, WMC Core Equity Opportunities Portfolio)
Notes to Financial Statements—June 30, 2016—(Continued)
As of December 31, 2015, the components of distributable earnings (accumulated losses) on a federal income tax basis were as follows:
| | | | | | | | | | | | | | | | |
Undistributed
Ordinary
Income | | Undistributed
Long-Term
Capital Gain | | | Net
Unrealized
Appreciation | | | Other
Accumulated
Capital Losses | | | Total | |
| $70,090,220 | | $ | 169,060,022 | | | $ | 350,272,354 | | | $ | — | | | $ | 589,422,596 | |
The Portfolio utilizes the provisions of the federal income tax laws that provide for the carryforward of capital losses for prior years, offsetting such losses against any future realized capital gains. Under the Regulated Investment Company Modernization Act of 2010 (the “Act”), net capital losses recognized after December 22, 2010 may be carried forward indefinitely and their character is retained as short-term and/or long-term losses. Previously, net capital losses were carried forward for up to eight years and treated as short-term losses. As a transition rule, the Act requires that post-enactment net capital losses be used before pre-enactment net capital losses.
As of December 31, 2015, the Portfolio had no post-enactment accumulated capital losses and no pre-enactment accumulated capital loss carryforwards.
8. Acquisition
At the close of business on April 29, 2016, the Portfolio, with aggregate Class A, Class B and Class E net assets of $2,079,742,205, $598,612,281 and $818,724,006, respectively, acquired all of the assets and liabilities of Pioneer Fund Portfolio of the Met Investors Series Trust (“Pioneer Fund”).
The acquisition was accomplished by a tax-free exchange of 11,681,896 Class A shares of the Portfolio (valued at $342,746,988) for 37,657,033 Class A shares of Pioneer Fund and 2,998,245 Class B shares of the Portfolio (valued at $86,919,323) for 9,737,087 Class B shares of Pioneer Fund. Each shareholder of Pioneer Fund received shares of the Portfolio with the same class designation and at the respective Class NAV, as determined at the close of business on April 29, 2016. The transaction was part of a restructuring designed to eliminate the offering of overlapping Portfolios in the MetLife, Inc. families of funds with similar investment objectives and similar investment strategies that serve as funding vehicles for insurance contracts that are offered by affiliates of MetLife. Some of the investments held by Pioneer Fund may have been purchased or sold prior to the acquisition for the purpose of complying with the anticipated investment policies or limitations of the Portfolio after the acquisition. If such purchases or sales occurred, the transaction costs were borne by Pioneer Fund. All other costs associated with the merger were not borne by the shareholders of either portfolio.
Pioneer Fund’s net assets on April 29, 2016, were $342,746,988 and $86,919,323 for Class A and Class B shares, respectively, including investments valued at $429,706,208 with a cost basis of $417,385,987. For financial reporting purposes, assets received, liabilities assumed and shares issued by the Portfolio were recorded at fair value; however, the cost basis of the investments received by the Portfolio from Pioneer Fund were carried forward to align ongoing reporting of the Portfolio’s realized and unrealized gains and losses with amounts distributable to shareholders for tax purposes. The aggregate net assets of the Portfolio immediately after the acquisition were $3,926,744,803, which included $12,320,388 of acquired unrealized appreciation on investments and foreign currency transactions.
Assuming the acquisition had been completed on January 1, 2016, the Portfolio’s pro-forma results of operations for the period ended June 30, 2016 are as follows:
| | | | |
Net Investment income | | $ | 31,155,786 | (a) |
Net realized and unrealized gain on investments | | $ | 168,585,875 | (b) |
| | | | |
Net increase in net assets from operations | | $ | 199,741,661 | |
| | | | |
Because the combined investment portfolios have been managed as a single integrated portfolio since the acquisition was completed, it is not practicable to separate the amounts of revenue and earnings of Pioneer Fund that have been included in the Portfolio’s Statement of Operations since April 29, 2016.
| (a) | $29,422,890 net investment income as reported at June 30, 2016, plus $1,584,300 from Pioneer Fund pre-merger net investment income, plus $130,479 in lower net advisory fees, plus $18,117 of pro-forma eliminated other expenses. |
| (b) | $512,160,025 unrealized appreciation as reported at June 30, 2016, minus $454,921,890 pro-forma December 31, 2015 unrealized appreciation, plus $24,608,246 net realized gain as reported at June 30, 2016, plus $86,739,494 in net realized gain from Pioneer Fund pre-merger. |
MSF-17
Metropolitan Series Fund
Shareholder Votes (Unaudited)
At a Special Meeting of Shareholders, held February 26, 2016, the shareholders of the Portfolio voted for the following proposal:
| | | | | | | | | | | | | | | | |
| | | For | | | Against | | | Abstain | | | Total | |
| To approve an Agreement and Plan of Reorganization (the “Plan”) providing for the acquisition of all of the assets of Pioneer Fund Portfolio (“MIST Portfolio”) by Met/Wellington Core Equity Opportunities Portfolio (“MSF Portfolio”), a series of Metropolitan Series Fund, in exchange for shares of MSF Portfolio and the assumption by MSF Portfolio of the liabilities of MIST Portfolio. | | | 30,169,998.432 | | | | 1,038,446.356 | | | | 3,069,800.493 | | | | 34,278,245.281 | |
MSF-18
Metropolitan Series Fund
MetLife Asset Allocation 20 Portfolio
Managed by MetLife Advisers, LLC
Portfolio Manager Commentary*
PERFORMANCE
For the six month period ended June 30, 2016, the Class A and B shares of the MetLife Asset Allocation 20 Portfolio returned 3.88% and 3.74%, respectively. The Portfolio’s benchmark, the Dow Jones Conservative Index1, returned 4.46%.
MARKET ENVIRONMENT / CONDITIONS
The first half of 2016 saw conflicted equity markets, remarkable bond performance and a second quarter rally in commodities. The themes of weak global growth persist, marked by a continued slowdown of Chinese gross domestic product (“GDP”) and razor-thin growth rates for developed economies. Commodities, as measured by the Bloomberg Commodity Index, were up 13.3%, largely driven by gains in the energy sub-index as oil jumped nearly $10 per barrel from recent lows. However, as the supply and demand in the period was decomposed, it appeared that the increase might have been due to supply side dynamics, and not necessarily driven by demand. As a result, the jump in oil price did not signal a turnaround in Chinese demand or some other bullish interpretation. The VIX volatility index experienced two notable spikes above the historical index average (one in late January/early February and the second in the period leading up to the so-called “Brexit” vote, the withdrawal of the United Kingdom (the “U.K.”) from the European Union), as investors transmitted their fears into their trading patterns, elevating volatility. Equities appeared historically overvalued when examining the cyclically-adjusted Shiller price/earnings (“P/E”) ratio, which showed domestic equities hovering near the third-highest valuation level since the 1870’s and did not give confidence to investors since high market P/E ratios have historically preceded periods of declining equity prices. The Federal Reserve, clearly anxious about repeating their December 2015 25 basis point rate hike in the middle of the uncertainty, signaled a flat 2016 for policy actions. All of this uncertainty led to flight-to-safety behavior which drove U.S. Treasuries to gain 5.4% (as measured by the Barclays U.S. Treasury Index) and global sovereign debt to gain an unfathomable 11.6% (as measured by the Barclays Global Treasury Index). Likewise, the price of spot gold experienced its most notable surge since the post-crisis period, with the price per troy ounce gaining nearly 25% in the first half as investors seemed to prefer safer assets. Yet, despite all of the activity which typically correlates with a bearish market, domestic equities shrugged off the intra-period uncertainty and finished the second half surging to near all-time highs—just days after rebounding from a temporary decline after the U.K. voted to do the unthinkable and leave the European Union on June 24th.
The U.S. stock market, as measured by the S&P 500 Index, returned 3.8% in the first half of 2016. Along the capitalization spectrum, mid-cap outperformed small-cap and large-cap stocks. The S&P 400 Mid Cap Index returned 7.9%, while the S&P 600 Small Cap Index returned 6.2%. Value stocks noticeably outperformed growth stocks, as measured by the Russell 3000 Value and Growth Indices (6.3% versus 1.4%). This represents a dramatic turnaround from last year, when growth stocks massively outperformed value. Foreign developed equities, as represented by the MSCI EAFE Index, fell 4.4% on the heels of a poor performance by Japanese equity markets and a broad European post-Brexit selloff. Interestingly, the U.K. market itself was unfazed by its own vote, with the FTSE 100 at a 7-month high just days after a brief post-vote tumble. Emerging market equities, as represented by the MSCI Emerging Markets Index, gained 6.4%—a welcome change after turning in very poor results last year when commodities suffered.
Fixed income markets experienced returns in the first half that defied all expectations of bond bears. As mentioned earlier, Global Treasuries generated returns of 11.6% due to yield curve movements alone. In the U.S., the 10-year Treasury rate fell an astounding 75 basis points in the first half, dropping from 2.24% to 1.49%. In the Eurozone, average European sovereign debt rates fell over 80 basis points, dropping from 70 basis points to negative 10 basis points. While rates were the big driver of fixed income returns, diversified core fixed income also did very well. The domestic Barclays U.S. Aggregate Bond Index returned 5.3% in the first half of 2016. Meanwhile, the Barclays Global Aggregate Bond Index returned 9.0%. In domestic core fixed income, top-performing subsectors included 20+ year Treasuries, which gained 15.8%, while long maturity Foreign Agency issues returned 17.2%. Long Corporates were also additive, delivering a return of 13.9% in the first half of the year.
PORTFOLIO REVIEW / PERIOD-END POSITIONING
The MetLife Asset Allocation 20 Portfolio invested in underlying portfolios of the Met Investors Series Trust and the Metropolitan Series Fund to maintain a broad asset allocation of approximately 20% to equities and 80% to fixed income.
Over the six month period, the Portfolio underperformed the Dow Jones Conservative Index. A large cap orientation vis-à-vis the Dow Jones Index within domestic equity held back relative results as did an overweight to developed markets and an underweight to emerging market equities, while an overweight to high yield bonds helped to offset these losses. During the period, security selection in the underlying portfolios detracted from relative results.
The fixed income underlying portfolios in aggregate made a negative contribution to performance. During the period, U.S. Treasury interest rates across the yield curve generally fell and the yield curve flattened, with longer term maturities falling more than shorter term maturities. The interest rate environment didn’t bode well for the portfolios with a shorter duration posture relative to the benchmark, in particular the Western Asset Management U.S. Government Portfolio and the Met/Franklin Low Duration Total Return Portfolio. Not surprisingly, the Western Asset Management U.S. Government Portfolio was a meaningful detractor from the Portfolio’s relative results, not only due to its shorter duration but as a result of its composition, investing predominantly in government and government-related securities during a period in which spread sectors outperformed. With respect to the Met/Franklin Low Duration
MSF-1
Metropolitan Series Fund
MetLife Asset Allocation 20 Portfolio
Managed by MetLife Advisers, LLC
Portfolio Manager Commentary*—(Continued)
Total Return Portfolio, despite it detracting from the Asset Allocation Portfolio’s relative results, it managed to slightly outperform its respective index due to the Portfolio’s exposure to high yield securities which outperformed their investment grade counterparts. Another notable detractor during the period was the Met/Templeton International Bond Portfolio, which employs a benchmark-unconstrained approach, resulting in large active positions compared to its benchmark index. During the period, a sizable underweight to the euro and the Japanese yen and an overweight to the dollar were unfavorable, given the dollar weakness as these currencies strengthened. Additionally, the Met/Templeton International Bond Portfolio has continued to position for a rising rate environment by maintaining a low portfolio duration which detracted from relative results during the period as yields fell. Lastly, detracting from fixed income results was the PIMCO Total Return Portfolio which held an underweight to both U.S. duration and the front end of the U.K. yield curve, which hurt performance as rates fell. Exposure to Treasury Inflation Protected securities (“TIPS”) via the PIMCO Inflation Protected Bond Portfolio was additive during the period, as TIPS outpaced nominal Treasury securities.
The domestic equity portfolios in aggregate detracted modestly from performance. Due to its conservative nature, the MetLife Asset Allocation 20 Portfolio has a bias to towards value-oriented portfolios, which proved to be beneficial as a value style significantly outperformed growth style during the six month period, although this was not enough to offset the weakness from the underlying growth oriented portfolios. The Jennison Growth Portfolio, T. Rowe Price Large Cap Growth Portfolio and BlackRock Capital Appreciation Portfolio were among the top detractors, due largely to the stylistic headwind. The Jennison Growth Portfolio underperformed its benchmark as a result of both stock selection and sector allocation. Most notably, stock selection in Health Care, Information Technology and Consumer Discretionary sectors proved to be detrimental. Within the Health Care sector, holdings in Alexion Pharmaceuticals, Allergan plc and Regeneron Pharmaceuticals were the leading detractors. Within the Information Technology sector, positioning in the software and services industry was a key driver of underperformance, in particular a holding in LinkedIn Corp. Detracting from results in the Consumer Discretionary sector was positioning in retailing, most notably Netflix Inc. Similarly, with T. Rowe Price Large Cap Growth Portfolio, stock selection in the Health Care and Information Technology sectors held back relative results, along with an underweight to the Consumer Staples sector. The BlackRock Capital Appreciation Portfolio was also a meaningful detractor from relative performance, and, like the other growth portfolios, was hurt by stock selection in Consumer Discretionary, Health Care and Information Technology sectors. On the other hand, a number of value-oriented portfolios contributed positively, with the MFS Value Portfolio being the top contributor. In addition from benefiting from its value style, the Portfolio outperformed its value benchmark. Contributing positively to results during the period were stock selection within the Industrials and Financials sectors, which was partly offset by an underweight to the Utilities sector and industry positioning within the Financials sector. Additionally, an overweight to the Consumer Staples sector aided results. The Met/Wellington Core Equity Opportunities Portfolio’s focus on dividend growing companies was rewarded by the market during the six month period. In particular, stock selection in the Industrials and Health Care sectors were the main drivers of performance, while selection in the Consumer Staples sector detracted. In aggregate, the portfolios investing in the mid and small cap space contributed positively to results, given their value orientation, although there were no notable contributors or detractors.
Among the equity portfolios that invest outside the U.S, the Harris Oakmark International Portfolio was the leading detractor. A combination of sector allocation and stock selection detracted from results, in particular an overweight to the Financials sector. Individual detractors included Credit Suisse Group (Switzerland), Nomura Holdings (Japan) and Lloyds Banking Group (United Kingdom). Additionally, a meaningful overweight and stock selection in the Consumer Discretionary sector hampered results. Notable detractors included Daimler AG (Germany), Honda Motor and Toyota Motor (Japan). Global Real Estate continued to deliver strong results during the six month period as yields declined, boosting dividend yielding sectors. The Clarion Global Real Estate Portfolio contributed positively to relative results, although it underperformed its respective benchmark. The primary detractors were stock selection in the U.S. and positioning in the Canadian and U.K. markets, which was partly offset by positive stock selection in Europe.
Investment Committee
MetLife Advisers, LLC
* This commentary may include statements that constitute “forward-looking statements” under the U.S. securities laws. Forward-looking statements include, among other things, projections, estimates, and information about possible or future results related to the Portfolio, market or regulatory developments. The views expressed above are not guarantees of future performance or economic results and involve certain risks, uncertainties and assumptions that could cause actual outcomes and results to differ materially from the views expressed herein. The views expressed above are subject to change at any time based upon economic, market, or other conditions and the advisory firm undertakes no obligation to update the views expressed herein. Any discussions of specific securities should not be considered a recommendation to buy or sell those securities. The views expressed above (including any forward-looking statement) may not be relied upon as investment advice or as an indication of the Portfolio’s trading intent. Information about the Portfolio’s holdings, asset allocation or country diversification is historical and is not an indication of future Portfolio composition, which may vary. Direct investment in any index is not possible. The performance of any index mentioned in this commentary has not been adjusted for ongoing management, distribution and operating expenses, and sales charges applicable to mutual fund investments. In addition, the returns do not reflect additional fees charged by separate accounts or variable insurance contracts that an investor in the Portfolio may pay. If these additional fees were reflected, performance would have been lower.
MSF-2
Metropolitan Series Fund
MetLife Asset Allocation 20 Portfolio
A $10,000 INVESTMENT COMPARED TO THE DOW JONES CONSERVATIVE INDEX
SIX MONTH RETURN & AVERAGE ANNUAL RETURNS (%) AS OF JUNE 30, 2016
| | | | | | | | | | | | | | | | |
| | | 6 Month | | | 1 Year | | | 5 Year | | | 10 Year | |
| MetLife Asset Allocation 20 Portfolio | | | | | | | | | | | | | | | | |
Class A | | | 3.88 | | | | 2.66 | | | | 4.43 | | | | 5.17 | |
Class B | | | 3.74 | | | | 2.33 | | | | 4.14 | | | | 4.90 | |
| Dow Jones Conservative Index | | | 4.46 | | | | 3.94 | | | | 3.25 | | | | 4.62 | |
1 The Dow Jones Conservative Index is a total return index designed to provide asset allocation strategists with a target risk benchmark. Each month, the Index adjusts its weighting of stocks, bonds, and cash indices (both domestic and foreign) such that the risk combination will have 20% of the risk of an all equity portfolio.
Portfolio performance is calculated including reinvestment of all income and capital gain distributions. Performance numbers are net of all Portfolio expenses but do not include any insurance, sales, separate account or administrative charges of variable annuity or life insurance contracts or any additional expenses that participants may bear relating to the operations of their plans. If these charges were included, the returns would be lower. The performance of any index referenced above has not been adjusted for ongoing management, distribution and operating expenses, and sales charges applicable to mutual fund investments. Direct investment in any index is not possible. The performance of Class A shares, as set forth in the line graph above, will differ from that of other classes because of the difference in expenses paid by policyholders investing in the different share classes.
This information represents past performance and is not indicative of future results. Investment return and principal value may fluctuate so that shares, upon redemption, may be worth more or less than the original cost.
PORTFOLIO COMPOSITION AS OF JUNE 30, 2016
Top Holdings
| | | | |
| | | % of
Net Assets | |
| Western Asset Management U.S. Government Portfolio(Class A) | | | 12.9 | |
| BlackRock Bond Income Portfolio(Class A) | | | 12.5 | |
| PIMCO Total Return Portfolio(Class A) | | | 12.0 | |
| TCW Core Fixed Income Portfolio(Class A) | | | 10.5 | |
| JPMorgan Core Bond Portfolio(Class A) | | | 9.5 | |
| PIMCO Inflation Protected Bond Portfolio(Class A) | | | 9.0 | |
| Met/Franklin Low Duration Total Return Portfolio(Class A) | | | 5.0 | |
| Western Asset Management Strategic Bond Opportunities Portfolio(Class A) | | | 4.0 | |
| T. Rowe Price Large Cap Value Portfolio(Class A) | | | 2.0 | |
| MFS Value Portfolio(Class A) | | | 2.0 | |
MSF-3
Metropolitan Series Fund
MetLife Asset Allocation 20 Portfolio
Understanding Your Portfolio’s Expenses (Unaudited)
Shareholder Expense Example
As a shareholder of the Portfolio, you incur ongoing costs, including management fees; distribution and service (12b-1) fees; and other Portfolio expenses. This example is intended to help you understand your ongoing costs (in dollars) (referred to as “expenses”) of investing in the Portfolio and compare these costs with the ongoing costs of investing in other mutual funds. The example is based on an investment of $1,000 invested at the beginning of the period and held for the entire period, January 1, 2016 through June 30, 2016.
Actual Expenses
The first line for each share class of the Portfolio in the table below provides information about actual account values and actual expenses. You may use the information in this line, together with the amount you invested in the particular share class of the Portfolio, to estimate the expenses that you paid over the period. Simply divide your account value by $1,000 (for example, an $8,600 account value divided by $1,000 = 8.6), then multiply the result by the number in the first line under the heading entitled “Expenses Paid During Period” to estimate the expenses you paid on your account during this period.
Hypothetical Example for Comparison Purposes
The second line for each share class of the Portfolio in the table below provides information about hypothetical account values and hypothetical expenses based on the Portfolio’s actual expense ratio and an assumed rate of return of 5% per year before expenses, which is not the Portfolio’s actual return. The hypothetical account values and expenses may not be used to estimate the actual ending account balance or expenses you paid for the period. You may use this information to compare the ongoing costs of investing in the Portfolio and other funds. To do so, compare this 5% hypothetical example with the 5% hypothetical examples that appear in the shareholder reports of the other funds.
Please note that the expenses shown in the table are meant to highlight your ongoing costs only and do not reflect any fees or charges of your variable insurance product or any additional expenses that participants in certain eligible qualified plans may bear relating to the operations of their plan. Therefore, the second line for each share class in the table is useful in comparing ongoing costs only, and will not help you determine the relative total costs of owning different funds. In addition, if these other costs were included, your costs would have been higher.
| | | | | | | | | | | | | | | | | | |
MetLife Asset Allocation 20 Portfolio | | | | Annualized
Expense
Ratio | | | Beginning
Account Value
January 1,
2016 | | | Ending
Account Value
June 30,
2016 | | | Expenses Paid
During Period**
January 1, 2016
to
June 30,
2016 | |
Class A(a)(b) | | Actual | | | 0.62 | % | | $ | 1,000.00 | | | $ | 1,038.80 | | | $ | 3.14 | |
| | Hypothetical* | | | 0.62 | % | | $ | 1,000.00 | | | $ | 1,021.78 | | | $ | 3.12 | |
| | | | | |
Class B(a)(b) | | Actual | | | 0.87 | % | | $ | 1,000.00 | | | $ | 1,037.40 | | | $ | 4.41 | |
| | Hypothetical* | | | 0.87 | % | | $ | 1,000.00 | | | $ | 1,020.54 | | | $ | 4.37 | |
* Hypothetical assumes a rate of return of 5% per year before expenses.
** Expenses paid are equal to the Portfolio’s annualized expense ratio for the most recent six month period, as shown above, multiplied by the average account value over the period, multiplied by the number of days (182 days) in the most recent fiscal half-year, divided by 366 (to reflect the one-half year period).
(a) The annualized expense ratio shown reflects an expense limitation agreement between MetLife Advisers, LLC and the Portfolio as described in Note 5 of the Notes to Financial Statements.
(b) The annualized expense ratio reflects the expenses of both the Portfolio and the Underlying Portfolios in which it invests.
MSF-4
Metropolitan Series Fund
MetLife Asset Allocation 20 Portfolio
Schedule of Investments as of June 30, 2016 (Unaudited)
Mutual Funds—100.0% of Net Assets
| | | | | | | | |
| Security Description | | Shares | | | Value | |
|
Affiliated Investment Companies—100.0% | |
Baillie Gifford International Stock Portfolio (Class A) (a) | | | 751,099 | | | $ | 7,188,021 | |
BlackRock Bond Income Portfolio (Class A) (a) | | | 813,927 | | | | 88,034,315 | |
BlackRock Capital Appreciation Portfolio (Class A) (a) | | | 223,952 | | | | 7,126,144 | |
BlackRock High Yield Portfolio (Class A) (b) | | | 491,778 | | | | 3,521,132 | |
BlackRock Large Cap Value Portfolio (Class A) (a) | | | 892,813 | | | | 7,160,360 | |
Clarion Global Real Estate Portfolio (Class A) (b) | | | 290,735 | | | | 3,578,950 | |
Goldman Sachs Mid Cap Value Portfolio (Class A) (b) | | | 169,055 | | | | 1,788,598 | |
Harris Oakmark International Portfolio (Class A) (b) | | | 809,307 | | | | 8,886,188 | |
Invesco Comstock Portfolio (Class A) (b) | | | 1,149,486 | | | | 14,357,077 | |
Jennison Growth Portfolio (Class A) (a) | | | 577,093 | | | | 7,121,329 | |
JPMorgan Core Bond Portfolio (Class A) (b) | | | 6,370,677 | | | | 66,828,400 | |
JPMorgan Small Cap Value Portfolio (Class A) (b) | | | 243,825 | | | | 3,596,415 | |
Met/Aberdeen Emerging Markets Equity Portfolio (Class A) (b) | | | 198,758 | | | | 1,796,773 | |
Met/Artisan International Portfolio (Class A) (b) | | | 785,304 | | | | 7,138,413 | |
Met/Artisan Mid Cap Value Portfolio (Class A) (a) | | | 8,692 | | | | 1,795,811 | |
Met/Eaton Vance Floating Rate Portfolio (Class A) (b) | | | 1,413,569 | | | | 13,951,929 | |
Met/Franklin Low Duration Total Return Portfolio (Class A) (b) | | | 3,691,343 | | | | 34,957,014 | |
Met/Templeton International Bond Portfolio (Class A) (b) | | | 1,100,888 | | | | 10,568,524 | |
Met/Wellington Core Equity Opportunities Portfolio (formerly, WMC Core Equity Opportunities Portfolio) (Class A) (a) | | | 509,570 | | | | 14,339,313 | |
Met/Wellington Large Cap Research Portfolio (formerly, WMC Large Cap Research Portfolio) (Class A) (b) | | | 556,179 | | | | 7,169,142 | |
MetLife Small Cap Value Portfolio (Class A) (b) | | | 273,654 | | | | 3,604,026 | |
MFS Research International Portfolio (Class A) (b) | | | 542,734 | | | | 5,373,067 | |
MFS Value Portfolio (Class A) (a) | | | 1,001,368 | | | | 14,359,620 | |
|
Affiliated Investment Companies—(Continued) | |
Neuberger Berman Genesis Portfolio (Class A) (a) | | | 376,323 | | | | 7,180,238 | |
Oppenheimer Global Equity Portfolio (Class A) (b) | | | 101,034 | | | | 1,785,267 | |
PIMCO Inflation Protected Bond Portfolio (Class A) (b) (c) | | | 6,428,500 | | | | 63,385,014 | |
PIMCO Total Return Portfolio (Class A) (b) | | | 7,363,116 | | | | 84,307,675 | |
T. Rowe Price Large Cap Growth Portfolio (Class A) (a) | | | 380,931 | | | | 7,115,799 | |
T. Rowe Price Large Cap Value Portfolio (Class A) (b) | | | 468,553 | | | | 14,365,823 | |
TCW Core Fixed Income Portfolio (Class A) (b) | | | 7,143,656 | | | | 73,722,532 | |
Western Asset Management Strategic Bond Opportunities Portfolio (Class A) (a) | | | 2,158,972 | | | | 28,109,816 | |
Western Asset Management U.S. Government Portfolio (Class A) (a) | | | 7,629,001 | | | | 91,166,563 | |
| | | | | | | | |
Total Mutual Funds
(Cost $726,964,025) | | | | | | | 705,379,288 | |
| | | | | | | | |
Total Investments—100.0%
(Cost $726,964,025) (d) | | | | | | | 705,379,288 | |
Other assets and liabilities (net)—0.0% | | | | | | | (310,323 | ) |
| | | | | | | | |
| Net Assets—100.0% | | | | | | $ | 705,068,965 | |
| | | | | | | | |
| (a) | A Portfolio of Metropolitan Series Fund. (See Note 6 of the Notes to Financial Statements for a summary of transactions in the securities of affiliated Underlying Portfolios.) |
| (b) | A Portfolio of Met Investors Series Trust. (See Note 6 of the Notes to Financial Statements for a summary of transactions in the securities of affiliated Underlying Portfolios.) |
| (c) | Non-income producing security. |
| (d) | As of June 30, 2016, the aggregate cost of investments was $726,964,025. The aggregate unrealized appreciation and depreciation of investments were $5,163,576 and $(26,748,313), respectively, resulting in net unrealized depreciation of $(21,584,737). |
See accompanying notes to financial statements.
MSF-5
Metropolitan Series Fund
MetLife Asset Allocation 20 Portfolio
Schedule of Investments as of June 30, 2016 (Unaudited)
Fair Value Hierarchy
Accounting principles generally accepted in the United States of America (“GAAP”) define fair market value as the price that the Portfolio would receive to sell an asset or pay to transfer a liability in an orderly transaction between market participants at the measurement date. It establishes a fair value hierarchy that prioritizes inputs to valuation methods and requires disclosure of the fair value hierarchy, separately for each major category of assets and liabilities, that segregates fair value measurements into three levels. Levels 1, 2 and 3 of the fair value hierarchy are defined as follows:
Level 1 - unadjusted quoted prices in active markets for identical investments
Level 2 - other significant observable inputs (including, but not limited to, quoted prices for similar assets or liabilities in markets that are either active or inactive; inputs other than quoted prices that are observable such as interest rates, yield curves, volatilities, prepayment speeds, loss severities, credit risks, default rates, or other market corroborated inputs)
Level 3 - significant unobservable inputs based on the best information available in the circumstances, to the extent observable inputs are unavailable (including the Portfolio’s own assumptions used in determining the fair value of investments and derivative financial instruments)
The inputs or methodologies used for valuing investments are not necessarily an indication of the risk associated with investing in them. Changes to the inputs or methodologies used may result in transfers between levels, which will be recognized as of the beginning of the reporting period. Information on transfers between Level 1 and Level 2, if any, will be disclosed following the fair value hierarchy table below. A reconciliation of Level 3 securities, if any, will also be disclosed following the fair value hierarchy table. For more information about the Portfolio’s policy regarding the valuation of investments, please refer to the Notes to Financial Statements.
The following table summarizes the fair value hierarchy of the Portfolio’s investments as of June 30, 2016:
| | | | | | | | | | | | | | | | |
| Description | | Level 1 | | | Level 2 | | | Level 3 | | | Total | |
| Mutual Funds | | | | | | | | | | | | | | | | |
Affiliated Investment Companies | | $ | 705,379,288 | | | $ | — | | | $ | — | | | $ | 705,379,288 | |
Total Investments | | $ | 705,379,288 | | | $ | — | | | $ | — | | | $ | 705,379,288 | |
| | | | | | | | | | | | | | | | | |
See accompanying notes to financial statements.
MSF-6
Metropolitan Series Fund
MetLife Asset Allocation 20 Portfolio
Statement of Assets and Liabilities
June 30, 2016 (Unaudited)
| | | | |
Assets | | | | |
Affiliated investments at value (a) | | $ | 705,379,288 | |
Receivable for: | | | | |
Investments sold | | | 155,085 | |
Fund shares sold | | | 43,218 | |
Due from investment adviser | | | 8,487 | |
| | | | |
Total Assets | | | 705,586,078 | |
Liabilities | | | | |
Payables for: | | | | |
Investments purchased | | | 1,550 | |
Fund shares redeemed | | | 196,753 | |
Accrued Expenses: | | | | |
Management fees | | | 52,989 | |
Distribution and service fees | | | 132,952 | |
Deferred trustees’ fees | | | 77,020 | |
Other expenses | | | 55,849 | |
| | | | |
Total Liabilities | | | 517,113 | |
| | | | |
Net Assets | | $ | 705,068,965 | |
| | | | |
Net Assets Consist of: | | | | |
Paid in surplus | | $ | 708,194,736 | |
Undistributed net investment income | | | 13,771,007 | |
Accumulated net realized gain | | | 4,687,959 | |
Unrealized depreciation on affiliated investments | | | (21,584,737 | ) |
| | | | |
Net Assets | | $ | 705,068,965 | |
| | | | |
Net Assets | | | | |
Class A | | $ | 46,544,463 | |
Class B | | | 658,524,502 | |
Capital Shares Outstanding* | | | | |
Class A | | | 4,392,488 | |
Class B | | | 62,574,939 | |
Net Asset Value, Offering Price and Redemption Price Per Share | | | | |
Class A | | $ | 10.60 | |
Class B | | | 10.52 | |
| * | The Portfolio is authorized to issue an unlimited number of shares. |
| (a) | Identified cost of affiliated investments was $726,964,025. |
Statement of Operations
Six Months Ended June 30, 2016 (Unaudited)
| | | | |
Investment Income | |
Dividends from Affiliated Underlying Portfolios | | $ | 15,072,171 | |
Interest | | | 865 | |
| | | | |
Total investment income | | | 15,073,036 | |
Expenses | | | | |
Management fees | | | 316,264 | |
Administration fees | | | 11,064 | |
Custodian and accounting fees | | | 12,631 | |
Distribution and service fees—Class B | | | 788,767 | |
Audit and tax services | | | 14,919 | |
Legal | | | 13,588 | |
Trustees’ fees and expenses | | | 15,990 | |
Miscellaneous | | | 3,520 | |
| | | | |
Total expenses | | | 1,176,743 | |
Less expenses reimbursed by the Adviser | | | (49,168 | ) |
| | | | |
Net expenses | | | 1,127,575 | |
| | | | |
Net Investment Income | | | 13,945,461 | |
| | | | |
Net Realized and Unrealized Gain (Loss) | | | | |
| Net realized gain (loss) on: | | | | |
Affiliated investments | | | (355,568 | ) |
Capital gain distributions from Affiliated Underlying Portfolios | | | 9,208,803 | |
| | | | |
Net realized gain | | | 8,853,235 | |
| | | | |
Net change in unrealized appreciation on affiliated investments | | | 2,999,385 | |
| | | | |
Net realized and unrealized gain | | | 11,852,620 | |
| | | | |
Net Increase in Net Assets From Operations | | $ | 25,798,081 | |
| | | | |
See accompanying notes to financial statements.
MSF-7
Metropolitan Series Fund
MetLife Asset Allocation 20 Portfolio
Statements of Changes in Net Assets
| | | | | | | | |
| | | Six Months
Ended
June 30,
2016
(Unaudited) | | | Year Ended
December 31,
2015 | |
Increase (Decrease) in Net Assets: | | | | | | | | |
From Operations | | | | | | | | |
Net investment income | | $ | 13,945,461 | | | $ | 20,059,942 | |
Net realized gain | | | 8,853,235 | | | | 24,704,372 | |
Net change in unrealized appreciation (depreciation) | | | 2,999,385 | | | | (47,782,427 | ) |
| | | | | | | | |
Increase (decrease) in net assets from operations | | | 25,798,081 | | | | (3,018,113 | ) |
| | | | | | | | |
From Distributions to Shareholders | | | | | | | | |
Net investment income | | | | | | | | |
Class A | | | (1,595,816 | ) | | | (1,170,030 | ) |
Class B | | | (20,821,731 | ) | | | (13,237,836 | ) |
Net realized capital gains | | | | | | | | |
Class A | | | (1,533,963 | ) | | | (1,562,919 | ) |
Class B | | | (21,575,721 | ) | | | (19,884,218 | ) |
| | | | | | | | |
Total distributions | | | (45,527,231 | ) | | | (35,855,003 | ) |
| | | | | | | | |
Increase (decrease) in net assets from capital share transactions | | | 61,980,340 | | | | (2,015,259 | ) |
| | | | | | | | |
Total increase (decrease) in net assets | | | 42,251,190 | | | | (40,888,375 | ) |
| | |
Net Assets | | | | | | | | |
Beginning of period | | | 662,817,775 | | | | 703,706,150 | |
| | | | | | | | |
End of period | | $ | 705,068,965 | | | $ | 662,817,775 | |
| | | | | | | | |
Undistributed net investment income | | | | | | | | |
End of period | | $ | 13,771,007 | | | $ | 22,243,093 | |
| | | | | | | | |
Other Information:
Capital Shares
Transactions in capital shares were as follows:
| | | | | | | | | | | | | | | | |
| | | Six Months Ended
June 30, 2016
(Unaudited) | | | Year Ended
December 31, 2015 | |
| | | Shares | | | Value | | | Shares | | | Value | |
Class A | | | | | | | | | | | | | | | | |
Sales | | | 171,541 | | | $ | 1,873,665 | | | | 522,688 | | | $ | 5,983,411 | |
Reinvestments | | | 297,507 | | | | 3,129,779 | | | | 245,990 | | | | 2,732,949 | |
Redemptions | | | (416,491 | ) | | | (4,575,416 | ) | | | (747,765 | ) | | | (8,472,736 | ) |
| | | | | | | | | | | | | | | | |
Net increase | | | 52,557 | | | $ | 428,028 | | | | 20,913 | | | $ | 243,624 | |
| | | | | | | | | | | | | | | | |
Class B | | | | | | | | | | | | | | | | |
Sales | | | 7,223,720 | | | $ | 78,114,641 | | | | 8,734,073 | | | $ | 97,554,725 | |
Reinvestments | | | 4,057,173 | | | | 42,397,452 | | | | 3,000,186 | | | | 33,122,054 | |
Redemptions | | | (5,407,318 | ) | | | (58,959,781 | ) | | | (11,835,805 | ) | | | (132,935,662 | ) |
| | | | | | | | | | | | | | | | |
Net increase (decrease) | | | 5,873,575 | | | $ | 61,552,312 | | | | (101,546 | ) | | $ | (2,258,883 | ) |
| | | | | | | | | | | | | | | | |
Increase (decrease) derived from capital shares transactions | | | | | | $ | 61,980,340 | | | | | | | $ | (2,015,259 | ) |
| | | | | | | | | | | | | | | | |
See accompanying notes to financial statements.
MSF-8
Metropolitan Series Fund
MetLife Asset Allocation 20 Portfolio
Financial Highlights
| | | | | | | | | | | | | | | | | | | | | | | | |
| Selected per share data | | | | | | | | | | | | | | | | | | |
| | | Class A | |
| | | Six Months
Ended
June 30,
2016
(Unaudited) | | | Year Ended December 31, | |
| | | | 2015 | | | 2014 | | | 2013 | | | 2012 | | | 2011 | |
Net Asset Value, Beginning of Period | | $ | 10.94 | | | $ | 11.59 | | | $ | 12.05 | | | $ | 11.94 | | | $ | 11.60 | | | $ | 11.51 | |
| | | | | | | | | | | | | | | | | | | | | | | | |
Income (Loss) from Investment Operations | | | | | | | | | | | | | | | | | | | | | | | | |
Net investment income (a) | | | 0.23 | | | | 0.36 | | | | 0.25 | | | | 0.33 | | | | 0.30 | | | | 0.33 | |
Net realized and unrealized gain (loss) on investments | | | 0.19 | | | | (0.38 | ) | | | 0.29 | | | | 0.20 | | | | 0.77 | | | | 0.07 | |
| | | | | | | | | | | | | | | | | | | | | | | | |
Total from investment operations | | | 0.42 | | | | (0.02 | ) | | | 0.54 | | | | 0.53 | | | | 1.07 | | | | 0.40 | |
| | | | | | | | | | | | | | | | | | | | | | | | |
Less Distributions | | | | | | | | | | | | | | | | | | | | | | | | |
Distributions from net investment income | | | (0.39 | ) | | | (0.27 | ) | | | (0.50 | ) | | | (0.36 | ) | | | (0.41 | ) | | | (0.31 | ) |
Distributions from net realized capital gains | | | (0.37 | ) | | | (0.36 | ) | | | (0.50 | ) | | | (0.06 | ) | | | (0.32 | ) | | | 0.00 | |
| | | | | | | | | | | | | | | | | | | | | | | | |
Total distributions | | | (0.76 | ) | | | (0.63 | ) | | | (1.00 | ) | | | (0.42 | ) | | | (0.73 | ) | | | (0.31 | ) |
| | | | | | | | | | | | | | | | | | | | | | | | |
Net Asset Value, End of Period | | $ | 10.60 | | | $ | 10.94 | | | $ | 11.59 | | | $ | 12.05 | | | $ | 11.94 | | | $ | 11.60 | |
| | | | | | | | | | | | | | | | | | | | | | | | |
Total Return (%) (b) | | | 3.88 | (c) | | | (0.23 | ) | | | 4.73 | | | | 4.50 | | | | 9.49 | | | | 3.48 | |
| | | | | | |
Ratios/Supplemental Data | | | | | | | | | | | | | | | | | | | | | | | | |
Gross ratio of expenses to average net assets (%) (d) | | | 0.11 | (e) | | | 0.11 | | | | 0.12 | | | | 0.11 | | | | 0.11 | | | | 0.11 | |
Net ratio of expenses to average net assets (%) (d)(f) | | | 0.10 | (e) | | | 0.10 | | | | 0.10 | | | | 0.10 | | | | 0.10 | | | | 0.10 | |
Ratio of net investment income to average net assets (%) (g) | | | 2.08 | (e)(h) | | | 3.20 | | | | 2.17 | | | | 2.73 | | | | 2.58 | | | | 2.84 | |
Portfolio turnover rate (%) | | | 7 | (c) | | | 21 | | | | 16 | | | | 18 | | | | 9 | | | | 33 | |
Net assets, end of period (in millions) | | $ | 46.5 | | | $ | 47.5 | | | $ | 50.1 | | | $ | 50.5 | | | $ | 54.9 | | | $ | 48.7 | |
| |
| | | Class B | |
| | | Six Months
Ended
June 30,
2016
(Unaudited) | | | Year Ended December 31, | |
| | | | 2015 | | | 2014 | | | 2013 | | | 2012 | | | 2011 | |
Net Asset Value, Beginning of Period | | $ | 10.85 | | | $ | 11.51 | | | $ | 11.97 | | | $ | 11.86 | | | $ | 11.53 | | | $ | 11.44 | |
| | | | | | | | | | | | | | | | | | | | | | | | |
Income (Loss) from Investment Operations | | | | | | | | | | | | | | | | | | | | | | | | |
Net investment income (a) | | | 0.22 | | | | 0.33 | | | | 0.22 | | | | 0.29 | | | | 0.27 | | | | 0.29 | |
Net realized and unrealized gain (loss) on investments | | | 0.18 | | | | (0.39 | ) | | | 0.28 | | | | 0.22 | | | | 0.76 | | | | 0.08 | |
| | | | | | | | | | | | | | | | | | | | | | | | |
Total from investment operations | | | 0.40 | | | | (0.06 | ) | | | 0.50 | | | | 0.51 | | | | 1.03 | | | | 0.37 | |
| | | | | | | | | | | | | | | | | | | | | | | | |
Less Distributions | | | | | | | | | | | | | | | | | | | | | | | | |
Distributions from net investment income | | | (0.36 | ) | | | (0.24 | ) | | | (0.46 | ) | | | (0.34 | ) | | | (0.38 | ) | | | (0.28 | ) |
Distributions from net realized capital gains | | | (0.37 | ) | | | (0.36 | ) | | | (0.50 | ) | | | (0.06 | ) | | | (0.32 | ) | | | 0.00 | |
| | | | | | | | | | | | | | | | | | | | | | | | |
Total distributions | | | (0.73 | ) | | | (0.60 | ) | | | (0.96 | ) | | | (0.40 | ) | | | (0.70 | ) | | | (0.28 | ) |
| | | | | | | | | | | | | | | | | | | | | | | | |
Net Asset Value, End of Period | | $ | 10.52 | | | $ | 10.85 | | | $ | 11.51 | | | $ | 11.97 | | | $ | 11.86 | | | $ | 11.53 | |
| | | | | | | | | | | | | | | | | | | | | | | | |
Total Return (%) (b) | | | 3.74 | (c) | | | (0.59 | ) | | | 4.47 | | | | 4.29 | | | | 9.18 | | | | 3.25 | |
| | | | | | |
Ratios/Supplemental Data | | | | | | | | | | | | | | | | | | | | | | | | |
Gross ratio of expenses to average net assets (%) (d) | | | 0.36 | (e) | | | 0.36 | | | | 0.37 | | | | 0.36 | | | | 0.36 | | | | 0.36 | |
Net ratio of expenses to average net assets (%) (d)(f) | | | 0.35 | (e) | | | 0.35 | | | | 0.35 | | | | 0.35 | | | | 0.35 | | | | 0.35 | |
Ratio of net investment income to average net assets (%) (g) | | | 1.86 | (e)(h) | | | 2.89 | | | | 1.89 | | | | 2.49 | | | | 2.35 | | | | 2.49 | |
Portfolio turnover rate (%) | | | 7 | (c) | | | 21 | | | | 16 | | | | 18 | | | | 9 | | | | 33 | |
Net assets, end of period (in millions) | | $ | 658.5 | | | $ | 615.4 | | | $ | 653.6 | | | $ | 653.8 | | | $ | 723.0 | | | $ | 634.3 | |
| (a) | Per share amounts based on average shares outstanding during the period. |
| (b) | Total return does not reflect any insurance, sales, separate account or administrative charges of variable annuity or life insurance contracts or any additional expenses that contract owners may bear under their variable contracts. If these charges were included, the returns would be lower. |
| (c) | Periods less than one year are not computed on an annualized basis. |
| (d) | The ratio of operating expenses to average net assets does not include expenses of the Underlying Portfolios in which the Asset Allocation Portfolio invests. |
| (e) | Computed on an annualized basis. |
| (f) | Includes the effects of expenses reimbursed by the Adviser (see Note 5 of the Notes to Financial Statements). |
| (g) | Recognition of net investment income by the Asset Allocation Portfolio is affected by the timing of the declaration of dividends by the Underlying Portfolios in which it invests. |
| (h) | The income earned by the Asset Allocation Portfolio through the investments in Underlying Portfolios is not annualized. |
See accompanying notes to financial statements.
MSF-9
Metropolitan Series Fund
MetLife Asset Allocation 20 Portfolio
Notes to Financial Statements—June 30, 2016 (Unaudited)
1. Organization
Metropolitan Series Fund (the “Trust”) is organized as a Delaware statutory trust and registered under the Investment Company Act of 1940, as amended (the “1940 Act”), as an open-end management investment company. The Trust, which is managed by MetLife Advisers, LLC (“MetLife Advisers” or the “Adviser”), an affiliate of MetLife, Inc., is currently comprised of thirty series, each of which operates as a distinct investment vehicle of the Trust. The portfolio included in this report is MetLife Asset Allocation 20 Portfolio (the “Asset Allocation Portfolio”), which is diversified. The Asset Allocation Portfolio operates under a “fund of funds” structure, investing substantially all of its assets in other Portfolios advised by MetLife Advisers (each, an “Underlying Portfolio,” and, collectively, the “Underlying Portfolios”). Shares in the Asset Allocation Portfolio are not offered directly to the general public and are currently available only to separate accounts established by Metropolitan Life Insurance Company (“MetLife”) and other affiliated life insurance companies.
The Asset Allocation Portfolio has registered and offers two classes of shares: Class A and B shares. Shares of each Class of the Asset Allocation Portfolio represent an equal pro rata interest in the Asset Allocation Portfolio and generally give the shareholder the same voting, dividend, liquidation, and other rights. Investment income, realized and unrealized capital gains and losses, the common expenses of the Asset Allocation Portfolio, and certain Asset Allocation Portfolio-level expense reductions, if any, are allocated on a pro rata basis to each Class based on the relative net assets of each Class to the net assets of the Asset Allocation Portfolio. Each Class of shares differs in its respective distribution plan and such distribution expenses are allocated to the corresponding Class of shares.
2. Significant Accounting Policies
The preparation of financial statements in conformity with accounting principles generally accepted in the United States of America (“GAAP”) requires management to make estimates and assumptions that affect the reported amounts of assets and liabilities and disclosure of contingent assets and liabilities as of the date of the financial statements and the reported amounts of income and expenses during the reporting period. Actual results could differ from those estimates. In the preparation of these financial statements, management has evaluated events and transactions subsequent to June 30, 2016 through the date the financial statements were issued.
The Asset Allocation Portfolio is an investment company and follows the accounting and reporting guidance of the Financial Accounting Standards Board (“FASB”) Accounting Standards Codification Topic 946- Financial Services- Investment Companies. The following is a summary of significant accounting policies consistently followed by the Asset Allocation Portfolio in the preparation of its financial statements.
Investment Valuation and Fair Value Measurements - Investments in the Underlying Portfolios are valued at their closing daily net asset value on the valuation date. Investments in the Underlying Portfolios are categorized as Level 1 within the fair value hierarchy. For information about the use of fair value pricing by the Underlying Portfolios, please refer to the prospectuses of the Underlying Portfolios.
Investment Transactions and Related Investment Income - Asset Allocation Portfolio security transactions are recorded on the trade date. Dividend income is recorded on the ex-dividend date. Realized gains and losses on investments are determined on the identified cost basis, which is the same basis used for federal income tax purposes. Capital gains distributions received from the Underlying Portfolios are recorded as net realized gain in the Statement of Operations.
Dividends and Distributions to Shareholders - The Asset Allocation Portfolio records dividends and distributions on the ex-dividend date. Net realized gains from securities transactions (if any) are generally distributed annually to shareholders. The timing and characterization of certain income and capital gains distributions are determined in accordance with federal tax regulations that may differ from GAAP. Permanent book and tax basis differences relating to shareholder distributions will result in reclassification between under/over distributed net investment income, accumulated net realized gains/losses, and paid-in surplus. Book-tax differences are primarily due to distributions from Underlying Portfolios. These adjustments have no impact on net assets or the results of operations.
Income Taxes - It is the Asset Allocation Portfolio’s policy to comply with the requirements of the Internal Revenue Code of 1986, as amended, and regulations thereunder, applicable to regulated investment companies and to distribute, with respect to each taxable year, all of its taxable income to shareholders. Therefore, no federal income tax provision is required. The Asset Allocation Portfolio files U.S. federal tax returns. No income tax returns are currently under examination. The Asset Allocation Portfolio’s federal tax returns for the prior three fiscal years remain subject to examination by the Internal Revenue Service. As of June 30, 2016, the Asset Allocation Portfolio had no uncertain tax positions that would require financial statement recognition, or de-recognition or disclosure.
3. Certain Risks
In the normal course of business, the Underlying Portfolios invest in securities and enter into transactions where risks exist due to fluctuations in the market (“market risk”) or failure of the other party to a transaction to perform (“credit and counterparty risk”).
MSF-10
Metropolitan Series Fund
MetLife Asset Allocation 20 Portfolio
Notes to Financial Statements—June 30, 2016—(Continued)
Market Risk: The value of securities held by the Underlying Portfolios may decline in response to certain events, including those directly involving the companies whose securities are owned by the Underlying Portfolios; conditions affecting the general economy; overall market changes; local, regional or global political, social or economic instability; and currency, interest rate, and price fluctuations.
Credit and Counterparty Risk: The Underlying Portfolios may be exposed to counterparty risk, or the risk that an entity with which the Underlying Portfolios have unsettled or open transactions may default. The potential loss could exceed the value of the financial assets and liabilities recorded in the financial statements. Financial assets that potentially expose the Underlying Portfolios to credit and counterparty risk consist principally of cash due from counterparties and investments. The Underlying Portfolios manage counterparty risk by entering into agreements only with counterparties that they believe have the financial resources to honor their obligations and by monitoring the financial stability of those counterparties. The Underlying Portfolios’ investment adviser attempts to mitigate counterparty risk by (i) periodically assessing the creditworthiness of their trading partners, (ii) monitoring and/or limiting the amount of their net exposure to each individual counterparty based on the adviser’s assessment, and (iii) requiring collateral from the counterparty for certain transactions. In order to preserve certain safeguards for non-standard settlement trades, the Underlying Portfolios restrict their exposure to credit and counterparty losses by entering into master netting agreements (“Master Agreements”) with counterparties (approved brokers) with whom the Underlying Portfolios undertake a significant volume of transactions. Master Agreements govern the terms of certain transactions, and reduce the counterparty risk associated with relevant transactions by specifying credit protection mechanisms and providing standardization that improves legal certainty. Master Agreements can also help limit counterparty risk by specifying collateral posting arrangements at pre-arranged exposure levels.
The Asset Allocation Portfolio’s prospectus includes a discussion of the principal risks of investing in the Asset Allocation Portfolio and in the Underlying Portfolios in which it invests.
4. Investment Transactions
Aggregate cost of purchases and proceeds of sales of shares of the Underlying Portfolios by the Asset Allocation Portfolio for the six months ended June 30, 2016 were as follows:
| | | | | | | | | | | | |
Purchases | | | Sales | |
U.S. Government | | Non U.S. Government | | | U.S. Government | | | Non U.S. Government | |
| $0 | | $ | 85,959,141 | | | $ | 0 | | | $ | 46,336,724 | |
5. Investment Management Fees and Other Transactions with Affiliates
Investment Management Agreement - MetLife Advisers is the investment adviser to the Asset Allocation Portfolio. The Trust has entered into an investment management agreement with MetLife Advisers with respect to the Asset Allocation Portfolio. For providing investment management services to the Asset Allocation Portfolio, MetLife Advisers receives monthly compensation at the following annual rates:
| | | | | | |
Management
Fees earned by
MetLife Advisers
for the six months ended
June 30, 2016 | | % per annum | | | Average Daily Net Assets |
| $316,264 | | | 0.100 | % | | Of the first $500 million |
| | | 0.075 | % | | Of the next $500 million |
| | | 0.050 | % | | On amounts in excess of $1 billion |
In addition to the above management fee paid to MetLife Advisers, the Asset Allocation Portfolio indirectly pays MetLife Advisers an investment advisory fee through its investments in the Underlying Portfolios.
Certain officers and trustees of the Trust may also be officers of MetLife Advisers; however, such officers and trustees receive no compensation from the Trust.
On January 12, 2016, MetLife, Inc. announced its plan to pursue the separation of a substantial portion of its retail segment and is currently evaluating structural alternatives for such separation. It is anticipated that MetLife Advisers would be included in any such separation. Any separation transaction that might occur will be subject to the satisfaction of various conditions and approvals, including approval of any transaction by the MetLife, Inc. Board of Directors, satisfaction of any applicable requirements of the SEC, and receipt of insurance and other regulatory approvals and other anticipated conditions. Because the form of a separation had yet to be determined, MetLife, Inc. cannot currently provide a specific potential completion date or information about the potential impact on MetLife Advisers. No assurance can be given regarding the form that a separation transaction may take or the specific terms
MSF-11
Metropolitan Series Fund
MetLife Asset Allocation 20 Portfolio
Notes to Financial Statements—June 30, 2016—(Continued)
thereof, or that a separation will in fact occur. Depending on the form a separation takes, MetLife Advisers’ continued service as investment adviser to the Trusts could be subject to the satisfaction of various conditions and approvals, which may include obtaining approvals from the Trusts’ Board and shareholders.
Expense Limitation Agreement - Pursuant to an expense agreement relating to each class of the Asset Allocation Portfolio, MetLife Advisers has contractually agreed, from May 1, 2016 to April 30, 2017, to waive a portion of its advisory fees or pay a portion of the other operating expenses (not including acquired fund fees and expenses, brokerage costs, interest, taxes, or extraordinary expenses) to the extent total operating expenses exceed stated annual expense limits (based on the Asset Allocation Portfolio’s then-current fiscal year). For the Asset Allocation Portfolio, this subsidy, and identical subsidies in effect in earlier periods, are subject to the obligation of each class of the Asset Allocation Portfolio to repay MetLife Advisers in future years, if any, when a class’ expenses fall below the stated expense limit pertaining to that class that was in effect at the time of the subsidy in question. Such deferred expenses may be charged to a class in a subsequent year to the extent that the charge does not cause the total expenses in such subsequent year to exceed the class’ stated expense limit that was in effect at the time of the subsidy in question; provided, however, that no class of the Asset Allocation Portfolio is obligated to repay any expense paid by MetLife Advisers more than five years after the end of the fiscal year in which such expense was incurred. The expense limits (annual rates as a percentage of each class of the Asset Allocation Portfolio’s net average daily net assets) in effect from May 1, 2015 to April 30, 2016 are 0.10% and 0.35% for Class A and B, respectively.
As of June 30, 2016, the amount of expenses deferred in 2011 subject to repayment until December 31, 2016 was $38,237. The amount of expenses deferred in 2012 subject to repayment until December 31, 2017 was $74,663. The amount of expenses deferred in 2013 subject to repayment until December 31, 2018 was $61,885. The amount of expenses deferred in 2014 subject to repayment until December 31, 2019 was $111,213. The amount of expenses deferred in 2015 subject to repayment until December 31, 2020 was $99,092. The amount of expenses deferred in 2016 subject to repayment until December 31, 2021 was $49,168.
Transfer Agency Agreement - MetLife serves as the transfer agent for the Trust. MetLife receives no fees for its services to the Trust under the transfer agency agreement.
Distribution and Service Fees - The Trust has a distribution agreement with MetLife Investors Distribution Company (“MIDC” or the “Distributor”) in which MIDC serves as the distributor for the Asset Allocation Portfolio’s Class A and B Shares. MIDC is a wholly-owned subsidiary of MetLife Investors Group, LLC, an affiliate of the Adviser. The Trust has also adopted a Distribution and Service Plan under Rule 12b-1 of the 1940 Act for the Asset Allocation Portfolio’s Class B shares. Under the Distribution and Services Plan, the Class B shares of the Asset Allocation Portfolio pay a fee to compensate the Insurance Companies (or their affiliates) and other broker-dealers and financial intermediaries involved in the offer and sale of Asset Allocation Portfolio shares for promoting or selling and servicing the Class B shares of the Asset Allocation Portfolio. The fees under the Distribution and Services Plan for each class of the Asset Allocation Portfolio’s shares are calculated as a percentage of the Asset Allocation Portfolio’s average daily net assets that are attributable to that Class. Currently, the fee is 0.25% per year for Class B shares. Amount incurred by the Asset Allocation Portfolio for the six months ended June 30, 2016 is shown as Distribution and service fees in the Statement of Operations.
Deferred Trustee Compensation - Each Trustee who is not currently an active employee of MetLife or its affiliates receives compensation from the Trust for his or her service to the Trust. A deferred compensation plan (the “Plan”) is available to the Trustees on a voluntary basis. Deferred amounts remain in the Trust until distributed in accordance with the provisions of the Plan. The value of a participating Trustee’s deferral account is based on theoretical investments of deferred amounts on the normal payment dates in certain portfolios of the Trust or Met Investors Series Trust, an affiliate of the Trust, as designated by the participating Trustee. Changes in the value of participants’ deferral accounts are reflected as Trustees’ fees and expenses in the Statement of Operations. The portion of the accrued obligations allocated to the Asset Allocation Portfolio under the Plan is reflected as Deferred trustees’ fees in the Statement of Assets and Liabilities.
6. Transactions in Securities of Affiliated Underlying Portfolios
The Asset Allocation Portfolio does not invest in the Underlying Portfolios for the purpose of exercising control; however, investments by the Asset Allocation Portfolio within its principal investment strategies may represent a significant portion of the Underlying Portfolios’ net assets. Transactions in the Underlying Portfolios for the six months ended June 30, 2016 were as follows:
| | | | | | | | | | | | | | | | |
Underlying Portfolio | | Number of
shares held at
December 31, 2015 | | | Shares
purchased | | | Shares
sold | | | Number of
shares held at
June 30, 2016 | |
Baillie Gifford International Stock | | | 676,030 | | | | 181,183 | | | | (106,114 | ) | | | 751,099 | |
BlackRock Bond Income | | | 751,851 | | | | 77,289 | | | | (15,213 | ) | | | 813,927 | |
BlackRock Capital Appreciation | | | 180,539 | | | | 63,807 | | | | (20,394 | ) | | | 223,952 | |
BlackRock High Yield | | | 455,067 | | | | 63,965 | | | | (27,254 | ) | | | 491,778 | |
BlackRock Large Cap Value | | | 781,037 | | | | 266,434 | | | | (154,658 | ) | | | 892,813 | |
Clarion Global Real Estate | | | 280,825 | | | | 53,188 | | | | (43,278 | ) | | | 290,735 | |
Goldman Sachs Mid Cap Value | | | 293,121 | | | | 70,675 | | | | (194,741 | ) | | | 169,055 | |
MSF-12
Metropolitan Series Fund
MetLife Asset Allocation 20 Portfolio
Notes to Financial Statements—June 30, 2016—(Continued)
| | | | | | | | | | | | | | | | |
Underlying Portfolio | | Number of
shares held at
December 31, 2015 | | | Shares
purchased | | | Shares sold | | | Number of
shares held at
June 30, 2016 | |
Harris Oakmark International | | | 487,931 | | | | 411,131 | | | | (89,755 | ) | | | 809,307 | |
Invesco Comstock | | | 938,190 | | | | 371,537 | | | | (160,241 | ) | | | 1,149,486 | |
Jennison Growth | | | 430,005 | | | | 204,235 | | | | (57,147 | ) | | | 577,093 | |
JPMorgan Core Bond | | | 6,142,782 | | | | 433,937 | | | | (206,042 | ) | | | 6,370,677 | |
JPMorgan Small Cap Value | | | 214,450 | | | | 72,948 | | | | (43,573 | ) | | | 243,825 | |
Lord Abbett Bond Debenture | | | 284,299 | | | | 54,886 | | | | (339,185 | ) | | | — | |
Met/Aberdeen Emerging Markets Equity | | | 199,885 | | | | 45,654 | | | | (46,781 | ) | | | 198,758 | |
Met/Artisan International | | | 686,411 | | | | 159,802 | | | | (60,909 | ) | | | 785,304 | |
Met/Artisan Mid Cap Value | | | 15,215 | | | | 3,650 | | | | (10,173 | ) | | | 8,692 | |
Met/Eaton Vance Floating Rate | | | 1,347,339 | | | | 109,504 | | | | (43,274 | ) | | | 1,413,569 | |
Met/Franklin Low Duration Total Return | | | 4,149,783 | | | | 310,368 | | | | (768,808 | ) | | | 3,691,343 | |
Met/Templeton International Bond | | | 1,322,475 | | | | 141,476 | | | | (363,063 | ) | | | 1,100,888 | |
Met/Wellington Core Equity Opportunities (formerly, WMC Core Equity Opportunities) | | | 465,081 | | | | 84,303 | | | | (39,814 | ) | | | 509,570 | |
Met/Wellington Large Cap Research (formerly, WMC Large Cap Research) | | | 472,534 | | | | 142,697 | | | | (59,052 | ) | | | 556,179 | |
MetLife Small Cap Value | | | 256,341 | | | | 71,013 | | | | (53,700 | ) | | | 273,654 | |
MFS Research International | | | 472,705 | | | | 129,445 | | | | (59,416 | ) | | | 542,734 | |
MFS Value | | | 872,478 | | | | 241,157 | | | | (112,267 | ) | | | 1,001,368 | |
Neuberger Berman Genesis | | | 359,440 | | | | 73,987 | | | | (57,104 | ) | | | 376,323 | |
Oppenheimer Global Equity | | | — | | | | 102,854 | | | | (1,820 | ) | | | 101,034 | |
PIMCO Inflation Protected Bond | | | 6,446,923 | | | | 210,558 | | | | (228,981 | ) | | | 6,428,500 | |
PIMCO Total Return | | | 7,048,316 | | | | 473,675 | | | | (158,875 | ) | | | 7,363,116 | |
T. Rowe Price Large Cap Growth | | | 290,773 | | | | 124,421 | | | | (34,263 | ) | | | 380,931 | |
T. Rowe Price Large Cap Value | | | 387,245 | | | | 136,910 | | | | (55,602 | ) | | | 468,553 | |
TCW Core Fixed Income | | | 6,349,046 | | | | 911,333 | | | | (116,723 | ) | | | 7,143,656 | |
Western Asset Management Strategic Bond Opportunities | | | 1,847,566 | | | | 385,379 | | | | (73,973 | ) | | | 2,158,972 | |
Western Asset Management U.S. Government | | | 7,266,635 | | | | 519,575 | | | | (157,209 | ) | | | 7,629,001 | |
| | | | |
Underlying Portfolio | | Net Realized
Gain/(Loss) on sales
of Affiliated
Underlying
Portfolios | | | Capital Gain
Distributions
from Affiliated
Underlying
Portfolios | | | Dividend Income
from Affiliated
Underlying
Portfolios | | | Ending Value
as of
June 30, 2016 | |
Baillie Gifford International Stock | | $ | 105,546 | | | $ | — | | | $ | 112,447 | | | $ | 7,188,021 | |
BlackRock Bond Income | | | 60,386 | | | | — | | | | 2,763,710 | | | | 88,034,315 | |
BlackRock Capital Appreciation | | | 195,274 | | | | 618,669 | | | | — | | | | 7,126,144 | |
BlackRock High Yield | | | (28,288 | ) | | | — | | | | 235,139 | | | | 3,521,132 | |
BlackRock Large Cap Value | | | (95,888 | ) | | | 526,773 | | | | 115,256 | | | | 7,160,360 | |
Clarion Global Real Estate | | | 13,807 | | | | — | | | | 80,098 | | | | 3,578,950 | |
Goldman Sachs Mid Cap Value | | | (761,794 | ) | | | 131,729 | | | | 19,158 | | | | 1,788,598 | |
Harris Oakmark International | | | 33,578 | | | | 579,670 | | | | 206,882 | | | | 8,886,188 | |
Invesco Comstock | | | 216,790 | | | | 1,075,325 | | | | 390,580 | | | | 14,357,077 | |
Jennison Growth | | | 152,337 | | | | 904,584 | | | | 20,439 | | | | 7,121,329 | |
JPMorgan Core Bond | | | 23 | | | | — | | | | 1,995,029 | | | | 66,828,400 | |
JPMorgan Small Cap Value | | | (44,467 | ) | | | 230,922 | | | | 64,216 | | | | 3,596,415 | |
Lord Abbett Bond Debenture | | | (39,933 | ) | | | — | | | | 230,095 | | | | — | |
Met/Aberdeen Emerging Markets Equity | | | (95,637 | ) | | | — | | | | 21,183 | | | | 1,796,773 | |
Met/Artisan International | | | (44,924 | ) | | | — | | | | 64,074 | | | | 7,138,413 | |
Met/Artisan Mid Cap Value | | | 215,645 | | | | 186,396 | | | | 18,706 | | | | 1,795,811 | |
Met/Eaton Vance Floating Rate | | | 6,099 | | | | — | | | | 577,739 | | | | 13,951,929 | |
Met/Franklin Low Duration Total Return | | | (216,614 | ) | | | — | | | | 1,115,822 | | | | 34,957,014 | |
Met/Templeton International Bond | | | (869,946 | ) | | | 27,285 | | | | — | | | | 10,568,524 | |
Met/Wellington Core Equity Opportunities (formerly, WMC Core Equity Opportunities) | | | (65,370 | ) | | | 610,902 | | | | 223,684 | | | | 14,339,313 | |
Met/Wellington Large Cap Research (formerly, WMC Large Cap Research) | | | 43,105 | | | | 455,332 | | | | 167,395 | | | | 7,169,142 | |
MetLife Small Cap Value | | | (375,392 | ) | | | 91,306 | | | | 44,904 | | | | 3,604,026 | |
MFS Research International | | | 85,698 | | | | — | | | | 115,596 | | | | 5,373,067 | |
MFS Value | | | 358,411 | | | | 1,238,363 | | | | 310,454 | | | | 14,359,620 | |
Neuberger Berman Genesis | | | 355,476 | | | | — | | | | 32,455 | | | | 7,180,238 | |
Oppenheimer Global Equity | | | 7 | | | | 86,322 | | | | 20,732 | | | | 1,785,267 | |
PIMCO Inflation Protected Bond | | | (347,074 | ) | | | — | | | | — | | | | 63,385,014 | |
MSF-13
Metropolitan Series Fund
MetLife Asset Allocation 20 Portfolio
Notes to Financial Statements—June 30, 2016—(Continued)
| | | | | | | | | | | | | | | | |
Underlying Portfolio | | Net Realized
Gain/(Loss) on sales
of Affiliated
Underlying
Portfolios | | | Capital Gain
Distributions
from Affiliated
Underlying
Portfolios | | | Dividend Income
from Affiliated
Underlying
Portfolios | | | Ending Value
as of
June 30, 2016 | |
PIMCO Total Return | | $ | (155,409 | ) | | $ | — | | | $ | 2,322,635 | | | $ | 84,307,675 | |
T. Rowe Price Large Cap Growth | | | 136,059 | | | | 859,957 | | | | 4,130 | | | | 7,115,799 | |
T. Rowe Price Large Cap Value | | | 727,745 | | | | 1,585,268 | | | | 415,954 | | | | 14,365,823 | |
TCW Core Fixed Income | | | 13,471 | | | | — | | | | 588,145 | | | | 73,722,532 | |
Western Asset Management Strategic Bond Opportunities | | | 41,503 | | | | — | | | | 434,517 | | | | 28,109,816 | |
Western Asset Management U.S. Government | | | 24,208 | | | | — | | | | 2,360,997 | | | | 91,166,563 | |
| | | | | | | | | | | | | | | | |
| | $ | (355,568 | ) | | $ | 9,208,803 | | | $ | 15,072,171 | | | $ | 705,379,288 | |
| | | | | | | | | | | | | | | | |
7. Contractual Obligations
Under the Trust’s organizational documents, its officers and Trustees may be indemnified against certain liabilities and expenses arising out of the performance of their duties to the Trust. Additionally, the Trust has a variety of indemnification obligations under contracts with its service providers. The Trust’s maximum exposure under these arrangements is unknown, as this would involve future claims that may be made against the Trust that have not yet occurred.
8. Income Tax Information
The tax character of distributions paid for the years ended December 31, 2015 and 2014 were as follows:
| | | | | | | | | | | | | | | | | | | | |
Ordinary Income | | | Long-Term Capital Gain | | | Total | |
2015 | | 2014 | | | 2015 | | | 2014 | | | 2015 | | | 2014 | |
| $14,585,605 | | $ | 27,307,125 | | | $ | 21,269,398 | | | $ | 27,567,555 | | | $ | 35,855,003 | | | $ | 54,874,680 | |
As of December 31, 2015, the components of distributable earnings (accumulated losses) on a federal income tax basis were as follows:
| | | | | | | | | | | | | | | | |
Undistributed
Ordinary
Income | | Undistributed
Long-Term
Capital Gain | | | Net
Unrealized
Depreciation | | | Other
Accumulated
Capital Losses | | | Total | |
| $22,350,597 | | $ | 22,951,030 | | | $ | (28,622,577 | ) | | $ | — | | | $ | 16,679,050 | |
The Asset Allocation Portfolio utilizes the provisions of the federal income tax laws that provide for the carryforward of capital losses for prior years, offsetting such losses against any future realized capital gains. Under the Regulated Investment Company Modernization Act of 2010 (the “Act”), net capital losses recognized after December 22, 2010 may be carried forward indefinitely and their character is retained as short-term and/or long-term losses. Previously, net capital losses were carried forward for up to eight years and treated as short-term losses. As a transition rule, the Act requires that post-enactment net capital losses be used before pre-enactment net capital losses.
As of December 31, 2015, the Asset Allocation Portfolio had no post-enactment accumulated capital losses and no pre-enactment accumulated capital loss carryforwards.
MSF-14
Metropolitan Series Fund
MetLife Asset Allocation 40 Portfolio
Managed by MetLife Advisers, LLC
Portfolio Manager Commentary*
PERFORMANCE
For the six month period ended June 30, 2016, the Class A and B shares of the MetLife Asset Allocation 40 Portfolio returned 3.24% and 3.16%, respectively. The Portfolio’s benchmark, the Dow Jones Moderately Conservative Index1, returned 5.72%.
MARKET ENVIRONMENT / CONDITIONS
The first half of 2016 saw conflicted equity markets, remarkable bond performance and a second quarter rally in commodities. The themes of weak global growth persist, marked by a continued slowdown of Chinese gross domestic product (“GDP”) and razor-thin growth rates for developed economies. Commodities, as measured by the Bloomberg Commodity Index, were up 13.3%, largely driven by gains in the energy sub-index as oil jumped nearly $10 per barrel from recent lows. However, as the supply and demand in the period was decomposed, it appeared that the increase might have been due to supply side dynamics, and not necessarily driven by demand. As a result, the jump in oil price did not signal a turnaround in Chinese demand or some other bullish interpretation. The VIX volatility index experienced two notable spikes above the historical index average (one in late January/early February and the second in the period leading up to the so-called “Brexit” vote, the withdrawal of the United Kingdom (the “U.K.”) from the European Union), as investors transmitted their fears into their trading patterns, elevating volatility. Equities appeared historically overvalued when examining the cyclically-adjusted Shiller price/earnings (“P/E”) ratio, which showed domestic equities hovering near the third-highest valuation level since the 1870’s and did not give confidence to investors since high market P/E ratios have historically preceded periods of declining equity prices. The Federal Reserve, clearly anxious about repeating their December 2015 25 basis point rate hike in the middle of the uncertainty, signaled a flat 2016 for policy actions. All of this uncertainty led to flight-to-safety behavior which drove U.S. Treasuries to gain 5.4% (as measured by the Barclays U.S. Treasury Index) and global sovereign debt to gain an unfathomable 11.6% (as measured by the Barclays Global Treasury Index). Likewise, the price of spot gold experienced its most notable surge since the post-crisis period, with the price per troy ounce gaining nearly 25% in the first half as investors seemed to prefer safer assets. Yet, despite all of the activity which typically correlates with a bearish market, domestic equities shrugged off the intra-period uncertainty and finished the second half surging to near all-time highs—just days after rebounding from a temporary decline after the U.K. voted to do the unthinkable and leave the European Union on June 24th.
The U.S. stock market, as measured by the S&P 500 Index, returned 3.8% in the first half of 2016. Along the capitalization spectrum, mid-cap outperformed small-cap and large-cap stocks. The S&P 400 Mid Cap Index returned 7.9%, while the S&P 600 Small Cap Index returned 6.2%. Value stocks noticeably outperformed growth stocks, as measured by the Russell 3000 Value and Growth Indices (6.3% versus 1.4%). This represents a dramatic turnaround from last year, when growth stocks massively outperformed value. Foreign developed equities, as represented by the MSCI EAFE Index, fell 4.4% on the heels of a poor performance by Japanese equity markets and a broad European post-Brexit selloff. Interestingly, the U.K. market itself was unfazed by its own vote, with the FTSE 100 at a 7-month high just days after a brief post-vote tumble. Emerging market equities, as represented by the MSCI Emerging Markets Index, gained 6.4%—a welcome change after turning in very poor results last year when commodities suffered.
Fixed income markets experienced returns in the first half that defied all expectations of bond bears. As mentioned earlier, Global Treasuries generated returns of 11.6% due to yield curve movements alone. In the U.S., the 10-year Treasury rate fell an astounding 75 basis points in the first half, dropping from 2.24% to 1.49%. In the Eurozone, average European sovereign debt rates fell over 80 basis points, dropping from 70 basis points to negative 10 basis points. While rates were the big driver of fixed income returns, diversified core fixed income also did very well. The domestic Barclays U.S. Aggregate Bond Index returned 5.3% in the first half of 2016. Meanwhile, the Barclays Global Aggregate Bond Index returned 9.0%. In domestic core fixed income, top-performing subsectors included 20+ year Treasuries, which gained 15.8%, while long maturity Foreign Agency issues returned 17.2%. Long Corporates were also additive, delivering a return of 13.9% in the first half of the year.
PORTFOLIO REVIEW / PERIOD-END POSITIONING
The MetLife Asset Allocation 40 Portfolio invested in underlying portfolios of the Met Investors Series Trust and the Metropolitan Series Fund to maintain a broad asset allocation of approximately 40% to equities and 60% to fixed income.
Over the six month period, the Portfolio underperformed the Dow Jones Moderately Conservative Index. A large cap orientation vis-à-vis the Dow Jones Index within domestic equity held back relative results, as did a slight overweight to developed markets and an underweight to emerging market equities, while an overweight to high yield bonds helped to offset these losses. During the period, security selection in the underlying portfolios detracted from relative results.
The fixed income underlying portfolios in aggregate made a negative contribution to performance. The Met/Templeton International Bond Portfolio, which employs a benchmark-unconstrained approach resulting in large active positions compared to its benchmark index, was the most significant detractor. During the period, a sizable underweight to the euro and the Japanese yen and an overweight to the dollar was unfavorable, given the dollar weakness as these currencies strengthened. During the six month period, U.S. Treasury interest rates across the yield curve generally fell and the yield curve flattened, with longer term maturities falling more than shorter term maturities. The Met/Templeton International Bond Portfolio, which has continued to position for a rising rate environment by maintaining a low portfolio duration, was negatively impacted in this environment. Not surprisingly, this interest rate environment didn’t bode well either for those portfolios with a shorter duration posture relative to the benchmark, in particular the Western Asset Management U.S. Government Portfolio and the Met/Franklin Low Duration Total Return Portfolio. The Western Asset Management U.S.
MSF-1
Metropolitan Series Fund
MetLife Asset Allocation 40 Portfolio
Managed by MetLife Advisers, LLC
Portfolio Manager Commentary*—(Continued)
Government Portfolio was a meaningful detractor from the Portfolio’s relative results, not only due to its shorter duration, but as a result of its composition, investing predominantly in government and government-related securities during a period in which spread sectors outperformed. With respect to the Met/Franklin Low Duration Total Return Portfolio, despite it detracting from the Asset Allocation Portfolio’s relative results, it managed to slightly outperform its respective index due to the Portfolio’s exposures to high yield securities, which outperformed their investment grade counterparts. Another notable detractor from fixed income results was the PIMCO Total Return Portfolio, which held an underweight to both U.S. duration and the front end of the U.K. yield curve, which hurt performance as rates fell. On the other hand, exposure to Treasury Inflation Protected securities (“TIPS”) via the PIMCO Inflation Protected Bond Portfolio was additive during the period, as TIPS outpaced nominal Treasury securities.
The domestic equity portfolios in aggregate detracted modestly from performance. While most growth-oriented portfolios detracted from performance, portfolios managed with a value style in general contributed positively, as a value style significantly outpaced growth over the six month period. Within the growth portfolios, the Jennison Growth Portfolio, T. Rowe Price Large Cap Growth Portfolio and BlackRock Capital Appreciation Portfolio were among the top detractors. The Jennison Growth Portfolio underperformed its benchmark as a result of both stock selection and sector allocation. Most notably, stock selection in Health Care, Information Technology and Consumer Discretionary sectors proved to be detrimental. Within the Health Care sector, holdings in Alexion Pharmaceuticals, Allergan plc and Regeneron Pharmaceuticals were the leading detractors. Within the Information Technology sector, positioning in the software and services industry was a key driver of underperformance, in particular a holding in LinkedIn Corp. Detracting from results in the Consumer Discretionary sector was positioning in retailing, most notably Netflix Inc. Similarly, with T. Rowe Price Large Cap Growth Portfolio, stock selection in the Health Care and Information Technology sectors held back relative results, along with an underweight to the Consumer Staples sector. The BlackRock Capital Appreciation Portfolio was also a meaningful detractor from relative performance and, like the other growth portfolios, was hurt by stock selection in Consumer Discretionary, Health Care and Information Technology sectors. Another notable detractor was the ClearBridge Aggressive Growth Portfolio, which underperformed its benchmark, primarily driven by an overweight and stock selection in the Health Care sector, in particular positioning in pharmaceuticals. On the other hand, a number of value-oriented portfolios contributed positively, with the MFS Value Portfolio being the top contributor. In addition from benefiting from its value style, the Portfolio outperformed its value benchmark. Contributing positively to results during the period were stock selection within the Industrials and Financials sectors, which was partly offset by an underweight to the Utilities sector and industry positioning within the Financials sector. Additionally, an overweight to the Consumer Staples sector aided results. The Met/Wellington Core Equity Opportunities Portfolio’s focus on dividend growing companies was rewarded by the market during the six month period. In particular, stock selection in the Industrials and Health Care sectors were the main drivers of performance, while selection in the Consumer Staples sector detracted.
Among the equity portfolios that invest outside the U.S, the Harris Oakmark International Portfolio was the leading detractor. A combination of sector allocation and stock selection detracted from results, in particular an overweight to the Financials sector. Individual detractors included Credit Suisse Group (Switzerland), Nomura Holdings (Japan) and Lloyds Banking Group (United Kingdom). Additionally, a meaningful overweight and stock selection in the Consumer Discretionary sector hampered results. Notable detractors included Daimler AG (Germany), Honda Motor and Toyota Motor (Japan). Conversely, the Van Eck Global Natural Resources Portfolio had a meaningful positive impact on results, as commodities, in particular energy, posted strong results over the period. The Van Eck Global Natural Resources Portfolio outpaced its benchmark, with the primary drivers being overweight allocations to gold and diversified metals and mining and an underweight allocation to oil and gas refining and marketing. Another notable contributor to results was the Met/Aberdeen Emerging Markets Equity Portfolio, as emerging markets generated exceptional performance when compared to the developed markets. The Met/Aberdeen Emerging Markets Portfolio outperformed its emerging markets index, with the key contributors including positioning in Brazil and China, although exposures in Hong Kong offset some of the positive impacts.
Investment Committee
MetLife Advisers, LLC
* This commentary may include statements that constitute “forward-looking statements” under the U.S. securities laws. Forward-looking statements include, among other things, projections, estimates, and information about possible or future results related to the Portfolio, market or regulatory developments. The views expressed above are not guarantees of future performance or economic results and involve certain risks, uncertainties and assumptions that could cause actual outcomes and results to differ materially from the views expressed herein. The views expressed above are subject to change at any time based upon economic, market, or other conditions and the advisory firm undertakes no obligation to update the views expressed herein. Any discussions of specific securities should not be considered a recommendation to buy or sell those securities. The views expressed above (including any forward-looking statement) may not be relied upon as investment advice or as an indication of the Portfolio’s trading intent. Information about the Portfolio’s holdings, asset allocation or country diversification is historical and is not an indication of future Portfolio composition, which may vary. Direct investment in any index is not possible. The performance of any index mentioned in this commentary has not been adjusted for ongoing management, distribution and operating expenses, and sales charges applicable to mutual fund investments. In addition, the returns do not reflect additional fees charged by separate accounts or variable insurance contracts that an investor in the Portfolio may pay. If these additional fees were reflected, performance would have been lower.
MSF-2
Metropolitan Series Fund
MetLife Asset Allocation 40 Portfolio
A $10,000 INVESTMENT COMPARED TO THE DOW JONES MODERATELY CONSERVATIVE INDEX
SIX MONTH RETURN & AVERAGE ANNUAL RETURNS (%) AS OF JUNE 30, 2016
| | | | | | | | | | | | | | | | |
| | | 6 Month | | | 1 Year | | | 5 Year | | | 10 Year | |
| MetLife Asset Allocation 40 Portfolio | | | | | | | | | | | | | | | | |
Class A | | | 3.24 | | | | 0.79 | | | | 5.39 | | | | 5.28 | |
Class B | | | 3.16 | | | | 0.60 | | | | 5.14 | | | | 5.02 | |
| Dow Jones Moderately Conservative Index | | | 5.72 | | | | 4.09 | | | | 4.91 | | | | 5.21 | |
1 The Dow Jones Moderately Conservative Index is a total return index designed to provide asset allocation strategists with a target risk benchmark. Each month, the Index adjusts its weighting of stocks, bonds, and cash indices (both domestic and foreign) such that the risk combination will have 40% of the risk of an all equity portfolio.
Portfolio performance is calculated including reinvestment of all income and capital gain distributions. Performance numbers are net of all Portfolio expenses but do not include any insurance, sales, separate account or administrative charges of variable annuity or life insurance contracts or any additional expenses that participants may bear relating to the operations of their plans. If these charges were included, the returns would be lower. The performance of any index referenced above has not been adjusted for ongoing management, distribution and operating expenses, and sales charges applicable to mutual fund investments. Direct investment in any index is not possible. The performance of Class A shares, as set forth in the line graph above, will differ from that of other classes because of the difference in expenses paid by policyholders investing in the different share classes.
This information represents past performance and is not indicative of future results. Investment return and principal value may fluctuate so that shares, upon redemption, may be worth more or less than the original cost.
PORTFOLIO COMPOSITION AS OF JUNE 30, 2016
Top Holdings
| | | | |
| | | % of
Net Assets | |
| BlackRock Bond Income Portfolio (Class A) | | | 9.5 | |
| PIMCO Total Return Portfolio (Class A) | | | 9.1 | |
| Western Asset Management U.S. Government Portfolio (Class A) | | | 8.1 | |
| TCW Core Fixed Income Portfolio (Class A) | | | 8.0 | |
| JPMorgan Core Bond Portfolio (Class A) | | | 7.1 | |
| PIMCO Inflation Protected Bond Portfolio (Class A) | | | 6.1 | |
| Met/Wellington Core Equity Opportunities Portfolio (formerly, WMC Core Equity Opportunities Portfolio) (Class A) | | | 3.7 | |
| Western Asset Management Strategic Bond Opportunities Portfolio (Class A) | | | 3.5 | |
| MFS Value Portfolio (Class A) | | | 3.5 | |
| T. Rowe Price Large Cap Value Portfolio (Class A) | | | 3.5 | |
MSF-3
Metropolitan Series Fund
MetLife Asset Allocation 40 Portfolio
Understanding Your Portfolio’s Expenses (Unaudited)
Shareholder Expense Example
As a shareholder of the Portfolio, you incur ongoing costs, including management fees; distribution and service (12b-1) fees; and other Portfolio expenses. This example is intended to help you understand your ongoing costs (in dollars) (referred to as “expenses”) of investing in the Portfolio and compare these costs with the ongoing costs of investing in other mutual funds. The example is based on an investment of $1,000 invested at the beginning of the period and held for the entire period, January 1, 2016 through June 30, 2016.
Actual Expenses
The first line for each share class of the Portfolio in the table below provides information about actual account values and actual expenses. You may use the information in this line, together with the amount you invested in the particular share class of the Portfolio, to estimate the expenses that you paid over the period. Simply divide your account value by $1,000 (for example, an $8,600 account value divided by $1,000 = 8.6), then multiply the result by the number in the first line under the heading entitled “Expenses Paid During Period” to estimate the expenses you paid on your account during this period.
Hypothetical Example for Comparison Purposes
The second line for each share class of the Portfolio in the table below provides information about hypothetical account values and hypothetical expenses based on the Portfolio’s actual expense ratio and an assumed rate of return of 5% per year before expenses, which is not the Portfolio’s actual return. The hypothetical account values and expenses may not be used to estimate the actual ending account balance or expenses you paid for the period. You may use this information to compare the ongoing costs of investing in the Portfolio and other funds. To do so, compare this 5% hypothetical example with the 5% hypothetical examples that appear in the shareholder reports of the other funds.
Please note that the expenses shown in the table are meant to highlight your ongoing costs only and do not reflect any fees or charges of your variable insurance product or any additional expenses that participants in certain eligible qualified plans may bear relating to the operations of their plan. Therefore, the second line for each share class in the table is useful in comparing ongoing costs only, and will not help you determine the relative total costs of owning different funds. In addition, if these other costs were included, your costs would have been higher.
| | | | | | | | | | | | | | | | | | |
MetLife Asset Allocation 40 Portfolio | | | | Annualized
Expense
Ratio | | | Beginning
Account Value
January 1,
2016 | | | Ending
Account Value
June 30,
2016 | | | Expenses Paid
During Period**
January 1, 2016
to
June 30,
2016 | |
Class A(a) | | Actual | | | 0.62 | % | | $ | 1,000.00 | | | $ | 1,032.40 | | | $ | 3.13 | |
| | Hypothetical* | | | 0.62 | % | | $ | 1,000.00 | | | $ | 1,021.78 | | | $ | 3.12 | |
| | | | | |
Class B(a) | | Actual | | | 0.87 | % | | $ | 1,000.00 | | | $ | 1,031.60 | | | $ | 4.39 | |
| | Hypothetical* | | | 0.87 | % | | $ | 1,000.00 | | | $ | 1,020.54 | | | $ | 4.37 | |
* Hypothetical assumes a rate of return of 5% per year before expenses.
** Expenses paid are equal to the Portfolio’s annualized expense ratio for the most recent six month period, as shown above, multiplied by the average account value over the period, multiplied by the number of days (182 days) in the most recent fiscal half-year, divided by 366 (to reflect the one-half year period).
(a) The annualized expense ratio reflects the expenses of both the Portfolio and the Underlying Portfolios in which it invests.
MSF-4
Metropolitan Series Fund
MetLife Asset Allocation 40 Portfolio
Schedule of Investments as of June 30, 2016 (Unaudited)
Mutual Funds—100.0% of Net Assets
| | | | | | | | |
| Security Description | | Shares | | | Value | |
|
Affiliated Investment Companies—100.0% | |
Baillie Gifford International Stock Portfolio (Class A) (a) | | | 14,533,617 | | | $ | 139,086,711 | |
BlackRock Bond Income Portfolio (Class A) (a) | | | 6,232,820 | | | | 674,141,767 | |
BlackRock Capital Appreciation Portfolio (Class A) (a) | | | 4,428,511 | | | | 140,915,229 | |
BlackRock High Yield Portfolio (Class A) (b) | | | 4,973,484 | | | | 35,610,149 | |
BlackRock Large Cap Value Portfolio (Class A) (a) | | | 17,571,259 | | | | 140,921,496 | |
Clarion Global Real Estate Portfolio (Class A) (b) | | | 4,366,420 | | | | 53,750,632 | |
ClearBridge Aggressive Growth Portfolio (Class A) (b) | | | 7,221,922 | | | | 105,078,962 | |
Goldman Sachs Mid Cap Value Portfolio (Class A) (b) | | | 1,677,733 | | | | 17,750,412 | |
Harris Oakmark International Portfolio (Class A) (b) | | | 15,884,035 | | | | 174,406,706 | |
Invesco Comstock Portfolio (Class A) (b) | | | 16,930,386 | | | | 211,460,522 | |
Invesco Small Cap Growth Portfolio (Class A) (b) | | | 7,024,977 | | | | 87,882,457 | |
Jennison Growth Portfolio (Class A) (a) | | | 8,424,195 | | | | 103,954,563 | |
JPMorgan Core Bond Portfolio (Class A) (b) | | | 47,652,121 | | | | 499,870,754 | |
JPMorgan Small Cap Value Portfolio (Class A) (b) | | | 3,590,757 | | | | 52,963,668 | |
Met/Aberdeen Emerging Markets Equity Portfolio (Class A) (b) | | | 7,958,445 | | | | 71,944,339 | |
Met/Artisan International Portfolio (Class A) (b) | | | 9,481,933 | | | | 86,190,772 | |
Met/Artisan Mid Cap Value Portfolio (Class A) (a) | | | 85,157 | | | | 17,594,272 | |
Met/Eaton Vance Floating Rate Portfolio (Class A) (b) | | | 14,376,264 | | | | 141,893,727 | |
Met/Franklin Low Duration Total Return Portfolio (Class A) (b) | | | 22,523,443 | | | | 213,297,004 | |
Met/Templeton International Bond Portfolio (Class A) (b) | | | 18,603,620 | | | | 178,594,749 | |
Met/Wellington Core Equity Opportunities Portfolio (formerly, WMC Core Equity Opportunities Portfolio) (Class A) (a) | | | 9,403,660 | | | | 264,618,998 | |
Met/Wellington Large Cap Research Portfolio (formerly, WMC Large Cap Research Portfolio) (Class A) (b) | | | 12,218,849 | | | | 157,500,969 | |
MetLife Small Cap Value Portfolio (Class A) (b) | | | 5,343,861 | | | | 70,378,656 | |
MFS Research International Portfolio (Class A) (b) | | | 10,459,509 | | | | 103,549,138 | |
|
Affiliated Investment Companies—(Continued) | |
MFS Value Portfolio (Class A) (a) | | | 17,431,254 | | | | 249,964,184 | |
Neuberger Berman Genesis Portfolio (Class A) (a) | | | 2,796,912 | | | | 53,365,076 | |
Oppenheimer Global Equity Portfolio (Class A) (b) | | | 3,826,057 | | | | 67,606,424 | |
PIMCO Inflation Protected Bond Portfolio (Class A) (b) (c) | | | 43,516,817 | | | | 429,075,819 | |
PIMCO Total Return Portfolio (Class A) (b) | | | 56,133,090 | | | | 642,723,884 | |
T. Rowe Price Large Cap Growth Portfolio (Class A) (a) | | | 7,468,888 | | | | 139,518,832 | |
T. Rowe Price Large Cap Value Portfolio (Class A) (b) | | | 8,122,971 | | | | 249,050,289 | |
T. Rowe Price Mid Cap Growth Portfolio (Class A) (b) | | | 3,570,231 | | | | 35,345,291 | |
TCW Core Fixed Income Portfolio (Class A ) (b) | | | 54,790,651 | | | | 565,439,515 | |
Van Eck Global Natural Resources Portfolio (Class A) (a) | | | 7,324,723 | | | | 71,342,805 | |
Western Asset Management Strategic Bond Opportunities Portfolio (Class A) (a) | | | 19,202,805 | | | | 250,020,521 | |
Western Asset Management U.S. Government Portfolio (Class A) (a) | | | 47,651,091 | | | | 569,430,540 | |
| | | | | | | | |
Total Mutual Funds
(Cost $7,210,488,123) | | | | | | | 7,066,239,832 | |
| | | | | | | | |
Total Investments—100.0%
(Cost $7,210,488,123) (d) | | | | | | | 7,066,239,832 | |
Other assets and liabilities (net)—0.0% | | | | | | | (1,970,096 | ) |
| | | | | | | | |
| Net Assets—100.0% | | | | | | $ | 7,064,269,736 | |
| | | | | | | | |
| (a) | A Portfolio of Metropolitan Series Fund. (See Note 6 of the Notes to Financial Statements for a summary of transactions in the securities of affiliated Underlying Portfolios.) |
| (b) | A Portfolio of Met Investors Series Trust. (See Note 6 of the Notes to Financial Statements for a summary of transactions in the securities of affiliated Underlying Portfolios.) |
| (c) | Non-income producing security. |
| (d) | As of June 30, 2016, the aggregate cost of investments was $7,210,488,123. The aggregate unrealized appreciation and depreciation of investments were $187,947,514 and $(332,195,805), respectively, resulting in net unrealized depreciation of $(144,248,291). |
See accompanying notes to financial statements.
MSF-5
Metropolitan Series Fund
MetLife Asset Allocation 40 Portfolio
Schedule of Investments as of June 30, 2016 (Unaudited)
Fair Value Hierarchy
Accounting principles generally accepted in the United States of America (“GAAP”) define fair market value as the price that the Portfolio would receive to sell an asset or pay to transfer a liability in an orderly transaction between market participants at the measurement date. It establishes a fair value hierarchy that prioritizes inputs to valuation methods and requires disclosure of the fair value hierarchy, separately for each major category of assets and liabilities, that segregates fair value measurements into three levels. Levels 1, 2 and 3 of the fair value hierarchy are defined as follows:
Level 1 - unadjusted quoted prices in active markets for identical investments
Level 2 - other significant observable inputs (including, but not limited to, quoted prices for similar assets or liabilities in markets that are either active or inactive; inputs other than quoted prices that are observable such as interest rates, yield curves, volatilities, prepayment speeds, loss severities, credit risks, default rates, or other market corroborated inputs)
Level 3 - significant unobservable inputs based on the best information available in the circumstances, to the extent observable inputs are unavailable (including the Portfolio’s own assumptions used in determining the fair value of investments and derivative financial instruments)
The inputs or methodologies used for valuing investments are not necessarily an indication of the risk associated with investing in them. Changes to the inputs or methodologies used may result in transfers between levels, which will be recognized as of the beginning of the reporting period. Information on transfers between Level 1 and Level 2, if any, will be disclosed following the fair value hierarchy table below. A reconciliation of Level 3 securities, if any, will also be disclosed following the fair value hierarchy table. For more information about the Portfolio’s policy regarding the valuation of investments, please refer to the Notes to Financial Statements.
The following table summarizes the fair value hierarchy of the Portfolio’s investments as of June 30, 2016:
| | | | | | | | | | | | | | | | |
| Description | | Level 1 | | | Level 2 | | | Level 3 | | | Total | |
| Mutual Funds | | | | | | | | | | | | | | | | |
Affiliated Investment Companies | | $ | 7,066,239,832 | | | $ | — | | | $ | — | | | $ | 7,066,239,832 | |
Total Investments | | $ | 7,066,239,832 | | | $ | — | | | $ | — | | | $ | 7,066,239,832 | |
| | | | | | | | | | | | | | | | | |
See accompanying notes to financial statements.
MSF-6
Metropolitan Series Fund
MetLife Asset Allocation 40 Portfolio
Statement of Assets and Liabilities
June 30, 2016 (Unaudited)
| | | | |
Assets | |
Affiliated investments at value (a) | | $ | 7,066,239,832 | |
Receivable for: | | | | |
Investments sold | | | 1,904,677 | |
Fund shares sold | | | 51,033 | |
| | | | |
Total Assets | | | 7,068,195,542 | |
Liabilities | | | | |
Payables for: | | | | |
Investments purchased | | | 681 | |
Fund shares redeemed | | | 1,955,029 | |
Accrued Expenses: | | | | |
Management fees | | | 319,501 | |
Distribution and service fees | | | 1,423,499 | |
Deferred trustees’ fees | | | 173,029 | |
Other expenses | | | 54,067 | |
| | | | |
Total Liabilities | | | 3,925,806 | |
| | | | |
Net Assets | | $ | 7,064,269,736 | |
| | | | |
Net Assets Consist of: | | | | |
Paid in surplus | | $ | 6,938,457,626 | |
Undistributed net investment income | | | 130,518,820 | |
Accumulated net realized gain | | | 139,541,581 | |
Unrealized depreciation on affiliated investments | | | (144,248,291 | ) |
| | | | |
Net Assets | | $ | 7,064,269,736 | |
| | | | |
Net Assets | | | | |
Class A | | $ | 98,653,683 | |
Class B | | | 6,965,616,053 | |
Capital Shares Outstanding* | | | | |
Class A | | | 8,941,047 | |
Class B | | | 636,887,240 | |
Net Asset Value, Offering Price and Redemption Price Per Share | | | | |
Class A | | $ | 11.03 | |
Class B | | | 10.94 | |
| * | The Portfolio is authorized to issue an unlimited number of shares. |
| (a) | Identified cost of affiliated investments was $7,210,488,123. |
Statement of Operations
Six Months Ended June 30, 2016 (Unaudited)
| | | | |
Investment Income | |
Dividends from Affiliated Underlying Portfolios | | $ | 141,574,168 | |
Interest | | | 865 | |
| | | | |
Total investment income | | | 141,575,033 | |
Expenses | | | | |
Management fees | | | 1,939,230 | |
Administration fees | | | 11,064 | |
Custodian and accounting fees | | | 12,631 | |
Distribution and service fees—Class B | | | 8,638,934 | |
Audit and tax services | | | 14,954 | |
Legal | | | 13,587 | |
Trustees’ fees and expenses | | | 15,990 | |
Miscellaneous | | | 7,885 | |
| | | | |
Total expenses | | | 10,654,275 | |
| | | | |
Net Investment Income | | | 130,920,758 | |
| | | | |
Net Realized and Unrealized Gain (Loss) | | | | |
| Net realized gain (loss) on: | | | | |
Affiliated investments | | | (8,583,522 | ) |
Capital gain distributions from Affiliated Underlying Portfolios | | | 190,208,170 | |
| | | | |
Net realized gain | | | 181,624,648 | |
| | | | |
Net change in unrealized depreciation on affiliated investments | | | (97,904,679 | ) |
| | | | |
Net realized and unrealized gain | | | 83,719,969 | |
| | | | |
Net Increase in Net Assets From Operations | | $ | 214,640,727 | |
| | | | |
See accompanying notes to financial statements.
MSF-7
Metropolitan Series Fund
MetLife Asset Allocation 40 Portfolio
Statements of Changes in Net Assets
| | | | | | | | |
| | | Six Months
Ended
June 30,
2016
(Unaudited) | | | Year Ended
December 31,
2015 | |
Increase (Decrease) in Net Assets: | | | | | | | | |
From Operations | | | | | | | | |
Net investment income | | $ | 130,920,758 | | | $ | 207,492,901 | |
Net realized gain | | | 181,624,648 | | | | 510,606,763 | |
Net change in unrealized depreciation | | | (97,904,679 | ) | | | (781,991,413 | ) |
| | | | | | | | |
Increase (decrease) in net assets from operations | | | 214,640,727 | | | | (63,891,749 | ) |
| | | | | | | | |
From Distributions to Shareholders | | | | | | | | |
Net investment income | | | | | | | | |
Class A | | | (3,752,608 | ) | | | (518,211 | ) |
Class B | | | (245,962,542 | ) | | | (21,482,236 | ) |
Net realized capital gains | | | | | | | | |
Class A | | | (6,398,157 | ) | | | (5,972,166 | ) |
Class B | | | (452,755,406 | ) | | | (431,486,058 | ) |
| | | | | | | | |
Total distributions | | | (708,868,713 | ) | | | (459,458,671 | ) |
| | | | | | | | |
Increase (decrease) in net assets from capital share transactions | | | 303,233,695 | | | | (638,557,857 | ) |
| | | | | | | | |
Total decrease in net assets | | | (190,994,291 | ) | | | (1,161,908,277 | ) |
| | |
Net Assets | | | | | | | | |
Beginning of period | | | 7,255,264,027 | | | | 8,417,172,304 | |
| | | | | | | | |
End of period | | $ | 7,064,269,736 | | | $ | 7,255,264,027 | |
| | | | | | | | |
Undistributed net investment income | | | | | | | | |
End of period | | $ | 130,518,820 | | | $ | 249,313,212 | |
| | | | | | | | |
Other Information:
Capital Shares
Transactions in capital shares were as follows:
| | | | | | | | | | | | | | | | |
| | | Six Months Ended
June 30, 2016
(Unaudited) | | | Year Ended
December 31, 2015 | |
| | | Shares | | | Value | | | Shares | | | Value | |
Class A | | | | | | | | | | | | | | | | |
Sales | | | 309,133 | | | $ | 3,655,506 | | | | 849,812 | | | $ | 10,598,533 | |
Reinvestments | | | 927,011 | | | | 10,150,765 | | | | 528,532 | | | | 6,490,377 | |
Redemptions | | | (918,732 | ) | | | (10,848,154 | ) | | | (1,615,348 | ) | | | (20,139,971 | ) |
| | | | | | | | | | | | | | | | |
Net increase (decrease) | | | 317,412 | | | $ | 2,958,117 | | | | (237,004 | ) | | $ | (3,051,061 | ) |
| | | | | | | | | | | | | | | | |
Class B | | | | | | | | | | | | | | | | |
Sales | | | 4,177,190 | | | $ | 48,689,978 | | | | 7,961,364 | | | $ | 98,018,022 | |
Reinvestments | | | 64,397,967 | | | | 698,717,948 | | | | 37,189,515 | | | | 452,968,294 | |
Redemptions | | | (38,354,156 | ) | | | (447,132,348 | ) | | | (95,699,293 | ) | | | (1,186,493,112 | ) |
| | | | | | | | | | | | | | | | |
Net increase (decrease) | | | 30,221,001 | | | $ | 300,275,578 | | | | (50,548,414 | ) | | $ | (635,506,796 | ) |
| | | | | | | | | | | | | | | | |
Increase (decrease) derived from capital shares transactions | | | | | | $ | 303,233,695 | | | | | | | $ | (638,557,857 | ) |
| | | | | | | | | | | | | | | | |
See accompanying notes to financial statements.
MSF-8
Metropolitan Series Fund
MetLife Asset Allocation 40 Portfolio
Financial Highlights
| | | | | | | | | | | | | | | | | | | | | | | | |
| Selected per share data | |
| | | Class A | |
| | | Six Months
Ended
June 30,
2016
(Unaudited) | | | Year Ended December 31, | |
| | | | 2015 | | | 2014 | | | 2013 | | | 2012 | | | 2011 | |
Net Asset Value, Beginning of Period | | $ | 11.90 | | | $ | 12.74 | | | $ | 12.99 | | | $ | 12.14 | | | $ | 11.25 | | | $ | 11.36 | |
| | | | | | | | | | | | | | | | | | | | | | | | |
Income (Loss) from Investment Operations | | | | | | | | | | | | | | | | | | | | | | | | |
Net investment income (a) | | | 0.23 | | | | 0.36 | | | | 0.24 | | | | 0.29 | | | | 0.28 | | | | 0.29 | |
Net realized and unrealized gain (loss) on investments | | | 0.15 | | | | (0.44 | ) | | | 0.40 | | | | 1.04 | | | | 1.02 | | | | (0.14 | ) |
| | | | | | | | | | | | | | | | | | | | | | | | |
Total from investment operations | | | 0.38 | | | | (0.08 | ) | | | 0.64 | | | | 1.33 | | | | 1.30 | | | | 0.15 | |
| | | | | | | | | | | | | | | | | | | | | | | | |
Less Distributions | | | | | | | | | | | | | | | | | | | | | | | | |
Distributions from net investment income | | | (0.46 | ) | | | (0.06 | ) | | | (0.41 | ) | | | (0.35 | ) | | | (0.37 | ) | | | (0.26 | ) |
Distributions from net realized capital gains | | | (0.79 | ) | | | (0.70 | ) | | | (0.48 | ) | | | (0.13 | ) | | | (0.04 | ) | | | 0.00 | |
| | | | | | | | | | | | | | | | | | | | | | | | |
Total distributions | | | (1.25 | ) | | | (0.76 | ) | | | (0.89 | ) | | | (0.48 | ) | | | (0.41 | ) | | | (0.26 | ) |
| | | | | | | | | | | | | | | | | | | | | | | | |
Net Asset Value, End of Period | | $ | 11.03 | | | $ | 11.90 | | | $ | 12.74 | | | $ | 12.99 | | | $ | 12.14 | | | $ | 11.25 | |
| | | | | | | | | | | | | | | | | | | | | | | | |
Total Return (%) (b) | | | 3.24 | (c) | | | (0.78 | ) | | | 5.16 | | | | 11.20 | | | | 11.74 | | | | 1.27 | |
| | | | | | |
Ratios/Supplemental Data | | | | | | | | | | | | | | | | | | | | | | | | |
Ratio of expenses to average net assets (%) (d) | | | 0.06 | (e) | | | 0.06 | | | | 0.06 | | | | 0.08 | | | | 0.08 | | | | 0.08 | |
Ratio of net investment income to average net assets (%) (f) | | | 1.94 | (e)(g) | | | 2.85 | | | | 1.92 | | | | 2.31 | | | | 2.37 | | | | 2.50 | |
Portfolio turnover rate (%) | | | 8 | (c) | | | 16 | | | | 15 | | | | 15 | | | | 10 | | | | 32 | |
Net assets, end of period (in millions) | | $ | 98.7 | | | $ | 102.6 | | | $ | 112.9 | | | $ | 107.7 | | | $ | 97.3 | | | $ | 84.8 | |
| |
| | | Class B | |
| | | Six Months
Ended
June 30,
2016
(Unaudited) | | | Year Ended December 31, | |
| | | | 2015 | | | 2014 | | | 2013 | | | 2012 | | | 2011 | |
Net Asset Value, Beginning of Period | | $ | 11.79 | | | $ | 12.64 | | | $ | 12.89 | | | $ | 12.05 | | | $ | 11.17 | | | $ | 11.28 | |
| | | | | | | | | | | | | | | | | | | | | | | | |
Income (Loss) from Investment Operations | | | | | | | | | | | | | | | | | | | | | | | | |
Net investment income (a) | | | 0.22 | | | | 0.32 | | | | 0.03 | | | | 0.26 | | | | 0.25 | | | | 0.24 | |
Net realized and unrealized gain (loss) on investments | | | 0.15 | | | | (0.43 | ) | | | 0.57 | | | | 1.03 | | | | 1.01 | | | | (0.11 | ) |
| | | | | | | | | | | | | | | | | | | | | | | | |
Total from investment operations | | | 0.37 | | | | (0.11 | ) | | | 0.60 | | | | 1.29 | | | | 1.26 | | | | 0.13 | |
| | | | | | | | | | | | | | | | | | | | | | | | |
Less Distributions | | | | | | | | | | | | | | | | | | | | | | | | |
Distributions from net investment income | | | (0.43 | ) | | | (0.04 | ) | | | (0.37 | ) | | | (0.32 | ) | | | (0.34 | ) | | | (0.24 | ) |
Distributions from net realized capital gains | | | (0.79 | ) | | | (0.70 | ) | | | (0.48 | ) | | | (0.13 | ) | | | (0.04 | ) | | | 0.00 | |
| | | | | | | | | | | | | | | | | | | | | | | | |
Total distributions | | | (1.22 | ) | | | (0.74 | ) | | | (0.85 | ) | | | (0.45 | ) | | | (0.38 | ) | | | (0.24 | ) |
| | | | | | | | | | | | | | | | | | | | | | | | |
Net Asset Value, End of Period | | $ | 10.94 | | | $ | 11.79 | | | $ | 12.64 | | | $ | 12.89 | | | $ | 12.05 | | | $ | 11.17 | |
| | | | | | | | | | | | | | | | | | | | | | | | |
Total Return (%) (b) | | | 3.16 | (c) | | | (1.07 | ) | | | 4.93 | | | | 10.92 | | | | 11.46 | | | | 1.05 | |
| | | | | | |
Ratios/Supplemental Data | | | | | | | | | | | | | | | | | | | | | | | | |
Ratio of expenses to average net assets (%) (d) | | | 0.31 | (e) | | | 0.31 | | | | 0.31 | | | | 0.33 | | | | 0.33 | | | | 0.33 | |
Ratio of net investment income to average net assets (%) (f) | | | 1.70 | (e)(g) | | | 2.62 | | | | 0.21 | | | | 2.10 | | | | 2.16 | | | | 2.16 | |
Portfolio turnover rate (%) | | | 8 | (c) | | | 16 | | | | 15 | | | | 15 | | | | 10 | | | | 32 | |
Net assets, end of period (in millions) | | $ | 6,965.6 | | | $ | 7,152.6 | | | $ | 8,304.3 | | | $ | 1,678.4 | | | $ | 1,618.0 | | | $ | 1,498.6 | |
| (a) | Per share amounts based on average shares outstanding during the period. |
| (b) | Total return does not reflect any insurance, sales, separate account or administrative charges of variable annuity or life insurance contracts or any additional expenses that contract owners may bear under their variable contracts. If these charges were included, the returns would be lower. |
| (c) | Periods less than one year are not computed on an annualized basis. |
| (d) | The ratio of operating expenses to average net assets does not include expenses of the Underlying Portfolios in which the Asset Allocation Portfolio invests. |
| (e) | Computed on an annualized basis. |
| (f) | Recognition of net investment income by the Asset Allocation Portfolio is affected by the timing of the declaration of dividends by the Underlying Portfolios in which it invests. |
| (g) | The income earned by the Asset Allocation Portfolio through the investments in Underlying Portfolios is not annualized. |
See accompanying notes to financial statements.
MSF-9
Metropolitan Series Fund
MetLife Asset Allocation 40 Portfolio
Notes to Financial Statements—June 30, 2016 (Unaudited)
1. Organization
Metropolitan Series Fund (the “Trust”) is organized as a Delaware statutory trust and registered under the Investment Company Act of 1940, as amended (the “1940 Act”), as an open-end management investment company. The Trust, which is managed by MetLife Advisers, LLC (“MetLife Advisers” or the “Adviser”), an affiliate of MetLife, Inc., is currently comprised of thirty series, each of which operates as a distinct investment vehicle of the Trust. The portfolio included in this report is MetLife Asset Allocation 40 Portfolio (the “Asset Allocation Portfolio”), which is diversified. The Asset Allocation Portfolio operates under a “fund of funds” structure, investing substantially all of its assets in other Portfolios advised by MetLife Advisers (each, an “Underlying Portfolio,” and, collectively, the “Underlying Portfolios”). Shares in the Asset Allocation Portfolio are not offered directly to the general public and are currently available only to separate accounts established by Metropolitan Life Insurance Company (“MetLife”) and other affiliated life insurance companies.
The Asset Allocation Portfolio has registered and offers two classes of shares: Class A and B shares. Shares of each Class of the Asset Allocation Portfolio represent an equal pro rata interest in the Asset Allocation Portfolio and generally give the shareholder the same voting, dividend, liquidation, and other rights. Investment income, realized and unrealized capital gains and losses, the common expenses of the Asset Allocation Portfolio, and certain Asset Allocation Portfolio-level expense reductions, if any, are allocated on a pro rata basis to each Class based on the relative net assets of each Class to the net assets of the Asset Allocation Portfolio. Each Class of shares differs in its respective distribution plan and such distribution expenses are allocated to the corresponding Class of shares.
2. Significant Accounting Policies
The preparation of financial statements in conformity with accounting principles generally accepted in the United States of America (“GAAP”) requires management to make estimates and assumptions that affect the reported amounts of assets and liabilities and disclosure of contingent assets and liabilities as of the date of the financial statements and the reported amounts of income and expenses during the reporting period. Actual results could differ from those estimates. In the preparation of these financial statements, management has evaluated events and transactions subsequent to June 30, 2016 through the date the financial statements were issued.
The Asset Allocation Portfolio is an investment company and follows the accounting and reporting guidance of the Financial Accounting Standards Board (“FASB”) Accounting Standards Codification Topic 946—Financial Services—Investment Companies. The following is a summary of significant accounting policies consistently followed by the Asset Allocation Portfolio in the preparation of its financial statements.
Investment Valuation and Fair Value Measurements - Investments in the Underlying Portfolios are valued at their closing daily net asset value on the valuation date. Investments in the Underlying Portfolios are categorized as Level 1 within the fair value hierarchy. For information about the use of fair value pricing by the Underlying Portfolios, please refer to the prospectuses of the Underlying Portfolios.
Investment Transactions and Related Investment Income - Asset Allocation Portfolio security transactions are recorded on the trade date. Dividend income is recorded on the ex-dividend date. Realized gains and losses on investments are determined on the identified cost basis, which is the same basis used for federal income tax purposes. Capital gains distributions received from the Underlying Portfolios are recorded as net realized gain in the Statement of Operations.
Dividends and Distributions to Shareholders - The Asset Allocation Portfolio records dividends and distributions on the ex-dividend date. Net realized gains from securities transactions (if any) are generally distributed annually to shareholders. The timing and characterization of certain income and capital gains distributions are determined in accordance with federal tax regulations that may differ from GAAP. Permanent book and tax basis differences relating to shareholder distributions will result in reclassification between under/over distributed net investment income, accumulated net realized gains/losses, and paid-in surplus. Book-tax differences are primarily due to distributions from Underlying Portfolios. These adjustments have no impact on net assets or the results of operations.
Income Taxes - It is the Asset Allocation Portfolio’s policy to comply with the requirements of the Internal Revenue Code of 1986, as amended, and regulations thereunder, applicable to regulated investment companies and to distribute, with respect to each taxable year, all of its taxable income to shareholders. Therefore, no federal income tax provision is required. The Asset Allocation Portfolio files U.S. federal tax returns. No income tax returns are currently under examination. The Asset Allocation Portfolio’s federal tax returns for the prior three fiscal years remain subject to examination by the Internal Revenue Service. As of June 30, 2016, the Asset Allocation Portfolio had no uncertain tax positions that would require financial statement recognition, or de-recognition or disclosure.
3. Certain Risks
In the normal course of business, the Underlying Portfolios invest in securities and enter into transactions where risks exist due to fluctuations in the market (“market risk”) or failure of the other party to a transaction to perform (“credit and counterparty risk”).
MSF-10
Metropolitan Series Fund
MetLife Asset Allocation 40 Portfolio
Notes to Financial Statements—June 30, 2016—(Continued)
Market Risk: The value of securities held by the Underlying Portfolios may decline in response to certain events, including those directly involving the companies whose securities are owned by the Underlying Portfolios; conditions affecting the general economy; overall market changes; local, regional or global political, social or economic instability; and currency, interest rate, and price fluctuations.
Credit and Counterparty Risk: The Underlying Portfolios may be exposed to counterparty risk, or the risk that an entity with which the Underlying Portfolios have unsettled or open transactions may default. The potential loss could exceed the value of the financial assets and liabilities recorded in the financial statements. Financial assets that potentially expose the Underlying Portfolios to credit and counterparty risk consist principally of cash due from counterparties and investments. The Underlying Portfolios manage counterparty risk by entering into agreements only with counterparties that they believe have the financial resources to honor their obligations and by monitoring the financial stability of those counterparties. The Underlying Portfolios’ investment adviser attempts to mitigate counterparty risk by (i) periodically assessing the creditworthiness of their trading partners, (ii) monitoring and/or limiting the amount of their net exposure to each individual counterparty based on the adviser’s assessment, and (iii) requiring collateral from the counterparty for certain transactions. In order to preserve certain safeguards for non-standard settlement trades, the Underlying Portfolios restrict their exposure to credit and counterparty losses by entering into master netting agreements (“Master Agreements”) with counterparties (approved brokers) with whom the Underlying Portfolios undertake a significant volume of transactions. Master Agreements govern the terms of certain transactions, and reduce the counterparty risk associated with relevant transactions by specifying credit protection mechanisms and providing standardization that improves legal certainty. Master Agreements can also help limit counterparty risk by specifying collateral posting arrangements at pre-arranged exposure levels.
The Asset Allocation Portfolio’s prospectus includes a discussion of the principal risks of investing in the Asset Allocation Portfolio and in the Underlying Portfolios in which it invests.
4. Investment Transactions
Aggregate cost of purchases and proceeds of sales of shares of the Underlying Portfolios by the Asset Allocation Portfolio for the six months ended June 30, 2016 were as follows:
| | | | | | | | | | | | |
Purchases | | | Sales | |
U.S. Government | | Non U.S. Government | | | U.S. Government | | | Non U.S. Government | |
| $0 | | $ | 557,578,021 | | | $ | 0 | | | $ | 642,203,812 | |
5. Investment Management Fees and Other Transactions with Affiliates
Investment Management Agreement - MetLife Advisers is the investment adviser to the Asset Allocation Portfolio. The Trust has entered into an investment management agreement with MetLife Advisers with respect to the Asset Allocation Portfolio. For providing investment management services to the Asset Allocation Portfolio, MetLife Advisers receives monthly compensation at the following annual rates:
| | | | | | |
Management
Fees earned by
MetLife Advisers
for the six months ended
June 30, 2016 | | % per annum | | | Average Daily Net Assets |
| $1,939,230 | | | 0.100 | % | | Of the first $500 million |
| | | 0.075 | % | | Of the next $500 million |
| | | 0.050 | % | | On amounts in excess of $1 billion |
In addition to the above management fee paid to MetLife Advisers, the Asset Allocation Portfolio indirectly pays MetLife Advisers an investment advisory fee through its investments in the Underlying Portfolios.
Certain officers and trustees of the Trust may also be officers of MetLife Advisers; however, such officers and trustees receive no compensation from the Trust.
On January 12, 2016, MetLife, Inc. announced its plan to pursue the separation of a substantial portion of its retail segment and is currently evaluating structural alternatives for such separation. It is anticipated that MetLife Advisers would be included in any such separation. Any separation transaction that might occur will be subject to the satisfaction of various conditions and approvals, including approval of any transaction by the MetLife, Inc. Board of Directors, satisfaction of any applicable requirements of the SEC, and receipt of insurance and other regulatory approvals and other anticipated conditions. Because the form of a separation had yet to be determined, MetLife, Inc. cannot currently provide a specific potential completion date or information about the potential impact on MetLife Advisers. No assurance can be given regarding the form that a separation transaction may take or the specific terms
MSF-11
Metropolitan Series Fund
MetLife Asset Allocation 40 Portfolio
Notes to Financial Statements—June 30, 2016—(Continued)
thereof, or that a separation will in fact occur. Depending on the form a separation takes, MetLife Advisers’ continued service as investment adviser to the Trusts could be subject to the satisfaction of various conditions and approvals, which may include obtaining approvals from the Trusts’ Board and shareholders.
Transfer Agency Agreement - MetLife serves as the transfer agent for the Trust. MetLife receives no fees for its services to the Trust under the transfer agency agreement.
Distribution and Service Fees - The Trust has a distribution agreement with MetLife Investors Distribution Company (“MIDC” or the “Distributor”) in which MIDC serves as the distributor for the Asset Allocation Portfolio’s Class A and B Shares. MIDC is a wholly-owned subsidiary of MetLife Investors Group, LLC, an affiliate of the Adviser. The Trust has also adopted a Distribution and Service Plan under Rule 12b-1 of the 1940 Act for the Asset Allocation Portfolio’s Class B shares. Under the Distribution and Services Plan, the Class B shares of the Asset Allocation Portfolio pay a fee to compensate the Insurance Companies (or their affiliates) and other broker-dealers and financial intermediaries involved in the offer and sale of Asset Allocation Portfolio shares for promoting or selling and servicing the Class B shares of the Asset Allocation Portfolio. The fees under the Distribution and Services Plan for each class of the Asset Allocation Portfolio’s shares are calculated as a percentage of the Asset Allocation Portfolio’s average daily net assets that are attributable to that Class. Currently, the fee is 0.25% per year for Class B shares. Amount incurred by the Asset Allocation Portfolio for the six months ended June 30, 2016 is shown as Distribution and service fees in the Statement of Operations.
Deferred Trustee Compensation - Each Trustee who is not currently an active employee of MetLife or its affiliates receives compensation from the Trust for his or her service to the Trust. A deferred compensation plan (the “Plan”) is available to the Trustees on a voluntary basis. Deferred amounts remain in the Trust until distributed in accordance with the provisions of the Plan. The value of a participating Trustee’s deferral account is based on theoretical investments of deferred amounts on the normal payment dates in certain portfolios of the Trust or Met Investors Series Trust, an affiliate of the Trust, as designated by the participating Trustee. Changes in the value of participants’ deferral accounts are reflected as Trustees’ fees and expenses in the Statement of Operations. The portion of the accrued obligations allocated to the Asset Allocation Portfolio under the Plan is reflected as Deferred trustees’ fees in the Statement of Assets and Liabilities.
6. Transactions in Securities of Affiliated Underlying Portfolios
The Asset Allocation Portfolio does not invest in the Underlying Portfolios for the purpose of exercising control; however, investments by the Asset Allocation Portfolio within its principal investment strategies may represent a significant portion of the Underlying Portfolios’ net assets. Transactions in the Underlying Portfolios for the six months ended June 30, 2016 were as follows:
| | | | | | | | | | | | | | | | |
Underlying Portfolio | | Number of
shares held at
December 31, 2015 | | | Shares
purchased | | | Shares
sold | | | Number of
shares held at
June 30, 2016 | |
Baillie Gifford International Stock | | | 14,833,137 | | | | 547,955 | | | | (847,475 | ) | | | 14,533,617 | |
BlackRock Bond Income | | | 6,216,855 | | | | 399,200 | | | | (383,235 | ) | | | 6,232,820 | |
BlackRock Capital Appreciation | | | 3,979,383 | | | | 485,797 | | | | (36,669 | ) | | | 4,428,511 | |
BlackRock High Yield | | | 5,014,395 | | | | 340,244 | | | | (381,155 | ) | | | 4,973,484 | |
BlackRock Large Cap Value | | | 17,051,891 | | | | 2,028,999 | | | | (1,509,631 | ) | | | 17,571,259 | |
Clarion Global Real Estate | | | 4,637,940 | | | | 103,290 | | | | (374,810 | ) | | | 4,366,420 | |
ClearBridge Aggressive Growth | | | 7,054,379 | | | | 251,276 | | | | (83,733 | ) | | | 7,221,922 | |
Goldman Sachs Mid Cap Value | | | 3,171,594 | | | | 269,674 | | | | (1,763,535 | ) | | | 1,677,733 | |
Harris Oakmark International | | | 13,076,802 | | | | 3,132,969 | | | | (325,736 | ) | | | 15,884,035 | |
Invesco Comstock | | | 15,402,207 | | | | 2,274,670 | | | | (746,491 | ) | | | 16,930,386 | |
Invesco Small Cap Growth | | | 7,136,912 | | | | 1,514,895 | | | | (1,626,830 | ) | | | 7,024,977 | |
Jennison Growth | | | 7,107,683 | | | | 1,342,067 | | | | (25,555 | ) | | | 8,424,195 | |
JPMorgan Core Bond | | | 49,911,714 | | | | 1,574,099 | | | | (3,833,692 | ) | | | 47,652,121 | |
JPMorgan Small Cap Value | | | 4,650,429 | | | | 509,624 | | | | (1,569,296 | ) | | | 3,590,757 | |
Lord Abbett Bond Debenture | | | 3,143,685 | | | | 213,981 | | | | (3,357,666 | ) | | | — | |
Met/Aberdeen Emerging Markets Equity | | | 8,223,175 | | | | 895,179 | | | | (1,159,909 | ) | | | 7,958,445 | |
Met/Artisan International | | | 9,398,029 | | | | 124,498 | | | | (40,594 | ) | | | 9,481,933 | |
Met/Artisan Mid Cap Value | | | 165,677 | | | | 15,162 | | | | (95,682 | ) | | | 85,157 | |
Met/Eaton Vance Floating Rate | | | 14,870,719 | | | | 600,324 | | | | (1,094,779 | ) | | | 14,376,264 | |
Met/Franklin Low Duration Total Return | | | 30,509,837 | | | | 729,821 | | | | (8,716,215 | ) | | | 22,523,443 | |
Met/Templeton International Bond | | | 21,948,523 | | | | 58,206 | | | | (3,403,109 | ) | | | 18,603,620 | |
Met/Wellington Core Equity Opportunities (formerly, WMC Core Equity Opportunities) | | | 8,963,882 | | | | 904,247 | | | | (464,469 | ) | | | 9,403,660 | |
Met/Wellington Large Cap Research (formerly, WMC Large Cap Research) | | | 10,408,233 | | | | 1,956,164 | | | | (145,548 | ) | | | 12,218,849 | |
MetLife Small Cap Value | | | 5,584,381 | | | | 462,896 | | | | (703,416 | ) | | | 5,343,861 | |
MFS Research International | | | 10,221,149 | | | | 558,060 | | | | (319,700 | ) | | | 10,459,509 | |
MFS Value | | | 16,828,609 | | | | 1,982,112 | | | | (1,379,467 | ) | | | 17,431,254 | |
Neuberger Berman Genesis | | | 3,932,809 | | | | 111,504 | | | | (1,247,401 | ) | | | 2,796,912 | |
MSF-12
Metropolitan Series Fund
MetLife Asset Allocation 40 Portfolio
Notes to Financial Statements—June 30, 2016—(Continued)
| | | | | | | | | | | | | | | | |
Underlying Portfolio | | Number of
shares held at
December 31, 2015 | | | Shares
purchased | | | Shares
sold | | | Number of
shares held at
June 30, 2016 | |
Oppenheimer Global Equity | | | 1,769,503 | | | | 2,068,768 | | | | (12,214 | ) | | | 3,826,057 | |
PIMCO Inflation Protected Bond | | | 47,383,678 | | | | 9,281 | | | | (3,876,142 | ) | | | 43,516,817 | |
PIMCO Total Return | | | 58,276,542 | | | | 1,599,061 | | | | (3,742,513 | ) | | | 56,133,090 | |
T. Rowe Price Large Cap Growth | | | 6,400,709 | | | | 1,094,250 | | | | (26,071 | ) | | | 7,468,888 | |
T. Rowe Price Large Cap Value | | | 7,460,847 | | | | 1,197,111 | | | | (534,987 | ) | | | 8,122,971 | |
T. Rowe Price Mid Cap Growth | | | 3,197,413 | | | | 545,435 | | | | (172,617 | ) | | | 3,570,231 | |
TCW Core Fixed Income* | | | 51,581,213 | | | | 6,411,197 | | | | (3,201,759 | ) | | | 54,790,651 | |
Van Eck Global Natural Resources | | | 7,773,717 | | | | 2,140,430 | | | | (2,589,424 | ) | | | 7,324,723 | |
Western Asset Management Strategic Bond Opportunities | | | 17,503,336 | | | | 3,098,159 | | | | (1,398,690 | ) | | | 19,202,805 | |
Western Asset Management U.S. Government | | | 49,312,059 | | | | 1,527,753 | | | | (3,188,721 | ) | | | 47,651,091 | |
| * | The Portfolio had ownership of at least 25% of the outstanding voting securities of the Underlying Portfolio as of December 31, 2015. The most recent Annual Report of the Underlying Portfolio is available without charge, upon request, by calling (800) 848-3854 or on the Securities and Exchange Commission’s website at http://www.sec.gov. |
| | | | | | | | | | | | | | | | |
Underlying Portfolio | | Net Realized
Gain/(Loss) on sales
of Affiliated
Underlying
Portfolios | | | Capital Gain
Distributions
from Affiliated
Underlying
Portfolios | | | Dividend Income
from Affiliated
Underlying
Portfolios | | | Ending Value
as of
June 30, 2016 | |
Baillie Gifford International Stock | | $ | 444,234 | | | $ | — | | | $ | 2,302,638 | | | $ | 139,086,711 | |
BlackRock Bond Income | | | 533,351 | | | | — | | | | 21,206,802 | | | | 674,141,767 | |
BlackRock Capital Appreciation | | | 222,541 | | | | 12,733,452 | | | | — | | | | 140,915,229 | |
BlackRock High Yield | | | (288,312 | ) | | | — | | | | 2,418,424 | | | | 35,610,149 | |
BlackRock Large Cap Value | | | (1,168,975 | ) | | | 10,833,525 | | | | 2,370,331 | | | | 140,921,496 | |
Clarion Global Real Estate | | | 773,161 | | | | — | | | | 1,229,211 | | | | 53,750,632 | |
ClearBridge Aggressive Growth | | | 480,479 | | | | — | | | | 710,688 | | | | 105,078,962 | |
Goldman Sachs Mid Cap Value | | | (3,432,805 | ) | | | 1,358,479 | | | | 197,569 | | | | 17,750,412 | |
Harris Oakmark International | | | 260,922 | | | | 12,409,067 | | | | 4,428,729 | | | | 174,406,706 | |
Invesco Comstock | | | 3,742,287 | | | | 16,548,177 | | | | 6,010,637 | | | | 211,460,522 | |
Invesco Small Cap Growth | | | 2,646,794 | | | | 15,639,334 | | | | — | | | | 87,882,457 | |
Jennison Growth | | | 71,656 | | | | 13,859,298 | | | | 313,163 | | | | 103,954,563 | |
JPMorgan Core Bond | | | (528,173 | ) | | | — | | | | 15,053,294 | | | | 499,870,754 | |
JPMorgan Small Cap Value | | | (1,176,696 | ) | | | 3,578,425 | | | | 995,105 | | | | 52,963,668 | |
Lord Abbett Bond Debenture | | | (148,570 | ) | | | — | | | | 2,396,593 | | | | — | |
Met/Aberdeen Emerging Markets Equity | | | (1,576,645 | ) | | | — | | | | 868,689 | | | | 71,944,339 | |
Met/Artisan International | | | (24,783 | ) | | | — | | | | 817,714 | | | | 86,190,772 | |
Met/Artisan Mid Cap Value | | | 5,567,444 | | | | 1,919,410 | | | | 192,617 | | | | 17,594,272 | |
Met/Eaton Vance Floating Rate | | | (30,528 | ) | | | — | | | | 5,930,935 | | | | 141,893,727 | |
Met/Franklin Low Duration Total Return | | | (2,631,235 | ) | | | — | | | | 6,880,267 | | | | 213,297,004 | |
Met/Templeton International Bond | | | (2,059,407 | ) | | | 465,639 | | | | — | | | | 178,594,749 | |
Met/Wellington Core Equity Opportunities (formerly, WMC Core Equity Opportunities) | | | (769,973 | ) | | | 11,487,152 | | | | 4,206,065 | | | | 264,618,998 | |
Met/Wellington Large Cap Research (formerly, WMC Large Cap Research) | | | 143,849 | | | | 10,364,627 | | | | 3,810,361 | | | | 157,500,969 | |
MetLife Small Cap Value | | | (1,400,308 | ) | | | 1,884,930 | | | | 927,014 | | | | 70,378,656 | |
MFS Research International | | | (82,239 | ) | | | — | | | | 2,370,207 | | | | 103,549,138 | |
MFS Value | | | 6,441,987 | | | | 22,324,716 | | | | 5,596,725 | | | | 249,964,184 | |
Neuberger Berman Genesis | | | 7,003,658 | | | | — | | | | 251,389 | | | | 53,365,076 | |
Oppenheimer Global Equity | | | (5,331 | ) | | | 3,461,724 | | | | 831,388 | | | | 67,606,424 | |
PIMCO Inflation Protected Bond | | | (4,224,608 | ) | | | — | | | | — | | | | 429,075,819 | |
PIMCO Total Return | | | (4,908,572 | ) | | | — | | | | 17,852,502 | | | | 642,723,884 | |
T. Rowe Price Large Cap Growth | | | 140,208 | | | | 17,662,604 | | | | 84,822 | | | | 139,518,832 | |
T. Rowe Price Large Cap Value | | | 6,102,865 | | | | 28,562,401 | | | | 7,494,406 | | | | 249,050,289 | |
T. Rowe Price Mid Cap Growth | | | 215,067 | | | | 5,115,210 | | | | — | | | | 35,345,291 | |
TCW Core Fixed Income | | | 242,753 | | | | — | | | | 4,522,229 | | | | 565,439,515 | |
Van Eck Global Natural Resources | | | (18,403,988 | ) | | | — | | | | 576,718 | | | | 71,342,805 | |
Western Asset Management Strategic Bond Opportunities | | | (1,301,363 | ) | | | — | | | | 3,909,013 | | | | 250,020,521 | |
Western Asset Management U.S. Government | | | 545,733 | | | | — | | | | 14,817,923 | | | | 569,430,540 | |
| | | | | | | | | | | | | | | | |
| | $ | (8,583,522 | ) | | $ | 190,208,170 | | | $ | 141,574,168 | | | $ | 7,066,239,832 | |
| | | | | | | | | | | | | | | | |
MSF-13
Metropolitan Series Fund
MetLife Asset Allocation 40 Portfolio
Notes to Financial Statements—June 30, 2016—(Continued)
7. Contractual Obligations
Under the Trust’s organizational documents, its officers and Trustees may be indemnified against certain liabilities and expenses arising out of the performance of their duties to the Trust. Additionally, the Trust has a variety of indemnification obligations under contracts with its service providers. The Trust’s maximum exposure under these arrangements is unknown, as this would involve future claims that may be made against the Trust that have not yet occurred.
8. Income Tax Information
The tax character of distributions paid for the years ended December 31, 2015 and 2014 were as follows:
| | | | | | | | | | | | | | | | | | | | |
Ordinary Income | | | Long-Term Capital Gain | | | Total | |
2015 | | 2014 | | | 2015 | | | 2014 | | | 2015 | | | 2014 | |
| $25,111,814 | | $ | 52,413,626 | | | $ | 434,346,857 | | | $ | 62,674,102 | | | $ | 459,458,671 | | | $ | 115,087,728 | |
As of December 31, 2015, the components of distributable earnings (accumulated losses) on a federal income tax basis were as follows:
| | | | | | | | | | | | | | | | |
Undistributed
Ordinary
Income | | Undistributed
Long-Term
Capital Gain | | | Net
Unrealized
Depreciation | | | Other
Accumulated
Capital Losses | | | Total | |
| $251,101,397 | | $ | 456,951,261 | | | $ | (87,835,729 | ) | | $ | — | | | $ | 620,216,929 | |
The Asset Allocation Portfolio utilizes the provisions of the federal income tax laws that provide for the carryforward of capital losses for prior years, offsetting such losses against any future realized capital gains. Under the Regulated Investment Company Modernization Act of 2010 (the “Act”), net capital losses recognized after December 22, 2010 may be carried forward indefinitely and their character is retained as short-term and/or long-term losses. Previously, net capital losses were carried forward for up to eight years and treated as short-term losses. As a transition rule, the Act requires that post-enactment net capital losses be used before pre-enactment net capital losses.
As of December 31, 2015, the Asset Allocation Portfolio had no post-enactment accumulated capital losses and no pre-enactment accumulated capital loss carryforwards.
MSF-14
Metropolitan Series Fund
MetLife Asset Allocation 60 Portfolio
Managed by MetLife Advisers, LLC
Portfolio Manager Commentary*
PERFORMANCE
For the six month period ended June 30, 2016, the Class A and B shares of the MetLife Asset Allocation 60 Portfolio returned 2.62% and 2.52%, respectively. The Portfolio’s benchmark, the Dow Jones Moderate Index1, returned 4.67%.
MARKET ENVIRONMENT / CONDITIONS
The first half of 2016 saw conflicted equity markets, remarkable bond performance and a second quarter rally in commodities. The themes of weak global growth persist, marked by a continued slowdown of Chinese gross domestic product (“GDP”) and razor-thin growth rates for developed economies. Commodities, as measured by the Bloomberg Commodity Index, were up 13.3%, largely driven by gains in the energy sub-index as oil jumped nearly $10 per barrel from recent lows. However, as the supply and demand in the period was decomposed, it appeared that the increase might have been due to supply side dynamics, and not necessarily driven by demand. As a result, the jump in oil price did not signal a turnaround in Chinese demand or some other bullish interpretation. The VIX volatility index experienced two notable spikes above the historical index average (one in late January/early February and the second in the period leading up to the so-called “Brexit” vote, the withdrawal of the United Kingdom (the “U.K.”) from the European Union), as investors transmitted their fears into their trading patterns, elevating volatility. Equities appeared historically overvalued when examining the cyclically-adjusted Shiller price/earnings (“P/E”) ratio, which showed domestic equities hovering near the third-highest valuation level since the 1870’s and did not give confidence to investors since high market P/E ratios have historically preceded periods of declining equity prices. The Federal Reserve, clearly anxious about repeating their December 2015 25 basis point rate hike in the middle of the uncertainty, signaled a flat 2016 for policy actions. All of this uncertainty led to flight-to-safety behavior which drove U.S. Treasuries to gain 5.4% (as measured by the Barclays U.S. Treasury Index) and global sovereign debt to gain an unfathomable 11.6% (as measured by the Barclays Global Treasury Index). Likewise, the price of spot gold experienced its most notable surge since the post-crisis period, with the price per troy ounce gaining nearly 25% in the first half as investors seemed to prefer safer assets. Yet, despite all of the activity which typically correlates with a bearish market, domestic equities shrugged off the intra-period uncertainty and finished the second half surging to near all-time highs—just days after rebounding from a temporary decline after the U.K. voted to do the unthinkable and leave the European Union on June 24th.
The U.S. stock market, as measured by the S&P 500 Index, returned 3.8% in the first half of 2016. Along the capitalization spectrum, mid-cap outperformed small-cap and large-cap stocks. The S&P 400 Mid Cap Index returned 7.9%, while the S&P 600 Small Cap Index returned 6.2%. Value stocks noticeably outperformed growth stocks, as measured by the Russell 3000 Value and Growth Indices (6.3% versus 1.4%). This represents a dramatic turnaround from last year, when growth stocks massively outperformed value. Foreign developed equities, as represented by the MSCI EAFE Index, fell 4.4% on the heels of a poor performance by Japanese equity markets and a broad European post-Brexit selloff. Interestingly, the U.K. market itself was unfazed by its own vote, with the FTSE 100 at a 7-month high just days after a brief post-vote tumble. Emerging market equities, as represented by the MSCI Emerging Markets Index, gained 6.4%—a welcome change after turning in very poor results last year when commodities suffered.
Fixed income markets experienced returns in the first half that defied all expectations of bond bears. As mentioned earlier, Global Treasuries generated returns of 11.6% due to yield curve movements alone. In the U.S., the 10-year Treasury rate fell an astounding 75 basis points in the first half, dropping from 2.24% to 1.49%. In the Eurozone, average European sovereign debt rates fell over 80 basis points, dropping from 70 basis points to negative 10 basis points. While rates were the big driver of fixed income returns, diversified core fixed income also did very well. The domestic Barclays U.S. Aggregate Bond Index returned 5.3% in the first half of 2016. Meanwhile, the Barclays Global Aggregate Bond Index returned 9.0%. In domestic core fixed income, top-performing subsectors included 20+ year Treasuries, which gained 15.8%, while long maturity Foreign Agency issues returned 17.2%. Long Corporates were also additive, delivering a return of 13.9% in the first half of the year.
PORTFOLIO REVIEW / PERIOD-END POSITIONING
The MetLife Asset Allocation 60 Portfolio invested in underlying portfolios of the Met Investors Series Trust and the Metropolitan Series Fund to maintain a broad asset allocation of approximately 60% to equities and 40% to fixed income.
Over the six month period, the Portfolio underperformed the Dow Jones Moderate Index. A large cap orientation vis-à-vis the Dow Jones Index within domestic equity held back relative results, as did a slight overweight to developed markets and an underweight to emerging market equities, while an overweight to high yield bonds helped to offset these losses. During the period, security selection in the underlying portfolios detracted from relative results.
The domestic equity portfolios in aggregate detracted modestly from performance. While most growth-oriented portfolios detracted from performance, portfolios managed with a value style in general contributed positively, as value style significantly outpaced growth over the six month period. Within the growth portfolios, the Jennison Growth Portfolio, T. Rowe Price Large Cap Growth Portfolio and BlackRock Capital Appreciation Portfolio were among the top detractors. The Jennison Growth Portfolio underperformed its benchmark, as a result of both stock selection and sector allocation. Most notably, stock selection in Health Care, Information Technology and Consumer Discretionary sectors proved to be detrimental. Within the Health Care sector, holdings in Alexion Pharmaceuticals, Allergan plc and Regeneron Pharmaceuticals were the leading detractors. Within
MSF-1
Metropolitan Series Fund
MetLife Asset Allocation 60 Portfolio
Managed by MetLife Advisers, LLC
Portfolio Manager Commentary*—(Continued)
the Information Technology sector, positioning in the software and services industry was a key driver of underperformance, in particular a holding in LinkedIn Corp. Detracting from results in the Consumer Discretionary sector was positioning in retailing, most notably Netflix Inc. Similarly, with the T. Rowe Price Large Cap Growth Portfolio, stock selection in the Health Care and Information Technology sectors held back relative results, along with an underweight to the Consumer Staples sector. The BlackRock Capital Appreciation Portfolio was also a meaningful detractor from relative performance and, like the other growth portfolios, was hurt by stock selection in Consumer Discretionary, Health Care and Information Technology sectors. Another notable detractor was the ClearBridge Aggressive Growth Portfolio, which underperformed its benchmark, primarily driven by an overweight and stock selection in the Health Care sector, in particular positioning in pharmaceuticals. On the other hand, a number of value-oriented portfolios contributed positively, with the MFS Value Portfolio being the top contributor. In addition from benefiting from its value style, the Portfolio outperformed its value benchmark. Contributing positively to results during the period was stock selection within the Industrials and Financials sectors, which was partly offset by an underweight to the Utilities sector and industry positioning within the Financials sector. Additionally, an overweight to the Consumer Staples sector aided results. The Met/Wellington Core Equity Opportunities Portfolio’s focus on dividend growing companies was rewarded by the market during the six month period. In particular, stock selection in the Industrials and Health Care sectors were the main drivers of performance, while selection in the Consumer Staples sector detracted. The T. Rowe Price Large Cap Value Portfolio also contributed positively to the Portfolio’s results, although it lagged its value benchmark due to a combination of both security selection and sector allocation. Worth noting, the Invesco Comstock Portfolio, a value-oriented portfolio, detracted from results as it struggled relative to its benchmark. Both sector allocation and stock selection hampered returns, in particular positioning within Financials, the worst performing sector.
Among the equity portfolios that invest outside the U.S, the Harris Oakmark International Portfolio was the leading detractor. A combination of sector allocation and stock selection detracted from results, in particular an overweight to the Financials sector. Individual detractors included Credit Suisse Group (Switzerland), Nomura Holdings (Japan) and Lloyds Banking Group (United Kingdom). Additionally, a meaningful overweight and stock selection in the Consumer Discretionary sector hampered results. Notable detractors included Daimler AG (Germany), Honda Motor and Toyota Motor (Japan). Additionally, the Oppenheimer Global Equity Portfolio hampered Portfolio results, in particular stock selection in Health Care, Information Technology and the Financials sectors. From a country perspective, leading detractors included Germany and the United States. Conversely, the Van Eck Global Natural Resources Portfolio had a meaningful positive impact on results, as commodities, in particular energy, posted strong results over the period. The Van Eck Global Natural Resources Portfolio outpaced its benchmark, with the primary drivers being overweight allocations to gold and diversified metals and mining and underweight allocation to oil and gas refining and marketing. Another notable contributor to results was the Met/Aberdeen Emerging Markets Equity Portfolio, as emerging markets generated exceptional performance when compared to the developed markets. The Met/Aberdeen Emerging Markets Portfolio outperformed its emerging markets index, with the key contributors including positioning in Brazil and China, while exposures in Hong Kong held back results. Global Real Estate continued to deliver strong results during the six month period, as yields declined, boosting dividend yielding sectors. The Clarion Global Real Estate Portfolio contributed positively to relative results, although trailed its respective benchmark. The primary detractors were stock selection in the U.S. and positioning in the Canadian and U.K. markets, which was partly offset by positive stock selection in Europe.
The fixed income underlying portfolios in aggregate made a negative contribution to performance. The Met/Templeton International Bond Portfolio, which employs a benchmark-unconstrained approach resulting in large active positions compared to its benchmark index, was the most significant detractor. During the period, a sizable underweight to the euro and the Japanese yen and an overweight to the dollar were unfavorable, given the dollar weakness as these currencies strengthened. During the six month period, U.S. Treasury interest rates across the yield curve generally fell and the yield curve flattened, with longer term maturities falling more than shorter term maturities. The Met/Templeton International Bond Portfolio which has continued to position for a rising rate environment by maintaining a low portfolio duration, was negatively impacted in this environment. Not surprisingly, this interest rate environment didn’t bode well either for those portfolios with a shorter duration posture relative to the benchmark, in particular the Western Asset Management U.S. Government Portfolio and the Met/Franklin Low Duration Total Return Portfolio. The Western Asset Management U.S. Government Portfolio was a meaningful detractor from the Portfolio’s relative results, not only due to its shorter duration, but as a result of its composition, investing predominantly in government and
MSF-2
Metropolitan Series Fund
MetLife Asset Allocation 60 Portfolio
Managed by MetLife Advisers, LLC
Portfolio Manager Commentary*—(Continued)
government related securities during a period in which spread sectors outperformed. With respect to the Met/Franklin Low Duration Total Return Portfolio, despite it detracting from the Asset Allocation Portfolio’s relative results, it managed to slightly outperform its respective index, due to the Portfolio’s exposures to high yield securities which outperformed their investment grade counterparts. Another notable detractor from fixed income results was the PIMCO Total Return Portfolio, which held an underweight to both U.S. duration and the front end of the U.K. yield curve which hurt performance as rates fell. On the other hand, exposure to Treasury Inflation Protected securities (“TIPS”) via the PIMCO Inflation Protected Bond Portfolio was additive during the period, as TIPS outpaced nominal Treasury securities.
Investment Committee
MetLife Advisers, LLC
* This commentary may include statements that constitute “forward-looking statements” under the U.S. securities laws. Forward-looking statements include, among other things, projections, estimates, and information about possible or future results related to the Portfolio, market or regulatory developments. The views expressed above are not guarantees of future performance or economic results and involve certain risks, uncertainties and assumptions that could cause actual outcomes and results to differ materially from the views expressed herein. The views expressed above are subject to change at any time based upon economic, market, or other conditions and the advisory firm undertakes no obligation to update the views expressed herein. Any discussions of specific securities should not be considered a recommendation to buy or sell those securities. The views expressed above (including any forward-looking statement) may not be relied upon as investment advice or as an indication of the Portfolio’s trading intent. Information about the Portfolio’s holdings, asset allocation or country diversification is historical and is not an indication of future Portfolio composition, which may vary. Direct investment in any index is not possible. The performance of any index mentioned in this commentary has not been adjusted for ongoing management, distribution and operating expenses, and sales charges applicable to mutual fund investments. In addition, the returns do not reflect additional fees charged by separate accounts or variable insurance contracts that an investor in the Portfolio may pay. If these additional fees were reflected, performance would have been lower.
MSF-3
Metropolitan Series Fund
MetLife Asset Allocation 60 Portfolio
A $10,000 INVESTMENT COMPARED TO THE DOW JONES MODERATE INDEX
SIX MONTH RETURN & AVERAGE ANNUAL RETURNS (%) AS OF JUNE 30, 2016
| | | | | | | | | | | | | | | | |
| | | 6 Month | | | 1 Year | | | 5 Year | | | 10 Year | |
| MetLife Asset Allocation 60 Portfolio | | | | | | | | | | | | | | | | |
Class A | | | 2.62 | | | | -0.87 | | | | 6.30 | | | | 5.26 | |
Class B | | | 2.52 | | | | -1.06 | | | | 6.05 | | | | 5.00 | |
| Dow Jones Moderate Index | | | 4.67 | | | | 1.73 | | | | 5.90 | | | | 5.63 | |
1 The Dow Jones Moderate Index is a total return index designed to provide asset allocation strategists with a target risk benchmark. Each month, the Index adjusts its weighting of stocks, bonds, and cash indices (both domestic and foreign) such that the risk combination will have 60% of the risk of an all equity portfolio.
Portfolio performance is calculated including reinvestment of all income and capital gain distributions. Performance numbers are net of all Portfolio expenses but do not include any insurance, sales, separate account or administrative charges of variable annuity or life insurance contracts or any additional expenses that participants may bear relating to the operations of their plans. If these charges were included, the returns would be lower. The performance of any index referenced above has not been adjusted for ongoing management, distribution and operating expenses, and sales charges applicable to mutual fund investments. Direct investment in any index is not possible. The performance of Class A shares, as set forth in the line graph above, will differ from that of other classes because of the difference in expenses paid by policyholders investing in the different share classes.
This information represents past performance and is not indicative of future results. Investment return and principal value may fluctuate so that shares, upon redemption, may be worth more or less than the original cost.
PORTFOLIO COMPOSITION AS OF JUNE 30, 2016
Top Holdings
| | | | |
| | | % of
Net Assets | |
| BlackRock Bond Income Portfolio (Class A) | | | 6.5 | |
| PIMCO Total Return Portfolio (Class A) | | | 6.1 | |
| TCW Core Fixed Income Portfolio (Class A) | | | 5.4 | |
| MFS Value Portfolio (Class A) | | | 4.6 | |
| JPMorgan Core Bond Portfolio (Class A) | | | 4.6 | |
| Met/Wellington Core Equity Opportunities Portfolio (formerly, WMC Core Equity Opportunities Portfolio) (Class A) | | | 4.5 | |
| T. Rowe Price Large Cap Value Portfolio (Class A) | | | 4.1 | |
| Western Asset Management U.S. Government Portfolio (Class A) | | | 4.0 | |
| BlackRock Large Cap Value Portfolio (Class A) | | | 3.5 | |
| Invesco Comstock Portfolio (Class A) | | | 3.5 | |
MSF-4
Metropolitan Series Fund
MetLife Asset Allocation 60 Portfolio
Understanding Your Portfolio’s Expenses (Unaudited)
Shareholder Expense Example
As a shareholder of the Portfolio, you incur ongoing costs, including management fees; distribution and service (12b-1) fees; and other Portfolio expenses. This example is intended to help you understand your ongoing costs (in dollars) (referred to as “expenses”) of investing in the Portfolio and compare these costs with the ongoing costs of investing in other mutual funds. The example is based on an investment of $1,000 invested at the beginning of the period and held for the entire period, January 1, 2016 through June 30, 2016.
Actual Expenses
The first line for each share class of the Portfolio in the table below provides information about actual account values and actual expenses. You may use the information in this line, together with the amount you invested in the particular share class of the Portfolio, to estimate the expenses that you paid over the period. Simply divide your account value by $1,000 (for example, an $8,600 account value divided by $1,000 = 8.6), then multiply the result by the number in the first line under the heading entitled “Expenses Paid During Period” to estimate the expenses you paid on your account during this period.
Hypothetical Example for Comparison Purposes
The second line for each share class of the Portfolio in the table below provides information about hypothetical account values and hypothetical expenses based on the Portfolio’s actual expense ratio and an assumed rate of return of 5% per year before expenses, which is not the Portfolio’s actual return. The hypothetical account values and expenses may not be used to estimate the actual ending account balance or expenses you paid for the period. You may use this information to compare the ongoing costs of investing in the Portfolio and other funds. To do so, compare this 5% hypothetical example with the 5% hypothetical examples that appear in the shareholder reports of the other funds.
Please note that the expenses shown in the table are meant to highlight your ongoing costs only and do not reflect any fees or charges of your variable insurance product or any additional expenses that participants in certain eligible qualified plans may bear relating to the operations of their plan. Therefore, the second line for each share class in the table is useful in comparing ongoing costs only, and will not help you determine the relative total costs of owning different funds. In addition, if these other costs were included, your costs would have been higher.
| | | | | | | | | | | | | | | | | | |
MetLife Asset Allocation 60 Portfolio | | | | Annualized
Expense
Ratio | | | Beginning
Account Value
January 1,
2016 | | | Ending
Account Value
June 30,
2016 | | | Expenses Paid
During Period**
January 1, 2016
to
June 30,
2016 | |
Class A(a) | | Actual | | | 0.65 | % | | $ | 1,000.00 | | | $ | 1,026.20 | | | $ | 3.27 | |
| | Hypothetical* | | | 0.65 | % | | $ | 1,000.00 | | | $ | 1,021.63 | | | $ | 3.27 | |
| | | | | |
Class B(a) | | Actual | | | 0.90 | % | | $ | 1,000.00 | | | $ | 1,025.20 | | | $ | 4.53 | |
| | Hypothetical* | | | 0.90 | % | | $ | 1,000.00 | | | $ | 1,020.39 | | | $ | 4.52 | |
* Hypothetical assumes a rate of return of 5% per year before expenses.
** Expenses paid are equal to the Portfolio’s annualized expense ratio for the most recent six month period, as shown above, multiplied by the average account value over the period, multiplied by the number of days (182 days) in the most recent fiscal half-year, divided by 366 (to reflect the one-half year period).
(a) The annualized expense ratio reflects the expenses of both the Portfolio and the Underlying Portfolios in which it invests.
MSF-5
Metropolitan Series Fund
MetLife Asset Allocation 60 Portfolio
Schedule of Investments as of June 30, 2016 (Unaudited)
Mutual Funds—100.0% of Net Assets
| | | | | | | | |
| Security Description | | Shares | | | Value | |
|
Affiliated Investment Companies—100.0% | |
Baillie Gifford International Stock Portfolio (Class A) (a) | | | 37,394,599 | | | $ | 357,866,315 | |
BlackRock Bond Income Portfolio (Class A) (a) | | | 8,649,476 | | | | 935,527,369 | |
BlackRock Capital Appreciation Portfolio (Class A) (a) | | | 13,564,174 | | | | 431,612,003 | |
BlackRock High Yield Portfolio (Class A) (b) | | | 12,186,478 | | | | 87,255,181 | |
BlackRock Large Cap Value Portfolio (Class A) (a) | | | 63,229,318 | | | | 507,099,133 | |
Clarion Global Real Estate Portfolio (Class A) (b) | | | 17,937,640 | | | | 220,812,353 | |
ClearBridge Aggressive Growth Portfolio (Class A) (b) | | | 31,548,876 | | | | 459,036,145 | |
Goldman Sachs Mid Cap Value Portfolio (Class A) (b) | | | 3,442,701 | | | | 36,423,774 | |
Harris Oakmark International Portfolio (Class A) (b) | | | 38,146,894 | | | | 418,852,894 | |
Invesco Comstock Portfolio (Class A) (b) | | | 40,479,280 | | | | 505,586,204 | |
Invesco Small Cap Growth Portfolio (Class A) (b) | | | 17,391,260 | | | | 217,564,667 | |
Jennison Growth Portfolio (Class A) (a) | | | 39,907,860 | | | | 492,462,998 | |
JPMorgan Core Bond Portfolio (Class A) (b) | | | 62,299,218 | | | | 653,518,802 | |
JPMorgan Small Cap Value Portfolio (Class A) (b) | | | 7,391,799 | | | | 109,029,034 | |
Loomis Sayles Small Cap Growth Portfolio (Class A) (a) | | | 6,342,372 | | | | 72,429,889 | |
Met/Aberdeen Emerging Markets Equity Portfolio (Class A) (b) | | | 28,704,596 | | | | 259,489,550 | |
Met/Artisan International Portfolio (Class A) (b) | | | 34,007,678 | | | | 309,129,794 | |
Met/Artisan Mid Cap Value Portfolio (Class A) (a) | | | 350,096 | | | | 72,333,321 | |
Met/Dimensional International Small Company Portfolio (Class A) (a) | | | 11,892,284 | | | | 139,853,254 | |
Met/Eaton Vance Floating Rate Portfolio (Class A) (b) | | | 29,282,734 | | | | 289,020,588 | |
Met/Franklin Low Duration Total Return Portfolio (Class A) (b) | | | 30,643,140 | | | | 290,190,535 | |
Met/Templeton International Bond Portfolio (Class A) (b) | | | 44,392,784 | | | | 426,170,728 | |
Met/Wellington Core Equity Opportunities Portfolio (formerly, WMC Core Equity Opportunities Portfolio) (Class A) (a) | | | 22,915,232 | | | | 644,834,632 | |
Met/Wellington Large Cap Research Portfolio (formerly, WMC Large Cap Research Portfolio) (Class A) (b) | | | 33,084,590 | | | | 426,460,359 | |
MetLife Small Cap Value Portfolio (Class A) (b) | | | 11,010,072 | | | | 145,002,655 | |
MFS Research International Portfolio (Class A) (b) | | | 28,495,308 | | | | 282,103,545 | |
MFS Value Portfolio (Class A) (a) | | | 45,886,913 | | | | 658,018,338 | |
Neuberger Berman Genesis Portfolio (Class A) (a) | | | 7,663,221 | | | | 146,214,254 | |
Oppenheimer Global Equity Portfolio (Class A) (b) | | | 7,789,442 | | | | 137,639,432 | |
PIMCO Inflation Protected Bond Portfolio (Class A) (b)(c) | | | 44,279,826 | | | | 436,599,085 | |
|
Affiliated Investment Companies—(Continued) | |
PIMCO Total Return Portfolio (Class A) (b) | | | 76,078,243 | | | | 871,095,885 | |
T. Rowe Price Large Cap Growth Portfolio (Class A) (a) | | | 22,773,188 | | | | 425,403,152 | |
T. Rowe Price Large Cap Value Portfolio (Class A) (b) | | | 19,027,806 | | | | 583,392,538 | |
T. Rowe Price Mid Cap Growth Portfolio (Class A) (b) | | | 14,638,866 | | | | 144,924,776 | |
T. Rowe Price Small Cap Growth Portfolio (Class A) (a) | | | 11,246,985 | | | | 218,978,802 | |
TCW Core Fixed Income Portfolio (Class A) (b) | | | 75,002,313 | | | | 774,023,874 | |
Van Eck Global Natural Resources Portfolio (Class A) (a) | | | 30,193,793 | | | | 294,087,545 | |
Western Asset Management Strategic Bond Opportunities Portfolio (Class A) (a) | | | 22,431,687 | | | | 292,060,570 | |
Western Asset Management U.S. Government Portfolio (Class A) (a) | | | 48,319,797 | | | | 577,421,580 | |
| | | | | | | | |
Total Mutual Funds
(Cost $14,652,103,072) | | | | | | | 14,349,525,553 | |
| | | | | | | | |
Total Investments—100.0%
(Cost $14,652,103,072) (d) | | | | | | | 14,349,525,553 | |
Other assets and liabilities (net)—0.0% | | | | | | | (3,658,898 | ) |
| | | | | | | | |
| Net Assets—100.0% | | | | | | $ | 14,345,866,655 | |
| | | | | | | | |
| (a) | A Portfolio of Metropolitan Series Fund. (See Note 6 of the Notes to Financial Statements for a summary of transactions in the securities of affiliated Underlying Portfolios.) |
| (b) | A Portfolio of Met Investors Series Trust. (See Note 6 of the Notes to Financial Statements for a summary of transactions in the securities of affiliated Underlying Portfolios.) |
| (c) | Non-income producing security. |
| (d) | As of June 30, 2016, the aggregate cost of investments was $14,652,103,072. The aggregate unrealized appreciation and depreciation of investments were $516,466,427 and $(819,043,946), respectively, resulting in net unrealized depreciation of $(302,577,519). |
See accompanying notes to financial statements.
MSF-6
Metropolitan Series Fund
MetLife Asset Allocation 60 Portfolio
Schedule of Investments as of June 30, 2016 (Unaudited)
Fair Value Hierarchy
Accounting principles generally accepted in the United States of America (“GAAP”) define fair market value as the price that the Portfolio would receive to sell an asset or pay to transfer a liability in an orderly transaction between market participants at the measurement date. It establishes a fair value hierarchy that prioritizes inputs to valuation methods and requires disclosure of the fair value hierarchy, separately for each major category of assets and liabilities, that segregates fair value measurements into three levels. Levels 1, 2 and 3 of the fair value hierarchy are defined as follows:
Level 1 - unadjusted quoted prices in active markets for identical investments
Level 2 - other significant observable inputs (including, but not limited to, quoted prices for similar assets or liabilities in markets that are either active or inactive; inputs other than quoted prices that are observable such as interest rates, yield curves, volatilities, prepayment speeds, loss severities, credit risks, default rates, or other market corroborated inputs)
Level 3 - significant unobservable inputs based on the best information available in the circumstances, to the extent observable inputs are unavailable (including the Portfolio’s own assumptions used in determining the fair value of investments and derivative financial instruments)
The inputs or methodologies used for valuing investments are not necessarily an indication of the risk associated with investing in them. Changes to the inputs or methodologies used may result in transfers between levels, which will be recognized as of the beginning of the reporting period. Information on transfers between Level 1 and Level 2, if any, will be disclosed following the fair value hierarchy table below. A reconciliation of Level 3 securities, if any, will also be disclosed following the fair value hierarchy table. For more information about the Portfolio’s policy regarding the valuation of investments, please refer to the Notes to Financial Statements.
The following table summarizes the fair value hierarchy of the Portfolio’s investments as of June 30, 2016:
| | | | | | | | | | | | | | | | |
| Description | | Level 1 | | | Level 2 | | | Level 3 | | | Total | |
| Mutual Funds | | | | | | | | | | | | | | | | |
Affiliated Investment Companies | | $ | 14,349,525,553 | | | $ | — | | | $ | — | | | $ | 14,349,525,553 | |
Total Investments | | $ | 14,349,525,553 | | | $ | — | | | $ | — | | | $ | 14,349,525,553 | |
| | | | | | | | | | | | | | | | | |
See accompanying notes to financial statements.
MSF-7
Metropolitan Series Fund
MetLife Asset Allocation 60 Portfolio
Statement of Assets and Liabilities
June 30, 2016 (Unaudited)
| | | | |
Assets | | | | |
Affiliated investments at value (a) | | $ | 14,349,525,553 | |
Receivable for: | | | | |
Investments sold | | | 5,022,398 | |
Fund shares sold | | | 391,065 | |
| | | | |
Total Assets | | | 14,354,939,016 | |
Liabilities | | | | |
Payables for: | | | | |
Fund shares redeemed | | | 5,413,463 | |
Accrued Expenses: | | | | |
Management fees | | | 616,693 | |
Distribution and service fees | | | 2,863,019 | |
Deferred trustees’ fees | | | 125,024 | |
Other expenses | | | 54,162 | |
| | | | |
Total Liabilities | | | 9,072,361 | |
| | | | |
Net Assets | | $ | 14,345,866,655 | |
| | | | |
Net Assets Consist of: | | | | |
Paid in surplus | | $ | 13,967,193,471 | |
Undistributed net investment income | | | 239,118,024 | |
Accumulated net realized gain | | | 442,132,679 | |
Unrealized depreciation on affiliated investments | | | (302,577,519 | ) |
| | | | |
Net Assets | | $ | 14,345,866,655 | |
| | | | |
Net Assets | | | | |
Class A | | $ | 327,463,722 | |
Class B | | | 14,018,402,933 | |
Capital Shares Outstanding* | | | | |
Class A | | | 29,151,574 | |
Class B | | | 1,253,155,820 | |
Net Asset Value, Offering Price and Redemption Price Per Share | | | | |
Class A | | $ | 11.23 | |
Class B | | | 11.19 | |
| * | The Portfolio is authorized to issue an unlimited number of shares. |
| (a) | Identified cost of affiliated investments was $14,652,103,072. |
Statement of Operations
Six Months Ended June 30, 2016 (Unaudited)
| | | | |
Investment Income | | | | |
Dividends from Affiliated Underlying Portfolios | | $ | 261,447,326 | |
Interest | | | 865 | |
| | | | |
Total investment income | | | 261,448,191 | |
Expenses | | | | |
Management fees | | | 3,719,669 | |
Administration fees | | | 11,064 | |
Custodian and accounting fees | | | 12,631 | |
Distribution and service fees—Class B | | | 17,265,186 | |
Audit and tax services | | | 14,936 | |
Legal | | | 13,575 | |
Trustees’ fees and expenses | | | 15,990 | |
Miscellaneous | | | 14,485 | |
| | | | |
Total expenses | | | 21,067,536 | |
| | | | |
Net Investment Income | | | 240,380,655 | |
| | | | |
Net Realized and Unrealized Gain (Loss) | | | | |
| Net realized gain (loss) on: | | | | |
Affiliated investments | | | (11,708,318 | ) |
Capital gain distributions from Affiliated Underlying Portfolios | | | 583,015,071 | |
| | | | |
Net realized gain | | | 571,306,753 | |
| | | | |
Net change in unrealized depreciation on affiliated investments | | | (467,554,554 | ) |
| | | | |
Net realized and unrealized gain | | | 103,752,199 | |
| | | | |
Net Increase in Net Assets from Operations | | $ | 344,132,854 | |
| | | | |
See accompanying notes to financial statements.
MSF-8
Metropolitan Series Fund
MetLife Asset Allocation 60 Portfolio
Statements of Changes in Net Assets
| | | | | | | | |
| | | Six Months
Ended
June 30,
2016
(Unaudited) | | | Year Ended
December 31,
2015 | |
Increase (Decrease) in Net Assets: | | | | | | | | |
From Operations | | | | | | | | |
Net investment income | | $ | 240,380,655 | | | $ | 342,104,501 | |
Net realized gain | | | 571,306,753 | | | | 1,441,615,565 | |
Net change in unrealized depreciation | | | (467,554,554 | ) | | | (1,947,867,438 | ) |
| | | | | | | | |
Increase (decrease) in net assets from operations | | | 344,132,854 | | | | (164,147,372 | ) |
| | | | | | | | |
From Distributions to Shareholders | | | | | | | | |
Net investment income | | | | | | | | |
Class A | | | (11,103,260 | ) | | | (2,574,394 | ) |
Class B | | | (440,630,708 | ) | | | (82,914,174 | ) |
Net realized capital gains | | | | | | | | |
Class A | | | (29,446,663 | ) | | | (22,379,384 | ) |
Class B | | | (1,271,092,592 | ) | | | (997,241,710 | ) |
| | | | | | | | |
Total distributions | | | (1,752,273,223 | ) | | | (1,105,109,662 | ) |
| | | | | | | | |
Increase (decrease) in net assets from capital share transactions | | | 1,034,134,351 | | | | (490,987,334 | ) |
| | | | | | | | |
Total decrease in net assets | | | (374,006,018 | ) | | | (1,760,244,368 | ) |
| | |
Net Assets | | | | | | | | |
Beginning of period | | | 14,719,872,673 | | | | 16,480,117,041 | |
| | | | | | | | |
End of period | | $ | 14,345,866,655 | | | $ | 14,719,872,673 | |
| | | | | | | | |
| | |
Undistributed net investment income | | | | | | | | |
End of period | | $ | 239,118,024 | | | $ | 450,471,337 | |
| | | | | | | | |
Other Information:
Capital Shares
Transactions in capital shares were as follows:
| | | | | | | | | | | | | | | | |
| | | Six Months Ended
June 30, 2016
(Unaudited) | | | Year Ended
December 31, 2015 | |
| | | Shares | | | Value | | | Shares | | | Value | |
Class A | | | | | | | | | | | | | | | | |
Sales | | | 845,874 | | | $ | 10,276,986 | | | | 2,093,319 | | | $ | 27,736,767 | |
Reinvestments | | | 3,640,029 | | | | 40,549,923 | | | | 1,909,241 | | | | 24,953,778 | |
Redemptions | | | (1,740,033 | ) | | | (21,305,433 | ) | | | (3,600,738 | ) | | | (47,485,604 | ) |
| | | | | | | | | | | | | | | | |
Net increase | | | 2,745,870 | | | $ | 29,521,476 | | | | 401,822 | | | $ | 5,204,941 | |
| | | | | | | | | | | | | | | | |
Class B | | | | | | | | | | | | | | | | |
Sales | | | 6,739,326 | | | $ | 82,115,965 | | | | 14,904,548 | | | $ | 196,446,489 | |
Reinvestments | | | 154,348,359 | | | | 1,711,723,300 | | | | 82,961,281 | | | | 1,080,155,884 | |
Redemptions | | | (64,868,969 | ) | | | (789,226,390 | ) | | | (134,153,618 | ) | | | (1,772,794,648 | ) |
| | | | | | | | | | | | | | | | |
Net increase (decrease) | | | 96,218,716 | | | $ | 1,004,612,875 | | | | (36,287,789 | ) | | $ | (496,192,275 | ) |
| | | | | | | | | | | | | | | | |
Increase (decrease) derived from capital shares transactions | | | | | | $ | 1,034,134,351 | | | | | | | $ | (490,987,334 | ) |
| | | | | | | | | | | | | | | | |
See accompanying notes to financial statements.
MSF-9
Metropolitan Series Fund
MetLife Asset Allocation 60 Portfolio
Financial Highlights
| | | | | | | | | | | | | | | | | | | | | | | | |
| Selected per share data | | | |
| | | Class A | |
| | | Six Months
Ended
June 30,
2016
(Unaudited) | | | Year Ended December 31, | |
| | | | 2015 | | | 2014 | | | 2013 | | | 2012 | | | 2011 | |
Net Asset Value, Beginning of Period | | $ | 12.50 | | | $ | 13.57 | | | $ | 13.74 | | | $ | 11.98 | | | $ | 10.83 | | | $ | 11.14 | |
| | | | | | | | | | | | | | | | | | | | | | | | |
Income (Loss) from Investment Operations | | | | | | | | | | | | | | | | | | | | | | | | |
Net investment income (a) | | | 0.22 | | | | 0.32 | | | | 0.21 | | | | 0.25 | | | | 0.23 | | | | 0.22 | |
Net realized and unrealized gain (loss) on investments | | | 0.09 | | | | (0.41 | ) | | | 0.48 | | | | 1.89 | | | | 1.21 | | | | (0.34 | ) |
| | | | | | | | | | | | | | | | | | | | | | | | |
Total from investment operations | | | 0.31 | | | | (0.09 | ) | | | 0.69 | | | | 2.14 | | | | 1.44 | | | | (0.12 | ) |
| | | | | | | | | | | | | | | | | | | | | | | | |
Less Distributions | | | | | | | | | | | | | | | | | | | | | | | | |
Distributions from net investment income | | | (0.43 | ) | | | (0.10 | ) | | | (0.32 | ) | | | (0.28 | ) | | | (0.29 | ) | | | (0.19 | ) |
Distributions from net realized capital gains | | | (1.15 | ) | | | (0.88 | ) | | | (0.54 | ) | | | (0.10 | ) | | | 0.00 | | | | 0.00 | |
| | | | | | | | | | | | | | | | | | | | | | | | |
Total distributions | | | (1.58 | ) | | | (0.98 | ) | | | (0.86 | ) | | | (0.38 | ) | | | (0.29 | ) | | | (0.19 | ) |
| | | | | | | | | | | | | | | | | | | | | | | | |
Net Asset Value, End of Period | | $ | 11.23 | | | $ | 12.50 | | | $ | 13.57 | | | $ | 13.74 | | | $ | 11.98 | | | $ | 10.83 | |
| | | | | | | | | | | | | | | | | | | | | | | | |
Total Return (%) (b) | | | 2.62 | (c) | | | (0.99 | ) | | | 5.29 | | | | 18.29 | | | | 13.47 | | | | (1.14 | ) |
| | | | | | |
Ratios/Supplemental Data | | | | | | | | | | | | | | | | | | | | | | | | |
Ratio of expenses to average net assets (%) (d) | | | 0.05 | (e) | | | 0.05 | | | | 0.05 | | | | 0.06 | | | | 0.06 | | | | 0.06 | |
Ratio of net investment income to average net assets (%) (f) | | | 1.78 | (e)(g) | | | 2.40 | | | | 1.58 | | | | 1.95 | | | | 2.03 | | | | 1.99 | |
Portfolio turnover rate (%) | | | 9 | (c) | | | 15 | | | | 16 | | | | 15 | | | | 11 | | | | 41 | |
Net assets, end of period (in millions) | | $ | 327.5 | | | $ | 330.1 | | | $ | 353.0 | | | $ | 331.6 | | | $ | 274.8 | | | $ | 239.0 | |
| |
| | | Class B | |
| | | Six Months
Ended
June 30,
2016
(Unaudited) | | | Year Ended December 31, | |
| | | | 2015 | | | 2014 | | | 2013 | | | 2012 | | | 2011 | |
Net Asset Value, Beginning of Period | | $ | 12.44 | | | $ | 13.52 | | | $ | 13.69 | | | $ | 11.94 | | | $ | 10.79 | | | $ | 11.10 | |
| | | | | | | | | | | | | | | | | | | | | | | | |
Income (Loss) from Investment Operations | | | | | | | | | | | | | | | | | | | | | | | | |
Net investment income (a) | | | 0.21 | | | | 0.28 | | | | 0.05 | | | | 0.22 | | | | 0.21 | | | | 0.19 | |
Net realized and unrealized gain (loss) on investments | | | 0.09 | | | | (0.41 | ) | | | 0.61 | | | | 1.88 | | | | 1.20 | | | | (0.33 | ) |
| | | | | | | | | | | | | | | | | | | | | | | | |
Total from investment operations | | | 0.30 | | | | (0.13 | ) | | | 0.66 | | | | 2.10 | | | | 1.41 | | | | (0.14 | ) |
| | | | | | | | | | | | | | | | | | | | | | | | |
Less Distributions | | | | | | | | | | | | | | | | | | | | | | | | |
Distributions from net investment income | | | (0.40 | ) | | | (0.07 | ) | | | (0.29 | ) | | | (0.25 | ) | | | (0.26 | ) | | | (0.17 | ) |
Distributions from net realized capital gains | | | (1.15 | ) | | | (0.88 | ) | | | (0.54 | ) | | | (0.10 | ) | | | 0.00 | | | | 0.00 | |
| | | | | | | | | | | | | | | | | | | | | | | | |
Total distributions | | | (1.55 | ) | | | (0.95 | ) | | | (0.83 | ) | | | (0.35 | ) | | | (0.26 | ) | | | (0.17 | ) |
| | | | | | | | | | | | | | | | | | | | | | | | |
Net Asset Value, End of Period | | $ | 11.19 | | | $ | 12.44 | | | $ | 13.52 | | | $ | 13.69 | | | $ | 11.94 | | | $ | 10.79 | |
| | | | | | | | | | | | | | | | | | | | | | | | |
Total Return (%) (b) | | | 2.52 | (c) | | | (1.27 | ) | | | 5.05 | | | | 17.98 | | | | 13.24 | | | | (1.37 | ) |
| | | | | | |
Ratios/Supplemental Data | | | | | | | | | | | | | | | | | | | | | | | | |
Ratio of expenses to average net assets (%) (d) | | | 0.30 | (e) | | | 0.30 | | | | 0.30 | | | | 0.31 | | | | 0.31 | | | | 0.31 | |
Ratio of net investment income to average net assets (%) (f) | | | 1.54 | (e)(g) | | | 2.15 | | | | 0.39 | | | | 1.71 | | | | 1.81 | | | | 1.74 | |
Portfolio turnover rate (%) | | | 9 | (c) | | | 15 | | | | 16 | | | | 15 | | | | 11 | | | | 41 | |
Net assets, end of period (in millions) | | $ | 14,018.4 | | | $ | 14,389.8 | | | $ | 16,127.1 | | | $ | 5,420.8 | | | $ | 4,800.4 | | | $ | 4,461.4 | |
| (a) | Per share amounts based on average shares outstanding during the period. |
| (b) | Total return does not reflect any insurance, sales, separate account or administrative charges of variable annuity or life insurance contracts or any additional expenses that contract owners may bear under their variable contracts. If these charges were included, the returns would be lower. |
| (c) | Periods less than one year are not computed on an annualized basis. |
| (d) | The ratio of operating expenses to average net assets does not include expenses of the Underlying Portfolios in which the Asset Allocation Portfolio invests. |
| (e) | Computed on an annualized basis. |
| (f) | Recognition of net investment income by the Asset Allocation Portfolio is affected by the timing of the declaration of dividends by the Underlying Portfolios in which it invests. |
| (g) | The income earned by the Asset Allocation Portfolio through the investments in Underlying Portfolios is not annualized. |
See accompanying notes to financial statements.
MSF-10
Metropolitan Series Fund
MetLife Asset Allocation 60 Portfolio
Notes to Financial Statements—June 30, 2016 (Unaudited)
1. Organization
Metropolitan Series Fund (the “Trust”) is organized as a Delaware statutory trust and registered under the Investment Company Act of 1940, as amended (the “1940 Act”), as an open-end management investment company. The Trust, which is managed by MetLife Advisers, LLC (“MetLife Advisers” or the “Adviser”), an affiliate of MetLife, Inc., is currently comprised of thirty series, each of which operates as a distinct investment vehicle of the Trust. The portfolio included in this report is MetLife Asset Allocation 60 Portfolio (the “Asset Allocation Portfolio”), which is diversified. The Asset Allocation Portfolio operates under a “fund of funds” structure, investing substantially all of its assets in other Portfolios advised by MetLife Advisers (each, an “Underlying Portfolio,” and, collectively, the “Underlying Portfolios”). Shares in the Asset Allocation Portfolio are not offered directly to the general public and are currently available only to separate accounts established by Metropolitan Life Insurance Company (“MetLife”) and other affiliated life insurance companies.
The Asset Allocation Portfolio has registered and offers two classes of shares: Class A and B shares. Shares of each Class of the Asset Allocation Portfolio represent an equal pro rata interest in the Asset Allocation Portfolio and generally give the shareholder the same voting, dividend, liquidation, and other rights. Investment income, realized and unrealized capital gains and losses, the common expenses of the Asset Allocation Portfolio, and certain Asset Allocation Portfolio-level expense reductions, if any, are allocated on a pro rata basis to each Class based on the relative net assets of each Class to the net assets of the Asset Allocation Portfolio. Each Class of shares differs in its respective distribution plan and such distribution expenses are allocated to the corresponding Class of shares.
2. Significant Accounting Policies
The preparation of financial statements in conformity with accounting principles generally accepted in the United States of America (“GAAP”) requires management to make estimates and assumptions that affect the reported amounts of assets and liabilities and disclosure of contingent assets and liabilities as of the date of the financial statements and the reported amounts of income and expenses during the reporting period. Actual results could differ from those estimates. In the preparation of these financial statements, management has evaluated events and transactions subsequent to June 30, 2016 through the date the financial statements were issued.
The Asset Allocation Portfolio is an investment company and follows the accounting and reporting guidance of the Financial Accounting Standards Board (“FASB”) Accounting Standards Codification Topic 946- Financial Services- Investment Companies. The following is a summary of significant accounting policies consistently followed by the Asset Allocation Portfolio in the preparation of its financial statements.
Investment Valuation and Fair Value Measurements - Investments in the Underlying Portfolios are valued at their closing daily net asset value on the valuation date. Investments in the Underlying Portfolios are categorized as Level 1 within the fair value hierarchy. For information about the use of fair value pricing by the Underlying Portfolios, please refer to the prospectuses of the Underlying Portfolios.
Investment Transactions and Related Investment Income - Asset Allocation Portfolio security transactions are recorded on the trade date. Dividend income is recorded on the ex-dividend date. Realized gains and losses on investments are determined on the identified cost basis, which is the same basis used for federal income tax purposes. Capital gains distributions received from the Underlying Portfolios are recorded as net realized gain in the Statement of Operations.
Dividends and Distributions to Shareholders - The Asset Allocation Portfolio records dividends and distributions on the ex-dividend date. Net realized gains from securities transactions (if any) are generally distributed annually to shareholders. The timing and characterization of certain income and capital gains distributions are determined in accordance with federal tax regulations that may differ from GAAP. Permanent book and tax basis differences relating to shareholder distributions will result in reclassification between under/over distributed net investment income, accumulated net realized gains/losses, and paid-in surplus. Book-tax differences are primarily due to distributions from Underlying Portfolios. These adjustments have no impact on net assets or the results of operations.
Income Taxes - It is the Asset Allocation Portfolio’s policy to comply with the requirements of the Internal Revenue Code of 1986, as amended, and regulations thereunder, applicable to regulated investment companies and to distribute, with respect to each taxable year, all of its taxable income to shareholders. Therefore, no federal income tax provision is required. The Asset Allocation Portfolio files U.S. federal tax returns. No income tax returns are currently under examination. The Asset Allocation Portfolio’s federal tax returns for the prior three fiscal years remain subject to examination by the Internal Revenue Service. As of June 30, 2016, the Asset Allocation Portfolio had no uncertain tax positions that would require financial statement recognition, or de-recognition or disclosure.
MSF-11
Metropolitan Series Fund
MetLife Asset Allocation 60 Portfolio
Notes to Financial Statements—June 30, 2016 (Unaudited)—(Continued)
3. Certain Risks
In the normal course of business, the Underlying Portfolios invest in securities and enter into transactions where risks exist due to fluctuations in the market (“market risk”) or failure of the other party to a transaction to perform (“credit and counterparty risk”).
Market Risk: The value of securities held by the Underlying Portfolios may decline in response to certain events, including those directly involving the companies whose securities are owned by the Underlying Portfolios; conditions affecting the general economy; overall market changes; local, regional or global political, social or economic instability; and currency, interest rate, and price fluctuations.
Credit and Counterparty Risk: The Underlying Portfolios may be exposed to counterparty risk, or the risk that an entity with which the Underlying Portfolios have unsettled or open transactions may default. The potential loss could exceed the value of the financial assets and liabilities recorded in the financial statements. Financial assets that potentially expose the Underlying Portfolios to credit and counterparty risk consist principally of cash due from counterparties and investments. The Underlying Portfolios manage counterparty risk by entering into agreements only with counterparties that they believe have the financial resources to honor their obligations and by monitoring the financial stability of those counterparties. The Underlying Portfolios’ investment adviser attempts to mitigate counterparty risk by (i) periodically assessing the creditworthiness of their trading partners, (ii) monitoring and/or limiting the amount of their net exposure to each individual counterparty based on the adviser’s assessment, and (iii) requiring collateral from the counterparty for certain transactions. In order to preserve certain safeguards for non-standard settlement trades, the Underlying Portfolios restrict their exposure to credit and counterparty losses by entering into master netting agreements (“Master Agreements”) with counterparties (approved brokers) with whom the Underlying Portfolios undertake a significant volume of transactions. Master Agreements govern the terms of certain transactions, and reduce the counterparty risk associated with relevant transactions by specifying credit protection mechanisms and providing standardization that improves legal certainty. Master Agreements can also help limit counterparty risk by specifying collateral posting arrangements at pre-arranged exposure levels.
The Asset Allocation Portfolio’s prospectus includes a discussion of the principal risks of investing in the Asset Allocation Portfolio and in the Underlying Portfolios in which it invests.
4. Investment Transactions
Aggregate cost of purchases and proceeds of sales of shares of the Underlying Portfolios by the Asset Allocation Portfolio for the six months ended June 30, 2016 were as follows:
| | | | | | | | | | | | |
Purchases | | | Sales | |
U.S. Government | | Non U.S. Government | | | U.S. Government | | | Non U.S. Government | |
| $0 | | $ | 1,366,718,812 | | | $ | 0 | | | $ | 1,261,708,844 | |
5. Investment Management Fees and Other Transactions with Affiliates
Investment Management Agreement - MetLife Advisers is the investment adviser to the Asset Allocation Portfolio. The Trust has entered into an investment management agreement with MetLife Advisers with respect to the Asset Allocation Portfolio. For providing investment management services to the Asset Allocation Portfolio, MetLife Advisers receives monthly compensation at the following annual rates:
| | | | | | |
Management
Fees earned by
MetLife Advisers
for the six months ended
June 30, 2016 | | % per annum | | | Average daily net assets |
| $3,719,669 | | | 0.100 | % | | Of the first $500 million |
| | | 0.075 | % | | Of the next $500 million |
| | | 0.050 | % | | On amounts in excess of $1 billion |
In addition to the above management fee paid to MetLife Advisers, the Asset Allocation Portfolio indirectly pays MetLife Advisers an investment advisory fee through its investments in the Underlying Portfolios.
Certain officers and trustees of the Trust may also be officers of MetLife Advisers; however, such officers and trustees receive no compensation from the Trust.
On January 12, 2016, MetLife, Inc. announced its plan to pursue the separation of a substantial portion of its retail segment and is currently evaluating structural alternatives for such separation. It is anticipated that MetLife Advisers would be included in any such separation. Any separation transaction that might occur will be subject to the satisfaction of various conditions and approvals,
MSF-12
Metropolitan Series Fund
MetLife Asset Allocation 60 Portfolio
Notes to Financial Statements—June 30, 2016 (Unaudited)—(Continued)
including approval of any transaction by the MetLife, Inc. Board of Directors, satisfaction of any applicable requirements of the SEC, and receipt of insurance and other regulatory approvals and other anticipated conditions. Because the form of a separation had yet to be determined, MetLife, Inc. cannot currently provide a specific potential completion date or information about the potential impact on MetLife Advisers. No assurance can be given regarding the form that a separation transaction may take or the specific terms thereof, or that a separation will in fact occur. Depending on the form a separation takes, MetLife Advisers’ continued service as investment adviser to the Trusts could be subject to the satisfaction of various conditions and approvals, which may include obtaining approvals from the Trusts’ Board and shareholders.
Transfer Agency Agreement - MetLife serves as the transfer agent for the Trust. MetLife receives no fees for its services to the Trust under the transfer agency agreement.
Distribution and Service Fees - The Trust has a distribution agreement with MetLife Investors Distribution Company (“MIDC” or the “Distributor”) in which MIDC serves as the distributor for the Asset Allocation Portfolio’s Class A and B Shares. MIDC is a wholly-owned subsidiary of MetLife Investors Group, LLC, an affiliate of the Adviser. The Trust has also adopted a Distribution and Service Plan under Rule 12b-1 of the 1940 Act for the Asset Allocation Portfolio’s Class B shares. Under the Distribution and Services Plan, the Class B shares of the Asset Allocation Portfolio pay a fee to compensate the Insurance Companies (or their affiliates) and other broker-dealers and financial intermediaries involved in the offer and sale of Asset Allocation Portfolio shares for promoting or selling and servicing the Class B shares of the Asset Allocation Portfolio. The fees under the Distribution and Services Plan for each class of the Asset Allocation Portfolio’s shares are calculated as a percentage of the Asset Allocation Portfolio’s average daily net assets that are attributable to that Class. Currently, the fee is 0.25% per year for Class B shares. Amount incurred by the Asset Allocation Portfolio for the six months ended June 30, 2016 is shown as Distribution and service fees in the Statement of Operations.
Deferred Trustee Compensation - Each Trustee who is not currently an active employee of MetLife or its affiliates receives compensation from the Trust for his or her service to the Trust. A deferred compensation plan (the “Plan”) is available to the Trustees on a voluntary basis. Deferred amounts remain in the Trust until distributed in accordance with the provisions of the Plan. The value of a participating Trustee’s deferral account is based on theoretical investments of deferred amounts on the normal payment dates in certain portfolios of the Trust or Met Investors Series Trust, an affiliate of the Trust, as designated by the participating Trustee. Changes in the value of participants’ deferral accounts are reflected as Trustees’ fees and expenses in the Statement of Operations. The portion of the accrued obligations allocated to the Asset Allocation Portfolio under the Plan is reflected as Deferred trustees’ fees in the Statement of Assets and Liabilities.
6. Transactions in Securities of Affiliated Underlying Portfolios
The Asset Allocation Portfolio does not invest in the Underlying Portfolios for the purpose of exercising control; however, investments by the Asset Allocation Portfolio within its principal investment strategies may represent a significant portion of the Underlying Portfolios’ net assets. Transactions in the Underlying Portfolios for the six months ended June 30, 2016 were as follows:
| | | | | | | | | | | | | | | | |
Underlying Portfolio | | Number of
shares held at
December 31, 2015 | | | Shares
purchased | | | Shares
sold | | | Number of
shares held at
June 30, 2016 | |
Baillie Gifford International Stock | | | 37,579,213 | | | | 640,971 | | | | (825,585 | ) | | | 37,394,599 | |
BlackRock Bond Income | | | 8,450,922 | | | | 822,060 | | | | (623,506 | ) | | | 8,649,476 | |
BlackRock Capital Appreciation | | | 12,239,055 | | | | 1,407,103 | | | | (81,984 | ) | | | 13,564,174 | |
BlackRock High Yield | | | 12,157,806 | | | | 833,672 | | | | (805,000 | ) | | | 12,186,478 | |
BlackRock Large Cap Value | | | 60,520,848 | | | | 6,030,238 | | | | (3,321,768 | ) | | | 63,229,318 | |
Clarion Global Real Estate | | | 19,027,930 | | | | 420,384 | | | | (1,510,674 | ) | | | 17,937,640 | |
ClearBridge Aggressive Growth | | | 28,753,090 | | | | 2,936,958 | | | | (141,172 | ) | | | 31,548,876 | |
Goldman Sachs Mid Cap Value | | | 6,424,892 | | | | 416,786 | | | | (3,398,977 | ) | | | 3,442,701 | |
Harris Oakmark International | | | 31,785,933 | | | | 6,513,777 | | | | (152,816 | ) | | | 38,146,894 | |
Invesco Comstock | | | 36,786,881 | | | | 4,381,965 | | | | (689,566 | ) | | | 40,479,280 | |
Invesco Small Cap Growth | | | 16,864,369 | | | | 3,386,597 | | | | (2,859,706 | ) | | | 17,391,260 | |
Jennison Growth | | | 34,055,978 | | | | 5,978,759 | | | | (126,877 | ) | | | 39,907,860 | |
JPMorgan Core Bond | | | 65,401,734 | | | | 2,343,863 | | | | (5,446,379 | ) | | | 62,299,218 | |
JPMorgan Small Cap Value | | | 9,538,284 | | | | 733,682 | | | | (2,880,167 | ) | | | 7,391,799 | |
Loomis Sayles Small Cap Growth | | | 5,587,636 | | | | 792,824 | | | | (38,088 | ) | | | 6,342,372 | |
Lord Abbett Bond Debenture | | | 8,946,551 | | | | 610,812 | | | | (9,557,363 | ) | | | — | |
Met/Aberdeen Emerging Markets Equity | | | 29,047,732 | | | | 2,647,778 | | | | (2,990,914 | ) | | | 28,704,596 | |
Met/Artisan International | | | 30,405,402 | | | | 3,725,259 | | | | (122,983 | ) | | | 34,007,678 | |
Met/Artisan Mid Cap Value | | | 670,611 | | | | 48,838 | | | | (369,353 | ) | | | 350,096 | |
Met/Dimensional International Small Company | | | 11,580,137 | | | | 1,022,062 | | | | (709,915 | ) | | | 11,892,284 | |
Met/Eaton Vance Floating Rate | | | 30,190,747 | | | | 1,220,625 | | | | (2,128,638 | ) | | | 29,282,734 | |
MSF-13
Metropolitan Series Fund
MetLife Asset Allocation 60 Portfolio
Notes to Financial Statements—June 30, 2016 (Unaudited)—(Continued)
| | | | | | | | | | | | | | | | |
Underlying Portfolio | | Number of
shares held at
December 31, 2015 | | | Shares
purchased | | | Shares
sold | | | Number of
shares held at
June 30, 2016 | |
Met/Franklin Low Duration Total Return | | | 46,665,314 | | | | 995,639 | | | | (17,017,813 | ) | | | 30,643,140 | |
Met/Templeton International Bond | | | 44,786,279 | | | | 755,698 | | | | (1,149,193 | ) | | | 44,392,784 | |
Met/Wellington Core Equity Opportunities (formerly, WMC Core Equity Opportunities) | | | 21,021,582 | | | | 3,076,708 | | | | (1,183,058 | ) | | | 22,915,232 | |
Met/Wellington Large Cap Research (formerly, WMC Large Cap Research) | | | 26,688,876 | | | | 6,897,790 | | | | (502,076 | ) | | | 33,084,590 | |
MetLife Small Cap Value | | | 14,320,914 | | | | 599,170 | | | | (3,910,012 | ) | | | 11,010,072 | |
MFS Research International | | | 27,620,038 | | | | 1,000,560 | | | | (125,290 | ) | | | 28,495,308 | |
MFS Value | | | 44,276,996 | | | | 5,215,525 | | | | (3,605,608 | ) | | | 45,886,913 | |
Neuberger Berman Genesis | | | 10,092,568 | | | | 37,462 | | | | (2,466,809 | ) | | | 7,663,221 | |
Oppenheimer Global Equity | | | 7,229,298 | | | | 586,333 | | | | (26,189 | ) | | | 7,789,442 | |
PIMCO Inflation Protected Bond | | | 48,179,383 | | | | 4 | | | | (3,899,561 | ) | | | 44,279,826 | |
PIMCO Total Return | | | 79,222,899 | | | | 2,511,974 | | | | (5,656,630 | ) | | | 76,078,243 | |
T. Rowe Price Large Cap Growth | | | 19,742,591 | | | | 3,103,886 | | | | (73,289 | ) | | | 22,773,188 | |
T. Rowe Price Large Cap Value | | | 17,481,846 | | | | 2,802,730 | | | | (1,256,770 | ) | | | 19,027,806 | |
T. Rowe Price Mid Cap Growth | | | 13,117,456 | | | | 2,132,206 | | | | (610,796 | ) | | | 14,638,866 | |
T. Rowe Price Small Cap Growth | | | 10,092,964 | | | | 1,462,061 | | | | (308,040 | ) | | | 11,246,985 | |
TCW Core Fixed Income | | | 67,619,840 | | | | 12,459,150 | | | | (5,076,677 | ) | | | 75,002,313 | |
Van Eck Global Natural Resources | | | 31,347,644 | | | | 8,045,100 | | | | (9,198,951 | ) | | | 30,193,793 | |
Western Asset Management Strategic Bond Opportunities | | | 20,131,062 | | | | 8,337,097 | | | | (6,036,472 | ) | | | 22,431,687 | |
Western Asset Management U.S. Government | | | 50,301,302 | | | | 1,774,038 | | | | (3,755,543 | ) | | | 48,319,797 | |
| | | | |
Underlying Portfolio | | Net Realized
Gain/(Loss) on sales
of Affiliated
Underlying
Portfolios | | | Capital Gain
Distributions
from Affiliated
Underlying
Portfolios | | | Dividend Income
from Affiliated
Underlying
Portfolios | | | Ending Value
as of
June 30, 2016 | |
Baillie Gifford International Stock | | $ | 1,089,897 | | | $ | — | | | $ | 5,901,450 | | | $ | 357,866,315 | |
BlackRock Bond Income | | | 811,466 | | | | — | | | | 29,451,371 | | | | 935,527,369 | |
BlackRock Capital Appreciation | | | 474,339 | | | | 39,001,720 | | | | — | | | | 431,612,003 | |
BlackRock High Yield | | | (517,131 | ) | | | — | | | | 5,927,404 | | | | 87,255,181 | |
BlackRock Large Cap Value | | | (7,274,275 | ) | | | 39,003,262 | | | | 8,533,754 | | | | 507,099,133 | |
Clarion Global Real Estate | | | 4,195,926 | | | | — | | | | 5,019,352 | | | | 220,812,353 | |
ClearBridge Aggressive Growth | | | 1,404,858 | | | | — | | | | 3,104,530 | | | | 459,036,145 | |
Goldman Sachs Mid Cap Value | | | (10,810,343 | ) | | | 2,799,199 | | | | 407,099 | | | | 36,423,774 | |
Harris Oakmark International | | | 308,535 | | | | 29,778,968 | | | | 10,627,952 | | | | 418,852,894 | |
Invesco Comstock | | | 3,957,155 | | | | 39,491,067 | | | | 14,343,965 | | | | 505,586,204 | |
Invesco Small Cap Growth | | | (4,197,777 | ) | | | 38,929,310 | | | | — | | | | 217,564,667 | |
Jennison Growth | | | 277,392 | | | | 65,649,827 | | | | 1,483,417 | | | | 492,462,998 | |
JPMorgan Core Bond | | | (839,660 | ) | | | — | | | | 19,630,242 | | | | 653,518,802 | |
JPMorgan Small Cap Value | | | (2,147,521 | ) | | | 7,397,311 | | | | 2,057,080 | | | | 109,029,034 | |
Loomis Sayles Small Cap Growth | | | 54,609 | | | | 7,899,726 | | | | — | | | | 72,429,889 | |
Lord Abbett Bond Debenture | | | (403,591 | ) | | | — | | | | 6,841,094 | | | | — | |
Met/Aberdeen Emerging Markets Equity | | | 1,217,862 | | | | — | | | | 3,132,446 | | | | 259,489,550 | |
Met/Artisan International | | | (78,628 | ) | | | — | | | | 2,929,645 | | | | 309,129,794 | |
Met/Artisan Mid Cap Value | | | 34,887,874 | | | | 7,898,618 | | | | 792,649 | | | | 72,333,321 | |
Met/Dimensional International Small Company | | | (2,041,556 | ) | | | 8,997,859 | | | | 3,115,481 | | | | 139,853,254 | |
Met/Eaton Vance Floating Rate | | | (140,582 | ) | | | — | | | | 12,071,985 | | | | 289,020,588 | |
Met/Franklin Low Duration Total Return | | | (5,132,635 | ) | | | — | | | | 9,366,957 | | | | 290,190,535 | |
Met/Templeton International Bond | | | (323,921 | ) | | | 1,107,739 | | | | — | | | | 426,170,728 | |
Met/Wellington Core Equity Opportunities (formerly, WMC Core Equity Opportunities) | | | 6,306,515 | | | | 27,985,252 | | | | 10,246,908 | | | | 644,834,632 | |
Met/Wellington Large Cap Research (formerly, WMC Large Cap Research) | | | 480,019 | | | | 28,059,029 | | | | 10,315,377 | | | | 426,460,359 | |
MetLife Small Cap Value | | | (11,076,942 | ) | | | 3,902,821 | | | | 1,919,420 | | | | 145,002,655 | |
MFS Research International | | | 10,579 | | | | — | | | | 6,407,820 | | | | 282,103,545 | |
MFS Value | | | 19,968,262 | | | | 58,751,722 | | | | 14,728,844 | | | | 658,018,338 | |
Neuberger Berman Genesis | | | 13,887,591 | | | | — | | | | 692,920 | | | | 146,214,254 | |
Oppenheimer Global Equity | | | (11,965 | ) | | | 7,046,111 | | | | 1,692,234 | | | | 137,639,432 | |
PIMCO Inflation Protected Bond | | | (4,206,415 | ) | | | — | | | | — | | | | 436,599,085 | |
PIMCO Total Return | | | (3,149,790 | ) | | | — | | | | 24,145,625 | | | | 871,095,885 | |
T. Rowe Price Large Cap Growth | | | 383,675 | | | | 53,851,738 | | | | 258,616 | | | | 425,403,152 | |
T. Rowe Price Large Cap Value | | | 18,558,213 | | | | 66,880,936 | | | | 17,548,695 | | | | 583,392,538 | |
MSF-14
Metropolitan Series Fund
MetLife Asset Allocation 60 Portfolio
Notes to Financial Statements—June 30, 2016 (Unaudited)—(Continued)
| | | | | | | | | | | | | | | | |
Underlying Portfolio | | Net Realized
Gain/(Loss) on sales
of Affiliated
Underlying
Portfolios | | | Capital Gain
Distributions
from Affiliated
Underlying
Portfolios | | | Dividend Income
from Affiliated
Underlying
Portfolios | | | Ending Value
as of
June 30, 2016 | |
T. Rowe Price Mid Cap Growth | | $ | 856,137 | | | $ | 20,995,331 | | | $ | — | | | $ | 144,924,776 | |
T. Rowe Price Small Cap Growth | | | 848,984 | | | | 27,587,525 | | | | 579,240 | | | | 218,978,802 | |
TCW Core Fixed Income | | | 355,349 | | | | — | | | | 6,195,603 | | | | 774,023,874 | |
Van Eck Global Natural Resources | | | (60,866,379 | ) | | | — | | | | 2,404,262 | | | | 294,087,545 | |
Western Asset Management Strategic Bond Opportunities | | | (9,517,300 | ) | | | — | | | | 4,577,810 | | | | 292,060,570 | |
Western Asset Management U.S. Government | | | 692,856 | | | | — | | | | 14,996,079 | | | | 577,421,580 | |
| | | | | | | | | | | | | | | | |
| | $ | (11,708,318 | ) | | $ | 583,015,071 | | | $ | 261,447,326 | | | $ | 14,349,525,553 | |
| | | | | | | | | | | | | | | | |
7. Contractual Obligations
Under the Trust’s organizational documents, its officers and Trustees may be indemnified against certain liabilities and expenses arising out of the performance of their duties to the Trust. Additionally, the Trust has a variety of indemnification obligations under contracts with its service providers. The Trust’s maximum exposure under these arrangements is unknown, as this would involve future claims that may be made against the Trust that have not yet occurred.
8. Income Tax Information
The tax character of distributions paid for the years ended December 31, 2015 and 2014 were as follows:
| | | | | | | | | | | | | | | | | | | | |
Ordinary Income | | | Long-Term Capital Gain | | | Total | |
2015 | | 2014 | | | 2015 | | | 2014 | | | 2015 | | | 2014 | |
| $88,972,467 | | $ | 123,142,634 | | | $ | 1,016,137,195 | | | $ | 216,577,065 | | | $ | 1,105,109,662 | | | $ | 339,719,699 | |
As of December 31, 2015, the components of distributable earnings (accumulated losses) on a federal income tax basis were as follows:
| | | | | | | | | | | | | | | | |
Undistributed
Ordinary
Income | | Undistributed
Long-Term
Capital Gain | | | Net
Unrealized
Appreciation | | | Other
Accumulated
Capital Losses | | | Total | |
| $453,991,577 | | $ | 1,295,257,386 | | | $ | 37,690,844 | | | $ | — | | | $ | 1,786,939,807 | |
The Asset Allocation Portfolio utilizes the provisions of the federal income tax laws that provide for the carryforward of capital losses for prior years, offsetting such losses against any future realized capital gains. Under the Regulated Investment Company Modernization Act of 2010 (the “Act”), net capital losses recognized after December 22, 2010 may be carried forward indefinitely and their character is retained as short-term and/or long-term losses. Previously, net capital losses were carried forward for up to eight years and treated as short-term losses. As a transition rule, the Act requires that post-enactment net capital losses be used before pre-enactment net capital losses.
As of December 31, 2015, the Asset Allocation Portfolio had no post-enactment accumulated capital losses and no pre-enactment accumulated capital loss carryforwards.
MSF-15
Metropolitan Series Fund
MetLife Asset Allocation 80 Portfolio
Managed by MetLife Advisers, LLC
Portfolio Manager Commentary*
PERFORMANCE
For the six month period ended June 30, 2016, the Class A and B shares of the MetLife Asset Allocation 80 Portfolio returned 1.86% and 1.72%, respectively. The Portfolio’s benchmark, the Dow Jones Moderately Aggressive Index1, returned 3.54%.
MARKET ENVIRONMENT / CONDITIONS
The first half of 2016 saw conflicted equity markets, remarkable bond performance and a second quarter rally in commodities. The themes of weak global growth persist, marked by a continued slowdown of Chinese gross domestic product (“GDP”) and razor-thin growth rates for developed economies. Commodities, as measured by the Bloomberg Commodity Index, were up 13.3%, largely driven by gains in the energy sub-index as oil jumped nearly $10 per barrel from recent lows. However, as the supply and demand in the period was decomposed, it appeared that the increase might have been due to supply side dynamics, and not necessarily driven by demand. As a result, the jump in oil price did not signal a turnaround in Chinese demand or some other bullish interpretation. The VIX volatility index experienced two notable spikes above the historical index average (one in late January/early February and the second in the period leading up to the so-called “Brexit” vote, the withdrawal of the United Kingdom (the “U.K.”) from the European Union), as investors transmitted their fears into their trading patterns, elevating volatility. Equities appeared historically overvalued when examining the cyclically-adjusted Shiller price/earnings (“P/E”) ratio, which showed domestic equities hovering near the third-highest valuation level since the 1870’s and did not give confidence to investors since high market P/E ratios have historically preceded periods of declining equity prices. The Federal Reserve, clearly anxious about repeating their December 2015 25 basis point rate hike in the middle of the uncertainty, signaled a flat 2016 for policy actions. All of this uncertainty led to flight-to-safety behavior which drove U.S. Treasuries to gain 5.4% (as measured by the Barclays U.S. Treasury Index) and global sovereign debt to gain an unfathomable 11.6% (as measured by the Barclays Global Treasury Index). Likewise, the price of spot gold experienced its most notable surge since the post-crisis period, with the price per troy ounce gaining nearly 25% in the first half as investors seemed to prefer safer assets. Yet, despite all of the activity which typically correlates with a bearish market, domestic equities shrugged off the intra-period uncertainty and finished the second half surging to near all-time highs—just days after rebounding from a temporary decline after the U.K. voted to do the unthinkable and leave the European Union on June 24th.
The U.S. stock market, as measured by the S&P 500 Index, returned 3.8% in the first half of 2016. Along the capitalization spectrum, mid-cap outperformed small-cap and large-cap stocks. The S&P 400 Mid Cap Index returned 7.9%, while the S&P 600 Small Cap Index returned 6.2%. Value stocks noticeably outperformed growth stocks, as measured by the Russell 3000 Value and Growth Indices (6.3% versus 1.4%). This represents a dramatic turnaround from last year, when growth stocks massively outperformed value. Foreign developed equities, as represented by the MSCI EAFE Index, fell 4.4% on the heels of a poor performance by Japanese equity markets and a broad European post-Brexit selloff. Interestingly, the U.K. market itself was unfazed by its own vote, with the FTSE 100 at a 7-month high just days after a brief post-vote tumble. Emerging market equities, as represented by the MSCI Emerging Markets Index, gained 6.4%—a welcome change after turning in very poor results last year when commodities suffered.
Fixed income markets experienced returns in the first half that defied all expectations of bond bears. As mentioned earlier, Global Treasuries generated returns of 11.6% due to yield curve movements alone. In the U.S., the 10-year Treasury rate fell an astounding 75 basis points in the first half, dropping from 2.24% to 1.49%. In the Eurozone, average European sovereign debt rates fell over 80 basis points, dropping from 70 basis points to negative 10 basis points. While rates were the big driver of fixed income returns, diversified core fixed income also did very well. The domestic Barclays U.S. Aggregate Bond Index returned 5.3% in the first half of 2016. Meanwhile, the Barclays Global Aggregate Bond Index returned 9.0%. In domestic core fixed income, top-performing subsectors included 20+ year Treasuries, which gained 15.8%, while long maturity Foreign Agency issues returned 17.2%. Long Corporates were also additive, delivering a return of 13.9% in the first half of the year.
PORTFOLIO REVIEW / PERIOD-END POSITIONING
The MetLife Asset Allocation 80 Portfolio invested in underlying portfolios of the Met Investors Series Trust and the Metropolitan Series Fund to maintain a broad asset allocation of approximately 80% to equities and 20% to fixed income.
Over the six month period, the Portfolio underperformed the Dow Jones Moderately Aggressive Index. A large cap orientation vis-à-vis the Dow Jones Index within domestic equity held back relative results as did a slight overweight to developed markets and an underweight to emerging market equities, while an overweight to high yield bonds helped to offset these losses. During the period, security selection in the underlying portfolios detracted from relative results.
The domestic equity portfolios in aggregate detracted modestly from performance. While most growth-oriented portfolios detracted from performance, portfolios managed with a value style in general contributed positively, as value style significantly outpaced growth over the six month period. Within the growth portfolios, the Jennison Growth Portfolio, T. Rowe Price Large Cap Growth Portfolio and BlackRock Capital Appreciation Portfolio were among the top detractors. The Jennison Growth Portfolio underperformed its benchmark, as a result of both stock selection and sector allocation. Most notably, stock selection in Health Care, Information Technology and Consumer Discretionary sectors proved to be detrimental. Within the Health Care sector, holdings in Alexion Pharmaceuticals, Allergan plc and Regeneron Pharmaceuticals were the leading detractors. Within
MSF-1
Metropolitan Series Fund
MetLife Asset Allocation 80 Portfolio
Managed by MetLife Advisers, LLC
Portfolio Manager Commentary*—(Continued)
the Information Technology sector, positioning in the software and services industry was a key driver of underperformance, in particular a holding in LinkedIn Corp. Detracting from results in the Consumer Discretionary sector was positioning in retailing, most notably Netflix Inc. Similarly, with the T. Rowe Price Large Cap Growth Portfolio, stock selection in the Health Care and Information Technology sectors held back relative results, along with an underweight to the Consumer Staples sector. The BlackRock Capital Appreciation Portfolio was also a meaningful detractor from relative performance and, like the other growth portfolios, was hurt by stock selection in Consumer Discretionary, Health Care and Information Technology sectors. Another notable detractor was the ClearBridge Aggressive Growth Portfolio, which underperformed its benchmark, primarily driven by an overweight and stock selection in the Health Care sector, in particular positioning in pharmaceuticals. On the other hand, a number of value-oriented portfolios contributed positively, with the MFS Value Portfolio being the top contributor. In addition from benefiting from its value style, the Portfolio outperformed its value benchmark. Contributing positively to results during the period were stock selection within the Industrials and Financials sectors, which was partly offset by an underweight to the Utilities sector and industry positioning within the Financials sector. Additionally, an overweight to the Consumer Staples sector aided results. The Met/Wellington Core Equity Opportunities Portfolio’s focus on dividend growing companies was rewarded by the market during the six month period. In particular, stock selection in the Industrials and Health Care sectors were the main drivers of performance, while selection in the Consumer Staples sector detracted. The T. Rowe Price Large Cap Value Portfolio also contributed positively to the Portfolio’s results, although it lagged its value benchmark due to a combination of both security selection and sector allocation. Worth noting, the Invesco Comstock Portfolio, a value-oriented portfolio, detracted from results and struggled relative to its value benchmark. Both sector allocation and stock selection hampered returns, in particular positioning within Financials, the worst performing sector. Within the mid and small cap portfolios, notable contributors to results included the MetLife Small Cap Value Portfolio and the Met/Artisan Mid Cap Value Portfolio. More specifically, within the Met/Artisan Mid Cap Value Portfolio, stock selection was the primary driver of returns, in particular within the Energy and Financials sector. With respect to the MetLife Small Cap Value Portfolio, aiding results was an overweight position in the Materials sector along with strong stock selection in the Consumer Discretionary sector. Conversely, the Loomis Sayles Small Cap Growth Portfolio detracted from Portfolio results, as its growth orientation served as a headwind.
Among the equity portfolios that invest outside the U.S, the Van Eck Global Natural Resources Portfolio was the leading contributor, as commodities, in particular energy, posted strong results over the period. The Van Eck Global Natural Resources Portfolio considerably outpaced its benchmark, with the primary drivers being overweight allocations to gold and diversified metals and mining and an underweight allocation to oil and gas refining and marketing. Another notable contributor to results was the Met/Aberdeen Emerging Markets Equity Portfolio, as emerging markets generated exceptional performance when compared to the developed markets. The Met/Aberdeen Emerging Markets Portfolio outperformed its emerging markets index, with the key contributors including positioning in Brazil and China, while exposures in Hong Kong offset some of these gains. Global Real Estate continued to deliver strong results during the six month period, as yields declined, boosting dividend yielding sectors. The Clarion Global Real Estate Portfolio also contributed positively to relative results, although it trailed its respective benchmark. The primary detractors were stock selection in the U.S. and positioning in the Canadian and U.K. markets, which was partly offset by positive stock selection in Europe. Conversely, the Harris Oakmark International Portfolio was the leading detractor. A combination of sector allocation and stock selection detracted from results, in particular an overweight to the Financials sector. Individual detractors included Credit Suisse Group (Switzerland), Nomura Holdings (Japan) and Lloyds Banking Group (United Kingdom). Additionally, a meaningful overweight and stock selection in the Consumer Discretionary sector hampered results. Notable detractors included Daimler AG (Germany), Honda Motor and Toyota Motor (Japan). Additionally, the Oppenheimer Global Equity Portfolio hampered results, due in particular to stock selection in Health Care, Information Technology and the Financials sectors. From a country perspective, leading detractors included Germany and the United States.
The fixed income underlying portfolios in aggregate made a negative contribution to performance. The Met/Templeton International Bond Portfolio, which employs a benchmark-unconstrained approach resulting in large active positions compared to its benchmark index, was the most significant detractor. During the period, a sizable underweight to the euro and the Japanese yen and an overweight to the dollar were unfavorable, given the dollar weakness as these currencies strengthened. During the six month period, U.S. Treasury interest rates across the yield curve generally fell and the yield curve flattened, with longer term maturities falling more than shorter term maturities. The Met/Templeton International Bond Portfolio, which
MSF-2
Metropolitan Series Fund
MetLife Asset Allocation 80 Portfolio
Managed by MetLife Advisers, LLC
Portfolio Manager Commentary*—(Continued)
has continued to position for a rising rate environment by maintaining a low portfolio duration, was negatively impacted in this environment. Another notable detractor from fixed income results was the PIMCO Total Return Portfolio, which held an underweight to both U.S. duration and the front end of the U.K. yield curve, which hurt performance as rates fell. On the other hand, exposure to Treasury Inflation Protected securities (“TIPS”) via the PIMCO Inflation Protected Bond Portfolio was additive during the period, as TIPS outpaced nominal Treasury securities.
Investment Committee
MetLife Advisers, LLC
* This commentary may include statements that constitute “forward-looking statements” under the U.S. securities laws. Forward-looking statements include, among other things, projections, estimates, and information about possible or future results related to the Portfolio, market or regulatory developments. The views expressed above are not guarantees of future performance or economic results and involve certain risks, uncertainties and assumptions that could cause actual outcomes and results to differ materially from the views expressed herein. The views expressed above are subject to change at any time based upon economic, market, or other conditions and the advisory firm undertakes no obligation to update the views expressed herein. Any discussions of specific securities should not be considered a recommendation to buy or sell those securities. The views expressed above (including any forward-looking statement) may not be relied upon as investment advice or as an indication of the Portfolio’s trading intent. Information about the Portfolio’s holdings, asset allocation or country diversification is historical and is not an indication of future Portfolio composition, which may vary. Direct investment in any index is not possible. The performance of any index mentioned in this commentary has not been adjusted for ongoing management, distribution and operating expenses, and sales charges applicable to mutual fund investments. In addition, the returns do not reflect additional fees charged by separate accounts or variable insurance contracts that an investor in the Portfolio may pay. If these additional fees were reflected, performance would have been lower.
MSF-3
Metropolitan Series Fund
MetLife Asset Allocation 80 Portfolio
A $10,000 INVESTMENT COMPARED TO THE DOW JONES MODERATELY AGGRESSIVE INDEX
SIX MONTH RETURN & AVERAGE ANNUAL RETURNS (%) AS OF JUNE 30, 2016
| | | | | | | | | | | | | | | | |
| | | 6 Month | | | 1 Year | | | 5 Year | | | 10 Year | |
| MetLife Asset Allocation 80 Portfolio | | | | | | | | | | | | | | | | |
Class A | | | 1.86 | | | | -2.80 | | | | 6.96 | | | | 5.05 | |
Class B | | | 1.72 | | | | -3.08 | | | | 6.71 | | | | 4.80 | |
| Dow Jones Moderately Aggressive Index | | | 3.54 | | | | -1.10 | | | | 6.56 | | | | 5.83 | |
1 The Dow Jones Moderately Aggressive Index is a total return index designed to provide asset allocation strategists with a target risk benchmark. Each month, the Index adjusts its weighting of stocks, bonds, and cash indices (both domestic and foreign) such that the risk combination will have 80% of the risk of an all equity portfolio.
Portfolio performance is calculated including reinvestment of all income and capital gain distributions. Performance numbers are net of all Portfolio expenses but do not include any insurance, sales, separate account or administrative charges of variable annuity or life insurance contracts or any additional expenses that participants may bear relating to the operations of their plans. If these charges were included, the returns would be lower. The performance of any index referenced above has not been adjusted for ongoing management, distribution and operating expenses, and sales charges applicable to mutual fund investments. Direct investment in any index is not possible. The performance of Class A shares, as set forth in the line graph above, will differ from that of other classes because of the difference in expenses paid by policyholders investing in the different share classes.
This information represents past performance and is not indicative of future results. Investment return and principal value may fluctuate so that shares, upon redemption, may be worth more or less than the original cost.
PORTFOLIO COMPOSITION AS OF JUNE 30, 2016
Top Holdings
| | | | |
| | | % of
Net Assets | |
| MFS Value Portfolio (Class A) | | | 5.1 | |
| Met/Wellington Core Equity Opportunities Portfolio (formerly, WMC Core Equity Opportunities Portfolio) (Class A) | | | 5.0 | |
| Jennison Growth Portfolio (Class A) | | | 5.0 | |
| ClearBridge Aggressive Growth Portfolio (Class A) | | | 4.7 | |
| T. Rowe Price Large Cap Value Portfolio (Class A) | | | 4.6 | |
| Invesco Comstock Portfolio (Class A) | | | 4.6 | |
| T. Rowe Price Large Cap Growth Portfolio (Class A) | | | 4.5 | |
| Harris Oakmark International Portfolio (Class A) | | | 3.8 | |
| BlackRock Large Cap Value Portfolio (Class A) | | | 3.6 | |
| BlackRock Capital Appreciation Portfolio (Class A) | | | 3.5 | |
MSF-4
Metropolitan Series Fund
MetLife Asset Allocation 80 Portfolio
Understanding Your Portfolio’s Expenses (Unaudited)
Shareholder Expense Example
As a shareholder of the Portfolio, you incur ongoing costs, including management fees; distribution and service (12b-1) fees; and other Portfolio expenses. This example is intended to help you understand your ongoing costs (in dollars) (referred to as “expenses”) of investing in the Portfolio and compare these costs with the ongoing costs of investing in other mutual funds. The example is based on an investment of $1,000 invested at the beginning of the period and held for the entire period, January 1, 2016 through June 30, 2016.
Actual Expenses
The first line for each share class of the Portfolio in the table below provides information about actual account values and actual expenses. You may use the information in this line, together with the amount you invested in the particular share class of the Portfolio, to estimate the expenses that you paid over the period. Simply divide your account value by $1,000 (for example, an $8,600 account value divided by $1,000 = 8.6), then multiply the result by the number in the first line under the heading entitled “Expenses Paid During Period” to estimate the expenses you paid on your account during this period.
Hypothetical Example for Comparison Purposes
The second line for each share class of the Portfolio in the table below provides information about hypothetical account values and hypothetical expenses based on the Portfolio’s actual expense ratio and an assumed rate of return of 5% per year before expenses, which is not the Portfolio’s actual return. The hypothetical account values and expenses may not be used to estimate the actual ending account balance or expenses you paid for the period. You may use this information to compare the ongoing costs of investing in the Portfolio and other funds. To do so, compare this 5% hypothetical example with the 5% hypothetical examples that appear in the shareholder reports of the other funds.
Please note that the expenses shown in the table are meant to highlight your ongoing costs only and do not reflect any fees or charges of your variable insurance product or any additional expenses that participants in certain eligible qualified plans may bear relating to the operations of their plan. Therefore, the second line for each share class in the table is useful in comparing ongoing costs only, and will not help you determine the relative total costs of owning different funds. In addition, if these other costs were included, your costs would have been higher.
| | | | | | | | | | | | | | | | | | |
MetLife Asset Allocation 80 Portfolio | | | | Annualized
Expense
Ratio | | | Beginning
Account Value
January 1,
2016 | | | Ending
Account Value
June 30,
2016 | | | Expenses Paid
During Period**
January 1, 2016
to
June 30,
2016 | |
Class A(a) | | Actual | | | 0.72 | % | | $ | 1,000.00 | | | $ | 1,018.60 | | | $ | 3.61 | |
| | Hypothetical* | | | 0.72 | % | | $ | 1,000.00 | | | $ | 1,021.28 | | | $ | 3.62 | |
| | | | | |
Class B(a) | | Actual | | | 0.97 | % | | $ | 1,000.00 | | | $ | 1,017.20 | | | $ | 4.86 | |
| | Hypothetical* | | | 0.97 | % | | $ | 1,000.00 | | | $ | 1,020.04 | | | $ | 4.87 | |
* Hypothetical assumes a rate of return of 5% per year before expenses.
** Expenses paid are equal to the Portfolio’s annualized expense ratio for the most recent six month period, as shown above, multiplied by the average account value over the period, multiplied by the number of days (182 days) in the most recent fiscal half-year, divided by 366 (to reflect the one-half year period).
(a) The annualized expense ratio reflects the expenses of both the Portfolio and the Underlying Portfolios in which it invests.
MSF-5
Metropolitan Series Fund
MetLife Asset Allocation 80 Portfolio
Schedule of Investments as of June 30, 2016 (Unaudited)
Mutual Funds—100.0% of Net Assets
| | | | | | | | |
| Security Description | | Shares | | | Value | |
|
Affiliated Investment Companies—100.0% | |
Baillie Gifford International Stock Portfolio (Class A) (a) | | | 39,426,636 | | | $ | 377,312,902 | |
BlackRock Bond Income Portfolio (Class A) (a) | | | 2,995,626 | | | | 324,006,871 | |
BlackRock Capital Appreciation Portfolio (Class A) (a) | | | 11,918,867 | | | | 379,258,348 | |
BlackRock High Yield Portfolio (Class A) (b) | | | 7,597,299 | | | | 54,396,657 | |
BlackRock Large Cap Value Portfolio (Class A) (a) | | | 47,559,315 | | | | 381,425,705 | |
Clarion Global Real Estate Portfolio (Class A) (b) | | | 22,422,702 | | | | 276,023,467 | |
ClearBridge Aggressive Growth Portfolio (Class A) (b) | | | 34,573,498 | | | | 503,044,403 | |
Frontier Mid Cap Growth Portfolio (Class A) (a) | | | 1,805,705 | | | | 54,478,128 | |
Goldman Sachs Mid Cap Value Portfolio (Class A) (b) | | | 10,341,350 | | | | 109,411,486 | |
Harris Oakmark International Portfolio (Class A) (b) | | | 37,376,279 | | | | 410,391,546 | |
Invesco Comstock Portfolio (Class A) (b) | | | 39,201,676 | | | | 489,628,938 | |
Invesco Small Cap Growth Portfolio (Class A) (b) | | | 21,782,937 | | | | 272,504,536 | |
Jennison Growth Portfolio (Class A) (a) | | | 43,070,001 | | | | 531,483,816 | |
JPMorgan Core Bond Portfolio (Class A) (b) | | | 20,545,026 | | | | 215,517,319 | |
JPMorgan Small Cap Value Portfolio (Class A) (b) | | | 11,098,279 | | | | 163,699,620 | |
Loomis Sayles Small Cap Growth Portfolio (Class A) (a) | | | 12,007,493 | | | | 137,125,569 | |
Met/Aberdeen Emerging Markets Equity Portfolio (Class A) (b) | | | 30,776,703 | | | | 278,221,392 | |
Met/Artisan International Portfolio (Class A) (b) | | | 36,840,389 | | | | 334,879,136 | |
Met/Artisan Mid Cap Value Portfolio (Class A) (a) | | | 263,098 | | | | 54,358,646 | |
Met/Dimensional International Small Company Portfolio (Class A) (a) | | | 17,902,752 | | | | 210,536,369 | |
Met/Eaton Vance Floating Rate Portfolio (Class A) (b) | | | 10,901,388 | | | | 107,596,704 | |
Met/Templeton International Bond Portfolio (Class A) (b) | | | 32,965,254 | | | | 316,466,439 | |
Met/Wellington Core Equity Opportunities Portfolio (formerly, WMC Core Equity Opportunities Portfolio) (Class A) (a) | | | 19,113,874 | | | | 537,864,418 | |
Met/Wellington Large Cap Research Portfolio (formerly, WMC Large Cap Research Portfolio) (Class A) (b) | | | 28,977,248 | | | | 373,516,728 | |
MetLife Small Cap Value Portfolio (Class A) (b) | | | 12,396,240 | | | | 163,258,481 | |
MFS Research International Portfolio (Class A) (b) | | | 32,258,811 | | | | 319,362,228 | |
MFS Value Portfolio (Class A) (a) | | | 38,278,852 | | | | 548,918,731 | |
Morgan Stanley Mid Cap Growth Portfolio (Class A) (b) (c) | | | 3,667,714 | | | | 53,842,047 | |
Neuberger Berman Genesis Portfolio (Class A) (a) | | | 2,875,859 | | | | 54,871,387 | |
Oppenheimer Global Equity Portfolio (Class A) (b) | | | 8,710,116 | | | | 153,907,758 | |
|
Affiliated Investment Companies—(Continued) | |
PIMCO Inflation Protected Bond Portfolio (Class A) (b) (c) | | | 16,497,300 | | | | 162,663,376 | |
PIMCO Total Return Portfolio (Class A) (b) | | | 28,253,547 | | | | 323,503,108 | |
T. Rowe Price Large Cap Growth Portfolio (Class A) (a) | | | 25,803,801 | | | | 482,015,001 | |
T. Rowe Price Large Cap Value Portfolio (Class A) (b) | | | 16,083,875 | | | | 493,131,621 | |
T. Rowe Price Mid Cap Growth Portfolio (Class A) (b) | | | 10,996,135 | | | | 108,861,738 | |
T. Rowe Price Small Cap Growth Portfolio (Class A) (a) | | | 8,455,248 | | | | 164,623,687 | |
TCW Core Fixed Income Portfolio (Class A) (b) | | | 25,942,174 | | | | 267,723,239 | |
Van Eck Global Natural Resources Portfolio (Class A) (a) | | | 34,032,793 | | | | 331,479,401 | |
Western Asset Management Strategic Bond Opportunities Portfolio (Class A) (a) | | | 16,785,423 | | | | 218,546,214 | |
| | | | | | | | |
Total Mutual Funds (Cost $10,954,912,814) | | | | | | | 10,739,857,160 | |
| | | | | | | | |
Total Investments—100.0%
(Cost $10,954,912,814) (d) | | | | | | | 10,739,857,160 | |
Other assets and liabilities (net)—0.0% | | | | | | | (2,799,437 | ) |
| | | | | | | | |
| Net Assets—100.0% | | | | | | $ | 10,737,057,723 | |
| | | | | | | | |
| (a) | A Portfolio of Metropolitan Series Fund. (See Note 6 of the Notes to Financial Statements for a summary of transactions in the securities of affiliated Underlying Portfolios.) |
| (b) | A Portfolio of Met Investors Series Trust. (See Note 6 of the Notes to Financial Statements for a summary of transactions in the securities of affiliated Underlying Portfolios.) |
| (c) | Non-income producing security. |
| (d) | As of June 30, 2016, the aggregate cost of investments was $10,954,912,814. The aggregate unrealized appreciation and depreciation of investments were $475,435,971 and $(690,491,625), respectively, resulting in net unrealized depreciation of $(215,055,654). |
See accompanying notes to financial statements.
MSF-6
Metropolitan Series Fund
MetLife Asset Allocation 80 Portfolio
Schedule of Investments as of June 30, 2016 (Unaudited)
Fair Value Hierarchy
Accounting principles generally accepted in the United States of America (“GAAP”) define fair market value as the price that the Portfolio would receive to sell an asset or pay to transfer a liability in an orderly transaction between market participants at the measurement date. It establishes a fair value hierarchy that prioritizes inputs to valuation methods and requires disclosure of the fair value hierarchy, separately for each major category of assets and liabilities, that segregates fair value measurements into three levels. Levels 1, 2 and 3 of the fair value hierarchy are defined as follows:
Level 1 - unadjusted quoted prices in active markets for identical investments
Level 2 - other significant observable inputs (including, but not limited to, quoted prices for similar assets or liabilities in markets that are either active or inactive; inputs other than quoted prices that are observable such as interest rates, yield curves, volatilities, prepayment speeds, loss severities, credit risks, default rates, or other market corroborated inputs)
Level 3 - significant unobservable inputs based on the best information available in the circumstances, to the extent observable inputs are unavailable (including the Portfolio’s own assumptions used in determining the fair value of investments and derivative financial instruments)
The inputs or methodologies used for valuing investments are not necessarily an indication of the risk associated with investing in them. Changes to the inputs or methodologies used may result in transfers between levels, which will be recognized as of the beginning of the reporting period. Information on transfers between Level 1 and Level 2, if any, will be disclosed following the fair value hierarchy table below. A reconciliation of Level 3 securities, if any, will also be disclosed following the fair value hierarchy table. For more information about the Portfolio’s policy regarding the valuation of investments, please refer to the Notes to Financial Statements.
The following table summarizes the fair value hierarchy of the Portfolio’s investments as of June 30, 2016:
| | | | | | | | | | | | | | | | |
| Description | | Level 1 | | | Level 2 | | | Level 3 | | | Total | |
Mutual Funds | | | | | | | | | | | | | | | | |
Affiliated Investment Companies | | $ | 10,739,857,160 | | | $ | — | | | $ | — | | | $ | 10,739,857,160 | |
Total Investments | | $ | 10,739,857,160 | | | $ | — | | | $ | — | | | $ | 10,739,857,160 | |
| | | | | | | | | | | | | | | | | |
MSF-7
See accompanying notes to financial statements.
Metropolitan Series Fund
MetLife Asset Allocation 80 Portfolio
Statement of Assets and Liabilities
June 30, 2016 (Unaudited)
| | | | |
Assets | | | | |
Affiliated investments at value (a) | | $ | 10,739,857,160 | |
Receivable for: | | | | |
Investments sold | | | 3,428,036 | |
Fund shares sold | | | 273,841 | |
| | | | |
Total Assets | | | 10,743,559,037 | |
Liabilities | | | | |
Payables for: | | | | |
Fund shares redeemed | | | 3,701,876 | |
Accrued Expenses: | | | | |
Management fees | | | 469,992 | |
Distribution and service fees | | | 2,117,220 | |
Deferred trustees’ fees | | | 158,070 | |
Other expenses | | | 54,156 | |
| | | | |
Total Liabilities | | | 6,501,314 | |
| | | | |
Net Assets | | $ | 10,737,057,723 | |
| | | | |
Net Assets Consist of: | | | | |
Paid in surplus | | $ | 10,369,862,139 | |
Undistributed net investment income | | | 158,658,245 | |
Accumulated net realized gain | | | 423,592,993 | |
Unrealized depreciation on affiliated investments | | | (215,055,654 | ) |
| | | | |
Net Assets | | $ | 10,737,057,723 | |
| | | | |
Net Assets | | | | |
Class A | | $ | 386,849,910 | |
Class B | | | 10,350,207,813 | |
Capital Shares Outstanding* | | | | |
Class A | | | 32,028,900 | |
Class B | | | 859,903,463 | |
Net Asset Value, Offering Price and Redemption Price Per Share | | | | |
Class A | | $ | 12.08 | |
Class B | | | 12.04 | |
| * | The Portfolio is authorized to issue an unlimited number of shares. |
| (a) | Identified cost of affiliated investments was $10,954,912,814. |
Statement of Operations
Six Months Ended June 30, 2016 (Unaudited)
| | | | |
Investment Income | | | | |
Dividends from Affiliated Underlying Portfolios | | $ | 174,695,729 | |
Interest | | | 865 | |
| | | | |
Total investment income | | | 174,696,594 | |
Expenses | | | | |
Management fees | | | 2,827,467 | |
Administration fees | | | 11,064 | |
Custodian and accounting fees | | | 12,631 | |
Distribution and service fees—Class B | | | 12,735,646 | |
Audit and tax services | | | 14,936 | |
Legal | | | 13,574 | |
Trustees’ fees and expenses | | | 15,990 | |
Miscellaneous | | | 10,969 | |
| | | | |
Total expenses | | | 15,642,277 | |
| | | | |
Net Investment Income | | | 159,054,317 | |
| | | | |
Net Realized and Unrealized Gain (Loss) | | | | |
| Net realized gain on: | | | | |
Affiliated investments | | | 40,292,768 | |
Capital gain distributions from Affiliated Underlying Portfolios | | | 575,648,394 | |
| | | | |
Net realized gain | | | 615,941,162 | |
| | | | |
Net change in unrealized depreciation on affiliated investments | | | (604,197,470 | ) |
| | | | |
Net realized and unrealized gain | | | 11,743,692 | |
| | | | |
Net Increase in Net Assets from Operations | | $ | 170,798,009 | |
| | | | |
See accompanying notes to financial statements.
MSF-8
Metropolitan Series Fund
MetLife Asset Allocation 80 Portfolio
Statements of Changes in Net Assets
| | | | | | | | |
| | | Six Months
Ended
June 30,
2016
(Unaudited) | | | Year Ended
December 31,
2015 | |
Increase (Decrease) in Net Assets: | | | | | | | | |
From Operations | | | | | | | | |
Net investment income | | $ | 159,054,317 | | | $ | 208,806,650 | |
Net realized gain | | | 615,941,162 | | | | 1,410,282,114 | |
Net change in unrealized depreciation | | | (604,197,470 | ) | | | (1,798,225,312 | ) |
| | | | | | | | |
Increase (decrease) in net assets from operations | | | 170,798,009 | | | | (179,136,548 | ) |
| | | | | | | | |
From Distributions to Shareholders | | | | | | | | |
Net investment income | | | | | | | | |
Class A | | | (12,442,422 | ) | | | (2,097,361 | ) |
Class B | | | (305,769,387 | ) | | | (38,532,004 | ) |
Net realized capital gains | | | | | | | | |
Class A | | | (45,949,646 | ) | | | (17,880,004 | ) |
Class B | | | (1,237,778,000 | ) | | | (525,576,538 | ) |
| | | | | | | | |
Total distributions | | | (1,601,939,455 | ) | | | (584,085,907 | ) |
| | | | | | | | |
Increase (decrease) in net assets from capital share transactions | | | 1,039,660,965 | | | | (537,645,681 | ) |
| | | | | | | | |
Total decrease in net assets | | | (391,480,481 | ) | | | (1,300,868,136 | ) |
| | |
Net Assets | | | | | | | | |
Beginning of period | | | 11,128,538,204 | | | | 12,429,406,340 | |
| | | | | | | | |
End of period | | $ | 10,737,057,723 | | | $ | 11,128,538,204 | |
| | | | | | | | |
Undistributed net investment income | | | | | | | | |
End of period | | $ | 158,658,245 | | | $ | 317,815,737 | |
| | | | | | | | |
Other Information:
Capital Shares
Transactions in capital shares were as follows:
| | | | | | | | | | | | | | | | |
| | | Six Months Ended
June 30, 2016
(Unaudited) | | | Year Ended
December 31, 2015 | |
| | | Shares | | | Value | | | Shares | | | Value | |
Class A | | | | | | | | | | | | | | | | |
Sales | | | 837,959 | | | $ | 11,295,083 | | | | 2,069,476 | | | $ | 30,549,734 | |
Reinvestments | | | 4,878,201 | | | | 58,392,068 | | | | 1,344,372 | | | | 19,977,365 | |
Redemptions | | | (1,329,321 | ) | | | (18,006,814 | ) | | | (2,276,097 | ) | | | (33,686,689 | ) |
| | | | | | | | | | | | | | | | |
Net increase | | | 4,386,839 | | | $ | 51,680,337 | | | | 1,137,751 | | | $ | 16,840,410 | |
| | | | | | | | | | | | | | | | |
Class B | | | | | | | | | | | | | | | | |
Sales | | | 4,540,204 | | | $ | 61,010,422 | | | | 13,028,991 | | | $ | 189,959,011 | |
Reinvestments | | | 129,383,688 | | | | 1,543,547,387 | | | | 38,089,706 | | | | 564,108,542 | |
Redemptions | | | (45,935,654 | ) | | | (616,577,181 | ) | | | (88,844,098 | ) | | | (1,308,553,644 | ) |
| | | | | | | | | | | | | | | | |
Net increase (decrease) | | | 87,988,238 | | | $ | 987,980,628 | | | | (37,725,401 | ) | | $ | (554,486,091 | ) |
| | | | | | | | | | | | | | | | |
Increase (decrease) derived from capital shares transactions | | | | | | $ | 1,039,660,965 | | | | | | | $ | (537,645,681 | ) |
| | | | | | | | | | | | | | | | |
See accompanying notes to financial statements.
MSF-9
Metropolitan Series Fund
MetLife Asset Allocation 80 Portfolio
Financial Highlights
| | | | | | | | | | | | | | | | | | | | | | | | |
| Selected per share data | | | | | | | | | | | | | | | | | | |
| | | Class A | |
| | | Six Months
Ended
June 30,
2016
(Unaudited) | | | Year Ended December 31, | |
| | | | 2015 | | | 2014 | | | 2013 | | | 2012 | | | 2011 | |
Net Asset Value, Beginning of Period | | $ | 13.98 | | | $ | 14.92 | | | $ | 14.41 | | | $ | 11.78 | | | $ | 10.39 | | | $ | 10.94 | |
| | | | | | | | | | | | | | | | | | | | | | | | |
Income (Loss) from Investment Operations | | | | | | | | | | | | | | | | | | | | | | | | |
Net investment income (a) | | | 0.22 | | | | 0.29 | | | | 0.18 | | | | 0.21 | | | | 0.18 | | | | 0.18 | |
Net realized and unrealized gain (loss) on investments | | | 0.02 | | | | (0.47 | ) | | | 0.60 | | | | 2.64 | | | | 1.45 | | | | (0.55 | ) |
| | | | | | | | | | | | | | | | | | | | | | | | |
Total from investment operations | | | 0.24 | | | | (0.18 | ) | | | 0.78 | | | | 2.85 | | | | 1.63 | | | | (0.37 | ) |
| | | | | | | | | | | | | | | | | | | | | | | | |
Less Distributions | | | | | | | | | | | | | | | | | | | | | | | | |
Distributions from net investment income | | | (0.46 | ) | | | (0.08 | ) | | | (0.27 | ) | | | (0.22 | ) | | | (0.24 | ) | | | (0.18 | ) |
Distributions from net realized capital gains | | | (1.68 | ) | | | (0.68 | ) | | | 0.00 | | | | 0.00 | | | | 0.00 | | | | 0.00 | |
| | | | | | | | | | | | | | | | | | | | | | | | |
Total distributions | | | (2.14 | ) | | | (0.76 | ) | | | (0.27 | ) | | | (0.22 | ) | | | (0.24 | ) | | | (0.18 | ) |
| | | | | | | | | | | | | | | | | | | | | | | | |
Net Asset Value, End of Period | | $ | 12.08 | | | $ | 13.98 | | | $ | 14.92 | | | $ | 14.41 | | | $ | 11.78 | | | $ | 10.39 | |
| | | | | | | | | | | | | | | | | | | | | | | | |
Total Return (%) (b) | | | 1.86 | (c) | | | (1.50 | ) | | | 5.53 | | | | 24.51 | | | | 15.82 | | | | (3.55 | ) |
| | | | | | |
Ratios/Supplemental Data | | | | | | | | | | | | | | | | | | | | | | | | |
Ratio of expenses to average net assets (%) (d) | | | 0.06 | (e) | | | 0.05 | | | | 0.06 | | | | 0.07 | | | | 0.07 | | | | 0.07 | |
Ratio of net investment income to average net assets (%) (f) | | | 1.59 | (e)(g) | | | 1.96 | | | | 1.26 | | | | 1.65 | | | | 1.60 | | | | 1.66 | |
Portfolio turnover rate (%) | | | 9 | (c) | | | 13 | | | | 22 | | | | 13 | | | | 13 | | | | 46 | |
Net assets, end of period (in millions) | | $ | 386.8 | | | $ | 386.4 | | | $ | 395.4 | | | $ | 365.2 | | | $ | 290.4 | | | $ | 246.1 | |
| |
| | | Class B | |
| | | Six Months
Ended
June 30,
2016
(Unaudited) | | | Year Ended December 31, | |
| | | | 2015
| | | 2014
| | | 2013
| | | 2012
| | | 2011
| |
Net Asset Value, Beginning of Period | | $ | 13.92 | | | $ | 14.86 | | | $ | 14.36 | | | $ | 11.73 | | | $ | 10.36 | | | $ | 10.91 | |
| | | | | | | | | | | | | | | | | | | | | | | | |
Income (Loss) from Investment Operations | | | | | | | | | | | | | | | | | | | | | | | | |
Net investment income (a) | | | 0.20 | | | | 0.25 | | | | 0.02 | | | | 0.19 | | | | 0.15 | | | | 0.16 | |
Net realized and unrealized gain (loss) on investments | | | 0.02 | | | | (0.46 | ) | | | 0.72 | | | | 2.63 | | | | 1.43 | | | | (0.56 | ) |
| | | | | | | | | | | | | | | | | | | | | | | | |
Total from investment operations | | | 0.22 | | | | (0.21 | ) | | | 0.74 | | | | 2.82 | | | | 1.58 | | | | (0.40 | ) |
| | | | | | | | | | | | | | | | | | | | | | | | |
Less Distributions | | | | | | | | | | | | | | | | | | | | | | | | |
Distributions from net investment income | | | (0.42 | ) | | | (0.05 | ) | | | (0.24 | ) | | | (0.19 | ) | | | (0.21 | ) | | | (0.15 | ) |
Distributions from net realized capital gains | | | (1.68 | ) | | | (0.68 | ) | | | 0.00 | | | | 0.00 | | | | 0.00 | | | | 0.00 | |
| | | | | | | | | | | | | | | | | | | | | | | | |
Total distributions | | | (2.10 | ) | | | (0.73 | ) | | | (0.24 | ) | | | (0.19 | ) | | | (0.21 | ) | | | (0.15 | ) |
| | | | | | | | | | | | | | | | | | | | | | | | |
Net Asset Value, End of Period | | $ | 12.04 | | | $ | 13.92 | | | $ | 14.86 | | | $ | 14.36 | | | $ | 11.73 | | | $ | 10.36 | |
| | | | | | | | | | | | | | | | | | | | | | | | |
Total Return (%) (b) | | | 1.72 | (c) | | | (1.70 | ) | | | 5.23 | | | | 24.31 | | | | 15.39 | | | | (3.77 | ) |
| | | | | | |
Ratios/Supplemental Data | | | | | | | | | | | | | | | | | | | | | | | | |
Ratio of expenses to average net assets (%) (d) | | | 0.31 | (e) | | | 0.30 | | | | 0.31 | | | | 0.32 | | | | 0.32 | | | | 0.32 | |
Ratio of net investment income to average net assets (%) (f) | | | 1.33 | (e)(g) | | | 1.73 | | | | 0.14 | | | | 1.43 | | | | 1.38 | | | | 1.44 | |
Portfolio turnover rate (%) | | | 9 | (c) | | | 13 | | | | 22 | | | | 13 | | | | 13 | | | | 46 | |
Net assets, end of period (in millions) | | $ | 10,350.2 | | | $ | 10,742.1 | | | $ | 12,034.0 | | | $ | 3,042.8 | | | $ | 2,608.8 | | | $ | 2,432.1 | |
| (a) | Per share amounts based on average shares outstanding during the period. |
| (b) | Total return does not reflect any insurance, sales, separate account or administrative charges of variable annuity or life insurance contracts or any additional expenses that contract owners may bear under their variable contracts. If these charges were included, the returns would be lower. |
| (c) | Periods less than one year are not computed on an annualized basis. |
| (d) | The ratio of operating expenses to average net assets does not include expenses of the Underlying Portfolios in which the Asset Allocation Portfolio invests. |
| (e) | Computed on an annualized basis. |
| (f) | Recognition of net investment income by the Asset Allocation Portfolio is affected by the timing of the declaration of dividends by the Underlying Portfolios in which it invests. |
| (g) | The income earned by the Asset Allocation Portfolio through the investments in Underlying Portfolios is not annualized. |
MSF-10
See accompanying notes to financial statements.
Metropolitan Series Fund
MetLife Asset Allocation 80 Portfolio
Notes to Financial Statements—June 30, 2016 (Unaudited)
1. Organization
Metropolitan Series Fund (the “Trust”) is organized as a Delaware statutory trust and registered under the Investment Company Act of 1940, as amended (the “1940 Act”), as an open-end management investment company. The Trust, which is managed by MetLife Advisers, LLC (“MetLife Advisers” or the “Adviser”), an affiliate of MetLife, Inc., is currently comprised of thirty series, each of which operates as a distinct investment vehicle of the Trust. The portfolio included in this report is MetLife Asset Allocation 80 Portfolio (the “Asset Allocation Portfolio”), which is diversified. The Asset Allocation Portfolio operates under a “fund of funds” structure, investing substantially all of its assets in other Portfolios advised by MetLife Advisers (each, an “Underlying Portfolio,” and, collectively, the “Underlying Portfolios”). Shares in the Asset Allocation Portfolio are not offered directly to the general public and are currently available only to separate accounts established by Metropolitan Life Insurance Company (“MetLife”) and other affiliated life insurance companies.
The Asset Allocation Portfolio has registered and offers two classes of shares: Class A and B shares. Shares of each Class of the Asset Allocation Portfolio represent an equal pro rata interest in the Asset Allocation Portfolio and generally give the shareholder the same voting, dividend, liquidation, and other rights. Investment income, realized and unrealized capital gains and losses, the common expenses of the Asset Allocation Portfolio, and certain Asset Allocation Portfolio-level expense reductions, if any, are allocated on a pro rata basis to each Class based on the relative net assets of each Class to the net assets of the Asset Allocation Portfolio. Each Class of shares differs in its respective distribution plan and such distribution expenses are allocated to the corresponding Class of shares.
2. Significant Accounting Policies
The preparation of financial statements in conformity with accounting principles generally accepted in the United States of America (“GAAP”) requires management to make estimates and assumptions that affect the reported amounts of assets and liabilities and disclosure of contingent assets and liabilities as of the date of the financial statements and the reported amounts of income and expenses during the reporting period. Actual results could differ from those estimates. In the preparation of these financial statements, management has evaluated events and transactions subsequent to June 30, 2016 through the date the financial statements were issued.
The Asset Allocation Portfolio is an investment company and follows the accounting and reporting guidance of the Financial Accounting Standards Board (“FASB”) Accounting Standards Codification Topic 946- Financial Services- Investment Companies. The following is a summary of significant accounting policies consistently followed by the Asset Allocation Portfolio in the preparation of its financial statements.
Investment Valuation and Fair Value Measurements - Investments in the Underlying Portfolios are valued at their closing daily net asset value on the valuation date. Investments in the Underlying Portfolios are categorized as Level 1 within the fair value hierarchy. For information about the use of fair value pricing by the Underlying Portfolios, please refer to the prospectuses of the Underlying Portfolios.
Investment Transactions and Related Investment Income - Asset Allocation Portfolio security transactions are recorded on the trade date. Dividend income is recorded on the ex-dividend date. Realized gains and losses on investments are determined on the identified cost basis, which is the same basis used for federal income tax purposes. Capital gains distributions received from the Underlying Portfolios are recorded as net realized gain in the Statement of Operations.
Dividends and Distributions to Shareholders - The Asset Allocation Portfolio records dividends and distributions on the ex-dividend date. Net realized gains from securities transactions (if any) are generally distributed annually to shareholders. The timing and characterization of certain income and capital gains distributions are determined in accordance with federal tax regulations that may differ from GAAP. Permanent book and tax basis differences relating to shareholder distributions will result in reclassification between under/over distributed net investment income, accumulated net realized gains/losses, and paid-in surplus. Book-tax differences are primarily due to distributions from Underlying Portfolios. These adjustments have no impact on net assets or the results of operations.
Income Taxes - It is the Asset Allocation Portfolio’s policy to comply with the requirements of the Internal Revenue Code of 1986, as amended, and regulations thereunder, applicable to regulated investment companies and to distribute, with respect to each taxable year, all of its taxable income to shareholders. Therefore, no federal income tax provision is required. The Asset Allocation Portfolio files U.S. federal tax returns. No income tax returns are currently under examination. The Asset Allocation Portfolio’s federal tax returns for the prior three fiscal years remain subject to examination by the Internal Revenue Service. As of June 30, 2016, the Asset Allocation Portfolio had no uncertain tax positions that would require financial statement recognition, or de-recognition or disclosure.
MSF-11
Metropolitan Series Fund
MetLife Asset Allocation 80 Portfolio
Notes to Financial Statements—June 30, 2016 (Unaudited)—(Continued)
3. Certain Risks
In the normal course of business, the Underlying Portfolios invest in securities and enter into transactions where risks exist due to fluctuations in the market (“market risk”) or failure of the other party to a transaction to perform (“credit and counterparty risk”).
Market Risk: The value of securities held by the Underlying Portfolios may decline in response to certain events, including those directly involving the companies whose securities are owned by the Underlying Portfolios; conditions affecting the general economy; overall market changes; local, regional or global political, social or economic instability; and currency, interest rate, and price fluctuations.
Credit and Counterparty Risk: The Underlying Portfolios may be exposed to counterparty risk, or the risk that an entity with which the Underlying Portfolios have unsettled or open transactions may default. The potential loss could exceed the value of the financial assets and liabilities recorded in the financial statements. Financial assets that potentially expose the Underlying Portfolios to credit and counterparty risk consist principally of cash due from counterparties and investments. The Underlying Portfolios manage counterparty risk by entering into agreements only with counterparties that they believe have the financial resources to honor their obligations and by monitoring the financial stability of those counterparties. The Underlying Portfolios’ investment adviser attempts to mitigate counterparty risk by (i) periodically assessing the creditworthiness of their trading partners, (ii) monitoring and/or limiting the amount of their net exposure to each individual counterparty based on the adviser’s assessment, and (iii) requiring collateral from the counterparty for certain transactions. In order to preserve certain safeguards for non-standard settlement trades, the Underlying Portfolios restrict their exposure to credit and counterparty losses by entering into master netting agreements (“Master Agreements”) with counterparties (approved brokers) with whom the Underlying Portfolios undertake a significant volume of transactions. Master Agreements govern the terms of certain transactions, and reduce the counterparty risk associated with relevant transactions by specifying credit protection mechanisms and providing standardization that improves legal certainty. Master Agreements can also help limit counterparty risk by specifying collateral posting arrangements at pre-arranged exposure levels.
The Asset Allocation Portfolio’s prospectus includes a discussion of the principal risks of investing in the Asset Allocation Portfolio and in the Underlying Portfolios in which it invests.
4. Investment Transactions
Aggregate cost of purchases and proceeds of sales of shares of the Underlying Portfolios by the Asset Allocation Portfolio for the six months ended June 30, 2016 were as follows:
| | | | | | | | | | | | |
Purchases | | | Sales | |
U.S. Government | | Non U.S. Government | | | U.S. Government | | | Non U.S. Government | |
| $0 | | $ | 1,096,713,348 | | | $ | 0 | | | $ | 924,500,023 | |
5. Investment Management Fees and Other Transactions with Affiliates
Investment Management Agreement - MetLife Advisers is the investment adviser to the Asset Allocation Portfolio. The Trust has entered into an investment management agreement with MetLife Advisers with respect to the Asset Allocation Portfolio. For providing investment management services to the Asset Allocation Portfolio, MetLife Advisers receives monthly compensation at the following annual rates:
| | | | | | |
Management
Fees earned by
MetLife Advisers
for the six months ended
June 30, 2016 | | % per annum | | | Average daily net assets |
| $2,827,467 | | | 0.100 | % | | Of the first $500 million |
| | | 0.075 | % | | Of the next $500 million |
| | | 0.050 | % | | On amounts in excess of $1 billion |
In addition to the above management fee paid to MetLife Advisers, the Asset Allocation Portfolio indirectly pays MetLife Advisers an investment advisory fee through its investments in the Underlying Portfolios.
Certain officers and trustees of the Trust may also be officers of MetLife Advisers; however, such officers and trustees receive no compensation from the Trust.
On January 12, 2016, MetLife, Inc. announced its plan to pursue the separation of a substantial portion of its retail segment and is currently evaluating structural alternatives for such separation. It is anticipated that MetLife Advisers would be included in any such separation. Any separation transaction that might occur will be subject to the satisfaction of various conditions and approvals, including approval of any transaction by the MetLife, Inc. Board of Directors, satisfaction of any applicable requirements of the SEC,
MSF-12
Metropolitan Series Fund
MetLife Asset Allocation 80 Portfolio
Notes to Financial Statements—June 30, 2016 (Unaudited)—(Continued)
and receipt of insurance and other regulatory approvals and other anticipated conditions. Because the form of a separation had yet to be determined, MetLife, Inc. cannot currently provide a specific potential completion date or information about the potential impact on MetLife Advisers. No assurance can be given regarding the form that a separation transaction may take or the specific terms thereof, or that a separation will in fact occur. Depending on the form a separation takes, MetLife Advisers’ continued service as investment adviser to the Trusts could be subject to the satisfaction of various conditions and approvals, which may include obtaining approvals from the Trusts’ Board and shareholders.
Transfer Agency Agreement - MetLife serves as the transfer agent for the Trust. MetLife receives no fees for its services to the Trust under the transfer agency agreement.
Distribution and Service Fees - The Trust has a distribution agreement with MetLife Investors Distribution Company (“MIDC” or the “Distributor”) in which MIDC serves as the distributor for the Asset Allocation Portfolio’s Class A and B Shares. MIDC is a wholly-owned subsidiary of MetLife Investors Group, LLC, an affiliate of the Adviser. The Trust has also adopted a Distribution and Service Plan under Rule 12b-1 of the 1940 Act for the Asset Allocation Portfolio’s Class B shares. Under the Distribution and Services Plan, the Class B shares of the Asset Allocation Portfolio pay a fee to compensate the Insurance Companies (or their affiliates) and other broker-dealers and financial intermediaries involved in the offer and sale of Asset Allocation Portfolio shares for promoting or selling and servicing the Class B shares of the Asset Allocation Portfolio. The fees under the Distribution and Services Plan for each class of the Asset Allocation Portfolio’s shares are calculated as a percentage of the Asset Allocation Portfolio’s average daily net assets that are attributable to that Class. Currently, the fee is 0.25% per year for Class B shares. Amount incurred by the Asset Allocation Portfolio for the six months ended June 30, 2016 is shown as Distribution and service fees in the Statement of Operations.
Deferred Trustee Compensation - Each Trustee who is not currently an active employee of MetLife or its affiliates receives compensation from the Trust for his or her service to the Trust. A deferred compensation plan (the “Plan”) is available to the Trustees on a voluntary basis. Deferred amounts remain in the Trust until distributed in accordance with the provisions of the Plan. The value of a participating Trustee’s deferral account is based on theoretical investments of deferred amounts on the normal payment dates in certain portfolios of the Trust or Met Investors Series Trust, an affiliate of the Trust, as designated by the participating Trustee. Changes in the value of participants’ deferral accounts are reflected as Trustees’ fees and expenses in the Statement of Operations. The portion of the accrued obligations allocated to the Asset Allocation Portfolio under the Plan is reflected as Deferred trustees’ fees in the Statement of Assets and Liabilities.
6. Transactions in Securities of Affiliated Underlying Portfolios
The Asset Allocation Portfolio does not invest in the Underlying Portfolios for the purpose of exercising control; however, investments by the Asset Allocation Portfolio within its principal investment strategies may represent a significant portion of the Underlying Portfolios’ net assets. Transactions in the Underlying Portfolios for the six months ended June 30, 2016 were as follows:
| | | | | | | | | | | | | | | | |
Underlying Portfolio | | Number of
shares held at
December 31, 2015 | | | Shares
purchased | | | Shares
sold | | | Number of
shares held at
June 30, 2016 | |
Baillie Gifford International Stock | | | 40,371,978 | | | | 670,219 | | | | (1,615,561 | ) | | | 39,426,636 | |
BlackRock Bond Income | | | 3,191,919 | | | | 147,068 | | | | (343,361 | ) | | | 2,995,626 | |
BlackRock Capital Appreciation | | | 10,853,918 | | | | 1,185,708 | | | | (120,759 | ) | | | 11,918,867 | |
BlackRock High Yield | | | 7,591,279 | | | | 522,035 | | | | (516,015 | ) | | | 7,597,299 | |
BlackRock Large Cap Value* | | | 46,292,832 | | | | 4,535,270 | | | | (3,268,787 | ) | | | 47,559,315 | |
Clarion Global Real Estate | | | 24,085,117 | | | | 526,073 | | | | (2,188,488 | ) | | | 22,422,702 | |
ClearBridge Aggressive Growth | | | 33,009,817 | | | | 1,749,560 | | | | (185,879 | ) | | | 34,573,498 | |
Frontier Mid Cap Growth | | | 1,660,188 | | | | 209,719 | | | | (64,202 | ) | | | 1,805,705 | |
Goldman Sachs Mid Cap Value | | | 14,832,588 | | | | 924,776 | | | | (5,416,014 | ) | | | 10,341,350 | |
Harris Oakmark International | | | 32,467,322 | | | | 5,042,942 | | | | (133,985 | ) | | | 37,376,279 | |
Invesco Comstock | | | 36,107,381 | | | | 4,244,940 | | | | (1,150,645 | ) | | | 39,201,676 | |
Invesco Mid Cap Value | | | 3,036,363 | | | | 83,487 | | | | (3,119,850 | ) | | | — | |
Invesco Small Cap Growth | | | 20,216,744 | | | | 3,913,415 | | | | (2,347,222 | ) | | | 21,782,937 | |
Jennison Growth | | | 37,025,242 | | | | 6,219,592 | | | | (174,833 | ) | | | 43,070,001 | |
JPMorgan Core Bond | | | 21,947,710 | | | | 1,004,648 | | | | (2,407,332 | ) | | | 20,545,026 | |
JPMorgan Small Cap Value* | | | 10,968,262 | | | | 969,297 | | | | (839,280 | ) | | | 11,098,279 | |
Loomis Sayles Small Cap Growth* | | | 12,690,835 | | | | 1,343,762 | | | | (2,027,104 | ) | | | 12,007,493 | |
Lord Abbett Bond Debenture | | | 14,380,088 | | | | 979,173 | | | | (15,359,261 | ) | | | — | |
Met/Aberdeen Emerging Markets Equity | | | 31,775,541 | | | | 1,683,723 | | | | (2,682,561 | ) | | | 30,776,703 | |
Met/Artisan International* | | | 34,440,380 | | | | 2,549,337 | | | | (149,328 | ) | | | 36,840,389 | |
Met/Artisan Mid Cap Value | | | 511,787 | | | | 31,885 | | | | (280,574 | ) | | | 263,098 | |
Met/Dimensional International Small Company* | | | 17,607,509 | | | | 1,538,312 | | | | (1,243,069 | ) | | | 17,902,752 | |
MSF-13
Metropolitan Series Fund
MetLife Asset Allocation 80 Portfolio
Notes to Financial Statements—June 30, 2016 (Unaudited)—(Continued)
| | | | | | | | | | | | | | | | |
Underlying Portfolio | | Number of
shares held at
December 31, 2015 | | | Shares
purchased | | | Shares
sold | | | Number of
shares held at
June 30, 2016 | |
Met/Eaton Vance Floating Rate | | | 11,327,411 | | | | 514,532 | | | | (940,555 | ) | | | 10,901,388 | |
Met/Templeton International Bond* | | | 34,036,040 | | | | 829,078 | | | | (1,899,864 | ) | | | 32,965,254 | |
Met/Wellington Core Equity Opportunities (formerly, WMC Core Equity Opportunities) | | | 17,974,943 | | | | 2,362,122 | | | | (1,223,191 | ) | | | 19,113,874 | |
Met/Wellington Large Cap Research (formerly, WMC Large Cap Research) | | | 24,333,501 | | | | 5,361,408 | | | | (717,661 | ) | | | 28,977,248 | |
MetLife Small Cap Value | | | 13,152,811 | | | | 500,505 | | | | (1,257,076 | ) | | | 12,396,240 | |
MFS Research International | | | 31,696,333 | | | | 763,532 | | | | (201,054 | ) | | | 32,258,811 | |
MFS Value | | | 37,381,138 | | | | 4,359,908 | | | | (3,462,194 | ) | | | 38,278,852 | |
Morgan Stanley Mid Cap Growth | | | 3,575,102 | | | | 114,671 | | | | (22,059 | ) | | | 3,667,714 | |
Neuberger Berman Genesis | | | 4,630,674 | | | | 13,961 | | | | (1,768,776 | ) | | | 2,875,859 | |
Oppenheimer Global Equity | | | 5,499,512 | | | | 3,241,923 | | | | (31,319 | ) | | | 8,710,116 | |
PIMCO Inflation Protected Bond | | | 18,078,897 | | | | 133,686 | | | | (1,715,283 | ) | | | 16,497,300 | |
PIMCO Total Return | | | 29,956,449 | | | | 1,249,003 | | | | (2,951,905 | ) | | | 28,253,547 | |
T. Rowe Price Large Cap Growth | | | 22,528,961 | | | | 3,401,654 | | | | (126,814 | ) | | | 25,803,801 | |
T. Rowe Price Large Cap Value | | | 14,948,745 | | | | 2,371,793 | | | | (1,236,663 | ) | | | 16,083,875 | |
T. Rowe Price Mid Cap Growth | | | 9,965,663 | | | | 1,604,173 | | | | (573,701 | ) | | | 10,996,135 | |
T. Rowe Price Small Cap Growth | | | 7,677,471 | | | | 1,101,580 | | | | (323,803 | ) | | | 8,455,248 | |
TCW Core Fixed Income | | | 22,696,128 | | | | 5,699,894 | | | | (2,453,848 | ) | | | 25,942,174 | |
Van Eck Global Natural Resources* | | | 35,787,387 | | | | 7,886,753 | | | | (9,641,347 | ) | | | 34,032,793 | |
Western Asset Management Strategic Bond Opportunities | | | 8,926,377 | | | | 13,071,088 | | | | (5,212,042 | ) | | | 16,785,423 | |
| * | The Portfolio had ownership of at least 25% of the outstanding voting securities of the Underlying Portfolio as of June 30, 2016. The most recent Annual Report of the Underlying Portfolio is available without charge, upon request, by calling (800) 848-3854 or on the Securities and Exchange Commission’s website at http://www.sec.gov. |
| | | | | | | | | | | | | | | | |
Underlying Portfolio | | Net Realized
Gain/(Loss) on sales
of Affiliated
Underlying
Portfolios | | | Capital Gain
Distributions
from Affiliated
Underlying
Portfolios | | | Dividend Income
from Affiliated
Underlying
Portfolios | | | Ending
Value
as of
June 30,
2016 | |
Baillie Gifford International Stock | | $ | 4,235,023 | | | $ | — | | | $ | 6,227,610 | | | $ | 377,312,902 | |
BlackRock Bond Income | | | 418,191 | | | | — | | | | 10,269,464 | | | | 324,006,871 | |
BlackRock Capital Appreciation | | | 624,666 | | | | 34,300,246 | | | | 1 | | | | 379,258,348 | |
BlackRock High Yield | | | (506,661 | ) | | | — | | | | 3,711,504 | | | | 54,396,657 | |
BlackRock Large Cap Value | | | (3,726,321 | ) | | | 29,368,770 | | | | 6,425,767 | | | | 381,425,705 | |
Clarion Global Real Estate | | | 11,819,857 | | | | — | | | | 6,280,611 | | | | 276,023,467 | |
ClearBridge Aggressive Growth | | | 1,864,555 | | | | — | | | | 3,404,363 | | | | 503,044,403 | |
Frontier Mid Cap Growth | | | 120,400 | | | | 6,286,104 | | | | — | | | | 54,478,128 | |
Goldman Sachs Mid Cap Value | | | (11,042,978 | ) | | | 8,438,404 | | | | 1,227,232 | | | | 109,411,486 | |
Harris Oakmark International | | | 641,618 | | | | 29,190,601 | | | | 10,417,966 | | | | 410,391,546 | |
Invesco Comstock | | | 9,224,106 | | | | 38,301,310 | | | | 13,911,820 | | | | 489,628,938 | |
Invesco Mid Cap Value | | | (2,764,856 | ) | | | — | | | | — | | | | — | |
Invesco Small Cap Growth | | | 12,707,551 | | | | 48,889,774 | | | | — | | | | 272,504,536 | |
Jennison Growth | | | 823,914 | | | | 70,857,392 | | | | 1,601,087 | | | | 531,483,816 | |
JPMorgan Core Bond | | | 599,162 | | | | — | | | | 6,480,396 | | | | 215,517,319 | |
JPMorgan Small Cap Value | | | (204,645 | ) | | | 11,107,085 | | | | 3,088,710 | | | | 163,699,620 | |
Loomis Sayles Small Cap Growth | | | 2,247,419 | | | | 15,077,543 | | | | — | | | | 137,125,569 | |
Lord Abbett Bond Debenture | | | (628,653 | ) | | | — | | | | 10,966,733 | | | | — | |
Met/Aberdeen Emerging Markets Equity | | | (3,129,462 | ) | | | — | | | | 3,362,831 | | | | 278,221,392 | |
Met/Artisan International | | | (101,352 | ) | | | — | | | | 3,174,800 | | | | 334,879,136 | |
Met/Artisan Mid Cap Value | | | 27,038,425 | | | | 5,942,812 | | | | 596,377 | | | | 54,358,646 | |
Met/Dimensional International Small Company | | | (2,140,080 | ) | | | 13,559,940 | | | | 4,695,088 | | | | 210,536,369 | |
Met/Eaton Vance Floating Rate | | | (429,917 | ) | | | — | | | | 4,507,157 | | | | 107,596,704 | |
Met/Templeton International Bond | | | (522,954 | ) | | | 822,782 | | | | — | | | | 316,466,439 | |
Met/Wellington Core Equity Opportunities (formerly, WMC Core Equity Opportunities) | | | (3,966,079 | ) | | | 23,343,737 | | | | 8,547,400 | | | | 537,864,418 | |
Met/Wellington Large Cap Research (formerly, WMC Large Cap Research) | | | 468,283 | | | | 24,577,534 | | | | 9,035,471 | | | | 373,516,728 | |
MetLife Small Cap Value | | | 3,180,213 | | | | 4,397,009 | | | | 2,162,463 | | | | 163,258,481 | |
MFS Research International | | | 210,279 | | | | — | | | | 7,262,637 | | | | 319,362,228 | |
MFS Value | | | 21,431,453 | | | | 49,113,275 | | | | 12,312,521 | | | | 548,918,731 | |
Morgan Stanley Mid Cap Growth | | | 31,669 | | | | — | | | | — | | | | 53,842,047 | |
Neuberger Berman Genesis | | | 9,190,536 | | | | — | | | | 260,871 | | | | 54,871,387 | |
MSF-14
Metropolitan Series Fund
MetLife Asset Allocation 80 Portfolio
Notes to Financial Statements—June 30, 2016 (Unaudited)—(Continued)
| | | | | | | | | | | | | | | | |
Underlying Portfolio | | Net Realized
Gain/(Loss) on sales
of Affiliated
Underlying
Portfolios | | | Capital Gain
Distributions
from Affiliated
Underlying
Portfolios | | | Dividend Income
from Affiliated
Underlying
Portfolios | | | Ending Value
as of
June 30, 2016 | |
Oppenheimer Global Equity | | $ | (15,109 | ) | | $ | 7,880,403 | | | $ | 1,892,602 | | | $ | 153,907,758 | |
PIMCO Inflation Protected Bond | | | (2,981,220 | ) | | | — | | | | — | | | | 162,663,376 | |
PIMCO Total Return | | | (1,646,100 | ) | | | — | | | | 8,980,840 | | | | 323,503,108 | |
T. Rowe Price Large Cap Growth | | | 666,226 | | | | 61,023,631 | | | | 293,058 | | | | 482,015,001 | |
T. Rowe Price Large Cap Value | | | 12,932,871 | | | | 56,598,788 | | | | 14,850,793 | | | | 493,131,621 | |
T. Rowe Price Mid Cap Growth | | | 371,921 | | | | 15,795,588 | | | | — | | | | 108,861,738 | |
T. Rowe Price Small Cap Growth | | | 809,662 | | | | 20,775,666 | | | | 436,215 | | | | 164,623,687 | |
TCW Core Fixed Income | | | 173,806 | | | | — | | | | 2,152,829 | | | | 267,723,239 | |
Van Eck Global Natural Resources | | | (38,108,333 | ) | | | — | | | | 2,710,880 | | | | 331,479,401 | |
Western Asset Management Strategic Bond Opportunities | | | (9,624,318 | ) | | | — | | | | 3,447,632 | | | | 218,546,214 | |
| | | | | | | | | | | | | | | | |
| | $ | 40,292,768 | | | $ | 575,648,394 | | | $ | 174,695,729 | | | $ | 10,739,857,160 | |
| | | | | | | | | | | | | | | | |
7. Contractual Obligations
Under the Trust’s organizational documents, its officers and Trustees may be indemnified against certain liabilities and expenses arising out of the performance of their duties to the Trust. Additionally, the Trust has a variety of indemnification obligations under contracts with its service providers. The Trust’s maximum exposure under these arrangements is unknown, as this would involve future claims that may be made against the Trust that have not yet occurred.
8. Income Tax Information
The tax character of distributions paid for the years ended December 31, 2015 and 2014 were as follows:
| | | | | | | | | | | | | | | | | | | | |
Ordinary Income | | | Long-Term Capital Gain | | | Total | |
2015 | | 2014 | | | 2015 | | | 2014 | | | 2015 | | | 2014 | |
| $40,629,365 | | $ | 56,197,477 | | | $ | 543,456,542 | | | $ | — | | | $ | 584,085,907 | | | $ | 56,197,477 | |
As of December 31, 2015, the components of distributable earnings (accumulated losses) on a federal income tax basis were as follows:
| | | | | | | | | | | | | | | | |
Undistributed
Ordinary
Income | | Undistributed
Long-Term
Capital Gain | | | Net
Unrealized
Appreciation | | | Other
Accumulated
Capital
Losses | | | Total | |
| $321,311,541 | | $ | 1,278,826,162 | | | $ | 198,360,398 | | | $ | — | | | $ | 1,798,498,101 | |
The Asset Allocation Portfolio utilizes the provisions of the federal income tax laws that provide for the carryforward of capital losses for prior years, offsetting such losses against any future realized capital gains. Under the Regulated Investment Company Modernization Act of 2010 (the “Act”), net capital losses recognized after December 22, 2010 may be carried forward indefinitely and their character is retained as short-term and/or long-term losses. Previously, net capital losses were carried forward for up to eight years and treated as short-term losses. As a transition rule, the Act requires that post-enactment net capital losses be used before pre-enactment net capital losses.
As of December 31, 2015, the Asset Allocation Portfolio had no post-enactment accumulated capital losses and no pre-enactment accumulated capital loss carryforwards.
MSF-15
Metropolitan Series Fund
MetLife Mid Cap Stock Index Portfolio
Managed by MetLife Investment Advisors, LLC
Portfolio Manager Commentary*
PERFORMANCE
For the six month period ended June 30, 2016, the Class A, B, E and G shares of the MetLife Mid Cap Stock Index Portfolio returned 7.81%, 7.63%, 7.75%, and 7.63%, respectively. The Portfolio’s benchmark, the Standard & Poor’s (“S&P”) MidCap 400 Index1, returned 7.93%.
MARKET ENVIRONMENT / CONDITIONS
During the first quarter, equity markets were volatile as investors worried about a global economic slowdown and macroeconomic data continued to disappoint. U.S. retail sales, industrial production, and housing starts were all weaker than expected. In March, equity indexes rallied on central bank intervention and improving commodity prices. The People’s Bank of China cut reserve requirement ratios, the European Central Bank cut rates further and the Federal Reserve Bank (“Fed”) lowered the expected number of rate increases for 2016. During the second quarter, equity markets continued to move higher as positive macroeconomic data and recovering oil prices contrasted with uncertainty about a potential Fed rate hike and the United Kingdom referendum on European Union membership. In May, U.S. construction spending hit a record high and U.S. new, existing, and pending home sales and durable goods orders were all better than expected. On June 23, United Kingdom voters chose to “Leave” the European Union and on the day after the unexpected vote outcome, the price of gold had its largest single day increase since 2008, the British pound fell to its lowest level in 30 years, and equity markets around the world fell as much as 8%. However, global equity markets remained resilient and rallied the last three days of the quarter as concerns about the referendum abated and volatility declined.
During the first six months, the Federal Open Market Committee (the “Committee”) met four times and maintained the target range for the Federal Funds Rate at 0.25% to 0.50%. The Committee stated that the pace of improvement in the labor market had slowed while growth in economic activity appeared to have picked up. The Committee also stated that it expects economic conditions will evolve in a manner that will warrant only gradual increases in the Federal Funds Rate.
All ten sectors comprising the S&P MidCap 400 Index experienced positive returns for the first six months of 2016. Utilities (5.1% beginning weight in the benchmark), up 27.5%, was the best performing sector. Materials (6.5% beginning weight), up 22.3%, and Telecom Services (0.2% beginning weight), up 15.8%, were the next best-performing sectors. Consumer Discretionary (12.9% beginning weight), up 1.7%, and Information Technology (16.7% beginning weight), up 3.2%, were the worst-relative performing sectors.
The stocks with the largest positive impact on the benchmark return for the first half of the year were Computer Sciences, up 53.0%; Albemarle, up 42.9%; and Ingredion, up 36.1%. The stocks with the largest negative impact were HollyFrontier, down 39.1%; Jones Lang LaSalle, down 38.9%; and United Therapeutics, down 32.4%.
PORTFOLIO REVIEW / PERIOD END POSITIONING
The Portfolio is managed utilizing a full replication strategy versus the S&P MidCap 400 Index. This strategy seeks to replicate the performance of the Index by owning all of the components of the Index at their respective Index capitalization weights. The Portfolio is periodically rebalanced for compositional changes in the S&P MidCap 400 Index. Factors that impact tracking error include transaction costs, cash drag, securities lending, NAV rounding, contributions and withdrawals.
Stacey Lituchy
Norman Hu
Mirsad Usejnoski
Portfolio Managers
MetLife Investment Advisors, LLC
* This commentary may include statements that constitute “forward-looking statements” under the U.S. securities laws. Forward-looking statements include, among other things, projections, estimates, and information about possible or future results related to the Portfolio, market or regulatory developments. The views expressed above are not guarantees of future performance or economic results and involve certain risks, uncertainties and assumptions that could cause actual outcomes and results to differ materially from the views expressed herein. The views expressed above are subject to change at any time based upon economic, market, or other conditions and the subadvisory firm undertakes no obligation to update the views expressed herein. Any discussions of specific securities should not be considered a recommendation to buy or sell those securities. The views expressed above (including any forward-looking statement) may not be relied upon as investment advice or as an indication of the Portfolio’s trading intent. Information about the Portfolio’s holdings, asset allocation or country diversification is historical and is not an indication of future Portfolio composition, which may vary. Direct investment in any index is not possible. The performance of any index mentioned in this commentary has not been adjusted for ongoing management, distribution and operating expenses, and sales charges applicable to mutual fund investments. In addition, the returns do not reflect additional fees charged by separate accounts or variable insurance contracts that an investor in the Portfolio may pay. If these additional fees were reflected, performance would have been lower.
MSF-1
Metropolitan Series Fund
MetLife Mid Cap Stock Index Portfolio
A $10,000 INVESTMENT COMPARED TO THE S&P MIDCAP 400 INDEX
SIX MONTH RETURN & AVERAGE ANNUAL RETURNS (%) AS OF JUNE 30, 2016
| | | | | | | | | | | | | | | | | | | | |
| | | 6 Month | | | 1 Year | | | 5 Year | | | 10 Year | | | Since Inception2 | |
| MetLife Mid Cap Stock Index Portfolio | | | | | | | | | | | | | | | | | | | | |
Class A | | | 7.81 | | | | 1.12 | | | | 10.30 | | | | 8.34 | | | | — | |
Class B | | | 7.63 | | | | 0.81 | | | | 10.02 | | | | 8.06 | | | | — | |
Class E | | | 7.75 | | | | 0.96 | | | | 10.12 | | | | 8.17 | | | | — | |
Class G | | | 7.63 | | | | 0.78 | | | | 9.97 | | | | — | | | | 16.20 | |
| S&P MidCap 400 Index | | | 7.93 | | | | 1.33 | | | | 10.54 | | | | 8.55 | | | | — | |
1 The Standard & Poor’s (S&P) MidCap 400 Index is an unmanaged index measuring the performance of the mid-size company segment of the U.S. market. The Index consists of 400 domestic stocks chosen for market size, liquidity, and industry group representation.
2 Inception dates of the Class A, Class B, Class E and Class G shares are 7/5/00, 1/2/01, 5/1/01 and 4/28/09, respectively.
Portfolio performance is calculated including reinvestment of all income and capital gain distributions. Performance numbers are net of all Portfolio expenses but do not include any insurance, sales, separate account or administrative charges of variable annuity or life insurance contracts or any additional expenses that participants may bear relating to the operations of their plans. If these charges were included, the returns would be lower. The performance of any index referenced above has not been adjusted for ongoing management, distribution and operating expenses, and sales charges applicable to mutual fund investments. Direct investment in any index is not possible. The performance of Class A shares, as set forth in the line graph above, will differ from that of other classes because of the difference in expenses paid by policyholders investing in the different share classes.
This information represents past performance and is not indicative of future results. Investment return and principal value may fluctuate so that shares, upon redemption, may be worth more or less than the original cost.
PORTFOLIO COMPOSITION AS OF JUNE 30, 2016
Top Holdings
| | | | |
| | | % of
Net Assets | |
| SPDR S&P MidCap 400 ETF Trust | | | 2.4 | |
| Mettler-Toledo International, Inc. | | | 0.6 | |
| Ingredion, Inc. | | | 0.6 | |
| Duke Realty Corp. | | | 0.6 | |
| ResMed, Inc. | | | 0.6 | |
| CDK Global, Inc. | | | 0.6 | |
| Alleghany Corp. | | | 0.6 | |
| IDEXX Laboratories, Inc. | | | 0.5 | |
| Atmos Energy Corp. | | | 0.5 | |
| Cooper Cos., Inc. (The) | | | 0.5 | |
Top Sectors
| | | | |
| | | % of
Net Assets | |
| Financials | | | 28.3 | |
| Information Technology | | | 16.0 | |
| Industrials | | | 12.8 | |
| Consumer Discretionary | | | 11.3 | |
| Health Care | | | 8.7 | |
| Materials | | | 6.8 | |
| Utilities | | | 5.8 | |
| Consumer Staples | | | 4.4 | |
| Energy | | | 3.5 | |
| Telecommunication Services | | | 0.2 | |
MSF-2
Metropolitan Series Fund
MetLife Mid Cap Stock Index Portfolio
Understanding Your Portfolio’s Expenses (Unaudited)
Shareholder Expense Example
As a shareholder of the Portfolio, you incur ongoing costs, including management fees; distribution and service (12b-1) fees; and other Portfolio expenses. This example is intended to help you understand your ongoing costs (in dollars) (referred to as “expenses”) of investing in the Portfolio and compare these costs with the ongoing costs of investing in other mutual funds. The example is based on an investment of $1,000 invested at the beginning of the period and held for the entire period, January 1, 2016 through June 30, 2016.
Actual Expenses
The first line for each share class of the Portfolio in the table below provides information about actual account values and actual expenses. You may use the information in this line, together with the amount you invested in the particular share class of the Portfolio, to estimate the expenses that you paid over the period. Simply divide your account value by $1,000 (for example, an $8,600 account value divided by $1,000 = 8.6), then multiply the result by the number in the first line under the heading entitled “Expenses Paid During Period” to estimate the expenses you paid on your account during this period.
Hypothetical Example for Comparison Purposes
The second line for each share class of the Portfolio in the table below provides information about hypothetical account values and hypothetical expenses based on the Portfolio’s actual expense ratio and an assumed rate of return of 5% per year before expenses, which is not the Portfolio’s actual return. The hypothetical account values and expenses may not be used to estimate the actual ending account balance or expenses you paid for the period. You may use this information to compare the ongoing costs of investing in the Portfolio and other funds. To do so, compare this 5% hypothetical example with the 5% hypothetical examples that appear in the shareholder reports of the other funds.
Please note that the expenses shown in the table are meant to highlight your ongoing costs only and do not reflect any fees or charges of your variable insurance product or any additional expenses that participants in certain eligible qualified plans may bear relating to the operations of their plan. Therefore, the second line for each share class in the table is useful in comparing ongoing costs only, and will not help you determine the relative total costs of owning different funds. In addition, if these other costs were included, your costs would have been higher.
| | | | | | | | | | | | | | | | | | |
MetLife Mid Cap Stock Index Portfolio | | | | Annualized
Expense
Ratio | | | Beginning
Account Value
January 1,
2016 | | | Ending
Account Value
June 30,
2016 | | | Expenses Paid
During Period**
January 1, 2016
to
June 30,
2016 | |
Class A(a) | | Actual | | | 0.30 | % | | $ | 1,000.00 | | | $ | 1,078.10 | | | $ | 1.55 | |
| | Hypothetical* | | | 0.30 | % | | $ | 1,000.00 | | | $ | 1,023.37 | | | $ | 1.51 | |
| | | | | |
Class B(a) | | Actual | | | 0.55 | % | | $ | 1,000.00 | | | $ | 1,076.30 | | | $ | 2.84 | |
| | Hypothetical* | | | 0.55 | % | | $ | 1,000.00 | | | $ | 1,022.13 | | | $ | 2.77 | |
| | | | | |
Class E(a) | | Actual | | | 0.45 | % | | $ | 1,000.00 | | | $ | 1,077.50 | | | $ | 2.32 | |
| | Hypothetical* | | | 0.45 | % | | $ | 1,000.00 | | | $ | 1,022.63 | | | $ | 2.26 | |
| | | | | |
Class G(a) | | Actual | | | 0.60 | % | | $ | 1,000.00 | | | $ | 1,076.30 | | | $ | 3.10 | |
| | Hypothetical* | | | 0.60 | % | | $ | 1,000.00 | | | $ | 1,021.88 | | | $ | 3.02 | |
* Hypothetical assumes a rate of return of 5% per year before expenses.
** Expenses paid are equal to the Portfolio’s annualized expense ratio for the most recent six month period, as shown above, multiplied by the average account value over the period, multiplied by the number of days (182 days) in the most recent fiscal half-year, divided by 366 (to reflect the one-half year period).
(a) The annualized expense ratio shown reflects the impact of the management fee waiver as described in Note 6 of the Notes to Financial Statements.
MSF-3
Metropolitan Series Fund
MetLife Mid Cap Stock Index Portfolio
Schedule of Investments as of June 30, 2016 (Unaudited)
Common Stocks—95.3% of Net Assets
| | | | | | | | |
| Security Description | | Shares | | | Value | |
| | |
Aerospace & Defense—1.9% | | | | | | | | |
BE Aerospace, Inc. | | | 64,482 | | | $ | 2,977,457 | |
Curtiss-Wright Corp. | | | 28,089 | | | | 2,366,498 | |
Esterline Technologies Corp. (a) | | | 18,519 | | | | 1,148,919 | |
Huntington Ingalls Industries, Inc. | | | 29,667 | | | | 4,984,946 | |
KLX, Inc. (a) | | | 33,253 | | | | 1,030,843 | |
Orbital ATK, Inc. | | | 36,945 | | | | 3,145,497 | |
Teledyne Technologies, Inc. (a) | | | 21,765 | | | | 2,155,823 | |
Triumph Group, Inc. (b) | | | 31,243 | | | | 1,109,127 | |
| | | | | | | | |
| | | | | | | 18,919,110 | |
| | | | | | | | |
| | |
Airlines—0.3% | | | | | | | | |
JetBlue Airways Corp. (a) | | | 203,254 | | | | 3,365,886 | |
| | | | | | | | |
| | |
Auto Components—0.4% | | | | | | | | |
Dana Holding Corp. | | | 93,303 | | | | 985,280 | |
Gentex Corp. (b) | | | 182,230 | | | | 2,815,453 | |
| | | | | | | | |
| | | | | | | 3,800,733 | |
| | | | | | | | |
| | |
Automobiles—0.2% | | | | | | | | |
Thor Industries, Inc. | | | 28,808 | | | | 1,865,030 | |
| | | | | | | | |
| | |
Banks—5.4% | | | | | | | | |
Associated Banc-Corp. | | | 94,723 | | | | 1,624,499 | |
BancorpSouth, Inc. | | | 53,623 | | | | 1,216,706 | |
Bank of Hawaii Corp. (b) | | | 27,155 | | | | 1,868,264 | |
Bank of the Ozarks, Inc. (b) | | | 51,517 | | | | 1,932,918 | |
Cathay General Bancorp | | | 46,262 | | | | 1,304,588 | |
Commerce Bancshares, Inc. (b) | | | 52,386 | | | | 2,509,289 | |
Cullen/Frost Bankers, Inc. (b) | | | 34,418 | | | | 2,193,459 | |
East West Bancorp, Inc. | | | 90,915 | | | | 3,107,475 | |
First Horizon National Corp. | | | 146,718 | | | | 2,021,774 | |
First Niagara Financial Group, Inc. | | | 223,160 | | | | 2,173,578 | |
FirstMerit Corp. | | | 105,042 | | | | 2,129,201 | |
FNB Corp. | | | 131,616 | | | | 1,650,465 | |
Fulton Financial Corp. | | | 109,443 | | | | 1,477,481 | |
Hancock Holding Co. | | | 48,905 | | | | 1,276,910 | |
International Bancshares Corp. | | | 34,948 | | | | 911,793 | |
PacWest Bancorp | | | 72,216 | | | | 2,872,753 | |
PrivateBancorp, Inc. | | | 50,088 | | | | 2,205,375 | |
Prosperity Bancshares, Inc. | | | 41,259 | | | | 2,103,796 | |
Signature Bank (a) | | | 33,870 | | | | 4,231,040 | |
SVB Financial Group (a) | | | 32,685 | | | | 3,110,305 | |
Synovus Financial Corp. | | | 79,180 | | | | 2,295,428 | |
TCF Financial Corp. | | | 107,918 | | | | 1,365,163 | |
Trustmark Corp. | | | 42,660 | | | | 1,060,101 | |
Umpqua Holdings Corp. | | | 139,094 | | | | 2,151,784 | |
Valley National Bancorp (b) | | | 141,236 | | | | 1,288,072 | |
Webster Financial Corp. | | | 57,830 | | | | 1,963,329 | |
| | | | | | | | |
| | | | | | | 52,045,546 | |
| | | | | | | | |
| | |
Beverages—0.1% | | | | | | | | |
Boston Beer Co., Inc. (The) - Class A (a) (b) | | | 5,891 | | | | 1,007,538 | |
| | | | | | | | |
| | |
Biotechnology—0.3% | | | | | | | | |
United Therapeutics Corp. (a) (b) | | | 28,153 | | | | 2,981,966 | |
| | | | | | | | |
| | |
Building Products—0.8% | | | | | | | | |
A.O. Smith Corp. | | | 46,959 | | | | 4,137,557 | |
Lennox International, Inc. (b) | | | 24,486 | | | | 3,491,704 | |
| | | | | | | | |
| | | | | | | 7,629,261 | |
| | | | | | | | |
| | |
Capital Markets—1.7% | | | | | | | | |
Eaton Vance Corp. (b) | | | 71,562 | | | | 2,529,001 | |
Federated Investors, Inc. - Class B | | | 59,698 | | | | 1,718,108 | |
Janus Capital Group, Inc. | | | 92,025 | | | | 1,280,988 | |
Raymond James Financial, Inc. | | | 79,473 | | | | 3,918,019 | |
SEI Investments Co. | | | 85,852 | | | | 4,130,340 | |
Stifel Financial Corp. (a) | | | 41,938 | | | | 1,318,950 | |
Waddell & Reed Financial, Inc. - Class A (b) | | | 51,413 | | | | 885,332 | |
WisdomTree Investments, Inc. (b) | | | 71,456 | | | | 699,554 | |
| | | | | | | | |
| | | | | | | 16,480,292 | |
| | | | | | | | |
| | |
Chemicals—2.9% | | | | | | | | |
Ashland, Inc. | | | 39,156 | | | | 4,493,934 | |
Cabot Corp. | | | 39,368 | | | | 1,797,543 | |
Minerals Technologies, Inc. | | | 21,973 | | | | 1,248,066 | |
NewMarket Corp. (b) | | | 6,280 | | | | 2,602,307 | |
Olin Corp. (b) | | | 104,196 | | | | 2,588,229 | |
PolyOne Corp. | | | 53,024 | | | | 1,868,566 | |
RPM International, Inc. | | | 83,815 | | | | 4,186,559 | |
Scotts Miracle-Gro Co. (The) - Class A | | | 28,585 | | | | 1,998,377 | |
Sensient Technologies Corp. | | | 28,282 | | | | 2,009,153 | |
Valspar Corp. (The) | | | 46,010 | | | | 4,970,460 | |
| | | | | | | | |
| | | | | | | 27,763,194 | |
| | | | | | | | |
|
Commercial Services & Supplies—1.5% | |
Clean Harbors, Inc. (a) | | | 33,043 | | | | 1,721,871 | |
Copart, Inc. (a) (b) | | | 62,800 | | | | 3,077,828 | |
Deluxe Corp. (b) | | | 30,861 | | | | 2,048,245 | |
Herman Miller, Inc. | | | 37,759 | | | | 1,128,616 | |
HNI Corp. | | | 27,997 | | | | 1,301,581 | |
MSA Safety, Inc. | | | 20,082 | | | | 1,054,907 | |
Rollins, Inc. | | | 59,331 | | | | 1,736,618 | |
RR Donnelley & Sons Co. (b) | | | 132,114 | | | | 2,235,369 | |
| | | | | | | | |
| | | | | | | 14,305,035 | |
| | | | | | | | |
| | |
Communications Equipment—1.3% | | | | | | | | |
ARRIS International plc (a) | | | 110,240 | | | | 2,310,631 | |
Brocade Communications Systems, Inc. | | | 294,472 | | | | 2,703,253 | |
Ciena Corp. (a) (b) | | | 81,575 | | | | 1,529,531 | |
InterDigital, Inc. | | | 21,813 | | | | 1,214,548 | |
NetScout Systems, Inc. (a) | | | 59,153 | | | | 1,316,154 | |
Plantronics, Inc. | | | 21,022 | | | | 924,968 | |
Polycom, Inc. (a) | | | 85,565 | | | | 962,606 | |
ViaSat, Inc. (a) (b) | | | 28,410 | | | | 2,028,474 | |
| | | | | | | | |
| | | | | | | 12,990,165 | |
| | | | | | | | |
|
Construction & Engineering—0.9% | |
AECOM (a) | | | 96,762 | | | | 3,074,129 | |
EMCOR Group, Inc. | | | 38,297 | | | | 1,886,510 | |
Granite Construction, Inc. | | | 24,965 | | | | 1,137,156 | |
See accompanying notes to financial statements.
MSF-4
Metropolitan Series Fund
MetLife Mid Cap Stock Index Portfolio
Schedule of Investments as of June 30, 2016 (Unaudited)
Common Stocks—(Continued)
| | | | | | | | |
| Security Description | | Shares | | | Value | |
|
Construction & Engineering—(Continued) | |
KBR, Inc. | | | 89,857 | | | $ | 1,189,707 | |
Valmont Industries, Inc. | | | 14,313 | | | | 1,936,119 | |
| | | | | | | | |
| | | | | | | 9,223,621 | |
| | | | | | | | |
| | |
Construction Materials—0.2% | | | | | | | | |
Eagle Materials, Inc. | | | 30,462 | | | | 2,350,143 | |
| | | | | | | | |
| | |
Consumer Finance—0.2% | | | | | | | | |
SLM Corp. (a) | | | 269,989 | | | | 1,668,532 | |
| | | | | | | | |
| | |
Containers & Packaging—1.6% | | | | | | | | |
AptarGroup, Inc. | | | 39,846 | | | | 3,153,014 | |
Bemis Co., Inc. | | | 59,740 | | | | 3,076,013 | |
Greif, Inc. - Class A | | | 16,263 | | | | 606,122 | |
Packaging Corp. of America | | | 59,376 | | | | 3,974,036 | |
Silgan Holdings, Inc. | | | 25,561 | | | | 1,315,369 | |
Sonoco Products Co. | | | 63,569 | | | | 3,156,836 | |
| | | | | | | | |
| | | | | | | 15,281,390 | |
| | | | | | | | |
| | |
Distributors—0.3% | | | | | | | | |
Pool Corp. | | | 26,543 | | | | 2,495,838 | |
| | | | | | | | |
| | |
Diversified Consumer Services—0.6% | | | | | | | | |
DeVry Education Group, Inc. | | | 35,631 | | | | 635,657 | |
Graham Holdings Co. - Class B | | | 2,702 | | | | 1,322,737 | |
Service Corp. International | | | 122,227 | | | | 3,305,018 | |
Sotheby’s (b) | | | 32,879 | | | | 900,885 | |
| | | | | | | | |
| | | | | | | 6,164,297 | |
| | | | | | | | |
| | |
Diversified Financial Services—1.6% | | | | | | | | |
CBOE Holdings, Inc. | | | 51,354 | | | | 3,421,203 | |
FactSet Research Systems, Inc. (b) | | | 25,792 | | | | 4,163,345 | |
MarketAxess Holdings, Inc. | | | 23,700 | | | | 3,445,980 | |
MSCI, Inc. | | | 54,797 | | | | 4,225,945 | |
| | | | | | | | |
| | | | | | | 15,256,473 | |
| | | | | | | | |
| | |
Electric Utilities—1.9% | | | | | | | | |
Great Plains Energy, Inc. | | | 97,453 | | | | 2,962,571 | |
Hawaiian Electric Industries, Inc. | | | 68,070 | | | | 2,232,015 | |
IDACORP, Inc. | | | 31,808 | | | | 2,587,581 | |
OGE Energy Corp. | | | 125,996 | | | | 4,126,369 | |
PNM Resources, Inc. | | | 50,255 | | | | 1,781,037 | |
Westar Energy, Inc. | | | 89,393 | | | | 5,014,054 | |
| | | | | | | | |
| | | | | | | 18,703,627 | |
| | | | | | | | |
| | |
Electrical Equipment—0.5% | | | | | | | | |
Hubbell, Inc. | | | 32,812 | | | | 3,460,682 | |
Regal-Beloit Corp. | | | 28,220 | | | | 1,553,511 | |
| | | | | | | | |
| | | | | | | 5,014,193 | |
| | | | | | | | |
|
Electronic Equipment, Instruments & Components—3.9% | |
Arrow Electronics, Inc. (a) | | | 57,815 | | | | 3,578,748 | |
Avnet, Inc. | | | 81,082 | | | | 3,284,632 | |
Belden, Inc. | | | 26,544 | | | | 1,602,461 | |
|
Electronic Equipment, Instruments & Components—(Continued) | |
Cognex Corp. | | | 53,661 | | | | 2,312,789 | |
FEI Co. | | | 25,780 | | | | 2,755,366 | |
Ingram Micro, Inc. - Class A | | | 93,604 | | | | 3,255,547 | |
IPG Photonics Corp. (a) (b) | | | 23,107 | | | | 1,848,560 | |
Jabil Circuit, Inc. | | | 120,624 | | | | 2,227,925 | |
Keysight Technologies, Inc. (a) | | | 107,400 | | | | 3,124,266 | |
Knowles Corp. (a) | | | 55,890 | | | | 764,575 | |
National Instruments Corp. | | | 63,624 | | | | 1,743,298 | |
SYNNEX Corp. | | | 18,286 | | | | 1,733,879 | |
Tech Data Corp. (a) | | | 22,207 | | | | 1,595,573 | |
Trimble Navigation, Ltd. (a) | | | 158,407 | | | | 3,858,795 | |
VeriFone Systems, Inc. (a) | | | 69,527 | | | | 1,289,031 | |
Vishay Intertechnology, Inc. (b) | | | 85,530 | | | | 1,059,717 | |
Zebra Technologies Corp. - Class A (a) (b) | | | 32,959 | | | | 1,651,246 | |
| | | | | | | | |
| | | | | | | 37,686,408 | |
| | | | | | | | |
| | |
Energy Equipment & Services—1.5% | | | | | | | | |
Dril-Quip, Inc. (a) (b) | | | 23,948 | | | | 1,399,282 | |
Ensco plc - Class A | | | 190,103 | | | | 1,845,900 | |
Nabors Industries, Ltd. | | | 177,862 | | | | 1,787,513 | |
Noble Corp. plc | | | 153,448 | | | | 1,264,412 | |
Oceaneering International, Inc. | | | 61,868 | | | | 1,847,378 | |
Oil States International, Inc. (a) | | | 32,404 | | | | 1,065,444 | |
Patterson-UTI Energy, Inc. (b) | | | 92,978 | | | | 1,982,291 | |
Rowan Cos. plc - Class A (b) | | | 79,159 | | | | 1,397,948 | |
Superior Energy Services, Inc. | | | 95,528 | | | | 1,758,670 | |
| | | | | | | | |
| | | | | | | 14,348,838 | |
| | | | | | | | |
| | |
Food & Staples Retailing—0.8% | | | | | | | | |
Casey’s General Stores, Inc. (b) | | | 24,638 | | | | 3,240,143 | |
Sprouts Farmers Market, Inc. (a) (b) | | | 89,400 | | | | 2,047,260 | |
SUPERVALU, Inc. (a) | | | 167,595 | | | | 791,049 | |
United Natural Foods, Inc. (a) | | | 31,755 | | | | 1,486,134 | |
| | | | | | | | |
| | | | | | | 7,564,586 | |
| | | | | | | | |
| | |
Food Products—2.9% | | | | | | | | |
Dean Foods Co. (b) | | | 57,897 | | | | 1,047,357 | |
Flowers Foods, Inc. (b) | | | 114,836 | | | | 2,153,175 | |
Hain Celestial Group, Inc. (The) (a) | | | 65,267 | | | | 3,247,033 | |
Ingredion, Inc. | | | 45,418 | | | | 5,877,543 | |
Lancaster Colony Corp. | | | 12,279 | | | | 1,566,923 | |
Post Holdings, Inc. (a) (b) | | | 40,574 | | | | 3,355,064 | |
Snyder’s-Lance, Inc. | | | 50,184 | | | | 1,700,736 | |
Tootsie Roll Industries, Inc. (b) | | | 11,326 | | | | 436,391 | |
TreeHouse Foods, Inc. (a) | | | 35,605 | | | | 3,654,853 | |
WhiteWave Foods Co. (The) (a) | | | 111,621 | | | | 5,239,490 | |
| | | | | | | | |
| | | | | | | 28,278,565 | |
| | | | | | | | |
| | |
Gas Utilities—2.6% | | | | | | | | |
Atmos Energy Corp. | | | 64,501 | | | | 5,245,221 | |
National Fuel Gas Co. (b) | | | 53,587 | | | | 3,048,029 | |
New Jersey Resources Corp. | | | 54,291 | | | | 2,092,918 | |
ONE Gas, Inc. | | | 32,909 | | | | 2,191,410 | |
Questar Corp. | | | 110,661 | | | | 2,807,470 | |
Southwest Gas Corp. | | | 29,951 | | | | 2,357,443 | |
See accompanying notes to financial statements.
MSF-5
Metropolitan Series Fund
MetLife Mid Cap Stock Index Portfolio
Schedule of Investments as of June 30, 2016 (Unaudited)
Common Stocks—(Continued)
| | | | | | | | |
| Security Description | | Shares | | | Value | |
| | |
Gas Utilities—(Continued) | | | | | | | | |
UGI Corp. | | | 108,948 | | | $ | 4,929,897 | |
WGL Holdings, Inc. | | | 31,759 | | | | 2,248,220 | |
| | | | | | | | |
| | | | | | | 24,920,608 | |
| | | | | | | | |
|
Health Care Equipment & Supplies—4.0% | |
ABIOMED, Inc. (a) | | | 24,806 | | | | 2,711,048 | |
Align Technology, Inc. (a) | | | 46,037 | | | | 3,708,280 | |
Cooper Cos., Inc. (The) | | | 30,567 | | | | 5,244,380 | |
Halyard Health, Inc. (a) | | | 29,445 | | | | 957,552 | |
Hill-Rom Holdings, Inc. | | | 35,889 | | | | 1,810,600 | |
IDEXX Laboratories, Inc. (a) | | | 56,487 | | | | 5,245,383 | |
LivaNova plc (a) | | | 26,934 | | | | 1,352,895 | |
ResMed, Inc. (b) | | | 88,587 | | | | 5,601,356 | |
STERIS plc | | | 54,259 | | | | 3,730,306 | |
Teleflex, Inc. | | | 27,506 | | | | 4,877,089 | |
West Pharmaceutical Services, Inc. | | | 46,106 | | | | 3,498,523 | |
| | | | | | | | |
| | | | | | | 38,737,412 | |
| | | | | | | | |
|
Health Care Providers & Services—2.1% | |
Amsurg Corp. (a) | | | 34,111 | | | | 2,644,967 | |
Community Health Systems, Inc. (a) (b) | | | 71,157 | | | | 857,442 | |
LifePoint Health, Inc. (a) | | | 27,392 | | | | 1,790,615 | |
MEDNAX, Inc. (a) | | | 58,691 | | | | 4,250,989 | |
Molina Healthcare, Inc. (a) (b) | | | 26,061 | | | | 1,300,444 | |
Owens & Minor, Inc. (b) | | | 39,618 | | | | 1,480,921 | |
Tenet Healthcare Corp. (a) (b) | | | 62,652 | | | | 1,731,701 | |
VCA, Inc. (a) | | | 50,993 | | | | 3,447,637 | |
WellCare Health Plans, Inc. (a) | | | 27,920 | | | | 2,995,257 | |
| | | | | | | | |
| | | | | | | 20,499,973 | |
| | | | | | | | |
| | |
Health Care Technology—0.2% | | | | | | | | |
Allscripts Healthcare Solutions, Inc. (a) | | | 118,026 | | | | 1,498,930 | |
| | | | | | | | |
| | |
Hotels, Restaurants & Leisure—2.4% | | | | | | | | |
Brinker International, Inc. (b) | | | 35,149 | | | | 1,600,334 | |
Buffalo Wild Wings, Inc. (a) (b) | | | 11,878 | | | | 1,650,448 | |
Cheesecake Factory, Inc. (The) (b) | | | 28,152 | | | | 1,355,237 | |
Churchill Downs, Inc. | | | 7,586 | | | | 958,567 | |
Cracker Barrel Old Country Store, Inc. (b) | | | 15,106 | | | | 2,590,226 | |
Domino’s Pizza, Inc. | | | 31,641 | | | | 4,156,995 | |
Dunkin’ Brands Group, Inc. (b) | | | 57,817 | | | | 2,521,978 | |
International Speedway Corp. - Class A | | | 16,737 | | | | 559,853 | |
Jack in the Box, Inc. | | | 20,531 | | | | 1,764,023 | |
Panera Bread Co. - Class A (a) (b) | | | 14,385 | | | | 3,048,757 | |
Texas Roadhouse, Inc. (b) | | | 39,929 | | | | 1,820,762 | |
Wendy’s Co. (The) | | | 134,528 | | | | 1,294,159 | |
| | | | | | | | |
| | | | | | | 23,321,339 | |
| | | | | | | | |
| | |
Household Durables—1.7% | | | | | | | | |
CalAtlantic Group, Inc. (b) | | | 47,048 | | | | 1,727,132 | |
Helen of Troy, Ltd. (a) | | | 17,510 | | | | 1,800,728 | |
KB Home | | | 52,717 | | | | 801,826 | |
NVR, Inc. (a) | | | 2,312 | | | | 4,116,146 | |
Tempur Sealy International, Inc. (a) (b) | | | 38,436 | | | | 2,126,280 | |
Toll Brothers, Inc. (a) | | | 96,263 | | | | 2,590,437 | |
| | |
Household Durables—(Continued) | | | | | | | | |
TRI Pointe Group, Inc. (a) | | | 92,015 | | | | 1,087,617 | |
Tupperware Brands Corp. (b) | | | 31,863 | | | | 1,793,250 | |
| | | | | | | | |
| | | | | | | 16,043,416 | |
| | | | | | | | |
| | |
Household Products—0.2% | | | | | | | | |
Energizer Holdings, Inc. | | | 39,010 | | | | 2,008,625 | |
| | | | | | | | |
|
Independent Power and Renewable Electricity Producers—0.1% | |
Talen Energy Corp. (a) | | | 40,545 | | | | 549,385 | |
| | | | | | | | |
| | |
Industrial Conglomerates—0.4% | | | | | | | | |
Carlisle Cos., Inc. | | | 40,500 | | | | 4,280,040 | |
| | | | | | | | |
| | |
Insurance—4.8% | | | | | | | | |
Alleghany Corp. (a) | | | 9,741 | | | | 5,353,459 | |
American Financial Group, Inc. | | | 44,858 | | | | 3,316,352 | |
Aspen Insurance Holdings, Ltd. | | | 38,309 | | | | 1,776,771 | |
Brown & Brown, Inc. | | | 73,324 | | | | 2,747,450 | |
CNO Financial Group, Inc. | | | 112,996 | | | | 1,972,910 | |
Endurance Specialty Holdings, Ltd. | | | 39,103 | | | | 2,626,157 | |
Everest Re Group, Ltd. (b) | | | 26,713 | | | | 4,879,664 | |
First American Financial Corp. | | | 69,133 | | | | 2,780,529 | |
Genworth Financial, Inc. - Class A (a) | | | 314,494 | | | | 811,395 | |
Hanover Insurance Group, Inc. (The) | | | 27,100 | | | | 2,293,202 | |
Kemper Corp. | | | 30,325 | | | | 939,468 | |
Mercury General Corp. | | | 23,008 | | | | 1,223,105 | |
Old Republic International Corp. | | | 153,833 | | | | 2,967,439 | |
Primerica, Inc. (b) | | | 29,682 | | | | 1,698,998 | |
Reinsurance Group of America, Inc. | | | 40,421 | | | | 3,920,433 | |
RenaissanceRe Holdings, Ltd. (b) | | | 27,190 | | | | 3,193,194 | |
W.R. Berkley Corp. (b) | | | 61,882 | | | | 3,707,969 | |
| | | | | | | | |
| | | | | | | 46,208,495 | |
| | | | | | | | |
| | |
Internet & Catalog Retail—0.1% | | | | | | | | |
HSN, Inc. | | | 20,123 | | | | 984,618 | |
| | | | | | | | |
| | |
Internet Software & Services—0.6% | | | | | | | | |
comScore, Inc. (a) (b) | | | 29,675 | | | | 708,639 | |
j2 Global, Inc. | | | 29,185 | | | | 1,843,616 | |
Rackspace Hosting, Inc. (a) (b) | | | 67,431 | | | | 1,406,611 | |
WebMD Health Corp. (a) (b) | | | 24,411 | | | | 1,418,523 | |
| | | | | | | | |
| | | | | | | 5,377,389 | |
| | | | | | | | |
| | |
IT Services—3.5% | | | | | | | | |
Acxiom Corp. (a) | | | 48,912 | | | | 1,075,575 | |
Broadridge Financial Solutions, Inc. | | | 74,584 | | | | 4,862,877 | |
Computer Sciences Corp. | | | 87,495 | | | | 4,344,127 | |
Convergys Corp. (b) | | | 60,873 | | | | 1,521,825 | |
CoreLogic, Inc. (a) | | | 56,060 | | | | 2,157,189 | |
DST Systems, Inc. | | | 19,681 | | | | 2,291,459 | |
Gartner, Inc. (a) (c) | | | 52,051 | | | | 5,070,288 | |
Jack Henry & Associates, Inc. | | | 49,770 | | | | 4,343,428 | |
Leidos Holdings, Inc. | | | 40,806 | | | | 1,953,383 | |
MAXIMUS, Inc. | | | 40,945 | | | | 2,267,124 | |
NeuStar, Inc. - Class A (a) (b) | | | 34,308 | | | | 806,581 | |
See accompanying notes to financial statements.
MSF-6
Metropolitan Series Fund
MetLife Mid Cap Stock Index Portfolio
Schedule of Investments as of June 30, 2016 (Unaudited)
Common Stocks—(Continued)
| | | | | | | | |
| Security Description | | Shares | | | Value | |
| | |
IT Services—(Continued) | | | | | | | | |
Science Applications International Corp. | | | 25,957 | | | $ | 1,514,591 | |
WEX, Inc. (a) | | | 24,416 | | | | 2,164,967 | |
| | | | | | | | |
| | | | | | | 34,373,414 | |
| | | | | | | | |
| | |
Leisure Products—0.8% | | | | | | | | |
Brunswick Corp. | | | 57,181 | | | | 2,591,443 | |
Polaris Industries, Inc. (b) | | | 37,920 | | | | 3,100,339 | |
Vista Outdoor, Inc. (a) | | | 38,317 | | | | 1,828,871 | |
| | | | | | | | |
| | | | | | | 7,520,653 | |
| | | | | | | | |
| | |
Life Sciences Tools & Services—1.6% | | | | | | | | |
Bio-Rad Laboratories, Inc. - Class A (a) | | | 13,169 | | | | 1,883,430 | |
Bio-Techne Corp. | | | 23,479 | | | | 2,647,727 | |
Charles River Laboratories International, Inc. (a) | | | 29,766 | | | | 2,453,909 | |
Mettler-Toledo International, Inc. (a) | | | 16,884 | | | | 6,161,309 | |
PAREXEL International Corp. (a) | | | 33,368 | | | | 2,098,180 | |
| | | | | | | | |
| | | | | | | 15,244,555 | |
| | | | | | | | |
| | |
Machinery—4.2% | | | | | | | | |
AGCO Corp. | | | 44,749 | | | | 2,109,020 | |
CLARCOR, Inc. | | | 30,600 | | | | 1,861,398 | |
Crane Co. | | | 31,267 | | | | 1,773,464 | |
Donaldson Co., Inc. (b) | | | 78,003 | | | | 2,680,183 | |
Graco, Inc. (b) | | | 35,088 | | | | 2,771,601 | |
IDEX Corp. | | | 47,888 | | | | 3,931,605 | |
ITT, Inc. | | | 56,845 | | | | 1,817,903 | |
Joy Global, Inc. | | | 61,916 | | | | 1,308,904 | |
Kennametal, Inc. | | | 50,278 | | | | 1,111,647 | |
Lincoln Electric Holdings, Inc. | | | 39,505 | | | | 2,333,955 | |
Nordson Corp. | | | 33,835 | | | | 2,828,944 | |
Oshkosh Corp. | | | 46,288 | | | | 2,208,401 | |
Terex Corp. | | | 68,896 | | | | 1,399,278 | |
Timken Co. (The) | | | 43,485 | | | | 1,333,250 | |
Toro Co. (The) | | | 34,722 | | | | 3,062,480 | |
Trinity Industries, Inc. (b) | | | 95,146 | | | | 1,766,861 | |
Wabtec Corp. (b) | | | 56,850 | | | | 3,992,576 | |
Woodward, Inc. | | | 34,696 | | | | 1,999,878 | |
| | | | | | | | |
| | | | | | | 40,291,348 | |
| | | | | | | | |
| | |
Marine—0.2% | | | | | | | | |
Kirby Corp. (a) | | | 33,984 | | | | 2,120,262 | |
| | | | | | | | |
| | |
Media—1.5% | | | | | | | | |
AMC Networks, Inc. - Class A (a) | | | 38,606 | | | | 2,332,575 | |
Cable One, Inc. | | | 2,753 | | | | 1,407,912 | |
Cinemark Holdings, Inc. | | | 66,698 | | | | 2,431,809 | |
DreamWorks Animation SKG,
Inc. - Class A (a) | | | 45,258 | | | | 1,849,694 | |
John Wiley & Sons, Inc. - Class A | | | 30,440 | | | | 1,588,359 | |
Live Nation Entertainment, Inc. (a) | | | 92,183 | | | | 2,166,300 | |
Meredith Corp. | | | 23,735 | | | | 1,232,084 | |
New York Times Co. (The) - Class A | | | 77,783 | | | | 941,174 | |
Time, Inc. | | | 64,208 | | | | 1,056,864 | |
| | | | | | | | |
| | | | | | | 15,006,771 | |
| | | | | | | | |
| | |
Metals & Mining—1.8% | | | | | | | | |
Allegheny Technologies, Inc. (b) | | | 68,694 | | | | 875,849 | |
Carpenter Technology Corp. | | | 29,393 | | | | 967,912 | |
Commercial Metals Co. | | | 72,268 | | | | 1,221,329 | |
Compass Minerals International, Inc. (b) | | | 21,313 | | | | 1,581,211 | |
Reliance Steel & Aluminum Co. | | | 45,636 | | | | 3,509,408 | |
Royal Gold, Inc. (b) | | | 41,196 | | | | 2,966,936 | |
Steel Dynamics, Inc. | | | 153,673 | | | | 3,764,989 | |
United States Steel Corp. (b) | | | 92,381 | | | | 1,557,544 | |
Worthington Industries, Inc. | | | 28,368 | | | | 1,199,966 | |
| | | | | | | | |
| | | | | | | 17,645,144 | |
| | | | | | | | |
| | |
Multi-Utilities—0.8% | | | | | | | | |
Black Hills Corp. (b) | | | 32,547 | | | | 2,051,763 | |
MDU Resources Group, Inc. | | | 123,221 | | | | 2,957,304 | |
Vectren Corp. | | | 52,244 | | | | 2,751,691 | |
| | | | | | | | |
| | | | | | | 7,760,758 | |
| | | | | | | | |
| | |
Multiline Retail—0.3% | | | | | | | | |
Big Lots, Inc. (b) | | | 27,996 | | | | 1,402,879 | |
J.C. Penney Co., Inc. (a) (b) | | | 193,970 | | | | 1,722,454 | |
| | | | | | | | |
| | | | | | | 3,125,333 | |
| | | | | | | | |
| | |
Oil, Gas & Consumable Fuels—2.0% | | | | | | | | |
CONSOL Energy, Inc. (b) | | | 144,711 | | | | 2,328,400 | |
Denbury Resources, Inc. (b) | | | 221,196 | | | | 794,094 | |
Energen Corp. | | | 61,242 | | | | 2,952,477 | |
Gulfport Energy Corp. (a) | | | 79,080 | | | | 2,472,041 | |
HollyFrontier Corp. (b) | | | 110,917 | | | | 2,636,497 | |
QEP Resources, Inc. | | | 149,369 | | | | 2,633,375 | |
SM Energy Co. (b) | | | 42,952 | | | | 1,159,704 | |
Western Refining, Inc. | | | 50,625 | | | | 1,044,394 | |
World Fuel Services Corp. | | | 44,686 | | | | 2,122,138 | |
WPX Energy, Inc. (a) | | | 174,904 | | | | 1,628,356 | |
| | | | | | | | |
| | | | | | | 19,771,476 | |
| | | | | | | | |
| | |
Paper & Forest Products—0.3% | | | | | | | | |
Domtar Corp. | | | 39,486 | | | | 1,382,405 | |
Louisiana-Pacific Corp. (a) (b) | | | 90,693 | | | | 1,573,523 | |
| | | | | | | | |
| | | | | | | 2,955,928 | |
| | | | | | | | |
| | |
Personal Products—0.4% | | | | | | | | |
Avon Products, Inc. (b) | | | 275,186 | | | | 1,040,203 | |
Edgewell Personal Care Co. | | | 37,451 | | | | 3,161,239 | |
| | | | | | | | |
| | | | | | | 4,201,442 | |
| | | | | | | | |
| | |
Pharmaceuticals—0.5% | | | | | | | | |
Akorn, Inc. (a) (b) | | | 52,744 | | | | 1,502,413 | |
Catalent, Inc. (a) | | | 67,639 | | | | 1,555,020 | |
Prestige Brands Holdings, Inc. (a) | | | 33,287 | | | | 1,844,100 | |
| | | | | | | | |
| | | | | | | 4,901,533 | |
| | | | | | | | |
| | |
Professional Services—0.5% | | | | | | | | |
CEB, Inc. | | | 20,319 | | | | 1,253,276 | |
FTI Consulting, Inc. (a) | | | 26,149 | | | | 1,063,741 | |
See accompanying notes to financial statements.
MSF-7
Metropolitan Series Fund
MetLife Mid Cap Stock Index Portfolio
Schedule of Investments as of June 30, 2016 (Unaudited)
Common Stocks—(Continued)
| | | | | | | | |
| Security Description | | Shares | | | Value | |
| | |
Professional Services—(Continued) | | | | | | | | |
ManpowerGroup, Inc. | | | 45,106 | | | $ | 2,902,120 | |
| | | | | | | | |
| | | | | | | 5,219,137 | |
| | | | | | | | |
|
Real Estate Investment Trusts—11.2% | |
Alexandria Real Estate Equities, Inc. | | | 46,609 | | | | 4,824,964 | |
American Campus Communities, Inc. | | | 82,297 | | | | 4,351,042 | |
Camden Property Trust (b) | | | 54,890 | | | | 4,853,374 | |
Care Capital Properties, Inc. | | | 52,961 | | | | 1,388,108 | |
Communications Sales & Leasing, Inc. (a) | | | 86,095 | | | | 2,488,146 | |
Corporate Office Properties Trust | | | 59,717 | | | | 1,765,832 | |
Corrections Corp. of America | | | 74,118 | | | | 2,595,612 | |
DCT Industrial Trust, Inc. | | | 55,865 | | | | 2,683,755 | |
Douglas Emmett, Inc. (b) | | | 88,589 | | | | 3,146,681 | |
Duke Realty Corp. | | | 218,263 | | | | 5,818,892 | |
Education Realty Trust, Inc. | | | 41,683 | | | | 1,923,254 | |
EPR Properties | | | 40,127 | | | | 3,237,446 | |
Equity One, Inc. | | | 57,374 | | | | 1,846,295 | |
First Industrial Realty Trust, Inc. | | | 73,721 | | | | 2,050,918 | |
Healthcare Realty Trust, Inc. | | | 71,175 | | | | 2,490,413 | |
Highwoods Properties, Inc. | | | 61,457 | | | | 3,244,930 | |
Hospitality Properties Trust | | | 95,614 | | | | 2,753,683 | |
Kilroy Realty Corp. | | | 58,158 | | | | 3,855,294 | |
Lamar Advertising Co. - Class A | | | 52,009 | | | | 3,448,197 | |
LaSalle Hotel Properties (b) | | | 71,331 | | | | 1,681,985 | |
Liberty Property Trust | | | 92,508 | | | | 3,674,418 | |
Mack-Cali Realty Corp. | | | 56,554 | | | | 1,526,958 | |
Medical Properties Trust, Inc. | | | 150,078 | | | | 2,282,686 | |
Mid-America Apartment Communities, Inc. | | | 47,641 | | | | 5,069,002 | |
National Retail Properties, Inc. | | | 90,869 | | | | 4,699,745 | |
Omega Healthcare Investors, Inc. | | | 104,474 | | | | 3,546,892 | |
Post Properties, Inc. | | | 33,746 | | | | 2,060,193 | |
Potlatch Corp. | | | 25,670 | | | | 875,347 | |
Rayonier, Inc. | | | 77,308 | | | | 2,028,562 | |
Regency Centers Corp. | | | 61,585 | | | | 5,156,512 | |
Senior Housing Properties Trust | | | 149,825 | | | | 3,120,855 | |
Sovran Self Storage, Inc. | | | 29,240 | | | | 3,067,861 | |
Tanger Factory Outlet Centers, Inc. | | | 59,963 | | | | 2,409,313 | |
Taubman Centers, Inc. | | | 38,072 | | | | 2,824,942 | |
Urban Edge Properties | | | 58,311 | | | | 1,741,166 | |
Weingarten Realty Investors | | | 72,835 | | | | 2,973,125 | |
WP Glimcher, Inc. (b) | | | 116,916 | | | | 1,308,290 | |
| | | | | | | | |
| | | | | | | 108,814,688 | |
| | | | | | | | |
|
Real Estate Management & Development—0.4% | |
Alexander & Baldwin, Inc. | | | 29,048 | | | | 1,049,795 | |
Jones Lang LaSalle, Inc. | | | 28,465 | | | | 2,773,914 | |
| | | | | | | | |
| | | | | | | 3,823,709 | |
| | | | | | | | |
| |
Road & Rail—0.7% | | | | | |
Genesee & Wyoming, Inc. - Class A (a) | | | 36,061 | | | | 2,125,796 | |
Landstar System, Inc. | | | 26,704 | | | | 1,833,497 | |
Old Dominion Freight Line, Inc. (a) | | | 43,168 | | | | 2,603,462 | |
Werner Enterprises, Inc. | | | 28,181 | | | | 647,317 | |
| | | | | | | | |
| | | | | | | 7,210,072 | |
| | | | | | | | |
|
Semiconductors & Semiconductor Equipment—1.8% | |
Advanced Micro Devices, Inc. (a) | | | 405,524 | | | | 2,084,393 | |
Cree, Inc. (a) (b) | | | 63,362 | | | | 1,548,567 | |
Cypress Semiconductor Corp. (b) | | | 196,695 | | | | 2,075,132 | |
Fairchild Semiconductor International, Inc. (a) | | | 71,658 | | | | 1,422,411 | |
Integrated Device Technology, Inc. (a) | | | 84,312 | | | | 1,697,201 | |
Intersil Corp. - Class A | | | 85,161 | | | | 1,153,080 | |
Microsemi Corp. (a) | | | 71,361 | | | | 2,332,078 | |
Silicon Laboratories, Inc. (a) | | | 24,497 | | | | 1,193,984 | |
Synaptics, Inc. (a) (b) | | | 23,245 | | | | 1,249,419 | |
Teradyne, Inc. | | | 128,189 | | | | 2,524,041 | |
| | | | | | | | |
| | | | | | | 17,280,306 | |
| | | | | | | | |
| | |
Software—4.4% | | | | | | | | |
ACI Worldwide, Inc. (a) | | | 73,577 | | | | 1,435,487 | |
ANSYS, Inc. (a) (b) | | | 55,546 | | | | 5,040,800 | |
Cadence Design Systems, Inc. (a) | | | 189,820 | | | | 4,612,626 | |
CDK Global, Inc. (b) | | | 98,004 | | | | 5,438,242 | |
CommVault Systems, Inc. (a) | | | 25,948 | | | | 1,120,694 | |
Fair Isaac Corp. | | | 19,672 | | | | 2,223,133 | |
Fortinet, Inc. (a) | | | 92,064 | | | | 2,908,302 | |
Manhattan Associates, Inc. (a) | | | 45,513 | | | | 2,918,749 | |
Mentor Graphics Corp. | | | 63,447 | | | | 1,348,883 | |
PTC, Inc. (a) | | | 72,318 | | | | 2,717,710 | |
Synopsys, Inc. (a) | | | 95,790 | | | | 5,180,323 | |
Tyler Technologies, Inc. (a) (b) | | | 20,510 | | | | 3,419,222 | |
Ultimate Software Group, Inc. (The) (a) (b) | | | 18,221 | | | | 3,831,694 | |
| | | | | | | | |
| | | | | | | 42,195,865 | |
| | | | | | | | |
| | |
Specialty Retail—2.0% | | | | | | | | |
Aaron’s, Inc. | | | 40,850 | | | | 894,207 | |
Abercrombie & Fitch Co. - Class A | | | 42,645 | | | | 759,508 | |
American Eagle Outfitters, Inc. | | | 104,999 | | | | 1,672,634 | |
Ascena Retail Group, Inc. (a) (b) | | | 107,779 | | | | 753,375 | |
Cabela’s, Inc. (a) | | | 30,581 | | | | 1,530,885 | |
Chico’s FAS, Inc. | | | 83,665 | | | | 896,052 | |
CST Brands, Inc. | | | 47,754 | | | | 2,057,242 | |
Dick’s Sporting Goods, Inc. (b) | | | 56,257 | | | | 2,534,940 | |
GameStop Corp. - Class A (b) | | | 65,584 | | | | 1,743,223 | |
Guess?, Inc. (b) | | | 40,429 | | | | 608,457 | |
Murphy USA, Inc. (a) | | | 23,365 | | | | 1,732,748 | |
Office Depot, Inc. (a) | | | 312,369 | | | | 1,033,941 | |
Restoration Hardware Holdings, Inc. (a) (b) | | | 23,825 | | | | 683,301 | |
Williams-Sonoma, Inc. (b) | | | 51,863 | | | | 2,703,618 | |
| | | | | | | | |
| | | | | | | 19,604,131 | |
| | | | | | | | |
|
Technology Hardware, Storage & Peripherals—0.6% | |
3D Systems Corp. (a) (b) | | | 67,156 | | | | 919,366 | |
Diebold, Inc. (b) | | | 41,102 | | | | 1,020,563 | |
Lexmark International, Inc. - Class A | | | 39,522 | | | | 1,491,955 | |
NCR Corp. (a) | | | 78,171 | | | | 2,170,809 | |
| | | | | | | | |
| | | | | | | 5,602,693 | |
| | | | | | | | |
|
Textiles, Apparel & Luxury Goods—1.0% | |
Carter’s, Inc. | | | 32,033 | | | | 3,410,553 | |
See accompanying notes to financial statements.
MSF-8
Metropolitan Series Fund
MetLife Mid Cap Stock Index Portfolio
Schedule of Investments as of June 30, 2016 (Unaudited)
Common Stocks—(Continued)
| | | | | | | | |
| Security Description | | Shares/
Principal
Amount* | | | Value | |
|
Textiles, Apparel & Luxury Goods—(Continued) | |
Deckers Outdoor Corp. (a) | | | 20,204 | | | $ | 1,162,134 | |
Fossil Group, Inc. (a) (b) | | | 26,104 | | | | 744,747 | |
Kate Spade & Co. (a) | | | 80,744 | | | | 1,664,134 | |
Skechers USA, Inc. - Class A (a) | | | 83,851 | | | | 2,492,052 | |
| | | | | | | | |
| | | | | | | 9,473,620 | |
| | | | | | | | |
|
Thrifts & Mortgage Finance—0.6% | |
New York Community Bancorp, Inc. | | | 307,268 | | | | 4,605,947 | |
Washington Federal, Inc. | | | 57,457 | | | | 1,393,907 | |
| | | | | | | | |
| | | | | | | 5,999,854 | |
| | | | | | | | |
|
Trading Companies & Distributors—0.7% | |
GATX Corp. (b) | | | 25,804 | | | | 1,134,602 | |
MSC Industrial Direct Co., Inc. - Class A | | | 30,335 | | | | 2,140,438 | |
NOW, Inc. (a) (b) | | | 67,777 | | | | 1,229,475 | |
Watsco, Inc. | | | 16,273 | | | | 2,289,448 | |
| | | | | | | | |
| | | | | | | 6,793,963 | |
| | | | | | | | |
| | |
Water Utilities—0.4% | | | | | | | | |
Aqua America, Inc. (b) | | | 111,844 | | | | 3,988,357 | |
| | | | | | | | |
|
Wireless Telecommunication Services—0.2% | |
Telephone & Data Systems, Inc. | | | 59,745 | | | | 1,772,037 | |
| | | | | | | | |
Total Common Stocks
(Cost $727,525,260) | | | | | | | 924,317,546 | |
| | | | | | | | |
|
| Mutual Fund—2.5% | |
|
Investment Company Security—2.5% | |
SPDR S&P MidCap 400 ETF Trust
(Cost $23,553,724) | | | 87,100 | | | | 23,724,298 | |
| | | | | | | | |
|
| Short-Term Investments—15.0% | |
| | |
Discount Notes—2.0% | | | | | | | | |
Fannie Mae
0.384%, 07/19/16 (d) | | | 4,800,000 | | | | 4,799,040 | |
Federal Home Loan Bank
0.232%, 07/21/16 (d) | | | 450,000 | | | | 449,940 | |
0.264%, 07/14/16 (d) | | | 400,000 | | | | 399,960 | |
0.328%, 07/20/16 (d) | | | 225,000 | | | | 224,960 | |
0.350%, 08/05/16 (d) | | | 9,700,000 | | | | 9,696,652 | |
0.392%, 10/07/16 (d) | | | 250,000 | | | | 249,735 | |
|
Discount Notes—(Continued) | |
Federal Home Loan Bank
0.401%, 09/14/16 (d) | | | 800,000 | | | $ | 799,333 | |
0.436%, 07/22/16 (d) | | | 2,475,000 | | | | 2,474,350 | |
0.477%, 08/19/16 (d) | | | 425,000 | | | | 424,722 | |
| | | | | | | | |
| | | | | | | 19,518,692 | |
| | | | | | | | |
| | |
Mutual Fund—12.9% | | | | | | | | |
State Street Navigator Securities Lending MET Portfolio (e) | | | 125,092,248 | | | | 125,092,248 | |
| | | | | | | | |
| | |
U.S. Treasury—0.1% | | | | | | | | |
U.S. Treasury Bill
0.241%, 09/29/16 (d) | | | 1,225,000 | | | | 1,224,265 | |
| | | | | | | | |
Total Short-Term Investments
(Cost $145,835,205) | | | | | | | 145,835,205 | |
| | | | | | | | |
Total Investments—112.8%
(Cost $896,914,189) (f) | | | | | | | 1,093,877,049 | |
Other assets and liabilities (net)—(12.8)% | | | | | | | (124,129,966 | ) |
| | | | | | | | |
| Net Assets—100.0% | | | | | | $ | 969,747,083 | |
| | | | | | | | |
| * | Principal amount stated in U.S. dollars unless otherwise noted. |
| (a) | Non-income producing security. |
| (b) | All or a portion of the security was held on loan. As of June 30, 2016, the market value of securities loaned was $155,520,719 and the collateral received consisted of cash in the amount of $125,092,248 and non-cash collateral with a value of $31,402,463. The cash collateral is invested in a money market fund managed by an affiliate of the custodian. The non-cash collateral received consists primarily of government securities and bank letters of credit, and is held for the benefit of the Portfolio at the Portfolio’s custodian. The Portfolio cannot repledge or resell this collateral. As such, this collateral is excluded from the Statement of Assets and Liabilities. |
| (c) | All or a portion of the security was pledged as collateral against open futures contracts. As of June 30, 2016, the market value of securities pledged was $2,435,250. |
| (d) | The rate shown represents current yield to maturity. |
| (e) | Represents investment of cash collateral received from securities on loan as of June 30, 2016. |
| (f) | As of June 30, 2016, the aggregate cost of investments was $896,914,189. The aggregate unrealized appreciation and depreciation of investments were $259,029,364 and $(62,066,504), respectively, resulting in net unrealized appreciation of $196,962,860. |
| (ETF)— | Exchange-Traded Fund |
Futures Contracts
| | | | | | | | | | | | | | | | | | | | |
Futures Contracts—Long | | Expiration
Date | | | Number of
Contracts | | | Notional
Amount | | | Unrealized
Depreciation | |
S&P Midcap 400 E-Mini Index Futures | | | 09/16/16 | | | | 142 | | | | USD | | | | 21,522,683 | | | $ | (322,083 | ) |
| | | | | | | | | | | | | | | | | | | | |
| (USD)— | United States Dollar |
See accompanying notes to financial statements.
MSF-9
Metropolitan Series Fund
MetLife Mid Cap Stock Index Portfolio
Schedule of Investments as of June 30, 2016 (Unaudited)
Fair Value Hierarchy
Accounting principles generally accepted in the United States of America (“GAAP”) define fair market value as the price that the Portfolio would receive to sell an asset or pay to transfer a liability in an orderly transaction between market participants at the measurement date. It establishes a fair value hierarchy that prioritizes inputs to valuation methods and requires disclosure of the fair value hierarchy, separately for each major category of assets and liabilities, that segregates fair value measurements into three levels. Levels 1, 2 and 3 of the fair value hierarchy are defined as follows:
Level 1 - unadjusted quoted prices in active markets for identical investments
Level 2 - other significant observable inputs (including, but not limited to, quoted prices for similar assets or liabilities in markets that are either active or inactive; inputs other than quoted prices that are observable such as interest rates, yield curves, volatilities, prepayment speeds, loss severities, credit risks, default rates, or other market corroborated inputs)
Level 3 - significant unobservable inputs based on the best information available in the circumstances, to the extent observable inputs are unavailable (including the Portfolio’s own assumptions used in determining the fair value of investments and derivative financial instruments)
The inputs or methodologies used for valuing investments are not necessarily an indication of the risk associated with investing in them. Changes to the inputs or methodologies used may result in transfers between levels, which will be recognized as of the beginning of the reporting period. Information on transfers between Level 1 and Level 2, if any, will be disclosed following the fair value hierarchy table below. A reconciliation of Level 3 securities, if any, will also be disclosed following the fair value hierarchy table. For more information about the Portfolio’s policy regarding the valuation of investments, please refer to the Notes to Financial Statements.
The following table summarizes the fair value hierarchy of the Portfolio’s investments as of June 30, 2016:
| | | | | | | | | | | | | | | | |
| Description | | Level 1 | | | Level 2 | | | Level 3 | | | Total | |
Total Common Stocks* | | $ | 924,317,546 | | | $ | — | | | $ | — | | | $ | 924,317,546 | |
Total Mutual Fund* | | | 23,724,298 | | | | — | | | | — | | | | 23,724,298 | |
| Short-Term Investments | | | | | | | | | | | | | | | | |
Discount Notes | | | — | | | | 19,518,692 | | | | — | | | | 19,518,692 | |
Mutual Fund | | | 125,092,248 | | | | — | | | | — | | | | 125,092,248 | |
U.S. Treasury | | | — | | | | 1,224,265 | | | | — | | | | 1,224,265 | |
Total Short-Term Investments | | | 125,092,248 | | | | 20,742,957 | | | | — | | | | 145,835,205 | |
Total Investments | | $ | 1,073,134,092 | | | $ | 20,742,957 | | | $ | — | | | $ | 1,093,877,049 | |
| | | | | | | | | | | | | | | | | |
Collateral for Securities Loaned (Liability) | | $ | — | | | $ | (125,092,248 | ) | | $ | — | | | $ | (125,092,248 | ) |
| Futures Contracts | | | | | | | | | | | | | | | | |
Futures Contracts (Unrealized Depreciation) | | $ | (322,083 | ) | | $ | — | | | $ | — | | | $ | (322,083 | ) |
| * | See Schedule of Investments for additional detailed categorizations. |
See accompanying notes to financial statements.
MSF-10
Metropolitan Series Fund
MetLife Mid Cap Stock Index Portfolio
Statement of Assets and Liabilities
June 30, 2016 (Unaudited)
| | | | |
Assets | | | | |
Investments at value (a) (b) | | $ | 1,093,877,049 | |
Cash | | | 2,758 | |
Receivable for: | | | | |
Investments sold | | | 11,976,013 | |
Fund shares sold | | | 253,696 | |
Dividends | | | 1,024,801 | |
Variation margin on futures contracts | | | 404,700 | |
Prepaid expenses | | | 6,149 | |
| | | | |
Total Assets | | | 1,107,545,166 | |
Liabilities | | | | |
Collateral for securities loaned | | | 125,092,248 | |
Payables for: | | | | |
Investments purchased | | | 11,225,690 | |
Fund shares redeemed | | | 873,604 | |
Accrued Expenses: | | | | |
Management fees | | | 195,897 | |
Distribution and service fees | | | 110,214 | |
Deferred trustees’ fees | | | 77,020 | |
Other expenses | | | 223,410 | |
| | | | |
Total Liabilities | | | 137,798,083 | |
| | | | |
Net Assets | | $ | 969,747,083 | |
| | | | |
Net Assets Consist of: | | | | |
Paid in surplus | | $ | 715,209,645 | |
Undistributed net investment income | | | 6,219,311 | |
Accumulated net realized gain | | | 51,677,350 | |
Unrealized appreciation on investments and futures contracts | | | 196,640,777 | |
| | | | |
Net Assets | | $ | 969,747,083 | |
| | | | |
Net Assets | | | | |
Class A | | $ | 436,531,984 | |
Class B | | | 386,390,038 | |
Class E | | | 37,443,995 | |
Class G | | | 109,381,066 | |
Capital Shares Outstanding* | | | | |
Class A | | | 25,822,002 | |
Class B | | | 23,148,120 | |
Class E | | | 2,230,219 | |
Class G | | | 6,590,121 | |
Net Asset Value, Offering Price and Redemption Price Per Share | | | | |
Class A | | $ | 16.91 | |
Class B | | | 16.69 | |
Class E | | | 16.79 | |
Class G | | | 16.60 | |
| * | The Portfolio is authorized to issue an unlimited number of shares. |
| (a) | Identified cost of investments was $896,914,189. |
| (b) | Includes securities loaned at value of $155,520,719. |
Statement of Operations
Six Months Ended June 30, 2016 (Unaudited)
| | | | |
Investment Income | | | | |
Dividends | | $ | 7,783,470 | |
Interest | | | 34,146 | |
Securities lending income | | | 323,842 | |
| | | | |
Total investment income | | | 8,141,458 | |
Expenses | | | | |
Management fees | | | 1,151,372 | |
Administration fees | | | 11,777 | |
Custodian and accounting fees | | | 57,208 | |
Distribution and service fees—Class B | | | 461,708 | |
Distribution and service fees—Class E | | | 26,786 | |
Distribution and service fees—Class G | | | 155,139 | |
Audit and tax services | | | 20,230 | |
Legal | | | 13,588 | |
Trustees’ fees and expenses | | | 15,990 | |
Shareholder reporting | | | 82,967 | |
Insurance | | | 3,093 | |
Miscellaneous | | | 18,315 | |
| | | | |
Total expenses | | | 2,018,173 | |
Less management fee waiver | | | (10,596 | ) |
| | | | |
Net expenses | | | 2,007,577 | |
| | | | |
Net Investment Income | | | 6,133,881 | |
| | | | |
Net Realized and Unrealized Gain | | | | |
| Net realized gain on: | | | | |
Investments | | | 54,044,650 | |
Futures contracts | | | 1,698,176 | |
| | | | |
Net realized gain | | | 55,742,826 | |
| | | | |
| Net change in unrealized appreciation (depreciation) on: | | | | |
Investments | | | 9,762,554 | |
Futures contracts | | | (149,296 | ) |
| | | | |
Net change in unrealized appreciation | | | 9,613,258 | |
| | | | |
Net realized and unrealized gain | | | 65,356,084 | |
| | | | |
Net Increase in Net Assets From Operations | | $ | 71,489,965 | |
| | | | |
See accompanying notes to financial statements.
MSF-11
Metropolitan Series Fund
MetLife Mid Cap Stock Index Portfolio
Statements of Changes in Net Assets
| | | | | | | | |
| | | Six Months
Ended
June 30,
2016
(Unaudited) | | | Year Ended
December 31,
2015 | |
Increase (Decrease) in Net Assets: | | | | | | | | |
From Operations | | | | | | | | |
Net investment income | | $ | 6,133,881 | | | $ | 11,066,217 | |
Net realized gain | | | 55,742,826 | | | | 75,095,053 | |
Net change in unrealized appreciation (depreciation) | | | 9,613,258 | | | | (109,787,489 | ) |
| | | | | | | | |
Increase (decrease) in net assets from operations | | | 71,489,965 | | | | (23,626,219 | ) |
| | | | | | | | |
From Distributions to Shareholders | | | | | | | | |
Net investment income | | | | | | | | |
Class A | | | (5,545,745 | ) | | | (4,767,959 | ) |
Class B | | | (3,993,247 | ) | | | (3,691,076 | ) |
Class E | | | (419,718 | ) | | | (405,629 | ) |
Class G | | | (1,094,410 | ) | | | (949,660 | ) |
Net realized capital gains | | | | | | | | |
Class A | | | (33,298,068 | ) | | | (25,916,508 | ) |
Class B | | | (29,970,595 | ) | | | (25,360,594 | ) |
Class E | | | (2,888,891 | ) | | | (2,557,138 | ) |
Class G | | | (8,484,683 | ) | | | (6,872,392 | ) |
| | | | | | | | |
Total distributions | | | (85,695,357 | ) | | | (70,520,956 | ) |
| | | | | | | | |
Increase in net assets from capital share transactions | | | 57,056,342 | | | | 69,824,634 | |
| | | | | | | | |
Total increase (decrease) in net assets | | | 42,850,950 | | | | (24,322,541 | ) |
| | |
Net Assets | | | | | | | | |
Beginning of period | | | 926,896,133 | | | | 951,218,674 | |
| | | | | | | | |
End of period | | $ | 969,747,083 | | | $ | 926,896,133 | |
| | | | | | | | |
| | |
Undistributed net investment income | | | | | | | | |
End of period | | $ | 6,219,311 | | | $ | 11,138,550 | |
| | | | | | | | |
Other Information:
Capital Shares
Transactions in capital shares were as follows:
| | | | | | | | | | | | | | | | |
| | | Six Months Ended
June 30, 2016
(Unaudited) | | | Year Ended
December 31, 2015 | |
| | | Shares | | | Value | | | Shares | | | Value | |
Class A | | | | | | | | | | | | | | | | |
Sales | | | 1,131,226 | | | $ | 18,816,363 | | | | 3,506,531 | | | $ | 64,641,146 | |
Reinvestments | | | 2,324,585 | | | | 38,843,813 | | | | 1,639,127 | | | | 30,684,467 | |
Redemptions | | | (1,521,809 | ) | | | (26,392,087 | ) | | | (2,274,800 | ) | | | (42,411,572 | ) |
| | | | | | | | | | | | | | | | |
Net increase | | | 1,934,002 | | | $ | 31,268,089 | | | | 2,870,858 | | | $ | 52,914,041 | |
| | | | | | | | | | | | | | | | |
Class B | | | | | | | | | | | | | | | | |
Sales | | | 515,528 | | | $ | 8,513,639 | | | | 1,208,962 | | | $ | 21,967,391 | |
Reinvestments | | | 2,058,415 | | | | 33,963,842 | | | | 1,569,513 | | | | 29,051,670 | |
Redemptions | | | (1,460,905 | ) | | | (25,059,545 | ) | | | (2,246,139 | ) | | | (41,819,610 | ) |
| | | | | | | | | | | | | | | | |
Net increase | | | 1,113,038 | | | $ | 17,417,936 | | | | 532,336 | | | $ | 9,199,451 | |
| | | | | | | | | | | | | | | | |
Class E | | | | | | | | | | | | | | | | |
Sales | | | 39,630 | | | $ | 674,184 | | | | 76,495 | | | $ | 1,400,972 | |
Reinvestments | | | 199,314 | | | | 3,308,609 | | | | 159,288 | | | | 2,962,767 | |
Redemptions | | | (153,556 | ) | | | (2,615,471 | ) | | | (336,558 | ) | | | (6,301,631 | ) |
| | | | | | | | | | | | | | | | |
Net increase (decrease) | | | 85,388 | | | $ | 1,367,322 | | | | (100,775 | ) | | $ | (1,937,892 | ) |
| | | | | | | | | | | | | | | | |
Class G | | | | | | | | | | | | | | | | |
Sales | | | 513,601 | | | $ | 8,583,523 | | | | 1,164,834 | | | $ | 21,323,849 | |
Reinvestments | | | 583,735 | | | | 9,579,093 | | | | 424,881 | | | | 7,822,052 | |
Redemptions | | | (655,400 | ) | | | (11,159,621 | ) | | | (1,066,078 | ) | | | (19,496,867 | ) |
| | | | | | | | | | | | | | | | |
Net increase | | | 441,936 | | | $ | 7,002,995 | | | | 523,637 | | | $ | 9,649,034 | |
| | | | | | | | | | | | | | | | |
Increase derived from capital shares transactions | | | | | | $ | 57,056,342 | | | | | | | $ | 69,824,634 | |
| | | | | | | | | | | | | | | | |
See accompanying notes to financial statements.
MSF-12
Metropolitan Series Fund
MetLife Mid Cap Stock Index Portfolio
Financial Highlights
| | | | | | | | | | | | | | | | | | | | | | | | |
| Selected per share data | | | |
| | | Class A | |
| | | Six Months
Ended
June 30,
2016
(Unaudited) | | | Year Ended December 31, | |
| | | | 2015 | | | 2014 | | | 2013 | | | 2012 | | | 2011 | |
Net Asset Value, Beginning of Period | | $ | 17.23 | | | $ | 19.01 | | | $ | 18.45 | | | $ | 14.47 | | | $ | 12.97 | | | $ | 13.88 | |
| | | | | | | | | | | | | | | | | | | | | | | | |
Income (Loss) from Investment Operations | | | | | | | | | | | | | | | | | | | | | | | | |
Net investment income (a) | | | 0.13 | | | | 0.24 | | | | 0.24 | | | | 0.18 | | | | 0.19 | | | | 0.14 | |
Net realized and unrealized gain (loss) on investments | | | 1.20 | | | | (0.57 | ) | | | 1.41 | | | | 4.46 | | | | 2.05 | | | | (0.34 | ) |
| | | | | | | | | | | | | | | | | | | | | | | | |
Total from investment operations | | | 1.33 | | | | (0.33 | ) | | | 1.65 | | | | 4.64 | | | | 2.24 | | | | (0.20 | ) |
| | | | | | | | | | | | | | | | | | | | | | | | |
Less Distributions | | | | | | | | | | | | | | | | | | | | | | | | |
Distributions from net investment income | | | (0.24 | ) | | | (0.23 | ) | | | (0.20 | ) | | | (0.19 | ) | | | (0.14 | ) | | | (0.13 | ) |
Distributions from net realized capital gains | | | (1.41 | ) | | | (1.22 | ) | | | (0.89 | ) | | | (0.47 | ) | | | (0.60 | ) | | | (0.58 | ) |
| | | | | | | | | | | | | | | | | | | | | | | | |
Total distributions | | | (1.65 | ) | | | (1.45 | ) | | | (1.09 | ) | | | (0.66 | ) | | | (0.74 | ) | | | (0.71 | ) |
| | | | | | | | | | | | | | | | | | | | | | | | |
Net Asset Value, End of Period | | $ | 16.91 | | | $ | 17.23 | | | $ | 19.01 | | | $ | 18.45 | | | $ | 14.47 | | | $ | 12.97 | |
| | | | | | | | | | | | | | | | | | | | | | | | |
Total Return (%) (b) | | | 7.81 | (c) | | | (2.35 | ) | | | 9.49 | | | | 33.15 | | | | 17.60 | | | | (1.89 | ) |
| | | | | | |
Ratios/Supplemental Data | | | | | | | | | | | | | | | | | | | | | | | | |
Gross ratio of expenses to average net assets (%) | | | 0.30 | (d) | | | 0.30 | | | | 0.30 | | | | 0.30 | | | | 0.32 | | | | 0.30 | |
Net ratio of expenses to average net assets (%) (e) | | | 0.30 | (d) | | | 0.29 | | | | 0.30 | | | | 0.30 | | | | 0.31 | | | | 0.30 | |
Ratio of net investment income to average net assets (%) | | | 1.47 | (d) | | | 1.30 | | | | 1.33 | | | | 1.09 | | | | 1.40 | | | | 1.03 | |
Portfolio turnover rate (%) | | | 20 | (c) | | | 25 | | | | 17 | | | | 16 | | | | 11 | | | | 24 | |
Net assets, end of period (in millions) | | $ | 436.5 | | | $ | 411.5 | | | $ | 399.6 | | | $ | 370.0 | | | $ | 260.2 | | | $ | 236.6 | |
| |
| | | Class B | |
| | | Six Months
Ended
June 30,
2016
(Unaudited) | | | Year Ended December 31, | |
| | | | 2015 | | | 2014 | | | 2013 | | | 2012 | | | 2011 | |
Net Asset Value, Beginning of Period | | $ | 17.01 | | | $ | 18.79 | | | $ | 18.25 | | | $ | 14.32 | | | $ | 12.84 | | | $ | 13.75 | |
| | | | | | | | | | | | | | | | | | | | | | | | |
Income (Loss) from Investment Operations | | | | | | | | | | | | | | | | | | | | | | | | |
Net investment income (a) | | | 0.10 | | | | 0.19 | | | | 0.19 | | | | 0.14 | | | | 0.16 | | | | 0.11 | |
Net realized and unrealized gain (loss) on investments | | | 1.18 | | | | (0.57 | ) | | | 1.39 | | | | 4.42 | | | | 2.03 | | | | (0.34 | ) |
| | | | | | | | | | | | | | | | | | | | | | | | |
Total from investment operations | | | 1.28 | | | | (0.38 | ) | | | 1.58 | | | | 4.56 | | | | 2.19 | | | | (0.23 | ) |
| | | | | | | | | | | | | | | | | | | | | | | | |
Less Distributions | | | | | | | | | | | | | | | | | | | | | | | | |
Distributions from net investment income | | | (0.19 | ) | | | (0.18 | ) | | | (0.15 | ) | | | (0.16 | ) | | | (0.11 | ) | | | (0.10 | ) |
Distributions from net realized capital gains | | | (1.41 | ) | | | (1.22 | ) | | | (0.89 | ) | | | (0.47 | ) | | | (0.60 | ) | | | (0.58 | ) |
| | | | | | | | | | | | | | | | | | | | | | | | |
Total distributions | | | (1.60 | ) | | | (1.40 | ) | | | (1.04 | ) | | | (0.63 | ) | | | (0.71 | ) | | | (0.68 | ) |
| | | | | | | | | | | | | | | | | | | | | | | | |
Net Asset Value, End of Period | | $ | 16.69 | | | $ | 17.01 | | | $ | 18.79 | | | $ | 18.25 | | | $ | 14.32 | | | $ | 12.84 | |
| | | | | | | | | | | | | | | | | | | | | | | | |
Total Return (%) (b) | | | 7.63 | (c) | | | (2.62 | ) | | | 9.23 | | | | 32.83 | | | | 17.33 | | | | (2.19 | ) |
| | | | | | |
Ratios/Supplemental Data | | | | | | | | | | | | | | | | | | | | | | | | |
Gross ratio of expenses to average net assets (%) | | | 0.55 | (d) | | | 0.55 | | | | 0.55 | | | | 0.55 | | | | 0.57 | | | | 0.55 | |
Net ratio of expenses to average net assets (%) (e) | | | 0.55 | (d) | | | 0.54 | | | | 0.55 | | | | 0.55 | | | | 0.56 | | | | 0.55 | |
Ratio of net investment income to average net assets (%) | | | 1.22 | (d) | | | 1.04 | | | | 1.08 | | | | 0.83 | | | | 1.16 | | | | 0.79 | |
Portfolio turnover rate (%) | | | 20 | (c) | | | 25 | | | | 17 | | | | 16 | | | | 11 | | | | 24 | |
Net assets, end of period (in millions) | | $ | 386.4 | | | $ | 374.7 | | | $ | 404.0 | | | $ | 388.4 | | | $ | 311.6 | | | $ | 275.5 | |
Please see following page for Financial Highlights footnote legend.
See accompanying notes to financial statements.
MSF-13
Metropolitan Series Fund
MetLife Mid Cap Stock Index Portfolio
Financial Highlights
| | | | | | | | | | | | | | | | | | | | | | | | |
| Selected per share data | | | |
| | | Class E | |
| | | Six Months
Ended
June 30,
2016
(Unaudited) | | | Year Ended December 31, | |
| | | | 2015 | | | 2014 | | | 2013 | | | 2012 | | | 2011 | |
Net Asset Value, Beginning of Period | | $ | 17.10 | | | $ | 18.89 | | | $ | 18.33 | | | $ | 14.38 | | | $ | 12.89 | | | $ | 13.80 | |
| | | | | | | | | | | | | | | | | | | | | | | | |
Income (Loss) from Investment Operations | | | | | | | | | | | | | | | | | | | | | | | | |
Net investment income (a) | | | 0.11 | | | | 0.21 | | | | 0.21 | | | | 0.15 | | | | 0.17 | | | | 0.12 | |
Net realized and unrealized gain (loss) on investments | | | 1.20 | | | | (0.59 | ) | | | 1.41 | | | | 4.44 | | | | 2.04 | | | | (0.34 | ) |
| | | | | | | | | | | | | | | | | | | | | | | | |
Total from investment operations | | | 1.31 | | | | (0.38 | ) | | | 1.62 | | | | 4.59 | | | | 2.21 | | | | (0.22 | ) |
| | | | | | | | | | | | | | | | | | | | | | | | |
Less Distributions | | | | | | | | | | | | | | | | | | | | | | | | |
Distributions from net investment income | | | (0.21 | ) | | | (0.19 | ) | | | (0.17 | ) | | | (0.17 | ) | | | (0.12 | ) | | | (0.11 | ) |
Distributions from net realized capital gains | | | (1.41 | ) | | | (1.22 | ) | | | (0.89 | ) | | | (0.47 | ) | | | (0.60 | ) | | | (0.58 | ) |
| | | | | | | | | | | | | | | | | | | | | | | | |
Total distributions | | | (1.62 | ) | | | (1.41 | ) | | | (1.06 | ) | | | (0.64 | ) | | | (0.72 | ) | | | (0.69 | ) |
| | | | | | | | | | | | | | | | | | | | | | | | |
Net Asset Value, End of Period | | $ | 16.79 | | | $ | 17.10 | | | $ | 18.89 | | | $ | 18.33 | | | $ | 14.38 | | | $ | 12.89 | |
| | | | | | | | | | | | | | | | | | | | | | | | |
Total Return (%) (b) | | | 7.75 | (c) | | | (2.58 | ) | | | 9.39 | | | | 32.95 | | | | 17.46 | | | | (2.10 | ) |
| | | | | | |
Ratios/Supplemental Data | | | | | | | | | | | | | | | | | | | | | | | | |
Gross ratio of expenses to average net assets (%) | | | 0.45 | (d) | | | 0.45 | | | | 0.45 | | | | 0.45 | | | | 0.47 | | | | 0.45 | |
Net ratio of expenses to average net assets (%) (e) | | | 0.45 | (d) | | | 0.44 | | | | 0.45 | | | | 0.45 | | | | 0.46 | | | | 0.45 | |
Ratio of net investment income to average net assets (%) | | | 1.32 | (d) | | | 1.13 | | | | 1.17 | | | | 0.93 | | | | 1.24 | | | | 0.87 | |
Portfolio turnover rate (%) | | | 20 | (c) | | | 25 | | | | 17 | | | | 16 | | | | 11 | | | | 24 | |
Net assets, end of period (in millions) | | $ | 37.4 | | | $ | 36.7 | | | $ | 42.4 | | | $ | 45.0 | | | $ | 37.6 | | | $ | 37.1 | |
| |
| | | Class G | |
| | | Six Months
Ended
June 30,
2016
(Unaudited) | | | Year Ended December 31, | |
| | | | 2015 | | | 2014 | | | 2013 | | | 2012 | | | 2011 | |
Net Asset Value, Beginning of Period | | $ | 16.92 | | | $ | 18.70 | | | $ | 18.16 | | | $ | 14.26 | | | $ | 12.79 | | | $ | 13.70 | |
| | | | | | | | | | | | | | | | | | | | | | | | |
Income (Loss) from Investment Operations | | | | | | | | | | | | | | | | | | | | | | | | |
Net investment income (a) | | | 0.10 | | | | 0.18 | | | | 0.18 | | | | 0.13 | | | | 0.15 | | | | 0.10 | |
Net realized and unrealized gain (loss) on investments | | | 1.17 | | | | (0.57 | ) | | | 1.39 | | | | 4.40 | | | | 2.02 | | | | (0.33 | ) |
| | | | | | | | | | | | | | | | | | | | | | | | |
Total from investment operations | | | 1.27 | | | | (0.39 | ) | | | 1.57 | | | | 4.53 | | | | 2.17 | | | | (0.23 | ) |
| | | | | | | | | | | | | | | | | | | | | | | | |
Less Distributions | | | | | | | | | | | | | | | | | | | | | | | | |
Distributions from net investment income | | | (0.18 | ) | | | (0.17 | ) | | | (0.14 | ) | | | (0.16 | ) | | | (0.10 | ) | | | (0.10 | ) |
Distributions from net realized capital gains | | | (1.41 | ) | | | (1.22 | ) | | | (0.89 | ) | | | (0.47 | ) | | | (0.60 | ) | | | (0.58 | ) |
| | | | | | | | | | | | | | | | | | | | | | | | |
Total distributions | | | (1.59 | ) | | | (1.39 | ) | | | (1.03 | ) | | | (0.63 | ) | | | (0.70 | ) | | | (0.68 | ) |
| | | | | | | | | | | | | | | | | | | | | | | | |
Net Asset Value, End of Period | | $ | 16.60 | | | $ | 16.92 | | | $ | 18.70 | | | $ | 18.16 | | | $ | 14.26 | | | $ | 12.79 | |
| | | | | | | | | | | | | | | | | | | | | | | | |
Total Return (%) (b) | | | 7.63 | (c) | | | (2.68 | ) | | | 9.21 | | | | 32.75 | | | | 17.27 | | | | (2.24 | ) |
| | | | | | |
Ratios/Supplemental Data | | | | | | | | | | | | | | | | | | | | | | | | |
Gross ratio of expenses to average net assets (%) | | | 0.60 | (d) | | | 0.60 | | | | 0.60 | | | | 0.60 | | | | 0.62 | | | | 0.60 | |
Net ratio of expenses to average net assets (%) (e) | | | 0.60 | (d) | | | 0.59 | | | | 0.60 | | | | 0.60 | | | | 0.61 | | | | 0.60 | |
Ratio of net investment income to average net assets (%) | | | 1.17 | (d) | | | 1.00 | | | | 1.02 | | | | 0.79 | | | | 1.10 | | | | 0.76 | |
Portfolio turnover rate (%) | | | 20 | (c) | | | 25 | | | | 17 | | | | 16 | | | | 11 | | | | 24 | |
Net assets, end of period (in millions) | | $ | 109.4 | | | $ | 104.0 | | | $ | 105.2 | | | $ | 103.3 | | | $ | 71.4 | | | $ | 62.7 | |
| (a) | Per share amounts based on average shares outstanding during the period. |
| (b) | Total return does not reflect any insurance, sales, separate account or administrative charges of variable annuity or life insurance contracts or any additional expenses that contract owners may bear under their variable contracts. If these charges were included, the returns would be lower. |
| (c) | Periods less than one year are not computed on an annualized basis. |
| (d) | Computed on an annualized basis. |
| (e) | Includes the effects of management fee waivers (see Note 6 of the Notes to Financial Statements). |
See accompanying notes to financial statements.
MSF-14
Metropolitan Series Fund
MetLife Mid Cap Stock Index Portfolio
Notes to Financial Statements—June 30, 2016 (Unaudited)
1. Organization
Metropolitan Series Fund (the “Trust”) is organized as a Delaware statutory trust and registered under the Investment Company Act of 1940, as amended (the “1940 Act”), as an open-end management investment company. The Trust, which is managed by MetLife Advisers, LLC (“MetLife Advisers” or the “Adviser”), an affiliate of MetLife, Inc., is currently comprised of thirty series, each of which operates as a distinct investment vehicle of the Trust. The portfolio included in this report is MetLife Mid Cap Stock Index Portfolio (the “Portfolio”), which is diversified. Shares in the Portfolio are not offered directly to the general public and are currently available only to separate accounts established by Metropolitan Life Insurance Company (“MetLife”) and other affiliated life insurance companies.
The Portfolio has registered and offers four classes of shares: Class A, B, E and G shares. Shares of each Class of the Portfolio represent an equal pro rata interest in the Portfolio and generally give the shareholder the same voting, dividend, liquidation, and other rights. Investment income, realized and unrealized capital gains and losses, the common expenses of the Portfolio, and certain Portfolio-level expense reductions, if any, are allocated on a pro rata basis to each Class based on the relative net assets of each Class to the net assets of the Portfolio. Each Class of shares differs in its respective distribution plan and such distribution expenses are allocated to the corresponding Class of shares.
2. Significant Accounting Policies
The preparation of financial statements in conformity with accounting principles generally accepted in the United States of America (“GAAP”) requires management to make estimates and assumptions that affect the reported amounts of assets and liabilities and disclosure of contingent assets and liabilities as of the date of the financial statements and the reported amounts of income and expenses during the reporting period. Actual results could differ from those estimates. In the preparation of these financial statements, management has evaluated events and transactions subsequent to June 30, 2016 through the date the financial statements were issued.
The Portfolio is an investment company and follows the accounting and reporting guidance of the Financial Accounting Standards Board (“FASB”) Accounting Standards Codification Topic 946—Financial Services—Investment Companies and Topic 820—Fair Value Measurement. The following is a summary of significant accounting policies consistently followed by the Portfolio in the preparation of its financial statements.
Investment Valuation and Fair Value Measurements - Domestic and foreign equity securities, such as common stock, exchange-traded funds, rights, warrants, and preferred stock, that are traded on a securities exchange on a valuation date are generally valued at their last quoted sale price or official closing price on the primary exchange for such security, or, if no sales occurred on that day, at the last reported bid price. Equity securities traded over-the-counter (“OTC”) are generally valued at the last reported bid price. In the event of a major exchange closing during the trading day, the Adviser may use other market information obtained from quotation reporting systems, established market makers, or pricing services in valuing the securities. Valuation adjustments may be applied to certain foreign equity securities that are traded solely on foreign exchanges that close before the time as of which the Portfolio determines its NAV to account for the market movement between the close of the foreign exchanges and the time as of which the Portfolio determines its NAV. The Portfolio may use a systematic fair valuation model provided by a pricing service to value securities principally traded in these foreign markets in order to adjust for possible market movements or other changes that may occur between the close of the foreign exchanges and the time as of which the Portfolio determines its NAV. Foreign equity securities valued using these valuation adjustments are generally categorized as Level 2 within the fair value hierarchy. Equity securities that are actively traded, and have no valuation adjustments applied, are categorized as Level 1 within the fair value hierarchy. Other equity securities traded on inactive markets, or valued in reference to similar instruments traded on active markets, are generally categorized as Level 2 within the fair value hierarchy.
Investments in registered open-end management investment companies are valued at reported net asset value per share on the valuation date and are categorized as Level 1 within the fair value hierarchy.
Debt securities, including corporate, convertible and municipal bonds and notes; obligations of the U.S. Treasury and U.S. government agencies; foreign sovereign issues; and non-U.S. bonds, are generally valued on the basis of evaluated or composite bid quotations obtained from independent pricing services and/or brokers and dealers selected by the Adviser (each a “pricing service”), pursuant to authorization of and subject to general oversight by the Board of Trustees of the Trust (the “Board” or “Trustees”). Such pricing services may use matrix pricing, which considers observable inputs including, among other things, issuer details, maturity dates, interest rates, yield curves, rates of prepayment, credit risks/spreads, default rates, reported trades, broker dealer quotes and quoted prices for similar assets. Short-term obligations with a remaining maturity of sixty days or less may be valued at amortized cost in the absence of market quotes, so long as the amortized cost value of such short-term debt instrument is approximately the same as the fair value of the instrument as determined without the use of amortized cost valuation. Floating rate loans are generally valued on the basis of an evaluated or composite average of aggregate bid and ask quotations supplied by brokers or dealers, as obtained from the pricing service. Securities that use similar valuation techniques and inputs as described above are generally categorized as Level 2 within the fair value hierarchy.
MSF-15
Metropolitan Series Fund
MetLife Mid Cap Stock Index Portfolio
Notes to Financial Statements—June 30, 2016—(Continued)
Options, whether on securities, indices, futures contracts, or otherwise, traded on exchanges are valued at the last sale price available as of the close of business on a valuation day or, if there is no such price available, at the last reported bid price. These types of options are categorized as Level 1 within the fair value hierarchy. Futures contracts that are traded on commodity exchanges are valued at their settlement prices established by the exchanges on which they are traded as of the close of such exchanges and are categorized as Level 1 within the fair value hierarchy.
If no current market value quotation or other observable inputs are readily available or market value quotations are deemed to be unreliable for an investment, the fair value of the investment will be determined in accordance with procedures approved by, and under the general supervision of, the Board. In such a circumstance, the Board will be assisted in its responsibility to determine the fair value of an investment by the Valuation Committee (“Committee”) of MetLife Advisers. The Committee provides general pricing oversight and fair value pricing determinations related to portfolio securities and meets on a regular basis to review reports relating to the valuation of the securities in the Portfolio. The Board has delegated to State Street Bank and Trust Company, the Trust’s custodian (“custodian”), the responsibility for calculating the net asset values (“NAVs”) of the Trust’s Portfolios. The Committee is responsible for overseeing the calculation of the NAVs of the Portfolios by the custodian. The Committee also periodically reviews pricing services, including the pricing services providing fair value pricing for the Portfolio’s foreign securities, and is responsible for overseeing the correction of pricing errors and addressing other pricing issues that arise in the ordinary course of business, such as making real-time fair value determinations, as necessary.
No single standard for determining the fair value of an investment can be set forth because fair value depends upon the facts and circumstances with respect to each investment. Information relating to any relevant factors may be obtained by the Committee from any appropriate source, including the subadviser of the Portfolio, the custodian, a pricing service, market maker and/or broker for such security or the issuer. Appropriate methodologies for determining fair value under particular circumstances may include: matrix pricing, a discounted cash flow analysis, comparisons of securities with comparable characteristics, value based on multiples of earnings, discount from market price of similar marketable securities or a combination of these and other methods.
Investment Transactions and Related Investment Income - Portfolio security transactions are recorded on the trade date. Dividend income is recorded on the ex-dividend date or, for certain foreign securities, when notified. Interest income, which includes amortization of premium and accretion of discount on debt securities, is recorded on the accrual basis. Realized gains and losses on investments are determined on the identified cost basis, which is the same basis used for federal income tax purposes. Foreign income and foreign capital gains on some foreign securities may be subject to foreign taxes, which are accrued as applicable. These foreign taxes have been provided for in accordance with the Portfolio’s understanding of the applicable countries’ tax rules and rates.
Foreign Currency Translation - The books and records of the Portfolio are maintained in U.S. dollars. The values of securities, currencies, and other assets and liabilities denominated in currencies other than the U.S. dollar are translated into U.S. dollars based upon foreign exchange rates prevailing at the end of the period. Purchases and sales of investment securities, income, and expenses are translated on the respective dates of such transactions. Because the values of investment securities are translated at the foreign exchange rates prevailing at the end of the period, that portion of the results of operations arising from changes in exchange rates and that portion of the results of operations reflecting fluctuations arising from changes in market prices of the investment securities are not separated. Such fluctuations are included in the net realized and unrealized gain or loss on investments.
Net realized foreign exchange gains or losses arise from activity in forward foreign currency exchange contracts, sales of foreign currency, currency gains or losses realized between the trade and settlement dates on securities transactions, and the difference between the amounts of dividends, interest, and foreign withholding taxes recorded by the Portfolio and the U.S. dollar equivalent of the amounts actually received or paid by the Portfolio. Net unrealized foreign exchange gains and losses arise from changes in the value of assets and liabilities, other than investment securities, resulting from changes in foreign exchange rates.
Dividends and Distributions to Shareholders - The Portfolio records dividends and distributions on the ex-dividend date. Net realized gains from securities transactions (if any) are generally distributed annually to shareholders. The timing and characterization of certain income and capital gains distributions are determined in accordance with federal tax regulations that may differ from GAAP. Permanent book and tax basis differences relating to shareholder distributions will result in reclassification between under/over distributed net investment income, accumulated net realized gains/losses, and paid-in surplus. Book-tax differences are primarily due to distribution redesignations and real estate investment trust (REIT) adjustments. These adjustments have no impact on net assets or the results of operations.
Income Taxes - It is the Portfolio’s policy to comply with the requirements of the Internal Revenue Code of 1986, as amended, and regulations thereunder, applicable to regulated investment companies and to distribute, with respect to each taxable year, all of its taxable income to shareholders. Therefore, no federal income tax provision is required. The Portfolio files U.S. federal tax returns. No income tax returns are currently under examination. The Portfolio’s federal tax returns for the prior three fiscal years remain subject to examination by the Internal Revenue Service. As of June 30, 2016, the Portfolio had no uncertain tax positions that would require financial statement recognition, or de-recognition or disclosure.
MSF-16
Metropolitan Series Fund
MetLife Mid Cap Stock Index Portfolio
Notes to Financial Statements—June 30, 2016—(Continued)
Repurchase Agreements - The Portfolio may enter into repurchase agreements, under the terms of a Master Repurchase Agreement (“MRA”), with selected commercial banks and broker-dealers, under which the Portfolio acquires securities as collateral and agrees to resell the securities at an agreed-upon time and at an agreed-upon price. The Portfolio, through the custodian or a subcustodian, under a tri-party repurchase agreement, receives delivery of the underlying securities collateralizing any repurchase agreements. It is the Portfolio’s policy that the market value of the collateral be equal to at least 100% of the repurchase price in the case of a repurchase agreement of one-day duration and equal to at least 102% of the repurchase price in the case of all other repurchase agreements. In the event of default or failure by a party to perform an obligation in connection with any repurchase transaction, the MRA gives the non-defaulting party the right to set-off claims and to apply property held by it in connection with any repurchase transaction against obligations owed to it.
Securities Lending - The Portfolio may lend its portfolio securities to certain qualified brokers who borrow securities in order to complete certain securities transactions. By lending its portfolio securities, the Portfolio attempts to increase its net investment income through the receipt of income on collateral held from securities on loan. Any gain or loss in the market price of the loaned securities that might occur and any interest earned or dividends declared during the term of the loan would accrue to the account of the Portfolio.
The Trust has entered into a Securities Lending Authorization Agreement with the custodian as the lending agent. Under this agreement, the custodian is authorized to loan portfolio securities on the Portfolio’s behalf. In exchange, the Portfolio receives either cash or securities as collateral against the loaned securities. The Portfolio receives collateral equal to at least 102% of the market value of the loaned securities (105% for foreign equity securities), at each loan’s inception. Collateral representing at least 100% of the market value of the loaned securities must be maintained for the duration of the loan. Cash collateral is generally invested in the State Street Navigator Securities Lending MET Portfolio (the “Navigator Portfolio”), a series of the State Street Navigator Securities Lending Trust that is managed by an affiliate of the custodian. The Navigator Portfolio is a registered money market fund that invests in a variety of high-quality, U.S. dollar-denominated instruments. If the market value of the collateral at the close of trading on a business day is less than 100% of the market value of the loaned securities at the close of trading on that day, the borrower shall be required to deliver, by the close of business on the following business day, an additional amount of collateral, so that the total amount of posted collateral is equal to at least 100% of the market value of all the loaned securities as of such preceding day. A portion of net income (income after the deduction of expenses and fees of the Navigator Portfolio) on the collateral is rebated to the borrower of the securities and the remainder is split between the custodian and the Portfolio. On loans collateralized by U.S. Treasuries, a fee is received from the borrower and is allocated between the Portfolio and the custodian. Income received by the Portfolio in securities lending transactions during the six months ended June 30, 2016 is reflected as Securities lending income on the Statement of Operations. The values of any securities loaned by the Portfolio and the related collateral at June 30, 2016 are disclosed in the footnotes to the Schedule of Investments. The value of the related collateral received by the Portfolio exceeded the value of the securities out on loan at June 30, 2016.
The risks associated with lending portfolio securities include, but are not limited to, possible delays in receiving additional collateral or in the recovery of the loaned securities, possible loss of rights in the collateral should the borrower fail financially, as well as risk of loss in the value of the collateral or the value of the investments made with the collateral. The lending agent shall indemnify the Portfolio in the case of default of any securities borrower.
All securities on loan are classified as Common Stocks in the Portfolio’s Schedule of Investments as of June 30, 2016, with a contractual maturity of overnight and continuous.
3. Investments in Derivative Instruments
Futures Contracts - The Portfolio may buy and sell futures contracts as a hedge, to maintain investment exposure to a target asset class or to enhance return. The Portfolio may be subject to fluctuations in equity prices, interest rates, commodity prices, and foreign currency exchange rates in the normal course of pursuing its investment objective. Futures contracts are standardized agreements to buy or sell a security, or deliver a final cash settlement price in connection with an index, interest rate, currency, or other asset. The Portfolio must deposit an amount (“initial margin”) equal to a certain percentage of the face value of the futures contract. The initial margin may be in the form of cash or securities, which is returned when the Portfolio’s obligations under the contract have been satisfied. If cash is deposited as the initial margin, it is shown as cash collateral on the Statement of Assets and Liabilities. Futures contracts are marked-to-market daily, and subsequent payments (“variation margin”) are made or received by the Portfolio depending on whether unrealized gains or losses are incurred. These amounts are reflected as receivables or payables on the Statement of Assets and Liabilities and as a component of net change in unrealized appreciation/depreciation on the Statement of Operations. When the contract is closed or expires, the Portfolio records a realized gain or loss equal to the difference between the value of the contract at the time it was opened and the value at the time it was closed. Risks of entering into futures contracts (and related options) include the possibility that the market for these instruments may be illiquid and that a change in the value of the contract or option may not correlate perfectly with changes in the value of the underlying instrument. If futures contracts are exchange-traded, the exchange’s clearinghouse, as counterparty to all exchange-traded futures, guarantees the futures contracts against default. For OTC futures, the
MSF-17
Metropolitan Series Fund
MetLife Mid Cap Stock Index Portfolio
Notes to Financial Statements—June 30, 2016—(Continued)
Portfolio’s ability to terminate the positions may be more limited than in the case of exchange-traded positions and may also involve the risk that securities dealers participating in such transactions would fail to meet their obligations to the Portfolio.
The following table summarizes the fair value of derivatives held by the Portfolio at June 30, 2016 by category of risk exposure:
| | | | | | |
| | | Liability Derivatives | |
Risk Exposure | | Statement of Assets &
Liabilities Location | | Fair Value | |
Equity | | Unrealized depreciation on futures contracts (a) | | $ | 322,083 | |
| | | | | | |
| | (a) | Includes cumulative appreciation/depreciation of futures contracts as reported in the Schedule of Investments. Only the current day’s variation margin is reported within the Statement of Assets and Liabilities. |
The following tables summarize the effect of derivative instruments on the Statement of Operations, classified by derivative type and category of risk exposure, for the six months ended June 30, 2016:
| | | | |
Statement of Operations Location—Net Realized Gain (Loss) | | Equity | |
Futures contracts | | $ | 1,698,176 | |
| | | | |
| |
Statement of Operations Location—Net Change in Unrealized Appreciation (Depreciation) | | Equity | |
Futures contracts | | $ | (149,296 | ) |
| | | | |
For the six months ended June 30, 2016, the average notional par or face amount outstanding for each derivative type was as follows:
| | | | |
Derivative Description | | Average
Notional Par or
Face Amount‡ | |
Futures contracts long | | $ | 14,200 | |
| | ‡ | Averages are based on activity levels during the period. |
4. Certain Risks
In the normal course of business, the Portfolio invests in securities and enters into transactions where risks exist due to fluctuations in the market (“market risk”) or failure of the other party to a transaction to perform (“credit and counterparty risk”).
Market Risk: The value of securities held by the Portfolio may decline in response to certain events, including those directly involving the companies whose securities are owned by the Portfolio; conditions affecting the general economy; overall market changes; local, regional or global political, social or economic instability; and currency, interest rate, and price fluctuations.
Credit and Counterparty Risk: The Portfolio may be exposed to counterparty risk, or the risk that an entity with which the Portfolio has unsettled or open transactions may default. The potential loss could exceed the value of the financial assets and liabilities recorded in the financial statements. Financial assets that potentially expose the Portfolio to credit and counterparty risk consist principally of cash due from counterparties and investments. The Portfolio manages counterparty risk by entering into agreements only with counterparties that it believes have the financial resources to honor their obligations and by monitoring the financial stability of those counterparties. The Portfolio’s investment adviser attempts to mitigate counterparty risk by (i) periodically assessing the creditworthiness of its trading partners, (ii) monitoring and/or limiting the amount of its net exposure to each individual counterparty based on its assessment, and (iii) requiring collateral from the counterparty for certain transactions. In order to preserve certain safeguards for non-standard settlement trades, the Portfolio restricts its exposure to credit and counterparty losses by entering into master netting agreements (“Master Agreements”) with counterparties (approved brokers) with whom it undertakes a significant volume of transactions. Master Agreements govern the terms of certain transactions, and reduce the counterparty risk associated with relevant transactions by specifying credit protection mechanisms and providing standardization that improves legal certainty. Master Agreements can also help limit counterparty risk by specifying collateral posting arrangements at pre-arranged exposure levels.
Repurchase and reverse repurchase agreements are primarily executed under Global Master Repurchase Agreements (“GMRAs”) or Master Repurchase Agreements (“MRAs”), which provide the rights to set-off. Each repurchase and reverse repurchase agreement is initially collateralized at the transaction level. In the event of default, the total market value exposure will be offset against collateral exchanged to date, which would result in a net receivable/(payable) that would be due from/to the counterparty.
Customer Account Agreements and related addenda govern cleared derivatives transactions such as futures, options on futures, and cleared OTC derivatives. Cleared derivative transactions require posting of initial margin as determined by each relevant clearing
MSF-18
Metropolitan Series Fund
MetLife Mid Cap Stock Index Portfolio
Notes to Financial Statements—June 30, 2016—(Continued)
agency, which is segregated at a broker account registered with the Commodities Futures Trading Commission (“CFTC”), or the applicable regulator. In the U.S., counterparty risk is significantly reduced as creditors of the futures broker do not have claim to Portfolio assets in the segregated account. Additionally, portability of exposure in the event of default further reduces risk to the Portfolio. Variation margin, or changes in market value, are exchanged daily, but may not be netted between futures and cleared OTC derivatives.
Additional risks associated with each type of investment are described above within the respective security type notes. The Portfolio’s prospectus includes a discussion of the principal risks of investing in the Portfolio.
5. Investment Transactions
Aggregate cost of purchases and proceeds of sales of investment securities, excluding short-term securities, for the six months ended June 30, 2016 were as follows:
| | | | | | | | | | | | |
Purchases | | | Sales | |
U.S. Government | | Non U.S. Government | | | U.S. Government | | | Non U.S. Government | |
| $0 | | $ | 180,644,939 | | | $ | 0 | | | $ | 196,075,718 | |
6. Investment Management Fees and Other Transactions with Affiliates
Investment Management Agreement - MetLife Advisers is the investment adviser to the Portfolio. The Trust has entered into an investment management agreement with MetLife Advisers with respect to the Portfolio. For providing investment management services to the Portfolio, MetLife Advisers receives monthly compensation at the annual rate of 0.250% of average daily net assets. Fees earned by MetLife Advisers with respect to the Portfolio for the six months ended June 30, 2016 were $1,151,372.
MetLife Advisers has entered into an investment subadvisory agreement with MetLife Investment Advisors, LLC (“MIA”) with respect to managing the Portfolio. For providing subadvisory services to the Portfolio, MetLife Advisers has agreed to pay MIA an investment subadvisory fee for each class of the Portfolio as follows:
| | |
% per annum | | Average Daily Net Assets |
| 0.030% | | On the first $500 million |
| 0.020% | | On the next $500 million |
| 0.010% | | On amounts over $1 billion |
Fees earned by MIA with respect to the Portfolio for the six months ended June 30, 2016 were $116,973.
Management Fee Waivers - Pursuant to an expense agreement, MetLife Advisers has agreed, for the period May 1, 2016 to April 30, 2017, to reduce its advisory fees set out above under “Investment Management Agreement” for each class of the Portfolio as follows:
| | |
% per annum reduction | | Average Daily Net Assets |
| 0.005% | | Over $500 million and under $1 billion |
| 0.010% | | Of the next $1 billion |
| 0.015% | | On amounts over $2 billion |
An identical expense agreement was in place for the period May 1, 2015 to April 30, 2016. Amounts waived for the six months ended June 30, 2016 are shown as management fee waivers in the Statement of Operations.
Certain officers and trustees of the Trust may also be officers of MetLife Advisers; however, such officers and trustees receive no compensation from the Trust.
On January 12, 2016, MetLife, Inc. announced its plan to pursue the separation of a substantial portion of its retail segment and is currently evaluating structural alternatives for such separation. It is anticipated that MetLife Advisers would be included in any such separation. Any separation transaction that might occur will be subject to the satisfaction of various conditions and approvals, including approval of any transaction by the MetLife, Inc. Board of Directors, satisfaction of any applicable requirements of the SEC, and receipt of insurance and other regulatory approvals and other anticipated conditions. Because the form of a separation had yet to be determined, MetLife, Inc. cannot currently provide a specific potential completion date or information about the potential impact on MetLife Advisers. No assurance can be given regarding the form that a separation transaction may take or the specific terms thereof, or that a separation will in fact occur. Depending on the form a separation takes, MetLife Advisers’ continued service as investment adviser to the Trusts could be subject to the satisfaction of various conditions and approvals, which may include obtaining approvals from the Trusts’ Board and shareholders.
MSF-19
Metropolitan Series Fund
MetLife Mid Cap Stock Index Portfolio
Notes to Financial Statements—June 30, 2016—(Continued)
Transfer Agency Agreement - MetLife serves as the transfer agent for the Trust. MetLife receives no fees for its services to the Trust under the transfer agency agreement.
Distribution and Service Fees - The Trust has a distribution agreement with MetLife Investors Distribution Company (“MIDC” or the “Distributor”) in which MIDC serves as the distributor for the Portfolio’s Class A, B, E, and G Shares. MIDC is a wholly-owned subsidiary of MetLife Investors Group, LLC, an affiliate of the Adviser. The Trust has also adopted a Distribution and Service Plan under Rule 12b-1 of the 1940 Act for the Portfolio’s Class B, E, and G Shares. Under the Distribution and Service Plan, the Class B, E, and G Shares of the Portfolio pay a fee to compensate the Insurance Companies (or their affiliates) and other broker-dealers and financial intermediaries involved in the offer and sale of Portfolio shares for promoting or selling and servicing the Class B, E, and G Shares of the Portfolio. The fees under the Distribution and Service Plan for each class of the Portfolio’s shares are calculated as a percentage of the Portfolio’s average daily net assets that are attributable to that Class. Currently, the fee is 0.25% per year for Class B Shares, 0.15% per year for Class E Shares, and 0.30% per year for Class G Shares. Amounts incurred by the Portfolio for the six months ended June 30, 2016 are shown as Distribution and service fees in the Statement of Operations.
Deferred Trustee Compensation - Each Trustee who is not currently an employee of the Adviser or any of its affiliates receives compensation from the Trust for his or her service to the Trust. A deferred compensation plan (the “Plan”) is available to the Trustees on a voluntary basis. Deferred amounts remain in the Trust until distributed in accordance with the provisions of the Plan. The value of a participating Trustee’s deferral account is based on theoretical investments of deferred amounts on the normal payment dates in certain portfolios of the Trust or Met Investors Series Trust, an affiliate of the Trust, as designated by the participating Trustee. Changes in the value of participants’ deferral accounts are reflected as Trustees’ fees and expenses in the Statement of Operations. The portion of the accrued obligations allocated to the Portfolio under the Plan is reflected as Deferred trustees’ fees in the Statement of Assets and Liabilities.
7. Contractual Obligations
Under the Trust’s organizational documents, its officers and Trustees may be indemnified against certain liabilities and expenses arising out of the performance of their duties to the Trust. Additionally, the Trust has a variety of indemnification obligations under contracts with its service providers. The Trust’s maximum exposure under these arrangements is unknown, as this would involve future claims that may be made against the Trust that have not yet occurred.
8. Income Tax Information
The tax character of distributions paid for the years ended December 31, 2015 and 2014 were as follows:
| | | | | | | | | | | | | | | | | | | | |
Ordinary Income | | | Long-Term Capital Gain | | | Total | |
2015 | | 2014 | | | 2015 | | | 2014 | | | 2015 | | | 2014 | |
| $14,033,509 | | $ | 13,838,966 | | | $ | 56,487,447 | | | $ | 37,782,266 | | | $ | 70,520,956 | | | $ | 51,621,232 | |
As of December 31, 2015, the components of distributable earnings (accumulated losses) on a federal income tax basis were as follows:
| | | | | | | | | | | | | | | | |
Undistributed
Ordinary
Income | | Undistributed
Long-Term
Capital Gain | | | Net
Unrealized
Appreciation | | | Other
Accumulated
Capital Losses | | | Total | |
| $11,214,220 | | $ | 74,404,316 | | | $ | 183,199,964 | | | $ | — | | | $ | 268,818,500 | |
The Portfolio utilizes the provisions of the federal income tax laws that provide for the carryforward of capital losses for prior years, offsetting such losses against any future realized capital gains. Under the Regulated Investment Company Modernization Act of 2010 (the “Act”), net capital losses recognized after December 22, 2010 may be carried forward indefinitely and their character is retained as short-term and/or long-term losses. Previously, net capital losses were carried forward for up to eight years and treated as short-term losses. As a transition rule, the Act requires that post-enactment net capital losses be used before pre-enactment net capital losses.
As of December 31, 2015, the Portfolio had no post-enactment accumulated capital losses and no pre-enactment accumulated capital loss carryforwards.
MSF-20
Metropolitan Series Fund
MetLife Stock Index Portfolio
Managed by MetLife Investment Advisors, LLC
Portfolio Manager Commentary*
PERFORMANCE
For the six month period ended June 30, 2016, the Class A, B, D, E and G shares of the MetLife Stock Index Portfolio returned 3.69%, 3.58%, 3.64%, 3.63%, and 3.55%, respectively. The Portfolio’s benchmark, the Standard & Poor’s (“S&P”) 500 Index1, returned 3.84%.
MARKET ENVIRONMENT / CONDITIONS
During the first quarter, equity markets were volatile as investors worried about a global economic slowdown and macroeconomic data continued to disappoint. U.S. retail sales, industrial production, and housing starts were all weaker than expected. In March, equity indexes rallied on central bank intervention and improving commodity prices. The People’s Bank of China cut reserve requirement ratios, the European Central Bank cut rates further and the Federal Reserve Bank (“Fed”) lowered the expected number of rate increases for 2016. During the second quarter, equity markets continued to move higher as positive macroeconomic data and recovering oil prices contrasted with uncertainty about a potential Fed rate hike and the United Kingdom referendum on European Union membership. In May, U.S. construction spending hit a record high and U.S. new, existing, and pending home sales and durable goods orders were all better than expected. On June 23, United Kingdom voters chose to “Leave” the European Union and on the day after the unexpected vote outcome, the price of gold had its largest single day increase since 2008, the British pound fell to its lowest level in 30 years, and equity markets around the world fell as much as 8%. However, global equity markets remained resilient and rallied the last three days of the quarter as concerns about the referendum abated and volatility declined.
During the first six months, the Federal Open Market Committee (the “Committee”) met four times and maintained the target range for the Federal Funds Rate at 0.25% to 0.50%. The Committee stated that the pace of improvement in the labor market had slowed while growth in economic activity appeared to have picked up. The Committee also stated that it expects economic conditions will evolve in a manner that will warrant only gradual increases in the Federal Funds Rate.
Eight of the ten sectors comprising the S&P 500 Index experienced positive returns for the first six months of 2016. Telecom Services (2.4% beginning weight in the benchmark), up 24.9%, was the best-performing sector. Utilities (3.0% beginning weight), up 23.5%, and Energy (6.5% beginning weight), up 15.9%, were the next best-performing sectors. Financials (16.5% beginning weight), down 3.1%, and Information Technology (20.7% beginning weight), down 0.4%, were the worst-performing sectors.
The stocks with the largest positive impact to the quarterly return of the Index were AT&T, up 28.9%, Exxon Mobil, up 22.4%, and Johnson & Johnson, up 19.8%. The stocks with the largest negative impact were Allergan, down 26.1%, Bank of America, down 20.6%, and Apple, down 8.1%.
PORTFOLIO REVIEW / PERIOD END POSITIONING
The Portfolio is managed utilizing a full replication strategy versus the S&P 500 Index. This strategy seeks to replicate the performance of the Index by owning all of the components of the Index at their respective Index capitalization weights. The Portfolio is periodically rebalanced for compositional changes in the S&P 500 Index. Factors that impact tracking error include transaction costs, cash drag, securities lending, NAV rounding, contributions and withdrawals.
Stacey Lituchy
Norman Hu
Mirsad Usejnoski
Portfolio Managers
MetLife Investment Advisors, LLC
* This commentary may include statements that constitute “forward-looking statements” under the U.S. securities laws. Forward-looking statements include, among other things, projections, estimates, and information about possible or future results related to the Portfolio, market or regulatory developments. The views expressed above are not guarantees of future performance or economic results and involve certain risks, uncertainties and assumptions that could cause actual outcomes and results to differ materially from the views expressed herein. The views expressed above are subject to change at any time based upon economic, market, or other conditions and the subadvisory firm undertakes no obligation to update the views expressed herein. Any discussions of specific securities should not be considered a recommendation to buy or sell those securities. The views expressed above (including any forward-looking statement) may not be relied upon as investment advice or as an indication of the Portfolio’s trading intent. Information about the Portfolio’s holdings, asset allocation or country diversification is historical and is not an indication of future Portfolio composition, which may vary. Direct investment in any index is not possible. The performance of any index mentioned in this commentary has not been adjusted for ongoing management, distribution and operating expenses, and sales charges applicable to mutual fund investments. In addition, the returns do not reflect additional fees charged by separate accounts or variable insurance contracts that an investor in the Portfolio may pay. If these additional fees were reflected, performance would have been lower.
MSF-1
Metropolitan Series Fund
MetLife Stock Index Portfolio
A $10,000 INVESTMENT COMPARED TO THE S&P 500 INDEX
SIX MONTH RETURN & AVERAGE ANNUAL RETURNS (%) AS OF JUNE 30, 2016
| | | | | | | | | | | | | | | | | | | | |
| | | 6 Month | | | 1 Year | | | 5 Year | | | 10 Year | | | Since Inception2 | |
| MetLife Stock Index Portfolio | | | | | | | | | | | | | | | | | | | | |
Class A | | | 3.69 | | | | 3.74 | | | | 11.81 | | | | 7.17 | | | | — | |
Class B | | | 3.58 | | | | 3.50 | | | | 11.54 | | | | 6.90 | | | | — | |
Class D | | | 3.64 | | | | 3.66 | | | | 11.71 | | | | — | | | | 15.36 | |
Class E | | | 3.63 | | | | 3.60 | | | | 11.65 | | | | 7.01 | | | | — | |
Class G | | | 3.55 | | | | 3.48 | | | | — | | | | — | | | | 3.49 | |
| S&P 500 Index | | | 3.84 | | | | 3.99 | | | | 12.09 | | | | 7.42 | | | | — | |
1 The Standard & Poor’s (S&P) 500 Index is an unmanaged index consisting of 500 stocks chosen for market size, liquidity, and industry group representation. It is a market-weighted index (stock price times number of shares outstanding) with each stock’s weight in the Index proportionate to its market value.
2 Inception dates of the Class A, Class B, Class D, Class E and Class G shares are 5/1/90, 1/2/01, 4/28/09, 5/1/01 and 11/12/14, respectively.
Portfolio performance is calculated including reinvestment of all income and capital gain distributions. Performance numbers are net of all Portfolio expenses but do not include any insurance, sales, separate account or administrative charges of variable annuity or life insurance contracts or any additional expenses that participants may bear relating to the operations of their plans. If these charges were included, the returns would be lower. The performance of any index referenced above has not been adjusted for ongoing management, distribution and operating expenses, and sales charges applicable to mutual fund investments. Direct investment in any index is not possible. The performance of Class A shares, as set forth in the line graph above, will differ from that of other classes because of the difference in expenses paid by policyholders investing in the different share classes.
This information represents past performance and is not indicative of future results. Investment return and principal value may fluctuate so that shares, upon redemption, may be worth more or less than the original cost.
PORTFOLIO COMPOSITION AS OF JUNE 30, 2016
Top Holdings
| | | | |
| | | % of
Net Assets | |
| Apple, Inc. | | | 2.8 | |
| Microsoft Corp. | | | 2.2 | |
| Exxon Mobil Corp. | | | 2.1 | |
| Johnson & Johnson | | | 1.8 | |
| SPDR S&P 500 ETF Trust | | | 1.7 | |
| General Electric Co. | | | 1.6 | |
| Amazon.com, Inc. | | | 1.5 | |
| Berkshire Hathaway, Inc. - Class B | | | 1.5 | |
| AT&T, Inc. | | | 1.4 | |
| Facebook, Inc. - Class A | | | 1.4 | |
Top Sectors
| | | | |
| | | % of
Net Assets | |
| Information Technology | | | 19.3 | |
| Financials | | | 17.1 | |
| Health Care | | | 14.4 | |
| Consumer Discretionary | | | 12.0 | |
| Consumer Staples | | | 10.3 | |
| Industrials | | | 10.0 | |
| Energy | | | 7.2 | |
| Utilities | | | 3.6 | |
| Telecommunication Services | | | 2.8 | |
| Materials | | | 2.8 | |
MSF-2
Metropolitan Series Fund
MetLife Stock Index Portfolio
Understanding Your Portfolio’s Expenses (Unaudited)
Shareholder Expense Example
As a shareholder of the Portfolio, you incur ongoing costs, including management fees; distribution and service (12b-1) fees; and other Portfolio expenses. This example is intended to help you understand your ongoing costs (in dollars) (referred to as “expenses”) of investing in the Portfolio and compare these costs with the ongoing costs of investing in other mutual funds. The example is based on an investment of $1,000 invested at the beginning of the period and held for the entire period, January 1, 2016 through June 30, 2016.
Actual Expenses
The first line for each share class of the Portfolio in the table below provides information about actual account values and actual expenses. You may use the information in this line, together with the amount you invested in the particular share class of the Portfolio, to estimate the expenses that you paid over the period. Simply divide your account value by $1,000 (for example, an $8,600 account value divided by $1,000 = 8.6), then multiply the result by the number in the first line under the heading entitled “Expenses Paid During Period” to estimate the expenses you paid on your account during this period.
Hypothetical Example for Comparison Purposes
The second line for each share class of the Portfolio in the table below provides information about hypothetical account values and hypothetical expenses based on the Portfolio’s actual expense ratio and an assumed rate of return of 5% per year before expenses, which is not the Portfolio’s actual return. The hypothetical account values and expenses may not be used to estimate the actual ending account balance or expenses you paid for the period. You may use this information to compare the ongoing costs of investing in the Portfolio and other funds. To do so, compare this 5% hypothetical example with the 5% hypothetical examples that appear in the shareholder reports of the other funds.
Please note that the expenses shown in the table are meant to highlight your ongoing costs only and do not reflect any fees or charges of your variable insurance product or any additional expenses that participants in certain eligible qualified plans may bear relating to the operations of their plan. Therefore, the second line for each share class in the table is useful in comparing ongoing costs only, and will not help you determine the relative total costs of owning different funds. In addition, if these other costs were included, your costs would have been higher.
| | | | | | | | | | | | | | | | | | |
MetLife Stock Index Portfolio | | | | Annualized
Expense
Ratio | | | Beginning
Account Value
January 1,
2016 | | | Ending
Account Value
June 30,
2016 | | | Expenses Paid
During Period**
January 1, 2016
to
June 30,
2016 | |
Class A(a) | | Actual | | | 0.26 | % | | $ | 1,000.00 | | | $ | 1,036.90 | | | $ | 1.32 | |
| | Hypothetical* | | | 0.26 | % | | $ | 1,000.00 | | | $ | 1,023.57 | | | $ | 1.31 | |
| | | | | |
Class B(a) | | Actual | | | 0.51 | % | | $ | 1,000.00 | | | $ | 1,035.80 | | | $ | 2.58 | |
| | Hypothetical* | | | 0.51 | % | | $ | 1,000.00 | | | $ | 1,022.33 | | | $ | 2.56 | |
| | | | | |
Class D(a) | | Actual | | | 0.36 | % | | $ | 1,000.00 | | | $ | 1,036.40 | | | $ | 1.82 | |
| | Hypothetical* | | | 0.36 | % | | $ | 1,000.00 | | | $ | 1,023.07 | | | $ | 1.81 | |
| | | | | |
Class E(a) | | Actual | | | 0.41 | % | | $ | 1,000.00 | | | $ | 1,036.30 | | | $ | 2.08 | |
| | Hypothetical* | | | 0.41 | % | | $ | 1,000.00 | | | $ | 1,022.83 | | | $ | 2.06 | |
| | | | | |
Class G(a) | | Actual | | | 0.56 | % | | $ | 1,000.00 | | | $ | 1,035.50 | | | $ | 2.83 | |
| | Hypothetical* | | | 0.56 | % | | $ | 1,000.00 | | | $ | 1,022.08 | | | $ | 2.82 | |
* Hypothetical assumes a rate of return of 5% per year before expenses.
** Expenses paid are equal to the Portfolio’s annualized expense ratio for the most recent six month period, as shown above, multiplied by the average account value over the period, multiplied by the number of days (182 days) in the most recent fiscal half-year, divided by 366 (to reflect the one-half year period).
(a) The annualized expense ratio shown reflects the impact of the management fee waiver as described in Note 6 of the Notes to Financial Statements.
MSF-3
Metropolitan Series Fund
MetLife Stock Index Portfolio
Schedule of Investments as of June 30, 2016 (Unaudited)
Common Stocks—97.8% of Net Assets
| | | | | | | | |
| Security Description | | Shares | | | Value | |
| |
Aerospace & Defense—2.6% | | | | |
Boeing Co. (The) (a) | | | 203,238 | | | $ | 26,394,519 | |
General Dynamics Corp. | | | 97,517 | | | | 13,578,267 | |
Honeywell International, Inc. | | | 258,673 | | | | 30,088,843 | |
L-3 Communications Holdings, Inc. | | | 26,119 | | | | 3,831,396 | |
Lockheed Martin Corp. | | | 88,869 | | | | 22,054,620 | |
Northrop Grumman Corp. | | | 61,248 | | | | 13,614,205 | |
Raytheon Co. | | | 100,800 | | | | 13,703,760 | |
Rockwell Collins, Inc. | | | 44,190 | | | | 3,762,337 | |
Textron, Inc. | | | 91,245 | | | | 3,335,917 | |
TransDigm Group, Inc. (a) (b) | | | 17,982 | | | | 4,741,674 | |
United Technologies Corp. | | | 264,161 | | | | 27,089,711 | |
| | | | | | | | |
| | | | | | | 162,195,249 | |
| | | | | | | | |
| |
Air Freight & Logistics—0.7% | | | | |
C.H. Robinson Worldwide, Inc. (a) | | | 48,457 | | | | 3,597,932 | |
Expeditors International of Washington, Inc. | | | 61,793 | | | | 3,030,329 | |
FedEx Corp. | | | 84,730 | | | | 12,860,320 | |
United Parcel Service, Inc. - Class B | | | 234,349 | | | | 25,244,074 | |
| | | | | | | | |
| | | | | | | 44,732,655 | |
| | | | | | | | |
| |
Airlines—0.5% | | | | |
Alaska Air Group, Inc. | | | 41,834 | | | | 2,438,504 | |
American Airlines Group, Inc. | | | 196,240 | | | | 5,555,554 | |
Delta Air Lines, Inc. | | | 261,889 | | | | 9,540,616 | |
Southwest Airlines Co. | | | 216,779 | | | | 8,499,905 | |
United Continental Holdings, Inc. (b) | | | 113,941 | | | | 4,676,139 | |
| | | | | | | | |
| | | | | | | 30,710,718 | |
| | | | | | | | |
| |
Auto Components—0.3% | | | | |
BorgWarner, Inc. (a) | | | 73,863 | | | | 2,180,436 | |
Delphi Automotive plc | | | 92,652 | | | | 5,800,015 | |
Goodyear Tire & Rubber Co. (The) | | | 90,265 | | | | 2,316,200 | |
Johnson Controls, Inc. | | | 220,066 | | | | 9,740,121 | |
| | | | | | | | |
| | | | | | | 20,036,772 | |
| | | | | | | | |
| |
Automobiles—0.5% | | | | |
Ford Motor Co. | | | 1,324,390 | | | | 16,647,583 | |
General Motors Co. | | | 475,601 | | | | 13,459,508 | |
Harley-Davidson, Inc. (a) | | | 61,464 | | | | 2,784,319 | |
| | | | | | | | |
| | | | | | | 32,891,410 | |
| | | | | | | | |
| |
Banks—5.1% | | | | |
Bank of America Corp. | | | 3,486,438 | | | | 46,265,032 | |
BB&T Corp. | | | 278,613 | | | | 9,921,409 | |
Citigroup, Inc. | | | 996,157 | | | | 42,227,095 | |
Citizens Financial Group, Inc. | | | 179,543 | | | | 3,587,269 | |
Comerica, Inc. | | | 59,443 | | | | 2,444,891 | |
Fifth Third Bancorp | | | 260,574 | | | | 4,583,497 | |
Huntington Bancshares, Inc. (a) | | | 271,147 | | | | 2,424,054 | |
JPMorgan Chase & Co. | | | 1,241,123 | | | | 77,123,383 | |
KeyCorp | | | 285,913 | | | | 3,159,339 | |
M&T Bank Corp. (a) | | | 53,967 | | | | 6,380,518 | |
People’s United Financial, Inc. (a) | | | 105,510 | | | | 1,546,777 | |
PNC Financial Services Group, Inc. (The) | | | 169,478 | | | | 13,793,814 | |
|
Banks—(Continued) | |
Regions Financial Corp. | | | 429,940 | | | | 3,658,789 | |
SunTrust Banks, Inc. | | | 170,090 | | | | 6,987,297 | |
U.S. Bancorp | | | 550,808 | | | | 22,214,087 | |
Wells Fargo & Co. | | | 1,568,134 | | | | 74,219,782 | |
Zions Bancorporation | | | 69,452 | | | | 1,745,329 | |
| | | | | | | | |
| | | | | | | 322,282,362 | |
| | | | | | | | |
|
Beverages—2.3% | |
Brown-Forman Corp. - Class B (a) | | | 34,112 | | | | 3,403,013 | |
Coca-Cola Co. (The) | | | 1,321,537 | | | | 59,905,272 | |
Constellation Brands, Inc. - Class A | | | 59,876 | | | | 9,903,491 | |
Dr Pepper Snapple Group, Inc. | | | 63,067 | | | | 6,094,164 | |
Molson Coors Brewing Co. - Class B | | | 62,495 | | | | 6,320,119 | |
Monster Beverage Corp. (b) | | | 47,783 | | | | 7,679,206 | |
PepsiCo, Inc. | | | 490,256 | | | | 51,937,721 | |
| | | | | | | | |
| | | | | | | 145,242,986 | |
| | | | | | | | |
| | |
Biotechnology—2.9% | | | | | | | | |
AbbVie, Inc. | | | 548,955 | | | | 33,985,804 | |
Alexion Pharmaceuticals, Inc. (b) | | | 76,036 | | | | 8,877,963 | |
Amgen, Inc. | | | 254,974 | | | | 38,794,294 | |
Biogen, Inc. (b) | | | 74,349 | | | | 17,979,075 | |
Celgene Corp. (b) | | | 262,911 | | | | 25,930,912 | |
Gilead Sciences, Inc. | | | 452,040 | | | | 37,709,177 | |
Regeneron Pharmaceuticals, Inc. (b) | | | 26,474 | | | | 9,245,515 | |
Vertex Pharmaceuticals, Inc. (b) | | | 83,954 | | | | 7,221,723 | |
| | | | | | | | |
| | | | | | | 179,744,463 | |
| | | | | | | | |
| | |
Building Products—0.1% | | | | | | | | |
Allegion plc | | | 32,493 | | | | 2,255,989 | |
Fortune Brands Home & Security, Inc. (a) | | | 52,058 | | | | 3,017,802 | |
Masco Corp. | | | 112,938 | | | | 3,494,302 | |
| | | | | | | | |
| | | | | | | 8,768,093 | |
| | | | | | | | |
| | |
Capital Markets—1.7% | | | | | | | | |
Affiliated Managers Group, Inc. (b) | | | 18,264 | | | | 2,571,023 | |
Ameriprise Financial, Inc. | | | 56,279 | | | | 5,056,668 | |
Bank of New York Mellon Corp. (The) | | | 365,577 | | | | 14,202,666 | |
BlackRock, Inc. | | | 42,696 | | | | 14,624,661 | |
Charles Schwab Corp. (The) | | | 408,227 | | | | 10,332,225 | |
E*Trade Financial Corp. (b) | | | 94,604 | | | | 2,222,248 | |
Franklin Resources, Inc. | | | 125,076 | | | | 4,173,786 | |
Goldman Sachs Group, Inc. (The) | | | 131,122 | | | | 19,482,107 | |
Invesco, Ltd. | | | 141,627 | | | | 3,617,154 | |
Legg Mason, Inc. | | | 35,774 | | | | 1,054,975 | |
Morgan Stanley | | | 512,814 | | | | 13,322,908 | |
Northern Trust Corp. | | | 72,795 | | | | 4,823,397 | |
State Street Corp. | | | 134,387 | | | | 7,246,147 | |
T. Rowe Price Group, Inc. | | | 84,243 | | | | 6,147,212 | |
| | | | | | | | |
| | | | | | | 108,877,177 | |
| | | | | | | | |
| | |
Chemicals—2.0% | | | | | | | | |
Air Products & Chemicals, Inc. | | | 66,007 | | | | 9,375,634 | |
Albemarle Corp. | | | 38,115 | | | | 3,022,901 | |
CF Industries Holdings, Inc. | | | 79,115 | | | | 1,906,672 | |
See accompanying notes to financial statements.
MSF-4
Metropolitan Series Fund
MetLife Stock Index Portfolio
Schedule of Investments as of June 30, 2016 (Unaudited)
Common Stocks—(Continued)
| | | | | | | | |
| Security Description | | Shares | | | Value | |
|
Chemicals—(Continued) | |
Dow Chemical Co. (The) | | | 381,104 | | | $ | 18,944,680 | |
E.I. du Pont de Nemours & Co. | | | 296,483 | | | | 19,212,098 | |
Eastman Chemical Co. | | | 50,457 | | | | 3,426,030 | |
Ecolab, Inc. | | | 89,597 | | | | 10,626,204 | |
FMC Corp. (a) | | | 45,397 | | | | 2,102,335 | |
International Flavors & Fragrances, Inc. (a) | | | 27,056 | | | | 3,410,950 | |
LyondellBasell Industries NV - Class A | | | 115,870 | | | | 8,623,045 | |
Monsanto Co. | | | 148,272 | | | | 15,332,808 | |
Mosaic Co. (The) (a) | | | 118,732 | | | | 3,108,404 | |
PPG Industries, Inc. | | | 90,306 | | | | 9,405,370 | |
Praxair, Inc. | | | 96,823 | | | | 10,881,937 | |
Sherwin-Williams Co. (The) | | | 26,685 | | | | 7,836,584 | |
| | | | | | | | |
| | | | | | | 127,215,652 | |
| | | | | | | | |
| |
Commercial Services & Supplies—0.4% | | | | | |
Cintas Corp. (a) | | | 29,418 | | | | 2,886,788 | |
Pitney Bowes, Inc. | | | 64,020 | | | | 1,139,556 | |
Republic Services, Inc. | | | 80,540 | | | | 4,132,507 | |
Stericycle, Inc. (b) | | | 28,821 | | | | 3,000,843 | |
Tyco International plc | | | 144,420 | | | | 6,152,292 | |
Waste Management, Inc. | | | 140,234 | | | | 9,293,307 | |
| | | | | | | | |
| | | | | | | 26,605,293 | |
| | | | | | | | |
| | |
Communications Equipment—1.0% | | | | | | | | |
Cisco Systems, Inc. | | | 1,707,157 | | | | 48,978,334 | |
F5 Networks, Inc. (b) | | | 22,734 | | | | 2,588,039 | |
Harris Corp. (a) | | | 42,334 | | | | 3,532,349 | |
Juniper Networks, Inc. | | | 119,891 | | | | 2,696,349 | |
Motorola Solutions, Inc. | | | 53,928 | | | | 3,557,630 | |
| | | | | | | | |
| | | | | | | 61,352,701 | |
| | | | | | | | |
| | |
Construction & Engineering—0.1% | | | | | | | | |
Fluor Corp. | | | 47,256 | | | | 2,328,776 | |
Jacobs Engineering Group, Inc. (b) | | | 41,383 | | | | 2,061,287 | |
Quanta Services, Inc. (b) | | | 51,263 | | | | 1,185,200 | |
| | | | | | | | |
| | | | | | | 5,575,263 | |
| | | | | | | | |
| | |
Construction Materials—0.2% | | | | | | | | |
Martin Marietta Materials, Inc. (a) | | | 21,562 | | | | 4,139,904 | |
Vulcan Materials Co. | | | 45,206 | | | | 5,440,994 | |
| | | | | | | | |
| | | | | | | 9,580,898 | |
| | | | | | | | |
| | |
Consumer Finance—0.7% | | | | | | | | |
American Express Co. | | | 274,375 | | | | 16,671,025 | |
Capital One Financial Corp. | | | 173,814 | | | | 11,038,927 | |
Discover Financial Services | | | 139,915 | | | | 7,498,045 | |
Navient Corp. | | | 112,181 | | | | 1,340,563 | |
Synchrony Financial (b) | | | 283,044 | | | | 7,155,352 | |
| | | | | | | | |
| | | | | | | 43,703,912 | |
| | | | | | | | |
| | |
Containers & Packaging—0.3% | | | | | | | | |
Avery Dennison Corp. | | | 30,269 | | | | 2,262,608 | |
Ball Corp. (a) | | | 59,042 | | | | 4,268,146 | |
International Paper Co. | | | 139,558 | | | | 5,914,468 | |
|
Containers & Packaging—(Continued) | |
Owens-Illinois, Inc. (b) | | | 54,957 | | | | 989,775 | |
Sealed Air Corp. | | | 66,912 | | | | 3,075,945 | |
WestRock Co. | | | 85,739 | | | | 3,332,675 | |
| | | | | | | | |
| | | | | | | 19,843,617 | |
| | | | | | | | |
| | |
Distributors—0.1% | | | | | | | | |
Genuine Parts Co. | | | 50,784 | | | | 5,141,880 | |
LKQ Corp. (b) | | | 104,091 | | | | 3,299,685 | |
| | | | | | | | |
| | | | | | | 8,441,565 | |
| | | | | | | | |
| |
Diversified Consumer Services—0.0% | | | | | |
H&R Block, Inc. (a) | | | 76,166 | | | | 1,751,818 | |
| | | | | | | | |
| | |
Diversified Financial Services—2.1% | | | | | | | | |
Berkshire Hathaway, Inc. - Class B (b) | | | 636,011 | | | | 92,088,033 | |
CME Group, Inc. | | | 114,939 | | | | 11,195,059 | |
Intercontinental Exchange, Inc. | | | 40,406 | | | | 10,342,320 | |
Leucadia National Corp. (a) | | | 113,141 | | | | 1,960,733 | |
Moody’s Corp. | | | 57,375 | | | | 5,376,611 | |
Nasdaq, Inc. | | | 39,087 | | | | 2,527,756 | |
S&P Global, Inc. | | | 89,809 | | | | 9,632,913 | |
| | | | | | | | |
| | | | | | | 133,123,425 | |
| | | | | | | | |
|
Diversified Telecommunication Services—2.9% | |
AT&T, Inc. | | | 2,089,436 | | | | 90,284,530 | |
CenturyLink, Inc. | | | 185,338 | | | | 5,376,655 | |
Frontier Communications Corp. (a) | | | 398,160 | | | | 1,966,910 | |
Level 3 Communications, Inc. (b) | | | 98,404 | | | | 5,066,822 | |
Verizon Communications, Inc. | | | 1,383,551 | | | | 77,257,488 | |
| | | | | | | | |
| | | | | | | 179,952,405 | |
| | | | | | | | |
| | |
Electric Utilities—2.2% | | | | | | | | |
Alliant Energy Corp. | | | 77,089 | | | | 3,060,433 | |
American Electric Power Co., Inc. | | | 166,759 | | | | 11,688,138 | |
Duke Energy Corp. | | | 233,824 | | | | 20,059,761 | |
Edison International | | | 110,585 | | | | 8,589,137 | |
Entergy Corp. | | | 60,667 | | | | 4,935,260 | |
Eversource Energy | | | 107,664 | | | | 6,449,074 | |
Exelon Corp. | | | 312,873 | | | | 11,376,062 | |
FirstEnergy Corp. | | | 144,153 | | | | 5,032,381 | |
NextEra Energy, Inc. | | | 156,622 | | | | 20,423,509 | |
PG&E Corp. | | | 168,363 | | | | 10,761,763 | |
Pinnacle West Capital Corp. | | | 37,722 | | | | 3,057,745 | |
PPL Corp. | | | 229,765 | | | | 8,673,629 | |
Southern Co. (The) | | | 318,558 | | | | 17,084,266 | |
Xcel Energy, Inc. | | | 172,406 | | | | 7,720,341 | |
| | | | | | | | |
| | | | | | | 138,911,499 | |
| | | | | | | | |
| | |
Electrical Equipment—0.5% | | | | | | | | |
Acuity Brands, Inc. | | | 14,877 | | | | 3,688,901 | |
AMETEK, Inc. | | | 79,222 | | | | 3,662,433 | |
Eaton Corp. plc | | | 155,452 | | | | 9,285,148 | |
Emerson Electric Co. | | | 218,362 | | | | 11,389,762 | |
Rockwell Automation, Inc. (a) | | | 44,212 | | | | 5,076,422 | |
| | | | | | | | |
| | | | | | | 33,102,666 | |
| | | | | | | | |
See accompanying notes to financial statements.
MSF-5
Metropolitan Series Fund
MetLife Stock Index Portfolio
Schedule of Investments as of June 30, 2016 (Unaudited)
Common Stocks—(Continued)
| | | | | | | | |
| Security Description | | Shares | | | Value | |
|
Electronic Equipment, Instruments & Components—0.4% | |
Amphenol Corp. - Class A | | | 104,515 | | | $ | 5,991,845 | |
Corning, Inc. | | | 364,989 | | | | 7,474,975 | |
FLIR Systems, Inc. | | | 46,714 | | | | 1,445,798 | |
TE Connectivity, Ltd. | | | 121,380 | | | | 6,932,012 | |
| | | | | | | | |
| | | | | | | 21,844,630 | |
| | | | | | | | |
| | |
Energy Equipment & Services—1.1% | | | | | | | | |
Baker Hughes, Inc. | | | 148,634 | | | | 6,707,852 | |
Diamond Offshore Drilling, Inc. | | | 21,882 | | | | 532,389 | |
FMC Technologies, Inc. (b) | | | 76,828 | | | | 2,049,003 | |
Halliburton Co. | | | 291,647 | | | | 13,208,693 | |
Helmerich & Payne, Inc. (a) | | | 36,670 | | | | 2,461,657 | |
National Oilwell Varco, Inc. (a) | | | 127,980 | | | | 4,306,527 | |
Schlumberger, Ltd. | | | 471,623 | | | | 37,295,947 | |
Transocean, Ltd. | | | 116,517 | | | | 1,385,387 | |
| | | | | | | | |
| | | | | | | 67,947,455 | |
| | | | | | | | |
| | |
Food & Staples Retailing—2.3% | | | | | | | | |
Costco Wholesale Corp. | | | 148,686 | | | | 23,349,649 | |
CVS Health Corp. | | | 364,539 | | | | 34,900,964 | |
Kroger Co. (The) | | | 323,729 | | | | 11,909,990 | |
Sysco Corp. | | | 177,877 | | | | 9,025,479 | |
Wal-Mart Stores, Inc. | | | 518,339 | | | | 37,849,114 | |
Walgreens Boots Alliance, Inc. | | | 293,321 | | | | 24,424,840 | |
Whole Foods Market, Inc. (a) | | | 108,961 | | | | 3,488,931 | |
| | | | | | | | |
| | | | | | | 144,948,967 | |
| | | | | | | | |
| | |
Food Products—1.8% | | | | | | | | |
Archer-Daniels-Midland Co. | | | 199,433 | | | | 8,553,681 | |
Campbell Soup Co. (a) | | | 60,859 | | | | 4,048,949 | |
ConAgra Foods, Inc. | | | 148,125 | | | | 7,081,856 | |
General Mills, Inc. | | | 201,748 | | | | 14,388,667 | |
Hershey Co. (The) (a) | | | 47,699 | | | | 5,413,360 | |
Hormel Foods Corp. (a) | | | 91,719 | | | | 3,356,915 | |
J.M. Smucker Co. (The) | | | 40,621 | | | | 6,191,047 | |
Kellogg Co. | | | 85,544 | | | | 6,984,668 | |
Kraft Heinz Co. (The) | | | 202,229 | | | | 17,893,222 | |
McCormick & Co., Inc. | | | 39,124 | | | | 4,173,357 | |
Mead Johnson Nutrition Co. | | | 63,356 | | | | 5,749,557 | |
Mondelez International, Inc. - Class A | | | 526,792 | | | | 23,974,304 | |
Tyson Foods, Inc. - Class A | | | 102,006 | | | | 6,812,981 | |
| | | | | | | | |
| | | | | | | 114,622,564 | |
| | | | | | | | |
| | |
Gas Utilities—0.0% | | | | | | | | |
AGL Resources, Inc. | | | 40,960 | | | | 2,702,131 | |
| | | | | | | | |
| |
Health Care Equipment & Supplies—2.4% | | | | | |
Abbott Laboratories | | | 498,651 | | | | 19,601,971 | |
Baxter International, Inc. | | | 187,446 | | | | 8,476,308 | |
Becton Dickinson & Co. | | | 72,025 | | | | 12,214,719 | |
Boston Scientific Corp. (b) | | | 460,540 | | | | 10,762,820 | |
C.R. Bard, Inc. | | | 24,886 | | | | 5,852,192 | |
DENTSPLY SIRONA, Inc. | | | 79,501 | | | | 4,932,242 | |
Edwards Lifesciences Corp. (b) | | | 71,875 | | | | 7,168,094 | |
Hologic, Inc. (b) | | | 82,335 | | | | 2,848,791 | |
|
Health Care Equipment & Supplies—(Continued) | |
Intuitive Surgical, Inc. (b) | | | 12,919 | | | | 8,544,756 | |
Medtronic plc | | | 477,270 | | | | 41,412,718 | |
St. Jude Medical, Inc. | | | 96,488 | | | | 7,526,064 | |
Stryker Corp. (a) | | | 106,625 | | | | 12,776,873 | |
Varian Medical Systems, Inc. (a) (b) | | | 32,317 | | | | 2,657,427 | |
Zimmer Biomet Holdings, Inc. | | | 67,624 | | | | 8,140,577 | |
| | | | | | | | |
| | | | | | | 152,915,552 | |
| | | | | | | | |
| |
Health Care Providers & Services—2.7% | | | | | |
Aetna, Inc. | | | 118,999 | | | | 14,533,348 | |
AmerisourceBergen Corp. | | | 62,275 | | | | 4,939,653 | |
Anthem, Inc. | | | 89,250 | | | | 11,722,095 | |
Cardinal Health, Inc. | | | 110,586 | | | | 8,626,814 | |
Centene Corp. (b) | | | 57,860 | | | | 4,129,468 | |
Cigna Corp. | | | 87,064 | | | | 11,143,321 | |
DaVita HealthCare Partners, Inc. (b) | | | 55,370 | | | | 4,281,208 | |
Express Scripts Holding Co. (b) | | | 214,782 | | | | 16,280,476 | |
HCA Holdings, Inc. (b) | | | 102,202 | | | | 7,870,576 | |
Henry Schein, Inc. (a) (b) | | | 27,855 | | | | 4,924,764 | |
Humana, Inc. | | | 50,586 | | | | 9,099,410 | |
Laboratory Corp. of America Holdings (b) | | | 34,756 | | | | 4,527,664 | |
McKesson Corp. | | | 76,376 | | | | 14,255,580 | |
Patterson Cos., Inc. | | | 28,251 | | | | 1,352,940 | |
Quest Diagnostics, Inc. | | | 48,012 | | | | 3,908,657 | |
UnitedHealth Group, Inc. | | | 322,717 | | | | 45,567,641 | |
Universal Health Services, Inc. - Class B | | | 30,466 | | | | 4,085,491 | |
| | | | | | | | |
| | | | | | | 171,249,106 | |
| | | | | | | | |
| | |
Health Care Technology—0.1% | | | | | | | | |
Cerner Corp. (a) (b) | | | 102,127 | | | | 5,984,642 | |
| | | | | | | | |
| | |
Hotels, Restaurants & Leisure—1.7% | | | | | | | | |
Carnival Corp. | | | 148,822 | | | | 6,577,932 | |
Chipotle Mexican Grill, Inc. (a) (b) | | | 9,912 | | | | 3,992,157 | |
Darden Restaurants, Inc. (a) | | | 38,711 | | | | 2,451,955 | |
Marriott International, Inc. - Class A (a) | | | 64,717 | | | | 4,301,092 | |
McDonald’s Corp. | | | 297,958 | | | | 35,856,266 | |
Royal Caribbean Cruises, Ltd. (a) | | | 56,983 | | | | 3,826,408 | |
Starbucks Corp. | | | 497,208 | | | | 28,400,521 | |
Starwood Hotels & Resorts Worldwide, Inc. | | | 57,208 | | | | 4,230,532 | |
Wyndham Worldwide Corp. (a) | | | 37,998 | | | | 2,706,597 | |
Wynn Resorts, Ltd. (a) | | | 27,639 | | | | 2,505,199 | |
Yum! Brands, Inc. | | | 138,291 | | | | 11,467,090 | |
| | | | | | | | |
| | | | | | | 106,315,749 | |
| | | | | | | | |
| | |
Household Durables—0.5% | | | | | | | | |
DR Horton, Inc. | | | 112,048 | | | | 3,527,271 | |
Garmin, Ltd. | | | 39,813 | | | | 1,688,867 | |
Harman International Industries, Inc. | | | 23,947 | | | | 1,719,874 | |
Leggett & Platt, Inc. (a) | | | 45,592 | | | | 2,330,207 | |
Lennar Corp. - Class A | | | 62,250 | | | | 2,869,725 | |
Mohawk Industries, Inc. (b) | | | 21,627 | | | | 4,103,940 | |
Newell Brands, Inc. | | | 155,003 | | | | 7,528,496 | |
PulteGroup, Inc. | | | 106,877 | | | | 2,083,033 | |
Whirlpool Corp. | | | 25,785 | | | | 4,296,812 | |
| | | | | | | | |
| | | | | | | 30,148,225 | |
| | | | | | | | |
See accompanying notes to financial statements.
MSF-6
Metropolitan Series Fund
MetLife Stock Index Portfolio
Schedule of Investments as of June 30, 2016 (Unaudited)
Common Stocks—(Continued)
| | | | | | | | |
| Security Description | | Shares | | | Value | |
| | |
Household Products—2.0% | | | | | | | | |
Church & Dwight Co., Inc. | | | 43,557 | | | $ | 4,481,580 | |
Clorox Co. (The) | | | 43,900 | | | | 6,075,321 | |
Colgate-Palmolive Co. | | | 303,103 | | | | 22,187,140 | |
Kimberly-Clark Corp. | | | 122,233 | | | | 16,804,593 | |
Procter & Gamble Co. (The) | | | 903,471 | | | | 76,496,889 | |
| | | | | | | | |
| | | | | | | 126,045,523 | |
| | | | | | | | |
|
Independent Power and Renewable Electricity Producers—0.1% | |
AES Corp. | | | 223,674 | | | | 2,791,452 | |
NRG Energy, Inc. | | | 106,885 | | | | 1,602,206 | |
| | | | | | | | |
| | | | | | | 4,393,658 | |
| | | | | | | | |
| | |
Industrial Conglomerates—2.5% | | | | | | | | |
3M Co. | | | 205,860 | | | | 36,050,203 | |
Danaher Corp. | | | 203,365 | | | | 20,539,865 | |
General Electric Co. | | | 3,121,140 | | | | 98,253,487 | |
Roper Technologies, Inc. | | | 34,349 | | | | 5,858,566 | |
| | | | | | | | |
| | | | | | | 160,702,121 | |
| | | | | | | | |
| | |
Insurance—2.6% | | | | | | | | |
Aflac, Inc. | | | 140,513 | | | | 10,139,418 | |
Allstate Corp. (The) | | | 127,065 | | | | 8,888,197 | |
American International Group, Inc. | | | 379,815 | | | | 20,088,415 | |
Aon plc | | | 89,917 | | | | 9,821,634 | |
Arthur J. Gallagher & Co. | | | 60,120 | | | | 2,861,712 | |
Assurant, Inc. | | | 21,022 | | | | 1,814,409 | |
Chubb, Ltd. | | | 157,651 | | | | 20,606,562 | |
Cincinnati Financial Corp. | | | 50,206 | | | | 3,759,927 | |
Hartford Financial Services Group, Inc. (The) | | | 133,520 | | | | 5,925,618 | |
Lincoln National Corp. | | | 81,122 | | | | 3,145,100 | |
Loews Corp. | | | 90,903 | | | | 3,735,204 | |
Marsh & McLennan Cos., Inc. | | | 176,914 | | | | 12,111,532 | |
MetLife, Inc. (c) | | | 372,903 | | | | 14,852,726 | |
Principal Financial Group, Inc. | | | 91,493 | | | | 3,761,277 | |
Progressive Corp. (The) | | | 197,878 | | | | 6,628,913 | |
Prudential Financial, Inc. | | | 150,021 | | | | 10,702,498 | |
Torchmark Corp. | | | 38,084 | | | | 2,354,353 | |
Travelers Cos., Inc. (The) | | | 99,243 | | | | 11,813,887 | |
Unum Group | | | 80,699 | | | | 2,565,421 | |
Willis Towers Watson plc | | | 46,989 | | | | 5,841,203 | |
XL Group plc | | | 96,621 | | | | 3,218,446 | |
| | | | | | | | |
| | | | | | | 164,636,452 | |
| | | | | | | | |
| | |
Internet & Catalog Retail—2.1% | | | | | | | | |
Amazon.com, Inc. (b) | | | 131,320 | | | | 93,975,218 | |
Expedia, Inc. (a) | | | 39,787 | | | | 4,229,358 | |
Netflix, Inc. (a) (b) | | | 145,371 | | | | 13,298,539 | |
Priceline Group, Inc. (The) (b) | | | 16,849 | | | | 21,034,460 | |
TripAdvisor, Inc. (a) (b) | | | 38,795 | | | | 2,494,519 | |
| | | | | | | | |
| | | | | | | 135,032,094 | |
| | | | | | | | |
| | |
Internet Software & Services—4.0% | | | | | | | | |
Akamai Technologies, Inc. (a) (b) | | | 59,598 | | | | 3,333,316 | |
Alphabet, Inc. - Class A (b) | | | 99,678 | | | | 70,126,463 | |
Alphabet, Inc. - Class C (b) (d) | | | 100,249 | | | | 69,382,333 | |
|
Internet Software & Services—(Continued) | |
eBay, Inc. (b) | | | 358,758 | | | | 8,398,525 | |
Facebook, Inc. - Class A (b) | | | 784,681 | | | | 89,673,345 | |
VeriSign, Inc. (a) (b) | | | 32,400 | | | | 2,801,304 | |
Yahoo!, Inc. (b) | | | 296,623 | | | | 11,141,160 | |
| | | | | | | | |
| | | | | | | 254,856,446 | |
| | | | | | | | |
| | |
IT Services—3.6% | | | | | | | | |
Accenture plc - Class A | | | 211,724 | | | | 23,986,212 | |
Alliance Data Systems Corp. (b) | | | 20,005 | | | | 3,919,380 | |
Automatic Data Processing, Inc. | | | 154,615 | | | | 14,204,480 | |
Cognizant Technology Solutions Corp. - Class A (b) | | | 205,641 | | | | 11,770,891 | |
CSRA, Inc. | | | 46,558 | | | | 1,090,854 | |
Fidelity National Information Services, Inc. | | | 94,181 | | | | 6,939,256 | |
Fiserv, Inc. (b) | | | 75,462 | | | | 8,204,983 | |
Global Payments, Inc. | | | 52,269 | | | | 3,730,961 | |
International Business Machines Corp. | | | 299,759 | | | | 45,497,421 | |
MasterCard, Inc. - Class A | | | 329,504 | | | | 29,016,122 | |
Paychex, Inc. (a) | | | 108,785 | | | | 6,472,707 | |
PayPal Holdings, Inc. (b) | | | 374,355 | | | | 13,667,701 | |
Teradata Corp. (b) | | | 44,123 | | | | 1,106,164 | |
Total System Services, Inc. | | | 57,334 | | | | 3,045,009 | |
Visa, Inc. - Class A (a) | | | 646,514 | | | | 47,951,943 | |
Western Union Co. (The) (a) | | | 166,699 | | | | 3,197,287 | |
Xerox Corp. | | | 323,197 | | | | 3,067,140 | |
| | | | | | | | |
| | | | | | | 226,868,511 | |
| | | | | | | | |
| | |
Leisure Products—0.1% | | | | | | | | |
Hasbro, Inc. | | | 38,093 | | | | 3,199,431 | |
Mattel, Inc. (a) | | | 115,552 | | | | 3,615,622 | |
| | | | | | | | |
| | | | | | | 6,815,053 | |
| | | | | | | | |
| |
Life Sciences Tools & Services—0.6% | | | | | |
Agilent Technologies, Inc. | | | 111,249 | | | | 4,935,006 | |
Illumina, Inc. (b) | | | 49,962 | | | | 7,013,666 | |
PerkinElmer, Inc. | | | 37,006 | | | | 1,939,854 | |
Thermo Fisher Scientific, Inc. | | | 133,564 | | | | 19,735,417 | |
Waters Corp. (b) | | | 27,473 | | | | 3,864,077 | |
| | | | | | | | |
| | | | | | | 37,488,020 | |
| | | | | | | | |
| | |
Machinery—1.2% | | | | | | | | |
Caterpillar, Inc. (a) | | | 198,174 | | | | 15,023,571 | |
Cummins, Inc. | | | 53,775 | | | | 6,046,461 | |
Deere & Co. (a) | | | 101,331 | | | | 8,211,864 | |
Dover Corp. | | | 52,660 | | | | 3,650,391 | |
Flowserve Corp. (a) | | | 44,248 | | | | 1,998,682 | |
Illinois Tool Works, Inc. | | | 109,778 | | | | 11,434,477 | |
Ingersoll-Rand plc | | | 87,387 | | | | 5,564,804 | |
PACCAR, Inc. | | | 118,952 | | | | 6,170,040 | |
Parker-Hannifin Corp. | | | 45,713 | | | | 4,939,290 | |
Pentair plc | | | 61,337 | | | | 3,575,334 | |
Snap-on, Inc. | | | 19,736 | | | | 3,114,736 | |
Stanley Black & Decker, Inc. | | | 50,952 | | | | 5,666,881 | |
Xylem, Inc. | | | 60,720 | | | | 2,711,148 | |
| | | | | | | | |
| | | | | | | 78,107,679 | |
| | | | | | | | |
See accompanying notes to financial statements.
MSF-7
Metropolitan Series Fund
MetLife Stock Index Portfolio
Schedule of Investments as of June 30, 2016 (Unaudited)
Common Stocks—(Continued)
| | | | | | | | |
| Security Description | | Shares | | | Value | |
| | |
Media—2.7% | | | | | | | | |
CBS Corp. - Class B | | | 140,963 | | | $ | 7,674,026 | |
Comcast Corp. - Class A | | | 820,620 | | | | 53,496,218 | |
Discovery Communications, Inc. - Class A (a) (b) | | | 51,075 | | | | 1,288,622 | |
Discovery Communications, Inc. - Class C (b) | | | 81,036 | | | | 1,932,709 | |
Interpublic Group of Cos., Inc. (The) | | | 136,582 | | | | 3,155,044 | |
News Corp. - Class A | | | 129,172 | | | | 1,466,102 | |
News Corp. - Class B (a) | | | 36,588 | | | | 426,982 | |
Omnicom Group, Inc. (a) | | | 80,696 | | | | 6,575,917 | |
Scripps Networks Interactive, Inc. - Class A (a) | | | 32,253 | | | | 2,008,394 | |
TEGNA, Inc. | | | 73,852 | | | | 1,711,151 | |
Time Warner, Inc. | | | 266,913 | | | | 19,628,782 | |
Twenty-First Century Fox, Inc. - Class A | | | 371,905 | | | | 10,060,030 | |
Twenty-First Century Fox, Inc. - Class B | | | 146,356 | | | | 3,988,201 | |
Viacom, Inc. - Class B | | | 117,644 | | | | 4,878,697 | |
Walt Disney Co. (The) | | | 506,626 | | | | 49,558,155 | |
| | | | | | | | |
| | | | | | | 167,849,030 | |
| | | | | | | | |
| | |
Metals & Mining—0.3% | | | | | | | | |
Alcoa, Inc. (a) | | | 446,366 | | | | 4,137,813 | |
Freeport-McMoRan, Inc. (a) | | | 424,994 | | | | 4,734,433 | |
Newmont Mining Corp. | | | 180,069 | | | | 7,044,299 | |
Nucor Corp. | | | 107,909 | | | | 5,331,784 | |
| | | | | | | | |
| | | | | | | 21,248,329 | |
| | | | | | | | |
| | |
Multi-Utilities—1.2% | | | | | | | | |
Ameren Corp. | | | 82,353 | | | | 4,412,474 | |
CenterPoint Energy, Inc. | | | 146,158 | | | | 3,507,792 | |
CMS Energy Corp. | | | 94,749 | | | | 4,345,189 | |
Consolidated Edison, Inc. (a) | | | 103,236 | | | | 8,304,304 | |
Dominion Resources, Inc. | | | 209,153 | | | | 16,299,293 | |
DTE Energy Co. | | | 60,903 | | | | 6,036,705 | |
NiSource, Inc. | | | 109,136 | | | | 2,894,287 | |
Public Service Enterprise Group, Inc. | | | 171,719 | | | | 8,003,823 | |
SCANA Corp. | | | 48,508 | | | | 3,670,115 | |
Sempra Energy | | | 80,449 | | | | 9,172,795 | |
TECO Energy, Inc. | | | 79,949 | | | | 2,209,790 | |
WEC Energy Group, Inc. (a) | | | 107,135 | | | | 6,995,916 | |
| | | | | | | | |
| | | | | | | 75,852,483 | |
| | | | | | | | |
| | |
Multiline Retail—0.6% | | | | | | | | |
Dollar General Corp. | | | 96,318 | | | | 9,053,892 | |
Dollar Tree, Inc. (b) | | | 79,954 | | | | 7,534,865 | |
Kohl’s Corp. | | | 62,353 | | | | 2,364,426 | |
Macy’s, Inc. | | | 104,673 | | | | 3,518,059 | |
Nordstrom, Inc. | | | 43,561 | | | | 1,657,496 | |
Target Corp. | | | 200,008 | | | | 13,964,559 | |
| | | | | | | | |
| | | | | | | 38,093,297 | |
| | | | | | | | |
| | |
Oil, Gas & Consumable Fuels—6.2% | | | | | | | | |
Anadarko Petroleum Corp. | | | 173,246 | | | | 9,225,349 | |
Apache Corp. | | | 128,480 | | | | 7,152,482 | |
Cabot Oil & Gas Corp. | | | 157,827 | | | | 4,062,467 | |
Chesapeake Energy Corp. (a) (b) | | | 198,502 | | | | 849,589 | |
|
Oil, Gas & Consumable Fuels—(Continued) | |
Chevron Corp. | | | 639,695 | | | | 67,059,227 | |
Cimarex Energy Co. | | | 32,182 | | | | 3,839,956 | |
Columbia Pipeline Group, Inc. | | | 135,711 | | | | 3,459,273 | |
Concho Resources, Inc. (b) | | | 44,242 | | | | 5,276,743 | |
ConocoPhillips | | | 420,326 | | | | 18,326,214 | |
Devon Energy Corp. | | | 177,853 | | | | 6,447,171 | |
EOG Resources, Inc. | | | 186,772 | | | | 15,580,520 | |
EQT Corp. | | | 58,629 | | | | 4,539,643 | |
Exxon Mobil Corp. | | | 1,407,420 | | | | 131,931,551 | |
Hess Corp. | | | 89,472 | | | | 5,377,267 | |
Kinder Morgan, Inc. | | | 621,086 | | | | 11,626,730 | |
Marathon Oil Corp. | | | 287,704 | | | | 4,318,437 | |
Marathon Petroleum Corp. | | | 179,833 | | | | 6,826,461 | |
Murphy Oil Corp. (a) | | | 54,938 | | | | 1,744,282 | |
Newfield Exploration Co. (b) | | | 66,764 | | | | 2,949,634 | |
Noble Energy, Inc. | | | 145,463 | | | | 5,217,758 | |
Occidental Petroleum Corp. | | | 259,225 | | | | 19,587,041 | |
ONEOK, Inc. | | | 71,312 | | | | 3,383,754 | |
Phillips 66 | | | 158,767 | | | | 12,596,574 | |
Pioneer Natural Resources Co. | | | 55,514 | | | | 8,394,272 | |
Range Resources Corp. | | | 57,614 | | | | 2,485,468 | |
Southwestern Energy Co. (b) | | | 160,649 | | | | 2,020,964 | |
Spectra Energy Corp. | | | 232,230 | | | | 8,506,585 | |
Tesoro Corp. | | | 40,723 | | | | 3,050,967 | |
Valero Energy Corp. | | | 159,458 | | | | 8,132,358 | |
Williams Cos., Inc. (The) | | | 231,826 | | | | 5,014,396 | |
| | | | | | | | |
| | | | | | | 388,983,133 | |
| | | | | | | | |
| | |
Personal Products—0.1% | | | | | | | | |
Estee Lauder Cos., Inc. (The) - Class A | | | 75,547 | | | | 6,876,288 | |
| | | | | | | | |
| | |
Pharmaceuticals—5.7% | | | | | | | | |
Allergan plc (b) | | | 134,258 | | | | 31,025,681 | |
Bristol-Myers Squibb Co. | | | 566,587 | | | | 41,672,474 | |
Eli Lilly & Co. | | | 329,699 | | | | 25,963,796 | |
Endo International plc (a) (b) | | | 69,529 | | | | 1,083,957 | |
Johnson & Johnson | | | 933,609 | | | | 113,246,772 | |
Mallinckrodt plc (b) | | | 37,107 | | | | 2,255,364 | |
Merck & Co., Inc. | | | 939,508 | | | | 54,125,056 | |
Mylan NV (b) | | | 144,939 | | | | 6,267,162 | |
Perrigo Co. plc (a) | | | 48,612 | | | | 4,407,650 | |
Pfizer, Inc. | | | 2,058,498 | | | | 72,479,715 | |
Zoetis, Inc. | | | 154,944 | | | | 7,353,642 | |
| | | | | | | | |
| | | | | | | 359,881,269 | |
| | | | | | | | |
| | |
Professional Services—0.3% | | | | | | | | |
Dun & Bradstreet Corp. (The) | | | 12,307 | | | | 1,499,485 | |
Equifax, Inc. | | | 40,395 | | | | 5,186,718 | |
Nielsen Holdings plc | | | 122,462 | | | | 6,364,350 | |
Robert Half International, Inc. | | | 44,571 | | | | 1,700,829 | |
Verisk Analytics, Inc. (b) | | | 52,512 | | | | 4,257,673 | |
| | | | | | | | |
| | | | | | | 19,009,055 | |
| | | | | | | | |
| |
Real Estate Investment Trusts—3.1% | | | | | |
American Tower Corp. | | | 144,102 | | | | 16,371,428 | |
See accompanying notes to financial statements.
MSF-8
Metropolitan Series Fund
MetLife Stock Index Portfolio
Schedule of Investments as of June 30, 2016 (Unaudited)
Common Stocks—(Continued)
| | | | | | | | |
| Security Description | | Shares | | | Value | |
|
Real Estate Investment Trusts—(Continued) | |
Apartment Investment & Management Co. - Class A | | | 53,155 | | | $ | 2,347,325 | |
AvalonBay Communities, Inc. | | | 46,555 | | | | 8,398,056 | |
Boston Properties, Inc. | | | 52,138 | | | | 6,877,002 | |
Crown Castle International Corp. | | | 114,348 | | | | 11,598,318 | |
Digital Realty Trust, Inc. (a) | | | 49,833 | | | | 5,431,299 | |
Equinix, Inc. | | | 23,566 | | | | 9,137,245 | |
Equity Residential | | | 124,057 | | | | 8,545,046 | |
Essex Property Trust, Inc. | | | 22,208 | | | | 5,065,423 | |
Extra Space Storage, Inc. | | | 42,498 | | | | 3,932,765 | |
Federal Realty Investment Trust | | | 24,066 | | | | 3,984,126 | |
General Growth Properties, Inc. | | | 197,848 | | | | 5,899,827 | |
HCP, Inc. | | | 158,536 | | | | 5,609,004 | |
Host Hotels & Resorts, Inc. (a) | | | 253,649 | | | | 4,111,650 | |
Iron Mountain, Inc. | | | 81,124 | | | | 3,231,169 | |
Kimco Realty Corp. | | | 142,435 | | | | 4,469,610 | |
Macerich Co. (The) | | | 42,840 | | | | 3,658,108 | |
Prologis, Inc. | | | 178,317 | | | | 8,744,666 | |
Public Storage | | | 50,021 | | | | 12,784,867 | |
Realty Income Corp. | | | 87,443 | | | | 6,065,047 | |
Simon Property Group, Inc. | | | 105,018 | | | | 22,778,404 | |
SL Green Realty Corp. | | | 34,022 | | | | 3,622,322 | |
UDR, Inc. | | | 90,670 | | | | 3,347,536 | |
Ventas, Inc. | | | 114,767 | | | | 8,357,333 | |
Vornado Realty Trust | | | 60,227 | | | | 6,029,927 | |
Welltower, Inc. | | | 121,169 | | | | 9,229,443 | |
Weyerhaeuser Co. | | | 253,567 | | | | 7,548,690 | |
| | | | | | | | |
| | | | | | | 197,175,636 | |
| | | | | | | | |
|
Real Estate Management & Development—0.0% | |
CBRE Group, Inc. - Class A (b) | | | 99,051 | | | | 2,622,870 | |
| | | | | | | | |
| | |
Road & Rail—0.8% | | | | | | | | |
CSX Corp. | | | 324,435 | | | | 8,461,265 | |
J.B. Hunt Transport Services, Inc. | | | 30,207 | | | | 2,444,652 | |
Kansas City Southern | | | 36,653 | | | | 3,302,069 | |
Norfolk Southern Corp. | | | 100,378 | | | | 8,545,179 | |
Ryder System, Inc. | | | 18,227 | | | | 1,114,399 | |
Union Pacific Corp. | | | 285,459 | | | | 24,906,298 | |
| | | | | | | | |
| | | | | | | 48,773,862 | |
| | | | | | | | |
|
Semiconductors & Semiconductor Equipment—2.8% | |
Analog Devices, Inc. | | | 104,319 | | | | 5,908,628 | |
Applied Materials, Inc. | | | 369,671 | | | | 8,861,014 | |
Broadcom, Ltd. | | | 125,898 | | | | 19,564,549 | |
First Solar, Inc. (a) (b) | | | 26,027 | | | | 1,261,789 | |
Intel Corp. | | | 1,602,715 | | | | 52,569,052 | |
KLA-Tencor Corp. | | | 52,849 | | | | 3,871,189 | |
Lam Research Corp. | | | 54,170 | | | | 4,553,530 | |
Linear Technology Corp. | | | 81,153 | | | | 3,776,049 | |
Microchip Technology, Inc. (a) | | | 72,913 | | | | 3,701,064 | |
Micron Technology, Inc. (b) | | | 351,986 | | | | 4,843,327 | |
NVIDIA Corp. (a) | | | 172,185 | | | | 8,094,417 | |
Qorvo, Inc. (b) | | | 43,285 | | | | 2,391,929 | |
QUALCOMM, Inc. | | | 498,571 | | | | 26,708,449 | |
Skyworks Solutions, Inc. (a) | | | 64,569 | | | | 4,085,926 | |
|
Semiconductors & Semiconductor Equipment—(Continued) | |
Texas Instruments, Inc. | | | 340,849 | | | | 21,354,190 | |
Xilinx, Inc. | | | 86,119 | | | | 3,972,670 | |
| | | | | | | | |
| | | | | | | 175,517,772 | |
| | | | | | | | |
| | |
Software—4.1% | | | | | | | | |
Activision Blizzard, Inc. | | | 172,890 | | | | 6,851,631 | |
Adobe Systems, Inc. (b) | | | 169,779 | | | | 16,263,130 | |
Autodesk, Inc. (b) | | | 76,228 | | | | 4,126,984 | |
CA, Inc. | | | 100,435 | | | | 3,297,281 | |
Citrix Systems, Inc. (b) | | | 52,644 | | | | 4,216,258 | |
Electronic Arts, Inc. (b) | | | 102,371 | | | | 7,755,627 | |
Intuit, Inc. | | | 86,846 | | | | 9,692,882 | |
Microsoft Corp. | | | 2,667,957 | | | | 136,519,360 | |
Oracle Corp. | | | 1,056,393 | | | | 43,238,165 | |
Red Hat, Inc. (b) | | | 61,582 | | | | 4,470,853 | |
Salesforce.com, Inc. (b) | | | 216,156 | | | | 17,164,948 | |
Symantec Corp. | | | 207,820 | | | | 4,268,623 | |
| | | | | | | | |
| | | | | | | 257,865,742 | |
| | | | | | | | |
| | |
Specialty Retail—2.5% | | | | | | | | |
Advance Auto Parts, Inc. | | | 24,966 | | | | 4,035,255 | |
AutoNation, Inc. (a) (b) | | | 24,146 | | | | 1,134,379 | |
AutoZone, Inc. (b) | | | 10,135 | | | | 8,045,568 | |
Bed Bath & Beyond, Inc. (a) | | | 52,394 | | | | 2,264,469 | |
Best Buy Co., Inc. (a) | | | 95,697 | | | | 2,928,328 | |
CarMax, Inc. (a) (b) | | | 65,788 | | | | 3,225,586 | |
Foot Locker, Inc. | | | 46,192 | | | | 2,534,093 | |
Gap, Inc. (The) | | | 76,992 | | | | 1,633,770 | |
Home Depot, Inc. (The) | | | 422,234 | | | | 53,915,059 | |
L Brands, Inc. (a) | | | 85,872 | | | | 5,764,587 | |
Lowe’s Cos., Inc. | | | 300,757 | | | | 23,810,932 | |
O’Reilly Automotive, Inc. (b) | | | 32,739 | | | | 8,875,543 | |
Ross Stores, Inc. | | | 136,378 | | | | 7,731,269 | |
Signet Jewelers, Ltd. (a) | | | 26,476 | | | | 2,181,887 | |
Staples, Inc. | | | 219,360 | | | | 1,890,883 | |
Tiffany & Co. (a) | | | 37,212 | | | | 2,256,536 | |
TJX Cos., Inc. (The) | | | 224,381 | | | | 17,328,945 | |
Tractor Supply Co. | | | 45,287 | | | | 4,129,269 | |
Ulta Salon Cosmetics & Fragrance, Inc. (b) | | | 21,198 | | | | 5,164,681 | |
Urban Outfitters, Inc. (b) | | | 29,415 | | | | 808,912 | |
| | | | | | | | |
| | | | | | | 159,659,951 | |
| | | | | | | | |
|
Technology Hardware, Storage & Peripherals—3.5% | |
Apple, Inc. | | | 1,859,118 | | | | 177,731,681 | |
EMC Corp. | | | 662,943 | | | | 18,012,161 | |
Hewlett Packard Enterprise Co. | | | 564,010 | | | | 10,304,463 | |
HP, Inc. | | | 580,605 | | | | 7,286,593 | |
NetApp, Inc. | | | 98,119 | | | | 2,412,746 | |
Seagate Technology plc (a) | | | 101,309 | | | | 2,467,887 | |
Western Digital Corp. (a) | | | 95,523 | | | | 4,514,417 | |
| | | | | | | | |
| | | | 222,729,948 | |
| | | | | | | | |
|
Textiles, Apparel & Luxury Goods—0.8% | |
Coach, Inc. (a) | | | 94,367 | | | | 3,844,512 | |
Hanesbrands, Inc. | | | 128,134 | | | | 3,220,007 | |
See accompanying notes to financial statements.
MSF-9
Metropolitan Series Fund
MetLife Stock Index Portfolio
Schedule of Investments as of June 30, 2016 (Unaudited)
Common Stocks—(Continued)
| | | | | | | | |
| Security Description | | Shares/ Principal
Amount* | | | Value | |
|
Textiles, Apparel & Luxury Goods—(Continued) | |
Michael Kors Holdings, Ltd. (a) (b) | | | 59,897 | | | $ | 2,963,704 | |
NIKE, Inc. - Class B | | | 451,920 | | | | 24,945,984 | |
PVH Corp. | | | 27,506 | | | | 2,591,890 | |
Ralph Lauren Corp. (a) | | | 19,354 | | | | 1,734,506 | |
Under Armour, Inc. - Class A (a) (b) | | | 62,160 | | | | 2,494,481 | |
Under Armour, Inc. - Class C (b) | | | 62,477 | | | | 2,274,160 | |
VF Corp. | | | 113,233 | | | | 6,962,697 | |
| | | | | | | | |
| | | | 51,031,941 | |
| | | | | | | | |
| | |
Tobacco—1.8% | | | | | | | | |
Altria Group, Inc. | | | 664,039 | | | | 45,792,129 | |
Philip Morris International, Inc. | | | 526,522 | | | | 53,557,818 | |
Reynolds American, Inc. | | | 280,987 | | | | 15,153,629 | |
| | | | | | | | |
| | | | 114,503,576 | |
| | | | | | | | |
|
Trading Companies & Distributors—0.2% | |
Fastenal Co. | | | 98,051 | | | | 4,352,484 | |
United Rentals, Inc. (b) | | | 30,039 | | | | 2,015,617 | |
WW Grainger, Inc. (a) | | | 19,149 | | | | 4,351,610 | |
| | | | | | | | |
| | | | 10,719,711 | |
| | | | | | | | |
| | |
Water Utilities—0.1% | | | | | | | | |
American Water Works Co., Inc. | | | 60,319 | | | | 5,097,559 | |
| | | | | | | | |
Total Common Stocks
(Cost $3,592,004,011) | | | | | | | 6,181,758,629 | |
| | | | | | | | |
| | |
| Mutual Fund—1.7% | | | | | | | | |
|
Investment Company Security—1.7% | |
SPDR S&P 500 ETF Trust
(Cost $109,135,135) | | | 523,000 | | | | 109,584,190 | |
| | | | | | | | |
|
| Short-Term Investments—3.9% | |
| | |
Discount Notes—0.5% | | | | | | | | |
Federal Home Loan Bank | | | | | | | | |
0.232%, 07/21/16 (e) | | | 6,400,000 | | | | 6,399,147 | |
0.265%, 07/20/16 (e) | | | 175,000 | | | | 174,975 | |
0.269%, 07/19/16 (e) | | | 175,000 | | | | 174,975 | |
0.372%, 07/12/16 (e) | | | 500,000 | | | | 499,939 | |
0.390%, 09/07/16 (e) | | | 650,000 | | | | 649,521 | |
0.392%, 10/07/16 (e) | | | 5,650,000 | | | | 5,644,002 | |
0.393%, 08/19/16 (e) | | | 5,200,000 | | | | 5,197,205 | |
0.401%, 09/14/16 (e) | | | 2,225,000 | | | | 2,223,146 | |
0.437%, 10/12/16 (e) | | | 2,200,000 | | | | 2,197,262 | |
0.447%, 10/21/16 (e) | | | 6,600,000 | | | | 6,590,883 | |
0.449%, 08/26/16 (e) | | | 725,000 | | | | 724,492 | |
0.459%, 07/22/16 (e) | | | 550,000 | | | | 549,848 | |
| | | | | | | | |
| | | | 31,025,395 | |
| | | | | | | | |
|
Mutual Fund—3.3% | |
State Street Navigator Securities Lending MET Portfolio (f) | | | 213,311,587 | | | | 213,311,587 | |
| | | | | | | | |
|
U.S. Treasury—0.1% | |
U.S. Treasury Bills | | | | | | | | |
0.179%, 07/07/16 (e) | | | 2,000,000 | | | | 1,999,931 | |
0.241%, 09/29/16 (e) | | | 1,775,000 | | | | 1,773,935 | |
| | | | | | | | |
| | | | | | | 3,773,866 | |
| | | | | | | | |
Total Short-Term Investments
(Cost $248,110,848) | | | | | | | 248,110,848 | |
| | | | | | | | |
Total Investments—103.4%
(Cost $3,949,249,994) (g) | | | | | | | 6,539,453,667 | |
Other assets and liabilities
(net)—(3.4)% | | | | | | | (217,551,678 | ) |
| | | | | | | | |
| Net Assets—100.0% | | | | | | $ | 6,321,901,989 | |
| | | | | | | | |
| * | Principal amount stated in U.S. dollars unless otherwise noted. |
| (a) | All or a portion of the security was held on loan. As of June 30, 2016, the market value of securities loaned was $313,761,129 and the collateral received consisted of cash in the amount of $213,311,587 and non-cash collateral with a value of $104,494,986. The cash collateral is invested in a money market fund managed by an affiliate of the custodian. The non-cash collateral received consists primarily of government securities and bank letters of credit, and is held for the benefit of the Portfolio at the Portfolio’s custodian. The Portfolio cannot repledge or resell this collateral. As such, this collateral is excluded from the Statement of Assets and Liabilities. |
| (b) | Non-income producing security. |
| (c) | Affiliated Issuer. (See Note 7 of the Notes to Financial Statements for a summary of transactions in securities of affiliated issuers.) |
| (d) | All or a portion of the security was pledged as collateral against open futures contracts. As of June 30, 2016, the market value of securities pledged was $13,880,066. |
| (e) | The rate shown represents current yield to maturity. |
| (f) | Represents investment of cash collateral received from securities on loan as of June 30, 2016. |
| (g) | As of June 30, 2016, the aggregate cost of investments was $3,949,249,994. The aggregate unrealized appreciation and depreciation of investments were $2,710,322,885 and $(120,119,212), respectively, resulting in net unrealized appreciation of $2,590,203,673. |
| (ETF)— | Exchange-Traded Fund |
See accompanying notes to financial statements.
MSF-10
Metropolitan Series Fund
MetLife Stock Index Portfolio
Schedule of Investments as of June 30, 2016 (Unaudited)
Futures Contracts
| | | | | | | | | | | | | | | | | | | | |
Futures Contracts—Long | | Expiration
Date | | | Number of
Contracts | | | Notional
Amount | | | Unrealized
Depreciation | |
S&P 500 Index Futures | | | 09/15/16 | | | | 60 | | | | USD | | | | 31,636,666 | | | $ | (283,666 | ) |
| | | | | | | | | | | | | | | | | | | | |
| (USD)— | United States Dollar |
Fair Value Hierarchy
Accounting principles generally accepted in the United States of America (“GAAP”) define fair market value as the price that the Portfolio would receive to sell an asset or pay to transfer a liability in an orderly transaction between market participants at the measurement date. It establishes a fair value hierarchy that prioritizes inputs to valuation methods and requires disclosure of the fair value hierarchy, separately for each major category of assets and liabilities, that segregates fair value measurements into three levels. Levels 1, 2 and 3 of the fair value hierarchy are defined as follows:
Level 1 - unadjusted quoted prices in active markets for identical investments
Level 2 - other significant observable inputs (including, but not limited to, quoted prices for similar assets or liabilities in markets that are either active or inactive; inputs other than quoted prices that are observable such as interest rates, yield curves, volatilities, prepayment speeds, loss severities, credit risks, default rates, or other market corroborated inputs)
Level 3 - significant unobservable inputs based on the best information available in the circumstances, to the extent observable inputs are unavailable (including the Portfolio’s own assumptions used in determining the fair value of investments and derivative financial instruments)
The inputs or methodologies used for valuing investments are not necessarily an indication of the risk associated with investing in them. Changes to the inputs or methodologies used may result in transfers between levels, which will be recognized as of the beginning of the reporting period. Information on transfers between Level 1 and Level 2, if any, will be disclosed following the fair value hierarchy table below. A reconciliation of Level 3 securities, if any, will also be disclosed following the fair value hierarchy table. For more information about the Portfolio’s policy regarding the valuation of investments, please refer to the Notes to Financial Statements.
The following table summarizes the fair value hierarchy of the Portfolio’s investments as of June 30, 2016:
| | | | | | | | | | | | | | | | |
| Description | | Level 1 | | | Level 2 | | | Level 3 | | | Total | |
Total Common Stocks* | | $ | 6,181,758,629 | | | $ | — | | | $ | — | | | $ | 6,181,758,629 | |
Total Mutual Fund* | | | 109,584,190 | | | | — | | | | — | | | | 109,584,190 | |
| Short-Term Investments | | | | | | | | | | | | | | | | |
Discount Notes | | | — | | | | 31,025,395 | | | | — | | | | 31,025,395 | |
Mutual Fund | | | 213,311,587 | | | | — | | | | — | | | | 213,311,587 | |
U.S. Treasury | | | — | | | | 3,773,866 | | | | — | | | | 3,773,866 | |
Total Short-Term Investments | | | 213,311,587 | | | | 34,799,261 | | | | — | | | | 248,110,848 | |
Total Investments | | $ | 6,504,654,406 | | | $ | 34,799,261 | | | $ | — | | | $ | 6,539,453,667 | |
| | | | | | | | | | | | | | | | | |
Collateral for Securities Loaned (Liability) | | $ | — | | | $ | (213,311,587 | ) | | $ | — | | | $ | (213,311,587 | ) |
| Futures Contracts | | | | | | | | | | | | | | | | |
Futures Contracts (Unrealized Depreciation) | | $ | (283,666 | ) | | $ | — | | | $ | — | | | $ | (283,666 | ) |
| * | See Schedule of Investments for additional detailed categorizations. |
See accompanying notes to financial statements.
MSF-11
Metropolitan Series Fund
MetLife Stock Index Portfolio
Statement of Assets and Liabilities
June 30, 2016 (Unaudited)
| | | | |
Assets | | | | |
Investments at value (a) (b) | | $ | 6,524,600,941 | |
Affiliated investments at value (c) | | | 14,852,726 | |
Cash | | | 283,148 | |
Receivable for: | | | | |
Fund shares sold | | | 895,944 | |
Dividends | | | 7,575,183 | |
Variation margin on futures contracts | | | 351,000 | |
Prepaid expenses | | | 40,063 | |
| | | | |
Total Assets | | | 6,548,599,005 | |
Liabilities | | | | |
Collateral for securities loaned | | | 213,311,587 | |
Payables for: | | | | |
Investments purchased | | | 7,252,612 | |
Fund shares redeemed | | | 3,763,937 | |
Accrued Expenses: | | | | |
Management fees | | | 1,221,173 | |
Distribution and service fees | | | 415,595 | |
Deferred trustees’ fees | | | 98,012 | |
Other expenses | | | 634,100 | |
| | | | |
Total Liabilities | | | 226,697,016 | |
| | | | |
Net Assets | | $ | 6,321,901,989 | |
| | | | |
Net Assets Consist of: | | | | |
Paid in surplus | | $ | 3,692,297,796 | |
Undistributed net investment income | | | 61,071,748 | |
Accumulated net realized loss | | | (21,387,562 | ) |
Unrealized appreciation on investments, affiliated investments and futures contracts | | | 2,589,920,007 | |
| | | | |
Net Assets | | $ | 6,321,901,989 | |
| | | | |
Net Assets | | | | |
Class A | | $ | 4,175,902,176 | |
Class B | | | 1,922,017,959 | |
Class D | | | 69,603,810 | |
Class E | | | 141,618,644 | |
Class G | | | 12,759,400 | |
Capital Shares Outstanding* | | | | |
Class A | | | 97,693,663 | |
Class B | | | 46,587,024 | |
Class D | | | 1,632,042 | |
Class E | | | 3,333,701 | |
Class G | | | 309,730 | |
Net Asset Value, Offering Price and Redemption Price Per Share | | | | |
Class A | | $ | 42.74 | |
Class B | | | 41.26 | |
Class D | | | 42.65 | |
Class E | | | 42.48 | |
Class G | | | 41.20 | |
| * | The Portfolio is authorized to issue an unlimited number of shares. |
| (a) | Identified cost of investments, excluding affiliated investments, was $3,933,964,682. |
| (b) | Includes securities loaned at value of $313,761,129. |
| (c) | Identified cost of affiliated investments was $15,285,312. |
Statement of Operations
Six Months Ended June 30, 2016 (Unaudited)
| | | | |
Investment Income | | | | |
Dividends (a) | | $ | 69,436,058 | |
Dividends from affiliated investments | | | 290,881 | |
Interest | | | 56,493 | |
Securities lending income | | | 430,253 | |
| | | | |
Total investment income | | | 70,213,685 | |
Expenses | | | | |
Management fees | | | 7,583,557 | |
Administration fees | | | 76,482 | |
Custodian and accounting fees | | | 158,697 | |
Distribution and service fees—Class B | | | 2,300,466 | |
Distribution and service fees—Class D | | | 36,738 | |
Distribution and service fees—Class E | | | 103,362 | |
Distribution and service fees—Class G | | | 15,918 | |
Audit and tax services | | | 20,230 | |
Legal | | | 13,696 | |
Trustees’ fees and expenses | | | 15,988 | |
Shareholder reporting | | | 254,160 | |
Insurance | | | 20,892 | |
Miscellaneous | | | 101,888 | |
| | | | |
Total expenses | | | 10,702,074 | |
Less management fee waiver | | | (367,992 | ) |
| | | | |
Net expenses | | | 10,334,082 | |
| | | | |
Net Investment Income | | | 59,879,603 | |
| | | | |
Net Realized and Unrealized Gain | | | | |
| Net realized gain (loss) on: | | | | |
Investments | | | 107,517,353 | |
Affiliated investments | | | (40,711 | ) |
Futures contracts | | | 1,153,588 | |
| | | | |
Net realized gain | | | 108,630,230 | |
| | | | |
| Net change in unrealized appreciation (depreciation) on: | | | | |
Investments | | | 56,980,859 | |
Affiliated investments | | | (3,093,514 | ) |
Futures contracts | | | (54,750 | ) |
| | | | |
Net change in unrealized appreciation | | | 53,832,595 | |
| | | | |
Net realized and unrealized gain | | | 162,462,825 | |
| | | | |
Net Increase in Net Assets From Operations | | $ | 222,342,428 | |
| | | | |
| (a) | Net of foreign withholding taxes of $21,067. |
See accompanying notes to financial statements.
MSF-12
Metropolitan Series Fund
MetLife Stock Index Portfolio
Statements of Changes in Net Assets
| | | | | | | | |
| | | Six Months
Ended
June 30, 2016
(Unaudited) | | | Year Ended
December 31,
2015 | |
Increase (Decrease) in Net Assets: | | | | | | | | |
From Operations | | | | | | | | |
Net investment income | | $ | 59,879,603 | | | $ | 116,616,898 | |
Net realized gain | | | 108,630,230 | | | | 285,658,755 | |
Net change in unrealized appreciation (depreciation) | | | 53,832,595 | | | | (327,512,527 | ) |
| | | | | | | | |
Increase in net assets from operations | | | 222,342,428 | | | | 74,763,126 | |
| | | | | | | | |
From Distributions to Shareholders | | | | | | | | |
Net investment income | | | | | | | | |
Class A | | | (82,857,392 | ) | | | (73,614,161 | ) |
Class B | | | (34,449,077 | ) | | | (30,456,704 | ) |
Class D | | | (1,352,543 | ) | | | (1,804,092 | ) |
Class E | | | (2,620,458 | ) | | | (2,445,450 | ) |
Class G | | | (221,158 | ) | | | (50,027 | ) |
Net realized capital gains | | | | | | | | |
Class A | | | (181,662,999 | ) | | | (177,074,360 | ) |
Class B | | | (86,318,673 | ) | | | (85,896,734 | ) |
Class D | | | (3,124,405 | ) | | | (4,613,354 | ) |
Class E | | | (6,212,616 | ) | | | (6,448,300 | ) |
Class G | | | (570,749 | ) | | | (146,175 | ) |
| | | | | | | | |
Total distributions | | | (399,390,070 | ) | | | (382,549,357 | ) |
| | | | | | | | |
Increase (decrease) in net assets from capital share transactions | | | 262,337,289 | | | | (81,924,353 | ) |
| | | | | | | | |
Total increase (decrease) in net assets | | | 85,289,647 | | | | (389,710,584 | ) |
| | |
Net Assets | | | | | | | | |
Beginning of period | | | 6,236,612,342 | | | | 6,626,322,926 | |
| | | | | | | | |
End of period | | $ | 6,321,901,989 | | | $ | 6,236,612,342 | |
| | | | | | | | |
Undistributed net investment income | | | | | | | | |
End of period | | $ | 61,071,748 | | | $ | 122,692,773 | |
| | | | | | | | |
Other Information:
Capital Shares
Transactions in capital shares were as follows:
| | | | | | | | | | | | | | | | |
| | | Six Months Ended
June 30, 2016
(Unaudited) | | | Year Ended
December 31, 2015 | |
| | | Shares | | | Value | | | Shares | | | Value | |
Class A | | | | | | | | | | | | | | | | |
Sales | | | 2,903,809 | | | $ | 125,829,198 | | | | 4,408,353 | | | $ | 197,974,631 | |
Reinvestments | | | 6,272,715 | | | | 264,520,391 | | | | 5,596,975 | | | | 250,688,521 | |
Redemptions | | | (4,769,409 | ) | | | (207,283,332 | ) | | | (9,668,977 | ) | | | (436,539,916 | ) |
| | | | | | | | | | | | | | | | |
Net increase | | | 4,407,115 | | | $ | 183,066,257 | | | | 336,351 | | | $ | 12,123,236 | |
| | | | | | | | | | | | | | | | |
Class B | | | | | | | | | | | | | | | | |
Sales | | | 1,811,100 | | | $ | 76,103,035 | | | | 2,909,978 | | | $ | 126,781,458 | |
Reinvestments | | | 2,967,266 | | | | 120,767,750 | | | | 2,685,287 | | | | 116,353,438 | |
Redemptions | | | (2,658,905 | ) | | | (112,159,482 | ) | | | (6,413,569 | ) | | | (280,296,296 | ) |
| | | | | | | | | | | | | | | | |
Net increase (decrease) | | | 2,119,461 | | | $ | 84,711,303 | | | | (818,304 | ) | | $ | (37,161,400 | ) |
| | | | | | | | | | | | | | | | |
Class D | | | | | | | | | | | | | | | | |
Sales | | | 154,411 | | | $ | 6,762,489 | | | | 171,240 | | | $ | 7,839,888 | |
Reinvestments | | | 106,417 | | | | 4,476,948 | | | | 143,599 | | | | 6,417,446 | |
Redemptions | | | (542,855 | ) | | | (23,272,384 | ) | | | (1,514,796 | ) | | | (68,755,233 | ) |
| | | | | | | | | | | | | | | | |
Net decrease | | | (282,027 | ) | | $ | (12,032,947 | ) | | | (1,199,957 | ) | | $ | (54,497,899 | ) |
| | | | | | | | | | | | | | | | |
Class E | | | | | | | | | | | | | | | | |
Sales | | | 34,849 | | | $ | 1,477,412 | | | | 81,125 | | | $ | 3,612,139 | |
Reinvestments | | | 210,763 | | | | 8,833,074 | | | | 199,725 | | | | 8,893,750 | |
Redemptions | | | (192,541 | ) | | | (8,265,467 | ) | | | (514,709 | ) | | | (23,229,019 | ) |
| | | | | | | | | | | | | | | | |
Net increase (decrease) | | | 53,071 | | | $ | 2,045,019 | | | | (233,859 | ) | | $ | (10,723,130 | ) |
| | | | | | | | | | | | | | | | |
Class G | | | | | | | | | | | | | | | | |
Sales | | | 100,076 | | | $ | 4,120,337 | | | | 248,691 | | | $ | 10,694,963 | |
Reinvestments | | | 19,486 | | | | 791,907 | | | | 4,535 | | | | 196,202 | |
Redemptions | | | (8,925 | ) | | | (364,587 | ) | | | (62,418 | ) | | | (2,556,325 | ) |
| | | | | | | | | | | | | | | | |
Net increase | | | 110,637 | | | $ | 4,547,657 | | | | 190,808 | | | $ | 8,334,840 | |
| | | | | | | | | | | | | | | | |
Increase (decrease) derived from capital shares transactions | | | | | | $ | 262,337,289 | | | | | | | $ | (81,924,353 | ) |
| | | | | | | | | | | | | | | | |
See accompanying notes to financial statements.
MSF-13
Metropolitan Series Fund
MetLife Stock Index Portfolio
Financial Highlights
| | | | | | | | | | | | | | | | | | | | | | | | |
| Selected per share data | | | |
| | | Class A | |
| | | Six Months
Ended
June 30,
2016
(Unaudited) | | | Year Ended December 31, | |
| | | | 2015 | | | 2014 | | | 2013 | | | 2012 | | | 2011 | |
Net Asset Value, Beginning of Period | | $ | 44.04 | | | $ | 46.21 | | | $ | 42.58 | | | $ | 33.42 | | | $ | 29.60 | | | $ | 29.71 | |
| | | | | | | | | | | | | | | | | | | | | | | | |
Income (Loss) from Investment Operations | | | | | | | | | | | | | | | | | | | | | | | | |
Net investment income (a) | | | 0.44 | | | | 0.85 | | | | 0.79 | | | | 0.71 | | | | 0.67 | | | | 0.55 | |
Net realized and unrealized gain (loss) on investments | | | 1.14 | | | | (0.26 | ) | | | 4.66 | | | | 9.72 | | | | 3.95 | | | | 0.02 | |
| | | | | | | | | | | | | | | | | | | | | | | | |
Total from investment operations | | | 1.58 | | | | 0.59 | | | | 5.45 | | | | 10.43 | | | | 4.62 | | | | 0.57 | |
| | | | | | | | | | | | | | | | | | | | | | | | |
Less Distributions | | | | | | | | | | | | | | | | | | | | | | | | |
Distributions from net investment income | | | (0.90 | ) | | | (0.81 | ) | | | (0.74 | ) | | | (0.70 | ) | | | (0.57 | ) | | | (0.50 | ) |
Distributions from net realized capital gains | | | (1.98 | ) | | | (1.95 | ) | | | (1.08 | ) | | | (0.57 | ) | | | (0.23 | ) | | | (0.18 | ) |
| | | | | | | | | | | | | | | | | | | | | | | | |
Total distributions | | | (2.88 | ) | | | (2.76 | ) | | | (1.82 | ) | | | (1.27 | ) | | | (0.80 | ) | | | (0.68 | ) |
| | | | | | | | | | | | | | | | | | | | | | | | |
Net Asset Value, End of Period | | $ | 42.74 | | | $ | 44.04 | | | $ | 46.21 | | | $ | 42.58 | | | $ | 33.42 | | | $ | 29.60 | |
| | | | | | | | | | | | | | | | | | | | | | | | |
Total Return (%) (b) | | | 3.69 | (c) | | | 1.17 | | | | 13.36 | | | | 32.02 | | | | 15.76 | | | | 1.84 | |
| | | | | | |
Ratios/Supplemental Data | | | | | | | | | | | | | | | | | | | | | | | | |
Gross ratio of expenses to average net assets (%) | | | 0.27 | (d) | | | 0.27 | | | | 0.27 | | | | 0.27 | | | | 0.28 | | | | 0.27 | |
Net ratio of expenses to average net assets (%) (e) | | | 0.26 | (d) | | | 0.26 | | | | 0.26 | | | | 0.26 | | | | 0.27 | | | | 0.26 | |
Ratio of net investment income to average net assets (%) | | | 2.06 | (d) | | | 1.88 | | | | 1.81 | | | | 1.87 | | | | 2.08 | | | | 1.85 | |
Portfolio turnover rate (%) | | | 5 | (c) | | | 9 | | | | 12 | | | | 12 | | | | 12 | | | | 11 | |
Net assets, end of period (in millions) | | $ | 4,175.9 | | | $ | 4,108.5 | | | $ | 4,295.4 | | | $ | 4,059.9 | | | $ | 3,303.3 | | | $ | 2,925.8 | |
| |
| | | Class B | |
| | | Six Months
Ended
June 30,
2016
(Unaudited) | | | Year Ended December 31, | |
| | | | 2015 | | | 2014 | | | 2013 | | | 2012 | | | 2011 | |
Net Asset Value, Beginning of Period | | $ | 42.55 | | | $ | 44.73 | | | $ | 41.27 | | | $ | 32.43 | | | $ | 28.76 | | | $ | 28.89 | |
| | | | | | | | | | | | | | | | | | | | | | | | |
Income (Loss) from Investment Operations | | | | | | | | | | | | | | | | | | | | | | | | |
Net investment income (a) | | | 0.38 | | | | 0.71 | | | | 0.66 | | | | 0.60 | | | | 0.57 | | | | 0.47 | |
Net realized and unrealized gain (loss) on investments | | | 1.10 | | | | (0.25 | ) | | | 4.52 | | | | 9.43 | | | | 3.83 | | | | 0.02 | |
| | | | | | | | | | | | | | | | | | | | | | | | |
Total from investment operations | | | 1.48 | | | | 0.46 | | | | 5.18 | | | | 10.03 | | | | 4.40 | | | | 0.49 | |
| | | | | | | | | | | | | | | | | | | | | | | | |
Less Distributions | | | | | | | | | | | | | | | | | | | | | | | | |
Distributions from net investment income | | | (0.79 | ) | | | (0.69 | ) | | | (0.64 | ) | | | (0.62 | ) | | | (0.50 | ) | | | (0.44 | ) |
Distributions from net realized capital gains | | | (1.98 | ) | | | (1.95 | ) | | | (1.08 | ) | | | (0.57 | ) | | | (0.23 | ) | | | (0.18 | ) |
| | | | | | | | | | | | | | | | | | | | | | | | |
Total distributions | | | (2.77 | ) | | | (2.64 | ) | | | (1.72 | ) | | | (1.19 | ) | | | (0.73 | ) | | | (0.62 | ) |
| | | | | | | | | | | | | | | | | | | | | | | | |
Net Asset Value, End of Period | | $ | 41.26 | | | $ | 42.55 | | | $ | 44.73 | | | $ | 41.27 | | | $ | 32.43 | | | $ | 28.76 | |
| | | | | | | | | | | | | | | | | | | | | | | | |
Total Return (%) (b) | | | 3.58 | (c) | | | 0.91 | | | | 13.10 | | | | 31.70 | | | | 15.43 | | | | 1.64 | |
| | | | | | |
Ratios/Supplemental Data | | | | | | | | | | | | | | | | | | | | | | | | |
Gross ratio of expenses to average net assets (%) | | | 0.52 | (d) | | | 0.52 | | | | 0.52 | | | | 0.52 | | | | 0.53 | | | | 0.52 | |
Net ratio of expenses to average net assets (%) (e) | | | 0.51 | (d) | | | 0.51 | | | | 0.51 | | | | 0.51 | | | | 0.52 | | | | 0.51 | |
Ratio of net investment income to average net assets (%) | | | 1.80 | (d) | | | 1.63 | | | | 1.56 | | | | 1.62 | | | | 1.83 | | | | 1.61 | |
Portfolio turnover rate (%) | | | 5 | (c) | | | 9 | | | | 12 | | | | 12 | | | | 12 | | | | 11 | |
Net assets, end of period (in millions) | | $ | 1,922.0 | | | $ | 1,892.0 | | | $ | 2,025.6 | | | $ | 1,928.0 | | | $ | 1,615.0 | | | $ | 1,454.7 | |
Please see following page for Financial Highlights footnote legend.
See accompanying notes to financial statements.
MSF-14
Metropolitan Series Fund
MetLife Stock Index Portfolio
Financial Highlights
| | | | | | | | | | | | | | | | | | | | | | | | |
| Selected per share data | | Class D | |
| | | Six Months
Ended
June 30,
2016
(Unaudited) | | | Year Ended December 31, | |
| | | | 2015 | | | 2014 | | | 2013 | | | 2012 | | | 2011 | |
Net Asset Value, Beginning of Period | | $ | 43.93 | | | $ | 46.10 | | | $ | 42.46 | | | $ | 33.32 | | | $ | 29.52 | | | $ | 29.63 | |
| | | | | | | | | | | | | | | | | | | | | | | | |
Income (Loss) from Investment Operations | | | | | | | | | | | | | | | | | | | | | | | | |
Net investment income (a) | | | 0.42 | | | | 0.80 | | | | 0.73 | | | | 0.66 | | | | 0.63 | | | | 0.52 | |
Net realized and unrealized gain (loss) on investments | | | 1.14 | | | | (0.26 | ) | | | 4.67 | | | | 9.71 | | | | 3.94 | | | | 0.02 | |
| | | | | | | | | | | | | | | | | | | | | | | | |
Total from investment operations | | | 1.56 | | | | 0.54 | | | | 5.40 | | | | 10.37 | | | | 4.57 | | | | 0.54 | |
| | | | | | | | | | | | | | | | | | | | | | | | |
Less Distributions | | | | | | | | | | | | | | | | | | | | | | | | |
Distributions from net investment income | | | (0.86 | ) | | | (0.76 | ) | | | (0.68 | ) | | | (0.66 | ) | | | (0.54 | ) | | | (0.47 | ) |
Distributions from net realized capital gains | | | (1.98 | ) | | | (1.95 | ) | | | (1.08 | ) | | | (0.57 | ) | | | (0.23 | ) | | | (0.18 | ) |
| | | | | | | | | | | | | | | | | | | | | | | | |
Total distributions | | | (2.84 | ) | | | (2.71 | ) | | | (1.76 | ) | | | (1.23 | ) | | | (0.77 | ) | | | (0.65 | ) |
| | | | | | | | | | | | | | | | | | | | | | | | |
Net Asset Value, End of Period | | $ | 42.65 | | | $ | 43.93 | | | $ | 46.10 | | | $ | 42.46 | | | $ | 33.32 | | | $ | 29.52 | |
| | | | | | | | | | | | | | | | | | | | | | | | |
Total Return (%) (b) | | | 3.64 | (c) | | | 1.07 | | | | 13.26 | | | | 31.91 | | | | 15.62 | | | | 1.76 | |
| | | | | | |
Ratios/Supplemental Data | | | | | | | | | | | | | | | | | | | | | | | | |
Gross ratio of expenses to average net assets (%) | | | 0.37 | (d) | | | 0.37 | | | | 0.37 | | | | 0.37 | | | | 0.38 | | | | 0.37 | |
Net ratio of expenses to average net assets (%) (e) | | | 0.36 | (d) | | | 0.36 | | | | 0.36 | | | | 0.36 | | | | 0.37 | | | | 0.36 | |
Ratio of net investment income to average net assets (%) | | | 1.95 | (d) | | | 1.76 | | | | 1.70 | | | | 1.77 | | | | 1.97 | | | | 1.75 | |
Portfolio turnover rate (%) | | | 5 | (c) | | | 9 | | | | 12 | | | | 12 | | | | 12 | | | | 11 | |
Net assets, end of period (in millions) | | $ | 69.6 | | | $ | 84.1 | | | $ | 143.5 | | | $ | 237.5 | | | $ | 297.3 | | | $ | 308.6 | |
| |
| | | Class E | |
| | | Six Months
Ended
June 30,
2016
(Unaudited) | | | Year Ended December 31, | |
| | | | 2015 | | | 2014 | | | 2013 | | | 2012 | | | 2011 | |
Net Asset Value, Beginning of Period | | $ | 43.75 | | | $ | 45.92 | | | $ | 42.32 | | | $ | 33.22 | | | $ | 29.44 | | | $ | 29.55 | |
| | | | | | | | | | | | | | | | | | | | | | | | |
Income (Loss) from Investment Operations | | | | | | | | | | | | | | | | | | | | | | | | |
Net investment income (a) | | | 0.41 | | | | 0.78 | | | | 0.72 | | | | 0.65 | | | | 0.62 | | | | 0.50 | |
Net realized and unrealized gain (loss) on investments | | | 1.14 | | | | (0.26 | ) | | | 4.64 | | | | 9.67 | | | | 3.92 | | | | 0.03 | |
| | | | | | | | | | | | | | | | | | | | | | | | |
Total from investment operations | | | 1.55 | | | | 0.52 | | | | 5.36 | | | | 10.32 | | | | 4.54 | | | | 0.53 | |
| | | | | | | | | | | | | | | | | | | | | | | | |
Less Distributions | | | | | | | | | | | | | | | | | | | | | | | | |
Distributions from net investment income | | | (0.84 | ) | | | (0.74 | ) | | | (0.68 | ) | | | (0.65 | ) | | | (0.53 | ) | | | (0.46 | ) |
Distributions from net realized capital gains | | | (1.98 | ) | | | (1.95 | ) | | | (1.08 | ) | | | (0.57 | ) | | | (0.23 | ) | | | (0.18 | ) |
| | | | | | | | | | | | | | | | | | | | | | | | |
Total distributions | | | (2.82 | ) | | | (2.69 | ) | | | (1.76 | ) | | | (1.22 | ) | | | (0.76 | ) | | | (0.64 | ) |
| | | | | | | | | | | | | | | | | | | | | | | | |
Net Asset Value, End of Period | | $ | 42.48 | | | $ | 43.75 | | | $ | 45.92 | | | $ | 42.32 | | | $ | 33.22 | | | $ | 29.44 | |
| | | | | | | | | | | | | | | | | | | | | | | | |
Total Return (%) (b) | | | 3.63 | (c) | | | 1.02 | | | | 13.20 | | | | 31.83 | | | | 15.54 | | | | 1.71 | |
| | | | | | |
Ratios/Supplemental Data | | | | | | | | | | | | | | | | | | | | | | | | |
Gross ratio of expenses to average net assets (%) | | | 0.42 | (d) | | | 0.42 | | | | 0.42 | | | | 0.42 | | | | 0.43 | | | | 0.42 | |
Net ratio of expenses to average net assets (%) (e) | | | 0.41 | (d) | | | 0.41 | | | | 0.41 | | | | 0.41 | | | | 0.42 | | | | 0.41 | |
Ratio of net investment income to average net assets (%) | | | 1.90 | (d) | | | 1.73 | | | | 1.66 | | | | 1.72 | | | | 1.92 | | | | 1.69 | |
Portfolio turnover rate (%) | | | 5 | (c) | | | 9 | | | | 12 | | | | 12 | | | | 12 | | | | 11 | |
Net assets, end of period (in millions) | | $ | 141.6 | | | $ | 143.5 | | | $ | 161.4 | | | $ | 164.9 | | | $ | 147.9 | | | $ | 147.0 | |
See accompanying notes to financial statements.
MSF-15
Metropolitan Series Fund
MetLife Stock Index Portfolio
Financial Highlights
| | | | | | | | | | | | |
| Selected per share data | | Class G | |
| | | Six Months
Ended
June 30,
2016
(Unaudited) | | | Year Ended December 31, | |
| | | | 2015 | | | 2014(f) | |
Net Asset Value, Beginning of Period | | $ | 42.48 | | | $ | 44.64 | | | $ | 44.10 | |
| | | | | | | | | | | | |
Income (Loss) from Investment Operations | | | | | | | | | | | | |
Net investment income (a) | | | 0.37 | | | | 0.70 | | | | 0.09 | |
Net realized and unrealized gain (loss) on investments | | | 1.10 | | | | (0.24 | ) | | | 0.45 | |
| | | | | | | | | | | | |
Total from investment operations | | | 1.47 | | | | 0.46 | | | | 0.54 | |
| | | | | | | | | | | | |
Less Distributions | | | | | | | | | | | | |
Distributions from net investment income | | | (0.77 | ) | | | (0.67 | ) | | | 0.00 | |
Distributions from net realized capital gains | | | (1.98 | ) | | | (1.95 | ) | | | 0.00 | |
| | | | | | | | | | | | |
Total distributions | | | (2.75 | ) | | | (2.62 | ) | | | 0.00 | |
| | | | | | | | | | | | |
Net Asset Value, End of Period | | $ | 41.20 | | | $ | 42.48 | | | $ | 44.64 | |
| | | | | | | | | | | | |
Total Return (%) (b) | | | 3.55 | (c) | | | 0.91 | | | | 1.22 | (c) |
| | | |
Ratios/Supplemental Data | | | | | | | | | | | | |
Gross ratio of expenses to average net assets (%) | | | 0.57 | (d) | | | 0.57 | | | | 0.58 | (d) |
Net ratio of expenses to average net assets (%) (e) | | | 0.56 | (d) | | | 0.56 | | | | 0.57 | (d) |
Ratio of net investment income to average net assets (%) | | | 1.76 | (d) | | | 1.64 | | | | 1.54 | (d) |
Portfolio turnover rate (%) | | | 5 | (c) | | | 9 | | | | 12 | |
Net assets, end of period (in millions) | | $ | 12.8 | | | $ | 8.5 | | | $ | 0.4 | |
| (a) | Per share amounts based on average shares outstanding during the period. |
| (b) | Total return does not reflect any insurance, sales, separate account or administrative charges of variable annuity or life insurance contracts or any additional expenses that contract owners may bear under their variable contracts. If these charges were included, the returns would be lower. |
| (c) | Periods less than one year are not computed on an annualized basis. |
| (d) | Computed on an annualized basis. |
| (e) | Includes the effects of management fee waivers (see Note 6 of the Notes to Financial Statements). |
| (f) | Commencement of operations was November 12, 2014. |
See accompanying notes to financial statements.
MSF-16
Metropolitan Series Fund
MetLife Stock Index Portfolio
Notes to Financial Statements—June 30, 2016 (Unaudited)
1. Organization
Metropolitan Series Fund (the “Trust”) is organized as a Delaware statutory trust and registered under the Investment Company Act of 1940, as amended (the “1940 Act”), as an open-end management investment company. The Trust, which is managed by MetLife Advisers, LLC (“MetLife Advisers” or the “Adviser”), an affiliate of MetLife, Inc., is currently comprised of thirty series, each of which operates as a distinct investment vehicle of the Trust. The portfolio included in this report is MetLife Stock Index Portfolio (the “Portfolio”), which is diversified. Shares in the Portfolio are not offered directly to the general public and are currently available only to separate accounts established by Metropolitan Life Insurance Company (“MetLife”) and other affiliated life insurance companies.
The Portfolio has registered and offers five classes of shares: Class A, B, D, E and G shares. Shares of each Class of the Portfolio represent an equal pro rata interest in the Portfolio and generally give the shareholder the same voting, dividend, liquidation, and other rights. Investment income, realized and unrealized capital gains and losses, the common expenses of the Portfolio, and certain Portfolio-level expense reductions, if any, are allocated on a pro rata basis to each Class based on the relative net assets of each Class to the net assets of the Portfolio. Each Class of shares differs in its respective distribution plan and such distribution expenses are allocated to the corresponding Class of shares.
2. Significant Accounting Policies
The preparation of financial statements in conformity with accounting principles generally accepted in the United States of America (“GAAP”) requires management to make estimates and assumptions that affect the reported amounts of assets and liabilities and disclosure of contingent assets and liabilities as of the date of the financial statements and the reported amounts of income and expenses during the reporting period. Actual results could differ from those estimates. In the preparation of these financial statements, management has evaluated events and transactions subsequent to June 30, 2016 through the date the financial statements were issued.
The Portfolio is an investment company and follows the accounting and reporting guidance of the Financial Accounting Standards Board (“FASB”) Accounting Standards Codification Topic 946—Financial Services—Investment Companies and Topic 820—Fair Value Measurement. The following is a summary of significant accounting policies consistently followed by the Portfolio in the preparation of its financial statements.
Investment Valuation and Fair Value Measurements - Domestic and foreign equity securities, such as common stock, exchange-traded funds, rights, warrants, and preferred stock, that are traded on a securities exchange on a valuation date are generally valued at their last quoted sale price or official closing price on the primary exchange for such security, or, if no sales occurred on that day, at the last reported bid price. Equity securities traded over-the-counter (“OTC”) are generally valued at the last reported bid price. In the event of a major exchange closing during the trading day, the Adviser may use other market information obtained from quotation reporting systems, established market makers, or pricing services in valuing the securities. Valuation adjustments may be applied to certain foreign equity securities that are traded solely on foreign exchanges that close before the time as of which the Portfolio determines its NAV to account for the market movement between the close of the foreign exchanges and the time as of which the Portfolio determines its NAV. The Portfolio may use a systematic fair valuation model provided by a pricing service to value securities principally traded in these foreign markets in order to adjust for possible market movements or other changes that may occur between the close of the foreign exchanges and the time as of which the Portfolio determines its NAV. Foreign equity securities valued using these valuation adjustments are generally categorized as Level 2 within the fair value hierarchy. Equity securities that are actively traded, and have no valuation adjustments applied, are categorized as Level 1 within the fair value hierarchy. Other equity securities traded on inactive markets, or valued in reference to similar instruments traded on active markets, are generally categorized as Level 2 within the fair value hierarchy.
Investments in registered open-end management investment companies are valued at reported net asset value per share on the valuation date and are categorized as Level 1 within the fair value hierarchy.
Debt securities, including corporate, convertible and municipal bonds and notes; obligations of the U.S. Treasury and U.S. government agencies; foreign sovereign issues; and non-U.S. bonds, are generally valued on the basis of evaluated or composite bid quotations obtained from independent pricing services and/or brokers and dealers selected by the Adviser (each a “pricing service”), pursuant to authorization of and subject to general oversight by the Board of Trustees of the Trust (the “Board” or “Trustees”). Such pricing services may use matrix pricing, which considers observable inputs including, among other things, issuer details, maturity dates, interest rates, yield curves, rates of prepayment, credit risks/spreads, default rates, reported trades, broker dealer quotes and quoted prices for similar assets. Short-term obligations with a remaining maturity of sixty days or less may be valued at amortized cost in the absence of market quotes, so long as the amortized cost value of such short-term debt instrument is approximately the same as the fair value of the instrument as determined without the use of amortized cost valuation. Floating rate loans are generally valued on the basis of an evaluated or composite average of aggregate bid and ask quotations supplied by brokers or dealers, as obtained from the pricing service. Securities that use similar valuation techniques and inputs as described above are generally categorized as Level 2 within the fair value hierarchy.
MSF-17
Metropolitan Series Fund
MetLife Stock Index Portfolio
Notes to Financial Statements—June 30, 2016—(Continued)
Options, whether on securities, indices, futures contracts, or otherwise, traded on exchanges are valued at the last sale price available as of the close of business on a valuation day or, if there is no such price available, at the last reported bid price. These types of options are categorized as Level 1 within the fair value hierarchy. Futures contracts that are traded on commodity exchanges are valued at their settlement prices established by the exchanges on which they are traded as of the close of such exchanges and are categorized as Level 1 within the fair value hierarchy.
If no current market value quotation or other observable inputs are readily available or market value quotations are deemed to be unreliable for an investment, the fair value of the investment will be determined in accordance with procedures approved by, and under the general supervision of, the Board. In such a circumstance, the Board will be assisted in its responsibility to determine the fair value of an investment by the Valuation Committee (“Committee”) of MetLife Advisers. The Committee provides general pricing oversight and fair value pricing determinations related to portfolio securities and meets on a regular basis to review reports relating to the valuation of the securities in the Portfolio. The Board has delegated to State Street Bank and Trust Company, the Trust’s custodian (“custodian”), the responsibility for calculating the net asset values (“NAVs”) of the Trust’s Portfolios. The Committee is responsible for overseeing the calculation of the NAVs of the Portfolios by the custodian. The Committee also periodically reviews pricing services, including the pricing services providing fair value pricing for the Portfolio’s foreign securities, and is responsible for overseeing the correction of pricing errors and addressing other pricing issues that arise in the ordinary course of business, such as making real-time fair value determinations, as necessary.
No single standard for determining the fair value of an investment can be set forth because fair value depends upon the facts and circumstances with respect to each investment. Information relating to any relevant factors may be obtained by the Committee from any appropriate source, including the subadviser of the Portfolio, the custodian, a pricing service, market maker and/or broker for such security or the issuer. Appropriate methodologies for determining fair value under particular circumstances may include: matrix pricing, a discounted cash flow analysis, comparisons of securities with comparable characteristics, value based on multiples of earnings, discount from market price of similar marketable securities or a combination of these and other methods.
Investment Transactions and Related Investment Income - Portfolio security transactions are recorded on the trade date. Dividend income is recorded on the ex-dividend date or, for certain foreign securities, when notified. Interest income, which includes amortization of premium and accretion of discount on debt securities, is recorded on the accrual basis. Realized gains and losses on investments are determined on the identified cost basis, which is the same basis used for federal income tax purposes. Foreign income and foreign capital gains on some foreign securities may be subject to foreign taxes, which are accrued as applicable. These foreign taxes have been provided for in accordance with the Portfolio’s understanding of the applicable countries’ tax rules and rates.
Foreign Currency Translation - The books and records of the Portfolio are maintained in U.S. dollars. The values of securities, currencies, and other assets and liabilities denominated in currencies other than the U.S. dollar are translated into U.S. dollars based upon foreign exchange rates prevailing at the end of the period. Purchases and sales of investment securities, income, and expenses are translated on the respective dates of such transactions. Because the values of investment securities are translated at the foreign exchange rates prevailing at the end of the period, that portion of the results of operations arising from changes in exchange rates and that portion of the results of operations reflecting fluctuations arising from changes in market prices of the investment securities are not separated. Such fluctuations are included in the net realized and unrealized gain or loss on investments.
Net realized foreign exchange gains or losses arise from activity in forward foreign currency exchange contracts, sales of foreign currency, currency gains or losses realized between the trade and settlement dates on securities transactions, and the difference between the amounts of dividends, interest, and foreign withholding taxes recorded by the Portfolio and the U.S. dollar equivalent of the amounts actually received or paid by the Portfolio. Net unrealized foreign exchange gains and losses arise from changes in the value of assets and liabilities, other than investment securities, resulting from changes in foreign exchange rates.
Dividends and Distributions to Shareholders - The Portfolio records dividends and distributions on the ex-dividend date. Net realized gains from securities transactions (if any) are generally distributed annually to shareholders. The timing and characterization of certain income and capital gains distributions are determined in accordance with federal tax regulations that may differ from GAAP. Permanent book and tax basis differences relating to shareholder distributions will result in reclassification between under/over distributed net investment income, accumulated net realized gains/losses, and paid-in surplus. Book-tax differences are primarily due to real estate investment trust (REIT) adjustments. These adjustments have no impact on net assets or the results of operations.
Income Taxes - It is the Portfolio’s policy to comply with the requirements of the Internal Revenue Code of 1986, as amended, and regulations thereunder, applicable to regulated investment companies and to distribute, with respect to each taxable year, all of its taxable income to shareholders. Therefore, no federal income tax provision is required. The Portfolio files U.S. federal tax returns. No income tax returns are currently under examination. The Portfolio’s federal tax returns for the prior three fiscal years remain subject to examination by the Internal Revenue Service. As of June 30, 2016, the Portfolio had no uncertain tax positions that would require financial statement recognition, or de-recognition or disclosure.
Repurchase Agreements - The Portfolio may enter into repurchase agreements, under the terms of a Master Repurchase Agreement (“MRA”), with selected commercial banks and broker-dealers, under which the Portfolio acquires securities as collateral and agrees to
MSF-18
Metropolitan Series Fund
MetLife Stock Index Portfolio
Notes to Financial Statements—June 30, 2016—(Continued)
resell the securities at an agreed-upon time and at an agreed-upon price. The Portfolio, through the custodian or a subcustodian, under a tri-party repurchase agreement, receives delivery of the underlying securities collateralizing any repurchase agreements. It is the Portfolio’s policy that the market value of the collateral be equal to at least 100% of the repurchase price in the case of a repurchase agreement of one-day duration and equal to at least 102% of the repurchase price in the case of all other repurchase agreements. In the event of default or failure by a party to perform an obligation in connection with any repurchase transaction, the MRA gives the non-defaulting party the right to set-off claims and to apply property held by it in connection with any repurchase transaction against obligations owed to it.
Securities Lending - The Portfolio may lend its portfolio securities to certain qualified brokers who borrow securities in order to complete certain securities transactions. By lending its portfolio securities, the Portfolio attempts to increase its net investment income through the receipt of income on collateral held from securities on loan. Any gain or loss in the market price of the loaned securities that might occur and any interest earned or dividends declared during the term of the loan would accrue to the account of the Portfolio.
The Trust has entered into a Securities Lending Authorization Agreement with the custodian as the lending agent. Under this agreement, the custodian is authorized to loan portfolio securities on the Portfolio’s behalf. In exchange, the Portfolio receives either cash or securities as collateral against the loaned securities. The Portfolio receives collateral equal to at least 102% of the market value of the loaned securities (105% for foreign equity securities), at each loan’s inception. Collateral representing at least 100% of the market value of the loaned securities must be maintained for the duration of the loan. Cash collateral is generally invested in the State Street Navigator Securities Lending MET Portfolio (the “Navigator Portfolio”), a series of the State Street Navigator Securities Lending Trust that is managed by an affiliate of the custodian. The Navigator Portfolio is a registered money market fund that invests in a variety of high-quality, U.S. dollar-denominated instruments. If the market value of the collateral at the close of trading on a business day is less than 100% of the market value of the loaned securities at the close of trading on that day, the borrower shall be required to deliver, by the close of business on the following business day, an additional amount of collateral, so that the total amount of posted collateral is equal to at least 100% of the market value of all the loaned securities as of such preceding day. A portion of net income (income after the deduction of expenses and fees of the Navigator Portfolio) on the collateral is rebated to the borrower of the securities and the remainder is split between the custodian and the Portfolio. On loans collateralized by U.S. Treasuries, a fee is received from the borrower and is allocated between the Portfolio and the custodian. Income received by the Portfolio in securities lending transactions during the six months ended June 30, 2016 is reflected as Securities lending income on the Statement of Operations. The values of any securities loaned by the Portfolio and the related collateral at June 30, 2016 are disclosed in the footnotes to the Schedule of Investments. The value of the related collateral received by the Portfolio exceeded the value of the securities out on loan at June 30, 2016.
The risks associated with lending portfolio securities include, but are not limited to, possible delays in receiving additional collateral or in the recovery of the loaned securities, possible loss of rights in the collateral should the borrower fail financially, as well as risk of loss in the value of the collateral or the value of the investments made with the collateral. The lending agent shall indemnify the Portfolio in the case of default of any securities borrower.
All securities on loan are classified as Common Stocks in the Portfolio’s Schedule of Investments as of June 30, 2016, with a contractual maturity of overnight and continuous.
3. Investments in Derivative Instruments
Futures Contracts - The Portfolio may buy and sell futures contracts as a hedge, to maintain investment exposure to a target asset class or to enhance return. The Portfolio may be subject to fluctuations in equity prices, interest rates, commodity prices, and foreign currency exchange rates in the normal course of pursuing its investment objective. Futures contracts are standardized agreements to buy or sell a security, or deliver a final cash settlement price in connection with an index, interest rate, currency, or other asset. The Portfolio must deposit an amount (“initial margin”) equal to a certain percentage of the face value of the futures contract. The initial margin may be in the form of cash or securities, which is returned when the Portfolio’s obligations under the contract have been satisfied. If cash is deposited as the initial margin, it is shown as cash collateral on the Statement of Assets and Liabilities. Futures contracts are marked-to-market daily, and subsequent payments (“variation margin”) are made or received by the Portfolio depending on whether unrealized gains or losses are incurred. These amounts are reflected as receivables or payables on the Statement of Assets and Liabilities and as a component of net change in unrealized appreciation/depreciation on the Statement of Operations. When the contract is closed or expires, the Portfolio records a realized gain or loss equal to the difference between the value of the contract at the time it was opened and the value at the time it was closed. Risks of entering into futures contracts (and related options) include the possibility that the market for these instruments may be illiquid and that a change in the value of the contract or option may not correlate perfectly with changes in the value of the underlying instrument. If futures contracts are exchange-traded, the exchange’s clearinghouse, as counterparty to all exchange-traded futures, guarantees the futures contracts against default. For OTC futures, the Portfolio’s ability to terminate the positions may be more limited than in the case of exchange-traded positions and may also involve the risk that securities dealers participating in such transactions would fail to meet their obligations to the Portfolio.
MSF-19
Metropolitan Series Fund
MetLife Stock Index Portfolio
Notes to Financial Statements—June 30, 2016—(Continued)
The following table summarizes the fair value of derivatives held by the Portfolio at June 30, 2016 by category of risk exposure:
| | | | | | |
| | | Liability Derivatives | |
Risk Exposure | | Statement of Assets &
Liabilities Location | | Fair Value | |
Equity | | Unrealized depreciation on futures contracts (a) | | $ | 283,666 | |
| | | | | | |
| | (a) | Includes cumulative appreciation/depreciation of futures contracts as reported in the Schedule of Investments. Only the current day’s variation margin is reported within the Statement of Assets and Liabilities. |
The following tables summarize the effect of derivative instruments on the Statement of Operations, classified by derivative type and category of risk exposure, for the six months ended June 30, 2016:
| | | | |
Statement of Operations Location—Net Realized Gain (Loss) | | Equity | |
Futures contracts | | $ | 1,153,588 | |
| | | | |
| |
Statement of Operations Location—Net Change in Unrealized Appreciation (Depreciation) | | Equity | |
Futures contracts | | $ | (54,750 | ) |
| | | | |
For the six months ended June 30, 2016, the average notional par or face amount outstanding for each derivative type was as follows:
| | | | |
Derivative Description | | Average
Notional Par or
Face Amount‡ | |
Futures contracts long | | $ | 15,000 | |
| | ‡ | Averages are based on activity levels during the period. |
4. Certain Risks
In the normal course of business, the Portfolio invests in securities and enters into transactions where risks exist due to fluctuations in the market (“market risk”) or failure of the other party to a transaction to perform (“credit and counterparty risk”).
Market Risk: The value of securities held by the Portfolio may decline in response to certain events, including those directly involving the companies whose securities are owned by the Portfolio; conditions affecting the general economy; overall market changes; local, regional or global political, social or economic instability; and currency, interest rate, and price fluctuations.
Credit and Counterparty Risk: The Portfolio may be exposed to counterparty risk, or the risk that an entity with which the Portfolio has unsettled or open transactions may default. The potential loss could exceed the value of the financial assets and liabilities recorded in the financial statements. Financial assets that potentially expose the Portfolio to credit and counterparty risk consist principally of cash due from counterparties and investments. The Portfolio manages counterparty risk by entering into agreements only with counterparties that it believes have the financial resources to honor their obligations and by monitoring the financial stability of those counterparties. The Portfolio’s investment adviser attempts to mitigate counterparty risk by (i) periodically assessing the creditworthiness of its trading partners, (ii) monitoring and/or limiting the amount of its net exposure to each individual counterparty based on its assessment, and (iii) requiring collateral from the counterparty for certain transactions. In order to preserve certain safeguards for non-standard settlement trades, the Portfolio restricts its exposure to credit and counterparty losses by entering into master netting agreements (“Master Agreements”) with counterparties (approved brokers) with whom it undertakes a significant volume of transactions. Master Agreements govern the terms of certain transactions, and reduce the counterparty risk associated with relevant transactions by specifying credit protection mechanisms and providing standardization that improves legal certainty. Master Agreements can also help limit counterparty risk by specifying collateral posting arrangements at pre-arranged exposure levels.
Customer Account Agreements and related addenda govern cleared derivatives transactions such as futures, options on futures, and cleared OTC derivatives. Cleared derivative transactions require posting of initial margin as determined by each relevant clearing agency, which is segregated at a broker account registered with the Commodities Futures Trading Commission (“CFTC”), or the applicable regulator. In the U.S., counterparty risk is significantly reduced as creditors of the futures broker do not have claim to Portfolio assets in the segregated account. Additionally, portability of exposure in the event of default further reduces risk to the Portfolio. Variation margin, or changes in market value, are exchanged daily, but may not be netted between futures and cleared OTC derivatives.
Additional risks associated with each type of investment are described above within the respective security type notes. The Portfolio’s prospectus includes a discussion of the principal risks of investing in the Portfolio.
MSF-20
Metropolitan Series Fund
MetLife Stock Index Portfolio
Notes to Financial Statements—June 30, 2016—(Continued)
5. Investment Transactions
Aggregate cost of purchases and proceeds of sales of investment securities, excluding short-term securities, for the six months ended June 30, 2016 were as follows:
| | | | | | | | | | | | |
Purchases | | | Sales | |
U.S. Government | | Non U.S. Government | | | U.S. Government | | | Non U.S. Government | |
| $0 | | $ | 288,866,443 | | | $ | 0 | | | $ | 349,514,737 | |
6. Investment Management Fees and Other Transactions with Affiliates
Investment Management Agreement - MetLife Advisers is the investment adviser to the Portfolio. The Trust has entered into an investment management agreement with MetLife Advisers with respect to the Portfolio. For providing investment management services to the Portfolio, MetLife Advisers receives monthly compensation at the annual rate of 0.250% of average daily net assets. Fees earned by MetLife Advisers with respect to the Portfolio for the six months ended June 30, 2016 were $7,583,557.
MetLife Advisers has entered into an investment subadvisory agreement with MetLife Investment Advisors, LLC (“MIA”) with respect to managing the Portfolio. For providing subadvisory services to the Portfolio, MetLife Advisers has agreed to pay MIA an investment subadvisory fee for each class of the Portfolio as follows:
| | |
% per annum | | Average Daily Net Assets |
| 0.020% | | On the first $500 million |
| 0.015% | | Of the next $500 million |
| 0.010% | | Of the next $1 billion |
| 0.005% | | On amounts over $2 billion |
Fees earned by MIA with respect to the Portfolio for the six months ended June 30, 2016 were $238,693.
Management Fee Waiver - Pursuant to a management fee waiver agreement, the Adviser has agreed, for the period May 1, 2016 to April 30, 2017, to reduce its advisory fees set out above under “Investment Management Agreement” for each class of the Portfolio as follows:
| | |
% per annum | | Average Daily Net Assets |
| 0.005% | | Over $500 million and under $1 billion |
| 0.010% | | Of the next $1 billion |
| 0.015% | | On amounts over $2 billion |
An identical agreement was in place for the period May 1, 2015 to April 30, 2016. Amounts waived for the six months ended June 30, 2016 are shown as a management fee waiver in the Statement of Operations.
Certain officers and trustees of the Trust may also be officers of MetLife Advisers; however, such officers and trustees receive no compensation from the Trust.
On January 12, 2016, MetLife, Inc. announced its plan to pursue the separation of a substantial portion of its retail segment and is currently evaluating structural alternatives for such separation. It is anticipated that MetLife Advisers would be included in any such separation. Any separation transaction that might occur will be subject to the satisfaction of various conditions and approvals, including approval of any transaction by the MetLife, Inc. Board of Directors, satisfaction of any applicable requirements of the SEC, and receipt of insurance and other regulatory approvals and other anticipated conditions. Because the form of a separation had yet to be determined, MetLife, Inc. cannot currently provide a specific potential completion date or information about the potential impact on MetLife Advisers. No assurance can be given regarding the form that a separation transaction may take or the specific terms thereof, or that a separation will in fact occur. Depending on the form a separation takes, MetLife Advisers’ continued service as investment adviser to the Trusts could be subject to the satisfaction of various conditions and approvals, which may include obtaining approvals from the Trusts’ Board and shareholders.
Transfer Agency Agreement - MetLife serves as the transfer agent for the Trust. MetLife receives no fees for its services to the Trust under the transfer agency agreement.
Distribution and Service Fees - The Trust has a distribution agreement with MetLife Investors Distribution Company (“MIDC” or the “Distributor”) in which MIDC serves as the distributor for the Portfolio’s Class A, B, D, E, and G Shares. MIDC is a wholly-owned subsidiary of MetLife Investors Group, LLC, an affiliate of the Adviser. The Trust has also adopted a Distribution and Service Plan under Rule 12b-1 of the 1940 Act for the Portfolio’s Class B, D, E, and G Shares. Under the Distribution and Service Plan, the Class B, D, E, and G Shares of the Portfolio pay a fee to compensate the Insurance Companies (or their affiliates) and other broker-dealers and
MSF-21
Metropolitan Series Fund
MetLife Stock Index Portfolio
Notes to Financial Statements—June 30, 2016—(Continued)
financial intermediaries involved in the offer and sale of Portfolio shares for promoting or selling and servicing the Class B, D, E, and G Shares of the Portfolio. The fees under the Distribution and Service Plan for each class of the Portfolio’s shares are calculated as a percentage of the Portfolio’s average daily net assets that are attributable to that Class. Currently, the fee is 0.25% per year for Class B Shares, 0.10% per year for Class D Shares, 0.15% per year for Class E Shares, and 0.30% per year for Class G Shares. Amounts incurred by the Portfolio for the six months ended June 30, 2016 are shown as Distribution and service fees in the Statement of Operations.
Deferred Trustee Compensation - Each Trustee who is not currently an employee of the Adviser or any of its affiliates receives compensation from the Trust for his or her service to the Trust. A deferred compensation plan (the “Plan”) is available to the Trustees on a voluntary basis. Deferred amounts remain in the Trust until distributed in accordance with the provisions of the Plan. The value of a participating Trustee’s deferral account is based on theoretical investments of deferred amounts on the normal payment dates in certain portfolios of the Trust or Met Investors Series Trust, an affiliate of the Trust, as designated by the participating Trustee. Changes in the value of participants’ deferral accounts are reflected as Trustees’ fees and expenses in the Statement of Operations. The portion of the accrued obligations allocated to the Portfolio under the Plan is reflected as Deferred trustees’ fees in the Statement of Assets and Liabilities.
7. Transactions in Securities of Affiliated Issuers
A summary of the Portfolio’s transactions in the securities of affiliated issuers during the six months ended June 30, 2016 is as follows:
| | | | | | | | | | | | | | | | | | | | | | | | |
Security Description | | Number of
shares held at
December 31, 2015 | | | Shares
purchased | | | Shares
sold | | | Number of
shares held at
June 30, 2016 | | | Realized
(Loss) on
shares sold | | | Income earned
from affiliates
during the
period | |
MetLife, Inc. | | | 380,176 | | | | 2,115 | | | | (9,388 | ) | | | 372,903 | | | $ | (40,711 | ) | | $ | 290,881 | |
8. Contractual Obligations
Under the Trust’s organizational documents, its officers and Trustees may be indemnified against certain liabilities and expenses arising out of the performance of their duties to the Trust. Additionally, the Trust has a variety of indemnification obligations under contracts with its service providers. The Trust’s maximum exposure under these arrangements is unknown, as this would involve future claims that may be made against the Trust that have not yet occurred.
9. Income Tax Information
The tax character of distributions paid for the years ended December 31, 2015 and 2014 were as follows:
| | | | | | | | | | | | | | | | | | | | |
Ordinary Income | | | Long-Term Capital Gain | | | Total | |
2015 | | 2014 | | | 2015 | | | 2014 | | | 2015 | | | 2014 | |
| $114,006,177 | | $ | 122,649,589 | | | $ | 268,543,180 | | | $ | 141,997,359 | | | $ | 382,549,357 | | | $ | 264,646,948 | |
As of December 31, 2015, the components of distributable earnings (accumulated losses) on a federal income tax basis were as follows:
| | | | | | | | | | | | | | | | |
Undistributed
Ordinary
Income | | Undistributed
Long-Term
Capital Gain | | | Net
Unrealized
Appreciation | | | Other
Accumulated
Capital Losses | | | Total | |
| $131,448,760 | | $ | 268,173,399 | | | $ | 2,407,127,467 | | | $ | — | | | $ | 2,806,749,626 | |
The Portfolio utilizes the provisions of the federal income tax laws that provide for the carryforward of capital losses for prior years, offsetting such losses against any future realized capital gains. Under the Regulated Investment Company Modernization Act of 2010 (the “Act”), net capital losses recognized after December 22, 2010 may be carried forward indefinitely and their character is retained as short-term and/or long-term losses. Previously, net capital losses were carried forward for up to eight years and treated as short-term losses. As a transition rule, the Act requires that post-enactment net capital losses be used before pre-enactment net capital losses.
As of December 31, 2015, the Portfolio had no post-enactment accumulated capital losses and no pre-enactment accumulated capital loss carryforwards.
MSF-22
Metropolitan Series Fund
MFS Total Return Portfolio
Managed by MFS Investment Management
Portfolio Manager Commentary*
PERFORMANCE
For the six month period ended June 30, 2016, the Class A, B, E and F shares of the MFS Total Return Portfolio returned 5.70%, 5.57%, 5.62%, and 5.59%, respectively. The Portfolio’s benchmarks, the Standard & Poor’s (“S&P”) 500 Index1 and the Barclays U.S. Aggregate Bond Index2, returned 3.84% and 5.31%, respectively. A blend of the S&P 500 Index (60%) and the Barclays U.S. Aggregate Bond Index (40%) returned 4.52%.
MARKET ENVIRONMENT/CONDITIONS
Sluggish global growth weighed on both developed and emerging market (“EM”) economies during the reporting period with EM economies proved to be particularly lackluster. Globally, central bank policy remained highly accommodative, which forced many government, and even some corporate, bond yields into negative territory. The U.S. Federal Reserve indicated that its monetary policy tightening cycle would be more gradual than earlier anticipated. In late June, the United Kingdom voted to leave the European Union, in what may have begun a multi-year process of negotiation in order to achieve “Brexit”.
U.S. earnings headwinds expanded beyond the Energy, Materials and Industrial sectors, to include most sectors of the market. The sharp rise in the U.S. dollar also weighed on earnings early in the period, though dollar strength ebbed somewhat late in the period. U.S. consumer spending held up well amid a modest increase in real wages and falling gasoline prices. Global trade was dampened particularly by falling demand in emerging markets. Weaker Chinese growth, which drove the decline in commodity prices, weighed on EM economies and asset prices. China responded with a variety of monetary and fiscal measures to stimulate its economy, which showed signs of stabilization at the end of the period, though concerns over high debt levels persisted. Structural factors such as floating exchange rates and fiscal buffers partially offset the cyclical headwinds to emerging markets.
PORTFOLIO REVIEW/PERIOD END POSITIONING
The Portfolio outperformed its benchmark for the period. Within the equity portion of the Portfolio, a combination of strong stock selection and an underweight allocation in the Information Technology sector contributed to performance relative to the S&P 500 Index. Underweight positions in computer and personal electronics maker Apple, internet search giant Alphabet and software company Microsoft aided relative performance. Security selection in the Industrials sector further supported relative results. The Portfolio’s overweight positions in manufacturing conglomerate Tyco International and global security company Northrop Grumman boosted relative performance. Stock selection in the Consumer Staples sector added relative value over the period. Overweight positions in tobacco company Philip Morris International and global food company General Mills contributed to relative results.
Elsewhere, overweight positions in utility services provider Exelon and telecommunications services company Verizon Communications aided relative performance. Additionally, an underweight position in banking services provider Bank of America also helped relative returns.
Within the fixed income portion of the Portfolio, performance relative to the Barclays U.S. Aggregate Bond Index was boosted through security selection within the U.S. Corporate, Commercial Mortgage-Backed Securities (CMBS) and U.S. Agency sectors. A greater than benchmark exposure to the Finance sector and lesser exposure to the Mortgage-Backed Securities (MBS) sector aided relative returns.
Within the equity portion of the Portfolio, a combination of weak stock selection and an overweight allocation to the Financials sector held back performance relative to the S&P 500 Index. Overweight positions in financial services firms JPMorgan Chase, Wells Fargo and Goldman Sachs Group and insurance provider Prudential Financial detracted from relative results. Further, holding of Swiss-based banking firm UBS (Switzerland) also weighed on relative performance.
Elsewhere, the Portfolio’s underweight positions in telecommunications services provider AT&T and integrated oil and gas company Exxon Mobil, and overweight positions in independent oil refiner Valero Energy and automotive components manufacturer Delphi Automotive dampened relative performance. Not owning health insurance and Medicare/Medicaid provider UnitedHealth Group also detracted from relative results.
Within the fixed income portion of the Portfolio, lesser exposure to Industrial and Utility sectors detracted from relative returns. These sectors, which contain commodity- and energy-sensitive companies, experienced strong performance during the 6-month period amid a rebound in oil and commodity prices. Relative to being underweight these sectors, the Portfolio was overweight financial institutions, which we believe offer attractive spreads, and solid fundamentals. However, the sector lagged Utilities and Industrials, weighing on relative performance during the period.
MSF-1
Metropolitan Series Fund
MFS Total Return Portfolio
Managed by MFS Investment Management
Portfolio Manager Commentary*—(Continued)
Over the trailing six months ending June 30, 2016, the equity portion of the Portfolio increased its weighting in Consumer Staples, Energy, and Industrials while reducing its exposure to Consumer Discretionary, Financials, and Information Technology. The Portfolio’s weighting within fixed income has remained relatively the same.
Brooks Taylor
Steven Gorham
Richard Hawkins
Nevin Chitkara
William Douglas
Joshua Marston
Jonathan Sage
Portfolio Managers
Massachusetts Financial Services Company
* This commentary may include statements that constitute “forward-looking statements” under the U.S. securities laws. Forward-looking statements include, among other things, projections, estimates, and information about possible or future results related to the Portfolio, market or regulatory developments. The views expressed above are not guarantees of future performance or economic results and involve certain risks, uncertainties and assumptions that could cause actual outcomes and results to differ materially from the views expressed herein. The views expressed above are subject to change at any time based upon economic, market, or other conditions and the subadvisory firm undertakes no obligation to update the views expressed herein. Any discussions of specific securities should not be considered a recommendation to buy or sell those securities. The views expressed above (including any forward-looking statement) may not be relied upon as investment advice or as an indication of the Portfolio’s trading intent. Information about the Portfolio’s holdings, asset allocation or country diversification is historical and is not an indication of future Portfolio composition, which may vary. Direct investment in any index is not possible. The performance of any index mentioned in this commentary has not been adjusted for ongoing management, distribution and operating expenses, and sales charges applicable to mutual fund investments. In addition, the returns do not reflect additional fees charged by separate accounts or variable insurance contracts that an investor in the Portfolio may pay. If these additional fees were reflected, performance would have been lower.
MSF-2
Metropolitan Series Fund
MFS Total Return Portfolio
A $10,000 INVESTMENT COMPARED TO THE S&P 500 INDEX & THE BARCLAYS U.S. AGGREGATE BOND INDEX
SIX MONTH RETURN & AVERAGE ANNUAL RETURNS (%) AS OF JUNE 30, 2016
| | | | | | | | | | | | | | | | |
| | | 6 Month | | | 1 Year | | | 5 Year | | | 10 Year | |
| MFS Total Return Portfolio | | | | | | | | | | | | | | | | |
Class A | | | 5.70 | | | | 4.39 | | | | 8.35 | | | | 6.18 | |
Class B | | | 5.57 | | | | 4.12 | | | | 8.08 | | | | 5.91 | |
Class E | | | 5.62 | | | | 4.23 | | | | 8.19 | | | | 6.02 | |
Class F | | | 5.59 | | | | 4.18 | | | | 8.13 | | | | 5.96 | |
| Barclays U.S. Aggregate Bond Index | | | 5.31 | | | | 6.00 | | | | 3.76 | | | | 5.13 | |
| S&P 500 Index | | | 3.84 | | | | 3.99 | | | | 12.09 | | | | 7.42 | |
1 The Standard & Poor’s (S&P) 500 Index is an unmanaged index consisting of 500 stocks chosen for market size, liquidity, and industry group representation. It is a market-weighted index (stock price times number of shares outstanding) with each stock’s weight in the Index proportionate to its market value.
2 Barclays U.S. Aggregate Bond Index is a broad based benchmark that measures the investment grade, U.S. dollar-denominated, fixed-rate taxable bond market, including Treasuries, government-related and corporate securities, mortgage-backed securities, asset-backed securities, and commercial mortgage-backed securities.
Portfolio performance is calculated including reinvestment of all income and capital gain distributions. Performance numbers are net of all Portfolio expenses but do not include any insurance, sales, separate account or administrative charges of variable annuity or life insurance contracts or any additional expenses that participants may bear relating to the operations of their plans. If these charges were included, the returns would be lower. The performance of any index referenced above has not been adjusted for ongoing management, distribution and operating expenses, and sales charges applicable to mutual fund investments. Direct investment in any index is not possible. The performance of Class A shares, as set forth in the line graph above, will differ from that of other classes because of the difference in expenses paid by policyholders investing in the different share classes.
This information represents past performance and is not indicative of future results. Investment return and principal value may fluctuate so that shares, upon redemption, may be worth more or less than the original cost.
PORTFOLIO COMPOSITION AS OF JUNE 30, 2016
Top Equity Sectors
| | | | |
| | | % of
Net Assets | |
| Financials | | | 13.0 | |
| Industrials | | | 8.6 | |
| Health Care | | | 8.1 | |
| Consumer Staples | | | 7.5 | |
| Consumer Discretionary | | | 6.3 | |
Top Fixed Income Sectors
| | | | |
| | | % of
Net Assets | |
| U.S. Treasury & Government Agencies | | | 24.3 | |
| Corporate Bonds & Notes | | | 12.1 | |
| Mortgage-Backed Securities | | | 1.9 | |
| Asset-Backed Securities | | | 1.0 | |
| Municipals | | | 0.2 | |
Top Equity Holdings
| | | | |
| | | % of
Net Assets | |
| JPMorgan Chase & Co. | | | 2.3 | |
| Philip Morris International, Inc. | | | 1.7 | |
| Johnson & Johnson | | | 1.3 | |
| Verizon Communications, Inc. | | | 1.2 | |
| Travelers Cos., Inc. (The) | | | 1.2 | |
Top Fixed Income Issuers
| | | | |
| | | % of
Net Assets | |
| U.S. Treasury Notes | | | 8.8 | |
| Fannie Mae 30 Yr. Pool | | | 5.2 | |
| U.S. Treasury Bonds | | | 3.7 | |
| Freddie Mac 30 Yr. Gold Pool | | | 2.7 | |
| Freddie Mac Multifamily Structured Pass-Through Certificates | | | 1.0 | |
MSF-3
Metropolitan Series Fund
MFS Total Return Portfolio
Understanding Your Portfolio’s Expenses (Unaudited)
Shareholder Expense Example
As a shareholder of the Portfolio, you incur ongoing costs, including management fees; distribution and service (12b-1) fees; and other Portfolio expenses. This example is intended to help you understand your ongoing costs (in dollars) (referred to as “expenses”) of investing in the Portfolio and compare these costs with the ongoing costs of investing in other mutual funds. The example is based on an investment of $1,000 invested at the beginning of the period and held for the entire period, January 1, 2016 through June 30, 2016.
Actual Expenses
The first line for each share class of the Portfolio in the table below provides information about actual account values and actual expenses. You may use the information in this line, together with the amount you invested in the particular share class of the Portfolio, to estimate the expenses that you paid over the period. Simply divide your account value by $1,000 (for example, an $8,600 account value divided by $1,000 = 8.6), then multiply the result by the number in the first line under the heading entitled “Expenses Paid During Period” to estimate the expenses you paid on your account during this period.
Hypothetical Example for Comparison Purposes
The second line for each share class of the Portfolio in the table below provides information about hypothetical account values and hypothetical expenses based on the Portfolio’s actual expense ratio and an assumed rate of return of 5% per year before expenses, which is not the Portfolio’s actual return. The hypothetical account values and expenses may not be used to estimate the actual ending account balance or expenses you paid for the period. You may use this information to compare the ongoing costs of investing in the Portfolio and other funds. To do so, compare this 5% hypothetical example with the 5% hypothetical examples that appear in the shareholder reports of the other funds.
Please note that the expenses shown in the table are meant to highlight your ongoing costs only and do not reflect any fees or charges of your variable insurance product or any additional expenses that participants in certain eligible qualified plans may bear relating to the operations of their plan. Therefore, the second line for each share class in the table is useful in comparing ongoing costs only, and will not help you determine the relative total costs of owning different funds. In addition, if these other costs were included, your costs would have been higher.
| | | | | | | | | | | | | | | | | | |
MFS Total Return Portfolio | | | | Annualized
Expense
Ratio | | | Beginning
Account Value
January 1,
2016 | | | Ending
Account Value
June 30,
2016 | | | Expenses Paid
During Period**
January 1, 2016
to
June 30,
2016 | |
Class A | | Actual | | | 0.62 | % | | $ | 1,000.00 | | | $ | 1,057.00 | | | $ | 3.17 | |
| | Hypothetical* | | | 0.62 | % | | $ | 1,000.00 | | | $ | 1,021.78 | | | $ | 3.12 | |
| | | | | |
Class B | | Actual | | | 0.87 | % | | $ | 1,000.00 | | | $ | 1,055.70 | | | $ | 4.45 | |
| | Hypothetical* | | | 0.87 | % | | $ | 1,000.00 | | | $ | 1,020.54 | | | $ | 4.37 | |
| | | | | |
Class E | | Actual | | | 0.77 | % | | $ | 1,000.00 | | | $ | 1,056.20 | | | $ | 3.94 | |
| | Hypothetical* | | | 0.77 | % | | $ | 1,000.00 | | | $ | 1,021.03 | | | $ | 3.87 | |
| | | | | |
Class F | | Actual | | | 0.82 | % | | $ | 1,000.00 | | | $ | 1,055.90 | | | $ | 4.19 | |
| | Hypothetical* | | | 0.82 | % | | $ | 1,000.00 | | | $ | 1,020.79 | | | $ | 4.12 | |
* Hypothetical assumes a rate of return of 5% per year before expenses.
** Expenses paid are equal to the Portfolio’s annualized expense ratio for the most recent six month period, as shown above, multiplied by the average account value over the period, multiplied by the number of days (182 days) in the most recent fiscal half-year, divided by 366 (to reflect the one-half year period).
MSF-4
Metropolitan Series Fund
MFS Total Return Portfolio
Schedule of Investments as of June 30, 2016 (Unaudited)
Common Stocks—58.9% of Net Assets
| | | | | | | | |
| Security Description | | Shares | | | Value | |
| | |
Aerospace & Defense—3.0% | | | | | | | | |
Boeing Co. (The) | | | 3,376 | | | $ | 438,441 | |
Honeywell International, Inc. | | | 63,812 | | | | 7,422,612 | |
Lockheed Martin Corp. | | | 20,356 | | | | 5,051,748 | |
Northrop Grumman Corp. | | | 27,285 | | | | 6,064,910 | |
Orbital ATK, Inc. | | | 4,246 | | | | 361,504 | |
United Technologies Corp. | | | 61,534 | | | | 6,310,312 | |
| | | | | | | | |
| | | | | | | 25,649,527 | |
| | | | | | | | |
| | |
Air Freight & Logistics—0.4% | | | | | | | | |
United Parcel Service, Inc. - Class B | | | 35,281 | | | | 3,800,469 | |
| | | | | | | | |
| | |
Airlines—0.2% | | | | | | | | |
Delta Air Lines, Inc. | | | 58,005 | | | | 2,113,122 | |
| | | | | | | | |
| | |
Auto Components—0.8% | | | | | | | | |
Delphi Automotive plc | | | 30,163 | | | | 1,888,204 | |
Johnson Controls, Inc. | | | 74,725 | | | | 3,307,328 | |
Magna International, Inc. | | | 47,883 | | | | 1,680,788 | |
| | | | | | | | |
| | | | | | | 6,876,320 | |
| | | | | | | | |
| | |
Automobiles—0.5% | | | | | | | | |
General Motors Co. | | | 42,419 | | | | 1,200,458 | |
Harley-Davidson, Inc. (a) | | | 16,062 | | | | 727,609 | |
Hyundai Motor Co. | | | 9,029 | | | | 1,069,534 | |
Kia Motors Corp. | | | 44,293 | | | | 1,668,199 | |
| | | | | | | | |
| | | | | | | 4,665,800 | |
| | | | | | | | |
| | |
Banks—5.3% | | | | | | | | |
Bank of America Corp. | | | 132,379 | | | | 1,756,669 | |
BB&T Corp. | | | 62,265 | | | | 2,217,257 | |
BNP Paribas S.A. | | | 12,264 | | | | 551,365 | |
BOC Hong Kong Holdings, Ltd. | | | 170,500 | | | | 514,298 | |
Citigroup, Inc. | | | 58,519 | | | | 2,480,620 | |
HSBC Holdings plc (a) | | | 142,421 | | | | 889,712 | |
JPMorgan Chase & Co. | | | 321,108 | | | | 19,953,651 | |
PNC Financial Services Group, Inc. (The) | | | 38,407 | | | | 3,125,946 | |
Sumitomo Mitsui Financial Group, Inc. | | | 45,500 | | | | 1,304,497 | |
SunTrust Banks, Inc. | | | 19,013 | | | | 781,054 | |
U.S. Bancorp | | | 127,497 | | | | 5,141,954 | |
Wells Fargo & Co. | | | 150,227 | | | | 7,110,244 | |
| | | | | | | | |
| | | | | | | 45,827,267 | |
| | | | | | | | |
| | |
Beverages—0.5% | | | | | | | | |
Coca-Cola Co. (The) | | | 24,488 | | | | 1,110,041 | |
Diageo plc | | | 113,514 | | | | 3,176,259 | |
| | | | | | | | |
| | | | | | | 4,286,300 | |
| | | | | | | | |
| | |
Biotechnology—0.2% | | | | | | | | |
Celgene Corp. (b) | | | 6,976 | | | | 688,043 | |
Gilead Sciences, Inc. | | | 11,971 | | | | 998,621 | |
| | | | | | | | |
| | | | | | | 1,686,664 | |
| | | | | | | | |
| | |
Building Products—0.4% | | | | | | | | |
Owens Corning (a) | | | 71,268 | | | | 3,671,727 | |
| | | | | | | | |
| | |
Capital Markets—2.5% | | | | | | | | |
Bank of New York Mellon Corp. (The) | | | 127,759 | | | $ | 4,963,437 | |
BlackRock, Inc. | | | 8,558 | | | | 2,931,372 | |
Blackstone Group L.P. (The) | | | 22,887 | | | | 561,647 | |
Charles Schwab Corp. (The) | | | 34,052 | | | | 861,856 | |
Franklin Resources, Inc. | | | 66,224 | | | | 2,209,895 | |
Goldman Sachs Group, Inc. (The) | | | 33,160 | | | | 4,926,913 | |
Morgan Stanley | | | 48,345 | | | | 1,256,003 | |
State Street Corp. | | | 47,468 | | | | 2,559,474 | |
UBS Group AG | | | 98,685 | | | | 1,276,846 | |
| | | | | | | | |
| | | | | | | 21,547,443 | |
| | | | | | | | |
| | |
Chemicals—1.9% | | | | | | | | |
Axalta Coating Systems, Ltd. (b) | | | 52,341 | | | | 1,388,607 | |
Celanese Corp. - Series A | | | 17,480 | | | | 1,144,066 | |
E.I. du Pont de Nemours & Co. | | | 32,868 | | | | 2,129,846 | |
LyondellBasell Industries NV - Class A | | | 36,732 | | | | 2,733,595 | |
Monsanto Co. | | | 18,355 | | | | 1,898,091 | |
PPG Industries, Inc. | | | 61,085 | | | | 6,362,003 | |
Praxair, Inc. | | | 6,123 | | | | 688,164 | |
| | | | | | | | |
| | | | | | | 16,344,372 | |
| | | | | | | | |
| | |
Commercial Services & Supplies—0.5% | | | | | | | | |
Transcontinental, Inc.- Class A | | | 40,080 | | | | 543,211 | |
Tyco International plc | | | 91,207 | | | | 3,885,418 | |
| | | | | | | | |
| | | | | | | 4,428,629 | |
| | | | | | | | |
| | |
Communications Equipment—0.8% | | | | | | | | |
Cisco Systems, Inc. | | | 172,595 | | | | 4,951,751 | |
Motorola Solutions, Inc. | | | 23,849 | | | | 1,573,318 | |
| | | | | | | | |
| | | | | | | 6,525,069 | |
| | | | | | | | |
| | |
Consumer Finance—0.5% | | | | | | | | |
American Express Co. | | | 44,569 | | | | 2,708,013 | |
Discover Financial Services | | | 35,782 | | | | 1,917,557 | |
| | | | | | | | |
| | | | | | | 4,625,570 | |
| | | | | | | | |
| | |
Containers & Packaging—0.1% | | | | | | | | |
Crown Holdings, Inc. (b) | | | 16,461 | | | | 834,079 | |
| | | | | | | | |
| | |
Distributors—0.1% | | | | | | | | |
LKQ Corp. (b) | | | 35,074 | | | | 1,111,846 | |
| | | | | | | | |
| | |
Diversified Financial Services—0.3% | | | | | | | | |
Moody’s Corp. (a) | | | 8,131 | | | | 761,956 | |
Nasdaq, Inc. | | | 25,929 | | | | 1,676,828 | |
S&P Global, Inc. | | | 3,283 | | | | 352,135 | |
| | | | | | | | |
| | | | | | | 2,790,919 | |
| | | | | | | | |
| |
Diversified Telecommunication Services—1.6% | | | | | |
AT&T, Inc. | | | 24,587 | | | | 1,062,404 | |
Frontier Communications Corp. (a) | | | 161,571 | | | | 798,161 | |
TDC A/S | | | 138,749 | | | | 679,140 | |
Telefonica Brasil S.A. (ADR) | | | 93,842 | | | | 1,276,251 | |
Verizon Communications, Inc. | | | 182,938 | | | | 10,215,258 | |
| | | | | | | | |
| | | | | | | 14,031,214 | |
| | | | | | | | |
See accompanying notes to financial statements.
MSF-5
Metropolitan Series Fund
MFS Total Return Portfolio
Schedule of Investments as of June 30, 2016 (Unaudited)
Common Stocks—(Continued)
| | | | | | | | |
| Security Description | | Shares | | | Value | |
| | |
Electric Utilities—1.5% | | | | | | | | |
American Electric Power Co., Inc. | | | 35,425 | | | $ | 2,482,938 | |
Duke Energy Corp. | | | 26,856 | | | | 2,303,976 | |
Exelon Corp. | | | 101,863 | | | | 3,703,739 | |
PPL Corp. | | | 95,499 | | | | 3,605,087 | |
SSE plc | | | 41,029 | | | | 857,912 | |
Xcel Energy, Inc. | | | 9,393 | | | | 420,619 | |
| | | | | | | | |
| | | | | | | 13,374,271 | |
| | | | | | | | |
| | |
Electrical Equipment—0.3% | | | | | | | | |
Eaton Corp. plc | | | 44,792 | | | | 2,675,426 | |
| | | | | | | | |
| | |
Energy Equipment & Services—0.4% | | | | | | | | |
National Oilwell Varco, Inc. (a) | | | 19,357 | | | | 651,363 | |
Schlumberger, Ltd. | | | 33,429 | | | | 2,643,565 | |
| | | | | | | | |
| | | | | | | 3,294,928 | |
| | | | | | | | |
| | |
Food & Staples Retailing—1.1% | | | | | | | | |
CVS Health Corp. | | | 85,244 | | | | 8,161,261 | |
Kroger Co. (The) | | | 30,273 | | | | 1,113,744 | |
Lawson, Inc. | | | 7,900 | | | | 626,299 | |
| | | | | | | | |
| | | | | | | 9,901,304 | |
| | | | | | | | |
| | |
Food Products—2.4% | | | | | | | | |
Archer-Daniels-Midland Co. | | | 100,799 | | | | 4,323,269 | |
Danone S.A. | | | 31,311 | | | | 2,207,822 | |
Dean Foods Co. (a) | | | 18,122 | | | | 327,827 | |
General Mills, Inc. | | | 65,333 | | | | 4,659,550 | |
J.M. Smucker Co. (The) | | | 6,405 | | | | 976,186 | |
Kellogg Co. | | | 18,316 | | | | 1,495,501 | |
Marine Harvest ASA (b) | | | 76,258 | | | | 1,282,715 | |
Mondelez International, Inc. - Class A | | | 26,910 | | | | 1,224,674 | |
Nestle S.A. | | | 55,558 | | | | 4,285,504 | |
| | | | | | | | |
| | | | | | | 20,783,048 | |
| | | | | | | | |
| | |
Health Care Equipment & Supplies—2.0% | | | | | | | | |
Abbott Laboratories | | | 131,570 | | | | 5,172,017 | |
Cooper Cos., Inc. (The) (a) | | | 7,925 | | | | 1,359,692 | |
Medtronic plc | | | 76,370 | | | | 6,626,625 | |
St. Jude Medical, Inc. | | | 31,233 | | | | 2,436,174 | |
Zimmer Biomet Holdings, Inc. | | | 14,404 | | | | 1,733,953 | |
| | | | | | | | |
| | | | | | | 17,328,461 | |
| | | | | | | | |
| | |
Health Care Providers & Services—0.6% | | | | | | | | |
Cigna Corp. | | | 13,066 | | | | 1,672,317 | |
Express Scripts Holding Co. (b) | | | 15,554 | | | | 1,178,993 | |
HCA Holdings, Inc. (b) | | | 5,986 | | | | 460,982 | |
McKesson Corp. | | | 10,049 | | | | 1,875,646 | |
| | | | | | | | |
| | | | | | | 5,187,938 | |
| | | | | | | | |
| | |
Hotels, Restaurants & Leisure—0.3% | | | | | | | | |
Aramark | | | 35,974 | | | | 1,202,251 | |
Hilton Worldwide Holdings, Inc. (a) | | | 26,369 | | | | 594,094 | |
Yum! Brands, Inc. | | | 7,950 | | | | 659,214 | |
| | | | | | | | |
| | | | | | | 2,455,559 | |
| | | | | | | | |
| | |
Household Durables—0.1% | | | | | | | | |
Bellway plc | | | 16,724 | | | | 422,834 | |
Newell Brands, Inc. | | | 12,454 | | | | 604,891 | |
| | | | | | | | |
| | | | | | | 1,027,725 | |
| | | | | | | | |
| | |
Household Products—0.5% | | | | | | | | |
Kimberly-Clark Corp. | | | 10,470 | | | | 1,439,416 | |
Procter & Gamble Co. (The) | | | 24,897 | | | | 2,108,029 | |
Reckitt Benckiser Group plc | | | 11,231 | | | | 1,129,901 | |
| | | | | | | | |
| | | | | | | 4,677,346 | |
| | | | | | | | |
| | |
Industrial Conglomerates—1.7% | | | | | | | | |
3M Co. | | | 37,335 | | | | 6,538,105 | |
Danaher Corp. | | | 78,504 | | | | 7,928,904 | |
| | | | | | | | |
| | | | | | | 14,467,009 | |
| | | | | | | | |
| | |
Insurance—3.7% | | | | | | | | |
Aon plc | | | 39,905 | | | | 4,358,823 | |
Chubb, Ltd. | | | 57,968 | | | | 7,576,997 | |
Prudential Financial, Inc. | | | 67,848 | | | | 4,840,276 | |
Sony Financial Holdings, Inc. | | | 43,800 | | | | 491,633 | |
Travelers Cos., Inc. (The) | | | 84,143 | | | | 10,016,383 | |
Validus Holdings, Ltd. | | | 54,855 | | | | 2,665,405 | |
Zurich Insurance Group AG (b) | | | 8,959 | | | | 2,216,646 | |
| | | | | | | | |
| | | | | | | 32,166,163 | |
| | | | | | | | |
| | |
Internet & Catalog Retail—0.5% | | | | | | | | |
Amazon.com, Inc. (b) | | | 5,985 | | | | 4,282,986 | |
| | | | | | | | |
| | |
Internet Software & Services—0.5% | | | | | | | | |
Alphabet, Inc. - Class A (b) | | | 1,499 | | | | 1,054,592 | |
Facebook, Inc. - Class A (b) | | | 29,904 | | | | 3,417,429 | |
| | | | | | | | |
| | | | | | | 4,472,021 | |
| | | | | | | | |
| | |
IT Services—2.6% | | | | | | | | |
Accenture plc - Class A | | | 66,234 | | | | 7,503,650 | |
Cognizant Technology Solutions Corp. - Class A (b) | | | 9,859 | | | | 564,329 | |
Fidelity National Information Services, Inc. | | | 21,916 | | | | 1,614,771 | |
Fiserv, Inc. (b) | | | 7,833 | | | | 851,682 | |
Global Payments, Inc. | | | 47,139 | | | | 3,364,782 | |
International Business Machines Corp. | | | 33,213 | | | | 5,041,069 | |
Sabre Corp. | | | 49,751 | | | | 1,332,829 | |
Visa, Inc. - Class A (a) | | | 32,005 | | | | 2,373,811 | |
| | | | | | | | |
| | | | | | | 22,646,923 | |
| | | | | | | | |
| | |
Life Sciences Tools & Services—0.7% | | | | | | | | |
Thermo Fisher Scientific, Inc. | | | 38,081 | | | | 5,626,849 | |
| | | | | | | | |
| | |
Machinery—1.5% | | | | | | | | |
Allison Transmission Holdings, Inc. | | | 74,518 | | | | 2,103,643 | |
Caterpillar, Inc. (a) | | | 7,059 | | | | 535,143 | |
Cummins, Inc. (a) | | | 13,158 | | | | 1,479,485 | |
Deere & Co. (a) | | | 21,217 | | | | 1,719,426 | |
Illinois Tool Works, Inc. | | | 32,225 | | | | 3,356,556 | |
Ingersoll-Rand plc | | | 10,125 | | | | 644,760 | |
Pentair plc | | | 26,124 | | | | 1,522,768 | |
Stanley Black & Decker, Inc. | | | 15,646 | | | | 1,740,148 | |
| | | | | | | | |
| | | | | | | 13,101,929 | |
| | | | | | | | |
See accompanying notes to financial statements.
MSF-6
Metropolitan Series Fund
MFS Total Return Portfolio
Schedule of Investments as of June 30, 2016 (Unaudited)
Common Stocks—(Continued)
| | | | | | | | |
| Security Description | | Shares | | | Value | |
| | |
Media—2.7% | | | | | | | | |
Charter Communications, Inc. - Class A (b) | | | 18,233 | | | $ | 4,168,793 | |
Comcast Corp. - Class A | | | 144,682 | | | | 9,431,820 | |
Omnicom Group, Inc. (a) | | | 45,031 | | | | 3,669,576 | |
Time Warner, Inc. | | | 50,883 | | | | 3,741,936 | |
Time, Inc. | | | 1,757 | | | | 28,920 | |
Twenty-First Century Fox, Inc. - Class A | | | 37,517 | | | | 1,014,835 | |
Viacom, Inc. - Class B | | | 9,220 | | | | 382,353 | |
Walt Disney Co. (The) | | | 12,033 | | | | 1,177,068 | |
| | | | | | | | |
| | | | | | | 23,615,301 | |
| | | | | | | | |
| | |
Metals & Mining—0.3% | | | | | | | | |
Rio Tinto plc | | | 68,731 | | | | 2,124,484 | |
| | | | | | | | |
| | |
Multi-Utilities—0.3% | | | | | | | | |
Engie S.A. | | | 73,686 | | | | 1,189,180 | |
Public Service Enterprise Group, Inc. (a) | | | 24,171 | | | | 1,126,610 | |
| | | | | | | | |
| | | | | | | 2,315,790 | |
| | | | | | | | |
| | |
Multiline Retail—0.9% | | | | | | | | |
Kohl’s Corp. (a) | | | 22,799 | | | | 864,538 | |
Target Corp. | | | 93,293 | | | | 6,513,717 | |
| | | | | | | | |
| | | | | | | 7,378,255 | |
| | | | | | | | |
| | |
Oil, Gas & Consumable Fuels—3.6% | | | | | | | | |
Anadarko Petroleum Corp. | | | 27,509 | | | | 1,464,854 | |
BP plc | | | 482,714 | | | | 2,818,727 | |
Canadian Natural Resources, Ltd. (a) | | | 21,377 | | | | 659,053 | |
Chevron Corp. | | | 35,312 | | | | 3,701,757 | |
Enterprise Products Partners L.P. | | | 21,587 | | | | 631,636 | |
EOG Resources, Inc. | | | 35,693 | | | | 2,977,510 | |
EQT Corp. | | | 19,436 | | | | 1,504,929 | |
Exxon Mobil Corp. | | | 53,406 | | | | 5,006,278 | |
Hess Corp. | | | 23,889 | | | | 1,435,729 | |
Marathon Petroleum Corp. | | | 19,711 | | | | 748,230 | |
Noble Energy, Inc. | | | 36,673 | | | | 1,315,461 | |
Occidental Petroleum Corp. | | | 45,760 | | | | 3,457,626 | |
Plains All American Pipeline L.P. | | | 20,725 | | | | 569,730 | |
Rice Energy, Inc. (a)(b) | | | 42,983 | | | | 947,345 | |
Valero Energy Corp. | | | 68,326 | | | | 3,484,626 | |
Williams Partners L.P. | | | 25,772 | | | | 892,742 | |
| | | | | | | | |
| | | | | | | 31,616,233 | |
| | | | | | | | |
| | |
Pharmaceuticals—4.6% | | | | | | | | |
Allergan plc (b) | | | 5,038 | | | | 1,164,232 | |
Bayer AG | | | 29,098 | | | | 2,927,613 | |
Bristol-Myers Squibb Co. | | | 34,107 | | | | 2,508,570 | |
Eli Lilly & Co. | | | 72,103 | | | | 5,678,111 | |
Johnson & Johnson | | | 92,249 | | | | 11,189,804 | |
Merck & Co., Inc. | | | 166,356 | | | | 9,583,769 | |
Novartis AG | | | 5,745 | | | | 472,605 | |
Pfizer, Inc. | | | 172,354 | | | | 6,068,584 | |
Roche Holding AG | | | 1,650 | | | | 435,651 | |
| | | | | | | | |
| | | | | | | 40,028,939 | |
| | | | | | | | |
| | |
Professional Services—0.1% | | | | | | | | |
Equifax, Inc. | | | 3,232 | | | | 414,989 | |
| | | | | | | | |
| | |
Real Estate Investment Trusts—0.6% | | | | | | | | |
Hospitality Properties Trust | | | 27,608 | | | | 795,110 | |
Medical Properties Trust, Inc. (a) | | | 54,041 | | | | 821,964 | |
Mid-America Apartment Communities, Inc. (a) | | | 19,157 | | | | 2,038,305 | |
Starwood Property Trust, Inc. | | | 36,838 | | | | 763,283 | |
STORE Capital Corp. (a) | | | 39,377 | | | | 1,159,653 | |
| | | | | | | | |
| | | | | | | 5,578,315 | |
| | | | | | | | |
| | |
Road & Rail—0.4% | | | | | | | | |
Canadian National Railway Co. (a) | | | 14,709 | | | | 868,714 | |
Union Pacific Corp. | | | 29,065 | | | | 2,535,921 | |
| | | | | | | | |
| | | | | | | 3,404,635 | |
| | | | | | | | |
| |
Semiconductors & Semiconductor Equipment—1.1% | | | | | |
Analog Devices, Inc. | | | 9,194 | | | | 520,748 | |
Intel Corp. | | | 32,446 | | | | 1,064,229 | |
Maxim Integrated Products, Inc. | | | 28,697 | | | | 1,024,196 | |
Microchip Technology, Inc. (a) | | | 12,776 | | | | 648,510 | |
Taiwan Semiconductor Manufacturing Co., Ltd. (ADR) | | | 100,639 | | | | 2,639,761 | |
Texas Instruments, Inc. | | | 60,480 | | | | 3,789,072 | |
| | | | | | | | |
| | | | | | | 9,686,516 | |
| | | | | | | | |
| | |
Software—1.0% | | | | | | | | |
Activision Blizzard, Inc. | | | 38,193 | | | | 1,513,589 | |
CA, Inc. | | | 34,013 | | | | 1,116,647 | |
Microsoft Corp. | | | 59,137 | | | | 3,026,040 | |
Oracle Corp. | | | 67,000 | | | | 2,742,310 | |
| | | | | | | | |
| | | | | | | 8,398,586 | |
| | | | | | | | |
| | |
Specialty Retail—0.4% | | | | | | | | |
Abercrombie & Fitch Co. - Class A | | | 41,753 | | | | 743,621 | |
Advance Auto Parts, Inc. | | | 3,406 | | | | 550,512 | |
American Eagle Outfitters, Inc. (a) | | | 80,777 | | | | 1,286,777 | |
Best Buy Co., Inc. (a) | | | 23,202 | | | | 709,981 | |
| | | | | | | | |
| | | | | | | 3,290,891 | |
| | | | | | | | |
|
Technology Hardware, Storage & Peripherals—0.2% | |
Apple, Inc. | | | 8,962 | | | | 856,767 | |
Hewlett Packard Enterprise Co. (a) | | | 44,314 | | | | 809,617 | |
| | | | | | | | |
| | | | | | | 1,666,384 | |
| | | | | | | | |
| | |
Tobacco—2.6% | | | | | | | | |
Altria Group, Inc. | | | 91,261 | | | | 6,293,358 | |
Japan Tobacco, Inc. (a) | | | 22,900 | | | | 917,388 | |
Philip Morris International, Inc. | | | 142,136 | | | | 14,458,074 | |
Reynolds American, Inc. | | | 18,104 | | | | 976,349 | |
| | | | | | | | |
| | | | | | | 22,645,169 | |
| | | | | | | | |
| | |
Trading Companies & Distributors—0.1% | | | | | | | | |
MSC Industrial Direct Co., Inc. - Class A | | | 10,816 | | | | 763,177 | |
| | | | | | | | |
| |
Wireless Telecommunication Services—0.0% | | | | | |
Vodafone Group plc | | | 124,224 | | | | 378,161 | |
| | | | | | | | |
Total Common Stocks
(Cost $406,066,789) | | | | | | | 511,592,048 | |
| | | | | | | | |
See accompanying notes to financial statements.
MSF-7
Metropolitan Series Fund
MFS Total Return Portfolio
Schedule of Investments as of June 30, 2016 (Unaudited)
U.S. Treasury & Government Agencies—24.3%
| | | | | | | | |
| Security Description | | Principal
Amount* | | | Value | |
| |
Agency Sponsored Mortgage-Backed—11.7% | | | | | |
Fannie Mae 15 Yr. Pool
3.000%, 03/01/27 | | | 134,509 | | | $ | 141,278 | |
3.000%, 04/01/27 | | | 405,831 | | | | 426,315 | |
3.000%, 04/01/30 | | | 370,813 | | | | 388,958 | |
3.000%, 05/01/30 | | | 765,494 | | | | 802,954 | |
3.000%, 10/01/30 | | | 1,079,590 | | | | 1,132,420 | |
3.000%, 11/01/30 | | | 398,400 | | | | 418,147 | |
3.000%, 12/01/30 | | | 674,894 | | �� | | 708,432 | |
3.000%, TBA (c) | | | 588,000 | | | | 616,435 | |
3.500%, TBA (c) | | | 2,034,000 | | | | 2,155,276 | |
4.500%, 04/01/18 | | | 10,154 | | | | 10,418 | |
4.500%, 06/01/18 | | | 31,941 | | | | 32,818 | |
4.500%, 07/01/18 | | | 25,238 | | | | 25,887 | |
4.500%, 03/01/19 | | | 50,200 | | | | 51,600 | |
4.500%, 06/01/19 | | | 32,449 | | | | 33,310 | |
4.500%, 04/01/20 | | | 37,012 | | | | 38,503 | |
4.500%, 07/01/20 | | | 18,893 | | | | 19,555 | |
5.000%, 11/01/17 | | | 18,439 | | | | 18,928 | |
5.000%, 02/01/18 | | | 57,168 | | | | 58,700 | |
5.000%, 12/01/18 | | | 117,715 | | | | 121,476 | |
5.000%, 07/01/19 | | | 68,907 | | | | 71,078 | |
5.000%, 07/01/20 | | | 46,198 | | | | 47,528 | |
5.000%, 08/01/20 | | | 31,033 | | | | 32,767 | |
5.000%, 12/01/20 | | | 93,521 | | | | 98,622 | |
5.500%, 11/01/17 | | | 26,883 | | | | 27,424 | |
5.500%, 12/01/17 | | | 4,434 | | | | 4,532 | |
5.500%, 01/01/18 | | | 27,341 | | | | 27,935 | |
5.500%, 02/01/18 | | | 17,400 | | | | 17,734 | |
5.500%, 06/01/19 | | | 76,578 | | | | 79,890 | |
5.500%, 07/01/19 | | | 67,432 | | | | 70,451 | |
5.500%, 08/01/19 | | | 17,411 | | | | 18,121 | |
5.500%, 09/01/19 | | | 68,958 | | | | 72,156 | |
5.500%, 01/01/21 | | | 38,731 | | | | 41,236 | |
5.500%, 03/01/21 | | | 11,472 | | | | 12,255 | |
6.000%, 07/01/16 | | | 78 | | | | 78 | |
6.000%, 01/01/17 | | | 4,076 | | | | 4,091 | |
6.000%, 02/01/17 | | | 6,023 | | | | 6,082 | |
6.000%, 07/01/17 | | | 10,532 | | | | 10,684 | |
6.000%, 08/01/17 | | | 1,560 | | | | 1,586 | |
6.000%, 09/01/17 | | | 14,089 | | | | 14,324 | |
6.000%, 03/01/18 | | | 1,856 | | | | 1,895 | |
6.000%, 11/01/18 | | | 9,588 | | | | 9,809 | |
6.000%, 01/01/21 | | | 51,057 | | | | 54,356 | |
6.000%, 05/01/21 | | | 15,427 | | | | 16,263 | |
Fannie Mae 20 Yr. Pool
6.000%, 11/01/25 | | | 28,306 | | | | 32,323 | |
Fannie Mae 30 Yr. Pool
3.500%, 11/01/41 | | | 66,864 | | | | 70,574 | |
3.500%, 01/01/42 | | | 875,021 | | | | 936,223 | |
3.500%, 01/01/43 | | | 304,114 | | | | 321,647 | |
3.500%, 04/01/43 | | | 972,069 | | | | 1,027,963 | |
3.500%, 05/01/43 | | | 1,677,015 | | | | 1,773,397 | |
3.500%, 06/01/43 | | | 594,226 | | | | 629,253 | |
3.500%, 07/01/43 | | | 1,598,128 | | | | 1,689,869 | |
3.500%, 08/01/43 | | | 500,926 | | | | 529,680 | |
3.500%, 09/01/43 | | | 2,261,363 | | | | 2,390,352 | |
| |
Agency Sponsored Mortgage-Backed—(Continued) | | | | | |
Fannie Mae 30 Yr. Pool | | | | | | | | |
3.500%, 09/01/45 | | | 1,853,410 | | | | 1,957,002 | |
3.500%, 10/01/45 | | | 743,665 | | | | 785,554 | |
4.000%, 09/01/40 | | | 1,971,038 | | | | 2,120,826 | |
4.000%, 11/01/40 | | | 401,115 | | | | 431,528 | |
4.000%, 12/01/40 | | | 928,874 | | | | 999,719 | |
4.000%, 02/01/41 | | | 1,063,323 | | | | 1,143,708 | |
4.000%, 06/01/41 | | | 868,276 | | | | 933,233 | |
4.000%, 11/01/41 | | | 362,484 | | | | 389,666 | |
4.000%, 01/01/42 | | | 2,528,294 | | | | 2,718,095 | |
4.000%, 04/01/42 | | | 305,726 | | | | 330,822 | |
4.000%, 10/01/42 | | | 280,125 | | | | 302,448 | |
4.000%, 12/01/42 | | | 324,636 | | | | 350,184 | |
4.000%, 01/01/43 | | | 379,102 | | | | 406,908 | |
4.000%, 04/01/43 | | | 97,855 | | | | 105,125 | |
4.000%, 05/01/43 | | | 531,369 | | | | 571,131 | |
4.000%, 06/01/43 | | | 475,498 | | | | 510,881 | |
4.000%, 07/01/43 | | | 492,533 | | | | 528,940 | |
4.000%, 11/01/44 | | | 803,296 | | | | 860,934 | |
4.000%, 02/01/45 | | | 648,315 | | | | 694,833 | |
4.500%, 08/01/33 | | | 228,504 | | | | 250,367 | |
4.500%, 03/01/34 | | | 678,839 | | | | 745,115 | |
4.500%, 01/01/40 | | | 242,830 | | | | 265,954 | |
4.500%, 08/01/40 | | | 57,151 | | | | 62,631 | |
4.500%, 02/01/41 | | | 364,253 | | | | 401,091 | |
4.500%, 04/01/41 | | | 644,413 | | | | 708,254 | |
4.500%, 11/01/42 | | | 230,508 | | | | 252,611 | |
4.500%, 01/01/43 | | | 517,410 | | | | 566,924 | |
4.500%, 04/01/44 | | | 2,902,217 | | | | 3,178,613 | |
4.500%, 06/01/44 | | | 302,466 | | | | 331,127 | |
5.000%, 11/01/33 | | | 128,916 | | | | 143,911 | |
5.000%, 03/01/34 | | | 109,095 | | | | 121,787 | |
5.000%, 05/01/34 | | | 46,266 | | | | 51,639 | |
5.000%, 08/01/34 | | | 45,726 | | | | 51,024 | |
5.000%, 09/01/34 | | | 171,050 | | | | 190,897 | |
5.000%, 06/01/35 | | | 114,130 | | | | 126,979 | |
5.000%, 07/01/35 | | | 343,335 | | | | 381,769 | |
5.000%, 08/01/35 | | | 108,498 | | | | 120,806 | |
5.000%, 09/01/35 | | | 78,355 | | | | 87,069 | |
5.000%, 10/01/35 | | | 317,067 | | | | 352,903 | |
5.000%, 07/01/39 | | | 384,451 | | | | 432,574 | |
5.000%, 10/01/39 | | | 214,644 | | | | 239,515 | |
5.000%, 11/01/39 | | | 93,260 | | | | 104,676 | |
5.000%, 11/01/40 | | | 136,647 | | | | 153,145 | |
5.000%, 01/01/41 | | | 32,899 | | | | 36,529 | |
5.000%, 03/01/41 | | | 94,288 | | | | 105,607 | |
5.500%, 02/01/33 | | | 58,564 | | | | 66,391 | |
5.500%, 05/01/33 | | | 8,941 | | | | 10,059 | |
5.500%, 06/01/33 | | | 210,862 | | | | 239,098 | |
5.500%, 07/01/33 | | | 209,873 | | | | 238,071 | |
5.500%, 11/01/33 | | | 129,944 | | | | 147,341 | |
5.500%, 12/01/33 | | | 18,716 | | | | 21,016 | |
5.500%, 01/01/34 | | | 151,366 | | | | 171,322 | |
5.500%, 02/01/34 | | | 192,172 | | | | 218,059 | |
5.500%, 03/01/34 | | | 52,243 | | | | 60,202 | |
5.500%, 04/01/34 | | | 62,591 | | | | 70,867 | |
5.500%, 05/01/34 | | | 383,068 | | | | 435,631 | |
See accompanying notes to financial statements.
MSF-8
Metropolitan Series Fund
MFS Total Return Portfolio
Schedule of Investments as of June 30, 2016 (Unaudited)
U.S. Treasury & Government Agencies—(Continued)
| | | | | | | | |
| Security Description | | Principal
Amount* | | | Value | |
| |
Agency Sponsored Mortgage-Backed—(Continued) | | | | | |
Fannie Mae 30 Yr. Pool | | | | | | | | |
5.500%, 06/01/34 | | | 477,119 | | | $ | 541,375 | |
5.500%, 07/01/34 | | | 140,574 | | | | 158,762 | |
5.500%, 09/01/34 | | | 539,441 | | | | 610,389 | |
5.500%, 10/01/34 | | | 615,034 | | | | 694,798 | |
5.500%, 11/01/34 | | | 825,263 | | | | 936,251 | |
5.500%, 12/01/34 | | | 358,349 | | | | 403,943 | |
5.500%, 01/01/35 | | | 405,101 | | | | 459,920 | |
5.500%, 02/01/35 | | | 10,852 | | | | 12,183 | |
5.500%, 04/01/35 | | | 73,611 | | | | 83,508 | |
5.500%, 07/01/35 | | | 44,777 | | | | 50,668 | |
5.500%, 08/01/35 | | | 8,230 | | | | 9,242 | |
5.500%, 09/01/35 | | | 253,246 | | | | 289,792 | |
6.000%, 02/01/32 | | | 109,410 | | | | 124,937 | |
6.000%, 03/01/34 | | | 26,995 | | | | 31,507 | |
6.000%, 04/01/34 | | | 252,541 | | | | 292,741 | |
6.000%, 06/01/34 | | | 288,832 | | | | 335,821 | |
6.000%, 07/01/34 | | | 270,053 | | | | 312,065 | |
6.000%, 08/01/34 | | | 414,623 | | | | 478,989 | |
6.000%, 10/01/34 | | | 227,273 | | | | 262,235 | |
6.000%, 11/01/34 | | | 36,192 | | | | 41,466 | |
6.000%, 12/01/34 | | | 9,071 | | | | 10,358 | |
6.000%, 08/01/35 | | | 74,106 | | | | 85,572 | |
6.000%, 09/01/35 | | | 77,300 | | | | 88,988 | |
6.000%, 10/01/35 | | | 118,178 | | | | 135,536 | |
6.000%, 11/01/35 | | | 23,422 | | | | 26,750 | |
6.000%, 12/01/35 | | | 112,553 | | | | 129,125 | |
6.000%, 02/01/36 | | | 151,157 | | | | 175,210 | |
6.000%, 04/01/36 | | | 167,902 | | | | 194,501 | |
6.000%, 06/01/36 | | | 44,403 | | | | 51,038 | |
6.000%, 07/01/37 | | | 144,882 | | | | 166,888 | |
6.500%, 06/01/31 | | | 42,176 | | | | 50,769 | |
6.500%, 07/01/31 | | | 10,201 | | | | 11,739 | |
6.500%, 08/01/31 | | | 7,290 | | | | 8,389 | |
6.500%, 09/01/31 | | | 38,404 | | | | 44,194 | |
6.500%, 02/01/32 | | | 32,323 | | | | 37,990 | |
6.500%, 07/01/32 | | | 115,713 | | | | 136,966 | |
6.500%, 08/01/32 | | | 93,759 | | | | 111,699 | |
6.500%, 01/01/33 | | | 47,932 | | | | 56,820 | |
6.500%, 04/01/34 | | | 62,208 | | | | 73,278 | |
6.500%, 06/01/34 | | | 28,368 | | | | 32,645 | |
6.500%, 08/01/34 | | | 18,031 | | | | 20,750 | |
6.500%, 04/01/36 | | | 25,942 | | | | 29,854 | |
6.500%, 05/01/36 | | | 80,075 | | | | 92,673 | |
6.500%, 02/01/37 | | | 120,439 | | | | 143,882 | |
6.500%, 05/01/37 | | | 83,662 | | | | 96,277 | |
6.500%, 07/01/37 | | | 72,167 | | | | 86,415 | |
Fannie Mae Pool
2.410%, 05/01/23 | | | 94,629 | | | | 98,339 | |
2.550%, 05/01/23 | | | 152,118 | | | | 159,344 | |
2.700%, 07/01/25 | | | 121,000 | | | | 125,699 | |
3.800%, 02/01/18 | | | 133,499 | | | | 137,793 | |
3.828%, 07/01/18 | | | 126,478 | | | | 132,612 | |
3.910%, 02/01/18 | | | 193,590 | | | | 199,968 | |
4.600%, 09/01/19 | | | 129,321 | | | | 141,208 | |
5.370%, 05/01/18 | | | 606,842 | | | | 640,737 | |
| |
Agency Sponsored Mortgage-Backed—(Continued) | | | | | |
Fannie Mae-ACES
2.578%, 09/25/18 | | | 479,442 | | | | 491,932 | |
Freddie Mac 15 Yr. Gold Pool
3.000%, 11/01/30 | | | 864,631 | | | | 907,677 | |
4.500%, 05/01/18 | | | 10,798 | | | | 11,046 | |
4.500%, 08/01/18 | | | 18,007 | | | | 18,419 | |
4.500%, 11/01/18 | | | 32,890 | | | | 33,700 | |
4.500%, 01/01/19 | | | 67,164 | | | | 68,813 | |
4.500%, 08/01/19 | | | 4,481 | | | | 4,596 | |
4.500%, 02/01/20 | | | 30,939 | | | | 31,784 | |
4.500%, 08/01/24 | | | 310,413 | | | | 332,918 | |
5.000%, 12/01/17 | | | 591 | | | | 606 | |
5.000%, 05/01/18 | | | 10,575 | | | | 10,853 | |
5.000%, 09/01/18 | | | 34,948 | | | | 35,928 | |
5.500%, 01/01/19 | | | 12,826 | | | | 13,250 | |
5.500%, 04/01/19 | | | 8,194 | | | | 8,469 | |
5.500%, 06/01/19 | | | 5,369 | | | | 5,552 | |
5.500%, 07/01/19 | | | 4,826 | | | | 4,993 | |
5.500%, 08/01/19 | | | 4,786 | | | | 4,983 | |
5.500%, 02/01/20 | | | 4,474 | | | | 4,677 | |
6.000%, 04/01/17 | | | 2,576 | | | | 2,607 | |
6.000%, 07/01/17 | | | 1,454 | | | | 1,469 | |
6.000%, 10/01/17 | | | 3,081 | | | | 3,123 | |
6.000%, 08/01/19 | | | 47,701 | | | | 49,816 | |
6.000%, 09/01/19 | | | 9,329 | | | | 9,537 | |
6.000%, 11/01/19 | | | 9,412 | | | | 9,801 | |
6.000%, 05/01/21 | | | 19,897 | | | | 20,924 | |
6.000%, 10/01/21 | | | 43,278 | | | | 46,078 | |
Freddie Mac 20 Yr. Gold Pool
5.500%, 10/01/24 | | | 56,818 | | | | 63,265 | |
5.500%, 06/01/25 | | | 105,173 | | | | 117,097 | |
5.500%, 07/01/25 | | | 59,165 | | | | 65,877 | |
5.500%, 08/01/25 | | | 85,815 | | | | 95,550 | |
6.000%, 02/01/23 | | | 85,053 | | | | 96,527 | |
6.000%, 12/01/25 | | | 38,441 | | | | 43,637 | |
6.000%, 02/01/26 | | | 34,344 | | | | 38,985 | |
Freddie Mac 30 Yr. Gold Pool
3.000%, 10/01/42 | | | 673,700 | | | | 700,041 | |
3.000%, 04/01/43 | | | 1,576,151 | | | | 1,655,285 | |
3.000%, 05/01/43 | | | 1,325,455 | | | | 1,387,857 | |
3.500%, 02/01/42 | | | 766,211 | | | | 818,774 | |
3.500%, 04/01/42 | | | 428,730 | | | | 460,985 | |
3.500%, 12/01/42 | | | 1,166,337 | | | | 1,248,737 | |
3.500%, 04/01/43 | | | 300,757 | | | | 322,116 | |
3.500%, 07/01/43 | | | 448,611 | | | | 473,231 | |
3.500%, 08/01/43 | | | 778,999 | | | | 822,129 | |
3.500%, 11/01/45 | | | 1,665,938 | | | | 1,759,840 | |
3.500%, 12/01/45 | | | 750,643 | | | | 792,979 | |
4.000%, 11/01/40 | | | 984,107 | | | | 1,058,003 | |
4.000%, 01/01/41 | | | 1,949,970 | | | | 2,095,937 | |
4.000%, 11/01/43 | | | 608,895 | | | | 652,057 | |
4.000%, 04/01/44 | | | 687,483 | | | | 736,721 | |
4.000%, 09/01/44 | | | 2,112,808 | | | | 2,260,905 | |
4.000%, 09/01/45 | | | 883,726 | | | | 945,858 | |
4.500%, 04/01/35 | | | 62,022 | | | | 67,749 | |
4.500%, 07/01/39 | | | 347,991 | | | | 380,862 | |
See accompanying notes to financial statements.
MSF-9
Metropolitan Series Fund
MFS Total Return Portfolio
Schedule of Investments as of June 30, 2016 (Unaudited)
U.S. Treasury & Government Agencies—(Continued)
| | | | | | | | |
| Security Description | | Principal
Amount* | | | Value | |
| |
Agency Sponsored Mortgage-Backed—(Continued) | | | | | |
Freddie Mac 30 Yr. Gold Pool | | | | | | | | |
4.500%, 09/01/39 | | | 183,318 | | | $ | 200,914 | |
4.500%, 10/01/39 | | | 109,709 | | | | 120,308 | |
4.500%, 12/01/39 | | | 176,468 | | | | 193,676 | |
4.500%, 05/01/42 | | | 296,589 | | | | 325,219 | |
5.000%, 09/01/33 | | | 264,280 | | | | 294,494 | |
5.000%, 03/01/34 | | | 62,361 | | | | 69,986 | |
5.000%, 04/01/34 | | | 46,672 | | | | 51,856 | |
5.000%, 08/01/35 | | | 66,303 | | | | 73,529 | |
5.000%, 10/01/35 | | | 135,443 | | | | 151,143 | |
5.000%, 11/01/35 | | | 110,773 | | | | 122,606 | |
5.000%, 12/01/36 | | | 75,804 | | | | 84,237 | |
5.000%, 07/01/39 | | | 560,116 | | | | 618,164 | |
5.500%, 12/01/33 | | | 270,011 | | | | 307,078 | |
5.500%, 01/01/34 | | | 198,280 | | | | 223,790 | |
5.500%, 04/01/34 | | | 50,175 | | | | 56,989 | |
5.500%, 11/01/34 | | | 44,884 | | | | 50,821 | |
5.500%, 12/01/34 | | | 53,663 | | | | 59,963 | |
5.500%, 05/01/35 | | | 34,582 | | | | 38,809 | |
5.500%, 09/01/35 | | | 66,653 | | | | 74,447 | |
5.500%, 10/01/35 | | | 75,196 | | | | 85,470 | |
6.000%, 04/01/34 | | | 108,673 | | | | 125,671 | |
6.000%, 07/01/34 | | | 37,394 | | | | 42,752 | |
6.000%, 08/01/34 | | | 332,013 | | | | 384,006 | |
6.000%, 09/01/34 | | | 4,789 | | | | 5,439 | |
6.000%, 07/01/35 | | | 57,581 | | | | 66,364 | |
6.000%, 08/01/35 | | | 65,290 | | | | 75,349 | |
6.000%, 11/01/35 | | | 127,072 | | | | 145,801 | |
6.000%, 03/01/36 | | | 53,589 | | | | 60,848 | |
6.000%, 10/01/36 | | | 45,366 | | | | 52,260 | |
6.000%, 03/01/37 | | | 8,031 | | | | 9,121 | |
6.000%, 05/01/37 | | | 70,346 | | | | 81,418 | |
6.000%, 06/01/37 | | | 83,396 | | | | 96,122 | |
6.500%, 05/01/34 | | | 29,019 | | | | 33,338 | |
6.500%, 06/01/34 | | | 77,612 | | | | 89,797 | |
6.500%, 08/01/34 | | | 91,633 | | | | 105,266 | |
6.500%, 10/01/34 | | | 98,146 | | | | 116,491 | |
6.500%, 11/01/34 | | | 45,328 | | | | 52,072 | |
6.500%, 05/01/37 | | | 74,148 | | | | 88,762 | |
6.500%, 07/01/37 | | | 106,505 | | | | 126,234 | |
Freddie Mac Multifamily Structured Pass-Through Certificates
1.869%, 11/25/19 | | | 363,000 | | | | 370,254 | |
2.412%, 08/25/18 | | | 455,855 | | | | 467,229 | |
2.456%, 08/25/19 | | | 330,000 | | | | 342,074 | |
2.510%, 11/25/22 | | | 415,000 | | | | 434,727 | |
2.670%, 12/25/24 | | | 507,000 | | | | 532,769 | |
2.673%, 03/25/26 | | | 300,000 | | | | 314,154 | |
2.682%, 10/25/22 | | | 620,000 | | | | 655,602 | |
2.716%, 06/25/22 | | | 346,271 | | | | 366,070 | |
2.791%, 01/25/22 | | | 474,000 | | | | 501,968 | |
3.111%, 02/25/23 | | | 695,000 | | | | 753,352 | |
3.154%, 02/25/18 | | | 110,889 | | | | 114,052 | |
3.171%, 10/25/24 | | | 424,000 | | | | 461,876 | |
3.250%, 04/25/23 (d) | | | 803,000 | | | | 876,993 | |
3.320%, 02/25/23 (d) | | | 186,000 | | | | 203,960 | |
| |
Agency Sponsored Mortgage-Backed—(Continued) | | | | | |
Freddie Mac Multifamily Structured Pass-Through Certificates | | | | | | | | |
3.458%, 08/25/23 (d) | | | 835,000 | | | | 922,939 | |
5.085%, 03/25/19 | | | 1,226,000 | | | | 1,338,268 | |
Ginnie Mae I 30 Yr. Pool
3.000%, 02/15/43 | | | 536,904 | | | | 563,480 | |
3.500%, 12/15/41 | | | 391,271 | | | | 419,141 | |
3.500%, 02/15/42 | | | 187,055 | | | | 198,701 | |
4.500%, 09/15/33 | | | 106,839 | | | | 118,460 | |
4.500%, 11/15/39 | | | 368,280 | | | | 406,051 | |
4.500%, 03/15/40 | | | 375,192 | | | | 423,473 | |
4.500%, 04/15/40 | | | 513,163 | | | | 566,294 | |
4.500%, 06/15/40 | | | 207,925 | | | | 231,959 | |
5.000%, 03/15/34 | | | 40,961 | | | | 46,250 | |
5.000%, 06/15/34 | | | 92,963 | | | | 105,139 | |
5.000%, 12/15/34 | | | 38,807 | | | | 43,932 | |
5.000%, 06/15/35 | | | 10,654 | | | | 11,859 | |
5.500%, 11/15/32 | | | 154,849 | | | | 176,046 | |
5.500%, 08/15/33 | | | 317,818 | | | | 363,102 | |
5.500%, 12/15/33 | | | 174,529 | | | | 200,808 | |
5.500%, 09/15/34 | | | 130,101 | | | | 149,802 | |
5.500%, 10/15/35 | | | 37,687 | | | | 43,149 | |
6.000%, 12/15/28 | | | 42,420 | | | | 49,336 | |
6.000%, 12/15/31 | | | 40,214 | | | | 47,176 | |
6.000%, 03/15/32 | | | 3,666 | | | | 4,197 | |
6.000%, 10/15/32 | | | 174,829 | | | | 205,161 | |
6.000%, 01/15/33 | | | 77,695 | | | | 89,393 | |
6.000%, 02/15/33 | | | 1,832 | | | | 2,094 | |
6.000%, 04/15/33 | | | 187,721 | | | | 219,839 | |
6.000%, 08/15/33 | | | 1,557 | | | | 1,793 | |
6.000%, 07/15/34 | | | 122,536 | | | | 143,109 | |
6.000%, 09/15/34 | | | 42,961 | | | | 49,181 | |
6.000%, 01/15/38 | | | 176,417 | | | | 205,044 | |
Ginnie Mae II 30 Yr. Pool
3.000%, 06/20/43 | | | 695,105 | | | | 729,191 | |
3.000%, 07/20/43 | | | 516,539 | | | | 541,877 | |
3.500%, 06/20/43 | | | 995,097 | | | | 1,060,504 | |
3.500%, 07/20/43 | | | 1,263,642 | | | | 1,346,699 | |
3.500%, 12/20/45 | | | 741,233 | | | | 787,809 | |
4.000%, 01/20/41 | | | 1,272,008 | | | | 1,370,669 | |
4.000%, 02/20/41 | | | 317,923 | | | | 342,582 | |
4.000%, 04/20/41 | | | 238,270 | | | | 256,713 | |
4.000%, 02/20/42 | | | 332,289 | | | | 357,490 | |
4.500%, 07/20/33 | | | 22,018 | | | | 23,832 | |
4.500%, 09/20/33 | | | 14,183 | | | | 15,353 | |
4.500%, 12/20/34 | | | 10,611 | | | | 11,410 | |
4.500%, 03/20/35 | | | 55,920 | | | | 60,517 | |
4.500%, 01/20/41 | | | 328,896 | | | | 359,077 | |
5.000%, 07/20/33 | | | 47,324 | | | | 53,263 | |
6.000%, 01/20/35 | | | 50,797 | | | | 60,026 | |
6.000%, 02/20/35 | | | 25,416 | | | | 30,032 | |
6.000%, 04/20/35 | | | 42,476 | | | | 50,177 | |
| | | | | | | | |
| | | | | | | 101,943,939 | |
| | | | | | | | |
|
Federal Agencies—0.1% | |
Financing Corp.
9.650%, 11/02/18 | | | 430,000 | | | | 518,222 | |
| | | | | | | | |
See accompanying notes to financial statements.
MSF-10
Metropolitan Series Fund
MFS Total Return Portfolio
Schedule of Investments as of June 30, 2016 (Unaudited)
U.S. Treasury & Government Agencies—(Continued)
| | | | | | | | |
| Security Description | | Principal
Amount* | | | Value | |
|
U.S. Treasury—12.5% | |
U.S. Treasury Bonds
2.875%, 05/15/43 | | | 22,942,400 | | | $ | 25,798,545 | |
4.500%, 02/15/36 (a) | | | 1,512,000 | | | | 2,177,871 | |
4.500%, 08/15/39 | | | 2,514,000 | | | | 3,634,301 | |
5.000%, 05/15/37 | | | 232,000 | | | | 356,628 | |
5.250%, 02/15/29 | | | 16,000 | | | | 22,624 | |
5.375%, 02/15/31 | | | 276,000 | | | | 409,353 | |
6.250%, 08/15/23 | | | 80,000 | | | | 107,228 | |
U.S. Treasury Notes
0.750%, 06/30/17 (a) | | | 4,523,000 | | | | 4,533,426 | |
0.875%, 12/31/16 | | | 584,000 | | | | 585,348 | |
1.000%, 06/30/19 | | | 16,589,000 | | | | 16,729,625 | |
1.375%, 02/29/20 | | | 798,000 | | | | 813,056 | |
2.500%, 08/15/23 | | | 7,449,000 | | | | 8,069,651 | |
2.750%, 02/15/19 | | | 2,524,100 | | | | 2,660,558 | |
3.125%, 05/15/19 | | | 6,086,000 | | | | 6,504,887 | |
3.125%, 05/15/21 | | | 3,504,000 | | | | 3,855,083 | |
3.500%, 05/15/20 | | | 25,140,000 | | | | 27,632,405 | |
3.750%, 11/15/18 | | | 2,067,000 | | | | 2,218,796 | |
4.750%, 08/15/17 | | | 2,444,000 | | | | 2,558,086 | |
| | | | | | | | |
| | | | | | | 108,667,471 | |
| | | | | | | | |
Total U.S. Treasury & Government Agencies
(Cost $201,972,218) | | | | | | | 211,129,632 | |
| | | | | | | | |
|
| Corporate Bonds & Notes—12.1% | |
|
Agriculture—0.3% | |
Imperial Brands Finance plc
2.950%, 07/21/20 (144A) (e) | | | 828,000 | | | | 852,660 | |
Reynolds American, Inc.
4.450%, 06/12/25 | | | 1,823,000 | | | | 2,041,647 | |
| | | | | | | | |
| | | | | | | 2,894,307 | |
| | | | | | | | |
|
Auto Manufacturers—0.4% | |
General Motors Financial Co., Inc.
3.200%, 07/06/21 | | | 776,000 | | | | 777,235 | |
5.250%, 03/01/26 | | | 391,000 | | | | 425,050 | |
Toyota Motor Credit Corp.
3.400%, 09/15/21 | | | 880,000 | | | | 957,848 | |
Volkswagen International Finance NV
2.375%, 03/22/17 (144A) (a) | | | 857,000 | | | | 862,596 | |
| | | | | | | | |
| | | | | | | 3,022,729 | |
| | | | | | | | |
|
Banks—2.6% | |
ABN AMRO Bank NV
4.800%, 04/18/26 (144A) | | | 800,000 | | | | 832,942 | |
Banco de Credito del Peru
5.375%, 09/16/20 | | | 835,000 | | | | 926,850 | |
Bank of America Corp.
4.100%, 07/24/23 | | | 1,270,000 | | | | 1,360,595 | |
4.125%, 01/22/24 | | | 1,973,000 | | | | 2,122,117 | |
5.490%, 03/15/19 | | | 196,000 | | | | 211,916 | |
7.625%, 06/01/19 | | | 710,000 | | | | 821,774 | |
Bank One Corp.
8.000%, 04/29/27 | | | 100,000 | | | | 135,527 | |
|
Banks—(Continued) | |
BBVA Bancomer S.A.
6.750%, 09/30/22 (144A) | | | 810,000 | | | | 904,260 | |
BNP Paribas S.A.
7.195%, 06/25/37 (144A) (a) (d) | | | 500,000 | | | | 540,000 | |
BPCE S.A.
12.500%, 09/30/19 (144A) (d) | | | 922,000 | | | | 1,137,702 | |
Capital One Financial Corp.
6.150%, 09/01/16 | | | 1,330,000 | | | | 1,340,345 | |
Citigroup, Inc.
2.500%, 09/26/18 | | | 580,000 | | | | 591,496 | |
Credit Suisse AG
6.500%, 08/08/23 (144A) | | | 396,000 | | | | 414,018 | |
Discover Bank
4.200%, 08/08/23 | | | 510,000 | | | | 539,077 | |
ING Bank NV
5.800%, 09/25/23 (144A) | | | 1,076,000 | | | | 1,180,821 | |
JPMorgan Chase & Co.
6.300%, 04/23/19 | | | 1,210,000 | | | | 1,360,179 | |
KFW
4.875%, 06/17/19 | | | 1,290,000 | | | | 1,436,198 | |
Mitsubishi UFJ Financial Group, Inc.
3.850%, 03/01/26 (a) | | | 784,000 | | | | 855,333 | |
Morgan Stanley
3.875%, 04/29/24 | | | 1,081,000 | | | | 1,157,121 | |
4.000%, 07/23/25 | | | 396,000 | | | | 424,032 | |
6.625%, 04/01/18 | | | 1,343,000 | | | | 1,455,507 | |
PNC Funding Corp.
5.625%, 02/01/17 | | | 1,080,000 | | | | 1,106,677 | |
Swedbank AB
2.125%, 09/29/17 (144A) | | | 231,000 | | | | 233,411 | |
UBS Group Funding Jersey, Ltd.
4.125%, 04/15/26 (144A) (e) | | | 838,000 | | | | 870,916 | |
Wells Fargo & Co.
5.900%, 06/15/24 (d) | | | 594,000 | | | | 611,077 | |
| | | | | | | | |
| | | | | | | 22,569,891 | |
| | | | | | | | |
| | |
Beverages—0.5% | | | | | | | | |
Anheuser-Busch InBev Finance, Inc.
3.650%, 02/01/26 | | | 1,171,000 | | | | 1,254,429 | |
Anheuser-Busch InBev Worldwide, Inc.
8.000%, 11/15/39 | | | 1,020,000 | | | | 1,593,968 | |
Diageo Capital plc
2.625%, 04/29/23 | | | 1,020,000 | | | | 1,058,904 | |
| | | | | | | | |
| | | | | | | 3,907,301 | |
| | | | | | | | |
| | |
Biotechnology—0.3% | | | | | | | | |
Celgene Corp.
2.875%, 08/15/20 | | | 504,000 | | | | 521,202 | |
Gilead Sciences, Inc.
3.500%, 02/01/25 | | | 1,880,000 | | | | 2,004,230 | |
3.700%, 04/01/24 | | | 312,000 | | | | 337,854 | |
| | | | | | | | |
| | | | | | | 2,863,286 | |
| | | | | | | | |
| | |
Commercial Services—0.2% | | | | | | | | |
ERAC USA Finance LLC
7.000%, 10/15/37 (144A) | | | 1,115,000 | | | | 1,519,047 | |
| | | | | | | | |
See accompanying notes to financial statements.
MSF-11
Metropolitan Series Fund
MFS Total Return Portfolio
Schedule of Investments as of June 30, 2016 (Unaudited)
Corporate Bonds & Notes—(Continued)
| | | | | | | | |
| Security Description | | Principal
Amount* | | | Value | |
| | |
Computers—0.2% | | | | | | | | |
Apple, Inc.
2.850%, 02/23/23 | | | 1,176,000 | | | $ | 1,235,760 | |
3.850%, 05/04/43 | | | 370,000 | | | | 371,487 | |
| | | | | | | | |
| | | | | | | 1,607,247 | |
| | | | | | | | |
| | |
Diversified Financial Services—0.3% | | | | | | | | |
GE Capital International Funding Co.
3.373%, 11/15/25 (144A) | | | 358,000 | | | | 388,513 | |
Intercontinental Exchange, Inc.
2.750%, 12/01/20 | | | 301,000 | | | | 316,248 | |
4.000%, 10/15/23 | | | 832,000 | | | | 902,979 | |
Visa, Inc.
3.150%, 12/14/25 | | | 1,192,000 | | | | 1,274,380 | |
| | | | | | | | |
| | | | | | | 2,882,120 | |
| | | | | | | | |
| | |
Electric—1.1% | | | | | | | | |
Berkshire Hathaway Energy Co.
3.750%, 11/15/23 | | | 440,000 | | | | 480,804 | |
Exelon Corp.
3.400%, 04/15/26 | | | 1,137,000 | | | | 1,188,310 | |
Midamerican Funding LLC
6.927%, 03/01/29 | | | 699,000 | | | | 979,727 | |
Oncor Electric Delivery Co. LLC
7.000%, 09/01/22 | | | 795,000 | | | | 1,012,384 | |
Pacific Gas & Electric Co.
4.600%, 06/15/43 | | | 880,000 | | | | 1,007,033 | |
PPL Capital Funding, Inc.
3.400%, 06/01/23 | | | 880,000 | | | | 918,284 | |
5.000%, 03/15/44 | | | 296,000 | | | | 331,202 | |
Progress Energy, Inc.
3.150%, 04/01/22 | | | 1,083,000 | | | | 1,127,011 | |
Southern Co. (The)
3.250%, 07/01/26 (a) | | | 1,295,000 | | | | 1,345,146 | |
State Grid Overseas Investment, Ltd.
2.750%, 05/07/19 (144A) (e) | | | 778,000 | | | | 801,251 | |
W3A Funding Corp.
8.090%, 01/02/17 | | | 244,260 | | | | 244,267 | |
| | | | | | | | |
| | | | | | | 9,435,419 | |
| | | | | | | | |
| | |
Food—0.2% | | | | | | | | |
J.M. Smucker Co. (The)
3.500%, 03/15/25 | | | 580,000 | | | | 626,320 | |
Kraft Heinz Foods Co.
3.500%, 06/06/22 | | | 412,000 | | | | 438,170 | |
WM Wrigley Jr. Co.
2.400%, 10/21/18 (144A) | | | 248,000 | | | | 252,922 | |
| | | | | | | | |
| | | | | | | 1,317,412 | |
| | | | | | | | |
| | |
Healthcare-Products—0.5% | | | | | | | | |
Becton Dickinson & Co.
2.675%, 12/15/19 | | | 596,000 | | | | 613,005 | |
6.375%, 08/01/19 | | | 1,110,000 | | | | 1,264,256 | |
Medtronic, Inc.
4.375%, 03/15/35 | | | 946,000 | | | | 1,070,058 | |
| | |
Healthcare-Products—(Continued) | | | | | | | | |
Zimmer Biomet Holdings, Inc.
3.550%, 04/01/25 | | | 1,222,000 | | | | 1,259,518 | |
| | | | | | | | |
| | | | | | | 4,206,837 | |
| | | | | | | | |
|
Healthcare-Services—0.5% | |
Aetna, Inc.
3.200%, 06/15/26 | | | 1,132,000 | | | | 1,164,629 | |
Anthem, Inc.
3.300%, 01/15/23 | | | 600,000 | | | | 619,755 | |
Laboratory Corp. of America Holdings
3.200%, 02/01/22 | | | 850,000 | | | | 879,223 | |
Roche Holdings, Inc.
6.000%, 03/01/19 (144A) | | | 315,000 | | | | 354,422 | |
UnitedHealth Group, Inc.
3.750%, 07/15/25 | | | 1,303,000 | | | | 1,429,543 | |
| | | | | | | | |
| | | | | | | 4,447,572 | |
| | | | | | | | |
|
Household Products/Wares—0.1% | |
Reckitt Benckiser Treasury Services plc
3.625%, 09/21/23 (144A) | | | 1,070,000 | | | | 1,153,940 | |
| | | | | | | | |
|
Housewares—0.1% | |
Newell Brands, Inc.
3.850%, 04/01/23 (a) | | | 914,000 | | | | 969,452 | |
| | | | | | | | |
|
Insurance—0.6% | |
American International Group, Inc.
4.125%, 02/15/24 | | | 750,000 | | | | 791,198 | |
4.875%, 06/01/22 | | | 1,770,000 | | | | 1,971,826 | |
Berkshire Hathaway, Inc.
3.125%, 03/15/26 | | | 390,000 | | | | 408,932 | |
Liberty Mutual Group, Inc.
4.250%, 06/15/23 (144A) | | | 578,000 | | | | 613,973 | |
Marsh & McLennan Cos., Inc.
4.800%, 07/15/21 | | | 920,000 | | | | 1,020,188 | |
ZFS Finance USA Trust V
6.500%, 05/09/37 (144A) (d) | | | 491,000 | | | | 491,000 | |
| | | | | | | | |
| | | | | | | 5,297,117 | |
| | | | | | | | |
|
Internet—0.1% | |
Baidu, Inc.
3.500%, 11/28/22 | | | 1,110,000 | | | | 1,135,226 | |
| | | | | | | | |
|
Media—0.4% | |
21st Century Fox America, Inc.
8.500%, 02/23/25 | | | 722,000 | | | | 979,861 | |
Charter Communications Operating LLC / Charter Communications Operating Capital Corp.
4.908%, 07/23/25 (144A) | | | 523,000 | | | | 571,797 | |
Grupo Televisa S.A.B.
5.000%, 05/13/45 | | | 318,000 | | | | 305,229 | |
Time Warner Entertainment Co. L.P.
8.375%, 07/15/33 | | | 1,240,000 | | | | 1,680,097 | |
| | | | | | | | |
| | | | | | | 3,536,984 | |
| | | | | | | | |
See accompanying notes to financial statements.
MSF-12
Metropolitan Series Fund
MFS Total Return Portfolio
Schedule of Investments as of June 30, 2016 (Unaudited)
Corporate Bonds & Notes—(Continued)
| | | | | | | | |
| Security Description | | Principal
Amount* | | | Value | |
|
Mining—0.1% | |
Freeport-McMoRan, Inc.
3.875%, 03/15/23 (a) | | | 1,010,000 | | | $ | 883,750 | |
| | | | | | | | |
|
Miscellaneous Manufacturing—0.1% | |
General Electric Co.
1.249%, 01/09/20 (d) | | | 633,000 | | | | 636,170 | |
3.100%, 01/09/23 | | | 138,000 | | | | 147,413 | |
| | | | | | | | |
| | | | | | | 783,583 | |
| | | | | | | | |
|
Multi-National—0.1% | |
Asian Development Bank
1.125%, 03/15/17 | | | 574,000 | | | | 575,629 | |
| | | | | | | | |
|
Oil & Gas—1.0% | |
Anadarko Petroleum Corp.
6.375%, 09/15/17 | | | 68,000 | | | | 71,573 | |
BP Capital Markets plc
4.500%, 10/01/20 | | | 306,000 | | | | 339,050 | |
4.742%, 03/11/21 | | | 847,000 | | | | 951,413 | |
Chevron Corp.
0.796%, 11/15/17 (d) | | | 1,696,000 | | | | 1,691,998 | |
CNOOC Finance, Ltd.
3.875%, 05/02/22 (144A) | | | 1,010,000 | | | | 1,060,884 | |
Petro-Canada
6.050%, 05/15/18 | | | 1,664,000 | | | | 1,789,585 | |
Petroleos Mexicanos
3.125%, 01/23/19 | | | 352,000 | | | | 351,120 | |
8.000%, 05/03/19 | | | 759,000 | | | | 845,572 | |
Ras Laffan Liquefied Natural Gas Co., Ltd.
5.832%, 09/30/16 (144A) | | | 104,178 | | | | 105,322 | |
Statoil ASA
7.750%, 06/15/23 | | | 100,000 | | | | 132,680 | |
Total Capital International S.A.
1.550%, 06/28/17 | | | 684,000 | | | | 687,555 | |
3.750%, 04/10/24 (a) | | | 910,000 | | | | 1,001,622 | |
| | | | | | | | |
| | | | | | | 9,028,374 | |
| | | | | | | | |
|
Pharmaceuticals—0.4% | |
AbbVie, Inc.
3.600%, 05/14/25 | | | 584,000 | | | | 611,933 | |
Actavis Funding SCS
3.800%, 03/15/25 | | | 463,000 | | | | 482,366 | |
4.850%, 06/15/44 | | | 537,000 | | | | 565,532 | |
Express Scripts Holding Co.
2.650%, 02/15/17 | | | 1,280,000 | | | | 1,293,608 | |
Teva Pharmaceutical Finance IV B.V.
3.650%, 11/10/21 | | | 572,000 | | | | 606,163 | |
| | | | | | | | |
| | | | | | | 3,559,602 | |
| | | | | | | | |
|
Pipelines—0.7% | |
APT Pipelines, Ltd.
4.200%, 03/23/25 (144A) | | | 1,228,000 | | | | 1,259,557 | |
Energy Transfer Partners L.P.
3.600%, 02/01/23 | | | 558,000 | | | | 534,699 | |
4.900%, 02/01/24 | | | 450,000 | | | | 460,068 | |
|
Pipelines—(Continued) | |
Enterprise Products Operating LLC
6.500%, 01/31/19 | | | 908,000 | | | | 1,016,816 | |
Kinder Morgan Energy Partners L.P.
4.150%, 02/01/24 | | | 691,000 | | | | 694,547 | |
7.750%, 03/15/32 | | | 625,000 | | | | 701,022 | |
Spectra Energy Capital LLC
8.000%, 10/01/19 | | | 1,253,000 | | | | 1,438,462 | |
| | | | | | | | |
| | | | | | | 6,105,171 | |
| | | | | | | | |
| | |
Real Estate Investment Trusts—0.1% | | | | | | | | |
HCP, Inc.
5.375%, 02/01/21 | | | 734,000 | | | | 815,967 | |
| | | | | | | | |
| | |
Retail—0.3% | | | | | | | | |
CVS Health Corp.
3.875%, 07/20/25 | | | 1,094,000 | | | | 1,203,375 | |
Home Depot, Inc. (The)
5.950%, 04/01/41 | | | 278,000 | | | | 383,616 | |
Walgreens Boots Alliance, Inc.
3.300%, 11/18/21 | | | 836,000 | | | | 876,663 | |
4.500%, 11/18/34 | | | 426,000 | | | | 447,107 | |
| | | | | | | | |
| | | | | | | 2,910,761 | |
| | | | | | | | |
| | |
Sovereign—0.2% | | | | | | | | |
Temasek Financial I, Ltd.
2.375%, 01/23/23 (144A) | | | 1,790,000 | | | | 1,846,469 | |
| | | | | | | | |
| | |
Telecommunications—0.7% | | | | | | | | |
AT&T, Inc.
3.000%, 06/30/22 | | | 838,000 | | | | 858,174 | |
3.400%, 05/15/25 | | | 838,000 | | | | 857,196 | |
Crown Castle Towers LLC
4.883%, 08/15/20 (144A) | | | 370,000 | | | | 403,349 | |
6.113%, 01/15/20 (144A) | | | 711,000 | | | | 790,888 | |
Rogers Communications, Inc.
6.800%, 08/15/18 | | | 1,483,000 | | | | 1,642,329 | |
Verizon Communications, Inc.
5.050%, 03/15/34 | | | 1,024,000 | | | | 1,136,533 | |
6.400%, 09/15/33 | | | 320,000 | | | | 408,449 | |
| | | | | | | | |
| | | | | | | 6,096,918 | |
| | | | | | | | |
Total Corporate Bonds & Notes
(Cost $98,958,478) | | | | | | | 105,372,111 | |
| | | | | | | | |
|
| Mortgage-Backed Securities—1.9% | |
|
Collateralized Mortgage Obligations—0.0% | |
BlackRock Capital Finance L.P.
7.750%, 09/25/26 (144A) (e) | | | 23,912 | | | | 4,682 | |
| | | | | | | | |
|
Commercial Mortgage-Backed Securities—1.9% | |
Commercial Mortgage Trust
3.708%, 07/10/48 | | | 1,300,833 | | | | 1,424,782 | |
5.475%, 03/10/39 | | | 3,025,000 | | | | 3,075,625 | |
Credit Suisse Commercial Mortgage Trust
5.695%, 09/15/40 (d) | | | 1,279,926 | | | | 1,323,582 | |
See accompanying notes to financial statements.
MSF-13
Metropolitan Series Fund
MFS Total Return Portfolio
Schedule of Investments as of June 30, 2016 (Unaudited)
Mortgage-Backed Securities—(Continued)
| | | | | | | | |
| Security Description | |
Principal
Amount* | | | Value | |
|
Commercial Mortgage-Backed Securities—(Continued) | |
CSAIL Commercial Mortgage Trust
3.504%, 06/15/57 | | | 738,578 | | | $ | 795,238 | |
General Electric Capital Assurance Co.
5.743%, 05/12/35 (144A) (d) (e) | | | 22,961 | | | | 24,922 | |
GS Mortgage Securities Corp. II
3.382%, 05/10/50 | | | 1,387,991 | | | | 1,485,421 | |
JPMBB Commercial Mortgage Securities Trust
3.494%, 01/15/48 | | | 1,590,000 | | | | 1,711,858 | |
JPMorgan Chase Commercial Mortgage Securities Trust
5.927%, 06/15/49 (d) | | | 2,207,157 | | | | 2,246,848 | |
Morgan Stanley Capital I, Inc.
1.135%, 11/15/30 (144A) (d) (f) | | | 1,119,775 | | | | 15,796 | |
Wachovia Bank Commercial Mortgage Trust
5.889%, 06/15/49 (d) | | | 1,131,867 | | | | 1,166,506 | |
6.147%, 02/15/51 (d) | | | 1,400,589 | | | | 1,429,577 | |
Wells Fargo Commercial Mortgage Trust
3.540%, 05/15/48 | | | 1,410,327 | | | | 1,522,695 | |
| | | | | | | | |
| | | | | | | 16,222,850 | |
| | | | | | | | |
Total Mortgage-Backed Securities
(Cost $13,642,475) | | | | | | | 16,227,532 | |
| | | | | | | | |
|
| Asset-Backed Securities—1.0% | |
| | |
Asset-Backed—Automobile—0.3% | | | | | | | | |
Chesapeake Funding II LLC
1.448%, 06/15/28 (144A) (d) (e) | | | 1,216,000 | | | | 1,215,999 | |
Ford Credit Auto Owner Trust
2.260%, 11/15/25 (144A) | | | 550,000 | | | | 561,061 | |
2.310%, 04/15/26 (144A) | | | 425,000 | | | | 434,147 | |
| | | | | | | | |
| | | | | | | 2,211,207 | |
| | | | | | | | |
| | |
Asset-Backed—Home Equity—0.1% | | | | | | | | |
Bayview Financial Revolving Asset Trust
2.038%, 12/28/40 (144A) (d) (e) | | | 741,172 | | | | 534,582 | |
GMAC Home Equity Loan Trust
5.805%, 10/25/36 (d) | | | 248,656 | | | | 238,281 | |
Home Equity Loan Trust
5.320%, 12/25/35 (d) | | | 557,264 | | | | 463,636 | |
| | | | | | | | |
| | | | | | | 1,236,499 | |
| | | | | | | | |
| | |
Asset-Backed—Other—0.6% | | | | | | | | |
American Tower Trust I
3.070%, 03/15/48 (144A) | | | 1,000,000 | | | | 1,027,037 | |
Atrium CDO Corp.
1.421%, 11/16/22 (144A) (d) (e) | | | 330,339 | | | | 329,489 | |
Cent CLO, Ltd.
1.937%, 01/30/25 (144A) (d) | | | 831,000 | | | | 825,774 | |
Dryden XXVI Senior Loan Fund
1.728%, 07/15/25 (144A) (d) | | | 1,068,000 | | | | 1,055,417 | |
Fortress Credit BSL, Ltd.
1.813%, 01/19/25 (144A) (d) | | | 716,478 | | | | 706,238 | |
| | |
Asset-Backed—Other—(Continued) | | | | | | | | |
Small Business Administration Participation Certificates
4.350%, 07/01/23 | | | 245,987 | | | | 260,648 | |
4.770%, 04/01/24 | | | 13,744 | | | | 14,817 | |
4.950%, 03/01/25 | | | 85,594 | | | | 93,147 | |
4.990%, 09/01/24 | | | 45,992 | | | | 49,938 | |
5.110%, 08/01/25 | | | 130,205 | | | | 141,786 | |
5.180%, 05/01/24 | | | 22,259 | | | | 24,248 | |
5.520%, 06/01/24 | | | 52,804 | | | | 58,180 | |
Voya CLO, Ltd.
1.788%, 04/25/25 (144A) (d) | | | 970,000 | | | | 958,981 | |
| | | | | | | | |
| | | | | | | 5,545,700 | |
| | | | | | | | |
Total Asset-Backed Securities
(Cost $9,193,363) | | | | | | | 8,993,406 | |
| | | | | | | | |
|
| Convertible Preferred Stocks—0.7% | |
|
Diversified Telecommunication Services—0.1% | |
Frontier Communications Corp.
11.125%, 06/29/18 | | | 5,512 | | | | 522,648 | |
| | | | | | | | |
|
Electric Utilities—0.2% | |
Exelon Corp.
6.500%, 06/01/17 | | | 37,363 | | | | 1,843,490 | |
| | | | | | | | |
|
Food Products—0.3% | |
Tyson Foods, Inc.
4.750%, 07/15/17 | | | 39,850 | | | | 2,944,118 | |
| | | | | | | | |
|
Pharmaceuticals—0.1% | |
Allergan plc
5.500%, 03/01/18 | | | 1,063 | | | | 886,138 | |
| | | | | | | | |
Total Convertible Preferred Stocks
(Cost $5,428,877) | | | | | | | 6,196,394 | |
| | | | | | | | |
|
| Municipals—0.2% | |
New Jersey State Turnpike Authority, Build America Bonds
7.414%, 01/01/40
(Cost $1,092,733) | | | 1,050,000 | | | | 1,647,503 | |
| | | | | | | | |
|
| Foreign Government—0.1% | |
|
Sovereign—0.1% | |
Mexico Government International Bonds
4.750%, 03/08/44 | | | 909,000 | | | | 979,448 | |
Peruvian Government International Bonds
7.350%, 07/21/25 | | | 103,000 | | | | 140,080 | |
| | | | | | | | |
Total Foreign Government
(Cost $1,003,672) | | | | | | | 1,119,528 | |
| | | | | | | | |
See accompanying notes to financial statements.
MSF-14
Metropolitan Series Fund
MFS Total Return Portfolio
Schedule of Investments as of June 30, 2016 (Unaudited)
Short-Term Investments—4.1%
| | | | | | | | |
| Security Description | | Shares/
Principal
Amount* | | | Value | |
|
Discount Note—0.3% | |
Federal Home Loan Bank
0.010%, 07/01/16 (g) | | | 2,632,000 | | | $ | 2,632,000 | |
| | | | | | | | |
|
Mutual Fund—2.9% | |
State Street Navigator Securities Lending MET Portfolio (h) | | | 25,290,042 | | | | 25,290,042 | |
| | | | | | | | |
|
Repurchase Agreement—0.9% | |
Fixed Income Clearing Corp.
Repurchase Agreement dated 06/30/16 at
0.030% to be repurchased at $7,679,509
on 07/01/16, collateralized by
$7,600,000 U.S. Treasury Note at 1.750% due 12/31/20 with a value of $7,837,500. | | | 7,679,503 | | | | 7,679,503 | |
| | | | | | | | |
Total Short-Term Investments
(Cost $35,601,545) | | | | | | | 35,601,545 | |
| | | | | | | | |
Total Investments—103.3%
(Cost $772,960,150) (i) | | | | | | | 897,879,699 | |
Other assets and liabilities (net)—(3.3)% | | | | | | | (28,932,136 | ) |
| | | | | | | | |
| Net Assets—100.0% | | | | | | $ | 868,947,563 | |
| | | | | | | | |
| * | Principal amount stated in U.S. dollars unless otherwise noted. |
| (a) | All or a portion of the security was held on loan. As of June 30, 2016, the market value of securities loaned was $36,815,553 and the collateral received consisted of cash in the amount of $25,290,042 and non-cash collateral with a value of $12,212,677. The cash collateral is invested in a money market fund managed by an affiliate of the custodian. The non-cash collateral received consists primarily of government securities and bank letters of credit, and is held for the benefit of the Portfolio at the Portfolio’s custodian. The Portfolio cannot repledge or resell this collateral. As such, this collateral is excluded from the Statement of Assets and Liabilities. |
| (b) | Non-income producing security. |
| (c) | TBA (To Be Announced) Securities are purchased on a forward commitment basis with an approximate principal amount and no defined maturity date. The actual principal and maturity date will be determined upon settlement date. |
| (d) | Variable or floating rate security. The stated rate represents the rate at June 30, 2016. Maturity date shown for callable securities reflects the earliest possible call date. |
| (e) | Restricted securities are not registered under the Securities Act of 1933 and are subject to legal restrictions on resale. These securities generally may be resold in transactions exempt from registration or to the public if the securities are subsequently registered. Disposal of these securities may involve time-consuming negotiations and prompt sale at an acceptable price may be difficult. As of June 30, 2016, the market value of restricted securities was $4,634,501, which is 0.5% of net assets. See details shown in the Restricted Securities table that follows. |
| (f) | Interest only security. |
| (g) | The rate shown represents current yield to maturity. |
| (h) | Represents investment of cash collateral received from securities on loan as of June 30, 2016. |
| (i) | As of June 30, 2016, the aggregate cost of investments was $772,960,150. The aggregate unrealized appreciation and depreciation of investments were $138,739,548 and $(13,819,999), respectively, resulting in net unrealized appreciation of $124,919,549. |
| (144A)— | Securities exempt from registration under Rule 144A of the Securities Act of 1933. These securities may be resold in transactions exempt from registration, normally to qualified institutional buyers. As of June 30, 2016, the market value of 144A securities was $27,136,785, which is 3.1% of net assets. |
| (ACES)— | Alternative Credit Enhancement Securities |
| (ADR)— | An American Depositary Receipt is a certificate issued by a custodian bank representing the right to receive securities of the foreign issuer described. Trading on exchanges not located in the United States or Canada significantly influences the value of ADRs. |
| (CDO)— | Collateralized Debt Obligation |
| (CLO)— | Collateralized Loan Obligation |
| | | | | | | | | | | | | | | | |
Restricted Securities | | Acquisition
Date | | | Principal
Amount | | | Cost | | | Value | |
Atrium CDO Corp., 1.421%, 11/16/22 | | | 02/03/16 | | | $ | 330,339 | | | $ | 329,136 | | | $ | 329,489 | |
Bayview Financial Revolving Asset Trust, 2.038%, 12/28/40 | | | 03/01/06 | | | | 741,172 | | | | 741,172 | | | | 534,582 | |
BlackRock Capital Finance L.P., 7.750%, 09/25/26 | | | 05/01/06 | | | | 23,912 | | | | 23,044 | | | | 4,682 | |
Chesapeake Funding II LLC, 1.448%, 06/15/28 | | | 06/14/16 | | | | 1,216,000 | | | | 1,216,000 | | | | 1,215,999 | |
General Electric Capital Assurance Co., 5.743%, 05/12/35 | | | 09/23/03 | | | | 22,961 | | | | 23,076 | | | | 24,922 | |
Imperial Brands Finance plc, 2.950%, 07/21/20 | | | 07/21/15 | | | | 828,000 | | | | 820,622 | | | | 852,660 | |
State Grid Overseas Investment, Ltd., 2.750%, 05/07/19 | | | 05/07/14 | | | | 778,000 | | | | 773,779 | | | | 801,251 | |
UBS Group Funding Jersey, Ltd., 4.125%, 04/15/26 | | | 03/29/16 | | | | 838,000 | | | | 836,184 | | | | 870,916 | |
| | | | | | | | | | | | | | | | |
| | | | | | | | | | | | | | $ | 4,634,501 | |
| | | | | | | | | | | | | | | | |
See accompanying notes to financial statements.
MSF-15
Metropolitan Series Fund
MFS Total Return Portfolio
Schedule of Investments as of June 30, 2016 (Unaudited)
Fair Value Hierarchy
Accounting principles generally accepted in the United States of America (“GAAP”) define fair market value as the price that the Portfolio would receive to sell an asset or pay to transfer a liability in an orderly transaction between market participants at the measurement date. It establishes a fair value hierarchy that prioritizes inputs to valuation methods and requires disclosure of the fair value hierarchy, separately for each major category of assets and liabilities, that segregates fair value measurements into three levels. Levels 1, 2 and 3 of the fair value hierarchy are defined as follows:
Level 1 - unadjusted quoted prices in active markets for identical investments
Level 2 - other significant observable inputs (including, but not limited to, quoted prices for similar assets or liabilities in markets that are either active or inactive; inputs other than quoted prices that are observable such as interest rates, yield curves, volatilities, prepayment speeds, loss severities, credit risks, default rates, or other market corroborated inputs)
Level 3 - significant unobservable inputs based on the best information available in the circumstances, to the extent observable inputs are unavailable (including the Portfolio’s own assumptions used in determining the fair value of investments and derivative financial instruments)
The inputs or methodologies used for valuing investments are not necessarily an indication of the risk associated with investing in them. Changes to the inputs or methodologies used may result in transfers between levels, which will be recognized as of the beginning of the reporting period. Information on transfers between Level 1 and Level 2, if any, will be disclosed following the fair value hierarchy table below. A reconciliation of Level 3 securities, if any, will also be disclosed following the fair value hierarchy table. For more information about the Portfolio’s policy regarding the valuation of investments, please refer to the Notes to Financial Statements.
The following table summarizes the fair value hierarchy of the Portfolio’s investments as of June 30, 2016:
| | | | | | | | | | | | | | | | |
| Description | | Level 1 | | | Level 2 | | | Level 3 | | | Total | |
| Common Stocks | | | | | | | | | | | | | | | | |
Aerospace & Defense | | $ | 25,649,527 | | | $ | — | | | $ | — | | | $ | 25,649,527 | |
Air Freight & Logistics | | | 3,800,469 | | | | — | | | | — | | | | 3,800,469 | |
Airlines | | | 2,113,122 | | | | — | | | | — | | | | 2,113,122 | |
Auto Components | | | 6,876,320 | | | | — | | | | — | | | | 6,876,320 | |
Automobiles | | | 1,928,067 | | | | 2,737,733 | | | | — | | | | 4,665,800 | |
Banks | | | 42,567,395 | | | | 3,259,872 | | | | — | | | | 45,827,267 | |
Beverages | | | 1,110,041 | | | | 3,176,259 | | | | — | | | | 4,286,300 | |
Biotechnology | | | 1,686,664 | | | | — | | | | — | | | | 1,686,664 | |
Building Products | | | 3,671,727 | | | | — | | | | — | | | | 3,671,727 | |
Capital Markets | | | 20,270,597 | | | | 1,276,846 | | | | — | | | | 21,547,443 | |
Chemicals | | | 16,344,372 | | | | — | | | | — | | | | 16,344,372 | |
Commercial Services & Supplies | | | 4,428,629 | | | | — | | | | — | | | | 4,428,629 | |
Communications Equipment | | | 6,525,069 | | | | — | | | | — | | | | 6,525,069 | |
Consumer Finance | | | 4,625,570 | | | | — | | | | — | | | | 4,625,570 | |
Containers & Packaging | | | 834,079 | | | | — | | | | — | | | | 834,079 | |
Distributors | | | 1,111,846 | | | | — | | | | — | | | | 1,111,846 | |
Diversified Financial Services | | | 2,790,919 | | | | — | | | | — | | | | 2,790,919 | |
Diversified Telecommunication Services | | | 13,352,074 | | | | 679,140 | | | | — | | | | 14,031,214 | |
Electric Utilities | | | 12,516,359 | | | | 857,912 | | | | — | | | | 13,374,271 | |
Electrical Equipment | | | 2,675,426 | | | | — | | | | — | | | | 2,675,426 | |
Energy Equipment & Services | | | 3,294,928 | | | | — | | | | — | | | | 3,294,928 | |
Food & Staples Retailing | | | 9,275,005 | | | | 626,299 | | | | — | | | | 9,901,304 | |
Food Products | | | 13,007,007 | | | | 7,776,041 | | | | — | | | | 20,783,048 | |
Health Care Equipment & Supplies | | | 17,328,461 | | | | — | | | | — | | | | 17,328,461 | |
Health Care Providers & Services | | | 5,187,938 | | | | — | | | | — | | | | 5,187,938 | |
Hotels, Restaurants & Leisure | | | 2,455,559 | | | | — | | | | — | | | | 2,455,559 | |
Household Durables | | | 604,891 | | | | 422,834 | | | | — | | | | 1,027,725 | |
Household Products | | | 3,547,445 | | | | 1,129,901 | | | | — | | | | 4,677,346 | |
Industrial Conglomerates | | | 14,467,009 | | | | — | | | | — | | | | 14,467,009 | |
Insurance | | | 29,457,884 | | | | 2,708,279 | | | | — | | | | 32,166,163 | |
Internet & Catalog Retail | | | 4,282,986 | | | | — | | | | — | | | | 4,282,986 | |
Internet Software & Services | | | 4,472,021 | | | | — | | | | — | | | | 4,472,021 | |
IT Services | | | 22,646,923 | | | | — | | | | — | | | | 22,646,923 | |
Life Sciences Tools & Services | | | 5,626,849 | | | | — | | | | — | | | | 5,626,849 | |
Machinery | | | 13,101,929 | | | | — | | | | — | | | | 13,101,929 | |
Media | | | 23,615,301 | | | | — | | | | — | | | | 23,615,301 | |
See accompanying notes to financial statements.
MSF-16
Metropolitan Series Fund
MFS Total Return Portfolio
Schedule of Investments as of June 30, 2016 (Unaudited)
Fair Value Hierarchy—(Continued)
| | | | | | | | | | | | | | | | |
| Description | | Level 1 | | | Level 2 | | | Level 3 | | | Total | |
Metals & Mining | | $ | — | | | $ | 2,124,484 | | | $ | — | | | $ | 2,124,484 | |
Multi-Utilities | | | 1,126,610 | | | | 1,189,180 | | | | — | | | | 2,315,790 | |
Multiline Retail | | | 7,378,255 | | | | — | | | | — | | | | 7,378,255 | |
Oil, Gas & Consumable Fuels | | | 28,797,506 | | | | 2,818,727 | | | | — | | | | 31,616,233 | |
Pharmaceuticals | | | 36,193,070 | | | | 3,835,869 | | | | — | | | | 40,028,939 | |
Professional Services | | | 414,989 | | | | — | | | | — | | | | 414,989 | |
Real Estate Investment Trusts | | | 5,578,315 | | | | — | | | | — | | | | 5,578,315 | |
Road & Rail | | | 3,404,635 | | | | — | | | | — | | | | 3,404,635 | |
Semiconductors & Semiconductor Equipment | | | 9,686,516 | | | | — | | | | — | | | | 9,686,516 | |
Software | | | 8,398,586 | | | | — | | | | — | | | | 8,398,586 | |
Specialty Retail | | | 3,290,891 | | | | — | | | | — | | | | 3,290,891 | |
Technology Hardware, Storage & Peripherals | | | 1,666,384 | | | | — | | | | — | | | | 1,666,384 | |
Tobacco | | | 21,727,781 | | | | 917,388 | | | | — | | | | 22,645,169 | |
Trading Companies & Distributors | | | 763,177 | | | | — | | | | — | | | | 763,177 | |
Wireless Telecommunication Services | | | — | | | | 378,161 | | | | — | | | | 378,161 | |
Total Common Stocks | | | 475,677,123 | | | | 35,914,925 | | | | — | | | | 511,592,048 | |
Total U.S. Treasury & Government Agencies* | | | — | | | | 211,129,632 | | | | — | | | | 211,129,632 | |
Total Corporate Bonds & Notes* | | | — | | | | 105,372,111 | | | | — | | | | 105,372,111 | |
Total Mortgage-Backed Securities* | | | — | | | | 16,227,532 | | | | — | | | | 16,227,532 | |
Total Asset-Backed Securities* | | | — | | | | 8,993,406 | | | | — | | | | 8,993,406 | |
Total Convertible Preferred Stocks* | | | 6,196,394 | | | | — | | | | — | | | | 6,196,394 | |
Total Municipals | | | — | | | | 1,647,503 | | | | — | | | | 1,647,503 | |
Total Foreign Government* | | | — | | | | 1,119,528 | | | | — | | | | 1,119,528 | |
| Short-Term Investments | | | | | | | | | | | | | | | | |
Discount Note | | | — | | | | 2,632,000 | | | | — | | | | 2,632,000 | |
Mutual Fund | | | 25,290,042 | | | | — | | | | — | | | | 25,290,042 | |
Repurchase Agreement | | | — | | | | 7,679,503 | | | | — | | | | 7,679,503 | |
Total Short-Term Investments | | | 25,290,042 | | | | 10,311,503 | | | | — | | | | 35,601,545 | |
Total Investments | | $ | 507,163,559 | | | $ | 390,716,140 | | | $ | — | | | $ | 897,879,699 | |
| | | | | | | | | | | | | | | | | |
Collateral for Securities Loaned (Liability) | | $ | — | | | $ | (25,290,042 | ) | | $ | — | | | $ | (25,290,042 | ) |
| * | See Schedule of Investments for additional detailed categorizations. |
See accompanying notes to financial statements.
MSF-17
Metropolitan Series Fund
MFS Total Return Portfolio
Statement of Assets and Liabilities
June 30, 2016 (Unaudited)
| | | | |
Assets | | | | |
Investments at value (a) (b) | | $ | 897,879,699 | |
Cash | | | 6,063 | |
Cash denominated in foreign currencies (c) | | | 31,111 | |
Receivable for: | | | | |
Investments sold | | | 749,245 | |
Fund shares sold | | | 106,429 | |
Dividends and interest | | | 3,130,304 | |
Prepaid expenses | | | 5,490 | |
| | | | |
Total Assets | | | 901,908,341 | |
Liabilities | | | | |
Collateral for securities loaned | | | 25,290,042 | |
Payables for: | | | | |
Investments purchased | | | 3,415,495 | |
TBA securities purchased | | | 2,772,767 | |
Fund shares redeemed | | | 612,769 | |
Accrued Expenses: | | | | |
Management fees | | | 394,573 | |
Distribution and service fees | | | 122,491 | |
Deferred trustees’ fees | | | 76,642 | |
Other expenses | | | 275,999 | |
| | | | |
Total Liabilities | | | 32,960,778 | |
| | | | |
Net Assets | | $ | 868,947,563 | |
| | | | |
Net Assets Consist of: | | | | |
Paid in surplus | | $ | 721,938,387 | |
Undistributed net investment income | | | 9,193,344 | |
Accumulated net realized gain | | | 12,909,173 | |
Unrealized appreciation on investments and foreign currency transactions | | | 124,906,659 | |
| | | | |
Net Assets | | $ | 868,947,563 | |
| | | | |
Net Assets | | | | |
Class A | | $ | 166,603,917 | |
Class B | | | 228,656,721 | |
Class E | | | 26,563,007 | |
Class F | | | 447,123,918 | |
Capital Shares Outstanding* | | | | |
Class A | | | 1,009,489 | |
Class B | | | 1,402,472 | |
Class E | | | 161,727 | |
Class F | | | 2,730,574 | |
Net Asset Value, Offering Price and Redemption Price Per Share | | | | |
Class A | | $ | 165.04 | |
Class B | | | 163.04 | |
Class E | | | 164.25 | |
Class F | | | 163.75 | |
| * | The Portfolio is authorized to issue an unlimited number of shares. |
| (a) | Identified cost of investments was $772,960,150. |
| (b) | Includes securities loaned at value of $36,815,553. |
| (c) | Identified cost of cash denominated in foreign currencies was $31,247. |
Statement of Operations
Six Months Ended June 30, 2016 (Unaudited)
| | | | |
Investment Income | | | | |
Dividends (a) | | $ | 7,142,706 | |
Interest | | | 5,226,637 | |
Securities lending income | | | 45,482 | |
| | | | |
Total investment income | | | 12,414,825 | |
Expenses | | | | |
Management fees | | | 2,370,374 | |
Administration fees | | | 10,872 | |
Custodian and accounting fees | | | 105,946 | |
Distribution and service fees—Class B | | | 275,761 | |
Distribution and service fees—Class E | | | 19,723 | |
Distribution and service fees—Class F | | | 438,896 | |
Audit and tax services | | | 29,852 | |
Legal | | | 13,597 | |
Trustees’ fees and expenses | | | 15,990 | |
Shareholder reporting | | | 52,487 | |
Insurance | | | 3,042 | |
Miscellaneous | | | 9,453 | |
| | | | |
Total expenses | | | 3,345,993 | |
Less broker commission recapture | | | (4,140 | ) |
| | | | |
Net expenses | | | 3,341,853 | |
| | | | |
Net Investment Income | | | 9,072,972 | |
| | | | |
Net Realized and Unrealized Gain | | | | |
| Net realized gain on: | | | | |
Investments | | | 20,351,739 | |
Foreign currency transactions | | | 6,899 | |
| | | | |
Net realized gain | | | 20,358,638 | |
| | | | |
| Net change in unrealized appreciation on: | | | | |
Investments | | | 17,152,740 | |
Foreign currency transactions | | | 509 | |
| | | | |
Net change in unrealized appreciation | | | 17,153,249 | |
| | | | |
Net realized and unrealized gain | | | 37,511,887 | |
| | | | |
Net Increase in Net Assets from Operations | | $ | 46,584,859 | |
| | | | |
| (a) | Net of foreign withholding taxes of $101,122. |
See accompanying notes to financial statements.
MSF-18
Metropolitan Series Fund
MFS Total Return Portfolio
Statements of Changes in Net Assets
| | | | | | | | |
| | | Six Months
Ended
June 30,
2016
(Unaudited) | | | Year Ended
December 31,
2015 | |
Increase (Decrease) in Net Assets: | | | | | | | | |
From Operations | | | | | | | | |
Net investment income | | $ | 9,072,972 | | | $ | 18,332,793 | |
Net realized gain | | | 20,358,638 | | | | 63,473,896 | |
Net change in unrealized appreciation (depreciation) | | | 17,153,249 | | | | (83,606,019 | ) |
| | | | | | | | |
Increase (decrease) in net assets from operations | | | 46,584,859 | | | | (1,799,330 | ) |
| | | | | | | | |
From Distributions to Shareholders | | | | | | | | |
Net investment income | | | | | | | | |
Class A | | | (4,805,228 | ) | | | (4,674,856 | ) |
Class B | | | (6,072,122 | ) | | | (5,704,188 | ) |
Class E | | | (733,783 | ) | | | (726,208 | ) |
Class F | | | (12,040,322 | ) | | | (11,893,043 | ) |
Net realized capital gains | | | | | | | | |
Class A | | | (6,863,400 | ) | | | 0 | |
Class B | | | (9,524,717 | ) | | | 0 | |
Class E | | | (1,110,818 | ) | | | 0 | |
Class F | | | (18,598,020 | ) | | | 0 | |
| | | | | | | | |
Total distributions | | | (59,748,410 | ) | | | (22,998,295 | ) |
| | | | | | | | |
Increase (decrease) in net assets from capital share transactions | | | 15,692,090 | | | | (98,585,300 | ) |
| | | | | | | | |
Total increase (decrease) in net assets | | | 2,528,539 | | | | (123,382,925 | ) |
| | |
Net Assets | | | | | | | | |
Beginning of period | | | 866,419,024 | | | | 989,801,949 | |
| | | | | | | | |
End of period | | $ | 868,947,563 | | | $ | 866,419,024 | |
| | | | | | | | |
| | |
Undistributed net investment income | | | | | | | | |
End of period | | $ | 9,193,344 | | | $ | 23,771,827 | |
| | | | | | | | |
Other Information:
Capital Shares
Transactions in capital shares were as follows:
| | | | | | | | | | | | | | | | |
| | | Six Months Ended
June 30, 2016
(Unaudited) | | | Year Ended
December 31, 2015 | |
| | | Shares | | | Value | | | Shares | | | Value | |
Class A | | | | | | | | | | | | | | | | |
Sales | | | 16,904 | | | $ | 2,873,549 | | | | 45,931 | | | $ | 7,887,755 | |
Reinvestments | | | 71,666 | | | | 11,668,628 | | | | 27,213 | | | | 4,674,856 | |
Redemptions | | | (66,538 | ) | | | (11,262,027 | ) | | | (166,791 | ) | | | (28,716,810 | ) |
| | | | | | | | | | | | | | | | |
Net increase (decrease) | | | 22,032 | | | $ | 3,280,150 | | | | (93,647 | ) | | $ | (16,154,199 | ) |
| | | | | | | | | | | | | | | | |
Class B | | | | | | | | | | | | | | | | |
Sales | | | 58,142 | | | $ | 9,721,303 | | | | 78,297 | | | $ | 13,303,631 | |
Reinvestments | | | 96,959 | | | | 15,596,839 | | | | 33,584 | | | | 5,704,188 | |
Redemptions | | | (97,185 | ) | | | (16,200,136 | ) | | | (218,141 | ) | | | (37,048,767 | ) |
| | | | | | | | | | | | | | | | |
Net increase (decrease) | | | 57,916 | | | $ | 9,118,006 | | | | (106,260 | ) | | $ | (18,040,948 | ) |
| | | | | | | | | | | | | | | | |
Class E | | | | | | | | | | | | | | | | |
Sales | | | 2,688 | | | $ | 457,273 | | | | 5,625 | | | $ | 957,696 | |
Reinvestments | | | 11,383 | | | | 1,844,601 | | | | 4,247 | | | | 726,208 | |
Redemptions | | | (14,626 | ) | | | (2,450,437 | ) | | | (27,391 | ) | | | (4,675,378 | ) |
| | | | | | | | | | | | | | | | |
Net decrease | | | (555 | ) | | $ | (148,563 | ) | | | (17,519 | ) | | $ | (2,991,474 | ) |
| | | | | | | | | | | | | | | | |
Class F | | | | | | | | | | | | | | | | |
Sales | | | 72,465 | | | $ | 12,145,442 | | | | 99,869 | | | $ | 17,025,766 | |
Reinvestments | | | 189,641 | | | | 30,638,342 | | | | 69,746 | | | | 11,893,043 | |
Redemptions | | | (234,936 | ) | | | (39,341,287 | ) | | | (530,173 | ) | | | (90,317,488 | ) |
| | | | | | | | | | | | | | | | |
Net increase (decrease) | | | 27,170 | | | $ | 3,442,497 | | | | (360,558 | ) | | $ | (61,398,679 | ) |
| | | | | | | | | | | | | | | | |
Increase (decrease) derived from capital shares transactions | | | | | | $ | 15,692,090 | | | | | | | $ | (98,585,300 | ) |
| | | | | | | | | | | | | | | | |
See accompanying notes to financial statements.
MSF-19
Metropolitan Series Fund
MFS Total Return Portfolio
Financial Highlights
| | | | | | | | | | | | | | | | | | | | | | | | |
| Selected per share data | |
| | | Class A | |
| | | Six Months
Ended
June 30,
2016
(Unaudited) | | | Year Ended December 31, | |
| | | | 2015
| | | 2014
| | | 2013
| | | 2012
| | | 2011
| |
Net Asset Value, Beginning of Period | | $ | 168.01 | | | $ | 172.72 | | | $ | 162.91 | | | $ | 140.60 | | | $ | 129.68 | | | $ | 130.06 | |
| | | | | | | | | | | | | | | | | | | | | | | | |
Income (Loss) from Investment Operations | | | | | | | | | | | | | | | | | | | | | | | | |
Net investment income (a) | | | 1.94 | | | | 3.66 | | | | 3.85 | | | | 3.33 | | | | 3.34 | | | | 3.34 | |
Net realized and unrealized gain (loss) on investments | | | 7.47 | | | | (3.83 | ) | | | 9.94 | | | | 22.92 | | | | 11.49 | | | | (0.14 | ) |
| | | | | | | | | | | | | | | | | | | | | | | | |
Total from investment operations | | | 9.41 | | | | (0.17 | ) | | | 13.79 | | | | 26.25 | | | | 14.83 | | | | 3.20 | |
| | | | | | | | | | | | | | | | | | | | | | | | |
Less Distributions | | | | | | | | | | | | | | | | | | | | | | | | |
Distributions from net investment income | | | (5.10 | ) | | | (4.54 | ) | | | (3.98 | ) | | | (3.94 | ) | | | (3.91 | ) | | | (3.58 | ) |
Distributions from net realized capital gains | | | (7.28 | ) | | | 0.00 | | | | 0.00 | | | | 0.00 | | | | 0.00 | | | | 0.00 | |
| | | | | | | | | | | | | | | | | | | | | | | | |
Total distributions | | | (12.38 | ) | | | (4.54 | ) | | | (3.98 | ) | | | (3.94 | ) | | | (3.91 | ) | | | (3.58 | ) |
| | | | | | | | | | | | | | | | | | | | | | | | |
Net Asset Value, End of Period | | $ | 165.04 | | | $ | 168.01 | | | $ | 172.72 | | | $ | 162.91 | | | $ | 140.60 | | | $ | 129.68 | |
| | | | | | | | | | | | | | | | | | | | | | | | |
Total Return (%) (b) | | | 5.70 | (c) | | | (0.16 | ) | | | 8.64 | | | | 18.99 | | | | 11.58 | | | | 2.42 | |
| | | | | | |
Ratios/Supplemental Data | | | | | | | | | | | | | | | | | | | | | | | | |
Ratio of expenses to average net assets (%) | | | 0.62 | (d) | | | 0.60 | | | | 0.60 | | | | 0.59 | | | | 0.60 | | | | 0.59 | |
Ratio of net investment income to average net assets (%) | | | 2.31 | (d) | | | 2.13 | | | | 2.32 | | | | 2.19 | | | | 2.46 | | | | 2.56 | |
Portfolio turnover rate (%) | | | 18 | (c)(e) | | | 41 | (e) | | | 34 | (e) | | | 53 | (e) | | | 20 | | | | 19 | |
Net assets, end of period (in millions) | | $ | 166.6 | | | $ | 165.9 | | | $ | 186.7 | | | $ | 185.5 | | | $ | 169.9 | | | $ | 169.5 | |
| |
| | | Class B | |
| | | Six Months
Ended
June 30,
2016
(Unaudited) | | | Year Ended December 31, | |
| | | | 2015 | | | 2014 | | | 2013 | | | 2012 | | | 2011 | |
Net Asset Value, Beginning of Period | | $ | 165.89 | | | $ | 170.57 | | | $ | 160.94 | | | $ | 138.95 | | | $ | 128.21 | | | $ | 128.66 | |
| | | | | | | | | | | | | | | | | | | | | | | | |
Income (Loss) from Investment Operations | | | | | | | | | | | | | | | | | | | | | | | | |
Net investment income (a) | | | 1.71 | | | | 3.20 | | | | 3.40 | | | | 2.92 | | | | 2.97 | | | | 2.98 | |
Net realized and unrealized gain (loss) on investments | | | 7.36 | | | | (3.79 | ) | | | 9.81 | | | | 22.66 | | | | 11.36 | | | | (0.15 | ) |
| | | | | | | | | | | | | | | | | | | | | | | | |
Total from investment operations | | | 9.07 | | | | (0.59 | ) | | | 13.21 | | | | 25.58 | | | | 14.33 | | | | 2.83 | |
| | | | | | | | | | | | | | | | | | | | | | | | |
Less Distributions | | | | | | | | | | | | | | | | | | | | | | | | |
Distributions from net investment income | | | (4.64 | ) | | | (4.09 | ) | | | (3.58 | ) | | | (3.59 | ) | | | (3.59 | ) | | | (3.28 | ) |
Distributions from net realized capital gains | | | (7.28 | ) | | | 0.00 | | | | 0.00 | | | | 0.00 | | | | 0.00 | | | | 0.00 | |
| | | | | | | | | | | | | | | | | | | | | | | | |
Total distributions | | | (11.92 | ) | | | (4.09 | ) | | | (3.58 | ) | | | (3.59 | ) | | | (3.59 | ) | | | (3.28 | ) |
| | | | | | | | | | | | | | | | | | | | | | | | |
Net Asset Value, End of Period | | $ | 163.04 | | | $ | 165.89 | | | $ | 170.57 | | | $ | 160.94 | | | $ | 138.95 | | | $ | 128.21 | |
| | | | | | | | | | | | | | | | | | | | | | | | |
Total Return (%) (b) | | | 5.57 | (c) | | | (0.40 | ) | | | 8.36 | | | | 18.70 | | | | 11.31 | | | | 2.16 | |
| | | | | | |
Ratios/Supplemental Data | | | | | | | | | | | | | | | | | | | | | | | | |
Ratio of expenses to average net assets (%) | | | 0.87 | (d) | | | 0.85 | | | | 0.85 | | | | 0.84 | | | | 0.85 | | | | 0.84 | |
Ratio of net investment income to average net assets (%) | | | 2.06 | (d) | | | 1.88 | | | | 2.07 | | | | 1.94 | | | | 2.21 | | | | 2.32 | |
Portfolio turnover rate (%) | | | 18 | (c)(e) | | | 41 | (e) | | | 34 | (e) | | | 53 | (e) | | | 20 | | | | 19 | |
Net assets, end of period (in millions) | | $ | 228.7 | | | $ | 223.0 | | | $ | 247.5 | | | $ | 252.6 | | | $ | 229.8 | | | $ | 220.0 | |
Please see following page for Financial Highlights footnote legend.
See accompanying notes to financial statements.
MSF-20
Metropolitan Series Fund
MFS Total Return Portfolio
Financial Highlights
| | | | | | | | | | | | | | | | | | | | | | | | |
| Selected per share data | | | | | | | | | | | | | | | | | | |
| | | Class E | |
| | | Six Months
Ended
June 30,
2016
(Unaudited) | | | Year Ended December 31, | |
| | | | 2015 | | | 2014 | | | 2013 | | | 2012 | | | 2011 | |
Net Asset Value, Beginning of Period | | $ | 167.11 | | | $ | 171.80 | | | $ | 162.06 | | | $ | 139.88 | | | $ | 129.04 | | | $ | 129.46 | |
| | | | | | | | | | | | | | | | | | | | | | | | |
Income (Loss) from Investment Operations | | | | | | | | | | | | | | | | | | | | | | | | |
Net investment income (a) | | | 1.81 | | | | 3.39 | | | | 3.59 | | | | 3.09 | | | | 3.12 | | | | 3.13 | |
Net realized and unrealized gain (loss) on investments | | | 7.42 | | | | (3.82 | ) | | | 9.88 | | | | 22.81 | | | | 11.44 | | | | (0.15 | ) |
| | | | | | | | | | | | | | | | | | | | | | | | |
Total from investment operations | | | 9.23 | | | | (0.43 | ) | | | 13.47 | | | | 25.90 | | | | 14.56 | | | | 2.98 | |
| | | | | | | | | | | | | | | | | | | | | | | | |
Less Distributions | | | | | | | | | | | | | | | | | | | | | | | | |
Distributions from net investment income | | | (4.81 | ) | | | (4.26 | ) | | | (3.73 | ) | | | (3.72 | ) | | | (3.72 | ) | | | (3.40 | ) |
Distributions from net realized capital gains | | | (7.28 | ) | | | 0.00 | | | | 0.00 | | | | 0.00 | | | | 0.00 | | | | 0.00 | |
| | | | | | | | | | | | | | | | | | | | | | | | |
Total distributions | | | (12.09 | ) | | | (4.26 | ) | | | (3.73 | ) | | | (3.72 | ) | | | (3.72 | ) | | | (3.40 | ) |
| | | | | | | | | | | | | | | | | | | | | | | | |
Net Asset Value, End of Period | | $ | 164.25 | | | $ | 167.11 | | | $ | 171.80 | | | $ | 162.06 | | | $ | 139.88 | | | $ | 129.04 | |
| | | | | | | | | | | | | | | | | | | | | | | | |
Total Return (%) (b) | | | 5.62 | (c) | | | (0.31 | ) | | | 8.48 | | | | 18.82 | | | | 11.42 | | | | 2.25 | |
| | | | | | |
Ratios/Supplemental Data | | | | | | | | | | | | | | | | | | | | | | | | |
Ratio of expenses to average net assets (%) | | | 0.77 | (d) | | | 0.75 | | | | 0.75 | | | | 0.74 | | | | 0.75 | | | | 0.74 | |
Ratio of net investment income to average net assets (%) | | | 2.16 | (d) | | | 1.98 | | | | 2.17 | | | | 2.04 | | | | 2.31 | | | | 2.41 | |
Portfolio turnover rate (%) | | | 18 | (c)(e) | | | 41 | (e) | | | 34 | (e) | | | 53 | (e) | | | 20 | | | | 19 | |
Net assets, end of period (in millions) | | $ | 26.6 | | | $ | 27.1 | | | $ | 30.9 | | | $ | 32.5 | | | $ | 30.3 | | | $ | 31.0 | |
| |
| | | Class F | |
| | | Six Months
Ended
June 30,
2016
(Unaudited) | | | Year Ended December 31, | |
| | | | 2015 | | | 2014 | | | 2013 | | | 2012 | | | 2011
| |
Net Asset Value, Beginning of Period | | $ | 166.59 | | | $ | 171.25 | | | $ | 161.54 | | | $ | 139.43 | | | $ | 128.64 | | | $ | 129.07 | |
| | | | | | | | | | | | | | | | | | | | | | | | |
Income (Loss) from Investment Operations | | | | | | | | | | | | | | | | | | | | | | | | |
Net investment income (a) | | | 1.76 | | | | 3.29 | | | | 3.50 | | | | 3.00 | | | | 3.04 | | | | 3.05 | |
Net realized and unrealized gain (loss) on investments | | | 7.40 | | | | (3.79 | ) | | | 9.84 | | | | 22.74 | | | | 11.40 | | | | (0.14 | ) |
| | | | | | | | | | | | | | | | | | | | | | | | |
Total from investment operations | | | 9.16 | | | | (0.50 | ) | | | 13.34 | | | | 25.74 | | | | 14.44 | | | | 2.91 | |
| | | | | | | | | | | | | | | | | | | | | | | | |
Less Distributions | | | | | | | | | | | | | | | | | | | | | | | | |
Distributions from net investment income | | | (4.72 | ) | | | (4.16 | ) | | | (3.63 | ) | | | (3.63 | ) | | | (3.65 | ) | | | (3.34 | ) |
Distributions from net realized capital gains | | | (7.28 | ) | | | 0.00 | | | | 0.00 | | | | 0.00 | | | | 0.00 | | | | 0.00 | |
| | | | | | | | | | | | | | | | | | | | | | | | |
Total distributions | | | (12.00 | ) | | | (4.16 | ) | | | (3.63 | ) | | | (3.63 | ) | | | (3.65 | ) | | | (3.34 | ) |
| | | | | | | | | | | | | | | | | | | | | | | | |
Net Asset Value, End of Period | | $ | 163.75 | | | $ | 166.59 | | | $ | 171.25 | | | $ | 161.54 | | | $ | 139.43 | | | $ | 128.64 | |
| | | | | | | | | | | | | | | | | | | | | | | | |
Total Return (%) (b) | | | 5.59 | (c) | | | (0.35 | ) | | | 8.42 | | | | 18.75 | | | | 11.36 | | | | 2.21 | |
| | | | | | |
Ratios/Supplemental Data | | | | | | | | | | | | | | | | | | | | | | | | |
Ratio of expenses to average net assets (%) | | | 0.82 | (d) | | | 0.80 | | | | 0.80 | | | | 0.79 | | | | 0.80 | | | | 0.79 | |
Ratio of net investment income to average net assets (%) | | | 2.11 | (d) | | | 1.93 | | | | 2.12 | | | | 1.99 | | | | 2.26 | | | | 2.36 | |
Portfolio turnover rate (%) | | | 18 | (c)(e) | | | 41 | (e) | | | 34 | (e) | | | 53 | (e) | | | 20 | | | | 19 | |
Net assets, end of period (in millions) | | $ | 447.1 | | | $ | 450.4 | | | $ | 524.7 | | | $ | 584.1 | | | $ | 571.1 | | | $ | 623.8 | |
| (a) | Per share amounts based on average shares outstanding during the period. |
| (b) | Total return does not reflect any insurance, sales, separate account or administrative charges of variable annuity or life insurance contracts or any additional expenses that contract owners may bear under their variable contracts. If these charges were included, the returns would be lower. |
| (c) | Periods less than one year are not computed on an annualized basis. |
| (d) | Computed on an annualized basis. |
| (e) | Includes mortgage dollar roll and TBA transactions; excluding these transactions the portfolio turnover rates would have been 17%, 37%, 25% and 45% for the six months ended June 30, 2016 and the years ended December 31, 2015, 2014 and 2013, respectively. |
See accompanying notes to financial statements.
MSF-21
Metropolitan Series Fund
MFS Total Return Portfolio
Notes to Financial Statements—June 30, 2016 (Unaudited)
1. Organization
Metropolitan Series Fund (the “Trust”) is organized as a Delaware statutory trust and registered under the Investment Company Act of 1940, as amended (the “1940 Act”), as an open-end management investment company. The Trust, which is managed by MetLife Advisers, LLC (“MetLife Advisers” or the “Adviser”), an affiliate of MetLife, Inc., is currently comprised of thirty series, each of which operates as a distinct investment vehicle of the Trust. The portfolio included in this report is MFS Total Return Portfolio (the “Portfolio”), which is diversified. Shares in the Portfolio are not offered directly to the general public and are currently available only to separate accounts established by Metropolitan Life Insurance Company (“MetLife”) and other affiliated life insurance companies.
The Portfolio has registered and offers four classes of shares: Class A, B, E and F shares. Shares of each Class of the Portfolio represent an equal pro rata interest in the Portfolio and generally give the shareholder the same voting, dividend, liquidation, and other rights. Investment income, realized and unrealized capital gains and losses, the common expenses of the Portfolio, and certain Portfolio-level expense reductions, if any, are allocated on a pro rata basis to each Class based on the relative net assets of each Class to the net assets of the Portfolio. Each Class of shares differs in its respective distribution plan and such distribution expenses are allocated to the corresponding Class of shares.
2. Significant Accounting Policies
The preparation of financial statements in conformity with accounting principles generally accepted in the United States of America (“GAAP”) requires management to make estimates and assumptions that affect the reported amounts of assets and liabilities and disclosure of contingent assets and liabilities as of the date of the financial statements and the reported amounts of income and expenses during the reporting period. Actual results could differ from those estimates. In the preparation of these financial statements, management has evaluated events and transactions subsequent to June 30, 2016 through the date the financial statements were issued.
The Portfolio is an investment company and follows the accounting and reporting guidance of the Financial Accounting Standards Board (“FASB”) Accounting Standards Codification Topic 946—Financial Services—Investment Companies and Topic 820—Fair Value Measurement. The following is a summary of significant accounting policies consistently followed by the Portfolio in the preparation of its financial statements.
Investment Valuation and Fair Value Measurements - Debt securities, including corporate, convertible and municipal bonds and notes; obligations of the U.S. Treasury and U.S. government agencies; foreign sovereign issues; and non-U.S. bonds, are generally valued on the basis of evaluated or composite bid quotations obtained from independent pricing services and/or brokers and dealers selected by the Adviser (each a “pricing service”), pursuant to authorization of and subject to general oversight by the Board of Trustees of the Trust (the “Board” or “Trustees”). Such pricing services may use matrix pricing, which considers observable inputs including, among other things, issuer details, maturity dates, interest rates, yield curves, rates of prepayment, credit risks/spreads, default rates, reported trades, broker dealer quotes and quoted prices for similar assets. Short-term obligations with a remaining maturity of sixty days or less may be valued at amortized cost in the absence of market quotes, so long as the amortized cost value of such short-term debt instrument is approximately the same as the fair value of the instrument as determined without the use of amortized cost valuation. Floating rate loans are generally valued on the basis of an evaluated or composite average of aggregate bid and ask quotations supplied by brokers or dealers, as obtained from the pricing service. Securities that use similar valuation techniques and inputs as described above are generally categorized as Level 2 within the fair value hierarchy.
Mortgage and asset-backed securities are generally valued on the basis of evaluated or composite bid quotations obtained from pricing services selected by the Adviser pursuant to authorization of and subject to general oversight by the Board. These securities are usually issued as separate tranches, or classes, of securities within each deal. The pricing models for these securities usually consider tranche-level attributes, current market data, estimated cash flows and market-based yield spreads for each tranche and incorporate deal collateral performance, as available. Mortgage and asset-backed securities that use similar valuation techniques and inputs as described above are generally categorized as Level 2 within the fair value hierarchy.
Domestic and foreign equity securities, such as common stock, exchange-traded funds, rights, warrants, and preferred stock, that are traded on a securities exchange on a valuation date are generally valued at their last quoted sale price or official closing price on the primary exchange for such security, or, if no sales occurred on that day, at the last reported bid price. Equity securities traded over-the-counter (“OTC”) are generally valued at the last reported bid price. In the event of a major exchange closing during the trading day, the Adviser may use other market information obtained from quotation reporting systems, established market makers, or pricing services in valuing the securities. Valuation adjustments may be applied to certain foreign equity securities that are traded solely on foreign exchanges that close before the time as of which the Portfolio determines its NAV to account for the market movement between the close of the foreign exchanges and the time as of which the Portfolio determines its NAV. The Portfolio may use a systematic fair valuation model provided by a pricing service to value securities principally traded in these foreign markets in order to adjust for possible market movements or other changes that may occur between the close of the foreign exchanges and the time as of
MSF-22
Metropolitan Series Fund
MFS Total Return Portfolio
Notes to Financial Statements—June 30, 2016 (Unaudited)—(Continued)
which the Portfolio determines its NAV. Foreign equity securities valued using these valuation adjustments are generally categorized as Level 2 within the fair value hierarchy. Equity securities that are actively traded, and have no valuation adjustments applied, are categorized as Level 1 within the fair value hierarchy. Other equity securities traded on inactive markets, or valued in reference to similar instruments traded on active markets, are generally categorized as Level 2 within the fair value hierarchy.
Investments in registered open-end management investment companies are valued at reported net asset value per share on the valuation date and are categorized as Level 1 within the fair value hierarchy.
Futures contracts that are traded on commodity exchanges are valued at their closing prices as of the close of such exchanges and are categorized as Level 1 within the fair value hierarchy.
If no current market value quotation or other observable inputs are readily available or market value quotations are deemed to be unreliable for an investment, the fair value of the investment will be determined in accordance with procedures approved by, and under the general supervision of, the Board. In such a circumstance, the Board will be assisted in its responsibility to determine the fair value of an investment by the Valuation Committee (“Committee”) of MetLife Advisers. The Committee provides general pricing oversight and fair value pricing determinations related to portfolio securities and meets on a regular basis to review reports relating to the valuation of the securities in the Portfolio. The Board has delegated to State Street Bank and Trust Company, the Trust’s custodian (“custodian”), the responsibility for calculating the net asset values (“NAVs”) of the Trust’s Portfolios. The Committee is responsible for overseeing the calculation of the NAVs of the Portfolios by the custodian. The Committee also periodically reviews pricing services, including the pricing services providing fair value pricing for the Portfolio’s foreign securities, and is responsible for overseeing the correction of pricing errors and addressing other pricing issues that arise in the ordinary course of business, such as making real-time fair value determinations, as necessary.
No single standard for determining the fair value of an investment can be set forth because fair value depends upon the facts and circumstances with respect to each investment. Information relating to any relevant factors may be obtained by the Committee from any appropriate source, including the subadviser of the Portfolio, the custodian, a pricing service, market maker and/or broker for such security or the issuer. Appropriate methodologies for determining fair value under particular circumstances may include: matrix pricing, a discounted cash flow analysis, comparisons of securities with comparable characteristics, value based on multiples of earnings, discount from market price of similar marketable securities or a combination of these and other methods.
Investment Transactions and Related Investment Income - Portfolio security transactions are recorded on the trade date. Dividend income is recorded on the ex-dividend date or, for certain foreign securities, when notified. Interest income, which includes amortization of premium and accretion of discount on debt securities, is recorded on the accrual basis. Realized gains and losses on investments are determined on the identified cost basis, which is the same basis used for federal income tax purposes. Foreign income and foreign capital gains on some foreign securities may be subject to foreign taxes, which are accrued as applicable. These foreign taxes have been provided for in accordance with the Portfolio’s understanding of the applicable countries’ tax rules and rates.
Foreign Currency Translation - The books and records of the Portfolio are maintained in U.S. dollars. The values of securities, currencies, and other assets and liabilities denominated in currencies other than the U.S. dollar are translated into U.S. dollars based upon foreign exchange rates prevailing at the end of the period. Purchases and sales of investment securities, income, and expenses are translated on the respective dates of such transactions. Because the values of investment securities are translated at the foreign exchange rates prevailing at the end of the period, that portion of the results of operations arising from changes in exchange rates and that portion of the results of operations reflecting fluctuations arising from changes in market prices of the investment securities are not separated. Such fluctuations are included in the net realized and unrealized gain or loss on investments.
Net realized foreign exchange gains or losses arise from activity in forward foreign currency exchange contracts, sales of foreign currency, currency gains or losses realized between the trade and settlement dates on securities transactions, and the difference between the amounts of dividends, interest, and foreign withholding taxes recorded by the Portfolio and the U.S. dollar equivalent of the amounts actually received or paid by the Portfolio. Net unrealized foreign exchange gains and losses arise from changes in the value of assets and liabilities, other than investment securities, resulting from changes in foreign exchange rates.
Dividends and Distributions to Shareholders - The Portfolio records dividends and distributions on the ex-dividend date. Net realized gains from securities transactions (if any) are generally distributed annually to shareholders. The timing and characterization of certain income and capital gains distributions are determined in accordance with federal tax regulations that may differ from GAAP. Permanent book and tax basis differences relating to shareholder distributions will result in reclassification between under/over distributed net investment income, accumulated net realized gains/losses, and paid-in surplus. Book-tax differences are primarily due to amortization of debt securities, paydown gain/loss reclasses, foreign currency transactions, real estate investment trust (REIT) adjustments, corporate actions and broker commission recapture. These adjustments have no impact on net assets or the results of operations.
Income Taxes - It is the Portfolio’s policy to comply with the requirements of the Internal Revenue Code of 1986, as amended, and regulations thereunder, applicable to regulated investment companies and to distribute, with respect to each taxable year, all of its
MSF-23
Metropolitan Series Fund
MFS Total Return Portfolio
Notes to Financial Statements—June 30, 2016 (Unaudited)—(Continued)
taxable income to shareholders. Therefore, no federal income tax provision is required. The Portfolio files U.S. federal tax returns. No income tax returns are currently under examination. The Portfolio’s federal tax returns for the prior three fiscal years remain subject to examination by the Internal Revenue Service. As of June 30, 2016, the Portfolio had no uncertain tax positions that would require financial statement recognition, or de-recognition or disclosure.
Mortgage Dollar Rolls - The Portfolio may enter into mortgage “dollar rolls” in which a Portfolio sells to-be-announced (“TBA”) mortgage-backed securities for delivery in the current month and simultaneously contracts to repurchase substantially similar (same type, coupon, and maturity) securities on a specified future date. For the duration of the transaction, or roll period, the Portfolio foregoes principal (including prepayments of principal) and interest paid on the securities sold. Dollar rolls are accounted for as purchase and sale transactions; gain or loss is recognized at the commencement of the term of the dollar roll and each time the mortgage-backed security is rolled.
Treasury and mortgage dollar roll transactions involve the risk that the market value of the securities that the Portfolio is required to repurchase or reacquire may be less than the agreed-upon repurchase price of those securities and that the investment performance of securities purchased with proceeds from these transactions does not exceed the income, capital appreciation, and gain or loss that would have been realized on the securities transferred or sold, as applicable, as part of the treasury or mortgage dollar roll.
Mortgage-Related and Other Asset-Backed Securities - The Portfolio may invest in mortgage-related or other asset-backed securities. These securities may include mortgage pass-through securities, collateralized mortgage obligations (“CMOs”), commercial mortgage-backed securities, CMO residuals, stripped mortgage-backed securities (“SMBS”), and other securities that directly or indirectly represent a participation in, or are secured by or payable from, mortgage loans on real property or other receivables. The value of some mortgage- or asset-backed securities may be particularly sensitive to changes in prevailing interest rates. Early repayment of principal on some mortgage-related securities may expose the Portfolio to a lower rate of return upon reinvestment of principal. The value of these securities may fluctuate in response to the market’s perception of the creditworthiness of the issuers. Additionally, although mortgages and mortgage-related securities are generally supported by some form of government or private guarantee and/or insurance, there is no assurance that private guarantors or insurers will meet their obligations.
In one type of SMBS, one class receives all of the interest from the mortgage assets (the interest-only or “IO” class), while the other class will receive all of the principal (the principal-only or “PO” class). Because principal will not be received at the maturity of an IO, adjustments are made to the book value of the security until maturity. These adjustments are netted against payments received for the IOs and the net amount is included in interest income on the Statement of Operations of the Portfolio. Payments received for POs are treated as reductions to the cost and par value of the securities. Details of mortgage-related and other asset-backed securities held by the Portfolio are included in the Portfolio’s Schedule of Investments.
The Portfolio may invest a significant portion of its assets in securities of issuers that hold mortgage and asset-backed securities and direct investments in securities backed by commercial and residential mortgage loans and other financial assets. The value and related income of these securities are sensitive to changes in economic conditions, including delinquencies and/or defaults, and may be negatively impacted by increased volatility of market prices and periods of illiquidity.
TBA Purchase & Forward Sale Commitments - The Portfolio may enter into TBA commitments to purchase or sell securities for a fixed price at a future date. TBA commitments are considered securities in themselves, and involve a risk of loss if the value of the security to be purchased or sold declines or increases prior to settlement date, which is in addition to the risk of decline in the value of the Portfolio’s other assets. TBA forward sale commitments are valued at the current market value of the underlying securities, according to the procedures described under “Investment Valuation and Fair Value Measurements”.
When-Issued and Delayed-Delivery Securities - The Portfolio may purchase securities on a when-issued or delayed-delivery basis. Settlement of such transactions normally occurs within a month or more after the purchase commitment is made. The Portfolio may purchase securities under such conditions only with the intention of actually acquiring them, but may enter into a separate agreement to sell the securities before the settlement date. Since the value of securities purchased may fluctuate prior to settlement, the Portfolio may be required to pay more at settlement than the security is worth. In addition, the purchaser is not entitled to any of the interest earned prior to settlement.
Upon making a commitment to purchase a security on a when-issued or delayed-delivery basis, the Portfolio will hold liquid assets in a segregated account with the Portfolio’s custodian, or set aside liquid assets in the Portfolio’s records, worth at least the equivalent of the amount due. The liquid assets will be monitored on a daily basis and adjusted as necessary to maintain the necessary value.
Directed Brokerage Agreement - The Trust has entered into a directed brokerage arrangement with State Street Global Markets (“SSGM”). Under this arrangement, the Portfolio directs certain trades to SSGM in return for a recapture credit. SSGM issues a cash rebate to the Portfolio. Amounts paid to the Portfolio are shown separately as broker commission recapture on the Statement of Operations of the Portfolio. Additionally, these amounts have been excluded from the calculation of the net ratio of expenses to average net assets presented in the Financial Highlights for each share class.
MSF-24
Metropolitan Series Fund
MFS Total Return Portfolio
Notes to Financial Statements—June 30, 2016 (Unaudited)—(Continued)
Repurchase Agreements - The Portfolio may enter into repurchase agreements, under the terms of a Master Repurchase Agreement (“MRA”), with selected commercial banks and broker-dealers, under which the Portfolio acquires securities as collateral and agrees to resell the securities at an agreed-upon time and at an agreed-upon price. The Portfolio, through the custodian or a subcustodian, under a tri-party repurchase agreement, receives delivery of the underlying securities collateralizing any repurchase agreements. It is the Portfolio’s policy that the market value of the collateral be equal to at least 100% of the repurchase price in the case of a repurchase agreement of one-day duration and equal to at least 102% of the repurchase price in the case of all other repurchase agreements. In the event of default or failure by a party to perform an obligation in connection with any repurchase transaction, the MRA gives the non-defaulting party the right to set-off claims and to apply property held by it in connection with any repurchase transaction against obligations owed to it.
At June 30, 2016, the Portfolio had investments in repurchase agreements with a gross value of $7,679,503, which is included as part of investments at value on the Statement of Assets and Liabilities. The value of the related collateral exceeded the value of the repurchase agreements at June 30, 2016.
Securities Lending - The Portfolio may lend its portfolio securities to certain qualified brokers who borrow securities in order to complete certain securities transactions. By lending its portfolio securities, the Portfolio attempts to increase its net investment income through the receipt of income on collateral held from securities on loan. Any gain or loss in the market price of the loaned securities that might occur and any interest earned or dividends declared during the term of the loan would accrue to the account of the Portfolio.
The Trust has entered into a Securities Lending Authorization Agreement with the custodian as the lending agent. Under this agreement, the custodian is authorized to loan portfolio securities on the Portfolio’s behalf. In exchange, the Portfolio receives either cash or securities as collateral against the loaned securities. The Portfolio receives collateral equal to at least 102% of the market value of the loaned securities (105% for foreign equity securities), at each loan’s inception. Collateral representing at least 100% of the market value of the loaned securities must be maintained for the duration of the loan. Cash collateral is generally invested in the State Street Navigator Securities Lending MET Portfolio (the “Navigator Portfolio”), a series of the State Street Navigator Securities Lending Trust that is managed by an affiliate of the custodian. The Navigator Portfolio is a registered money market fund that invests in a variety of high-quality, U.S. dollar-denominated instruments. If the market value of the collateral at the close of trading on a business day is less than 100% of the market value of the loaned securities at the close of trading on that day, the borrower shall be required to deliver, by the close of business on the following business day, an additional amount of collateral, so that the total amount of posted collateral is equal to at least 100% of the market value of all the loaned securities as of such preceding day. A portion of net income (income after the deduction of expenses and fees of the Navigator Portfolio) on the collateral is rebated to the borrower of the securities and the remainder is split between the custodian and the Portfolio. On loans collateralized by U.S. Treasuries, a fee is received from the borrower and is allocated between the Portfolio and the custodian. Income received by the Portfolio in securities lending transactions during the six months ended June 30, 2016 is reflected as Securities lending income on the Statement of Operations. The values of any securities loaned by the Portfolio and the related collateral at June 30, 2016 are disclosed in the footnotes to the Schedule of Investments. The value of the related collateral received by the Portfolio exceeded the value of the securities out on loan at June 30, 2016.
The risks associated with lending portfolio securities include, but are not limited to, possible delays in receiving additional collateral or in the recovery of the loaned securities, possible loss of rights in the collateral should the borrower fail financially, as well as risk of loss in the value of the collateral or the value of the investments made with the collateral. The lending agent shall indemnify the Portfolio in the case of default of any securities borrower.
The following table provides a breakdown of the collateral received and the remaining contractual maturities for securities lending transactions, which are accounted for as secured borrowings.
| | | | | | | | | | | | | | | | | | | | |
| | | Remaining Contractual Maturity of the Agreements
As of June 30, 2016 | |
| | | Overnight and
Continuous | | | Up to
30 Days | | | 31 - 90
Days | | | Greater than
90 days | | | Total | |
| Securities Lending Transactions | | | | | | | | | | | | | | | | | | | | |
Common Stocks | | $ | (18,156,405 | ) | | $ | — | | | $ | — | | | $ | — | | | $ | (18,156,405 | ) |
Corporate Bonds & Notes | | | (2,569,462 | ) | | | — | | | | — | | | | — | | | | (2,569,462 | ) |
U.S. Treasury & Government Agencies | | | (4,564,175 | ) | | | — | | | | — | | | | — | | | | (4,564,175 | ) |
Total | | $ | (25,290,042 | ) | | $ | — | | | $ | — | | | $ | — | | | $ | (25,290,042 | ) |
Total Borrowings | | $ | (25,290,042 | ) | | $ | — | | | $ | — | | | $ | — | | | $ | (25,290,042 | ) |
Gross amount of recognized liabilities for securities lending transactions | | | $ | (25,290,042 | ) |
MSF-25
Metropolitan Series Fund
MFS Total Return Portfolio
Notes to Financial Statements—June 30, 2016 (Unaudited)—(Continued)
3. Certain Risks
In the normal course of business, the Portfolio invests in securities and enters into transactions where risks exist due to fluctuations in the market (“market risk”) or failure of the other party to a transaction to perform (“credit and counterparty risk”).
Market Risk: The value of securities held by the Portfolio may decline in response to certain events, including those directly involving the companies whose securities are owned by the Portfolio; conditions affecting the general economy; overall market changes; local, regional or global political, social or economic instability; and currency, interest rate, and price fluctuations.
Credit and Counterparty Risk: The Portfolio may be exposed to counterparty risk, or the risk that an entity with which the Portfolio has unsettled or open transactions may default. The potential loss could exceed the value of the financial assets and liabilities recorded in the financial statements. Financial assets that potentially expose the Portfolio to credit and counterparty risk consist principally of cash due from counterparties and investments. The Portfolio manages counterparty risk by entering into agreements only with counterparties that it believes have the financial resources to honor their obligations and by monitoring the financial stability of those counterparties. The Portfolio’s investment adviser attempts to mitigate counterparty risk by (i) periodically assessing the creditworthiness of its trading partners, (ii) monitoring and/or limiting the amount of its net exposure to each individual counterparty based on its assessment, and (iii) requiring collateral from the counterparty for certain transactions. In order to preserve certain safeguards for non-standard settlement trades, the Portfolio restricts its exposure to credit and counterparty losses by entering into master netting agreements (“Master Agreements”) with counterparties (approved brokers) with whom it undertakes a significant volume of transactions. Master Agreements govern the terms of certain transactions, and reduce the counterparty risk associated with relevant transactions by specifying credit protection mechanisms and providing standardization that improves legal certainty. Master Agreements can also help limit counterparty risk by specifying collateral posting arrangements at pre-arranged exposure levels.
Repurchase and reverse repurchase agreements are primarily executed under Global Master Repurchase Agreements (“GMRAs”) or Master Repurchase Agreements (“MRAs”), which provide the rights to set-off. Each repurchase and reverse repurchase agreement is initially collateralized at the transaction level. In the event of default, the total market value exposure will be offset against collateral exchanged to date, which would result in a net receivable/(payable) that would be due from/to the counterparty.
Master Securities Forward Transaction Agreements (“MSFTA”) govern the considerations and factors surrounding the settlement of certain forward settling transactions, such as TBA securities and delayed-delivery or secured borrowings transactions by and between the Portfolio and select counterparties. The MSFTA maintain provisions for, among other things, initiation and confirmation, payment and transfer, events of default, termination, and maintenance of collateral.
Additional risks associated with each type of investment are described above within the respective security type notes. The Portfolio’s prospectus includes a discussion of the principal risks of investing in the Portfolio.
4. Investment Transactions
Aggregate cost of purchases and proceeds of sales of investment securities, including mortgage dollar roll and TBA transactions but excluding short-term securities, for the six months ended June 30, 2016 were as follows:
| | | | | | | | | | | | |
Purchases | | | Sales | |
U.S. Government | | Non U.S. Government | | | U.S. Government | | | Non U.S. Government | |
| $60,012,959 | | $ | 91,623,688 | | | $ | 70,608,638 | | | $ | 107,373,658 | |
The Portfolio engaged in security transactions with other accounts managed by Massachusetts Financial Services Company that amounted to $48,289 in purchases and $4,868 in sales of investments, which are included above, and resulted in realized losses of $1,027.
Purchases and sales of mortgage dollar rolls and TBA transactions for the six months ended June 30, 2016 were as follows:
| | | | |
Purchases | | Sales | |
| $8,044,832 | | $ | 11,463,431 | |
MSF-26
Metropolitan Series Fund
MFS Total Return Portfolio
Notes to Financial Statements—June 30, 2016 (Unaudited)—(Continued)
5. Investment Management Fees and Other Transactions with Affiliates
Investment Management Agreement - MetLife Advisers is the investment adviser to the Portfolio. The Trust has entered into an investment management agreement with MetLife Advisers with respect to the Portfolio. For providing investment management services to the Portfolio, MetLife Advisers receives monthly compensation at the following annual rates:
| | | | | | |
Management
Fees earned by
MetLife Advisers
for the six months ended
June 30, 2016 | | % per annum | | | Average daily net assets |
| $2,370,374 | | | 0.600 | % | | Of the first $250 million |
| | | 0.550 | % | | Of the next $500 million |
| | | 0.500 | % | | On amounts in excess of $750 million |
Certain officers and trustees of the Trust may also be officers of MetLife Advisers; however, such officers and trustees receive no compensation from the Trust.
On January 12, 2016, MetLife, Inc. announced its plan to pursue the separation of a substantial portion of its retail segment and is currently evaluating structural alternatives for such separation. It is anticipated that MetLife Advisers would be included in any such separation. Any separation transaction that might occur will be subject to the satisfaction of various conditions and approvals, including approval of any transaction by the MetLife, Inc. Board of Directors, satisfaction of any applicable requirements of the SEC, and receipt of insurance and other regulatory approvals and other anticipated conditions. Because the form of a separation had yet to be determined, MetLife, Inc. cannot currently provide a specific potential completion date or information about the potential impact on MetLife Advisers. No assurance can be given regarding the form that a separation transaction may take or the specific terms thereof, or that a separation will in fact occur. Depending on the form a separation takes, MetLife Advisers’ continued service as investment adviser to the Trusts could be subject to the satisfaction of various conditions and approvals, which may include obtaining approvals from the Trusts’ Board and shareholders.
MetLife Advisers has entered into an investment subadvisory agreement with respect to managing the Portfolio. Massachusetts Financial Services Company is compensated by MetLife Advisers to provide subadvisory services for the Portfolio.
Transfer Agency Agreement - MetLife serves as the transfer agent for the Trust. MetLife receives no fees for its services to the Trust under the transfer agency agreement.
Distribution and Service Fees - The Trust has a distribution agreement with MetLife Investors Distribution Company (“MIDC” or the “Distributor”) in which MIDC serves as the distributor for the Portfolio’s Class A, B, E, and F Shares. MIDC is a wholly-owned subsidiary of MetLife Investors Group, LLC, an affiliate of the Adviser. The Trust has also adopted a Distribution and Service Plan under Rule 12b-1 of the 1940 Act for the Portfolio’s Class B, E, and F Shares. Under the Distribution and Service Plan, the Class B, E, and F Shares of the Portfolio pay a fee to compensate the Insurance Companies (or their affiliates) and other broker-dealers and financial intermediaries involved in the offer and sale of Portfolio shares for promoting or selling and servicing the Class B, E, and F Shares. The fees under the Distribution and Service Plan for each class of the Portfolio’s shares are calculated as a percentage of the Portfolio’s average daily net assets that are attributable to that Class. Currently, the fee is 0.25% per year for Class B Shares, 0.15% per year for Class E Shares, and 0.20% per year for Class F Shares. Amounts incurred by the Portfolio for the six months ended June 30, 2016 are shown as Distribution and service fees in the Statement of Operations.
Deferred Trustee Compensation - Each Trustee who is not currently an employee of the Adviser or any of its affiliates receives compensation from the Trust for his or her service to the Trust. A deferred compensation plan (the “Plan”) is available to the Trustees on a voluntary basis. Deferred amounts remain in the Trust until distributed in accordance with the provisions of the Plan. The value of a participating Trustee’s deferral account is based on theoretical investments of deferred amounts on the normal payment dates in certain portfolios of the Trust or Met Investors Series Trust, an affiliate of the Trust, as designated by the participating Trustee. Changes in the value of participants’ deferral accounts are reflected as Trustees’ fees and expenses in the Statement of Operations. The portion of the accrued obligations allocated to the Portfolio under the Plan is reflected as Deferred trustees’ fees in the Statement of Assets and Liabilities.
6. Contractual Obligations
Under the Trust’s organizational documents, its officers and Trustees may be indemnified against certain liabilities and expenses arising out of the performance of their duties to the Trust. Additionally, the Trust has a variety of indemnification obligations under contracts with its service providers. The Trust’s maximum exposure under these arrangements is unknown, as this would involve future claims that may be made against the Trust that have not yet occurred.
MSF-27
Metropolitan Series Fund
MFS Total Return Portfolio
Notes to Financial Statements—June 30, 2016 (Unaudited)—(Continued)
7. Income Tax Information
The tax character of distributions paid for the years ended December 31, 2015 and 2014 were as follows:
| | | | | | | | | | | | | | | | | | | | |
Ordinary Income | | | Long-Term Capital Gain | | | Total | |
2015 | | 2014 | | | 2015 | | | 2014 | | | 2015 | | | 2014 | |
| $22,998,295 | | $ | 22,776,614 | | | $ | — | | | $ | — | | | $ | 22,998,295 | | | $ | 22,776,614 | |
As of December 31, 2015, the components of distributable earnings (accumulated losses) on a federal income tax basis were as follows:
| | | | | | | | | | | | | | | | | | | | |
Undistributed
Ordinary
Income | | Undistributed
Long-Term
Capital Gain | | | Net
Unrealized
Appreciation | | | Loss Carryforwards | | | Other
Accumulated
Capital Losses | | | Total | |
| $23,847,099 | | $ | 35,919,470 | | | $ | 100,481,430 | | | $ | — | | | $ | — | | | $ | 160,247,999 | |
The Portfolio utilizes the provisions of the federal income tax laws that provide for the carryforward of capital losses for prior years, offsetting such losses against any future realized capital gains. Under the Regulated Investment Company Modernization Act of 2010 (the “Act”), net capital losses recognized after December 22, 2010 may be carried forward indefinitely and their character is retained as short-term and/or long-term losses. Previously, net capital losses were carried forward for up to eight years and treated as short-term losses. As a transition rule, the Act requires that post-enactment net capital losses be used before pre-enactment net capital losses.
During the year ended December 31, 2015, the Portfolio utilized capital loss carry forwards of $22,671,987.
As of December 31, 2015, the Portfolio had no post-enactment accumulated capital losses and no pre-enactment accumulated capital loss carryforwards.
MSF-28
Metropolitan Series Fund
MFS Value Portfolio
Managed By Massachusetts Financial Services Company
Portfolio Manager Commentary*
PERFORMANCE
For the six month period ended June 30, 2016, the Class A, B, D and E shares of the MFS Value Portfolio returned 7.14%, 6.94%, 7.05%, and 7.07%, respectively. The Portfolio’s benchmark, the Russell 1000 Value Index1, returned 6.30%.
MARKET ENVIRONMENT/CONDITIONS
Sluggish global growth weighed on both developed and emerging market (“EM”) economies during the reporting period with EM economies proved to be particularly lackluster. Globally, central bank policy remained highly accommodative, which forced many government, and even some corporate, bond yields into negative territory. The U.S. Federal Reserve indicated that its monetary policy tightening cycle would be more gradual than earlier anticipated. In late June, the United Kingdom voted to leave the European Union, in what may have begun a multi-year process of negotiation in order to achieve “Brexit”.
U.S. earnings headwinds expanded beyond the Energy, Materials and Industrial sectors, to include most sectors of the market. The sharp rise in the U.S. dollar also weighed on earnings early in the period, though dollar strength ebbed somewhat late in the period. U.S. consumer spending held up well amid a modest increase in real wages and falling gasoline prices. Global trade was dampened particularly by falling demand in emerging markets. Weaker Chinese growth, which drove the decline in commodity prices, weighed on EM economies and asset prices. China responded with a variety of monetary and fiscal measures to stimulate its economy, which showed signs of stabilization at the end of the period, though concerns over high debt levels persisted. Structural factors such as floating exchange rates and fiscal buffers partially offset the cyclical headwinds to emerging markets.
PORTFOLIO REVIEW / PERIOD END POSITIONING
The Portfolio outperformed the Russell 1000 Value Index for the period. Within the Industrials sector, stock selection had a positive impact on performance. The Portfolio’s overweight position in manufacturing conglomerate Tyco International and its holdings of diversified technology company 3M boosted relative results. Stock selection in the Information Technology sector contributed to relative returns. Not owning software giant Microsoft helped the Portfolio’s relative performance as the stock lagged the benchmark during the reporting period.
Both an overweight allocation and strong stock selection in the Consumer Staples sector helped relative results. Within the sector, an overweight position in tobacco company Philip Morris International and owning global food company General Mills supported relative performance over the period.
Individual stocks that benefited relative performance included not holding banking firm Bank of America, an overweight position in telecommunications services provider Verizon Communications and owning financial services firm Aon. Further, underweight positions in weak-performing diversified financial services firm Citigroup and pharmaceutical company Allergan aided relative results.
An underweight allocation to the Utilities sector held back relative results. There were no individual stocks within this sector that were among the Portfolio’s top relative detractors during the period. The Portfolio’s underweight allocation to the Energy sector also weighed on relative performance. Namely, an underweight position in integrated oil and gas company Exxon Mobil dampened relative returns.
Individual stocks that detracted from relative performance included not holding telecommunications company AT&T as well as overweight positions in diversified financial services firms Goldman Sachs Group, JPMorgan Chase, State Street and Wells Fargo, and healthcare services company Express Scripts and insurance company Prudential Financial. A position held in automotive components manufacturer Delphi Automotive and not owning retail giant Wal-Mart Stores were relative detractors during the period.
Over the trailing six-month period ended June 30, 2016, the Portfolio reflected an increased absolute weighting in Industrials and Health Care. Conversely, at the end of the period, the Portfolio reflected decreased exposure to Financials and to a lesser extent Energy stocks.
MSF-1
Metropolitan Series Fund
MFS Value Portfolio
Managed By Massachusetts Financial Services Company
Portfolio Manager Commentary*—(Continued)
At period end, the Portfolio was overweight Industrials, Consumer Staples, and Consumer Discretionary while underweight Energy, Utilities, and Information Technology. Relative sector positioning reflected the investment team’s bottom up stock selection process rather than any top-down macroeconomic or sector view.
Steven R. Gorham
Nevin P. Chitkara
Portfolio Managers
Massachusetts Financial Services Company
* This commentary may include statements that constitute “forward-looking statements” under the U.S. securities laws. Forward-looking statements include, among other things, projections, estimates, and information about possible or future results related to the Portfolio, market or regulatory developments. The views expressed above are not guarantees of future performance or economic results and involve certain risks, uncertainties and assumptions that could cause actual outcomes and results to differ materially from the views expressed herein. The views expressed above are subject to change at any time based upon economic, market, or other conditions and the subadvisory firm undertakes no obligation to update the views expressed herein. Any discussions of specific securities should not be considered a recommendation to buy or sell those securities. The views expressed above (including any forward-looking statement) may not be relied upon as investment advice or as an indication of the Portfolio’s trading intent. Information about the Portfolio’s holdings, asset allocation or country diversification is historical and is not an indication of future Portfolio composition, which may vary. Direct investment in any index is not possible. The performance of any index mentioned in this commentary has not been adjusted for ongoing management, distribution and operating expenses, and sales charges applicable to mutual fund investments. In addition, the returns do not reflect additional fees charged by separate accounts or variable insurance contracts that an investor in the Portfolio may pay. If these additional fees were reflected, performance would have been lower.
MSF-2
Metropolitan Series Fund
MFS Value Portfolio
A $10,000 INVESTMENT COMPARED TO THE RUSSELL 1000 VALUE INDEX
SIX MONTH RETURN & AVERAGE ANNUAL RETURNS (%) AS OF JUNE 30, 2016
| | | | | | | | | | | | | | | | | | | | |
| | | 6 Month | | | 1 Year | | | 5 Year | | | 10 Year | | | Since Inception2 | |
| MFS Value Portfolio | | | | | | | | | | | | | | | | | | | | |
Class A | | | 7.14 | | | | 5.67 | | | | 12.34 | | | | 7.77 | | | | — | |
Class B | | | 6.94 | | | | 5.45 | | | | 12.05 | | | | — | | | | 7.17 | |
Class D | | | 7.05 | | | | 5.57 | | | | — | | | | — | | | | 11.34 | |
Class E | | | 7.07 | | | | 5.59 | | | | 12.19 | | | | — | | | | 7.29 | |
| Russell 1000 Value Index | | | 6.30 | | | | 2.86 | | | | 11.35 | | | | 6.13 | | | | — | |
1 The Russell 1000 Value Index is an unmanaged measure of the largest capitalized U.S. domiciled companies with a less than average growth orientation. Companies in this Index generally have a low price-to-book and price-to-earnings ratio, higher dividend yields and lower forecasted growth values.
2 Inception dates of the Class A, Class B, Class D and Class E shares are 7/20/98, 4/28/08, 4/26/13 and 4/28/08, respectively.
Portfolio performance is calculated including reinvestment of all income and capital gain distributions. Performance numbers are net of all Portfolio expenses but do not include any insurance, sales, separate account or administrative charges of variable annuity or life insurance contracts or any additional expenses that participants may bear relating to the operations of their plans. If these charges were included, the returns would be lower. The performance of any index referenced above has not been adjusted for ongoing management, distribution and operating expenses, and sales charges applicable to mutual fund investments. Direct investment in any index is not possible. The performance of Class A shares, as set forth in the line graph above, will differ from that of other classes because of the difference in expenses paid by policyholders investing in the different share classes.
This information represents past performance and is not indicative of future results. Investment return and principal value may fluctuate so that shares, upon redemption, may be worth more or less than the original cost.
PORTFOLIO COMPOSITION AS OF JUNE 30, 2016
Top Holdings
| | | | |
| | | % of
Net Assets | |
| JPMorgan Chase & Co. | | | 4.2 | |
| Johnson & Johnson | | | 3.8 | |
| Philip Morris International, Inc. | | | 3.4 | |
| Wells Fargo & Co. | | | 2.7 | |
| Accenture plc- Class A | | | 2.6 | |
| Travelers Cos., Inc. (The) | | | 2.6 | |
| Pfizer, Inc. | | | 2.5 | |
| Medtronic plc | | | 2.3 | |
| Chubb, Ltd. | | | 2.3 | |
| 3M Co. | | | 2.1 | |
Top Sectors
| | | | |
| | | % of
Net Assets | |
| Financials | | | 26.0 | |
| Industrials | | | 18.0 | |
| Health Care | | | 15.3 | |
| Consumer Staples | | | 12.5 | |
| Information Technology | | | 7.6 | |
| Consumer Discretionary | | | 7.2 | |
| Energy | | | 5.6 | |
| Materials | | | 3.6 | |
| Telecommunication Services | | | 1.9 | |
| Utilities | | | 1.1 | |
MSF-3
Metropolitan Series Fund
MFS Value Portfolio
Understanding Your Portfolio’s Expenses (Unaudited)
Shareholder Expense Example
As a shareholder of the Portfolio, you incur ongoing costs, including management fees; distribution and service (12b-1) fees; and other Portfolio expenses. This example is intended to help you understand your ongoing costs (in dollars) (referred to as “expenses”) of investing in the Portfolio and compare these costs with the ongoing costs of investing in other mutual funds. The example is based on an investment of $1,000 invested at the beginning of the period and held for the entire period, January 1, 2016 through June 30, 2016.
Actual Expenses
The first line for each share class of the Portfolio in the table below provides information about actual account values and actual expenses. You may use the information in this line, together with the amount you invested in the particular share class of the Portfolio, to estimate the expenses that you paid over the period. Simply divide your account value by $1,000 (for example, an $8,600 account value divided by $1,000 = 8.6), then multiply the result by the number in the first line under the heading entitled “Expenses Paid During Period” to estimate the expenses you paid on your account during this period.
Hypothetical Example for Comparison Purposes
The second line for each share class of the Portfolio in the table below provides information about hypothetical account values and hypothetical expenses based on the Portfolio’s actual expense ratio and an assumed rate of return of 5% per year before expenses, which is not the Portfolio’s actual return. The hypothetical account values and expenses may not be used to estimate the actual ending account balance or expenses you paid for the period. You may use this information to compare the ongoing costs of investing in the Portfolio and other funds. To do so, compare this 5% hypothetical example with the 5% hypothetical examples that appear in the shareholder reports of the other funds.
Please note that the expenses shown in the table are meant to highlight your ongoing costs only and do not reflect any fees or charges of your variable insurance product or any additional expenses that participants in certain eligible qualified plans may bear relating to the operations of their plan. Therefore, the second line for each share class in the table is useful in comparing ongoing costs only, and will not help you determine the relative total costs of owning different funds. In addition, if these other costs were included, your costs would have been higher.
| | | | | | | | | | | | | | | | | | |
MFS Value Portfolio | | | | Annualized
Expense
Ratio | | | Beginning
Account Value
January 1,
2016 | | | Ending
Account Value
June 30,
2016 | | | Expenses Paid
During Period**
January 1, 2016
to
June 30,
2016 | |
Class A(a) | | Actual | | | 0.58 | % | | $ | 1,000.00 | | | $ | 1,071.40 | | | $ | 2.99 | |
| | Hypothetical* | | | 0.58 | % | | $ | 1,000.00 | | | $ | 1,021.98 | | | $ | 2.92 | |
| | | | | |
Class B(a) | | Actual | | | 0.83 | % | | $ | 1,000.00 | | | $ | 1,069.40 | | | $ | 4.27 | |
| | Hypothetical* | | | 0.83 | % | | $ | 1,000.00 | | | $ | 1,020.74 | | | $ | 4.17 | |
| | | | | |
Class D(a) | | Actual | | | 0.68 | % | | $ | 1,000.00 | | | $ | 1,070.50 | | | $ | 3.50 | |
| | Hypothetical* | | | 0.68 | % | | $ | 1,000.00 | | | $ | 1,021.48 | | | $ | 3.42 | |
| | | | | |
Class E(a) | | Actual | | | 0.73 | % | | $ | 1,000.00 | | | $ | 1,070.70 | | | $ | 3.76 | |
| | Hypothetical* | | | 0.73 | % | | $ | 1,000.00 | | | $ | 1,021.23 | | | $ | 3.67 | |
* Hypothetical assumes a rate of return of 5% per year before expenses.
** Expenses paid are equal to the Portfolio’s annualized expense ratio for the most recent six month period, as shown above, multiplied by the average account value over the period, multiplied by the number of days (182 days) in the most recent fiscal half-year, divided by 366 (to reflect the one-half year period).
(a) The annualized expense ratio shown reflects the impact of the management fee waiver as described in Note 5 of the Notes to Financial Statements.
MSF-4
Metropolitan Series Fund
MFS Value Portfolio
Schedule of Investments as of June 30, 2016 (Unaudited)
Common Stocks—98.8% of Net Assets
| | | | | | | | |
| Security Description | | Shares | | | Value | |
|
Aerospace & Defense—6.5% | |
Honeywell International, Inc. | | | 548,181 | | | $ | 63,764,414 | |
Lockheed Martin Corp. | | | 196,364 | | | | 48,731,654 | |
Northrop Grumman Corp. | | | 139,493 | | | | 31,006,504 | |
United Technologies Corp. | | | 541,711 | | | | 55,552,463 | |
| | | | | | | | |
| | | | | | | 199,055,035 | |
| | | | | | | | |
|
Air Freight & Logistics—1.4% | |
United Parcel Service, Inc. - Class B | | | 397,260 | | | | 42,792,847 | |
| | | | | | | | |
|
Auto Components—1.4% | |
Delphi Automotive plc | | | 250,952 | | | | 15,709,595 | |
Johnson Controls, Inc. | | | 581,113 | | | | 25,720,062 | |
| | | | | | | | |
| | | | | | | 41,429,657 | |
| | | | | | | | |
|
Automobiles—0.4% | |
Harley-Davidson, Inc. (a) | | | 279,085 | | | | 12,642,550 | |
| | | | | | | | |
|
Banks—11.1% | |
BB&T Corp. | | | 440,770 | | | | 15,695,820 | |
Citigroup, Inc. | | | 723,785 | | | | 30,681,246 | |
JPMorgan Chase & Co. | | | 2,049,160 | | | | 127,334,802 | |
PNC Financial Services Group, Inc. (The) | | | 335,787 | | | | 27,329,704 | |
U.S. Bancorp | | | 1,336,455 | | | | 53,899,230 | |
Wells Fargo & Co. | | | 1,767,555 | | | | 83,658,378 | |
| | | | | | | | |
| | | | | | | 338,599,180 | |
| | | | | | | | |
|
Beverages—1.1% | |
Diageo plc | | | 1,217,590 | | | | 34,069,636 | |
| | | | | | | | |
|
Capital Markets—4.9% | |
Bank of New York Mellon Corp. (The) | | | 800,302 | | | | 31,091,733 | |
BlackRock, Inc. | | | 80,362 | | | | 27,526,396 | |
Franklin Resources, Inc. | | | 715,495 | | | | 23,876,068 | |
Goldman Sachs Group, Inc. (The) | | | 331,232 | | | | 49,214,451 | |
State Street Corp. | | | 358,246 | | | | 19,316,624 | |
| | | | | | | | |
| | | | | | | 151,025,272 | |
| | | | | | | | |
|
Chemicals—3.1% | |
E.I. du Pont de Nemours & Co. | | | 367,644 | | | | 23,823,331 | |
Monsanto Co. | | | 115,627 | | | | 11,956,988 | |
PPG Industries, Inc. | | | 577,314 | | | | 60,127,253 | |
| | | | | | | | |
| | | | 95,907,572 | |
| | | | | | | | |
|
Commercial Services & Supplies—1.4% | |
Tyco International plc | | | 988,251 | | | | 42,099,493 | |
| | | | | | | | |
|
Consumer Finance—0.8% | |
American Express Co. | | | 402,014 | | | | 24,426,371 | |
| | | | | | | | |
|
Containers & Packaging—0.5% | |
Crown Holdings, Inc. (b) | | | 285,237 | | | | 14,452,959 | |
| | | | | | | | |
|
Diversified Financial Services—1.6% | |
Moody’s Corp. (a) | | | 142,466 | | | | 13,350,489 | |
Nasdaq, Inc. | | | 454,955 | | | | 29,421,940 | |
|
Diversified Financial Services—(Continued) | |
S&P Global, Inc. | | | 56,713 | | | | 6,083,036 | |
| | | | | | | | |
| | | | | | | 48,855,465 | |
| | | | | | | | |
|
Diversified Telecommunication Services—1.7% | |
Verizon Communications, Inc. | | | 927,767 | | | | 51,806,509 | |
| | | | | | | | |
| | |
Electric Utilities—1.1% | | | | | | | | |
Duke Energy Corp. (a) | | | 299,327 | | | | 25,679,263 | |
Xcel Energy, Inc. | | | 163,897 | | | | 7,339,308 | |
| | | | | | | | |
| | | | | | | 33,018,571 | |
| | | | | | | | |
| | |
Electrical Equipment—0.9% | | | | | | | | |
Eaton Corp. plc | | | 466,408 | | | | 27,858,550 | |
| | | | | | | | |
| | |
Energy Equipment & Services—1.5% | | | | | | | | |
National Oilwell Varco, Inc. (a) | | | 339,089 | | | | 11,410,345 | |
Schlumberger, Ltd. | | | 434,174 | | | | 34,334,480 | |
| | | | | | | | |
| | | | | | | 45,744,825 | |
| | | | | | | | |
| | |
Food & Staples Retailing—1.6% | | | | | | | | |
CVS Health Corp. | | | 506,243 | | | | 48,467,705 | |
| | | | | | | | |
| | |
Food Products—5.2% | | | | | | | | |
Archer-Daniels-Midland Co. | | | 582,572 | | | | 24,986,513 | |
Danone S.A. | | | 318,222 | | | | 22,438,676 | |
General Mills, Inc. | | | 661,520 | | | | 47,179,606 | |
J.M. Smucker Co. (The) | | | 106,328 | | | | 16,205,451 | |
Nestle S.A. | | | 624,371 | | | | 48,161,284 | |
| | | | | | | | |
| | | | | | | 158,971,530 | |
| | | | | | | | |
|
Health Care Equipment & Supplies—4.2% | |
Abbott Laboratories | | | 881,551 | | | | 34,653,770 | |
Medtronic plc | | | 814,467 | | | | 70,671,301 | |
St. Jude Medical, Inc. | | | 305,488 | | | | 23,828,064 | |
| | | | | | | | |
| | | | | | | 129,153,135 | |
| | | | | | | | |
|
Health Care Providers & Services—1.6% | |
Cigna Corp. | | | 97,467 | | | | 12,474,801 | |
Express Scripts Holding Co. (b) | | | 270,211 | | | | 20,481,994 | |
McKesson Corp. | | | 89,153 | | | | 16,640,408 | |
| | | | | | | | |
| | | | | | | 49,597,203 | |
| | | | | | | | |
| | |
Household Durables—0.3% | | | | | | | | |
Newell Brands, Inc. | | | 215,641 | | | | 10,473,683 | |
| | | | | | | | |
| | |
Household Products—0.5% | | | | | | | | |
Procter & Gamble Co. (The) | | | 170,778 | | | | 14,459,773 | |
| | | | | | | | |
| | |
Industrial Conglomerates—3.6% | | | | | | | | |
3M Co. | | | 368,055 | | | | 64,453,792 | |
Danaher Corp. | | | 443,502 | | | | 44,793,702 | |
| | | | | | | | |
| | | | | | | 109,247,494 | |
| | | | | | | | |
See accompanying notes to financial statements.
MSF-5
Metropolitan Series Fund
MFS Value Portfolio
Schedule of Investments as of June 30, 2016 (Unaudited)
Common Stocks—(Continued)
| | | | | | | | |
| Security Description | | Shares | | | Value | |
| | |
Insurance—7.6% | | | | | | | | |
Aon plc | | | 438,383 | | | $ | 47,884,575 | |
Chubb, Ltd. | | | 528,237 | | | | 69,045,858 | |
Prudential Financial, Inc. | | | 509,618 | | | | 36,356,148 | |
Travelers Cos., Inc. (The) | | | 665,039 | | | | 79,166,243 | |
| | | | | | | | |
| | | | | | | 232,452,824 | |
| | | | | | | | |
| | |
IT Services—5.2% | | | | | | | | |
Accenture plc - Class A | | | 710,548 | | | | 80,497,983 | |
Cognizant Technology Solutions Corp. - Class A (b) | | | 172,722 | | | | 9,886,607 | |
Fidelity National Information Services, Inc. | | | 380,416 | | | | 28,029,051 | |
Fiserv, Inc. (b) | | | 136,441 | | | | 14,835,230 | |
International Business Machines Corp. | | | 180,486 | | | | 27,394,165 | |
| | | | | | | | |
| | | | | | | 160,643,036 | |
| | | | | | | | |
|
Life Sciences Tools & Services—1.2% | |
Thermo Fisher Scientific, Inc. | | | 249,079 | | | | 36,803,913 | |
| | | | | | | | |
| | |
Machinery—2.9% | | | | | | | | |
Caterpillar, Inc. (a) | | | 123,265 | | | | 9,344,720 | |
Cummins, Inc. (a) | | | 64,367 | | | | 7,237,425 | |
Deere & Co. (a) | | | 96,226 | | | | 7,798,155 | |
Illinois Tool Works, Inc. | | | 239,867 | | | | 24,984,547 | |
Ingersoll-Rand plc | | | 177,371 | | | | 11,294,985 | |
Pentair plc (a) | | | 228,088 | | | | 13,295,249 | |
Stanley Black & Decker, Inc. | | | 140,498 | | | | 15,626,188 | |
| | | | | | | | |
| | | | | | | 89,581,269 | |
| | | | | | | | |
| | |
Media—4.0% | | | | | | | | |
Comcast Corp. - Class A | | | 593,130 | | | | 38,666,145 | |
Omnicom Group, Inc. (a) | | | 553,940 | | | | 45,140,571 | |
Time Warner, Inc. | | | 338,420 | | | | 24,887,407 | |
Time, Inc. (a) | | | 31,682 | | | | 521,486 | |
Viacom, Inc. - Class B | | | 161,114 | | | | 6,681,397 | |
Walt Disney Co. (The) | | | 76,731 | | | | 7,505,826 | |
| | | | | | | | |
| | | | | | | 123,402,832 | |
| | | | | | | | |
| | |
Multiline Retail—0.7% | | | | | | | | |
Target Corp. | | | 322,395 | | | | 22,509,619 | |
| | | | | | | | |
| | |
Oil, Gas & Consumable Fuels—4.1% | | | | | | | | |
Chevron Corp. | | | 303,357 | | | | 31,800,914 | |
EOG Resources, Inc. | | | 331,625 | | | | 27,664,158 | |
Exxon Mobil Corp. | | | 391,577 | | | | 36,706,428 | |
Occidental Petroleum Corp. | | | 392,688 | | | | 29,671,505 | |
| | | | | | | | |
| | | | | | | 125,843,005 | |
| | | | | | | | |
| | |
Pharmaceuticals—8.2% | | | | | | | | |
Johnson & Johnson | | | 952,765 | | | | 115,570,394 | |
Merck & Co., Inc. | | | 770,458 | | | | 44,386,085 | |
Novartis AG | | | 99,621 | | | | 8,195,200 | |
Pfizer, Inc. | | | 2,177,031 | | | | 76,653,262 | |
| | |
Pharmaceuticals—(Continued) | | | | | | | | |
Roche Holding AG | | | 28,578 | | | | 7,545,466 | |
| | | | | | | | |
| | | | | | | 252,350,407 | |
| | | | | | | | |
| | |
Professional Services—0.2% | | | | | | | | |
Equifax, Inc. | | | 55,966 | | | | 7,186,034 | |
| | | | | | | | |
| | |
Road & Rail—1.2% | | | | | | | | |
Canadian National Railway Co. (a) | | | 256,064 | | | | 15,123,140 | |
Union Pacific Corp. | | | 232,894 | | | | 20,320,001 | |
| | | | | | | | |
| | | | | | | 35,443,141 | |
| | | | | | | | |
|
Semiconductors & Semiconductor Equipment—1.7% | |
Analog Devices, Inc. | | | 159,926 | | | | 9,058,209 | |
Texas Instruments, Inc. | | | 679,157 | | | | 42,549,186 | |
| | | | | | | | |
| | | | | | | 51,607,395 | |
| | | | | | | | |
| | |
Software—0.7% | | | | | | | | |
Oracle Corp. | | | 505,805 | | | | 20,702,599 | |
| | | | | | | | |
| | |
Specialty Retail—0.3% | | | | | | | | |
Advance Auto Parts, Inc. | | | 58,932 | | | | 9,525,179 | |
| | | | | | | | |
| | |
Tobacco—4.2% | | | | | | | | |
Altria Group, Inc. | | | 328,772 | | | | 22,672,117 | |
Philip Morris International, Inc. | | | 1,036,475 | | | | 105,430,237 | |
| | | | | | | | |
| | | | | | | 128,102,354 | |
| | | | | | | | |
|
Wireless Telecommunication Services—0.2% | |
Vodafone Group plc | | | 2,140,064 | | | | 6,514,760 | |
| | | | | | | | |
Total Common Stocks
(Cost $2,307,807,434) | | | | | | | 3,026,823,382 | |
| | | | | | | | |
|
| Short-Term Investments—3.8% | |
| | |
Discount Note—0.3% | | | | | | | | |
Federal Home Loan Bank
0.010%, 07/01/16 (c) | | | 8,357,000 | | | | 8,357,000 | |
| | | | | | | | |
| | |
Mutual Fund—2.7% | | | | | | | | |
State Street Navigator Securities Lending MET Portfolio (d) | | | 83,896,264 | | | | 83,896,264 | |
| | | | | | | | |
See accompanying notes to financial statements.
MSF-6
Metropolitan Series Fund
MFS Value Portfolio
Schedule of Investments as of June 30, 2016 (Unaudited)
Short-Term Investments—(Continued)
| | | | | | | | |
| Security Description | | Principal
Amount* | | | Value | |
| | |
Repurchase Agreement—0.8% | | | | | | | | |
Fixed Income Clearing Corp. Repurchase Agreement dated 06/30/16 at 0.030% to be repurchased at $24,409,097 on 07/01/16, collateralized by $24,205,000 U.S. Treasury Note at 1.625% due 11/30/20 with a value of $24,900,894. | | | 24,409,077 | | | $ | 24,409,077 | |
| | | | | | | | |
Total Short-Term Investments
(Cost $116,662,341) | | | | | | | 116,662,341 | |
| | | | | | | | |
Total Investments—102.6%
(Cost $2,424,469,775) (e) | | | | | | | 3,143,485,723 | |
Other assets and liabilities (net)—(2.6)% | | | | | | | (80,863,538 | ) |
| | | | | | | | |
| Net Assets—100.0% | | | | | | $ | 3,062,622,185 | |
| | | | | | | | |
| * | Principal amount stated in U.S. dollars unless otherwise noted. |
| (a) | All or a portion of the security was held on loan. As of June 30, 2016, the market value of securities loaned was $124,141,951 and the collateral received consisted of cash in the amount of $83,896,264 and non-cash collateral with a value of $40,719,870. The cash collateral is invested in a money market fund managed by an affiliate of the custodian. The non-cash collateral received consists primarily of government securities and bank letters of credit, and is held for the benefit of the Portfolio at the Portfolio’s custodian. The Portfolio cannot repledge or resell this collateral. As such, this collateral is excluded from the Statement of Assets and Liabilities. |
| (b) | Non-income producing security. |
| (c) | The rate shown represents current yield to maturity. |
| (d) | Represents investment of cash collateral received from securities on loan as of June 30, 2016. |
| (e) | As of June 30, 2016, the aggregate cost of investments was $2,424,469,775. The aggregate unrealized appreciation and depreciation of investments were $772,496,449 and $(53,480,501), respectively, resulting in net unrealized appreciation of $719,015,948. |
Fair Value Hierarchy
Accounting principles generally accepted in the United States of America (“GAAP”) define fair market value as the price that the Portfolio would receive to sell an asset or pay to transfer a liability in an orderly transaction between market participants at the measurement date. It establishes a fair value hierarchy that prioritizes inputs to valuation methods and requires disclosure of the fair value hierarchy, separately for each major category of assets and liabilities, that segregates fair value measurements into three levels. Levels 1, 2 and 3 of the fair value hierarchy are defined as follows:
Level 1 - unadjusted quoted prices in active markets for identical investments
Level 2 - other significant observable inputs (including, but not limited to, quoted prices for similar assets or liabilities in markets that are either active or inactive; inputs other than quoted prices that are observable such as interest rates, yield curves, volatilities, prepayment speeds, loss severities, credit risks, default rates, or other market corroborated inputs)
Level 3 - significant unobservable inputs based on the best information available in the circumstances, to the extent observable inputs are unavailable (including the Portfolio’s own assumptions used in determining the fair value of investments and derivative financial instruments)
The inputs or methodologies used for valuing investments are not necessarily an indication of the risk associated with investing in them. Changes to the inputs or methodologies used may result in transfers between levels, which will be recognized as of the beginning of the reporting period. Information on transfers between Level 1 and Level 2, if any, will be disclosed following the fair value hierarchy table below. A reconciliation of Level 3 securities, if any, will also be disclosed following the fair value hierarchy table. For more information about the Portfolio’s policy regarding the valuation of investments, please refer to the Notes to Financial Statements.
The following table summarizes the fair value hierarchy of the Portfolio’s investments as of June 30, 2016:
| | | | | | | | | | | | | | | | |
| Description | | Level 1 | | | Level 2 | | | Level 3 | | | Total | |
| Common Stocks | | | | | | | | | | | | | | | | |
Aerospace & Defense | | $ | 199,055,035 | | | $ | — | | | $ | — | | | $ | 199,055,035 | |
Air Freight & Logistics | | | 42,792,847 | | | | — | | | | — | | | | 42,792,847 | |
Auto Components | | | 41,429,657 | | | | — | | | | — | | | | 41,429,657 | |
Automobiles | | | 12,642,550 | | | | — | | | | — | | | | 12,642,550 | |
Banks | | | 338,599,180 | | | | — | | | | — | | | | 338,599,180 | |
Beverages | | | — | | | | 34,069,636 | | | | — | | | | 34,069,636 | |
Capital Markets | | | 151,025,272 | | | | — | | | | — | | | | 151,025,272 | |
Chemicals | | | 95,907,572 | | | | — | | | | — | | | | 95,907,572 | |
Commercial Services & Supplies | | | 42,099,493 | | | | — | | | | — | | | | 42,099,493 | |
Consumer Finance | | | 24,426,371 | | | | — | | | | — | | | | 24,426,371 | |
Containers & Packaging | | | 14,452,959 | | | | — | | | | — | | | | 14,452,959 | |
Diversified Financial Services | | | 48,855,465 | | | | — | | | | — | | | | 48,855,465 | |
Diversified Telecommunication Services | | | 51,806,509 | | | | — | | | | — | | | | 51,806,509 | |
Electric Utilities | | | 33,018,571 | | | | — | | | | — | | | | 33,018,571 | |
See accompanying notes to financial statements.
MSF-7
Metropolitan Series Fund
MFS Value Portfolio
Schedule of Investments as of June 30, 2016 (Unaudited)
Fair Value Hierarchy—(Continued)
| | | | | | | | | | | | | | | | |
| Description | | Level 1 | | | Level 2 | | | Level 3 | | | Total | |
Electrical Equipment | | $ | 27,858,550 | | | $ | — | | | $ | — | | | $ | 27,858,550 | |
Energy Equipment & Services | | | 45,744,825 | | | | — | | | | — | | | | 45,744,825 | |
Food & Staples Retailing | | | 48,467,705 | | | | — | | | | — | | | | 48,467,705 | |
Food Products | | | 88,371,570 | | | | 70,599,960 | | | | — | | | | 158,971,530 | |
Health Care Equipment & Supplies | | | 129,153,135 | | | | — | | | | — | | | | 129,153,135 | |
Health Care Providers & Services | | | 49,597,203 | | | | — | | | | — | | | | 49,597,203 | |
Household Durables | | | 10,473,683 | | | | — | | | | — | | | | 10,473,683 | |
Household Products | | | 14,459,773 | | | | — | | | | — | | | | 14,459,773 | |
Industrial Conglomerates | | | 109,247,494 | | | | — | | | | — | | | | 109,247,494 | |
Insurance | | | 232,452,824 | | | | — | | | | — | | | | 232,452,824 | |
IT Services | | | 160,643,036 | | | | — | | | | — | | | | 160,643,036 | |
Life Sciences Tools & Services | | | 36,803,913 | | | | — | | | | — | | | | 36,803,913 | |
Machinery | | | 89,581,269 | | | | — | | | | — | | | | 89,581,269 | |
Media | | | 123,402,832 | | | | — | | | | — | | | | 123,402,832 | |
Multiline Retail | | | 22,509,619 | | | | — | | | | — | | | | 22,509,619 | |
Oil, Gas & Consumable Fuels | | | 125,843,005 | | | | — | | | | — | | | | 125,843,005 | |
Pharmaceuticals | | | 236,609,741 | | | | 15,740,666 | | | | — | | | | 252,350,407 | |
Professional Services | | | 7,186,034 | | | | — | | | | — | | | | 7,186,034 | |
Road & Rail | | | 35,443,141 | | | | — | | | | — | | | | 35,443,141 | |
Semiconductors & Semiconductor Equipment | | | 51,607,395 | | | | — | | | | — | | | | 51,607,395 | |
Software | | | 20,702,599 | | | | — | | | | — | | | | 20,702,599 | |
Specialty Retail | | | 9,525,179 | | | | — | | | | — | | | | 9,525,179 | |
Tobacco | | | 128,102,354 | | | | — | | | | — | | | | 128,102,354 | |
Wireless Telecommunication Services | | | — | | | | 6,514,760 | | | | — | | | | 6,514,760 | |
Total Common Stocks | | | 2,899,898,360 | | | | 126,925,022 | | | | — | | | | 3,026,823,382 | |
| Short-Term Investments | | | | | | | | | | | | | | | | |
Discount Note | | | — | | | | 8,357,000 | | | | — | | | | 8,357,000 | |
Mutual Fund | | | 83,896,264 | | | | — | | | | — | | | | 83,896,264 | |
Repurchase Agreement | | | — | | | | 24,409,077 | | | | — | | | | 24,409,077 | |
Total Short-Term Investments | | | 83,896,264 | | | | 32,766,077 | | | | — | | | | 116,662,341 | |
Total Investments | | $ | 2,983,794,624 | | | $ | 159,691,099 | | | $ | — | | | $ | 3,143,485,723 | |
| | | | | | | | | | | | | | | | | |
Collateral for Securities Loaned (Liability) | | $ | — | | | $ | (83,896,264 | ) | | $ | — | | | $ | (83,896,264 | ) |
See accompanying notes to financial statements.
MSF-8
Metropolitan Series Fund
MFS Value Portfolio
Statement of Assets and Liabilities
June 30, 2016 (Unaudited)
| | | | |
Assets | | | | |
Investments at value (a) (b) | | $ | 3,143,485,723 | |
Cash | | | 106,287 | |
Cash denominated in foreign currencies (c) | | | 819 | |
Receivable for: | | | | |
Investments sold | | | 1,802,447 | |
Fund shares sold | | | 234,728 | |
Dividends and interest | | | 5,762,688 | |
Prepaid expenses | | | 19,352 | |
| | | | |
Total Assets | | | 3,151,412,044 | |
Liabilities | | | | |
Collateral for securities loaned | | | 83,896,264 | |
Payables for: | | | | |
Fund shares redeemed | | | 2,883,136 | |
Accrued Expenses: | | | | |
Management fees | | | 1,399,637 | |
Distribution and service fees | | | 164,864 | |
Deferred trustees’ fees | | | 136,865 | |
Other expenses | | | 309,093 | |
| | | | |
Total Liabilities | | | 88,789,859 | |
| | | | |
Net Assets | | $ | 3,062,622,185 | |
| | | | |
Net Assets Consist of: | | | | |
Paid in surplus | | $ | 2,212,965,463 | |
Undistributed net investment income | | | 29,953,363 | |
Accumulated net realized gain | | | 100,780,527 | |
Unrealized appreciation on investments and foreign currency transactions | | | 718,922,832 | |
| | | | |
Net Assets | | $ | 3,062,622,185 | |
| | | | |
Net Assets | | | | |
Class A | | $ | 2,209,311,430 | |
Class B | | | 772,413,604 | |
Class D | | | 14,500,546 | |
Class E | | | 66,396,605 | |
Capital Shares Outstanding* | | | | |
Class A | | | 154,039,077 | |
Class B | | | 54,420,773 | |
Class D | | | 1,013,911 | |
Class E | | | 4,654,297 | |
Net Asset Value, Offering Price and Redemption Price Per Share | | | | |
Class A | | $ | 14.34 | |
Class B | | | 14.19 | |
Class D | | | 14.30 | |
Class E | | | 14.27 | |
| * | The Portfolio is authorized to issue an unlimited number of shares. |
| (a) | Identified cost of investments was $2,424,469,775. |
| (b) | Includes securities loaned at value of $124,141,951. |
| (c) | Identified cost of cash denominated in foreign currencies was $840. |
Statement of Operations
Six Months Ended June 30, 2016 (Unaudited)
| | | | |
Investment Income | | | | |
Dividends (a) | | $ | 38,068,676 | |
Interest | | | 33,787 | |
Securities lending income | | | 124,022 | |
| | | | |
Total investment income | | | 38,226,485 | |
Expenses | | | | |
Management fees | | | 10,339,032 | |
Administration fees | | | 37,330 | |
Custodian and accounting fees | | | 83,213 | |
Distribution and service fees—Class B | | | 907,015 | |
Distribution and service fees—Class D | | | 7,035 | |
Distribution and service fees—Class E | | | 48,110 | |
Audit and tax services | | | 20,230 | |
Legal | | | 13,766 | |
Trustees’ fees and expenses | | | 15,980 | |
Shareholder reporting | | | 90,791 | |
Insurance | | | 10,385 | |
Miscellaneous | | | 18,743 | |
| | | | |
Total expenses | | | 11,591,630 | |
Less management fee waiver | | | (1,999,509 | ) |
Less broker commission recapture | | | (26,767 | ) |
| | | | |
Net expenses | | | 9,565,354 | |
| | | | |
Net Investment Income | | | 28,661,131 | |
| | | | |
Net Realized and Unrealized Gain | | | | |
| Net realized gain (loss) on: | | | | |
Investments | | | 105,204,984 | |
Foreign currency transactions | | | (21,172 | ) |
| | | | |
Net realized gain | | | 105,183,812 | |
| | | | |
Net change in unrealized appreciation on: | | | | |
Investments | | | 70,430,855 | |
Foreign currency transactions | | | 30,280 | |
| | | | |
Net change in unrealized appreciation | | | 70,461,135 | |
| | | | |
Net realized and unrealized gain | | | 175,644,947 | |
| | | | |
Net Increase in Net Assets from Operations | | $ | 204,306,078 | |
| | | | |
| (a) | Net of foreign withholding taxes of $803,143. |
See accompanying notes to financial statements.
MSF-9
Metropolitan Series Fund
MFS Value Portfolio
Statements of Changes in Net Assets
| | | | | | | | |
| | | Six Months
Ended
June 30,
2016
(Unaudited) | | | Year Ended
December 31,
2015 | |
Increase (Decrease) in Net Assets: | | | | | | | | |
From Operations | | | | | | | | |
Net investment income | | $ | 28,661,131 | | | $ | 58,468,761 | |
Net realized gain | | | 105,183,812 | | | | 283,803,641 | |
Net change in unrealized appreciation (depreciation) | | | 70,461,135 | | | | (342,330,247 | ) |
| | | | | | | | |
Increase (decrease) in net assets from operations | | | 204,306,078 | | | | (57,845 | ) |
| | | | | | | | |
From Distributions to Shareholders | | | | | | | | |
Net investment income | | | | | | | | |
Class A | | | (49,437,763 | ) | | | (64,266,030 | ) |
Class B | | | (15,441,649 | ) | | | (18,873,575 | ) |
Class D | | | (312,156 | ) | | | (413,063 | ) |
Class E | | | (1,387,482 | ) | | | (1,838,640 | ) |
Net realized capital gains | | | | | | | | |
Class A | | | (197,201,744 | ) | | | (369,239,893 | ) |
Class B | | | (69,294,401 | ) | | | (119,713,583 | ) |
Class D | | | (1,306,868 | ) | | | (2,472,344 | ) |
Class E | | | (5,965,342 | ) | | | (11,239,619 | ) |
| | | | | | | | |
Total distributions | | | (340,347,405 | ) | | | (588,056,747 | ) |
| | | | | | | | |
Increase in net assets from capital share transactions | | | 160,563,584 | | | | 239,569,799 | |
| | | | | | | | |
Total increase (decrease) in net assets | | | 24,522,257 | | | | (348,544,793 | ) |
| | |
Net Assets | | | | | | | | |
Beginning of period | | | 3,038,099,928 | | | | 3,386,644,721 | |
| | | | | | | | |
End of period | | $ | 3,062,622,185 | | | $ | 3,038,099,928 | |
| | | | | | | | |
| | |
Undistributed net investment income | | | | | | | | |
End of period | | $ | 29,953,363 | | | $ | 67,871,282 | |
| | | | | | | | |
Other Information:
Capital Shares
Transactions in capital shares were as follows:
| | | | | | | | | | | | | | | | |
| | | Six Months Ended
June 30, 2016
(Unaudited) | | | Year Ended
December 31, 2015 | |
| | | Shares | | | Value | | | Shares | | | Value | |
Class A | | | | | | | | | | | | | | | | |
Sales | | | 1,343,653 | | | $ | 20,265,285 | | | | 3,370,415 | | | $ | 57,892,552 | |
Reinvestments | | | 17,504,578 | | | | 246,639,507 | | | | 27,842,385 | | | | 433,505,923 | |
Redemptions | | | (11,752,876 | ) | | | (178,350,338 | ) | | | (19,942,986 | ) | | | (335,396,986 | ) |
| | | | | | | | | | | | | | | | |
Net increase | | | 7,095,355 | | | $ | 88,554,454 | | | | 11,269,814 | | | $ | 156,001,489 | |
| | | | | | | | | | | | | | | | |
Class B | | | | | | | | | | | | | | | | |
Sales | | | 2,877,878 | | | $ | 43,408,022 | | | | 4,205,956 | | | $ | 67,865,522 | |
Reinvestments | | | 6,074,269 | | | | 84,736,050 | | | | 8,981,670 | | | | 138,587,158 | |
Redemptions | | | (4,032,050 | ) | | | (59,941,545 | ) | | | (7,493,315 | ) | | | (124,870,417 | ) |
| | | | | | | | | | | | | | | | |
Net increase | | | 4,920,097 | | | $ | 68,202,527 | | | | 5,694,311 | | | $ | 81,582,263 | |
| | | | | | | | | | | | | | | | |
Class D | | | | | | | | | | | | | | | | |
Sales | | | 24,944 | | | $ | 386,218 | | | | 17,071 | | | $ | 268,085 | |
Reinvestments | | | 115,233 | | | | 1,619,024 | | | | 185,796 | | | | 2,885,407 | |
Redemptions | | | (100,541 | ) | | | (1,502,495 | ) | | | (143,771 | ) | | | (2,360,733 | ) |
| | | | | | | | | | | | | | | | |
Net increase | | | 39,636 | | | $ | 502,747 | | | | 59,096 | | | $ | 792,759 | |
| | | | | | | | | | | | | | | | |
Class E | | | | | | | | | | | | | | | | |
Sales | | | 93,561 | | | $ | 1,403,576 | | | | 108,399 | | | $ | 1,772,656 | |
Reinvestments | | | 524,453 | | | | 7,352,824 | | | | 843,758 | | | | 13,078,259 | |
Redemptions | | | (363,410 | ) | | | (5,452,544 | ) | | | (815,386 | ) | | | (13,657,627 | ) |
| | | | | | | | | | | | | | | | |
Net increase | | | 254,604 | | | $ | 3,303,856 | | | | 136,771 | | | $ | 1,193,288 | |
| | | | | | | | | | | | | | | | |
Increase derived from capital shares transactions | | | | | | $ | 160,563,584 | | | | | | | $ | 239,569,799 | |
| | | | | | | | | | | | | | | | |
See accompanying notes to financial statements.
MSF-10
Metropolitan Series Fund
MFS Value Portfolio
Financial Highlights
| | | | | | | | | | | | | | | | | | | | | | | | |
| Selected per share data | | | | | | | | | | | | | | | | | | |
| | | Class A | |
| | | Six Months
Ended
June 30,
2016
(Unaudited) | | | Year Ended December 31, | |
| | | | 2015 | | | 2014 | | | 2013 | | | 2012 | | | 2011 | |
Net Asset Value, Beginning of Period | | $ | 15.09 | | | $ | 18.38 | | | $ | 17.75 | | | $ | 13.80 | | | $ | 12.23 | | | $ | 12.31 | |
| | | | | | | | | | | | | | | | | | | | | | | | |
Income (Loss) from Investment Operations | | | | | | | | | | | | | | | | | | | | | | | | |
Net investment income (a) | | | 0.15 | | | | 0.31 | | | | 0.43 | | | | 0.30 | | | | 0.29 | | | | 0.25 | |
Net realized and unrealized gain (loss) on investments | | | 0.90 | | | | (0.23 | ) | | | 1.36 | | | | 4.46 | | | | 1.72 | | | | (0.13 | ) |
| | | | | | | | | | | | | | | | | | | | | | | | |
Total from investment operations | | | 1.05 | | | | 0.08 | | | | 1.79 | | | | 4.76 | | | | 2.01 | | | | 0.12 | |
| | | | | | | | | | | | | | | | | | | | | | | | |
Less Distributions | | | | | | | | | | | | | | | | | | | | | | | | |
Distributions from net investment income | | | (0.36 | ) | | | (0.50 | ) | | | (0.31 | ) | | | (0.30 | ) | | | (0.26 | ) | | | (0.20 | ) |
Distributions from net realized capital gains | | | (1.44 | ) | | | (2.87 | ) | | | (0.85 | ) | | | (0.51 | ) | | | (0.18 | ) | | | 0.00 | |
| | | | | | | | | | | | | | | | | | | | | | | | |
Total distributions | | | (1.80 | ) | | | (3.37 | ) | | | (1.16 | ) | | | (0.81 | ) | | | (0.44 | ) | | | (0.20 | ) |
| | | | | | | | | | | | | | | | | | | | | | | | |
Net Asset Value, End of Period | | $ | 14.34 | | | $ | 15.09 | | | $ | 18.38 | | | $ | 17.75 | | | $ | 13.80 | | | $ | 12.23 | |
| | | | | | | | | | | | | | | | | | | | | | | | |
Total Return (%) (b) | | | 7.14 | (c) | | | (0.15 | ) | | | 10.81 | | | | 35.73 | | | | 16.65 | | | | 0.85 | |
| | | | | | |
Ratios/Supplemental Data | | | | | | | | | | | | | | | | | | | | | | | | |
Gross ratio of expenses to average net assets (%) | | | 0.72 | (d) | | | 0.72 | | | | 0.72 | | | | 0.72 | | | | 0.73 | | | | 0.73 | |
Net ratio of expenses to average net assets (%) (e) | | | 0.58 | (d) | | | 0.58 | | | | 0.58 | | | | 0.58 | | | | 0.60 | | | | 0.61 | |
Ratio of net investment income to average net assets (%) | | | 2.01 | (d) | | | 1.87 | | | | 2.49 | | | | 1.92 | | | | 2.21 | | | | 2.03 | |
Portfolio turnover rate (%) | | | 6 | (c) | | | 12 | | | | 12 | | | | 17 | | | | 16 | | | | 16 | |
Net assets, end of period (in millions) | | $ | 2,209.3 | | | $ | 2,218.1 | | | $ | 2,493.9 | | | $ | 3,074.8 | | | $ | 2,363.0 | | | $ | 2,141.2 | |
| |
| | | Class B | |
| | | Six Months
Ended
June 30,
2016
(Unaudited) | | | Year Ended December 31, | |
| | | | 2015 | | | 2014 | | | 2013 | | | 2012 | | | 2011 | |
Net Asset Value, Beginning of Period | | $ | 14.94 | | | $ | 18.22 | | | $ | 17.61 | | | $ | 13.70 | | | $ | 12.15 | | | $ | 12.23 | |
| | | | | | | | | | | | | | | | | | | | | | | | |
Income (Loss) from Investment Operations | | | | | | | | | | | | | | | | | | | | | | | | |
Net investment income (a) | | | 0.13 | | | | 0.27 | | | | 0.37 | | | | 0.27 | | | | 0.26 | | | | 0.22 | |
Net realized and unrealized gain (loss) on investments | | | 0.88 | | | | (0.23 | ) | | | 1.36 | | | | 4.41 | | | | 1.70 | | | | (0.13 | ) |
| | | | | | | | | | | | | | | | | | | | | | | | |
Total from investment operations | | | 1.01 | | | | 0.04 | | | | 1.73 | | | | 4.68 | | | | 1.96 | | | | 0.09 | |
| | | | | | | | | | | | | | | | | | | | | | | | |
Less Distributions | | | | | | | | | | | | | | | | | | | | | | | | |
Distributions from net investment income | | | (0.32 | ) | | | (0.45 | ) | | | (0.27 | ) | | | (0.26 | ) | | | (0.23 | ) | | | (0.17 | ) |
Distributions from net realized capital gains | | | (1.44 | ) | | | (2.87 | ) | | | (0.85 | ) | | | (0.51 | ) | | | (0.18 | ) | | | 0.00 | |
| | | | | | | | | | | | | | | | | | | | | | | | |
Total distributions | | | (1.76 | ) | | | (3.32 | ) | | | (1.12 | ) | | | (0.77 | ) | | | (0.41 | ) | | | (0.17 | ) |
| | | | | | | | | | | | | | | | | | | | | | | | |
Net Asset Value, End of Period | | $ | 14.19 | | | $ | 14.94 | | | $ | 18.22 | | | $ | 17.61 | | | $ | 13.70 | | | $ | 12.15 | |
| | | | | | | | | | | | | | | | | | | | | | | | |
Total Return (%) (b) | | | 6.94 | (c) | | | (0.36 | ) | | | 10.56 | | | | 35.38 | | | | 16.32 | | | | 0.64 | |
| | | | | | | | | | | | | | | | | | | | | | | | |
Ratios/Supplemental Data | | | | | | | | | | | | | | | | | | | | | | | | |
Gross ratio of expenses to average net assets (%) | | | 0.97 | (d) | | | 0.97 | | | | 0.97 | | | | 0.97 | | | | 0.98 | | | | 0.98 | |
Net ratio of expenses to average net assets (%) (e) | | | 0.83 | (d) | | | 0.83 | | | | 0.83 | | | | 0.83 | | | | 0.85 | | | | 0.86 | |
Ratio of net investment income to average net assets (%) | | | 1.76 | (d) | | | 1.62 | | | | 2.16 | | | | 1.68 | | | | 1.96 | | | | 1.79 | |
Portfolio turnover rate (%) | | | 6 | (c) | | | 12 | | | | 12 | | | | 17 | | | | 16 | | | | 16 | |
Net assets, end of period (in millions) | | $ | 772.4 | | | $ | 739.3 | | | $ | 798.0 | | | $ | 795.9 | | | $ | 250.2 | | | $ | 217.7 | |
Please see following page for Financial Highlights footnote legend.
See accompanying notes to financial statements.
MSF-11
Metropolitan Series Fund
MFS Value Portfolio
Financial Highlights
| | | | | | | | | | | | | | | | |
| Selected per share data | | | | | | | | | | | | |
| | | Class D | |
| | | Six Months
Ended
June 30,
2016
(Unaudited) | | | Year Ended December 31, | |
| | | | 2015 | | | 2014 | | | 2013(f) | |
Net Asset Value, Beginning of Period | | $ | 15.05 | | | $ | 18.33 | | | $ | 17.71 | | | $ | 14.88 | |
| | | | | | | | | | | | | | | | |
Income (Loss) from Investment Operations | | | | | | | | | | | | | | | | |
Net investment income (a) | | | 0.14 | | | | 0.29 | | | | 0.41 | | | | 0.20 | |
Net realized and unrealized gain (loss) on investments | | | 0.89 | | | | (0.22 | ) | | | 1.35 | | | | 2.63 | |
| | | | | | | | | | | | | | | | |
Total from investment operations | | | 1.03 | | | | 0.07 | | | | 1.76 | | | | 2.83 | |
| | | | | | | | | | | | | | | | |
Less Distributions | | | | | | | | | | | | | | | | |
Distributions from net investment income | | | (0.34 | ) | | | (0.48 | ) | | | (0.29 | ) | | | 0.00 | |
Distributions from net realized capital gains | | | (1.44 | ) | | | (2.87 | ) | | | (0.85 | ) | | | 0.00 | |
| | | | | | | | | | | | | | | | |
Total distributions | | | (1.78 | ) | | | (3.35 | ) | | | (1.14 | ) | | | 0.00 | |
| | | | | | | | | | | | | | | | |
Net Asset Value, End of Period | | $ | 14.30 | | | $ | 15.05 | | | $ | 18.33 | | | $ | 17.71 | |
| | | | | | | | | | | | | | | | |
Total Return (%) (b) | | | 7.05 | (c) | | | (0.20 | ) | | | 10.69 | | | | 19.02 | (c) |
| | | | |
Ratios/Supplemental Data | | | | | | | | | | | | | | | | |
Gross ratio of expenses to average net assets (%) | | | 0.82 | (d) | | | 0.82 | | | | 0.82 | | | | 0.82 | (d) |
Net ratio of expenses to average net assets (%) (e) | | | 0.68 | (d) | | | 0.68 | | | | 0.68 | | | | 0.68 | (d) |
Ratio of net investment income to average net assets (%) | | | 1.90 | (d) | | | 1.77 | | | | 2.34 | | | | 1.80 | (d) |
Portfolio turnover rate (%) | | | 6 | (c) | | | 12 | | | | 12 | | | | 17 | |
Net assets, end of period (in millions) | | $ | 14.5 | | | $ | 14.7 | | | $ | 16.8 | | | $ | 18.6 | |
| | | | | | | | | | | | | | | | | | | | | | | | |
| |
| | | Class E | |
| | | Six Months
Ended
June 30,
2016
(Unaudited) | | | Year Ended December 31, | |
| | | | 2015 | | | 2014 | | | 2013 | | | 2012 | | | 2011 | |
Net Asset Value, Beginning of Period | | $ | 15.01 | | | $ | 18.29 | | | $ | 17.67 | | | $ | 13.73 | | | $ | 12.18 | | | $ | 12.25 | |
| | | | | | | | | | | | | | | | | | | | | | | | |
Income (Loss) from Investment Operations | | | | | | | | | | | | | | | | | | | | | | | | |
Net investment income (a) | | | 0.14 | | | | 0.29 | | | | 0.40 | | | | 0.28 | | | | 0.27 | | | | 0.23 | |
Net realized and unrealized gain (loss) on investments | | | 0.89 | | | | (0.23 | ) | | | 1.35 | | | | 4.45 | | | | 1.70 | | | | (0.12 | ) |
| | | | | | | | | | | | | | | | | | | | | | | | |
Total from investment operations | | | 1.03 | | | | 0.06 | | | | 1.75 | | | | 4.73 | | | | 1.97 | | | | 0.11 | |
| | | | | | | | | | | | | | | | | | | | | | | | |
Less Distributions | | | | | | | | | | | | | | | | | | | | | | | | |
Distributions from net investment income | | | (0.33 | ) | | | (0.47 | ) | | | (0.28 | ) | | | (0.28 | ) | | | (0.24 | ) | | | (0.18 | ) |
Distributions from net realized capital gains | | | (1.44 | ) | | | (2.87 | ) | | | (0.85 | ) | | | (0.51 | ) | | | (0.18 | ) | | | 0.00 | |
| | | | | | | | | | | | | | | | | | | | | | | | |
Total distributions | | | (1.77 | ) | | | (3.34 | ) | | | (1.13 | ) | | | (0.79 | ) | | | (0.42 | ) | | | (0.18 | ) |
| | | | | | | | | | | | | | | | | | | | | | | | |
Net Asset Value, End of Period | | $ | 14.27 | | | $ | 15.01 | | | $ | 18.29 | | | $ | 17.67 | | | $ | 13.73 | | | $ | 12.18 | |
| | | | | | | | | | | | | | | | | | | | | | | | |
Total Return (%) (b) | | | 7.07 | (c) | | | (0.27 | ) | | | 10.63 | | | | 35.63 | | | | 16.39 | | | | 0.81 | |
| | | | | | | | | | | | | | | | | | | | | | | | |
Ratios/Supplemental Data | | | | | | | | | | | | | | | | | | | | | | | | |
Gross ratio of expenses to average net assets (%) | | | 0.87 | (d) | | | 0.87 | | | | 0.87 | | | | 0.87 | | | | 0.88 | | | | 0.88 | |
Net ratio of expenses to average net assets (%) (e) | | | 0.73 | (d) | | | 0.73 | | | | 0.73 | | | | 0.73 | | | | 0.75 | | | | 0.76 | |
Ratio of net investment income to average net assets (%) | | | 1.86 | (d) | | | 1.72 | | | | 2.28 | | | | 1.81 | | | | 2.05 | | | | 1.85 | |
Portfolio turnover rate (%) | | | 6 | (c) | | | 12 | | | | 12 | | | | 17 | | | | 16 | | | | 16 | |
Net assets, end of period (in millions) | | $ | 66.4 | | | $ | 66.0 | | | $ | 78.0 | | | $ | 83.5 | | | $ | 57.0 | | | $ | 58.1 | |
| (a) | Per share amounts based on average shares outstanding during the period. |
| (b) | Total return does not reflect any insurance, sales, separate account or administrative charges of variable annuity or life insurance contracts or any additional expenses that contract owners may bear under their variable contracts. If these charges were included, the returns would be lower. |
| (c) | Periods less than one year are not computed on an annualized basis. |
| (d) | Computed on an annualized basis. |
| (e) | Includes the effects of management fee waivers (see Note 5 of the Notes to Financial Statements). |
| (f) | Commencement of operations was April 26, 2013. |
See accompanying notes to financial statements.
MSF-12
Metropolitan Series Fund
MFS Value Portfolio
Notes to Financial Statements—June 30, 2016 (Unaudited)
1. Organization
Metropolitan Series Fund (the “Trust”) is organized as a Delaware statutory trust and registered under the Investment Company Act of 1940, as amended (the “1940 Act”), as an open-end management investment company. The Trust, which is managed by MetLife Advisers, LLC (“MetLife Advisers” or the “Adviser”), an affiliate of MetLife, Inc., is currently comprised of thirty series, each of which operates as a distinct investment vehicle of the Trust. The portfolio included in this report is MFS Value Portfolio (the “Portfolio”), which is diversified. Shares in the Portfolio are not offered directly to the general public and are currently available only to separate accounts established by Metropolitan Life Insurance Company (“MetLife”) and other affiliated life insurance companies.
The Portfolio has registered and offers four classes of shares: Class A, B, D and E shares. Shares of each Class of the Portfolio represent an equal pro rata interest in the Portfolio and generally give the shareholder the same voting, dividend, liquidation, and other rights. Investment income, realized and unrealized capital gains and losses, the common expenses of the Portfolio, and certain Portfolio-level expense reductions, if any, are allocated on a pro rata basis to each Class based on the relative net assets of each Class to the net assets of the Portfolio. Each Class of shares differs in its respective distribution plan and such distribution expenses are allocated to the corresponding Class of shares.
2. Significant Accounting Policies
The preparation of financial statements in conformity with accounting principles generally accepted in the United States of America (“GAAP”) requires management to make estimates and assumptions that affect the reported amounts of assets and liabilities and disclosure of contingent assets and liabilities as of the date of the financial statements and the reported amounts of income and expenses during the reporting period. Actual results could differ from those estimates. In the preparation of these financial statements, management has evaluated events and transactions subsequent to June 30, 2016 through the date the financial statements were issued.
The Portfolio is an investment company and follows the accounting and reporting guidance of the Financial Accounting Standards Board (“FASB”) Accounting Standards Codification Topic 946—Financial Services—Investment Companies and Topic 820—Fair Value Measurement. The following is a summary of significant accounting policies consistently followed by the Portfolio in the preparation of its financial statements.
Investment Valuation and Fair Value Measurements - Domestic and foreign equity securities, such as common stock, exchange-traded funds, rights, warrants, and preferred stock, that are traded on a securities exchange on a valuation date are generally valued at their last quoted sale price or official closing price on the primary exchange for such security, or, if no sales occurred on that day, at the last reported bid price. Equity securities traded over-the-counter (“OTC”) are generally valued at the last reported bid price. In the event of a major exchange closing during the trading day, the Adviser may use other market information obtained from quotation reporting systems, established market makers, or pricing services in valuing the securities. Valuation adjustments may be applied to certain foreign equity securities that are traded solely on foreign exchanges that close before the time as of which the Portfolio determines its NAV to account for the market movement between the close of the foreign exchanges and the time as of which the Portfolio determines its NAV. The Portfolio may use a systematic fair valuation model provided by a pricing service to value securities principally traded in these foreign markets in order to adjust for possible market movements or other changes that may occur between the close of the foreign exchanges and the time as of which the Portfolio determines its NAV. Foreign equity securities valued using these valuation adjustments are generally categorized as Level 2 within the fair value hierarchy. Equity securities that are actively traded, and have no valuation adjustments applied, are categorized as Level 1 within the fair value hierarchy. Other equity securities traded on inactive markets, or valued in reference to similar instruments traded on active markets, are generally categorized as Level 2 within the fair value hierarchy.
Investments in registered open-end management investment companies are valued at reported net asset value per share on the valuation date and are categorized as Level 1 within the fair value hierarchy.
Debt securities, including corporate, convertible and municipal bonds and notes; obligations of the U.S. Treasury and U.S. government agencies; foreign sovereign issues; and non-U.S. bonds, are generally valued on the basis of evaluated or composite bid quotations obtained from independent pricing services and/or brokers and dealers selected by the Adviser (each a “pricing service”), pursuant to authorization of and subject to general oversight by the Board of Trustees of the Trust (the “Board” or “Trustees”). Such pricing services may use matrix pricing, which considers observable inputs including, among other things, issuer details, maturity dates, interest rates, yield curves, rates of prepayment, credit risks/spreads, default rates, reported trades, broker dealer quotes and quoted prices for similar assets. Short-term obligations with a remaining maturity of sixty days or less may be valued at amortized cost in the absence of market quotes, so long as the amortized cost value of such short-term debt instrument is approximately the same as the fair value of the instrument as determined without the use of amortized cost valuation. Floating rate loans are generally valued on the basis of an evaluated or composite average of aggregate bid and ask quotations supplied by brokers or dealers, as obtained from the pricing service. Securities that use similar valuation techniques and inputs as described above are generally categorized as Level 2 within the fair value hierarchy.
MSF-13
Metropolitan Series Fund
MFS Value Portfolio
Notes to Financial Statements—June 30, 2016—(Continued)
Options, whether on securities, indices, futures contracts, or otherwise, traded on exchanges are valued at the last sale price available as of the close of business on a valuation day or, if there is no such price available, at the last reported bid price. These types of options are categorized as Level 1 within the fair value hierarchy. Futures contracts that are traded on commodity exchanges are valued at their settlement prices established by the exchanges on which they are traded as of the close of such exchanges and are categorized as Level 1 within the fair value hierarchy.
If no current market value quotation or other observable inputs are readily available or market value quotations are deemed to be unreliable for an investment, the fair value of the investment will be determined in accordance with procedures approved by, and under the general supervision of, the Board. In such a circumstance, the Board will be assisted in its responsibility to determine the fair value of an investment by the Valuation Committee (“Committee”) of MetLife Advisers. The Committee provides general pricing oversight and fair value pricing determinations related to portfolio securities and meets on a regular basis to review reports relating to the valuation of the securities in the Portfolio. The Board has delegated to State Street Bank and Trust Company, the Trust’s custodian (“custodian”), the responsibility for calculating the net asset values (“NAVs”) of the Trust’s Portfolios. The Committee is responsible for overseeing the calculation of the NAVs of the Portfolios by the custodian. The Committee also periodically reviews pricing services, including the pricing services providing fair value pricing for the Portfolio’s foreign securities, and is responsible for overseeing the correction of pricing errors and addressing other pricing issues that arise in the ordinary course of business, such as making real-time fair value determinations, as necessary.
No single standard for determining the fair value of an investment can be set forth because fair value depends upon the facts and circumstances with respect to each investment. Information relating to any relevant factors may be obtained by the Committee from any appropriate source, including the subadviser of the Portfolio, the custodian, a pricing service, market maker and/or broker for such security or the issuer. Appropriate methodologies for determining fair value under particular circumstances may include: matrix pricing, a discounted cash flow analysis, comparisons of securities with comparable characteristics, value based on multiples of earnings, discount from market price of similar marketable securities or a combination of these and other methods.
Investment Transactions and Related Investment Income - Portfolio security transactions are recorded on the trade date. Dividend income is recorded on the ex-dividend date or, for certain foreign securities, when notified. Interest income, which includes amortization of premium and accretion of discount on debt securities, is recorded on the accrual basis. Realized gains and losses on investments are determined on the identified cost basis, which is the same basis used for federal income tax purposes. Foreign income and foreign capital gains on some foreign securities may be subject to foreign taxes, which are accrued as applicable. These foreign taxes have been provided for in accordance with the Portfolio’s understanding of the applicable countries’ tax rules and rates.
Foreign Currency Translation - The books and records of the Portfolio are maintained in U.S. dollars. The values of securities, currencies, and other assets and liabilities denominated in currencies other than the U.S. dollar are translated into U.S. dollars based upon foreign exchange rates prevailing at the end of the period. Purchases and sales of investment securities, income, and expenses are translated on the respective dates of such transactions. Because the values of investment securities are translated at the foreign exchange rates prevailing at the end of the period, that portion of the results of operations arising from changes in exchange rates and that portion of the results of operations reflecting fluctuations arising from changes in market prices of the investment securities are not separated. Such fluctuations are included in the net realized and unrealized gain or loss on investments.
Net realized foreign exchange gains or losses arise from activity in forward foreign currency exchange contracts, sales of foreign currency, currency gains or losses realized between the trade and settlement dates on securities transactions, and the difference between the amounts of dividends, interest, and foreign withholding taxes recorded by the Portfolio and the U.S. dollar equivalent of the amounts actually received or paid by the Portfolio. Net unrealized foreign exchange gains and losses arise from changes in the value of assets and liabilities, other than investment securities, resulting from changes in foreign exchange rates.
Dividends and Distributions to Shareholders - The Portfolio records dividends and distributions on the ex-dividend date. Net realized gains from securities transactions (if any) are generally distributed annually to shareholders. The timing and characterization of certain income and capital gains distributions are determined in accordance with federal tax regulations that may differ from GAAP. Permanent book and tax basis differences relating to shareholder distributions will result in reclassification between under/over distributed net investment income, accumulated net realized gains/losses, and paid-in surplus. Book-tax differences are primarily due to foreign currency transactions, corporate actions and broker commission recapture. These adjustments have no impact on net assets or the results of operations.
Income Taxes - It is the Portfolio’s policy to comply with the requirements of the Internal Revenue Code of 1986, as amended, and regulations thereunder, applicable to regulated investment companies and to distribute, with respect to each taxable year, all of its taxable income to shareholders. Therefore, no federal income tax provision is required. The Portfolio files U.S. federal tax returns. No income tax returns are currently under examination. The Portfolio’s federal tax returns for the prior three fiscal years remain subject to examination by the Internal Revenue Service. As of June 30, 2016, the Portfolio had no uncertain tax positions that would require financial statement recognition, or de-recognition or disclosure.
Directed Brokerage Agreement - The Trust has entered into a directed brokerage arrangement with State Street Global Markets (“SSGM”). Under this arrangement, the Portfolio directs certain trades to SSGM in return for a recapture credit. SSGM issues a cash
MSF-14
Metropolitan Series Fund
MFS Value Portfolio
Notes to Financial Statements—June 30, 2016—(Continued)
rebate to the Portfolio. Amounts paid to the Portfolio are shown separately as broker commission recapture on the Statement of Operations of the Portfolio. Additionally, these amounts have been excluded from the calculation of the net ratio of expenses to average net assets presented in the Financial Highlights for each share class.
Repurchase Agreements - The Portfolio may enter into repurchase agreements, under the terms of a Master Repurchase Agreement (“MRA”), with selected commercial banks and broker-dealers, under which the Portfolio acquires securities as collateral and agrees to resell the securities at an agreed-upon time and at an agreed-upon price. The Portfolio, through the custodian or a subcustodian, under a tri-party repurchase agreement, receives delivery of the underlying securities collateralizing any repurchase agreements. It is the Portfolio’s policy that the market value of the collateral be equal to at least 100% of the repurchase price in the case of a repurchase agreement of one-day duration and equal to at least 102% of the repurchase price in the case of all other repurchase agreements. In the event of default or failure by a party to perform an obligation in connection with any repurchase transaction, the MRA gives the non-defaulting party the right to set-off claims and to apply property held by it in connection with any repurchase transaction against obligations owed to it.
At June 30, 2016, the Portfolio had investments in repurchase agreements with a gross value of $24,409,077, which is included as part of investments at value on the Statement of Assets and Liabilities. The value of the related collateral exceeded the value of the repurchase agreements at June 30, 2016.
Securities Lending - The Portfolio may lend its portfolio securities to certain qualified brokers who borrow securities in order to complete certain securities transactions. By lending its portfolio securities, the Portfolio attempts to increase its net investment income through the receipt of income on collateral held from securities on loan. Any gain or loss in the market price of the loaned securities that might occur and any interest earned or dividends declared during the term of the loan would accrue to the account of the Portfolio.
The Trust has entered into a Securities Lending Authorization Agreement with the custodian as the lending agent. Under this agreement, the custodian is authorized to loan portfolio securities on the Portfolio’s behalf. In exchange, the Portfolio receives either cash or securities as collateral against the loaned securities. The Portfolio receives collateral equal to at least 102% of the market value of the loaned securities (105% for foreign equity securities), at each loan’s inception. Collateral representing at least 100% of the market value of the loaned securities must be maintained for the duration of the loan. Cash collateral is generally invested in the State Street Navigator Securities Lending MET Portfolio (the “Navigator Portfolio”), a series of the State Street Navigator Securities Lending Trust that is managed by an affiliate of the custodian. The Navigator Portfolio is a registered money market fund that invests in a variety of high-quality, U.S. dollar-denominated instruments. If the market value of the collateral at the close of trading on a business day is less than 100% of the market value of the loaned securities at the close of trading on that day, the borrower shall be required to deliver, by the close of business on the following business day, an additional amount of collateral, so that the total amount of posted collateral is equal to at least 100% of the market value of all the loaned securities as of such preceding day. A portion of net income (income after the deduction of expenses and fees of the Navigator Portfolio) on the collateral is rebated to the borrower of the securities and the remainder is split between the custodian and the Portfolio. On loans collateralized by U.S. Treasuries, a fee is received from the borrower and is allocated between the Portfolio and the custodian. Income received by the Portfolio in securities lending transactions during the six months ended June 30, 2016 is reflected as Securities lending income on the Statement of Operations. The values of any securities loaned by the Portfolio and the related collateral at June 30, 2016 are disclosed in the footnotes to the Schedule of Investments. The value of the related collateral received by the Portfolio exceeded the value of the securities out on loan at June 30, 2016.
The risks associated with lending portfolio securities include, but are not limited to, possible delays in receiving additional collateral or in the recovery of the loaned securities, possible loss of rights in the collateral should the borrower fail financially, as well as risk of loss in the value of the collateral or the value of the investments made with the collateral. The lending agent shall indemnify the Portfolio in the case of default of any securities borrower.
All securities on loan are classified as Common Stocks in the Portfolio’s Schedule of Investments as of June 30, 2016, with a contractual maturity of overnight and continuous.
3. Certain Risks
In the normal course of business, the Portfolio invests in securities and enters into transactions where risks exist due to fluctuations in the market (“market risk”) or failure of the other party to a transaction to perform (“credit and counterparty risk”).
Market Risk: The value of securities held by the Portfolio may decline in response to certain events, including those directly involving the companies whose securities are owned by the Portfolio; conditions affecting the general economy; overall market changes; local, regional or global political, social or economic instability; and currency, interest rate, and price fluctuations.
Credit and Counterparty Risk: The Portfolio may be exposed to counterparty risk, or the risk that an entity with which the Portfolio has unsettled or open transactions may default. The potential loss could exceed the value of the financial assets and liabilities
MSF-15
Metropolitan Series Fund
MFS Value Portfolio
Notes to Financial Statements—June 30, 2016—(Continued)
recorded in the financial statements. Financial assets that potentially expose the Portfolio to credit and counterparty risk consist principally of cash due from counterparties and investments. The Portfolio manages counterparty risk by entering into agreements only with counterparties that it believes have the financial resources to honor their obligations and by monitoring the financial stability of those counterparties. The Portfolio’s investment adviser attempts to mitigate counterparty risk by (i) periodically assessing the creditworthiness of its trading partners, (ii) monitoring and/or limiting the amount of its net exposure to each individual counterparty based on its assessment, and (iii) requiring collateral from the counterparty for certain transactions. In order to preserve certain safeguards for non-standard settlement trades, the Portfolio restricts its exposure to credit and counterparty losses by entering into master netting agreements (“Master Agreements”) with counterparties (approved brokers) with whom it undertakes a significant volume of transactions. Master Agreements govern the terms of certain transactions, and reduce the counterparty risk associated with relevant transactions by specifying credit protection mechanisms and providing standardization that improves legal certainty. Master Agreements can also help limit counterparty risk by specifying collateral posting arrangements at pre-arranged exposure levels.
Repurchase and reverse repurchase agreements are primarily executed under Global Master Repurchase Agreements (“GMRAs”) or Master Repurchase Agreements (“MRAs”), which provide the rights to set-off. Each repurchase and reverse repurchase agreement is initially collateralized at the transaction level. In the event of default, the total market value exposure will be offset against collateral exchanged to date, which would result in a net receivable/(payable) that would be due from/to the counterparty.
Additional risks associated with each type of investment are described above within the respective security type notes. The Portfolio’s prospectus includes a discussion of the principal risks of investing in the Portfolio.
4. Investment Transactions
Aggregate cost of purchases and proceeds of sales of investment securities, excluding short-term securities, for the six months ended June 30, 2016 were as follows:
| | | | | | | | | | | | |
Purchases | | | Sales | |
U.S. Government | | Non U.S. Government | | | U.S. Government | | | Non U.S. Government | |
| $0 | | $ | 171,318,786 | | | $ | 0 | | | $ | 311,021,436 | |
The Portfolio engaged in security transactions with other accounts managed by Massachusetts Financial Services Company that amounted to $814,330 in purchases and $4,334,571 in sales of investments, which are included above, and resulted in realized gains of $1,633,195.
5. Investment Management Fees and Other Transactions with Affiliates
Investment Management Agreement - MetLife Advisers is the investment adviser to the Portfolio. The Trust has entered into an investment management agreement with MetLife Advisers with respect to the Portfolio. For providing investment management services to the Portfolio, MetLife Advisers receives monthly compensation at the following annual rates:
| | | | | | |
Management
Fees earned by
MetLife Advisers
for the six months ended
June 30, 2016 | | % per annum | | | Average daily net
assets |
| $10,339,032 | | | 0.750 | % | | Of the first $250 million |
| | | 0.700 | % | | Of the next $2.25 billion |
| | | 0.675 | % | | Of the next $2.5 billion |
| | | 0.650 | % | | On amounts in excess of $5 billion |
MetLife Advisers has entered into an investment subadvisory agreement with respect to managing the Portfolio. Massachusetts Financial Services Company is compensated by MetLife Advisers to provide subadvisory services for the Portfolio.
Management Fee Waiver - Pursuant to a management fee waiver agreement, MetLife Advisers has agreed, for the period May 1, 2016 to April 30, 2017, to reduce its advisory fees set out above under “Investment Management Agreement” for each class of the Portfolio as follows:
| | |
% per annum | | Average daily net assets |
| 0.100% | | On the first $200 million |
| 0.125% | | On the next $50 million |
| 0.075% | | On the next $1.25 billion |
| 0.200% | | On the next $1 billion |
| 0.175% | | On the next $2.5 billion |
| 0.150% | | On amounts in excess of $5 billion |
MSF-16
Metropolitan Series Fund
MFS Value Portfolio
Notes to Financial Statements—June 30, 2016—(Continued)
An identical agreement was in place for the period May 1, 2015 to April 30, 2016. Amounts waived for the six months ended June 30, 2016 are shown as a management fee waiver in the Statement of Operations.
Certain officers and trustees of the Trust may also be officers of MetLife Advisers; however, such officers and trustees receive no compensation from the Trust.
On January 12, 2016, MetLife, Inc. announced its plan to pursue the separation of a substantial portion of its retail segment and is currently evaluating structural alternatives for such separation. It is anticipated that MetLife Advisers would be included in any such separation. Any separation transaction that might occur will be subject to the satisfaction of various conditions and approvals, including approval of any transaction by the MetLife, Inc. Board of Directors, satisfaction of any applicable requirements of the SEC, and receipt of insurance and other regulatory approvals and other anticipated conditions. Because the form of a separation had yet to be determined, MetLife, Inc. cannot currently provide a specific potential completion date or information about the potential impact on MetLife Advisers. No assurance can be given regarding the form that a separation transaction may take or the specific terms thereof, or that a separation will in fact occur. Depending on the form a separation takes, MetLife Advisers’ continued service as investment adviser to the Trusts could be subject to the satisfaction of various conditions and approvals, which may include obtaining approvals from the Trusts’ Board and shareholders.
Transfer Agency Agreement - MetLife serves as the transfer agent for the Trust. MetLife receives no fees for its services to the Trust under the transfer agency agreement.
Distribution and Service Fees - The Trust has a distribution agreement with MetLife Investors Distribution Company (“MIDC” or the “Distributor”) in which MIDC serves as the distributor for the Portfolio’s Class A, B, D, and E Shares. MIDC is a wholly-owned subsidiary of MetLife Investors Group, LLC, an affiliate of the Adviser. The Trust has also adopted a Distribution and Service Plan under Rule 12b-1 of the 1940 Act for the Portfolio’s Class B, D, and E Shares. Under the Distribution and Service Plan, the Class B, D, and E Shares of the Portfolio pay a fee to compensate the Insurance Companies (or their affiliates) and other broker-dealers and financial intermediaries involved in the offer and sale of Portfolio shares for promoting or selling and servicing the Class B, D, and E Shares. The fees under the Distribution and Service Plan for each class of the Portfolio’s shares are calculated as a percentage of the Portfolio’s average daily net assets that are attributable to that Class. Currently, the fee is 0.25% per year for Class B Shares, 0.10% per year for Class D Shares, and 0.15% per year for Class E Shares. Amounts incurred by the Portfolio for the six months ended June 30, 2016 are shown as Distribution and service fees in the Statement of Operations.
Deferred Trustee Compensation - Each Trustee who is not currently an employee of the Adviser or any of its affiliates receives compensation from the Trust for his or her service to the Trust. A deferred compensation plan (the “Plan”) is available to the Trustees on a voluntary basis. Deferred amounts remain in the Trust until distributed in accordance with the provisions of the Plan. The value of a participating Trustee’s deferral account is based on theoretical investments of deferred amounts on the normal payment dates in certain portfolios of the Trust or Met Investors Series Trust, an affiliate of the Trust, as designated by the participating Trustee. Changes in the value of participants’ deferral accounts are reflected as Trustees’ fees and expenses in the Statement of Operations. The portion of the accrued obligations allocated to the Portfolio under the Plan is reflected as Deferred trustees’ fees in the Statement of Assets and Liabilities.
6. Contractual Obligations
Under the Trust’s organizational documents, its officers and Trustees may be indemnified against certain liabilities and expenses arising out of the performance of their duties to the Trust. Additionally, the Trust has a variety of indemnification obligations under contracts with its service providers. The Trust’s maximum exposure under these arrangements is unknown, as this would involve future claims that may be made against the Trust that have not yet occurred.
7. Income Tax Information
The tax character of distributions paid for the years ended December 31, 2015 and 2014 were as follows:
| | | | | | | | | | | | | | | | | | | | |
Ordinary Income | | | Long-Term Capital Gain | | | Total | |
2015 | | 2014 | | | 2015 | | | 2014 | | | 2015 | | | 2014 | |
| $93,281,069 | | $ | 64,772,682 | | | $ | 494,775,678 | | | $ | 185,144,942 | | | $ | 588,056,747 | | | $ | 249,917,624 | |
As of December 31, 2015, the components of distributable earnings (accumulated losses) on a federal income tax basis were as follows:
| | | | | | | | | | | | | | | | |
Undistributed
Ordinary
Income | | Undistributed
Long-Term
Capital Gain | | | Net
Unrealized
Appreciation | | | Other
Accumulated
Capital Losses | | | Total | |
| $72,286,217 | | $ | 268,954,575 | | | $ | 644,595,984 | | | $ | — | | | $ | 985,836,776 | |
MSF-17
Metropolitan Series Fund
MFS Value Portfolio
Notes to Financial Statements—June 30, 2016—(Continued)
The Portfolio utilizes the provisions of the federal income tax laws that provide for the carryforward of capital losses for prior years, offsetting such losses against any future realized capital gains. Under the Regulated Investment Company Modernization Act of 2010 (the “Act”), net capital losses recognized after December 22, 2010 may be carried forward indefinitely and their character is retained as short-term and/or long-term losses. Previously, net capital losses were carried forward for up to eight years and treated as short-term losses. As a transition rule, the Act requires that post-enactment net capital losses be used before pre-enactment net capital losses.
As of December 31, 2015, the Portfolio had no post-enactment accumulated capital losses and no pre-enactment accumulated capital loss carryforwards.
MSF-18
Metropolitan Series Fund
MSCI EAFE Index Portfolio
Managed by MetLife Investment Advisors, LLC
Portfolio Manager Commentary*
PERFORMANCE
For the six month period ended June 30, 2016, the Class A, B, E and G shares of the MSCI EAFE Index Portfolio returned -2.89%, -3.05%, -3.08%, and -3.10%, respectively. The Portfolio’s benchmark, the MSCI EAFE Index1, returned -4.42%.
MARKET ENVIRONMENT / CONDITIONS
During the first quarter, equity markets were volatile as investors worried about a global economic slowdown and macroeconomic data continued to disappoint. U.S. retail sales, industrial production, and housing starts were all weaker than expected. In March, equity indexes rallied on central bank intervention and improving commodity prices. The People’s Bank of China cut reserve requirement ratios, the European Central Bank cut rates further and the Federal Reserve Bank (“Fed”) lowered the expected number of rate increases for 2016. During the second quarter, equity markets continued to move higher as positive macroeconomic data and recovering oil prices contrasted with uncertainty about a potential Fed rate hike and the United Kingdom referendum on European Union membership. In May, U.S. construction spending hit a record high and U.S. new, existing, and pending home sales and durable goods orders were all better than expected. On June 23, United Kingdom voters chose to “Leave” the European Union and on the day after the unexpected vote outcome, the price of gold had its largest single day increase since 2008, the British pound fell to its lowest level in 30 years, and equity markets around the world fell as much as 8%. However, global equity markets remained resilient and rallied the last three days of the quarter as concerns about the referendum abated and volatility declined.
The U.S. Dollar weakened during the six-month period, which positively impacted the U.S. investors’ MSCI EAFE Index return versus the local currency return by approximately 2.8%.
Seven of the twenty-one countries comprising the MSCI EAFE Index experienced positive returns for the first six months of 2016. New Zealand (0.2%) beginning weight in the benchmark), up 19.3%, was the best performing country. Singapore (1.3% beginning weight), up 5.4%, and Norway (0.6% beginning weight), up 5.0%, were the next best-performing countries. Italy (2.4% beginning weight), down 20.4%, and Ireland (0.4% beginning weight), down 13.9% were the worst performing countries.
The stocks in the MSCI EAFE Index with the largest positive impact on the benchmark return for the first half of the year were Royal Dutch Shell Class A, up 26.6%, Royal Dutch Shell Class B, up 26.4%, and British American Tobacco, up 19.5%. The stocks with the largest negative impact were Mitsubishi UFJ Financial Group, down 28.2%, Toyota Motor, down 19.5%, and HSBC Holdings, down 17.3%.
PORTFOLIO REVIEW / PERIOD END POSITIONING
The Portfolio is managed utilizing a stratified sampling strategy versus the MSCI EAFE Index. This strategy seeks to replicate the performance of the Index by owning a subset of Index constituents and neutralizing exposures across countries. The Portfolio is periodically rebalanced for compositional changes in the MSCI EAFE Index. Factors that impact tracking error include sampling, fair value pricing, transaction costs, cash drag, securities lending, NAV rounding, contributions and withdrawals.
Stacey Lituchy
Norman Hu
Mirsad Usejnoski
Portfolio Managers
MetLife Investment Advisors, LLC
* This commentary may include statements that constitute “forward-looking statements” under the U.S. securities laws. Forward-looking statements include, among other things, projections, estimates, and information about possible or future results related to the Portfolio, market or regulatory developments. The views expressed above are not guarantees of future performance or economic results and involve certain risks, uncertainties and assumptions that could cause actual outcomes and results to differ materially from the views expressed herein. The views expressed above are subject to change at any time based upon economic, market, or other conditions and the subadvisory firm undertakes no obligation to update the views expressed herein. Any discussions of specific securities should not be considered a recommendation to buy or sell those securities. The views expressed above (including any forward-looking statement) may not be relied upon as investment advice or as an indication of the Portfolio’s trading intent. Information about the Portfolio’s holdings, asset allocation or country diversification is historical and is not an indication of future Portfolio composition, which may vary. Direct investment in any index is not possible. The performance of any index mentioned in this commentary has not been adjusted for ongoing management, distribution and operating expenses, and sales charges applicable to mutual fund investments. In addition, the returns do not reflect additional fees charged by separate accounts or variable insurance contracts that an investor in the Portfolio may pay. If these additional fees were reflected, performance would have been lower.
MSF-1
Metropolitan Series Fund
MSCI EAFE Index Portfolio
A $10,000 INVESTMENT COMPARED TO THE MSCI EAFE INDEX

SIX MONTH RETURN & AVERAGE ANNUAL RETURNS (%) AS OF JUNE 30, 2016
| | | | | | | | | | | | | | | | | | | | |
| | | 6 Month | | | 1 Year | | | 5 Year | | | 10 Year | | | Since Inception2 | |
| MSCI EAFE Index Portfolio | | | | | | | | | | | | | | | | | | | | |
Class A | | | -2.89 | | | | -9.53 | | | | 1.62 | | | | 1.53 | | | | — | |
Class B | | | -3.05 | | | | -9.72 | | | | 1.37 | | | | 1.28 | | | | — | |
Class E | | | -3.08 | | | | -9.73 | | | | 1.44 | | | | 1.37 | | | | — | |
Class G | | | -3.10 | | | | -9.80 | | | | 1.30 | | | | — | | | | 7.62 | |
| MSCI EAFE Index | | | -4.42 | | | | -10.16 | | | | 1.68 | | | | 1.58 | | | | — | |
1 The MSCI EAFE (Europe, Australasia, Far East) Index is a free float-adjusted market capitalization index that is designed to measure the equity market performance of developed markets, excluding the U.S. & Canada.
2 Inception dates of the Class A, Class B, Class E and Class G shares are 11/9/98, 1/2/01, 5/1/01 and 4/28/09, respectively.
Portfolio performance is calculated including reinvestment of all income and capital gain distributions. Performance numbers are net of all Portfolio expenses but do not include any insurance, sales, separate account or administrative charges of variable annuity or life insurance contracts or any additional expenses that participants may bear relating to the operations of their plans. If these charges were included, the returns would be lower. The performance of any index referenced above has not been adjusted for ongoing management, distribution and operating expenses, and sales charges applicable to mutual fund investments. Direct investment in any index is not possible. The performance of Class A shares, as set forth in the line graph above, will differ from that of other classes because of the difference in expenses paid by policyholders investing in the different share classes.
This information represents past performance and is not indicative of future results. Investment return and principal value may fluctuate so that shares, upon redemption, may be worth more or less than the original cost.
PORTFOLIO COMPOSITION AS OF JUNE 30, 2016
Top Holdings
| | | | |
| | | % of
Net Assets | |
| iShares MSCI EAFE ETF | | | 3.7 | |
| Nestle S.A. | | | 2.0 | |
| Novartis AG | | | 1.5 | |
| Roche Holding AG | | | 1.5 | |
| Toyota Motor Corp. | | | 1.1 | |
| HSBC Holdings plc | | | 1.0 | |
| British American Tobacco plc | | | 1.0 | |
| Royal Dutch Shell plc - A Shares | | | 0.9 | |
| BP plc | | | 0.9 | |
| Total S.A. | | | 0.8 | |
Top Countries
| | | | |
| | | % of
Net Assets | |
| Japan | | | 22.0 | |
| United Kingdom | | | 18.0 | |
| Switzerland | | | 8.9 | |
| France | | | 8.7 | |
| Germany | | | 8.2 | |
| Australia | | | 7.0 | |
| Hong Kong | | | 3.1 | |
| Spain | | | 2.8 | |
| Netherlands | | | 2.7 | |
| Sweden | | | 2.6 | |
MSF-2
Metropolitan Series Fund
MSCI EAFE Index Portfolio
Understanding Your Portfolio’s Expenses (Unaudited)
Shareholder Expense Example
As a shareholder of the Portfolio, you incur ongoing costs, including management fees; distribution and service (12b-1) fees; and other Portfolio expenses. This example is intended to help you understand your ongoing costs (in dollars) (referred to as “expenses”) of investing in the Portfolio and compare these costs with the ongoing costs of investing in other mutual funds. The example is based on an investment of $1,000 invested at the beginning of the period and held for the entire period, January 1, 2016 through June 30, 2016.
Actual Expenses
The first line for each share class of the Portfolio in the table below provides information about actual account values and actual expenses. You may use the information in this line, together with the amount you invested in the particular share class of the Portfolio, to estimate the expenses that you paid over the period. Simply divide your account value by $1,000 (for example, an $8,600 account value divided by $1,000 = 8.6), then multiply the result by the number in the first line under the heading entitled “Expenses Paid During Period” to estimate the expenses you paid on your account during this period.
Hypothetical Example for Comparison Purposes
The second line for each share class of the Portfolio in the table below provides information about hypothetical account values and hypothetical expenses based on the Portfolio’s actual expense ratio and an assumed rate of return of 5% per year before expenses, which is not the Portfolio’s actual return. The hypothetical account values and expenses may not be used to estimate the actual ending account balance or expenses you paid for the period. You may use this information to compare the ongoing costs of investing in the Portfolio and other funds. To do so, compare this 5% hypothetical example with the 5% hypothetical examples that appear in the shareholder reports of the other funds.
Please note that the expenses shown in the table are meant to highlight your ongoing costs only and do not reflect any fees or charges of your variable insurance product or any additional expenses that participants in certain eligible qualified plans may bear relating to the operations of their plan. Therefore, the second line for each share class in the table is useful in comparing ongoing costs only, and will not help you determine the relative total costs of owning different funds. In addition, if these other costs were included, your costs would have been higher.
| | | | | | | | | | | | | | | | | | |
MSCI EAFE Index Portfolio | | | | Annualized
Expense
Ratio | | | Beginning
Account Value
January 1,
2016 | | | Ending
Account Value
June 30,
2016 | | | Expenses Paid
During Period**
January 1, 2016
to
June 30,
2016 | |
Class A(a) | | Actual | | | 0.38 | % | | $ | 1,000.00 | | | $ | 971.10 | | | $ | 1.86 | |
| | Hypothetical* | | | 0.38 | % | | $ | 1,000.00 | | | $ | 1,022.97 | | | $ | 1.91 | |
| | | | | |
Class B(a) | | Actual | | | 0.63 | % | | $ | 1,000.00 | | | $ | 969.50 | | | $ | 3.09 | |
| | Hypothetical* | | | 0.63 | % | | $ | 1,000.00 | | | $ | 1,021.73 | | | $ | 3.17 | |
| | | | | |
Class E(a) | | Actual | | | 0.53 | % | | $ | 1,000.00 | | | $ | 969.20 | | | $ | 2.59 | |
| | Hypothetical* | | | 0.53 | % | | $ | 1,000.00 | | | $ | 1,022.23 | | | $ | 2.66 | |
| | | | | |
Class G(a) | | Actual | | | 0.68 | % | | $ | 1,000.00 | | | $ | 969.00 | | | $ | 3.33 | |
| | Hypothetical* | | | 0.68 | % | | $ | 1,000.00 | | | $ | 1,021.48 | | | $ | 3.42 | |
* Hypothetical assumes a rate of return of 5% per year before expenses.
** Expenses paid are equal to the Portfolio’s annualized expense ratio for the most recent six month period, as shown above, multiplied by the average account value over the period, multiplied by the number of days (182 days) in the most recent fiscal half-year, divided by 366 (to reflect the one-half year period).
(a) The annualized expense ratio shown reflects the impact of the management fee waiver as described in Note 6 of the Notes to Financial Statements.
MSF-3
Metropolitan Series Fund
MSCI EAFE Index Portfolio
Schedule of Investments as of June 30, 2016 (Unaudited)
Common Stocks—93.7% of Net Assets
| | | | | | | | |
| Security Description | | Shares | | | Value | |
| | |
Australia—7.0% | | | | | | | | |
AGL Energy, Ltd. | | | 49,491 | | | $ | 713,053 | |
Alumina, Ltd. (a) | | | 191,453 | | | | 186,907 | |
Amcor, Ltd. | | | 95,202 | | | | 1,062,999 | |
AMP, Ltd. | | | 234,994 | | | | 910,680 | |
APA Group | | | 98,264 | | | | 679,558 | |
Aristocrat Leisure, Ltd. | | | 41,217 | | | | 425,204 | |
Asciano, Ltd. | | | 48,897 | | | | 323,249 | |
ASX, Ltd. | | | 16,055 | | | | 548,879 | |
Aurizon Holdings, Ltd. | | | 157,842 | | | | 570,846 | |
AusNet Services | | | 138,423 | | | | 169,578 | |
Australia & New Zealand Banking Group, Ltd. | | | 230,051 | | | | 4,187,771 | |
Bank of Queensland, Ltd. | | | 24,917 | | | | 198,171 | |
Bendigo and Adelaide Bank, Ltd. | | | 35,779 | | | | 259,092 | |
BHP Billiton plc | | | 172,349 | | | | 2,176,945 | |
BHP Billiton, Ltd. | | | 251,544 | | | | 3,576,949 | |
Boral, Ltd. | | | 61,162 | | | | 286,144 | |
Brambles, Ltd. | | | 129,540 | | | | 1,200,086 | |
Caltex Australia, Ltd. | | | 19,432 | | | | 463,511 | |
Challenger, Ltd. | | | 44,035 | | | | 285,402 | |
CIMIC Group, Ltd. | | | 8,428 | | | | 225,353 | |
Coca-Cola Amatil, Ltd. | | | 42,510 | | | | 261,920 | |
Cochlear, Ltd. | | | 5,478 | | | | 496,063 | |
Commonwealth Bank of Australia | | | 135,072 | | | | 7,567,755 | |
Computershare, Ltd. | | | 41,806 | | | | 287,500 | |
Crown Resorts, Ltd. | | | 29,464 | | | | 278,322 | |
CSL, Ltd. | | | 37,261 | | | | 3,127,938 | |
Dexus Property Group (REIT) | | | 77,269 | | | | 520,982 | |
Domino’s Pizza Enterprises, Ltd. | | | 4,938 | | | | 252,030 | |
DUET Group (b) | | | 178,971 | | | | 334,421 | |
Fortescue Metals Group, Ltd. | | | 100,245 | | | | 269,376 | |
Goodman Group (REIT) | | | 139,425 | | | | 742,026 | |
GPT Group (The) (REIT) | | | 140,241 | | | | 566,399 | |
Harvey Norman Holdings, Ltd. | | | 44,837 | | | | 155,199 | |
Healthscope, Ltd. | | | 134,432 | | | | 287,410 | |
Incitec Pivot, Ltd. | | | 152,808 | | | | 342,093 | |
Insurance Australia Group, Ltd. | | | 184,566 | | | | 756,823 | |
Lend Lease Group | | | 51,045 | | | | 483,304 | |
Macquarie Group, Ltd. | | | 24,276 | | | | 1,260,492 | |
Medibank Private, Ltd. | | | 199,900 | | | | 440,233 | |
Mirvac Group (REIT) | | | 298,553 | | | | 450,945 | |
National Australia Bank, Ltd. | | | 209,020 | | | | 4,008,887 | |
Newcrest Mining, Ltd. (c) | | | 60,310 | | | | 1,035,405 | |
Oil Search, Ltd. | | | 104,563 | | | | 524,970 | |
Orica, Ltd. | | | 26,176 | | | | 242,117 | |
Origin Energy, Ltd. | | | 123,698 | | | | 539,421 | |
QBE Insurance Group, Ltd. | | | 110,125 | | | | 862,916 | |
Ramsay Health Care, Ltd. | | | 10,616 | | | | 569,947 | |
REA Group, Ltd. (a) | | | 4,158 | | | | 184,833 | |
Rio Tinto, Ltd. | | | 31,918 | | | | 1,097,391 | |
Santos, Ltd. | | | 164,725 | | | | 580,323 | |
Scentre Group (REIT) | | | 417,733 | | | | 1,533,951 | |
Seek, Ltd. (a) | | | 22,233 | | | | 253,280 | |
Sonic Healthcare, Ltd. | | | 32,696 | | | | 527,680 | |
South32, Ltd. (c) | | | 393,402 | | | | 458,995 | |
Stockland (REIT) | | | 205,214 | | | | 721,597 | |
Suncorp Group, Ltd. | | | 108,776 | | | | 994,823 | |
Sydney Airport | | | 80,467 | | | | 417,430 | |
| | |
Australia—(Continued) | | | | | | | | |
Tabcorp Holdings, Ltd. | | | 54,472 | | | | 185,943 | |
Tatts Group, Ltd. | | | 123,533 | | | | 352,889 | |
Telstra Corp., Ltd. | | | 335,688 | | | | 1,394,768 | |
TPG Telecom, Ltd. | | | 21,838 | | | | 193,980 | |
Transurban Group | | | 159,204 | | | | 1,425,594 | |
Treasury Wine Estates, Ltd. | | | 68,905 | | | | 475,887 | |
Vicinity Centres (REIT) | | | 252,185 | | | | 626,478 | |
Vocus Communications, Ltd. (a) | | | 34,500 | | | | 244,133 | |
Wesfarmers, Ltd. | | | 88,016 | | | | 2,646,602 | |
Westfield Corp. (REIT) | | | 163,017 | | | | 1,296,723 | |
Westpac Banking Corp. | | | 266,028 | | | | 5,898,173 | |
Woodside Petroleum, Ltd. | | | 60,391 | | | | 1,222,172 | |
Woolworths, Ltd. | | | 104,896 | | | | 1,644,226 | |
| | | | | | | | |
| | | | | | | 69,493,142 | |
| | | | | | | | |
| | |
Austria—0.2% | | | | | | | | |
Andritz AG | | | 6,601 | | | | 313,990 | |
Erste Group Bank AG (c) | | | 22,499 | | | | 515,071 | |
OMV AG | | | 12,416 | | | | 348,197 | |
Voestalpine AG (a) | | | 9,525 | | | | 319,076 | |
| | | | | | | | |
| | | | | | | 1,496,334 | |
| | | | | | | | |
| | |
Belgium—1.4% | | | | | | | | |
Ageas | | | 15,573 | | | | 538,620 | |
Anheuser-Busch InBev S.A. | | | 63,583 | | | | 8,366,996 | |
Colruyt S.A. | | | 5,430 | | | | 300,011 | |
Delhaize Group S.A. | | | 7,921 | | | | 837,865 | |
Groupe Bruxelles Lambert S.A. | | | 5,864 | | | | 479,936 | |
KBC Groep NV | | | 19,071 | | | | 935,970 | |
Proximus | | | 14,232 | | | | 451,172 | |
Solvay S.A. | | | 5,735 | | | | 533,687 | |
Telenet Group Holding NV (c) | | | 4,184 | | | | 191,184 | |
UCB S.A. | | | 9,619 | | | | 720,034 | |
Umicore S.A. | | | 8,519 | | | | 439,438 | |
| | | | | | | | |
| | | | | | | 13,794,913 | |
| | | | | | | | |
| | |
Denmark—1.9% | | | | | | | | |
AP Moeller - Maersk A/S - Class A | | | 274 | | | | 348,926 | |
AP Moeller - Maersk A/S - Class B | | | 566 | | | | 746,842 | |
Carlsberg A/S - Class B | | | 7,997 | | | | 759,502 | |
Chr Hansen Holding A/S | | | 7,473 | | | | 491,091 | |
Coloplast A/S - Class B (a) | | | 9,594 | | | | 716,718 | |
Danske Bank A/S | | | 58,351 | | | | 1,547,417 | |
DSV A/S | | | 16,462 | | | | 692,671 | |
Genmab A/S (c) | | | 4,236 | | | | 772,221 | |
ISS A/S | | | 13,228 | | | | 495,703 | |
Novo Nordisk A/S - Class B | | | 146,945 | | | | 7,908,347 | |
Novozymes A/S - B Shares | | | 17,609 | | | | 849,241 | |
Pandora A/S | | | 9,197 | | | | 1,249,405 | |
TDC A/S | | | 59,338 | | | | 290,667 | |
Tryg A/S | | | 8,735 | | | | 156,023 | |
Vestas Wind Systems A/S | | | 18,883 | | | | 1,282,471 | |
William Demant Holding A/S (c) | | | 9,405 | | | | 183,045 | |
| | | | | | | | |
| | | | | | | 18,490,290 | |
| | | | | | | | |
See accompanying notes to financial statements.
MSF-4
Metropolitan Series Fund
MSCI EAFE Index Portfolio
Schedule of Investments as of June 30, 2016 (Unaudited)
Common Stocks—(Continued)
| | | | | | | | |
| Security Description | | Shares | | | Value | |
| | |
Finland—0.9% | | | | | | | | |
Elisa Oyj | | | 13,058 | | | $ | 502,232 | |
Fortum Oyj | | | 31,487 | | | | 505,018 | |
Kone Oyj - Class B | | | 26,344 | | | | 1,217,682 | |
Metso Oyj (a) | | | 7,511 | | | | 177,668 | |
Neste Oyj | | | 9,073 | | | | 325,426 | |
Nokia Oyj (a) | | | 451,151 | | | | 2,569,807 | |
Nokian Renkaat Oyj | | | 10,639 | | | | 380,440 | |
Orion Oyj - Class B | | | 9,644 | | | | 375,038 | |
Sampo Oyj - A Shares | | | 35,348 | | | | 1,445,735 | |
Stora Enso Oyj - R Shares | | | 40,497 | | | | 326,662 | |
UPM-Kymmene Oyj | | | 42,203 | | | | 774,498 | |
Wartsila Oyj Abp | | | 12,999 | | | | 532,547 | |
| | | | | | | | |
| | | | | | | 9,132,753 | |
| | | | | | | | |
| | |
France—8.7% | | | | | | | | |
Accor S.A. | | | 13,973 | | | | 542,309 | |
Aeroports de Paris | | | 2,209 | | | | 244,588 | |
Air Liquide S.A. | | | 26,902 | | | | 2,822,413 | |
Alstom S.A. (c) | | | 13,067 | | | | 305,396 | |
Arkema S.A. | | | 5,073 | | | | 391,903 | |
Atos SE | | | 6,339 | | | | 530,060 | |
AXA S.A. | | | 155,873 | | | | 3,134,812 | |
BNP Paribas S.A. | | | 82,830 | | | | 3,727,895 | |
Bollore S.A. | | | 61,600 | | | | 210,382 | |
Bouygues S.A. | | | 14,921 | | | | 431,716 | |
Bureau Veritas S.A. | | | 19,643 | | | | 415,174 | |
Cap Gemini S.A. | | | 12,372 | | | | 1,080,894 | |
Carrefour S.A. | | | 46,421 | | | | 1,149,692 | |
Casino Guichard Perrachon S.A. | | | 4,364 | | | | 244,118 | |
Christian Dior SE | | | 4,654 | | | | 754,734 | |
Cie de St-Gobain | | | 40,023 | | | | 1,533,789 | |
Cie Generale des Etablissements Michelin | | | 14,364 | | | | 1,362,237 | |
CNP Assurances | | | 10,520 | | | | 156,092 | |
Credit Agricole S.A. | | | 81,041 | | | | 687,190 | |
Danone S.A. | | | 46,007 | | | | 3,247,582 | |
Dassault Systemes S.A. | | | 10,162 | | | | 776,807 | |
Edenred | | | 13,868 | | | | 286,448 | |
Eiffage S.A. | | | 4,533 | | | | 324,067 | |
Electricite de France S.A. (a) | | | 17,389 | | | | 213,977 | |
Engie S.A. | | | 120,464 | | | | 1,946,207 | |
Essilor International S.A. | | | 16,817 | | | | 2,240,643 | |
Eurazeo S.A. | | | 2,479 | | | | 148,124 | |
Eutelsat Communications S.A. | | | 14,990 | | | | 286,001 | |
Fonciere Des Regions (REIT) | | | 3,163 | | | | 281,880 | |
Gecina S.A. (REIT) | | | 3,255 | | | | 445,407 | |
Groupe Eurotunnel SE | | | 32,808 | | | | 349,533 | |
Hermes International | | | 2,256 | | | | 851,135 | |
ICADE (REIT) | | | 3,450 | | | | 245,588 | |
Iliad S.A. | | | 2,335 | | | | 475,162 | |
Imerys S.A. | | | 2,253 | | | | 144,103 | |
Ingenico Group S.A. | | | 4,093 | | | | 480,086 | |
JCDecaux S.A. (a) | | | 4,706 | | | | 159,861 | |
Kering | | | 5,893 | | | | 962,108 | |
Klepierre (REIT) | | | 16,658 | | | | 743,973 | |
L’Oreal S.A. | | | 19,696 | | | | 3,771,642 | |
Lagardere SCA | | | 8,303 | | | | 182,435 | |
| | |
France—(Continued) | | | | | | | | |
Legrand S.A. | | | 20,811 | | | | 1,074,903 | |
LVMH Moet Hennessy Louis Vuitton SE | | | 21,849 | | | | 3,311,888 | |
Natixis S.A. | | | 80,165 | | | | 308,228 | |
Numericable-SFR S.A. | | | 9,888 | | | | 250,554 | |
Orange S.A. | | | 155,617 | | | | 2,544,598 | |
Pernod-Ricard S.A. (a) | | | 17,290 | | | | 1,927,967 | |
Peugeot S.A. (c) | | | 40,345 | | | | 491,954 | |
Publicis Groupe S.A. | | | 15,420 | | | | 1,045,805 | |
Remy Cointreau S.A. | | | 1,860 | | | | 160,425 | |
Renault S.A. | | | 15,031 | | | | 1,146,579 | |
Rexel S.A. | | | 20,012 | | | | 252,925 | |
Safran S.A. | | | 24,884 | | | | 1,693,014 | |
Sanofi | | | 92,351 | | | | 7,771,226 | |
Schneider Electric SE | | | 43,651 | | | | 2,586,109 | |
SCOR SE | | | 11,686 | | | | 352,424 | |
SES S.A. | | | 24,380 | | | | 527,200 | |
Societe BIC S.A. | | | 2,149 | | | | 304,208 | |
Societe Generale S.A. | | | 60,631 | | | | 1,918,180 | |
Sodexo S.A. | | | 7,921 | | | | 854,143 | |
Suez | | | 22,682 | | | | 357,629 | |
Technip S.A. | | | 9,722 | | | | 529,324 | |
Thales S.A. | | | 7,807 | | | | 655,923 | |
Total S.A. | | | 173,540 | | | | 8,377,436 | |
Unibail-Rodamco SE (REIT) (a) | | | 7,985 | | | | 2,094,278 | |
Valeo S.A. | | | 20,400 | | | | 912,100 | |
Veolia Environnement S.A. | | | 38,440 | | | | 835,993 | |
Vinci S.A. | | | 39,654 | | | | 2,827,279 | |
Vivendi S.A. | | | 94,245 | | | | 1,787,605 | |
Wendel S.A. | | | 2,267 | | | | 236,484 | |
Zodiac Aerospace | | | 14,929 | | | | 351,668 | |
| | | | | | | | |
| | | | | | | 85,776,212 | |
| | | | | | | | |
| | |
Germany—7.7% | | | | | | | | |
adidas AG | | | 14,905 | | | | 2,127,820 | |
Allianz SE | | | 36,569 | | | | 5,215,692 | |
Axel Springer SE | | | 3,006 | | | | 157,699 | |
BASF SE | | | 72,707 | | | | 5,552,602 | |
Bayer AG | | | 65,388 | | | | 6,585,941 | |
Bayerische Motoren Werke AG | | | 26,677 | | | | 1,957,243 | |
Beiersdorf AG | | | 8,429 | | | | 797,364 | |
Brenntag AG | | | 12,657 | | | | 612,307 | |
Commerzbank AG | | | 87,047 | | | | 565,201 | |
Continental AG | | | 8,442 | | | | 1,588,205 | |
Covestro AG | | | 5,610 | | | | 250,249 | |
Daimler AG | | | 77,142 | | | | 4,605,392 | |
Deutsche Bank AG (c) | | | 109,061 | | | | 1,485,581 | |
Deutsche Boerse AG | | | 14,683 | | | | 1,203,495 | |
Deutsche Lufthansa AG (a) | | | 17,782 | | | | 207,245 | |
Deutsche Post AG | | | 76,616 | | | | 2,141,323 | |
Deutsche Telekom AG | | | 252,157 | | | | 4,294,970 | |
Deutsche Wohnen AG | | | 28,299 | | | | 961,422 | |
E.ON SE | | | 159,825 | | | | 1,600,720 | |
Evonik Industries AG | | | 10,400 | | | | 309,888 | |
Fraport AG Frankfurt Airport Services Worldwide (a) | | | 4,331 | | | | 231,638 | |
Fresenius Medical Care AG & Co. KGaA | | | 17,215 | | | | 1,491,150 | |
See accompanying notes to financial statements.
MSF-5
Metropolitan Series Fund
MSCI EAFE Index Portfolio
Schedule of Investments as of June 30, 2016 (Unaudited)
Common Stocks—(Continued)
| | | | | | | | |
| Security Description | | Shares | | | Value | |
| | |
Germany—(Continued) | | | | | | | | |
Fresenius SE & Co. KGaA | | | 32,401 | | | $ | 2,390,057 | |
GEA Group AG | | | 14,300 | | | | 672,849 | |
Hannover Rueck SE | | | 5,368 | | | | 561,501 | |
HeidelbergCement AG | | | 10,797 | | | | 810,438 | |
Henkel AG & Co. KGaA | | | 7,933 | | | | 853,370 | |
HOCHTIEF AG | | | 1,646 | | | | 212,259 | |
Hugo Boss AG | | | 4,934 | | | | 279,055 | |
Infineon Technologies AG | | | 85,888 | | | | 1,235,586 | |
K&S AG (a) | | | 14,121 | | | | 290,040 | |
LANXESS AG | | | 7,402 | | | | 323,806 | |
Linde AG | | | 15,006 | | | | 2,090,843 | |
MAN SE | | | 3,022 | | | | 307,971 | |
Merck KGaA | | | 10,657 | | | | 1,086,142 | |
Metro AG | | | 15,747 | | | | 482,241 | |
Muenchener Rueckversicherungs-Gesellschaft AG | | | 13,047 | | | | 2,182,879 | |
OSRAM Licht AG | | | 8,388 | | | | 433,959 | |
ProSiebenSat.1 Media SE | | | 16,646 | | | | 727,644 | |
RTL Group S.A. | | | 2,700 | | | | 220,452 | |
RWE AG (c) | | | 34,949 | | | | 552,876 | |
SAP SE | | | 77,711 | | | | 5,814,990 | |
Siemens AG | | | 60,557 | | | | 6,210,046 | |
Symrise AG | | | 8,990 | | | | 613,246 | |
Telefonica Deutschland Holding AG | | | 58,800 | | | | 242,419 | |
ThyssenKrupp AG | | | 32,245 | | | | 644,322 | |
TUI AG | | | 37,093 | | | | 422,876 | |
United Internet AG | | | 8,781 | | | | 362,698 | |
Volkswagen AG | | | 2,495 | | | | 335,597 | |
Vonovia SE | | | 36,786 | | | | 1,343,967 | |
Zalando SE (c) | | | 6,525 | | | | 172,923 | |
| | | | | | | | |
| | | | | | | 75,820,199 | |
| | | | | | | | |
| | |
Hong Kong—3.1% | | | | | | | | |
AIA Group, Ltd. | | | 969,200 | | | | 5,827,774 | |
ASM Pacific Technology, Ltd. (a) | | | 19,600 | | | | 141,158 | |
Bank of East Asia, Ltd. (The) (a) | | | 103,920 | | | | 403,185 | |
BOC Hong Kong Holdings, Ltd. | | | 290,465 | | | | 876,179 | |
Cathay Pacific Airways, Ltd. | | | 87,000 | | | | 127,636 | |
Cheung Kong Infrastructure Holdings, Ltd. | | | 57,000 | | | | 489,686 | |
Cheung Kong Property Holdings, Ltd. | | | 214,440 | | | | 1,352,633 | |
CK Hutchison Holdings, Ltd. | | | 212,440 | | | | 2,337,957 | |
CLP Holdings, Ltd. | | | 131,377 | | | | 1,344,881 | |
Galaxy Entertainment Group, Ltd. | | | 181,000 | | | | 540,475 | |
Hang Lung Properties, Ltd. | | | 161,000 | | | | 327,715 | |
Hang Seng Bank, Ltd. | | | 60,800 | | | | 1,044,462 | |
Henderson Land Development Co., Ltd. | | | 98,093 | | | | 555,857 | |
HK Electric Investments & HK Electric Investments, Ltd. (144A) | | | 206,500 | | | | 192,687 | |
HKT Trust & HKT, Ltd. | | | 189,980 | | | | 274,616 | |
Hong Kong & China Gas Co., Ltd. | | | 646,116 | | | | 1,181,869 | |
Hong Kong Exchanges and Clearing, Ltd. | | | 90,200 | | | | 2,200,563 | |
Hongkong Land Holdings, Ltd. | | | 95,400 | | | | 583,100 | |
Hysan Development Co., Ltd. | | | 45,000 | | | | 200,377 | |
Jardine Matheson Holdings, Ltd. | | | 19,700 | | | | 1,153,612 | |
Li & Fung, Ltd. (a) | | | 429,600 | | | | 209,724 | |
Link REIT (REIT) | | | 181,141 | | | | 1,239,231 | |
Melco Crown Entertainment, Ltd. (ADR) | | | 16,000 | | | | 201,280 | |
| | |
Hong Kong—(Continued) | | | | | | | | |
MTR Corp., Ltd. | | | 110,500 | | | | 562,163 | |
New World Development Co., Ltd. | | | 476,707 | | | | 484,883 | |
NWS Holdings, Ltd. | | | 177,000 | | | | 282,104 | |
PCCW, Ltd. | | | 481,000 | | | | 323,410 | |
Power Assets Holdings, Ltd. | | | 107,049 | | | | 982,812 | |
Sands China, Ltd. | | | 190,000 | | | | 642,030 | |
Sino Land Co., Ltd. | | | 289,600 | | | | 477,689 | |
Sun Hung Kai Properties, Ltd. | | | 115,250 | | | | 1,387,815 | |
Swire Pacific, Ltd. - Class A | | | 56,317 | | | | 641,256 | |
Swire Properties, Ltd. | | | 83,600 | | | | 223,032 | |
Techtronic Industries Co., Ltd. | | | 128,000 | | | | 535,847 | |
WH Group, Ltd. | | | 437,000 | | | | 345,782 | |
Wharf Holdings, Ltd. (The) | | | 104,976 | | | | 641,560 | |
Wheelock & Co., Ltd. | | | 68,000 | | | | 321,618 | |
Wynn Macau, Ltd. | | | 134,800 | | | | 196,423 | |
Yue Yuen Industrial Holdings, Ltd. | | | 50,500 | | | | 201,452 | |
| | | | | | | | |
| | | | | | | 31,056,533 | |
| | | | | | | | |
| | |
Ireland—1.1% | | | | | | | | |
Bank of Ireland (c) | | | 2,405,091 | | | | 501,744 | |
CRH plc | | | 67,317 | | | | 1,943,301 | |
DCC plc | | | 7,008 | | | | 618,752 | |
Experian plc | | | 79,898 | | | | 1,523,955 | |
James Hardie Industries plc | | | 40,250 | | | | 615,541 | |
Kerry Group plc - Class A | | | 13,003 | | | | 1,156,550 | |
Paddy Power Betfair plc | | | 6,200 | | | | 652,821 | |
Shire plc | | | 70,414 | | | | 4,354,135 | |
| | | | | | | | |
| | | | | | | 11,366,799 | |
| | | | | | | | |
| | |
Israel—0.7% | | | | | | | | |
Azrieli Group, Ltd. | | | 3,653 | | | | 155,811 | |
Bank Hapoalim B.M. | | | 86,396 | | | | 437,051 | |
Bank Leumi Le-Israel B.M. (c) | | | 120,713 | | | | 426,561 | |
Bezeq The Israeli Telecommunication Corp., Ltd. | | | 178,026 | | | | 354,390 | |
Check Point Software Technologies, Ltd. (a) (c) | | | 10,500 | | | | 836,640 | |
Israel Chemicals, Ltd. | | | 45,583 | | | | 178,421 | |
Nice Ltd. | | | 5,213 | | | | 328,051 | |
Taro Pharmaceutical Industries, Ltd. (c) | | | 1,300 | | | | 189,280 | |
Teva Pharmaceutical Industries, Ltd. | | | 73,053 | | | | 3,705,843 | |
| | | | | | | | |
| | | | | | | 6,612,048 | |
| | | | | | | | |
| | |
Italy—1.6% | | | | | | | | |
Assicurazioni Generali S.p.A. | | | 93,308 | | | | 1,099,850 | |
Atlantia S.p.A. | | | 31,412 | | | | 784,305 | |
Banca Monte dei Paschi di Siena S.p.A. (c) | | | 1 | | | | 0 | |
Enel S.p.A. | | | 626,740 | | | | 2,790,437 | |
Eni S.p.A. | | | 199,268 | | | | 3,220,593 | |
Exor S.p.A. | | | 10,723 | | | | 396,553 | |
Intesa Sanpaolo S.p.A. | | | 993,553 | | | | 1,907,821 | |
Intesa Sanpaolo S.p.A. - Risparmio Shares (a) | | | 65,400 | | | | 116,929 | |
Leonardo-Finmeccanica S.p.A. (c) | | | 28,782 | | | | 292,745 | |
Luxottica Group S.p.A. | | | 13,581 | | | | 662,454 | |
Mediobanca S.p.A. | | | 44,816 | | | | 260,641 | |
Poste Italiane S.p.A. (a) | | | 41,357 | | | | 275,132 | |
See accompanying notes to financial statements.
MSF-6
Metropolitan Series Fund
MSCI EAFE Index Portfolio
Schedule of Investments as of June 30, 2016 (Unaudited)
Common Stocks—(Continued)
| | | | | | | | |
| Security Description | | Shares | | | Value | |
| | |
Italy—(Continued) | | | | | | | | |
Prysmian S.p.A. | | | 13,126 | | | $ | 288,054 | |
Rizzoli Corriere Della Sera Mediagroup
S.p.A. (a) (c) | | | 4,794 | | | | 4,292 | |
Saipem S.p.A. (c) | | | 422,993 | | | | 170,857 | |
Snam S.p.A. | | | 193,977 | | | | 1,161,751 | |
Telecom Italia S.p.A. (c) | | | 866,636 | | | | 711,751 | |
Telecom Italia S.p.A. - Risparmio Shares (c) | | | 501,246 | | | | 322,842 | |
Terna Rete Elettrica Nazionale S.p.A. | | | 118,746 | | | | 662,372 | |
UniCredit S.p.A. | | | 392,223 | | | | 876,489 | |
Unione di Banche Italiane S.p.A. (a) | | | 67,193 | | | | 188,667 | |
UnipolSai S.p.A. | | | 64,500 | | | | 97,060 | |
| | | | | | | | |
| | | | | | | 16,291,595 | |
| | | | | | | | |
| | |
Japan—22.0% | | | | | | | | |
ABC-Mart, Inc. | | | 2,200 | | | | 147,379 | |
Acom Co., Ltd. (a) (c) | | | 31,200 | | | | 150,937 | |
Aeon Co., Ltd. | | | 51,500 | | | | 803,108 | |
AEON Financial Service Co., Ltd. | | | 8,400 | | | | 181,699 | |
Air Water, Inc. | | | 10,000 | | | | 147,376 | |
Aisin Seiki Co., Ltd. | | | 16,500 | | | | 674,160 | |
Ajinomoto Co., Inc. | | | 44,000 | | | | 1,039,677 | |
Alfresa Holdings Corp. | | | 12,000 | | | | 251,549 | |
Alps Electric Co., Ltd. | | | 13,100 | | | | 248,382 | |
Amada Holdings Co., Ltd. | | | 27,000 | | | | 274,803 | |
ANA Holdings, Inc. | | | 84,000 | | | | 239,901 | |
Aozora Bank, Ltd. | | | 77,000 | | | | 267,795 | |
Asahi Glass Co., Ltd. (a) | | | 72,000 | | | | 391,683 | |
Asahi Group Holdings, Ltd. | | | 30,700 | | | | 996,857 | |
Asahi Kasei Corp. | | | 97,000 | | | | 676,589 | |
Asics Corp. | | | 11,000 | | | | 185,861 | |
Astellas Pharma, Inc. | | | 165,500 | | | | 2,606,998 | |
Bandai Namco Holdings, Inc. | | | 16,000 | | | | 413,831 | |
Bank of Kyoto, Ltd. (The) | | | 22,000 | | | | 135,198 | |
Bridgestone Corp. (a) | | | 51,600 | | | | 1,658,538 | |
Brother Industries, Ltd. | | | 16,400 | | | | 176,142 | |
Calbee, Inc. | | | 5,500 | | | | 229,819 | |
Canon, Inc. (a) | | | 83,700 | | | | 2,404,063 | |
Casio Computer Co., Ltd. | | | 16,900 | | | | 243,088 | |
Central Japan Railway Co. | | | 11,700 | | | | 2,084,484 | |
Chiba Bank, Ltd. (The) | | | 49,000 | | | | 232,640 | |
Chubu Electric Power Co., Inc. | | | 57,000 | | | | 816,956 | |
Chugai Pharmaceutical Co., Ltd. (a) | | | 16,800 | | | | 600,826 | |
Chugoku Bank, Ltd. (The) | | | 12,000 | | | | 122,838 | |
Chugoku Electric Power Co., Inc. (The) | | | 23,700 | | | | 301,979 | |
Concordia Financial Group, Ltd. (c) | | | 83,000 | | | | 326,916 | |
Credit Saison Co., Ltd. | | | 10,500 | | | | 176,880 | |
CYBERDYNE, Inc. (a) (c) | | | 8,200 | | | | 184,818 | |
Dai Nippon Printing Co., Ltd. | | | 40,000 | | | | 447,182 | |
Dai-ichi Life Insurance Co., Ltd. (The) | | | 91,700 | | | | 1,023,388 | |
Daicel Corp. | | | 22,000 | | | | 229,036 | |
Daihatsu Motor Co., Ltd. | | | 14,000 | | | | 183,029 | |
Daiichi Sankyo Co., Ltd. | | | 49,000 | | | | 1,190,126 | |
Daikin Industries, Ltd. | | | 18,000 | | | | 1,509,554 | |
Daito Trust Construction Co., Ltd. | | | 6,200 | | | | 1,011,608 | |
Daiwa House Industry Co., Ltd. | | | 47,500 | | | | 1,395,161 | |
Daiwa Securities Group, Inc. | | | 126,000 | | | | 666,639 | |
| | |
Japan—(Continued) | | | | | | | | |
Denso Corp. | | | 40,100 | | | | 1,418,023 | |
Dentsu, Inc. | | | 16,600 | | | | 780,690 | |
Don Quijote Holdings Co., Ltd. | | | 8,200 | | | | 304,944 | |
East Japan Railway Co. | | | 26,900 | | | | 2,494,959 | |
Eisai Co., Ltd. | | | 19,300 | | | | 1,079,384 | |
Electric Power Development Co., Ltd. | | | 10,900 | | | | 255,014 | |
FamilyMart Co., Ltd. | | | 4,300 | | | | 262,917 | |
FANUC Corp. | | | 15,300 | | | | 2,492,850 | |
Fast Retailing Co., Ltd. | | | 4,200 | | | | 1,133,421 | |
Fuji Electric Co., Ltd. | | | 43,000 | | | | 181,737 | |
Fuji Heavy Industries, Ltd. | | | 45,600 | | | | 1,571,259 | |
FUJIFILM Holdings Corp. | | | 36,700 | | | | 1,427,551 | |
Fujitsu, Ltd. | | | 169,000 | | | | 623,370 | |
Fukuoka Financial Group, Inc. | | | 53,000 | | | | 175,460 | |
Hachijuni Bank, Ltd. (The) | | | 30,000 | | | | 131,166 | |
Hakuhodo DY Holdings, Inc. | | | 17,600 | | | | 211,292 | |
Hamamatsu Photonics KK | | | 9,600 | | | | 269,045 | |
Hankyu Hanshin Holdings, Inc. | | | 102,000 | | | | 764,171 | |
Hikari Tsushin, Inc. | | | 1,800 | | | | 151,428 | |
Hino Motors, Ltd. | | | 19,000 | | | | 189,255 | |
Hirose Electric Co., Ltd. | | | 2,300 | | | | 283,017 | |
Hiroshima Bank, Ltd. (The) | | | 38,000 | | | | 127,351 | |
Hisamitsu Pharmaceutical Co., Inc. | | | 4,500 | | | | 259,792 | |
Hitachi Chemical Co., Ltd. | | | 8,500 | | | | 158,602 | |
Hitachi High-Technologies Corp. | | | 5,500 | | | | 150,797 | |
Hitachi Metals, Ltd. | | | 20,000 | | | | 203,684 | |
Hitachi, Ltd. | | | 383,000 | | | | 1,602,568 | |
Hokuriku Electric Power Co. | | | 12,000 | | | | 149,151 | |
Honda Motor Co., Ltd. | | | 127,700 | | | | 3,245,494 | |
Hoshizaki Electric Co., Ltd. | | | 4,100 | | | | 402,532 | |
Hoya Corp. | | | 31,900 | | | | 1,143,244 | |
Hulic Co., Ltd. | | | 32,300 | | | | 340,877 | |
Idemitsu Kosan Co., Ltd. (a) | | | 7,200 | | | | 156,271 | |
IHI Corp. | | | 99,000 | | | | 266,910 | |
Iida Group Holdings Co., Ltd. | | | 12,700 | | | | 260,378 | |
Inpex Corp. | | | 71,100 | | | | 558,338 | |
Isetan Mitsukoshi Holdings, Ltd. | | | 26,900 | | | | 240,162 | |
Isuzu Motors, Ltd. | | | 54,500 | | | | 671,443 | |
ITOCHU Corp. | | | 124,100 | | | | 1,517,793 | |
J Front Retailing Co., Ltd. | | | 23,000 | | | | 239,092 | |
Japan Airlines Co., Ltd. | | | 8,400 | | | | 271,385 | |
Japan Exchange Group, Inc. | | | 46,400 | | | | 534,296 | |
Japan Post Bank Co., Ltd. | | | 30,800 | | | | 363,284 | |
Japan Post Holdings Co., Ltd. | | | 34,200 | | | | 416,783 | |
Japan Prime Realty Investment Corp. (REIT) (a) | | | 88 | | | | 379,373 | |
Japan Real Estate Investment Corp. (REIT) | | | 105 | | | | 650,502 | |
Japan Retail Fund Investment Corp. (REIT) | | | 202 | | | | 517,477 | |
Japan Tobacco, Inc. (a) | | | 86,200 | | | | 3,475,945 | |
JFE Holdings, Inc. (a) | | | 41,700 | | | | 543,160 | |
JGC Corp. | | | 14,000 | | | | 200,249 | |
Joyo Bank, Ltd. (The) (a) | | | 54,000 | | | | 202,614 | |
JSR Corp. | | | 19,100 | | | | 252,978 | |
JTEKT Corp. | | | 20,000 | | | | 226,975 | |
JX Holdings, Inc. | | | 160,000 | | | | 625,826 | |
Kajima Corp. | | | 80,000 | | | | 556,163 | |
Kakaku.com, Inc. (a) | | | 11,000 | | | | 218,270 | |
Kamigumi Co., Ltd. | | | 17,000 | | | | 157,233 | |
See accompanying notes to financial statements.
MSF-7
Metropolitan Series Fund
MSCI EAFE Index Portfolio
Schedule of Investments as of June 30, 2016 (Unaudited)
Common Stocks—(Continued)
| | | | | | | | |
| Security Description | | Shares | | | Value | |
| | |
Japan—(Continued) | | | | | | | | |
Kaneka Corp. | | | 22,000 | | | $ | 146,686 | |
Kansai Electric Power Co., Inc. (The) (c) | | | 55,000 | | | | 536,795 | |
Kansai Paint Co., Ltd. | | | 17,200 | | | | 348,758 | |
Kao Corp. | | | 40,000 | | | | 2,323,546 | |
Kawasaki Heavy Industries, Ltd. | | | 124,000 | | | | 349,257 | |
KDDI Corp. | | | 149,300 | | | | 4,574,793 | |
Keihan Holdings Co., Ltd. | | | 39,000 | | | | 271,206 | |
Keikyu Corp. | | | 36,000 | | | | 362,963 | |
Keio Corp. | | | 45,000 | | | | 425,656 | |
Keisei Electric Railway Co., Ltd. | | | 20,000 | | | | 258,200 | |
Keyence Corp. | | | 3,700 | | | | 2,511,894 | |
Kikkoman Corp. | | | 12,000 | | | | 442,016 | |
Kintetsu Group Holdings Co., Ltd. | | | 157,120 | | | | 674,931 | |
Kirin Holdings Co., Ltd. (a) | | | 62,000 | | | | 1,048,953 | |
Kobe Steel, Ltd. | | | 272,000 | | | | 222,913 | |
Koito Manufacturing Co., Ltd. | | | 10,100 | | | | 465,281 | |
Komatsu, Ltd. | | | 75,400 | | | | 1,318,462 | |
Konami Holdings Corp. | | | 7,300 | | | | 278,232 | |
Konica Minolta, Inc. | | | 37,000 | | | | 270,086 | |
Kose Corp. | | | 2,300 | | | | 194,285 | |
Kubota Corp. | | | 89,000 | | | | 1,199,854 | |
Kuraray Co., Ltd. | | | 24,500 | | | | 293,290 | |
Kurita Water Industries, Ltd. | | | 7,100 | | | | 159,009 | |
Kyocera Corp. | | | 24,900 | | | | 1,188,339 | |
Kyowa Hakko Kirin Co., Ltd. (a) | | | 20,000 | | | | 341,913 | |
Kyushu Electric Power Co., Inc. | | | 39,700 | | | | 398,251 | |
Kyushu Financial Group, Inc. | | | 26,400 | | | | 131,770 | |
Lawson, Inc. | | | 4,900 | | | | 391,020 | |
LIXIL Group Corp. | | | 24,500 | | | | 405,439 | |
M3, Inc. (a) | | | 18,600 | | | | 648,415 | |
Mabuchi Motor Co., Ltd. | | | 3,600 | | | | 152,134 | |
Makita Corp. | | | 9,500 | | | | 630,541 | |
Marubeni Corp. | | | 133,500 | | | | 603,228 | |
Marui Group Co., Ltd. | | | 16,000 | | | | 216,115 | |
Maruichi Steel Tube, Ltd. | | | 4,600 | | | | 161,478 | |
Mazda Motor Corp. | | | 41,400 | | | | 558,147 | |
McDonald’s Holdings Co. Japan, Ltd. (a) | | | 5,400 | | | | 147,503 | |
Medipal Holdings Corp. | | | 10,700 | | | | 176,730 | |
MEIJI Holdings Co., Ltd. | | | 10,200 | | | | 1,042,420 | |
Minebea Co., Ltd. | | | 24,000 | | | | 162,596 | |
Miraca Holdings, Inc. | | | 4,000 | | | | 173,509 | |
Mitsubishi Chemical Holdings Corp. | | | 116,300 | | | | 533,921 | |
Mitsubishi Corp. | | | 119,900 | | | | 2,110,216 | |
Mitsubishi Electric Corp. | | | 160,000 | | | | 1,909,631 | |
Mitsubishi Estate Co., Ltd. | | | 99,000 | | | | 1,822,032 | |
Mitsubishi Gas Chemical Co., Inc. | | | 26,000 | | | | 135,751 | |
Mitsubishi Heavy Industries, Ltd. | | | 260,000 | | | | 1,044,709 | |
Mitsubishi Materials Corp. | | | 79,000 | | | | 189,409 | |
Mitsubishi Motors Corp. | | | 44,999 | | | | 205,793 | |
Mitsubishi Tanabe Pharma Corp. | | | 22,000 | | | | 397,201 | |
Mitsubishi UFJ Financial Group, Inc. | | | 998,588 | | | | 4,480,323 | |
Mitsubishi UFJ Lease & Finance Co., Ltd. | | | 41,500 | | | | 159,582 | |
Mitsui & Co., Ltd. | | | 132,217 | | | | 1,575,835 | |
Mitsui Chemicals, Inc. | | | 57,000 | | | | 209,251 | |
Mitsui Fudosan Co., Ltd. | | | 69,000 | | | | 1,585,492 | |
Mitsui OSK Lines, Ltd. | | | 75,000 | | | | 160,040 | |
Mixi, Inc. | | | 3,800 | | | | 156,643 | |
| | |
Japan—(Continued) | | | | | | | | |
Mizuho Financial Group, Inc. | | | 1,845,900 | | | | 2,660,125 | |
MS&AD Insurance Group Holdings, Inc. | | | 40,200 | | | | 1,042,139 | |
Murata Manufacturing Co., Ltd. | | | 15,900 | | | | 1,795,372 | |
Nabtesco Corp. | | | 12,700 | | | | 305,251 | |
Nagoya Railroad Co., Ltd. (a) | | | 62,000 | | | | 350,113 | |
NEC Corp. | | | 225,000 | | | | 525,436 | |
Nexon Co., Ltd. | | | 10,300 | | | | 152,308 | |
NGK Insulators, Ltd. | | | 23,000 | | | | 464,832 | |
NGK Spark Plug Co., Ltd. | | | 12,000 | | | | 181,746 | |
NH Foods, Ltd. | | | 14,000 | | | | 342,378 | |
NHK Spring Co., Ltd. | | | 17,000 | | | | 138,086 | |
Nidec Corp. | | | 18,500 | | | | 1,405,569 | |
Nikon Corp. (a) | | | 31,200 | | | | 424,387 | |
Nintendo Co., Ltd. | | | 9,000 | | | | 1,292,615 | |
Nippon Building Fund, Inc. (REIT) | | | 118 | | | | 730,075 | |
Nippon Electric Glass Co., Ltd. | | | 31,000 | | | | 130,163 | |
Nippon Express Co., Ltd. | | | 59,000 | | | | 270,699 | |
Nippon Paint Holdings Co., Ltd. (a) | | | 13,000 | | | | 321,407 | |
Nippon Prologis REIT, Inc. (REIT) | | | 109 | | | | 266,457 | |
Nippon Steel & Sumitomo Metal Corp. | | | 62,100 | | | | 1,194,467 | |
Nippon Telegraph & Telephone Corp. | | | 54,900 | | | | 2,594,155 | |
Nippon Yusen KK | | | 142,000 | | | | 250,602 | |
Nissan Motor Co., Ltd. | | | 197,400 | | | | 1,790,474 | |
Nisshin Seifun Group, Inc. | | | 15,700 | | | | 252,611 | |
Nissin Foods Holdings Co., Ltd. | | | 4,700 | | | | 257,578 | |
Nitori Holdings Co., Ltd. | | | 6,900 | | | | 833,322 | |
Nitto Denko Corp. | | | 12,600 | | | | 799,772 | |
Nomura Holdings, Inc. | | | 303,200 | | | | 1,093,649 | |
Nomura Real Estate Holdings, Inc. | | | 13,100 | | | | 229,428 | |
Nomura Real Estate Master Fund, Inc. (REIT) | | | 260 | | | | 413,701 | |
Nomura Research Institute, Ltd. | | | 9,000 | | | | 329,941 | |
NSK, Ltd. | | | 39,000 | | | | 290,356 | |
NTT Data Corp. | | | 10,776 | | | | 511,144 | |
NTT DoCoMo, Inc. | | | 112,700 | | | | 3,052,474 | |
Obayashi Corp. | | | 58,000 | | | | 618,106 | |
Obic Co., Ltd. | | | 5,000 | | | | 275,145 | |
Odakyu Electric Railway Co., Ltd. | | | 55,000 | | | | 646,126 | |
OJI Holdings Corp. | | | 68,000 | | | | 262,498 | |
Olympus Corp. | | | 22,800 | | | | 853,830 | |
Omron Corp. | | | 16,400 | | | | 534,887 | |
Ono Pharmaceutical Co., Ltd. | | | 32,000 | | | | 1,390,920 | |
Oracle Corp. Japan | | | 3,000 | | | | 160,721 | |
Oriental Land Co., Ltd. | | | 17,300 | | | | 1,123,043 | |
ORIX Corp. | | | 110,600 | | | | 1,421,594 | |
Osaka Gas Co., Ltd. | | | 161,000 | | | | 620,566 | |
Otsuka Corp. | | | 3,700 | | | | 173,047 | |
Otsuka Holdings Co., Ltd. | | | 32,000 | | | | 1,484,300 | |
Panasonic Corp. | | | 183,800 | | | | 1,600,803 | |
Park24 Co., Ltd. | | | 7,400 | | | | 255,111 | |
Pola Orbis Holdings, Inc. (a) | | | 1,900 | | | | 178,104 | |
Rakuten, Inc. | | | 76,600 | | | | 831,613 | |
Recruit Holdings Co., Ltd. (a) | | | 22,500 | | | | 823,642 | |
Resona Holdings, Inc. | | | 169,400 | | | | 621,138 | |
Ricoh Co., Ltd. | | | 63,700 | | | | 554,077 | |
Rinnai Corp. | | | 2,800 | | | | 248,008 | |
Rohm Co., Ltd. | | | 6,700 | | | | 264,434 | |
Ryohin Keikaku Co., Ltd. | | | 1,800 | | | | 439,587 | |
See accompanying notes to financial statements.
MSF-8
Metropolitan Series Fund
MSCI EAFE Index Portfolio
Schedule of Investments as of June 30, 2016 (Unaudited)
Common Stocks—(Continued)
| | | | | | | | |
| Security Description | | Shares | | | Value | |
| | |
Japan—(Continued) | | | | | | | | |
Santen Pharmaceutical Co., Ltd. | | | 27,500 | | | $ | 431,684 | |
SBI Holdings, Inc. | | | 19,011 | | | | 189,209 | |
Secom Co., Ltd. | | | 17,500 | | | | 1,300,203 | |
Sega Sammy Holdings, Inc. | | | 13,300 | | | | 143,730 | |
Seibu Holdings, Inc. | | | 13,800 | | | | 234,535 | |
Seiko Epson Corp. | | | 20,000 | | | | 321,709 | |
Sekisui Chemical Co., Ltd. | | | 37,900 | | | | 467,620 | |
Sekisui House, Ltd. | | | 46,800 | | | | 819,750 | |
Seven & I Holdings Co., Ltd. | | | 59,100 | | | | 2,483,618 | |
Seven Bank, Ltd. | | | 43,000 | | | | 133,639 | |
Shikoku Electric Power Co., Inc. | | | 15,100 | | | | 178,974 | |
Shimadzu Corp. | | | 25,000 | | | | 374,524 | |
Shimamura Co., Ltd. | | | 1,400 | | | | 208,021 | |
Shimano, Inc. | | | 6,000 | | | | 915,311 | |
Shimizu Corp. | | | 54,000 | | | | 506,004 | |
Shin-Etsu Chemical Co., Ltd. | | | 30,900 | | | | 1,814,313 | |
Shinsei Bank, Ltd. | | | 160,000 | | | | 232,441 | |
Shionogi & Co., Ltd. | | | 25,200 | | | | 1,379,522 | |
Shiseido Co., Ltd. | | | 29,300 | | | | 760,433 | |
Shizuoka Bank, Ltd. (The) | | | 41,000 | | | | 289,992 | |
Showa Shell Sekiyu KK (a) | | | 15,400 | | | | 144,034 | |
SMC Corp. | | | 4,500 | | | | 1,104,913 | |
SoftBank Group Corp. | | | 76,100 | | | | 4,333,681 | |
Sohgo Security Services Co., Ltd. | | | 4,800 | | | | 237,464 | |
Sompo Japan Nipponkoa Holdings, Inc. | | | 26,999 | | | | 719,895 | |
Sony Corp. | | | 99,000 | | | | 2,916,408 | |
Sony Financial Holdings, Inc. | | | 12,800 | | | | 144,619 | |
Stanley Electric Co., Ltd. | | | 11,800 | | | | 252,236 | |
Start Today Co., Ltd. | | | 4,800 | | | | 256,733 | |
Sumitomo Chemical Co., Ltd. | | | 126,000 | | | | 520,110 | |
Sumitomo Corp. | | | 93,000 | | | | 936,878 | |
Sumitomo Dainippon Pharma Co., Ltd. (a) | | | 12,500 | | | | 217,205 | |
Sumitomo Electric Industries, Ltd. | | | 56,334 | | | | 746,382 | |
Sumitomo Heavy Industries, Ltd. | | | 39,000 | | | | 171,332 | |
Sumitomo Metal Mining Co., Ltd. | | | 40,000 | | | | 406,395 | |
Sumitomo Mitsui Financial Group, Inc. | | | 106,500 | | | | 3,073,473 | |
Sumitomo Mitsui Trust Holdings, Inc. | | | 265,262 | | | | 864,114 | |
Sumitomo Realty & Development Co., Ltd. | | | 28,000 | | | | 760,571 | |
Sumitomo Rubber Industries, Ltd. (a) | | | 12,500 | | | | 167,558 | |
Sundrug Co., Ltd. | | | 3,000 | | | | 280,767 | |
Suntory Beverage & Food, Ltd. | | | 10,400 | | | | 471,082 | |
Suruga Bank, Ltd. (a) | | | 13,000 | | | | 295,486 | |
Suzuken Co., Ltd. | | | 5,800 | | | | 183,533 | |
Suzuki Motor Corp. | | | 30,200 | | | | 820,402 | |
Sysmex Corp. | | | 12,200 | | | | 839,423 | |
T&D Holdings, Inc. | | | 49,200 | | | | 418,126 | |
Taiheiyo Cement Corp. | | | 82,000 | | | | 194,532 | |
Taisei Corp. | | | 80,000 | | | | 656,661 | |
Taisho Pharmaceutical Holdings Co., Ltd. | | | 3,000 | | | | 316,451 | |
Takashimaya Co., Ltd. | | | 19,000 | | | | 136,543 | |
Takeda Pharmaceutical Co., Ltd. | | | 56,400 | | | | 2,450,470 | |
TDK Corp. | | | 10,500 | | | | 588,917 | |
Teijin, Ltd. | | | 66,000 | | | | 218,814 | |
Terumo Corp. | | | 27,200 | | | | 1,160,904 | |
THK Co., Ltd. | | | 7,700 | | | | 131,512 | |
Tobu Railway Co., Ltd. | | | 73,000 | | | | 402,082 | |
Toho Co., Ltd. | | | 8,500 | | | | 235,673 | |
| | |
Japan—(Continued) | | | | | | | | |
Toho Gas Co., Ltd. (a) | | | 31,000 | | | | 253,873 | |
Tohoku Electric Power Co., Inc. | | | 39,800 | | | | 502,399 | |
Tokio Marine Holdings, Inc. | | | 53,500 | | | | 1,781,386 | |
Tokyo Electric Power Co. Holdings, Inc. (c) | | | 124,100 | | | | 526,761 | |
Tokyo Electron, Ltd. | | | 13,500 | | | | 1,142,467 | |
Tokyo Gas Co., Ltd. | | | 162,000 | | | | 669,420 | |
Tokyo Tatemono Co., Ltd. | | | 14,500 | | | | 174,349 | |
Tokyu Corp. | | | 96,000 | | | | 845,017 | |
Tokyu Fudosan Holdings Corp. | | | 37,000 | | | | 231,013 | |
TonenGeneral Sekiyu KK (a) | | | 18,000 | | | | 164,526 | |
Toppan Printing Co., Ltd. | | | 41,000 | | | | 353,794 | |
Toray Industries, Inc. | | | 111,000 | | | | 949,581 | |
Toshiba Corp. (a) (c) | | | 313,000 | | | | 860,831 | |
TOTO, Ltd. | | | 10,400 | | | | 414,802 | |
Toyo Seikan Group Holdings, Ltd. (a) | | | 17,200 | | | | 329,156 | |
Toyo Suisan Kaisha, Ltd. | | | 6,000 | | | | 243,998 | |
Toyota Industries Corp. | | | 12,600 | | | | 501,596 | |
Toyota Motor Corp. | | | 211,300 | | | | 10,633,837 | |
Toyota Tsusho Corp. | | | 20,800 | | | | 449,134 | |
Trend Micro, Inc. | | | 10,400 | | | | 372,840 | |
Tsuruha Holdings, Inc. | | | 2,900 | | | | 350,608 | |
Unicharm Corp. | | | 33,200 | | | | 744,406 | |
United Urban Investment Corp. (REIT) | | | 266 | | | | 480,935 | |
USS Co., Ltd. | | | 16,600 | | | | 274,057 | |
West Japan Railway Co. | | | 13,700 | | | | 871,629 | |
Yahoo Japan Corp. | | | 132,900 | | | | 589,125 | |
Yakult Honsha Co., Ltd. (a) | | | 6,300 | | | | 326,434 | |
Yamada Denki Co., Ltd. (a) | | | 55,900 | | | | 295,682 | |
Yamaguchi Financial Group, Inc. (a) | | | 15,000 | | | | 142,150 | |
Yamaha Corp. | | | 15,800 | | | | 427,439 | |
Yamaha Motor Co., Ltd. | | | 23,700 | | | | 361,258 | |
Yamato Holdings Co., Ltd. | | | 27,000 | | | | 622,469 | |
Yamazaki Baking Co., Ltd. | | | 9,000 | | | | 251,235 | |
Yaskawa Electric Corp. | | | 18,000 | | | | 234,723 | |
Yokogawa Electric Corp. | | | 16,300 | | | | 184,228 | |
| | | | | | | | |
| | | | | | | 218,011,782 | |
| | | | | | | | |
| | |
Luxembourg—0.1% | | | | | | | | |
ArcelorMittal | | | 145,609 | | | | 671,123 | |
Tenaris S.A. (a) | | | 43,902 | | | | 635,577 | |
| | | | | | | | |
| | | | | | | 1,306,700 | |
| | | | | | | | |
| | |
Netherlands—2.7% | | | | | | | | |
ABN AMRO Group NV | | | 18,839 | | | | 312,784 | |
Aegon NV | | | 144,233 | | | | 575,946 | |
AerCap Holdings NV (c) | | | 13,600 | | | | 456,824 | |
Airbus Group SE | | | 46,190 | | | | 2,685,079 | |
Akzo Nobel NV | | | 18,902 | | | | 1,190,469 | |
Altice NV - Class A (a) (c) | | | 27,259 | | | | 410,360 | |
Altice NV - Class B (c) | | | 8,983 | | | | 135,817 | |
ASML Holding NV | | | 29,205 | | | | 2,898,019 | |
Boskalis Westminster | | | 6,294 | | | | 217,329 | |
CNH Industrial NV (a) | | | 78,026 | | | | 567,893 | |
Ferrari NV (a) | | | 9,578 | | | | 390,881 | |
Gemalto NV | | | 7,697 | | | | 471,927 | |
Heineken Holding NV | | | 8,233 | | | | 673,260 | |
See accompanying notes to financial statements.
MSF-9
Metropolitan Series Fund
MSCI EAFE Index Portfolio
Schedule of Investments as of June 30, 2016 (Unaudited)
Common Stocks—(Continued)
| | | | | | | | |
| Security Description | | Shares | | | Value | |
| | |
Netherlands—(Continued) | | | | | | | | |
Heineken NV | | | 18,019 | | | $ | 1,666,808 | |
ING Groep NV | | | 303,467 | | | | 3,157,590 | |
Koninklijke Ahold NV | | | 66,939 | | | | 1,490,207 | |
Koninklijke DSM NV | | | 15,861 | | | | 920,010 | |
Koninklijke KPN NV (a) | | | 263,537 | | | | 956,920 | |
Koninklijke Philips NV | | | 74,893 | | | | 1,870,708 | |
Koninklijke Vopak NV | | | 7,217 | | | | 361,876 | |
NN Group NV | | | 24,394 | | | | 678,417 | |
NXP Semiconductors NV (c) | | | 23,300 | | | | 1,825,322 | |
QIAGEN NV (c) | | | 15,370 | | | | 333,269 | |
Randstad Holding NV | | | 9,402 | | | | 379,092 | |
RELX NV | | | 78,420 | | | | 1,370,024 | |
STMicroelectronics NV (a) | | | 44,693 | | | | 263,655 | |
Wolters Kluwer NV | | | 22,968 | | | | 939,613 | |
| | | | | | | | |
| | | | | | | 27,200,099 | |
| | | | | | | | |
| | |
New Zealand—0.2% | | | | | | | | |
Auckland International Airport, Ltd. | | | 99,212 | | | | 459,994 | |
Contact Energy, Ltd. | | | 58,969 | | | | 217,976 | |
Fletcher Building, Ltd. | | | 56,031 | | | | 343,617 | |
Meridian Energy, Ltd. | | | 124,449 | | | | 234,382 | |
Ryman Healthcare, Ltd. | | | 29,900 | | | | 198,725 | |
Spark New Zealand, Ltd. | | | 127,873 | | | | 323,266 | |
| | | | | | | | |
| | | | | | | 1,777,960 | |
| | | | | | | | |
| | |
Norway—0.6% | | | | | | | | |
DNB ASA | | | 81,386 | | | | 984,063 | |
Gjensidige Forsikring ASA | | | 14,357 | | | | 238,368 | |
Marine Harvest ASA (c) | | | 30,284 | | | | 509,448 | |
Norsk Hydro ASA | | | 92,923 | | | | 339,646 | |
Orkla ASA | | | 68,492 | | | | 606,746 | |
Schibsted ASA - B Shares | | | 6,744 | | | | 193,057 | |
Schibsted ASA - Class A | | | 5,724 | | | | 170,819 | |
Statoil ASA (a) | | | 87,269 | | | | 1,511,242 | |
Telenor ASA | | | 58,784 | | | | 971,045 | |
Yara International ASA | | | 15,820 | | | | 502,295 | |
| | | | | | | | |
| | | | | | | 6,026,729 | |
| | | | | | | | |
| | |
Portugal—0.1% | | | | | | | | |
Banco Espirito Santo S.A. (b) (c) (d) | | | 199,038 | | | | 0 | |
EDP - Energias de Portugal S.A. | | | 157,853 | | | | 485,315 | |
Galp Energia SGPS S.A. | | | 40,100 | | | | 557,491 | |
Jeronimo Martins SGPS S.A. | | | 22,596 | | | | 356,378 | |
| | | | | | | | |
| | | | | | | 1,399,184 | |
| | | | | | | | |
| | |
Singapore—1.3% | | | | | | | | |
Ascendas Real Estate Investment Trust (REIT) (a) | | | 215,000 | | | | 397,546 | |
CapitaLand Commercial Trust (REIT) | | | 143,000 | | | | 157,432 | |
CapitaLand Mall Trust (REIT) | | | 240,200 | | | | 381,744 | |
CapitaLand, Ltd. | | | 227,200 | | | | 522,385 | |
City Developments, Ltd. | | | 34,000 | | | | 207,341 | |
ComfortDelGro Corp., Ltd. | | | 153,000 | | | | 313,868 | |
DBS Group Holdings, Ltd. | | | 134,767 | | | | 1,589,252 | |
Genting Singapore plc | | | 418,200 | | | | 228,438 | |
Global Logistic Properties, Ltd. | | | 278,000 | | | | 375,526 | |
| | |
Singapore—(Continued) | | | | | | | | |
Golden Agri-Resources, Ltd. | | | 605,100 | | | | 158,793 | |
Hutchison Port Holdings Trust - Class U | | | 538,000 | | | | 247,141 | |
Jardine Cycle & Carriage, Ltd. | | | 8,888 | | | | 244,083 | |
Keppel Corp., Ltd. (a) | | | 128,900 | | | | 529,821 | |
Oversea-Chinese Banking Corp., Ltd. | | | 247,264 | | | | 1,612,922 | |
Sembcorp Industries, Ltd. | | | 71,000 | | | | 149,673 | |
Singapore Airlines, Ltd. | | | 51,440 | | | | 408,344 | |
Singapore Exchange, Ltd. | | | 56,000 | | | | 319,299 | |
Singapore Press Holdings, Ltd. (a) | | | 153,050 | | | | 452,278 | |
Singapore Technologies Engineering, Ltd. | | | 130,000 | | | | 307,158 | |
Singapore Telecommunications, Ltd. | | | 628,020 | | | | 1,943,841 | |
Suntec Real Estate Investment Trust (REIT) (a) | | | 179,000 | | | | 236,871 | |
United Overseas Bank, Ltd. | | | 105,192 | | | | 1,453,868 | |
UOL Group, Ltd. | | | 33,000 | | | | 134,735 | |
Wilmar International, Ltd. | | | 159,200 | | | | 388,200 | |
| | | | | | | | |
| | | | | | | 12,760,559 | |
| | | | | | | | |
| | |
Spain—2.8% | | | | | | | | |
Abertis Infraestructuras S.A. (a) | | | 41,230 | | | | 606,612 | |
ACS Actividades de Construccion y Servicios S.A. | | | 14,185 | | | | 389,106 | |
Aena S.A. | | | 5,774 | | | | 761,134 | |
Amadeus IT Holding S.A. - A Shares | | | 36,080 | | | | 1,582,319 | |
Banco Bilbao Vizcaya Argentaria S.A. (a) | | | 509,241 | | | | 2,921,406 | |
Banco de Sabadell S.A. (a) | | | 465,409 | | | | 622,524 | |
Banco Popular Espanol S.A. (a) | | | 253,956 | | | | 331,251 | |
Banco Santander S.A. | | | 1,130,381 | | | | 4,405,794 | |
Bankia S.A. (a) | | | 323,299 | | | | 236,564 | |
Bankinter S.A. (a) | | | 48,939 | | | | 315,110 | |
CaixaBank S.A. (a) | | | 198,231 | | | | 436,826 | |
Distribuidora Internacional de Alimentacion S.A. (a) | | | 40,490 | | | | 238,091 | |
Enagas S.A. (a) | | | 17,953 | | | | 546,773 | |
Endesa S.A. (a) | | | 23,384 | | | | 470,819 | |
Ferrovial S.A. | | | 37,538 | | | | 730,153 | |
Gas Natural SDG S.A. (a) | | | 31,745 | | | | 630,217 | |
Grifols S.A. (a) | | | 23,842 | | | | 538,989 | |
Iberdrola S.A. | | | 429,617 | | | | 2,905,019 | |
Industria de Diseno Textil S.A. | | | 85,299 | | | | 2,847,580 | |
International Consolidated Airlines Group
S.A. - Class DI | | | 69,940 | | | | 348,886 | |
Mapfre S.A. | | | 74,474 | | | | 164,866 | |
Red Electrica Corp. S.A. (a) | | | 9,130 | | | | 814,860 | |
Repsol S.A. | | | 85,633 | | | | 1,087,520 | |
Telefonica S.A. | | | 352,406 | | | | 3,372,133 | |
Zardoya Otis S.A. (a) | | | 21,385 | | | | 200,616 | |
| | | | | | | | |
| | | | | | | 27,505,168 | |
| | | | | | | | |
| | |
Sweden—2.6% | | | | | | | | |
Alfa Laval AB (a) | | | 20,852 | | | | 326,840 | |
Assa Abloy AB - Class B | | | 76,998 | | | | 1,575,987 | |
Atlas Copco AB - A Shares | | | 51,088 | | | | 1,320,972 | |
Atlas Copco AB - B Shares | | | 32,703 | | | | 771,003 | |
Boliden AB | | | 18,744 | | | | 363,617 | |
Electrolux AB - Series B | | | 17,118 | | | | 464,268 | |
Getinge AB - B Shares (a) | | | 19,011 | | | | 389,890 | |
See accompanying notes to financial statements.
MSF-10
Metropolitan Series Fund
MSCI EAFE Index Portfolio
Schedule of Investments as of June 30, 2016 (Unaudited)
Common Stocks—(Continued)
| | | | | | | | |
| Security Description | | Shares | | | Value | |
| | |
Sweden—(Continued) | | | | | | | | |
Hennes & Mauritz AB - B Shares | | | 74,424 | | | $ | 2,177,960 | |
Hexagon AB - B Shares (a) | | | 19,206 | | | | 698,107 | |
Husqvarna AB - B Shares | | | 25,677 | | | | 190,212 | |
ICA Gruppen AB (a) | | | 5,619 | | | | 187,488 | |
Industrivarden AB - C Shares | | | 16,050 | | | | 259,040 | |
Investor AB - B Shares | | | 35,158 | | | | 1,174,474 | |
Kinnevik AB - Class B | | | 21,519 | | | | 510,748 | |
Lundin Petroleum AB (c) | | | 16,017 | | | | 289,164 | |
Millicom International Cellular S.A. | | | 5,384 | | | | 328,811 | |
Nordea Bank AB | | | 237,519 | | | | 2,003,403 | |
Sandvik AB | | | 84,986 | | | | 845,866 | |
Securitas AB - B Shares | | | 21,462 | | | | 329,389 | |
Skandinaviska Enskilda Banken AB - Class A | | | 125,966 | | | | 1,093,171 | |
Skanska AB - B Shares | | | 30,119 | | | | 627,246 | |
SKF AB - B Shares | | | 32,785 | | | | 522,755 | |
Svenska Cellulosa AB SCA - Class B | | | 46,579 | | | | 1,483,245 | |
Svenska Handelsbanken AB - A Shares | | | 123,478 | | | | 1,491,518 | |
Swedbank AB - A Shares | | | 75,029 | | | | 1,567,202 | |
Swedish Match AB | | | 14,499 | | | | 503,152 | |
Tele2 AB - B Shares | | | 21,032 | | | | 183,720 | |
Telefonaktiebolaget LM Ericsson - B Shares | | | 245,096 | | | | 1,870,769 | |
Telia Co. AB | | | 219,400 | | | | 1,033,553 | |
Volvo AB - B Shares | | | 126,102 | | | | 1,243,510 | |
| | | | | | | | |
| | | | | | | 25,827,080 | |
| | | | | | | | |
| | |
Switzerland—8.9% | | | | | | | | |
ABB, Ltd. (c) | | | 155,750 | | | | 3,074,975 | |
Actelion, Ltd. (c) | | | 8,051 | | | | 1,354,119 | |
Adecco Group AG | | | 12,943 | | | | 653,553 | |
Aryzta AG (a) (c) | | | 7,132 | | | | 262,693 | |
Baloise Holding AG | | | 4,297 | | | | 480,338 | |
Barry Callebaut AG (c) | | | 132 | | | | 162,502 | |
Chocoladefabriken Lindt & Spruengli AG (a) | | | 9 | | | | 643,797 | |
Chocoladefabriken Lindt & Spruengli AG (Participation Certifcate) | | | 81 | | | | 482,948 | |
Cie Financiere Richemont S.A. | | | 40,858 | | | | 2,402,595 | |
Coca-Cola HBC AG (c) | | | 13,800 | | | | 279,494 | |
Credit Suisse Group AG (c) | | | 145,390 | | | | 1,552,987 | |
Dufry AG (c) | | | 3,625 | | | | 436,103 | |
EMS-Chemie Holding AG | | | 579 | | | | 300,124 | |
Galenica AG (a) | | | 295 | | | | 398,329 | |
Geberit AG | | | 2,876 | | | | 1,088,988 | |
Givaudan S.A. | | | 717 | | | | 1,444,167 | |
Glencore plc (c) | | | 957,509 | | | | 1,964,478 | |
Julius Baer Group, Ltd. (c) | | | 17,027 | | | | 685,871 | |
Kuehne & Nagel International AG | | | 4,135 | | | | 579,474 | |
LafargeHolcim, Ltd. (c) | | | 37,989 | | | | 1,590,608 | |
Lonza Group AG (c) | | | 4,579 | | | | 760,593 | |
Nestle S.A. | | | 252,149 | | | | 19,495,604 | |
Novartis AG | | | 179,960 | | | | 14,839,140 | |
Pargesa Holding S.A. | | | 3,763 | | | | 249,701 | |
Partners Group Holding AG | | | 1,228 | | | | 527,804 | |
Roche Holding AG | | | 55,563 | | | | 14,704,966 | |
Schindler Holding AG | | | 1,428 | | | | 260,532 | |
Schindler Holding AG (Participation Certificate) | | | 3,959 | | | | 719,095 | |
SGS S.A. (a) | | | 429 | | | | 986,009 | |
| | |
Switzerland—(Continued) | | | | | | | | |
Sika AG | | | 170 | | | | 712,816 | |
Sonova Holding AG (a) | | | 4,058 | | | | 540,430 | |
Swatch Group AG (The) | | | 5,039 | | | | 289,722 | |
Swatch Group AG (The) - Bearer Shares (a) | | | 2,384 | | | | 694,669 | |
Swiss Life Holding AG (c) | | | 2,458 | | | | 569,170 | |
Swiss Prime Site AG (a) (c) | | | 4,882 | | | | 442,581 | |
Swiss Re AG | | | 26,071 | | | | 2,284,671 | |
Swisscom AG (a) | | | 2,156 | | | | 1,073,530 | |
Syngenta AG | | | 7,274 | | | | 2,802,555 | |
UBS Group AG | | | 294,259 | | | | 3,816,289 | |
Zurich Insurance Group AG (c) | | | 11,772 | | | | 2,919,519 | |
| | | | | | | | |
| | | | | | | 88,527,539 | |
| | | | | | | | |
| | |
United Kingdom—18.0% | | | | | | | | |
3i Group plc | | | 83,477 | | | | 623,888 | |
Aberdeen Asset Management plc (a) | | | 62,282 | | | | 241,691 | |
Admiral Group plc | | | 16,009 | | | | 438,778 | |
Aggreko plc | | | 17,661 | | | | 304,591 | |
Anglo American plc (a) | | | 114,075 | | | | 1,112,397 | |
Antofagasta plc (a) | | | 26,957 | | | | 168,163 | |
ARM Holdings plc | | | 116,734 | | | | 1,775,420 | |
Ashtead Group plc | | | 36,539 | | | | 526,562 | |
Associated British Foods plc (a) | | | 27,546 | | | | 1,002,930 | |
AstraZeneca plc | | | 99,955 | | | | 5,975,030 | |
Auto Trader Group plc | | | 75,401 | | | | 358,020 | |
Aviva plc | | | 331,823 | | | | 1,790,748 | |
Babcock International Group plc | | | 22,688 | | | | 275,786 | |
BAE Systems plc | | | 259,623 | | | | 1,828,041 | |
Barclays plc | | | 1,312,463 | | | | 2,509,113 | |
Barratt Developments plc | | | 88,548 | | | | 486,935 | |
Berkeley Group Holdings plc | | | 10,289 | | | | 351,718 | |
BP plc | | | 1,463,342 | | | | 8,580,567 | |
British American Tobacco plc | | | 147,426 | | | | 9,633,075 | |
British Land Co. plc (The) (REIT) | | | 73,348 | | | | 609,939 | |
BT Group plc | | | 669,710 | | | | 3,713,454 | |
Bunzl plc | | | 27,344 | | | | 849,290 | |
Burberry Group plc | | | 32,742 | | | | 513,952 | |
Capita plc | | | 56,282 | | | | 725,911 | |
Carnival plc | | | 15,318 | | | | 682,903 | |
Centrica plc | | | 410,376 | | | | 1,244,129 | |
Cobham plc | | | 148,611 | | | | 313,076 | |
Coca-Cola European Partners plc (c) | | | 17,100 | | | | 613,421 | |
Compass Group plc | | | 128,908 | | | | 2,467,437 | |
Croda International plc | | | 12,193 | | | | 513,192 | |
Diageo plc | | | 199,591 | | | | 5,608,082 | |
Direct Line Insurance Group plc | | | 120,497 | | | | 559,557 | |
Dixons Carphone plc | | | 87,082 | | | | 379,622 | |
easyJet plc | | | 10,815 | | | | 157,754 | |
Fiat Chrysler Automobiles NV (a) | | | 70,787 | | | | 437,443 | |
Fresnillo plc | | | 22,254 | | | | 493,846 | |
G4S plc | | | 145,464 | | | | 361,586 | |
GKN plc | | | 126,099 | | | | 455,777 | |
GlaxoSmithKline plc | | | 384,893 | | | | 8,309,041 | |
Hammerson plc (REIT) | | | 56,484 | | | | 414,366 | |
Hargreaves Lansdown plc | | | 23,808 | | | | 397,836 | |
Hikma Pharmaceuticals plc | | | 11,370 | | | | 376,505 | |
See accompanying notes to financial statements.
MSF-11
Metropolitan Series Fund
MSCI EAFE Index Portfolio
Schedule of Investments as of June 30, 2016 (Unaudited)
Common Stocks—(Continued)
| | | | | | | | |
| Security Description | | Shares | | | Value | |
| | |
United Kingdom—(Continued) | | | | | | | | |
HSBC Holdings plc (a) | | | 1,548,785 | | | $ | 9,715,684 | |
ICAP plc | | | 53,697 | | | | 303,093 | |
IMI plc | | | 20,055 | | | | 260,231 | |
Imperial Brands plc | | | 77,211 | | | | 4,208,862 | |
Inmarsat plc | | | 33,445 | | | | 360,478 | |
InterContinental Hotels Group plc | | | 15,517 | | | | 578,998 | |
Intertek Group plc | | | 14,174 | | | | 664,642 | |
Intu Properties plc (REIT) (a) | | | 92,411 | | | | 363,039 | |
Investec plc | | | 41,855 | | | | 264,923 | |
J Sainsbury plc (a) | | | 120,106 | | | | 374,028 | |
Johnson Matthey plc | | | 15,590 | | | | 592,615 | |
Kingfisher plc | | | 189,541 | | | | 821,568 | |
Land Securities Group plc (REIT) | | | 59,558 | | | | 846,424 | |
Legal & General Group plc | | | 465,307 | | | | 1,211,084 | |
Lloyds Banking Group plc | | | 5,084,951 | | | | 3,754,709 | |
London Stock Exchange Group plc | | | 25,259 | | | | 859,192 | |
Marks & Spencer Group plc | | | 137,472 | | | | 586,942 | |
Mediclinic International plc | | | 30,600 | | | | 449,888 | |
Meggitt plc | | | 55,862 | | | | 304,295 | |
Merlin Entertainments plc | | | 52,353 | | | | 312,244 | |
Mondi plc | | | 27,093 | | | | 507,028 | |
National Grid plc | | | 292,804 | | | | 4,323,781 | |
Next plc | | | 11,803 | | | | 792,930 | |
Old Mutual plc | | | 378,865 | | | | 1,025,491 | |
Pearson plc | | | 63,486 | | | | 831,447 | |
Persimmon plc | | | 22,805 | | | | 446,878 | |
Petrofac, Ltd. (a) | | | 17,337 | | | | 180,933 | |
Provident Financial plc | | | 11,099 | | | | 344,500 | |
Prudential plc | | | 201,111 | | | | 3,440,372 | |
Randgold Resources, Ltd. | | | 8,250 | | | | 930,175 | |
Reckitt Benckiser Group plc | | | 50,047 | | | | 5,056,001 | |
RELX plc | | | 85,441 | | | | 1,580,871 | |
Rio Tinto plc | | | 100,627 | | | | 3,123,362 | |
Rolls-Royce Holdings plc (c) | | | 152,053 | | | | 1,449,880 | |
Royal Bank of Scotland Group plc (c) | | | 262,192 | | | | 620,069 | |
Royal Dutch Shell plc - A Shares | | | 333,236 | | | | 9,136,411 | |
Royal Dutch Shell plc - B Shares | | | 296,493 | | | | 8,187,331 | |
Royal Mail plc | | | 67,965 | | | | 462,673 | |
RSA Insurance Group plc | | | 93,305 | | | | 625,712 | |
SABMiller plc | | | 78,048 | | | | 4,568,923 | |
Sage Group plc (The) | | | 93,810 | | | | 819,201 | |
Schroders plc | | | 10,735 | | | | 340,387 | |
Segro plc (REIT) | | | 61,844 | | | | 348,630 | |
Severn Trent plc | | | 20,415 | | | | 669,677 | |
Sky plc | | | 81,836 | | | | 932,735 | |
Smith & Nephew plc | | | 70,070 | | | | 1,193,301 | |
Smiths Group plc | | | 31,976 | | | | 494,571 | |
SSE plc | | | 80,939 | | | | 1,699,483 | |
St. James’s Place plc | | | 38,927 | | | | 418,693 | |
Standard Chartered plc | | | 260,617 | | | | 1,990,634 | |
Standard Life plc | | | 166,532 | | | | 657,216 | |
Tate & Lyle plc | | | 33,576 | | | | 300,632 | |
Taylor Wimpey plc | | | 240,026 | | | | 430,639 | |
Tesco plc (c) | | | 671,221 | | | | 1,576,874 | |
Travis Perkins plc | | | 20,832 | | | | 418,492 | |
Unilever NV | | | 130,477 | | | | 6,089,289 | |
Unilever plc | | | 101,509 | | | | 4,889,391 | |
| | |
United Kingdom—(Continued) | | | | | | | | |
United Utilities Group plc | | | 57,234 | | | | 800,289 | |
Vodafone Group plc | | | 2,100,036 | | | | 6,419,563 | |
Weir Group plc (The) | | | 17,104 | | | | 331,647 | |
Whitbread plc | | | 14,502 | | | | 680,647 | |
William Hill plc | | | 82,380 | | | | 286,527 | |
WM Morrison Supermarkets plc (a) | | | 166,578 | | | | 419,585 | |
Wolseley plc | | | 20,872 | | | | 1,086,205 | |
Worldpay Group plc (c) | | | 110,824 | | | | 405,071 | |
WPP plc | | | 101,340 | | | | 2,112,865 | |
| | | | | | | | |
| | | | | | | 178,461,523 | |
| | | | | | | | |
| | |
United States—0.1% | | | | | | | | |
Ball Corp. | | | 2,810 | | | | 203,102 | |
Mobileye NV (a) (c) | | | 14,200 | | | | 655,188 | |
| | | | | | | | |
| | | | | | | 858,290 | |
| | | | | | | | |
Total Common Stocks
(Cost $915,032,549) | | | | | | | 928,993,431 | |
| | | | | | | | |
| | |
| Mutual Fund—3.7% | | | | | | | | |
| | |
United States—3.7% | | | | | | | | |
iShares MSCI EAFE ETF (a) (e)
(Cost $36,556,761) | | | 660,100 | | | | 36,840,181 | |
| | | | | | | | |
| | |
| Preferred Stocks—0.5% | | | | | | | | |
| | |
Germany—0.5% | | | | | | | | |
Bayerische Motoren Werke (BMW) AG | | | 3,505 | | | | 222,423 | |
FUCHS Petrolub SE | | | 4,900 | | | | 192,654 | |
Henkel AG & Co. KGaA | | | 13,964 | | | | 1,699,851 | |
Porsche Automobil Holding SE (a) | | | 11,870 | | | | 547,455 | |
Schaeffler AG | | | 13,141 | | | | 174,403 | |
Volkswagen AG | | | 15,111 | | | | 1,818,054 | |
| | | | | | | | |
Total Preferred Stocks
(Cost $4,075,657) | | | | | | | 4,654,840 | |
| | | | | | | | |
| | |
| Rights—0.0% | | | | | | | | |
| | |
Spain—0.0% | | | | | | | | |
ACS Actividades de Construccion y Servicios S.A., Expires 07/18/16 (c) | | | 14,185 | | | | 9,975 | |
Repsol S.A., Expires 07/08/16 (a) (c) | | | 85,633 | | | | 27,874 | |
| | | | | | | | |
Total Rights
(Cost $39,241) | | | | | | | 37,849 | |
| | | | | | | | |
See accompanying notes to financial statements.
MSF-12
Metropolitan Series Fund
MSCI EAFE Index Portfolio
Schedule of Investments as of June 30, 2016 (Unaudited)
Short-Term Investments—10.1%
| | | | | | | | |
| Security Description | | Shares/
Principal
Amount* | | | Value | |
| | |
Discount Notes—1.5% | | | | | | | | |
Federal Home Loan Bank
0.260%, 07/20/16 (f) | | | 525,000 | | | $ | 524,925 | |
0.269%, 07/19/16 (f) | | | 150,000 | | | | 149,979 | |
0.293%, 07/26/16 (f) | | | 1,000,000 | | | | 999,792 | |
0.295%, 08/03/16 (f) | | | 2,525,000 | | | | 2,524,306 | |
0.316%, 07/14/16 (f) | | | 150,000 | | | | 149,982 | |
0.367%, 08/19/16 (f) | | | 775,000 | | | | 774,611 | |
0.400%, 07/27/16 (f) | | | 175,000 | | | | 174,948 | |
0.437%, 07/22/16 (f) | | | 2,450,000 | | | | 2,449,355 | |
0.449%, 08/26/16 (f) | | | 2,875,000 | | | | 2,872,987 | |
0.457%, 08/17/16 (f) | | | 4,275,000 | | | | 4,272,432 | |
| | | | | | | | |
| | | | | | | 14,893,317 | |
| | | | | | | | |
| | |
Mutual Fund—8.3% | | | | | | | | |
State Street Navigator Securities Lending MET Portfolio (g) | | | 82,351,002 | | | | 82,351,002 | |
| | | | | | | | |
| | |
U.S. Treasury—0.3% | | | | | | | | |
U.S. Treasury Bills
0.162%, 07/07/16 (f) | | | 1,175,000 | | | | 1,174,964 | |
0.241%, 09/29/16 (f) | | | 1,950,000 | | | | 1,948,830 | |
| | | | | | | | |
| | | | | | | 3,123,794 | |
| | | | | | | | |
Total Short-Term Investments
(Cost $100,368,113) | | | | | | | 100,368,113 | |
| | | | | | | | |
Total Investments—108.0%
(Cost $1,056,072,321) (h) | | | | | | | 1,070,894,414 | |
Other assets and liabilities
(net)—(8.0)% | | | | | | | (79,692,275 | ) |
| | | | | | | | |
| Net Assets—100.0% | | | | | | $ | 991,202,139 | |
| | | | | | | | |
| * | Principal amount stated in U.S. dollars unless otherwise noted. |
| (a) | All or a portion of the security was held on loan. As of June 30, 2016, the market value of securities loaned was $82,764,114 and the collateral received consisted of cash in the amount of $82,351,002 and non-cash collateral with a value of $2,254,913. The cash collateral is invested in a money market fund managed by an affiliate of the custodian. The non-cash collateral received consists primarily of government securities and bank letters of credit, and is held for the benefit of the Portfolio at the Portfolio’s custodian. The Portfolio cannot repledge or resell this collateral. As such, this collateral is excluded from the Statement of Assets and Liabilities. |
| (b) | Security was valued in good faith under procedures approved by the Board of Trustees. As of June 30, 2016, these securities represent less than 0.05% of net assets. |
| (c) | Non-income producing security. |
| (d) | Illiquid security. As of June 30, 2016, these securities represent 0.0% of net assets. |
| (e) | All or a portion of the security was pledged as collateral against open futures contracts. As of June 30, 2016, the market value of securities pledged was $1,674,300. |
| (f) | The rate shown represents current yield to maturity. |
| (g) | Represents investment of cash collateral received from securities on loan as of June 30, 2016. |
| (h) | As of June 30, 2016, the aggregate cost of investments was $1,056,072,321. The aggregate unrealized appreciation and depreciation of investments were $206,123,639 and $(191,301,546), respectively, resulting in net unrealized appreciation of $14,822,093. |
| (ADR)— | An American Depositary Receipt is a certificate issued by a custodian bank representing the right to receive securities of the foreign issuer described. Trading on exchanges not located in the United States or Canada significantly influences the value of ADRs. |
| (ETF)— | Exchange-Traded Fund |
| (REIT)— | A Real Estate Investment Trust is a pooled investment vehicle that invests primarily in income-producing real estate or real estate related loans or interest. |
| | | | |
Ten Largest Industries as of
June 30, 2016 (Unaudited) | | % of
Net Assets | |
Banks | | | 9.8 | |
Pharmaceuticals | | | 8.8 | |
Insurance | | | 4.8 | |
Oil, Gas & Consumable Fuels | | | 4.7 | |
Food Products | | | 3.4 | |
Chemicals | | | 3.3 | |
Automobiles | | | 3.2 | |
Diversified Telecommunication Services | | | 3.0 | |
Beverages | | | 2.8 | |
Machinery | | | 2.2 | |
Futures Contracts
| | | | | | | | | | | | | | | | | | | | |
Futures Contracts—Long | | Expiration
Date | | | Number of
Contracts | | | Notional
Amount | | | Unrealized
Depreciation | |
MSCI EAFE Mini Index Futures | | | 09/16/16 | | | | 179 | | | | USD | | | | 14,487,728 | | | $ | (31,688 | ) |
| | | | | | | | | | | | | | | | | | | | |
| (USD)— | United States Dollar |
See accompanying notes to financial statements.
MSF-13
Metropolitan Series Fund
MSCI EAFE Index Portfolio
Schedule of Investments as of June 30, 2016 (Unaudited)
Fair Value Hierarchy
Accounting principles generally accepted in the United States of America (“GAAP”) define fair market value as the price that the Portfolio would receive to sell an asset or pay to transfer a liability in an orderly transaction between market participants at the measurement date. It establishes a fair value hierarchy that prioritizes inputs to valuation methods and requires disclosure of the fair value hierarchy, separately for each major category of assets and liabilities, that segregates fair value measurements into three levels. Levels 1, 2 and 3 of the fair value hierarchy are defined as follows:
Level 1 - unadjusted quoted prices in active markets for identical investments
Level 2 - other significant observable inputs (including, but not limited to, quoted prices for similar assets or liabilities in markets that are either active or inactive; inputs other than quoted prices that are observable such as interest rates, yield curves, volatilities, prepayment speeds, loss severities, credit risks, default rates, or other market corroborated inputs)
Level 3 - significant unobservable inputs based on the best information available in the circumstances, to the extent observable inputs are unavailable (including the Portfolio’s own assumptions used in determining the fair value of investments and derivative financial instruments)
The inputs or methodologies used for valuing investments are not necessarily an indication of the risk associated with investing in them. Changes to the inputs or methodologies used may result in transfers between levels, which will be recognized as of the beginning of the reporting period. Information on transfers between Level 1 and Level 2, if any, will be disclosed following the fair value hierarchy table below. A reconciliation of Level 3 securities, if any, will also be disclosed following the fair value hierarchy table. For more information about the Portfolio’s policy regarding the valuation of investments, please refer to the Notes to Financial Statements.
The following table summarizes the fair value hierarchy of the Portfolio’s investments as of June 30, 2016:
| | | | | | | | | | | | | | | | |
| Description | | Level 1 | | | Level 2 | | | Level 3 | | | Total | |
| Common Stocks | | | | | | | | | | | | | | | | |
Australia | | $ | — | | | $ | 69,493,142 | | | $ | — | | | $ | 69,493,142 | |
Austria | | | — | | | | 1,496,334 | | | | — | | | | 1,496,334 | |
Belgium | | | — | | | | 13,794,913 | | | | — | | | | 13,794,913 | |
Denmark | | | — | | | | 18,490,290 | | | | — | | | | 18,490,290 | |
Finland | | | — | | | | 9,132,753 | | | | — | | | | 9,132,753 | |
France | | | — | | | | 85,776,212 | | | | — | | | | 85,776,212 | |
Germany | | | — | | | | 75,820,199 | | | | — | | | | 75,820,199 | |
Hong Kong | | | 201,280 | | | | 30,855,253 | | | | — | | | | 31,056,533 | |
Ireland | | | — | | | | 11,366,799 | | | | — | | | | 11,366,799 | |
Israel | | | 1,025,920 | | | | 5,586,128 | | | | — | | | | 6,612,048 | |
Italy | | | — | | | | 16,291,595 | | | | — | | | | 16,291,595 | |
Japan | | | — | | | | 218,011,782 | | | | — | | | | 218,011,782 | |
Luxembourg | | | — | | | | 1,306,700 | | | | — | | | | 1,306,700 | |
Netherlands | | | 2,282,146 | | | | 24,917,953 | | | | — | | | | 27,200,099 | |
New Zealand | | | — | | | | 1,777,960 | | | | — | | | | 1,777,960 | |
Norway | | | — | | | | 6,026,729 | | | | — | | | | 6,026,729 | |
Portugal | | | — | | | | 1,399,184 | | | | 0 | | | | 1,399,184 | |
Singapore | | | — | | | | 12,760,559 | | | | — | | | | 12,760,559 | |
Spain | | | — | | | | 27,505,168 | | | | — | | | | 27,505,168 | |
Sweden | | | — | | | | 25,827,080 | | | | — | | | | 25,827,080 | |
Switzerland | | | — | | | | 88,527,539 | | | | — | | | | 88,527,539 | |
United Kingdom | | | 613,421 | | | | 177,848,102 | | | | — | | | | 178,461,523 | |
United States | | | 858,290 | | | | — | | | | — | | | | 858,290 | |
Total Common Stocks | | | 4,981,057 | | | | 924,012,374 | | | | 0 | | | | 928,993,431 | |
Total Mutual Fund* | | | 36,840,181 | | | | — | | | | — | | | | 36,840,181 | |
Total Preferred Stocks* | | | — | | | | 4,654,840 | | | | — | | | | 4,654,840 | |
Total Rights* | | | 37,849 | | | | — | | | | — | | | | 37,849 | |
| Short-Term Investments | | | | | | | | | | | | | | | | |
Discount Notes | | | — | | | | 14,893,317 | | | | — | | | | 14,893,317 | |
Mutual Fund | | | 82,351,002 | | | | — | | | | — | | | | 82,351,002 | |
U.S. Treasury | | | — | | | | 3,123,794 | | | | — | | | | 3,123,794 | |
Total Short-Term Investments | | | 82,351,002 | | | | 18,017,111 | | | | — | | | | 100,368,113 | |
Total Investments | | $ | 124,210,089 | | | $ | 946,684,325 | | | $ | 0 | | | $ | 1,070,894,414 | |
| | | | | | | | | | | | | | | | | |
See accompanying notes to financial statements.
MSF-14
Metropolitan Series Fund
MSCI EAFE Index Portfolio
Schedule of Investments as of June 30, 2016 (Unaudited)
Fair Value Hierarchy—(Continued)
| | | | | | | | | | | | | | | | |
| Description | | Level 1 | | | Level 2 | | | Level 3 | | | Total | |
Collateral for Securities Loaned (Liability) | | $ | — | | | $ | (82,351,002 | ) | | $ | — | | | $ | (82,351,002 | ) |
| Futures Contracts | | | | | | | | | | | | | | | | |
Futures Contracts (Unrealized Depreciation) | | $ | (31,688 | ) | | $ | — | | | $ | — | | | $ | (31,688 | ) |
| * | See Schedule of Investments for additional detailed categorizations. |
Transfers from Level 1 to Level 2 in the amount of $978,287 were due to the application of a systematic fair valuation model factor.
As of June 30, 2016, the security designated as Level 3 was fair valued using significant unobservable inputs under procedures adopted by the Board. Such valuations were based on a review of inputs such as, but not limited to, similar securities, company specific financial information, and company specific news. For this security there was no change in the value and valuation techniques used since the December 31, 2015 annual report. The Level 3 security comprised 0.0% of net assets of the Portfolio. As such, the Level 3 roll forward and change in unrealized appreciation (depreciation) of the Level 3 security held at June 30, 2016 have not been presented
See accompanying notes to financial statements.
MSF-15
Metropolitan Series Fund
MSCI EAFE Index Portfolio
Statement of Assets and Liabilities
June 30, 2016 (Unaudited)
| | | | |
Assets | |
Investments at value (a) (b) | | $ | 1,070,894,414 | |
Cash | | | 21,709 | |
Cash denominated in foreign currencies (c) | | | 781,290 | |
Receivable for: | | | | |
Investments sold | | | 585,758 | |
Fund shares sold | | | 1,709,136 | |
Dividends | | | 3,552,503 | |
Variation margin on futures contracts | | | 211,220 | |
Prepaid expenses | | | 6,307 | |
| | | | |
Total Assets | | | 1,077,762,337 | |
Liabilities | | | | |
Collateral for securities loaned | | | 82,351,002 | |
Payables for: | | | | |
Investments purchased | | | 3,179,304 | |
Fund shares redeemed | | | 157,794 | |
Accrued Expenses: | | | | |
Management fees | | | 240,109 | |
Distribution and service fees | | | 105,709 | |
Deferred trustees’ fees | | | 77,882 | |
Other expenses | | | 448,398 | |
| | | | |
Total Liabilities | | | 86,560,198 | |
| | | | |
Net Assets | | $ | 991,202,139 | |
| | | | |
Net Assets Consist of: | | | | |
Paid in surplus | | $ | 1,014,073,096 | |
Undistributed net investment income | | | 12,662,047 | |
Accumulated net realized loss | | | (50,212,082 | ) |
Unrealized appreciation on investments, futures contracts and foreign currency transactions | | | 14,679,078 | |
| | | | |
Net Assets | | $ | 991,202,139 | |
| | | | |
Net Assets | | | | |
Class A | | $ | 481,346,420 | |
Class B | | | 386,366,813 | |
Class E | | | 29,595,556 | |
Class G | | | 93,893,350 | |
Capital Shares Outstanding* | | | | |
Class A | | | 41,976,862 | |
Class B | | | 34,325,170 | |
Class E | | | 2,592,720 | |
Class G | | | 8,389,053 | |
Net Asset Value, Offering Price and Redemption Price Per Share | | | | |
Class A | | $ | 11.47 | |
Class B | | | 11.26 | |
Class E | | | 11.41 | |
Class G | | | 11.19 | |
| * | The Portfolio is authorized to issue an unlimited number of shares. |
| (a) | Identified cost of investments was $1,056,072,321. |
| (b) | Includes securities loaned at value of $82,764,114. |
| (c) | Identified cost of cash denominated in foreign currencies was $781,106. |
Statement of Operations
Six Months Ended June 30, 2016 (Unaudited)
| | | | |
Investment Income | |
Dividends (a) | | $ | 21,300,062 | |
Interest | | | 25,867 | |
Securities lending income | | | 406,470 | |
| | | | |
Total investment income | | | 21,732,399 | |
Expenses | | | | |
Management fees | | | 1,439,107 | |
Administration fees | | | 12,260 | |
Custodian and accounting fees | | | 158,256 | |
Distribution and service fees—Class B | | | 473,010 | |
Distribution and service fees—Class E | | | 22,131 | |
Distribution and service fees—Class G | | | 137,539 | |
Audit and tax services | | | 20,230 | |
Legal | | | 13,588 | |
Trustees’ fees and expenses | | | 15,990 | |
Shareholder reporting | | | 81,568 | |
Insurance | | | 3,278 | |
Miscellaneous | | | 80,852 | |
| | | | |
Total expenses | | | 2,457,809 | |
Less management fee waiver | | | (11,635 | ) |
| | | | |
Net expenses | | | 2,446,174 | |
| | | | |
Net Investment Income | | | 19,286,225 | |
| | | | |
Net Realized and Unrealized Loss | | | | |
| Net realized gain (loss) on: | | | | |
Investments | | | (4,845,489 | ) |
Futures contracts | | | (584,119 | ) |
Foreign currency transactions | | | 141,249 | |
| | | | |
Net realized loss | | | (5,288,359 | ) |
| | | | |
| Net change in unrealized appreciation (depreciation) on: | | | | |
Investments | | | (41,473,313 | ) |
Futures contracts | | | 73,387 | |
Foreign currency transactions | | | (26,631 | ) |
| | | | |
Net change in unrealized depreciation | | | (41,426,557 | ) |
| | | | |
Net realized and unrealized loss | | | (46,714,916 | ) |
| | | | |
Net Decrease in Net Assets From Operations | | $ | (27,428,691 | ) |
| | | | |
| (a) | Net of foreign withholding taxes of $2,049,518. |
See accompanying notes to financial statements.
MSF-16
Metropolitan Series Fund
MSCI EAFE Index Portfolio
Statements of Changes in Net Assets
| | | | | | | | |
| | | Six Months
Ended
June 30,
2016
(Unaudited) | | | Year Ended
December 31,
2015 | |
Increase (Decrease) in Net Assets: | | | | | | | | |
From Operations | | | | | | | | |
Net investment income | | $ | 19,286,225 | | | $ | 24,846,819 | |
Net realized loss | | | (5,288,359 | ) | | | (6,126,582 | ) |
Net change in unrealized depreciation | | | (41,426,557 | ) | | | (29,385,462 | ) |
| | | | | | | | |
Decrease in net assets from operations | | | (27,428,691 | ) | | | (10,665,225 | ) |
| | | | | | | | |
From Distributions to Shareholders | | | | | | | | |
Net investment income | | | | | | | | |
Class A | | | (12,581,615 | ) | | | (14,562,770 | ) |
Class B | | | (9,346,457 | ) | | | (12,357,853 | ) |
Class E | | | (740,137 | ) | | | (1,026,590 | ) |
Class G | | | (2,272,642 | ) | | | (3,019,719 | ) |
| | | | | | | | |
Total distributions | | | (24,940,851 | ) | | | (30,966,932 | ) |
| | | | | | | | |
Increase in net assets from capital share transactions | | | 60,250,117 | | | | 64,623,279 | |
| | | | | | | | |
Total increase in net assets | | | 7,880,575 | | | | 22,991,122 | |
| | |
Net Assets | | | | | | | | |
Beginning of period | | | 983,321,564 | | | | 960,330,442 | |
| | | | | | | | |
End of period | | $ | 991,202,139 | | | $ | 983,321,564 | |
| | | | | | | | |
Undistributed net investment income | | | | | | | | |
End of period | | $ | 12,662,047 | | | $ | 18,316,673 | |
| | | | | | | | |
Other Information:
Capital Shares
Transactions in capital shares were as follows:
| | | | | | | | | | | | | | | | |
| | | Six Months Ended
June 30, 2016
(Unaudited) | | | Year Ended
December 31, 2015 | |
| | | Shares | | | Value | | | Shares | | | Value | |
Class A | | | | | | | | | | | | | | | | |
Sales | | | 4,189,519 | | | $ | 47,480,314 | | | | 6,272,137 | | | $ | 79,515,163 | |
Reinvestments | | | 1,120,357 | | | | 12,581,615 | | | | 1,108,278 | | | | 14,562,770 | |
Redemptions | | | (1,619,148 | ) | | | (18,850,374 | ) | | | (3,046,693 | ) | | | (39,870,679 | ) |
| | | | | | | | | | | | | | | | |
Net increase | | | 3,690,728 | | | $ | 41,211,555 | | | | 4,333,722 | | | $ | 54,207,254 | |
| | | | | | | | | | | | | | | | |
Class B | | | | | | | | | | | | | | | | |
Sales | | | 1,551,904 | | | $ | 17,377,915 | | | | 2,583,811 | | | $ | 31,901,634 | |
Reinvestments | | | 848,136 | | | | 9,346,457 | | | | 957,973 | | | | 12,357,853 | |
Redemptions | | | (1,163,858 | ) | | | (13,364,525 | ) | | | (3,059,588 | ) | | | (39,653,025 | ) |
| | | | | | | | | | | | | | | | |
Net increase | | | 1,236,182 | | | $ | 13,359,847 | | | | 482,196 | | | $ | 4,606,462 | |
| | | | | | | | | | | | | | | | |
Class E | | | | | | | | | | | | | | | | |
Sales | | | 58,258 | | | $ | 658,906 | | | | 156,699 | | | $ | 1,969,785 | |
Reinvestments | | | 66,202 | | | | 740,137 | | | | 78,486 | | | | 1,026,590 | |
Redemptions | | | (125,516 | ) | | | (1,449,845 | ) | | | (364,841 | ) | | | (4,779,099 | ) |
| | | | | | | | | | | | | | | | |
Net decrease | | | (1,056 | ) | | $ | (50,802 | ) | | | (129,656 | ) | | $ | (1,782,724 | ) |
| | | | | | | | | | | | | | | | |
Class G | | | | | | | | | | | | | | | | |
Sales | | | 740,432 | | | $ | 8,306,098 | | | | 2,300,480 | | | $ | 29,415,668 | |
Reinvestments | | | 207,358 | | | | 2,272,642 | | | | 235,364 | | | | 3,019,719 | |
Redemptions | | | (425,870 | ) | | | (4,849,223 | ) | | | (2,007,117 | ) | | | (24,843,100 | ) |
| | | | | | | | | | | | | | | | |
Net increase | | | 521,920 | | | $ | 5,729,517 | | | | 528,727 | | | $ | 7,592,287 | |
| | | | | | | | | | | | | | | | |
Increase derived from capital shares transactions | | | | | | $ | 60,250,117 | | | | | | | $ | 64,623,279 | |
| | | | | | | | | | | | | | | | |
See accompanying notes to financial statements.
MSF-17
Metropolitan Series Fund
MSCI EAFE Index Portfolio
Financial Highlights
| | | | | | | | | | | | | | | | | | | | | | | | |
| Selected per share data | | | | | | | | | | | | | | | | | | |
| | | Class A | |
| | | Six Months
Ended
June 30,
2016
(Unaudited) | | | Year Ended December 31, | |
| | | | 2015
| | | 2014
| | | 2013
| | | 2012
| | | 2011
| |
Net Asset Value, Beginning of Period | | $ | 12.14 | | | $ | 12.67 | | | $ | 13.83 | | | $ | 11.72 | | | $ | 10.22 | | | $ | 11.95 | |
| | | | | | | | | | | | | | | | | | | | | | | | |
Income (Loss) from Investment Operations | | | | | | | | | | | | | | | | | | | | | | | | |
Net investment income (a) | | | 0.24 | | | | 0.34 | | | | 0.45 | | | | 0.35 | | | | 0.35 | | | | 0.36 | |
Net realized and unrealized gain (loss) on investments | | | (0.60 | ) | | | (0.45 | ) | | | (1.26 | ) | | | 2.15 | | | | 1.49 | | | | (1.80 | ) |
| | | | | | | | | | | | | | | | | | | | | | | | |
Total from investment operations | | | (0.36 | ) | | | (0.11 | ) | | | (0.81 | ) | | | 2.50 | | | | 1.84 | | | | (1.44 | ) |
| | | | | | | | | | | | | | | | | | | | | | | | |
Less Distributions | | | | | | | | | | | | | | | | | | | | | | | | |
Distributions from net investment income | | | (0.31 | ) | | | (0.42 | ) | | | (0.35 | ) | | | (0.39 | ) | | | (0.34 | ) | | | (0.29 | ) |
| | | | | | | | | | | | | | | | | | | | | | | | |
Total distributions | | | (0.31 | ) | | | (0.42 | ) | | | (0.35 | ) | | | (0.39 | ) | | | (0.34 | ) | | | (0.29 | ) |
| | | | | | | | | | | | | | | | | | | | | | | | |
Net Asset Value, End of Period | | $ | 11.47 | | | $ | 12.14 | | | $ | 12.67 | | | $ | 13.83 | | | $ | 11.72 | | | $ | 10.22 | |
| | | | | | | | | | | | | | | | | | | | | | | | |
Total Return (%) (b) | | | (2.89 | ) (c) | | | (1.09 | ) | | | (6.00 | ) | | | 21.86 | | | | 18.33 | | | | (12.50 | ) |
| | | | | | |
Ratios/Supplemental Data | | | | | | | | | | | | | | | | | | | | | | | | |
Gross ratio of expenses to average net assets (%) | | | 0.38 | (d) | | | 0.40 | | | | 0.40 | | | | 0.40 | | | | 0.41 | | | | 0.41 | |
Net ratio of expenses to average net assets (%) (e) | | | 0.38 | (d) | | | 0.40 | | | | 0.40 | | | | 0.40 | | | | 0.40 | | | | 0.41 | |
Ratio of net investment income to average net assets (%) | | | 4.16 | (d) | | | 2.59 | | | | 3.34 | | | | 2.76 | | | | 3.25 | | | | 3.09 | |
Portfolio turnover rate (%) | | | 7 | (c) | | | 9 | | | | 9 | | | | 10 | | | | 8 | | | | 11 | |
Net assets, end of period (in millions) | | $ | 481.3 | | | $ | 464.9 | | | $ | 430.0 | | | $ | 394.5 | | | $ | 297.7 | | | $ | 283.2 | |
| |
| | | Class B | |
| | | Six Months
Ended
June 30,
2016
(Unaudited) | | | Year Ended December 31, | |
| | | | 2015
| | | 2014
| | | 2013
| | | 2012
| | | 2011
| |
Net Asset Value, Beginning of Period | | $ | 11.91 | | | $ | 12.43 | | | $ | 13.58 | | | $ | 11.52 | | | $ | 10.05 | | | $ | 11.75 | |
| | | | | | | | | | | | | | | | | | | | | | | | |
Income (Loss) from Investment Operations | | | | | | | | | | | | | | | | | | | | | | | | |
Net investment income (a) | | | 0.22 | | | | 0.30 | | | | 0.42 | | | | 0.31 | | | | 0.32 | | | | 0.32 | |
Net realized and unrealized gain (loss) on investments | | | (0.59 | ) | | | (0.43 | ) | | | (1.25 | ) | | | 2.11 | | | | 1.46 | | | | (1.76 | ) |
| | | | | | | | | | | | | | | | | | | | | | | | |
Total from investment operations | | | (0.37 | ) | | | (0.13 | ) | | | (0.83 | ) | | | 2.42 | | | | 1.78 | | | | (1.44 | ) |
| | | | | | | | | | | | | | | | | | | | | | | | |
Less Distributions | | | | | | | | | | | | | | | | | | | | | | | | |
Distributions from net investment income | | | (0.28 | ) | | | (0.39 | ) | | | (0.32 | ) | | | (0.36 | ) | | | (0.31 | ) | | | (0.26 | ) |
| | | | | | | | | | | | | | | | | | | | | | | | |
Total distributions | | | (0.28 | ) | | | (0.39 | ) | | | (0.32 | ) | | | (0.36 | ) | | | (0.31 | ) | | | (0.26 | ) |
| | | | | | | | | | | | | | | | | | | | | | | | |
Net Asset Value, End of Period | | $ | 11.26 | | | $ | 11.91 | | | $ | 12.43 | | | $ | 13.58 | | | $ | 11.52 | | | $ | 10.05 | |
| | | | | | | | | | | | | | | | | | | | | | | | |
Total Return (%) (b) | | | (3.05 | ) (c) | | | (1.28 | ) | | | (6.27 | ) | | | 21.52 | | | | 18.02 | | | | (12.65 | ) |
| | | | | | |
Ratios/Supplemental Data | | | | | | | | | | | | | | | | | | | | | | | | |
Gross ratio of expenses to average net assets (%) | | | 0.63 | (d) | | | 0.65 | | | | 0.65 | | | | 0.65 | | | | 0.66 | | | | 0.66 | |
Net ratio of expenses to average net assets (%) (e) | | | 0.63 | (d) | | | 0.65 | | | | 0.65 | | | | 0.65 | | | | 0.65 | | | | 0.66 | |
Ratio of net investment income to average net assets (%) | | | 3.89 | (d) | | | 2.37 | | | | 3.14 | | | | 2.55 | | | | 2.99 | | | | 2.83 | |
Portfolio turnover rate (%) | | | 7 | (c) | | | 9 | | | | 9 | | | | 10 | | | | 8 | | | | 11 | |
Net assets, end of period (in millions) | | $ | 386.4 | | | $ | 394.0 | | | $ | 405.3 | | | $ | 422.9 | | | $ | 375.4 | | | $ | 329.2 | |
Please see following page for Financial Highlights footnote legend.
See accompanying notes to financial statements.
MSF-18
Metropolitan Series Fund
MSCI EAFE Index Portfolio
Financial Highlights
| | | | | | | | | | | | | | | | | | | | | | | | |
| Selected per share data | | | | | | | | | | | | | | | | | | |
| | | Class E | |
| | | Six Months
Ended
June 30,
2016
(Unaudited) | | | Year Ended December 31, | |
| | | | 2015
| | | 2014
| | | 2013
| | | 2012
| | | 2011
| |
Net Asset Value, Beginning of Period | | $ | 12.08 | | | $ | 12.60 | | | $ | 13.75 | | | $ | 11.66 | | | $ | 10.17 | | | $ | 11.89 | |
| | | | | | | | | | | | | | | | | | | | | | | | |
Income (Loss) from Investment Operations | | | | | | | | | | | | | | | | | | | | | | | | |
Net investment income (a) | | | 0.23 | | | | 0.32 | | | | 0.44 | | | | 0.33 | | | | 0.33 | | | | 0.34 | |
Net realized and unrealized gain (loss) on investments | | | (0.61 | ) | | | (0.44 | ) | | | (1.26 | ) | | | 2.13 | | | | 1.48 | | | | (1.79 | ) |
| | | | | | | | | | | | | | | | | | | | | | | | |
Total from investment operations | | | (0.38 | ) | | | (0.12 | ) | | | (0.82 | ) | | | 2.46 | | | | 1.81 | | | | (1.45 | ) |
| | | | | | | | | | | | | | | | | | | | | | | | |
Less Distributions | | | | | | | | | | | | | | | | | | | | | | | | |
Distributions from net investment income | | | (0.29 | ) | | | (0.40 | ) | | | (0.33 | ) | | | (0.37 | ) | | | (0.32 | ) | | | (0.27 | ) |
| | | | | | | | | | | | | | | | | | | | | | | | |
Total distributions | | | (0.29 | ) | | | (0.40 | ) | | | (0.33 | ) | | | (0.37 | ) | | | (0.32 | ) | | | (0.27 | ) |
| | | | | | | | | | | | | | | | | | | | | | | | |
Net Asset Value, End of Period | | $ | 11.41 | | | $ | 12.08 | | | $ | 12.60 | | | $ | 13.75 | | | $ | 11.66 | | | $ | 10.17 | |
| | | | | | | | | | | | | | | | | | | | | | | | |
Total Return (%) (b) | | | (3.08 | ) (c) | | | (1.18 | ) | | | (6.11 | ) | | | 21.62 | | | | 18.13 | | | | (12.59 | ) |
| | | | | | |
Ratios/Supplemental Data | | | | | | | | | | | | | | | | | | | | | | | | |
Gross ratio of expenses to average net assets (%) | | | 0.53 | (d) | | | 0.55 | | | | 0.55 | | | | 0.55 | | | | 0.56 | | | | 0.56 | |
Net ratio of expenses to average net assets (%) (e) | | | 0.53 | (d) | | | 0.55 | | | | 0.55 | | | | 0.55 | | | | 0.55 | | | | 0.56 | |
Ratio of net investment income to average net assets (%) | | | 3.97 | (d) | | | 2.48 | | | | 3.26 | | | | 2.66 | | | | 3.11 | | | | 2.94 | |
Portfolio turnover rate (%) | | | 7 | (c) | | | 9 | | | | 9 | | | | 10 | | | | 8 | | | | 11 | |
Net assets, end of period (in millions) | | $ | 29.6 | | | $ | 31.3 | | | $ | 34.3 | | | $ | 38.9 | | | $ | 37.0 | | | $ | 35.5 | |
| |
| | | Class G | |
| | | Six Months
Ended
June 30,
2016
(Unaudited) | | | Year Ended December 31, | |
| | | | 2015
| | | 2014
| | | 2013
| | | 2012
| | | 2011
| |
Net Asset Value, Beginning of Period | | $ | 11.84 | | | $ | 12.36 | | | $ | 13.51 | | | $ | 11.47 | | | $ | 10.01 | | | $ | 11.70 | |
| | | | | | | | | | | | | | | | | | | | | | | | |
Income (Loss) from Investment Operations | | | | | | | | | | | | | | | | | | | | | | | | |
Net investment income (a) | | | 0.22 | | | | 0.29 | | | | 0.41 | | | | 0.31 | | | | 0.31 | | | | 0.31 | |
Net realized and unrealized gain (loss) on investments | | | (0.59 | ) | | | (0.42 | ) | | | (1.25 | ) | | | 2.09 | | | | 1.46 | | | | (1.75 | ) |
| | | | | | | | | | | | | | | | | | | | | | | | |
Total from investment operations | | | (0.37 | ) | | | (0.13 | ) | | | (0.84 | ) | | | 2.40 | | | | 1.77 | | | | (1.44 | ) |
| | | | | | | | | | | | | | | | | | | | | | | | |
Less Distributions | | | | | | | | | | | | | | | | | | | | | | | | |
Distributions from net investment income | | | (0.28 | ) | | | (0.39 | ) | | | (0.31 | ) | | | (0.36 | ) | | | (0.31 | ) | | | (0.25 | ) |
| | | | | | | | | | | | | | | | | | | | | | | | |
Total distributions | | | (0.28 | ) | | | (0.39 | ) | | | (0.31 | ) | | | (0.36 | ) | | | (0.31 | ) | | | (0.25 | ) |
| | | | | | | | | | | | | | | | | | | | | | | | |
Net Asset Value, End of Period | | $ | 11.19 | | | $ | 11.84 | | | $ | 12.36 | | | $ | 13.51 | | | $ | 11.47 | | | $ | 10.01 | |
| | | | | | | | | | | | | | | | | | | | | | | | |
Total Return (%) (b) | | | (3.10 | ) (c) | | | (1.31 | ) | | | (6.33 | ) | | | 21.44 | | | | 17.94 | | | | (12.65 | ) |
| | | | | | |
Ratios/Supplemental Data | | | | | | | | | | | | | | | | | | | | | | | | |
Gross ratio of expenses to average net assets (%) | | | 0.68 | (d) | | | 0.70 | | | | 0.70 | | | | 0.70 | | | | 0.71 | | | | 0.71 | |
Net ratio of expenses to average net assets (%) (e) | | | 0.68 | (d) | | | 0.70 | | | | 0.70 | | | | 0.70 | | | | 0.70 | | | | 0.71 | |
Ratio of net investment income to average net assets (%) | | | 3.85 | (d) | | | 2.32 | | | | 3.10 | | | | 2.49 | | | | 2.94 | | | | 2.80 | |
Portfolio turnover rate (%) | | | 7 | (c) | | | 9 | | | | 9 | | | | 10 | | | | 8 | | | | 11 | |
Net assets, end of period (in millions) | | $ | 93.9 | | | $ | 93.1 | | | $ | 90.7 | | | $ | 99.3 | | | $ | 69.8 | | | $ | 58.9 | |
| (a) | Per share amounts based on average shares outstanding during the period. |
| (b) | Total return does not reflect any insurance, sales, separate account or administrative charges of variable annuity or life insurance contracts or any additional expenses that contract owners may bear under their variable contracts. If these charges were included, the returns would be lower. |
| (c) | Periods less than one year are not computed on an annualized basis. |
| (d) | Computed on an annualized basis. |
| (e) | Includes the effects of management fee waivers (see Note 6 of the Notes to Financial Statements). |
See accompanying notes to financial statements.
MSF-19
Metropolitan Series Fund
MSCI EAFE Index Portfolio
Notes to Financial Statements—June 30, 2016 (Unaudited)
1. Organization
Metropolitan Series Fund (the “Trust”) is organized as a Delaware statutory trust and registered under the Investment Company Act of 1940, as amended (the “1940 Act”), as an open-end management investment company. The Trust, which is managed by MetLife Advisers, LLC (“MetLife Advisers” or the “Adviser”), an affiliate of MetLife, Inc., is currently comprised of thirty series, each of which operates as a distinct investment vehicle of the Trust. The portfolio included in this report is MSCI EAFE Index Portfolio (the “Portfolio”), which is diversified. Shares in the Portfolio are not offered directly to the general public and are currently available only to separate accounts established by Metropolitan Life Insurance Company (“MetLife”) and other affiliated life insurance companies.
The Portfolio has registered and offers four classes of shares: Class A, B, E and G shares. Shares of each Class of the Portfolio represent an equal pro rata interest in the Portfolio and generally give the shareholder the same voting, dividend, liquidation, and other rights. Investment income, realized and unrealized capital gains and losses, the common expenses of the Portfolio, and certain Portfolio-level expense reductions, if any, are allocated on a pro rata basis to each Class based on the relative net assets of each Class to the net assets of the Portfolio. Each Class of shares differs in its respective distribution plan and such distribution expenses are allocated to the corresponding Class of shares.
2. Significant Accounting Policies
The preparation of financial statements in conformity with accounting principles generally accepted in the United States of America (“GAAP”) requires management to make estimates and assumptions that affect the reported amounts of assets and liabilities and disclosure of contingent assets and liabilities as of the date of the financial statements and the reported amounts of income and expenses during the reporting period. Actual results could differ from those estimates. In the preparation of these financial statements, management has evaluated events and transactions subsequent to June 30, 2016 through the date the financial statements were issued.
The Portfolio is an investment company and follows the accounting and reporting guidance of the Financial Accounting Standards Board (“FASB”) Accounting Standards Codification Topic 946—Financial Services—Investment Companies and Topic 820—Fair Value Measurement. The following is a summary of significant accounting policies consistently followed by the Portfolio in the preparation of its financial statements.
Investment Valuation and Fair Value Measurements - Domestic and foreign equity securities, such as common stock, exchange-traded funds, rights, warrants, and preferred stock, that are traded on a securities exchange on a valuation date are generally valued at their last quoted sale price or official closing price on the primary exchange for such security, or, if no sales occurred on that day, at the last reported bid price. Equity securities traded over-the-counter (“OTC”) are generally valued at the last reported bid price. In the event of a major exchange closing during the trading day, the Adviser may use other market information obtained from quotation reporting systems, established market makers, or pricing services in valuing the securities. Valuation adjustments may be applied to certain foreign equity securities that are traded solely on foreign exchanges that close before the time as of which the Portfolio determines its NAV to account for the market movement between the close of the foreign exchanges and the time as of which the Portfolio determines its NAV. The Portfolio may use a systematic fair valuation model provided by a pricing service to value securities principally traded in these foreign markets in order to adjust for possible market movements or other changes that may occur between the close of the foreign exchanges and the time as of which the Portfolio determines its NAV. Foreign equity securities valued using these valuation adjustments are generally categorized as Level 2 within the fair value hierarchy. Equity securities that are actively traded, and have no valuation adjustments applied, are categorized as Level 1 within the fair value hierarchy. Other equity securities traded on inactive markets, or valued in reference to similar instruments traded on active markets, are generally categorized as Level 2 within the fair value hierarchy.
Investments in registered open-end management investment companies are valued at reported net asset value per share on the valuation date and are categorized as Level 1 within the fair value hierarchy.
Debt securities, including corporate, convertible and municipal bonds and notes; obligations of the U.S. Treasury and U.S. government agencies; foreign sovereign issues; and non-U.S. bonds, are generally valued on the basis of evaluated or composite bid quotations obtained from independent pricing services and/or brokers and dealers selected by the Adviser (each a “pricing service”), pursuant to authorization of and subject to general oversight by the Board of Trustees of the Trust (the “Board” or “Trustees”). Such pricing services may use matrix pricing, which considers observable inputs including, among other things, issuer details, maturity dates, interest rates, yield curves, rates of prepayment, credit risks/spreads, default rates, reported trades, broker dealer quotes and quoted prices for similar assets. Short-term obligations with a remaining maturity of sixty days or less may be valued at amortized cost in the absence of market quotes, so long as the amortized cost value of such short-term debt instrument is approximately the same as the fair value of the instrument as determined without the use of amortized cost valuation. Floating rate loans are generally valued on the basis of an evaluated or composite average of aggregate bid and ask quotations supplied by brokers or dealers, as obtained from the pricing service. Securities that use similar valuation techniques and inputs as described above are generally categorized as Level 2 within the fair value hierarchy.
MSF-20
Metropolitan Series Fund
MSCI EAFE Index Portfolio
Notes to Financial Statements—June 30, 2016—(Continued)
Options, whether on securities, indices, futures contracts, or otherwise, traded on exchanges are valued at the last sale price available as of the close of business on a valuation day or, if there is no such price available, at the last reported bid price. These types of options are categorized as Level 1 within the fair value hierarchy. Futures contracts that are traded on commodity exchanges are valued at their settlement prices established by the exchanges on which they are traded as of the close of such exchanges and are categorized as Level 1 within the fair value hierarchy.
If no current market value quotation or other observable inputs are readily available or market value quotations are deemed to be unreliable for an investment, the fair value of the investment will be determined in accordance with procedures approved by, and under the general supervision of, the Board. In such a circumstance, the Board will be assisted in its responsibility to determine the fair value of an investment by the Valuation Committee (“Committee”) of MetLife Advisers. The Committee provides general pricing oversight and fair value pricing determinations related to portfolio securities and meets on a regular basis to review reports relating to the valuation of the securities in the Portfolio. The Board has delegated to State Street Bank and Trust Company, the Trust’s custodian (“custodian”), the responsibility for calculating the net asset values (“NAVs”) of the Trust’s Portfolios. The Committee is responsible for overseeing the calculation of the NAVs of the Portfolios by the custodian. The Committee also periodically reviews pricing services, including the pricing services providing fair value pricing for the Portfolio’s foreign securities, and is responsible for overseeing the correction of pricing errors and addressing other pricing issues that arise in the ordinary course of business, such as making real-time fair value determinations, as necessary.
No single standard for determining the fair value of an investment can be set forth because fair value depends upon the facts and circumstances with respect to each investment. Information relating to any relevant factors may be obtained by the Committee from any appropriate source, including the subadviser of the Portfolio, the custodian, a pricing service, market maker and/or broker for such security or the issuer. Appropriate methodologies for determining fair value under particular circumstances may include: matrix pricing, a discounted cash flow analysis, comparisons of securities with comparable characteristics, value based on multiples of earnings, discount from market price of similar marketable securities or a combination of these and other methods.
Investment Transactions and Related Investment Income - Portfolio security transactions are recorded on the trade date. Dividend income is recorded on the ex-dividend date or, for certain foreign securities, when notified. Interest income, which includes amortization of premium and accretion of discount on debt securities, is recorded on the accrual basis. Realized gains and losses on investments are determined on the identified cost basis, which is the same basis used for federal income tax purposes. Foreign income and foreign capital gains on some foreign securities may be subject to foreign taxes, which are accrued as applicable. These foreign taxes have been provided for in accordance with the Portfolio’s understanding of the applicable countries’ tax rules and rates.
Foreign Currency Translation - The books and records of the Portfolio are maintained in U.S. dollars. The values of securities, currencies, and other assets and liabilities denominated in currencies other than the U.S. dollar are translated into U.S. dollars based upon foreign exchange rates prevailing at the end of the period. Purchases and sales of investment securities, income, and expenses are translated on the respective dates of such transactions. Because the values of investment securities are translated at the foreign exchange rates prevailing at the end of the period, that portion of the results of operations arising from changes in exchange rates and that portion of the results of operations reflecting fluctuations arising from changes in market prices of the investment securities are not separated. Such fluctuations are included in the net realized and unrealized gain or loss on investments.
Net realized foreign exchange gains or losses arise from activity in forward foreign currency exchange contracts, sales of foreign currency, currency gains or losses realized between the trade and settlement dates on securities transactions, and the difference between the amounts of dividends, interest, and foreign withholding taxes recorded by the Portfolio and the U.S. dollar equivalent of the amounts actually received or paid by the Portfolio. Net unrealized foreign exchange gains and losses arise from changes in the value of assets and liabilities, other than investment securities, resulting from changes in foreign exchange rates.
Dividends and Distributions to Shareholders - The Portfolio records dividends and distributions on the ex-dividend date. Net realized gains from securities transactions (if any) are generally distributed annually to shareholders. The timing and characterization of certain income and capital gains distributions are determined in accordance with federal tax regulations that may differ from GAAP. Permanent book and tax basis differences relating to shareholder distributions will result in reclassification between under/over distributed net investment income, accumulated net realized gains/losses, and paid-in surplus. Book-tax differences are primarily due to foreign currency transactions and passive foreign investment companies (PFICs). These adjustments have no impact on net assets or the results of operations.
Income Taxes - It is the Portfolio’s policy to comply with the requirements of the Internal Revenue Code of 1986, as amended, and regulations thereunder, applicable to regulated investment companies and to distribute, with respect to each taxable year, all of its taxable income to shareholders. Therefore, no federal income tax provision is required. The Portfolio files U.S. federal tax returns. No income tax returns are currently under examination. The Portfolio’s federal tax returns for the prior three fiscal years remain subject to examination by the Internal Revenue Service. As of June 30, 2016, the Portfolio had no uncertain tax positions that would require financial statement recognition, or de-recognition or disclosure.
MSF-21
Metropolitan Series Fund
MSCI EAFE Index Portfolio
Notes to Financial Statements—June 30, 2016—(Continued)
Repurchase Agreements - The Portfolio may enter into repurchase agreements, under the terms of a Master Repurchase Agreement (“MRA”), with selected commercial banks and broker-dealers, under which the Portfolio acquires securities as collateral and agrees to resell the securities at an agreed-upon time and at an agreed-upon price. The Portfolio, through the custodian or a subcustodian, under a tri-party repurchase agreement, receives delivery of the underlying securities collateralizing any repurchase agreements. It is the Portfolio’s policy that the market value of the collateral be equal to at least 100% of the repurchase price in the case of a repurchase agreement of one-day duration and equal to at least 102% of the repurchase price in the case of all other repurchase agreements. In the event of default or failure by a party to perform an obligation in connection with any repurchase transaction, the MRA gives the non-defaulting party the right to set-off claims and to apply property held by it in connection with any repurchase transaction against obligations owed to it.
Securities Lending - The Portfolio may lend its portfolio securities to certain qualified brokers who borrow securities in order to complete certain securities transactions. By lending its portfolio securities, the Portfolio attempts to increase its net investment income through the receipt of income on collateral held from securities on loan. Any gain or loss in the market price of the loaned securities that might occur and any interest earned or dividends declared during the term of the loan would accrue to the account of the Portfolio.
The Trust has entered into a Securities Lending Authorization Agreement with the custodian as the lending agent. Under this agreement, the custodian is authorized to loan portfolio securities on the Portfolio’s behalf. In exchange, the Portfolio receives either cash or securities as collateral against the loaned securities. The Portfolio receives collateral equal to at least 102% of the market value of the loaned securities (105% for foreign equity securities), at each loan’s inception. Collateral representing at least 100% of the market value of the loaned securities must be maintained for the duration of the loan. Cash collateral is generally invested in the State Street Navigator Securities Lending MET Portfolio (the “Navigator Portfolio”), a series of the State Street Navigator Securities Lending Trust that is managed by an affiliate of the custodian. The Navigator Portfolio is a registered money market fund that invests in a variety of high-quality, U.S. dollar-denominated instruments. If the market value of the collateral at the close of trading on a business day is less than 100% of the market value of the loaned securities at the close of trading on that day, the borrower shall be required to deliver, by the close of business on the following business day, an additional amount of collateral, so that the total amount of posted collateral is equal to at least 100% of the market value of all the loaned securities as of such preceding day. A portion of net income (income after the deduction of expenses and fees of the Navigator Portfolio) on the collateral is rebated to the borrower of the securities and the remainder is split between the custodian and the Portfolio. On loans collateralized by U.S. Treasuries, a fee is received from the borrower and is allocated between the Portfolio and the custodian. Income received by the Portfolio in securities lending transactions during the six months ended June 30, 2016 is reflected as Securities lending income on the Statement of Operations. The values of any securities loaned by the Portfolio and the related collateral at June 30, 2016 are disclosed in the footnotes to the Schedule of Investments. The value of the related collateral received by the Portfolio exceeded the value of the securities out on loan at June 30, 2016.
The risks associated with lending portfolio securities include, but are not limited to, possible delays in receiving additional collateral or in the recovery of the loaned securities, possible loss of rights in the collateral should the borrower fail financially, as well as risk of loss in the value of the collateral or the value of the investments made with the collateral. The lending agent shall indemnify the Portfolio in the case of default of any securities borrower.
The following table provides a breakdown of the collateral received and the remaining contractual maturities for securities lending transactions, which are accounted for as secured borrowings.
| | | | | | | | | | | | | | | | | | | | |
| | | Remaining Contractual Maturity of the Agreements
As of June 30, 2016 | |
| | | Overnight and
Continuous | | | Up to
30 Days | | | 31 - 90
Days | | | Greater than
90 days | | | Total | |
| Securities Lending Transactions | | | | | | | | | | | | | | | | | | | | |
Common Stocks | | $ | (50,783,492 | ) | | $ | — | | | $ | — | | | $ | — | | | $ | (50,783,492 | ) |
Mutual Funds | | | (31,019,401 | ) | | | — | | | | — | | | | — | | | | (31,019,401 | ) |
Preferred Stocks | | | (526,928 | ) | | | — | | | | — | | | | — | | | | (526,928 | ) |
Rights | | | (21,181 | ) | | | — | | | | — | | | | — | | | | (21,181 | ) |
Total | | $ | (82,351,002 | ) | | $ | — | | | $ | — | | | $ | — | | | $ | (82,351,002 | ) |
Total Borrowings | | $ | (82,351,002 | ) | | $ | — | | | $ | — | | | $ | — | | | $ | (82,351,002 | ) |
Gross amount of recognized liabilities for securities lending transactions | | | $ | (82,351,002 | ) |
| | | | | | | | | | | | | | | | | | | | |
3. Investments in Derivative Instruments
Futures Contracts - The Portfolio may buy and sell futures contracts as a hedge, to maintain investment exposure to a target asset class or to enhance return. The Portfolio may be subject to fluctuations in equity prices, interest rates, commodity prices, and foreign
MSF-22
Metropolitan Series Fund
MSCI EAFE Index Portfolio
Notes to Financial Statements—June 30, 2016—(Continued)
currency exchange rates in the normal course of pursuing its investment objective. Futures contracts are standardized agreements to buy or sell a security, or deliver a final cash settlement price in connection with an index, interest rate, currency, or other asset. The Portfolio must deposit an amount (“initial margin”) equal to a certain percentage of the face value of the futures contract. The initial margin may be in the form of cash or securities, which is returned when the Portfolio’s obligations under the contract have been satisfied. If cash is deposited as the initial margin, it is shown as cash collateral on the Statement of Assets and Liabilities. Futures contracts are marked-to-market daily, and subsequent payments (“variation margin”) are made or received by the Portfolio depending on whether unrealized gains or losses are incurred. These amounts are reflected as receivables or payables on the Statement of Assets and Liabilities and as a component of net change in unrealized appreciation/depreciation on the Statement of Operations. When the contract is closed or expires, the Portfolio records a realized gain or loss equal to the difference between the value of the contract at the time it was opened and the value at the time it was closed. Risks of entering into futures contracts (and related options) include the possibility that the market for these instruments may be illiquid and that a change in the value of the contract or option may not correlate perfectly with changes in the value of the underlying instrument. If futures contracts are exchange-traded, the exchange’s clearinghouse, as counterparty to all exchange-traded futures, guarantees the futures contracts against default. For OTC futures, the Portfolio’s ability to terminate the positions may be more limited than in the case of exchange-traded positions and may also involve the risk that securities dealers participating in such transactions would fail to meet their obligations to the Portfolio.
The following table summarizes the fair value of derivatives held by the Portfolio at June 30, 2016 by category of risk exposure:
| | | | | | |
| | | Liability Derivatives | |
Risk Exposure | | Statement of Assets &
Liabilities Location | | Fair Value | |
Equity | | Unrealized depreciation on futures contracts (a) | | $ | 31,688 | |
| | | | | | |
| | (a) | Includes cumulative appreciation/depreciation of futures contracts as reported in the Schedule of Investments. Only the current day’s variation margin is reported within the Statement of Assets and Liabilities. |
The following tables summarize the effect of derivative instruments on the Statement of Operations, classified by derivative type and category of risk exposure, for the six months ended June 30, 2016:
| | | | |
Statement of Operations Location—Net Realized Gain (Loss) | | Equity | |
Futures contracts | | $ | (584,119 | ) |
| | | | |
| |
Statement of Operations Location—Net Change in Unrealized Appreciation (Depreciation) | | Equity | |
Futures contracts | | $ | 73,387 | |
| | | | |
For the six months ended June 30, 2016, the average notional par or face amount outstanding for each derivative type was as follows:
| | | | |
Derivative Description | | Average
Notional Par or
Face Amount‡ | |
Futures contracts long | | $ | 8,950 | |
| | ‡ | Averages are based on activity levels during the period. |
4. Certain Risks
In the normal course of business, the Portfolio invests in securities and enters into transactions where risks exist due to fluctuations in the market (“market risk”) or failure of the other party to a transaction to perform (“credit and counterparty risk”).
Market Risk: The value of securities held by the Portfolio may decline in response to certain events, including those directly involving the companies whose securities are owned by the Portfolio; conditions affecting the general economy; overall market changes; local, regional or global political, social or economic instability; and currency, interest rate, and price fluctuations.
Credit and Counterparty Risk: The Portfolio may be exposed to counterparty risk, or the risk that an entity with which the Portfolio has unsettled or open transactions may default. The potential loss could exceed the value of the financial assets and liabilities recorded in the financial statements. Financial assets that potentially expose the Portfolio to credit and counterparty risk consist principally of cash due from counterparties and investments. The Portfolio manages counterparty risk by entering into agreements only with counterparties that it believes have the financial resources to honor their obligations and by monitoring the financial stability of those counterparties. The Portfolio’s investment adviser attempts to mitigate counterparty risk by (i) periodically assessing
MSF-23
Metropolitan Series Fund
MSCI EAFE Index Portfolio
Notes to Financial Statements—June 30, 2016—(Continued)
the creditworthiness of its trading partners, (ii) monitoring and/or limiting the amount of its net exposure to each individual counterparty based on its assessment, and (iii) requiring collateral from the counterparty for certain transactions. In order to preserve certain safeguards for non-standard settlement trades, the Portfolio restricts its exposure to credit and counterparty losses by entering into master netting agreements (“Master Agreements”) with counterparties (approved brokers) with whom it undertakes a significant volume of transactions. Master Agreements govern the terms of certain transactions, and reduce the counterparty risk associated with relevant transactions by specifying credit protection mechanisms and providing standardization that improves legal certainty. Master Agreements can also help limit counterparty risk by specifying collateral posting arrangements at pre-arranged exposure levels.
Repurchase and reverse repurchase agreements are primarily executed under Global Master Repurchase Agreements (“GMRAs”) or Master Repurchase Agreements (“MRAs”), which provide the rights to set-off. Each repurchase and reverse repurchase agreement is initially collateralized at the transaction level. In the event of default, the total market value exposure will be offset against collateral exchanged to date, which would result in a net receivable/(payable) that would be due from/to the counterparty.
Customer Account Agreements and related addenda govern cleared derivatives transactions such as futures, options on futures, and cleared OTC derivatives. Cleared derivative transactions require posting of initial margin as determined by each relevant clearing agency, which is segregated at a broker account registered with the Commodities Futures Trading Commission (“CFTC”), or the applicable regulator. In the U.S., counterparty risk is significantly reduced as creditors of the futures broker do not have claim to Portfolio assets in the segregated account. Additionally, portability of exposure in the event of default further reduces risk to the Portfolio. Variation margin, or changes in market value, are exchanged daily, but may not be netted between futures and cleared OTC derivatives.
Foreign Investment Risk: The investments by the Portfolio in foreign securities may involve risks not present in domestic investments. Because securities may be denominated in foreign currencies, may require settlement in foreign currencies and may pay interest or dividends in foreign currencies, changes in the relationship of these foreign currencies to the U.S. dollar can significantly affect the value of the investments and earnings of the Portfolio. Foreign investments may also subject the Portfolio to foreign government exchange restrictions, expropriation, taxation or other political, social or economic developments, all of which could affect the market and/or credit risk of the investments. In addition to the risks described above, risks may arise from forward foreign currency contracts with respect to the potential inability of counterparties to meet the terms of their contracts.
Additional risks associated with each type of investment are described above within the respective security type notes. The Portfolio’s prospectus includes a discussion of the principal risks of investing in the Portfolio.
5. Investment Transactions
Aggregate cost of purchases and proceeds of sales of investment securities, excluding short-term securities, for the six months ended June 30, 2016 were as follows:
| | | | | | | | | | | | |
Purchases | | | Sales | |
U.S. Government | | Non U.S. Government | | | U.S. Government | | | Non U.S. Government | |
| $0 | | $ | 116,236,971 | | | $ | 0 | | | $ | 64,965,797 | |
6. Investment Management Fees and Other Transactions with Affiliates
Investment Management Agreement - MetLife Advisers is the investment adviser to the Portfolio. The Trust has entered into an investment management agreement with MetLife Advisers with respect to the Portfolio. For providing investment management services to the Portfolio, MetLife Advisers receives monthly compensation at the annual rate of 0.300% of average daily net assets. Fees earned by MetLife Advisers with respect to the Portfolio for the six months ended June 30, 2016 were $1,439,107.
MetLife Advisers has entered into an investment subadvisory agreement with MetLife Investment Advisors, LLC (“MIA”) with respect to managing the Portfolio. For providing subadvisory services to the Portfolio, MetLife Advisers has agreed to pay MIA an investment subadvisory fee for each class of the Portfolio as follows:
| | |
% per annum | | Average Daily Net Assets |
| 0.050% | | On the first $500 million |
| 0.040% | | Of the next $500 million |
| 0.020% | | On amounts over $1 billion |
Fees earned by MIA with respect to the Portfolio for the six months ended June 30, 2016 were $216,418.
MSF-24
Metropolitan Series Fund
MSCI EAFE Index Portfolio
Notes to Financial Statements—June 30, 2016—(Continued)
Management Fee Waiver - Pursuant to a management fee waiver agreement, the Adviser has agreed, for the period May 1, 2016 to April 30, 2017, to reduce its advisory fees set out above under “Investment Management Agreement” for each class of the Portfolio as follows:
| | |
% per annum | | Average Daily Net Assets |
| 0.005% | | Over $500 million and under $1 billion |
| 0.010% | | Of the next $1 billion |
| 0.015% | | On amounts over $2 billion |
An identical agreement was in place for the period May 1, 2015 to April 30, 2016. Amounts waived for the six months ended June 30, 2016 are shown as a management fee waiver in the Statement of Operations.
Certain officers and trustees of the Trust may also be officers of MetLife Advisers; however, such officers and trustees receive no compensation from the Trust.
On January 12, 2016, MetLife, Inc. announced its plan to pursue the separation of a substantial portion of its retail segment and is currently evaluating structural alternatives for such separation. It is anticipated that MetLife Advisers would be included in any such separation. Any separation transaction that might occur will be subject to the satisfaction of various conditions and approvals, including approval of any transaction by the MetLife, Inc. Board of Directors, satisfaction of any applicable requirements of the SEC, and receipt of insurance and other regulatory approvals and other anticipated conditions. Because the form of a separation had yet to be determined, MetLife, Inc. cannot currently provide a specific potential completion date or information about the potential impact on MetLife Advisers. No assurance can be given regarding the form that a separation transaction may take or the specific terms thereof, or that a separation will in fact occur. Depending on the form a separation takes, MetLife Advisers’ continued service as investment adviser to the Trusts could be subject to the satisfaction of various conditions and approvals, which may include obtaining approvals from the Trusts’ Board and shareholders.
Transfer Agency Agreement - MetLife serves as the transfer agent for the Trust. MetLife receives no fees for its services to the Trust under the transfer agency agreement.
Distribution and Service Fees - The Trust has a distribution agreement with MetLife Investors Distribution Company (“MIDC” or the “Distributor”) in which MIDC serves as the distributor for the Portfolio’s Class A, B, E, and G Shares. MIDC is a wholly-owned subsidiary of MetLife Investors Group, LLC, an affiliate of the Adviser. The Trust has also adopted a Distribution and Service Plan under Rule 12b-1 of the 1940 Act for the Portfolio’s Class B, E, and G Shares. Under the Distribution and Service Plan, the Class B, E, and G Shares of the Portfolio pay a fee to compensate the Insurance Companies (or their affiliates) and other broker-dealers and financial intermediaries involved in the offer and sale of Portfolio shares for promoting or selling and servicing the Class B, E, and G Shares of the Portfolio. The fees under the Distribution and Service Plan for each class of the Portfolio’s shares are calculated as a percentage of the Portfolio’s average daily net assets that are attributable to that Class. Currently, the fee is 0.25% per year for Class B Shares, 0.15% per year for Class E Shares, and 0.30% per year for Class G Shares. Amounts incurred by the Portfolio for the six months ended June 30, 2016 are shown as Distribution and service fees in the Statement of Operations.
Deferred Trustee Compensation - Each Trustee who is not currently an employee of the Adviser or any of its affiliates receives compensation from the Trust for his or her service to the Trust. A deferred compensation plan (the “Plan”) is available to the Trustees on a voluntary basis. Deferred amounts remain in the Trust until distributed in accordance with the provisions of the Plan. The value of a participating Trustee’s deferral account is based on theoretical investments of deferred amounts on the normal payment dates in certain portfolios of the Trust or Met Investors Series Trust, an affiliate of the Trust, as designated by the participating Trustee. Changes in the value of participants’ deferral accounts are reflected as Trustees’ fees and expenses in the Statement of Operations. The portion of the accrued obligations allocated to the Portfolio under the Plan is reflected as Deferred trustees’ fees in the Statement of Assets and Liabilities.
7. Contractual Obligations
Under the Trust’s organizational documents, its officers and Trustees may be indemnified against certain liabilities and expenses arising out of the performance of their duties to the Trust. Additionally, the Trust has a variety of indemnification obligations under contracts with its service providers. The Trust’s maximum exposure under these arrangements is unknown, as this would involve future claims that may be made against the Trust that have not yet occurred.
MSF-25
Metropolitan Series Fund
MSCI EAFE Index Portfolio
Notes to Financial Statements—June 30, 2016—(Continued)
8. Income Tax Information
The tax character of distributions paid for the years ended December 31, 2015 and 2014 were as follows:
| | | | | | | | | | | | | | | | | | | | |
Ordinary Income | | | Long-Term Capital Gain | | | Total | |
2015 | | 2014 | | | 2015 | | | 2014 | | | 2015 | | | 2014 | |
| $30,966,932 | | $ | 23,267,550 | | | $ | — | | | $ | — | | | $ | 30,966,932 | | | $ | 23,267,550 | |
As of December 31, 2015, the components of distributable earnings (accumulated losses) on a federal income tax basis were as follows:
| | | | | | | | | | | | | | | | | | | | |
Undistributed
Ordinary
Income | | Undistributed
Long-Term
Capital Gain | | | Net
Unrealized
Appreciation | | | Loss Carryforwards | | | Other
Accumulated
Capital Losses | | | Total | |
| $24,771,084 | | $ | — | | | $ | 40,729,010 | | | $ | (26,531,041 | ) | | $ | (9,393,890 | ) | | $ | 29,575,163 | |
The Portfolio utilizes the provisions of the federal income tax laws that provide for the carryforward of capital losses for prior years, offsetting such losses against any future realized capital gains. Under the Regulated Investment Company Modernization Act of 2010 (the “Act”), net capital losses recognized after December 22, 2010 may be carried forward indefinitely and their character is retained as short-term and/or long-term losses. Previously, net capital losses were carried forward for up to eight years and treated as short-term losses. As a transition rule, the Act requires that post-enactment net capital losses be used before pre-enactment net capital losses.
As of December 31, 2015, the post-enactment accumulated short-term capital losses were $994,804, the post-enactment accumulated long-term capital losses were $8,399,086 and the pre-enactment accumulated capital loss carryforwards and expiration dates were as follows:
| | | | | | | | |
Expiring
12/31/17 | | Expiring
12/31/18 | | | Total | |
| $23,421,712 | | $ | 3,109,329 | | | $ | 26,531,041 | |
MSF-26
Metropolitan Series Fund
Neuberger Berman Genesis Portfolio
Managed By Neuberger Berman Investment Advisers LLC
Portfolio Manager Commentary*
PERFORMANCE
For the six month period ended June 30, 2016, the Class A, B and E shares of the Neuberger Berman Genesis Portfolio returned 5.92%, 5.84%, and 5.92%, respectively. The Portfolio’s benchmark, the Russell 2000 Value Index1, returned 6.08%.
MARKET ENVIRONMENT / CONDITIONS
The U.S. stock market experienced periods of volatility, but generated a positive return during the first half of 2016. The market began the year on a weak note amid declining oil prices and concerns that the slowdown in China would impact the global economy. After treading water in February, the market then rallied sharply over the next three months. Investor risk appetite returned given signs of resiliency by the U.S. economy, rising energy prices and indications from the Federal Reserve that it would take a measured approach in terms of raising interest rates. While the market sold off sharply in the immediate aftermath of the June 23rd U.K. referendum to leave the European Union (“Brexit”), U.S. equities recouped those losses later in the month. The overall U.S. stock market, as measured by the S&P 500 Index, gained 3.84% for the six months ended June 30, 2016. Small-cap stocks generated a modest gain, as the Russell 2000 Index returned 2.22% during the reporting period. There was a significant dispersion between small-cap growth and value stocks, as the Russell 2000 Growth and Value Indexes returned -1.59% and 6.08%, respectively.
PORTFOLIO REVIEW / PERIOD END POSITIONING
The Portfolio narrowly underperformed the Russell 2000 Value Index during the reporting period. Strong stock selection drove the Portfolio’s performance, whereas sector allocation was a drag on results.
The largest detractors from performance from a sector perspective were holdings in the Materials, Information Technology and Consumer Staples sectors. A number of individual holdings were negative for performance due to company-specific issues. These included Zebra Technologies Corporation, Bank of the Ozarks, Inc. and Nexstar Broadcasting. Zebra Technologies designs and manufactures enterprise mobile computers, advanced data capture devices, radio frequency identification scanners and specialty printers. The company recently reported weaker than expected results and provided guidance
that was below its previously issued guidance. Bank of the Ozarks is focused on underwriting complex commercial real estate loans. It has a long track record of above-average growth and profitability, as well as conservative underwriting. The stock has lagged due to concerns about the company’s ability to sustain strong growth and operating returns amid increased regulatory scrutiny on commercial real estate lenders, fears of a slowing economy and prolonged low interest rates. Nexstar Broadcasting is a local television broadcasting company. The stock was under pressure as a result of delayed approval for its acquisition of Media General owing to the pending spectrum auction, concerns over peaking auto production, generally sluggish economic activity and the aggregate amount of political spending.
The largest contributors to performance during the reporting period were in the Health Care, Industrials and Consumer Discretionary sectors. Examples of individual stocks that produced strong returns included West Pharmaceutical Services, Inc., Church & Dwight Co., Inc. and FEI Company. Along with a dominant position in drug packaging (rubbers stoppers for injectable drug vials), West Pharmaceutical Services operates a nascent drug delivery segment where they’ve received commercial orders. During the reporting period the company reported solid revenue and earnings per share (EPS) growth. Church & Dwight is a manufacturer of household and personal care products. In our view, the company has a durable business model with a balanced portfolio of value-oriented and premium brands. The stock performed well during the second quarter, as the company continued to deliver strong results despite ongoing industry pressures. FEI Company designs, manufactures and sells ion beam workstations, electron microscopes and components. FEI Company recently received a takeover offer from Thermo Fisher Scientific.
Sector allocation detracted from performance during the reporting period. An overweight to the Health Care sector was the largest negative for relative returns. Having no exposure to real estate investment trusts (“REITs”) also detracted from results. We do not typically own REITs, as they do not meet our investment criteria. Elsewhere, having no allocation to the Utilities sector was a drag on performance. On the upside, an overweight to Materials and an underweight to Financials were the largest contributors to performance.
While there were several changes on the margin, there were no significant adjustments to the Portfolio’s sector positioning during the reporting period.
As a U.S. small cap manager, we are less exposed to potential European malaise than our larger-cap fellows. Moreover, we have been nervous about the viability of the euro and the European banking system for years and have maintained a conservative positioning in light of this view. The Portfolio, by design, is comprised of companies with differentiated business models that have consistently generated solid free cash flow, enjoyed healthy levels of profitability and maintained conservative balance sheets. These businesses, on a relative basis, have historically performed well in difficult macro
MSF-1
Metropolitan Series Fund
Neuberger Berman Genesis Portfolio
Managed By Neuberger Berman Investment Advisers LLC
Portfolio Manager Commentary*—(Continued)
environments. We believe they will emerge stronger after economic or financial stress, as they are able to increase market share and use their financial strength to enhance long-term shareholder value.
Judith M. Vale,
Robert W. D’Alelio
Michael L. Bowyer
Brett S. Reiner
Portfolio Managers
Neuberger Berman Investment Advisers LLC
* This commentary may include statements that constitute “forward-looking statements” under the U.S. securities laws. Forward-looking statements include, among other things, projections, estimates, and information about possible or future results related to the Portfolio, market or regulatory developments. The views expressed above are not guarantees of future performance or economic results and involve certain risks, uncertainties and assumptions that could cause actual outcomes and results to differ materially from the views expressed herein. The views expressed above are subject to change at any time based upon economic, market, or other conditions and the subadvisory firm undertakes no obligation to update the views expressed herein. Any discussions of specific securities should not be considered a recommendation to buy or sell those securities. The views expressed above (including any forward-looking statement) may not be relied upon as investment advice or as an indication of the Portfolio’s trading intent. Information about the Portfolio’s holdings, asset allocation or country diversification is historical and is not an indication of future Portfolio composition, which may vary. Direct investment in any index is not possible. The performance of any index mentioned in this commentary has not been adjusted for ongoing management, distribution and operating expenses, and sales charges applicable to mutual fund investments. In addition, the returns do not reflect additional fees charged by separate accounts or variable insurance contracts that an investor in the Portfolio may pay. If these additional fees were reflected, performance would have been lower.
MSF-2
Metropolitan Series Fund
Neuberger Berman Genesis Portfolio
A $10,000 INVESTMENT COMPARED TO THE RUSSELL 2000 VALUE INDEX
SIX MONTH RETURN & AVERAGE ANNUAL RETURNS (%) AS OF JUNE 30, 2016
| | | | | | | | | | | | | | | | |
| | | 6 Month | | | 1 Year | | | 5 Year | | | 10 Year | |
| Neuberger Berman Genesis Portfolio | | | | | | | | | | | | | | | | |
Class A | | | 5.92 | | | | 1.54 | | | | 9.17 | | | | 4.50 | |
Class B | | | 5.84 | | | | 1.34 | | | | 8.90 | | | | 4.25 | |
Class E | | | 5.92 | | | | 1.44 | | | | 9.01 | | | | 4.36 | |
| Russell 2000 Value Index | | | 6.08 | | | | -2.58 | | | | 8.14 | | | | 5.15 | |
1 The Russell 2000 Value Index is an unmanaged measure of performance of those Russell 2000 companies that have lower price-to-book ratios and lower forecasted growth values.
Portfolio performance is calculated including reinvestment of all income and capital gain distributions. Performance numbers are net of all Portfolio expenses but do not include any insurance, sales, separate account or administrative charges of variable annuity or life insurance contracts or any additional expenses that participants may bear relating to the operations of their plans. If these charges were included, the returns would be lower. The performance of any index referenced above has not been adjusted for ongoing management, distribution and operating expenses, and sales charges applicable to mutual fund investments. Direct investment in any index is not possible. The performance of Class A shares, as set forth in the line graph above, will differ from that of other classes because of the difference in expenses paid by policyholders investing in the different share classes.
This information represents past performance and is not indicative of future results. Investment return and principal value may fluctuate so that shares, upon redemption, may be worth more or less than the original cost.
PORTFOLIO COMPOSITION AS OF JUNE 30, 2016
Top Holdings
| | | | |
| | | % of
Net Assets | |
| Church & Dwight Co., Inc. | | | 2.5 | |
| West Pharmaceutical Services, Inc. | | | 2.3 | |
| Sensient Technologies Corp. | | | 2.0 | |
| AptarGroup, Inc. | | | 2.0 | |
| Tyler Technologies, Inc. | | | 2.0 | |
| Pool Corp. | | | 1.9 | |
| ICON plc | | | 1.7 | |
| Manhattan Associates, Inc. | | | 1.7 | |
| IDEXX Laboratories, Inc. | | | 1.6 | |
| Henry Schein, Inc. | | | 1.6 | |
Top Sectors
| | | | |
| | | % of
Net Assets | |
| Industrials | | | 20.7 | |
| Information Technology | | | 18.8 | |
| Health Care | | | 16.2 | |
| Consumer Discretionary | | | 12.3 | |
| Financials | | | 12.2 | |
| Materials | | | 9.1 | |
| Consumer Staples | | | 6.8 | |
| Energy | | | 2.3 | |
MSF-3
Metropolitan Series Fund
Neuberger Berman Genesis Portfolio
Understanding Your Portfolio’s Expenses (Unaudited)
Shareholder Expense Example
As a shareholder of the Portfolio, you incur ongoing costs, including management fees; distribution and service (12b-1) fees; and other Portfolio expenses. This example is intended to help you understand your ongoing costs (in dollars) (referred to as “expenses”) of investing in the Portfolio and compare these costs with the ongoing costs of investing in other mutual funds. The example is based on an investment of $1,000 invested at the beginning of the period and held for the entire period, January 1, 2016 through June 30, 2016.
Actual Expenses
The first line for each share class of the Portfolio in the table below provides information about actual account values and actual expenses. You may use the information in this line, together with the amount you invested in the particular share class of the Portfolio, to estimate the expenses that you paid over the period. Simply divide your account value by $1,000 (for example, an $8,600 account value divided by $1,000 = 8.6), then multiply the result by the number in the first line under the heading entitled “Expenses Paid During Period” to estimate the expenses you paid on your account during this period.
Hypothetical Example for Comparison Purposes
The second line for each share class of the Portfolio in the table below provides information about hypothetical account values and hypothetical expenses based on the Portfolio’s actual expense ratio and an assumed rate of return of 5% per year before expenses, which is not the Portfolio’s actual return. The hypothetical account values and expenses may not be used to estimate the actual ending account balance or expenses you paid for the period. You may use this information to compare the ongoing costs of investing in the Portfolio and other funds. To do so, compare this 5% hypothetical example with the 5% hypothetical examples that appear in the shareholder reports of the other funds.
Please note that the expenses shown in the table are meant to highlight your ongoing costs only and do not reflect any fees or charges of your variable insurance product or any additional expenses that participants in certain eligible qualified plans may bear relating to the operations of their plan. Therefore, the second line for each share class in the table is useful in comparing ongoing costs only, and will not help you determine the relative total costs of owning different funds. In addition, if these other costs were included, your costs would have been higher.
| | | | | | | | | | | | | | | | | | |
Neuberger Berman Genesis Portfolio | | | | Annualized
Expense
Ratio | | | Beginning
Account Value
January 1,
2016 | | | Ending
Account Value
June 30,
2016 | | | Expenses Paid
During Period**
January 1, 2016
to
June 30,
2016 | |
Class A(a) | | Actual | | | 0.84 | % | | $ | 1,000.00 | | | $ | 1,059.20 | | | $ | 4.30 | |
| | Hypothetical* | | | 0.84 | % | | $ | 1,000.00 | | | $ | 1,020.69 | | | $ | 4.22 | |
| | | | | |
Class B(a) | | Actual | | | 1.09 | % | | $ | 1,000.00 | | | $ | 1,058.40 | | | $ | 5.58 | |
| | Hypothetical* | | | 1.09 | % | | $ | 1,000.00 | | | $ | 1,019.44 | | | $ | 5.47 | |
| | | | | |
Class E(a) | | Actual | | | 0.99 | % | | $ | 1,000.00 | | | $ | 1,059.20 | | | $ | 5.07 | |
| | Hypothetical* | | | 0.99 | % | | $ | 1,000.00 | | | $ | 1,019.94 | | | $ | 4.97 | |
* Hypothetical assumes a rate of return of 5% per year before expenses.
** Expenses paid are equal to the Portfolio’s annualized expense ratio for the most recent six month period, as shown above, multiplied by the average account value over the period, multiplied by the number of days (182 days) in the most recent fiscal half-year, divided by 366 (to reflect the one-half year period).
(a) The annualized expense ratio shown reflects the impact of the management fee waiver as described in Note 6 of the Notes to Financial Statements.
MSF-4
Metropolitan Series Fund
Neuberger Berman Genesis Portfolio
Schedule of Investments as of June 30, 2016 (Unaudited)
Common Stocks—98.4% of Net Assets
| | | | | | | | |
| Security Description | | Shares | | | Value | |
| | |
Aerospace & Defense—0.4% | | | | | | | | |
Astronics Corp. (a) | | | 128,172 | | | $ | 4,263,001 | |
| | | | | | | | |
| | |
Air Freight & Logistics—0.7% | | | | | | | | |
Forward Air Corp. | | | 170,526 | | | | 7,593,523 | |
| | | | | | | | |
| | |
Airlines—0.5% | | | | | | | | |
Allegiant Travel Co. | | | 39,000 | | | | 5,908,500 | |
| | | | | | | | |
| | |
Auto Components—1.3% | | | | | | | | |
Drew Industries, Inc. | | | 122,500 | | | | 10,392,900 | |
Gentex Corp. | | | 282,150 | | | | 4,359,217 | |
| | | | | | | | |
| | | | | | | 14,752,117 | |
| | | | | | | | |
| | |
Banks—8.1% | | | | | | | | |
Bank of Hawaii Corp. | | | 223,950 | | | | 15,407,760 | |
Bank of the Ozarks, Inc. | | | 263,976 | | | | 9,904,380 | |
BankUnited, Inc. | | | 216,750 | | | | 6,658,560 | |
BOK Financial Corp. | | | 124,432 | | | | 7,801,886 | |
Community Bank System, Inc. | | | 145,137 | | | | 5,963,679 | |
Cullen/Frost Bankers, Inc. | | | 169,998 | | | | 10,833,973 | |
CVB Financial Corp. | | | 520,400 | | | | 8,529,356 | |
First Financial Bankshares, Inc. | | | 325,960 | | | | 10,688,228 | |
FNB Corp. | | | 580,798 | | | | 7,283,207 | |
LegacyTexas Financial Group, Inc. | | | 162,950 | | | | 4,384,984 | |
PacWest Bancorp | | | 130,978 | | | | 5,210,305 | |
| | | | | | | | |
| | | | | | | 92,666,318 | |
| | | | | | | | |
| | |
Beverages—0.4% | | | | | | | | |
Boston Beer Co., Inc. (The) - Class A (a) | | | 29,372 | | | | 5,023,493 | |
| | | | | | | | |
| | |
Building Products—1.9% | | | | | | | | |
A.O. Smith Corp. | | | 119,750 | | | | 10,551,173 | |
AAON, Inc. | | | 286,322 | | | | 7,876,718 | |
Advanced Drainage Systems, Inc. | | | 107,200 | | | | 2,934,064 | |
| | | | | | | | |
| | | | | | | 21,361,955 | |
| | | | | | | | |
| | |
Capital Markets—0.4% | | | | | | | | |
Artisan Partners Asset Management, Inc. - Class A | | | 120,600 | | | | 3,338,208 | |
OM Asset Management plc | | | 48,100 | | | | 642,135 | |
| | | | | | | | |
| | | | | | | 3,980,343 | |
| | | | | | | | |
| | |
Chemicals—3.9% | | | | | | | | |
Balchem Corp. | | | 170,713 | | | | 10,183,030 | |
NewMarket Corp. | | | 8,267 | | | | 3,425,679 | |
Quaker Chemical Corp. | | | 26,650 | | | | 2,377,180 | |
RPM International, Inc. | | | 112,550 | | | | 5,621,873 | |
Sensient Technologies Corp. | | | 324,250 | | | | 23,034,720 | |
| | | | | | | | |
| | | | | | | 44,642,482 | |
| | | | | | | | |
| | |
Commercial Services & Supplies—4.4% | | | | | | | | |
G&K Services, Inc. - Class A | | | 97,400 | | | | 7,457,918 | |
Healthcare Services Group, Inc. | | | 361,014 | | | | 14,938,759 | |
Ritchie Bros. Auctioneers, Inc. | | | 182,300 | | | | 6,158,094 | |
Rollins, Inc. | | | 595,965 | | | | 17,443,896 | |
|
Commercial Services & Supplies—(Continued) | |
UniFirst Corp. | | | 38,050 | | | | 4,403,146 | |
| | | | | | | | |
| | | | | | | 50,401,813 | |
| | | | | | | | |
| | |
Communications Equipment—0.7% | | | | | | | | |
NetScout Systems, Inc. (a) | | | 375,150 | | | | 8,347,088 | |
| | | | | | | | |
| | |
Construction & Engineering—0.9% | | | | | | | | |
Valmont Industries, Inc. | | | 76,400 | | | | 10,334,628 | |
| | | | | | | | |
| | |
Construction Materials—0.9% | | | | | | | | |
Eagle Materials, Inc. | | | 134,000 | | | | 10,338,100 | |
| | | | | | | | |
| | |
Containers & Packaging—2.5% | | | | | | | | |
AptarGroup, Inc. | | | 284,704 | | | | 22,528,628 | |
Silgan Holdings, Inc. | | | 117,750 | | | | 6,059,415 | |
| | | | | | | | |
| | | | | | | 28,588,043 | |
| | | | | | | | |
| | |
Distributors—1.9% | | | | | | | | |
Pool Corp. | | | 235,110 | | | | 22,107,393 | |
| | | | | | | | |
| | |
Diversified Financial Services—2.0% | | | | | | | | |
FactSet Research Systems, Inc. | | | 61,100 | | | | 9,862,762 | |
MarketAxess Holdings, Inc. | | | 92,150 | | | | 13,398,610 | |
| | | | | | | | |
| | | | | | | 23,261,372 | |
| | | | | | | | |
| | |
Electrical Equipment—0.2% | | | | | | | | |
AZZ, Inc. | | | 21,000 | | | | 1,259,580 | |
Thermon Group Holdings, Inc. (a) | | | 76,950 | | | | 1,478,210 | |
| | | | | | | | |
| | | | | | | 2,737,790 | |
| | | | | | | | |
|
Electronic Equipment, Instruments & Components—5.1% | |
Badger Meter, Inc. | | | 40,938 | | | | 2,989,702 | |
Cognex Corp. | | | 172,800 | | | | 7,447,680 | |
FEI Co. | | | 149,704 | | | | 16,000,364 | |
Littelfuse, Inc. | | | 123,550 | | | | 14,602,374 | |
Rogers Corp. (a) | | | 137,850 | | | | 8,422,635 | |
Zebra Technologies Corp. - Class A (a) | | | 183,932 | | | | 9,214,993 | |
| | | | | | | | |
| | | | | | | 58,677,748 | |
| | | | | | | | |
| | |
Energy Equipment & Services—1.3% | | | | | | | | |
Dril-Quip, Inc. (a) | | | 31,900 | | | | 1,863,917 | |
Natural Gas Services Group, Inc. (a) | | | 175,985 | | | | 4,030,057 | |
Oceaneering International, Inc. | | | 106,450 | | | | 3,178,597 | |
Pason Systems, Inc. | | | 394,800 | | | | 5,450,253 | |
| | | | | | | | |
| | | | | | | 14,522,824 | |
| | | | | | | | |
| | |
Food & Staples Retailing—0.2% | | | | | | | | |
North West Co., Inc. (The) | | | 103,700 | | | | 2,364,644 | |
| | | | | | | | |
| | |
Food Products—3.4% | | | | | | | | |
B&G Foods, Inc. | | | 73,750 | | | | 3,554,750 | |
Blue Buffalo Pet Products, Inc. (a) | | | 178,900 | | | | 4,175,526 | |
Cal-Maine Foods, Inc. | | | 67,100 | | | | 2,973,872 | |
Calavo Growers, Inc. | | | 68,700 | | | | 4,602,900 | |
See accompanying notes to financial statements.
MSF-5
Metropolitan Series Fund
Neuberger Berman Genesis Portfolio
Schedule of Investments as of June 30, 2016 (Unaudited)
Common Stocks—(Continued)
| | | | | | | | |
| Security Description | | Shares | | | Value | |
| | |
Food Products—(Continued) | | | | | | | | |
Flowers Foods, Inc. | | | 240,550 | | | $ | 4,510,313 | |
J&J Snack Foods Corp. | | | 80,609 | | | | 9,614,235 | |
Lancaster Colony Corp. | | | 72,100 | | | | 9,200,681 | |
| | | | | | | | |
| | | | | | | 38,632,277 | |
| | | | | | | | |
|
Health Care Equipment & Supplies—7.9% | |
Abaxis, Inc. | | | 136,254 | | | | 6,435,277 | |
Atrion Corp. | | | 2,900 | | | | 1,240,794 | |
Cantel Medical Corp. | | | 86,707 | | | | 5,959,372 | |
DENTSPLY SIRONA, Inc. | | | 264,850 | | | | 16,431,294 | |
Haemonetics Corp. (a) | | | 145,996 | | | | 4,232,424 | |
IDEXX Laboratories, Inc. (a) | | | 200,300 | | | | 18,599,858 | |
Natus Medical, Inc. (a) | | | 143,924 | | | | 5,440,327 | |
Neogen Corp. (a) | | | 42,700 | | | | 2,401,875 | |
Vascular Solutions, Inc. (a) | | | 70,300 | | | | 2,928,698 | |
West Pharmaceutical Services, Inc. | | | 347,416 | | | | 26,361,926 | |
| | | | | | | | |
| | | | | | | 90,031,845 | |
| | | | | | | | |
| | |
Health Care Providers & Services—4.2% | | | | | | | | |
Amsurg Corp. (a) | | | 124,292 | | | | 9,637,601 | |
Chemed Corp. | | | 71,600 | | | | 9,759,796 | |
Henry Schein, Inc. (a) | | | 100,850 | | | | 17,830,280 | |
Surgery Partners, Inc. (a) | | | 90,500 | | | | 1,619,950 | |
Surgical Care Affiliates, Inc. (a) | | | 90,107 | | | | 4,295,401 | |
U.S. Physical Therapy, Inc. | | | 79,200 | | | | 4,768,632 | |
| | | | | | | | |
| | | | | | | 47,911,660 | |
| | | | | | | | |
| | |
Hotels, Restaurants & Leisure—3.6% | | | | | | | | |
Brinker International, Inc. | | | 190,650 | | | | 8,680,295 | |
Cheesecake Factory, Inc. (The) | | | 116,200 | | | | 5,593,868 | |
Cracker Barrel Old Country Store, Inc. | | | 60,850 | | | | 10,433,949 | |
Papa John’s International, Inc. | | | 101,900 | | | | 6,929,200 | |
Texas Roadhouse, Inc. | | | 211,250 | | | | 9,633,000 | |
| | | | | | | | |
| | | | | | | 41,270,312 | |
| | | | | | | | |
| | |
Household Products—2.8% | | | | | | | | |
Church & Dwight Co., Inc. | | | 273,500 | | | | 28,140,415 | |
Energizer Holdings, Inc. | | | 26,300 | | | | 1,354,187 | |
WD-40 Co. | | | 19,400 | | | | 2,278,530 | |
| | | | | | | | |
| | | | | | | 31,773,132 | |
| | | | | | | | |
| | |
Industrial Conglomerates—0.3% | | | | | | | | |
Raven Industries, Inc. | | | 158,279 | | | | 2,997,804 | |
| | | | | | | | |
| | |
Insurance—1.7% | | | | | | | | |
AMERISAFE, Inc. | | | 52,300 | | | | 3,201,806 | |
RLI Corp. | | | 226,090 | | | | 15,550,470 | |
Safety Insurance Group, Inc. | | | 16,500 | | | | 1,016,070 | |
| | | | | | | | |
| | | | | | | 19,768,346 | |
| | | | | | | | |
| | |
Internet Software & Services—0.1% | | | | | | | | |
j2 Global, Inc. | | | 8,700 | | | | 549,579 | |
NIC, Inc. | | | 44,600 | | | | 978,524 | |
| | | | | | | | |
| | | | | | | 1,528,103 | |
| | | | | | | | |
| | |
IT Services—1.2% | | | | | | | | |
Jack Henry & Associates, Inc. | | | 154,850 | | | | 13,513,760 | |
| | | | | | | | |
| | |
Leisure Products—0.7% | | | | | | | | |
Polaris Industries, Inc. | | | 100,898 | | | | 8,249,420 | |
| | | | | | | | |
| | |
Life Sciences Tools & Services—3.6% | | | | | | | | |
Bio-Techne Corp. | | | 129,900 | | | | 14,648,823 | |
ICON plc (a) | | | 282,187 | | | | 19,755,912 | |
PAREXEL International Corp. (a) | | | 107,450 | | | | 6,756,456 | |
| | | | | | | | |
| | | | | | | 41,161,191 | |
| | | | | | | | |
| | |
Machinery—8.4% | | | | | | | | |
CLARCOR, Inc. | | | 183,302 | | | | 11,150,261 | |
Donaldson Co., Inc. | | | 136,650 | | | | 4,695,294 | |
Franklin Electric Co., Inc. | | | 149,650 | | | | 4,945,933 | |
Graco, Inc. | | | 69,650 | | | | 5,501,653 | |
Middleby Corp. (The) (a) | | | 111,600 | | | | 12,861,900 | |
Nordson Corp. | | | 132,562 | | | | 11,083,509 | |
RBC Bearings, Inc. (a) | | | 151,750 | | | | 11,001,875 | |
Tennant Co. | | | 105,078 | | | | 5,660,552 | |
Toro Co. (The) | | | 154,100 | | | | 13,591,620 | |
Wabtec Corp. | | | 216,550 | | | | 15,208,306 | |
| | | | | | | | |
| | | | | | | 95,700,903 | |
| | | | | | | | |
| | |
Marine—0.3% | | | | | | | | |
Kirby Corp. (a) | | | 53,200 | | | | 3,319,148 | |
| | | | | | | | |
| | |
Media—1.5% | | | | | | | | |
Gray Television, Inc. (a) | | | 439,500 | | | | 4,768,575 | |
Media General, Inc. (a) | | | 96,311 | | | | 1,655,586 | |
Nexstar Broadcasting Group, Inc. - Class A | | | 232,600 | | | | 11,067,108 | |
| | | | | | | | |
| | | | | | | 17,491,269 | |
| | | | | | | | |
| | |
Metals & Mining—0.7% | | | | | | | | |
Compass Minerals International, Inc. | | | 114,100 | | | | 8,465,079 | |
| | | | | | | | |
| | |
Oil, Gas & Consumable Fuels—1.0% | | | | | | | | |
Diamondback Energy, Inc. (a) | | | 28,600 | | | | 2,608,606 | |
Gulfport Energy Corp. (a) | | | 108,600 | | | | 3,394,836 | |
Matador Resources Co. (a) | | | 86,000 | | | | 1,702,800 | |
RSP Permian, Inc. (a) | | | 100,500 | | | | 3,506,445 | |
| | | | | | | | |
| | | | | | | 11,212,687 | |
| | | | | | | | |
| | |
Paper & Forest Products—1.0% | | | | | | | | |
Stella-Jones, Inc. | | | 317,350 | | | | 11,817,569 | |
| | | | | | | | |
| | |
Pharmaceuticals—0.6% | | | | | | | | |
Phibro Animal Health Corp. - Class A | | | 23,973 | | | | 447,336 | |
Prestige Brands Holdings, Inc. (a) | | | 106,500 | | | | 5,900,100 | |
| | | | | | | | |
| | | | | | | 6,347,436 | |
| | | | | | | | |
| | |
Professional Services—1.2% | | | | | | | | |
Exponent, Inc. | | | 237,956 | | | | 13,899,010 | |
| | | | | | | | |
See accompanying notes to financial statements.
MSF-6
Metropolitan Series Fund
Neuberger Berman Genesis Portfolio
Schedule of Investments as of June 30, 2016 (Unaudited)
Common Stocks—(Continued)
| | | | | | | | |
| Security Description | |
Shares | | | Value | |
| | |
Road & Rail—0.2% | | | | | | | | |
Genesee & Wyoming, Inc. - Class A (a) | | | 33,100 | | | $ | 1,951,245 | |
| | | | | | | | |
|
Semiconductors & Semiconductor Equipment—1.4% | |
MKS Instruments, Inc. | | | 109,500 | | | | 4,715,070 | |
Power Integrations, Inc. | | | 234,380 | | | | 11,735,407 | |
| | | | | | | | |
| | | | | | | 16,450,477 | |
| | | | | | | | |
| | |
Software—9.4% | | | | | | | | |
Aspen Technology, Inc. (a) | | | 227,400 | | | | 9,150,576 | |
Computer Modelling Group, Ltd. | | | 245,600 | | | | 1,966,028 | |
Constellation Software, Inc. | | | 38,120 | | | | 14,753,188 | |
Descartes Systems Group, Inc. (The) (a) | | | 225,200 | | | | 4,299,068 | |
Fair Isaac Corp. | | | 146,350 | | | | 16,539,013 | |
Manhattan Associates, Inc. (a) | | | 301,976 | | | | 19,365,721 | |
Monotype Imaging Holdings, Inc. | | | 312,443 | | | | 7,695,471 | |
Nice Ltd. (ADR) | | | 81,200 | | | | 5,184,620 | |
Progress Software Corp. (a) | | | 156,800 | | | | 4,305,728 | |
Qualys, Inc. (a) | | | 47,050 | | | | 1,402,561 | |
Tyler Technologies, Inc. (a) | | | 133,600 | | | | 22,272,456 | |
| | | | | | | | |
| | | | | | | 106,934,430 | |
| | | | | | | | |
| | |
Specialty Retail—3.3% | | | | | | | | |
Asbury Automotive Group, Inc. (a) | | | 66,100 | | | | 3,486,114 | |
Hibbett Sports, Inc. (a) | | | 128,950 | | | | 4,486,171 | |
Lithia Motors, Inc. - Class A | | | 77,550 | | | | 5,511,478 | |
Monro Muffler Brake, Inc. | | | 91,550 | | | | 5,818,918 | |
Sally Beauty Holdings, Inc. (a) | | | 201,850 | | | | 5,936,408 | |
Tractor Supply Co. | | | 129,550 | | | | 11,812,369 | |
| | | | | | | | |
| | | | | | | 37,051,458 | |
| | | | | | | | |
|
Technology Hardware, Storage & Peripherals—0.8% | |
Electronics For Imaging, Inc. (a) | | | 203,050 | | | | 8,739,272 | |
| | | | | | | | |
|
Trading Companies & Distributors—1.4% | |
Applied Industrial Technologies, Inc. | | | 87,521 | | | | 3,950,698 | |
Watsco, Inc. | | | 83,975 | | | | 11,814,443 | |
| | | | | | | | |
| | | | | | | 15,765,141 | |
| | | | | | | | |
Total Common Stocks
(Cost $782,579,732) | | | | | | | 1,123,856,149 | |
| | | | | | | | |
| Short-Term Investment—1.8% | |
| Security Description | | Principal
Amount* | | | Value | |
| | |
Repurchase Agreement—1.8% | | | | | | | | |
Fixed Income Clearing Corp. Repurchase Agreement dated 06/30/16 at 0.030% to be repurchased at $20,215,117 on 07/01/16, collateralized by $19,975,000 U.S. Treasury Note at 1.625% due 07/31/20 with a value of $20,624,188. | | | 20,215,100 | | | | 20,215,100 | |
| | | | | | | | |
Total Short-Term Investments
(Cost $20,215,100) | | | | | | | 20,215,100 | |
| | | | | | | | |
Total Investments—100.2%
(Cost $802,794,832) (b) | | | | | | | 1,144,071,249 | |
Other assets and liabilities
(net)—(0.2)% | | | | | | | (2,591,594 | ) |
| | | | | | | | |
| Net Assets—100.0% | | | | | | $ | 1,141,479,655 | |
| | | | | | | | |
| * | Principal amount stated in U.S. dollars unless otherwise noted. |
| (a) | Non-income producing security. |
| (b) | As of June 30, 2016, the aggregate cost of investments was $802,794,832. The aggregate unrealized appreciation and depreciation of investments were $369,639,784 and $(28,363,367), respectively, resulting in net unrealized appreciation of $341,276,417. |
| (ADR)— | An American Depositary Receipt is a certificate issued by a custodian bank representing the right to receive securities of the foreign issuer described. Trading on exchanges not located in the United States or Canada significantly influences the value of ADRs. |
See accompanying notes to financial statements.
MSF-7
Metropolitan Series Fund
Neuberger Berman Genesis Portfolio
Schedule of Investments as of June 30, 2016 (Unaudited)
Fair Value Hierarchy
Accounting principles generally accepted in the United States of America (“GAAP”) define fair market value as the price that the Portfolio would receive to sell an asset or pay to transfer a liability in an orderly transaction between market participants at the measurement date. It establishes a fair value hierarchy that prioritizes inputs to valuation methods and requires disclosure of the fair value hierarchy, separately for each major category of assets and liabilities, that segregates fair value measurements into three levels. Levels 1, 2 and 3 of the fair value hierarchy are defined as follows:
Level 1 - unadjusted quoted prices in active markets for identical investments
Level 2 - other significant observable inputs (including, but not limited to, quoted prices for similar assets or liabilities in markets that are either active or inactive; inputs other than quoted prices that are observable such as interest rates, yield curves, volatilities, prepayment speeds, loss severities, credit risks, default rates, or other market corroborated inputs)
Level 3 - significant unobservable inputs based on the best information available in the circumstances, to the extent observable inputs are unavailable (including the Portfolio’s own assumptions used in determining the fair value of investments and derivative financial instruments)
The inputs or methodologies used for valuing investments are not necessarily an indication of the risk associated with investing in them. Changes to the inputs or methodologies used may result in transfers between levels, which will be recognized as of the beginning of the reporting period. Information on transfers between Level 1 and Level 2, if any, will be disclosed following the fair value hierarchy table below. A reconciliation of Level 3 securities, if any, will also be disclosed following the fair value hierarchy table. For more information about the Portfolio’s policy regarding the valuation of investments, please refer to the Notes to Financial Statements.
The following table summarizes the fair value hierarchy of the Portfolio’s investments as of June 30, 2016:
| | | | | | | | | | | | | | | | |
| Description | | Level 1 | | | Level 2 | | | Level 3 | | | Total | |
Total Common Stocks* | | $ | 1,123,856,149 | | | $ | — | | | $ | — | | | $ | 1,123,856,149 | |
Total Short-Term Investment* | | | — | | | | 20,215,100 | | | | — | | | | 20,215,100 | |
Total Investments | | $ | 1,123,856,149 | | | $ | 20,215,100 | | | $ | — | | | $ | 1,144,071,249 | |
| | | | | | | | | | | | | | | | | |
| * | See Schedule of Investments for additional detailed categorizations. |
See accompanying notes to financial statements.
MSF-8
Metropolitan Series Fund
Neuberger Berman Genesis Portfolio
Statement of Assets and Liabilities
June 30, 2016 (Unaudited)
| | | | |
Assets | | | | |
Investments at value (a) | | $ | 1,144,071,249 | |
Cash | | | 435 | |
Cash denominated in foreign currencies (b) | | | 2,110 | |
Receivable for: | | | | |
Investments sold | | | 1,313,459 | |
Fund shares sold | | | 81,990 | |
Dividends and interest | | | 450,765 | |
Prepaid expenses | | | 7,252 | |
| | | | |
Total Assets | | | 1,145,927,260 | |
Liabilities | | | | |
Payables for: | | | | |
Investments purchased | | | 2,321,837 | |
Fund shares redeemed | | | 967,656 | |
Accrued Expenses: | | | | |
Management fees | | | 753,735 | |
Distribution and service fees | | | 76,345 | |
Deferred trustees’ fees | | | 107,300 | |
Other expenses | | | 220,732 | |
| | | | |
Total Liabilities | | | 4,447,605 | |
| | | | |
Net Assets | | $ | 1,141,479,655 | |
| | | | |
Net Assets Consist of: | | | | |
Paid in surplus | | $ | 774,953,874 | |
Undistributed net investment income | | | 1,765,038 | |
Accumulated net realized gain | | | 23,484,031 | |
Unrealized appreciation on investments and foreign currency transactions | | | 341,276,712 | |
| | | | |
Net Assets | | $ | 1,141,479,655 | |
| | | | |
Net Assets | | | | |
Class A | | $ | 732,752,215 | |
Class B | | | 319,870,826 | |
Class E | | | 88,856,614 | |
Capital Shares Outstanding* | | | | |
Class A | | | 38,394,693 | |
Class B | | | 17,018,861 | |
Class E | | | 4,704,977 | |
Net Asset Value, Offering Price and Redemption Price Per Share | | | | |
Class A | | $ | 19.08 | |
Class B | | | 18.80 | |
Class E | | | 18.89 | |
| * | The Portfolio is authorized to issue an unlimited number of shares. |
| (a) | Identified cost of investments was $802,794,832. |
| (b) | Identified cost of cash denominated in foreign currencies was $2,091. |
Statement of Operations
Six Months Ended June 30, 2016 (Unaudited)
| | | | |
Investment Income | | | | |
Dividends (a) | | $ | 7,055,242 | |
Interest | | | 3,521 | |
| | | | |
Total investment income | | | 7,058,763 | |
Expenses | | | | |
Management fees | | | 4,716,372 | |
Administration fees | | | 14,764 | |
Custodian and accounting fees | | | 56,123 | |
Distribution and service fees—Class B | | | 383,263 | |
Distribution and service fees—Class E | | | 63,882 | |
Audit and tax services | | | 20,230 | |
Legal | | | 13,588 | |
Trustees’ fees and expenses | | | 15,990 | |
Shareholder reporting | | | 84,235 | |
Insurance | | | 4,255 | |
Miscellaneous | | | 7,731 | |
| | | | |
Total expenses | | | 5,380,433 | |
Less management fee waiver | | | (62,158 | ) |
Less broker commission recapture | | | (40,785 | ) |
| | | | |
Net expenses | | | 5,277,490 | |
| | | | |
Net Investment Income | | | 1,781,273 | |
| | | | |
Net Realized and Unrealized Gain (Loss) | | | | |
| Net realized gain on: | | | | |
Investments | | | 65,826,893 | |
Futures contracts | | | 213,627 | |
Foreign currency transactions | | | 652 | |
| | | | |
Net realized gain | | | 66,041,172 | |
| | | | |
| Net change in unrealized appreciation (depreciation) on: | | | | |
Investments | | | (1,796,969 | ) |
Foreign currency transactions | | | 278 | |
| | | | |
Net change in unrealized depreciation | | | (1,796,691 | ) |
| | | | |
Net realized and unrealized gain | | | 64,244,481 | |
| | | | |
Net Increase in Net Assets From Operations | | $ | 66,025,754 | |
| | | | |
| (a) | Net of foreign withholding taxes of $58,744. |
See accompanying notes to financial statements.
MSF-9
Metropolitan Series Fund
Neuberger Berman Genesis Portfolio
Statements of Changes in Net Assets
| | | | | | | | |
| | | Six Months
Ended
June 30, 2016
(Unaudited) | | | Year Ended
December 31,
2015 | |
Increase (Decrease) in Net Assets: | | | | | | | | |
From Operations | | | | | | | | |
Net investment income | | $ | 1,781,273 | | | $ | 4,663,836 | |
Net realized gain | | | 66,041,172 | | | | 107,705,200 | |
Net change in unrealized depreciation | | | (1,796,691 | ) | | | (99,286,751 | ) |
| | | | | | | | |
Increase in net assets from operations | | | 66,025,754 | | | | 13,082,285 | |
| | | | | | | | |
From Distributions to Shareholders | | | | | | | | |
Net investment income | | | | | | | | |
Class A | | | (3,463,083 | ) | | | (3,753,077 | ) |
Class B | | | (665,055 | ) | | | (551,741 | ) |
Class E | | | (278,065 | ) | | | (262,696 | ) |
| | | | | | | | |
Total distributions | | | (4,406,203 | ) | | | (4,567,514 | ) |
| | | | | | | | |
Decrease in net assets from capital share transactions | | | (145,707,972 | ) | | | (239,142,296 | ) |
| | | | | | | | |
Total decrease in net assets | | | (84,088,421 | ) | | | (230,627,525 | ) |
| | |
Net Assets | | | | | | | | |
Beginning of period | | | 1,225,568,076 | | | | 1,456,195,601 | |
| | | | | | | | |
End of period | | $ | 1,141,479,655 | | | $ | 1,225,568,076 | |
| | | | | | | | |
Undistributed net investment income | | | | | | | | |
End of period | | $ | 1,765,038 | | | $ | 4,389,968 | |
| | | | | | | | |
Other Information:
Capital Shares
Transactions in capital shares were as follows:
| | | | | | | | | | | | | | | | |
| | | Six Months Ended
June 30, 2016
(Unaudited) | | | Year Ended
December 31, 2015 | |
| | | Shares | | | Value | | | Shares | | | Value | |
Class A | | | | | | | | | | | | | | | | |
Sales | | | 508,739 | | | $ | 8,867,655 | | | | 609,854 | | | $ | 11,146,651 | |
Reinvestments | | | 183,329 | | | | 3,463,083 | | | | 196,805 | | | | 3,753,077 | |
Redemptions | | | (7,314,981 | ) | | | (134,621,897 | ) | | | (10,359,968 | ) | | | (192,459,060 | ) |
| | | | | | | | | | | | | | | | |
Net decrease | | | (6,622,913 | ) | | $ | (122,291,159 | ) | | | (9,553,309 | ) | | $ | (177,559,332 | ) |
| | | | | | | | | | | | | | | | |
Class B | | | | | | | | | | | | | | | | |
Sales | | | 357,234 | | | $ | 6,298,462 | | | | 781,858 | | | $ | 14,264,839 | |
Reinvestments | | | 35,737 | | | | 665,055 | | | | 29,379 | | | | 551,741 | |
Redemptions | | | (1,449,474 | ) | | | (25,375,338 | ) | | | (3,381,960 | ) | | | (61,607,986 | ) |
| | | | | | | | | | | | | | | | |
Net decrease | | | (1,056,503 | ) | | $ | (18,411,821 | ) | | | (2,570,723 | ) | | $ | (46,791,406 | ) |
| | | | | | | | | | | | | | | | |
Class E | | | | | | | | | | | | | | | | |
Sales | | | 42,956 | | | $ | 768,779 | | | | 59,140 | | | $ | 1,086,128 | |
Reinvestments | | | 14,870 | | | | 278,065 | | | | 13,921 | | | | 262,696 | |
Redemptions | | | (343,400 | ) | | | (6,051,836 | ) | | | (882,303 | ) | | | (16,140,382 | ) |
| | | | | | | | | | | | | | | | |
Net decrease | | | (285,574 | ) | | $ | (5,004,992 | ) | | | (809,242 | ) | | $ | (14,791,558 | ) |
| | | | | | | | | | | | | | | | |
Decrease derived from capital shares transactions | | | | | | $ | (145,707,972 | ) | | | | | | $ | (239,142,296 | ) |
| | | | | | | | | | | | | | | | |
See accompanying notes to financial statements.
MSF-10
Metropolitan Series Fund
Neuberger Berman Genesis Portfolio
Financial Highlights
| | | | | | | | | | | | | | | | | | | | | | | | |
| Selected per share data | | | |
| | | Class A | |
| | | Six Months
Ended
June 30,
2016
(Unaudited) | | | Year Ended December 31, | |
| | | | 2015 | | | 2014 | | | 2013 | | | 2012 | | | 2011 | |
Net Asset Value, Beginning of Period | | $ | 18.10 | | | $ | 18.07 | | | $ | 18.14 | | | $ | 13.21 | | | $ | 12.05 | | | $ | 11.47 | |
| | | | | | | | | | | | | | | | | | | | | | | | |
Income (Loss) from Investment Operations | | | | | | | | | | | | | | | | | | | | | | | | |
Net investment income (a) | | | 0.03 | | | | 0.08 | | | | 0.08 | | | | 0.07 | | | | 0.11 | | | | 0.05 | |
Net realized and unrealized gain (loss) on investments | | | 1.04 | | | | 0.03 | | | | (0.08 | ) | | | 4.98 | | | | 1.10 | | | | 0.62 | |
| | | | | | | | | | | | | | | | | | | | | | | | |
Total from investment operations | | | 1.07 | | | | 0.11 | | | | 0.00 | | | | 5.05 | | | | 1.21 | | | | 0.67 | |
| | | | | | | | | | | | | | | | | | | | | | | | |
Less Distributions | | | | | | | | | | | | | | | | | | | | | | | | |
Distributions from net investment income | | | (0.09 | ) | | | (0.08 | ) | | | (0.07 | ) | | | (0.12 | ) | | | (0.05 | ) | | | (0.09 | ) |
| | | | | | | | | | | | | | | | | | | | | | | | |
Total distributions | | | (0.09 | ) | | | (0.08 | ) | | | (0.07 | ) | | | (0.12 | ) | | | (0.05 | ) | | | (0.09 | ) |
| | | | | | | | | | | | | | | | | | | | | | | | |
Net Asset Value, End of Period | | $ | 19.08 | | | $ | 18.10 | | | $ | 18.07 | | | $ | 18.14 | | | $ | 13.21 | | | $ | 12.05 | |
| | | | | | | | | | | | | | | | | | | | | | | | |
Total Return (%) (b) | | | 5.92 | (c) | | | 0.58 | | | | 0.01 | | | | 38.52 | | | | 10.03 | | | | 5.80 | |
| | | | | | |
Ratios/Supplemental Data | | | | | | | | | | | | | | | | | | | | | | | | |
Gross ratio of expenses to average net assets (%) | | | 0.85 | (d) | | | 0.84 | | | | 0.83 | | | | 0.83 | | | | 0.86 | | | | 0.86 | |
Net ratio of expenses to average net assets (%) (e) | | | 0.84 | (d) | | | 0.83 | | | | 0.83 | | | | 0.82 | | | | 0.85 | | | | 0.85 | |
Ratio of net investment income to average net assets (%) | | | 0.38 | (d) | | | 0.42 | | | | 0.43 | | | | 0.42 | | | | 0.89 | | | | 0.40 | |
Portfolio turnover rate (%) | | | 7 | (c) | | | 16 | | | | 9 | | | | 17 | | | | 15 | | | | 12 | |
Net assets, end of period (in millions) | | $ | 732.8 | | | $ | 814.6 | | | $ | 985.8 | | | $ | 1,154.0 | | | $ | 922.1 | | | $ | 868.1 | |
| |
| | | Class B | |
| | | Six Months
Ended
June 30,
2016
(Unaudited) | | | Year Ended December 31, | |
| | | | 2015 | | | 2014 | | | 2013 | | | 2012 | | | 2011 | |
Net Asset Value, Beginning of Period | | $ | 17.80 | | | $ | 17.76 | | | $ | 17.85 | | | $ | 13.00 | | | $ | 11.86 | | | $ | 11.30 | |
| | | | | | | | | | | | | | | | | | | | | | | | |
Income (Loss) from Investment Operations | | | | | | | | | | | | | | | | | | | | | | | | |
Net investment income (a) | | | 0.01 | | | | 0.03 | | | | 0.03 | | | | 0.03 | | | | 0.08 | | | | 0.02 | |
Net realized and unrealized gain (loss) on investments | | | 1.03 | | | | 0.04 | | | | (0.08 | ) | | | 4.91 | | | | 1.08 | | | | 0.61 | |
| | | | | | | | | | | | | | | | | | | | | | | | |
Total from investment operations | | | 1.04 | | | | 0.07 | | | | (0.05 | ) | | | 4.94 | | | | 1.16 | | | | 0.63 | |
| | | | | | | | | | | | | | | | | | | | | | | | |
Less Distributions | | | | | | | | | | | | | | | | | | | | | | | | |
Distributions from net investment income | | | (0.04 | ) | | | (0.03 | ) | �� | | (0.04 | ) | | | (0.09 | ) | | | (0.02 | ) | | | (0.07 | ) |
| | | | | | | | | | | | | | | | | | | | | | | | |
Total distributions | | | (0.04 | ) | | | (0.03 | ) | | | (0.04 | ) | | | (0.09 | ) | | | (0.02 | ) | | | (0.07 | ) |
| | | | | | | | | | | | | | | | | | | | | | | | |
Net Asset Value, End of Period | | $ | 18.80 | | | $ | 17.80 | | | $ | 17.76 | | | $ | 17.85 | | | $ | 13.00 | | | $ | 11.86 | |
| | | | | | | | | | | | | | | | | | | | | | | | |
Total Return (%) (b) | | | 5.84 | (c) | | | 0.38 | | | | (0.30 | ) | | | 38.19 | | | | 9.75 | | | | 5.51 | |
| | | | | | |
Ratios/Supplemental Data | | | | | | | | | | | | | | | | | | | | | | | | |
Gross ratio of expenses to average net assets (%) | | | 1.10 | (d) | | | 1.09 | | | | 1.08 | | | | 1.08 | | | | 1.11 | | | | 1.11 | |
Net ratio of expenses to average net assets (%) (e) | | | 1.09 | (d) | | | 1.08 | | | | 1.08 | | | | 1.07 | | | | 1.10 | | | | 1.10 | |
Ratio of net investment income to average net assets (%) | | | 0.14 | (d) | | | 0.17 | | | | 0.18 | | | | 0.22 | | | | 0.63 | | | | 0.14 | |
Portfolio turnover rate (%) | | | 7 | (c) | | | 16 | | | | 9 | | | | 17 | | | | 15 | | | | 12 | |
Net assets, end of period (in millions) | | $ | 319.9 | | | $ | 321.7 | | | $ | 366.8 | | | $ | 418.9 | | | $ | 117.0 | | | $ | 118.2 | |
Please see following page for Financial Highlights footnote legend.
See accompanying notes to financial statements.
MSF-11
Metropolitan Series Fund
Neuberger Berman Genesis Portfolio
Financial Highlights
| | | | | | | | | | | | | | | | | | | | | | | | |
| Selected per share data | | | | | | | | | | | | | | | | | | |
| | | Class E | |
| | | Six Months
Ended
June 30,
2016
(Unaudited) | | | Year Ended December 31, | |
| | | | 2015 | | | 2014 | | | 2013 | | | 2012 | | | 2011 | |
Net Asset Value, Beginning of Period | | $ | 17.89 | | | $ | 17.86 | | | $ | 17.94 | | | $ | 13.06 | | | $ | 11.91 | | | $ | 11.35 | |
| | | | | | | | | | | | | | | | | | | | | | | | |
Income (Loss) from Investment Operations | | | | | | | | | | | | | | | | | | | | | | | | |
Net investment income (a) | | | 0.02 | | | | 0.05 | | | | 0.05 | | | | 0.04 | | | | 0.09 | | | | 0.03 | |
Net realized and unrealized gain (loss) on investments | | | 1.04 | | | | 0.03 | | | | (0.09 | ) | | | 4.94 | | | | 1.09 | | | | 0.60 | |
| | | | | | | | | | | | | | | | | | | | | | | | |
Total from investment operations | | | 1.06 | | | | 0.08 | | | | (0.04 | ) | | | 4.98 | | | | 1.18 | | | | 0.63 | |
| | | | | | | | | | | | | | | | | | | | | | | | |
Less Distributions | | | | | | | | | | | | | | | | | | | | | | | | |
Distributions from net investment income | | | (0.06 | ) | | | (0.05 | ) | | | (0.04 | ) | | | (0.10 | ) | | | (0.03 | ) | | | (0.07 | ) |
| | | | | | | | | | | | | | | | | | | | | | | | |
Total distributions | | | (0.06 | ) | | | (0.05 | ) | | | (0.04 | ) | | | (0.10 | ) | | | (0.03 | ) | | | (0.07 | ) |
| | | | | | | | | | | | | | | | | | | | | | | | |
Net Asset Value, End of Period | | $ | 18.89 | | | $ | 17.89 | | | $ | 17.86 | | | $ | 17.94 | | | $ | 13.06 | | | $ | 11.91 | |
| | | | | | | | | | | | | | | | | | | | | | | | |
Total Return (%) (b) | | | 5.92 | (c) | | | 0.43 | | | | (0.19 | ) | | | 38.37 | | | | 9.90 | | | | 5.56 | |
| | | | | | |
Ratios/Supplemental Data | | | | | | | | | | | | | | | | | | | | | | | | |
Gross ratio of expenses to average net assets (%) | | | 1.00 | (d) | | | 0.99 | | | | 0.98 | | | | 0.98 | | | | 1.01 | | | | 1.01 | |
Net ratio of expenses to average net assets (%) (e) | | | 0.99 | (d) | | | 0.98 | | | | 0.98 | | | | 0.97 | | | | 1.00 | | | | 1.00 | |
Ratio of net investment income to average net assets (%) | | | 0.24 | (d) | | | 0.27 | | | | 0.28 | | | | 0.28 | | | | 0.72 | | | | 0.24 | |
Portfolio turnover rate (%) | | | 7 | (c) | | | 16 | | | | 9 | | | | 17 | | | | 15 | | | | 12 | |
Net assets, end of period (in millions) | | $ | 88.9 | | | $ | 89.3 | | | $ | 103.6 | | | $ | 122.0 | | | $ | 90.6 | | | $ | 97.1 | |
| (a) | Per share amounts based on average shares outstanding during the period. |
| (b) | Total return does not reflect any insurance, sales, separate account or administrative charges of variable annuity or life insurance contracts or any additional expenses that contract owners may bear under their variable contracts. If these charges were included, the returns would be lower. |
| (c) | Periods less than one year are not computed on an annualized basis. |
| (d) | Computed on an annualized basis. |
| (e) | Includes the effects of management fee waivers (see Note 6 of the Notes to Financial Statements). |
See accompanying notes to financial statements.
MSF-12
Metropolitan Series Fund
Neuberger Berman Genesis Portfolio
Notes to Financial Statements—June 30, 2016 (Unaudited)
1. Organization
Metropolitan Series Fund (the “Trust”) is organized as a Delaware statutory trust and registered under the Investment Company Act of 1940, as amended (the “1940 Act”), as an open-end management investment company. The Trust, which is managed by MetLife Advisers, LLC (“MetLife Advisers” or the “Adviser”), an affiliate of MetLife, Inc., is currently comprised of thirty series, each of which operates as a distinct investment vehicle of the Trust. The portfolio included in this report is Neuberger Berman Genesis Portfolio (the “Portfolio”), which is diversified. Shares in the Portfolio are not offered directly to the general public and are currently available only to separate accounts established by Metropolitan Life Insurance Company (“MetLife”) and other affiliated life insurance companies.
The Portfolio has registered and offers three classes of shares: Class A, B and E shares. Shares of each Class of the Portfolio represent an equal pro rata interest in the Portfolio and generally give the shareholder the same voting, dividend, liquidation, and other rights. Investment income, realized and unrealized capital gains and losses, the common expenses of the Portfolio, and certain Portfolio-level expense reductions, if any, are allocated on a pro rata basis to each Class based on the relative net assets of each Class to the net assets of the Portfolio. Each Class of shares differs in its respective distribution plan and such distribution expenses are allocated to the corresponding Class of shares.
2. Significant Accounting Policies
The preparation of financial statements in conformity with accounting principles generally accepted in the United States of America (“GAAP”) requires management to make estimates and assumptions that affect the reported amounts of assets and liabilities and disclosure of contingent assets and liabilities as of the date of the financial statements and the reported amounts of income and expenses during the reporting period. Actual results could differ from those estimates. In the preparation of these financial statements, management has evaluated events and transactions subsequent to June 30, 2016 through the date the financial statements were issued.
The Portfolio is an investment company and follows the accounting and reporting guidance of the Financial Accounting Standards Board (“FASB”) Accounting Standards Codification Topic 946—Financial Services—Investment Companies and Topic 820—Fair Value Measurement. The following is a summary of significant accounting policies consistently followed by the Portfolio in the preparation of its financial statements.
Investment Valuation and Fair Value Measurements - Domestic and foreign equity securities, such as common stock, exchange-traded funds, rights, warrants, and preferred stock, that are traded on a securities exchange on a valuation date are generally valued at their last quoted sale price or official closing price on the primary exchange for such security, or, if no sales occurred on that day, at the last reported bid price. Equity securities traded over-the-counter (“OTC”) are generally valued at the last reported bid price. In the event of a major exchange closing during the trading day, the Adviser may use other market information obtained from quotation reporting systems, established market makers, or pricing services in valuing the securities. Valuation adjustments may be applied to certain foreign equity securities that are traded solely on foreign exchanges that close before the time as of which the Portfolio determines its NAV to account for the market movement between the close of the foreign exchanges and the time as of which the Portfolio determines its NAV. The Portfolio may use a systematic fair valuation model provided by a pricing service to value securities principally traded in these foreign markets in order to adjust for possible market movements or other changes that may occur between the close of the foreign exchanges and the time as of which the Portfolio determines its NAV. Foreign equity securities valued using these valuation adjustments are generally categorized as Level 2 within the fair value hierarchy. Equity securities that are actively traded, and have no valuation adjustments applied, are categorized as Level 1 within the fair value hierarchy. Other equity securities traded on inactive markets, or valued in reference to similar instruments traded on active markets, are generally categorized as Level 2 within the fair value hierarchy.
Investments in registered open-end management investment companies are valued at reported net asset value per share on the valuation date and are categorized as Level 1 within the fair value hierarchy.
Debt securities, including corporate, convertible and municipal bonds and notes; obligations of the U.S. Treasury and U.S. government agencies; foreign sovereign issues; and non-U.S. bonds, are generally valued on the basis of evaluated or composite bid quotations obtained from independent pricing services and/or brokers and dealers selected by the Adviser (each a “pricing service”), pursuant to authorization of and subject to general oversight by the Board of Trustees of the Trust (the “Board” or “Trustees”). Such pricing services may use matrix pricing, which considers observable inputs including, among other things, issuer details, maturity dates, interest rates, yield curves, rates of prepayment, credit risks/spreads, default rates, reported trades, broker dealer quotes and quoted prices for similar assets. Short-term obligations with a remaining maturity of sixty days or less may be valued at amortized cost in the absence of market quotes, so long as the amortized cost value of such short-term debt instrument is approximately the same as the fair value of the instrument as determined without the use of amortized cost valuation. Floating rate loans are generally valued on the basis of an evaluated or composite average of aggregate bid and ask quotations supplied by brokers or dealers, as obtained from the pricing service. Securities that use similar valuation techniques and inputs as described above are generally categorized as Level 2 within the fair value hierarchy.
MSF-13
Metropolitan Series Fund
Neuberger Berman Genesis Portfolio
Notes to Financial Statements—June 30, 2016—(Continued)
Options, whether on securities, indices, futures contracts, or otherwise, traded on exchanges are valued at the last sale price available as of the close of business on a valuation day or, if there is no such price available, at the last reported bid price. These types of options are categorized as Level 1 within the fair value hierarchy. Futures contracts that are traded on commodity exchanges are valued at their settlement prices established by the exchanges on which they are traded as of the close of such exchanges and are categorized as Level 1 within the fair value hierarchy.
If no current market value quotation or other observable inputs are readily available or market value quotations are deemed to be unreliable for an investment, the fair value of the investment will be determined in accordance with procedures approved by, and under the general supervision of, the Board. In such a circumstance, the Board will be assisted in its responsibility to determine the fair value of an investment by the Valuation Committee (“Committee”) of MetLife Advisers. The Committee provides general pricing oversight and fair value pricing determinations related to portfolio securities and meets on a regular basis to review reports relating to the valuation of the securities in the Portfolio. The Board has delegated to State Street Bank and Trust Company, the Trust’s custodian (“custodian”), the responsibility for calculating the net asset values (“NAVs”) of the Trust’s Portfolios. The Committee is responsible for overseeing the calculation of the NAVs of the Portfolios by the custodian. The Committee also periodically reviews pricing services, including the pricing services providing fair value pricing for the Portfolio’s foreign securities, and is responsible for overseeing the correction of pricing errors and addressing other pricing issues that arise in the ordinary course of business, such as making real-time fair value determinations, as necessary.
No single standard for determining the fair value of an investment can be set forth because fair value depends upon the facts and circumstances with respect to each investment. Information relating to any relevant factors may be obtained by the Committee from any appropriate source, including the subadviser of the Portfolio, the custodian, a pricing service, market maker and/or broker for such security or the issuer. Appropriate methodologies for determining fair value under particular circumstances may include: matrix pricing, a discounted cash flow analysis, comparisons of securities with comparable characteristics, value based on multiples of earnings, discount from market price of similar marketable securities or a combination of these and other methods.
Investment Transactions and Related Investment Income - Portfolio security transactions are recorded on the trade date. Dividend income is recorded on the ex-dividend date or, for certain foreign securities, when notified. Interest income, which includes amortization of premium and accretion of discount on debt securities, is recorded on the accrual basis. Realized gains and losses on investments are determined on the identified cost basis, which is the same basis used for federal income tax purposes. Foreign income and foreign capital gains on some foreign securities may be subject to foreign taxes, which are accrued as applicable. These foreign taxes have been provided for in accordance with the Portfolio’s understanding of the applicable countries’ tax rules and rates.
Foreign Currency Translation - The books and records of the Portfolio are maintained in U.S. dollars. The values of securities, currencies, and other assets and liabilities denominated in currencies other than the U.S. dollar are translated into U.S. dollars based upon foreign exchange rates prevailing at the end of the period. Purchases and sales of investment securities, income, and expenses are translated on the respective dates of such transactions. Because the values of investment securities are translated at the foreign exchange rates prevailing at the end of the period, that portion of the results of operations arising from changes in exchange rates and that portion of the results of operations reflecting fluctuations arising from changes in market prices of the investment securities are not separated. Such fluctuations are included in the net realized and unrealized gain or loss on investments.
Net realized foreign exchange gains or losses arise from activity in forward foreign currency exchange contracts, sales of foreign currency, currency gains or losses realized between the trade and settlement dates on securities transactions, and the difference between the amounts of dividends, interest, and foreign withholding taxes recorded by the Portfolio and the U.S. dollar equivalent of the amounts actually received or paid by the Portfolio. Net unrealized foreign exchange gains and losses arise from changes in the value of assets and liabilities, other than investment securities, resulting from changes in foreign exchange rates.
Dividends and Distributions to Shareholders - The Portfolio records dividends and distributions on the ex-dividend date. Net realized gains from securities transactions (if any) are generally distributed annually to shareholders. The timing and characterization of certain income and capital gains distributions are determined in accordance with federal tax regulations that may differ from GAAP. Permanent book and tax basis differences relating to shareholder distributions will result in reclassification between under/over distributed net investment income, accumulated net realized gains/losses, and paid-in surplus. Book-tax differences are primarily due to broker commission recapture adjustments and foreign currency transactions. These adjustments have no impact on net assets or the results of operations.
Income Taxes - It is the Portfolio’s policy to comply with the requirements of the Internal Revenue Code of 1986, as amended, and regulations thereunder, applicable to regulated investment companies and to distribute, with respect to each taxable year, all of its taxable income to shareholders. Therefore, no federal income tax provision is required. The Portfolio files U.S. federal tax returns. No income tax returns are currently under examination. The Portfolio’s federal tax returns for the prior three fiscal years remain subject to examination by the Internal Revenue Service. As of June 30, 2016, the Portfolio had no uncertain tax positions that would require financial statement recognition, or de-recognition or disclosure.
MSF-14
Metropolitan Series Fund
Neuberger Berman Genesis Portfolio
Notes to Financial Statements—June 30, 2016—(Continued)
Directed Brokerage Agreement - The Trust has entered into a directed brokerage arrangement with State Street Global Markets (“SSGM”). Under this arrangement, the Portfolio directs certain trades to SSGM in return for a recapture credit. SSGM issues a cash rebate to the Portfolio. Amounts paid to the Portfolio are shown separately as broker commission recapture on the Statement of Operations of the Portfolio. Additionally, these amounts have been excluded from the calculation of the net ratio of expenses to average net assets presented in the Financial Highlights for each share class.
Repurchase Agreements - The Portfolio may enter into repurchase agreements, under the terms of a Master Repurchase Agreement (“MRA”), with selected commercial banks and broker-dealers, under which the Portfolio acquires securities as collateral and agrees to resell the securities at an agreed-upon time and at an agreed-upon price. The Portfolio, through the custodian or a subcustodian, under a tri-party repurchase agreement, receives delivery of the underlying securities collateralizing any repurchase agreements. It is the Portfolio’s policy that the market value of the collateral be equal to at least 100% of the repurchase price in the case of a repurchase agreement of one-day duration and equal to at least 102% of the repurchase price in the case of all other repurchase agreements. In the event of default or failure by a party to perform an obligation in connection with any repurchase transaction, the MRA gives the non-defaulting party the right to set-off claims and to apply property held by it in connection with any repurchase transaction against obligations owed to it.
At June 30, 2016, the Portfolio had investments in repurchase agreements with a gross value of $20,215,100, which is included as part of investments at value on the Statement of Assets and Liabilities. The value of the related collateral exceeded the value of the repurchase agreements at June 30, 2016.
3. Investments in Derivative Instruments
Futures Contracts - The Portfolio may buy and sell futures contracts as a hedge, to maintain investment exposure to a target asset class or to enhance return. The Portfolio may be subject to fluctuations in equity prices, interest rates, commodity prices, and foreign currency exchange rates in the normal course of pursuing its investment objective. Futures contracts are standardized agreements to buy or sell a security, or deliver a final cash settlement price in connection with an index, interest rate, currency, or other asset. The Portfolio must deposit an amount (“initial margin”) equal to a certain percentage of the face value of the futures contract. The initial margin may be in the form of cash or securities, which is returned when the Portfolio’s obligations under the contract have been satisfied. If cash is deposited as the initial margin, it is shown as cash collateral on the Statement of Assets and Liabilities. Futures contracts are marked-to-market daily, and subsequent payments (“variation margin”) are made or received by the Portfolio depending on whether unrealized gains or losses are incurred. These amounts are reflected as receivables or payables on the Statement of Assets and Liabilities and as a component of net change in unrealized appreciation/depreciation on the Statement of Operations. When the contract is closed or expires, the Portfolio records a realized gain or loss equal to the difference between the value of the contract at the time it was opened and the value at the time it was closed. Risks of entering into futures contracts (and related options) include the possibility that the market for these instruments may be illiquid and that a change in the value of the contract or option may not correlate perfectly with changes in the value of the underlying instrument. If futures contracts are exchange-traded, the exchange’s clearinghouse, as counterparty to all exchange-traded futures, guarantees the futures contracts against default. For OTC futures, the Portfolio’s ability to terminate the positions may be more limited than in the case of exchange-traded positions and may also involve the risk that securities dealers participating in such transactions would fail to meet their obligations to the Portfolio.
During the six months ended June 30, 2016, the Portfolio entered into equity index futures contracts which were subject to equity price risk. During the period May 6, 2016 through May 9, 2016, the Portfolio had bought and sold $66,681,366 in notional cost on equity index futures contracts. At June 30, 2016, the Portfolio did not have any open futures contracts. For the six months ended June 30, 2016, the Portfolio had realized gains in the amount of $213,627 which are shown under Net realized gain on futures contracts in the Statement of Operations.
4. Certain Risks
In the normal course of business, the Portfolio invests in securities and enters into transactions where risks exist due to fluctuations in the market (“market risk”) or failure of the other party to a transaction to perform (“credit and counterparty risk”).
Market Risk: The value of securities held by the Portfolio may decline in response to certain events, including those directly involving the companies whose securities are owned by the Portfolio; conditions affecting the general economy; overall market changes; local, regional or global political, social or economic instability; and currency, interest rate, and price fluctuations.
Credit and Counterparty Risk: The Portfolio may be exposed to counterparty risk, or the risk that an entity with which the Portfolio has unsettled or open transactions may default. The potential loss could exceed the value of the financial assets and liabilities recorded in the financial statements. Financial assets that potentially expose the Portfolio to credit and counterparty risk consist principally of cash due from counterparties and investments. The Portfolio manages counterparty risk by entering into agreements only with counterparties that it believes have the financial resources to honor their obligations and by monitoring the financial
MSF-15
Metropolitan Series Fund
Neuberger Berman Genesis Portfolio
Notes to Financial Statements—June 30, 2016—(Continued)
stability of those counterparties. The Portfolio’s investment adviser attempts to mitigate counterparty risk by (i) periodically assessing the creditworthiness of its trading partners, (ii) monitoring and/or limiting the amount of its net exposure to each individual counterparty based on its assessment, and (iii) requiring collateral from the counterparty for certain transactions. In order to preserve certain safeguards for non-standard settlement trades, the Portfolio restricts its exposure to credit and counterparty losses by entering into master netting agreements (“Master Agreements”) with counterparties (approved brokers) with whom it undertakes a significant volume of transactions. Master Agreements govern the terms of certain transactions, and reduce the counterparty risk associated with relevant transactions by specifying credit protection mechanisms and providing standardization that improves legal certainty. Master Agreements can also help limit counterparty risk by specifying collateral posting arrangements at pre-arranged exposure levels.
Repurchase and reverse repurchase agreements are primarily executed under Global Master Repurchase Agreements (“GMRAs”) or Master Repurchase Agreements (“MRAs”), which provide the rights to set-off. Each repurchase and reverse repurchase agreement is initially collateralized at the transaction level. In the event of default, the total market value exposure will be offset against collateral exchanged to date, which would result in a net receivable/(payable) that would be due from/to the counterparty.
Customer Account Agreements and related addenda govern cleared derivatives transactions such as futures, options on futures, and cleared OTC derivatives. Cleared derivative transactions require posting of initial margin as determined by each relevant clearing agency, which is segregated at a broker account registered with the Commodities Futures Trading Commission (“CFTC”), or the applicable regulator. In the U.S., counterparty risk is significantly reduced as creditors of the futures broker do not have claim to Portfolio assets in the segregated account. Additionally, portability of exposure in the event of default further reduces risk to the Portfolio. Variation margin, or changes in market value, are exchanged daily, but may not be netted between futures and cleared OTC derivatives.
Additional risks associated with each type of investment are described above within the respective security type notes. The Portfolio’s prospectus includes a discussion of the principal risks of investing in the Portfolio.
5. Investment Transactions
Aggregate cost of purchases and proceeds of sales of investment securities, excluding short-term securities, for the six months ended June 30, 2016 were as follows:
| | | | | | | | | | | | |
Purchases | | | Sales | |
U.S. Government | | Non U.S. Government | | | U.S. Government | | | Non U.S. Government | |
| $0 | | $ | 79,048,218 | | | $ | 0 | | | $ | 219,857,351 | |
6. Investment Management Fees and Other Transactions with Affiliates
Investment Management Agreement - MetLife Advisers is the investment adviser to the Portfolio. The Trust has entered into an investment management agreement with MetLife Advisers with respect to the Portfolio. For providing investment management services to the Portfolio, MetLife Advisers receives monthly compensation at the following annual rates:
| | | | | | |
Management
Fees earned by
MetLife Advisers
for the six months ended
June 30, 2016 | | % per annum | | | Average Daily Net Assets |
| $4,716,372 | | | 0.850 | % | | Of the first $500 million |
| | | 0.800 | % | | Of the next $500 million |
| | | 0.750 | % | | On amounts in excess of $1 billion |
MetLife Advisers has entered into an investment subadvisory agreement with respect to managing the Portfolio. Neuberger Berman Management LLC is compensated by MetLife Advisers to provide subadvisory services for the Portfolio.
Management Fee Waiver - Pursuant to a management fee waiver agreement, MetLife Advisers has agreed, for the period May 1, 2016 to April 30, 2017, to reduce its advisory fees set out above under “Investment Management Agreement” for each class of the Portfolio as follows:
| | |
% per annum | | Average Daily Net Assets |
| 0.025% | | First $500 million |
An identical agreement was in place for the period May 1, 2015 to April 30, 2016. Amounts waived for the six months ended June 30, 2016 are shown as a management fee waiver in the Statement of Operations.
Certain officers and trustees of the Trust may also be officers of MetLife Advisers; however, such officers and trustees receive no compensation from the Trust.
MSF-16
Metropolitan Series Fund
Neuberger Berman Genesis Portfolio
Notes to Financial Statements—June 30, 2016—(Continued)
On January 12, 2016, MetLife, Inc. announced its plan to pursue the separation of a substantial portion of its retail segment and is currently evaluating structural alternatives for such separation. It is anticipated that MetLife Advisers would be included in any such separation. Any separation transaction that might occur will be subject to the satisfaction of various conditions and approvals, including approval of any transaction by the MetLife, Inc. Board of Directors, satisfaction of any applicable requirements of the SEC, and receipt of insurance and other regulatory approvals and other anticipated conditions. Because the form of a separation had yet to be determined, MetLife, Inc. cannot currently provide a specific potential completion date or information about the potential impact on MetLife Advisers. No assurance can be given regarding the form that a separation transaction may take or the specific terms thereof, or that a separation will in fact occur. Depending on the form a separation takes, MetLife Advisers’ continued service as investment adviser to the Trusts could be subject to the satisfaction of various conditions and approvals, which may include obtaining approvals from the Trusts’ Board and shareholders.
Transfer Agency Agreement - MetLife serves as the transfer agent for the Trust. MetLife receives no fees for its services to the Trust under the transfer agency agreement.
Distribution and Service Fees - The Trust has a distribution agreement with MetLife Investors Distribution Company (“MIDC” or the “Distributor”) in which MIDC serves as the distributor for the Portfolio’s Class A, B and E Shares. MIDC is a wholly-owned subsidiary of MetLife Investors Group, LLC, an affiliate of the Adviser. The Trust has also adopted a Distribution and Service Plan under Rule 12b-1 of the 1940 Act for the Portfolio’s Class B and E Shares. Under the Distribution and Service Plan, the Class B and E Shares of the Portfolio pay a fee to compensate the Insurance Companies (or their affiliates) and other broker-dealers and financial intermediaries involved in the offer and sale of Portfolio shares for promoting or selling and servicing the Class B and E Shares. The fees under the Distribution and Service Plan for each class of the Portfolio’s shares are calculated as a percentage of the Portfolio’s average daily net assets that are attributable to that Class. Currently, the fee is 0.25% per year for Class B Shares and 0.15% per year for Class E Shares. Amounts incurred by the Portfolio for the six months ended June 30, 2016 are shown as Distribution and service fees in the Statement of Operations.
Deferred Trustee Compensation - Each Trustee who is not currently an employee of the Adviser or any of its affiliates receives compensation from the Trust for his or her service to the Trust. A deferred compensation plan (the “Plan”) is available to the Trustees on a voluntary basis. Deferred amounts remain in the Trust until distributed in accordance with the provisions of the Plan. The value of a participating Trustee’s deferral account is based on theoretical investments of deferred amounts on the normal payment dates in certain portfolios of the Trust or Met Investors Series Trust, an affiliate of the Trust, as designated by the participating Trustee. Changes in the value of participants’ deferral accounts are reflected as Trustees’ fees and expenses in the Statement of Operations. The portion of the accrued obligations allocated to the Portfolio under the Plan is reflected as Deferred trustees’ fees in the Statement of Assets and Liabilities.
7. Contractual Obligations
Under the Trust’s organizational documents, its officers and Trustees may be indemnified against certain liabilities and expenses arising out of the performance of their duties to the Trust. Additionally, the Trust has a variety of indemnification obligations under contracts with its service providers. The Trust’s maximum exposure under these arrangements is unknown, as this would involve future claims that may be made against the Trust that have not yet occurred.
8. Income Tax Information
The tax character of distributions paid for the years ended December 31, 2015 and 2014 were as follows:
| | | | | | | | | | | | | | | | | | | | |
Ordinary Income | | | Long-Term Capital Gain | | | Total | |
2015 | | 2014 | | | 2015 | | | 2014 | | | 2015 | | | 2014 | |
| $4,567,514 | | $ | 5,379,886 | | | $ | — | | | $ | — | | | $ | 4,567,514 | | | $ | 5,379,886 | |
As of December 31, 2015, the components of distributable earnings (accumulated losses) on a federal income tax basis were as follows:
| | | | | | | | | | | | | | | | | | | | |
Undistributed
Ordinary
Income | | Undistributed
Long-Term
Capital Gain | | | Net
Unrealized
Appreciation | | | Loss Carryforwards | | | Other
Accumulated
Capital Losses | | | Total | |
| $4,497,543 | | $ | — | | | $ | 343,080,715 | | | $ | (42,564,453 | ) | | $ | — | | | $ | 305,013,805 | |
The Portfolio utilizes the provisions of the federal income tax laws that provide for the carryforward of capital losses for prior years, offsetting such losses against any future realized capital gains. Under the Regulated Investment Company Modernization Act of 2010 (the “Act”), net capital losses recognized after December 22, 2010 may be carried forward indefinitely and their character is retained as short-term and/or long-term losses. Previously, net capital losses were carried forward for up to eight years and treated as short-term losses. As a transition rule, the Act requires that post-enactment net capital losses be used before pre-enactment net capital losses.
MSF-17
Metropolitan Series Fund
Neuberger Berman Genesis Portfolio
Notes to Financial Statements—June 30, 2016—(Continued)
During the year ended December 31, 2015, the Portfolio utilized capital loss carryforwards of $108,150,013.
As of December 31, 2015, the Portfolio had no post-enactment accumulated capital losses and had pre-enactment accumulated capital loss carryforwards in the amount of $42,564,453 that expire on December 31, 2017.
MSF-18
Metropolitan Series Fund
Russell 2000 Index Portfolio
Managed by MetLife Investment Advisors, LLC
Portfolio Manager Commentary*
PERFORMANCE
For the six month period ended June 30, 2016, the Class A, B, E and G shares of the Russell 2000 Index Portfolio returned 2.27%, 2.11%, 2.17%, and 2.08%, respectively. The Portfolio’s benchmark, the Russell 2000 Index1, returned 2.22%.
MARKET ENVIRONMENT / CONDITIONS
During the first quarter, equity markets were volatile as investors worried about a global economic slowdown and macroeconomic data continued to disappoint. U.S. retail sales, industrial production, and housing starts were all weaker than expected. In March, equity indexes rallied on central bank intervention and improving commodity prices. The People’s Bank of China cut reserve requirement ratios, the European Central Bank cut rates further and the Federal Reserve Bank (“Fed”) lowered the expected number of rate increases for 2016. During the second quarter, equity markets continued to move higher as positive macroeconomic data and recovering oil prices contrasted with uncertainty about a potential Fed rate hike and the United Kingdom referendum on European Union membership. In May, U.S. construction spending hit a record high and U.S. new, existing, and pending home sales and durable goods orders were all better than expected. On June 23, United Kingdom voters chose to “Leave” the European Union and on the day after the unexpected vote outcome, the price of gold had its largest single day increase since 2008, the British pound fell to its lowest level in 30 years, and equity markets around the world fell as much as 8%. However, global equity markets remained resilient and rallied the last three days of the quarter as concerns about the referendum abated and volatility declined.
During the first six months, the Federal Open Market Committee (the “Committee”) met four times and maintained the target range for the Federal Funds Rate at 0.25% to 0.50%. The Committee stated that the pace of improvement in the labor market had slowed while growth in economic activity appeared to have picked up. The Committee also stated that it expects economic conditions will evolve in a manner that will warrant only gradual increases in the Federal Funds Rate.
Eight of the nine sectors comprising the Russell 2000 Index experienced positive returns for the first six months of 2016. Utilities (4.9% beginning weight in the benchmark), up 19.8%, was the best performing sector. Materials and Processing (5.7% beginning weight), up 17.3%, and Consumer Staples (3.2% beginning weight), up 11.8%, were the next best-performing sectors. Health Care (16.4% beginning weight), down 12.8% was the worst performing sector.
The stocks with the largest positive impact on the benchmark return for the first half of the year were Advanced Micro Devices, up 79.1%; Burlington Stores, up 55.5%; and EPR Properties, up 42.1%. The stocks with the largest negative impact were Restoration Hardware Holdings, down 63.9%; Ultragenyx Pharmaceutical, down 56.4%; and Pacira Pharmaceuticals, down 56.1%.
PORTFOLIO REVIEW / PERIOD END POSITIONING
The Portfolio is managed utilizing a stratified sampling strategy versus the Russell 2000 Index. This strategy seeks to replicate the performance of the Index by owning a subset of Index constituents and neutralizing exposures across sectors. The Portfolio is periodically rebalanced for compositional changes in the Russell 2000 Index. Factors that impact tracking error include sampling, transaction costs, cash drag, securities lending, NAV rounding, contributions and withdrawals.
Stacey Lituchy
Norman Hu
Mirsad Usejnoski
Portfolio Managers
MetLife Investment Advisors, LLC
* This commentary may include statements that constitute “forward-looking statements” under the U.S. securities laws. Forward-looking statements include, among other things, projections, estimates, and information about possible or future results related to the Portfolio, market or regulatory developments. The views expressed above are not guarantees of future performance or economic results and involve certain risks, uncertainties and assumptions that could cause actual outcomes and results to differ materially from the views expressed herein. The views expressed above are subject to change at any time based upon economic, market, or other conditions and the subadvisory firm undertakes no obligation to update the views expressed herein. Any discussions of specific securities should not be considered a recommendation to buy or sell those securities. The views expressed above (including any forward-looking statement) may not be relied upon as investment advice or as an indication of the Portfolio’s trading intent. Information about the Portfolio’s holdings, asset allocation or country diversification is historical and is not an indication of future Portfolio composition, which may vary. Direct investment in any index is not possible. The performance of any index mentioned in this commentary has not been adjusted for ongoing management, distribution and operating expenses, and sales charges applicable to mutual fund investments. In addition, the returns do not reflect additional fees charged by separate accounts or variable insurance contracts that an investor in the Portfolio may pay. If these additional fees were reflected, performance would have been lower.
MSF-1
Metropolitan Series Fund
Russell 2000 Index Portfolio
A $10,000 INVESTMENT COMPARED TO THE RUSSELL 2000 INDEX
SIX MONTH RETURN & AVERAGE ANNUAL RETURNS (%) AS OF JUNE 30, 2016
| | | | | | | | | | | | | | | | | | | | |
| | | 6 Month | | | 1 Year | | | 5 Year | | | 10 Year | | | Since Inception2 | |
| Russell 2000 Index Portfolio | | | | | | | | | | | | | | | | | | | | |
Class A | | | 2.27 | | | | -6.61 | | | | 8.40 | | | | 6.15 | | | | — | |
Class B | | | 2.11 | | | | -6.84 | | | | 8.11 | | | | 5.87 | | | | — | |
Class E | | | 2.17 | | | | -6.75 | | | | 8.24 | | | | 5.99 | | | | — | |
Class G | | | 2.08 | | | | -6.89 | | | | 8.07 | | | | — | | | | 14.41 | |
| Russell 2000 Index | | | 2.22 | | | | -6.73 | | | | 8.35 | | | | 6.20 | | | | — | |
1 The Russell 2000 Index is an unmanaged measure of performance of the 2,000 smallest companies in the Russell 3000 Index.
2 Inception dates of the Class A, Class B, Class E and Class G shares are 11/9/98, 1/2/01, 5/1/01 and 4/28/09, respectively.
Portfolio performance is calculated including reinvestment of all income and capital gain distributions. Performance numbers are net of all Portfolio expenses but do not include any insurance, sales, separate account or administrative charges of variable annuity or life insurance contracts or any additional expenses that participants may bear relating to the operations of their plans. If these charges were included, the returns would be lower. The performance of any index referenced above has not been adjusted for ongoing management, distribution and operating expenses, and sales charges applicable to mutual fund investments. Direct investment in any index is not possible. The performance of Class A shares, as set forth in the line graph above, will differ from that of other classes because of the difference in expenses paid by policyholders investing in the different share classes.
This information represents past performance and is not indicative of future results. Investment return and principal value may fluctuate so that shares, upon redemption, may be worth more or less than the original cost.
PORTFOLIO COMPOSITION AS OF JUNE 30, 2016
Top Holdings
| | | | |
| | | % of
Net Assets | |
| Olin Corp. | | | 0.2 | |
| IDACORP, Inc. | | | 0.2 | |
| Portland General Electric Co. | | | 0.2 | |
| Gramercy Property Trust | | | 0.2 | |
| iShares Russell 2000 Index Fund | | | 0.2 | |
| Southwest Gas Corp. | | | 0.2 | |
| Microsemi Corp. | | | 0.2 | |
| Curtiss-Wright Corp. | | | 0.2 | |
| Healthcare Realty Trust, Inc. | | | 0.2 | |
| Medical Properties Trust, Inc. | | | 0.2 | |
Top Sectors
| | | | |
| | | % of
Net Assets | |
| Financials | | | 25.3 | |
| Information Technology | | | 16.7 | |
| Industrials | | | 13.4 | |
| Health Care | | | 13.2 | |
| Consumer Discretionary | | | 13.2 | |
| Materials | | | 4.4 | |
| Utilities | | | 4.1 | |
| Consumer Staples | | | 3.0 | |
| Energy | | | 3.0 | |
| Telecommunication Services | | | 0.9 | |
MSF-2
Metropolitan Series Fund
Russell 2000 Index Portfolio
Understanding Your Portfolio’s Expenses (Unaudited)
Shareholder Expense Example
As a shareholder of the Portfolio, you incur ongoing costs, including management fees; distribution and service (12b-1) fees; and other Portfolio expenses. This example is intended to help you understand your ongoing costs (in dollars) (referred to as “expenses”) of investing in the Portfolio and compare these costs with the ongoing costs of investing in other mutual funds. The example is based on an investment of $1,000 invested at the beginning of the period and held for the entire period, January 1, 2016 through June 30, 2016.
Actual Expenses
The first line for each share class of the Portfolio in the table below provides information about actual account values and actual expenses. You may use the information in this line, together with the amount you invested in the particular share class of the Portfolio, to estimate the expenses that you paid over the period. Simply divide your account value by $1,000 (for example, an $8,600 account value divided by $1,000 = 8.6), then multiply the result by the number in the first line under the heading entitled “Expenses Paid During Period” to estimate the expenses you paid on your account during this period.
Hypothetical Example for Comparison Purposes
The second line for each share class of the Portfolio in the table below provides information about hypothetical account values and hypothetical expenses based on the Portfolio’s actual expense ratio and an assumed rate of return of 5% per year before expenses, which is not the Portfolio’s actual return. The hypothetical account values and expenses may not be used to estimate the actual ending account balance or expenses you paid for the period. You may use this information to compare the ongoing costs of investing in the Portfolio and other funds. To do so, compare this 5% hypothetical example with the 5% hypothetical examples that appear in the shareholder reports of the other funds.
Please note that the expenses shown in the table are meant to highlight your ongoing costs only and do not reflect any fees or charges of your variable insurance product or any additional expenses that participants in certain eligible qualified plans may bear relating to the operations of their plan. Therefore, the second line for each share class in the table is useful in comparing ongoing costs only, and will not help you determine the relative total costs of owning different funds. In addition, if these other costs were included, your costs would have been higher.
| | | | | | | | | | | | | | | | | | |
Russell 2000 Index Portfolio | | | | Annualized
Expense
Ratio | | | Beginning
Account Value
January 1,
2016 | | | Ending
Account Value
June 30,
2016 | | | Expenses Paid
During Period**
January 1, 2016
to
June 30,
2016 | |
Class A(a) | | Actual | | | 0.31 | % | | $ | 1,000.00 | | | $ | 1,022.70 | | | $ | 1.56 | |
| | Hypothetical* | | | 0.31 | % | | $ | 1,000.00 | | | $ | 1,023.32 | | | $ | 1.56 | |
| | | | | |
Class B(a) | | Actual | | | 0.56 | % | | $ | 1,000.00 | | | $ | 1,021.10 | | | $ | 2.81 | |
| | Hypothetical* | | | 0.56 | % | | $ | 1,000.00 | | | $ | 1,022.08 | | | $ | 2.82 | |
| | | | | |
Class E(a) | | Actual | | | 0.46 | % | | $ | 1,000.00 | | | $ | 1,021.70 | | | $ | 2.31 | |
| | Hypothetical* | | | 0.46 | % | | $ | 1,000.00 | | | $ | 1,022.58 | | | $ | 2.31 | |
| | | | | |
Class G(a) | | Actual | | | 0.61 | % | | $ | 1,000.00 | | | $ | 1,020.80 | | | $ | 3.06 | |
| | Hypothetical* | | | 0.61 | % | | $ | 1,000.00 | | | $ | 1,021.83 | | | $ | 3.07 | |
* Hypothetical assumes a rate of return of 5% per year before expenses.
** Expenses paid are equal to the Portfolio’s annualized expense ratio for the most recent six month period, as shown above, multiplied by the average account value over the period, multiplied by the number of days (182 days) in the most recent fiscal half-year, divided by 366 (to reflect the one-half year period).
(a) The annualized expense ratio shown reflects the impact of the management fee waiver as described in Note 6 of the Notes to Financial Statements.
MSF-3
Metropolitan Series Fund
Russell 2000 Index Portfolio
Schedule of Investments as of June 30, 2016 (Unaudited)
Common Stocks—97.0% of Net Assets
| | | | | | | | |
| Security Description | | Shares | | | Value | |
| | |
Aerospace & Defense—1.5% | | | | | | | | |
AAR Corp. | | | 16,635 | | | $ | 388,261 | |
Aerojet Rocketdyne Holdings, Inc. (a) (b) | | | 29,383 | | | | 537,121 | |
Aerovironment, Inc. (a) (b) | | | 8,967 | | | | 249,283 | |
American Science & Engineering, Inc. | | | 3,412 | | | | 127,643 | |
Astronics Corp. (a) | | | 10,621 | | | | 353,254 | |
Cubic Corp. | | | 12,431 | | | | 499,229 | |
Curtiss-Wright Corp. | | | 21,215 | | | | 1,787,364 | |
DigitalGlobe, Inc. (a) (b) | | | 29,669 | | | | 634,620 | |
Ducommun, Inc. (a) | | | 5,959 | | | | 117,869 | |
Engility Holdings, Inc. (a) | | | 8,737 | | | | 184,525 | |
Esterline Technologies Corp. (a) | | | 14,168 | | | | 878,983 | |
KEYW Holding Corp. (The) (a) | | | 17,571 | | | | 174,656 | |
KLX, Inc. (a) | | | 25,831 | | | | 800,761 | |
Kratos Defense & Security Solutions, Inc. (a) (b) | | | 23,529 | | | | 96,469 | |
Mercury Systems, Inc. (a) | | | 19,389 | | | | 482,011 | |
Moog, Inc. - Class A (a) | | | 15,634 | | | | 842,985 | |
National Presto Industries, Inc. | | | 2,572 | | | | 242,668 | |
Sparton Corp. (a) | | | 5,193 | | | | 113,052 | |
TASER International, Inc. (a) (b) | | | 26,071 | | | | 648,646 | |
Teledyne Technologies, Inc. (a) | | | 16,663 | | | | 1,650,470 | |
Triumph Group, Inc. (b) | | | 24,082 | | | | 854,911 | |
Vectrus, Inc. (a) | | | 5,231 | | | | 149,031 | |
| | | | | | | | |
| | | | | | | 11,813,812 | |
| | | | | | | | |
| | |
Air Freight & Logistics—0.5% | | | | | | | | |
Air Transport Services Group, Inc. (a) | | | 25,431 | | | | 329,586 | |
Atlas Air Worldwide Holdings, Inc. (a) | | | 12,481 | | | | 516,963 | |
Echo Global Logistics, Inc. (a) | | | 14,649 | | | | 328,431 | |
Forward Air Corp. | | | 14,772 | | | | 657,797 | |
HUB Group, Inc. - Class A (a) | | | 17,356 | | | | 665,950 | |
Park-Ohio Holdings Corp. | | | 4,748 | | | | 134,273 | |
XPO Logistics, Inc. (a) (b) | | | 47,650 | | | | 1,251,289 | |
| | | | | | | | |
| | | | | | | 3,884,289 | |
| | | | | | | | |
| | |
Airlines—0.4% | | | | | | | | |
Allegiant Travel Co. | | | 6,708 | | | | 1,016,262 | |
Hawaiian Holdings, Inc. (a) | | | 25,756 | | | | 977,698 | |
SkyWest, Inc. | | | 24,419 | | | | 646,126 | |
Virgin America, Inc. (a) (b) | | | 10,390 | | | | 584,022 | |
| | | | | | | | |
| | | | | | | 3,224,108 | |
| | | | | | | | |
| | |
Auto Components—1.0% | | | | | | | | |
American Axle & Manufacturing Holdings, Inc. (a) | | | 37,813 | | | | 547,532 | |
Cooper Tire & Rubber Co. | | | 27,246 | | | | 812,476 | |
Cooper-Standard Holding, Inc. (a) | | | 6,881 | | | | 543,530 | |
Dana Holding Corp. | | | 75,676 | | | | 799,138 | |
Dorman Products, Inc. (a) (b) | | | 12,774 | | | | 730,673 | |
Drew Industries, Inc. | | | 11,598 | | | | 983,974 | |
Federal-Mogul Holdings Corp. (a) | | | 15,664 | | | | 130,168 | |
Fox Factory Holding Corp. (a) (b) | | | 11,504 | | | | 199,824 | |
Gentherm, Inc. (a) | | | 17,276 | | | | 591,703 | |
Horizon Global Corp. (a) | | | 9,617 | | | | 109,153 | |
Metaldyne Performance Group, Inc. | | | 6,210 | | | | 85,387 | |
Modine Manufacturing Co. (a) | | | 23,187 | | | | 204,046 | |
Motorcar Parts of America, Inc. (a) | | | 8,000 | | | | 217,440 | |
| | |
Auto Components—(Continued) | | | | | | | | |
Spartan Motors, Inc. | | | 17,934 | | | | 112,267 | |
Standard Motor Products, Inc. | | | 9,638 | | | | 383,400 | |
Stoneridge, Inc. (a) | | | 13,705 | | | | 204,753 | |
Superior Industries International, Inc. | | | 12,615 | | | | 337,830 | |
Tenneco, Inc. (a) | | | 27,494 | | | | 1,281,495 | |
Tower International, Inc. | | | 10,455 | | | | 215,164 | |
| | | | | | | | |
| | | | | | | 8,489,953 | |
| | | | | | | | |
| | |
Automobiles—0.0% | | | | | | | | |
Winnebago Industries, Inc. (b) | | | 12,257 | | | | 280,930 | |
| | | | | | | | |
| | |
Banks—9.4% | | | | | | | | |
1st Source Corp. | | | 7,645 | | | | 247,622 | |
Allegiance Bancshares, Inc. (a) (b) | | | 5,825 | | | | 144,926 | |
American National Bankshares, Inc. (b) | | | 4,311 | | | | 108,551 | |
Ameris Bancorp | | | 16,855 | | | | 500,593 | |
Ames National Corp. (b) | | | 4,647 | | | | 124,633 | |
Arrow Financial Corp. (b) | | | 5,820 | | | | 176,288 | |
Atlantic Capital Bancshares, Inc. (a) | | | 13,143 | | | | 190,048 | |
Banc of California, Inc. | | | 23,881 | | | | 432,246 | |
BancFirst Corp. | | | 3,589 | | | | 216,488 | |
Banco Latinoamericano de Comercio Exterior S.A. - Class E (b) | | | 14,005 | | | | 371,132 | |
Bancorp, Inc. (The) (a) | | | 17,041 | | | | 102,587 | |
BancorpSouth, Inc. | | | 45,366 | | | | 1,029,355 | |
Bank of Marin Bancorp (b) | | | 3,199 | | | | 154,736 | |
Bank of the Ozarks, Inc. (b) | | | 40,882 | | | | 1,533,893 | |
Banner Corp. | | | 14,787 | | | | 629,039 | |
Bar Harbor Bankshares (b) | | | 2,884 | | | | 101,228 | |
BBCN Bancorp, Inc. | | | 36,725 | | | | 547,937 | |
Berkshire Hills Bancorp, Inc. | | | 14,754 | | | | 397,178 | |
Blue Hills Bancorp, Inc. (b) | | | 13,063 | | | | 192,810 | |
BNC Bancorp | | | 18,833 | | | | 427,697 | |
Boston Private Financial Holdings, Inc. | | | 40,232 | | | | 473,933 | |
Bridge Bancorp, Inc. (b) | | | 8,870 | | | | 251,908 | |
Brookline Bancorp, Inc. | | | 33,001 | | | | 364,001 | |
Bryn Mawr Bank Corp. | | | 8,151 | | | | 238,009 | |
Camden National Corp. | | | 5,226 | | | | 219,492 | |
Capital Bank Financial Corp. - Class A (b) | | | 11,497 | | | | 331,114 | |
Cardinal Financial Corp. | | | 14,931 | | | | 327,586 | |
Cathay General Bancorp | | | 37,025 | | | | 1,044,105 | |
Centerstate Banks, Inc. | | | 21,605 | | | | 340,279 | |
Central Pacific Financial Corp. | | | 15,142 | | | | 357,351 | |
Chemical Financial Corp. | | | 18,789 | | | | 700,642 | |
Citizens & Northern Corp. (b) | | | 6,716 | | | | 135,798 | |
City Holding Co. (b) | | | 8,256 | | | | 375,400 | |
CNB Financial Corp. (b) | | | 6,782 | | | | 120,720 | |
CoBiz Financial, Inc. | | | 17,832 | | | | 208,634 | |
Columbia Banking System, Inc. | | | 28,451 | | | | 798,335 | |
Community Bank System, Inc. (b) | | | 22,222 | | | | 913,102 | |
Community Trust Bancorp, Inc. | | | 8,162 | | | | 282,895 | |
ConnectOne Bancorp, Inc. | | | 16,906 | | | | 265,255 | |
CU Bancorp (a) | | | 8,163 | | | | 185,545 | |
Customers Bancorp, Inc. (a) (b) | | | 11,686 | | | | 293,669 | |
CVB Financial Corp. (b) | | | 50,002 | | | | 819,533 | |
Eagle Bancorp, Inc. (a) | | | 15,010 | | | | 722,131 | |
See accompanying notes to financial statements.
MSF-4
Metropolitan Series Fund
Russell 2000 Index Portfolio
Schedule of Investments as of June 30, 2016 (Unaudited)
Common Stocks—(Continued)
| | | | | | | | |
| Security Description | | Shares | | | Value | |
| | |
Banks—(Continued) | | | | | | | | |
Enterprise Bancorp, Inc. | | | 4,064 | | | $ | 97,495 | |
Enterprise Financial Services Corp. | | | 9,318 | | | | 259,879 | |
Farmers Capital Bank Corp. | | | 3,713 | | | | 101,551 | |
Farmers National Banc Corp. | | | 13,414 | | | | 118,043 | |
FCB Financial Holdings, Inc. - Class A (a) | | | 14,825 | | | | 504,050 | |
Fidelity Southern Corp. | | | 10,827 | | | | 169,659 | |
Financial Institutions, Inc. | | | 6,461 | | | | 168,438 | |
First Bancorp | | | 8,573 | | | | 150,713 | |
First BanCorp (a) | | | 55,535 | | | | 220,474 | |
First Bancorp, Inc. (b) | | | 5,308 | | | | 114,334 | |
First Busey Corp. | | | 15,850 | | | | 339,031 | |
First Business Financial Services, Inc. | | | 4,182 | | | | 98,152 | |
First Citizens BancShares, Inc. - Class A | | | 3,585 | | | | 928,192 | |
First Commonwealth Financial Corp. | | | 41,887 | | | | 385,360 | |
First Community Bancshares, Inc. | | | 8,470 | | | | 190,067 | |
First Connecticut Bancorp, Inc. | | | 7,629 | | | | 126,336 | |
First Financial Bancorp | | | 28,214 | | | | 548,762 | |
First Financial Bankshares, Inc. (b) | | | 30,167 | | | | 989,176 | |
First Financial Corp. | | | 6,038 | | | | 221,112 | |
First Foundation, Inc. (a) | | | 6,983 | | | | 150,135 | |
First Interstate BancSystem, Inc. - Class A (b) | | | 9,233 | | | | 259,447 | |
First Merchants Corp. | | | 20,166 | | | | 502,738 | |
First Midwest Bancorp, Inc. | | | 39,553 | | | | 694,551 | |
First NBC Bank Holding Co. (a) | | | 7,557 | | | | 126,882 | |
First of Long Island Corp. (The) | | | 6,616 | | | | 189,681 | |
FirstMerit Corp. | | | 80,467 | | | | 1,631,066 | |
Flushing Financial Corp. | | | 15,132 | | | | 300,824 | |
FNB Corp. | | | 102,372 | | | | 1,283,745 | |
Franklin Financial Network, Inc. (a) | | | 4,922 | | | | 154,354 | |
Fulton Financial Corp. | | | 82,075 | | | | 1,108,012 | |
German American Bancorp, Inc. (b) | | | 6,759 | | | | 216,085 | |
Glacier Bancorp, Inc. | | | 37,248 | | | | 990,052 | |
Great Southern Bancorp, Inc. (b) | | | 4,991 | | | | 184,517 | |
Great Western Bancorp, Inc. | | | 28,884 | | | | 911,001 | |
Guaranty Bancorp | | | 8,675 | | | | 144,873 | |
Hancock Holding Co. (b) | | | 37,825 | | | | 987,611 | |
Hanmi Financial Corp. | | | 15,681 | | | | 368,347 | |
Heartland Financial USA, Inc. | | | 10,964 | | | | 386,920 | |
Heritage Commerce Corp. | | | 10,489 | | | | 110,449 | |
Heritage Financial Corp. | | | 17,398 | | | | 305,857 | |
Heritage Oaks Bancorp | | | 11,367 | | | | 90,254 | |
Hilltop Holdings, Inc. (a) | | | 38,481 | | | | 807,716 | |
Home BancShares, Inc. (b) | | | 58,980 | | | | 1,167,214 | |
HomeTrust Bancshares, Inc. (a) | | | 10,270 | | | | 189,995 | |
Horizon Bancorp (b) | | | 5,200 | | | | 130,728 | |
Iberiabank Corp. | | | 19,964 | | | | 1,192,450 | |
Independent Bank Corp. | | | 11,863 | | | | 172,132 | |
Independent Bank Corp./Rockland Trust | | | 12,760 | | | | 583,132 | |
Independent Bank Group, Inc. (b) | | | 6,728 | | | | 288,698 | |
International Bancshares Corp. | | | 25,537 | | | | 666,260 | |
Investors Bancorp, Inc. | | | 144,619 | | | | 1,602,379 | |
Lakeland Bancorp, Inc. | | | 17,320 | | | | 197,102 | |
Lakeland Financial Corp. | | | 8,139 | | | | 382,614 | |
LegacyTexas Financial Group, Inc. | | | 22,230 | | | | 598,209 | |
Live Oak Bancshares, Inc. | | | 10,388 | | | | 146,575 | |
MainSource Financial Group, Inc. | | | 10,246 | | | | 225,924 | |
MB Financial, Inc. | | | 34,863 | | | | 1,264,830 | |
| | |
Banks—(Continued) | | | | | | | | |
Mercantile Bank Corp. | | | 8,647 | | | | 206,317 | |
MidWestOne Financial Group, Inc. | | | 3,645 | | | | 104,101 | |
National Bank Holdings Corp. - Class A | | | 12,889 | | | | 262,420 | |
National Bankshares, Inc. (b) | | | 3,487 | | | | 121,766 | |
National Commerce Corp. (a) | | | 4,628 | | | | 107,925 | |
NBT Bancorp, Inc. | | | 20,117 | | | | 575,950 | |
Nicolet Bankshares, Inc. (a) (b) | | | 3,298 | | | | 125,588 | |
OFG Bancorp | | | 19,884 | | | | 165,037 | |
Old National Bancorp | | | 65,101 | | | | 815,716 | |
Old Second Bancorp, Inc. | | | 14,296 | | | | 97,642 | |
Opus Bank | | | 8,631 | | | | 291,728 | |
Pacific Continental Corp. | | | 10,841 | | | | 170,312 | |
Pacific Premier Bancorp, Inc. (a) | | | 12,610 | | | | 302,640 | |
Park National Corp. | | | 6,727 | | | | 617,404 | |
Park Sterling Corp. | | | 23,392 | | | | 165,849 | |
Peapack Gladstone Financial Corp. (b) | | | 6,672 | | | | 123,499 | |
Penns Woods Bancorp, Inc. (b) | | | 2,408 | | | | 101,112 | |
People’s Utah Bancorp | | | 7,011 | | | | 116,383 | |
Peoples Bancorp, Inc. | | | 10,141 | | | | 220,972 | |
Peoples Financial Services Corp. (b) | | | 3,673 | | | | 143,761 | |
Pinnacle Financial Partners, Inc. (b) | | | 19,605 | | | | 957,704 | |
Preferred Bank | | | 5,630 | | | | 162,566 | |
PrivateBancorp, Inc. | | | 38,203 | | | | 1,682,078 | |
Prosperity Bancshares, Inc. (b) | | | 32,660 | | | | 1,665,333 | |
QCR Holdings, Inc. | | | 5,811 | | | | 158,001 | |
Renasant Corp. | | | 20,087 | | | | 649,413 | |
Republic Bancorp, Inc. - Class A | | | 5,421 | | | | 149,782 | |
S&T Bancorp, Inc. | | | 15,660 | | | | 382,887 | |
Sandy Spring Bancorp, Inc. | | | 13,447 | | | | 390,770 | |
Seacoast Banking Corp. of Florida (a) | | | 15,100 | | | | 245,224 | |
ServisFirst Bancshares, Inc. (b) | | | 12,241 | | | | 604,583 | |
Sierra Bancorp | | | 5,841 | | | | 97,486 | |
Simmons First National Corp. - Class A | | | 13,943 | | | | 643,957 | |
South State Corp. | | | 12,175 | | | | 828,509 | |
Southside Bancshares, Inc. | | | 12,682 | | | | 392,124 | |
Southwest Bancorp, Inc. | | | 9,007 | | | | 152,489 | |
State Bank Financial Corp. (b) | | | 16,379 | | | | 333,313 | |
Sterling Bancorp | | | 61,931 | | | | 972,317 | |
Stock Yards Bancorp, Inc. (b) | | | 10,633 | | | | 300,170 | |
Stonegate Bank | | | 5,132 | | | | 165,610 | |
Suffolk Bancorp | | | 6,378 | | | | 199,695 | |
Sun Bancorp, Inc. (a) | | | 4,652 | | | | 96,110 | |
Talmer Bancorp, Inc. - Class A | | | 28,871 | | | | 553,457 | |
Texas Capital Bancshares, Inc. (a) | | | 22,538 | | | | 1,053,877 | |
Tompkins Financial Corp. | | | 7,424 | | | | 482,560 | |
Towne Bank | | | 32,751 | | | | 709,058 | |
TriCo Bancshares | | | 11,155 | | | | 307,878 | |
TriState Capital Holdings, Inc. (a) (b) | | | 11,422 | | | | 156,824 | |
Triumph Bancorp, Inc. (a) | | | 7,480 | | | | 119,680 | |
Trustmark Corp. (b) | | | 33,957 | | | | 843,831 | |
UMB Financial Corp. (b) | | | 21,887 | | | | 1,164,607 | |
Umpqua Holdings Corp. (b) | | | 110,163 | | | | 1,704,222 | |
Union Bankshares Corp. | | | 20,843 | | | | 515,031 | |
United Bankshares, Inc. (b) | | | 32,641 | | | | 1,224,364 | |
United Community Banks, Inc. | | | 34,521 | | | | 631,389 | |
Univest Corp. of Pennsylvania | | | 9,559 | | | | 200,930 | |
Valley National Bancorp (b) | | | 120,885 | | | | 1,102,471 | |
See accompanying notes to financial statements.
MSF-5
Metropolitan Series Fund
Russell 2000 Index Portfolio
Schedule of Investments as of June 30, 2016 (Unaudited)
Common Stocks—(Continued)
| | | | | | | | |
| Security Description | | Shares | | | Value | |
| | |
Banks—(Continued) | | | | | | | | |
Washington Trust Bancorp, Inc. | | | 7,713 | | | $ | 292,477 | |
Webster Financial Corp. (b) | | | 43,929 | | | | 1,491,390 | |
WesBanco, Inc. | | | 17,978 | | | | 558,217 | |
West Bancorp, Inc. | | | 8,036 | | | | 149,389 | |
Westamerica Bancorp (b) | | | 12,513 | | | | 616,390 | |
Wilshire Bancorp, Inc. | | | 33,080 | | | | 344,694 | |
Wintrust Financial Corp. | | | 23,613 | | | | 1,204,263 | |
Yadkin Financial Corp. | | | 24,582 | | | | 616,762 | |
Your Community Bankshares, Inc. (b) | | | 2,723 | | | | 101,187 | |
| | | | | | | | |
| | | | | | | 76,053,798 | |
| | | | | | | | |
| | |
Beverages—0.2% | | | | | | | | |
Boston Beer Co., Inc. (The) - Class A (a) (b) | | | 4,334 | | | | 741,244 | |
Coca-Cola Bottling Co. Consolidated (b) | | | 2,376 | | | | 350,389 | |
MGP Ingredients, Inc. | | | 5,440 | | | | 207,971 | |
National Beverage Corp. (a) | | | 5,742 | | | | 360,655 | |
Primo Water Corp. (a) | | | 10,997 | | | | 129,875 | |
| | | | | | | | |
| | | | | | | 1,790,134 | |
| | | | | | | | |
| | |
Biotechnology—4.4% | | | | | | | | |
Acceleron Pharma, Inc. (a) (b) | | | 13,695 | | | | 465,356 | |
Achillion Pharmaceuticals, Inc. (a) (b) | | | 56,103 | | | | 437,603 | |
Acorda Therapeutics, Inc. (a) (b) | | | 20,455 | | | | 521,705 | |
Adamas Pharmaceuticals, Inc. (a) (b) | | | 7,040 | | | | 106,586 | |
Aduro Biotech, Inc. (a) (b) | | | 18,643 | | | | 210,852 | |
Advaxis, Inc. (a) (b) | | | 14,489 | | | | 117,216 | |
Agenus, Inc. (a) (b) | | | 38,088 | | | | 154,256 | |
Aimmune Therapeutics, Inc. (a) (b) | | | 14,043 | | | | 151,945 | |
Akebia Therapeutics, Inc. (a) (b) | | | 22,828 | | | | 170,753 | |
Alder Biopharmaceuticals, Inc. (a) (b) | | | 23,239 | | | | 580,278 | |
AMAG Pharmaceuticals, Inc. (a) (b) | | | 16,034 | | | | 383,533 | |
Amicus Therapeutics, Inc. (a) (b) | | | 64,253 | | | | 350,821 | |
Ardelyx, Inc. (a) (b) | | | 12,919 | | | | 112,783 | |
Arena Pharmaceuticals, Inc. (a) (b) | | | 114,310 | | | | 195,470 | |
ARIAD Pharmaceuticals, Inc. (a) (b) | | | 87,547 | | | | 646,972 | |
Array BioPharma, Inc. (a) (b) | | | 64,536 | | | | 229,748 | |
Arrowhead Pharmaceuticals, Inc. (a) (b) | | | 25,887 | | | | 137,719 | |
Atara Biotherapeutics, Inc. (a) (b) | | | 11,963 | | | | 269,287 | |
Avexis, Inc. (a) (b) | | | 2,701 | | | | 102,692 | |
Axovant Sciences, Ltd. (a) (b) | | | 13,161 | | | | 168,987 | |
Bellicum Pharmaceuticals, Inc. (a) | | | 11,404 | | | | 147,796 | |
BioCryst Pharmaceuticals, Inc. (a) (b) | | | 42,881 | | | | 121,782 | |
BioSpecifics Technologies Corp. (a) | | | 3,039 | | | | 121,378 | |
Bluebird Bio, Inc. (a) (b) | | | 18,261 | | | | 790,519 | |
Blueprint Medicines Corp. (a) | | | 10,512 | | | | 212,868 | |
Celator Pharmaceuticals, Inc. (a) | | | 16,308 | | | | 492,175 | |
Celldex Therapeutics, Inc. (a) (b) | | | 47,742 | | | | 209,587 | |
Cepheid, Inc. (a) (b) | | | 35,601 | | | | 1,094,731 | |
Clovis Oncology, Inc. (a) (b) | | | 16,535 | | | | 226,860 | |
Coherus Biosciences, Inc. (a) (b) | | | 15,243 | | | | 257,454 | |
Concert Pharmaceuticals, Inc. (a) (b) | | | 7,706 | | | | 86,538 | |
Curis, Inc. (a) | | | 63,039 | | | | 98,341 | |
Cytokinetics, Inc. (a) (b) | | | 18,716 | | | | 177,615 | |
CytomX Therapeutics, Inc. (a) | | | 11,599 | | | | 118,484 | |
Dyax Corp. (b) (c) | | | 69,204 | | | | 76,816 | |
Dynavax Technologies Corp. (a) (b) | | | 17,634 | | | | 257,104 | |
| | |
Biotechnology—(Continued) | | | | | | | | |
Eagle Pharmaceuticals, Inc. (a) (b) | | | 4,073 | | | | 157,992 | |
Editas Medicine, Inc. (a) (b) | | | 5,014 | | | | 122,342 | |
Emergent Biosolutions, Inc. (a) | | | 15,717 | | | | 441,962 | |
Enanta Pharmaceuticals, Inc. (a) (b) | | | 7,598 | | | | 167,536 | |
Epizyme, Inc. (a) | | | 20,920 | | | | 214,221 | |
Esperion Therapeutics, Inc. (a) (b) | | | 6,166 | | | | 60,920 | |
Exact Sciences Corp. (a) (b) | | | 45,224 | | | | 553,994 | |
Exelixis, Inc. (a) (b) | | | 111,773 | | | | 872,947 | |
FibroGen, Inc. (a) (b) | | | 24,972 | | | | 409,791 | |
Five Prime Therapeutics, Inc. (a) (b) | | | 13,422 | | | | 555,000 | |
Flexion Therapeutics, Inc. (a) (b) | | | 7,961 | | | | 119,136 | |
Foundation Medicine, Inc. (a) (b) | | | 7,156 | | | | 133,531 | |
Galena Biopharma, Inc. (a) (b) | | | 102,975 | | | | 47,997 | |
Genomic Health, Inc. (a) (b) | | | 8,810 | | | | 228,135 | |
Geron Corp. (a) (b) | | | 75,588 | | | | 202,576 | |
Global Blood Therapeutics, Inc. (a) (b) | | | 7,789 | | | | 129,220 | |
Halozyme Therapeutics, Inc. (a) (b) | | | 51,119 | | | | 441,157 | |
Heron Therapeutics, Inc. (a) (b) | | | 18,692 | | | | 337,391 | |
ImmunoGen, Inc. (a) (b) | | | 48,008 | | | | 147,865 | |
Immunomedics, Inc. (a) (b) | | | 49,803 | | | | 115,543 | |
Inovio Pharmaceuticals, Inc. (a) (b) | | | 36,297 | | | | 335,384 | |
Insmed, Inc. (a) (b) | | | 30,343 | | | | 299,182 | |
Insys Therapeutics, Inc. (a) (b) | | | 11,118 | | | | 143,867 | |
Intellia Therapeutics, Inc. (a) (b) | | | 6,001 | | | | 128,121 | |
Invitae Corp. (a) | | | 13,018 | | | | 96,203 | |
Ironwood Pharmaceuticals, Inc. (a) (b) | | | 63,682 | | | | 832,642 | |
Karyopharm Therapeutics, Inc. (a) (b) | | | 13,644 | | | | 91,551 | |
Keryx Biopharmaceuticals, Inc. (a) (b) | | | 50,118 | | | | 331,781 | |
Kite Pharma, Inc. (a) (b) | | | 19,210 | | | | 960,500 | |
La Jolla Pharmaceutical Co. (a) (b) | | | 10,265 | | | | 164,240 | |
Lexicon Pharmaceuticals, Inc. (a) (b) | | | 23,843 | | | | 342,147 | |
Ligand Pharmaceuticals, Inc. (a) (b) | | | 9,331 | | | | 1,112,908 | |
Lion Biotechnologies, Inc. (a) (b) | | | 25,388 | | | | 205,643 | |
Loxo Oncology, Inc. (a) (b) | | | 7,131 | | | | 165,297 | |
MacroGenics, Inc. (a) (b) | | | 14,803 | | | | 399,533 | |
MannKind Corp. (a) (b) | | | 169,958 | | | | 197,151 | |
MediciNova, Inc. (a) | | | 16,691 | | | | 126,017 | |
Merrimack Pharmaceuticals, Inc. (a) | | | 64,388 | | | | 347,051 | |
MiMedx Group, Inc. (a) (b) | | | 59,054 | | | | 471,251 | |
Momenta Pharmaceuticals, Inc. (a) (b) | | | 32,218 | | | | 347,954 | |
Myriad Genetics, Inc. (a) (b) | | | 33,438 | | | | 1,023,203 | |
Natera, Inc. (a) | | | 13,813 | | | | 166,654 | |
NewLink Genetics Corp. (a) (b) | | | 11,288 | | | | 127,103 | |
Novavax, Inc. (a) (b) | | | 138,764 | | | | 1,008,814 | |
OncoMed Pharmaceuticals, Inc. (a) (b) | | | 9,560 | | | | 117,684 | |
Ophthotech Corp. (a) (b) | | | 15,006 | | | | 765,756 | |
Organovo Holdings, Inc. (a) (b) | | | 45,372 | | | | 168,784 | |
Otonomy, Inc. (a) (b) | | | 12,561 | | | | 199,469 | |
PDL BioPharma, Inc. | | | 77,531 | | | | 243,447 | |
Portola Pharmaceuticals, Inc. (a) (b) | | | 23,603 | | | | 557,031 | |
Progenics Pharmaceuticals, Inc. (a) (b) | | | 32,263 | | | | 136,150 | |
Prothena Corp. plc (a) (b) | | | 16,317 | | | | 570,442 | |
PTC Therapeutics, Inc. (a) (b) | | | 15,786 | | | | 110,818 | |
Puma Biotechnology, Inc. (a) (b) | | | 12,406 | | | | 369,575 | |
Radius Health, Inc. (a) (b) | | | 15,372 | | | | 564,921 | |
Raptor Pharmaceutical Corp. (a) (b) | | | 39,815 | | | | 213,807 | |
REGENXBIO, Inc. (a) | | | 11,468 | | | | 91,744 | |
See accompanying notes to financial statements.
MSF-6
Metropolitan Series Fund
Russell 2000 Index Portfolio
Schedule of Investments as of June 30, 2016 (Unaudited)
Common Stocks—(Continued)
| | | | | | | | |
| Security Description | | Shares | | | Value | |
| | |
Biotechnology—(Continued) | | | | | | | | |
Regulus Therapeutics, Inc. (a) (b) | | | 21,644 | | | $ | 62,551 | |
Repligen Corp. (a) | | | 15,913 | | | | 435,380 | |
Retrophin, Inc. (a) (b) | | | 16,403 | | | | 292,137 | |
Rigel Pharmaceuticals, Inc. (a) | | | 44,752 | | | | 99,797 | |
Sage Therapeutics, Inc. (a) (b) | | | 13,318 | | | | 401,271 | |
Sangamo Biosciences, Inc. (a) (b) | | | 31,616 | | | | 183,057 | |
Sarepta Therapeutics, Inc. (a) (b) | | | 21,304 | | | | 406,267 | |
Seres Therapeutics, Inc. (a) (b) | | | 9,150 | | | | 265,808 | |
Spark Therapeutics, Inc. (a) (b) | | | 8,629 | | | | 441,201 | |
Spectrum Pharmaceuticals, Inc. (a) | | | 30,932 | | | | 203,223 | |
Synergy Pharmaceuticals, Inc. (a) (b) | | | 91,913 | | | | 349,269 | |
TESARO, Inc. (a) (b) | | | 12,733 | | | | 1,070,209 | |
TG Therapeutics, Inc. (a) (b) | | | 16,876 | | | | 102,269 | |
Trevena, Inc. (a) (b) | | | 24,287 | | | | 153,008 | |
Ultragenyx Pharmaceutical, Inc. (a) (b) | | | 19,019 | | | | 930,219 | |
Vanda Pharmaceuticals, Inc. (a) | | | 20,273 | | | | 226,855 | |
Versartis, Inc. (a) (b) | | | 12,818 | | | | 141,767 | |
Vitae Pharmaceuticals, Inc. (a) | | | 14,278 | | | | 154,060 | |
XBiotech, Inc. (a) | | | 9,412 | | | | 196,899 | |
Xencor, Inc. (a) | | | 16,674 | | | | 316,639 | |
ZIOPHARM Oncology, Inc. (a) (b) | | | 61,375 | | | | 336,949 | |
| | | | | | | | |
| | | | | | | 35,766,526 | |
| | | | | | | | |
| | |
Building Products—1.2% | | | | | | | | |
AAON, Inc. | | | 19,095 | | | | 525,303 | |
Advanced Drainage Systems, Inc. (b) | | | 15,729 | | | | 430,503 | |
American Woodmark Corp. (a) | | | 6,699 | | | | 444,680 | |
Apogee Enterprises, Inc. | | | 13,684 | | | | 634,253 | |
Armstrong Flooring, Inc. (a) (b) | | | 11,681 | | | | 197,993 | |
Builders FirstSource, Inc. (a) (b) | | | 41,041 | | | | 461,711 | |
Caesarstone, Ltd. (a) (b) | | | 11,687 | | | | 406,240 | |
Continental Building Products, Inc. (a) | | | 17,313 | | | | 384,868 | |
CSW Industrials, Inc. (a) | | | 8,998 | | | | 293,425 | |
Gibraltar Industries, Inc. (a) | | | 14,856 | | | | 469,004 | |
Griffon Corp. (b) | | | 14,438 | | | | 243,425 | |
Insteel Industries, Inc. | | | 9,958 | | | | 284,699 | |
Masonite International Corp. (a) | | | 14,468 | | | | 956,914 | |
NCI Building Systems, Inc. (a) | | | 13,110 | | | | 209,629 | |
Nortek, Inc. (a) | | | 4,481 | | | | 265,768 | |
Patrick Industries, Inc. (a) | | | 7,120 | | | | 429,265 | |
PGT, Inc. (a) | | | 22,494 | | | | 231,688 | |
Ply Gem Holdings, Inc. (a) | | | 11,295 | | | | 164,568 | |
Quanex Building Products Corp. | | | 17,697 | | | | 328,987 | |
Simpson Manufacturing Co., Inc. | | | 19,498 | | | | 779,335 | |
Trex Co., Inc. (a) (b) | | | 14,671 | | | | 659,021 | |
Universal Forest Products, Inc. | | | 9,556 | | | | 885,746 | |
| | | | | | | | |
| | | | | | | 9,687,025 | |
| | | | | | | | |
| | |
Capital Markets—1.2% | | | | | | | | |
Arlington Asset Investment Corp. - Class A (b) | | | 10,056 | | | | 130,829 | |
BGC Partners, Inc. - Class A (b) | | | 106,454 | | | | 927,214 | |
Cohen & Steers, Inc. (b) | | | 9,693 | | | | 391,985 | |
Cowen Group, Inc. - Class A (a) (b) | | | 52,786 | | | | 156,247 | |
Diamond Hill Investment Group, Inc. (b) | | | 1,546 | | | | 291,297 | |
Evercore Partners, Inc. - Class A | | | 19,079 | | | | 843,101 | |
Financial Engines, Inc. (b) | | | 28,001 | | | | 724,386 | |
| | |
Capital Markets—(Continued) | | | | | | | | |
Greenhill & Co., Inc. (b) | | | 13,790 | | | | 222,019 | |
Houlihan Lokey, Inc. (b) | | | 5,655 | | | | 126,502 | |
International FCStone, Inc. (a) | | | 7,668 | | | | 209,260 | |
Investment Technology Group, Inc. | | | 17,949 | | | | 300,107 | |
Janus Capital Group, Inc. (b) | | | 73,633 | | | | 1,024,971 | |
KCG Holdings, Inc. - Class A (a) | | | 26,254 | | | | 349,178 | |
Ladenburg Thalmann Financial Services, Inc. (a) (b) | | | 51,479 | | | | 121,490 | |
Moelis & Co. - Class A (b) | | | 8,425 | | | | 189,563 | |
OM Asset Management plc | | | 20,265 | | | | 270,538 | |
Piper Jaffray Cos. (a) | | | 7,063 | | | | 266,275 | |
PJT Partners, Inc. - Class A | | | 11,278 | | | | 259,394 | |
Safeguard Scientifics, Inc. (a) (b) | | | 10,084 | | | | 125,949 | |
Stifel Financial Corp. (a) | | | 31,775 | | | | 999,324 | |
Virtu Financial, Inc. - Class A (b) | | | 12,905 | | | | 232,290 | |
Virtus Investment Partners, Inc. (b) | | | 3,430 | | | | 244,147 | |
Waddell & Reed Financial, Inc. - Class A (b) | | | 38,993 | | | | 671,459 | |
Westwood Holdings Group, Inc. | | | 4,941 | | | | 255,944 | |
WisdomTree Investments, Inc. (b) | | | 53,688 | | | | 525,606 | |
| | | | | | | | |
| | | | | | | 9,859,075 | |
| | | | | | | | |
| | |
Chemicals—2.4% | | | | | | | | |
A. Schulman, Inc. | | | 15,885 | | | | 387,912 | |
American Vanguard Corp. | | | 14,887 | | | | 224,943 | |
Axiall Corp. (b) | | | 33,438 | | | | 1,090,413 | |
Balchem Corp. | | | 15,291 | | | | 912,108 | |
Calgon Carbon Corp. | | | 26,333 | | | | 346,279 | |
Chase Corp. (b) | | | 3,533 | | | | 208,694 | |
Chemours Co. (The) | | | 89,108 | | | | 734,250 | |
Chemtura Corp. (a) | | | 31,150 | | | | 821,737 | |
Ferro Corp. (a) | | | 40,624 | | | | 543,549 | |
Flotek Industries, Inc. (a) (b) | | | 28,523 | | | | 376,504 | |
FutureFuel Corp. | | | 10,195 | | | | 110,922 | |
GCP Applied Technologies, Inc. (a) | | | 34,475 | | | | 897,729 | |
Hawkins, Inc. | | | 4,778 | | | | 207,413 | |
HB Fuller Co. | | | 23,919 | | | | 1,052,197 | |
Ingevity Corp. (a) | | | 20,745 | | | | 706,160 | |
Innophos Holdings, Inc. | | | 9,884 | | | | 417,204 | |
Innospec, Inc. | | | 11,303 | | | | 519,825 | |
KMG Chemicals, Inc. | | | 5,294 | | | | 137,591 | |
Koppers Holdings, Inc. (a) | | | 10,265 | | | | 315,443 | |
Kraton Performance Polymers, Inc. (a) | | | 16,524 | | | | 461,515 | |
LSB Industries, Inc. (a) (b) | | | 9,923 | | | | 119,870 | |
Minerals Technologies, Inc. | | | 16,456 | | | | 934,701 | |
Olin Corp. (b) | | | 80,173 | | | | 1,991,497 | |
OMNOVA Solutions, Inc. (a) | | | 22,821 | | | | 165,452 | |
PolyOne Corp. | | | 42,027 | | | | 1,481,031 | |
Quaker Chemical Corp. | | | 6,591 | | | | 587,917 | |
Rayonier Advanced Materials, Inc. | | | 19,176 | | | | 260,602 | |
Sensient Technologies Corp. | | | 22,015 | | | | 1,563,946 | |
Stepan Co. | | | 9,222 | | | | 548,986 | |
Trecora Resources (a) | | | 10,819 | | | | 112,842 | |
Tredegar Corp. | | | 13,367 | | | | 215,476 | |
Trinseo S.A. (a) | | | 14,013 | | | | 601,578 | |
Tronox, Ltd. - Class A | | | 30,359 | | | | 133,883 | |
| | | | | | | | |
| | | | | | | 19,190,169 | |
| | | | | | | | |
See accompanying notes to financial statements.
MSF-7
Metropolitan Series Fund
Russell 2000 Index Portfolio
Schedule of Investments as of June 30, 2016 (Unaudited)
Common Stocks—(Continued)
| | | | | | | | |
| Security Description | | Shares | | | Value | |
| | |
Commercial Services & Supplies—2.3% | | | | | | | | |
ABM Industries, Inc. | | | 28,156 | | | $ | 1,027,131 | |
ACCO Brands Corp. (a) | | | 52,031 | | | | 537,480 | |
Brady Corp. - Class A | | | 22,732 | | | | 694,690 | |
Brink’s Co. (The) | | | 24,828 | | | | 707,350 | |
Casella Waste Systems, Inc. - Class A (a) | | | 20,153 | | | | 158,201 | |
Ceco Environmental Corp. | | | 10,889 | | | | 95,170 | |
Deluxe Corp. (b) | | | 23,575 | | | | 1,564,673 | |
Ennis, Inc. | | | 14,123 | | | | 270,879 | |
Essendant, Inc. | | | 18,301 | | | | 559,279 | |
G&K Services, Inc. - Class A | | | 9,849 | | | | 754,138 | |
Healthcare Services Group, Inc. (b) | | | 33,776 | | | | 1,397,651 | |
Herman Miller, Inc. | | | 28,305 | | | | 846,036 | |
HNI Corp. (b) | | | 22,606 | | | | 1,050,953 | |
InnerWorkings, Inc. (a) | | | 18,741 | | | | 154,988 | |
Interface, Inc. | | | 31,333 | | | | 477,828 | |
Kimball International, Inc. - Class B | | | 16,738 | | | | 190,478 | |
Knoll, Inc. | | | 23,781 | | | | 577,403 | |
Matthews International Corp. - Class A | | | 15,251 | | | | 848,566 | |
McGrath RentCorp | | | 13,375 | | | | 409,141 | |
Mobile Mini, Inc. (b) | | | 23,301 | | | | 807,147 | |
MSA Safety, Inc. | | | 15,204 | | | | 798,666 | |
Multi-Color Corp. (b) | | | 6,168 | | | | 391,051 | |
Quad/Graphics, Inc. | | | 13,076 | | | | 304,540 | |
SP Plus Corp. (a) | | | 8,683 | | | | 196,062 | |
Steelcase, Inc. - Class A | | | 42,340 | | | | 574,554 | |
Team, Inc. (a) (b) | | | 14,183 | | | | 352,164 | |
Tetra Tech, Inc. (d) | | | 27,830 | | | | 855,633 | |
U.S. Ecology, Inc. | | | 10,067 | | | | 462,579 | |
UniFirst Corp. | | | 7,187 | | | | 831,680 | |
Viad Corp. | | | 11,468 | | | | 355,508 | |
VSE Corp. | | | 2,095 | | | | 139,946 | |
West Corp. | | | 24,184 | | | | 475,457 | |
| | | | | | | | |
| | | | | | | 18,867,022 | |
| | | | | | | | |
|
Communications Equipment—1.6% | |
ADTRAN, Inc. | | | 24,190 | | | | 451,144 | |
Black Box Corp. | | | 8,122 | | | | 106,236 | |
CalAmp Corp. (a) | | | 19,380 | | | | 287,018 | |
Calix, Inc. (a) | | | 19,494 | | | | 134,704 | |
Ciena Corp. (a) (b) | | | 66,636 | | | | 1,249,425 | |
Clearfield, Inc. (a) | | | 6,024 | | | | 107,769 | |
Comtech Telecommunications Corp. | | | 8,068 | | | | 103,593 | |
Digi International, Inc. (a) | | | 12,500 | | | | 134,125 | |
Extreme Networks, Inc. (a) | | | 50,414 | | | | 170,904 | |
Finisar Corp. (a) | | | 50,382 | | | | 882,189 | |
Harmonic, Inc. (a) (b) | | | 42,437 | | | | 120,945 | |
Infinera Corp. (a) (b) | | | 66,643 | | | | 751,733 | |
InterDigital, Inc. | | | 17,110 | | | | 952,685 | |
Ixia (a) | | | 28,748 | | | | 282,305 | |
Lumentum Holdings, Inc. (a) | | | 24,695 | | | | 597,619 | |
NETGEAR, Inc. (a) | | | 16,562 | | | | 787,358 | |
NetScout Systems, Inc. (a) (b) | | | 46,389 | | | | 1,032,155 | |
Oclaro, Inc. (a) (b) | | | 49,350 | | | | 240,828 | |
Plantronics, Inc. | | | 15,665 | | | | 689,260 | |
Polycom, Inc. (a) | | | 66,034 | | | | 742,883 | |
ShoreTel, Inc. (a) | | | 28,961 | | | | 193,749 | |
| | |
Communications Equipment—(Continued) | | | | | | | | |
Sonus Networks, Inc. (a) | | | 24,015 | | | | 208,690 | |
Ubiquiti Networks, Inc. (a) (b) | | | 12,458 | | | | 481,626 | |
ViaSat, Inc. (a) (b) | | | 21,021 | | | | 1,500,899 | |
Viavi Solutions, Inc. (a) | | | 114,315 | | | | 757,908 | |
| | | | | | | | |
| | | | | | | 12,967,750 | |
| | | | | | | | |
| | |
Construction & Engineering—0.8% | | | | | | | | |
Aegion Corp. (a) | | | 17,495 | | | | 341,327 | |
Argan, Inc. | | | 6,140 | | | | 256,161 | |
Comfort Systems USA, Inc. | | | 17,796 | | | | 579,616 | |
Dycom Industries, Inc. (a) (b) | | | 14,939 | | | | 1,340,925 | |
EMCOR Group, Inc. | | | 29,573 | | | | 1,456,766 | |
Granite Construction, Inc. | | | 19,068 | | | | 868,547 | |
Great Lakes Dredge & Dock Corp. (a) (b) | | | 30,133 | | | | 131,380 | |
MasTec, Inc. (a) (b) | | | 32,059 | | | | 715,557 | |
MYR Group, Inc. (a) | | | 10,017 | | | | 241,209 | |
NV5 Global, Inc. (a) | | | 3,969 | | | | 112,878 | |
Primoris Services Corp. (b) | | | 17,845 | | | | 337,806 | |
Tutor Perini Corp. (a) | | | 19,192 | | | | 451,972 | |
| | | | | | | | |
| | | | | | | 6,834,144 | |
| | | | | | | | |
| | |
Construction Materials—0.2% | | | | | | | | |
Headwaters, Inc. (a) | | | 34,173 | | | | 613,064 | |
Summit Materials, Inc. - Class A (a) | | | 30,833 | | | | 630,843 | |
U.S. Concrete, Inc. (a) | | | 7,217 | | | | 439,587 | |
| | | | | | | | |
| | | | | | | 1,683,494 | |
| | | | | | | | |
| | |
Consumer Finance—0.5% | | | | | | | | |
Cash America International, Inc. | | | 12,729 | | | | 542,510 | |
Encore Capital Group, Inc. (a) (b) | | | 12,804 | | | | 301,278 | |
Enova International, Inc. (a) (b) | | | 13,048 | | | | 96,033 | |
EZCORP, Inc. - Class A (a) | | | 25,543 | | | | 193,105 | |
First Cash Financial Services, Inc. | | | 13,486 | | | | 692,236 | |
Green Dot Corp. - Class A (a) (b) | | | 21,594 | | | | 496,446 | |
LendingClub Corp. (a) (b) | | | 161,286 | | | | 693,530 | |
Nelnet, Inc. - Class A | | | 11,398 | | | | 396,081 | |
PRA Group, Inc. (a) (b) | | | 22,334 | | | | 539,143 | |
World Acceptance Corp. (a) (b) | | | 3,560 | | | | 162,336 | |
| | | | | | | | |
| | | | | | | 4,112,698 | |
| | | | | | | | |
| | |
Containers & Packaging—0.2% | | | | | | | | |
AEP Industries, Inc. | | | 1,974 | | | | 158,828 | |
Greif, Inc. - Class A | | | 14,378 | | | | 535,868 | |
Greif, Inc. - Class B (b) | | | 4,002 | | | | 219,109 | |
Multi Packaging Solutions International, Ltd. (a) | | | 9,350 | | | | 124,823 | |
Myers Industries, Inc. | | | 13,337 | | | | 192,053 | |
| | | | | | | | |
| | | | | | | 1,230,681 | |
| | | | | | | | |
| | |
Distributors—0.1% | | | | | | | | |
Core-Mark Holding Co., Inc. | | | 22,876 | | | | 1,071,969 | |
| | | | | | | | |
| | |
Diversified Consumer Services—0.9% | | | | | | | | |
American Public Education, Inc. (a) | | | 8,921 | | | | 250,680 | |
Apollo Education Group, Inc. (a) | | | 44,173 | | | | 402,858 | |
Bright Horizons Family Solutions, Inc. (a) | | | 21,377 | | | | 1,417,509 | |
See accompanying notes to financial statements.
MSF-8
Metropolitan Series Fund
Russell 2000 Index Portfolio
Schedule of Investments as of June 30, 2016 (Unaudited)
Common Stocks—(Continued)
| | | | | | | | |
| Security Description | | Shares | | | Value | |
|
Diversified Consumer Services—(Continued) | |
Capella Education Co. | | | 5,633 | | | $ | 296,521 | |
Career Education Corp. (a) | | | 35,115 | | | | 208,934 | |
Carriage Services, Inc. (b) | | | 9,414 | | | | 222,923 | |
Chegg, Inc. (a) (b) | | | 36,609 | | | | 183,045 | |
DeVry Education Group, Inc. | | | 29,702 | | | | 529,884 | |
Grand Canyon Education, Inc. (a) | | | 22,843 | | | | 911,893 | |
Houghton Mifflin Harcourt Co. (a) | | | 59,125 | | | | 924,124 | |
K12, Inc. (a) | | | 17,337 | | | | 216,539 | |
LifeLock, Inc. (a) (b) | | | 44,145 | | | | 697,932 | |
Regis Corp. (a) (b) | | | 18,180 | | | | 226,341 | |
Sotheby’s (b) | | | 26,392 | | | | 723,141 | |
Strayer Education, Inc. (a) (b) | | | 5,524 | | | | 271,394 | |
Weight Watchers International, Inc. (a) (b) | | | 13,493 | | | | 156,924 | |
| | | | | | | | |
| | | | | | | 7,640,642 | |
| | | | | | | | |
| | |
Diversified Financial Services—0.1% | | | | | | | | |
FNFV Group (a) (b) | | | 37,452 | | | | 429,574 | |
Gain Capital Holdings, Inc. | | | 20,006 | | | | 126,438 | |
NewStar Financial, Inc. (a) | | | 12,166 | | | | 102,438 | |
On Deck Capital, Inc. (a) (b) | | | 25,577 | | | | 131,721 | |
PICO Holdings, Inc. (a) | | | 12,147 | | | | 114,911 | |
| | | | | | | | |
| | | | | | | 905,082 | |
| | | | | | | | |
|
Diversified Telecommunication Services—0.8% | |
8x8, Inc. (a) (b) | | | 41,065 | | | | 599,960 | |
ATN International, Inc. | | | 4,754 | | | | 369,909 | |
Cincinnati Bell, Inc. (a) | | | 97,588 | | | | 445,977 | |
Cogent Communications Holdings, Inc. (b) | | | 22,011 | | | | 881,761 | |
Consolidated Communications Holdings, Inc. (b) | | | 24,229 | | | | 659,998 | |
FairPoint Communications, Inc. (a) | | | 11,602 | | | | 170,317 | |
General Communication, Inc. - Class A (a) | | | 16,537 | | | | 261,285 | |
Globalstar, Inc. (a) (b) | | | 221,510 | | | | 268,027 | |
IDT Corp. - Class B | | | 8,438 | | | | 119,735 | |
Inteliquent, Inc. | | | 16,025 | | | | 318,737 | |
Iridium Communications, Inc. (a) (b) | | | 38,356 | | | | 340,601 | |
Lumos Networks Corp. (a) | | | 8,396 | | | | 101,592 | |
ORBCOMM, Inc. (a) | | | 31,662 | | | | 315,037 | |
pdvWireless, Inc. (a) | | | 6,964 | | | | 148,960 | |
Straight Path Communications, Inc. - Class B (a) (b) | | | 4,588 | | | | 126,950 | |
Vonage Holdings Corp. (a) | | | 86,416 | | | | 527,137 | |
Windstream Holdings, Inc. (b) | | | 47,088 | | | | 436,506 | |
| | | | | | | | |
| | | | | | | 6,092,489 | |
| | | | | | | | |
| | |
Electric Utilities—1.2% | | | | | | | | |
ALLETE, Inc. (b) | | | 23,439 | | | | 1,514,862 | |
El Paso Electric Co. | | | 18,779 | | | | 887,683 | |
Empire District Electric Co. (The) | | | 22,766 | | | | 773,361 | |
IDACORP, Inc. | | | 24,442 | | | | 1,988,357 | |
MGE Energy, Inc. | | | 16,879 | | | | 953,917 | |
Otter Tail Corp. | | | 18,873 | | | | 632,057 | |
PNM Resources, Inc. | | | 38,721 | | | | 1,372,272 | |
Portland General Electric Co. | | | 43,293 | | | | 1,910,087 | |
| | | | | | | | |
| | | | | | | 10,032,596 | |
| | | | | | | | |
| | |
Electrical Equipment—0.6% | | | | | | | | |
AZZ, Inc. | | | 12,522 | | | | 751,070 | |
Babcock & Wilcox Enterprises, Inc. (a) | | | 22,628 | | | | 332,405 | |
Encore Wire Corp. | | | 10,537 | | | | 392,819 | |
EnerSys | | | 21,009 | | | | 1,249,405 | |
Generac Holdings, Inc. (a) (b) | | | 32,764 | | | | 1,145,430 | |
General Cable Corp. (b) | | | 24,951 | | | | 317,127 | |
LSI Industries, Inc. | | | 10,801 | | | | 119,567 | |
Plug Power, Inc. (a) (b) | | | 84,766 | | | | 157,665 | |
Powell Industries, Inc. | | | 4,404 | | | | 173,253 | |
Sunrun, Inc. (a) | | | 34,164 | | | | 202,593 | |
Thermon Group Holdings, Inc. (a) | | | 15,847 | | | | 304,421 | |
| | | | | | | | |
| | | | | | | 5,145,755 | |
| | | | | | | | |
|
Electronic Equipment, Instruments & Components—2.6% | |
Anixter International, Inc. (a) | | | 13,642 | | | | 726,846 | |
AVX Corp. | | | 21,871 | | | | 297,008 | |
Badger Meter, Inc. (b) | | | 6,820 | | | | 498,065 | |
Belden, Inc. | | | 19,822 | | | | 1,196,654 | |
Benchmark Electronics, Inc. (a) | | | 24,418 | | | | 516,441 | |
Coherent, Inc. (a) | | | 11,761 | | | | 1,079,425 | |
CTS Corp. | | | 15,701 | | | | 281,362 | |
Daktronics, Inc. | | | 18,513 | | | | 115,706 | |
DTS, Inc. (a) | | | 9,298 | | | | 245,932 | |
Electro Rent Corp. | | | 9,122 | | | | 140,570 | |
ePlus, Inc. (a) | | | 2,743 | | | | 224,350 | |
Fabrinet (a) | | | 17,507 | | | | 649,860 | |
FARO Technologies, Inc. (a) (b) | | | 8,551 | | | | 289,280 | |
II-VI, Inc. (a) | | | 29,121 | | | | 546,310 | |
Insight Enterprises, Inc. (a) (d) | | | 19,337 | | | | 502,762 | |
InvenSense, Inc. (a) | | | 34,992 | | | | 214,501 | |
Itron, Inc. (a) | | | 18,332 | | | | 790,109 | |
Kimball Electronics, Inc. (a) | | | 14,109 | | | | 175,657 | |
Knowles Corp. (a) | | | 43,119 | | | | 589,868 | |
Littelfuse, Inc. | | | 10,673 | | | | 1,261,442 | |
Mesa Laboratories, Inc. (b) | | | 1,474 | | | | 181,302 | |
Methode Electronics, Inc. | | | 17,959 | | | | 614,737 | |
MTS Systems Corp. (b) | | | 7,482 | | | | 328,011 | |
Multi-Fineline Electronix, Inc. (a) | | | 4,794 | | | | 111,221 | |
Novanta, Inc. (a) | | | 18,739 | | | | 283,896 | |
OSI Systems, Inc. (a) | | | 9,211 | | | | 535,435 | |
Park Electrochemical Corp. | | | 10,569 | | | | 153,568 | |
PC Connection, Inc. | | | 5,366 | | | | 127,711 | |
Plexus Corp. (a) (d) | | | 15,422 | | | | 666,230 | |
QLogic Corp. (a) | | | 41,031 | | | | 604,797 | |
Rofin-Sinar Technologies, Inc. (a) | | | 13,337 | | | | 425,984 | |
Rogers Corp. (a) | | | 8,965 | | | | 547,761 | |
Sanmina Corp. (a) | | | 35,180 | | | | 943,176 | |
ScanSource, Inc. (a) | | | 13,430 | | | | 498,387 | |
SYNNEX Corp. | | | 14,237 | | | | 1,349,952 | |
Tech Data Corp. (a) | | | 16,978 | | | | 1,219,869 | |
TTM Technologies, Inc. (a) | | | 35,998 | | | | 271,065 | |
Universal Display Corp. (a) (b) | | | 20,124 | | | | 1,364,407 | |
Vishay Intertechnology, Inc. (b) | | | 66,423 | | | | 822,981 | |
| | | | | | | | |
| | | | | | | 21,392,638 | |
| | | | | | | | |
See accompanying notes to financial statements.
MSF-9
Metropolitan Series Fund
Russell 2000 Index Portfolio
Schedule of Investments as of June 30, 2016 (Unaudited)
Common Stocks—(Continued)
| | | | | | | | |
| Security Description | | Shares | | | Value | |
| | |
Energy Equipment & Services—1.0% | | | | | | | | |
Archrock, Inc. | | | 34,795 | | | $ | 327,769 | |
Atwood Oceanics, Inc. (b) | | | 30,662 | | | | 383,888 | |
Bristow Group, Inc. (b) | | | 17,044 | | | | 194,472 | |
CARBO Ceramics, Inc. (b) | | | 13,695 | | | | 179,404 | |
Era Group, Inc. (a) | | | 14,630 | | | | 137,522 | |
Exterran Corp. (a) | | | 14,849 | | | | 190,810 | |
Fairmount Santrol Holdings, Inc. (a) (b) | | | 38,015 | | | | 293,096 | |
Forum Energy Technologies, Inc. (a) | | | 29,182 | | | | 505,140 | |
Geospace Technologies Corp. (a) | | | 8,328 | | | | 136,329 | |
Helix Energy Solutions Group, Inc. (a) | | | 45,582 | | | | 308,134 | |
Hornbeck Offshore Services, Inc. (a) (b) | | | 18,165 | | | | 151,496 | |
Matrix Service Co. (a) | | | 14,196 | | | | 234,092 | |
McDermott International, Inc. (a) | | | 116,414 | | | | 575,085 | |
Natural Gas Services Group, Inc. (a) | | | 6,643 | | | | 152,125 | |
Newpark Resources, Inc. (a) (b) | | | 44,365 | | | | 256,873 | |
Oil States International, Inc. (a) | | | 24,545 | | | | 807,040 | |
Parker Drilling Co. (a) | | | 59,681 | | | | 136,669 | |
PHI, Inc. (a) | | | 6,426 | | | | 114,897 | |
Pioneer Energy Services Corp. (a) | | | 42,051 | | | | 193,435 | |
SEACOR Holdings, Inc. (a) | | | 8,648 | | | | 501,152 | |
Seadrill, Ltd. (a) (b) | | | 188,659 | | | | 611,255 | |
Tesco Corp. (b) | | | 19,926 | | | | 133,305 | |
TETRA Technologies, Inc. (a) | | | 41,173 | | | | 262,272 | |
Tidewater, Inc. (b) | | | 22,085 | | | | 97,395 | |
U.S. Silica Holdings, Inc. | | | 30,347 | | | | 1,046,061 | |
Unit Corp. (a) (b) | | | 24,655 | | | | 383,632 | |
| | | | | | | | |
| | | | | | | 8,313,348 | |
| | | | | | | | |
| | |
Food & Staples Retailing—0.6% | | | | | | | | |
Andersons, Inc. (The) | | | 13,251 | | | | 470,941 | |
Chefs’ Warehouse, Inc. (The) (a) (b) | | | 8,577 | | | | 137,232 | |
Ingles Markets, Inc. - Class A (b) | | | 6,173 | | | | 230,253 | |
Performance Food Group Co. (a) (b) | | | 18,393 | | | | 494,956 | |
Pricesmart, Inc. | | | 9,802 | | | | 917,173 | |
Smart & Final Stores, Inc. (a) | | | 12,072 | | | | 179,752 | |
SpartanNash Co. | | | 16,917 | | | | 517,322 | |
SUPERVALU, Inc. (a) | | | 122,481 | | | | 578,110 | |
United Natural Foods, Inc. (a) | | | 23,843 | | | | 1,115,852 | |
Village Super Market, Inc. - Class A | | | 3,674 | | | | 106,142 | |
Weis Markets, Inc. | | | 4,490 | | | | 226,969 | |
| | | | | | | | |
| | | | | | | 4,974,702 | |
| | | | | | | | |
| | |
Food Products—1.4% | | | | | | | | |
Amplify Snack Brands, Inc. (a) (b) | | | 14,688 | | | | 216,648 | |
B&G Foods, Inc. (b) | | | 29,999 | | | | 1,445,952 | |
Cal-Maine Foods, Inc. (b) | | | 14,936 | | | | 661,964 | |
Calavo Growers, Inc. | | | 7,353 | | | | 492,651 | |
Darling Ingredients, Inc. (a) | | | 78,508 | | | | 1,169,769 | |
Dean Foods Co. (b) | | | 44,397 | | | | 803,142 | |
Farmer Bros Co. (a) | | | 3,967 | | | | 127,182 | |
Fresh Del Monte Produce, Inc. (b) | | | 15,644 | | | | 851,503 | |
Freshpet, Inc. (a) (b) | | | 10,616 | | | | 99,047 | |
J&J Snack Foods Corp. | | | 7,001 | | | | 835,009 | |
John B Sanfilippo & Son, Inc. | | | 4,642 | | | | 197,888 | |
Lancaster Colony Corp. | | | 9,036 | | | | 1,153,084 | |
Landec Corp. (a) (b) | | | 14,010 | | | | 150,748 | |
| | |
Food Products—(Continued) | | | | | | | | |
Limoneira Co. | | | 6,121 | | | | 107,852 | |
Omega Protein Corp. (a) | | | 11,349 | | | | 226,866 | |
Sanderson Farms, Inc. | | | 10,394 | | | | 900,536 | |
Seaboard Corp. (a) | | | 116 | | | | 332,994 | |
Seneca Foods Corp. - Class A (a) | | | 4,612 | | | | 167,001 | |
Snyder’s-Lance, Inc. | | | 39,103 | | | | 1,325,201 | |
Tootsie Roll Industries, Inc. (b) | | | 9,390 | | | | 361,797 | |
| | | | | | | | |
| | | | | | | 11,626,834 | |
| | | | | | | | |
| | |
Gas Utilities—1.3% | | | | | | | | |
Chesapeake Utilities Corp. | | | 6,975 | | | | 461,606 | |
New Jersey Resources Corp. | | | 41,016 | | | | 1,581,167 | |
Northwest Natural Gas Co. | | | 13,257 | | | | 859,319 | |
ONE Gas, Inc. (b) | | | 24,719 | | | | 1,646,038 | |
South Jersey Industries, Inc. | | | 37,607 | | | | 1,189,133 | |
Southwest Gas Corp. | | | 22,906 | | | | 1,802,931 | |
Spire, Inc. | | | 21,579 | | | | 1,528,656 | |
WGL Holdings, Inc. (b) | | | 24,423 | | | | 1,728,904 | |
| | | | | | | | |
| | | | | | | 10,797,754 | |
| | | | | | | | |
|
Health Care Equipment & Supplies—3.2% | |
Abaxis, Inc. (b) | | | 11,146 | | | | 526,426 | |
Accuray, Inc. (a) | | | 37,218 | | | | 193,161 | |
Analogic Corp. | | | 6,383 | | | | 507,066 | |
AngioDynamics, Inc. (a) | | | 13,423 | | | | 192,889 | |
Anika Therapeutics, Inc. (a) | | | 7,087 | | | | 380,218 | |
AtriCure, Inc. (a) (b) | | | 16,270 | | | | 229,895 | |
Atrion Corp. | | | 822 | | | | 351,701 | |
Cantel Medical Corp. | | | 16,951 | | | | 1,165,042 | |
Cardiovascular Systems, Inc. (a) (b) | | | 14,951 | | | | 274,725 | |
Cerus Corp. (a) (b) | | | 45,274 | | | | 282,510 | |
ConforMIS, Inc. (a) | | | 19,621 | | | | 137,739 | |
CONMED Corp. | | | 14,604 | | | | 697,049 | |
CryoLife, Inc. | | | 17,220 | | | | 203,368 | |
Cynosure, Inc. - Class A (a) | | | 11,463 | | | | 557,618 | |
Endologix, Inc. (a) (b) | | | 44,063 | | | | 549,025 | |
Exactech, Inc. (a) | | | 5,785 | | | | 154,691 | |
GenMark Diagnostics, Inc. (a) (b) | | | 19,362 | | | | 168,449 | |
Glaukos Corp. (a) | | | 8,646 | | | | 252,117 | |
Globus Medical, Inc. - Class A (a) (b) | | | 34,489 | | | | 821,873 | |
Haemonetics Corp. (a) | | | 26,476 | | | | 767,539 | |
Halyard Health, Inc. (a) (b) | | | 23,074 | | | | 750,366 | |
HeartWare International, Inc. (a) (b) | | | 8,570 | | | | 494,917 | |
ICU Medical, Inc. (a) | | | 7,246 | | | | 816,986 | |
Inogen, Inc. (a) (b) | | | 7,470 | | | | 374,322 | |
Insulet Corp. (a) (b) | | | 27,643 | | | | 835,924 | |
Integer Holdings Corp. (a) | | | 15,275 | | | | 472,456 | |
Integra LifeSciences Holdings Corp. (a) (b) | | | 14,525 | | | | 1,158,804 | |
Invacare Corp. (b) | | | 15,930 | | | | 193,231 | |
InVivo Therapeutics Holdings Corp. (a) | | | 18,522 | | | | 107,057 | |
K2M Group Holdings, Inc. (a) (b) | | | 13,487 | | | | 209,318 | |
LDR Holding Corp. (a) (b) | | | 13,703 | | | | 506,326 | |
LeMaitre Vascular, Inc. | | | 7,651 | | | | 109,180 | |
Masimo Corp. (a) | | | 21,582 | | | | 1,133,379 | |
Meridian Bioscience, Inc. (b) | | | 22,552 | | | | 439,764 | |
Merit Medical Systems, Inc. (a) | | | 21,638 | | | | 429,082 | |
See accompanying notes to financial statements.
MSF-10
Metropolitan Series Fund
Russell 2000 Index Portfolio
Schedule of Investments as of June 30, 2016 (Unaudited)
Common Stocks—(Continued)
| | | | | | | | |
| Security Description | | Shares | | | Value | |
|
Health Care Equipment & Supplies—(Continued) | |
Natus Medical, Inc. (a) | | | 16,472 | | | $ | 622,642 | |
Neogen Corp. (a) | | | 17,828 | | | | 1,002,825 | |
Nevro Corp. (a) | | | 11,810 | | | | 871,106 | |
Novocure, Ltd. (a) | | | 25,960 | | | | 302,953 | |
NuVasive, Inc. (a) (b) | | | 24,181 | | | | 1,444,089 | |
NxStage Medical, Inc. (a) | | | 30,508 | | | | 661,413 | |
OraSure Technologies, Inc. (a) | | | 29,491 | | | | 174,292 | |
Orthofix International NV (a) | | | 9,598 | | | | 406,955 | |
Oxford Immunotec Global plc (a) (b) | | | 12,537 | | | | 112,833 | |
Penumbra, Inc. (a) | | | 12,555 | | | | 747,022 | |
Quidel Corp. (a) (b) | | | 13,903 | | | | 248,308 | |
Rockwell Medical, Inc. (a) (b) | | | 30,372 | | | | 229,916 | |
RTI Surgical, Inc. (a) | | | 28,130 | | | | 100,987 | |
Spectranetics Corp. (The) (a) (b) | | | 21,548 | | | | 403,163 | |
STAAR Surgical Co. (a) (b) | | | 19,419 | | | | 106,999 | |
SurModics, Inc. (a) | | | 9,244 | | | | 217,049 | |
Utah Medical Products, Inc. (b) | | | 2,002 | | | | 126,126 | |
Vascular Solutions, Inc. (a) | | | 10,428 | | | | 434,430 | |
Wright Medical Group NV (a) (b) | | | 50,705 | | | | 880,746 | |
Zeltiq Aesthetics, Inc. (a) (b) | | | 17,712 | | | | 484,069 | |
| | | | | | | | |
| | | | | | | 26,022,136 | |
| | | | | | | | |
| | |
Health Care Providers & Services—2.5% | | | | | | | | |
AAC Holdings, Inc. (a) (b) | | | 5,604 | | | | 127,883 | |
Aceto Corp. | | | 15,842 | | | | 346,781 | |
Adeptus Health, Inc. - Class A (a) (b) | | | 6,300 | | | | 325,458 | |
Air Methods Corp. (a) (b) | | | 18,730 | | | | 671,096 | |
Almost Family, Inc. (a) | | | 4,667 | | | | 198,861 | |
Amedisys, Inc. (a) (b) | | | 13,972 | | | | 705,307 | |
American Renal Associates Holdings, Inc. (a) | | | 6,702 | | | | 194,157 | |
AMN Healthcare Services, Inc. (a) (b) | | | 23,983 | | | | 958,601 | |
BioScrip, Inc. (a) (b) | | | 40,300 | | | | 102,765 | |
BioTelemetry, Inc. (a) | | | 15,006 | | | | 244,598 | |
Capital Senior Living Corp. (a) (b) | | | 14,260 | | | | 251,974 | |
Chemed Corp. (b) | | | 8,550 | | | | 1,165,450 | |
Civitas Solutions, Inc. (a) | | | 6,456 | | | | 134,478 | |
Community Health Systems, Inc. (a) | | | 54,438 | | | | 655,978 | |
Corvel Corp. (a) | | | 5,325 | | | | 229,934 | |
Cross Country Healthcare, Inc. (a) | | | 16,495 | | | | 229,610 | |
Diplomat Pharmacy, Inc. (a) (b) | | | 22,308 | | | | 780,780 | |
Ensign Group, Inc. (The) | | | 24,374 | | | | 512,098 | |
ExamWorks Group, Inc. (a) | | | 19,285 | | | | 672,082 | |
HealthEquity, Inc. (a) (b) | | | 21,384 | | | | 649,753 | |
HealthSouth Corp. | | | 44,584 | | | | 1,730,751 | |
Healthways, Inc. (a) | | | 16,239 | | | | 187,560 | |
Kindred Healthcare, Inc. (b) | | | 40,056 | | | | 452,232 | |
Landauer, Inc. (b) | | | 5,165 | | | | 212,591 | |
LHC Group, Inc. (a) | | | 6,847 | | | | 296,338 | |
Magellan Health, Inc. (a) | | | 12,415 | | | | 816,535 | |
Molina Healthcare, Inc. (a) (b) | | | 21,194 | | | | 1,057,581 | |
National Healthcare Corp. | | | 5,246 | | | | 339,626 | |
Owens & Minor, Inc. | | | 31,238 | | | | 1,167,676 | |
PharMerica Corp. (a) | | | 16,508 | | | | 407,087 | |
Providence Service Corp. (The) (a) | | | 6,975 | | | | 313,038 | |
Quorum Health Corp. (a) | | | 15,756 | | | | 168,747 | |
RadNet, Inc. (a) | | | 21,044 | | | | 112,375 | |
|
Health Care Providers & Services—(Continued) | |
Select Medical Holdings Corp. (a) (b) | | | 52,961 | | | | 575,686 | |
Surgery Partners, Inc. (a) | | | 12,495 | | | | 223,661 | |
Surgical Care Affiliates, Inc. (a) (b) | | | 13,303 | | | | 634,154 | |
Team Health Holdings, Inc. (a) (b) | | | 34,959 | | | | 1,421,783 | |
Teladoc, Inc. (a) (b) | | | 11,307 | | | | 181,138 | |
Triple-S Management Corp. - Class B (a) | | | 12,074 | | | | 294,968 | |
U.S. Physical Therapy, Inc. | | | 6,011 | | | | 361,922 | |
Universal American Corp. | | | 33,119 | | | | 251,042 | |
| | | | | | | | |
| | | | | | | 20,364,135 | |
| | | | | | | | |
| | |
Health Care Technology—0.6% | | | | | | | | |
Castlight Health, Inc. - Class B (a) | | | 23,113 | | | | 91,528 | |
Computer Programs & Systems, Inc. (b) | | | 5,856 | | | | 233,772 | |
Cotiviti Holdings, Inc. (a) | | | 9,671 | | | | 204,348 | |
Evolent Health, Inc. - Class A (a) | | | 7,002 | | | | 134,438 | |
HealthStream, Inc. (a) | | | 12,016 | | | | 318,664 | |
HMS Holdings Corp. (a) | | | 44,959 | | | | 791,728 | |
Imprivata, Inc. (a) (b) | | | 8,905 | | | | 124,670 | |
Medidata Solutions, Inc. (a) (b) | | | 26,132 | | | | 1,224,807 | |
Omnicell, Inc. (a) | | | 19,160 | | | | 655,847 | |
Press Ganey Holdings, Inc. (a) | | | 11,111 | | | | 437,218 | |
Quality Systems, Inc. (b) | | | 24,814 | | | | 295,535 | |
Vocera Communications, Inc. (a) (b) | | | 11,244 | | | | 144,485 | |
| | | | | | | | |
| | | | | | | 4,657,040 | |
| | | | | | | | |
| | |
Hotels, Restaurants & Leisure—3.2% | | | | | | | | |
Belmond, Ltd. - Class A (a) | | | 45,218 | | | | 447,658 | |
Biglari Holdings, Inc. (a) | | | 528 | | | | 212,964 | |
BJ’s Restaurants, Inc. (a) | | | 11,541 | | | | 505,842 | |
Bloomin’ Brands, Inc. | | | 57,635 | | | | 1,029,937 | |
Bob Evans Farms, Inc. (b) | | | 8,975 | | | | 340,601 | |
Boyd Gaming Corp. (a) (b) | | | 40,615 | | | | 747,316 | |
Buffalo Wild Wings, Inc. (a) (b) | | | 8,962 | | | | 1,245,270 | |
Caesars Acquisition Co. - Class A (a) | | | 23,146 | | | | 259,698 | |
Caesars Entertainment Corp. (a) (b) | | | 25,824 | | | | 198,587 | |
Carrols Restaurant Group, Inc. (a) | | | 17,458 | | | | 207,750 | |
Cheesecake Factory, Inc. (The) (b) | | | 22,672 | | | | 1,091,430 | |
Churchill Downs, Inc. | | | 6,613 | | | | 835,619 | |
Chuy’s Holdings, Inc. (a) (b) | | | 8,272 | | | | 286,294 | |
ClubCorp Holdings, Inc. (b) | | | 32,025 | | | | 416,325 | |
Cracker Barrel Old Country Store, Inc. (b) | | | 9,084 | | | | 1,557,633 | |
Dave & Buster’s Entertainment, Inc. (a) (b) | | | 18,558 | | | | 868,329 | |
Del Frisco’s Restaurant Group, Inc. (a) | | | 12,052 | | | | 172,585 | |
Del Taco Restaurants, Inc. (a) | | | 18,811 | | | | 171,180 | |
Denny’s Corp. (a) | | | 39,857 | | | | 427,666 | |
Diamond Resorts International, Inc. (a) (b) | | | 19,545 | | | | 585,568 | |
DineEquity, Inc. | | | 8,597 | | | | 728,854 | |
El Pollo Loco Holdings, Inc. (a) (b) | | | 10,816 | | | | 140,608 | |
Eldorado Resorts, Inc. (a) | | | 14,157 | | | | 215,116 | |
Fiesta Restaurant Group, Inc. (a) (b) | | | 13,371 | | | | 291,622 | |
Habit Restaurants, Inc. (The) - Class A (a) | | | 5,649 | | | | 92,531 | |
International Speedway Corp. - Class A | | | 12,935 | | | | 432,676 | |
Interval Leisure Group, Inc. | | | 53,999 | | | | 858,584 | |
Intrawest Resorts Holdings, Inc. (a) | | | 8,831 | | | | 114,626 | |
Isle of Capri Casinos, Inc. (a) | | | 12,013 | | | | 220,078 | |
Jack in the Box, Inc. (b) | | | 16,395 | | | | 1,408,658 | |
See accompanying notes to financial statements.
MSF-11
Metropolitan Series Fund
Russell 2000 Index Portfolio
Schedule of Investments as of June 30, 2016 (Unaudited)
Common Stocks—(Continued)
| | | | | | | | |
| Security Description | | Shares | | | Value | |
| | |
Hotels, Restaurants & Leisure—(Continued) | | | | | | | | |
Krispy Kreme Doughnuts, Inc. (a) (b) | | | 28,974 | | | $ | 607,295 | |
La Quinta Holdings, Inc. (a) (b) | | | 43,635 | | | | 497,439 | |
Marcus Corp. (The) | | | 9,550 | | | | 201,505 | |
Marriott Vacations Worldwide Corp. (b) | | | 10,700 | | | | 732,843 | |
Monarch Casino & Resort, Inc. (a) | | | 5,265 | | | | 115,672 | |
Papa John’s International, Inc. (b) | | | 13,488 | | | | 917,184 | |
Penn National Gaming, Inc. (a) (b) | | | 39,538 | | | | 551,555 | |
Pinnacle Entertainment, Inc. (a) | | | 28,622 | | | | 317,132 | |
Planet Fitness, Inc. - Class A (a) (b) | | | 6,759 | | | | 127,610 | |
Popeyes Louisiana Kitchen, Inc. (a) | | | 11,051 | | | | 603,827 | |
Potbelly Corp. (a) | | | 12,520 | | | | 157,001 | |
Red Robin Gourmet Burgers, Inc. (a) (b) | | | 7,619 | | | | 361,369 | |
Red Rock Resorts, Inc. - Class A (a) | | | 17,592 | | | | 386,672 | |
Ruby Tuesday, Inc. (a) | | | 30,240 | | | | 109,166 | |
Ruth’s Hospitality Group, Inc. | | | 17,912 | | | | 285,696 | |
Scientific Games Corp. - Class A (a) (b) | | | 23,377 | | | | 214,835 | |
SeaWorld Entertainment, Inc. (b) | | | 32,101 | | | | 460,007 | |
Shake Shack, Inc. - Class A (a) (b) | | | 7,924 | | | | 288,671 | |
Sonic Corp. | | | 24,157 | | | | 653,447 | |
Speedway Motorsports, Inc. | | | 7,078 | | | | 125,634 | |
Texas Roadhouse, Inc. (b) | | | 33,097 | | | | 1,509,223 | |
Wingstop, Inc. (a) | | | 8,064 | | | | 219,744 | |
Zoe’s Kitchen, Inc. (a) | | | 9,191 | | | | 333,358 | |
| | | | | | | | |
| | | | | | | 25,888,490 | |
| | | | | | | | |
| | |
Household Durables—1.3% | | | | | | | | |
Bassett Furniture Industries, Inc. | | | 5,374 | | | | 128,654 | |
Beazer Homes USA, Inc. (a) (b) | | | 13,700 | | | | 106,175 | |
Cavco Industries, Inc. (a) | | | 4,452 | | | | 417,152 | |
Century Communities, Inc. (a) | | | 7,561 | | | | 131,108 | |
CSS Industries, Inc. | | | 4,201 | | | | 112,629 | |
Ethan Allen Interiors, Inc. (b) | | | 12,159 | | | | 401,733 | |
Flexsteel Industries, Inc. | | | 3,005 | | | | 119,058 | |
GoPro, Inc. - Class A (a) (b) | | | 49,877 | | | | 539,170 | |
Helen of Troy, Ltd. (a) | | | 13,453 | | | | 1,383,507 | |
Hooker Furniture Corp. | | | 5,444 | | | | 116,992 | |
Hovnanian Enterprises, Inc. - Class A (a) (b) | | | 60,910 | | | | 102,329 | |
Installed Building Products, Inc. (a) (b) | | | 9,469 | | | | 343,630 | |
iRobot Corp. (a) (b) | | | 14,746 | | | | 517,290 | |
KB Home | | | 41,097 | | | | 625,085 | |
La-Z-Boy, Inc. | | | 24,718 | | | | 687,655 | |
LGI Homes, Inc. (a) (b) | | | 8,210 | | | | 262,227 | |
Libbey, Inc. | | | 10,247 | | | | 162,825 | |
Lifetime Brands, Inc. | | | 6,107 | | | | 89,101 | |
M/I Homes, Inc. (a) (b) | | | 12,868 | | | | 242,304 | |
MDC Holdings, Inc. (b) | | | 19,869 | | | | 483,611 | |
Meritage Homes Corp. (a) | | | 20,456 | | | | 767,918 | |
NACCO Industries, Inc. - Class A | | | 2,176 | | | | 121,856 | |
Taylor Morrison Home Corp. - Class A (a) (b) | | | 15,532 | | | | 230,495 | |
TopBuild Corp. (a) | | | 18,904 | | | | 684,325 | |
TRI Pointe Group, Inc. (a) | | | 76,582 | | | | 905,199 | |
Universal Electronics, Inc. (a) | | | 7,461 | | | | 539,281 | |
WCI Communities, Inc. (a) | | | 11,203 | | | | 189,331 | |
William Lyon Homes - Class A (a) (b) | | | 12,315 | | | | 198,518 | |
| | | | | | | | |
| | | | | | | 10,609,158 | |
| | | | | | | | |
| | |
Household Products—0.3% | | | | | | | | |
Central Garden and Pet Co. (a) | | | 8,006 | | | | 182,777 | |
Central Garden and Pet Co. - Class A (a) | | | 16,480 | | | | 357,781 | |
HRG Group, Inc. (a) | | | 58,164 | | | | 798,592 | |
Orchids Paper Products Co. (b) | | | 5,348 | | | | 190,228 | |
WD-40 Co. | | | 6,750 | | | | 792,787 | |
| | | | | | | | |
| | | | | | | 2,322,165 | |
| | | | | | | | |
|
Independent Power and Renewable Electricity Producers—0.6% | |
Atlantic Power Corp. | | | 57,898 | | | | 143,587 | |
Atlantica Yield plc (b) | | | 28,653 | | | | 532,373 | |
Dynegy, Inc. (a) (b) | | | 59,317 | | | | 1,022,625 | |
NRG Yield, Inc. - Class A (b) | | | 16,087 | | | | 244,844 | |
NRG Yield, Inc. - Class C (b) | | | 29,107 | | | | 453,778 | |
Ormat Technologies, Inc. (b) | | | 18,869 | | | | 825,708 | |
Pattern Energy Group, Inc. (b) | | | 26,388 | | | | 606,132 | |
Talen Energy Corp. (a) | | | 38,673 | | | | 524,019 | |
TerraForm Global, Inc. - Class A (a) | | | 51,489 | | | | 167,854 | |
TerraForm Power, Inc. - Class A (a) (b) | | | 44,539 | | | | 485,475 | |
| | | | | | | | |
| | | | | | | 5,006,395 | |
| | | | | | | | |
| | |
Industrial Conglomerates—0.0% | | | | | | | | |
Raven Industries, Inc. (b) | | | 18,658 | | | | 353,383 | |
| | | | | | | | |
| | |
Insurance—2.3% | | | | | | | | |
Ambac Financial Group, Inc. (a) | | | 22,444 | | | | 369,428 | |
American Equity Investment Life Holding Co. (b) | | | 37,681 | | | | 536,954 | |
AMERISAFE, Inc. | | | 9,298 | | | | 569,224 | |
Argo Group International Holdings, Ltd. | | | 14,148 | | | | 734,281 | |
Baldwin & Lyons, Inc. - Class B | | | 4,133 | | | | 101,920 | |
Citizens, Inc. (a) (b) | | | 22,172 | | | | 168,507 | |
CNO Financial Group, Inc. | | | 86,562 | | | | 1,511,373 | |
eHealth, Inc. (a) | | | 8,864 | | | | 124,273 | |
EMC Insurance Group, Inc. | | | 3,800 | | | | 105,336 | |
Employers Holdings, Inc. | | | 14,789 | | | | 429,177 | |
Enstar Group, Ltd. (a) | | | 5,573 | | | | 902,770 | |
FBL Financial Group, Inc. - Class A | | | 4,790 | | | | 290,609 | |
Federated National Holding Co. | | | 5,884 | | | | 112,031 | |
Fidelity & Guaranty Life (b) | | | 4,816 | | | | 111,635 | |
Genworth Financial, Inc. - Class A (a) | | | 246,697 | | | | 636,478 | |
Global Indemnity plc (a) | | | 3,335 | | | | 91,813 | |
Greenlight Capital Re, Ltd. - Class A (a) (b) | | | 13,998 | | | | 282,200 | |
HCI Group, Inc. (b) | | | 5,671 | | | | 154,705 | |
Heritage Insurance Holdings, Inc. | | | 11,792 | | | | 141,150 | |
Horace Mann Educators Corp. | | | 18,978 | | | | 641,267 | |
Infinity Property & Casualty Corp. | | | 5,597 | | | | 451,454 | |
James River Group Holdings, Ltd. | | | 7,276 | | | | 247,093 | |
Kemper Corp. | | | 20,321 | | | | 629,545 | |
Maiden Holdings, Ltd. (b) | | | 29,535 | | | | 361,508 | |
MBIA, Inc. (a) (b) | | | 65,336 | | | | 446,245 | |
National General Holdings Corp. | | | 23,963 | | | | 513,287 | |
National Interstate Corp. | | | 3,585 | | | | 108,446 | |
National Western Life Group, Inc. - Class A | | | 1,054 | | | | 205,815 | |
Navigators Group, Inc. (The) | | | 5,559 | | | | 511,261 | |
OneBeacon Insurance Group, Ltd. - Class A | | | 11,496 | | | | 158,645 | |
Primerica, Inc. (b) | | | 23,745 | | | | 1,359,164 | |
RLI Corp. | | | 18,544 | | | | 1,275,456 | |
See accompanying notes to financial statements.
MSF-12
Metropolitan Series Fund
Russell 2000 Index Portfolio
Schedule of Investments as of June 30, 2016 (Unaudited)
Common Stocks—(Continued)
| | | | | | | | |
| Security Description | | Shares | | | Value | |
| | |
Insurance—(Continued) | | | | | | | | |
Safety Insurance Group, Inc. | | | 6,815 | | | $ | 419,668 | |
Selective Insurance Group, Inc. | | | 26,789 | | | | 1,023,608 | |
State Auto Financial Corp. | | | 7,940 | | | | 173,965 | |
State National Cos., Inc. | | | 15,205 | | | | 160,109 | |
Stewart Information Services Corp. (b) | | | 11,286 | | | | 467,353 | |
Third Point Reinsurance, Ltd. (a) (b) | | | 39,485 | | | | 462,764 | |
Trupanion, Inc. (a) (b) | | | 8,141 | | | | 107,868 | |
United Fire Group, Inc. | | | 11,823 | | | | 501,650 | |
United Insurance Holdings Corp. (b) | | | 8,654 | | | | 141,753 | |
Universal Insurance Holdings, Inc. (b) | | | 17,550 | | | | 326,079 | |
WMIH Corp. (a) | | | 127,179 | | | | 282,337 | |
| | | | | | | | |
| | | | | | | 18,350,204 | |
| | | | | | | | |
| | |
Internet & Catalog Retail—0.6% | | | | | | | | |
1-800-Flowers.com, Inc. - Class A (a) | | | 13,330 | | | | 120,237 | |
Blue Nile, Inc. | | | 6,605 | | | | 180,845 | |
Duluth Holdings, Inc. - Class B (a) (b) | | | 4,134 | | | | 101,118 | |
Etsy, Inc. (a) (b) | | | 51,942 | | | | 498,124 | |
FTD Cos., Inc. (a) | | | 9,600 | | | | 239,616 | |
HSN, Inc. (b) | | | 16,447 | | | | 804,752 | |
Lands’ End, Inc. (a) (b) | | | 8,472 | | | | 139,110 | |
Liberty TripAdvisor Holdings, Inc. - Class A (a) | | | 34,803 | | | | 761,490 | |
Nutrisystem, Inc. | | | 14,262 | | | | 361,684 | |
Overstock.com, Inc. (a) | | | 6,439 | | | | 103,732 | |
PetMed Express, Inc. (b) | | | 11,281 | | | | 211,631 | |
Shutterfly, Inc. (a) (b) | | | 17,108 | | | | 797,404 | |
Wayfair, Inc. - Class A (a) (b) | | | 15,513 | | | | 605,007 | |
| | | | | | | | |
| | | | | | | 4,924,750 | |
| | | | | | | | |
|
Internet Software & Services—2.5% | |
2U, Inc. (a) (b) | | | 18,127 | | | | 533,115 | |
Actua Corp. (a) | | | 20,148 | | | | 181,936 | |
Alarm.com Holdings, Inc. (a) (b) | | | 5,307 | | | | 136,018 | |
Angie’s List, Inc. (a) | | | 21,237 | | | | 138,253 | |
Apigee Corp. (a) | | | 8,074 | | | | 98,664 | |
Bankrate, Inc. (a) | | | 31,827 | | | | 238,066 | |
Bazaarvoice, Inc. (a) | | | 41,849 | | | | 167,815 | |
Benefitfocus, Inc. (a) (b) | | | 6,419 | | | | 244,692 | |
Blucora, Inc. (a) | | | 20,338 | | | | 210,702 | |
Box, Inc. - Class A (a) | | | 24,267 | | | | 250,921 | |
Brightcove, Inc. (a) | | | 16,995 | | | | 149,556 | |
ChannelAdvisor Corp. (a) (b) | | | 10,403 | | | | 150,740 | |
Cimpress NV (a) | | | 12,234 | | | | 1,131,400 | |
comScore, Inc. (a) (b) | | | 23,234 | | | | 554,828 | |
Cornerstone OnDemand, Inc. (a) | | | 24,008 | | | | 913,745 | |
Cvent, Inc. (a) | | | 14,769 | | | | 527,549 | |
Demandware, Inc. (a) | | | 18,297 | | | | 1,370,445 | |
DHI Group, Inc. (a) | | | 21,586 | | | | 134,481 | |
EarthLink Holdings Corp. | | | 48,787 | | | | 312,237 | |
Endurance International Group Holdings, Inc. (a) | | | 27,384 | | | | 246,182 | |
Envestnet, Inc. (a) (b) | | | 20,207 | | | | 673,095 | |
Everyday Health, Inc. (a) | | | 14,700 | | | | 115,836 | |
Five9, Inc. (a) | | | 16,631 | | | | 197,909 | |
Gogo, Inc. (a) (b) | | | 27,419 | | | | 230,045 | |
GrubHub, Inc. (a) (b) | | | 39,224 | | | | 1,218,690 | |
GTT Communications, Inc. (a) (b) | | | 11,597 | | | | 214,313 | |
|
Internet Software & Services—(Continued) | |
Hortonworks, Inc. (a) | | | 20,178 | | | | 215,703 | |
inContact, Inc. (a) (b) | | | 27,382 | | | | 379,241 | |
Instructure, Inc. (a) (b) | | | 5,753 | | | | 109,307 | |
IntraLinks Holdings, Inc. (a) | | | 20,583 | | | | 133,790 | |
j2 Global, Inc. | | | 22,619 | | | | 1,428,842 | |
Liquidity Services, Inc. (a) | | | 13,611 | | | | 106,710 | |
LivePerson, Inc. (a) (b) | | | 29,330 | | | | 185,952 | |
LogMeIn, Inc. (a) | | | 12,270 | | | | 778,286 | |
Marketo, Inc. (a) (b) | | | 20,272 | | | | 705,871 | |
MeetMe, Inc. (a) | | | 21,638 | | | | 115,331 | |
MINDBODY, Inc. - Class A (a) | | | 7,507 | | | | 121,163 | |
Monster Worldwide, Inc. (a) | | | 43,593 | | | | 104,187 | |
New Relic, Inc. (a) | | | 10,856 | | | | 318,949 | |
NIC, Inc. | | | 33,080 | | | | 725,775 | |
Q2 Holdings, Inc. (a) (b) | | | 12,619 | | | | 353,584 | |
Quotient Technology, Inc. (a) (b) | | | 29,125 | | | | 390,566 | |
Reis, Inc. | | | 4,338 | | | | 108,016 | |
RetailMeNot, Inc. (a) | | | 18,130 | | | | 139,782 | |
SciQuest, Inc. (a) | | | 15,491 | | | | 273,571 | |
Shutterstock, Inc. (a) (b) | | | 9,230 | | | | 422,734 | |
SPS Commerce, Inc. (a) | | | 7,550 | | | | 457,530 | |
Stamps.com, Inc. (a) (b) | | | 7,949 | | | | 694,902 | |
TrueCar, Inc. (a) (b) | | | 23,179 | | | | 181,955 | |
Web.com Group, Inc. (a) | | | 20,520 | | | | 373,054 | |
WebMD Health Corp. (a) (b) | | | 17,955 | | | | 1,043,365 | |
Xactly Corp. (a) | | | 11,677 | | | | 149,582 | |
XO Group, Inc. (a) | | | 11,305 | | | | 197,046 | |
| | | | | | | | |
| | | | | | | 20,556,027 | |
| | | | | | | | |
| | |
IT Services—2.1% | | | | | | | | |
Acxiom Corp. (a) | | | 37,591 | | | | 826,626 | |
Blackhawk Network Holdings, Inc. (a) | | | 27,022 | | | | 904,967 | |
CACI International, Inc. - Class A (a) (d) | | | 12,041 | | | | 1,088,627 | |
Cardtronics, Inc. (a) | | | 22,064 | | | | 878,368 | |
Cass Information Systems, Inc. (b) | | | 5,928 | | | | 306,478 | |
Convergys Corp. (b) | | | 46,697 | | | | 1,167,425 | |
CSG Systems International, Inc. (b) | | | 15,258 | | | | 615,050 | |
EPAM Systems, Inc. (a) (b) | | | 23,687 | | | | 1,523,311 | |
EVERTEC, Inc. (b) | | | 30,384 | | | | 472,167 | |
ExlService Holdings, Inc. (a) | | | 15,842 | | | | 830,279 | |
Forrester Research, Inc. | | | 5,782 | | | | 213,124 | |
Hackett Group, Inc. (The) | | | 13,330 | | | | 184,887 | |
Lionbridge Technologies, Inc. (a) | | | 31,361 | | | | 123,876 | |
ManTech International Corp. - Class A | | | 12,440 | | | | 470,481 | |
MAXIMUS, Inc. (b) | | | 31,383 | | | | 1,737,677 | |
MoneyGram International, Inc. (a) | | | 14,692 | | | | 100,640 | |
NeuStar, Inc. - Class A (a) (b) | | | 26,451 | | | | 621,863 | |
Perficient, Inc. (a) | | | 17,369 | | | | 352,764 | |
Planet Payment, Inc. (a) | | | 23,400 | | | | 105,066 | |
Science Applications International Corp. | | | 21,353 | | | | 1,245,947 | |
ServiceSource International, Inc. (a) (b) | | | 29,419 | | | | 118,558 | |
Sykes Enterprises, Inc. (a) | | | 18,634 | | | | 539,641 | |
Syntel, Inc. (a) (b) | | | 14,931 | | | | 675,777 | |
TeleTech Holdings, Inc. | | | 7,377 | | | | 200,138 | |
Travelport Worldwide, Ltd. | | | 56,729 | | | | 731,237 | |
Unisys Corp. (a) (b) | | | 26,228 | | | | 190,940 | |
See accompanying notes to financial statements.
MSF-13
Metropolitan Series Fund
Russell 2000 Index Portfolio
Schedule of Investments as of June 30, 2016 (Unaudited)
Common Stocks—(Continued)
| | | | | | | | |
| Security Description | | Shares | | | Value | |
| | |
IT Services—(Continued) | | | | | | | | |
Virtusa Corp. (a) | | | 15,311 | | | $ | 442,182 | |
| | | | | | | | |
| | | | | | | 16,668,096 | |
| | | | | | | | |
| | |
Leisure Products—0.3% | | | | | | | | |
Arctic Cat, Inc. (b) | | | 6,845 | | | | 116,365 | |
Callaway Golf Co. | | | 46,706 | | | | 476,868 | |
Malibu Boats, Inc. - Class A (a) | | | 8,768 | | | | 105,917 | |
Nautilus, Inc. (a) | | | 16,328 | | | | 291,292 | |
Smith & Wesson Holding Corp. (a) (b) | | | 25,637 | | | | 696,814 | |
Sturm Ruger & Co., Inc. | | | 8,538 | | | | 546,517 | |
| | | | | | | | |
| | | | | | | 2,233,773 | |
| | | | | | | | |
| | |
Life Sciences Tools & Services—0.7% | | | | | | | | |
Accelerate Diagnostics, Inc. (a) (b) | | | 11,348 | | | | 163,298 | |
Albany Molecular Research, Inc. (a) | | | 12,484 | | | | 167,785 | |
Cambrex Corp. (a) | | | 15,180 | | | | 785,261 | |
Enzo Biochem, Inc. (a) | | | 21,985 | | | | 131,251 | |
Fluidigm Corp. (a) (b) | | | 13,200 | | | | 119,196 | |
INC Research Holdings, Inc. - Class A (a) (b) | | | 20,394 | | | | 777,623 | |
Luminex Corp. (a) | | | 23,255 | | | | 470,449 | |
NanoString Technologies, Inc. (a) (b) | | | 7,907 | | | | 99,628 | |
NeoGenomics, Inc. (a) (b) | | | 26,497 | | | | 213,036 | |
Pacific Biosciences of California, Inc. (a) (b) | | | 34,410 | | | | 242,074 | |
PAREXEL International Corp. (a) | | | 26,785 | | | | 1,684,241 | |
PRA Health Sciences, Inc. (a) | | | 12,050 | | | | 503,208 | |
| | | | | | | | |
| | | | | | | 5,357,050 | |
| | | | | | | | |
| | |
Machinery—3.2% | | | | | | | | |
Actuant Corp. - Class A | | | 28,401 | | | | 642,147 | |
Alamo Group, Inc. | | | 4,629 | | | | 305,375 | |
Albany International Corp. - Class A | | | 14,147 | | | | 564,890 | |
Altra Industrial Motion Corp. | | | 13,385 | | | | 361,127 | |
American Railcar Industries, Inc. | | | 4,708 | | | | 185,825 | |
Astec Industries, Inc. | | | 9,004 | | | | 505,575 | |
Barnes Group, Inc. | | | 25,967 | | | | 860,027 | |
Briggs & Stratton Corp. (b) | | | 21,617 | | | | 457,848 | |
Chart Industries, Inc. (a) | | | 15,307 | | | | 369,358 | |
CIRCOR International, Inc. | | | 8,835 | | | | 503,507 | |
CLARCOR, Inc. | | | 23,160 | | | | 1,408,823 | |
Columbus McKinnon Corp. | | | 10,074 | | | | 142,547 | |
Douglas Dynamics, Inc. | | | 9,877 | | | | 254,135 | |
Energy Recovery, Inc. (a) | | | 17,996 | | | | 159,984 | |
EnPro Industries, Inc. | | | 11,493 | | | | 510,174 | |
ESCO Technologies, Inc. | | | 12,540 | | | | 500,848 | |
Federal Signal Corp. | | | 29,548 | | | | 380,578 | |
Franklin Electric Co., Inc. | | | 23,378 | | | | 772,643 | |
Global Brass & Copper Holdings, Inc. | | | 11,099 | | | | 302,892 | |
Gorman-Rupp Co. (The) | | | 10,331 | | | | 283,173 | |
Greenbrier Cos., Inc. (The) (b) | | | 14,368 | | | | 418,540 | |
Harsco Corp. | | | 37,700 | | | | 250,328 | |
Hillenbrand, Inc. | | | 29,866 | | | | 897,175 | |
Hurco Cos., Inc. | | | 3,501 | | | | 97,433 | |
Hyster-Yale Materials Handling, Inc. | | | 4,976 | | | | 296,022 | |
John Bean Technologies Corp. | | | 13,616 | | | | 833,571 | |
Joy Global, Inc. | | | 48,075 | | | | 1,016,305 | |
| | |
Machinery—(Continued) | | | | | | | | |
Kadant, Inc. | | | 5,766 | | | | 297,007 | |
Kennametal, Inc. | | | 38,584 | | | | 853,092 | |
Lindsay Corp. (b) | | | 5,740 | | | | 389,516 | |
Lydall, Inc. (a) | | | 8,342 | | | | 321,667 | |
Manitowoc Co., Inc. (The) | | | 63,397 | | | | 345,514 | |
Meritor, Inc. (a) (b) | | | 43,321 | | | | 311,911 | |
Milacron Holdings Corp. (a) | | | 6,533 | | | | 94,794 | |
Miller Industries, Inc. | | | 5,680 | | | | 116,951 | |
Mueller Industries, Inc. | | | 28,764 | | | | 916,996 | |
Mueller Water Products, Inc. - Class A | | | 76,369 | | | | 872,134 | |
Navistar International Corp. (a) (b) | | | 23,914 | | | | 279,555 | |
NN, Inc. (b) | | | 12,696 | | | | 177,617 | |
Proto Labs, Inc. (a) (b) | | | 12,094 | | | | 696,131 | |
RBC Bearings, Inc. (a) | | | 10,876 | | | | 788,510 | |
Rexnord Corp. (a) | | | 40,317 | | | | 791,423 | |
SPX Corp. (a) | | | 20,781 | | | | 308,598 | |
SPX FLOW, Inc. (a) | | | 17,419 | | | | 454,113 | |
Standex International Corp. | | | 6,262 | | | | 517,429 | |
Sun Hydraulics Corp. | | | 10,558 | | | | 313,467 | |
Tennant Co. | | | 8,929 | | | | 481,005 | |
Titan International, Inc. | | | 22,706 | | | | 140,777 | |
TriMas Corp. (a) | | | 22,514 | | | | 405,252 | |
Wabash National Corp. (a) (b) | | | 32,109 | | | | 407,784 | |
Watts Water Technologies, Inc. - Class A | | | 13,118 | | | | 764,255 | |
Woodward, Inc. | | | 25,737 | | | | 1,483,481 | |
| | | | | | | | |
| | | | | | | 25,809,829 | |
| | | | | | | | |
| | |
Marine—0.1% | | | | | | | | |
Costamare, Inc. | | | 13,958 | | | | 107,058 | |
Matson, Inc. | | | 20,127 | | | | 649,901 | |
| | | | | | | | |
| | | | | | | 756,959 | |
| | | | | | | | |
| | |
Media—1.8% | | | | | | | | |
AMC Entertainment Holdings, Inc. - Class A | | | 9,526 | | | | 263,013 | |
Carmike Cinemas, Inc. (a) | | | 12,031 | | | | 362,374 | |
Daily Journal Corp. (a) (b) | | | 598 | | | | 141,720 | |
DreamWorks Animation SKG, Inc. - Class A (a) | | | 37,694 | | | | 1,540,554 | |
Entercom Communications Corp. - Class A | | | 14,538 | | | | 197,281 | |
Entravision Communications Corp. - Class A | | | 29,645 | | | | 199,214 | |
Eros International plc (a) (b) | | | 13,360 | | | | 217,367 | |
EW Scripps Co. (The) - Class A (a) (b) | | | 29,695 | | | | 470,369 | |
Gannett Co., Inc. | | | 57,579 | | | | 795,166 | |
Global Eagle Entertainment, Inc. (a) (b) | | | 28,412 | | | | 188,656 | |
Gray Television, Inc. (a) | | | 30,714 | | | | 333,247 | |
IMAX Corp. (a) (b) | | | 28,090 | | | | 828,093 | |
Liberty Braves Group - Class C (a) | | | 16,010 | | | | 234,707 | |
Liberty Media Group - Class A (a) | | | 11,738 | | | | 224,665 | |
Liberty Media Group - Class C (a) (b) | | | 22,971 | | | | 435,760 | |
Loral Space & Communications, Inc. (a) (b) | | | 6,669 | | | | 235,216 | |
MDC Partners, Inc. - Class A | | | 25,380 | | | | 464,200 | |
Media General, Inc. (a) | | | 53,348 | | | | 917,052 | |
Meredith Corp. (b) | | | 18,346 | | | | 952,341 | |
MSG Networks, Inc. - Class A (a) | | | 29,478 | | | | 452,192 | |
National CineMedia, Inc. | | | 31,052 | | | | 480,685 | |
New Media Investment Group, Inc. (b) | | | 22,310 | | | | 403,142 | |
New York Times Co. (The) - Class A | | | 65,251 | | | | 789,537 | |
See accompanying notes to financial statements.
MSF-14
Metropolitan Series Fund
Russell 2000 Index Portfolio
Schedule of Investments as of June 30, 2016 (Unaudited)
Common Stocks—(Continued)
| | | | | | | | |
| Security Description | | Shares | | | Value | |
| | |
Media—(Continued) | | | | | | | | |
Nexstar Broadcasting Group, Inc. - Class A (b) | | | 14,830 | | | $ | 705,611 | |
Reading International, Inc. - Class A (a) | | | 8,504 | | | | 106,215 | |
Scholastic Corp. | | | 14,176 | | | | 561,511 | |
Sinclair Broadcast Group, Inc. - Class A (b) | | | 30,881 | | | | 922,107 | |
Time, Inc. | | | 50,189 | | | | 826,111 | |
tronc, Inc. | | | 14,706 | | | | 202,943 | |
World Wrestling Entertainment, Inc. - Class A (b) | | | 18,113 | | | | 333,460 | |
| | | | | | | | |
| | | | | | | 14,784,509 | |
| | | | | | | | |
| | |
Metals & Mining—1.1% | | | | | | | | |
AK Steel Holding Corp. (a) (b) | | | 114,252 | | | | 532,414 | |
Allegheny Technologies, Inc. (b) | | | 52,856 | | | | 673,914 | |
Carpenter Technology Corp. (b) | | | 23,384 | | | | 770,035 | |
Century Aluminum Co. (a) (b) | | | 24,781 | | | | 156,864 | |
Cliffs Natural Resources, Inc. (a) (b) | | | 87,769 | | | | 497,650 | |
Coeur Mining, Inc. (a) | | | 74,425 | | | | 793,370 | |
Commercial Metals Co. (b) | | | 53,553 | | | | 905,046 | |
Ferroglobe plc | | | 31,634 | | | | 272,369 | |
Haynes International, Inc. (b) | | | 6,653 | | | | 213,428 | |
Hecla Mining Co. (b) | | | 185,576 | | | | 946,438 | |
Kaiser Aluminum Corp. | | | 8,616 | | | | 778,973 | |
Materion Corp. | | | 9,498 | | | | 235,170 | |
Olympic Steel, Inc. | | | 4,630 | | | | 126,445 | |
Real Industry, Inc. (a) | | | 14,231 | | | | 110,575 | |
Schnitzer Steel Industries, Inc. - Class A (b) | | | 13,529 | | | | 238,110 | |
Stillwater Mining Co. (a) (b) | | | 56,563 | | | | 670,837 | |
SunCoke Energy, Inc. | | | 35,308 | | | | 205,493 | |
TimkenSteel Corp. | | | 18,629 | | | | 179,211 | |
Worthington Industries, Inc. | | | 21,960 | | | | 928,908 | |
| | | | | | | | |
| | | | | | | 9,235,250 | |
| | | | | | | | |
| | |
Multi-Utilities—0.6% | | | | | | | | |
Avista Corp. | | | 30,657 | | | | 1,373,434 | |
Black Hills Corp. | | | 24,978 | | | | 1,574,613 | |
NorthWestern Corp. | | | 23,557 | | | | 1,485,740 | |
Unitil Corp. | | | 7,429 | | | | 316,995 | |
| | | | | | | | |
| | | | | | | 4,750,782 | |
| | | | | | | | |
| | |
Multiline Retail—0.2% | | | | | | | | |
Big Lots, Inc. (b) | | | 24,327 | | | | 1,219,026 | |
Fred’s, Inc. - Class A (b) | | | 16,936 | | | | 272,839 | |
Ollie’s Bargain Outlet Holdings, Inc. (a) | | | 10,284 | | | | 255,969 | |
Tuesday Morning Corp. (a) (b) | | | 21,822 | | | | 153,190 | |
| | | | | | | | |
| | | | | | | 1,901,024 | |
| | | | | | | | |
|
Oil, Gas & Consumable Fuels—1.9% | |
Alon USA Energy, Inc. (b) | | | 18,417 | | | | 119,342 | |
Bill Barrett Corp. (a) | | | 31,337 | | | | 200,243 | |
California Resources Corp. (b) | | | 16,775 | | | | 204,655 | |
Callon Petroleum Co. (a) | | | 58,934 | | | | 661,829 | |
Carrizo Oil & Gas, Inc. (a) (b) | | | 28,057 | | | | 1,005,844 | |
Clean Energy Fuels Corp. (a) (b) | | | 51,916 | | | | 180,149 | |
Cobalt International Energy, Inc. (a) (b) | | | 207,968 | | | | 278,677 | |
Contango Oil & Gas Co. (a) | | | 12,282 | | | | 150,332 | |
CVR Energy, Inc. (b) | | | 8,864 | | | | 137,392 | |
| | |
Oil, Gas & Consumable Fuels—(Continued) | | | | | | | | |
Delek U.S. Holdings, Inc. | | | 28,305 | | | | 373,909 | |
Denbury Resources, Inc. (b) | | | 174,216 | | | | 625,435 | |
DHT Holdings, Inc. | | | 44,160 | | | | 222,125 | |
Eclipse Resources Corp. (a) (b) | | | 28,528 | | | | 95,284 | |
EP Energy Corp. - Class A (a) (b) | | | 22,078 | | | | 114,364 | |
EXCO Resources, Inc. (a) | | | 83,769 | | | | 108,900 | |
Frontline, Ltd. (b) | | | 32,746 | | | | 257,711 | |
GasLog, Ltd. (b) | | | 20,748 | | | | 269,309 | |
Gener8 Maritime, Inc. (a) | | | 20,667 | | | | 132,269 | |
Golar LNG, Ltd. | | | 44,104 | | | | 683,612 | |
Green Plains, Inc. (b) | | | 19,435 | | | | 383,258 | |
Matador Resources Co. (a) (b) | | | 40,991 | | | | 811,622 | |
Nordic American Tankers, Ltd. (b) | | | 41,561 | | | | 577,282 | |
Northern Oil and Gas, Inc. (a) (b) | | | 32,713 | | | | 151,134 | |
Oasis Petroleum, Inc. (a) (b) | | | 85,789 | | | | 801,269 | |
Overseas Shipholding Group, Inc. - Class A | | | 23,363 | | | | 256,759 | |
Panhandle Oil and Gas, Inc. - Class A (b) | | | 10,459 | | | | 174,352 | |
Par Pacific holdings, Inc. (a) (b) | | | 14,816 | | | | 227,277 | |
PDC Energy, Inc. (a) (b) | | | 22,630 | | | | 1,303,714 | |
Renewable Energy Group, Inc. (a) (b) | | | 22,727 | | | | 200,679 | |
REX American Resources Corp. (a) (b) | | | 2,989 | | | | 178,832 | |
Ring Energy, Inc. (a) | | | 19,854 | | | | 175,112 | |
RSP Permian, Inc. (a) (b) | | | 38,535 | | | | 1,344,486 | |
Sanchez Energy Corp. (a) (b) | | | 30,771 | | | | 217,243 | |
Scorpio Tankers, Inc. | | | 83,337 | | | | 350,015 | |
SemGroup Corp. - Class A (b) | | | 21,399 | | | | 696,752 | |
Ship Finance International, Ltd. (b) | | | 28,428 | | | | 419,029 | |
Synergy Resources Corp. (a) (b) | | | 91,847 | | | | 611,701 | |
Teekay Corp. (b) | | | 22,735 | | | | 162,101 | |
Teekay Tankers, Ltd. - Class A (b) | | | 53,596 | | | | 159,716 | |
Western Refining, Inc. | | | 34,157 | | | | 704,659 | |
| | | | | | | | |
| | | | | | | 15,728,373 | |
| | | | | | | | |
|
Paper & Forest Products—0.6% | |
Boise Cascade Co. (a) | | | 18,411 | | | | 422,532 | |
Clearwater Paper Corp. (a) | | | 9,289 | | | | 607,222 | |
Deltic Timber Corp. (b) | | | 5,314 | | | | 356,729 | |
KapStone Paper and Packaging Corp. | | | 39,372 | | | | 512,230 | |
Louisiana-Pacific Corp. (a) | | | 69,948 | | | | 1,213,598 | |
Neenah Paper, Inc. | | | 7,745 | | | | 560,505 | |
PH Glatfelter Co. | | | 21,278 | | | | 416,198 | |
Schweitzer-Mauduit International, Inc. | | | 14,898 | | | | 525,601 | |
| | | | | | | | |
| | | | | | | 4,614,615 | |
| | | | | | | | |
|
Personal Products—0.3% | |
Avon Products, Inc. (b) | | | 215,512 | | | | 814,636 | |
Elizabeth Arden, Inc. (a) | | | 13,967 | | | | 192,186 | |
Inter Parfums, Inc. | | | 8,191 | | | | 234,017 | |
Lifevantage Corp. (a) | | | 11,572 | | | | 157,379 | |
Medifast, Inc. | | | 5,660 | | | | 188,308 | |
Natural Health Trends Corp. (b) | | | 4,063 | | | | 114,536 | |
Nutraceutical International Corp. (a) | | | 4,388 | | | | 101,582 | |
Revlon, Inc. - Class A (a) | | | 6,172 | | | | 198,615 | |
USANA Health Sciences, Inc. (a) (b) | | | 2,803 | | | | 312,338 | |
| | | | | | | | |
| | | | | | | 2,313,597 | |
| | | | | | | | |
See accompanying notes to financial statements.
MSF-15
Metropolitan Series Fund
Russell 2000 Index Portfolio
Schedule of Investments as of June 30, 2016 (Unaudited)
Common Stocks—(Continued)
| | | | | | | | |
| Security Description | | Shares | | | Value | |
|
Pharmaceuticals—1.9% | |
Aerie Pharmaceuticals, Inc. (a) (b) | | | 12,540 | | | $ | 220,704 | |
Amphastar Pharmaceuticals, Inc. (a) (b) | | | 18,205 | | | | 293,465 | |
ANI Pharmaceuticals, Inc. (a) (b) | | | 3,945 | | | | 220,210 | |
Aratana Therapeutics, Inc. (a) (b) | | | 17,356 | | | | 109,690 | |
Catalent, Inc. (a) | | | 48,749 | | | | 1,120,740 | |
Cempra, Inc. (a) (b) | | | 20,861 | | | | 343,998 | |
Collegium Pharmaceutical, Inc. (a) | | | 7,761 | | | | 91,968 | |
Corcept Therapeutics, Inc. (a) (b) | | | 39,100 | | | | 213,486 | |
Depomed, Inc. (a) (b) | | | 31,379 | | | | 615,656 | |
Dermira, Inc. (a) (b) | | | 10,682 | | | | 312,449 | |
Heska Corp. (a) | | | 3,277 | | | | 121,806 | |
Horizon Pharma plc (a) | | | 78,756 | | | | 1,297,111 | |
Impax Laboratories, Inc. (a) | | | 35,866 | | | | 1,033,658 | |
Innoviva, Inc. | | | 40,393 | | | | 425,338 | |
Intersect ENT, Inc. (a) (b) | | | 11,434 | | | | 147,842 | |
Intra-Cellular Therapies, Inc. (a) (b) | | | 16,993 | | | | 659,668 | |
Lannett Co., Inc. (a) (b) | | | 12,710 | | | | 302,371 | |
Medicines Co. (The) (a) (b) | | | 32,038 | | | | 1,077,438 | |
Nektar Therapeutics (a) (b) | | | 62,084 | | | | 883,455 | |
Omeros Corp. (a) (b) | | | 18,771 | | | | 197,471 | |
Pacira Pharmaceuticals, Inc. (a) (b) | | | 17,459 | | | | 588,892 | |
Paratek Pharmaceuticals, Inc. (a) (b) | | | 7,167 | | | | 99,693 | |
Phibro Animal Health Corp. - Class A (b) | | | 9,993 | | | | 186,469 | |
Prestige Brands Holdings, Inc. (a) | | | 25,686 | | | | 1,423,004 | |
Relypsa, Inc. (a) (b) | | | 17,803 | | | | 329,355 | |
Revance Therapeutics, Inc. (a) (b) | | | 8,949 | | | | 121,706 | |
Sagent Pharmaceuticals, Inc. (a) | | | 11,006 | | | | 164,870 | |
Sciclone Pharmaceuticals, Inc. (a) | | | 27,839 | | | | 363,577 | |
Sucampo Pharmaceuticals, Inc. - Class A (a) | | | 12,005 | | | | 131,695 | |
Supernus Pharmaceuticals, Inc. (a) (b) | | | 23,502 | | | | 478,736 | |
Teligent, Inc. (a) | | | 28,000 | | | | 199,920 | |
TherapeuticsMD, Inc. (a) (b) | | | 70,014 | | | | 595,119 | |
Theravance Biopharma, Inc. (a) (b) | | | 16,997 | | | | 385,662 | |
XenoPort, Inc. (a) (b) | | | 30,042 | | | | 211,496 | |
Zogenix, Inc. (a) | | | 12,033 | | | | 96,866 | |
| | | | | | | | |
| | | | | | | 15,065,584 | |
| | | | | | | | |
|
Professional Services—1.3% | |
Acacia Research Corp. (b) | | | 26,966 | | | | 118,650 | |
Advisory Board Co. (The) (a) | | | 20,097 | | | | 711,233 | |
Barrett Business Services, Inc. | | | 3,858 | | | | 159,413 | |
CBIZ, Inc. (a) | | | 24,387 | | | | 253,869 | |
CEB, Inc. | | | 15,566 | | | | 960,111 | |
CRA International, Inc. (a) | | | 4,868 | | | | 122,771 | |
Exponent, Inc. (b) | | | 12,398 | | | | 724,167 | |
FTI Consulting, Inc. (a) | | | 19,255 | | | | 783,293 | |
GP Strategies Corp. (a) | | | 5,793 | | | | 125,650 | |
Heidrick & Struggles International, Inc. | | | 9,634 | | | | 162,622 | |
Huron Consulting Group, Inc. (a) | | | 10,356 | | | | 625,709 | |
ICF International, Inc. (a) | | | 10,002 | | | | 409,082 | |
Insperity, Inc. | | | 7,461 | | | | 576,213 | |
Kelly Services, Inc. - Class A | | | 14,944 | | | | 283,488 | |
Kforce, Inc. | | | 12,692 | | | | 214,368 | |
Korn/Ferry International | | | 28,161 | | | | 582,933 | |
Mistras Group, Inc. (a) | | | 8,222 | | | | 196,259 | |
Navigant Consulting, Inc. (a) | | | 21,686 | | | | 350,229 | |
|
Professional Services—(Continued) | |
On Assignment, Inc. (a) | | | 24,181 | | | | 893,488 | |
Resources Connection, Inc. | | | 17,930 | | | | 265,005 | |
RPX Corp. (a) | | | 26,264 | | | | 240,841 | |
TriNet Group, Inc. (a) | | | 19,326 | | | | 401,788 | |
TrueBlue, Inc. (a) | | | 19,573 | | | | 370,321 | |
WageWorks, Inc. (a) | | | 17,251 | | | | 1,031,782 | |
| | | | | | | | |
| | | | | | | 10,563,285 | |
| | | | | | | | |
|
Real Estate Investment Trusts—9.2% | |
Acadia Realty Trust (b) | | | 34,195 | | | | 1,214,606 | |
AG Mortgage Investment Trust, Inc. | | | 14,345 | | | | 207,142 | |
Agree Realty Corp. | | | 11,290 | | | | 544,630 | |
Alexander’s, Inc. (b) | | | 1,029 | | | | 421,098 | |
Altisource Residential Corp. (b) | | | 26,537 | | | | 243,875 | |
American Assets Trust, Inc. | | | 19,187 | | | | 814,296 | |
American Capital Mortgage Investment Corp. | | | 23,775 | | | | 375,407 | |
Anworth Mortgage Asset Corp. | | | 49,995 | | | | 234,977 | |
Apollo Commercial Real Estate Finance, Inc. (b) | | | 28,760 | | | | 462,173 | |
Apollo Residential Mortgage, Inc. | | | 16,439 | | | | 220,283 | |
Ares Commercial Real Estate Corp. | | | 11,438 | | | | 140,573 | |
Armada Hoffler Properties, Inc. | | | 19,662 | | | | 270,156 | |
ARMOUR Residential REIT, Inc. (b) | | | 16,682 | | | | 333,640 | |
Ashford Hospitality Prime, Inc. (b) | | | 14,521 | | | | 205,327 | |
Ashford Hospitality Trust, Inc. | | | 39,201 | | | | 210,509 | |
Bluerock Residential Growth REIT, Inc. (b) | | | 9,427 | | | | 122,551 | |
Capstead Mortgage Corp. (b) | | | 44,863 | | | | 435,171 | |
CareTrust REIT, Inc. | | | 27,942 | | | | 385,041 | |
CatchMark Timber Trust, Inc. - Class A (b) | | | 19,002 | | | | 232,204 | |
CBL & Associates Properties, Inc. | | | 82,772 | | | | 770,607 | |
Cedar Realty Trust, Inc. | | | 37,954 | | | | 281,998 | |
Chatham Lodging Trust | | | 18,798 | | | | 413,180 | |
Chesapeake Lodging Trust | | | 28,075 | | | | 652,744 | |
City Office REIT, Inc. | | | 10,122 | | | | 131,384 | |
Colony Capital, Inc. - Class A (b) | | | 57,752 | | | | 886,493 | |
Colony Starwood Homes (b) | | | 31,797 | | | | 967,265 | |
Community Healthcare Trust, Inc. | | | 6,730 | | | | 142,272 | |
CorEnergy Infrastructure Trust, Inc. (b) | | | 5,980 | | | | 172,523 | |
CoreSite Realty Corp. (b) | | | 16,325 | | | | 1,447,864 | |
Cousins Properties, Inc. (b) | | | 107,365 | | | | 1,116,596 | |
CYS Investments, Inc. | | | 74,681 | | | | 625,080 | |
DiamondRock Hospitality Co. (b) | | | 101,168 | | | | 913,547 | |
DuPont Fabros Technology, Inc. | | | 36,270 | | | | 1,724,276 | |
Dynex Capital, Inc. (b) | | | 26,422 | | | | 183,369 | |
Easterly Government Properties, Inc. (b) | | | 12,206 | | | | 240,824 | |
EastGroup Properties, Inc. (b) | | | 15,137 | | | | 1,043,242 | |
Education Realty Trust, Inc. | | | 32,364 | | | | 1,493,275 | |
FelCor Lodging Trust, Inc. (b) | | | 66,829 | | | | 416,345 | |
First Industrial Realty Trust, Inc. (b) | | | 56,517 | | | | 1,572,303 | |
First Potomac Realty Trust | | | 27,829 | | | | 256,027 | |
Four Corners Property Trust, Inc. (b) | | | 29,818 | | | | 613,953 | |
Franklin Street Properties Corp. | | | 48,177 | | | | 591,132 | |
Geo Group, Inc. (The) | | | 35,110 | | | | 1,200,060 | |
Getty Realty Corp. | | | 13,449 | | | | 288,481 | |
Gladstone Commercial Corp. (b) | | | 10,038 | | | | 169,542 | |
Global Net Lease, Inc. (b) | | | 90,671 | | | | 720,834 | |
Government Properties Income Trust (b) | | | 33,503 | | | | 772,579 | |
See accompanying notes to financial statements.
MSF-16
Metropolitan Series Fund
Russell 2000 Index Portfolio
Schedule of Investments as of June 30, 2016 (Unaudited)
Common Stocks—(Continued)
| | | | | | | | |
| Security Description | | Shares | | | Value | |
|
Real Estate Investment Trusts—(Continued) | |
Gramercy Property Trust | | | 205,223 | | | $ | 1,892,156 | |
Hannon Armstrong Sustainable Infrastructure Capital, Inc. (b) | | | 20,919 | | | | 451,850 | |
Hatteras Financial Corp. (b) | | | 45,676 | | | | 749,086 | |
Healthcare Realty Trust, Inc. | | | 50,734 | | | | 1,775,183 | |
Hersha Hospitality Trust (b) | | | 21,188 | | | | 363,374 | |
Hudson Pacific Properties, Inc. | | | 39,585 | | | | 1,155,090 | |
Independence Realty Trust, Inc. | | | 21,185 | | | | 173,293 | |
InfraREIT, Inc. (b) | | | 19,986 | | | | 350,554 | |
Invesco Mortgage Capital, Inc. | | | 55,256 | | | | 756,455 | |
Investors Real Estate Trust | | | 56,725 | | | | 367,011 | |
iStar, Inc. (a) (b) | | | 40,007 | | | | 383,667 | |
Kite Realty Group Trust | | | 42,146 | | | | 1,181,352 | |
Ladder Capital Corp. (b) | | | 20,669 | | | | 252,162 | |
LaSalle Hotel Properties (b) | | | 53,022 | | | | 1,250,259 | |
Lexington Realty Trust | | | 112,246 | | | | 1,134,807 | |
LTC Properties, Inc. | | | 17,896 | | | | 925,760 | |
Mack-Cali Realty Corp. (b) | | | 43,539 | | | | 1,175,553 | |
Medical Properties Trust, Inc. (b) | | | 114,839 | | | | 1,746,701 | |
Monmouth Real Estate Investment Corp. - Class A | | | 34,969 | | | | 463,689 | |
Monogram Residential Trust, Inc. | | | 82,552 | | | | 842,856 | |
National Health Investors, Inc. (b) | | | 17,654 | | | | 1,325,639 | |
National Storage Affiliates Trust (b) | | | 10,849 | | | | 225,876 | |
New Residential Investment Corp. (b) | | | 113,306 | | | | 1,568,155 | |
New Senior Investment Group, Inc. (b) | | | 40,485 | | | | 432,380 | |
New York Mortgage Trust, Inc. (b) | | | 51,471 | | | | 313,973 | |
New York REIT, Inc. (b) | | | 81,130 | | | | 750,452 | |
NexPoint Residential Trust, Inc. | | | 9,072 | | | | 165,110 | |
NorthStar Realty Europe Corp. | | | 30,012 | | | | 277,611 | |
One Liberty Properties, Inc. | | | 6,290 | | | | 150,017 | |
Orchid Island Capital, Inc. (b) | | | 11,326 | | | | 116,545 | |
Parkway Properties, Inc. | | | 38,318 | | | | 641,060 | |
Pebblebrook Hotel Trust (b) | | | 33,791 | | | | 887,014 | |
Pennsylvania Real Estate Investment Trust | | | 32,570 | | | | 698,627 | |
PennyMac Mortgage Investment Trust | | | 35,722 | | | | 579,768 | |
Physicians Realty Trust | | | 63,878 | | | | 1,342,077 | |
Potlatch Corp. | | | 19,692 | | | | 671,497 | |
Preferred Apartment Communities, Inc. - Class A (b) | | | 11,149 | | | | 164,113 | |
PS Business Parks, Inc. | | | 9,635 | | | | 1,022,081 | |
QTS Realty Trust, Inc. - Class A | | | 22,822 | | | | 1,277,576 | |
RAIT Financial Trust (b) | | | 39,654 | | | | 124,117 | |
Ramco-Gershenson Properties Trust (b) | | | 37,976 | | | | 744,709 | |
Redwood Trust, Inc. | | | 39,826 | | | | 549,997 | |
Resource Capital Corp. (b) | | | 16,059 | | | | 206,519 | |
Retail Opportunity Investments Corp. (b) | | | 46,826 | | | | 1,014,719 | |
Rexford Industrial Realty, Inc. | | | 31,246 | | | | 658,978 | |
RLJ Lodging Trust | | | 58,062 | | | | 1,245,430 | |
Rouse Properties, Inc. | | | 18,643 | | | | 340,235 | |
Ryman Hospitality Properties, Inc. | | | 20,440 | | | | 1,035,286 | |
Sabra Health Care REIT, Inc. | | | 33,240 | | | | 685,907 | |
Saul Centers, Inc. | | | 4,228 | | | | 260,910 | |
Select Income REIT | | | 31,114 | | | | 808,653 | |
Seritage Growth Properties - Class A (b) | | | 13,408 | | | | 668,255 | |
Silver Bay Realty Trust Corp. | | | 16,953 | | | | 288,710 | |
STAG Industrial, Inc. | | | 33,732 | | | | 803,159 | |
Summit Hotel Properties, Inc. | | | 40,984 | | | | 542,628 | |
|
Real Estate Investment Trusts—(Continued) | |
Sunstone Hotel Investors, Inc. | | | 105,917 | | | | 1,278,418 | |
Terreno Realty Corp. | | | 20,992 | | | | 543,063 | |
Tier REIT, Inc. | | | 27,543 | | | | 422,234 | |
UMH Properties, Inc. (b) | | | 11,462 | | | | 128,948 | |
United Development Funding IV (b) (c) (e) | | | 14,302 | | | | 45,766 | |
Universal Health Realty Income Trust (b) | | | 6,109 | | | | 349,313 | |
Urban Edge Properties (b) | | | 43,765 | | | | 1,306,823 | |
Urstadt Biddle Properties, Inc. - Class A | | | 13,207 | | | | 327,269 | |
Washington Real Estate Investment Trust | | | 34,947 | | | | 1,099,433 | |
Western Asset Mortgage Capital Corp. (b) | | | 20,929 | | | | 196,523 | |
Whitestone REIT (b) | | | 16,717 | | | | 252,092 | |
WP Glimcher, Inc. (b) | | | 90,826 | | | | 1,016,343 | |
Xenia Hotels & Resorts, Inc. (b) | | | 53,296 | | | | 894,307 | |
| | | | | | | | |
| | | | | | | 74,720,627 | |
| | | | | | | | |
|
Real Estate Management & Development—0.5% | |
Alexander & Baldwin, Inc. | | | 22,995 | | | | 831,039 | |
Altisource Portfolio Solutions S.A. (a) (b) | | | 6,754 | | | | 188,031 | |
Consolidated-Tomoka Land Co. (b) | | | 2,461 | | | | 116,824 | |
Forestar Group, Inc. (a) (b) | | | 17,933 | | | | 213,223 | |
FRP Holdings, Inc. (a) (b) | | | 3,389 | | | | 116,920 | |
HFF, Inc. - Class A | | | 17,641 | | | | 509,472 | |
Kennedy-Wilson Holdings, Inc. (b) | | | 43,109 | | | | 817,347 | |
Marcus & Millichap, Inc. (a) | | | 6,463 | | | | 164,225 | |
RE/MAX Holdings, Inc. - Class A | | | 8,877 | | | | 357,388 | |
RMR Group, Inc. (The) - Class A | | | 3,481 | | | | 107,807 | |
St. Joe Co. (The) (a) (b) | | | 25,487 | | | | 451,630 | |
Tejon Ranch Co. (a) | | | 7,566 | | | | 178,860 | |
| | | | | | | | |
| | | | | | | 4,052,766 | |
| | | | | | | | |
| | |
Road & Rail—0.5% | | | | | | | | |
ArcBest Corp. | | | 12,815 | | | | 208,244 | |
Celadon Group, Inc. | | | 13,029 | | | | 106,447 | |
Covenant Transportation Group, Inc. - Class A (a) | | | 5,776 | | | | 104,372 | |
Heartland Express, Inc. | | | 22,410 | | | | 389,710 | |
Knight Transportation, Inc. (b) | | | 32,744 | | | | 870,336 | |
Marten Transport, Ltd. | | | 11,626 | | | | 230,195 | |
Roadrunner Transportation Systems, Inc. (a) | | | 13,855 | | | | 103,358 | |
Saia, Inc. (a) | | | 11,835 | | | | 297,532 | |
Swift Transportation Co. (a) (b) | | | 41,359 | | | | 637,342 | |
USA Truck, Inc. (a) | | | 4,895 | | | | 85,711 | |
Werner Enterprises, Inc. (b) | | | 22,043 | | | | 506,328 | |
YRC Worldwide, Inc. (a) (b) | | | 14,785 | | | | 130,108 | |
| | | | | | | | |
| | | | | | | 3,669,683 | |
| | | | | | | | |
|
Semiconductors & Semiconductor Equipment—3.2% | |
Acacia Communications, Inc. (a) (b) | | | 4,309 | | | | 172,101 | |
Advanced Energy Industries, Inc. (a) | | | 19,555 | | | | 742,308 | |
Advanced Micro Devices, Inc. (a) | | | 317,768 | | | | 1,633,328 | |
Alpha & Omega Semiconductor, Ltd. (a) | | | 10,203 | | | | 142,128 | |
Ambarella, Inc. (a) (b) | | | 15,830 | | | | 804,322 | |
Amkor Technology, Inc. (a) | | | 56,069 | | | | 322,397 | |
Applied Micro Circuits Corp. (a) (b) | | | 37,494 | | | | 240,711 | |
Axcelis Technologies, Inc. (a) | | | 55,739 | | | | 149,938 | |
Brooks Automation, Inc. | | | 32,611 | | | | 365,895 | |
See accompanying notes to financial statements.
MSF-17
Metropolitan Series Fund
Russell 2000 Index Portfolio
Schedule of Investments as of June 30, 2016 (Unaudited)
Common Stocks—(Continued)
| | | | | | | | |
| Security Description | | Shares | | | Value | |
|
Semiconductors & Semiconductor Equipment—(Continued) | |
Cabot Microelectronics Corp. | | | 11,541 | | | $ | 488,646 | |
Cavium, Inc. (a) (b) | | | 27,344 | | | | 1,055,478 | |
Ceva, Inc. (a) | | | 9,018 | | | | 245,019 | |
Cirrus Logic, Inc. (a) | | | 30,584 | | | | 1,186,353 | |
Cohu, Inc. | | | 11,848 | | | | 128,551 | |
Diodes, Inc. (a) | | | 18,315 | | | | 344,139 | |
DSP Group, Inc. (a) | | | 11,248 | | | | 119,341 | |
Entegris, Inc. (a) | | | 70,382 | | | | 1,018,428 | |
Exar Corp. (a) (b) (d) | | | 20,123 | | | | 161,990 | |
Fairchild Semiconductor International, Inc. (a) | | | 56,225 | | | | 1,116,066 | |
FormFactor, Inc. (a) (d) | | | 31,704 | | | | 285,015 | |
Inphi Corp. (a) | | | 19,424 | | | | 622,151 | |
Integrated Device Technology, Inc. (a) | | | 64,575 | | | | 1,299,895 | |
Intersil Corp. - Class A | | | 65,364 | | | | 885,029 | |
IXYS Corp. | | | 13,771 | | | | 141,153 | |
Lattice Semiconductor Corp. (a) (b) | | | 55,774 | | | | 298,391 | |
M/A-COM Technology Solutions Holdings,
Inc. (a) (b) | | | 10,997 | | | | 362,681 | |
MaxLinear, Inc. - Class A (a) | | | 26,699 | | | | 480,048 | |
Microsemi Corp. (a) | | | 55,165 | | | | 1,802,792 | |
MKS Instruments, Inc. | | | 25,868 | | | | 1,113,876 | |
Monolithic Power Systems, Inc. (b) | | | 18,931 | | | | 1,293,366 | |
Nanometrics, Inc. (a) | | | 12,771 | | | | 265,509 | |
NeoPhotonics Corp. (a) (b) | | | 14,422 | | | | 137,442 | |
NVE Corp. (b) | | | 2,605 | | | | 152,783 | |
PDF Solutions, Inc. (a) | | | 13,631 | | | | 190,698 | |
Photronics, Inc. (a) | | | 30,362 | | | | 270,525 | |
Power Integrations, Inc. | | | 13,771 | | | | 689,514 | |
Rambus, Inc. (a) (b) | | | 56,543 | | | | 683,039 | |
Rudolph Technologies, Inc. (a) (b) | | | 18,288 | | | | 284,013 | |
Semtech Corp. (a) | | | 33,156 | | | | 791,102 | |
Sigma Designs, Inc. (a) | | | 16,965 | | | | 109,085 | |
Silicon Laboratories, Inc. (a) | | | 19,814 | | | | 965,734 | |
Synaptics, Inc. (a) (b) | | | 17,366 | | | | 933,423 | |
Tessera Technologies, Inc. (b) | | | 24,436 | | | | 748,719 | |
Ultra Clean Holdings, Inc. (a) | | | 16,793 | | | | 95,552 | |
Ultratech, Inc. (a) | | | 13,618 | | | | 312,805 | |
Veeco Instruments, Inc. (a) (b) | | | 20,425 | | | | 338,238 | |
Xcerra Corp. (a) | | | 26,473 | | | | 152,220 | |
| | | | | | | | |
| | | | | | | 26,141,937 | |
| | | | | | | | |
| | |
Software—4.0% | | | | | | | | |
A10 Networks, Inc. (a) (b) | | | 17,081 | | | | 110,514 | |
ACI Worldwide, Inc. (a) | | | 58,316 | | | | 1,137,745 | |
American Software, Inc. - Class A (b) | | | 12,761 | | | | 133,735 | |
Aspen Technology, Inc. (a) (b) (d) | | | 41,625 | | | | 1,674,990 | |
AVG Technologies NV (a) | | | 19,150 | | | | 363,659 | |
Barracuda Networks, Inc. (a) | | | 11,138 | | | | 168,629 | |
Blackbaud, Inc. | | | 22,367 | | | | 1,518,719 | |
Bottomline Technologies de, Inc. (a) | | | 19,170 | | | | 412,730 | |
BroadSoft, Inc. (a) (b) | | | 14,701 | | | | 603,182 | |
Callidus Software, Inc. (a) | | | 28,634 | | | | 572,107 | |
CommVault Systems, Inc. (a) | | | 18,850 | | | | 814,132 | |
Digimarc Corp. (a) (b) | | | 3,943 | | | | 126,018 | |
Ebix, Inc. (b) | | | 12,915 | | | | 618,629 | |
Ellie Mae, Inc. (a) (b) | | | 14,041 | | | | 1,286,858 | |
| | |
Software—(Continued) | | | | | | | | |
EPIQ Systems, Inc. (b) | | | 15,846 | | | | 231,352 | |
Exa Corp. (a) | | | 7,285 | | | | 105,268 | |
Fair Isaac Corp. | | | 15,124 | | | | 1,709,163 | |
FleetMatics Group plc (a) | | | 18,434 | | | | 798,745 | |
Gigamon, Inc. (a) | | | 15,887 | | | | 594,015 | |
Globant S.A. (a) (b) | | | 12,602 | | | | 495,889 | |
Glu Mobile, Inc. (a) (b) | | | 56,662 | | | | 124,656 | |
HubSpot, Inc. (a) | | | 14,089 | | | | 611,744 | |
Imperva, Inc. (a) (b) | | | 14,007 | | | | 602,441 | |
Infoblox, Inc. (a) (b) | | | 27,141 | | | | 509,165 | |
Interactive Intelligence Group, Inc. (a) (b) | | | 7,901 | | | | 323,862 | |
Jive Software, Inc. (a) (b) | | | 29,952 | | | | 112,620 | |
Mentor Graphics Corp. | | | 52,058 | | | | 1,106,753 | |
MicroStrategy, Inc. - Class A (a) | | | 4,589 | | | | 803,167 | |
Mitek Systems, Inc. (a) | | | 15,344 | | | | 109,096 | |
Model N, Inc. (a) (b) | | | 10,589 | | | | 141,363 | |
Monotype Imaging Holdings, Inc. | | | 18,592 | | | | 457,921 | |
Paycom Software, Inc. (a) (b) | | | 21,414 | | | | 925,299 | |
Paylocity Holding Corp. (a) (b) | | | 10,675 | | | | 461,160 | |
Pegasystems, Inc. | | | 16,572 | | | | 446,615 | |
Progress Software Corp. (a) | | | 23,712 | | | | 651,132 | |
Proofpoint, Inc. (a) (b) | | | 19,783 | | | | 1,248,109 | |
PROS Holdings, Inc. (a) (b) | | | 10,832 | | | | 188,802 | |
QAD, Inc. - Class A | | | 5,009 | | | | 96,523 | |
Qlik Technologies, Inc. (a) | | | 45,552 | | | | 1,347,428 | |
Qualys, Inc. (a) | | | 13,378 | | | | 398,798 | |
Rapid7, Inc. (a) | | | 10,207 | | | | 128,404 | |
RealPage, Inc. (a) (b) | | | 27,401 | | | | 611,864 | |
RingCentral, Inc. - Class A (a) | | | 28,664 | | | | 565,254 | |
Rovi Corp. (a) (b) | | | 41,187 | | | | 644,165 | |
Rubicon Project, Inc. (The) (a) | | | 18,549 | | | | 253,194 | |
Sapiens International Corp. NV (b) | | | 11,949 | | | | 139,923 | |
Silver Spring Networks, Inc. (a) | | | 17,691 | | | | 214,946 | |
Synchronoss Technologies, Inc. (a) (b) | | | 19,823 | | | | 631,561 | |
Take-Two Interactive Software, Inc. (a) (b) | | | 39,881 | | | | 1,512,288 | |
Tangoe, Inc. (a) (b) | | | 19,395 | | | | 149,729 | |
TiVo, Inc. (a) | | | 45,871 | | | | 454,123 | |
TubeMogul, Inc. (a) (b) | | | 8,244 | | | | 98,104 | |
Varonis Systems, Inc. (a) | | | 5,014 | | | | 120,436 | |
VASCO Data Security International, Inc. (a) | | | 15,031 | | | | 246,358 | |
Verint Systems, Inc. (a) | | | 28,969 | | | | 959,743 | |
VirnetX Holding Corp. (a) (b) | | | 24,130 | | | | 96,520 | |
Workiva, Inc. (a) | | | 11,206 | | | | 153,074 | |
Xura, Inc. (a) | | | 11,872 | | | | 290,033 | |
Zendesk, Inc. (a) (b) | | | 39,450 | | | | 1,040,691 | |
Zix Corp. (a) | | | 28,558 | | | | 107,093 | |
| | | | | | | | |
| | | | | | | 32,560,236 | |
| | | | | | | | |
| | |
Specialty Retail—2.6% | | | | | | | | |
Aaron’s, Inc. | | | 32,279 | | | | 706,587 | |
Abercrombie & Fitch Co. - Class A | | | 32,535 | | | | 579,448 | |
America’s Car-Mart, Inc. (a) (b) | | | 3,580 | | | | 101,099 | |
American Eagle Outfitters, Inc. (b) | | | 80,529 | | | | 1,282,827 | |
Asbury Automotive Group, Inc. (a) (b) | | | 10,689 | | | | 563,738 | |
Ascena Retail Group, Inc. (a) (b) | | | 79,891 | | | | 558,438 | |
Barnes & Noble Education, Inc. (a) | | | 20,589 | | | | 208,978 | |
See accompanying notes to financial statements.
MSF-18
Metropolitan Series Fund
Russell 2000 Index Portfolio
Schedule of Investments as of June 30, 2016 (Unaudited)
Common Stocks—(Continued)
| | | | | | | | |
| Security Description | | Shares | | | Value | |
| | |
Specialty Retail—(Continued) | | | | | | | | |
Barnes & Noble, Inc. (b) | | | 31,637 | | | $ | 359,080 | |
Buckle, Inc. (The) (b) | | | 14,188 | | | | 368,746 | |
Build-A-Bear Workshop, Inc. (a) | | | 7,101 | | | | 95,295 | |
Caleres, Inc. | | | 20,189 | | | | 488,776 | |
Cato Corp. (The) - Class A | | | 13,930 | | | | 525,440 | |
Chico’s FAS, Inc. | | | 66,717 | | | | 714,539 | |
Children’s Place, Inc. (The) (b) | | | 8,817 | | | | 706,947 | |
Citi Trends, Inc. | | | 8,551 | | | | 132,797 | |
DSW, Inc. - Class A (b) | | | 33,068 | | | | 700,380 | |
Express, Inc. (a) | | | 37,753 | | | | 547,796 | |
Finish Line, Inc. (The) - Class A | | | 20,123 | | | | 406,283 | |
Five Below, Inc. (a) (b) | | | 25,874 | | | | 1,200,812 | |
Francesca’s Holdings Corp. (a) | | | 22,196 | | | | 245,266 | |
Genesco, Inc. (a) (b) | | | 10,535 | | | | 677,506 | |
GNC Holdings, Inc. - Class A (b) | | | 33,443 | | | | 812,331 | |
Group 1 Automotive, Inc. (b) | | | 10,876 | | | | 536,839 | |
Guess?, Inc. (b) | | | 30,485 | | | | 458,799 | |
Haverty Furniture Cos., Inc. | | | 10,391 | | | | 187,350 | |
Hibbett Sports, Inc. (a) (b) | | | 10,209 | | | | 355,171 | |
Kirkland’s, Inc. (a) | | | 9,307 | | | | 136,627 | |
Lithia Motors, Inc. - Class A (b) | | | 11,630 | | | | 826,544 | |
Lumber Liquidators Holdings, Inc. (a) | | | 13,856 | | | | 213,660 | |
MarineMax, Inc. (a) | | | 12,696 | | | | 215,451 | |
Mattress Firm Holding Corp. (a) (b) | | | 9,630 | | | | 323,087 | |
Monro Muffler Brake, Inc. (b) | | | 15,070 | | | | 957,849 | |
Office Depot, Inc. (a) | | | 270,619 | | | | 895,749 | |
Outerwall, Inc. (b) | | | 8,102 | | | | 340,284 | |
Party City Holdco, Inc. (a) (b) | | | 13,656 | | | | 189,955 | |
Pier 1 Imports, Inc. (b) | | | 47,023 | | | | 241,698 | |
Rent-A-Center, Inc. (b) | | | 29,515 | | | | 362,444 | |
Restoration Hardware Holdings, Inc. (a) (b) | | | 19,129 | | | | 548,620 | |
Select Comfort Corp. (a) (b) | | | 24,198 | | | | 517,353 | |
Shoe Carnival, Inc. | | | 8,227 | | | | 206,169 | |
Sonic Automotive, Inc. - Class A (b) | | | 14,688 | | | | 251,312 | |
Sportsman’s Warehouse Holdings, Inc. (a) | | | 14,062 | | | | 113,340 | |
Stein Mart, Inc. | | | 15,504 | | | | 119,691 | |
Tailored Brands, Inc. | | | 22,434 | | | | 284,014 | |
Tile Shop Holdings, Inc. (a) (b) | | | 14,624 | | | | 290,725 | |
Vitamin Shoppe, Inc. (a) (b) | | | 12,621 | | | | 385,824 | |
Winmark Corp. | | | 1,140 | | | | 113,624 | |
Zumiez, Inc. (a) (b) | | | 10,452 | | | | 149,568 | |
| | | | | | | | |
| | | | | | | 21,204,856 | |
| | | | | | | | |
|
Technology Hardware, Storage & Peripherals—0.6% | |
3D Systems Corp. (a) (b) | | | 52,340 | | | | 716,534 | |
Avid Technology, Inc. (a) | | | 17,191 | | | | 99,880 | |
Cray, Inc. (a) (b) | | | 19,290 | | | | 577,157 | |
Diebold, Inc. (b) | | | 30,087 | | | | 747,060 | |
Eastman Kodak Co. (a) | | | 9,487 | | | | 152,551 | |
Electronics for Imaging, Inc. (a) (b) | | | 22,186 | | | | 954,885 | |
Immersion Corp. (a) (b) | | | 15,004 | | | | 110,129 | |
Nimble Storage, Inc. (a) (b) | | | 31,351 | | | | 249,554 | |
Pure Storage, Inc. - Class A (a) (b) | | | 30,203 | | | | 329,213 | |
Silicon Graphics International Corp. (a) (b) | | | 19,073 | | | | 95,937 | |
Stratasys, Ltd. (a) | | | 23,667 | | | | 541,738 | |
Super Micro Computer, Inc. (a) | | | 17,788 | | | | 442,032 | |
| | | | | | | | |
| | | | | | | 5,016,670 | |
| | | | | | | | |
|
Textiles, Apparel & Luxury Goods—1.0% | |
Columbia Sportswear Co. (b) | | | 13,362 | | | | 768,850 | |
Crocs, Inc. (a) (b) (d) | | | 36,244 | | | | 408,832 | |
Culp, Inc. | | | 4,697 | | | | 129,778 | |
Deckers Outdoor Corp. (a) (b) | | | 16,464 | | | | 947,009 | |
Fossil Group, Inc. (a) (b) | | | 20,656 | | | | 589,316 | |
G-III Apparel Group, Ltd. (a) (b) | | | 21,024 | | | | 961,217 | |
Iconix Brand Group, Inc. (a) (b) | | | 23,416 | | | | 158,292 | |
Movado Group, Inc. | | | 7,984 | | | | 173,093 | |
Oxford Industries, Inc. | | | 7,657 | | | | 433,539 | |
Perry Ellis International, Inc. (a) | | | 7,318 | | | | 147,238 | |
Sequential Brands Group, Inc. (a) | | | 17,180 | | | | 137,097 | |
Steven Madden, Ltd. (a) | | | 30,077 | | | | 1,028,032 | |
Tumi Holdings, Inc. (a) | | | 26,950 | | | | 720,643 | |
Unifi, Inc. (a) | | | 7,892 | | | | 214,899 | |
Vera Bradley, Inc. (a) (b) | | | 10,263 | | | | 145,427 | |
Wolverine World Wide, Inc. | | | 49,486 | | | | 1,005,556 | |
| | | | | | | | |
| | | | | | | 7,968,818 | |
| | | | | | | | |
|
Thrifts & Mortgage Finance—1.9% | |
Astoria Financial Corp. | | | 45,250 | | | | 693,682 | |
Bank Mutual Corp. | | | 22,673 | | | | 174,129 | |
BankFinancial Corp. | | | 9,195 | | | | 110,248 | |
Beneficial Bancorp, Inc. (a) | | | 38,821 | | | | 493,803 | |
BofI Holding, Inc. (a) (b) | | | 28,164 | | | | 498,784 | |
BSB Bancorp, Inc. (a) | | | 4,035 | | | | 91,393 | |
Capitol Federal Financial, Inc. | | | 66,206 | | | | 923,574 | |
Clifton Bancorp, Inc. (b) | | | 13,646 | | | | 205,645 | |
Dime Community Bancshares, Inc. | | | 15,501 | | | | 263,672 | |
Essent Group, Ltd. (a) | | | 36,651 | | | | 799,358 | |
EverBank Financial Corp. | | | 50,515 | | | | 750,653 | |
Federal Agricultural Mortgage Corp. - Class C | | | 5,480 | | | | 190,814 | |
First Defiance Financial Corp. | | | 5,038 | | | | 195,726 | |
Flagstar Bancorp, Inc. (a) | | | 9,133 | | | | 222,937 | |
Fox Chase Bancorp, Inc. (b) | | | 5,775 | | | | 117,464 | |
HomeStreet, Inc. (a) | | | 10,511 | | | | 209,379 | |
Kearny Financial Corp. | | | 43,899 | | | | 552,249 | |
LendingTree, Inc. (a) (b) | | | 2,772 | | | | 244,851 | |
Meridian Bancorp, Inc. | | | 26,006 | | | | 384,369 | |
Meta Financial Group, Inc. | | | 4,218 | | | | 214,949 | |
MGIC Investment Corp. (a) (b) | | | 167,352 | | | | 995,744 | |
Nationstar Mortgage Holdings, Inc. (a) (b) | | | 18,633 | | | | 209,808 | |
NMI Holdings, Inc. - Class A (a) | | | 20,655 | | | | 113,189 | |
Northfield Bancorp, Inc. | | | 25,455 | | | | 377,498 | |
Northwest Bancshares, Inc. | | | 47,880 | | | | 710,060 | |
OceanFirst Financial Corp. | | | 10,121 | | | | 183,899 | |
Oritani Financial Corp. | | | 22,475 | | | | 359,375 | |
PennyMac Financial Services, Inc. - Class A (a) | | | 7,528 | | | | 94,025 | |
PHH Corp. (a) | | | 24,884 | | | | 331,455 | |
Provident Financial Services, Inc. | | | 33,611 | | | | 660,120 | |
Radian Group, Inc. (b) | | | 105,091 | | | | 1,095,048 | |
Territorial Bancorp, Inc. | | | 4,282 | | | | 113,345 | |
TrustCo Bank Corp. | | | 45,137 | | | | 289,328 | |
United Community Financial Corp. | | | 24,319 | | | | 147,860 | |
United Financial Bancorp, Inc. | | | 27,799 | | | | 360,831 | |
Walker & Dunlop, Inc. (a) | | | 12,545 | | | | 285,775 | |
Washington Federal, Inc. | | | 43,725 | | | | 1,060,768 | |
See accompanying notes to financial statements.
MSF-19
Metropolitan Series Fund
Russell 2000 Index Portfolio
Schedule of Investments as of June 30, 2016 (Unaudited)
Common Stocks—(Continued)
| | | | | | | | |
| Security Description | |
Shares | | | Value | |
|
Thrifts & Mortgage Finance—(Continued) | |
Waterstone Financial, Inc. | | | 16,341 | | | $ | 250,508 | |
WSFS Financial Corp. | | | 14,223 | | | | 457,838 | |
| | | | | | | | |
| | | | | | | 15,434,153 | |
| | | | | | | | |
| | |
Tobacco—0.2% | | | | | | | | |
Universal Corp. (b) | | | 10,350 | | | | 597,609 | |
Vector Group, Ltd. (b) | | | 42,779 | | | | 959,105 | |
| | | | | | | | |
| | | | | | | 1,556,714 | |
| | | | | | | | |
|
Trading Companies & Distributors—1.0% | |
Aircastle, Ltd. (b) | | | 23,576 | | | | 461,147 | |
Applied Industrial Technologies, Inc. | | | 17,771 | | | | 802,183 | |
Beacon Roofing Supply, Inc. (a) | | | 28,993 | | | | 1,318,312 | |
BMC Stock Holdings, Inc. (a) (b) | | | 26,965 | | | | 480,516 | |
DXP Enterprises, Inc. (a) (b) | | | 6,978 | | | | 104,182 | |
GATX Corp. | | | 19,980 | | | | 878,521 | |
H&E Equipment Services, Inc. | | | 15,412 | | | | 293,290 | |
Kaman Corp. (b) | | | 13,043 | | | | 554,588 | |
MRC Global, Inc. (a) | | | 47,898 | | | | 680,631 | |
NOW, Inc. (a) (b) | | | 52,731 | | | | 956,540 | |
Rush Enterprises, Inc. - Class A (a) | | | 16,786 | | | | 361,738 | |
SiteOne Landscape Supply, Inc. (a) | | | 7,677 | | | | 260,941 | |
TAL International Group, Inc. | | | 16,976 | | | | 227,648 | |
Textainer Group Holdings, Ltd. (b) | | | 10,746 | | | | 119,710 | |
Titan Machinery, Inc. (a) | | | 9,593 | | | | 106,962 | |
Univar, Inc. (a) (b) | | | 21,106 | | | | 399,115 | |
Veritiv Corp. (a) (b) | | | 3,938 | | | | 147,990 | |
| | | | | | | | |
| | | | | | | 8,154,014 | |
| | | | | | | | |
|
Transportation Infrastructure—0.1% | |
Wesco Aircraft Holdings, Inc. (a) (b) | | | 29,211 | | | | 392,012 | |
| | | | | | | | |
| | |
Water Utilities—0.4% | | | | | | | | |
American States Water Co. | | | 19,053 | | | | 834,903 | |
Artesian Resources Corp. - Class A (b) | | | 3,766 | | | | 127,743 | |
California Water Service Group (b) | | | 22,665 | | | | 791,688 | |
Connecticut Water Service, Inc. | | | 4,871 | | | | 273,750 | |
Consolidated Water Co., Ltd. | | | 7,253 | | | | 94,724 | |
Middlesex Water Co. | | | 7,497 | | | | 325,220 | |
SJW Corp. | | | 7,394 | | | | 291,176 | |
York Water Co. (The) (b) | | | 6,695 | | | | 214,508 | |
| | | | | | | | |
| | | | | | | 2,953,712 | |
| | | | | | | | |
|
Wireless Telecommunication Services—0.2% | |
Boingo Wireless, Inc. (a) (b) | | | 17,390 | | | | 155,119 | |
Shenandoah Telecommunications Co. | | | 22,906 | | | | 894,708 | |
Spok Holdings, Inc. | | | 11,723 | | | | 224,671 | |
| | | | | | | | |
| | | | | | | 1,274,498 | |
| | | | | | | | |
Total Common Stocks
(Cost $646,176,781) | | | | | | | 787,666,722 | |
| | | | | | | | |
| Mutual Fund—0.2% | | | | | | | | |
| Security Description | | Shares/
Principal
Amount* | | | Value | |
|
Investment Company Security—0.2% | |
iShares Russell 2000 Index Fund (b)
(Cost $1,811,447) | | | 16,100 | | | | 1,851,017 | |
| | | | | | | | |
| | |
| Rights—0.0% | | | | | | | | |
| | |
Machinery—0.0% | | | | | | | | |
Gerber Scientific, Inc. (a) (b) (c) | | | 14,024 | | | | 0 | |
| | | | | | | | |
|
Wireless Telecommunication Services—0.0% | |
Leap Wireless International, Inc., Expires 03/13/17 (a) (c) (e) | | | 27,485 | | | | 69,262 | |
| | | | | | | | |
Total Rights
(Cost $69,262) | | | | | | | 69,262 | |
| | | | | | | | |
|
| Short-Term Investments—27.1% | |
| | |
Discount Notes—2.4% | | | | | | | | |
Federal Home Loan Bank | | | | | | | | |
0.232%, 07/21/16 (f) | | | 725,000 | | | | 724,903 | |
0.295%, 08/03/16 (f) | | | 3,300,000 | | | | 3,299,092 | |
0.316%, 07/14/16 (f) | | | 275,000 | | | | 274,967 | |
0.318%, 08/19/16 (f) | | | 400,000 | | | | 399,826 | |
0.350%, 08/05/16 (f) | | | 12,125,000 | | | | 12,120,815 | |
0.437%, 10/12/16 (f) | | | 1,125,000 | | | | 1,123,600 | |
0.457%, 08/17/16 (f) | | | 1,650,000 | | | | 1,649,009 | |
| | | | | | | | |
| | | | | | | 19,592,212 | |
| | | | | | | | |
| | |
Mutual Fund—24.4% | | | | | | | | |
State Street Navigator Securities Lending MET Portfolio (g) | | | 198,383,682 | | | | 198,383,682 | |
| | | | | | | | |
| | |
U.S. Treasury—0.3% | | | | | | | | |
U.S. Treasury Bills | | | | | | | | |
0.241%, 09/29/16 (f) | | | 1,925,000 | | | | 1,923,845 | |
| | | | | | | | |
Total Short-Term Investments
(Cost $219,899,739) | | | | | | | 219,899,739 | |
| | | | | | | | |
Total Investments—124.3%
(Cost $867,957,229) (h) | | | | | | | 1,009,486,740 | |
Other assets and liabilities
(net)—(24.3)% | | | | | | | (197,179,165 | ) |
| | | | | | | | |
| Net Assets—100.0% | | | | | | $ | 812,307,575 | |
| | | | | | | | |
| * | Principal amount stated in U.S. dollars unless otherwise noted. |
| (a) | Non-income producing security. |
| (b) | All or a portion of the security was held on loan. As of June 30, 2016, the market value of securities loaned was $214,756,470 and the collateral received consisted of cash in the amount of $198,383,682 and non-cash collateral with a value of $20,954,795. The cash collateral is invested in a money market fund managed by an affiliate of |
See accompanying notes to financial statements.
MSF-20
Metropolitan Series Fund
Russell 2000 Index Portfolio
Schedule of Investments as of June 30, 2016 (Unaudited)
| | the custodian. The non-cash collateral received consists primarily of government securities and bank letters of credit, and is held for the benefit of the Portfolio at the Portfolio’s custodian. The Portfolio cannot repledge or resell this collateral. As such, this collateral is excluded from the Statement of Assets and Liabilities. |
| (c) | Illiquid security. As of June 30, 2016, these securities represent 0.0% of net assets. |
| (d) | All or a portion of the security was pledged as collateral against open futures contracts. As of June 30, 2016, the market value of securities pledged was $2,530,614. |
| (e) | Security was valued in good faith under procedures approved by the Board of Trustees. As of June 30, 2016, these securities represent less than 0.05% of net assets. |
| (f) | The rate shown represents current yield to maturity. |
| (g) | Represents investment of cash collateral received from securities on loan as of June 30, 2016. |
| (h) | As of June 30, 2016, the aggregate cost of investments was $867,957,229. The aggregate unrealized appreciation and depreciation of investments were $208,408,597 and $(66,879,086), respectively, resulting in net unrealized appreciation of $141,529,511. |
Futures Contracts
| | | | | | | | | | | | | | | | | | | | |
Futures Contracts—Long | | Expiration
Date | | | Number of
Contracts | | | Notional
Amount | | | Unrealized
Depreciation | |
Russell 2000 Mini Index Futures | | | 09/16/16 | | | | 197 | | | | USD | | | | 23,317,296 | | | $ | (713,516 | ) |
| | | | | | | | | | | | | | | | | | | | |
| (USD)— | United States Dollar |
Fair Value Hierarchy
Accounting principles generally accepted in the United States of America (“GAAP”) define fair market value as the price that the Portfolio would receive to sell an asset or pay to transfer a liability in an orderly transaction between market participants at the measurement date. It establishes a fair value hierarchy that prioritizes inputs to valuation methods and requires disclosure of the fair value hierarchy, separately for each major category of assets and liabilities, that segregates fair value measurements into three levels. Levels 1, 2 and 3 of the fair value hierarchy are defined as follows:
Level 1 - unadjusted quoted prices in active markets for identical investments
Level 2 - other significant observable inputs (including, but not limited to, quoted prices for similar assets or liabilities in markets that are either active or inactive; inputs other than quoted prices that are observable such as interest rates, yield curves, volatilities, prepayment speeds, loss severities, credit risks, default rates, or other market corroborated inputs)
Level 3 - significant unobservable inputs based on the best information available in the circumstances, to the extent observable inputs are unavailable (including the Portfolio’s own assumptions used in determining the fair value of investments and derivative financial instruments)
The inputs or methodologies used for valuing investments are not necessarily an indication of the risk associated with investing in them. Changes to the inputs or methodologies used may result in transfers between levels, which will be recognized as of the beginning of the reporting period. Information on transfers between Level 1 and Level 2, if any, will be disclosed following the fair value hierarchy table below. A reconciliation of Level 3 securities, if any, will also be disclosed following the fair value hierarchy table. For more information about the Portfolio’s policy regarding the valuation of investments, please refer to the Notes to Financial Statements.
The following table summarizes the fair value hierarchy of the Portfolio’s investments as of June 30, 2016:
| | | | | | | | | | | | | | | | |
| Description | | Level 1 | | | Level 2 | | | Level 3 | | | Total | |
| Common Stocks | | | | | | | | | | | | | | | | |
Aerospace & Defense | | $ | 11,813,812 | | | $ | — | | | $ | — | | | $ | 11,813,812 | |
Air Freight & Logistics | | | 3,884,289 | | | | — | | | | — | | | | 3,884,289 | |
Airlines | | | 3,224,108 | | | | — | | | | — | | | | 3,224,108 | |
Auto Components | | | 8,489,953 | | | | — | | | | — | | | | 8,489,953 | |
Automobiles | | | 280,930 | | | | — | | | | — | | | | 280,930 | |
Banks | | | 76,053,798 | | | | — | | | | — | | | | 76,053,798 | |
Beverages | | | 1,790,134 | | | | — | | | | — | | | | 1,790,134 | |
Biotechnology | | | 35,766,526 | | | | — | | | | — | | | | 35,766,526 | |
Building Products | | | 9,687,025 | | | | — | | | | — | | | | 9,687,025 | |
Capital Markets | | | 9,859,075 | | | | — | | | | — | | | | 9,859,075 | |
Chemicals | | | 19,190,169 | | | | — | | | | — | | | | 19,190,169 | |
Commercial Services & Supplies | | | 18,867,022 | | | | — | | | | — | | | | 18,867,022 | |
Communications Equipment | | | 12,967,750 | | | | — | | | | — | | | | 12,967,750 | |
Construction & Engineering | | | 6,834,144 | | | | — | | | | — | | | | 6,834,144 | |
See accompanying notes to financial statements.
MSF-21
Metropolitan Series Fund
Russell 2000 Index Portfolio
Schedule of Investments as of June 30, 2016 (Unaudited)
Fair Value Hierarchy—(Continued)
| | | | | | | | | | | | | | | | |
| Description | | Level 1 | | | Level 2 | | | Level 3 | | | Total | |
Construction Materials | | $ | 1,683,494 | | | $ | — | | | $ | — | | | $ | 1,683,494 | |
Consumer Finance | | | 4,112,698 | | | | — | | | | — | | | | 4,112,698 | |
Containers & Packaging | | | 1,230,681 | | | | — | | | | — | | | | 1,230,681 | |
Distributors | | | 1,071,969 | | | | — | | | | — | | | | 1,071,969 | |
Diversified Consumer Services | | | 7,640,642 | | | | — | | | | — | | | | 7,640,642 | |
Diversified Financial Services | | | 905,082 | | | | — | | | | — | | | | 905,082 | |
Diversified Telecommunication Services | | | 6,092,489 | | | | — | | | | — | | | | 6,092,489 | |
Electric Utilities | | | 10,032,596 | | | | — | | | | — | | | | 10,032,596 | |
Electrical Equipment | | | 5,145,755 | | | | — | | | | — | | | | 5,145,755 | |
Electronic Equipment, Instruments & Components | | | 21,392,638 | | | | — | | | | — | | | | 21,392,638 | |
Energy Equipment & Services | | | 8,313,348 | | | | — | | | | — | | | | 8,313,348 | |
Food & Staples Retailing | | | 4,974,702 | | | | — | | | | — | | | | 4,974,702 | |
Food Products | | | 11,626,834 | | | | — | | | | — | | | | 11,626,834 | |
Gas Utilities | | | 10,797,754 | | | | — | | | | — | | | | 10,797,754 | |
Health Care Equipment & Supplies | | | 26,022,136 | | | | — | | | | — | | | | 26,022,136 | |
Health Care Providers & Services | | | 20,364,135 | | | | — | | | | — | | | | 20,364,135 | |
Health Care Technology | | | 4,657,040 | | | | — | | | | — | | | | 4,657,040 | |
Hotels, Restaurants & Leisure | | | 25,888,490 | | | | — | | | | — | | | | 25,888,490 | |
Household Durables | | | 10,609,158 | | | | — | | | | — | | | | 10,609,158 | |
Household Products | | | 2,322,165 | | | | — | | | | — | | | | 2,322,165 | |
Independent Power and Renewable Electricity Producers | | | 5,006,395 | | | | — | | | | — | | | | 5,006,395 | |
Industrial Conglomerates | | | 353,383 | | | | — | | | | — | | | | 353,383 | |
Insurance | | | 18,350,204 | | | | — | | | | — | | | | 18,350,204 | |
Internet & Catalog Retail | | | 4,924,750 | | | | — | | | | — | | | | 4,924,750 | |
Internet Software & Services | | | 20,556,027 | | | | — | | | | — | | | | 20,556,027 | |
IT Services | | | 16,668,096 | | | | — | | | | — | | | | 16,668,096 | |
Leisure Products | | | 2,233,773 | | | | — | | | | — | | | | 2,233,773 | |
Life Sciences Tools & Services | | | 5,357,050 | | | | — | | | | — | | | | 5,357,050 | |
Machinery | | | 25,809,829 | | | | — | | | | — | | | | 25,809,829 | |
Marine | | | 756,959 | | | | — | | | | — | | | | 756,959 | |
Media | | | 14,784,509 | | | | — | | | | — | | | | 14,784,509 | |
Metals & Mining | | | 9,235,250 | | | | — | | | | — | | | | 9,235,250 | |
Multi-Utilities | | | 4,750,782 | | | | — | | | | — | | | | 4,750,782 | |
Multiline Retail | | | 1,901,024 | | | | — | | | | — | | | | 1,901,024 | |
Oil, Gas & Consumable Fuels | | | 15,728,373 | | | | — | | | | — | | | | 15,728,373 | |
Paper & Forest Products | | | 4,614,615 | | | | — | | | | — | | | | 4,614,615 | |
Personal Products | | | 2,313,597 | | | | — | | | | — | | | | 2,313,597 | |
Pharmaceuticals | | | 15,065,584 | | | | — | | | | — | | | | 15,065,584 | |
Professional Services | | | 10,563,285 | | | | — | | | | — | | | | 10,563,285 | |
Real Estate Investment Trusts | | | 74,674,861 | | | | — | | | | 45,766 | | | | 74,720,627 | |
Real Estate Management & Development | | | 4,052,766 | | | | — | | | | — | | | | 4,052,766 | |
Road & Rail | | | 3,669,683 | | | | — | | | | — | | | | 3,669,683 | |
Semiconductors & Semiconductor Equipment | | | 26,141,937 | | | | — | | | | — | | | | 26,141,937 | |
Software | | | 32,560,236 | | | | — | | | | — | | | | 32,560,236 | |
Specialty Retail | | | 21,204,856 | | | | — | | | | — | | | | 21,204,856 | |
Technology Hardware, Storage & Peripherals | | | 5,016,670 | | | | — | | | | — | | | | 5,016,670 | |
Textiles, Apparel & Luxury Goods | | | 7,968,818 | | | | — | | | | — | | | | 7,968,818 | |
Thrifts & Mortgage Finance | | | 15,434,153 | | | | — | | | | — | | | | 15,434,153 | |
Tobacco | | | 1,556,714 | | | | — | | | | — | | | | 1,556,714 | |
Trading Companies & Distributors | | | 8,154,014 | | | | — | | | | — | | | | 8,154,014 | |
Transportation Infrastructure | | | 392,012 | | | | — | | | | — | | | | 392,012 | |
Water Utilities | | | 2,953,712 | | | | — | | | | — | | | | 2,953,712 | |
Wireless Telecommunication Services | | | 1,274,498 | | | | — | | | | — | | | | 1,274,498 | |
Total Common Stocks | | | 787,620,956 | | | | — | | | | 45,766 | | | | 787,666,722 | |
Total Mutual Fund* | | | 1,851,017 | | | | — | | | | — | | | | 1,851,017 | |
Total Rights* | | | — | | | | — | | | | 69,262 | | | | 69,262 | |
See accompanying notes to financial statements.
MSF-22
Metropolitan Series Fund
Russell 2000 Index Portfolio
Schedule of Investments as of June 30, 2016 (Unaudited)
Fair Value Hierarchy—(Continued)
| | | | | | | | | | | | | | | | |
| Description | | Level 1 | | | Level 2 | | | Level 3 | | | Total | |
| Short-Term Investments | | | | | | | | | | | | | | | | |
Discount Notes | | $ | — | | | $ | 19,592,212 | | | $ | — | | | $ | 19,592,212 | |
Mutual Fund | | | 198,383,682 | | | | — | | | | — | | | | 198,383,682 | |
U.S. Treasury | | | — | | | | 1,923,845 | | | | — | | | | 1,923,845 | |
Total Short-Term Investments | | | 198,383,682 | | | | 21,516,057 | | | | — | | | | 219,899,739 | |
Total Investments | | $ | 987,855,655 | | | $ | 21,516,057 | | | $ | 115,028 | | | $ | 1,009,486,740 | |
| | | | | | | | | | | | | | | | | |
Collateral for Securities Loaned (Liability) | | $ | — | | | $ | (198,383,682 | ) | | $ | — | | | $ | (198,383,682 | ) |
| Futures Contracts | | | | | | | | | | | | | | | | |
Futures Contracts (Unrealized Depreciation) | | $ | (713,516 | ) | | $ | — | | | $ | — | | | $ | (713,516 | ) |
| * | See Schedule of Investments for additional detailed categorizations. |
Following is a reconciliation of Level 3 assets for which significant unobservable inputs were used to determine fair value:
| | | | | | | | | | | | | | | | | | | | |
Investments in Securities | | Balance as of
December 31,
2015 | | | Change in
Unrealized
Depreciation | | | Transfer
Into
Level 3 | | | Balance as of
June 30,
2016 | | | Change in Unrealized
Depreciation from
Investments Still Held at
June 30, 2016 | |
| Common Stock | | | | | | | | | | | | | | | | | | | | |
Real Estate Investment Trusts | | $ | — | | | $ | (111,556 | ) | | $ | 157,322 | | | $ | 45,766 | | | $ | (111,556 | ) |
| Rights | | | | | | | | | | | | | | | | | | | | |
Machinery | | | 0 | | | | 0 | | | | — | | | | 0 | | | | 0 | |
Wireless Telecommunication Services | | | 69,262 | | | | 0 | | | | — | | | | 69,262 | | | | 0 | |
| | | | | | | | | | | | | | | | | | | | |
Total | | $ | 69,262 | | | $ | (111,556 | ) | | $ | 157,322 | | | $ | 115,028 | | | $ | (111,556 | ) |
| | | | | | | | | | | | | | | | | | | | |
Common Stock in the amount of $157,322 was transferred into Level 3 due to a decline in market activity for significant observables which resulted in a lack of available market inputs to determine price.
See accompanying notes to financial statements.
MSF-23
Metropolitan Series Fund
Russell 2000 Index Portfolio
Statement of Assets and Liabilities
June 30, 2016 (Unaudited)
| | | | |
Assets | |
Investments at value (a) (b) | | $ | 1,009,486,740 | |
Cash | | | 1,402,335 | |
Receivable for: | | | | |
Investments sold | | | 976,719 | |
Fund shares sold | | | 104,329 | |
Dividends | | | 1,014,187 | |
Variation margin on futures contracts | | | 360,510 | |
Prepaid expenses | | | 5,246 | |
| | | | |
Total Assets | | | 1,013,350,066 | |
Liabilities | | | | |
Collateral for securities loaned | | | 198,383,682 | |
Payables for: | | | | |
Investments purchased | | | 955,092 | |
Fund shares redeemed | | | 1,103,221 | |
Accrued Expenses: | | | | |
Management fees | | | 165,875 | |
Distribution and service fees | | | 79,185 | |
Deferred trustees’ fees | | | 77,020 | |
Other expenses | | | 278,416 | |
| | | | |
Total Liabilities | | | 201,042,491 | |
| | | | |
Net Assets | | $ | 812,307,575 | |
| | | | |
Net Assets Consist of: | | | | |
Paid in surplus | | $ | 642,015,795 | |
Undistributed net investment income | | | 5,611,696 | |
Accumulated net realized gain | | | 23,864,089 | |
Unrealized appreciation on investments and futures contracts | | | 140,815,995 | |
| | | | |
Net Assets | | $ | 812,307,575 | |
| | | | |
Net Assets | | | | |
Class A | | $ | 443,358,831 | |
Class B | | | 222,217,610 | |
Class E | | | 24,359,234 | |
Class G | | | 122,371,900 | |
Capital Shares Outstanding* | | | | |
Class A | | | 26,006,531 | |
Class B | | | 13,319,659 | |
Class E | | | 1,436,406 | |
Class G | | | 7,357,582 | |
Net Asset Value, Offering Price and Redemption Price Per Share | | | | |
Class A | | $ | 17.05 | |
Class B | | | 16.68 | |
Class E | | | 16.96 | |
Class G | | | 16.63 | |
| * | The Portfolio is authorized to issue an unlimited number of shares. |
| (a) | Identified cost of investments was $867,957,229. |
| (b) | Includes securities loaned at value of $214,756,470. |
Statement of Operations
Six Months Ended June 30, 2016 (Unaudited)
| | | | |
Investment Income | |
Dividends (a) | | $ | 6,109,977 | |
Interest | | | 35,463 | |
Securities lending income | | | 1,148,705 | |
| | | | |
Total investment income | | | 7,294,145 | |
Expenses | | | | |
Management fees | | | 989,440 | |
Administration fees | | | 10,149 | |
Custodian and accounting fees | | | 79,585 | |
Distribution and service fees—Class B | | | 264,948 | |
Distribution and service fees—Class E | | | 17,651 | |
Distribution and service fees—Class G | | | 184,136 | |
Audit and tax services | | | 20,489 | |
Legal | | | 13,588 | |
Trustees’ fees and expenses | | | 15,990 | |
Shareholder reporting | | | 86,633 | |
Insurance | | | 2,903 | |
Miscellaneous | | | 35,082 | |
| | | | |
Total expenses | | | 1,720,594 | |
Less management fee waiver | | | (7,357 | ) |
| | | | |
Net expenses | | | 1,713,237 | |
| | | | |
Net Investment Income | | | 5,580,908 | |
| | | | |
Net Realized and Unrealized Gain (Loss) | | | | |
| Net realized gain on: | | | | |
Investments | | | 29,503,962 | |
Futures contracts | | | 1,114,500 | |
| | | | |
Net realized gain | | | 30,618,462 | |
| | | | |
| Net change in unrealized appreciation (depreciation) on: | | | | |
Investments | | | (17,598,221 | ) |
Futures contracts | | | (600,850 | ) |
Foreign currency transactions | | | 5 | |
| | | | |
Net change in unrealized depreciation | | | (18,199,066 | ) |
| | | | |
Net realized and unrealized gain | | | 12,419,396 | |
| | | | |
Net Increase in Net Assets from Operations | | $ | 18,000,304 | |
| | | | |
| (a) | Net of foreign withholding taxes of $2,367. |
See accompanying notes to financial statements.
MSF-24
Metropolitan Series Fund
Russell 2000 Index Portfolio
Statements of Changes in Net Assets
| | | | | | | | |
| | | Six Months
Ended
June 30,
2016
(Unaudited) | | | Year Ended
December 31,
2015 | |
Increase (Decrease) in Net Assets: | | | | | | | | |
From Operations | | | | | | | | |
Net investment income | | $ | 5,580,908 | | | $ | 10,956,587 | |
Net realized gain | | | 30,618,462 | | | | 45,329,061 | |
Net change in unrealized depreciation | | | (18,199,066 | ) | | | (92,804,307 | ) |
| | | | | | | | |
Increase (decrease) in net assets from operations | | | 18,000,304 | | | | (36,518,659 | ) |
| | | | | | | | |
From Distributions to Shareholders | | | | | | | | |
Net investment income | | | | | | | | |
Class A | | | (6,199,626 | ) | | | (5,846,773 | ) |
Class B | | | (2,602,492 | ) | | | (2,312,441 | ) |
Class E | | | (306,015 | ) | | | (293,363 | ) |
Class G | | | (1,328,503 | ) | | | (1,394,445 | ) |
Net realized capital gains | | | | | | | | |
Class A | | | (26,106,237 | ) | | | (27,706,544 | ) |
Class B | | | (13,423,379 | ) | | | (13,697,672 | ) |
Class E | | | (1,459,665 | ) | | | (1,599,037 | ) |
Class G | | | (7,420,341 | ) | | | (8,565,878 | ) |
| | | | | | | | |
Total distributions | | | (58,846,258 | ) | | | (61,416,153 | ) |
| | | | | | | | |
Increase in net assets from capital share transactions | | | 17,434,747 | | | | 31,844,502 | |
| | | | | | | | |
Total decrease in net assets | | | (23,411,207 | ) | | | (66,090,310 | ) |
| | |
Net Assets | | | | | | | | |
Beginning of period | | | 835,718,782 | | | | 901,809,092 | |
| | | | | | | | |
End of period | | $ | 812,307,575 | | | $ | 835,718,782 | |
| | | | | | | | |
Undistributed net investment income | | | | | | | | |
End of period | | $ | 5,611,696 | | | $ | 10,467,424 | |
| | | | | | | | |
Other Information:
Capital Shares
Transactions in capital shares were as follows:
| | | | | | | | | | | | | | | | |
| | | Six Months Ended
June 30, 2016
(Unaudited) | | | Year Ended
December 31, 2015 | |
| | | Shares | | | Value | | | Shares | | | Value | |
Class A | | | | | | | | | | | | | | | | |
Sales | | | 1,229,463 | | | $ | 20,650,012 | | | | 2,532,460 | | | $ | 48,694,241 | |
Reinvestments | | | 1,900,345 | | | | 32,305,863 | | | | 1,686,944 | | | | 33,553,317 | |
Redemptions | | | (2,643,346 | ) | | | (46,083,670 | ) | | | (2,981,074 | ) | | | (58,210,387 | ) |
| | | | | | | | | | | | | | | | |
Net increase | | | 486,462 | | | $ | 6,872,205 | | | | 1,238,330 | | | $ | 24,037,171 | |
| | | | | | | | | | | | | | | | |
Class B | | | | | | | | | | | | | | | | |
Sales | | | 576,606 | | | $ | 9,405,694 | | | | 939,710 | | | $ | 17,661,440 | |
Reinvestments | | | 963,673 | | | | 16,025,871 | | | | 821,031 | | | | 16,010,113 | |
Redemptions | | | (762,577 | ) | | | (12,879,705 | ) | | | (1,402,642 | ) | | | (27,143,102 | ) |
| | | | | | | | | | | | | | | | |
Net increase | | | 777,702 | | | $ | 12,551,860 | | | | 358,099 | | | $ | 6,528,451 | |
| | | | | | | | | | | | | | | | |
Class E | | | | | | | | | | | | | | | | |
Sales | | | 76,553 | | | $ | 1,249,897 | | | | 284,095 | | | $ | 5,510,582 | |
Reinvestments | | | 104,416 | | | | 1,765,680 | | | | 95,624 | | | | 1,892,400 | |
Redemptions | | | (142,110 | ) | | | (2,393,138 | ) | | | (418,044 | ) | | | (8,188,505 | ) |
| | | | | | | | | | | | | | | | |
Net increase (decrease) | | | 38,859 | | | $ | 622,439 | | | | (38,325 | ) | | $ | (785,523 | ) |
| | | | | | | | | | | | | | | | |
Class G | | | | | | | | | | | | | | | | |
Sales | | | 391,430 | | | $ | 6,410,978 | | | | 1,613,232 | | | $ | 30,391,213 | |
Reinvestments | | | 527,675 | | | | 8,748,844 | | | | 512,626 | | | | 9,960,323 | |
Redemptions | | | (1,027,388 | ) | | | (17,771,579 | ) | | | (2,022,084 | ) | | | (38,287,133 | ) |
| | | | | | | | | | | | | | | | |
Net increase (decrease) | | | (108,283 | ) | | $ | (2,611,757 | ) | | | 103,774 | | | $ | 2,064,403 | |
| | | | | | | | | | | | | | | | |
Increase derived from capital shares transactions | | | | | | $ | 17,434,747 | | | | | | | $ | 31,844,502 | |
| | | | | | | | | | | | | | | | |
See accompanying notes to financial statements.
MSF-25
Metropolitan Series Fund
Russell 2000 Index Portfolio
Financial Highlights
| | | | | | | | | | | | | | | | | | | | | | | | |
| Selected per share data | | | | | | | | | | | | | | | | | | |
| | | Class A | |
| | | Six Months
Ended
June 30,
2016
(Unaudited) | | | Year Ended December 31, | |
| | | | 2015 | | | 2014 | | | 2013 | | | 2012 | | | 2011 | |
Net Asset Value, Beginning of Period | | $ | 17.98 | | | $ | 20.11 | | | $ | 19.83 | | | $ | 14.56 | | | $ | 12.66 | | | $ | 13.33 | |
| | | | | | | | | | | | | | | | | | | | | | | | |
Income (Loss) from Investment Operations | | | | | | | | | | | | | | | | | | | | | | | | |
Net investment income (a) | | | 0.13 | | | | 0.26 | | | | 0.24 | | | | 0.20 | | | | 0.28 | | | | 0.15 | |
Net realized and unrealized gain (loss) on investments | | | 0.28 | | | | (0.98 | ) | | | 0.71 | | | | 5.33 | | | | 1.78 | | | | (0.68 | ) |
| | | | | | | | | | | | | | | | | | | | | | | | |
Total from investment operations | | | 0.41 | | | | (0.72 | ) | | | 0.95 | | | | 5.53 | | | | 2.06 | | | | (0.53 | ) |
| | | | | | | | | | | | | | | | | | | | | | | | |
Less Distributions | | | | | | | | | | | | | | | | | | | | | | | | |
Distributions from net investment income | | | (0.26 | ) | | | (0.25 | ) | | | (0.23 | ) | | | (0.26 | ) | | | (0.16 | ) | | | (0.14 | ) |
Distributions from net realized capital gains | | | (1.08 | ) | | | (1.16 | ) | | | (0.44 | ) | | | 0.00 | | | | 0.00 | | | | 0.00 | |
| | | | | | | | | | | | | | | | | | | | | | | | |
Total distributions | | | (1.34 | ) | | | (1.41 | ) | | | (0.67 | ) | | | (0.26 | ) | | | (0.16 | ) | | | (0.14 | ) |
| | | | | | | | | | | | | | | | | | | | | | | | |
Net Asset Value, End of Period | | $ | 17.05 | | | $ | 17.98 | | | $ | 20.11 | | | $ | 19.83 | | | $ | 14.56 | | | $ | 12.66 | |
| | | | | | | | | | | | | | | | | | | | | | | | |
Total Return (%) (b) | | | 2.27 | (c) | | | (4.27 | ) | | | 5.04 | | | | 38.55 | | | | 16.35 | | | | (4.10 | ) |
| | | | | | |
Ratios/Supplemental Data | | | | | | | | | | | | | | | | | | | | | | | | |
Gross ratio of expenses to average net assets (%) | | | 0.32 | (d) | | | 0.31 | | | | 0.32 | | | | 0.31 | | | | 0.33 | | | | 0.31 | |
Net ratio of expenses to average net assets (%) (e) | | | 0.31 | (d) | | | 0.31 | | | | 0.31 | | | | 0.31 | | | | 0.33 | | | | 0.31 | |
Ratio of net investment income to average net assets (%) | | | 1.53 | (d) | | | 1.35 | | | | 1.26 | | | | 1.18 | | | | 2.01 | | | | 1.12 | |
Portfolio turnover rate (%) | | | 17 | (c) | | | 27 | | | | 24 | | | | 25 | | | | 26 | | | | 25 | |
Net assets, end of period (in millions) | | $ | 443.4 | | | $ | 459.0 | | | $ | 488.3 | | | $ | 485.5 | | | $ | 366.9 | | | $ | 350.3 | |
| |
| | | Class B | |
| | | Six Months
Ended
June 30,
2016
(Unaudited) | | | Year Ended December 31, | |
| | | | 2015 | | | 2014 | | | 2013 | | | 2012 | | | 2011 | |
Net Asset Value, Beginning of Period | | $ | 17.60 | | | $ | 19.71 | | | $ | 19.45 | | | $ | 14.29 | | | $ | 12.43 | | | $ | 13.09 | |
| | | | | | | | | | | | | | | | | | | | | | | | |
Income (Loss) from Investment Operations | | | | | | | | | | | | | | | | | | | | | | | | |
Net investment income (a) | | | 0.11 | | | | 0.21 | | | | 0.19 | | | | 0.16 | | | | 0.24 | | | | 0.11 | |
Net realized and unrealized gain (loss) on investments | | | 0.26 | | | | (0.96 | ) | | | 0.69 | | | | 5.23 | | | | 1.75 | | | | (0.66 | ) |
| | | | | | | | | | | | | | | | | | | | | | | | |
Total from investment operations | | | 0.37 | | | | (0.75 | ) | | | 0.88 | | | | 5.39 | | | | 1.99 | | | | (0.55 | ) |
| | | | | | | | | | | | | | | | | | | | | | | | |
Less Distributions | | | | | | | | | | | | | | | | | | | | | | | | |
Distributions from net investment income | | | (0.21 | ) | | | (0.20 | ) | | | (0.18 | ) | | | (0.23 | ) | | | (0.13 | ) | | | (0.11 | ) |
Distributions from net realized capital gains | | | (1.08 | ) | | | (1.16 | ) | | | (0.44 | ) | | | 0.00 | | | | 0.00 | | | | 0.00 | |
| | | | | | | | | | | | | | | | | | | | | | | | |
Total distributions | | | (1.29 | ) | | | (1.36 | ) | | | (0.62 | ) | | | (0.23 | ) | | | (0.13 | ) | | | (0.11 | ) |
| | | | | | | | | | | | | | | | | | | | | | | | |
Net Asset Value, End of Period | | $ | 16.68 | | | $ | 17.60 | | | $ | 19.71 | | | $ | 19.45 | | | $ | 14.29 | | | $ | 12.43 | |
| | | | | | | | | | | | | | | | | | | | | | | | |
Total Return (%) (b) | | | 2.11 | (c) | | | (4.49 | ) | | | 4.78 | | | | 38.18 | | | | 16.05 | | | | (4.29 | ) |
| | | | | | |
Ratios/Supplemental Data | | | | | | | | | | | | | | | | | | | | | | | | |
Gross ratio of expenses to average net assets (%) | | | 0.57 | (d) | | | 0.56 | | | | 0.57 | | | | 0.56 | | | | 0.58 | | | | 0.56 | |
Net ratio of expenses to average net assets (%) (e) | | | 0.56 | (d) | | | 0.56 | | | | 0.56 | | | | 0.56 | | | | 0.58 | | | | 0.56 | |
Ratio of net investment income to average net assets (%) | | | 1.28 | (d) | | | 1.10 | | | | 1.01 | | | | 0.93 | | | | 1.77 | | | | 0.89 | |
Portfolio turnover rate (%) | | | 17 | (c) | | | 27 | | | | 24 | | | | 25 | | | | 26 | | | | 25 | |
Net assets, end of period (in millions) | | $ | 222.2 | | | $ | 220.8 | | | $ | 240.2 | | | $ | 238.1 | | | $ | 185.7 | | | $ | 168.0 | |
Please see following page for Financial Highlights footnote legend.
See accompanying notes to financial statements.
MSF-26
Metropolitan Series Fund
Russell 2000 Index Portfolio
Financial Highlights
| | | | | | | | | | | | | | | | | | | | | | | | |
| Selected per share data | | | | | | | | | | | | | | | | | | |
| | | Class E | |
| | | Six Months
Ended
June 30,
2016
(Unaudited) | | | Year Ended December 31, | |
| | | | 2015 | | | 2014 | | | 2013 | | | 2012 | | | 2011 | |
Net Asset Value, Beginning of Period | | $ | 17.88 | | | $ | 20.00 | | | $ | 19.72 | | | $ | 14.48 | | | $ | 12.60 | | | $ | 13.26 | |
| | | | | | | | | | | | | | | | | | | | | | | | |
Income (Loss) from Investment Operations | | | | | | | | | | | | | | | | | | | | | | | | |
Net investment income (a) | | | 0.12 | | | | 0.23 | | | | 0.21 | | | | 0.17 | | | | 0.25 | | | | 0.13 | |
Net realized and unrealized gain (loss) on investments | | | 0.27 | | | | (0.98 | ) | | | 0.71 | | | | 5.31 | | | | 1.77 | | | | (0.67 | ) |
| | | | | | | | | | | | | | | | | | | | | | | | |
Total from investment operations | | | 0.39 | | | | (0.75 | ) | | | 0.92 | | | | 5.48 | | | | 2.02 | | | | (0.54 | ) |
| | | | | | | | | | | | | | | | | | | | | | | | |
Less Distributions | | | | | | | | | | | | | | | | | | | | | | | | |
Distributions from net investment income | | | (0.23 | ) | | | (0.21 | ) | | | (0.20 | ) | | | (0.24 | ) | | | (0.14 | ) | | | (0.12 | ) |
Distributions from net realized capital gains | | | (1.08 | ) | | | (1.16 | ) | | | (0.44 | ) | | | 0.00 | | | | 0.00 | | | | 0.00 | |
| | | | | | | | | | | | | | | | | | | | | | | | |
Total distributions | | | (1.31 | ) | | | (1.37 | ) | | | (0.64 | ) | | | (0.24 | ) | | | (0.14 | ) | | | (0.12 | ) |
| | | | | | | | | | | | | | | | | | | | | | | | |
Net Asset Value, End of Period | | $ | 16.96 | | | $ | 17.88 | | | $ | 20.00 | | | $ | 19.72 | | | $ | 14.48 | | | $ | 12.60 | |
| | | | | | | | | | | | | | | | | | | | | | | | |
Total Return (%) (b) | | | 2.17 | (c) | | | (4.39 | ) | | | 4.91 | | | | 38.35 | | | | 16.10 | | | | (4.16 | ) |
| | | | | | |
Ratios/Supplemental Data | | | | | | | | | | | | | | | | | | | | | | | | |
Gross ratio of expenses to average net assets (%) | | | 0.47 | (d) | | | 0.46 | | | | 0.47 | | | | 0.46 | | | | 0.48 | | | | 0.46 | |
Net ratio of expenses to average net assets (%) (e) | | | 0.46 | (d) | | | 0.46 | | | | 0.46 | | | | 0.46 | | | | 0.48 | | | | 0.46 | |
Ratio of net investment income to average net assets (%) | | | 1.38 | (d) | | | 1.19 | | | | 1.10 | | | | 1.03 | | | | 1.85 | | | | 0.96 | |
Portfolio turnover rate (%) | | | 17 | (c) | | | 27 | | | | 24 | | | | 25 | | | | 26 | | | | 25 | |
Net assets, end of period (in millions) | | $ | 24.4 | | | $ | 25.0 | | | $ | 28.7 | | | $ | 30.6 | | | $ | 25.7 | | | $ | 25.1 | |
| |
| | | Class G | |
| | | Six Months
Ended
June 30,
2016
(Unaudited) | | | Year Ended December 31, | |
| | | | 2015 | | | 2014 | | | 2013 | | | 2012 | | | 2011 | |
Net Asset Value, Beginning of Period | | $ | 17.54 | | | $ | 19.65 | | | $ | 19.40 | | | $ | 14.26 | | | $ | 12.41 | | | $ | 13.07 | |
| | | | | | | | | | | | | | | | | | | | | | | | |
Income (Loss) from Investment Operations | | | | | | | | | | | | | | | | | | | | | | | | |
Net investment income (a) | | | 0.10 | | | | 0.20 | | | | 0.18 | | | | 0.15 | | | | 0.24 | | | | 0.11 | |
Net realized and unrealized gain (loss) on investments | | | 0.26 | | | | (0.96 | ) | | | 0.69 | | | | 5.22 | | | | 1.73 | | | | (0.66 | ) |
| | | | | | | | | | | | | | | | | | | | | | | | |
Total from investment operations | | | 0.36 | | | | (0.76 | ) | | | 0.87 | | | | 5.37 | | | | 1.97 | | | | (0.55 | ) |
| | | | | | | | | | | | | | | | | | | | | | | | |
Less Distributions | | | | | | | | | | | | | | | | | | | | | | | | |
Distributions from net investment income | | | (0.19 | ) | | | (0.19 | ) | | | (0.18 | ) | | | (0.23 | ) | | | (0.12 | ) | | | (0.11 | ) |
Distributions from net realized capital gains | | | (1.08 | ) | | | (1.16 | ) | | | (0.44 | ) | | | 0.00 | | | | 0.00 | | | | 0.00 | |
| | | | | | | | | | | | | | | | | | | | | | | | |
Total distributions | | | (1.27 | ) | | | (1.35 | ) | | | (0.62 | ) | | | (0.23 | ) | | | (0.12 | ) | | | (0.11 | ) |
| | | | | | | | | | | | | | | | | | | | | | | | |
Net Asset Value, End of Period | | $ | 16.63 | | | $ | 17.54 | | | $ | 19.65 | | | $ | 19.40 | | | $ | 14.26 | | | $ | 12.41 | |
| | | | | | | | | | | | | | | | | | | | | | | | |
Total Return (%) (b) | | | 2.08 | (c) | | | (4.54 | ) | | | 4.73 | | | | 38.12 | | | | 15.94 | | | | (4.33 | ) |
| | | | | | |
Ratios/Supplemental Data | | | | | | | | | | | | | | | | | | | | | | | | |
Gross ratio of expenses to average net assets (%) | | | 0.62 | (d) | | | 0.61 | | | | 0.62 | | | | 0.61 | | | | 0.63 | | | | 0.61 | |
Net ratio of expenses to average net assets (%) (e) | | | 0.61 | (d) | | | 0.61 | | | | 0.61 | | | | 0.61 | | | | 0.63 | | | | 0.61 | |
Ratio of net investment income to average net assets (%) | | | 1.23 | (d) | | | 1.04 | | | | 0.96 | | | | 0.89 | | | | 1.81 | | | | 0.88 | |
Portfolio turnover rate (%) | | | 17 | (c) | | | 27 | | | | 24 | | | | 25 | | | | 26 | | | | 25 | |
Net assets, end of period (in millions) | | $ | 122.4 | | | $ | 131.0 | | | $ | 144.7 | | | $ | 141.2 | | | $ | 88.7 | | | $ | 61.5 | |
| (a) | Per share amounts based on average shares outstanding during the period. |
| (b) | Total return does not reflect any insurance, sales, separate account or administrative charges of variable annuity or life insurance contracts or any additional expenses that contract owners may bear under their variable contracts. If these charges were included, the returns would be lower. |
| (c) | Periods less than one year are not computed on an annualized basis. |
| (d) | Computed on an annualized basis. |
| (e) | Includes the effects of management fee waivers (see Note 6 of the Notes to Financial Statements). |
See accompanying notes to financial statements.
MSF-27
Metropolitan Series Fund
Russell 2000 Index Portfolio
Notes to Financial Statements—June 30, 2016 (Unaudited)
1. Organization
Metropolitan Series Fund (the “Trust”) is organized as a Delaware statutory trust and registered under the Investment Company Act of 1940, as amended (the “1940 Act”), as an open-end management investment company. The Trust, which is managed by MetLife Advisers, LLC (“MetLife Advisers” or the “Adviser”), an affiliate of MetLife, Inc., is currently comprised of thirty series, each of which operates as a distinct investment vehicle of the Trust. The portfolio included in this report is Russell 2000 Index Portfolio (the “Portfolio”), which is diversified. Shares in the Portfolio are not offered directly to the general public and are currently available only to separate accounts established by Metropolitan Life Insurance Company (“MetLife”) and other affiliated life insurance companies.
The Portfolio has registered and offers four classes of shares: Class A, B, E and G shares. Shares of each Class of the Portfolio represent an equal pro rata interest in the Portfolio and generally give the shareholder the same voting, dividend, liquidation, and other rights. Investment income, realized and unrealized capital gains and losses, the common expenses of the Portfolio, and certain Portfolio-level expense reductions, if any, are allocated on a pro rata basis to each Class based on the relative net assets of each Class to the net assets of the Portfolio. Each Class of shares differs in its respective distribution plan and such distribution expenses are allocated to the corresponding Class of shares.
2. Significant Accounting Policies
The preparation of financial statements in conformity with accounting principles generally accepted in the United States of America (“GAAP”) requires management to make estimates and assumptions that affect the reported amounts of assets and liabilities and disclosure of contingent assets and liabilities as of the date of the financial statements and the reported amounts of income and expenses during the reporting period. Actual results could differ from those estimates. In the preparation of these financial statements, management has evaluated events and transactions subsequent to June 30, 2016 through the date the financial statements were issued.
The Portfolio is an investment company and follows the accounting and reporting guidance of the Financial Accounting Standards Board (“FASB”) Accounting Standards Codification Topic 946—Financial Services—Investment Companies and Topic 820—Fair Value Measurement. The following is a summary of significant accounting policies consistently followed by the Portfolio in the preparation of its financial statements.
Investment Valuation and Fair Value Measurements - Domestic and foreign equity securities, such as common stock, exchange-traded funds, rights, warrants, and preferred stock, that are traded on a securities exchange on a valuation date are generally valued at their last quoted sale price or official closing price on the primary exchange for such security, or, if no sales occurred on that day, at the last reported bid price. Equity securities traded over-the-counter (“OTC”) are generally valued at the last reported bid price. In the event of a major exchange closing during the trading day, the Adviser may use other market information obtained from quotation reporting systems, established market makers, or pricing services in valuing the securities. Valuation adjustments may be applied to certain foreign equity securities that are traded solely on foreign exchanges that close before the time as of which the Portfolio determines its NAV to account for the market movement between the close of the foreign exchanges and the time as of which the Portfolio determines its NAV. The Portfolio may use a systematic fair valuation model provided by a pricing service to value securities principally traded in these foreign markets in order to adjust for possible market movements or other changes that may occur between the close of the foreign exchanges and the time as of which the Portfolio determines its NAV. Foreign equity securities valued using these valuation adjustments are generally categorized as Level 2 within the fair value hierarchy. Equity securities that are actively traded, and have no valuation adjustments applied, are categorized as Level 1 within the fair value hierarchy. Other equity securities traded on inactive markets, or valued in reference to similar instruments traded on active markets, are generally categorized as Level 2 within the fair value hierarchy.
Investments in registered open-end management investment companies are valued at reported net asset value per share on the valuation date and are categorized as Level 1 within the fair value hierarchy.
Debt securities, including corporate, convertible and municipal bonds and notes; obligations of the U.S. Treasury and U.S. government agencies; foreign sovereign issues; and non-U.S. bonds, are generally valued on the basis of evaluated or composite bid quotations obtained from independent pricing services and/or brokers and dealers selected by the Adviser (each a “pricing service”), pursuant to authorization of and subject to general oversight by the Board of Trustees of the Trust (the “Board” or “Trustees”). Such pricing services may use matrix pricing, which considers observable inputs including, among other things, issuer details, maturity dates, interest rates, yield curves, rates of prepayment, credit risks/spreads, default rates, reported trades, broker dealer quotes and quoted prices for similar assets. Short-term obligations with a remaining maturity of sixty days or less may be valued at amortized cost in the absence of market quotes, so long as the amortized cost value of such short-term debt instrument is approximately the same as the fair value of the instrument as determined without the use of amortized cost valuation. Floating rate loans are generally valued on the basis of an evaluated or composite average of aggregate bid and ask quotations supplied by brokers or dealers, as obtained from the pricing service. Securities that use similar valuation techniques and inputs as described above are generally categorized as Level 2 within the fair value hierarchy.
MSF-28
Metropolitan Series Fund
Russell 2000 Index Portfolio
Notes to Financial Statements—June 30, 2016—(Continued)
Options, whether on securities, indices, futures contracts, or otherwise, traded on exchanges are valued at the last sale price available as of the close of business on a valuation day or, if there is no such price available, at the last reported bid price. These types of options are categorized as Level 1 within the fair value hierarchy. Futures contracts that are traded on commodity exchanges are valued at their settlement prices established by the exchanges on which they are traded as of the close of such exchanges and are categorized as Level 1 within the fair value hierarchy.
If no current market value quotation or other observable inputs are readily available or market value quotations are deemed to be unreliable for an investment, the fair value of the investment will be determined in accordance with procedures approved by, and under the general supervision of, the Board. In such a circumstance, the Board will be assisted in its responsibility to determine the fair value of an investment by the Valuation Committee (“Committee”) of MetLife Advisers. The Committee provides general pricing oversight and fair value pricing determinations related to portfolio securities and meets on a regular basis to review reports relating to the valuation of the securities in the Portfolio. The Board has delegated to State Street Bank and Trust Company, the Trust’s custodian (“custodian”), the responsibility for calculating the net asset values (“NAVs”) of the Trust’s Portfolios. The Committee is responsible for overseeing the calculation of the NAVs of the Portfolios by the custodian. The Committee also periodically reviews pricing services, including the pricing services providing fair value pricing for the Portfolio’s foreign securities, and is responsible for overseeing the correction of pricing errors and addressing other pricing issues that arise in the ordinary course of business, such as making real-time fair value determinations, as necessary.
No single standard for determining the fair value of an investment can be set forth because fair value depends upon the facts and circumstances with respect to each investment. Information relating to any relevant factors may be obtained by the Committee from any appropriate source, including the subadviser of the Portfolio, the custodian, a pricing service, market maker and/or broker for such security or the issuer. Appropriate methodologies for determining fair value under particular circumstances may include: matrix pricing, a discounted cash flow analysis, comparisons of securities with comparable characteristics, value based on multiples of earnings, discount from market price of similar marketable securities or a combination of these and other methods.
Investment Transactions and Related Investment Income - Portfolio security transactions are recorded on the trade date. Dividend income is recorded on the ex-dividend date or, for certain foreign securities, when notified. Interest income, which includes amortization of premium and accretion of discount on debt securities, is recorded on the accrual basis. Realized gains and losses on investments are determined on the identified cost basis, which is the same basis used for federal income tax purposes. Foreign income and foreign capital gains on some foreign securities may be subject to foreign taxes, which are accrued as applicable. These foreign taxes have been provided for in accordance with the Portfolio’s understanding of the applicable countries’ tax rules and rates.
Foreign Currency Translation - The books and records of the Portfolio are maintained in U.S. dollars. The values of securities, currencies, and other assets and liabilities denominated in currencies other than the U.S. dollar are translated into U.S. dollars based upon foreign exchange rates prevailing at the end of the period. Purchases and sales of investment securities, income, and expenses are translated on the respective dates of such transactions. Because the values of investment securities are translated at the foreign exchange rates prevailing at the end of the period, that portion of the results of operations arising from changes in exchange rates and that portion of the results of operations reflecting fluctuations arising from changes in market prices of the investment securities are not separated. Such fluctuations are included in the net realized and unrealized gain or loss on investments.
Net realized foreign exchange gains or losses arise from activity in forward foreign currency exchange contracts, sales of foreign currency, currency gains or losses realized between the trade and settlement dates on securities transactions, and the difference between the amounts of dividends, interest, and foreign withholding taxes recorded by the Portfolio and the U.S. dollar equivalent of the amounts actually received or paid by the Portfolio. Net unrealized foreign exchange gains and losses arise from changes in the value of assets and liabilities, other than investment securities, resulting from changes in foreign exchange rates.
Dividends and Distributions to Shareholders - The Portfolio records dividends and distributions on the ex-dividend date. Net realized gains from securities transactions (if any) are generally distributed annually to shareholders. The timing and characterization of certain income and capital gains distributions are determined in accordance with federal tax regulations that may differ from GAAP. Permanent book and tax basis differences relating to shareholder distributions will result in reclassification between under/over distributed net investment income, accumulated net realized gains/losses, and paid-in surplus. Book-tax differences are primarily due to foreign currency transactions, passive foreign investment companies (PFICs), distribution redesignations and real estate investment trust (REIT) adjustments. These adjustments have no impact on net assets or the results of operations.
Income Taxes - It is the Portfolio’s policy to comply with the requirements of the Internal Revenue Code of 1986, as amended, and regulations thereunder, applicable to regulated investment companies and to distribute, with respect to each taxable year, all of its taxable income to shareholders. Therefore, no federal income tax provision is required. The Portfolio files U.S. federal tax returns. No income tax returns are currently under examination. The Portfolio’s federal tax returns for the prior three fiscal years remain subject to examination by the Internal Revenue Service. As of June 30, 2016, the Portfolio had no uncertain tax positions that would require financial statement recognition, or de-recognition or disclosure.
MSF-29
Metropolitan Series Fund
Russell 2000 Index Portfolio
Notes to Financial Statements—June 30, 2016—(Continued)
Repurchase Agreements - The Portfolio may enter into repurchase agreements, under the terms of a Master Repurchase Agreement (“MRA”), with selected commercial banks and broker-dealers, under which the Portfolio acquires securities as collateral and agrees to resell the securities at an agreed-upon time and at an agreed-upon price. The Portfolio, through the custodian or a subcustodian, under a tri-party repurchase agreement, receives delivery of the underlying securities collateralizing any repurchase agreements. It is the Portfolio’s policy that the market value of the collateral be equal to at least 100% of the repurchase price in the case of a repurchase agreement of one-day duration and equal to at least 102% of the repurchase price in the case of all other repurchase agreements. In the event of default or failure by a party to perform an obligation in connection with any repurchase transaction, the MRA gives the non-defaulting party the right to set-off claims and to apply property held by it in connection with any repurchase transaction against obligations owed to it.
Securities Lending - The Portfolio may lend its portfolio securities to certain qualified brokers who borrow securities in order to complete certain securities transactions. By lending its portfolio securities, the Portfolio attempts to increase its net investment income through the receipt of income on collateral held from securities on loan. Any gain or loss in the market price of the loaned securities that might occur and any interest earned or dividends declared during the term of the loan would accrue to the account of the Portfolio.
The Trust has entered into a Securities Lending Authorization Agreement with the custodian as the lending agent. Under this agreement, the custodian is authorized to loan portfolio securities on the Portfolio’s behalf. In exchange, the Portfolio receives either cash or securities as collateral against the loaned securities. The Portfolio receives collateral equal to at least 102% of the market value of the loaned securities (105% for foreign equity securities), at each loan’s inception. Collateral representing at least 100% of the market value of the loaned securities must be maintained for the duration of the loan. Cash collateral is generally invested in the State Street Navigator Securities Lending MET Portfolio (the “Navigator Portfolio”), a series of the State Street Navigator Securities Lending Trust that is managed by an affiliate of the custodian. The Navigator Portfolio is a registered money market fund that invests in a variety of high-quality, U.S. dollar-denominated instruments. If the market value of the collateral at the close of trading on a business day is less than 100% of the market value of the loaned securities at the close of trading on that day, the borrower shall be required to deliver, by the close of business on the following business day, an additional amount of collateral, so that the total amount of posted collateral is equal to at least 100% of the market value of all the loaned securities as of such preceding day. A portion of net income (income after the deduction of expenses and fees of the Navigator Portfolio) on the collateral is rebated to the borrower of the securities and the remainder is split between the custodian and the Portfolio. On loans collateralized by U.S. Treasuries, a fee is received from the borrower and is allocated between the Portfolio and the custodian. Income received by the Portfolio in securities lending transactions during the six months ended June 30, 2016 is reflected as Securities lending income on the Statement of Operations. The values of any securities loaned by the Portfolio and the related collateral at June 30, 2016 are disclosed in the footnotes to the Schedule of Investments. The value of the related collateral received by the Portfolio exceeded the value of the securities out on loan at June 30, 2016.
The risks associated with lending portfolio securities include, but are not limited to, possible delays in receiving additional collateral or in the recovery of the loaned securities, possible loss of rights in the collateral should the borrower fail financially, as well as risk of loss in the value of the collateral or the value of the investments made with the collateral. The lending agent shall indemnify the Portfolio in the case of default of any securities borrower.
The following table provides a breakdown of the collateral received and the remaining contractual maturities for securities lending transactions, which are accounted for as secured borrowings.
| | | | | | | | | | | | | | | | | | | | |
| | | Remaining Contractual Maturity of the Agreements
As of June 30, 2016 | |
| | | Overnight and
Continuous | | | Up to
30 Days | | | 31 - 90
Days | | | Greater than
90 days | | | Total | |
Securities Lending Transactions | | | | | | | | | | | | | | | | | | | | |
Common Stocks | | $ | (197,092,809 | ) | | $ | — | | | $ | — | | | $ | — | | | $ | (197,092,809 | ) |
Mutual Funds | | | (1,290,873 | ) | | | — | | | | — | | | | — | | | | (1,290,873 | ) |
Rights | | | (0 | ) | | | — | | | | — | | | | — | | | | (0 | ) |
Total | | $ | (198,383,682 | ) | | $ | — | | | $ | — | | | $ | — | | | $ | (198,383,682 | ) |
Total Borrowings | | $ | (198,383,682 | ) | | $ | — | | | $ | — | | | $ | — | | | $ | (198,383,682 | ) |
Gross amount of recognized liabilities for securities lending transactions | | | $ | (198,383,682 | ) |
| | | | | | | | | | | | | | | | | | | | |
3. Investments in Derivative Instruments
Futures Contracts - The Portfolio may buy and sell futures contracts as a hedge, to maintain investment exposure to a target asset class or to enhance return. The Portfolio may be subject to fluctuations in equity prices, interest rates, commodity prices, and foreign currency exchange rates in the normal course of pursuing its investment objective. Futures contracts are standardized agreements to
MSF-30
Metropolitan Series Fund
Russell 2000 Index Portfolio
Notes to Financial Statements—June 30, 2016—(Continued)
buy or sell a security, or deliver a final cash settlement price in connection with an index, interest rate, currency, or other asset. The Portfolio must deposit an amount (“initial margin”) equal to a certain percentage of the face value of the futures contract. The initial margin may be in the form of cash or securities, which is returned when the Portfolio’s obligations under the contract have been satisfied. If cash is deposited as the initial margin, it is shown as cash collateral on the Statement of Assets and Liabilities. Futures contracts are marked-to-market daily, and subsequent payments (“variation margin”) are made or received by the Portfolio depending on whether unrealized gains or losses are incurred. These amounts are reflected as receivables or payables on the Statement of Assets and Liabilities and as a component of net change in unrealized appreciation/depreciation on the Statement of Operations. When the contract is closed or expires, the Portfolio records a realized gain or loss equal to the difference between the value of the contract at the time it was opened and the value at the time it was closed. Risks of entering into futures contracts (and related options) include the possibility that the market for these instruments may be illiquid and that a change in the value of the contract or option may not correlate perfectly with changes in the value of the underlying instrument. If futures contracts are exchange-traded, the exchange’s clearinghouse, as counterparty to all exchange-traded futures, guarantees the futures contracts against default. For OTC futures, the Portfolio’s ability to terminate the positions may be more limited than in the case of exchange-traded positions and may also involve the risk that securities dealers participating in such transactions would fail to meet their obligations to the Portfolio.
The following table summarizes the fair value of derivatives held by the Portfolio at June 30, 2016 by category of risk exposure:
| | | | | | |
| | | Liability Derivatives | |
Risk Exposure | | Statement of Assets &
Liabilities Location | | Fair Value | |
Equity | | Unrealized depreciation on futures contracts (a) | | $ | 713,516 | |
| | | | | | |
| | (a) | Includes cumulative appreciation/depreciation of futures contracts as reported in the Schedule of Investments. Only the current day’s variation margin is reported within the Statement of Assets and Liabilities. |
The following tables summarize the effect of derivative instruments on the Statement of Operations, classified by derivative type and category of risk exposure, for the six months ended June 30, 2016:
| | | | |
Statement of Operations Location—Net Realized Gain (Loss) | | Equity | |
Futures contracts | | $ | 1,114,500 | |
| | | | |
| |
Statement of Operations Location—Net Change in Unrealized Appreciation (Depreciation) | | Equity | |
Futures contracts | | $ | (600,850 | ) |
| | | | |
For the six months ended June 30, 2016, the average notional par or face amount outstanding for each derivative type was as follows:
| | | | |
Derivative Description | | Average
Notional Par or
Face Amount‡ | |
Futures contracts long | | $ | 19,700 | |
| | ‡ | Averages are based on activity levels during the period. |
4. Certain Risks
In the normal course of business, the Portfolio invests in securities and enters into transactions where risks exist due to fluctuations in the market (“market risk”) or failure of the other party to a transaction to perform (“credit and counterparty risk”).
Market Risk: The value of securities held by the Portfolio may decline in response to certain events, including those directly involving the companies whose securities are owned by the Portfolio; conditions affecting the general economy; overall market changes; local, regional or global political, social or economic instability; and currency, interest rate, and price fluctuations.
Credit and Counterparty Risk: The Portfolio may be exposed to counterparty risk, or the risk that an entity with which the Portfolio has unsettled or open transactions may default. The potential loss could exceed the value of the financial assets and liabilities recorded in the financial statements. Financial assets that potentially expose the Portfolio to credit and counterparty risk consist principally of cash due from counterparties and investments. The Portfolio manages counterparty risk by entering into agreements only with counterparties that it believes have the financial resources to honor their obligations and by monitoring the financial stability of those counterparties. The Portfolio’s investment adviser attempts to mitigate counterparty risk by (i) periodically assessing the creditworthiness of its trading partners, (ii) monitoring and/or limiting the amount of its net exposure to each individual
MSF-31
Metropolitan Series Fund
Russell 2000 Index Portfolio
Notes to Financial Statements—June 30, 2016—(Continued)
counterparty based on its assessment, and (iii) requiring collateral from the counterparty for certain transactions. In order to preserve certain safeguards for non-standard settlement trades, the Portfolio restricts its exposure to credit and counterparty losses by entering into master netting agreements (“Master Agreements”) with counterparties (approved brokers) with whom it undertakes a significant volume of transactions. Master Agreements govern the terms of certain transactions, and reduce the counterparty risk associated with relevant transactions by specifying credit protection mechanisms and providing standardization that improves legal certainty. Master Agreements can also help limit counterparty risk by specifying collateral posting arrangements at pre-arranged exposure levels.
Customer Account Agreements and related addenda govern cleared derivatives transactions such as futures, options on futures, and cleared OTC derivatives. Cleared derivative transactions require posting of initial margin as determined by each relevant clearing agency, which is segregated at a broker account registered with the Commodities Futures Trading Commission (“CFTC”), or the applicable regulator. In the U.S., counterparty risk is significantly reduced as creditors of the futures broker do not have claim to Portfolio assets in the segregated account. Additionally, portability of exposure in the event of default further reduces risk to the Portfolio. Variation margin, or changes in market value, are exchanged daily, but may not be netted between futures and cleared OTC derivatives.
Additional risks associated with each type of investment are described above within the respective security type notes. The Portfolio’s prospectus includes a discussion of the principal risks of investing in the Portfolio.
5. Investment Transactions
Aggregate cost of purchases and proceeds of sales of investment securities, excluding short-term securities, for the six months ended June 30, 2016 were as follows:
| | | | | | | | | | | | |
Purchases | | | Sales | |
U.S. Government | | Non U.S. Government | | | U.S. Government | | | Non U.S. Government | |
| $0 | | $ | 130,059,557 | | | $ | 0 | | | $ | 159,654,276 | |
6. Investment Management Fees and Other Transactions with Affiliates
Investment Management Agreement - MetLife Advisers is the investment adviser to the Portfolio. The Trust has entered into an investment management agreement with MetLife Advisers with respect to the Portfolio. For providing investment management services to the Portfolio, MetLife Advisers receives monthly compensation at the annual rate of 0.250% of average daily net assets. Fees earned by MetLife Advisers with respect to the Portfolio for the six months ended June 30, 2016 were $989,440.
MetLife Advisers has entered into an investment subadvisory agreement with MetLife Investment Advisor, LLC (“MIA”) with respect to managing the Portfolio. For providing subadvisory services to the Portfolio, MetLife Advisers has agreed to pay MIA an investment subadvisory fee for each class of the Portfolio as follows:
| | |
% per annum | | Average Daily Net Assets |
| 0.040% | | On the first $500 million |
| 0.030% | | Of the next $500 million |
| 0.015% | | On amounts over $1 billion |
Fees earned by MIA with respect to the Portfolio for the six months ended June 30, 2016 were $143,596.
Management Fee Waiver - Pursuant to a management fee waiver agreement, MetLife Advisers has agreed, for the period May 1, 2016 to April 30, 2017, to reduce its advisory fees set out above under “Investment Management Agreement” for each class of the Portfolio as follows:
| | |
% per annum | | Average Daily Net Assets |
| 0.005% | | Over $500 million and under $1 billion |
| 0.010% | | Of the next $1 billion |
| 0.015% | | On amounts over $2 billion |
An identical agreement was in place for the period May 1, 2015 to April 30, 2016. Amounts waived for the six months ended June 30, 2016 are shown as a management fee waiver in the Statement of Operations.
Certain officers and trustees of the Trust may also be officers of MetLife Advisers; however, such officers and trustees receive no compensation from the Trust.
On January 12, 2016, MetLife, Inc. announced its plan to pursue the separation of a substantial portion of its retail segment and is currently evaluating structural alternatives for such separation. It is anticipated that MetLife Advisers would be included in any such
MSF-32
Metropolitan Series Fund
Russell 2000 Index Portfolio
Notes to Financial Statements—June 30, 2016—(Continued)
separation. Any separation transaction that might occur will be subject to the satisfaction of various conditions and approvals, including approval of any transaction by the MetLife, Inc. Board of Directors, satisfaction of any applicable requirements of the SEC, and receipt of insurance and other regulatory approvals and other anticipated conditions. Because the form of a separation had yet to be determined, MetLife, Inc. cannot currently provide a specific potential completion date or information about the potential impact on MetLife Advisers. No assurance can be given regarding the form that a separation transaction may take or the specific terms thereof, or that a separation will in fact occur. Depending on the form a separation takes, MetLife Advisers’ continued service as investment adviser to the Trusts could be subject to the satisfaction of various conditions and approvals, which may include obtaining approvals from the Trusts’ Board and shareholders.
Transfer Agency Agreement - MetLife serves as the transfer agent for the Trust. MetLife receives no fees for its services to the Trust under the transfer agency agreement.
Distribution and Service Fees - The Trust has a distribution agreement with MetLife Investors Distribution Company (“MIDC” or the “Distributor”) in which MIDC serves as the distributor for the Portfolio’s Class A, B, E, and G Shares. MIDC is a wholly-owned subsidiary of MetLife Investors Group, LLC, an affiliate of the Adviser. The Trust has also adopted a Distribution and Service Plan under Rule 12b-1 of the 1940 Act for the Portfolio’s Class B, E, and G Shares. Under the Distribution and Service Plan, the Class B, E, and G Shares of the Portfolio pay a fee to compensate the Insurance Companies (or their affiliates) and other broker-dealers and financial intermediaries involved in the offer and sale of Portfolio shares for promoting or selling and servicing the Class B, E, and G Shares of the Portfolio. The fees under the Distribution and Service Plan for each class of the Portfolio’s shares are calculated as a percentage of the Portfolio’s average daily net assets that are attributable to that Class. Currently, the fee is 0.25% per year for Class B Shares, 0.15% per year for Class E Shares, and 0.30% per year for Class G Shares. Amounts incurred by the Portfolio for the six months ended June 30, 2016 are shown as Distribution and service fees in the Statement of Operations.
Deferred Trustee Compensation - Each Trustee who is not currently an employee of the Adviser or any of its affiliates receives compensation from the Trust for his or her service to the Trust. A deferred compensation plan (the “Plan”) is available to the Trustees on a voluntary basis. Deferred amounts remain in the Trust until distributed in accordance with the provisions of the Plan. The value of a participating Trustee’s deferral account is based on theoretical investments of deferred amounts on the normal payment dates in certain portfolios of the Trust or Met Investors Series Trust, an affiliate of the Trust, as designated by the participating Trustee. Changes in the value of participants’ deferral accounts are reflected as Trustees’ fees and expenses in the Statement of Operations. The portion of the accrued obligations allocated to the Portfolio under the Plan is reflected as Deferred trustees’ fees in the Statement of Assets and Liabilities.
7. Contractual Obligations
Under the Trust’s organizational documents, its officers and Trustees may be indemnified against certain liabilities and expenses arising out of the performance of their duties to the Trust. Additionally, the Trust has a variety of indemnification obligations under contracts with its service providers. The Trust’s maximum exposure under these arrangements is unknown, as this would involve future claims that may be made against the Trust that have not yet occurred.
8. Income Tax Information
The tax character of distributions paid for the years ended December 31, 2015 and 2014 were as follows:
| | | | | | | | | | | | | | | | | | | | |
Ordinary Income | | | Long-Term Capital Gain | | | Total | |
2015 | | 2014 | | | 2015 | | | 2014 | | | 2015 | | | 2014 | |
| $10,291,201 | | $ | 9,295,424 | | | $ | 51,124,952 | | | $ | 19,762,455 | | | $ | 61,416,153 | | | $ | 29,057,879 | |
As of December 31, 2015, the components of distributable earnings (accumulated losses) on a federal income tax basis were as follows:
| | | | | | | | | | | | | | | | |
Undistributed
Ordinary
Income | | Undistributed
Long-Term
Capital Gain | | | Net
Unrealized
Appreciation | | | Other
Accumulated
Capital Losses | | | Total | |
| $10,861,613 | | $ | 47,648,221 | | | $ | 152,703,564 | | | $ | — | | | $ | 211,213,398 | |
The Portfolio utilizes the provisions of the federal income tax laws that provide for the carryforward of capital losses for prior years, offsetting such losses against any future realized capital gains. Under the Regulated Investment Company Modernization Act of 2010 (the “Act”), net capital losses recognized after December 22, 2010 may be carried forward indefinitely and their character is retained as short-term and/or long-term losses. Previously, net capital losses were carried forward for up to eight years and treated as short-term losses. As a transition rule, the Act requires that post-enactment net capital losses be used before pre-enactment net capital losses.
As of December 31, 2015, the Portfolio had no post-enactment accumulated capital losses and no pre-enactment accumulated capital loss carryforwards.
MSF-33
Metropolitan Series Fund
T. Rowe Price Large Cap Growth Portfolio
Managed By T. Rowe Price Associates, Inc.
Portfolio Manager Commentary*
PERFORMANCE
For the six month period ended June 30, 2016, the Class A, B and E shares of the T. Rowe Price Large Cap Growth Portfolio returned -5.80%, -5.94%, and -5.91%, respectively. The Portfolio’s benchmark, the Russell 1000 Growth Index1, returned 1.36%.
MARKET ENVIRONMENT / CONDITIONS
Most major U.S. stock indexes rose in the first half of 2016, a period of significant global market volatility. World markets started the year with deep losses as oil prices collapsed to 13-year lows amid concerns about weakening Chinese and global economic growth. In fact, by mid-February, U.S. small-caps and some non-U.S. markets had fallen into a bear market, commonly defined as a drop of at least 20% from recent highs. However, equities and other risk assets rallied through late June, as the Bank of Japan and the European Central Bank unveiled new stimulus efforts. Also, the dollar weakened due to diminishing expectations for U.S. interest rate increases in 2016, and commodity prices rebounded sharply amid speculation about global production cuts and, to a lesser extent, supply disruptions in Nigeria and Canada. As the period ended, global markets fluctuated wildly in response to a referendum, in which U.K. citizens voted in favor of leaving the European Union—the so-called “Brexit.”
In the U.S., mid-cap shares outperformed their larger and smaller counterparts. As measured by various Russell indexes, value stocks outperformed growth stocks across all market capitalizations.
In the large-cap universe, as measured by the S&P 500 Index, sector returns were mostly positive. The Utilities and Telecommunication Services sectors outperformed other sectors, aided by investors seeking attractive income versus low-yielding fixed income alternatives. Energy rallied with crude oil prices, while Consumer Staples produced solid gains. Financials fell, as the expected rise in U.S. interest rates, which could help banks make more profitable loans, failed to materialize. Turmoil in Europe’s banking sector also weighed on U.S. financials. On relative basis, the Health Care and Information Technology sectors lagged over the period.
PORTFOLIO REVIEW / PERIOD END POSITIONING
The Portfolio underperformed the Russell 1000 Growth Index for the six-month period. Overall, stock selection and sector allocation both detracted from relative results.
Stock selection in Health Care was the largest detractor of relative returns, driven by holdings in Allergan and Valeant Pharmaceuticals. Shares of global specialty pharmaceutical company Allergan were pressured after the U.S. Treasury Department announced new regulations that led global pharmaceutical company Pfizer to abandon merger plans with Allergan. Despite the failure of this merger, we maintained a favorable outlook on Allergan, and believe it has the ability to deliver strong organic growth through sales of its newly branded and legacy products. Valeant Pharmaceuticals continued to be battered by controversies, which included accounting restatements, investigations by the Securities and Exchange Commission, and the return and subsequent ouster of the company’s CEO following an extended medical leave. The turmoil ultimately led to reputational damage for Valeant, weakness in its core business segments, and a material lowering of 2016 earnings estimates. The remaining shares of Valeant were eliminated from the Portfolio in March 2016.
A relative underweight to the Industrials sector detracted from relative performance, although to a lesser extent than stock selection. Shares of American Airlines declined after issuing disappointing guidance for passenger revenue per available seat mile, a key performance metric in the airline industry. U.S. airline stocks have also been pressured by the strength of the U.S. dollar, which makes tickets more expensive for foreign customers. The stock rebounded slightly toward the end of the quarter after reporting that passenger traffic rose in May, but it came under severe stress following the Brexit vote late in the quarter on concerns that global travel would be impacted.
On the positive side, stock selection in Materials was the largest contributor to relative returns for the period, offsetting an underweight allocation. Martin Marietta Materials was a top contributor in the sector and shares of the firm increased after the construction materials company reported quarterly earnings that significantly exceeded expectations. Despite an unsupportive macroeconomic backdrop, sales of aggregates increased due to volume growth and price improvement. We believe Martin Marietta Materials is poised for continued modest growth from increases in state-financed infrastructure projects and nonresidential construction in the U.S.
At period end, the Portfolio was underweight Industrials (versus an overweight on December 31, 2015). Meanwhile, the Portfolio’s exposure to Financials shifted from underweight to overweight. We
MSF-1
Metropolitan Series Fund
T. Rowe Price Large Cap Growth Portfolio
Managed By T. Rowe Price Associates, Inc.
Portfolio Manager Commentary*—(Continued)
continued to maintain a relatively modest exposure to the sector and are focused on select, high-quality wireless infrastructure providers, which are structured as real estate investment trusts, and high-quality asset managers and financial exchanges that have solid balance sheets and unique company-specific growth opportunities.
Joseph B. Fath
Portfolio Manager
T. Rowe Price Associates, Inc.
* This commentary may include statements that constitute “forward-looking statements” under the U.S. securities laws. Forward-looking statements include, among other things, projections, estimates, and information about possible or future results related to the Portfolio, market or regulatory developments. The views expressed above are not guarantees of future performance or economic results and involve certain risks, uncertainties and assumptions that could cause actual outcomes and results to differ materially from the views expressed herein. The views expressed above are subject to change at any time based upon economic, market, or other conditions and the subadvisory firm undertakes no obligation to update the views expressed herein. Any discussions of specific securities should not be considered a recommendation to buy or sell those securities. The views expressed above (including any forward-looking statement) may not be relied upon as investment advice or as an indication of the Portfolio’s trading intent. Information about the Portfolio’s holdings, asset allocation or country diversification is historical and is not an indication of future Portfolio composition, which may vary. Direct investment in any index is not possible. The performance of any index mentioned in this commentary has not been adjusted for ongoing management, distribution and operating expenses, and sales charges applicable to mutual fund investments. In addition, the returns do not reflect additional fees charged by separate accounts or variable insurance contracts that an investor in the Portfolio may pay. If these additional fees were reflected, performance would have been lower.
MSF-2
Metropolitan Series Fund
T. Rowe Price Large Cap Growth Portfolio
A $10,000 INVESTMENT COMPARED TO THE RUSSELL 1000 GROWTH INDEX
SIX MONTH RETURN & AVERAGE ANNUAL RETURNS (%) AS OF JUNE 30, 2016
| | | | | | | | | | | | | | | | |
| | | 6 Month | | | 1 Year | | | 5 Year | | | 10 Year | |
| T. Rowe Price Large Cap Growth Portfolio | | | | | | | | | | | | | | | | |
Class A | | | -5.80 | | | | -2.58 | | | | 12.12 | | | | 8.40 | |
Class B | | | -5.94 | | | | -2.82 | | | | 11.83 | | | | 8.12 | |
Class E | | | -5.91 | | | | -2.76 | | | | 11.95 | | | | 8.23 | |
| Russell 1000 Growth Index | | | 1.36 | | | | 3.02 | | | | 12.34 | | | | 8.78 | |
1 The Russell 1000 Growth Index is an unmanaged measure of performance of the largest capitalized U.S. companies, within the Russell 1000 companies, that have higher price-to-book ratios and forecasted growth values.
Portfolio performance is calculated including reinvestment of all income and capital gain distributions. Performance numbers are net of all Portfolio expenses but do not include any insurance, sales, separate account or administrative charges of variable annuity or life insurance contracts or any additional expenses that participants may bear relating to the operations of their plans. If these charges were included, the returns would be lower. The performance of any index referenced above has not been adjusted for ongoing management, distribution and operating expenses, and sales charges applicable to mutual fund investments. Direct investment in any index is not possible. The performance of Class A shares, as set forth in the line graph above, will differ from that of other classes because of the difference in expenses paid by policyholders investing in the different share classes.
This information represents past performance and is not indicative of future results. Investment return and principal value may fluctuate so that shares, upon redemption, may be worth more or less than the original cost.
PORTFOLIO COMPOSITION AS OF JUNE 30, 2016
Top Holdings
| | | | |
| | | % of
Net Assets | |
Amazon.com, Inc. | | | 8.4 | |
Facebook, Inc. - Class A | | | 4.3 | |
Priceline Group, Inc. (The) | | | 4.0 | |
Alphabet, Inc. - Class A | | | 3.3 | |
Microsoft Corp. | | | 3.1 | |
Alphabet, Inc. - Class C | | | 2.9 | |
Apple, Inc. | | | 2.9 | |
Danaher Corp. | | | 2.7 | |
Visa, Inc. - Class A | | | 2.7 | |
Bristol-Myers Squibb Co. | | | 2.6 | |
Top Sectors
| | | | |
| | | % of
Net Assets | |
Information Technology | | | 32.8 | |
Consumer Discretionary | | | 25.9 | |
Health Care | | | 18.4 | |
Industrials | | | 8.6 | |
Financials | | | 7.4 | |
Consumer Staples | | | 3.7 | |
Materials | | | 1.1 | |
Telecommunication Services | | | 0.5 | |
MSF-3
Metropolitan Series Fund
T. Rowe Price Large Cap Growth Portfolio
Understanding Your Portfolio’s Expenses (Unaudited)
Shareholder Expense Example
As a shareholder of the Portfolio, you incur ongoing costs, including management fees; distribution and service (12b-1) fees; and other Portfolio expenses. This example is intended to help you understand your ongoing costs (in dollars) (referred to as “expenses”) of investing in the Portfolio and compare these costs with the ongoing costs of investing in other mutual funds. The example is based on an investment of $1,000 invested at the beginning of the period and held for the entire period, January 1, 2016 through June 30, 2016.
Actual Expenses
The first line for each share class of the Portfolio in the table below provides information about actual account values and actual expenses. You may use the information in this line, together with the amount you invested in the particular share class of the Portfolio, to estimate the expenses that you paid over the period. Simply divide your account value by $1,000 (for example, an $8,600 account value divided by $1,000 = 8.6), then multiply the result by the number in the first line under the heading entitled “Expenses Paid During Period” to estimate the expenses you paid on your account during this period.
Hypothetical Example for Comparison Purposes
The second line for each share class of the Portfolio in the table below provides information about hypothetical account values and hypothetical expenses based on the Portfolio’s actual expense ratio and an assumed rate of return of 5% per year before expenses, which is not the Portfolio’s actual return. The hypothetical account values and expenses may not be used to estimate the actual ending account balance or expenses you paid for the period. You may use this information to compare the ongoing costs of investing in the Portfolio and other funds. To do so, compare this 5% hypothetical example with the 5% hypothetical examples that appear in the shareholder reports of the other funds.
Please note that the expenses shown in the table are meant to highlight your ongoing costs only and do not reflect any fees or charges of your variable insurance product or any additional expenses that participants in certain eligible qualified plans may bear relating to the operations of their plan. Therefore, the second line for each share class in the table is useful in comparing ongoing costs only, and will not help you determine the relative total costs of owning different funds. In addition, if these other costs were included, your costs would have been higher.
| | | | | | | | | | | | | | | | | | |
T. Rowe Price Large Cap Growth Portfolio | | | | Annualized
Expense
Ratio | | | Beginning
Account Value
January 1,
2016 | | | Ending
Account Value
June 30,
2016 | | | Expenses Paid
During Period**
January 1, 2016
to
June 30,
2016 | |
Class A(a) | | Actual | | | 0.58 | % | | $ | 1,000.00 | | | $ | 942.00 | | | $ | 2.80 | |
| | Hypothetical* | | | 0.58 | % | | $ | 1,000.00 | | | $ | 1,021.98 | | | $ | 2.92 | |
| | | | | |
Class B(a) | | Actual | | | 0.83 | % | | $ | 1,000.00 | | | $ | 940.60 | | | $ | 4.00 | |
| | Hypothetical* | | | 0.83 | % | | $ | 1,000.00 | | | $ | 1,020.74 | | | $ | 4.17 | |
| | | | | |
Class E(a) | | Actual | | | 0.73 | % | | $ | 1,000.00 | | | $ | 940.90 | | | $ | 3.52 | |
| | Hypothetical* | | | 0.73 | % | | $ | 1,000.00 | | | $ | 1,021.23 | | | $ | 3.67 | |
* Hypothetical assumes a rate of return of 5% per year before expenses.
** Expenses paid are equal to the Portfolio’s annualized expense ratio for the most recent six month period, as shown above, multiplied by the average account value over the period, multiplied by the number of days (182 days) in the most recent fiscal half-year, divided by 366 (to reflect the one-half year period).
(a) The annualized expense ratio shown reflects the impact of the management fee waiver as described in Note 5 of the Notes to Financial Statements.
MSF-4
Metropolitan Series Fund
T. Rowe Price Large Cap Growth Portfolio
Schedule of Investments as of June 30, 2016 (Unaudited)
Common Stocks—97.2% of Net Assets
| | | | | | | | |
| Security Description | | Shares | | | Value | |
| |
Aerospace & Defense—1.2% | | | | |
Boeing Co. (The) | | | 206,700 | | | $ | 26,844,129 | |
| | | | | | | | |
|
Air Freight & Logistics—0.6% | |
FedEx Corp. | | | 89,200 | | | | 13,538,776 | |
| | | | | | | | |
|
Airlines—1.8% | |
American Airlines Group, Inc. (a) | | | 1,042,200 | | | | 29,504,682 | |
Delta Air Lines, Inc. | | | 102,225 | | | | 3,724,057 | |
United Continental Holdings, Inc. (b) | | | 148,912 | | | | 6,111,348 | |
| | | | | | | | |
| | | | | | | 39,340,087 | |
| | | | | | | | |
|
Auto Components—0.9% | |
BorgWarner, Inc. (a) | | | 298,100 | | | | 8,799,912 | |
Delphi Automotive plc | | | 184,300 | | | | 11,537,180 | |
| | | | | | | | |
| | | | | | | 20,337,092 | |
| | | | | | | | |
|
Automobiles—1.8% | |
Ferrari NV | | | 246,820 | | | | 10,102,343 | |
Tesla Motors, Inc. (a) (b) | | | 137,820 | | | | 29,256,429 | |
| | | | | | | | |
| | | | | | | 39,358,772 | |
| | | | | | | | |
|
Biotechnology—3.9% | |
Alexion Pharmaceuticals, Inc. (b) | | | 181,667 | | | | 21,211,439 | |
Biogen, Inc. (b) | | | 66,690 | | | | 16,126,976 | |
BioMarin Pharmaceutical, Inc. (b) | | | 47,000 | | | | 3,656,600 | |
Celgene Corp. (b) | | | 154,634 | | | | 15,251,551 | |
Gilead Sciences, Inc. | | | 61,400 | | | | 5,121,988 | |
Incyte Corp. (b) | | | 57,200 | | | | 4,574,856 | |
Vertex Pharmaceuticals, Inc. (b) | | | 213,800 | | | | 18,391,076 | |
| | | | | | | | |
| | | | | | | 84,334,486 | |
| | | | | | | | |
|
Capital Markets—2.8% | |
BlackRock, Inc. | | | 16,700 | | | | 5,720,251 | |
Morgan Stanley | | | 1,102,700 | | | | 28,648,146 | |
State Street Corp. | | | 217,800 | | | | 11,743,776 | |
TD Ameritrade Holding Corp. (a) | | | 520,641 | | | | 14,825,253 | |
| | | | | | | | |
| | | | | | | 60,937,426 | |
| | | | | | | | |
|
Chemicals—0.7% | |
Ashland, Inc. | | | 133,600 | | | | 15,333,272 | |
| | | | | | | | |
|
Communications Equipment—0.2% | |
Palo Alto Networks, Inc. (a) (b) | | | 42,000 | | | | 5,150,880 | |
| | | | | | | | |
|
Construction Materials—0.4% | |
Martin Marietta Materials, Inc. (a) | | | 46,600 | | | | 8,947,200 | |
| | | | | | | | |
|
Diversified Financial Services—1.1% | |
Intercontinental Exchange, Inc. | | | 96,308 | | | | 24,650,996 | |
| | | | | | | | |
|
Food & Staples Retailing—1.6% | |
Costco Wholesale Corp. | | | 59,300 | | | | 9,312,472 | |
Walgreens Boots Alliance, Inc. | | | 313,100 | | | | 26,071,837 | |
| | | | | | | | |
| | | | | | | 35,384,309 | |
| | | | | | | | |
|
Food Products—0.7% | |
Mondelez International, Inc. - Class A | | | 339,300 | | | | 15,441,543 | |
| | | | | | | | |
|
Health Care Equipment & Supplies—2.6% | |
Intuitive Surgical, Inc. (b) | | | 54,700 | | | | 36,179,127 | |
Stryker Corp. (a) | | | 174,900 | | | | 20,958,267 | |
| | | | | | | | |
| | | | | | | 57,137,394 | |
| | | | | | | | |
|
Health Care Providers & Services—6.6% | |
Aetna, Inc. | | | 204,150 | | | | 24,932,839 | |
Anthem, Inc. | | | 185,900 | | | | 24,416,106 | |
Cigna Corp. | | | 128,700 | | | | 16,472,313 | |
Humana, Inc. | | | 143,694 | | | | 25,847,677 | |
McKesson Corp. | | | 110,700 | | | | 20,662,155 | |
UnitedHealth Group, Inc. | | | 225,200 | | | | 31,798,240 | |
| | | | | | | | |
| | | | | | | 144,129,330 | |
| | | | | | | | |
|
Hotels, Restaurants & Leisure—4.2% | |
Hilton Worldwide Holdings, Inc. (a) | | | 554,700 | | | | 12,497,391 | |
Las Vegas Sands Corp. | | | 226,600 | | | | 9,854,834 | |
Marriott International, Inc. - Class A (a) | | | 248,700 | | | | 16,528,602 | |
MGM Resorts International (b) | | | 1,141,720 | | | | 25,837,124 | |
Royal Caribbean Cruises, Ltd. (a) | | | 138,200 | | | | 9,280,130 | |
Starbucks Corp. | | | 308,200 | | | | 17,604,384 | |
| | | | | | | | |
| | | | | | | 91,602,465 | |
| | | | | | | | |
|
Industrial Conglomerates—3.6% | |
Danaher Corp. | | | 593,300 | | | | 59,923,300 | |
Roper Technologies, Inc. | | | 104,340 | | | | 17,796,230 | |
| | | | | | | | |
| | | | | | | 77,719,530 | |
| | | | | | | | |
|
Internet & Catalog Retail—13.8% | |
Amazon.com, Inc. (b) | | | 257,205 | | | | 184,061,042 | |
Ctrip.com International, Ltd. (ADR) (b) | | | 81,800 | | | | 3,370,160 | |
Netflix, Inc. (a) (b) | | | 280,800 | | | | 25,687,584 | |
Priceline Group, Inc. (The) (b) | | | 70,440 | | | | 87,938,001 | |
| | | | | | | | |
| | | | | | | 301,056,787 | |
| | | | | | | | |
|
Internet Software & Services—12.9% | |
Alphabet, Inc. - Class A (b) | | | 103,670 | | | | 72,934,955 | |
Alphabet, Inc. - Class C (b) | | | 92,302 | | | | 63,882,214 | |
Dropbox, Inc. - Class A (b) (c) (d) | | | 214,763 | | | | 1,698,775 | |
Facebook, Inc. - Class A (b) | | | 818,900 | | | | 93,583,892 | |
Tencent Holdings, Ltd. | | | 1,392,385 | | | | 31,756,934 | |
VeriSign, Inc. (a) (b) | | | 218,900 | | | | 18,926,094 | |
| | | | | | | | |
| | | | | | | 282,782,864 | |
| | | | | | | | |
|
IT Services—6.5% | |
Fiserv, Inc. (b) | | | 143,200 | | | | 15,570,136 | |
MasterCard, Inc. - Class A | | | 590,200 | | | | 51,973,012 | |
PayPal Holdings, Inc. (b) | | | 448,400 | | | | 16,371,084 | |
Visa, Inc. - Class A (a) | | | 790,120 | | | | 58,603,200 | |
| | | | | | | | |
| | | | | | | 142,517,432 | |
| | | | | | | | |
See accompanying notes to financial statements.
MSF-5
Metropolitan Series Fund
T. Rowe Price Large Cap Growth Portfolio
Schedule of Investments as of June 30, 2016 (Unaudited)
Common Stocks—(Continued)
| | | | | | | | |
| Security Description | | Shares | | | Value | |
|
Life Sciences Tools & Services—0.4% | |
Illumina, Inc. (b) | | | 58,800 | | | $ | 8,254,344 | |
| | | | | | | | |
|
Machinery—0.9% | |
Flowserve Corp. (a) | | | 103,481 | | | | 4,674,237 | |
Illinois Tool Works, Inc. | | | 32,100 | | | | 3,343,536 | |
Wabtec Corp. (a) | | | 155,777 | | | | 10,940,219 | |
| | | | | | | | |
| | | | | | | 18,957,992 | |
| | | | | | | | |
|
Media—0.2% | |
Walt Disney Co. (The) | | | 40,846 | | | | 3,995,556 | |
| | | | | | | | |
|
Pharmaceuticals—4.9% | |
Allergan plc (b) | | | 172,983 | | | | 39,974,641 | |
Bristol-Myers Squibb Co. | | | 765,200 | | | | 56,280,460 | |
Zoetis, Inc. | | | 231,600 | | | | 10,991,736 | |
| | | | | | | | |
| | | | | | | 107,246,837 | |
| | | | | | | | |
|
Professional Services—0.4% | |
IHS, Inc. - Class A (b) | | | 66,800 | | | | 7,722,748 | |
| | | | | | | | |
|
Real Estate Investment Trusts—3.4% | |
American Tower Corp. | | | 377,400 | | | | 42,876,414 | |
Crown Castle International Corp. | | | 223,178 | | | | 22,636,945 | |
Equinix, Inc. | | | 19,800 | | | | 7,677,054 | |
| | | | | | | | |
| | | | | | | 73,190,413 | |
| | | | | | | | |
|
Real Estate Management & Development—0.0% | |
WeWork Cos., Inc. - Class A (b) (c) (d) | | | 7,199 | | | | 270,999 | |
| | | | | | | | |
|
Road & Rail—0.2% | |
Kansas City Southern | | | 38,900 | | | | 3,504,501 | |
| | | | | | | | |
|
Semiconductors & Semiconductor Equipment—2.1% | |
ASML Holding NV (a) | | | 186,800 | | | | 18,532,428 | |
NXP Semiconductors NV (b) | | | 338,700 | | | | 26,533,758 | |
| | | | | | | | |
| | | | | | | 45,066,186 | |
| | | | | | | | |
|
Software—7.0% | |
Microsoft Corp. | | | 1,315,800 | | | | 67,329,486 | |
Mobileye NV (a) (b) | | | 549,400 | | | | 25,349,316 | |
NetSuite, Inc. (a) (b) | | | 139,000 | | | | 10,119,200 | |
Salesforce.com, Inc. (b) | | | 431,760 | | | | 34,286,062 | |
ServiceNow, Inc. (b) | | | 248,300 | | | | 16,487,120 | |
| | | | | | | | |
| | | | | | | 153,571,184 | |
| | | | | | | | |
|
Specialty Retail—4.2% | |
AutoZone, Inc. (a) (b) | | | 30,778 | | | | 24,432,807 | |
Lowe’s Cos., Inc. | | | 369,600 | | | | 29,261,232 | |
Ross Stores, Inc. | | | 286,500 | | | | 16,241,685 | |
Tractor Supply Co. | | | 239,982 | | | | 21,881,559 | |
| | | | | | | | |
| | | | | | | 91,817,283 | |
| | | | | | | | |
|
Technology Hardware, Storage & Peripherals—2.9% | |
Apple, Inc. | | | 660,440 | | | | 63,138,064 | |
| | | | | | | | |
|
Textiles, Apparel & Luxury Goods—0.8% | |
Hanesbrands, Inc. | | | 722,800 | | | | 18,163,964 | |
| | | | | | | | |
|
Tobacco—1.4% | |
Philip Morris International, Inc. | | | 296,500 | | | | 30,159,980 | |
| | | | | | | | |
|
Wireless Telecommunication Services—0.5% | |
T-Mobile U.S., Inc. (a) (b) | | | 272,700 | | | | 11,799,729 | |
| | | | | | | | |
Total Common Stocks
(Cost $1,723,725,412) | | | | | | | 2,123,404,550 | |
| | | | | | | | |
|
| Convertible Preferred Stocks—1.2% | |
|
Internet Software & Services—0.6% | |
Airbnb, Inc. - Series D (b) (c) (d) | | | 97,047 | | | | 8,786,635 | |
Airbnb, Inc. - Series E (b) (c) (d) | | | 9,760 | | | | 883,671 | |
Living Social, Inc. - Class F (b) (c) (d) | | | 101,591 | | | | 0 | |
Xiaoju Kuaizhi, Inc. -
Series A-17 (b) (c) (d) | | | 91,053 | | | | 3,480,692 | |
| | | | | | | | |
| | | | | | | 13,150,998 | |
| | | | | | | | |
|
Real Estate Management & Development—0.1% | |
WeWork Cos., Inc. -
Series E (b) (c) (d) | | | 64,744 | | | | 2,437,223 | |
| | | | | | | | |
|
Software—0.5% | |
Magic Leap, Inc. - Series C (b) (c) (d) | | | 124,428 | | | | 2,865,950 | |
Snapchat, Inc. - Series F (b) (c) (d) | | | 108,803 | | | | 3,342,428 | |
UBER Technologies, Inc. -
Series G (b) (c) (d) | | | 98,227 | | | | 4,790,747 | |
| | | | | | | | |
| | | | | | | 10,999,125 | |
| | | | | | | | |
Total Convertible Preferred Stocks
(Cost $21,266,679) | | | | | | | 26,587,346 | |
| | | | | | | | |
|
| Short-Term Investments—7.7% | |
|
Mutual Funds—7.7% | |
State Street Navigator Securities Lending MET Portfolio (e) | | | 132,202,333 | | | | 132,202,333 | |
T. Rowe Price Government Reserve Investment Fund (f) | | | 36,906,298 | | | | 36,906,298 | |
| | | | | | | | |
Total Short-Term Investments
(Cost $169,108,631) | | | | | | | 169,108,631 | |
| | | | | | | | |
Total Investments—106.1%
(Cost $1,914,100,722) (g) | | | | | | | 2,319,100,527 | |
Other assets and liabilities
(net)—(6.1)% | | | | | | | (133,454,323 | ) |
| | | | | | | | |
| Net Assets—100.0% | | | | | | $ | 2,185,646,204 | |
| | | | | | | | |
| (a) | All or a portion of the security was held on loan. As of June 30, 2016, the market value of securities loaned was $237,610,537 and the collateral received consisted of cash in the amount of $132,202,333 and non-cash collateral with a value of $108,596,763. The cash collateral is invested in a money market fund managed by an affiliate of the custodian. The non-cash collateral received consists primarily of government securities and bank letters of credit, and is held for the benefit of the Portfolio at the Portfolio’s custodian. The Portfolio cannot repledge or resell this collateral. As such, this collateral is excluded from the Statement of Assets and Liabilities. |
See accompanying notes to financial statements.
MSF-6
Metropolitan Series Fund
T. Rowe Price Large Cap Growth Portfolio
Schedule of Investments as of June 30, 2016 (Unaudited)
| (b) | Non-income producing security. |
| (c) | Security was valued in good faith under procedures approved by the Board of Trustees. As of June 30, 2016, these securities represent 1.3% of net assets. |
| (d) | Restricted securities are not registered under the Securities Act of 1933 and are subject to legal restrictions on resale. These securities generally may be resold in transactions exempt from registration or to the public if the securities are subsequently registered. Disposal of these securities may involve time-consuming negotiations and prompt sale at an acceptable price may be difficult. As of June 30, 2016, the market value of restricted securities was $28,557,120, which is 1.3% of net assets. See details shown in the Restricted Securities table that follows. |
| (e) | Represents investment of cash collateral received from securities on loan as of June 30, 2016. |
| (f) | Affiliated Issuer. (See Note 6 of the Notes to Financial Statements for a summary of transactions in securities of affiliated issuers.) |
| (g) | As of June 30, 2016, the aggregate cost of investments was $1,914,100,722. The aggregate unrealized appreciation and depreciation of investments were $479,177,625 and $(74,177,820), respectively, resulting in net unrealized appreciation of $404,999,805. |
| (ADR)— | An American Depositary Receipt is a certificate issued by a custodian bank representing the right to receive securities of the foreign issuer described. Trading on exchanges not located in the United States or Canada significantly influences the value of ADRs. |
| | | | | | | | | | | | | | | | |
Restricted Securities | | Acquisition
Date | | | Shares | | | Cost | | | Value | |
Airbnb, Inc. - Series D | | | 04/16/14 | | | | 97,047 | | | $ | 3,951,078 | | | $ | 8,786,635 | |
Airbnb, Inc. - Series E | | | 07/14/15 | | | | 9,760 | | | | 908,601 | | | | 883,671 | |
Dropbox, Inc. - Class A | | | 11/07/14 | | | | 214,763 | | | | 4,102,231 | | | | 1,698,775 | |
Living Social, Inc. - Class F | | | 11/18/11 | | | | 101,591 | | | | 781,235 | | | | 0 | |
Magic Leap, Inc. - Series C | | | 01/20/16 | | | | 124,428 | | | | 2,865,950 | | | | 2,865,950 | |
Snapchat, Inc. - Series F | | | 05/06/16 | | | | 108,803 | | | | 3,342,428 | | | | 3,342,428 | |
UBER Technologies, Inc. - Series G | | | 12/03/15 | | | | 98,227 | | | | 4,790,747 | | | | 4,790,747 | |
WeWork Cos., Inc. - Class A | | | 06/23/15 | | | | 7,199 | | | | 236,772 | | | | 270,999 | |
WeWork Cos., Inc. - Series E | | | 06/23/15 | | | | 64,744 | | | | 2,129,402 | | | | 2,437,223 | |
Xiaoju Kuaizhi, Inc. - Series A-17 | | | 10/19/15 | | | | 91,053 | | | | 2,497,238 | | | | 3,480,692 | |
| | | | | | | | | | | | | | | | |
| | | | | | | | | | | | | | $ | 28,557,120 | |
| | | | | | | | | | | | | | | | |
See accompanying notes to financial statements.
MSF-7
Metropolitan Series Fund
T. Rowe Price Large Cap Growth Portfolio
Schedule of Investments as of June 30, 2016 (Unaudited)
Fair Value Hierarchy
Accounting principles generally accepted in the United States of America (“GAAP”) define fair market value as the price that the Portfolio would receive to sell an asset or pay to transfer a liability in an orderly transaction between market participants at the measurement date. It establishes a fair value hierarchy that prioritizes inputs to valuation methods and requires disclosure of the fair value hierarchy, separately for each major category of assets and liabilities, that segregates fair value measurements into three levels. Levels 1, 2 and 3 of the fair value hierarchy are defined as follows:
Level 1 - unadjusted quoted prices in active markets for identical investments
Level 2 - other significant observable inputs (including, but not limited to, quoted prices for similar assets or liabilities in markets that are either active or inactive; inputs other than quoted prices that are observable such as interest rates, yield curves, volatilities, prepayment speeds, loss severities, credit risks, default rates, or other market corroborated inputs)
Level 3 - significant unobservable inputs based on the best information available in the circumstances, to the extent observable inputs are unavailable (including the Portfolio’s own assumptions used in determining the fair value of investments and derivative financial instruments)
The inputs or methodologies used for valuing investments are not necessarily an indication of the risk associated with investing in them. Changes to the inputs or methodologies used may result in transfers between levels, which will be recognized as of the beginning of the reporting period. Information on transfers between Level 1 and Level 2, if any, will be disclosed following the fair value hierarchy table below. A reconciliation of Level 3 securities, if any, will also be disclosed following the fair value hierarchy table. For more information about the Portfolio’s policy regarding the valuation of investments, please refer to the Notes to Financial Statements.
The following table summarizes the fair value hierarchy of the Portfolio’s investments as of June 30, 2016:
| | | | | | | | | | | | | | | | |
| Description | | Level 1 | | | Level 2 | | | Level 3 | | | Total | |
| Common Stocks | | | | | | | | | | | | | | | | |
Aerospace & Defense | | $ | 26,844,129 | | | $ | — | | | $ | — | | | $ | 26,844,129 | |
Air Freight & Logistics | | | 13,538,776 | | | | — | | | | — | | | | 13,538,776 | |
Airlines | | | 39,340,087 | | | | — | | | | — | | | | 39,340,087 | |
Auto Components | | | 20,337,092 | | | | — | | | | — | | | | 20,337,092 | |
Automobiles | | | 39,358,772 | | | | — | | | | — | | | | 39,358,772 | |
Biotechnology | | | 84,334,486 | | | | — | | | | — | | | | 84,334,486 | |
Capital Markets | | | 60,937,426 | | | | — | | | | — | | | | 60,937,426 | |
Chemicals | | | 15,333,272 | | | | — | | | | — | | | | 15,333,272 | |
Communications Equipment | | | 5,150,880 | | | | — | | | | — | | | | 5,150,880 | |
Construction Materials | | | 8,947,200 | | | | — | | | | — | | | | 8,947,200 | |
Diversified Financial Services | | | 24,650,996 | | | | — | | | | — | | | | 24,650,996 | |
Food & Staples Retailing | | | 35,384,309 | | | | — | | | | — | | | | 35,384,309 | |
Food Products | | | 15,441,543 | | | | — | | | | — | | | | 15,441,543 | |
Health Care Equipment & Supplies | | | 57,137,394 | | | | — | | | | — | | | | 57,137,394 | |
Health Care Providers & Services | | | 144,129,330 | | | | — | | | | — | | | | 144,129,330 | |
Hotels, Restaurants & Leisure | | | 91,602,465 | | | | — | | | | — | | | | 91,602,465 | |
Industrial Conglomerates | | | 77,719,530 | | | | — | | | | — | | | | 77,719,530 | |
Internet & Catalog Retail | | | 301,056,787 | | | | — | | | | — | | | | 301,056,787 | |
Internet Software & Services | | | 249,327,155 | | | | 31,756,934 | | | | 1,698,775 | | | | 282,782,864 | |
IT Services | | | 142,517,432 | | | | — | | | | — | | | | 142,517,432 | |
Life Sciences Tools & Services | | | 8,254,344 | | | | — | | | | — | | | | 8,254,344 | |
Machinery | | | 18,957,992 | | | | — | | | | — | | | | 18,957,992 | |
Media | | | 3,995,556 | | | | — | | | | — | | | | 3,995,556 | |
Pharmaceuticals | | | 107,246,837 | | | | — | | | | — | | | | 107,246,837 | |
Professional Services | | | 7,722,748 | | | | — | | | | — | | | | 7,722,748 | |
Real Estate Investment Trusts | | | 73,190,413 | | | | — | | | | — | | | | 73,190,413 | |
Real Estate Management & Development | | | — | | | | — | | | | 270,999 | | | | 270,999 | |
Road & Rail | | | 3,504,501 | | | | — | | | | — | | | | 3,504,501 | |
Semiconductors & Semiconductor Equipment | | | 45,066,186 | | | | — | | | | — | | | | 45,066,186 | |
Software | | | 153,571,184 | | | | — | | | | — | | | | 153,571,184 | |
Specialty Retail | | | 91,817,283 | | | | — | | | | — | | | | 91,817,283 | |
Technology Hardware, Storage & Peripherals | | | 63,138,064 | | | | — | | | | — | | | | 63,138,064 | |
Textiles, Apparel & Luxury Goods | | | 18,163,964 | | | | — | | | | — | | | | 18,163,964 | |
See accompanying notes to financial statements.
MSF-8
Metropolitan Series Fund
T. Rowe Price Large Cap Growth Portfolio
Schedule of Investments as of June 30, 2016 (Unaudited)
Fair Value Hierarchy—(Continued)
| | | | | | | | | | | | | | | | |
| Description | | Level 1 | | | Level 2 | | | Level 3 | | | Total | |
Tobacco | | $ | 30,159,980 | | | $ | — | | | $ | — | | | $ | 30,159,980 | |
Wireless Telecommunication Services | | | 11,799,729 | | | | — | | | | — | | | | 11,799,729 | |
Total Common Stocks | | | 2,089,677,842 | | | | 31,756,934 | | | | 1,969,774 | | | | 2,123,404,550 | |
Total Convertible Preferred Stocks* | | | — | | | | — | | | | 26,587,346 | | | | 26,587,346 | |
Total Short-Term Investments* | | | 169,108,631 | | | | — | | | | — | | | | 169,108,631 | |
Total Investments | | $ | 2,258,786,473 | | | $ | 31,756,934 | | | $ | 28,557,120 | | | $ | 2,319,100,527 | |
| | | | | | | | | | | | | | | | | |
Collateral for Securities Loaned (Liability) | | $ | — | | | $ | (132,202,333 | ) | | $ | — | | | $ | (132,202,333 | ) |
| * | See Schedule of Investments for additional detailed categorizations. |
Following is a reconciliation of Level 3 assets for which significant unobservable inputs were used to determine fair value:
| | | | | | | | | | | | | | | | | | | | |
Investments in Securities | | Balance as of
December 31,
2015 | | | Change in
Unrealized
Appreciation/
Depreciation | | | Purchases | | | Balance as of
June 30,
2016 | | | Change in Unrealized
Appreciation/
Depreciation from
Investments Still Held at
June 30, 2016 | |
| Common Stock | | | | | | | | | | | | | | | | | | | | |
Internet Software & Services | | $ | 2,018,772 | | | $ | (319,997 | ) | | | — | | | $ | 1,698,775 | | | $ | (319,997 | ) |
Real Estate Management & Development | | | 236,772 | | | | 34,227 | | | | — | | | | 270,999 | | | | 34,227 | |
| Convertible Preferred Stocks | | | | | | | | | | | | | | | | | | | | |
Internet Software & Services | | | 11,718,487 | | | | 1,432,511 | | | | — | | | | 13,150,998 | | | | 1,432,511 | |
Real Estate Management & Development | | | 2,129,403 | | | | 307,820 | | | | — | | | | 2,437,223 | | | | 307,820 | |
Software | | | 4,790,750 | | | | (3 | ) | | | 6,208,378 | | | | 10,999,125 | | | | (3 | ) |
| | | | | | | | | | | | | | | | | | | | |
Total | | $ | 20,894,184 | | | $ | 1,454,558 | | | $ | 6,208,378 | | | $ | 28,557,120 | | | $ | 1,454,558 | |
| | | | | | | | | | | | | | | | | | | | |
Following is quantitative information about Level 3 fair value measurements:
| | | | | | | | | | | | | | | | | | | | | | | | |
| | | Fair Value
at
June 30,
2016 | | | Valuation
Technique(s) | | Unobservable
Input | | Range | | | Weighted
Average | | | Relationship
Between
Fair Value
and Input;
if input value
increases
then Fair
Value: | |
| Common Stock | | | | | | | | | | | | | | | | | | | | | | | | |
Internet Software & Services | | $ | 1,698,775 | | | Merger & Acquisition Transaction | | Enterprise
Value/Revenue | | | 8.0x | | | | 8.0x | | | | 8.0x | | | | Increase | |
| | | | | | Comparable Company Analysis | | Enterprise
Value/Revenue | | | 4.7x | | | | 4.7x | | | | 4.7x | | | | Increase | |
| | | | | | | | Discount for Lack of
Marketability | | | 10.00 | % | | | 10.00 | % | | | 10.00 | % | | | Decrease | |
Real Estate Management & Development | | | 270,999 | | | Market Transaction Method | | Precedent Transaction | | $ | 50.19 | | | $ | 50.19 | | | $ | 50.19 | | | | Increase | |
| | | | | | | | Discount for Lack of
Marketability | | | 25.00 | % | | | 25.00 | % | | | 25.00 | % | | | Decrease | |
| Convertible Preferred Stocks | | | | | | | | | | | | | | | | | | | | | | | | |
Internet Software & Services | | | 9,670,306 | | | Discounted Cash Flow | | Weighted Average
Cost of Capital | | | 16.00 | % | | | 18.00 | % | | | 17.00 | % | | | Decrease | |
| | | | | | | | Perpetual Growth Rate | | | 3.00 | % | | | 4.00 | % | | | 3.50 | % | | | Increase | |
| | | | | | Comparable Company Analysis | | Enterprise
Value/Revenue | | | 12.0x | | | | 12.0x | | | | 12.0x | | | | Increase | |
| | | | | | | | Discount for Lack of
Marketability | | | 20.00 | % | | | 20.00 | % | | | 20.00 | % | | | Decrease | |
| | | 0 | | | Asset Approach | | Liquidation Value | | $ | 0.00 | | | $ | 0.00 | | | $ | 0.00 | | | | Increase | |
| | | 3,480,692 | | | Market Transaction Method | | Precedent Transaction | | $ | 38.23 | | | $ | 38.23 | | | $ | 38.23 | | | | Increase | |
Real Estate Management & Development | | | 2,437,223 | | | Market Transaction Method | | Precedent Transaction | | $ | 50.19 | | | $ | 50.19 | | | $ | 50.19 | | | | Increase | |
| | | | | | | | Discount for Lack of
Marketability | | | 25.00 | % | | | 25.00 | % | | | 25.00 | % | | | Decrease | |
Software | | | 2,865,950 | | | Market Transaction Method | | Precedent Transaction | | $ | 23.03 | | | $ | 23.03 | | | $ | 23.03 | | | | Increase | |
| | | 3,342,428 | | | Market Transaction Method | | Precedent Transaction | | $ | 30.72 | | | $ | 30.72 | | | $ | 30.72 | | | | Increase | |
| | | 4,790,747 | | | Market Transaction Method | | Precedent Transaction | | $ | 48.77 | | | $ | 48.77 | | | $ | 48.77 | | | | Increase | |
See accompanying notes to financial statements.
MSF-9
Metropolitan Series Fund
T. Rowe Price Large Cap Growth Portfolio
Statement of Assets and Liabilities
June 30, 2016 (Unaudited)
| | | | |
Assets | | | | |
Investments at value (a) (b) | | $ | 2,282,194,229 | |
Affiliated investments at value (c) | | | 36,906,298 | |
Receivable for: | | | | |
Investments sold | | | 11,636,875 | |
Fund shares sold | | | 1,397,164 | |
Dividends | | | 1,370,282 | |
Dividends on affiliated investments | | | 6,927 | |
Prepaid expenses | | | 14,226 | |
| | | | |
Total Assets | | | 2,333,526,001 | |
Liabilities | | | | |
Collateral for securities loaned | | | 132,202,333 | |
Payables for: | | | | |
Investments purchased | | | 13,894,003 | |
Fund shares redeemed | | | 238,866 | |
Accrued Expenses: | | | | |
Management fees | | | 1,006,207 | |
Distribution and service fees | | | 148,021 | |
Deferred trustees’ fees | | | 107,300 | |
Other expenses | | | 283,067 | |
| | | | |
Total Liabilities | | | 147,879,797 | |
| | | | |
Net Assets | | $ | 2,185,646,204 | |
| | | | |
Net Assets Consist of: | | | | |
Paid in surplus | | $ | 1,735,946,033 | |
Undistributed net investment income | | | 3,611,888 | |
Accumulated net realized gain | | | 41,095,719 | |
Unrealized appreciation on investments and foreign currency transactions | | | 404,992,564 | |
| | | | |
Net Assets | | $ | 2,185,646,204 | |
| | | | |
Net Assets | | | | |
Class A | | $ | 1,452,452,580 | |
Class B | | | 698,132,407 | |
Class E | | | 35,061,217 | |
Capital Shares Outstanding* | | | | |
Class A | | | 77,766,245 | |
Class B | | | 37,984,126 | |
Class E | | | 1,891,801 | |
Net Asset Value, Offering Price and Redemption Price Per Share | | | | |
Class A | | $ | 18.68 | |
Class B | | | 18.38 | |
Class E | | | 18.53 | |
| * | The Portfolio is authorized to issue an unlimited number of shares. |
| (a) | Identified cost of investments, excluding affiliated investments, was $1,877,194,424. |
| (b) | Includes securities loaned at value of $237,610,537. |
| (c) | Identified cost of affiliated investments was $36,906,298. |
Statement of Operations
Six Months Ended June 30, 2016 (Unaudited)
| | | | |
Investment Income | | | | |
Dividends (a) | | $ | 9,342,797 | |
Dividends from affiliated investments | | | 37,088 | |
Securities lending income | | | 675,010 | |
| | | | |
Total investment income | | | 10,054,895 | |
Expenses | | | | |
Management fees | | | 6,483,119 | |
Administration fees | | | 27,319 | |
Custodian and accounting fees | | | 95,617 | |
Distribution and service fees—Class B | | | 870,881 | |
Distribution and service fees—Class E | | | 26,743 | |
Audit and tax services | | | 20,036 | |
Legal | | | 13,588 | |
Trustees’ fees and expenses | | | 15,990 | |
Shareholder reporting | | | 73,094 | |
Insurance | | | 7,441 | |
Miscellaneous | | | 13,599 | |
| | | | |
Total expenses | | | 7,647,427 | |
Less management fee waiver | | | (455,460 | ) |
Less broker commission recapture | | | (6,172 | ) |
| | | | |
Net expenses | | | 7,185,795 | |
| | | | |
Net Investment Income | | | 2,869,100 | |
| | | | |
Net Realized and Unrealized Gain (Loss) | | | | |
| Net realized gain on: | | | | |
Investments | | | 43,905,688 | |
Foreign currency transactions | | | 87 | |
| | | | |
Net realized gain | | | 43,905,775 | |
| | | | |
| Net change in unrealized appreciation (depreciation) on: | | | | |
Investments | | | (182,350,808 | ) |
Foreign currency transactions | | | 2,665 | |
| | | | |
Net change in unrealized depreciation | | | (182,348,143 | ) |
| | | | |
Net realized and unrealized loss | | | (138,442,368 | ) |
| | | | |
Net Decrease in Net Assets From Operations | | $ | (135,573,268 | ) |
| | | | |
| (a) | Net of foreign withholding taxes of $52,535. |
See accompanying notes to financial statements.
MSF-10
Metropolitan Series Fund
T. Rowe Price Large Cap Growth Portfolio
Statements of Changes in Net Assets
| | | | | | | | |
| | | Six Months
Ended
June 30,
2016
(Unaudited) | | | Year Ended
December 31,
2015 | |
Increase (Decrease) in Net Assets: | | | | | | | | |
From Operations | | | | | | | | |
Net investment income | | $ | 2,869,100 | | | $ | 1,955,094 | |
Net realized gain | | | 43,905,775 | | | | 277,364,162 | |
Net change in unrealized depreciation | | | (182,348,143 | ) | | | (33,254,026 | ) |
| | | | | | | | |
Increase (decrease) in net assets from operations | | | (135,573,268 | ) | | | 246,065,230 | |
| | | | | | | | |
From Distributions to Shareholders | | | | | | | | |
Net investment income | | | | | | | | |
Class A | | | (883,202 | ) | | | (2,222,739 | ) |
Net realized capital gains | | | | | | | | |
Class A | | | (183,909,807 | ) | | | (284,325,405 | ) |
Class B | | | (89,221,445 | ) | | | (118,081,761 | ) |
Class E | | | (4,487,412 | ) | | | (6,718,484 | ) |
| | | | | | | | |
Total distributions | | | (278,501,866 | ) | | | (411,348,389 | ) |
| | | | | | | | |
Increase in net assets from capital share transactions | | | 267,893,324 | | | | 106,410,312 | |
| | | | | | | | |
Total decrease in net assets | | | (146,181,810 | ) | | | (58,872,847 | ) |
| | |
Net Assets | | | | | | | | |
Beginning of period | | | 2,331,828,014 | | | | 2,390,700,861 | |
| | | | | | | | |
End of period | | $ | 2,185,646,204 | | | $ | 2,331,828,014 | |
| | | | | | | | |
Undistributed net investment income | | | | | | | | |
End of period | | $ | 3,611,888 | | | $ | 1,625,990 | |
| | | | | | | | |
Other Information:
Capital Shares
Transactions in capital shares were as follows:
| | | | | | | | | | | | | | | | |
| | | Six Months Ended
June 30, 2016
(Unaudited) | | | Year Ended
December 31, 2015 | |
| | | Shares | | | Value | | | Shares | | | Value | |
Class A | | | | | | | | | | | | | | | | |
Sales | | | 1,562,549 | | | $ | 32,606,983 | | | | 1,319,598 | | | $ | 31,306,653 | |
Reinvestments | | | 9,829,415 | | | | 184,793,009 | | | | 12,861,228 | | | | 286,548,144 | |
Redemptions | | | (1,498,500 | ) | | | (31,552,311 | ) | | | (15,383,857 | ) | | | (376,148,086 | ) |
| | | | | | | | | | | | | | | | |
Net increase (decrease) | | | 9,893,464 | | | $ | 185,847,681 | | | | (1,203,031 | ) | | $ | (58,293,289 | ) |
| | | | | | | | | | | | | | | | |
Class B | | | | | | | | | | | | | | | | |
Sales | | | 3,231,595 | | | $ | 65,437,964 | | | | 7,164,173 | | | $ | 165,681,094 | |
Reinvestments | | | 4,822,781 | | | | 89,221,445 | | | | 5,364,915 | | | | 118,081,761 | |
Redemptions | | | (3,621,373 | ) | | | (74,987,552 | ) | | | (5,189,456 | ) | | | (123,208,224 | ) |
| | | | | | | | | | | | | | | | |
Net increase | | | 4,433,003 | | | $ | 79,671,857 | | | | 7,339,632 | | | $ | 160,554,631 | |
| | | | | | | | | | | | | | | | |
Class E | | | | | | | | | | | | | | | | |
Sales | | | 79,395 | | | $ | 1,611,356 | | | | 210,050 | | | $ | 4,788,133 | |
Reinvestments | | | 240,483 | | | | 4,487,412 | | | | 303,317 | | | | 6,718,484 | |
Redemptions | | | (179,894 | ) | | | (3,724,982 | ) | | | (308,265 | ) | | | (7,357,647 | ) |
| | | | | | | | | | | | | | | | |
Net increase | | | 139,984 | | | $ | 2,373,786 | | | | 205,102 | | | $ | 4,148,970 | |
| | | | | | | | | | | | | | | | |
Increase derived from capital shares transactions | | | | | | $ | 267,893,324 | | | | | | | $ | 106,410,312 | |
| | | | | | | | | | | | | | | | |
See accompanying notes to financial statements.
MSF-11
Metropolitan Series Fund
T. Rowe Price Large Cap Growth Portfolio
Financial Highlights
| | | | | | | | | | | | | | | | | | | | | | | | |
| Selected per share data | | | |
| | | Class A | |
| | | Six Months
Ended
June 30,
2016
(Unaudited) | | | Year Ended December 31, | |
| | | | 2015 | | | 2014 | | | 2013 | | | 2012 | | | 2011 | |
Net Asset Value, Beginning of Period | | $ | 22.70 | | | $ | 24.76 | | | $ | 24.51 | | | $ | 17.67 | | | $ | 14.87 | | | $ | 15.05 | |
| | | | | | | | | | | | | | | | | | | | | | | | |
Income (Loss) from Investment Operations | | | | | | | | | | | | | | | | | | | | | | | | |
Net investment income (a) | | | 0.04 | | | | 0.04 | | | | 0.04 | | | | 0.03 | | | | 0.07 | | | | 0.03 | |
Net realized and unrealized gain (loss) on investments | | | (1.34 | ) | | | 2.55 | | | | 1.94 | | | | 6.87 | | | | 2.75 | | | | (0.20 | ) |
| | | | | | | | | | | | | | | | | | | | | | | | |
Total from investment operations | | | (1.30 | ) | | | 2.59 | | | | 1.98 | | | | 6.90 | | | | 2.82 | | | | (0.17 | ) |
| | | | | | | | | | | | | | | | | | | | | | | | |
Less Distributions | | | | | | | | | | | | | | | | | | | | | | | | |
Distributions from net investment income | | | (0.01 | ) | | | (0.04 | ) | | | (0.02 | ) | | | (0.06 | ) | | | (0.02 | ) | | | (0.01 | ) |
Distributions from net realized capital gains | | | (2.71 | ) | | | (4.61 | ) | | | (1.71 | ) | | | 0.00 | | | | 0.00 | | | | 0.00 | |
| | | | | | | | | | | | | | | | | | | | | | | | |
Total distributions | | | (2.72 | ) | | | (4.65 | ) | | | (1.73 | ) | | | (0.06 | ) | | | (0.02 | ) | | | (0.01 | ) |
| | | | | | | | | | | | | | | | | | | | | | | | |
Net Asset Value, End of Period | | $ | 18.68 | | | $ | 22.70 | | | $ | 24.76 | | | $ | 24.51 | | | $ | 17.67 | | | $ | 14.87 | |
| | | | | | | | | | | | | | | | | | | | | | | | |
Total Return (%) (b) | | | (5.80 | )(c) | | | 10.78 | | | | 9.09 | | | | 39.16 | | | | 18.97 | | | | (1.12 | ) |
| | | | | | |
Ratios/Supplemental Data | | | | | | | | | | | | | | | | | | | | | | | | |
Gross ratio of expenses to average net assets (%) | | | 0.63 | (d) | | | 0.62 | | | | 0.63 | | | | 0.63 | | | | 0.64 | | | | 0.64 | |
Net ratio of expenses to average net assets (%) (e)(f) | | | 0.58 | (d) | | | 0.58 | | | | 0.58 | | | | 0.58 | | | | 0.60 | | | | 0.60 | |
Ratio of net investment income to average net assets (%) | | | 0.35 | (d) | | | 0.16 | | | | 0.15 | | | | 0.14 | | | | 0.43 | | | | 0.18 | |
Portfolio turnover rate (%) | | | 21 | (c) | | | 35 | | | | 34 | | | | 41 | | | | 38 | | | | 33 | |
Net assets, end of period (in millions) | | $ | 1,452.5 | | | $ | 1,540.8 | | | $ | 1,710.2 | | | $ | 2,007.8 | | | $ | 1,328.9 | | | $ | 971.1 | |
| |
| | | Class B | |
| | | Six Months
Ended
June 30,
2016
(Unaudited) | | | Year Ended December 31, | |
| | | | 2015 | | | 2014 | | | 2013 | | | 2012 | | | 2011 | |
Net Asset Value, Beginning of Period | | $ | 22.40 | | | $ | 24.51 | | | $ | 24.32 | | | $ | 17.54 | | | $ | 14.78 | | | $ | 14.98 | |
| | | | | | | | | | | | | | | | | | | | | | | | |
Income (Loss) from Investment Operations | | | | | | | | | | | | | | | | | | | | | | | | |
Net investment income (loss) (a) | | | 0.01 | | | | (0.02 | ) | | | (0.02 | ) | | | (0.03 | ) | | | 0.02 | | | | (0.01 | ) |
Net realized and unrealized gain (loss) on investments | | | (1.32 | ) | | | 2.52 | | | | 1.92 | | | | 6.83 | | | | 2.74 | | | | (0.19 | ) |
| | | | | | | | | | | | | | | | | | | | | | | | |
Total from investment operations | | | (1.31 | ) | | | 2.50 | | | | 1.90 | | | | 6.80 | | | | 2.76 | | | | (0.20 | ) |
| | | | | | | | | | | | | | | | | | | | | | | | |
Less Distributions | | | | | | | | | | | | | | | | | | | | | | | | |
Distributions from net investment income | | | 0.00 | | | | 0.00 | | | | 0.00 | | | | (0.02 | ) | | | 0.00 | | | | 0.00 | |
Distributions from net realized capital gains | | | (2.71 | ) | | | (4.61 | ) | | | (1.71 | ) | | | 0.00 | | | | 0.00 | | | | 0.00 | |
| | | | | | | | | | | | | | | | | | | | | | | | |
Total distributions | | | (2.71 | ) | | | (4.61 | ) | | | (1.71 | ) | | | (0.02 | ) | | | 0.00 | | | | 0.00 | |
| | | | | | | | | | | | | | | | | | | | | | | | |
Net Asset Value, End of Period | | $ | 18.38 | | | $ | 22.40 | | | $ | 24.51 | | | $ | 24.32 | | | $ | 17.54 | | | $ | 14.78 | |
| | | | | | | | | | | | | | | | | | | | | | | | |
Total Return (%) (b) | | | (5.94 | )(c) | | | 10.51 | | | | 8.83 | | | | 38.77 | | | | 18.67 | | | | (1.34 | ) |
| | | | | | |
Ratios/Supplemental Data | | | | | | | | | | | | | | | | | | | | | | | | |
Gross ratio of expenses to average net assets (%) | | | 0.88 | (d) | | | 0.87 | | | | 0.88 | | | | 0.88 | | | | 0.89 | | | | 0.89 | |
Net ratio of expenses to average net assets (%) (e)(f) | | | 0.83 | (d) | | | 0.83 | | | | 0.83 | | | | 0.83 | | | | 0.85 | | | | 0.85 | |
Ratio of net investment income (loss) to average net assets (%) | | | 0.10 | (d) | | | (0.09 | ) | | | (0.09 | ) | | | (0.12 | ) | | | 0.12 | �� | | | (0.09 | ) |
Portfolio turnover rate (%) | | | 21 | (c) | | | 35 | | | | 34 | | | | 41 | | | | 38 | | | | 33 | |
Net assets, end of period (in millions) | | $ | 698.1 | | | $ | 751.5 | | | $ | 642.4 | | | $ | 615.0 | | | $ | 215.7 | | | $ | 199.5 | |
Please see following page for Financial Highlights footnote legend.
See accompanying notes to financial statements.
MSF-12
Metropolitan Series Fund
T. Rowe Price Large Cap Growth Portfolio
Financial Highlights
| | | | | | | | | | | | | | | | | | | | | | | | |
| Selected per share data | | | |
| | | Class E | |
| | | Six Months
Ended
June 30,
2016
(Unaudited) | | | Year Ended December 31, | |
| | | | 2015 | | | 2014 | | | 2013 | | | 2012 | | | 2011 | |
Net Asset Value, Beginning of Period | | $ | 22.55 | | | $ | 24.62 | | | $ | 24.40 | | | $ | 17.60 | | | $ | 14.81 | | | $ | 15.00 | |
| | | | | | | | | | | | | | | | | | | | | | | | |
Income (Loss) from Investment Operations | | | | | | | | | | | | | | | | | | | | | | | | |
Net investment income (loss) (a) | | | 0.02 | | | | 0.00 | (g) | | | 0.00 | (g) | | | (0.01 | ) | | | 0.04 | | | | 0.00 | (g) |
Net realized and unrealized gain (loss) on investments | | | (1.33 | ) | | | 2.54 | | | | 1.93 | | | | 6.84 | | | | 2.75 | | | | (0.19 | ) |
| | | | | | | | | | | | | | | | | | | | | | | | |
Total from investment operations | | | (1.31 | ) | | | 2.54 | | | | 1.93 | | | | 6.83 | | | | 2.79 | | | | (0.19 | ) |
| | | | | | | | | | | | | | | | | | | | | | | | |
Less Distributions | | | | | | | | | | | | | | | | | | | | | | | | |
Distributions from net investment income | | | 0.00 | | | | 0.00 | | | | 0.00 | | | | (0.03 | ) | | | 0.00 | | | | 0.00 | |
Distributions from net realized capital gains | | | (2.71 | ) | | | (4.61 | ) | | | (1.71 | ) | | | 0.00 | | | | 0.00 | | | | 0.00 | |
| | | | | | | | | | | | | | | | | | | | | | | | |
Total distributions | | | (2.71 | ) | | | (4.61 | ) | | | (1.71 | ) | | | (0.03 | ) | | | 0.00 | | | | 0.00 | |
| | | | | | | | | | | | | | | | | | | | | | | | |
Net Asset Value, End of Period | | $ | 18.53 | | | $ | 22.55 | | | $ | 24.62 | | | $ | 24.40 | | | $ | 17.60 | | | $ | 14.81 | |
| | | | | | | | | | | | | | | | | | | | | | | | |
Total Return (%) (b) | | | (5.91 | )(c) | | | 10.63 | | | | 8.93 | | | | 38.87 | | | | 18.84 | | | | (1.27 | ) |
| | | | | | |
Ratios/Supplemental Data | | | | | | | | | | | | | | | | | | | | | | | | |
Gross ratio of expenses to average net assets (%) | | | 0.78 | (d) | | | 0.77 | | | | 0.78 | | | | 0.78 | | | | 0.79 | | | | 0.79 | |
Net ratio of expenses to average net assets (%) (e)(f) | | | 0.73 | (d) | | | 0.73 | | | | 0.73 | | | | 0.73 | | | | 0.75 | | | | 0.75 | |
Ratio of net investment income (loss) to average net assets (%) | | | 0.20 | (d) | | | 0.01 | | | | 0.00 | (h) | | | (0.03 | ) | | | 0.22 | | | | 0.01 | |
Portfolio turnover rate (%) | | | 21 | (c) | | | 35 | | | | 34 | | | | 41 | | | | 38 | | | | 33 | |
Net assets, end of period (in millions) | | $ | 35.1 | | | $ | 39.5 | | | $ | 38.1 | | | $ | 40.1 | | | $ | 16.8 | | | $ | 16.0 | |
| (a) | Per share amounts based on average shares outstanding during the period. |
| (b) | Total return does not reflect any insurance, sales, separate account or administrative charges of variable annuity or life insurance contracts or any additional expenses that contract owners may bear under their variable contracts. If these charges were included, the returns would be lower. |
| (c) | Periods less than one year are not computed on an annualized basis. |
| (d) | Computed on an annualized basis. |
| (e) | The effect of the voluntary portion of the waiver on average net assets was 0.03% for the six months ended June 30, 2016 and for each of the years ended December 31, 2015 through 2011 (see Note 5 of the Notes to Financial Statements). |
| (f) | Includes the effects of management fee waivers (see Note 5 of the Notes to Financial Statements). |
| (g) | Net investment income was less than $0.01. |
| (h) | Ratio of net investment income to average net assets was less than 0.01%. |
See accompanying notes to financial statements.
MSF-13
Metropolitan Series Fund
T. Rowe Price Large Cap Growth Portfolio
Notes to Financial Statements—June 30, 2016 (Unaudited)
1. Organization
Metropolitan Series Fund (the “Trust”) is organized as a Delaware statutory trust and registered under the Investment Company Act of 1940, as amended (the “1940 Act”), as an open-end management investment company. The Trust, which is managed by MetLife Advisers, LLC (“MetLife Advisers” or the “Adviser”), an affiliate of MetLife, Inc., is currently comprised of thirty series, each of which operates as a distinct investment vehicle of the Trust. The portfolio included in this report is T. Rowe Price Large Cap Growth Portfolio (the “Portfolio”), which is diversified. Shares in the Portfolio are not offered directly to the general public and are currently available only to separate accounts established by Metropolitan Life Insurance Company (“MetLife”) and other affiliated life insurance companies.
The Portfolio has registered and offers three classes of shares: Class A, B and E shares. Shares of each Class of the Portfolio represent an equal pro rata interest in the Portfolio and generally give the shareholder the same voting, dividend, liquidation, and other rights. Investment income, realized and unrealized capital gains and losses, the common expenses of the Portfolio, and certain Portfolio-level expense reductions, if any, are allocated on a pro rata basis to each Class based on the relative net assets of each Class to the net assets of the Portfolio. Each Class of shares differs in its respective distribution plan and such distribution expenses are allocated to the corresponding Class of shares.
2. Significant Accounting Policies
The preparation of financial statements in conformity with accounting principles generally accepted in the United States of America (“GAAP”) requires management to make estimates and assumptions that affect the reported amounts of assets and liabilities and disclosure of contingent assets and liabilities as of the date of the financial statements and the reported amounts of income and expenses during the reporting period. Actual results could differ from those estimates. In the preparation of these financial statements, management has evaluated events and transactions subsequent to June 30, 2016 through the date the financial statements were issued.
The Portfolio is an investment company and follows the accounting and reporting guidance of the Financial Accounting Standards Board (“FASB”) Accounting Standards Codification Topic 946—Financial Services—Investment Companies and Topic 820—Fair Value Measurement. The following is a summary of significant accounting policies consistently followed by the Portfolio in the preparation of its financial statements.
Investment Valuation and Fair Value Measurements - Domestic and foreign equity securities, such as common stock, exchange-traded funds, rights, warrants, and preferred stock, that are traded on a securities exchange on a valuation date are generally valued at their last quoted sale price or official closing price on the primary exchange for such security, or, if no sales occurred on that day, at the last reported bid price. Equity securities traded over-the-counter (“OTC”) are generally valued at the last reported bid price. In the event of a major exchange closing during the trading day, the Adviser may use other market information obtained from quotation reporting systems, established market makers, or pricing services in valuing the securities. Valuation adjustments may be applied to certain foreign equity securities that are traded solely on foreign exchanges that close before the time as of which the Portfolio determines its NAV to account for the market movement between the close of the foreign exchanges and the time as of which the Portfolio determines its NAV. The Portfolio may use a systematic fair valuation model provided by a pricing service to value securities principally traded in these foreign markets in order to adjust for possible market movements or other changes that may occur between the close of the foreign exchanges and the time as of which the Portfolio determines its NAV. Foreign equity securities valued using these valuation adjustments are generally categorized as Level 2 within the fair value hierarchy. Equity securities that are actively traded, and have no valuation adjustments applied, are categorized as Level 1 within the fair value hierarchy. Other equity securities traded on inactive markets, or valued in reference to similar instruments traded on active markets, are generally categorized as Level 2 within the fair value hierarchy.
Investments in registered open-end management investment companies are valued at reported net asset value per share on the valuation date and are categorized as Level 1 within the fair value hierarchy.
Debt securities, including corporate, convertible and municipal bonds and notes; obligations of the U.S. Treasury and U.S. government agencies; foreign sovereign issues; and non-U.S. bonds, are generally valued on the basis of evaluated or composite bid quotations obtained from independent pricing services and/or brokers and dealers selected by the Adviser (each a “pricing service”), pursuant to authorization of and subject to general oversight by the Board of Trustees of the Trust (the “Board” or “Trustees”). Such pricing services may use matrix pricing, which considers observable inputs including, among other things, issuer details, maturity dates, interest rates, yield curves, rates of prepayment, credit risks/spreads, default rates, reported trades, broker dealer quotes and quoted prices for similar assets. Short-term obligations with a remaining maturity of sixty days or less may be valued at amortized cost in the absence of market quotes, so long as the amortized cost value of such short-term debt instrument is approximately the same as the fair value of the instrument as determined without the use of amortized cost valuation. Floating rate loans are generally valued on the basis of an evaluated or composite average of aggregate bid and ask quotations supplied by brokers or dealers, as obtained from the pricing service. Securities that use similar valuation techniques and inputs as described above are generally categorized as Level 2 within the fair value hierarchy.
MSF-14
Metropolitan Series Fund
T. Rowe Price Large Cap Growth Portfolio
Notes to Financial Statements—June 30, 2016—(Continued)
Options, whether on securities, indices, futures contracts, or otherwise, traded on exchanges are valued at the last sale price available as of the close of business on a valuation day or, if there is no such price available, at the last reported bid price. These types of options are categorized as Level 1 within the fair value hierarchy. Futures contracts that are traded on commodity exchanges are valued at their settlement prices established by the exchanges on which they are traded as of the close of such exchanges and are categorized as Level 1 within the fair value hierarchy.
If no current market value quotation or other observable inputs are readily available or market value quotations are deemed to be unreliable for an investment, the fair value of the investment will be determined in accordance with procedures approved by, and under the general supervision of, the Board. In such a circumstance, the Board will be assisted in its responsibility to determine the fair value of an investment by the Valuation Committee (“Committee”) of MetLife Advisers. The Committee provides general pricing oversight and fair value pricing determinations related to portfolio securities and meets on a regular basis to review reports relating to the valuation of the securities in the Portfolio. The Board has delegated to State Street Bank and Trust Company, the Trust’s custodian (“custodian”), the responsibility for calculating the net asset values (“NAVs”) of the Trust’s Portfolios. The Committee is responsible for overseeing the calculation of the NAVs of the Portfolios by the custodian. The Committee also periodically reviews pricing services, including the pricing services providing fair value pricing for the Portfolio’s foreign securities, and is responsible for overseeing the correction of pricing errors and addressing other pricing issues that arise in the ordinary course of business, such as making real-time fair value determinations, as necessary.
No single standard for determining the fair value of an investment can be set forth because fair value depends upon the facts and circumstances with respect to each investment. Information relating to any relevant factors may be obtained by the Committee from any appropriate source, including the subadviser of the Portfolio, the custodian, a pricing service, market maker and/or broker for such security or the issuer. Appropriate methodologies for determining fair value under particular circumstances may include: matrix pricing, a discounted cash flow analysis, comparisons of securities with comparable characteristics, value based on multiples of earnings, discount from market price of similar marketable securities or a combination of these and other methods.
Investment Transactions and Related Investment Income - Portfolio security transactions are recorded on the trade date. Dividend income is recorded on the ex-dividend date or, for certain foreign securities, when notified. Interest income, which includes amortization of premium and accretion of discount on debt securities, is recorded on the accrual basis. Realized gains and losses on investments are determined on the identified cost basis, which is the same basis used for federal income tax purposes. Foreign income and foreign capital gains on some foreign securities may be subject to foreign taxes, which are accrued as applicable. These foreign taxes have been provided for in accordance with the Portfolio’s understanding of the applicable countries’ tax rules and rates.
Foreign Currency Translation - The books and records of the Portfolio are maintained in U.S. dollars. The values of securities, currencies, and other assets and liabilities denominated in currencies other than the U.S. dollar are translated into U.S. dollars based upon foreign exchange rates prevailing at the end of the period. Purchases and sales of investment securities, income, and expenses are translated on the respective dates of such transactions. Because the values of investment securities are translated at the foreign exchange rates prevailing at the end of the period, that portion of the results of operations arising from changes in exchange rates and that portion of the results of operations reflecting fluctuations arising from changes in market prices of the investment securities are not separated. Such fluctuations are included in the net realized and unrealized gain or loss on investments.
Net realized foreign exchange gains or losses arise from activity in forward foreign currency exchange contracts, sales of foreign currency, currency gains or losses realized between the trade and settlement dates on securities transactions, and the difference between the amounts of dividends, interest, and foreign withholding taxes recorded by the Portfolio and the U.S. dollar equivalent of the amounts actually received or paid by the Portfolio. Net unrealized foreign exchange gains and losses arise from changes in the value of assets and liabilities, other than investment securities, resulting from changes in foreign exchange rates.
Dividends and Distributions to Shareholders - The Portfolio records dividends and distributions on the ex-dividend date. Net realized gains from securities transactions (if any) are generally distributed annually to shareholders. The timing and characterization of certain income and capital gains distributions are determined in accordance with federal tax regulations that may differ from GAAP. Permanent book and tax basis differences relating to shareholder distributions will result in reclassification between under/over distributed net investment income, accumulated net realized gains/losses, and paid-in surplus. Book-tax differences are primarily due to foreign currency transactions, distribution redesignations and broker commission recapture. These adjustments have no impact on net assets or the results of operations.
Income Taxes - It is the Portfolio’s policy to comply with the requirements of the Internal Revenue Code of 1986, as amended, and regulations thereunder, applicable to regulated investment companies and to distribute, with respect to each taxable year, all of its taxable income to shareholders. Therefore, no federal income tax provision is required. The Portfolio files U.S. federal tax returns. No income tax returns are currently under examination. The Portfolio’s federal tax returns for the prior three fiscal years remain subject to examination by the Internal Revenue Service. As of June 30, 2016, the Portfolio had no uncertain tax positions that would require financial statement recognition, or de-recognition or disclosure.
MSF-15
Metropolitan Series Fund
T. Rowe Price Large Cap Growth Portfolio
Notes to Financial Statements—June 30, 2016—(Continued)
Directed Brokerage Agreement - The Trust has entered into a directed brokerage arrangement with State Street Global Markets (“SSGM”). Under this arrangement, the Portfolio directs certain trades to SSGM in return for a recapture credit. SSGM issues a cash rebate to the Portfolio. Amounts paid to the Portfolio are shown separately as broker commission recapture on the Statement of Operations of the Portfolio. Additionally, these amounts have been excluded from the calculation of the net ratio of expenses to average net assets presented in the Financial Highlights for each share class.
Securities Lending - The Portfolio may lend its portfolio securities to certain qualified brokers who borrow securities in order to complete certain securities transactions. By lending its portfolio securities, the Portfolio attempts to increase its net investment income through the receipt of income on collateral held from securities on loan. Any gain or loss in the market price of the loaned securities that might occur and any interest earned or dividends declared during the term of the loan would accrue to the account of the Portfolio.
The Trust has entered into a Securities Lending Authorization Agreement with the custodian as the lending agent. Under this agreement, the custodian is authorized to loan portfolio securities on the Portfolio’s behalf. In exchange, the Portfolio receives either cash or securities as collateral against the loaned securities. The Portfolio receives collateral equal to at least 102% of the market value of the loaned securities (105% for foreign equity securities), at each loan’s inception. Collateral representing at least 100% of the market value of the loaned securities must be maintained for the duration of the loan. Cash collateral is generally invested in the State Street Navigator Securities Lending MET Portfolio (the “Navigator Portfolio”), a series of the State Street Navigator Securities Lending Trust that is managed by an affiliate of the custodian. The Navigator Portfolio is a registered money market fund that invests in a variety of high-quality, U.S. dollar-denominated instruments. If the market value of the collateral at the close of trading on a business day is less than 100% of the market value of the loaned securities at the close of trading on that day, the borrower shall be required to deliver, by the close of business on the following business day, an additional amount of collateral, so that the total amount of posted collateral is equal to at least 100% of the market value of all the loaned securities as of such preceding day. A portion of net income (income after the deduction of expenses and fees of the Navigator Portfolio) on the collateral is rebated to the borrower of the securities and the remainder is split between the custodian and the Portfolio. On loans collateralized by U.S. Treasuries, a fee is received from the borrower and is allocated between the Portfolio and the custodian. Income received by the Portfolio in securities lending transactions during the six months ended June 30, 2016 is reflected as Securities lending income on the Statement of Operations. The values of any securities loaned by the Portfolio and the related collateral at June 30, 2016 are disclosed in the footnotes to the Schedule of Investments. The value of the related collateral received by the Portfolio exceeded the value of the securities out on loan at June 30, 2016.
The risks associated with lending portfolio securities include, but are not limited to, possible delays in receiving additional collateral or in the recovery of the loaned securities, possible loss of rights in the collateral should the borrower fail financially, as well as risk of loss in the value of the collateral or the value of the investments made with the collateral. The lending agent shall indemnify the Portfolio in the case of default of any securities borrower.
All securities on loan are classified as Common Stocks in the Portfolio’s Schedule of Investments as of June 30, 2016, with a contractual maturity of overnight and continuous.
3. Certain Risks
In the normal course of business, the Portfolio invests in securities and enters into transactions where risks exist due to fluctuations in the market (“market risk”) or failure of the other party to a transaction to perform (“credit and counterparty risk”).
Market Risk: The value of securities held by the Portfolio may decline in response to certain events, including those directly involving the companies whose securities are owned by the Portfolio; conditions affecting the general economy; overall market changes; local, regional or global political, social or economic instability; and currency, interest rate, and price fluctuations.
Credit and Counterparty Risk: The Portfolio may be exposed to counterparty risk, or the risk that an entity with which the Portfolio has unsettled or open transactions may default. The potential loss could exceed the value of the financial assets and liabilities recorded in the financial statements. Financial assets that potentially expose the Portfolio to credit and counterparty risk consist principally of cash due from counterparties and investments. The Portfolio manages counterparty risk by entering into agreements only with counterparties that it believes have the financial resources to honor their obligations and by monitoring the financial stability of those counterparties. The Portfolio’s investment adviser attempts to mitigate counterparty risk by (i) periodically assessing the creditworthiness of its trading partners, (ii) monitoring and/or limiting the amount of its net exposure to each individual counterparty based on its assessment, and (iii) requiring collateral from the counterparty for certain transactions. In order to preserve certain safeguards for non-standard settlement trades, the Portfolio restricts its exposure to credit and counterparty losses by entering into master netting agreements (“Master Agreements”) with counterparties (approved brokers) with whom it undertakes a significant volume of transactions. Master Agreements govern the terms of certain transactions, and reduce the counterparty risk associated with relevant transactions by specifying credit protection mechanisms and providing standardization that improves legal certainty. Master Agreements can also help limit counterparty risk by specifying collateral posting arrangements at pre-arranged exposure levels.
MSF-16
Metropolitan Series Fund
T. Rowe Price Large Cap Growth Portfolio
Notes to Financial Statements—June 30, 2016—(Continued)
Repurchase and reverse repurchase agreements are primarily executed under Global Master Repurchase Agreements (“GMRAs”) or Master Repurchase Agreements (“MRAs”), which provide the rights to set-off. Each repurchase and reverse repurchase agreement is initially collateralized at the transaction level. In the event of default, the total market value exposure will be offset against collateral exchanged to date, which would result in a net receivable/(payable) that would be due from/to the counterparty.
Additional risks associated with each type of investment are described above within the respective security type notes. The Portfolio’s prospectus includes a discussion of the principal risks of investing in the Portfolio.
4. Investment Transactions
Aggregate cost of purchases and proceeds of sales of investment securities, excluding short-term securities, for the six months ended June 30, 2016 were as follows:
| | | | | | | | | | | | |
Purchases | | | Sales | |
U.S. Government | | Non U.S. Government | | | U.S. Government | | | Non U.S. Government | |
| $0 | | $ | 465,499,324 | | | $ | 0 | | | $ | 464,559,284 | |
The Portfolio engaged in security transactions with other accounts managed by T. Rowe Price Associates, Inc. that amounted to $355,555 in purchases of investments, which are included above.
5. Investment Management Fees and Other Transactions with Affiliates
Investment Management Agreement - MetLife Advisers is the investment adviser to the Portfolio. The Trust has entered into an investment management agreement with MetLife Advisers with respect to the Portfolio. For providing investment management services to the Portfolio, MetLife Advisers receives monthly compensation at the following annual rates:
| | | | | | |
Management
Fees earned by
MetLife Advisers
for the six months ended
June 30, 2016 | | % per annum | | | Average Daily Net Assets |
| $6,483,119 | | | 0.650 | % | | Of the first $50 million |
| | | 0.600 | % | | On amounts in excess of $50 million |
MetLife Advisers has entered into an investment subadvisory agreement with respect to managing the Portfolio. T. Rowe Price Associates, Inc. (“T. Rowe Price”) is compensated by MetLife Advisers to provide subadvisory services for the Portfolio.
Management Fee Waivers - Pursuant to an expense agreement, MetLife Advisers has agreed, for the period May 1, 2016 to April 30, 2017, to reduce its advisory fees set out above under “Investment Management Agreement” for each class of the Portfolio as follows provided the Portfolio’s assets exceed $1 billion:
| | |
% per annum | | Average Daily Net Assets |
| 0.030% | | On the first $50 million |
| 0.010% | | On amounts between $100 million and $1.5 billion |
| 0.025% | | On amounts in excess of $1.5 billion |
If the Portfolio’s average daily net assets fall below $1 billion, the per annum fee reduction would be 0.015% on the first $50 million.
An identical expense agreement was in place for the period May 1, 2015 to April 30, 2016. Amounts waived for the six months ended June 30, 2016 amounted to $160,213 and are included in the total amounts shown as management fee waivers in the Statement of Operations.
Effective February 17, 2005, T. Rowe Price agreed to a voluntary subadvisory fee waiver that applies if (i) assets under management by T. Rowe Price for the Trust and Met Investors Series Trust (“MIST”), an affiliate of the Trust, in the aggregate, exceed $750,000,000, (ii) T. Rowe Price subadvises three or more portfolios of the Trust and MIST in the aggregate, and (iii) at least one of those portfolios is a large cap domestic equity portfolio.
If the aforementioned conditions are met, T. Rowe Price will waive its subadvisory fee paid by MetLife Advisers by 5% for combined Trust and MIST average daily net assets over $750,000,000, 7.5% for the next $1,500,000,000 of combined assets, and 10% for amounts over $3,000,000,000. MetLife Advisers has voluntarily agreed to reduce its advisory fee for the Portfolio by the amount waived (if any) by T. Rowe Price for the Portfolio pursuant to this voluntary subadvisory fee waiver. Because these fee waivers are voluntary, and not contractual, they may be discontinued by T. Rowe Price and MetLife Advisers at any time. Amounts voluntarily waived by MetLife Advisers for the six months ended June 30, 2016 amounted to $295,247 and are included in the total amounts shown as management fee waivers in the Statement of Operations.
MSF-17
Metropolitan Series Fund
T. Rowe Price Large Cap Growth Portfolio
Notes to Financial Statements—June 30, 2016—(Continued)
Certain officers and trustees of the Trust may also be officers of MetLife Advisers; however, such officers and trustees receive no compensation from the Trust.
On January 12, 2016, MetLife, Inc. announced its plan to pursue the separation of a substantial portion of its retail segment and is currently evaluating structural alternatives for such separation. It is anticipated that MetLife Advisers would be included in any such separation. Any separation transaction that might occur will be subject to the satisfaction of various conditions and approvals, including approval of any transaction by the MetLife, Inc. Board of Directors, satisfaction of any applicable requirements of the SEC, and receipt of insurance and other regulatory approvals and other anticipated conditions. Because the form of a separation had yet to be determined, MetLife, Inc. cannot currently provide a specific potential completion date or information about the potential impact on MetLife Advisers. No assurance can be given regarding the form that a separation transaction may take or the specific terms thereof, or that a separation will in fact occur. Depending on the form a separation takes, MetLife Advisers’ continued service as investment adviser to the Trusts could be subject to the satisfaction of various conditions and approvals, which may include obtaining approvals from the Trusts’ Board and shareholders.
Transfer Agency Agreement - MetLife serves as the transfer agent for the Trust. MetLife receives no fees for its services to the Trust under the transfer agency agreement.
Distribution and Service Fees - The Trust has a distribution agreement with MetLife Investors Distribution Company (“MIDC” or the “Distributor”) in which MIDC serves as the distributor for the Portfolio’s Class A, B and E Shares. MIDC is a wholly-owned subsidiary of MetLife Investors Group, LLC, an affiliate of the Adviser. The Trust has also adopted a Distribution and Service Plan under Rule 12b-1 of the 1940 Act for the Portfolio’s Class B and E Shares. Under the Distribution and Service Plan, the Class B and E Shares of the Portfolio pay a fee to compensate the Insurance Companies (or their affiliates) and other broker-dealers and financial intermediaries involved in the offer and sale of Portfolio shares for promoting or selling and servicing the Class B and E Shares. The fees under the Distribution and Service Plan for each class of the Portfolio’s shares are calculated as a percentage of the Portfolio’s average daily net assets that are attributable to that Class. Currently, the fee is 0.25% per year for Class B Shares and 0.15% per year for Class E Shares. Amounts incurred by the Portfolio for the six months ended June 30, 2016 are shown as Distribution and service fees in the Statement of Operations.
Deferred Trustee Compensation - Each Trustee who is not currently an employee of the Adviser or any of its affiliates receives compensation from the Trust for his or her service to the Trust. A deferred compensation plan (the “Plan”) is available to the Trustees on a voluntary basis. Deferred amounts remain in the Trust until distributed in accordance with the provisions of the Plan. The value of a participating Trustee’s deferral account is based on theoretical investments of deferred amounts on the normal payment dates in certain portfolios of the Trust or Met Investors Series Trust, an affiliate of the Trust, as designated by the participating Trustee. Changes in the value of participants’ deferral accounts are reflected as Trustees’ fees and expenses in the Statement of Operations. The portion of the accrued obligations allocated to the Portfolio under the Plan is reflected as Deferred trustees’ fees in the Statement of Assets and Liabilities.
6. Transactions in Securities of Affiliated Issuers
A summary of the Portfolio’s transactions in the securities of affiliated issuers during the six months ended June 30, 2016 is as follows:
| | | | | | | | | | | | | | | | | | | | | | | | |
Security Description | | Number of
shares held at
December 31, 2015 | | | Shares
purchased | | | Shares
sold | | | Number of
shares held at
June 30, 2016 | | | Realized Gain on shares sold | | | Income earned from affiliates during the period | |
T. Rowe Price Government Reserve Investment Fund | | | 38,785,488 | | | | 181,750,641 | | | | (183,629,831 | ) | | | 36,906,298 | | | $ | — | | | $ | 37,088 | |
7. Contractual Obligations
Under the Trust’s organizational documents, its officers and Trustees may be indemnified against certain liabilities and expenses arising out of the performance of their duties to the Trust. Additionally, the Trust has a variety of indemnification obligations under contracts with its service providers. The Trust’s maximum exposure under these arrangements is unknown, as this would involve future claims that may be made against the Trust that have not yet occurred.
8. Income Tax Information
The tax character of distributions paid for the years ended December 31, 2015 and 2014 were as follows:
| | | | | | | | | | | | | | | | | | | | |
Ordinary Income | | | Long-Term Capital Gain | | | Total | |
2015 | | 2014 | | | 2015 | | | 2014 | | | 2015 | | | 2014 | |
| $33,229,220 | | $ | 1,184,801 | | | $ | 378,119,169 | | | $ | 181,003,465 | | | $ | 411,348,389 | | | $ | 182,188,266 | |
MSF-18
Metropolitan Series Fund
T. Rowe Price Large Cap Growth Portfolio
Notes to Financial Statements—June 30, 2016—(Continued)
As of December 31, 2015, the components of distributable earnings (accumulated losses) on a federal income tax basis were as follows:
| | | | | | | | | | | | | | | | |
Undistributed
Ordinary
Income | | Undistributed
Long-Term
Capital Gain | | | Net
Unrealized
Appreciation | | | Other
Accumulated
Capital Losses | | | Total | |
| $1,733,565 | | $ | 276,614,981 | | | $ | 585,534,335 | | | $ | — | | | $ | 863,882,881 | |
The Portfolio utilizes the provisions of the federal income tax laws that provide for the carryforward of capital losses for prior years, offsetting such losses against any future realized capital gains. Under the Regulated Investment Company Modernization Act of 2010 (the “Act”), net capital losses recognized after December 22, 2010 may be carried forward indefinitely and their character is retained as short-term and/or long-term losses. Previously, net capital losses were carried forward for up to eight years and treated as short-term losses. As a transition rule, the Act requires that post-enactment net capital losses be used before pre-enactment net capital losses.
As of December 31, 2015, the Portfolio had no post-enactment accumulated capital losses and no pre-enactment accumulated capital loss carryforwards.
MSF-19
Metropolitan Series Fund
T. Rowe Price Small Cap Growth Portfolio
Managed by T. Rowe Price Associates, Inc.
Portfolio Manager Commentary*
PERFORMANCE
For the six month period ended June 30, 2016, the Class A, B, E and G shares of the T. Rowe Price Small Cap Growth Portfolio returned 1.62%, 1.45%, 1.49%, and 1.16%, respectively. The Portfolio’s benchmark, the MSCI U.S. Small Cap Growth Index1, returned 1.39%.
MARKET ENVIRONMENT / CONDITIONS
Most major U.S. stock indexes rose in the first half of 2016, a period of significant global market volatility. World markets started the year with deep losses as oil prices collapsed to 13-year lows amid concerns about weakening Chinese and global economic growth. However, equities and other risk assets rallied through late June, as the Bank of Japan and the European Central Bank unveiled new stimulus efforts. As the period ended, global markets fluctuated wildly in response to the so-called “Brexit,” a referendum in which U.K. citizens voted in favor of leaving the European Union.
In the U.S., mid-cap shares outperformed their larger and smaller counterparts. As measured by various Russell indexes, value stocks outperformed growth stocks across all market capitalizations. Within the MSCI U.S. Small Cap Growth Index, Utilities, Energy, and Telecommunication Services had the largest gains, while Health Care, Information Technology, and Consumer Discretionary ended in negative territory.
PORTFOLIO REVIEW / PERIOD END POSITIONING
The Portfolio outperformed its MSCI benchmark for the six months ended June 30, 2016. Relative gains were driven by stock selection.
Stock selection in Consumer Discretionary added relative value, most notably Burlington Stores, which is the third-largest off-price retailer in the U.S. The company weathered a mild U.S. winter by offsetting slumping outerwear sales with increasing strength and penetration in other segments. Shares of Domino’s Pizza, which operates and
franchises pizza delivery and carryout restaurants throughout the world, also gained for the period as the company posted higher-than-expected same-store sales.
Health Care was another area of relative strength, due to stock choices that included IDEXX Laboratories, the leading provider of diagnostic solutions for companion animal veterinarians. While the stock has contributed over the period, we anticipate a slowdown in revenues that may pressure margins and therefore trimmed our position on strength. Relative gains also came from Align Technology, a designer and manufacturer of Invisalign, a more aesthetic and comfortable alternative to traditional orthodontic braces. The company has exhibited strong organic topline growth with broad-based momentum in both U.S. and international markets.
On the negative side, stock choices in Financials detracted from relative results. Jones Lang LaSalle, a global diversified commercial real estate firm, saw shares fall due to a combination of a significant earnings miss, a drop in fees from the company’s investment management arm, and concerns around its exposure to U.K. real estate post Brexit.
While our stock selection is primarily based on a quantitative model, we take into consideration the fundamental research conducted by T. Rowe Price’s equity analysts. In constructing the Portfolio, our sector weights are usually in line with those of the MSCI U.S. Small Cap Growth Index, but we will occasionally overweight or underweight certain sectors based on our analysis. At the end of the period, the Portfolio’s sector allocations were generally in line with the benchmark across most sectors. The Portfolio finished the period overweight the benchmark in Consumer Discretionary and Information Technology and underweight the benchmark in Financials.
Sudhir Nanda
Portfolio Manager
T. Rowe Price Associates, Inc.
* This commentary may include statements that constitute “forward-looking statements” under the U.S. securities laws. Forward-looking statements include, among other things, projections, estimates, and information about possible or future results related to the Portfolio, market or regulatory developments. The views expressed above are not guarantees of future performance or economic results and involve certain risks, uncertainties and assumptions that could cause actual outcomes and results to differ materially from the views expressed herein. The views expressed above are subject to change at any time based upon economic, market, or other conditions and the subadvisory firm undertakes no obligation to update the views expressed herein. Any discussions of specific securities should not be considered a recommendation to buy or sell those securities. The views expressed above (including any forward-looking statement) may not be relied upon as investment advice or as an indication of the Portfolio’s trading intent. Information about the Portfolio’s holdings, asset allocation or country diversification is historical and is not an indication of future Portfolio composition, which may vary. Direct investment in any index is not possible. The performance of any index mentioned in this commentary has not been adjusted for ongoing management, distribution and operating expenses, and sales charges applicable to mutual fund investments. In addition, the returns do not reflect additional fees charged by separate accounts or variable insurance contracts that an investor in the Portfolio may pay. If these additional fees were reflected, performance would have been lower.
MSF-1
Metropolitan Series Fund
T. Rowe Price Small Cap Growth Portfolio
A $10,000 INVESTMENT COMPARED TO THE MSCI U.S. SMALL CAP GROWTH INDEX
SIX MONTH RETURN & AVERAGE ANNUAL RETURNS (%) AS OF JUNE 30, 2016
| | | | | | | | | | | | | | | | | | | | |
| | | 6 Month | | | 1 Year | | | 5 Year | | | 10 Year | | | Since Inception2 | |
| T. Rowe Price Small Cap Growth Portfolio | | | | | | | | | | | | | | | | | | | | |
Class A | | | 1.62 | | | | -4.70 | | | | 11.20 | | | | 10.02 | | | | — | |
Class B | | | 1.45 | | | | -4.98 | | | | 10.91 | | | | 9.75 | | | | — | |
Class E | | | 1.49 | | | | -4.87 | | | | 11.03 | | | | 9.85 | | | | — | |
Class G | | | 1.16 | | | | -5.40 | | | | — | | | | — | | | | 3.09 | |
| MSCI U.S. Small Cap Growth Index | | | 1.39 | | | | -8.85 | | | | 9.34 | | | | 8.32 | | | | — | |
1 The MSCI U.S. Small Cap Growth Index represents the growth companies of the MSCI U.S. Small Cap 1750 Index. (The MSCI U.S. Small Cap 1750 Index represents the universe of small capitalization companies in the U.S. equity market).
2 Inception dates of the Class A, Class B, Class E and Class G shares are 3/3/97, 7/30/02, 5/1/01 and 11/12/14, respectively.
Portfolio performance is calculated including reinvestment of all income and capital gain distributions. Performance numbers are net of all Portfolio expenses but do not include any insurance, sales, separate account or administrative charges of variable annuity or life insurance contracts or any additional expenses that participants may bear relating to the operations of their plans. If these charges were included, the returns would be lower. The performance of any index referenced above has not been adjusted for ongoing management, distribution and operating expenses, and sales charges applicable to mutual fund investments. Direct investment in any index is not possible. The performance of Class A shares, as set forth in the line graph above, will differ from that of other classes because of the difference in expenses paid by policyholders investing in the different share classes.
This information represents past performance and is not indicative of future results. Investment return and principal value may fluctuate so that shares, upon redemption, may be worth more or less than the original cost.
PORTFOLIO COMPOSITION AS OF JUNE 30, 2016
Top Holdings
| | | | |
| | | % of
Net Assets | |
| Casey’s General Stores, Inc. | | | 1.2 | |
| Tyler Technologies, Inc. | | | 1.1 | |
| Vail Resorts, Inc. | | | 1.1 | |
| Domino’s Pizza, Inc. | | | 1.1 | |
| Burlington Stores, Inc. | | | 1.0 | |
| MarketAxess Holdings, Inc. | | | 1.0 | |
| MAXIMUS, Inc. | | | 0.9 | |
| Toro Co. (The) | | | 0.9 | |
| Manhattan Associates, Inc. | | | 0.9 | |
| J&J Snack Foods Corp. | | | 0.9 | |
Top Sectors
| | | | |
| | | % of
Net Assets | |
| Information Technology | | | 23.3 | |
| Health Care | | | 19.8 | |
| Consumer Discretionary | | | 19.4 | |
| Industrials | | | 16.0 | |
| Financials | | | 9.5 | |
| Consumer Staples | | | 4.7 | |
| Materials | | | 3.9 | |
| Energy | | | 3.0 | |
MSF-2
Metropolitan Series Fund
T. Rowe Price Small Cap Growth Portfolio
Understanding Your Portfolio’s Expenses (Unaudited)
Shareholder Expense Example
As a shareholder of the Portfolio, you incur ongoing costs, including management fees; distribution and service (12b-1) fees; and other Portfolio expenses. This example is intended to help you understand your ongoing costs (in dollars) (referred to as “expenses”) of investing in the Portfolio and compare these costs with the ongoing costs of investing in other mutual funds. The example is based on an investment of $1,000 invested at the beginning of the period and held for the entire period, January 1, 2016 through June 30, 2016.
Actual Expenses
The first line for each share class of the Portfolio in the table below provides information about actual account values and actual expenses. You may use the information in this line, together with the amount you invested in the particular share class of the Portfolio, to estimate the expenses that you paid over the period. Simply divide your account value by $1,000 (for example, an $8,600 account value divided by $1,000 = 8.6), then multiply the result by the number in the first line under the heading entitled “Expenses Paid During Period” to estimate the expenses you paid on your account during this period.
Hypothetical Example for Comparison Purposes
The second line for each share class of the Portfolio in the table below provides information about hypothetical account values and hypothetical expenses based on the Portfolio’s actual expense ratio and an assumed rate of return of 5% per year before expenses, which is not the Portfolio’s actual return. The hypothetical account values and expenses may not be used to estimate the actual ending account balance or expenses you paid for the period. You may use this information to compare the ongoing costs of investing in the Portfolio and other funds. To do so, compare this 5% hypothetical example with the 5% hypothetical examples that appear in the shareholder reports of the other funds.
Please note that the expenses shown in the table are meant to highlight your ongoing costs only and do not reflect any fees or charges of your variable insurance product or any additional expenses that participants in certain eligible qualified plans may bear relating to the operations of their plan. Therefore, the second line for each share class in the table is useful in comparing ongoing costs only, and will not help you determine the relative total costs of owning different funds. In addition, if these other costs were included, your costs would have been higher.
| | | | | | | | | | | | | | | | | | |
T. Rowe Price Small Cap Growth Portfolio | | | | Annualized
Expense
Ratio | | | Beginning
Account Value
January 1,
2016 | | | Ending
Account Value
June 30,
2016 | | | Expenses Paid
During Period**
January 1, 2016
to
June 30,
2016 | |
Class A(a) | | Actual | | | 0.48 | % | | $ | 1,000.00 | | | $ | 1,016.20 | | | $ | 2.41 | |
| | Hypothetical* | | | 0.48 | % | | $ | 1,000.00 | | | $ | 1,022.48 | | | $ | 2.41 | |
| | | | | |
Class B(a) | | Actual | | | 0.73 | % | | $ | 1,000.00 | | | $ | 1,014.50 | | | $ | 3.66 | |
| | Hypothetical* | | | 0.73 | % | | $ | 1,000.00 | | | $ | 1,021.23 | | | $ | 3.67 | |
| | | | | |
Class E(a) | | Actual | | | 0.63 | % | | $ | 1,000.00 | | | $ | 1,014.90 | | | $ | 3.16 | |
| | Hypothetical* | | | 0.63 | % | | $ | 1,000.00 | | | $ | 1,021.73 | | | $ | 3.17 | |
| | | | | |
Class G(a) | | Actual | | | 0.78 | % | | $ | 1,000.00 | | | $ | 1,011.60 | | | $ | 3.90 | |
| | Hypothetical* | | | 0.78 | % | | $ | 1,000.00 | | | $ | 1,020.99 | | | $ | 3.92 | |
* Hypothetical assumes a rate of return of 5% per year before expenses.
** Expenses paid are equal to the Portfolio’s annualized expense ratio for the most recent six month period, as shown above, multiplied by the average account value over the period, multiplied by the number of days (182 days) in the most recent fiscal half-year, divided by 366 (to reflect the one-half year period).
(a) The annualized expense ratio shown reflects the impact of the management fee waiver as described in Note 5 of the Notes to Financial Statements.
MSF-3
Metropolitan Series Fund
T. Rowe Price Small Cap Growth Portfolio
Schedule of Investments as of June 30, 2016 (Unaudited)
Common Stocks—99.6% of Net Assets
| | | | | | | | |
| Security Description | | Shares | | | Value | |
| | |
Aerospace & Defense—2.4% | | | | | | | | |
Aerojet Rocketdyne Holdings, Inc. (a) (b) | | | 163,400 | | | $ | 2,986,952 | |
Esterline Technologies Corp. (a) | | | 27,100 | | | | 1,681,284 | |
HEICO Corp. - Class A | | | 124,481 | | | | 6,678,406 | |
Hexcel Corp. | | | 116,600 | | | | 4,855,224 | |
Moog, Inc. - Class A (a) | | | 87,200 | | | | 4,701,824 | |
Teledyne Technologies, Inc. (a) | | | 93,100 | | | | 9,221,555 | |
| | | | | | | | |
| | | | | | | 30,125,245 | |
| | | | | | | | |
| | |
Airlines—0.5% | | | | | | | | |
Allegiant Travel Co. | | | 19,400 | | | | 2,939,100 | |
Spirit Airlines, Inc. (a) (b) | | | 72,400 | | | | 3,248,588 | |
| | | | | | | | |
| | | | | | | 6,187,688 | |
| | | | | | | | |
| | |
Auto Components—0.5% | | | | | | | | |
Gentherm, Inc. (a) | | | 70,000 | | | | 2,397,500 | |
Tenneco, Inc. (a) | | | 85,600 | | | | 3,989,816 | |
| | | | | | | | |
| | | | | | | 6,387,316 | |
| | | | | | | | |
| | |
Banks—1.0% | | | | | | | | |
Signature Bank (a) | | | 54,600 | | | | 6,820,632 | |
SVB Financial Group (a) | | | 46,300 | | | | 4,405,908 | |
Texas Capital Bancshares, Inc. (a) | | | 34,500 | | | | 1,613,220 | |
| | | | | | | | |
| | | | | | | 12,839,760 | |
| | | | | | | | |
| | |
Beverages—0.4% | | | | | | | | |
Boston Beer Co., Inc. (The) - Class A (a) (b) | | | 29,387 | | | | 5,026,059 | |
| | | | | | | | |
| | |
Biotechnology—5.0% | | | | | | | | |
ACADIA Pharmaceuticals, Inc. (a) (b) | | | 102,000 | | | | 3,310,920 | |
Acceleron Pharma, Inc. (a) (b) | | | 17,400 | | | | 591,252 | |
Acorda Therapeutics, Inc. (a) (b) | | | 45,900 | | | | 1,170,679 | |
Agios Pharmaceuticals, Inc. (a) (b) | | | 22,300 | | | | 934,259 | |
Alkermes plc (a) | | | 38,200 | | | | 1,651,004 | |
Alnylam Pharmaceuticals, Inc. (a) (b) | | | 30,400 | | | | 1,686,896 | |
AMAG Pharmaceuticals, Inc. (a) (b) | | | 54,400 | | | | 1,301,248 | |
BioMarin Pharmaceutical, Inc. (a) | | | 18,600 | | | | 1,447,080 | |
Bluebird Bio, Inc. (a) (b) | | | 33,400 | | | | 1,445,886 | |
Cepheid, Inc. (a) (b) | | | 88,200 | | | | 2,712,150 | |
Dyax Corp. | | | 132,100 | | | | 146,631 | |
Exelixis, Inc. (a) (b) | | | 308,200 | | | | 2,407,042 | |
Incyte Corp. (a) | | | 53,105 | | | | 4,247,338 | |
Insmed, Inc. (a) (b) | | | 150,000 | | | | 1,479,000 | |
Insys Therapeutics, Inc. (a) (b) | | | 24,100 | | | | 311,854 | |
Ionis Pharmaceuticals, Inc. (a) (b) | | | 58,800 | | | | 1,369,452 | |
Ligand Pharmaceuticals, Inc. (a) (b) | | | 48,700 | | | | 5,808,449 | |
Medivation, Inc. (a) | | | 19,800 | | | | 1,193,940 | |
Neurocrine Biosciences, Inc. (a) | | | 147,400 | | | | 6,699,330 | |
Novavax, Inc. (a) (b) | | | 332,700 | | | | 2,418,729 | |
Ophthotech Corp. (a) (b) | | | 28,400 | | | | 1,449,252 | |
Opko Health, Inc. (a) (b) | | | 235,500 | | | | 2,199,570 | |
Prothena Corp. plc (a) (b) | | | 41,800 | | | | 1,461,328 | |
Regulus Therapeutics, Inc. (a) (b) | | | 32,500 | | | | 93,925 | |
Repligen Corp. (a) (b) | | | 56,400 | | | | 1,543,104 | |
Seattle Genetics, Inc. (a) (b) | | | 59,700 | | | | 2,412,477 | |
Spark Therapeutics, Inc. (a) (b) | | | 36,700 | | | | 1,876,471 | |
| | |
Biotechnology—(Continued) | | | | | | | | |
TESARO, Inc. (a) (b) | | | 43,700 | | | | 3,672,985 | |
Ultragenyx Pharmaceutical, Inc. (a) (b) | | | 31,000 | | | | 1,516,210 | |
United Therapeutics Corp. (a) (b) | | | 26,400 | | | | 2,796,288 | |
| | | | | | | | |
| | | | | | | 61,354,749 | |
| | | | | | | | |
| | |
Building Products—1.3% | | | | | | | | |
AAON, Inc. | | | 135,499 | | | | 3,727,577 | |
Lennox International, Inc. (b) | | | 65,900 | | | | 9,397,340 | |
Patrick Industries, Inc. (a) | | | 51,000 | | | | 3,074,790 | |
| | | | | | | | |
| | | | | | | 16,199,707 | |
| | | | | | | | |
| | |
Capital Markets—0.8% | | | | | | | | |
Affiliated Managers Group, Inc. (a) | | | 10,649 | | | | 1,499,060 | |
E*Trade Financial Corp. (a) | | | 213,860 | | | | 5,023,571 | |
Financial Engines, Inc. (b) | | | 66,200 | | | | 1,712,594 | |
Waddell & Reed Financial, Inc. - Class A (b) | | | 106,200 | | | | 1,828,764 | |
| | | | | | | | |
| | | | | | | 10,063,989 | �� |
| | | | | | | | |
| | |
Chemicals—2.2% | | | | | | | | |
GCP Applied Technologies, Inc. (a) | | | 184,600 | | | | 4,806,984 | |
Minerals Technologies, Inc. | | | 59,200 | | | | 3,362,560 | |
NewMarket Corp. (b) | | | 16,900 | | | | 7,003,022 | |
PolyOne Corp. | | | 189,000 | | | | 6,660,360 | |
Stepan Co. | | | 37,700 | | | | 2,244,281 | |
WR Grace & Co. | | | 36,800 | | | | 2,694,128 | |
| | | | | | | | |
| | | | | | | 26,771,335 | |
| | | | | | | | |
| | |
Commercial Services & Supplies—2.2% | | | | | | | | |
Clean Harbors, Inc. (a) (b) | | | 58,400 | | | | 3,043,224 | |
Healthcare Services Group, Inc. (b) | | | 136,600 | | | | 5,652,508 | |
Rollins, Inc. (b) | | | 258,825 | | | | 7,575,808 | |
Team, Inc. (a) (b) | | | 31,200 | | | | 774,696 | |
U.S. Ecology, Inc. | | | 95,300 | | | | 4,379,035 | |
Waste Connections, Inc. | | | 64,800 | | | | 4,668,840 | |
West Corp. | | | 66,300 | | | | 1,303,458 | |
| | | | | | | | |
| | | | | | | 27,397,569 | |
| | | | | | | | |
| | |
Communications Equipment—1.1% | | | | | | | | |
ARRIS International plc (a) | | | 213,500 | | | | 4,474,960 | |
EchoStar Corp. - Class A (a) | | | 51,200 | | | | 2,032,640 | |
NetScout Systems, Inc. (a) (b) | | | 84,200 | | | | 1,873,450 | |
Plantronics, Inc. | | | 88,400 | | | | 3,889,600 | |
Polycom, Inc. (a) | | | 98,186 | | | | 1,104,592 | |
| | | | | | | | |
| | | | | | | 13,375,242 | |
| | | | | | | | |
| | |
Construction & Engineering—0.2% | | | | | | | | |
Valmont Industries, Inc. | | | 20,300 | | | | 2,745,981 | |
| | | | | | | | |
| | |
Consumer Finance—0.2% | | | | | | | | |
PRA Group, Inc. (a) (b) | | | 87,200 | | | | 2,105,008 | |
| | | | | | | | |
| | |
Containers & Packaging—1.3% | | | | | | | | |
Berry Plastics Group, Inc. (a) | | | 241,100 | | | | 9,366,735 | |
Graphic Packaging Holding Co. | | | 513,900 | | | | 6,444,306 | |
| | | | | | | | |
| | | | | | | 15,811,041 | |
| | | | | | | | |
See accompanying notes to financial statements.
MSF-4
Metropolitan Series Fund
T. Rowe Price Small Cap Growth Portfolio
Schedule of Investments as of June 30, 2016 (Unaudited)
Common Stocks—(Continued)
| | | | | | | | |
| Security Description | | Shares | | | Value | |
| | |
Distributors—0.8% | | | | | | | | |
Pool Corp. | | | 103,400 | | | $ | 9,722,702 | |
| | | | | | | | |
|
Diversified Consumer Services—1.7% | |
Capella Education Co. | | | 50,100 | | | | 2,637,264 | |
Service Corp. International | | | 305,900 | | | | 8,271,536 | |
ServiceMaster Global Holdings, Inc. (a) | | | 231,100 | | | | 9,197,780 | |
Sotheby’s (b) | | | 51,400 | | | | 1,408,360 | |
| | | | | | | | |
| | | | | | | 21,514,940 | |
| | | | | | | | |
|
Diversified Financial Services—2.8% | |
CBOE Holdings, Inc. | | | 134,100 | | | | 8,933,742 | |
FactSet Research Systems, Inc. (b) | | | 36,100 | | | | 5,827,262 | |
MarketAxess Holdings, Inc. | | | 87,300 | | | | 12,693,420 | |
MSCI, Inc. | | | 93,878 | | | | 7,239,871 | |
NewStar Financial, Inc. (a) (b) | | | 33,387 | | | | 281,119 | |
| | | | | | | | |
| | | | | | | 34,975,414 | |
| | | | | | | | |
|
Electrical Equipment—1.0% | |
Acuity Brands, Inc. | | | 28,800 | | | | 7,141,248 | |
AZZ, Inc. | | | 67,400 | | | | 4,042,652 | |
Generac Holdings, Inc. (a) (b) | | | 49,100 | | | | 1,716,536 | |
| | | | | | | | |
| | | | | | | 12,900,436 | |
| | | | | | | | |
|
Electronic Equipment, Instruments & Components—2.2% | |
Anixter International, Inc. (a) | | | 50,700 | | | | 2,701,296 | |
Cognex Corp. | | | 134,100 | | | | 5,779,710 | |
Coherent, Inc. (a) | | | 66,500 | | | | 6,103,370 | |
FEI Co. | | | 73,100 | | | | 7,812,928 | |
OSI Systems, Inc. (a) | | | 51,300 | | | | 2,982,069 | |
VeriFone Systems, Inc. (a) | | | 80,100 | | | | 1,485,054 | |
| | | | | | | | |
| | | | | | | 26,864,427 | |
| | | | | | | | |
|
Energy Equipment & Services—0.6% | |
Atwood Oceanics, Inc. (b) | | | 24,900 | | | | 311,748 | |
Core Laboratories NV (b) | | | 10,700 | | | | 1,325,623 | |
Dril-Quip, Inc. (a) | | | 42,900 | | | | 2,506,647 | |
Oceaneering International, Inc. | | | 70,600 | | | | 2,108,116 | |
Oil States International, Inc. (a) | | | 39,800 | | | | 1,308,624 | |
Tesco Corp. (b) | | | 56,000 | | | | 374,640 | |
| | | | | | | | |
| | | | | | | 7,935,398 | |
| | | | | | | | |
|
Food & Staples Retailing—1.3% | |
Casey’s General Stores, Inc. | | | 109,400 | | | | 14,387,194 | |
Rite Aid Corp. (a) | | | 289,000 | | | | 2,164,610 | |
| | | | | | | | |
| | | | | | | 16,551,804 | |
| | | | | | | | |
|
Food Products—2.4% | |
Cal-Maine Foods, Inc. (b) | | | 87,500 | | | | 3,878,000 | |
J&J Snack Foods Corp. | | | 91,100 | | | | 10,865,497 | |
John B Sanfilippo & Son, Inc. | | | 19,200 | | | | 818,496 | |
Post Holdings, Inc. (a) | | | 89,000 | | | | 7,359,410 | |
TreeHouse Foods, Inc. (a) (b) | | | 67,900 | | | | 6,969,935 | |
| | | | | | | | |
| | | | | | | 29,891,338 | |
| | | | | | | | |
|
Health Care Equipment & Supplies—5.2% | |
Abaxis, Inc. (b) | | | 47,800 | | | | 2,257,594 | |
Align Technology, Inc. (a) | | | 122,500 | | | | 9,867,375 | |
Cantel Medical Corp. | | | 74,000 | | | | 5,086,020 | |
Cooper Cos., Inc. (The) | | | 24,100 | | | | 4,134,837 | |
DexCom, Inc. (a) | | | 92,800 | | | | 7,361,824 | |
Halyard Health, Inc. (a) | | | 80,800 | | | | 2,627,616 | |
ICU Medical, Inc. (a) | | | 55,200 | | | | 6,223,800 | |
IDEXX Laboratories, Inc. (a) | | | 52,500 | | | | 4,875,150 | |
Inogen, Inc. (a) | | | 68,500 | | | | 3,432,535 | |
Masimo Corp. (a) | | | 105,000 | | | | 5,514,075 | |
Natus Medical, Inc. (a) | | | 106,600 | | | | 4,029,480 | |
West Pharmaceutical Services, Inc. | | | 115,100 | | | | 8,733,788 | |
| | | | | | | | |
| | | | | | | 64,144,094 | |
| | | | | | | | |
|
Health Care Providers & Services—4.0% | |
Air Methods Corp. (a) (b) | | | 47,100 | | | | 1,687,593 | |
Centene Corp. (a) | | | 142,687 | | | | 10,183,571 | |
Chemed Corp. (b) | | | 38,900 | | | | 5,302,459 | |
Corvel Corp. (a) | | | 65,800 | | | | 2,841,244 | |
HealthSouth Corp. | | | 97,900 | | | | 3,800,478 | |
MEDNAX, Inc. (a) (b) | | | 58,500 | | | | 4,237,155 | |
Surgical Care Affiliates, Inc. (a) | | | 97,800 | | | | 4,662,126 | |
Team Health Holdings, Inc. (a) (b) | | | 120,300 | | | | 4,892,601 | |
U.S. Physical Therapy, Inc. | | | 79,600 | | | | 4,792,716 | |
WellCare Health Plans, Inc. (a) | | | 63,000 | | | | 6,758,640 | |
| | | | | | | | |
| | | | | | | 49,158,583 | |
| | | | | | | | |
|
Health Care Technology—0.3% | |
Omnicell, Inc. (a) | | | 111,000 | | | | 3,799,530 | |
| | | | | | | | |
|
Hotels, Restaurants & Leisure—6.5% | |
Brinker International, Inc. (b) | | | 130,200 | | | | 5,928,006 | |
Buffalo Wild Wings, Inc. (a) (b) | | | 23,300 | | | | 3,237,535 | |
Cheesecake Factory, Inc. (The) (b) | | | 56,500 | | | | 2,719,910 | |
Choice Hotels International, Inc. (b) | | | 84,400 | | | | 4,019,128 | |
Churchill Downs, Inc. | | | 44,000 | | | | 5,559,840 | |
Denny’s Corp. (a) | | | 530,200 | | | | 5,689,046 | |
Diamond Resorts International, Inc. (a) (b) | | | 194,700 | | | | 5,833,212 | |
Domino’s Pizza, Inc. | | | 101,600 | | | | 13,348,208 | |
Jack in the Box, Inc. | | | 75,500 | | | | 6,486,960 | |
Marriott Vacations Worldwide Corp. (b) | | | 95,900 | | | | 6,568,191 | |
Red Robin Gourmet Burgers, Inc. (a) | | | 28,200 | | | | 1,337,526 | |
Six Flags Entertainment Corp. | | | 105,300 | | | | 6,102,135 | |
Vail Resorts, Inc. | | | 97,500 | | | | 13,477,425 | |
| | | | | | | | |
| | | | | | | 80,307,122 | |
| | | | | | | | |
|
Household Durables—0.8% | |
Helen of Troy, Ltd. (a) | | | 96,200 | | | | 9,893,208 | |
| | | | | | | | |
|
Household Products—0.4% | |
Spectrum Brands Holdings, Inc. (b) | | | 45,400 | | | | 5,416,674 | |
| | | | | | | | |
|
Insurance—0.4% | |
Amtrust Financial Services, Inc. (b) | | | 207,156 | | | | 5,075,322 | |
| | | | | | | | |
See accompanying notes to financial statements.
MSF-5
Metropolitan Series Fund
T. Rowe Price Small Cap Growth Portfolio
Schedule of Investments as of June 30, 2016 (Unaudited)
Common Stocks—(Continued)
| | | | | | | | |
| Security Description | | Shares | | | Value | |
|
Internet & Catalog Retail—1.6% | |
HSN, Inc. | | | 133,900 | | | $ | 6,551,727 | |
Liberty TripAdvisor Holdings, Inc. - Class A (a) | | | 154,800 | | | | 3,387,024 | |
Liberty Ventures - Series A (a) | | | 181,600 | | | | 6,731,912 | |
Shutterfly, Inc. (a) (b) | | | 56,000 | | | | 2,610,160 | |
| | | | | | | | |
| | | | | | | 19,280,823 | |
| | | | | | | | |
| | |
Internet Software & Services—2.5% | | | | | | | | |
comScore, Inc. (a) (b) | | | 85,700 | | | | 2,046,516 | |
CoStar Group, Inc. (a) | | | 24,900 | | | | 5,444,634 | |
Envestnet, Inc. (a) (b) | | | 75,500 | | | | 2,514,905 | |
j2 Global, Inc. (b) | | | 60,300 | | | | 3,809,151 | |
LogMeIn, Inc. (a) | | | 55,800 | | | | 3,539,394 | |
MercadoLibre, Inc. | | | 19,500 | | | | 2,743,065 | |
Stamps.com, Inc. (a) (b) | | | 47,600 | | | | 4,161,192 | |
WebMD Health Corp. (a) (b) | | | 120,400 | | | | 6,996,444 | |
| | | | | | | | |
| | | | | | | 31,255,301 | |
| | | | | | | | |
| | |
IT Services—6.7% | | | | | | | | |
Blackhawk Network Holdings, Inc. (a) | | | 88,200 | | | | 2,953,818 | |
Booz Allen Hamilton Holding Corp. | | | 191,900 | | | | 5,687,916 | |
Broadridge Financial Solutions, Inc. | | | 136,800 | | | | 8,919,360 | |
Cardtronics, Inc. (a) | | | 131,200 | | | | 5,223,072 | |
CoreLogic, Inc. (a) | | | 168,300 | | | | 6,476,184 | |
DST Systems, Inc. | | | 65,300 | | | | 7,602,879 | |
EPAM Systems, Inc. (a) | | | 25,200 | | | | 1,620,612 | |
Euronet Worldwide, Inc. (a) | | | 97,400 | | | | 6,739,106 | |
Gartner, Inc. (a) | | | 77,000 | | | | 7,500,570 | |
Global Payments, Inc. | | | 27,715 | | | | 1,978,297 | |
Jack Henry & Associates, Inc. | | | 53,800 | | | | 4,695,126 | |
MAXIMUS, Inc. | | | 210,200 | | | | 11,638,774 | |
Perficient, Inc. (a) | | | 43,900 | | | | 891,609 | |
Travelport Worldwide, Ltd. | | | 222,900 | | | | 2,873,181 | |
WEX, Inc. (a) | | | 98,300 | | | | 8,716,261 | |
| | | | | | | | |
| | | | | | | 83,516,765 | |
| | | | | | | | |
| | |
Leisure Products—0.6% | | | | | | | | |
Brunswick Corp. | | | 131,800 | | | | 5,973,176 | |
Polaris Industries, Inc. (b) | | | 16,400 | | | | 1,340,864 | |
| | | | | | | | |
| | | | | | | 7,314,040 | |
| | | | | | | | |
| | |
Life Sciences Tools & Services—3.0% | | | | | | | | |
Bio-Rad Laboratories, Inc. - Class A (a) | | | 31,100 | | | | 4,447,922 | |
Bruker Corp. | | | 144,100 | | | | 3,276,834 | |
Cambrex Corp. (a) | | | 121,300 | | | | 6,274,849 | |
Charles River Laboratories International, Inc. (a) | | | 74,100 | | | | 6,108,804 | |
INC Research Holdings, Inc. - Class A (a) | | | 102,100 | | | | 3,893,073 | |
PAREXEL International Corp. (a) | | | 86,400 | | | | 5,432,832 | |
PRA Health Sciences, Inc. (a) | | | 47,800 | | | | 1,996,128 | |
VWR Corp. (a) | | | 195,400 | | | | 5,647,060 | |
| | | | | | | | |
| | | | | | | 37,077,502 | |
| | | | | | | | |
| | |
Machinery—5.0% | | | | | | | | |
Actuant Corp. - Class A (b) | | | 26,300 | | | | 594,643 | |
Chart Industries, Inc. (a) | | | 13,600 | | | | 328,168 | |
Graco, Inc. | | | 84,800 | | | | 6,698,352 | |
|
Machinery—(Continued) | |
Hyster-Yale Materials Handling, Inc. | | | 14,094 | | | | 838,452 | |
IDEX Corp. | | | 40,200 | | | | 3,300,420 | |
John Bean Technologies Corp. | | | 137,200 | | | | 8,399,384 | |
Lincoln Electric Holdings, Inc. | | | 36,200 | | | | 2,138,696 | |
Middleby Corp. (The) (a) | | | 84,400 | | | | 9,727,100 | |
Nordson Corp. | | | 67,200 | | | | 5,618,592 | |
Standex International Corp. | | | 26,500 | | | | 2,189,695 | |
Sun Hydraulics Corp. | | | 49,100 | | | | 1,457,779 | |
Toro Co. (The) | | | 130,600 | | | | 11,518,920 | |
Wabtec Corp. (b) | | | 61,500 | | | | 4,319,145 | |
Woodward, Inc. | | | 80,500 | | | | 4,640,020 | |
| | | | | | | | |
| | | | | | | 61,769,366 | |
| | | | | | | | |
| | |
Marine—0.4% | | | | | | | | |
Kirby Corp. (a) (b) | | | 49,100 | | | | 3,063,349 | |
Matson, Inc. | | | 66,700 | | | | 2,153,743 | |
| | | | | | | | |
| | | | | | | 5,217,092 | |
| | | | | | | | |
| | |
Media—1.8% | | | | | | | | |
Cable One, Inc. (b) | | | 12,200 | | | | 6,239,202 | |
Eros International plc (a) (b) | | | 64,300 | | | | 1,046,161 | |
Gray Television, Inc. (a) | | | 190,200 | | | | 2,063,670 | |
John Wiley & Sons, Inc. - Class A | | | 4,900 | | | | 255,682 | |
Live Nation Entertainment, Inc. (a) | | | 287,700 | | | | 6,760,950 | |
Starz - Class A (a) (b) | | | 194,000 | | | | 5,804,480 | |
| | | | | | | | |
| | | | | | | 22,170,145 | |
| | | | | | | | |
| | |
Metals & Mining—0.2% | | | | | | | | |
Compass Minerals International, Inc. (b) | | | 24,900 | | | | 1,847,331 | |
Worthington Industries, Inc. | | | 12,000 | | | | 507,600 | |
| | | | | | | | |
| | | | | | | 2,354,931 | |
| | | | | | | | |
| | |
Multiline Retail—0.4% | | | | | | | | |
Big Lots, Inc. (b) | | | 109,800 | | | | 5,502,078 | |
| | | | | | | | |
| | |
Oil, Gas & Consumable Fuels—2.4% | | | | | | | | |
Carrizo Oil & Gas, Inc. (a) (b) | | | 115,700 | | | | 4,147,845 | |
Diamondback Energy, Inc. (a) | | | 61,000 | | | | 5,563,810 | |
Gran Tierra Energy, Inc. (a) (b) | | | 179,500 | | | | 606,710 | |
Matador Resources Co. (a) (b) | | | 246,200 | | | | 4,874,760 | |
PDC Energy, Inc. (a) | | | 101,800 | | | | 5,864,698 | |
SemGroup Corp. - Class A (b) | | | 34,800 | | | | 1,133,088 | |
World Fuel Services Corp. | | | 144,900 | | | | 6,881,301 | |
| | | | | | | | |
| | | | | | | 29,072,212 | |
| | | | | | | | |
| | |
Paper & Forest Products—0.2% | | | | | | | | |
Clearwater Paper Corp. (a) | | | 21,500 | | | | 1,405,455 | |
KapStone Paper and Packaging Corp. | | | 112,500 | | | | 1,463,625 | |
| | | | | | | | |
| | | | | | | 2,869,080 | |
| | | | | | | | |
| | |
Personal Products—0.1% | | | | | | | | |
Nu Skin Enterprises, Inc. - Class A | | | 27,500 | | | | 1,270,225 | |
| | | | | | | | |
See accompanying notes to financial statements.
MSF-6
Metropolitan Series Fund
T. Rowe Price Small Cap Growth Portfolio
Schedule of Investments as of June 30, 2016 (Unaudited)
Common Stocks—(Continued)
| | | | | | | | |
| Security Description | | Shares | | | Value | |
| | |
Pharmaceuticals—2.4% | | | | | | | | |
Akorn, Inc. (a) (b) | | | 165,400 | | | $ | 4,711,419 | |
Depomed, Inc. (a) (b) | | | 154,700 | | | | 3,035,214 | |
Innoviva, Inc. (a) (b) | | | 62,900 | | | | 662,337 | |
Jazz Pharmaceuticals plc (a) | | | 6,300 | | | | 890,253 | |
Mallinckrodt plc (a) | | | 12,176 | | | | 740,057 | |
Medicines Co. (The) (a) (b) | | | 66,500 | | | | 2,236,395 | |
Nektar Therapeutics (a) (b) | | | 139,500 | | | | 1,985,085 | |
Pacira Pharmaceuticals, Inc. (a) (b) | | | 35,400 | | | | 1,194,042 | |
Phibro Animal Health Corp. - Class A | | | 116,500 | | | | 2,173,890 | |
Prestige Brands Holdings, Inc. (a) (b) | | | 167,600 | | | | 9,285,040 | |
TherapeuticsMD, Inc. (a) (b) | | | 274,100 | | | | 2,329,850 | |
Theravance Biopharma, Inc. (a) (b) | | | 36,714 | | | | 833,041 | |
| | | | | | | | |
| | | | | | | 30,076,623 | |
| | | | | | | | |
| | |
Professional Services—1.4% | | | | | | | | |
Dun & Bradstreet Corp. (The) (b) | | | 44,600 | | | | 5,434,064 | |
Exponent, Inc. | | | 110,300 | | | | 6,442,623 | |
Huron Consulting Group, Inc. (a) | | | 70,200 | | | | 4,241,484 | |
TransUnion (a) | | | 25,455 | | | | 851,215 | |
TriNet Group, Inc. (a) | | | 11,000 | | | | 228,690 | |
| | | | | | | | |
| | | | | | | 17,198,076 | |
| | | | | | | | |
| | |
Real Estate Investment Trusts—3.4% | | | | | | | | |
CoreSite Realty Corp. | | | 99,000 | | | | 8,780,310 | |
CubeSmart | | | 135,100 | | | | 4,171,888 | |
CyrusOne, Inc. | | | 152,600 | | | | 8,493,716 | |
Equity Lifestyle Properties, Inc. | | | 127,000 | | | | 10,166,350 | |
FelCor Lodging Trust, Inc. (b) | | | 547,300 | | | | 3,409,679 | |
Forest City Realty Trust, Inc. - Class A | | | 206,300 | | | | 4,602,553 | |
Pebblebrook Hotel Trust (b) | | | 71,600 | | | | 1,879,500 | |
| | | | | | | | |
| | | | | | | 41,503,996 | |
| | | | | | | | |
| |
Real Estate Management & Development—0.5% | | | | | |
Jones Lang LaSalle, Inc. | | | 27,500 | | | | 2,679,875 | |
Kennedy-Wilson Holdings, Inc. | | | 166,643 | | | | 3,159,551 | |
| | | | | | | | |
| | | | | | | 5,839,426 | |
| | | | | | | | |
| | |
Road & Rail—1.3% | | | | | | | | |
AMERCO | | | 14,800 | | | | 5,543,340 | |
Avis Budget Group, Inc. (a) | | | 40,900 | | | | 1,318,207 | |
Landstar System, Inc. (b) | | | 46,700 | | | | 3,206,422 | |
Old Dominion Freight Line, Inc. (a) | | | 99,250 | | | | 5,985,767 | |
| | | | | | | | |
| | | | | | | 16,053,736 | |
| | | | | | | | |
|
Semiconductors & Semiconductor Equipment—2.3% | |
Cabot Microelectronics Corp. | | | 38,700 | | | | 1,638,558 | |
Cavium, Inc. (a) (b) | | | 70,400 | | | | 2,717,440 | |
Cirrus Logic, Inc. (a) | | | 109,400 | | | | 4,243,626 | |
Integrated Device Technology, Inc. (a) | | | 263,100 | | | | 5,296,203 | |
Microsemi Corp. (a) (b) | | | 205,800 | | | | 6,725,544 | |
Synaptics, Inc. (a) (b) | | | 92,500 | | | | 4,971,875 | |
Teradyne, Inc. | | | 134,000 | | | | 2,638,460 | |
| | | | | | | | |
| | | | | | | 28,231,706 | |
| | | | | | | | |
| | |
Software—8.4% | | | | | | | | |
ACI Worldwide, Inc. (a) | | | 199,700 | | | | 3,896,147 | |
Aspen Technology, Inc. (a) (b) | | | 139,300 | | | | 5,605,432 | |
Blackbaud, Inc. | | | 128,600 | | | | 8,731,940 | |
CommVault Systems, Inc. (a) | | | 48,600 | | | | 2,099,034 | |
Computer Modelling Group, Ltd. (b) | | | 240,700 | | | | 1,926,420 | |
Descartes Systems Group, Inc. (The) (a) | | | 175,600 | | | | 3,352,204 | |
Fair Isaac Corp. | | | 80,400 | | | | 9,086,004 | |
Fortinet, Inc. (a) | | | 184,100 | | | | 5,815,719 | |
Manhattan Associates, Inc. (a) | | | 171,300 | | | | 10,985,469 | |
Monotype Imaging Holdings, Inc. | | | 73,705 | | | | 1,815,354 | |
Pegasystems, Inc. | | | 154,900 | | | | 4,174,555 | |
Proofpoint, Inc. (a) (b) | | | 82,300 | | | | 5,192,307 | |
PTC, Inc. (a) | | | 164,000 | | | | 6,163,120 | |
SS&C Technologies Holdings, Inc. (b) | | | 278,000 | | | | 7,806,240 | |
Take-Two Interactive Software, Inc. (a) (b) | | | 98,800 | | | | 3,746,496 | |
Tyler Technologies, Inc. (a) (b) | | | 83,400 | | | | 13,903,614 | |
Ultimate Software Group, Inc. (The) (a) | | | 43,900 | | | | 9,231,731 | |
| | | | | | | | |
| | | | | | | 103,531,786 | |
| | | | | | | | |
| | |
Specialty Retail—3.0% | | | | | | | | |
Aaron’s, Inc. | | | 17,900 | | | | 391,831 | |
Buckle, Inc. (The) (b) | | | 10,000 | | | | 259,900 | |
Burlington Stores, Inc. (a) | | | 191,600 | | | | 12,781,636 | |
Chico’s FAS, Inc. | | | 71,600 | | | | 766,836 | |
Children’s Place, Inc. (The) (b) | | | 22,800 | | | | 1,828,104 | |
Monro Muffler Brake, Inc. (b) | | | 118,100 | | | | 7,506,436 | |
Murphy USA, Inc. (a) | | | 132,900 | | | | 9,855,864 | |
Sally Beauty Holdings, Inc. (a) (b) | | | 144,600 | | | | 4,252,686 | |
| | | | | | | | |
| | | | | | | 37,643,293 | |
| | | | | | | | |
|
Technology Hardware, Storage & Peripherals—0.2% | |
Cray, Inc. (a) | | | 70,900 | | | | 2,121,328 | |
| | | | | | | | |
|
Textiles, Apparel & Luxury Goods—1.7% | |
Carter’s, Inc. | | | 92,700 | | | | 9,869,769 | |
G-III Apparel Group, Ltd. (a) | | | 99,100 | | | | 4,530,852 | |
Steven Madden, Ltd. (a) | | | 190,900 | | | | 6,524,962 | |
| | | | | | | | |
| | | | | | | 20,925,583 | |
| | | | | | | | |
| | |
Thrifts & Mortgage Finance—0.4% | | | | | | | | |
MGIC Investment Corp. (a) | | | 438,900 | | | | 2,611,455 | |
Radian Group, Inc. | | | 264,800 | | | | 2,759,216 | |
| | | | | | | | |
| | | | | | | 5,370,671 | |
| | | | | | | | |
| |
Trading Companies & Distributors—0.2% | | | | | |
Beacon Roofing Supply, Inc. (a) | | | 60,300 | | | | 2,741,841 | |
| | | | | | | | |
Total Common Stocks
(Cost $1,014,668,061) | | | | | | | 1,234,449,306 | |
| | | | | | | | |
See accompanying notes to financial statements.
MSF-7
Metropolitan Series Fund
T. Rowe Price Small Cap Growth Portfolio
Schedule of Investments as of June 30, 2016 (Unaudited)
Short-Term Investments—17.0%
| | | | | | | | |
| Security Description | | Shares | | | Value | |
| | |
Mutual Funds—17.0% | | | | | | | | |
State Street Navigator Securities Lending MET Portfolio (c) | | | 204,844,110 | | | $ | 204,844,110 | |
T. Rowe Price Government Reserve Investment Fund (d) | | | 5,861,385 | | | | 5,861,385 | |
| | | | | | | | |
Total Short-Term Investments
(Cost $210,705,495) | | | | | | | 210,705,495 | |
| | | | | | | | |
Total Investments—116.6%
(Cost $1,225,373,556) (e) | | | | | | | 1,445,154,801 | |
Other assets and liabilities (net)—(16.6)% | | | | | | | (205,506,973 | ) |
| | | | | | | | |
| Net Assets—100.0% | | | | | | $ | 1,239,647,828 | |
| | | | | | | | |
| (a) | Non-income producing security. |
| (b) | All or a portion of the security was held on loan. As of June 30, 2016, the market value of securities loaned was $245,592,504 and the collateral received consisted of cash in the amount of $204,844,110 and non-cash collateral with a value of $46,647,851. The cash collateral is invested in a money market fund managed by an affiliate of the custodian. The non-cash collateral received consists primarily of government securities and bank letters of credit, and is held for the benefit of the Portfolio at the Portfolio’s custodian. The Portfolio cannot repledge or resell this collateral. As such, this collateral is excluded from the Statement of Assets and Liabilities. |
| (c) | Represents investment of cash collateral received from securities on loan as of June 30, 2016. |
| (d) | Affiliated Issuer. (See Note 6 of the Notes to Financial Statements for a summary of transactions in securities of affiliated issuers.) |
| (e) | As of June 30, 2016, the aggregate cost of investments was $1,225,373,556. The aggregate unrealized appreciation and depreciation of investments were $288,637,744 and $(68,856,499), respectively, resulting in net unrealized appreciation of $219,781,245. |
Fair Value Hierarchy
Accounting principles generally accepted in the United States of America (“GAAP”) define fair market value as the price that the Portfolio would receive to sell an asset or pay to transfer a liability in an orderly transaction between market participants at the measurement date. It establishes a fair value hierarchy that prioritizes inputs to valuation methods and requires disclosure of the fair value hierarchy, separately for each major category of assets and liabilities, that segregates fair value measurements into three levels. Levels 1, 2 and 3 of the fair value hierarchy are defined as follows:
Level 1 - unadjusted quoted prices in active markets for identical investments
Level 2 - other significant observable inputs (including, but not limited to, quoted prices for similar assets or liabilities in markets that are either active or inactive; inputs other than quoted prices that are observable such as interest rates, yield curves, volatilities, prepayment speeds, loss severities, credit risks, default rates, or other market corroborated inputs)
Level 3 - significant unobservable inputs based on the best information available in the circumstances, to the extent observable inputs are unavailable (including the Portfolio’s own assumptions used in determining the fair value of investments and derivative financial instruments)
The inputs or methodologies used for valuing investments are not necessarily an indication of the risk associated with investing in them. Changes to the inputs or methodologies used may result in transfers between levels, which will be recognized as of the beginning of the reporting period. Information on transfers between Level 1 and Level 2, if any, will be disclosed following the fair value hierarchy table below. A reconciliation of Level 3 securities, if any, will also be disclosed following the fair value hierarchy table. For more information about the Portfolio’s policy regarding the valuation of investments, please refer to the Notes to Financial Statements.
The following table summarizes the fair value hierarchy of the Portfolio’s investments as of June 30, 2016:
| | | | | | | | | | | | | | | | |
| Description | | Level 1 | | | Level 2 | | | Level 3 | | | Total | |
Total Common Stocks* | | $ | 1,234,449,306 | | | $ | — | | | $ | — | | | $ | 1,234,449,306 | |
Total Short-Term Investments* | | | 210,705,495 | | | | — | | | | — | | | | 210,705,495 | |
Total Investments | | $ | 1,445,154,801 | | | $ | — | | | $ | — | | | $ | 1,445,154,801 | |
| | | | | | | | | | | | | | | | | |
Collateral for Securities Loaned (Liability) | | $ | — | | | $ | (204,844,110 | ) | | $ | — | | | $ | (204,844,110 | ) |
| * | See Schedule of Investments for additional detailed categorizations. |
See accompanying notes to financial statements.
MSF-8
Metropolitan Series Fund
T. Rowe Price Small Cap Growth Portfolio
Statement of Assets and Liabilities
June 30, 2016 (Unaudited)
| | | | |
Assets | | | | |
Investments at value (a) (b) | | $ | 1,439,293,416 | |
Affiliated investments at value (c) | | | 5,861,385 | |
Cash denominated in foreign currencies (d) | | | 15,836 | |
Receivable for: | | | | |
Investments sold | | | 5,284,098 | |
Fund shares sold | | | 142,997 | |
Dividends | | | 733,289 | |
Dividends on affiliated investments | | | 1,067 | |
Prepaid expenses | | | 7,928 | |
| | | | |
Total Assets | | | 1,451,340,016 | |
Liabilities | | | | |
Due to custodian | | | 3,453,602 | |
Collateral for securities loaned | | | 204,844,110 | |
Payables for: | | | | |
Investments purchased | | | 1,829,876 | |
Fund shares redeemed | | | 741,120 | |
Accrued Expenses: | | | | |
Management fees | | | 452,977 | |
Distribution and service fees | | | 77,425 | |
Deferred trustees’ fees | | | 77,020 | |
Other expenses | | | 216,058 | |
| | | | |
Total Liabilities | | | 211,692,188 | |
| | | | |
Net Assets | | $ | 1,239,647,828 | |
| | | | |
Net Assets Consist of: | | | | |
Paid in surplus | | $ | 992,978,663 | |
Undistributed net investment income | | | 1,802,004 | |
Accumulated net realized gain | | | 25,085,906 | |
Unrealized appreciation on investments and foreign currency transactions | | | 219,781,255 | |
| | | | |
Net Assets | | $ | 1,239,647,828 | |
| | | | |
Net Assets | | | | |
Class A | | $ | 853,740,996 | |
Class B | | | 368,225,827 | |
Class E | | | 15,374,214 | |
Class G | | | 2,306,791 | |
Capital Shares Outstanding* | | | | |
Class A | | | 43,855,422 | |
Class B | | | 20,117,076 | |
Class E | | | 822,939 | |
Class G | | | 130,010 | |
Net Asset Value, Offering Price and Redemption Price Per Share | | | | |
Class A | | $ | 19.47 | |
Class B | | | 18.30 | |
Class E | | | 18.68 | |
Class G | | | 17.74 | |
| * | The Portfolio is authorized to issue an unlimited number of shares. |
| (a) | Identified cost of investments, excluding affiliated investments, was $1,219,512,171. |
| (b) | Includes securities loaned at value of $245,592,504. |
| (c) | Identified cost of affiliated investments was $5,861,385. |
| (d) | Identified cost of cash denominated in foreign currencies was $15,826. |
Statement of Operations
Six Months Ended June 30, 2016 (Unaudited)
| | | | |
Investment Income | | | | |
Dividends (a) | | $ | 4,288,902 | |
Dividends from affiliated investments | | | 13,262 | |
Securities lending income | | | 743,155 | |
| | | | |
Total investment income | | | 5,045,319 | |
Expenses | | | | |
Management fees | | | 2,783,004 | |
Administration fees | | | 15,053 | |
Custodian and accounting fees | | | 63,758 | |
Distribution and service fees—Class B | | | 438,393 | |
Distribution and service fees—Class E | | | 11,435 | |
Distribution and service fees—Class G | | | 2,663 | |
Audit and tax services | | | 20,230 | |
Legal | | | 13,696 | |
Trustees’ fees and expenses | | | 15,990 | |
Shareholder reporting | | | 64,189 | |
Insurance | | | 4,263 | |
Miscellaneous | | | 9,104 | |
| | | | |
Total expenses | | | 3,441,778 | |
Less management fee waiver | | | (130,281 | ) |
Less broker commission recapture | | | (2,831 | ) |
| | | | |
Net expenses | | | 3,308,666 | |
| | | | |
Net Investment Income | | | 1,736,653 | |
| | | | |
Net Realized and Unrealized Gain (Loss) | | | | |
| Net realized gain on: | | | | |
Investments | | | 26,398,251 | |
Foreign currency transactions | | | 73 | |
| | | | |
Net realized gain | | | 26,398,324 | |
| | | | |
| Net change in unrealized appreciation (depreciation) on: | | | | |
Investments | | | (9,760,296 | ) |
Foreign currency transactions | | | 133 | |
| | | | |
Net change in unrealized depreciation | | | (9,760,163 | ) |
| | | | |
Net realized and unrealized gain | | | 16,638,161 | |
| | | | |
Net Increase in Net Assets From Operations | | $ | 18,374,814 | |
| | | | |
| (a) | Net of foreign withholding taxes of $7,876. |
See accompanying notes to financial statements.
MSF-9
Metropolitan Series Fund
T. Rowe Price Small Cap Growth Portfolio
Statements of Changes in Net Assets
| | | | | | | | |
| | | Six Months
Ended
June 30, 2016
(Unaudited) | | | Year Ended
December 31,
2015 | |
Increase (Decrease) in Net Assets: | | | | | | | | |
From Operations | | | | | | | | |
Net investment income | | $ | 1,736,653 | | | $ | 2,688,274 | |
Net realized gain | | | 26,398,324 | | | | 158,042,254 | |
Net change in unrealized depreciation | | | (9,760,163 | ) | | | (122,202,415 | ) |
| | | | | | | | |
Increase in net assets from operations | | | 18,374,814 | | | | 38,528,113 | |
| | | | | | | | |
From Distributions to Shareholders | | | | | | | | |
Net investment income | | | | | | | | |
Class A | | | (2,262,161 | ) | | | (1,259,590 | ) |
Class B | | | (122,343 | ) | | | 0 | |
Class E | | | (22,202 | ) | | | 0 | |
Net realized capital gains | | | | | | | | |
Class A | | | (107,740,208 | ) | | | (79,094,819 | ) |
Class B | | | (49,111,904 | ) | | | (34,643,548 | ) |
Class E | | | (2,012,509 | ) | | | (1,604,588 | ) |
Class G | | | (310,878 | ) | | | (31,998 | ) |
| | | | | | | | |
Total distributions | | | (161,582,205 | ) | | | (116,634,543 | ) |
| | | | | | | | |
Increase in net assets from capital share transactions | | | 127,699,982 | | | | 8,079,153 | |
| | | | | | | | |
Total decrease in net assets | | | (15,507,409 | ) | | | (70,027,277 | ) |
| | |
Net Assets | | | | | | | | |
Beginning of period | | | 1,255,155,237 | | | | 1,325,182,514 | |
| | | | | | | | |
End of period | | $ | 1,239,647,828 | | | $ | 1,255,155,237 | |
| | | | | | | | |
| | |
Undistributed net investment income | | | | | | | | |
End of period | | $ | 1,802,004 | | | $ | 2,472,057 | |
| | | | | | | | |
Other Information:
Capital Shares
Transactions in capital shares were as follows:
| | | | | | | | | | | | | | | | |
| | | Six Months Ended
June 30, 2016
(Unaudited) | | | Year Ended
December 31, 2015 | |
| | | Shares | | | Value | | | Shares | | | Value | |
Class A | | | | | | | | | | | | | | | | |
Sales | | | 1,694,277 | | | $ | 36,247,290 | | | | 920,807 | | | $ | 21,896,567 | |
Reinvestments | | | 5,702,559 | | | | 110,002,369 | | | | 3,406,291 | | | | 80,354,409 | |
Redemptions | | | (2,772,230 | ) | | | (59,418,051 | ) | | | (5,210,225 | ) | | | (125,668,142 | ) |
| | | | | | | | | | | | | | | | |
Net increase (decrease) | | | 4,624,606 | | | $ | 86,831,608 | | | | (883,127 | ) | | $ | (23,417,166 | ) |
| | | | | | | | | | | | | | | | |
Class B | | | | | | | | | | | | | | | | |
Sales | | | 888,689 | | | $ | 17,333,230 | | | | 1,884,588 | | | $ | 41,925,115 | |
Reinvestments | | | 2,714,126 | | | | 49,234,247 | | | | 1,548,661 | | | | 34,643,548 | |
Redemptions | | | (1,403,065 | ) | | | (27,366,600 | ) | | | (2,107,023 | ) | | | (47,302,904 | ) |
| | | | | | | | | | | | | | | | |
Net increase | | | 2,199,750 | | | $ | 39,200,877 | | | | 1,326,226 | | | $ | 29,265,759 | |
| | | | | | | | | | | | | | | | |
Class E | | | | | | | | | | | | | | | | |
Sales | | | 34,825 | | | $ | 699,474 | | | | 111,886 | | | $ | 2,564,259 | |
Reinvestments | | | 109,925 | | | | 2,034,711 | | | | 70,469 | | | | 1,604,588 | |
Redemptions | | | (118,046 | ) | | | (2,346,202 | ) | | | (141,884 | ) | | | (3,228,218 | ) |
| | | | | | | | | | | | | | | | |
Net increase | | | 26,704 | | | $ | 387,983 | | | | 40,471 | | | $ | 940,629 | |
| | | | | | | | | | | | | | | | |
Class G | | | | | | | | | | | | | | | | |
Sales | | | 53,702 | | | $ | 1,005,986 | | | | 61,861 | | | $ | 1,321,908 | |
Reinvestments | | | 17,684 | | | | 310,878 | | | | 1,463 | | | | 31,998 | |
Redemptions | | | (1,940 | ) | | | (37,350 | ) | | | (3,075 | ) | | | (63,975 | ) |
| | | | | | | | | | | | | | | | |
Net increase | | | 69,446 | | | $ | 1,279,514 | | | | 60,249 | | | $ | 1,289,931 | |
| | | | | | | | | | | | | | | | |
Increase derived from capital shares transactions | | | | | | $ | 127,699,982 | | | | | | | $ | 8,079,153 | |
| | | | | | | | | | | | | | | | |
See accompanying notes to financial statements.
MSF-10
Metropolitan Series Fund
T. Rowe Price Small Cap Growth Portfolio
Financial Highlights
| | | | | | | | | | | | | | | | | | | | | | | | |
| Selected per share data | | | | | | | | | | | | | | | | | | |
| | | Class A | |
| | | Six Months
Ended
June 30,
2016
(Unaudited) | | | Year Ended December 31, | |
| | | | 2015 | | | 2014 | | | 2013 | | | 2012 | | | 2011 | |
Net Asset Value, Beginning of Period | | $ | 22.01 | | | $ | 23.40 | | | $ | 23.77 | | | $ | 17.53 | | | $ | 16.68 | | | $ | 16.39 | |
| | | | | | | | | | | | | | | | | | | | | | | | |
Income (Loss) from Investment Operations | | | | | | | | | | | | | | | | | | | | | | | | |
Net investment income (loss) (a) | | | 0.04 | | | | 0.07 | | | | 0.06 | | | | 0.04 | | | | 0.10 | | | | (0.02 | ) |
Net realized and unrealized gain on investments | | | 0.29 | | | | 0.71 | | | | 1.35 | | | | 7.37 | | | | 2.52 | | | | 0.31 | |
| | | | | | | | | | | | | | | | | | | | | | | | |
Total from investment operations | | | 0.33 | | | | 0.78 | | | | 1.41 | | | | 7.41 | | | | 2.62 | | | | 0.29 | |
| | | | | | | | | | | | | | | | | | | | | | | | |
Less Distributions | | | | | | | | | | | | | | | | | | | | | | | | |
Distributions from net investment income | | | (0.06 | ) | | | (0.03 | ) | | | (0.00 | )(b) | | | (0.07 | ) | | | 0.00 | | | | 0.00 | |
Distributions from net realized capital gains | | | (2.81 | ) | | | (2.14 | ) | | | (1.78 | ) | | | (1.10 | ) | | | (1.77 | ) | | | 0.00 | |
| | | | | | | | | | | | | | | | | | | | | | | | |
Total distributions | | | (2.87 | ) | | | (2.17 | ) | | | (1.78 | ) | | | (1.17 | ) | | | (1.77 | ) | | | 0.00 | |
| | | | | | | | | | | | | | | | | | | | | | | | |
Net Asset Value, End of Period | | $ | 19.47 | | | $ | 22.01 | | | $ | 23.40 | | | $ | 23.77 | | | $ | 17.53 | | | $ | 16.68 | |
| | | | | | | | | | | | | | | | | | | | | | | | |
Total Return (%) (c) | | | 1.62 | (d) | | | 2.71 | | | | 6.91 | | | | 44.55 | | | | 16.18 | | | | 1.77 | |
| | | | | | |
Ratios/Supplemental Data | | | | | | | | | | | | | | | | | | | | | | | | |
Gross ratio of expenses to average net assets (%) | | | 0.51 | (e) | | | 0.50 | | | | 0.51 | | | | 0.52 | | | | 0.55 | | | | 0.55 | |
Net ratio of expenses to average net assets (%) (f) | | | 0.48 | (e) | | | 0.48 | | | | 0.48 | | | | 0.49 | | | | 0.52 | | | | 0.53 | |
Ratio of net investment income (loss) to average net assets (%) | | | 0.37 | (e) | | | 0.28 | | | | 0.25 | | | | 0.21 | | | | 0.56 | | | | (0.09 | ) |
Portfolio turnover rate (%) | | | 11 | (d) | | | 27 | | | | 25 | | | | 29 | | | | 26 | | | | 29 | |
Net assets, end of period (in millions) | | $ | 853.7 | | | $ | 863.6 | | | $ | 938.5 | | | $ | 714.2 | | | $ | 387.0 | | | $ | 263.8 | |
| |
| | | Class B | |
| | | Six Months
Ended
June 30,
2016
(Unaudited) | | | Year Ended December 31, | |
| | | | 2015 | | | 2014 | | | 2013 | | | 2012 | | | 2011 | |
Net Asset Value, Beginning of Period | | $ | 20.84 | | | $ | 22.28 | | | $ | 22.77 | | | $ | 16.84 | | | $ | 16.12 | | | $ | 15.89 | |
| | | | | | | | | | | | | | | | | | | | | | | | |
Income (Loss) from Investment Operations | | | | | | | | | | | | | | | | | | | | | | | | |
Net investment income (loss) (a) | | | 0.01 | | | | 0.01 | | | | (0.00 | )(g) | | | (0.01 | ) | | | 0.04 | | | | (0.06 | ) |
Net realized and unrealized gain on investments | | | 0.27 | | | | 0.69 | | | | 1.29 | | | | 7.07 | | | | 2.45 | | | | 0.29 | |
| | | | | | | | | | | | | | | | | | | | | | | | |
Total from investment operations | | | 0.28 | | | | 0.70 | | | | 1.29 | | | | 7.06 | | | | 2.49 | | | | 0.23 | |
| | | | | | | | | | | | | | | | | | | | | | | | |
Less Distributions | | | | | | | | | | | | | | | | | | | | | | | | |
Distributions from net investment income | | | (0.01 | ) | | | 0.00 | | | | 0.00 | | | | (0.03 | ) | | | 0.00 | | | | 0.00 | |
Distributions from net realized capital gains | | | (2.81 | ) | | | (2.14 | ) | | | (1.78 | ) | | | (1.10 | ) | | | (1.77 | ) | | | 0.00 | |
| | | | | | | | | | | | | | | | | | | | | | | | |
Total distributions | | | (2.82 | ) | | | (2.14 | ) | | | (1.78 | ) | | | (1.13 | ) | | | (1.77 | ) | | | 0.00 | |
| | | | | | | | | | | | | | | | | | | | | | | | |
Net Asset Value, End of Period | | $ | 18.30 | | | $ | 20.84 | | | $ | 22.28 | | | $ | 22.77 | | | $ | 16.84 | | | $ | 16.12 | |
| | | | | | | | | | | | | | | | | | | | | | | | |
Total Return (%) (c) | | | 1.45 | (d) | | | 2.46 | | | | 6.65 | | | | 44.17 | | | | 15.91 | | | | 1.45 | |
| | | | | | |
Ratios/Supplemental Data | | | | | | | | | | | | | | | | | | | | | | | | |
Gross ratio of expenses to average net assets (%) | | | 0.76 | (e) | | | 0.75 | | | | 0.76 | | | | 0.77 | | | | 0.80 | | | | 0.80 | |
Net ratio of expenses to average net assets (%) (f) | | | 0.73 | (e) | | | 0.73 | | | | 0.73 | | | | 0.74 | | | | 0.77 | | | | 0.78 | |
Ratio of net investment income (loss) to average net assets (%) | | | 0.12 | (e) | | | 0.03 | | | | (0.01 | ) | | | (0.05 | ) | | | 0.25 | | | | (0.34 | ) |
Portfolio turnover rate (%) | | | 11 | (d) | | | 27 | | | | 25 | | | | 29 | | | | 26 | | | | 29 | |
Net assets, end of period (in millions) | | $ | 368.2 | | | $ | 373.4 | | | $ | 369.6 | | | $ | 373.6 | | | $ | 276.5 | | | $ | 268.4 | |
Please see following page for Financial Highlights footnote legend.
See accompanying notes to financial statements.
MSF-11
Metropolitan Series Fund
T. Rowe Price Small Cap Growth Portfolio
Financial Highlights
| | | | | | | | | | | | | | | | | | | | | | | | |
| Selected per share data | | | | | | | | | | | | | | | | | | |
| | | Class E | |
| | | Six Months
Ended
June 30,
2016
(Unaudited) | | | Year Ended December 31, | |
| | | | 2015 | | | 2014 | | | 2013 | | | 2012 | | | 2011 | |
Net Asset Value, Beginning of Period | | $ | 21.23 | | | $ | 22.63 | | | $ | 23.09 | | | $ | 17.06 | | | $ | 16.29 | | | $ | 16.04 | |
| | | | | | | | | | | | | | | | | | | | | | | | |
Income (Loss) from Investment Operations | | | | | | | | | | | | | | | | | | | | | | | | |
Net investment income (loss) (a) | | | 0.02 | | | | 0.03 | | | | 0.02 | | | | 0.01 | | | | 0.06 | | | | (0.04 | ) |
Net realized and unrealized gain on investments | | | 0.27 | | | | 0.71 | | | | 1.30 | | | | 7.16 | | | | 2.48 | | | | 0.29 | |
| | | | | | | | | | | | | | | | | | | | | | | | |
Total from investment operations | | | 0.29 | | | | 0.74 | | | | 1.32 | | | | 7.17 | | | | 2.54 | | | | 0.25 | |
| | | | | | | | | | | | | | | | | | | | | | | | |
Less Distributions | | | | | | | | | | | | | | | | | | | | | | | | |
Distributions from net investment income | | | (0.03 | ) | | | 0.00 | | | | 0.00 | | | | (0.04 | ) | | | 0.00 | | | | 0.00 | |
Distributions from net realized capital gains | | | (2.81 | ) | | | (2.14 | ) | | | (1.78 | ) | | | (1.10 | ) | | | (1.77 | ) | | | 0.00 | |
| | | | | | | | | | | | | | | | | | | | | | | | |
Total distributions | | | (2.84 | ) | | | (2.14 | ) | | | (1.78 | ) | | | (1.14 | ) | | | (1.77 | ) | | | 0.00 | |
| | | | | | | | | | | | | | | | | | | | | | | | |
Net Asset Value, End of Period | | $ | 18.68 | | | $ | 21.23 | | | $ | 22.63 | | | $ | 23.09 | | | $ | 17.06 | | | $ | 16.29 | |
| | | | | | | | | | | | | | | | | | | | | | | | |
Total Return (%) (c) | | | 1.49 | (d) | | | 2.61 | | | | 6.69 | | | | 44.32 | | | | 16.06 | | | | 1.56 | |
| | | | | | |
Ratios/Supplemental Data | | | | | | | | | | | | | | | | | | | | | | | | |
Gross ratio of expenses to average net assets (%) | | | 0.66 | (e) | | | 0.65 | | | | 0.66 | | | | 0.67 | | | | 0.70 | | | | 0.70 | |
Net ratio of expenses to average net assets (%) (f) | | | 0.63 | (e) | | | 0.63 | | | | 0.63 | | | | 0.64 | | | | 0.67 | | | | 0.68 | |
Ratio of net investment income (loss) to average net assets (%) | | | 0.21 | (e) | | | 0.12 | | | | 0.09 | | | | 0.05 | | | | 0.34 | | | | (0.24 | ) |
Portfolio turnover rate (%) | | | 11 | (d) | | | 27 | | | | 25 | | | | 29 | | | | 26 | | | | 29 | |
Net assets, end of period (in millions) | | $ | 15.4 | | | $ | 16.9 | | | $ | 17.1 | | | $ | 18.8 | | | $ | 14.2 | | | $ | 14.2 | |
| | | | | | | | | | | | |
| |
| | | Class G | |
| | | Six Months
Ended
June 30,
2016
(Unaudited) | | | Year Ended
December 31, | |
| | | | 2015 | | | 2014(h) | |
Net Asset Value, Beginning of Period | | $ | 20.34 | | | $ | 21.78 | | | $ | 21.49 | |
| | | | | | | | | | | | |
Income (Loss) from Investment Operations | | | | | | | | | | | | |
Net investment income (loss) (a) | | | 0.01 | | | | (0.01 | ) | | | 0.01 | |
Net realized and unrealized gain on investments | | | 0.20 | | | | 0.71 | | | | 0.28 | |
| | | | | | | | | | | | |
Total from investment operations | | | 0.21 | | | | 0.70 | | | | 0.29 | |
| | | | | | | | | | | | |
Less Distributions | | | | | | | | | | | | |
Distributions from net realized capital gains | | | (2.81 | ) | | | (2.14 | ) | | | 0.00 | |
| | | | | | | | | | | | |
Total distributions | | | (2.81 | ) | | | (2.14 | ) | | | 0.00 | |
| | | | | | | | | | | | |
Net Asset Value, End of Period | | $ | 17.74 | | | $ | 20.34 | | | $ | 21.78 | |
| | | | | | | | | | | | |
Total Return (%) (c) | | | 1.16 | (d) | | | 2.51 | | | | 1.35 | (d) |
| | | |
Ratios/Supplemental Data | | | | | | | | | | | | |
Gross ratio of expenses to average net assets (%) | | | 0.81 | (e) | | | 0.80 | | | | 0.83 | (e) |
Net ratio of expenses to average net assets (%) (f) | | | 0.78 | (e) | | | 0.78 | | | | 0.81 | (e) |
Ratio of net investment income (loss) to average net assets (%) | | | 0.11 | (e) | | | (0.06 | ) | | | 0.40 | (e) |
Portfolio turnover rate (%) | | | 11 | (d) | | | 27 | | | | 25 | |
Net assets, end of period (in millions) | | $ | 2.3 | | | $ | 1.2 | | | $ | 0.0 | (i) |
| (a) | Per share amounts based on average shares outstanding during the period. |
| (b) | Distributions from net investment income were less than $0.01. |
| (c) | Total return does not reflect any insurance, sales, separate account or administrative charges of variable annuity or life insurance contracts or any additional expenses that contract owners may bear under their variable contracts. If these charges were included, the returns would be lower. |
| (d) | Periods less than one year are not computed on an annualized basis. |
| (e) | Computed on an annualized basis. |
| (f) | Includes the effects of management fee waivers (see Note 5 of the Notes to Financial Statements). |
| (g) | Net investment loss was less than $0.01. |
| (h) | Commencement of operations was November 12, 2014. |
| (i) | Net assets, end of period rounds to less than $0.1 million. |
See accompanying notes to financial statements.
MSF-12
Metropolitan Series Fund
T. Rowe Price Small Cap Growth Portfolio
Notes to Financial Statements—June 30, 2016 (Unaudited)
1. Organization
Metropolitan Series Fund (the “Trust”) is organized as a Delaware statutory trust and registered under the Investment Company Act of 1940, as amended (the “1940 Act”), as an open-end management investment company. The Trust, which is managed by MetLife Advisers, LLC (“MetLife Advisers” or the “Adviser”), an affiliate of MetLife, Inc., is currently comprised of thirty series, each of which operates as a distinct investment vehicle of the Trust. The portfolio included in this report is T. Rowe Price Small Cap Growth Portfolio (the “Portfolio”), which is diversified. Shares in the Portfolio are not offered directly to the general public and are currently available only to separate accounts established by Metropolitan Life Insurance Company (“MetLife”) and other affiliated life insurance companies.
The Portfolio has registered and offers four classes of shares: Class A, B, E and G shares. Shares of each Class of the Portfolio represent an equal pro rata interest in the Portfolio and generally give the shareholder the same voting, dividend, liquidation, and other rights. Investment income, realized and unrealized capital gains and losses, the common expenses of the Portfolio, and certain Portfolio-level expense reductions, if any, are allocated on a pro rata basis to each Class based on the relative net assets of each Class to the net assets of the Portfolio. Each Class of shares differs in its respective distribution plan and such distribution expenses are allocated to the corresponding Class of shares.
2. Significant Accounting Policies
The preparation of financial statements in conformity with accounting principles generally accepted in the United States of America (“GAAP”) requires management to make estimates and assumptions that affect the reported amounts of assets and liabilities and disclosure of contingent assets and liabilities as of the date of the financial statements and the reported amounts of income and expenses during the reporting period. Actual results could differ from those estimates. In the preparation of these financial statements, management has evaluated events and transactions subsequent to June 30, 2016 through the date the financial statements were issued.
The Portfolio is an investment company and follows the accounting and reporting guidance of the Financial Accounting Standards Board (“FASB”) Accounting Standards Codification Topic 946—Financial Services—Investment Companies and Topic 820—Fair Value Measurement. The following is a summary of significant accounting policies consistently followed by the Portfolio in the preparation of its financial statements.
Investment Valuation and Fair Value Measurements - Domestic and foreign equity securities, such as common stock, exchange-traded funds, rights, warrants, and preferred stock, that are traded on a securities exchange on a valuation date are generally valued at their last quoted sale price or official closing price on the primary exchange for such security, or, if no sales occurred on that day, at the last reported bid price. Equity securities traded over-the-counter (“OTC”) are generally valued at the last reported bid price. In the event of a major exchange closing during the trading day, the Adviser may use other market information obtained from quotation reporting systems, established market makers, or pricing services in valuing the securities. Valuation adjustments may be applied to certain foreign equity securities that are traded solely on foreign exchanges that close before the time as of which the Portfolio determines its NAV to account for the market movement between the close of the foreign exchanges and the time as of which the Portfolio determines its NAV. The Portfolio may use a systematic fair valuation model provided by a pricing service to value securities principally traded in these foreign markets in order to adjust for possible market movements or other changes that may occur between the close of the foreign exchanges and the time as of which the Portfolio determines its NAV. Foreign equity securities valued using these valuation adjustments are generally categorized as Level 2 within the fair value hierarchy. Equity securities that are actively traded, and have no valuation adjustments applied, are categorized as Level 1 within the fair value hierarchy. Other equity securities traded on inactive markets, or valued in reference to similar instruments traded on active markets, are generally categorized as Level 2 within the fair value hierarchy.
Investments in registered open-end management investment companies are valued at reported net asset value per share on the valuation date and are categorized as Level 1 within the fair value hierarchy.
Debt securities, including corporate, convertible and municipal bonds and notes; obligations of the U.S. Treasury and U.S. government agencies; foreign sovereign issues; and non-U.S. bonds, are generally valued on the basis of evaluated or composite bid quotations obtained from independent pricing services and/or brokers and dealers selected by the Adviser (each a “pricing service”), pursuant to authorization of and subject to general oversight by the Board of Trustees of the Trust (the “Board” or “Trustees”). Such pricing services may use matrix pricing, which considers observable inputs including, among other things, issuer details, maturity dates, interest rates, yield curves, rates of prepayment, credit risks/spreads, default rates, reported trades, broker dealer quotes and quoted prices for similar assets. Short-term obligations with a remaining maturity of sixty days or less may be valued at amortized cost in the absence of market quotes, so long as the amortized cost value of such short-term debt instrument is approximately the same as the fair value of the instrument as determined without the use of amortized cost valuation. Floating rate loans are generally valued on the basis of an evaluated or composite average of aggregate bid and ask quotations supplied by brokers or dealers, as obtained from the pricing service. Securities that use similar valuation techniques and inputs as described above are generally categorized as Level 2 within the fair value hierarchy.
MSF-13
Metropolitan Series Fund
T. Rowe Price Small Cap Growth Portfolio
Notes to Financial Statements—June 30, 2016—(Continued)
Options, whether on securities, indices, futures contracts, or otherwise, traded on exchanges are valued at the last sale price available as of the close of business on a valuation day or, if there is no such price available, at the last reported bid price. These types of options are categorized as Level 1 within the fair value hierarchy. Futures contracts that are traded on commodity exchanges are valued at their settlement prices established by the exchanges on which they are traded as of the close of such exchanges and are categorized as Level 1 within the fair value hierarchy.
If no current market value quotation or other observable inputs are readily available or market value quotations are deemed to be unreliable for an investment, the fair value of the investment will be determined in accordance with procedures approved by, and under the general supervision of, the Board. In such a circumstance, the Board will be assisted in its responsibility to determine the fair value of an investment by the Valuation Committee (“Committee”) of MetLife Advisers. The Committee provides general pricing oversight and fair value pricing determinations related to portfolio securities and meets on a regular basis to review reports relating to the valuation of the securities in the Portfolio. The Board has delegated to State Street Bank and Trust Company, the Trust’s custodian (“custodian”), the responsibility for calculating the net asset values (“NAVs”) of the Trust’s Portfolios. The Committee is responsible for overseeing the calculation of the NAVs of the Portfolios by the custodian. The Committee also periodically reviews pricing services, including the pricing services providing fair value pricing for the Portfolio’s foreign securities, and is responsible for overseeing the correction of pricing errors and addressing other pricing issues that arise in the ordinary course of business, such as making real-time fair value determinations, as necessary.
No single standard for determining the fair value of an investment can be set forth because fair value depends upon the facts and circumstances with respect to each investment. Information relating to any relevant factors may be obtained by the Committee from any appropriate source, including the subadviser of the Portfolio, the custodian, a pricing service, market maker and/or broker for such security or the issuer. Appropriate methodologies for determining fair value under particular circumstances may include: matrix pricing, a discounted cash flow analysis, comparisons of securities with comparable characteristics, value based on multiples of earnings, discount from market price of similar marketable securities or a combination of these and other methods.
Investment Transactions and Related Investment Income - Portfolio security transactions are recorded on the trade date. Dividend income is recorded on the ex-dividend date or, for certain foreign securities, when notified. Interest income, which includes amortization of premium and accretion of discount on debt securities, is recorded on the accrual basis. Realized gains and losses on investments are determined on the identified cost basis, which is the same basis used for federal income tax purposes. Foreign income and foreign capital gains on some foreign securities may be subject to foreign taxes, which are accrued as applicable. These foreign taxes have been provided for in accordance with the Portfolio’s understanding of the applicable countries’ tax rules and rates.
Foreign Currency Translation - The books and records of the Portfolio are maintained in U.S. dollars. The values of securities, currencies, and other assets and liabilities denominated in currencies other than the U.S. dollar are translated into U.S. dollars based upon foreign exchange rates prevailing at the end of the period. Purchases and sales of investment securities, income, and expenses are translated on the respective dates of such transactions. Because the values of investment securities are translated at the foreign exchange rates prevailing at the end of the period, that portion of the results of operations arising from changes in exchange rates and that portion of the results of operations reflecting fluctuations arising from changes in market prices of the investment securities are not separated. Such fluctuations are included in the net realized and unrealized gain or loss on investments.
Net realized foreign exchange gains or losses arise from activity in forward foreign currency exchange contracts, sales of foreign currency, currency gains or losses realized between the trade and settlement dates on securities transactions, and the difference between the amounts of dividends, interest, and foreign withholding taxes recorded by the Portfolio and the U.S. dollar equivalent of the amounts actually received or paid by the Portfolio. Net unrealized foreign exchange gains and losses arise from changes in the value of assets and liabilities, other than investment securities, resulting from changes in foreign exchange rates.
Dividends and Distributions to Shareholders - The Portfolio records dividends and distributions on the ex-dividend date. Net realized gains from securities transactions (if any) are generally distributed annually to shareholders. The timing and characterization of certain income and capital gains distributions are determined in accordance with federal tax regulations that may differ from GAAP. Permanent book and tax basis differences relating to shareholder distributions will result in reclassification between under/over distributed net investment income, accumulated net realized gains/losses, and paid-in surplus. Book-tax differences are primarily due to foreign currency transactions, real estate investment trust (REIT) adjustments, and broker commission recapture. These adjustments have no impact on net assets or the results of operations.
Income Taxes - It is the Portfolio’s policy to comply with the requirements of the Internal Revenue Code of 1986, as amended, and regulations thereunder, applicable to regulated investment companies and to distribute, with respect to each taxable year, all of its taxable income to shareholders. Therefore, no federal income tax provision is required. The Portfolio files U.S. federal tax returns. No income tax returns are currently under examination. The Portfolio’s federal tax returns for the prior three fiscal years remain subject to examination by the Internal Revenue Service. As of June 30, 2016, the Portfolio had no uncertain tax positions that would require financial statement recognition, or de-recognition or disclosure.
MSF-14
Metropolitan Series Fund
T. Rowe Price Small Cap Growth Portfolio
Notes to Financial Statements—June 30, 2016—(Continued)
Directed Brokerage Agreement - The Trust has entered into a directed brokerage arrangement with State Street Global Markets (“SSGM”). Under this arrangement, the Portfolio directs certain trades to SSGM in return for a recapture credit. SSGM issues a cash rebate to the Portfolio. Amounts paid to the Portfolio are shown separately as broker commission recapture on the Statement of Operations of the Portfolio. Additionally, these amounts have been excluded from the calculation of the net ratio of expenses to average net assets presented in the Financial Highlights for each share class.
Securities Lending - The Portfolio may lend its portfolio securities to certain qualified brokers who borrow securities in order to complete certain securities transactions. By lending its portfolio securities, the Portfolio attempts to increase its net investment income through the receipt of income on collateral held from securities on loan. Any gain or loss in the market price of the loaned securities that might occur and any interest earned or dividends declared during the term of the loan would accrue to the account of the Portfolio.
The Trust has entered into a Securities Lending Authorization Agreement with the custodian as the lending agent. Under this agreement, the custodian is authorized to loan portfolio securities on the Portfolio’s behalf. In exchange, the Portfolio receives either cash or securities as collateral against the loaned securities. The Portfolio receives collateral equal to at least 102% of the market value of the loaned securities (105% for foreign equity securities), at each loan’s inception. Collateral representing at least 100% of the market value of the loaned securities must be maintained for the duration of the loan. Cash collateral is generally invested in the State Street Navigator Securities Lending MET Portfolio (the “Navigator Portfolio”), a series of the State Street Navigator Securities Lending Trust that is managed by an affiliate of the custodian. The Navigator Portfolio is a registered money market fund that invests in a variety of high-quality, U.S. dollar-denominated instruments. If the market value of the collateral at the close of trading on a business day is less than 100% of the market value of the loaned securities at the close of trading on that day, the borrower shall be required to deliver, by the close of business on the following business day, an additional amount of collateral, so that the total amount of posted collateral is equal to at least 100% of the market value of all the loaned securities as of such preceding day. A portion of net income (income after the deduction of expenses and fees of the Navigator Portfolio) on the collateral is rebated to the borrower of the securities and the remainder is split between the custodian and the Portfolio. On loans collateralized by U.S. Treasuries, a fee is received from the borrower and is allocated between the Portfolio and the custodian. Income received by the Portfolio in securities lending transactions during the six months ended June 30, 2016 is reflected as Securities lending income on the Statement of Operations. The values of any securities loaned by the Portfolio and the related collateral at June 30, 2016 are disclosed in the footnotes to the Schedule of Investments. The value of the related collateral received by the Portfolio exceeded the value of the securities out on loan at June 30, 2016.
The risks associated with lending portfolio securities include, but are not limited to, possible delays in receiving additional collateral or in the recovery of the loaned securities, possible loss of rights in the collateral should the borrower fail financially, as well as risk of loss in the value of the collateral or the value of the investments made with the collateral. The lending agent shall indemnify the Portfolio in the case of default of any securities borrower.
All securities on loan are classified as Common Stocks in the Portfolio’s Schedule of Investments as of June 30, 2016, with a contractual maturity of overnight and continuous.
3. Certain Risks
In the normal course of business, the Portfolio invests in securities and enters into transactions where risks exist due to fluctuations in the market (“market risk”) or failure of the other party to a transaction to perform (“credit and counterparty risk”).
Market Risk: The value of securities held by the Portfolio may decline in response to certain events, including those directly involving the companies whose securities are owned by the Portfolio; conditions affecting the general economy; overall market changes; local, regional or global political, social or economic instability; and currency, interest rate, and price fluctuations.
Credit and Counterparty Risk: The Portfolio may be exposed to counterparty risk, or the risk that an entity with which the Portfolio has unsettled or open transactions may default. The potential loss could exceed the value of the financial assets and liabilities recorded in the financial statements. Financial assets that potentially expose the Portfolio to credit and counterparty risk consist principally of cash due from counterparties and investments. The Portfolio manages counterparty risk by entering into agreements only with counterparties that it believes have the financial resources to honor their obligations and by monitoring the financial stability of those counterparties. The Portfolio’s investment adviser attempts to mitigate counterparty risk by (i) periodically assessing the creditworthiness of its trading partners, (ii) monitoring and/or limiting the amount of its net exposure to each individual counterparty based on its assessment, and (iii) requiring collateral from the counterparty for certain transactions. In order to preserve certain safeguards for non-standard settlement trades, the Portfolio restricts its exposure to credit and counterparty losses by entering into master netting agreements (“Master Agreements”) with counterparties (approved brokers) with whom it undertakes a significant volume of transactions. Master Agreements govern the terms of certain transactions, and reduce the counterparty risk associated with relevant transactions by specifying credit protection mechanisms and providing standardization that improves legal certainty. Master Agreements can also help limit counterparty risk by specifying collateral posting arrangements at pre-arranged exposure levels.
MSF-15
Metropolitan Series Fund
T. Rowe Price Small Cap Growth Portfolio
Notes to Financial Statements—June 30, 2016—(Continued)
Repurchase and reverse repurchase agreements are primarily executed under Global Master Repurchase Agreements (“GMRAs”) or Master Repurchase Agreements (“MRAs”), which provide the rights to set-off. Each repurchase and reverse repurchase agreement is initially collateralized at the transaction level. In the event of default, the total market value exposure will be offset against collateral exchanged to date, which would result in a net receivable/(payable) that would be due from/to the counterparty.
Additional risks associated with each type of investment are described above within the respective security type notes. The Portfolio’s prospectus includes a discussion of the principal risks of investing in the Portfolio.
4. Investment Transactions
Aggregate cost of purchases and proceeds of sales of investment securities, excluding short-term securities, for the six months ended June 30, 2016 were as follows:
| | | | | | | | |
Purchases | | | Sales |
U.S. Government | | Non U.S. Government | | | U.S. Government | | Non U.S. Government |
| $0 | | $ | 129,451,072 | | | $0 | | $149,111,086 |
The Portfolio engaged in security transactions with other accounts managed by T. Rowe Price Associates, Inc. that amounted to $260,764 in sales of investments, which are included above, and resulted in realized losses of $70,320.
5. Investment Management Fees and Other Transactions with Affiliates
Investment Management Agreement - MetLife Advisers is the investment adviser to the Portfolio. The Trust has entered into an investment management agreement with MetLife Advisers with respect to the Portfolio. For providing investment management services to the Portfolio, MetLife Advisers receives monthly compensation at the following annual rates:
| | | | | | |
Management
Fees earned by
MetLife Advisers
for the six months ended
June 30, 2016 | | % per annum | | | Average Daily Net Assets |
| $2,783,004 | | | 0.550 | % | | Of the first $100 million |
| | | 0.500 | % | | Of the next $300 million |
| | | 0.450 | % | | On amounts in excess of $400 million |
MetLife Advisers has entered into an investment subadvisory agreement with respect to managing the Portfolio. T. Rowe Price Associates, Inc. (“T. Rowe Price”) is compensated by MetLife Advisers to provide subadvisory services for the Portfolio.
Management Fee Waivers - Effective February 17, 2005, T. Rowe Price agreed to a voluntary subadvisory fee waiver that applies if (i) assets under management by T. Rowe Price for the Trust and Met Investors Series Trust (“MIST”), an affiliate of the Trust, in the aggregate, exceed $750,000,000, (ii) T. Rowe Price subadvises three or more portfolios of the Trust and MIST in the aggregate, and (iii) at least one of those portfolios is a large cap domestic equity portfolio.
If the aforementioned conditions are met, T. Rowe Price will waive its subadvisory fee paid by MetLife Advisers by 5% for combined Trust and MIST average daily net assets over $750,000,000, 7.5% for the next $1,500,000,000 of combined assets, and 10% for amounts over $3,000,000,000. MetLife Advisers has voluntarily agreed to reduce its advisory fee for the Portfolio by the amount waived (if any) by T. Rowe Price for the Portfolio pursuant to this voluntary subadvisory fee waiver. Because these fee waivers are voluntary, and not contractual, they may be discontinued by T. Rowe Price and MetLife Advisers at any time. Amounts waived for the six months ended June 30, 2016 are shown as management fee waivers in the Statement of Operations.
Certain officers and trustees of the Trust may also be officers of MetLife Advisers; however, such officers and trustees receive no compensation from the Trust.
On January 12, 2016, MetLife, Inc. announced its plan to pursue the separation of a substantial portion of its retail segment and is currently evaluating structural alternatives for such separation. It is anticipated that MetLife Advisers would be included in any such separation. Any separation transaction that might occur will be subject to the satisfaction of various conditions and approvals, including approval of any transaction by the MetLife, Inc. Board of Directors, satisfaction of any applicable requirements of the SEC, and receipt of insurance and other regulatory approvals and other anticipated conditions. Because the form of a separation had yet to be determined, MetLife, Inc. cannot currently provide a specific potential completion date or information about the potential impact on MetLife Advisers. No assurance can be given regarding the form that a separation transaction may take or the specific terms thereof, or that a separation will in fact occur. Depending on the form a separation takes, MetLife Advisers’ continued service as investment adviser to the Trusts could be subject to the satisfaction of various conditions and approvals, which may include obtaining approvals from the Trusts’ Board and shareholders.
MSF-16
Metropolitan Series Fund
T. Rowe Price Small Cap Growth Portfolio
Notes to Financial Statements—June 30, 2016—(Continued)
Transfer Agency Agreement - MetLife serves as the transfer agent for the Trust. MetLife receives no fees for its services to the Trust under the transfer agency agreement.
Distribution and Service Fees - The Trust has a distribution agreement with MetLife Investors Distribution Company (“MIDC” or the “Distributor”) in which MIDC serves as the distributor for the Portfolio’s Class A, B, E, and G Shares. MIDC is a wholly-owned subsidiary of MetLife Investors Group, LLC, an affiliate of the Adviser. The Trust has also adopted a Distribution and Service Plan under Rule 12b-1 of the 1940 Act for the Portfolio’s Class B, E, and G Shares. Under the Distribution and Service Plan, the Class B, E, and G Shares of the Portfolio pay a fee to compensate the Insurance Companies (or their affiliates) and other broker-dealers and financial intermediaries involved in the offer and sale of Portfolio shares for promoting or selling and servicing the Class B, E, and G Shares of the Portfolio. The fees under the Distribution and Service Plan for each class of the Portfolio’s shares are calculated as a percentage of the Portfolio’s average daily net assets that are attributable to that Class. Currently, the fee is 0.25% per year for Class B Shares, 0.15% per year for Class E Shares, and 0.30% per year for Class G Shares. Amounts incurred by the Portfolio for the six months ended June 30, 2016 are shown as Distribution and service fees in the Statement of Operations.
Deferred Trustee Compensation - Each Trustee who is not currently an employee of the Adviser or any of its affiliates receives compensation from the Trust for his or her service to the Trust. A deferred compensation plan (the “Plan”) is available to the Trustees on a voluntary basis. Deferred amounts remain in the Trust until distributed in accordance with the provisions of the Plan. The value of a participating Trustee’s deferral account is based on theoretical investments of deferred amounts on the normal payment dates in certain portfolios of the Trust or Met Investors Series Trust, an affiliate of the Trust, as designated by the participating Trustee. Changes in the value of participants’ deferral accounts are reflected as Trustees’ fees and expenses in the Statement of Operations. The portion of the accrued obligations allocated to the Portfolio under the Plan is reflected as Deferred trustees’ fees in the Statement of Assets and Liabilities.
6. Transactions in Securities of Affiliated Issuers
A summary of the Portfolio’s transactions in the securities of affiliated issuers during the six months ended June 30, 2016 is as follows:
| | | | | | | | | | | | | | | | | | | | | | | | |
Security Description | | Number of
shares held at
December 31, 2015 | | | Shares
purchased | | | Shares
sold | | | Number of
shares held at
June 30, 2016 | | | Realized
Gain/(Loss) on
shares
sold | | | Income earned
from affiliates
during the
period | |
T. Rowe Price Government Reserve Investment Fund | | | 6,869,128 | | | | 95,633,498 | | | | (96,641,241 | ) | | | 5,861,385 | | | $ | — | | | $ | 13,262 | |
7. Contractual Obligations
Under the Trust’s organizational documents, its officers and Trustees may be indemnified against certain liabilities and expenses arising out of the performance of their duties to the Trust. Additionally, the Trust has a variety of indemnification obligations under contracts with its service providers. The Trust’s maximum exposure under these arrangements is unknown, as this would involve future claims that may be made against the Trust that have not yet occurred.
8. Income Tax Information
The tax character of distributions paid for the years ended December 31, 2015 and 2014 were as follows:
| | | | | | | | | | | | | | | | | | | | |
Ordinary Income | | | Long-Term Capital Gain | | | Total | |
2015 | | 2014 | | | 2015 | | | 2014 | | | 2015 | | | 2014 | |
| $6,987,808 | | $ | 439,885 | | | $ | 109,646,735 | | | $ | 82,033,527 | | | $ | 116,634,543 | | | $ | 82,473,412 | |
As of December 31, 2015, the components of distributable earnings (accumulated losses) on a federal income tax basis were as follows:
| | | | | | | | | | | | | | | | | | |
Undistributed
Ordinary
Income | | Undistributed
Long-Term
Capital Gain | | | Net
Unrealized
Appreciation | | | Other
Accumulated
Capital Losses | | | Total | |
| $11,516,399 | | $ | 149,850,634 | | | $ | 228,585,194 | | | $ | — | | | $ | 389,952,227 | |
The Portfolio utilizes the provisions of the federal income tax laws that provide for the carryforward of capital losses for prior years, offsetting such losses against any future realized capital gains. Under the Regulated Investment Company Modernization Act of 2010 (the “Act”), net capital losses recognized after December 22, 2010 may be carried forward indefinitely and their character is retained as short-term and/or long-term losses. Previously, net capital losses were carried forward for up to eight years and treated as short-term losses. As a transition rule, the Act requires that post-enactment net capital losses be used before pre-enactment net capital losses.
As of December 31, 2015, the Portfolio had no post-enactment accumulated capital losses and no pre-enactment accumulated capital loss carryforwards.
MSF-17
Metropolitan Series Fund
Van Eck Global Natural Resources Portfolio
Managed By Van Eck Associates Corporation
Portfolio Manager Commentary*
PERFORMANCE
For the six month period ended June 30, 2016, the Class A and B shares of the Van Eck Global Natural Resources Portfolio returned 29.39% and 29.22%, respectively. The Portfolio’s benchmark, the Standard & Poor’s (“S&P”) North American Natural Resources Sector Index1, returned 19.56%.
MARKET ENVIRONMENT / CONDITIONS
The market spent the first six months of the year (and especially the second quarter) under the twin shadows, and uncertainties, of Brexit (the U.K. referendum on exiting the European Union) and the U.S. Presidential election.
The most significant macroeconomic factor influencing the market in which the Portfolio invested was the continued extraordinary accommodation extended by central banks around the world. In addition, supply and demand, particularly for oil and gas, continued to rebalance. Both factors proved positive for commodities. In addition, a weaker U.S. dollar (against emerging markets currencies) during the first half was generally beneficial for the hard assets space.
For many, the Brexit referendum on June 23rd (the result of which was U.K. voters rejecting continuing membership of the European Union) was seen as a defining moment. Perhaps somewhat surprisingly, its immediate effect was somewhat less than cataclysmic. And, indeed, broadly speaking, commodities have remained surprisingly resilient. It remains to be seen, however, just what the long-term effects of the vote will be.
During the period under review, all of these were hugely beneficial not only for gold, but, when taken together with the continuing restructuring and strategic improvements they have been undertaking, also for gold mining companies. Indeed, over the six-months, they performed better than the metal itself.
In the U.S., the rig count continued to drop in the early part of the year, before appearing to bottom at the end of May and rebound slightly thereafter. But, any rebound has to be taken in the context that, since the count started to fall, some 1,300 rigs throughout the U.S. have been taken out of commission and we remain at very near historically low levels. So, any rebound will necessarily be, in contrast, incremental.
Despite lackluster prospects for economic growth in both Europe and the U.S.—albeit economic growth in the U.S. was somewhat stronger in the second quarter than it was in the first—the demand for crude oil and, in particular, gasoline has been remarkably strong. The U.S. is now consuming almost 10 million barrels a day. The country’s gasoline demand exceeds the unrefined crude oil demand of every country in the world except China.
Concerns that a flood of Iranian crude oil could swamp the market proved unfounded. While supply from the country did, indeed, come on reasonably strongly, it was in no way enough to offset supply disruptions in the market, for exogenous reasons, during the period. These included pipeline outages in Nigeria, wild fires in Canada that hit oil sands production particularly hard, reduced supply from Libya on the back of persistent political uncertainty, and supply from Venezuela reduced still further because of both the country’s dire economic circumstances and continued drilling challenges. And those were quite apart from the overall reduction in U.S. crude oil supply.
Base metal companies continued to restructure, cleaning up their balance sheets, streamlining their operations, and focus more on profitability. And, in addition, they continued to sell off assets and reduce their debt levels. Among the base metals, zinc was one where supply and demand came into better alignment, not least because, essentially, mining giant Glencore stopped producing it at one of its major mines.
On the back of the finding by the U.S. Department of Commerce that government subsidies and dumping were occurring, tariffs were imposed on imports of steel into the U.S., particularly those from China. U.S. steel stocks have benefited accordingly.
While grain prices (soy, corn and wheat) were strong in the first half of the year, this did not necessarily translate into strong equity prices, as uncertainty persisted in the market. Soy beans were strong on the back of both very good demand (especially from China) and a less abundant than expected South American crop. Corn, too, experienced a weaker than expected crop in South America. Nevertheless, large U.S. planting intentions and beneficial early weather put the risks to the downside for both corn and soy beans.
PORTFOLIO REVIEW / PERIOD END POSITIONING
Several key aspects that contributed to outperformance of the Portfolio relative to the S&P North American Natural Resources Sector Index were overweight allocations to gold and diversified metals & mining and an underweight allocation to oil & gas refining and marketing. An overweight position and stock selection in oil & gas exploration and production also contributed significantly to outperformance.
The three strongest positive-contributing sub-industries to the Portfolio’s performance were gold, oil & gas exploration and production, and diversified metals & mining.
The Portfolio’s three strongest contributors were all gold mining companies. In order, these were: Agnico Eagle Mines, which benefited from strong operational performance, its continued focus on cost reduction, and its engineering-related restructuring; Barrick Gold, which benefited from the restructuring it has been undertaking and its leverage to gold prices; and, Randgold Resources, which also benefited from strong operational performance and, not least, from the continuing strength of its balance sheet and the options with which this provided it.
MSF-1
Metropolitan Series Fund
Van Eck Global Natural Resources Portfolio
Managed By Van Eck Associates Corporation
Portfolio Manager Commentary*—(Continued)
The three weakest-contributing sub-industries to the Portfolio’s absolute performance were fertilizers & agricultural chemicals, oil & gas refining and marketing, and semiconductor equipment (solar energy). On a relative basis, an overweight allocation to fertilizers & agricultural chemicals, an underweight allocation and security selection in oil & gas storage and transportation, and an overweight allocation to forest products all detracted.
The Portfolio’s three weakest-contributing companies were fertilizers & agricultural chemicals company CF Industries Holdings, which was hit by concerns about both Chinese production (which continued unabated) and the value of the renminbi, in addition to concerns around nitrogen prices; oil & gas refining and marketing company Valero Energy, which suffered from the rebound in crude oil prices; and, semiconductor equipment (solar energy) company SunEdison.
Significant purchases by the Portfolio were made in the oil & gas exploration and production, and gold sub-industries. These saw new positions taken in oil & gas exploration and production companies PDC Energy and Hess. A new position was taken in gold mining company Newmont Mining.
The Portfolio’s largest sales during the period were the oil & gas refining and marketing company Valero Energy, the oil & gas equipment and services company Baker Hughes, and the oil & gas storage and transportation company Kinder Morgan (all eliminated by the Portfolio by period end).
Broadly speaking, on both an absolute and relative basis, the Portfolio increased its weighting to the gold, oil & gas exploration and production, and diversified metals & mining sub-industries over the period. The Portfolio decreased its weighting to the oil & gas equipment and services, oil & gas refining and marketing, and oil & gas storage and transportation sub-industries.
As of June 30, 2016, the Portfolio’s most substantially overweight positions relative to the benchmark were in the oil & gas exploration and production, and gold sub-industries. As of the same date, the Portfolio also held an overweight position in the diversified metals & mining sub-industry.
As of June 30, 2016, the Portfolio had no allocation to the integrated oil & gas sub-industry, making that a substantially underweight position in relation to the benchmark. As of the same date, the Portfolio’s next most substantially underweight position was in the oil & gas storage and transportation sub-industry. The Portfolio also held an underweight position in the oil & gas refining and marketing sub-industry.
Charles Cameron
Shawn Reynolds
Portfolio Managers
Van Eck Associates Corporation
* This commentary may include statements that constitute “forward-looking statements” under the U.S. securities laws. Forward-looking statements include, among other things, projections, estimates, and information about possible or future results related to the Portfolio, market or regulatory developments. The views expressed above are not guarantees of future performance or economic results and involve certain risks, uncertainties and assumptions that could cause actual outcomes and results to differ materially from the views expressed herein. The views expressed above are subject to change at any time based upon economic, market, or other conditions and the subadvisory firm undertakes no obligation to update the views expressed herein. Any discussions of specific securities should not be considered a recommendation to buy or sell those securities. The views expressed above (including any forward-looking statement) may not be relied upon as investment advice or as an indication of the Portfolio’s trading intent. Information about the Portfolio’s holdings, asset allocation or country diversification is historical and is not an indication of future Portfolio composition, which may vary. Direct investment in any index is not possible. The performance of any index mentioned in this commentary has not been adjusted for ongoing management, distribution and operating expenses, and sales charges applicable to mutual fund investments. In addition, the returns do not reflect additional fees charged by separate accounts or variable insurance contracts that an investor in the Portfolio may pay. If these additional fees were reflected, performance would have been lower.
MSF-2
Metropolitan Series Fund
Van Eck Global Natural Resources Portfolio
A $10,000 INVESTMENT COMPARED TO THE S&P NORTH AMERICAN NATURAL RESOURCES SECTOR INDEX
SIX MONTH RETURN & AVERAGE ANNUAL RETURNS (%) AS OF JUNE 30, 2016
| | | | | | | | | | | | | | | | |
| | | 6 Month | | | 1 Year | | | 5 Year | | | Since Inception2 | |
| Van Eck Global Natural Resources Portfolio | | | | | | | | | | | | | | | | |
Class A | | | 29.39 | | | | -11.69 | | | | -7.88 | | | | 3.68 | |
Class B | | | 29.22 | | | | -11.87 | | | | -8.09 | | | | 2.82 | |
| S&P North American Natural Resources Sector Index | | | 19.56 | | | | -5.56 | | | | -3.13 | | | | 5.19 | |
1 The S&P North American Natural Resources Sector Index was developed as an equity benchmark for U.S. traded natural resource related stocks.
2 Inception dates of the Class A and Class B shares are 10/31/08 and 4/28/09, respectively. Index since inception return is based on the Class A inception date.
Portfolio performance is calculated including reinvestment of all income and capital gain distributions. Performance numbers are net of all Portfolio expenses but do not include any insurance, sales, separate account or administrative charges of variable annuity or life insurance contracts or any additional expenses that participants may bear relating to the operations of their plans. If these charges were included, the returns would be lower. The performance of any index referenced above has not been adjusted for ongoing management, distribution and operating expenses, and sales charges applicable to mutual fund investments. Direct investment in any index is not possible. The performance of Class A shares, as set forth in the line graph above, will differ from that of other classes because of the difference in expenses paid by policyholders investing in the different share classes.
This information represents past performance and is not indicative of future results. Investment return and principal value may fluctuate so that shares, upon redemption, may be worth more or less than the original cost.
PORTFOLIO COMPOSITION AS OF JUNE 30, 2016
Top Holdings
| | | | |
| | | % of
Net Assets | |
Agnico Eagle Mines, Ltd. (U.S. Listed Shares) | | | 5.0 | |
Pioneer Natural Resources Co. | | | 4.7 | |
Cimarex Energy Co. | | | 4.1 | |
Halliburton Co. | | | 4.1 | |
Newfield Exploration Co. | | | 4.1 | |
Concho Resources, Inc. | | | 4.0 | |
Diamondback Energy, Inc. | | | 3.9 | |
EOG Resources, Inc. | | | 3.9 | |
Schlumberger, Ltd. | | | 3.6 | |
Parsley Energy, Inc. - Class A | | | 3.5 | |
Top Sectors
| | | | |
| | | % of
Net Assets | |
Energy | | | 56.7 | |
Materials | | | 37.8 | |
Industrials | | | 1.4 | |
MSF-3
Metropolitan Series Fund
Van Eck Global Natural Resources Portfolio
Understanding Your Portfolio’s Expenses (Unaudited)
Shareholder Expense Example
As a shareholder of the Portfolio, you incur ongoing costs, including management fees; distribution and service (12b-1) fees; and other Portfolio expenses. This example is intended to help you understand your ongoing costs (in dollars) (referred to as “expenses”) of investing in the Portfolio and compare these costs with the ongoing costs of investing in other mutual funds. The example is based on an investment of $1,000 invested at the beginning of the period and held for the entire period, January 1, 2016 through June 30, 2016.
Actual Expenses
The first line for each share class of the Portfolio in the table below provides information about actual account values and actual expenses. You may use the information in this line, together with the amount you invested in the particular share class of the Portfolio, to estimate the expenses that you paid over the period. Simply divide your account value by $1,000 (for example, an $8,600 account value divided by $1,000 = 8.6), then multiply the result by the number in the first line under the heading entitled “Expenses Paid During Period” to estimate the expenses you paid on your account during this period.
Hypothetical Example for Comparison Purposes
The second line for each share class of the Portfolio in the table below provides information about hypothetical account values and hypothetical expenses based on the Portfolio’s actual expense ratio and an assumed rate of return of 5% per year before expenses, which is not the Portfolio’s actual return. The hypothetical account values and expenses may not be used to estimate the actual ending account balance or expenses you paid for the period. You may use this information to compare the ongoing costs of investing in the Portfolio and other funds. To do so, compare this 5% hypothetical example with the 5% hypothetical examples that appear in the shareholder reports of the other funds.
Please note that the expenses shown in the table are meant to highlight your ongoing costs only and do not reflect any fees or charges of your variable insurance product or any additional expenses that participants in certain eligible qualified plans may bear relating to the operations of their plan. Therefore, the second line for each share class in the table is useful in comparing ongoing costs only, and will not help you determine the relative total costs of owning different funds. In addition, if these other costs were included, your costs would have been higher.
| | | | | | | | | | | | | | | | | | |
Van Eck Global Natural Resources Portfolio | | | | Annualized
Expense
Ratio | | | Beginning
Account Value
January 1,
2016 | | | Ending
Account Value
June 30,
2016 | | | Expenses Paid
During Period**
January 1, 2016
to
June 30,
2016 | |
Class A(a) | | Actual | | | 0.80 | % | | $ | 1,000.00 | | | $ | 1,293.90 | | | $ | 4.56 | |
| | Hypothetical* | | | 0.80 | % | | $ | 1,000.00 | | | $ | 1,020.89 | | | $ | 4.02 | |
| | | | | |
Class B(a) | | Actual | | | 1.05 | % | | $ | 1,000.00 | | | $ | 1,292.20 | | | $ | 5.98 | |
| | Hypothetical* | | | 1.05 | % | | $ | 1,000.00 | | | $ | 1,019.64 | | | $ | 5.27 | |
* Hypothetical assumes a rate of return of 5% per year before expenses.
** Expenses paid are equal to the Portfolio’s annualized expense ratio for the most recent six month period, as shown above, multiplied by the average account value over the period, multiplied by the number of days (182 days) in the most recent fiscal half-year, divided by 366 (to reflect the one-half year period).
(a) The annualized expense ratio shown reflects the impact of the management fee waiver as described in Note 5 of the Notes to Financial Statements.
MSF-4
Metropolitan Series Fund
Van Eck Global Natural Resources Portfolio
Schedule of Investments as of June 30, 2016 (Unaudited)
Common Stocks—95.8% of Net Assets
| | | | | | | | |
| Security Description | | Shares | | | Value | |
| | |
Chemicals—3.6% | | | | | | | | |
Agrium, Inc. (a) | | | 228,500 | | | $ | 20,660,970 | |
CF Industries Holdings, Inc. | | | 735,100 | | | | 17,715,910 | |
| | | | | | | | |
| | | | | | | 38,376,880 | |
| | | | | | | | |
| | |
Electrical Equipment—0.4% | | | | | | | | |
Sunrun, Inc. (a) (b) | | | 668,200 | | | | 3,962,426 | |
| | | | | | | | |
|
Energy Equipment & Services—11.9% | |
Halliburton Co. | | | 953,700 | | | | 43,193,073 | |
Nabors Industries, Ltd. | | | 2,006,600 | | | | 20,166,330 | |
Patterson-UTI Energy, Inc. | | | 387,400 | | | | 8,259,368 | |
Schlumberger, Ltd. | | | 486,700 | | | | 38,488,236 | |
Superior Energy Services, Inc. (a) | | | 854,300 | | | | 15,727,663 | |
| | | | | | | | |
| | | | | | | 125,834,670 | |
| | | | | | | | |
| | |
Metals & Mining—31.9% | | | | | | | | |
Agnico Eagle Mines, Ltd. (U.S. Listed Shares) (a) | | | 983,533 | | | | 52,619,016 | |
Barrick Gold Corp. (a) | | | 1,599,300 | | | | 34,145,055 | |
Commercial Metals Co. (a) | | | 595,400 | | | | 10,062,260 | |
Eldorado Gold Corp. | | | 2,543,000 | | | | 11,443,500 | |
First Quantum Minerals, Ltd. (a) | | | 4,033,000 | | | | 28,313,255 | |
Freeport-McMoRan, Inc. | | | 973,600 | | | | 10,845,904 | |
Glencore plc (b) | | | 16,738,337 | | | | 34,198,707 | |
Goldcorp, Inc. | | | 1,817,900 | | | | 34,776,427 | |
Kinross Gold Corp. (b) | | | 2,682,100 | | | | 13,115,469 | |
New Gold, Inc. (b) | | | 2,592,700 | | | | 11,356,026 | |
Newmont Mining Corp. | | | 633,800 | | | | 24,794,256 | |
Osisko Gold Royalties, Ltd. (a) | | | 109,279 | | | | 1,428,633 | |
Petra Diamonds, Ltd. (a) | | | 3,964,700 | | | | 6,161,189 | |
Randgold Resources, Ltd. (ADR) (a) | | | 317,900 | | | | 35,617,516 | |
Steel Dynamics, Inc. | | | 655,600 | | | | 16,062,200 | |
Teck Resources, Ltd. - Class B (a) | | | 975,400 | | | | 12,846,018 | |
| | | | | | | | |
| | | | | | | 337,785,431 | |
| | | | | | | | |
|
Oil, Gas & Consumable Fuels—44.8% | |
Anadarko Petroleum Corp. | | | 556,250 | | | | 29,620,313 | |
Cimarex Energy Co. (a) | | | 367,600 | | | | 43,862,032 | |
Concho Resources, Inc. (a) (b) | | | 357,050 | | | | 42,585,353 | |
CONSOL Energy, Inc. (a) | | | 1,420,400 | | | | 22,854,236 | |
Diamondback Energy, Inc. (a) (b) | | | 457,000 | | | | 41,682,970 | |
EOG Resources, Inc. | | | 496,600 | | | | 41,426,372 | |
Golar LNG, Ltd. (a) | | | 347,700 | | | | 5,389,350 | |
Green Plains, Inc. (a) | | | 337,700 | | | | 6,659,444 | |
Gulfport Energy Corp. (b) | | | 814,600 | | | | 25,464,396 | |
Hess Corp. | | | 427,100 | | | | 25,668,710 | |
Laredo Petroleum, Inc. (b) | | | 1,688,700 | | | | 17,697,576 | |
Newfield Exploration Co. (a) (b) | | | 973,600 | | | | 43,013,648 | |
Parsley Energy, Inc. - Class A (a) (b) | | | 1,380,800 | | | | 37,364,448 | |
PDC Energy, Inc. (a) (b) | | | 437,100 | | | | 25,181,331 | |
Pioneer Natural Resources Co. | | | 327,700 | | | | 49,551,517 | |
RSP Permian, Inc. (a) (b) | | | 89,400 | | | | 3,119,166 | |
Scorpio Tankers, Inc. | | | 566,200 | | | | 2,378,040 | |
SM Energy Co. (a) | | | 407,200 | | | | 10,994,400 | |
| | | | | | | | |
| | | | | | | 474,513,302 | |
| | | | | | | | |
| | |
Paper & Forest Products—2.2% | | | | | | | | |
Louisiana-Pacific Corp. (a) (b) | | | 1,370,800 | | | $ | 23,783,380 | |
| | | | | | | | |
| | |
Road & Rail—1.0% | | | | | | | | |
Union Pacific Corp. | | | 118,600 | | | | 10,347,850 | |
| | | | | | | | |
Total Common Stocks
(Cost $964,349,777) | | | | | | | 1,014,603,939 | |
| | | | | | | | |
|
| Short-Term Investments—15.6% | |
| | |
Mutual Funds—15.6% | | | | | | | | |
AIM STIT-STIC Prime Portfolio | | | 46,235,429 | | | | 46,235,429 | |
State Street Navigator Securities Lending MET Portfolio (c) | | | 119,441,056 | | | | 119,441,056 | |
| | | | | | | | |
Total Short-Term Investments
(Cost $165,676,485) | | | | | | | 165,676,485 | |
| | | | | | | | |
Total Investments—111.4%
(Cost $1,130,026,262) (d) | | | | | | | 1,180,280,424 | |
Other assets and liabilities
(net)—(11.4)% | | | | | | | (121,096,495 | ) |
| | | | | | | | |
| Net Assets—100.0% | | | | | | $ | 1,059,183,929 | |
| | | | | | | | |
| (a) | All or a portion of the security was held on loan. As of June 30, 2016, the market value of securities loaned was $180,514,997 and the collateral received consisted of cash in the amount of $119,441,056 and non-cash collateral with a value of $63,804,187. The cash collateral is invested in a money market fund managed by an affiliate of the custodian. The non-cash collateral received consists primarily of government securities and bank letters of credit, and is held for the benefit of the Portfolio at the Portfolio’s custodian. The Portfolio cannot repledge or resell this collateral. As such, this collateral is excluded from the Statement of Assets and Liabilities. |
| (b) | Non-income producing security. |
| (c) | Represents investment of cash collateral received from securities on loan as of June 30, 2016. |
| (d) | As of June 30, 2016, the aggregate cost of investments was $1,130,026,262. The aggregate unrealized appreciation and depreciation of investments were $158,898,597 and $(108,644,435), respectively, resulting in net unrealized appreciation of $50,254,162. |
| (ADR)— | An American Depositary Receipt is a certificate issued by a custodian bank representing the right to receive securities of the foreign issuer described. Trading on exchanges not located in the United States or Canada significantly influences the value of ADRs. |
See accompanying notes to financial statements.
MSF-5
Metropolitan Series Fund
Van Eck Global Natural Resources Portfolio
Schedule of Investments as of June 30, 2016 (Unaudited)
Fair Value Hierarchy
Accounting principles generally accepted in the United States of America (“GAAP”) define fair market value as the price that the Portfolio would receive to sell an asset or pay to transfer a liability in an orderly transaction between market participants at the measurement date. It establishes a fair value hierarchy that prioritizes inputs to valuation methods and requires disclosure of the fair value hierarchy, separately for each major category of assets and liabilities, that segregates fair value measurements into three levels. Levels 1, 2 and 3 of the fair value hierarchy are defined as follows:
Level 1 - unadjusted quoted prices in active markets for identical investments
Level 2 - other significant observable inputs (including, but not limited to, quoted prices for similar assets or liabilities in markets that are either active or inactive; inputs other than quoted prices that are observable such as interest rates, yield curves, volatilities, prepayment speeds, loss severities, credit risks, default rates, or other market corroborated inputs)
Level 3 - significant unobservable inputs based on the best information available in the circumstances, to the extent observable inputs are unavailable (including the Portfolio’s own assumptions used in determining the fair value of investments and derivative financial instruments)
The inputs or methodologies used for valuing investments are not necessarily an indication of the risk associated with investing in them. Changes to the inputs or methodologies used may result in transfers between levels, which will be recognized as of the beginning of the reporting period. Information on transfers between Level 1 and Level 2, if any, will be disclosed following the fair value hierarchy table below. A reconciliation of Level 3 securities, if any, will also be disclosed following the fair value hierarchy table. For more information about the Portfolio’s policy regarding the valuation of investments, please refer to the Notes to Financial Statements.
The following table summarizes the fair value hierarchy of the Portfolio’s investments as of June 30, 2016:
| | | | | | | | | | | | | | | | |
| Description | | Level 1 | | | Level 2 | | | Level 3 | | | Total | |
| Common Stocks | | | | | | | | | | | | | | | | |
Chemicals | | $ | 38,376,880 | | | $ | — | | | $ | — | | | $ | 38,376,880 | |
Electrical Equipment | | | 3,962,426 | | | | — | | | | — | | | | 3,962,426 | |
Energy Equipment & Services | | | 125,834,670 | | | | — | | | | — | | | | 125,834,670 | |
Metals & Mining | | | 297,425,535 | | | | 40,359,896 | | | | — | | | | 337,785,431 | |
Oil, Gas & Consumable Fuels | | | 474,513,302 | | | | — | | | | — | | | | 474,513,302 | |
Paper & Forest Products | | | 23,783,380 | | | | — | | | | — | | | | 23,783,380 | |
Road & Rail | | | 10,347,850 | | | | — | | | | — | | | | 10,347,850 | |
Total Common Stocks | | | 974,244,043 | | | | 40,359,896 | | | | — | | | | 1,014,603,939 | |
Total Short-Term Investments* | | | 165,676,485 | | | | — | | | | — | | | | 165,676,485 | |
Total Investments | | $ | 1,139,920,528 | | | $ | 40,359,896 | | | $ | — | | | $ | 1,180,280,424 | |
| | | | | | | | | | | | | | | | | |
Collateral for Securities Loaned (Liability) | | $ | — | | | $ | (119,441,056 | ) | | $ | — | | | $ | (119,441,056 | ) |
| * | See Schedule of Investments for additional detailed categorizations. |
See accompanying notes to financial statements.
MSF-6
Metropolitan Series Fund
Van Eck Global Natural Resources Portfolio
Statement of Assets and Liabilities
June 30, 2016 (Unaudited)
| | | | |
Assets | | | | |
Investments at value (a) (b) | | $ | 1,180,280,424 | |
Cash | | | 30,971 | |
Receivable for: | | | | |
Fund shares sold | | | 29,295 | |
Dividends and interest | | | 727,322 | |
Prepaid expenses | | | 6,621 | |
| | | | |
Total Assets | | | 1,181,074,633 | |
Liabilities | | | | |
Cash due to bank denominated in foreign currencies (c) | | | 6 | |
Collateral for securities loaned | | | 119,441,056 | |
Payables for: | | | | |
Fund shares redeemed | | | 1,527,620 | |
Accrued Expenses: | | | | |
Management fees | | | 664,537 | |
Distribution and service fees | | | 27,691 | |
Deferred trustees’ fees | | | 75,480 | |
Other expenses | | | 154,314 | |
| | | | |
Total Liabilities | | | 121,890,704 | |
| | | | |
Net Assets | | $ | 1,059,183,929 | |
| | | | |
Net Assets Consist of: | | | | |
Paid in surplus | | $ | 1,296,121,563 | |
Undistributed net investment income | | | 1,568,344 | |
Accumulated net realized loss | | | (288,760,177 | ) |
Unrealized appreciation on investments and foreign currency transactions | | | 50,254,199 | |
| | | | |
Net Assets | | $ | 1,059,183,929 | |
| | | | |
Net Assets | | | | |
Class A | | $ | 924,090,354 | |
Class B | | | 135,093,575 | |
Capital Shares Outstanding* | | | | |
Class A | | | 94,846,062 | |
Class B | | | 13,931,263 | |
Net Asset Value, Offering Price and Redemption Price Per Share | | | | |
Class A | | $ | 9.74 | |
Class B | | | 9.70 | |
| * | The Portfolio is authorized to issue an unlimited number of shares. |
| (a) | Identified cost of investments was $1,130,026,262. |
| (b) | Includes securities loaned at value of $180,514,997. |
| (c) | Identified cost of cash due to bank denominated in foreign currencies was $6. |
Statement of Operations
Six Months Ended June 30, 2016 (Unaudited)
| | | | |
Investment Income | | | | |
Dividends (a) | | $ | 5,350,665 | |
Interest | | | 50,252 | |
Securities lending income | | | 563,197 | |
| | | | |
Total investment income | | | 5,964,114 | |
Expenses | | | | |
Management fees | | | 3,947,050 | |
Administration fees | | | 12,919 | |
Custodian and accounting fees | | | 46,860 | |
Distribution and service fees—Class B | | | 160,593 | |
Audit and tax services | | | 26,447 | |
Legal | | | 13,588 | |
Trustees’ fees and expenses | | | 15,990 | |
Shareholder reporting | | | 23,005 | |
Insurance | | | 3,554 | |
Miscellaneous | | | 10,354 | |
| | | | |
Total expenses | | | 4,260,360 | |
Less management fee waiver | | | (57,576 | ) |
Less broker commission recapture | | | (31,922 | ) |
| | | | |
Net expenses | | | 4,170,862 | |
| | | | |
Net Investment Income | | | 1,793,252 | |
| | | | |
Net Realized and Unrealized Gain (Loss) | | | | |
| Net realized loss on: | | | | |
Investments | | | (153,481,588 | ) |
Foreign currency transactions | | | (10,375 | ) |
| | | | |
Net realized loss | | | (153,491,963 | ) |
| | | | |
| Net change in unrealized appreciation on: | | | | |
Investments | | | 441,393,549 | |
Foreign currency transactions | | | 91 | |
| | | | |
Net change in unrealized appreciation | | | 441,393,640 | |
| | | | |
Net realized and unrealized gain | | | 287,901,677 | |
| | | | |
Net Increase in Net Assets From Operations | | $ | 289,694,929 | |
| | | | |
| (a) | Net of foreign withholding taxes of $149,429. |
See accompanying notes to financial statements.
MSF-7
Metropolitan Series Fund
Van Eck Global Natural Resources Portfolio
Statements of Changes in Net Assets
| | | | | | | | |
| | | Six Months
Ended
June 30,
2016
(Unaudited) | | | Year Ended
December 31,
2015 | |
Increase (Decrease) in Net Assets: | | | | | | | | |
From Operations | | | | | | | | |
Net investment income | | $ | 1,793,252 | | | $ | 8,261,009 | |
Net realized loss | | | (153,491,963 | ) | | | (116,383,481 | ) |
Net change in unrealized appreciation (depreciation) | | | 441,393,640 | | | | (267,741,713 | ) |
| | | | | | | | |
Increase (decrease) in net assets from operations | | | 289,694,929 | | | | (375,864,185 | ) |
| | | | | | | | |
From Distributions to Shareholders | | | | | | | | |
Net investment income | | | | | | | | |
Class A | | | (7,529,545 | ) | | | (4,538,788 | ) |
Class B | | | (774,707 | ) | | | (282,297 | ) |
| | | | | | | | |
Total distributions | | | (8,304,252 | ) | | | (4,821,085 | ) |
| | | | | | | | |
Increase (decrease) in net assets from capital share transactions | | | (88,546,055 | ) | | | 270,758,603 | |
| | | | | | | | |
Total increase (decrease) in net assets | | | 192,844,622 | | | | (109,926,667 | ) |
| | |
Net Assets | | | | | | | | |
Beginning of period | | | 866,339,307 | | | | 976,265,974 | |
| | | | | | | | |
End of period | | $ | 1,059,183,929 | | | $ | 866,339,307 | |
| | | | | | | | |
Undistributed net investment income | | | | | | | | |
End of period | | $ | 1,568,344 | | | $ | 8,079,344 | |
| | | | | | | | |
Other Information:
Capital Shares
Transactions in capital shares were as follows:
| | | | | | | | | | | | | | | | |
| | | Six Months Ended
June 30, 2016
(Unaudited) | | | Year Ended
December 31, 2015 | |
| | | Shares | | | Value | | | Shares | | | Value | |
Class A | | | | | | | | | | | | | | | | |
Sales | | | 22,362,284 | | | $ | 158,472,148 | | | | 29,202,455 | | | $ | 297,797,116 | |
Reinvestments | | | 786,786 | | | | 7,529,545 | | | | 388,928 | | | | 4,538,788 | |
Redemptions | | | (27,374,331 | ) | | | (240,461,565 | ) | | | (4,823,710 | ) | | | (59,007,302 | ) |
| | | | | | | | | | | | | | | | |
Net increase (decrease) | | | (4,225,261 | ) | | $ | (74,459,872 | ) | | | 24,767,673 | | | $ | 243,328,602 | |
| | | | | | | | | | | | | | | | |
Class B | | | | | | | | | | | | | | | | |
Sales | | | 1,955,848 | | | $ | 14,336,518 | | | | 4,747,123 | | | $ | 45,406,659 | |
Reinvestments | | | 81,377 | | | | 774,707 | | | | 24,294 | | | | 282,297 | |
Redemptions | | | (3,242,570 | ) | | | (29,197,408 | ) | | | (1,662,099 | ) | | | (18,258,955 | ) |
| | | | | | | | | | | | | | | | |
Net increase (decrease) | | | (1,205,345 | ) | | $ | (14,086,183 | ) | | | 3,109,318 | | | $ | 27,430,001 | |
| | | | | | | | | | | | | �� | | | |
Increase (decrease) derived from capital shares transactions | | | | | | $ | (88,546,055 | ) | | | | | | $ | 270,758,603 | |
| | | | | | | | | | | | | | | | |
See accompanying notes to financial statements.
MSF-8
Metropolitan Series Fund
Van Eck Global Natural Resources Portfolio
Financial Highlights
| | | | | | | | | | | | | | | | | | | | | | | | |
| Selected per share data | | | | | | | | | | | | | | | | | | |
| | | Class A | |
| | | Six Months
Ended
June 30,
2016
(Unaudited) | | | Year Ended December 31, | |
| | | | 2015 | | | 2014 | | | 2013 | | | 2012 | | | 2011 | |
Net Asset Value, Beginning of Period | | $ | 7.59 | | | $ | 11.32 | | | $ | 14.21 | | | $ | 12.91 | | | $ | 13.52 | | | $ | 18.06 | |
| | | | | | | | | | | | | | | | | | | | | | | | |
Income (Loss) from Investment Operations | | | | | | | | | | | | | | | | | | | | | | | | |
Net investment income (a) | | | 0.02 | | | | 0.08 | | | | 0.08 | | | | 0.08 | | | | 0.13 | | | | 0.04 | |
Net realized and unrealized gain (loss) on investments | | | 2.21 | | | | (3.76 | ) | | | (2.66 | ) | | | 1.34 | | | | 0.25 | | | | (2.56 | ) |
| | | | | | | | | | | | | | | | | | | | | | | | |
Total from investment operations | | | 2.23 | | | | (3.68 | ) | | | (2.58 | ) | | | 1.42 | | | | 0.38 | | | | (2.52 | ) |
| | | | | | | | | | | | | | | | | | | | | | | | |
Less Distributions | | | | | | | | | | | | | | | | | | | | | | | | |
Distributions from net investment income | | | (0.08 | ) | | | (0.05 | ) | | | (0.08 | ) | | | (0.12 | ) | | | 0.00 | | | | (0.24 | ) |
Distributions from net realized capital gains | | | 0.00 | | | | 0.00 | | | | (0.23 | ) | | | 0.00 | | | | (0.99 | ) | | | (1.78 | ) |
| | | | | | | | | | | | | | | | | | | | | | | | |
Total distributions | | | (0.08 | ) | | | (0.05 | ) | | | (0.31 | ) | | | (0.12 | ) | | | (0.99 | ) | | | (2.02 | ) |
| | | | | | | | | | | | | | | | | | | | | | | | |
Net Asset Value, End of Period | | $ | 9.74 | | | $ | 7.59 | | | $ | 11.32 | | | $ | 14.21 | | | $ | 12.91 | | | $ | 13.52 | |
| | | | | | | | | | | | | | | | | | | | | | | | |
Total Return (%) (b) | | | 29.39 | (c) | | | (32.64 | ) | | | (18.63 | ) | | | 11.06 | | | | 2.80 | | | | (16.45 | ) |
| | | | | | |
Ratios/Supplemental Data | | | | | | | | | | | | | | | | | | | | | | | | |
Gross ratio of expenses to average net assets (%) | | | 0.81 | (d) | | | 0.81 | | | | 0.81 | | | | 0.81 | | | | 0.82 | | | | 0.82 | |
Net ratio of expenses to average net assets (%) (e) | | | 0.80 | (d) | | | 0.80 | | | | 0.80 | | | | 0.80 | | | | 0.82 | | | | 0.82 | |
Ratio of net investment income to average net assets (%) | | | 0.39 | (d) | | | 0.82 | | | | 0.56 | | | | 0.64 | | | | 0.98 | | | | 0.25 | |
Portfolio turnover rate (%) | | | 32 | (c) | | | 25 | | | | 39 | | | | 36 | | | | 23 | | | | 42 | |
Net assets, end of period (in millions) | | $ | 924.1 | | | $ | 752.1 | | | $ | 841.0 | | | $ | 1,018.8 | | | $ | 828.1 | | | $ | 695.7 | |
| |
| | | Class B | |
| | | Six Months
Ended
June 30,
2016
(Unaudited) | | | Year Ended December 31, | |
| | | | 2015 | | | 2014 | | | 2013 | | | 2012 | | | 2011 | |
Net Asset Value, Beginning of Period | | $ | 7.55 | | | $ | 11.25 | | | $ | 14.12 | | | $ | 12.83 | | | $ | 13.47 | | | $ | 18.01 | |
| | | | | | | | | | | | | | | | | | | | | | | | |
Income (Loss) from Investment Operations | | | | | | | | | | | | | | | | | | | | | | | | |
Net investment income (a) | | | 0.01 | | | | 0.06 | | | | 0.04 | | | | 0.05 | | | | 0.09 | | | | 0.00 | (f) |
Net realized and unrealized gain (loss) on investments | | | 2.20 | | | | (3.74 | ) | | | (2.64 | ) | | | 1.33 | | | | 0.26 | | | | (2.55 | ) |
| | | | | | | | | | | | | | | | | | | | | | | | |
Total from investment operations | | | 2.21 | | | | (3.68 | ) | | | (2.60 | ) | | | 1.38 | | | | 0.35 | | | | (2.55 | ) |
| | | | | | | | | | | | | | | | | | | | | | | | |
Less Distributions | | | | | | | | | | | | | | | | | | | | | | | | |
Distributions from net investment income | | | (0.06 | ) | | | (0.02 | ) | | | (0.04 | ) | | | (0.09 | ) | | | 0.00 | | | | (0.21 | ) |
Distributions from net realized capital gains | | | 0.00 | | | | 0.00 | | | | (0.23 | ) | | | 0.00 | | | | (0.99 | ) | | | (1.78 | ) |
| | | | | | | | | | | | | | | | | | | | | | | | |
Total distributions | | | (0.06 | ) | | | (0.02 | ) | | | (0.27 | ) | | | (0.09 | ) | | | (0.99 | ) | | | (1.99 | ) |
| | | | | | | | | | | | | | | | | | | | | | | | |
Net Asset Value, End of Period | | $ | 9.70 | | | $ | 7.55 | | | $ | 11.25 | | | $ | 14.12 | | | $ | 12.83 | | | $ | 13.47 | |
| | | | | | | | | | | | | | | | | | | | | | | | |
Total Return (%) (b) | | | 29.22 | (c) | | | (32.76 | ) | | | (18.82 | ) | | | 10.76 | | | | 2.58 | | | | (16.67 | ) |
| | | | | | |
Ratios/Supplemental Data | | | | | | | | | | | | | | | | | | | | | | | | |
Gross ratio of expenses to average net assets (%) | | | 1.06 | (d) | | | 1.06 | | | | 1.06 | | | | 1.06 | | | | 1.07 | | | | 1.07 | |
Net ratio of expenses to average net assets (%) (e) | | | 1.05 | (d) | | | 1.05 | | | | 1.05 | | | | 1.05 | | | | 1.07 | | | | 1.07 | |
Ratio of net investment income to average net assets (%) | | | 0.12 | (d) | | | 0.56 | | | | 0.31 | | | | 0.38 | | | | 0.72 | | | | 0.01 | |
Portfolio turnover rate (%) | | | 32 | (c) | | | 25 | | | | 39 | | | | 36 | | | | 23 | | | | 42 | |
Net assets, end of period (in millions) | | $ | 135.1 | | | $ | 114.2 | | | $ | 135.3 | | | $ | 158.8 | | | $ | 165.1 | | | $ | 153.0 | |
| (a) | Per share amounts based on average shares outstanding during the period. |
| (b) | Total return does not reflect any insurance, sales, separate account or administrative charges of variable annuity or life insurance contracts or any additional expenses that contract owners may bear under their variable contracts. If these charges were included, the returns would be lower. |
| (c) | Periods less than one year are not computed on an annualized basis. |
| (d) | Computed on an annualized basis. |
| (e) | Includes the effects of management fee waivers (see Note 5 of the Notes to Financial Statements). |
| (f) | Net investment income was less than $0.01. |
See accompanying notes to financial statements.
MSF-9
Metropolitan Series Fund
Van Eck Global Natural Resources Portfolio
Notes to Financial Statements—June 30, 2016 (Unaudited)
1. Organization
Metropolitan Series Fund (the “Trust”) is organized as a Delaware statutory trust and registered under the Investment Company Act of 1940, as amended (the “1940 Act”), as an open-end management investment company. The Trust, which is managed by MetLife Advisers, LLC (“MetLife Advisers” or the “Adviser”), an affiliate of MetLife, Inc., is currently comprised of thirty series, each of which operates as a distinct investment vehicle of the Trust. The portfolio included in this report is Van Eck Global Natural Resources Portfolio (the “Portfolio”), which is diversified. Shares in the Portfolio are not offered directly to the general public and are currently available only to separate accounts established by Metropolitan Life Insurance Company (“MetLife”) and other affiliated life insurance companies.
The Portfolio has registered and offers two classes of shares: Class A and B shares. Shares of each Class of the Portfolio represent an equal pro rata interest in the Portfolio and generally give the shareholder the same voting, dividend, liquidation, and other rights. Investment income, realized and unrealized capital gains and losses, the common expenses of the Portfolio, and certain Portfolio-level expense reductions, if any, are allocated on a pro rata basis to each Class based on the relative net assets of each Class to the net assets of the Portfolio. Each Class of shares differs in its respective distribution plan and such distribution expenses are allocated to the corresponding Class of shares.
2. Significant Accounting Policies
The preparation of financial statements in conformity with accounting principles generally accepted in the United States of America (“GAAP”) requires management to make estimates and assumptions that affect the reported amounts of assets and liabilities and disclosure of contingent assets and liabilities as of the date of the financial statements and the reported amounts of income and expenses during the reporting period. Actual results could differ from those estimates. In the preparation of these financial statements, management has evaluated events and transactions subsequent to June 30, 2016 through the date the financial statements were issued.
The Portfolio is an investment company and follows the accounting and reporting guidance of the Financial Accounting Standards Board (“FASB”) Accounting Standards Codification Topic 946—Financial Services—Investment Companies and Topic 820—Fair Value Measurement. The following is a summary of significant accounting policies consistently followed by the Portfolio in the preparation of its financial statements.
Investment Valuation and Fair Value Measurements - Domestic and foreign equity securities, such as common stock, exchange-traded funds, rights, warrants, and preferred stock, that are traded on a securities exchange on a valuation date are generally valued at their last quoted sale price or official closing price on the primary exchange for such security, or, if no sales occurred on that day, at the last reported bid price. Equity securities traded over-the-counter (“OTC”) are generally valued at the last reported bid price. In the event of a major exchange closing during the trading day, the Adviser may use other market information obtained from quotation reporting systems, established market makers, or pricing services in valuing the securities. Valuation adjustments may be applied to certain foreign equity securities that are traded solely on foreign exchanges that close before the time as of which the Portfolio determines its NAV to account for the market movement between the close of the foreign exchanges and the time as of which the Portfolio determines its NAV. The Portfolio may use a systematic fair valuation model provided by a pricing service to value securities principally traded in these foreign markets in order to adjust for possible market movements or other changes that may occur between the close of the foreign exchanges and the time as of which the Portfolio determines its NAV. Foreign equity securities valued using these valuation adjustments are generally categorized as Level 2 within the fair value hierarchy. Equity securities that are actively traded, and have no valuation adjustments applied, are categorized as Level 1 within the fair value hierarchy. Other equity securities traded on inactive markets, or valued in reference to similar instruments traded on active markets, are generally categorized as Level 2 within the fair value hierarchy.
Investments in registered open-end management investment companies are valued at reported net asset value per share on the valuation date and are categorized as Level 1 within the fair value hierarchy.
Debt securities, including corporate, convertible and municipal bonds and notes; obligations of the U.S. Treasury and U.S. government agencies; foreign sovereign issues; and non-U.S. bonds, are generally valued on the basis of evaluated or composite bid quotations obtained from independent pricing services and/or brokers and dealers selected by the Adviser (each a “pricing service”), pursuant to authorization of and subject to general oversight by the Board of Trustees of the Trust (the “Board” or “Trustees”). Such pricing services may use matrix pricing, which considers observable inputs including, among other things, issuer details, maturity dates, interest rates, yield curves, rates of prepayment, credit risks/spreads, default rates, reported trades, broker dealer quotes and quoted prices for similar assets. Short-term obligations with a remaining maturity of sixty days or less may be valued at amortized cost in the absence of market quotes, so long as the amortized cost value of such short-term debt instrument is approximately the same as the fair value of the instrument as determined without the use of amortized cost valuation. Floating rate loans are generally valued on the basis of an evaluated or composite average of aggregate bid and ask quotations supplied by brokers or dealers, as obtained from the pricing service. Securities that use similar valuation techniques and inputs as described above are generally categorized as Level 2 within the fair value hierarchy.
MSF-10
Metropolitan Series Fund
Van Eck Global Natural Resources Portfolio
Notes to Financial Statements—June 30, 2016—(Continued)
Options, whether on securities, indices, futures contracts, or otherwise, traded on exchanges are valued at the last sale price available as of the close of business on a valuation day or, if there is no such price available, at the last reported bid price. These types of options are categorized as Level 1 within the fair value hierarchy. Futures contracts that are traded on commodity exchanges are valued at their settlement prices established by the exchanges on which they are traded as of the close of such exchanges and are categorized as Level 1 within the fair value hierarchy.
If no current market value quotation or other observable inputs are readily available or market value quotations are deemed to be unreliable for an investment, the fair value of the investment will be determined in accordance with procedures approved by, and under the general supervision of, the Board. In such a circumstance, the Board will be assisted in its responsibility to determine the fair value of an investment by the Valuation Committee (“Committee”) of MetLife Advisers. The Committee provides general pricing oversight and fair value pricing determinations related to portfolio securities and meets on a regular basis to review reports relating to the valuation of the securities in the Portfolio. The Board has delegated to State Street Bank and Trust Company, the Trust’s custodian (“custodian”), the responsibility for calculating the net asset values (“NAVs”) of the Trust’s Portfolios. The Committee is responsible for overseeing the calculation of the NAVs of the Portfolios by the custodian. The Committee also periodically reviews pricing services, including the pricing services providing fair value pricing for the Portfolio’s foreign securities, and is responsible for overseeing the correction of pricing errors and addressing other pricing issues that arise in the ordinary course of business, such as making real-time fair value determinations, as necessary.
No single standard for determining the fair value of an investment can be set forth because fair value depends upon the facts and circumstances with respect to each investment. Information relating to any relevant factors may be obtained by the Committee from any appropriate source, including the subadviser of the Portfolio, the custodian, a pricing service, market maker and/or broker for such security or the issuer. Appropriate methodologies for determining fair value under particular circumstances may include: matrix pricing, a discounted cash flow analysis, comparisons of securities with comparable characteristics, value based on multiples of earnings, discount from market price of similar marketable securities or a combination of these and other methods.
Investment Transactions and Related Investment Income - Portfolio security transactions are recorded on the trade date. Dividend income is recorded on the ex-dividend date or, for certain foreign securities, when notified. Interest income, which includes amortization of premium and accretion of discount on debt securities, is recorded on the accrual basis. Realized gains and losses on investments are determined on the identified cost basis, which is the same basis used for federal income tax purposes. Foreign income and foreign capital gains on some foreign securities may be subject to foreign taxes, which are accrued as applicable. These foreign taxes have been provided for in accordance with the Portfolio’s understanding of the applicable countries’ tax rules and rates.
Foreign Currency Translation - The books and records of the Portfolio are maintained in U.S. dollars. The values of securities, currencies, and other assets and liabilities denominated in currencies other than the U.S. dollar are translated into U.S. dollars based upon foreign exchange rates prevailing at the end of the period. Purchases and sales of investment securities, income, and expenses are translated on the respective dates of such transactions. Because the values of investment securities are translated at the foreign exchange rates prevailing at the end of the period, that portion of the results of operations arising from changes in exchange rates and that portion of the results of operations reflecting fluctuations arising from changes in market prices of the investment securities are not separated. Such fluctuations are included in the net realized and unrealized gain or loss on investments.
Net realized foreign exchange gains or losses arise from activity in forward foreign currency exchange contracts, sales of foreign currency, currency gains or losses realized between the trade and settlement dates on securities transactions, and the difference between the amounts of dividends, interest, and foreign withholding taxes recorded by the Portfolio and the U.S. dollar equivalent of the amounts actually received or paid by the Portfolio. Net unrealized foreign exchange gains and losses arise from changes in the value of assets and liabilities, other than investment securities, resulting from changes in foreign exchange rates.
Dividends and Distributions to Shareholders - The Portfolio records dividends and distributions on the ex-dividend date. Net realized gains from securities transactions (if any) are generally distributed annually to shareholders. The timing and characterization of certain income and capital gains distributions are determined in accordance with federal tax regulations that may differ from GAAP. Permanent book and tax basis differences relating to shareholder distributions will result in reclassification between under/over distributed net investment income, accumulated net realized gains/losses, and paid-in surplus. Book-tax differences are primarily due to foreign currency transactions, passive foreign investment companies (PFICs) and broker commission recapture. These adjustments have no impact on net assets or the results of operations.
Income Taxes - It is the Portfolio’s policy to comply with the requirements of the Internal Revenue Code of 1986, as amended, and regulations thereunder, applicable to regulated investment companies and to distribute, with respect to each taxable year, all of its taxable income to shareholders. Therefore, no federal income tax provision is required. The Portfolio files U.S. federal tax returns. No income tax returns are currently under examination. The Portfolio’s federal tax returns for the prior three fiscal years remain subject to examination by the Internal Revenue Service. As of June 30, 2016, the Portfolio had no uncertain tax positions that would require financial statement recognition, or de-recognition or disclosure.
MSF-11
Metropolitan Series Fund
Van Eck Global Natural Resources Portfolio
Notes to Financial Statements—June 30, 2016—(Continued)
Directed Brokerage Agreement - The Trust has entered into a directed brokerage arrangement with State Street Global Markets (“SSGM”). Under this arrangement, the Portfolio directs certain trades to SSGM in return for a recapture credit. SSGM issues a cash rebate to the Portfolio. Amounts paid to the Portfolio are shown separately as broker commission recapture on the Statement of Operations of the Portfolio. Additionally, these amounts have been excluded from the calculation of the net ratio of expenses to average net assets presented in the Financial Highlights for each share class.
Securities Lending - The Portfolio may lend its portfolio securities to certain qualified brokers who borrow securities in order to complete certain securities transactions. By lending its portfolio securities, the Portfolio attempts to increase its net investment income through the receipt of income on collateral held from securities on loan. Any gain or loss in the market price of the loaned securities that might occur and any interest earned or dividends declared during the term of the loan would accrue to the account of the Portfolio.
The Trust has entered into a Securities Lending Authorization Agreement with the custodian as the lending agent. Under this agreement, the custodian is authorized to loan portfolio securities on the Portfolio’s behalf. In exchange, the Portfolio receives either cash or securities as collateral against the loaned securities. The Portfolio receives collateral equal to at least 102% of the market value of the loaned securities (105% for foreign equity securities), at each loan’s inception. Collateral representing at least 100% of the market value of the loaned securities must be maintained for the duration of the loan. Cash collateral is generally invested in the State Street Navigator Securities Lending MET Portfolio (the “Navigator Portfolio”), a series of the State Street Navigator Securities Lending Trust that is managed by an affiliate of the custodian. The Navigator Portfolio is a registered money market fund that invests in a variety of high-quality, U.S. dollar-denominated instruments. If the market value of the collateral at the close of trading on a business day is less than 100% of the market value of the loaned securities at the close of trading on that day, the borrower shall be required to deliver, by the close of business on the following business day, an additional amount of collateral, so that the total amount of posted collateral is equal to at least 100% of the market value of all the loaned securities as of such preceding day. A portion of net income (income after the deduction of expenses and fees of the Navigator Portfolio) on the collateral is rebated to the borrower of the securities and the remainder is split between the custodian and the Portfolio. On loans collateralized by U.S. Treasuries, a fee is received from the borrower and is allocated between the Portfolio and the custodian. Income received by the Portfolio in securities lending transactions during the six months ended June 30, 2016 is reflected as Securities lending income on the Statement of Operations. The values of any securities loaned by the Portfolio and the related collateral at June 30, 2016 are disclosed in the footnotes to the Schedule of Investments. The value of the related collateral received by the Portfolio exceeded the value of the securities out on loan at June 30, 2016.
The risks associated with lending portfolio securities include, but are not limited to, possible delays in receiving additional collateral or in the recovery of the loaned securities, possible loss of rights in the collateral should the borrower fail financially, as well as risk of loss in the value of the collateral or the value of the investments made with the collateral. The lending agent shall indemnify the Portfolio in the case of default of any securities borrower.
All securities on loan are classified as Common Stocks in the Portfolio’s Schedule of Investments as of June 30, 2016, with a contractual maturity of overnight and continuous.
3. Certain Risks
In the normal course of business, the Portfolio invests in securities and enters into transactions where risks exist due to fluctuations in the market (“market risk”) or failure of the other party to a transaction to perform (“credit and counterparty risk”).
Market Risk: The value of securities held by the Portfolio may decline in response to certain events, including those directly involving the companies whose securities are owned by the Portfolio; conditions affecting the general economy; overall market changes; local, regional or global political, social or economic instability; and currency, interest rate, and price fluctuations.
Credit and Counterparty Risk: The Portfolio may be exposed to counterparty risk, or the risk that an entity with which the Portfolio has unsettled or open transactions may default. The potential loss could exceed the value of the financial assets and liabilities recorded in the financial statements. Financial assets that potentially expose the Portfolio to credit and counterparty risk consist principally of cash due from counterparties and investments. The Portfolio manages counterparty risk by entering into agreements only with counterparties that it believes have the financial resources to honor their obligations and by monitoring the financial stability of those counterparties. The Portfolio’s investment adviser attempts to mitigate counterparty risk by (i) periodically assessing the creditworthiness of its trading partners, (ii) monitoring and/or limiting the amount of its net exposure to each individual counterparty based on its assessment, and (iii) requiring collateral from the counterparty for certain transactions. In order to preserve certain safeguards for non-standard settlement trades, the Portfolio restricts its exposure to credit and counterparty losses by entering into master netting agreements (“Master Agreements”) with counterparties (approved brokers) with whom it undertakes a significant volume of transactions. Master Agreements govern the terms of certain transactions, and reduce the counterparty risk associated with relevant transactions by specifying credit protection mechanisms and providing standardization that improves legal certainty. Master Agreements can also help limit counterparty risk by specifying collateral posting arrangements at pre-arranged exposure levels.
MSF-12
Metropolitan Series Fund
Van Eck Global Natural Resources Portfolio
Notes to Financial Statements—June 30, 2016—(Continued)
Repurchase and reverse repurchase agreements are primarily executed under Global Master Repurchase Agreements (“GMRAs”) or Master Repurchase Agreements (“MRAs”), which provide the rights to set-off. Each repurchase and reverse repurchase agreement is initially collateralized at the transaction level. In the event of default, the total market value exposure will be offset against collateral exchanged to date, which would result in a net receivable/(payable) that would be due from/to the counterparty.
Natural Resource and Foreign Investment Risk: The Portfolio may concentrate its investments in companies which are significantly engaged in the exploration, development, production and distribution of gold and other natural resources such as strategic and other metals, minerals, forest products, oil, natural gas and coal and by investing in gold bullion and coins. Since the Portfolio may concentrate its investments, it may be subject to greater risks and market fluctuations than other more diversified portfolios. The production and marketing of gold and other natural resources may be affected by actions and changes in governments. In addition, gold and natural resources may be cyclical in nature. In addition, the investments by the Portfolio in foreign securities may involve risks not present in domestic investments. Since securities may be denominated in foreign currencies, may require settlement in foreign currencies and pay interest or dividends in foreign currencies, changes in the relationship of these foreign currencies to the U.S. dollar can significantly affect the value of the investments and earnings of the Portfolio. Foreign investments may also subject the Portfolio to foreign government exchange restrictions, expropriation, taxation or other political, social or economic developments, all of which could affect the market and/or credit risk of the investments. In addition to the risks described above, risks may arise from forward foreign currency contracts with respect to the potential inability of counterparties to meet the terms of their contracts.
Additional risks associated with each type of investment are described above within the respective security type notes. The Portfolio’s prospectus includes a discussion of the principal risks of investing in the Portfolio.
4. Investment Transactions
Aggregate cost of purchases and proceeds of sales of investment securities, excluding short-term securities, for the six months ended June 30, 2016 were as follows:
| | | | | | | | | | | | |
Purchases | | | Sales | |
U.S. Government | | Non U.S. Government | | | U.S. Government | | | Non U.S. Government | |
| $0 | | $ | 317,952,649 | | | $ | 0 | | | $ | 418,985,761 | |
The Portfolio engaged in security transactions with other accounts managed by Van Eck Associates Corporation that amounted to $10,673,258 in purchases of investments, which are included above.
5. Investment Management Fees and Other Transactions with Affiliates
Investment Management Agreement - MetLife Advisers is the investment adviser to the Portfolio. The Trust has entered into an investment management agreement with MetLife Advisers with respect to the Portfolio. For providing investment management services to the Portfolio, MetLife Advisers receives monthly compensation at the following annual rates:
| | | | | | |
Management
Fees earned by
MetLife Advisers
for the six months ended
June 30, 2016 | | % per annum | | | Average Daily Net Assets |
| $3,947,050 | | | 0.800 | % | | Of the first $250 million |
| | | 0.775 | % | | Of the next $750 million |
| | | 0.750 | % | | On amounts in excess of $1 billion |
Certain officers and trustees of the Trust may also be officers of MetLife Advisers; however, such officers and trustees receive no compensation from the Trust.
On January 12, 2016, MetLife, Inc. announced its plan to pursue the separation of a substantial portion of its retail segment and is currently evaluating structural alternatives for such separation. It is anticipated that MetLife Advisers would be included in any such separation. Any separation transaction that might occur will be subject to the satisfaction of various conditions and approvals, including approval of any transaction by the MetLife, Inc. Board of Directors, satisfaction of any applicable requirements of the SEC, and receipt of insurance and other regulatory approvals and other anticipated conditions. Because the form of a separation had yet to be determined, MetLife, Inc. cannot currently provide a specific potential completion date or information about the potential impact on MetLife Advisers. No assurance can be given regarding the form that a separation transaction may take or the specific terms thereof, or that a separation will in fact occur. Depending on the form a separation takes, MetLife Advisers’ continued service as investment adviser to the Trusts could be subject to the satisfaction of various conditions and approvals, which may include obtaining approvals from the Trusts’ Board and shareholders.
MSF-13
Metropolitan Series Fund
Van Eck Global Natural Resources Portfolio
Notes to Financial Statements—June 30, 2016—(Continued)
MetLife Advisers has entered into an investment subadvisory agreement with respect to managing the Portfolio. Van Eck Associates Corporation is compensated by MetLife Advisers to provide subadvisory services for the Portfolio.
Management Fee Waiver - Pursuant to a management fee waiver agreement, the Adviser has agreed, for the period May 1, 2016 to April 30, 2017, to reduce its advisory fees set out above under “Investment Management Agreement” for each class of the Portfolio as follows:
| | |
% per annum | | Average Daily Net Assets |
| 0.025% | | On amounts over $500 million and under $1 billion |
An identical agreement was in place for the period May 1, 2015 to April 30, 2016. Amounts waived for the six months ended June 30, 2016 are shown as a management fee waiver in the Statement of Operations.
Transfer Agency Agreement - MetLife serves as the transfer agent for the Trust. MetLife receives no fees for its services to the Trust under the transfer agency agreement.
Distribution and Service Fees - The Trust has a distribution agreement with MetLife Investors Distribution Company (“MIDC” or the “Distributor”) in which MIDC serves as the distributor for the Portfolio’s Class A and B Shares. MIDC is a wholly-owned subsidiary of MetLife Investors Group, LLC, an affiliate of the Adviser. The Trust has also adopted a Distribution and Service Plan under Rule 12b-1 of the 1940 Act for the Portfolio’s Class B Shares. Under the Distribution and Service Plan, the Class B Shares of the Portfolio pay a fee to compensate the Insurance Companies (or their affiliates) and other broker-dealers and financial intermediaries involved in the offer and sale of Portfolio shares for promoting or selling and servicing the Class B Shares. The fees under the Distribution and Service Plan for each class of the Portfolio’s shares are calculated as a percentage of the Portfolio’s average daily net assets that are attributable to that Class. Currently, the fee is 0.25% per year for Class B Shares. Amounts incurred by the Portfolio for the six months ended June 30, 2016 are shown as Distribution and service fees in the Statement of Operations.
Deferred Trustee Compensation - Each Trustee who is not currently an employee of the Adviser or any of its affiliates receives compensation from the Trust for his or her service to the Trust. A deferred compensation plan (the “Plan”) is available to the Trustees on a voluntary basis. Deferred amounts remain in the Trust until distributed in accordance with the provisions of the Plan. The value of a participating Trustee’s deferral account is based on theoretical investments of deferred amounts on the normal payment dates in certain portfolios of the Trust or Met Investors Series Trust, an affiliate of the Trust, as designated by the participating Trustee. Changes in the value of participants’ deferral accounts are reflected as Trustees’ fees and expenses in the Statement of Operations. The portion of the accrued obligations allocated to the Portfolio under the Plan is reflected as Deferred trustees’ fees in the Statement of Assets and Liabilities.
6. Contractual Obligations
Under the Trust’s organizational documents, its officers and Trustees may be indemnified against certain liabilities and expenses arising out of the performance of their duties to the Trust. Additionally, the Trust has a variety of indemnification obligations under contracts with its service providers. The Trust’s maximum exposure under these arrangements is unknown, as this would involve future claims that may be made against the Trust that have not yet occurred.
7. Income Tax Information
The tax character of distributions paid for the years ended December 31, 2015 and 2014 were as follows:
| | | | | | | | | | | | | | | | | | | | |
Ordinary Income | | | Long-Term Capital Gain | | | Total | |
2015 | | 2014 | | | 2015 | | | 2014 | | | 2015 | | | 2014 | |
| $4,821,085 | | $ | 6,134,646 | | | $ | — | | | $ | 18,832,592 | | | $ | 4,821,085 | | | $ | 24,967,238 | |
As of December 31, 2015, the components of distributable earnings (accumulated losses) on a federal income tax basis were as follows:
| | | | | | | | | | | | | | | | |
Undistributed
Ordinary
Income | | Undistributed
Long-Term
Capital Gain | | | Net
Unrealized
Depreciation | | | Other
Accumulated
Capital Losses | | | Total | |
| $8,153,563 | | $ | — | | | $ | (394,750,203 | ) | | $ | (131,657,426 | ) | | $ | (518,254,066 | ) |
The Portfolio utilizes the provisions of the federal income tax laws that provide for the carryforward of capital losses for prior years, offsetting such losses against any future realized capital gains. Under the Regulated Investment Company Modernization Act of 2010 (the “Act”), net capital losses recognized after December 22, 2010 may be carried forward indefinitely and their character is retained as short-term and/or long-term losses. Previously, net capital losses were carried forward for up to eight years and treated as short-term losses. As a transition rule, the Act requires that post-enactment net capital losses be used before pre-enactment net capital losses.
As of December 31, 2015, the post-enactment accumulated short-term capital losses were $37,759,307 and the post-enactment accumulated long-term capital losses were $93,898,119.
MSF-14
Metropolitan Series Fund
Western Asset Management Strategic Bond Opportunities Portfolio
Managed by Western Asset Management Company
Portfolio Manager Commentary*
PERFORMANCE
For the six month period ended June 30, 2016, the Class A, B and E shares of the Western Asset Management Strategic Bond Opportunities Portfolio returned 5.56%, 5.45%, and 5.55%, respectively. The Portfolio’s benchmark, the Barclays U.S. Aggregate Bond Index1, returned 5.31%.
MARKET ENVIRONMENT / CONDITIONS
Despite a very sluggish first quarter, the U.S. economy generally improved over the first half of 2016, as the post-crisis trend of steady but unspectacular economic growth continued. After several shifts in messaging, the Federal Reserve (the “Fed”) remained highly accommodative throughout the period and kept rates on hold. Notwithstanding the volatility of the first six weeks of the year, risk markets generally performed well. Equity market gains were respectable, with the S&P 500 Index up 3.8% during the six-month period. International events, such as the Brexit (the U.K. referendum on leaving the European Union) vote, threatened to roil markets but largely had only modest effects.
The economy grew at a real annualized rate of 1.4% in the fourth quarter of 2015, resulting in 2.4% annual growth for 2015, which was the same annual growth rate in 2014. In a familiar pattern, expectations for the economy heading into 2016 were fairly high, only to be disappointed in the first months of the year. First quarter 2016 gross domestic product registered an anemic increase of only 0.5% and was eventually revised up to 1.1%. Positive contributions from residential investment were a principal contributor to the revision. Other areas of note were increased contributions from personal consumption expenditures, government spending and exports. Manufacturing related data, however, continued to be weak. The labor market seems to be cooling recently even though the unemployment rate ticked down from 5.0% at the end of 2015 to 4.9% by the end of June. Recent jobs numbers have been especially volatile as the economy added 287,000 in June after a dismal May jobs number of only 11,000. Looking past the monthly volatility it is evident that the jobs growth trend is slowing as gains averaged 171,500 per month over the first six months.
After the Fed raised interest rates for the first time in nearly a decade last December, the Fed entered 2016 with a goal of gradual but continuous rate hikes. Market turmoil and weak global economic data, however, forced the Fed to pause and pivot to a more dovish stance. Fed Chair Janet Yellen’s speech on March 29th confirmed this pivot as she described the need to observe financial conditions very carefully. Her discussion of the asymmetry of policy risks when growth was at a low level clarified the need for greater caution in raising rates. The Fed seemed to be focused on risk management as opposed to a very straightforward, data-dependent path of higher interest rates.
However, during the second quarter the Fed shifted its message abruptly and reinforced its position coming into the year with a clear and definitive bias to tighten. They were only awaiting the expected improvement in the data to warrant the next hike. The Fed had endorsed the notion that growth will be improving sharply from the disappointing 1.1% growth in the first quarter. But the Fed decided to keep rates on hold in June as Federal Open Market Committee participants expressed concerns about job growth, downside risks to their economic outlook, and wanting to know the impact a Brexit vote could have on the U.S. economy. Now that the U.K. has voted to leave the European Union, this only increased the Fed’s concern and uncertainty and they have most likely adopted a wait and see approach.
The price of West Texas Intermediate (WTI) crude oil continued its precipitous descent in 2016 by dropping as low as $26.21 in the first quarter before recovering to end June at $48.33. This recovery benefited energy producers, a major component of high-yield bond indices, which suffered during the price plunge. Many producers had responded to the drop in oil prices by reducing capital expenditures, raising equity capital and retiring older and less efficient rigs. Going forward, the survivors are generally better situated to operate profitably despite lower prices.
Markets were rattled at the end of June as the U.K. defied the betting lines and unexpectedly voted to leave the European Union. Treasuries immediately rallied as investors sought safe haven assets and while spread sectors underperformed, the markets were orderly and no panic selling was detected. In fact, the spread sector underperformance lasted only a couple of days and these markets recovered over the last few days of the month but Treasuries continued to rally. While the Brexit vote will clearly have major political implications, investors were unsure how significant the economic impact will be.
Both short- and long-term Treasury yields moved sharply lower during the six months ended June 30, 2016. Two-year Treasury yields fell from a peak of 1.06% at the beginning of the period to a low of 0.58% at the end of the period. Ten-year Treasury yields began the reporting period at a peak of 2.27% and ended the period at 1.49%. Their low of 1.46% occurred on June 27 and 28, 2016. Despite the extreme sell-off during the first six weeks of the year, spread product sectors including investment grade and high yield credit, structured products and emerging markets have all done well in the first half of the year as spreads have tightened and they’ve generated positive excess returns over Treasuries.
PORTFOLIO REVIEW / PERIOD END POSITIONING
The Western Asset Management Strategic Bond Opportunities Portfolio outperformed its benchmark for the six month reporting period ending June 30, 2016. The main contributor to performance was the Portfolio’s high yield allocation. High yield bonds benefited from stabilizing market sentiment and strong investor demand in the second quarter following a volatile start of the year.
MSF-1
Metropolitan Series Fund
Western Asset Management Strategic Bond Opportunities Portfolio
Managed by Western Asset Management Company
Portfolio Manager Commentary*—(Continued)
Our tactical overweight to duration over the period also contributed to performance as U.S. and global yields declined markedly. The Portfolio’s emerging markets allocation also contributed to performance as the sector saw meaningful positive excess returns as fears of a global recession abated and energy prices rallied in the first quarter of the year. The Portfolio’s underweight to Agency mortgage-backed securities (“MBS”) helped performance as the sector underperformed Treasuries of similar interest rate risk.
The largest detractor from performance was the Portfolio’s overweight to commercial MBS (“CMBS”) securities. The CMBS market, in particular, experienced a great deal of volatility in early 2016, as well as a withdrawal of liquidity, a decline in trading volumes and an increased regulatory burden. Despite the various challenges the commercial real estate market faces, at period end we continued to believe CMBS securities remained attractively priced given our fundamental outlook and we maintained the Portfolio’s overweight positioning to that sector. Yield curve strategies were also a detractor to the Portfolio’s performance as well as non-U.S. dollar exposure, particular short euro and yen positions.
Interest rate options, futures, and swaps were used for managing duration and curve positioning and contributed to performance during the first half of the year. FX forwards, swaps, and options used to manage currency exposures detracted from performance. In aggregate, the Portfolio’s total derivative exposure detracted slightly from performance during the period.
We remained cautiously optimistic that global growth will hold up, but we are revisiting and rethinking this position given the uncertainty that Brexit has introduced. We expect that the U.S. economy can continue to expand at roughly 1.5% and the global economy at approximately 3%. This expectation will require that global central banks remain accommodative, but it suggests that spread sectors should outperform U.S. Treasuries and other developed country sovereign bonds; however, the downside risks to growth and inflation are real.
Over the last six months, we increased exposure to Investment Grade and High Yield Credit, and Emerging Markets securities. We generally increased our duration positioning over the first half of the year as rates trended higher. We also increased our overweight to longer key rate durations as the curve steepened significantly over the period.
At period end, we continued to maintain exposure to the global Investment Grade Credit (25%) and High Yield Credit (24%) sectors, where we believed the fundamental outlook and management of companies remain positive, particularly in the Financials sector. The Portfolio also remained positioned to benefit from risk premiums in emerging market bonds (19%), diversified across sovereign debt in local currencies, sovereign debt in U.S. dollars and select emerging market corporate issuers. The Portfolio remained overweight CMBS (6%) and Non-Agency MBS (6%) as we continued to see these sectors representing good risk-adjusted value and having less sensitivity to changes in commodity prices—a key driver of market volatility over the past two years.
S. Kenneth Leech
Michael Buchanan
Carl L. Eichstaedt
Mark S. Lindbloom
Chia-Liang Lian
Portfolio Managers
Western Asset Management Company
* This commentary may include statements that constitute “forward-looking statements” under the U.S. securities laws. Forward-looking statements include, among other things, projections, estimates, and information about possible or future results related to the Portfolio, market or regulatory developments. The views expressed above are not guarantees of future performance or economic results and involve certain risks, uncertainties and assumptions that could cause actual outcomes and results to differ materially from the views expressed herein. The views expressed above are subject to change at any time based upon economic, market, or other conditions and the subadvisory firm undertakes no obligation to update the views expressed herein. Any discussions of specific securities should not be considered a recommendation to buy or sell those securities. The views expressed above (including any forward-looking statement) may not be relied upon as investment advice or as an indication of the Portfolio’s trading intent. Information about the Portfolio’s holdings, asset allocation or country diversification is historical and is not an indication of future Portfolio composition, which may vary. Direct investment in any index is not possible. The performance of any index mentioned in this commentary has not been adjusted for ongoing management, distribution and operating expenses, and sales charges applicable to mutual fund investments. In addition, the returns do not reflect additional fees charged by separate accounts or variable insurance contracts that an investor in the Portfolio may pay. If these additional fees were reflected, performance would have been lower.
MSF-2
Metropolitan Series Fund
Western Asset Management Strategic Bond Opportunities Portfolio
A $10,000 INVESTMENT COMPARED TO THE BARCLAYS U.S. AGGREGATE BOND INDEX
SIX MONTH RETURN & AVERAGE ANNUAL RETURNS (%) AS OF JUNE 30, 2016
| | | | | | | | | | | | | | | | |
| | | 6 Month | | | 1 Year | | | 5 Year | | | 10 Year | |
| Western Asset Management Strategic Bond Opportunities Portfolio | | | | | | | | | | | | | | | | |
Class A | | | 5.56 | | | | 3.17 | | | | 4.82 | | | | 6.18 | |
Class B | | | 5.45 | | | | 2.97 | | | | 4.56 | | | | 5.92 | |
Class E | | | 5.55 | | | | 3.07 | | | | 4.68 | | | | 6.03 | |
| Barclays U.S. Aggregate Bond Index | | | 5.31 | | | | 6.00 | | | | 3.76 | | | | 5.13 | |
1 Barclays U.S. Aggregate Bond Index is a broad based benchmark that measures the investment grade, U.S. dollar-denominated, fixed-rate taxable bond market, including Treasuries, government-related and corporate securities, mortgage-backed securities, asset-backed securities, and commercial mortgage-backed securities.
Portfolio performance is calculated including reinvestment of all income and capital gain distributions. Performance numbers are net of all Portfolio expenses but do not include any insurance, sales, separate account or administrative charges of variable annuity or life insurance contracts or any additional expenses that participants may bear relating to the operations of their plans. If these charges were included, the returns would be lower. The performance of any index referenced above has not been adjusted for ongoing management, distribution and operating expenses, and sales charges applicable to mutual fund investments. Direct investment in any index is not possible. The performance of Class A shares, as set forth in the line graph above, will differ from that of other classes because of the difference in expenses paid by policyholders investing in the different share classes.
This information represents past performance and is not indicative of future results. Investment return and principal value may fluctuate so that shares, upon redemption, may be worth more or less than the original cost.
PORTFOLIO COMPOSITION AS OF JUNE 30, 2016
Top Sectors
| | | | |
| | | % of
Net Assets | |
| Corporate Bonds & Notes | | | 52.1 | |
| U.S. Treasury & Government Agencies | | | 15.3 | |
| Foreign Government | | | 14.2 | |
| Mortgage-Backed Securities | | | 10.7 | |
| Asset-Backed Securities | | | 2.4 | |
| Investment Company Securities | | | 0.7 | |
| Floating Rate Loans | | | 0.3 | |
| Municipals | | | 0.3 | |
| Convertible Preferred Stocks | | | 0.2 | |
| Preferred Stocks | | | 0.1 | |
MSF-3
Metropolitan Series Fund
Western Asset Management Strategic Bond Opportunities Portfolio
Understanding Your Portfolio’s Expenses
Shareholder Expense Example
As a shareholder of the Portfolio, you incur ongoing costs, including management fees; distribution and service (12b-1) fees; and other Portfolio expenses. This example is intended to help you understand your ongoing costs (in dollars) (referred to as “expenses”) of investing in the Portfolio and compare these costs with the ongoing costs of investing in other mutual funds. The example is based on an investment of $1,000 invested at the beginning of the period and held for the entire period, January 1, 2016 through June 30, 2016.
Actual Expenses
The first line for each share class of the Portfolio in the table below provides information about actual account values and actual expenses. You may use the information in this line, together with the amount you invested in the particular share class of the Portfolio, to estimate the expenses that you paid over the period. Simply divide your account value by $1,000 (for example, an $8,600 account value divided by $1,000 = 8.6), then multiply the result by the number in the first line under the heading entitled “Expenses Paid During Period” to estimate the expenses you paid on your account during this period.
Hypothetical Example for Comparison Purposes
The second line for each share class of the Portfolio in the table below provides information about hypothetical account values and hypothetical expenses based on the Portfolio’s actual expense ratio and an assumed rate of return of 5% per year before expenses, which is not the Portfolio’s actual return. The hypothetical account values and expenses may not be used to estimate the actual ending account balance or expenses you paid for the period. You may use this information to compare the ongoing costs of investing in the Portfolio and other funds. To do so, compare this 5% hypothetical example with the 5% hypothetical examples that appear in the shareholder reports of the other funds.
Please note that the expenses shown in the table are meant to highlight your ongoing costs only and do not reflect any fees or charges of your variable insurance product or any additional expenses that participants in certain eligible qualified plans may bear relating to the operations of their plan. Therefore, the second line for each share class in the table is useful in comparing ongoing costs only, and will not help you determine the relative total costs of owning different funds. In addition, if these other costs were included, your costs would have been higher.
| | | | | | | | | | | | | | | | | | |
Western Asset Management
Strategic Bond Opportunities Portfolio | | | | Annualized
Expense
Ratio | | | Beginning
Account Value
January 1,
2016 | | | Ending
Account Value
June 30,
2016 | | | Expenses Paid
During Period**
January 1, 2016
to
June 30,
2016 | |
Class A(a) | | Actual | | | 0.56 | % | | $ | 1,000.00 | | | $ | 1,055.60 | | | $ | 2.86 | |
| | Hypothetical* | | | 0.56 | % | | $ | 1,000.00 | | | $ | 1,022.08 | | | $ | 2.82 | |
| | | | | |
Class B(a) | | Actual | | | 0.81 | % | | $ | 1,000.00 | | | $ | 1,054.50 | | | $ | 4.14 | |
| | Hypothetical* | | | 0.81 | % | | $ | 1,000.00 | | | $ | 1,020.89 | | | $ | 4.07 | |
| | | | | |
Class E(a) | | Actual | | | 0.71 | % | | $ | 1,000.00 | | | $ | 1,055.50 | | | $ | 3.63 | |
| | Hypothetical* | | | 0.71 | % | | $ | 1,000.00 | | | $ | 1,021.33 | | | $ | 3.57 | |
* Hypothetical assumes a rate of return of 5% per year before expenses.
** Expenses paid are equal to the Portfolio’s annualized expense ratio for the most recent six month period, as shown above, multiplied by the average account value over the period, multiplied by the number of days (182 days) in the most recent fiscal half-year, divided by 366 (to reflect the one-half year period).
(a) The annualized expense ratio shown reflects the impact of the management fee waiver as described in Note 6 of the Notes to Financial Statements.
MSF-4
Metropolitan Series Fund
Western Asset Management Strategic Bond Opportunities Portfolio
Schedule of Investments as of June 30, 2016
Corporate Bonds & Notes—52.1% of Net Assets
| | | | | | | | |
| Security Description | | Principal
Amount* | | | Value | |
| | |
Advertising—0.0% | | | | | | | | |
WPP Finance
5.125%, 09/07/42 | | | 120,000 | | | $ | 126,567 | |
| | | | | | | | |
| | |
Aerospace/Defense—0.5% | | | | | | | | |
Harris Corp.
4.854%, 04/27/35 | | | 570,000 | | | | 625,733 | |
5.054%, 04/27/45 | | | 1,089,000 | | | | 1,235,183 | |
Lockheed Martin Corp.
3.100%, 01/15/23 | | | 220,000 | | | | 231,877 | |
3.550%, 01/15/26 | | | 2,261,000 | | | | 2,456,016 | |
4.700%, 05/15/46 | | | 11,101,000 | | | | 13,085,537 | |
Raytheon Co.
3.125%, 10/15/20 | | | 30,000 | | | | 32,158 | |
United Technologies Corp.
4.500%, 06/01/42 | | | 290,000 | | | | 332,140 | |
| | | | | | | | |
| | | | | | | 17,998,644 | |
| | | | | | | | |
| | |
Agriculture—0.9% | | | | | | | | |
Alliance One International, Inc.
9.875%, 07/15/21 (a) | | | 12,675,000 | | | | 10,694,531 | |
Altria Group, Inc.
5.375%, 01/31/44 (a) | | | 1,129,000 | | | | 1,447,492 | |
Reynolds American, Inc.
4.450%, 06/12/25 | | | 2,000,000 | | | | 2,239,876 | |
4.850%, 09/15/23 | | | 2,960,000 | | | | 3,379,533 | |
5.850%, 08/15/45 | | | 12,115,000 | | | | 15,479,711 | |
| | | | | | | | |
| | | | | | | 33,241,143 | |
| | | | | | | | |
| | |
Airlines—0.0% | | | | | | | | |
Air Canada Pass-Through Trust
4.125%, 05/15/25 (144A) | | | 726,630 | | | | 748,429 | |
Delta Air Lines Pass-Through Trust
4.950%, 05/23/19 | | | 346,557 | | | | 366,484 | |
Hawaiian Airlines Pass-Through Certificates
3.900%, 01/15/26 | | | 428,265 | | | | 425,054 | |
Northwest Airlines Pass-Through Trust
7.575%, 03/01/19 | | | 12,757 | | | | 13,267 | |
| | | | | | | | |
| | | | | | | 1,553,234 | |
| | | | | | | | |
| | |
Apparel—0.1% | | | | | | | | |
William Carter Co. (The)
5.250%, 08/15/21 | | | 2,375,000 | | | | 2,458,125 | |
| | | | | | | | |
| | |
Auto Manufacturers—0.7% | | | | | | | | |
Ford Motor Co.
4.750%, 01/15/43 (a) | | | 2,210,000 | | | | 2,339,248 | |
Ford Motor Credit Co. LLC
3.200%, 01/15/21 | | | 1,740,000 | | | | 1,792,346 | |
3.664%, 09/08/24 (a) | | | 720,000 | | | | 745,646 | |
General Motors Co.
6.600%, 04/01/36 | | | 5,134,000 | | | | 5,887,199 | |
6.750%, 04/01/46 | | | 10,000,000 | | | | 11,861,850 | |
General Motors Financial Co., Inc.
5.250%, 03/01/26 | | | 1,660,000 | | | | 1,804,561 | |
| | | | | | | | |
| | | | | | | 24,430,850 | |
| | | | | | | | |
| | |
Auto Parts & Equipment—0.8% | | | | | | | | |
American Axle & Manufacturing, Inc.
6.250%, 03/15/21 | | | 2,100,000 | | | | 2,178,750 | |
6.625%, 10/15/22 (a) | | | 1,590,000 | | | | 1,701,300 | |
Goodyear Tire & Rubber Co. (The)
5.000%, 05/31/26 | | | 3,630,000 | | | | 3,698,062 | |
Schaeffler Finance B.V.
4.250%, 05/15/21 (144A) | | | 4,000,000 | | | | 4,055,000 | |
Schaeffler Holding Finance B.V.
6.750%, 11/15/22 (144A) (a) (b) | | | 2,179,090 | | | | 2,396,999 | |
ZF North America Capital, Inc.
4.500%, 04/29/22 (144A) | | | 1,425,000 | | | | 1,444,594 | |
4.750%, 04/29/25 (144A) | | | 12,130,000 | | | | 12,289,146 | |
| | | | | | | | |
| | | | | | | 27,763,851 | |
| | | | | | | | |
| | |
Banks—9.6% | | | | | | | | |
ABN AMRO Bank NV
4.750%, 07/28/25 (144A) | | | 3,831,000 | | | | 3,976,884 | |
Bank of America Corp.
3.875%, 08/01/25 | | | 1,040,000 | | | | 1,103,243 | |
4.000%, 01/22/25 | | | 19,810,000 | | | | 20,192,551 | |
4.125%, 01/22/24 | | | 880,000 | | | | 946,510 | |
4.200%, 08/26/24 | | | 2,380,000 | | | | 2,460,249 | |
4.250%, 10/22/26 (a) | | | 7,628,000 | | | | 7,910,907 | |
6.300%, 03/10/26 (c) | | | 375,000 | | | | 398,438 | |
6.500%, 10/23/24 (a) (c) | | | 5,525,000 | | | | 5,884,125 | |
Barclays Bank plc
7.625%, 11/21/22 | | | 13,000,000 | | | | 13,991,250 | |
10.179%, 06/12/21 (144A) | | | 1,180,000 | | | | 1,485,648 | |
Barclays plc
4.375%, 01/12/26 | | | 1,575,000 | | | | 1,590,278 | |
BNP Paribas S.A.
4.375%, 05/12/26 (144A) (a) | | | 11,070,000 | | | | 11,184,464 | |
7.625%, 03/30/21 (144A) (c) | | | 2,850,000 | | | | 2,850,000 | |
BPCE S.A.
4.875%, 04/01/26 (144A) | | | 12,000,000 | | | | 12,311,484 | |
5.150%, 07/21/24 (144A) | | | 420,000 | | | | 437,054 | |
CIT Group, Inc.
5.000%, 08/15/22 | | | 1,482,000 | | | | 1,507,935 | |
Citigroup, Inc.
4.050%, 07/30/22 | | | 2,000,000 | | | | 2,107,186 | |
4.400%, 06/10/25 | | | 1,470,000 | | | | 1,537,045 | |
4.450%, 09/29/27 | | | 26,474,000 | | | | 27,271,159 | |
5.350%, 05/15/23 (a) (c) | | | 560,000 | | | | 526,848 | |
5.900%, 02/15/23 (c) | | | 1,475,000 | | | | 1,452,875 | |
5.950%, 01/30/23 (c) | | | 3,606,000 | | | | 3,563,179 | |
5.950%, 05/15/25 (c) | | | 2,790,000 | | | | 2,727,225 | |
6.300%, 05/15/24 (c) | | | 850,000 | | | | 845,665 | |
Cooperatieve Rabobank UA
4.375%, 08/04/25 (a) | | | 1,470,000 | | | | 1,535,456 | |
5.250%, 08/04/45 (a) | | | 1,530,000 | | | | 1,700,826 | |
5.750%, 12/01/43 | | | 1,480,000 | | | | 1,724,185 | |
11.000%, 06/30/19 (144A) (c) | | | 415,000 | | | | 494,888 | |
Corpbanca S.A.
3.875%, 09/22/19 | | | 6,290,000 | | | | 6,590,725 | |
Credit Agricole S.A.
4.375%, 03/17/25 (144A) (a) | | | 500,000 | | | | 505,243 | |
See accompanying notes to financial statements.
MSF-5
Metropolitan Series Fund
Western Asset Management Strategic Bond Opportunities Portfolio
Schedule of Investments as of June 30, 2016
Corporate Bonds & Notes—(Continued)
| | | | | | | | |
| Security Description | | Principal
Amount* | | | Value | |
| | |
Banks—(Continued) | | | | | | | | |
Credit Agricole S.A.
7.875%, 01/23/24 (144A) (c) | | | 1,750,000 | | | $ | 1,671,250 | |
8.125%, 12/23/25 (144A) (a) (c) | | | 4,540,000 | | | | 4,508,965 | |
8.375%, 10/13/19 (144A) (a) (c) | | | 640,000 | | | | 714,528 | |
Credit Suisse Group AG
7.500%, 12/11/23 (144A) (a) (c) | | | 1,665,000 | | | | 1,673,325 | |
Credit Suisse Group Funding Guernsey, Ltd.
4.875%, 05/15/45 | | | 1,560,000 | | | | 1,553,470 | |
Goldman Sachs Group, Inc. (The)
3.750%, 02/25/26 | | | 1,660,000 | | | | 1,747,152 | |
4.000%, 03/03/24 (a) | | | 3,180,000 | | | | 3,399,643 | |
4.250%, 10/21/25 | | | 15,890,000 | | | | 16,425,318 | |
5.150%, 05/22/45 | | | 3,184,000 | | | | 3,321,743 | |
5.250%, 07/27/21 | | | 1,330,000 | | | | 1,500,881 | |
6.750%, 10/01/37 | | | 2,000,000 | | | | 2,467,068 | |
7.500%, 02/15/19 | | | 20,000 | | | | 22,872 | |
HSBC Holdings plc
3.900%, 05/25/26 (a) | | | 16,950,000 | | | | 17,438,431 | |
4.250%, 08/18/25 (a) | | | 2,253,000 | | | | 2,273,554 | |
5.250%, 03/14/44 (a) | | | 3,700,000 | | | | 3,909,124 | |
6.375%, 09/17/24 (a) (c) | | | 1,290,000 | | | | 1,219,050 | |
ICICI Bank, Ltd.
5.750%, 11/16/20 (a) | | | 9,290,000 | | | | 10,421,438 | |
Intesa Sanpaolo S.p.A.
6.500%, 02/24/21 (144A) (a) | | | 1,175,000 | | | | 1,337,045 | |
Itau Unibanco Holding S.A.
2.850%, 05/26/18 (a) | | | 10,770,000 | | | | 10,726,920 | |
JPMorgan Chase & Co.
3.375%, 05/01/23 (a) | | | 600,000 | | | | 611,717 | |
3.625%, 05/13/24 | | | 690,000 | | | | 732,679 | |
3.875%, 09/10/24 | | | 6,352,000 | | | | 6,576,461 | |
4.350%, 08/15/21 | | | 10,000 | | | | 11,001 | |
4.500%, 01/24/22 | | | 160,000 | | | | 178,055 | |
6.750%, 02/01/24 (a) (c) | | | 1,105,000 | | | | 1,216,881 | |
Lloyds Banking Group plc
4.582%, 12/10/25 (144A) | | | 3,011,000 | | | | 3,026,832 | |
4.650%, 03/24/26 (a) | | | 10,300,000 | | | | 10,429,914 | |
7.500%, 06/27/24 (c) | | | 2,360,000 | | | | 2,306,900 | |
Macquarie Bank, Ltd.
4.875%, 06/10/25 (144A) (a) | | | 2,100,000 | | | | 2,174,134 | |
Morgan Stanley
4.000%, 07/23/25 | | | 1,165,000 | | | | 1,247,469 | |
4.100%, 05/22/23 | | | 2,500,000 | | | | 2,592,155 | |
4.875%, 11/01/22 | | | 450,000 | | | | 492,775 | |
6.625%, 04/01/18 | | | 714,000 | | | | 773,814 | |
Nordea Bank AB
4.250%, 09/21/22 (144A) | | | 3,400,000 | | | | 3,593,351 | |
Oversea-Chinese Banking Corp., Ltd.
4.250%, 06/19/24 (a) | | | 10,230,000 | | | | 10,825,233 | |
PNC Financial Services Group, Inc. (The)
6.750%, 08/01/21 (c) | | | 1,970,000 | | | | 2,198,815 | |
Royal Bank of Scotland Group plc
4.800%, 04/05/26 | | | 400,000 | | | | 406,828 | |
5.125%, 05/28/24 (a) | | | 1,330,000 | | | | 1,296,887 | |
6.000%, 12/19/23 | | | 875,000 | | | | 889,116 | |
6.100%, 06/10/23 | | | 780,000 | | | | 797,736 | |
| | |
Banks—(Continued) | | | | | | | | |
Royal Bank of Scotland Group plc
6.125%, 12/15/22 | | | 390,000 | | | | 408,998 | |
Royal Bank of Scotland NV
4.650%, 06/04/18 | | | 410,000 | | | | 420,166 | |
Royal Bank of Scotland plc (The)
13.125%, 03/19/22 (AUD) (c) | | | 1,580,000 | | | | 1,245,824 | |
Santander Holdings USA, Inc.
4.500%, 07/17/25 | | | 890,000 | | | | 914,207 | |
Santander UK Group Holdings plc
4.750%, 09/15/25 (144A) (a) | | | 7,791,000 | | | | 7,689,873 | |
7.375%, 06/24/22 (GBP) (c) | | | 2,620,000 | | | | 3,234,947 | |
Santander UK plc
7.950%, 10/26/29 | | | 272,000 | | | | 331,840 | |
Scotia Bank Peru DPR Finance Co.
3.403%, 03/15/17 (144A) (c) (d) | | | 157,895 | | | | 157,823 | |
Standard Chartered plc
3.950%, 01/11/23 (144A) (a) | | | 2,425,000 | | | | 2,351,239 | |
5.700%, 03/26/44 (144A) (a) | | | 17,500,000 | | | | 17,805,917 | |
UBS AG
7.625%, 08/17/22 | | | 2,850,000 | | | | 3,227,625 | |
UBS Group Funding Jersey, Ltd.
4.125%, 09/24/25 (144A) | | | 660,000 | | | | 684,122 | |
Wachovia Capital Trust III
5.570%, 08/01/16 (c) | | | 1,021,000 | | | | 1,008,276 | |
Wells Fargo & Co.
4.300%, 07/22/27 (a) | | | 17,670,000 | | | | 19,078,847 | |
Wells Fargo Capital X
5.950%, 12/15/36 | | | 380,000 | | | | 400,900 | |
| | | | | | | | |
| | | | | | | 338,484,659 | |
| | | | | | | | |
| | |
Beverages—1.5% | | | | | | | | |
Anheuser-Busch InBev Finance, Inc.
3.650%, 02/01/26 | | | 8,882,000 | | | | 9,514,807 | |
4.900%, 02/01/46 | | | 12,995,000 | | | | 15,228,087 | |
Anheuser-Busch InBev Worldwide, Inc.
7.750%, 01/15/19 | | | 1,254,000 | | | | 1,450,759 | |
Carolina Beverage Group LLC / Carolina Beverage Group Finance, Inc.
10.625%, 08/01/18 (144A) | | | 370,000 | | | | 352,425 | |
Constellation Brands, Inc.
4.250%, 05/01/23 | | | 2,500,000 | | | | 2,600,000 | |
4.750%, 11/15/24 (a) | | | 11,649,000 | | | | 12,260,572 | |
4.750%, 12/01/25 | | | 1,500,000 | | | | 1,580,625 | |
6.000%, 05/01/22 | | | 2,282,000 | | | | 2,550,135 | |
Dr Pepper Snapple Group, Inc.
3.400%, 11/15/25 | | | 2,204,000 | | | | 2,342,149 | |
4.500%, 11/15/45 | | | 1,102,000 | | | | 1,215,039 | |
PepsiCo, Inc.
4.250%, 10/22/44 | | | 751,000 | | | | 842,396 | |
4.450%, 04/14/46 | | | 1,178,000 | | | | 1,374,702 | |
| | | | | | | | |
| | | | | | | 51,311,696 | |
| | | | | | | | |
| | |
Biotechnology—0.4% | | | | | | | | |
Biogen, Inc.
3.625%, 09/15/22 | | | 1,350,000 | | | | 1,433,037 | |
4.050%, 09/15/25 | | | 1,625,000 | | | | 1,749,233 | |
See accompanying notes to financial statements.
MSF-6
Metropolitan Series Fund
Western Asset Management Strategic Bond Opportunities Portfolio
Schedule of Investments as of June 30, 2016
Corporate Bonds & Notes—(Continued)
| | | | | | | | |
| Security Description | | Principal
Amount* | | | Value | |
| | |
Biotechnology—(Continued) | | | | | | | | |
Celgene Corp.
3.875%, 08/15/25 (a) | | | 1,120,000 | | | $ | 1,194,664 | |
5.000%, 08/15/45 | | | 920,000 | | | | 1,013,232 | |
Gilead Sciences, Inc.
2.550%, 09/01/20 (a) | | | 1,675,000 | | | | 1,740,474 | |
3.500%, 02/01/25 | | | 2,525,000 | | | | 2,691,852 | |
4.600%, 09/01/35 | | | 1,800,000 | | | | 2,001,411 | |
4.750%, 03/01/46 (a) | | | 1,675,000 | | | | 1,904,647 | |
| | | | | | | | |
| | | | | | | 13,728,550 | |
| | | | | | | | |
| | |
Building Materials—0.1% | | | | | | | | |
Hardwoods Acquisition, Inc.
7.500%, 08/01/21 (144A) | | | 2,800,000 | | | | 2,128,000 | |
NWH Escrow Corp.
7.500%, 08/01/21 (144A) | | | 550,000 | | | | 407,000 | |
Ply Gem Industries, Inc.
6.500%, 02/01/22 | | | 1,540,000 | | | | 1,493,800 | |
| | | | | | | | |
| | | | | | | 4,028,800 | |
| | | | | | | | |
| | |
Chemicals—0.5% | | | | | | | | |
Axiall Corp.
4.875%, 05/15/23 (a) | | | 1,820,000 | | | | 1,870,050 | |
Eagle Spinco, Inc.
4.625%, 02/15/21 | | | 2,190,000 | | | | 2,242,013 | |
Eastman Chemical Co.
4.800%, 09/01/42 | | | 740,000 | | | | 767,021 | |
Ecolab, Inc.
4.350%, 12/08/21 | | | 70,000 | | | | 79,244 | |
OCP S.A.
5.625%, 04/25/24 | | | 9,930,000 | | | | 10,525,800 | |
Potash Corp. of Saskatchewan, Inc.
4.875%, 03/30/20 (a) | | | 40,000 | | | | 44,108 | |
Rain CII Carbon LLC / CII Carbon Corp.
8.000%, 12/01/18 (144A) | | | 1,275,000 | | | | 1,102,875 | |
| | | | | | | | |
| | | | | | | 16,631,111 | |
| | | | | | | | |
| | |
Coal—0.0% | | | | | | | | |
Murray Energy Corp.
11.250%, 04/15/21 (144A) | | | 4,550,000 | | | | 1,274,000 | |
| | | | | | | | |
| | |
Commercial Services—0.8% | | | | | | | | |
AA Bond Co., Ltd.
5.500%, 07/31/22 (GBP) | | | 2,690,000 | | | | 3,410,961 | |
ADT Corp. (The)
4.125%, 06/15/23 | | | 4,070,000 | | | | 3,810,537 | |
Board of Trustees of The Leland Stanford Junior University (The)
4.750%, 05/01/19 | | | 950,000 | | | | 1,043,094 | |
Cleveland Clinic Foundation (The)
4.858%, 01/01/2114 | | | 1,450,000 | | | | 1,616,741 | |
Massachusetts Institute of Technology
5.600%, 07/01/2111 | | | 800,000 | | | | 1,138,457 | |
Metropolitan Museum of Art (The)
3.400%, 07/01/45 | | | 2,025,000 | | | | 2,141,438 | |
| | |
Commercial Services—(Continued) | | | | | | | | |
Total System Services, Inc.
4.800%, 04/01/26 | | | 2,201,000 | | | | 2,386,729 | |
UBM plc
5.750%, 11/03/20 (144A) | | | 50,000 | | | | 54,104 | |
United Rentals North America, Inc.
5.875%, 09/15/26 (a) | | | 9,600,000 | | | | 9,528,000 | |
6.125%, 06/15/23 (a) | | | 1,850,000 | | | | 1,926,313 | |
University of Southern California
5.250%, 10/01/2111 | | | 550,000 | | | | 738,088 | |
Verisk Analytics, Inc.
5.500%, 06/15/45 (a) | | | 1,571,000 | | | | 1,615,549 | |
| | | | | | | | |
| | | | | | | 29,410,011 | |
| | | | | | | | |
| | |
Computers—0.5% | | | | | | | | |
Compiler Finance Sub, Inc.
7.000%, 05/01/21 (144A) (d) | | | 990,000 | | | | 415,800 | |
Diamond 1 Finance Corp. / Diamond 2 Finance Corp.
3.480%, 06/01/19 (144A) | | | 1,000,000 | | | | 1,024,410 | |
4.420%, 06/15/21 (144A) | | | 14,500,000 | | | | 14,924,429 | |
| | | | | | | | |
| | | | | | | 16,364,639 | |
| | | | | | | | |
| | |
Diversified Financial Services—2.1% | | | | | | | | |
AerCap Ireland Capital, Ltd. / AerCap Global Aviation Trust
3.950%, 02/01/22 (a) | | | 8,000,000 | | | | 8,000,000 | |
4.625%, 10/30/20 | | | 1,060,000 | | | | 1,098,955 | |
4.625%, 07/01/22 (a) | | | 600,000 | | | | 614,448 | |
5.000%, 10/01/21 | | | 7,056,000 | | | | 7,338,240 | |
Ally Financial, Inc.
5.750%, 11/20/25 (a) | | | 5,392,000 | | | | 5,405,480 | |
8.000%, 11/01/31 | | | 1,025,000 | | | | 1,186,438 | |
Carlyle Holdings II Finance LLC
5.625%, 03/30/43 (144A) | | | 3,370,000 | | | | 3,704,587 | |
GE Capital International Funding Co.
2.342%, 11/15/20 (144A) | | | 538,000 | | | | 554,227 | |
4.418%, 11/15/35 (144A) | | | 2,885,000 | | | | 3,235,776 | |
International Lease Finance Corp.
6.250%, 05/15/19 | | | 2,470,000 | | | | 2,645,988 | |
8.250%, 12/15/20 (a) | | | 2,613,000 | | | | 3,089,402 | |
KKR Group Finance Co. II LLC
5.500%, 02/01/43 (144A) | | | 130,000 | | | | 135,472 | |
Macquarie Group, Ltd.
6.000%, 01/14/20 (144A) | | | 3,200,000 | | | | 3,567,347 | |
6.250%, 01/14/21 (144A) | | | 400,000 | | | | 457,168 | |
Navient Corp.
5.000%, 10/26/20 | | | 5,811,000 | | | | 5,447,812 | |
5.875%, 10/25/24 | | | 3,150,000 | | | | 2,693,250 | |
8.000%, 03/25/20 | | | 1,610,000 | | | | 1,645,227 | |
Quicken Loans, Inc.
5.750%, 05/01/25 (144A) (a) | | | 19,470,000 | | | | 18,788,550 | |
Visa, Inc.
3.150%, 12/14/25 | | | 2,670,000 | | | | 2,854,526 | |
| | | | | | | | |
| | | | | | | 72,462,893 | |
| | | | | | | | |
See accompanying notes to financial statements.
MSF-7
Metropolitan Series Fund
Western Asset Management Strategic Bond Opportunities Portfolio
Schedule of Investments as of June 30, 2016
Corporate Bonds & Notes—(Continued)
| | | | | | | | |
| Security Description | | Principal
Amount* | | | Value | |
| | |
Electric—1.4% | | | | | | | | |
Calpine Corp.
5.250%, 06/01/26 (144A) (a) | | | 3,270,000 | | | $ | 3,261,825 | |
5.875%, 01/15/24 (144A) | | | 874,000 | | | | 908,960 | |
Comision Federal de Electricidad
6.125%, 06/16/45 (144A) | | | 10,430,000 | | | | 11,042,762 | |
Electricite de France S.A.
5.250%, 01/29/23 (144A) (c) | | | 950,000 | | | | 911,905 | |
Enel S.p.A.
7.750%, 09/10/75 (GBP) (c) | | | 2,450,000 | | | | 3,460,034 | |
Exelon Corp.
5.625%, 06/15/35 | | | 255,000 | | | | 304,208 | |
FirstEnergy Corp.
4.250%, 03/15/23 | | | 1,560,000 | | | | 1,609,404 | |
7.375%, 11/15/31 | | | 3,550,000 | | | | 4,406,327 | |
Mirant Mid Atlantic Pass-Through Trust
10.060%, 12/30/28 | | | 5,056,588 | | | | 4,778,476 | |
NSG Holdings LLC / NSG Holdings, Inc.
7.750%, 12/15/25 (144A) (d) | | | 2,802,397 | | | | 2,998,565 | |
Pacific Gas & Electric Co.
6.050%, 03/01/34 | | | 1,180,000 | | | | 1,572,182 | |
Panoche Energy Center LLC
6.885%, 07/31/29 (144A) | | | 729,340 | | | | 767,592 | |
Perusahaan Listrik Negara PT
5.500%, 11/22/21 (a) | | | 9,750,000 | | | | 10,608,195 | |
Southern California Edison Co.
3.900%, 03/15/43 | | | 1,217,000 | | | | 1,314,420 | |
| | | | | | | | |
| | | | | | | 47,944,855 | |
| | | | | | | | |
| | |
Electronics—0.1% | | | | | | | | |
Flextronics International, Ltd.
4.625%, 02/15/20 (a) | | | 780,000 | | | | 807,300 | |
5.000%, 02/15/23 | | | 1,300,000 | | | | 1,348,750 | |
Sanmina Corp.
4.375%, 06/01/19 (144A) | | | 2,320,000 | | | | 2,372,200 | |
| | | | | | | | |
| | | | | | | 4,528,250 | |
| | | | | | | | |
| | |
Energy-Alternate Sources—0.0% | | | | | | | | |
Alta Wind Holdings LLC
7.000%, 06/30/35 (144A) (d) | | | 1,539,668 | | | | 1,585,763 | |
| | | | | | | | |
| | |
Engineering & Construction—0.3% | | | | | | | | |
CRCC Yuxiang, Ltd.
3.500%, 05/16/23 | | | 10,520,000 | | | | 10,823,260 | |
| | | | | | | | |
| | |
Entertainment—0.1% | | | | | | | | |
Greektown Holdings LLC / Greektown Mothership Corp.
8.875%, 03/15/19 (144A) | | | 1,150,000 | | | | 1,193,125 | |
Vougeot Bidco plc
7.875%, 07/15/20 (GBP) | | | 2,510,000 | | | | 3,416,618 | |
| | | | | | | | |
| | | | | | | 4,609,743 | |
| | | | | | | | |
| | |
Environmental Control—0.0% | | | | | | | | |
Waste Management, Inc.
3.500%, 05/15/24 | | | 890,000 | | | | 961,933 | |
| | |
Environmental Control—(Continued) | | | | | | | | |
Waste Management, Inc.
4.600%, 03/01/21 | | | 180,000 | | | | 200,107 | |
7.375%, 05/15/29 | | | 190,000 | | | | 266,279 | |
| | | | | | | | |
| | | | | | | 1,428,319 | |
| | | | | | | | |
| | |
Food—0.4% | | | | | | | | |
Dole Food Co., Inc.
7.250%, 05/01/19 (144A) | | | 8,520,000 | | | | 8,498,700 | |
Kraft Heinz Foods Co.
3.500%, 06/06/22 (a) | | | 570,000 | | | | 606,205 | |
3.950%, 07/15/25 (144A) | | | 280,000 | | | | 304,438 | |
4.875%, 02/15/25 (144A) | | | 1,157,000 | | | | 1,268,884 | |
5.000%, 07/15/35 (144A) | | | 380,000 | | | | 435,830 | |
5.200%, 07/15/45 (144A) | | | 390,000 | | | | 461,822 | |
R&R Ice Cream plc
5.500%, 05/15/20 (GBP) | | | 2,550,000 | | | | 3,454,093 | |
| | | | | | | | |
| | | | | | | 15,029,972 | |
| | | | | | | | |
| | |
Forest Products & Paper—0.0% | | | | | | | | |
Resolute Forest Products, Inc.
5.875%, 05/15/23 (a) | | | 460,000 | | | | 362,250 | |
| | | | | | | | |
| | |
Healthcare-Products—0.7% | | | | | | | | |
DJO Finance LLC / DJO Finance Corp.
10.750%, 04/15/20 (144A) | | | 2,060,000 | | | | 1,668,600 | |
DJO Finco, Inc. / DJO Finance LLC / DJO Finance Corp.
8.125%, 06/15/21 (144A) | | | 4,570,000 | | | | 3,953,050 | |
Immucor, Inc.
11.125%, 08/15/19 | | | 4,810,000 | | | | 4,377,100 | |
Medtronic, Inc.
3.150%, 03/15/22 (a) | | | 2,393,000 | | | | 2,553,736 | |
3.500%, 03/15/25 (a) | | | 1,730,000 | | | | 1,885,916 | |
Universal Hospital Services, Inc.
7.625%, 08/15/20 (a) | | | 10,255,000 | | | | 9,421,781 | |
| | | | | | | | |
| | | | | | | 23,860,183 | |
| | | | | | | | |
| | |
Healthcare-Services—1.9% | | | | | | | | |
Amsurg Corp.
5.625%, 11/30/20 | | | 2,565,000 | | | | 2,648,362 | |
5.625%, 07/15/22 | | | 963,000 | | | | 989,483 | |
Centene Corp.
4.750%, 05/15/22 | | | 6,600,000 | | | | 6,732,000 | |
5.625%, 02/15/21 (144A) | | | 1,906,000 | | | | 1,987,005 | |
6.125%, 02/15/24 (144A) | | | 3,073,000 | | | | 3,266,983 | |
DaVita HealthCare Partners, Inc.
5.000%, 05/01/25 (a) | | | 3,460,000 | | | | 3,429,725 | |
5.125%, 07/15/24 | | | 730,000 | | | | 738,103 | |
5.750%, 08/15/22 | | | 3,500,000 | | | | 3,661,875 | |
Dignity Health
3.812%, 11/01/24 | | | 1,800,000 | | | | 1,921,684 | |
4.500%, 11/01/42 | | | 339,000 | | | | 361,962 | |
Fresenius Medical Care U.S. Finance II, Inc.
4.750%, 10/15/24 (144A) | | | 700,000 | | | | 722,750 | |
5.875%, 01/31/22 (144A) | | | 3,225,000 | | | | 3,535,406 | |
See accompanying notes to financial statements.
MSF-8
Metropolitan Series Fund
Western Asset Management Strategic Bond Opportunities Portfolio
Schedule of Investments as of June 30, 2016
Corporate Bonds & Notes—(Continued)
| | | | | | | | |
| Security Description | | Principal
Amount* | | | Value | |
| | |
Healthcare-Services—(Continued) | | | | | | | | |
HCA, Inc.
4.750%, 05/01/23 (a) | | | 590,000 | | | $ | 604,750 | |
5.250%, 04/15/25 (a) | | | 1,655,000 | | | | 1,729,475 | |
5.250%, 06/15/26 | | | 1,270,000 | | | | 1,318,419 | |
5.375%, 02/01/25 | | | 4,615,000 | | | | 4,730,375 | |
5.875%, 05/01/23 | | | 50,000 | | | | 53,250 | |
5.875%, 02/15/26 | | | 190,000 | | | | 197,125 | |
6.500%, 02/15/20 | | | 1,550,000 | | | | 1,714,687 | |
7.500%, 02/15/22 | | | 6,583,000 | | | | 7,484,871 | |
7.690%, 06/15/25 | | | 1,817,000 | | | | 1,944,190 | |
8.360%, 04/15/24 | | | 50,000 | | | | 56,500 | |
IASIS Healthcare LLC / IASIS Capital Corp.
8.375%, 05/15/19 | | | 10,520,000 | | | | 10,105,775 | |
Memorial Sloan-Kettering Cancer Center
4.200%, 07/01/55 | | | 1,825,000 | | | | 2,063,033 | |
Tenet Healthcare Corp.
6.750%, 06/15/23 (a) | | | 1,847,000 | | | | 1,768,502 | |
8.125%, 04/01/22 | | | 3,655,000 | | | | 3,745,644 | |
| | | | | | | | |
| | | | | | | 67,511,934 | |
| | | | | | | | |
|
Holding Companies-Diversified—0.4% | |
Argos Merger Sub, Inc.
7.125%, 03/15/23 (144A) (a) | | | 4,716,000 | | | | 4,857,480 | |
Co-operative Group Holdings, Ltd.
7.500%, 07/08/26 (GBP) | | | 2,410,000 | | | | 3,425,966 | |
DH Services Luxembourg S.a.r.l.
7.750%, 12/15/20 (144A) | | | 6,940,000 | | | | 7,269,650 | |
| | | | | | | | |
| | | | | | | 15,553,096 | |
| | | | | | | | |
| | |
Home Builders—0.8% | | | | | | | | |
Meritage Homes Corp.
7.000%, 04/01/22 | | | 2,500,000 | | | | 2,700,000 | |
Taylor Morrison Communities, Inc. / Monarch Communities, Inc.
5.250%, 04/15/21 (144A) | | | 3,955,000 | | | | 3,945,112 | |
5.625%, 03/01/24 (144A) | | | 6,000,000 | | | | 5,850,000 | |
5.875%, 04/15/23 (144A) | | | 780,000 | | | | 783,900 | |
William Lyon Homes, Inc.
5.750%, 04/15/19 | | | 4,247,000 | | | | 4,162,060 | |
7.000%, 08/15/22 | | | 8,040,000 | | | | 7,959,600 | |
8.500%, 11/15/20 | | | 3,060,000 | | | | 3,144,150 | |
| | | | | | | | |
| | | | | | | 28,544,822 | |
| | | | | | | | |
| | |
Household Products/Wares—0.4% | | | | | | | | |
Sun Products Corp. (The)
7.750%, 03/15/21 (144A) (a) | | | 12,980,000 | | | | 13,450,525 | |
| | | | | | | | |
| | |
Housewares—0.7% | | | | | | | | |
American Greetings Corp.
7.375%, 12/01/21 | | | 1,505,000 | | | | 1,561,438 | |
Newell Brands, Inc.
3.850%, 04/01/23 (a) | | | 2,750,000 | | | | 2,916,840 | |
4.200%, 04/01/26 | | | 7,000,000 | | | | 7,588,357 | |
5.500%, 04/01/46 | | | 10,200,000 | | | | 12,135,215 | |
| | | | | | | | |
| | | | | | | 24,201,850 | |
| | | | | | | | |
| | |
Insurance—0.8% | | | | | | | | |
American Equity Investment Life Holding Co.
6.625%, 07/15/21 | | | 1,630,000 | | | | 1,654,450 | |
American International Group, Inc.
3.750%, 07/10/25 (a) | | | 1,380,000 | | | | 1,406,503 | |
6.250%, 03/15/87 (c) | | | 453,000 | | | | 462,060 | |
AXA S.A.
8.600%, 12/15/30 | | | 1,320,000 | | | | 1,808,400 | |
Berkshire Hathaway, Inc.
2.750%, 03/15/23 | | | 1,101,000 | | | | 1,137,588 | |
3.125%, 03/15/26 | | | 1,101,000 | | | | 1,154,447 | |
Chubb INA Holdings, Inc.
2.300%, 11/03/20 | | | 350,000 | | | | 359,848 | |
3.350%, 05/03/26 | | | 470,000 | | | | 500,972 | |
4.350%, 11/03/45 | | | 1,104,000 | | | | 1,270,064 | |
Delphi Financial Group, Inc.
7.875%, 01/31/20 | | | 2,190,000 | | | | 2,533,863 | |
Liberty Mutual Insurance Co.
7.697%, 10/15/97 (144A) | | | 2,600,000 | | | | 3,319,828 | |
Prudential Financial, Inc.
5.625%, 06/15/43 (c) | | | 550,000 | | | | 573,551 | |
5.875%, 09/15/42 (a) (c) | | | 1,200,000 | | | | 1,297,500 | |
8.875%, 05/15/38 (c) | | | 915,000 | | | | 1,006,500 | |
Teachers Insurance & Annuity Association of America
4.900%, 09/15/44 (144A) | | | 1,771,000 | | | | 1,987,776 | |
6.850%, 12/16/39 (144A) | | | 2,546,000 | | | | 3,458,629 | |
TIAA Asset Management Finance Co. LLC
4.125%, 11/01/24 (144A) | | | 1,807,000 | | | | 1,898,244 | |
Trinity Acquisition plc
4.400%, 03/15/26 | | | 1,650,000 | | | | 1,722,805 | |
| | | | | | | | |
| | | | | | | 27,553,028 | |
| | | | | | | | |
| | |
Internet—0.6% | | | | | | | | |
Alibaba Group Holding, Ltd.
3.125%, 11/28/21 (a) | | | 10,475,000 | | | | 10,712,311 | |
Amazon.com, Inc.
4.800%, 12/05/34 | | | 4,581,000 | | | | 5,388,209 | |
eBay, Inc.
3.800%, 03/09/22 | | | 1,095,000 | | | | 1,163,524 | |
Netflix, Inc.
5.375%, 02/01/21 (a) | | | 2,453,000 | | | | 2,605,061 | |
Priceline Group, Inc. (The)
3.650%, 03/15/25 | | | 1,625,000 | | | | 1,721,421 | |
| | | | | | | | |
| | | | | | | 21,590,526 | |
| | | | | | | | |
| | |
Iron/Steel—0.2% | | | | | | | | |
Vale Overseas, Ltd.
6.875%, 11/10/39 | | | 7,980,000 | | | | 7,264,194 | |
| | | | | | | | |
| | |
Leisure Time—0.5% | | | | | | | | |
Gibson Brands, Inc.
8.875%, 08/01/18 (144A) (a) | | | 2,640,000 | | | | 1,465,200 | |
NCL Corp., Ltd.
4.625%, 11/15/20 (144A) | | | 2,590,000 | | | | 2,585,131 | |
5.250%, 11/15/19 (144A) | | | 6,305,000 | | | | 6,368,050 | |
See accompanying notes to financial statements.
MSF-9
Metropolitan Series Fund
Western Asset Management Strategic Bond Opportunities Portfolio
Schedule of Investments as of June 30, 2016
Corporate Bonds & Notes—(Continued)
| | | | | | | | |
| Security Description | | Principal
Amount* | | | Value | |
| | |
Leisure Time—(Continued) | | | | | | | | |
Viking Cruises, Ltd.
8.500%, 10/15/22 (144A) | | | 9,800,000 | | | $ | 8,354,500 | |
| | | | | | | | |
| | | | | | | 18,772,881 | |
| | | | | | | | |
| | |
Lodging—0.4% | | | | | | | | |
MCE Finance, Ltd.
5.000%, 02/15/21 (144A) | | | 2,450,000 | | | | 2,424,336 | |
MGM Resorts International
6.000%, 03/15/23 (a) | | | 6,592,000 | | | | 6,954,560 | |
6.625%, 12/15/21 | | | 4,180,000 | | | | 4,545,750 | |
| | | | | | | | |
| | | | | | | 13,924,646 | |
| | | | | | | | |
| |
Machinery-Construction & Mining—0.0% | | | | | |
Ormat Funding Corp.
8.250%, 12/30/20 | | | 506,834 | | | | 501,766 | |
| | | | | | | | |
| | |
Media—2.7% | | | | | | | | |
Altice Financing S.A.
6.625%, 02/15/23 (144A) | | | 5,340,000 | | | | 5,243,186 | |
7.500%, 05/15/26 (144A) | | | 5,000,000 | | | | 4,900,000 | |
CCO Holdings LLC / CCO Holdings Capital Corp.
5.375%, 05/01/25 (144A) | | | 880,000 | | | | 893,200 | |
5.875%, 04/01/24 (144A) (a) | | | 2,184,000 | | | | 2,265,900 | |
6.625%, 01/31/22 | | | 2,300,000 | | | | 2,426,500 | |
Charter Communications Operating LLC / Charter Communications Operating Capital Corp.
4.464%, 07/23/22 (144A) | | | 280,000 | | | | 300,926 | |
4.908%, 07/23/25 (144A) | | | 3,660,000 | | | | 4,001,485 | |
6.384%, 10/23/35 (144A) | | | 4,647,000 | | | | 5,502,908 | |
6.484%, 10/23/45 (144A) | | | 1,100,000 | | | | 1,313,423 | |
DISH DBS Corp.
5.000%, 03/15/23 | | | 3,247,000 | | | | 2,954,770 | |
5.875%, 07/15/22 (a) | | | 2,880,000 | | | | 2,800,800 | |
5.875%, 11/15/24 | | | 2,450,000 | | | | 2,278,500 | |
6.750%, 06/01/21 | | | 75,000 | | | | 77,719 | |
7.750%, 07/01/26 (144A) | | | 3,630,000 | | | | 3,738,900 | |
Neptune Finco Corp.
6.625%, 10/15/25 (144A) | | | 2,680,000 | | | | 2,814,000 | |
10.125%, 01/15/23 (144A) | | | 1,125,000 | | | | 1,260,000 | |
10.875%, 10/15/25 (144A) (a) | | | 6,447,000 | | | | 7,369,695 | |
Numericable-SFR S.A.
6.000%, 05/15/22 (144A) | | | 7,185,000 | | | | 6,987,412 | |
7.375%, 05/01/26 (144A) | | | 3,040,000 | | | | 3,005,800 | |
Time Warner Cable, Inc.
5.875%, 11/15/40 | | | 1,942,000 | | | | 2,114,813 | |
6.550%, 05/01/37 | | | 1,000,000 | | | | 1,165,214 | |
6.750%, 06/15/39 | | | 50,000 | | | | 58,745 | |
Unitymedia Hessen GmbH & Co. KG / Unitymedia NRW GmbH
5.500%, 01/15/23 (144A) | | | 5,975,000 | | | | 6,004,875 | |
Univision Communications, Inc.
5.125%, 02/15/25 (144A) | | | 9,890,000 | | | | 9,778,737 | |
6.750%, 09/15/22 (144A) | | | 1,400,000 | | | | 1,477,000 | |
| | |
Media—(Continued) | | | | | | | | |
UPCB Finance IV, Ltd.
5.375%, 01/15/25 (144A) | | | 2,296,000 | | | | 2,273,040 | |
Viacom, Inc.
3.875%, 04/01/24 (a) | | | 240,000 | | | | 243,768 | |
Virgin Media Finance plc
6.000%, 10/15/24 (144A) | | | 3,985,000 | | | | 3,910,281 | |
6.375%, 10/15/24 (GBP) | | | 2,510,000 | | | | 3,324,729 | |
Virgin Media Secured Finance plc
5.375%, 04/15/21 (144A) | | | 2,736,900 | | | | 2,784,796 | |
5.500%, 08/15/26 (144A) | | | 3,000,000 | | | | 2,917,500 | |
| | | | | | | | |
| | | | | | | 96,188,622 | |
| | | | | | | | |
| | |
Metal Fabricate/Hardware—0.0% | | | | | | | | |
Valmont Industries, Inc.
6.625%, 04/20/20 | | | 314,000 | | | | 355,484 | |
| | | | | | | | |
| | |
Mining—2.7% | | | | | | | | |
Alcoa, Inc.
5.125%, 10/01/24 (a) | | | 2,125,000 | | | | 2,119,687 | |
Anglo American Capital plc
2.625%, 04/03/17 (144A) | | | 850,000 | | | | 847,450 | |
2.625%, 09/27/17 (144A) | | | 3,000,000 | | | | 2,985,000 | |
Barrick Gold Corp.
4.100%, 05/01/23 (a) | | | 2,521,000 | | | | 2,659,315 | |
5.250%, 04/01/42 | | | 4,000,000 | | | | 4,082,800 | |
6.950%, 04/01/19 | | | 57,000 | | | | 63,499 | |
Barrick North America Finance LLC
4.400%, 05/30/21 | | | 400,000 | | | | 430,684 | |
5.750%, 05/01/43 (a) | | | 11,289,000 | | | | 12,258,544 | |
BHP Billiton Finance USA, Ltd.
2.875%, 02/24/22 | | | 160,000 | | | | 166,104 | |
3.250%, 11/21/21 | | | 430,000 | | | | 454,489 | |
5.000%, 09/30/43 | | | 750,000 | | | | 871,479 | |
6.250%, 10/19/75 (144A) (a) (c) | | | 2,392,000 | | | | 2,518,776 | |
6.750%, 10/19/75 (144A) (a) (c) | | | 8,191,000 | | | | 8,702,937 | |
Coeur Mining, Inc.
7.875%, 02/01/21 (a) | | | 2,126,000 | | | | 2,046,275 | |
FMG Resources Pty, Ltd.
6.875%, 04/01/22 (144A) (a) | | | 3,240,000 | | | | 3,078,000 | |
Freeport-McMoRan, Inc.
2.300%, 11/14/17 | | | 1,500,000 | | | | 1,473,750 | |
3.550%, 03/01/22 (a) | | | 5,670,000 | | | | 4,989,600 | |
3.875%, 03/15/23 (a) | | | 4,704,000 | | | | 4,116,000 | |
Glencore Finance Canada, Ltd.
4.250%, 10/25/22 (144A) | | | 788,000 | | | | 741,114 | |
Glencore Funding LLC
2.875%, 04/16/20 (144A) | | | 2,890,000 | | | | 2,716,600 | |
4.000%, 04/16/25 (144A) (a) | | | 6,580,000 | | | | 5,823,300 | |
Gold Fields Orogen Holdings BVI, Ltd.
4.875%, 10/07/20 (144A) (a) | | | 2,745,000 | | | | 2,703,825 | |
Imperial Metals Corp.
7.000%, 03/15/19 (144A) | | | 1,450,000 | | | | 1,301,375 | |
Midwest Vanadium Pty, Ltd.
11.500%, 02/15/18 (144A) (d) (e) | | | 1,000,000 | | | | 80,000 | |
Mirabela Nickel, Ltd.
1.000%, 09/10/44 (144A) (d) (f) | | | 36,053 | | | | 4 | |
See accompanying notes to financial statements.
MSF-10
Metropolitan Series Fund
Western Asset Management Strategic Bond Opportunities Portfolio
Schedule of Investments as of June 30, 2016
Corporate Bonds & Notes—(Continued)
| | | | | | | | |
| Security Description | | Principal
Amount* | | | Value | |
| | |
Mining—(Continued) | | | | | | | | |
Rio Tinto Finance USA, Ltd.
3.750%, 09/20/21 (a) | | | 130,000 | | | $ | 139,705 | |
3.750%, 06/15/25 (a) | | | 7,330,000 | | | | 7,668,067 | |
Southern Copper Corp.
5.250%, 11/08/42 | | | 12,250,000 | | | | 10,860,201 | |
Yamana Gold, Inc.
4.950%, 07/15/24 | | | 9,130,000 | | | | 8,982,094 | |
| | | | | | | | |
| | | | | | | 94,880,674 | |
| | | | | | | | |
| | |
Miscellaneous Manufacturing—0.8% | | | | | | | | |
Actuant Corp.
5.625%, 06/15/22 | | | 3,380,000 | | | | 3,447,600 | |
CBC Ammo LLC / CBC FinCo, Inc.
7.250%, 11/15/21 (144A) | | | 1,400,000 | | | | 1,183,000 | |
General Electric Co.
4.500%, 03/11/44 | | | 260,000 | | | | 300,035 | |
5.000%, 01/21/21 (c) | | | 9,740,000 | | | | 10,334,140 | |
5.300%, 02/11/21 | | | 187,000 | | | | 216,955 | |
6.875%, 01/10/39 | | | 1,258,000 | | | | 1,898,887 | |
Vista Outdoor, Inc.
5.875%, 10/01/23 (144A) | | | 9,530,000 | | | | 9,911,200 | |
| | | | | | | | |
| | | | | | | 27,291,817 | |
| | | | | | | | |
| | |
Oil & Gas—5.4% | | | | | | | | |
Anadarko Finance Co.
7.500%, 05/01/31 | | | 80,000 | | | | 95,781 | |
Anadarko Petroleum Corp.
4.500%, 07/15/44 | | | 800,000 | | | | 734,746 | |
5.550%, 03/15/26 (a) | | | 3,000,000 | | | | 3,312,840 | |
6.450%, 09/15/36 | | | 220,000 | | | | 253,465 | |
6.600%, 03/15/46 | | | 7,000,000 | | | | 8,452,535 | |
Apache Corp.
3.250%, 04/15/22 | | | 574,000 | | | | 588,008 | |
4.250%, 01/15/44 | | | 260,000 | | | | 251,691 | |
4.750%, 04/15/43 | | | 12,000,000 | | | | 12,336,804 | |
Berry Petroleum Co. LLC
6.375%, 09/15/22 (e) | | | 1,040,000 | | | | 358,800 | |
6.750%, 11/01/20 (e) | | | 850,000 | | | | 293,250 | |
BP Capital Markets plc
3.119%, 05/04/26 | | | 15,000,000 | | | | 15,321,975 | |
3.245%, 05/06/22 | | | 270,000 | | | | 283,356 | |
Carrizo Oil & Gas, Inc.
6.250%, 04/15/23 (a) | | | 2,238,000 | | | | 2,154,075 | |
7.500%, 09/15/20 (a) | | | 3,980,000 | | | | 4,029,750 | |
Chesapeake Energy Corp.
5.750%, 03/15/23 (a) | | | 2,430,000 | | | | 1,555,200 | |
6.125%, 02/15/21 | | | 7,590,000 | | | | 5,123,250 | |
6.625%, 08/15/20 | | | 6,110,000 | | | | 4,292,275 | |
Clayton Williams Energy, Inc.
7.750%, 04/01/19 (a) | | | 1,441,000 | | | | 1,087,955 | |
Concho Resources, Inc.
5.500%, 04/01/23 | | | 4,875,000 | | | | 4,887,187 | |
6.500%, 01/15/22 (a) | | | 1,400,000 | | | | 1,433,250 | |
ConocoPhillips Holding Co.
6.950%, 04/15/29 | | | 375,000 | | | | 468,026 | |
| | |
Oil & Gas—(Continued) | | | | | | | | |
Continental Resources, Inc.
4.900%, 06/01/44 | | | 597,000 | | | | 492,525 | |
5.000%, 09/15/22 (a) | | | 2,906,000 | | | | 2,840,615 | |
7.125%, 04/01/21 | | | 840,000 | | | | 867,300 | |
CrownRock L.P. / CrownRock Finance, Inc.
7.125%, 04/15/21 (144A) | | | 3,850,000 | | | | 3,946,250 | |
Devon Energy Corp.
3.250%, 05/15/22 (a) | | | 2,035,000 | | | | 1,973,533 | |
5.000%, 06/15/45 | | | 2,110,000 | | | | 1,968,360 | |
5.600%, 07/15/41 | | | 110,000 | | | | 106,280 | |
5.850%, 12/15/25 (a) | | | 970,000 | | | | 1,069,992 | |
Devon Financing Co. LLC
7.875%, 09/30/31 | | | 140,000 | | | | 162,914 | |
Ecopetrol S.A.
5.375%, 06/26/26 (a) | | | 11,570,000 | | | | 11,251,825 | |
Ensco plc
4.500%, 10/01/24 | | | 2,377,000 | | | | 1,592,590 | |
5.200%, 03/15/25 | | | 2,212,000 | | | | 1,537,340 | |
EOG Resources, Inc.
3.150%, 04/01/25 (a) | | | 1,248,000 | | | | 1,266,504 | |
4.150%, 01/15/26 (a) | | | 1,665,000 | | | | 1,822,790 | |
Exxon Mobil Corp.
4.114%, 03/01/46 (a) | | | 1,630,000 | | | | 1,838,345 | |
Hess Corp.
8.125%, 02/15/19 | | | 90,000 | | | | 100,297 | |
Kerr-McGee Corp.
6.950%, 07/01/24 | | | 290,000 | | | | 335,306 | |
7.875%, 09/15/31 | | | 285,000 | | | | 339,564 | |
MEG Energy Corp.
6.375%, 01/30/23 (144A) | | | 3,825,000 | | | | 2,830,500 | |
6.500%, 03/15/21 (144A) | | | 180,000 | | | | 139,500 | |
7.000%, 03/31/24 (144A) | | | 5,297,000 | | | | 4,078,690 | |
Newfield Exploration Co.
5.625%, 07/01/24 (a) | | | 4,116,000 | | | | 4,116,000 | |
Noble Energy, Inc.
6.000%, 03/01/41 | | | 10,200,000 | | | | 10,969,692 | |
Oasis Petroleum, Inc.
6.500%, 11/01/21 (a) | | | 6,550,000 | | | | 5,976,875 | |
Occidental Petroleum Corp.
2.700%, 02/15/23 (a) | | | 390,000 | | | | 396,520 | |
3.125%, 02/15/22 | | | 110,000 | | | | 115,286 | |
3.500%, 06/15/25 | | | 1,850,000 | | | | 1,954,939 | |
4.625%, 06/15/45 | | | 230,000 | | | | 256,482 | |
Pacific Exploration and Production Corp.
5.375%, 01/26/19 (144A) (d) | | | 710,000 | | | | 131,350 | |
Parsley Energy LLC / Parsley Finance Corp.
7.500%, 02/15/22 (144A) | | | 1,703,000 | | | | 1,775,377 | |
Petrobras Global Finance B.V.
3.000%, 01/15/19 | | | 2,216,000 | | | | 2,053,124 | |
5.375%, 01/27/21 | | | 4,720,000 | | | | 4,323,284 | |
6.850%, 06/05/15 (a) | | | 15,090,000 | | | | 11,468,400 | |
Pride International, Inc.
6.875%, 08/15/20 | | | 1,795,000 | | | | 1,713,148 | |
QEP Resources, Inc.
5.250%, 05/01/23 | | | 2,650,000 | | | | 2,438,000 | |
6.875%, 03/01/21 (a) | | | 2,130,000 | | | | 2,151,300 | |
See accompanying notes to financial statements.
MSF-11
Metropolitan Series Fund
Western Asset Management Strategic Bond Opportunities Portfolio
Schedule of Investments as of June 30, 2016
Corporate Bonds & Notes—(Continued)
| | | | | | | | |
| Security Description | | Principal
Amount* | | | Value | |
| | |
Oil & Gas—(Continued) | | | | | | | | |
Range Resources Corp.
4.875%, 05/15/25 (a) | | | 2,875,000 | | | $ | 2,738,437 | |
Rice Energy, Inc.
6.250%, 05/01/22 (a) | | | 4,218,000 | | | | 4,186,365 | |
7.250%, 05/01/23 (a) | | | 2,050,000 | | | | 2,080,750 | |
RSP Permian, Inc.
6.625%, 10/01/22 | | | 6,444,000 | | | | 6,637,320 | |
Sanchez Energy Corp.
6.125%, 01/15/23 (a) | | | 3,070,000 | | | | 2,371,575 | |
7.750%, 06/15/21 (a) | | | 3,000,000 | | | | 2,542,500 | |
Shell International Finance B.V.
2.875%, 05/10/26 (a) | | | 3,200,000 | | | | 3,251,139 | |
3.250%, 05/11/25 | | | 1,773,000 | | | | 1,860,031 | |
4.125%, 05/11/35 (a) | | | 470,000 | | | | 506,841 | |
4.550%, 08/12/43 | | | 735,000 | | | | 817,482 | |
SM Energy Co.
5.000%, 01/15/24 | | | 110,000 | | | | 94,050 | |
6.500%, 11/15/21 (a) | | | 1,725,000 | | | | 1,617,188 | |
Valero Energy Corp.
9.375%, 03/15/19 | | | 1,230,000 | | | | 1,469,878 | |
Whiting Petroleum Corp.
6.250%, 04/01/23 (a) | | | 1,755,000 | | | | 1,570,725 | |
WPX Energy, Inc.
6.000%, 01/15/22 | | | 20,000 | | | | 18,600 | |
8.250%, 08/01/23 | | | 20,000 | | | | 20,050 | |
| | | | | | | | |
| | | | | | | 189,497,947 | |
| | | | | | | | |
| | |
Oil & Gas Services—0.6% | | | | | | | | |
CGG S.A.
6.500%, 06/01/21 | | | 2,840,000 | | | | 1,249,600 | |
6.875%, 01/15/22 | | | 220,000 | | | | 95,700 | |
Freeport-McMoran Oil & Gas LLC / FCX Oil & Gas, Inc.
6.750%, 02/01/22 | | | 1,453,000 | | | | 1,424,395 | |
Globe Luxembourg SCA
9.625%, 05/01/18 (144A) | | | 4,500,000 | | | | 3,743,437 | |
Halliburton Co.
3.800%, 11/15/25 (a) | | | 1,210,000 | | | | 1,263,783 | |
4.850%, 11/15/35 | | | 2,000,000 | | | | 2,165,704 | |
5.000%, 11/15/45 | | | 8,200,000 | | | | 9,019,041 | |
KCA Deutag UK Finance plc
7.250%, 05/15/21 (144A) | | | 1,430,000 | | | | 1,072,500 | |
| | | | | | | | |
| | | | | | | 20,034,160 | |
| | | | | | | | |
| | |
Packaging & Containers—0.9% | | | | | | | | |
Ardagh Finance Holdings S.A.
8.625%, 06/15/19 (144A) (a) (b) | | | 6,590,350 | | | | 6,656,253 | |
Ardagh Packaging Finance plc / Ardagh Holdings USA, Inc.
7.000%, 11/15/20 (144A) | | | 211,765 | | | | 207,529 | |
7.250%, 05/15/24 (144A) | | | 5,000,000 | | | | 5,103,125 | |
BWAY Holding Co.
9.125%, 08/15/21 (144A) | | | 1,263,000 | | | | 1,209,323 | |
Coveris Holdings S.A.
7.875%, 11/01/19 (144A) | | | 3,190,000 | | | | 3,098,287 | |
| |
Packaging & Containers—(Continued) | | | | | |
Graphic Packaging International, Inc.
4.750%, 04/15/21 | | | 1,400,000 | | | | 1,463,868 | |
4.875%, 11/15/22 | | | 1,337,000 | | | | 1,390,480 | |
Pactiv LLC
7.950%, 12/15/25 | | | 1,300,000 | | | | 1,348,750 | |
8.375%, 04/15/27 | | | 3,180,000 | | | | 3,339,000 | |
Reynolds Group Issuer, Inc. / Reynolds Group Issuer LLC
5.125%, 07/15/23 (144A) (a) | | | 2,010,000 | | | | 2,035,125 | |
5.750%, 10/15/20 | | | 1,250,000 | | | | 1,290,625 | |
7.000%, 07/15/24 (144A) | | | 2,920,000 | | | | 3,006,140 | |
9.875%, 08/15/19 | | | 2,960,000 | | | | 3,056,200 | |
WestRock RKT Co.
4.000%, 03/01/23 (a) | | | 140,000 | | | | 146,180 | |
| | | | | | | | |
| | | | | | | 33,350,885 | |
| | | | | | | | |
| | |
Pharmaceuticals—1.1% | | | | | | | | |
Actavis Funding SCS
3.450%, 03/15/22 | | | 450,000 | | | | 467,352 | |
3.800%, 03/15/25 | | | 690,000 | | | | 718,861 | |
4.550%, 03/15/35 | | | 50,000 | | | | 51,386 | |
4.750%, 03/15/45 (a) | | | 10,220,000 | | | | 10,731,746 | |
AstraZeneca plc
3.375%, 11/16/25 | | | 2,201,000 | | | | 2,307,407 | |
Bayer U.S. Finance LLC
3.375%, 10/08/24 (144A) | | | 2,404,000 | | | | 2,498,949 | |
BioScrip, Inc.
8.875%, 02/15/21 | | | 5,342,000 | | | | 4,941,350 | |
DPx Holdings B.V.
7.500%, 02/01/22 (144A) | | | 2,030,000 | | | | 2,085,825 | |
JLL/Delta Dutch Pledgeco B.V.
8.750%, 05/01/20 (144A) (b) | | | 1,750,000 | | | | 1,750,000 | |
Mead Johnson Nutrition Co.
4.125%, 11/15/25 (a) | | | 1,653,000 | | | | 1,803,016 | |
Valeant Pharmaceuticals International, Inc.
5.875%, 05/15/23 (144A) (a) | | | 675,000 | | | | 545,063 | |
6.125%, 04/15/25 (144A) | | | 5,080,000 | | | | 4,076,700 | |
6.375%, 10/15/20 (144A) | | | 4,590,000 | | | | 3,947,400 | |
Zoetis, Inc.
3.250%, 02/01/23 | | | 1,766,000 | | | | 1,799,591 | |
| | | | | | | | |
| | | | | | | 37,724,646 | |
| | | | | | | | |
| | |
Pipelines—2.1% | | | | | | | | |
Blue Racer Midstream LLC / Blue Racer Finance Corp.
6.125%, 11/15/22 (144A) | | | 3,185,000 | | | | 3,017,788 | |
El Paso Natural Gas Co. LLC
8.375%, 06/15/32 | | | 190,000 | | | | 222,087 | |
Energy Transfer Equity L.P.
5.500%, 06/01/27 | | | 1,376,000 | | | | 1,293,440 | |
5.875%, 01/15/24 (a) | | | 1,638,000 | | | | 1,592,955 | |
Enterprise Products Operating LLC
3.700%, 02/15/26 (a) | | | 1,072,000 | | | | 1,115,585 | |
3.750%, 02/15/25 | | | 2,100,000 | | | | 2,190,266 | |
3.900%, 02/15/24 | | | 225,000 | | | | 238,130 | |
8.375%, 08/01/66 (c) | | | 1,059,000 | | | | 933,032 | |
See accompanying notes to financial statements.
MSF-12
Metropolitan Series Fund
Western Asset Management Strategic Bond Opportunities Portfolio
Schedule of Investments as of June 30, 2016
Corporate Bonds & Notes—(Continued)
| | | | | | | | |
| Security Description | | Principal
Amount* | | | Value | |
| | |
Pipelines—(Continued) | | | | | | | | |
Genesis Energy L.P. / Genesis Energy Finance Corp.
6.000%, 05/15/23 | | | 6,046,000 | | | $ | 5,653,010 | |
6.750%, 08/01/22 | | | 5,004,000 | | | | 4,853,880 | |
Hiland Partners L.P. / Hiland Partner Finance Corp.
7.250%, 10/01/20 (144A) | | | 400,000 | | | | 415,000 | |
IFM U.S. Colonial Pipeline 2 LLC
6.450%, 05/01/21 (144A) | | | 2,500,000 | | | | 2,749,005 | |
Kinder Morgan, Inc.
5.550%, 06/01/45 | | | 4,130,000 | | | | 4,196,402 | |
7.800%, 08/01/31 | | | 67,000 | | | | 75,181 | |
MPLX L.P.
4.875%, 12/01/24 (144A) | | | 6,130,000 | | | | 5,971,607 | |
5.500%, 02/15/23 (144A) (a) | | | 1,680,000 | | | | 1,706,875 | |
Plains All American Pipeline L.P. / PAA Finance Corp.
4.650%, 10/15/25 (a) | | | 2,050,000 | | | | 2,069,776 | |
Regency Energy Partners L.P. / Regency Energy Finance Corp.
5.875%, 03/01/22 | | | 780,000 | | | | 834,322 | |
Rockies Express Pipeline LLC
5.625%, 04/15/20 (144A) | | | 1,298,000 | | | | 1,301,245 | |
6.875%, 04/15/40 (144A) | | | 2,675,000 | | | | 2,547,938 | |
7.500%, 07/15/38 (144A) | | | 6,175,000 | | | | 6,082,375 | |
Sabine Pass Liquefaction LLC
5.625%, 02/01/21 | | | 2,970,000 | | | | 2,999,700 | |
5.750%, 05/15/24 | | | 2,648,000 | | | | 2,628,140 | |
Southern Natural Gas Co. LLC
5.900%, 04/01/17 (144A) | | | 10,000 | | | | 10,266 | |
8.000%, 03/01/32 | | | 25,000 | | | | 27,719 | |
Summit Midstream Holdings LLC / Summit Midstream Finance Corp.
7.500%, 07/01/21 | | | 4,020,000 | | | | 3,859,200 | |
Tesoro Logistics L.P. / Tesoro Logistics Finance Corp.
5.500%, 10/15/19 | | | 600,000 | | | | 627,000 | |
5.875%, 10/01/20 | | | 1,753,000 | | | | 1,801,208 | |
6.125%, 10/15/21 | | | 1,200,000 | | | | 1,242,000 | |
6.250%, 10/15/22 (a) | | | 1,720,000 | | | | 1,793,100 | |
Williams Cos., Inc. (The)
5.750%, 06/24/44 (a) | | | 8,465,000 | | | | 7,216,412 | |
7.500%, 01/15/31 | | | 1,495,000 | | | | 1,502,475 | |
7.750%, 06/15/31 | | | 1,563,000 | | | | 1,578,630 | |
7.875%, 09/01/21 | | | 436,000 | | | | 468,700 | |
8.750%, 03/15/32 | | | 255,000 | | | | 272,850 | |
| | | | | | | | |
| | | | | | | 75,087,299 | |
| | | | | | | | |
| | |
Real Estate—0.2% | | | | | | | | |
CBRE Services, Inc.
4.875%, 03/01/26 (a) | | | 2,404,000 | | | | 2,457,804 | |
Grainger plc
5.000%, 12/16/20 (GBP) | | | 2,550,000 | | | | 3,437,429 | |
| | | | | | | | |
| | | | | | | 5,895,233 | |
| | | | | | | | |
| | |
Real Estate Investment Trusts—0.5% | | | | | | | | |
Crown Castle International Corp.
5.250%, 01/15/23 | | | 1,850,000 | | | | 2,075,811 | |
CTR Partnership L.P. / CareTrust Capital Corp.
5.875%, 06/01/21 | | | 2,410,000 | | | | 2,410,000 | |
Digital Realty Trust L.P.
4.750%, 10/01/25 | | | 1,668,000 | | | | 1,791,424 | |
EPR Properties
4.500%, 04/01/25 (a) | | | 1,112,000 | | | | 1,102,780 | |
Equinix, Inc.
5.375%, 04/01/23 | | | 1,065,000 | | | | 1,099,613 | |
5.875%, 01/15/26 | | | 1,214,000 | | | | 1,264,836 | |
Iron Mountain, Inc.
4.375%, 06/01/21 (144A) (a) | | | 4,580,000 | | | | 4,614,350 | |
6.000%, 10/01/20 (144A) | | | 1,657,000 | | | | 1,733,636 | |
6.000%, 08/15/23 (a) | | | 560,000 | | | | 589,400 | |
| | | | | | | | |
| | | | | | | 16,681,850 | |
| | | | | | | | |
| | |
Retail—1.9% | | | | | | | | |
1011778 BC ULC / New Red Finance, Inc.
6.000%, 04/01/22 (144A) | | | 10,120,000 | | | | 10,496,363 | |
AutoZone, Inc.
2.500%, 04/15/21 | | | 800,000 | | | | 814,687 | |
CST Brands, Inc.
5.000%, 05/01/23 | | | 2,692,000 | | | | 2,732,380 | |
CVS Health Corp.
3.875%, 07/20/25 | | | 496,000 | | | | 545,589 | |
5.125%, 07/20/45 (a) | | | 1,440,000 | | | | 1,786,429 | |
Dollar Tree, Inc.
5.750%, 03/01/23 (144A) | | | 11,372,000 | | | | 12,082,750 | |
Guitar Center, Inc.
6.500%, 04/15/19 (144A) | | | 1,920,000 | | | | 1,651,200 | |
9.625%, 04/15/20 (144A) (a) | | | 1,940,000 | | | | 1,348,300 | |
L Brands, Inc.
5.625%, 02/15/22 | | | 6,100,000 | | | | 6,563,600 | |
5.625%, 10/15/23 | | | 1,330,000 | | | | 1,433,075 | |
6.625%, 04/01/21 | | �� | 3,103,000 | | | | 3,490,875 | |
6.950%, 03/01/33 | | | 8,060,000 | | | | 7,999,550 | |
7.000%, 05/01/20 | | | 1,000,000 | | | | 1,130,000 | |
McDonald’s Corp.
2.750%, 12/09/20 | | | 441,000 | | | | 460,405 | |
3.700%, 01/30/26 (a) | | | 1,047,000 | | | | 1,131,225 | |
4.600%, 05/26/45 | | | 1,259,000 | | | | 1,405,213 | |
4.875%, 12/09/45 | | | 1,102,000 | | | | 1,288,546 | |
Neiman Marcus Group, Ltd. LLC
8.000%, 10/15/21 (144A) (a) | | | 10,123,000 | | | | 8,250,245 | |
8.750%, 10/15/21 (144A) (a) (b) | | | 1,530,000 | | | | 1,162,800 | |
| | | | | | | | |
| | | | | | | 65,773,232 | |
| | | | | | | | |
|
Savings & Loans—0.1% | |
Nationwide Building Society
6.875%, 06/20/19 (GBP) (c) | | | 2,640,000 | | | | 3,283,842 | |
Washington Mutual Bank
6.875%, 06/15/11 (e) (f) | | | 6,000,000 | | | | 600 | |
| | | | | | | | |
| | | | | | | 3,284,442 | |
| | | | | | | | |
See accompanying notes to financial statements.
MSF-13
Metropolitan Series Fund
Western Asset Management Strategic Bond Opportunities Portfolio
Schedule of Investments as of June 30, 2016
Corporate Bonds & Notes—(Continued)
| | | | | | | | |
| Security Description | | Principal
Amount* | | | Value | |
|
Semiconductors—0.3% | |
Intel Corp.
4.900%, 07/29/45 | | | 4,375,000 | | | $ | 5,096,302 | |
Micron Technology, Inc.
5.250%, 01/15/24 (144A) | | | 3,740,000 | | | | 3,169,650 | |
5.625%, 01/15/26 (144A) | | | 2,820,000 | | | | 2,347,650 | |
| | | | | | | | |
| | | | | | | 10,613,602 | |
| | | | | | | | |
|
Software—0.7% | |
Activision Blizzard, Inc.
5.625%, 09/15/21 (144A) | | | 6,230,000 | | | | 6,518,137 | |
6.125%, 09/15/23 (144A) | | | 2,327,000 | | | | 2,530,613 | |
First Data Corp.
5.750%, 01/15/24 (144A) | | | 1,468,000 | | | | 1,456,990 | |
7.000%, 12/01/23 (144A) | | | 3,759,000 | | | | 3,805,988 | |
Microsoft Corp.
2.375%, 02/12/22 | | | 3,932,000 | | | | 4,057,969 | |
4.000%, 02/12/55 | | | 2,845,000 | | | | 2,869,000 | |
Oracle Corp.
4.375%, 05/15/55 | | | 2,590,000 | | | | 2,720,518 | |
| | | | | | | | |
| | | | | | | 23,959,215 | |
| | | | | | | | |
|
Telecommunications—3.1% | |
AT&T, Inc.
3.950%, 01/15/25 | | | 4,723,000 | | | | 5,020,285 | |
4.125%, 02/17/26 | | | 2,771,000 | | | | 2,976,702 | |
4.750%, 05/15/46 | | | 1,250,000 | | | | 1,281,091 | |
4.800%, 06/15/44 | | | 5,000,000 | | | | 5,133,055 | |
Bharti Airtel International Netherlands B.V.
5.350%, 05/20/24 | | | 9,810,000 | | | | 10,841,875 | |
CenturyLink, Inc.
5.625%, 04/01/20 (a) | | | 690,000 | | | | 715,875 | |
5.625%, 04/01/25 | | | 1,670,000 | | | | 1,486,300 | |
5.800%, 03/15/22 | | | 520,000 | | | | 504,889 | |
6.450%, 06/15/21 | | | 1,175,000 | | | | 1,194,094 | |
6.750%, 12/01/23 | | | 1,290,000 | | | | 1,267,425 | |
CommScope, Inc.
5.500%, 06/15/24 (144A) (a) | | | 2,200,000 | | | | 2,233,000 | |
Digicel Group, Ltd.
8.250%, 09/30/20 (144A) | | | 2,135,000 | | | | 1,782,725 | |
Digicel, Ltd.
7.000%, 02/15/20 (144A) | | | 2,600,000 | | | | 2,405,000 | |
Frontier Communications Corp.
8.875%, 09/15/20 | | | 50,000 | | | | 53,375 | |
11.000%, 09/15/25 | | | 5,757,000 | | | | 5,958,495 | |
HC2 Holdings, Inc.
11.000%, 12/01/19 (144A) | | | 4,350,000 | | | | 3,936,750 | |
Sprint Communications, Inc.
9.000%, 11/15/18 (144A) | | | 4,500,000 | | | | 4,792,500 | |
11.500%, 11/15/21 | | | 7,763,000 | | | | 7,669,844 | |
Sprint Corp.
7.625%, 02/15/25 (a) | | | 1,790,000 | | | | 1,416,337 | |
7.875%, 09/15/23 (a) | | | 8,000,000 | | | | 6,540,000 | |
T-Mobile USA, Inc.
6.500%, 01/15/24 | | | 803,000 | | | | 845,157 | |
6.542%, 04/28/20 | | | 900,000 | | | | 928,125 | |
|
Telecommunications—(Continued) | |
T-Mobile USA, Inc.
6.625%, 11/15/20 | | | 875,000 | | | | 902,344 | |
6.633%, 04/28/21 (a) | | | 3,425,000 | | | | 3,579,125 | |
6.836%, 04/28/23 (a) | | | 228,000 | | | | 240,825 | |
Telefonica Europe B.V.
6.750%, 11/26/20 (GBP) (c) | | | 2,400,000 | | | | 3,242,924 | |
Verizon Communications, Inc.
4.862%, 08/21/46 | | | 70,000 | | | | 76,516 | |
5.012%, 08/21/54 | | | 1,582,000 | | | | 1,673,047 | |
5.150%, 09/15/23 | | | 1,790,000 | | | | 2,084,681 | |
6.550%, 09/15/43 | | | 6,778,000 | | | | 9,132,582 | |
West Corp.
5.375%, 07/15/22 (144A) | | | 13,564,000 | | | | 12,614,520 | |
Windstream Services LLC
6.375%, 08/01/23 (a) | | | 265,000 | | | | 222,600 | |
7.750%, 10/15/20 (a) | | | 5,925,000 | | | | 5,806,500 | |
| | | | | | | | |
| | | | | | | 108,558,563 | |
| | | | | | | | |
|
Transportation—0.6% | |
FedEx Corp.
4.550%, 04/01/46 | | | 1,650,000 | | | | 1,790,407 | |
Florida East Coast Holdings Corp.
6.750%, 05/01/19 (144A) | | | 9,865,000 | | | | 9,815,675 | |
9.750%, 05/01/20 (144A) | | | 872,000 | | | | 741,200 | |
Navios Maritime Acquisition Corp. / Navios Acquisition Finance U.S., Inc.
8.125%, 11/15/21 (144A) | | | 4,670,000 | | | | 3,665,950 | |
XPO Logistics, Inc.
6.500%, 06/15/22 (144A) (a) | | | 5,520,000 | | | | 5,264,700 | |
7.875%, 09/01/19 (144A) (a) | | | 1,594,000 | | | | 1,625,880 | |
| | | | | | | | |
| | | | | | | 22,903,812 | |
| | | | | | | | |
|
Trucking & Leasing—0.1% | |
Penske Truck Leasing Co. L.P. / PTL Finance Corp.
3.375%, 02/01/22 (144A) (a) | | | 3,495,000 | | | | 3,564,177 | |
| | | | | | | | |
|
Water—0.1% | |
Anglian Water Osprey Financing plc
5.000%, 04/30/23 (GBP) | | | 2,650,000 | | | | 3,571,909 | |
| | | | | | | | |
Total Corporate Bonds & Notes
(Cost $1,819,991,439) | | | | | | | 1,839,528,205 | |
| | | | | | | | |
|
| U.S. Treasury & Government Agencies—15.3% | |
|
Agency Sponsored Mortgage-Backed—1.1% | |
Fannie Mae 15 Yr. Pool
4.000%, 07/01/18 | | | 50,037 | | | | 51,818 | |
4.000%, 08/01/18 | | | 62,635 | | | | 64,869 | |
4.000%, 03/01/19 | | | 72,650 | | | | 75,249 | |
5.000%, 12/01/21 | | | 22,679 | | | | 24,304 | |
5.500%, 12/01/16 | | | 706 | | | | 711 | |
6.500%, 12/01/16 | | | 952 | | | | 956 | |
6.500%, 01/01/17 | | | 572 | | | | 576 | |
See accompanying notes to financial statements.
MSF-14
Metropolitan Series Fund
Western Asset Management Strategic Bond Opportunities Portfolio
Schedule of Investments as of June 30, 2016
U.S. Treasury & Government Agencies—(Continued)
| | | | | | | | |
| Security Description | | Principal
Amount* | | | Value | |
|
Agency Sponsored Mortgage-Backed—(Continued) | |
Fannie Mae 20 Yr. Pool
8.500%, 08/01/19 | | | 8,636 | | | $ | 9,081 | |
Fannie Mae 30 Yr. Pool
4.500%, 05/01/39 | | | 2,421,917 | | | | 2,696,210 | |
4.500%, 08/01/40 | | | 7,017,170 | | | | 7,683,148 | |
4.500%, 05/01/41 | | | 4,753,077 | | | | 5,209,848 | |
4.500%, 11/01/43 | | | 3,975,540 | | | | 4,347,198 | |
5.000%, 01/01/39 | | | 482,781 | | | | 535,663 | |
5.000%, 06/01/40 | | | 254,684 | | | | 283,564 | |
5.000%, 07/01/40 | | | 194,085 | | | | 216,137 | |
6.000%, 07/01/38 | | | 31,032 | | | | 35,528 | |
6.500%, 08/01/31 | | | 1,324 | | | | 1,524 | |
6.500%, 03/01/32 | | | 13,650 | | | | 15,708 | |
6.500%, 12/01/36 | | | 1,773 | | | | 2,186 | |
6.500%, 06/01/37 | | | 34,372 | | | | 40,292 | |
6.500%, 10/01/37 | | | 32,150 | | | | 38,005 | |
7.000%, 05/01/26 | | | 1,415 | | | | 1,515 | |
7.000%, 07/01/30 | | | 281 | | | | 289 | |
7.000%, 01/01/31 | | | 422 | | | | 484 | |
7.000%, 07/01/31 | | | 1,650 | | | | 1,823 | |
7.000%, 09/01/31 | | | 3,894 | | | | 4,417 | |
7.000%, 10/01/31 | | | 3,391 | | | | 3,987 | |
7.000%, 11/01/31 | | | 24,629 | | | | 26,358 | |
7.000%, 01/01/32 | | | 5,970 | | | | 6,150 | |
7.000%, 02/01/32 | | | 4,601 | | | | 4,790 | |
7.500%, 12/01/29 | | | 496 | | | | 508 | |
7.500%, 01/01/30 | | | 597 | | | | 746 | |
7.500%, 02/01/30 | | | 348 | | | | 353 | |
7.500%, 06/01/30 | | | 563 | | | | 566 | |
7.500%, 08/01/30 | | | 90 | | | | 92 | |
7.500%, 09/01/30 | | | 833 | | | | 983 | |
7.500%, 10/01/30 | | | 93 | | | | 106 | |
7.500%, 11/01/30 | | | 10,581 | | | | 11,285 | |
7.500%, 02/01/31 | | | 3,764 | | | | 3,887 | |
8.000%, 08/01/27 | | | 1,237 | | | | 1,409 | |
8.000%, 07/01/30 | | | 733 | | | | 843 | |
8.000%, 09/01/30 | | | 417 | | | | 444 | |
Fannie Mae REMICS (CMO)
0.803%, 05/25/34 (c) | | | 165,212 | | | | 164,877 | |
4.500%, 06/25/29 | | | 375,673 | | | | 405,880 | |
9.750%, 11/25/18 | | | 145,473 | | | | 155,385 | |
9.750%, 08/25/19 | | | 48,046 | | | | 51,299 | |
Freddie Mac 30 Yr. Gold Pool
3.000%, 11/01/42 | | | 2,713,383 | | | | 2,842,987 | |
6.000%, 12/01/36 | | | 25,337 | | | | 29,078 | |
6.000%, 02/01/37 | | | 34,077 | | | | 38,755 | |
7.000%, 03/01/39 | | | 186,463 | | | | 215,368 | |
Freddie Mac ARM Non-Gold Pool
2.247%, 02/01/37 (c) | | | 27,147 | | | | 28,316 | |
2.247%, 05/01/37 (c) | | | 52,677 | | | | 54,380 | |
2.333%, 03/01/37 (c) | | | 108,392 | | | | 113,140 | |
2.382%, 04/01/37 (c) | | | 51,837 | | | | 54,036 | |
2.535%, 01/01/38 (c) | | | 29,710 | | | | 31,456 | |
2.814%, 02/01/36 (c) | | | 46,804 | | | | 49,387 | |
2.995%, 05/01/37 (c) | | | 70,735 | | | | 75,407 | |
|
Agency Sponsored Mortgage-Backed—(Continued) | |
Freddie Mac Multifamily Structured Pass-Through Certificates
1.375%, 08/25/42 (c) (g) | | | 70,400,000 | | | | 4,512,908 | |
Freddie Mac REMICS (CMO)
1,156.500%, 06/15/21 (g) | | | 6 | | | | 68 | |
Ginnie Mae I 30 Yr. Pool
5.000%, 04/15/35 | | | 12,754 | | | | 14,498 | |
5.500%, 01/15/34 | | | 66,847 | | | | 76,882 | |
5.500%, 04/15/34 | | | 22,563 | | | | 25,921 | |
5.500%, 07/15/34 | | | 119,850 | | | | 137,953 | |
5.500%, 10/15/34 | | | 111,522 | | | | 127,762 | |
5.750%, 10/15/38 | | | 101,040 | | | | 115,459 | |
6.000%, 02/15/33 | | | 2,122 | | | | 2,486 | |
6.000%, 03/15/33 | | | 8,988 | | | | 10,497 | |
6.000%, 06/15/33 | | | 5,919 | | | | 6,916 | |
6.000%, 07/15/33 | | | 8,672 | | | | 10,207 | |
6.000%, 09/15/33 | | | 6,967 | | | | 7,976 | |
6.000%, 10/15/33 | | | 3,862 | | | | 4,527 | |
6.000%, 08/15/34 | | | 31,959 | | | | 36,534 | |
6.500%, 03/15/29 | | | 3,776 | | | | 4,315 | |
6.500%, 02/15/32 | | | 1,248 | | | | 1,473 | |
6.500%, 03/15/32 | | | 1,270 | | | | 1,527 | |
6.500%, 11/15/32 | | | 4,659 | | | | 5,422 | |
7.000%, 03/15/31 | | | 323 | | | | 368 | |
Ginnie Mae II 30 Yr. Pool
3.500%, 03/20/45 | | | 455,266 | | | | 483,887 | |
3.500%, 03/20/46 | | | 542,485 | | | | 584,071 | |
5.000%, 08/20/34 | | | 86,201 | | | | 95,961 | |
5.500%, 03/20/34 | | | 10,435 | | | | 12,000 | |
6.000%, 05/20/32 | | | 14,617 | | | | 17,268 | |
6.000%, 11/20/33 | | | 17,330 | | | | 20,483 | |
Ginnie Mae II ARM Pool
2.020%, 01/20/60 (c) | | | 778,362 | | | | 797,437 | |
2.396%, 05/20/60 (c) | | | 660,109 | | | | 683,245 | |
Government National Mortgage Association (CMO)
0.965%, 04/16/52 (c) (g) | | | 17,606,749 | | | | 652,342 | |
1.052%, 09/16/56 (c) (g) | | | 20,027,175 | | | | 1,533,245 | |
1.060%, 03/16/47 (c) (g) | | | 11,901,988 | | | | 465,218 | |
3.000%, 04/20/41 | | | 898,089 | | | | 935,393 | |
| | | | | | | | |
| | | | | | | 37,097,610 | |
| | | | | | | | |
|
Federal Agencies—0.1% | |
Tennessee Valley Authority
5.250%, 09/15/39 | | | 400,000 | | | | 548,179 | |
5.980%, 04/01/36 | | | 1,760,000 | | | | 2,563,370 | |
| | | | | | | | |
| | | | | | | 3,111,549 | |
| | | | | | | | |
|
U.S. Treasury—14.1% | |
U.S. Treasury Bonds
2.500%, 02/15/46 (a) | | | 29,780,000 | | | | 31,009,586 | |
2.500%, 05/15/46 | | | 12,060,000 | | | | 12,567,364 | |
4.500%, 02/15/36 (a) | | | 23,250,000 | | | | 33,489,091 | |
See accompanying notes to financial statements.
MSF-15
Metropolitan Series Fund
Western Asset Management Strategic Bond Opportunities Portfolio
Schedule of Investments as of June 30, 2016
U.S. Treasury & Government Agencies—(Continued)
| | | | | | | | |
| Security Description | | Principal
Amount* | | | Value | |
|
U.S. Treasury—(Continued) | |
U.S. Treasury Floating Rate Notes
0.337%, 07/31/17 (c) | | | 50,000,000 | | | $ | 50,001,900 | |
0.428%, 10/31/17 (c) | | | 50,000,000 | | | | 50,033,350 | |
0.532%, 01/31/18 (c) | | | 50,000,000 | | | | 50,094,650 | |
U.S. Treasury Inflation Indexed Bonds | | | | | | | | |
0.750%, 02/15/45 (h) | | | 21,496,232 | | | | 21,587,763 | |
1.000%, 02/15/46 (h) | | | 11,030,099 | | | | 11,907,907 | |
U.S. Treasury Notes
0.750%, 10/31/17 (a) | | | 30,000,000 | | | | 30,072,660 | |
0.750%, 02/28/18 (a) | | | 30,000,000 | | | | 30,082,020 | |
0.875%, 03/31/18 (a) | | | 40,000,000 | | | | 40,195,320 | |
1.375%, 01/31/21 (a) | | | 50,210,000 | | | | 51,098,466 | |
1.500%, 08/31/18 | | | 220,000 | | | | 224,151 | |
1.500%, 03/31/23 (a) | | | 51,000,000 | | | | 51,735,114 | |
1.625%, 02/15/26 (a) | | | 30,000,000 | | | | 30,337,500 | |
1.625%, 05/15/26 (a) | | | 4,585,000 | | | | 4,641,061 | |
2.375%, 08/15/24 | | | 10,000 | | | | 10,764 | |
| | | | | | | | |
| | | | | | | 499,088,667 | |
| | | | | | | | |
Total U.S. Treasury & Government Agencies
(Cost $529,244,065) | | | | | | | 539,297,826 | |
| | | | | | | | |
|
| Foreign Government—14.2% | |
|
Regional Government—0.1% | |
Japan Finance Organization for Municipalities
4.000%, 01/13/21 | | | 1,900,000 | | | | 2,088,227 | |
| | | | | | �� | | |
|
Sovereign—14.1% | |
Abu Dhabi Government International Bond
3.125%, 05/03/26 (144A) | | | 17,360,000 | | | | 17,882,883 | |
Argentine Republic Government International Bonds
6.875%, 04/22/21 (144A) | | | 2,150,000 | | | | 2,292,975 | |
7.500%, 04/22/26 (144A) | | | 49,610,000 | | | | 53,628,410 | |
7.625%, 04/22/46 (144A) (a) | | | 1,170,000 | | | | 1,263,600 | |
Bahamas Government International Bond
5.750%, 01/16/24 (144A) | | | 1,500,000 | | | | 1,567,500 | |
Bermuda Government International Bond
4.138%, 01/03/23 (144A) | | | 2,000,000 | | | | 2,065,000 | |
Brazil Notas do Tesouro Nacional
10.000%, 01/01/21 (BRL) | | | 25,000,000 | | | | 7,224,290 | |
10.000%, 01/01/23 (BRL) | | | 110,000,000 | | | | 31,191,760 | |
Brazilian Government International Bond
6.000%, 04/07/26 (a) | | | 52,100,000 | | | | 56,528,500 | |
Hungary Government International Bond
5.750%, 11/22/23 | | | 31,214,000 | | | | 35,534,018 | |
Indonesia Government International Bonds
4.750%, 01/08/26 (a) | | | 23,000,000 | | | | 25,044,033 | |
5.125%, 01/15/45 | | | 3,000,000 | | | | 3,182,814 | |
5.250%, 01/17/42 | | | 41,590,000 | | | | 44,112,059 | |
Kazakhstan Government International Bond
5.125%, 07/21/25 | | | 33,880,000 | | | | 37,102,666 | |
|
Sovereign—(Continued) | |
Mexico Government International Bonds
4.125%, 01/21/26 (a) | | | 8,170,000 | | | | 8,856,280 | |
4.750%, 03/08/44 | | | 62,260,000 | | | | 67,085,150 | |
Peruvian Government International Bond
4.125%, 08/25/27 (a) | | | 33,400,000 | | | | 36,656,500 | |
Poland Government International Bonds
3.250%, 04/06/26 (a) | | | 33,000,000 | | | | 33,641,388 | |
4.000%, 01/22/24 | | | 19,410,000 | | | | 20,962,800 | |
Portugal Government International Bond
5.125%, 10/15/24 (144A) | | | 14,000,000 | | | | 13,995,940 | |
| | | | | | | | |
| | | | | | | 499,818,566 | |
| | | | | | | | |
Total Foreign Government
(Cost $475,255,001) | | | | | | | 501,906,793 | |
| | | | | | | | |
|
| Mortgage-Backed Securities—10.7% | |
|
Collateralized Mortgage Obligations—5.6% | |
Alternative Loan Trust
1.093%, 07/25/35 (c) | | | 1,300,000 | | | | 1,196,269 | |
American Home Mortgage Assets Trust
0.643%, 12/25/46 (c) | | | 3,742,522 | | | | 2,353,380 | |
American Home Mortgage Investment Trust
1.033%, 11/25/45 (c) | | | 684,285 | | | | 567,467 | |
Banc of America Funding Trust
0.618%, 05/20/36 (c) | | | 340,365 | | | | 323,967 | |
0.698%, 03/27/36 (144A) (c) | | | 6,447,145 | | | | 3,406,738 | |
Banc of America Mortgage Trust
2.764%, 12/25/34 (c) | | | 9,144 | | | | 8,861 | |
2.872%, 09/25/35 (c) | | | 152,638 | | | | 139,416 | |
5.750%, 01/25/35 | | | 353,443 | | | | 358,491 | |
BCAP LLC Trust
0.656%, 10/28/36 (144A) (c) | | | 3,884,197 | | | | 3,702,548 | |
3.143%, 05/26/47 (144A) (c) | | | 8,091,767 | | | | 5,477,536 | |
Bear Stearns ALT-A Trust
1.203%, 01/25/35 (c) | | | 1,515,000 | | | | 1,286,932 | |
Bear Stearns Asset-Backed Securities Trust
31.651%, 07/25/36 (c) | | | 827,942 | | | | 1,402,643 | |
Citigroup Mortgage Loan Trust, Inc.
3.089%, 12/25/35 (c) | | | 2,019,360 | | | | 1,776,697 | |
CitiMortgage Alternative Loan Trust
33.234%, 07/25/37 (c) | | | 2,031,040 | | | | 3,699,529 | |
Countrywide Alternative Loan Trust
0.678%, 07/20/35 (c) | | | 2,053,578 | | | | 1,710,294 | |
0.723%, 01/25/36 (c) | | | 332,075 | | | | 269,728 | |
5.750%, 01/25/37 | | | 3,568,309 | | | | 2,669,936 | |
6.000%, 01/25/37 | | | 3,657,002 | | | | 2,920,775 | |
15.943%, 06/25/35 (c) | | | 2,422,393 | | | | 3,066,630 | |
21.440%, 02/25/36 (c) | | | 2,296,656 | | | | 2,895,206 | |
26.787%, 07/25/36 (c) | | | 4,010,049 | | | | 5,876,576 | |
36.280%, 08/25/37 (c) | | | 2,007,313 | | | | 3,832,771 | |
Countrywide Alternative Loan Trust Resecuritization
6.000%, 08/25/37 | | | 8,795,389 | | | | 6,464,128 | |
See accompanying notes to financial statements.
MSF-16
Metropolitan Series Fund
Western Asset Management Strategic Bond Opportunities Portfolio
Schedule of Investments as of June 30, 2016
Mortgage-Backed Securities—(Continued)
| | | | | | | | |
| Security Description | | Principal
Amount* | | | Value | |
|
Collateralized Mortgage Obligations—(Continued) | |
Countrywide Home Loan Reperforming Loan REMIC Trust
0.813%, 03/25/35 (144A) (c) | | | 763,881 | | | $ | 667,544 | |
0.873%, 11/25/34 (144A) (c) | | | 82,077 | | | | 69,110 | |
5.704%, 03/25/35 (144A) (c) (g) | | | 9,410,951 | | | | 1,447,877 | |
Credit Suisse Mortgage Trust
0.646%, 06/27/46 (144A) (c) | | | 3,726,373 | | | | 3,525,810 | |
4.500%, 06/27/36 (144A) | | | 2,026,064 | | | | 2,047,387 | |
28.032%, 02/25/36 (c) | | | 2,253,094 | | | | 3,482,505 | |
DSLA Mortgage Loan Trust
0.658%, 03/19/45 (c) | | | 192,025 | | | | 170,752 | |
1.330%, 03/19/46 (c) | | | 1,536,515 | | | | 1,176,285 | |
Fannie Mae Connecticut Avenue Securities
3.453%, 07/25/24 (c) | | | 5,470,000 | | | | 5,154,932 | |
5.703%, 10/25/23 (c) | | | 2,780,000 | | | | 2,943,232 | |
Freddie Mac Structured Agency Credit Risk Debt Notes
4.953%, 02/25/24 (c) | | | 2,210,000 | | | | 2,258,218 | |
5.103%, 10/25/28 (c) | | | 12,940,000 | | | | 12,618,478 | |
5.203%, 10/25/24 (c) | | | 5,925,000 | | | | 6,060,208 | |
GreenPoint MTA Trust
0.893%, 06/25/45 (c) | | | 1,844,302 | | | | 1,595,893 | |
GS Mortgage Securities Corp.
1.286%, 06/26/36 (144A) (c) | | | 7,760,000 | | | | 5,105,060 | |
GSMPS Mortgage Loan Trust
0.853%, 04/25/36 (144A) (c) | | | 996,003 | | | | 816,791 | |
GSR Mortgage Loan Trust
3.132%, 10/25/35 (c) | | | 423,356 | | | | 366,680 | |
HarborView Mortgage Loan Trust
0.698%, 01/19/36 (c) | | | 1,180,411 | | | | 795,385 | |
1.248%, 11/19/34 (c) | | | 2,155,401 | | | | 1,896,567 | |
1.453%, 10/25/37 (c) | | | 2,055,067 | | | | 1,746,050 | |
Impac CMB Trust
1.093%, 09/25/34 (c) | | | 820,271 | | | | 773,168 | |
Impac Secured Assets CMN Owner Trust
0.773%, 03/25/36 (c) | | | 1,080,648 | | | | 772,772 | |
IndyMac INDX Mortgage Loan Trust
1.173%, 01/25/35 (c) | | | 1,334,641 | | | | 1,007,054 | |
2.971%, 03/25/35 (c) | | | 620,992 | | | | 593,703 | |
3.113%, 05/25/37 (c) | | | 4,725,086 | | | | 3,748,453 | |
JPMorgan Mortgage Trust
2.500%, 03/25/43 (144A) (c) | | | 19,547 | | | | 19,807 | |
6.500%, 01/25/36 | | | 130,180 | | | | 106,658 | |
JPMorgan Resecuritization Trust
0.656%, 07/27/46 (144A) (c) | | | 5,413,983 | | | | 5,028,295 | |
Lehman Mortgage Trust
6.177%, 02/25/37 (c) (g) | | | 9,894,282 | | | | 3,794,213 | |
Lehman XS Trust
0.606%, 03/25/47 (c) | | | 4,093,631 | | | | 3,394,080 | |
0.653%, 08/25/46 (c) | | | 3,257,578 | | | | 2,590,942 | |
Luminent Mortgage Trust
0.643%, 05/25/46 (c) | | | 1,429,953 | | | | 1,070,106 | |
MASTR Adjustable Rate Mortgages Trust
2.904%, 11/25/35 (144A) (c) | | | 75,315 | | | | 56,723 | |
MASTR Seasoned Securitization Trust
3.418%, 10/25/32 (c) | | | 184,211 | | | | 178,687 | |
|
Collateralized Mortgage Obligations—(Continued) | |
Merrill Lynch Mortgage Investors Trust
2.820%, 08/25/33 (c) | | | 1,098,560 | | | | 1,021,549 | |
3.185%, 05/25/34 (c) | | | 116,609 | | | | 115,223 | |
Morgan Stanley Mortgage Loan Trust
0.773%, 01/25/35 (c) | | | 1,184,153 | | | | 1,091,899 | |
Nomura Resecuritization Trust
0.616%, 07/26/37 (144A) (c) | | | 2,986,898 | | | | 2,865,406 | |
0.636%, 05/26/46 (144A) (c) | | | 17,785,312 | | | | 10,195,213 | |
0.706%, 02/26/46 (144A) (c) | | | 4,868,000 | | | | 3,952,560 | |
NovaStar Mortgage Funding Trust
0.636%, 09/25/46 (c) | | | 1,126,472 | | | | 910,932 | |
Prime Mortgage Trust
5.500%, 05/25/35 (144A) | | | 1,308,540 | | | | 1,309,989 | |
6.000%, 05/25/35 (144A) | | | 2,988,327 | | | | 2,862,297 | |
RBSGC Mortgage Loan Trust
0.903%, 01/25/37 (c) | | | 1,061,632 | | | | 612,607 | |
Residential Accredit Loans, Inc. Trust
0.643%, 05/25/47 (c) | | | 1,737,822 | | | | 1,347,511 | |
0.663%, 04/25/46 (c) | | | 1,867,422 | | | | 810,224 | |
0.713%, 04/25/46 (c) | | | 968,938 | | | | 427,194 | |
1.655%, 11/25/37 (c) | | | 5,634,091 | | | | 3,729,468 | |
Residential Asset Securitization Trust
5.750%, 02/25/36 | | | 2,947,852 | | | | 2,736,214 | |
6.097%, 12/25/36 (c) (g) | | | 15,479,660 | | | | 5,919,427 | |
Sequoia Mortgage Trust
1.611%, 06/20/33 (c) | | | 161,550 | | | | 156,185 | |
3.729%, 07/25/45 (144A) (c) | | | 10,748 | | | | 10,578 | |
Structured Adjustable Rate Mortgage Loan Trust
1.957%, 09/25/37 (c) | | | 5,439,078 | | | | 4,489,066 | |
2.921%, 01/25/35 (c) | | | 799,371 | | | | 754,263 | |
3.082%, 09/25/35 (c) | | | 1,063,895 | | | | 873,744 | |
3.295%, 03/25/34 (c) | | | 126,587 | | | | 125,143 | |
Structured Asset Mortgage Investments Trust
0.663%, 05/25/46 (c) | | | 277,709 | | | | 191,511 | |
0.733%, 02/25/36 (c) | | | 5,134,218 | | | | 4,164,770 | |
2.782%, 08/25/35 (c) | | | 96,231 | | | | 91,238 | |
Structured Asset Securities Corp. Trust
0.803%, 03/25/35 (c) | | | 2,249,316 | | | | 1,676,921 | |
WaMu Mortgage Pass-Through Certificates Trust
0.723%, 12/25/45 (c) | | | 894,869 | | | | 823,328 | |
0.743%, 07/25/45 (c) | | | 25,653 | | | | 23,991 | |
1.220%, 07/25/47 (c) | | | 156,272 | | | | 40,820 | |
1.928%, 03/25/47 (c) | | | 2,940,781 | | | | 2,324,060 | |
2.420%, 09/25/36 (c) | | | 1,204,811 | | | | 1,068,095 | |
2.490%, 08/25/33 (c) | | | 2,285,399 | | | | 2,195,307 | |
2.596%, 10/25/34 (c) | | | 996,479 | | | | 999,743 | |
6.227%, 04/25/37 (c) (g) | | | 14,719,429 | | | | 4,518,525 | |
Wells Fargo Mortgage-Backed Securities Trust
2.866%, 04/25/36 (c) | | | 127,754 | | | | 124,225 | |
2.912%, 06/25/35 (c) | | | 76,864 | | | | 78,144 | |
2.954%, 10/25/35 (c) | | | 89,029 | | | | 89,590 | |
| | | | | | | | |
| | | | | | | 197,212,903 | |
| | | | | | | | |
See accompanying notes to financial statements.
MSF-17
Metropolitan Series Fund
Western Asset Management Strategic Bond Opportunities Portfolio
Schedule of Investments as of June 30, 2016
Mortgage-Backed Securities—(Continued)
| | | | | | | | |
| Security Description | | Principal
Amount* | | | Value | |
|
Commercial Mortgage-Backed Securities—5.1% | |
A10 Securitization LLC
2.400%, 11/15/25 (144A) | | | 14,776 | | | $ | 14,773 | |
BAMLL Mezzanine Securities Trust
8.922%, 12/15/19 (144A) (c) | | | 5,700,000 | | | | 5,377,443 | |
Bayview Commercial Asset Trust | | | | | | | | |
Zero Coupon, 07/25/37 (144A) (d) (g) | | | 4,198,993 | | | | 0 | |
Bear Stearns Commercial Mortgage Securities Trust
6.404%, 06/11/50 (c) | | | 1,040,000 | | | | 1,004,084 | |
BLCP Hotel Trust
6.170%, 08/15/29 (144A) (c) | | | 6,414,136 | | | | 6,113,326 | |
CD Mortgage Trust
5.506%, 01/15/46 (c) | | | 1,038 | | | | 1,036 | |
Citigroup Commercial Mortgage Trust
3.110%, 04/10/48 (144A) | | | 1,400,000 | | | | 933,776 | |
3.208%, 07/10/47 (144A) (c) | | | 4,398,000 | | | | 2,637,839 | |
3.386%, 09/15/27 (144A) (c) | | | 7,250,000 | | | | 6,547,816 | |
6.345%, 12/10/49 (c) | | | 9,063,000 | | | | 6,669,824 | |
Commercial Mortgage Pass-Through Certificates Mortgage Trust
3.000%, 12/10/47 (144A) | | | 2,230,000 | | | | 1,365,318 | |
4.492%, 03/10/46 (144A) (c) | | | 2,710,000 | | | | 1,720,823 | |
4.591%, 07/10/50 (c) | | | 1,726,000 | | | | 1,267,742 | |
4.699%, 08/10/48 (144A) (c) | | | 5,800,000 | | | | 3,081,114 | |
Credit Suisse Commercial Mortgage Trust
4.373%, 09/15/37 (144A) | | | 3,920,000 | | | | 3,257,647 | |
5.373%, 12/15/39 | | | 1,490,209 | | | | 1,322,317 | |
6.296%, 06/15/38 (c) | | | 9,595,189 | | | | 6,784,306 | |
9.168%, 03/15/17 (144A) | | | 6,400,000 | | | | 6,204,800 | |
Credit Suisse European Mortgage Capital, Ltd.
7.165%, 07/20/22 (144A) (EUR) (c) | | | 870,316 | | | | 941,704 | |
DBUBS Mortgage Trust
3.750%, 08/10/44 (144A) | | | 5,180,000 | | | | 3,130,429 | |
FREMF Mortgage Trust
3.703%, 06/25/21 (144A) (c) | | | 1,253,643 | | | | 1,243,623 | |
4.453%, 09/25/22 (144A) (c) | | | 5,738,844 | | | | 5,330,681 | |
GE Business Loan Trust
0.862%, 05/15/34 (144A) (c) | | | 864,228 | | | | 729,105 | |
GE Commercial Mortgage Corp. Trust
5.677%, 12/10/49 (c) | | | 240,000 | | | | 153,036 | |
GMAC Commercial Mortgage Securities, Inc.
5.349%, 11/10/45 (c) | | | 2,210,000 | | | | 2,153,898 | |
GS Mortgage Securities Trust
5.622%, 11/10/39 | | | 3,095,143 | | | | 2,545,755 | |
5.988%, 08/10/45 (c) | | | 15,370,000 | | | | 6,300,769 | |
JPMorgan Chase Commercial Mortgage Securities Trust
3.742%, 08/15/27 (144A) (c) | | | 460,000 | | | | 452,435 | |
4.042%, 06/15/29 (144A) (c) | | | 3,540,000 | | | | 3,380,130 | |
5.386%, 05/15/47 (c) | | | 2,280,000 | | | | 1,799,650 | |
5.411%, 05/15/47 | | | 2,120,000 | | | | 1,704,904 | |
5.502%, 06/12/47 (c) | | | 3,070,000 | | | | 2,792,380 | |
5.503%, 01/15/49 (c) | | | 7,680,000 | | | | 3,455,201 | |
|
Commercial Mortgage-Backed Securities—(Continued) | |
JPMorgan Chase Commercial Mortgage Securities Trust
5.623%, 05/12/45 | | | 730,000 | | | | 721,291 | |
6.203%, 02/15/51 (c) | | | 1,350,000 | | | | 1,278,570 | |
6.667%, 10/15/19 (144A) (c) | | | 9,900,000 | | | | 9,608,931 | |
6.670%, 06/15/29 (144A) (c) | | | 2,000,000 | | | | 1,960,891 | |
LB-UBS Commercial Mortgage Trust
6.449%, 09/15/45 (c) | | | 1,100,000 | | | | 950,336 | |
Lone Star Portfolio Trust
7.342%, 09/15/28 (144A) (c) | | | 5,545,947 | | | | 5,262,311 | |
7.500%, 09/15/20 | | | 5,483,998 | | | | 5,171,807 | |
ML-CFC Commercial Mortgage Trust
5.450%, 08/12/48 (144A) (c) | | | 200,000 | | | | 178,779 | |
5.450%, 08/12/48 (c) | | | 1,518,000 | | | | 1,355,434 | |
6.193%, 09/12/49 (c) | | | 3,473,000 | | | | 2,813,344 | |
6.222%, 09/12/49 (c) | | | 5,780,000 | | | | 4,704,384 | |
Morgan Stanley Bank of America Merrill Lynch Trust
4.680%, 10/15/48 (144A) (c) | | | 9,534,000 | | | | 6,000,156 | |
Morgan Stanley Capital Trust
5.399%, 12/15/43 | | | 3,561,053 | | | | 2,791,118 | |
6.102%, 06/11/49 (c) | | | 5,560,000 | | | | 5,223,768 | |
Multifamily Trust
1.039%, 04/25/46 (144A) (c) | | | 18,150,811 | | | | 19,832,048 | |
PFP III, Ltd.
4.542%, 06/14/31 (144A) (c) | | | 1,280,000 | | | | 1,279,674 | |
Resource Capital Corp. Ltd.
2.596%, 12/15/28 (144A) (c) | | | 59,282 | | | | 59,285 | |
UBS-Barclays Commercial Mortgage Trust
5.000%, 05/10/63 (144A) (c) | | | 4,530,000 | | | | 2,459,831 | |
Wachovia Bank Commercial Mortgage Trust
0.646%, 12/15/43 (144A) (c) | | | 646,000 | | | | 621,676 | |
5.789%, 01/15/45 (144A) (c) | | | 6,466,500 | | | | 6,282,812 | |
Waterfall Commercial Mortgage Trust
4.104%, 09/14/22 (144A) (c) | | | 6,530,937 | | | | 6,277,916 | |
WF-RBS Commercial Mortgage Trust
3.016%, 11/15/47 (144A) | | | 4,441,004 | | | | 2,134,472 | |
3.250%, 06/15/46 (144A) | | | 8,240,000 | | | | 5,090,661 | |
| | | | | | | | |
| | | | | | | 182,477,179 | |
| | | | | | | | |
Total Mortgage-Backed Securities
(Cost $390,796,750) | | | | | | | 379,690,082 | |
| | | | | | | | |
|
| Asset-Backed Securities—2.4% | |
|
Asset-Backed - Automobile—0.0% | |
Hertz Vehicle Financing II L.P.
3.520%, 03/25/21 (144A) | | | 1,300,000 | | | | 1,319,640 | |
| | | | | | | | |
|
Asset-Backed - Home Equity—0.2% | |
Asset-Backed Securities Corp. Home Equity Loan Trust
3.292%, 04/15/33 (c) | | | 10,957 | | | | 10,571 | |
Bear Stearns Asset-Backed Securities Trust
1.193%, 01/25/34 (c) | | | 23,985 | | | | 23,054 | |
See accompanying notes to financial statements.
MSF-18
Metropolitan Series Fund
Western Asset Management Strategic Bond Opportunities Portfolio
Schedule of Investments as of June 30, 2016
Asset-Backed Securities—(Continued)
| | | | | | | | |
| Security Description | |
Principal
Amount* | | | Value | |
|
Asset-Backed - Home Equity—(Continued) | |
EMC Mortgage Loan Trust
0.896%, 05/25/43 (144A) (c) | | | 702,121 | | | $ | 683,108 | |
1.096%, 05/25/43 (144A) (c) | | | 7,660,000 | | | | 6,257,124 | |
1.153%, 01/25/41 (144A) (c) | | | 31,243 | | | | 30,905 | |
Structured Asset Securities Corp. Mortgage Loan Trust
0.673%, 02/25/36 (144A) (c) | | | 2,673,211 | | | | 185,114 | |
| | | | | | | | |
| | | | | | | 7,189,876 | |
| | | | | | | | |
|
Asset-Backed - Manufactured Housing—0.5% | |
Conseco Financial Corp.
7.030%, 07/15/28 | | | 7,169,551 | | | | 6,907,025 | |
Greenpoint Manufactured Housing
3.076%, 03/18/29 (c) | | | 450,000 | | | | 387,034 | |
3.713%, 06/19/29 (c) | | | 375,000 | | | | 326,250 | |
3.943%, 02/20/30 (c) | | | 350,000 | | | | 304,500 | |
Manufactured Housing Contract Trust Pass-Through Certificates
3.934%, 03/13/32 (c) | | | 450,000 | | | | 396,177 | |
3.938%, 02/20/32 (c) | | | 250,000 | | | | 220,202 | |
Mid-State Trust VI
7.340%, 07/01/35 | | | 217,101 | | | | 230,375 | |
Origen Manufactured Housing Contract Trust
2.291%, 04/15/37 (c) | | | 1,639,808 | | | | 1,369,466 | |
2.379%, 10/15/37 (c) | | | 1,840,546 | | | | 1,564,374 | |
UCFC Manufactured Housing Contract
7.095%, 04/15/29 (c) | | | 4,850,000 | | | | 4,811,303 | |
| | | | | | | | |
| | | | | | | 16,516,706 | |
| | | | | | | | |
| | |
Asset-Backed - Other—1.1% | | | | | | | | |
Amortizing Residential Collateral Trust
2.253%, 08/25/32 (c) | | | 44,941 | | | | 39,594 | |
Applebee’s Funding LLC / IHOP Funding LLC
4.277%, 09/05/44 (144A) | | | 1,900,000 | | | | 1,933,772 | |
Bear Stearns Asset-Backed Securities Trust
6.000%, 10/25/36 | | | 2,104,466 | | | | 1,557,474 | |
Countrywide Asset-Backed Certificates Trust
2.328%, 06/25/34 (c) | | | 162,843 | | | | 149,303 | |
Countrywide Revolving Home Equity Loan Resecuritization Trust
0.742%, 12/15/33 (144A) (c) | | | 242,468 | | | | 200,000 | |
Countrywide Revolving Home Equity Loan Trust
0.582%, 07/15/36 (c) | | | 526,684 | | | | 449,448 | |
Encore Credit Receivables Trust
1.488%, 10/25/35 (c) | | | 2,327,806 | | | | 1,411,747 | |
First Horizon Asset-Backed Trust
0.613%, 10/25/34 (c) | | | 48,011 | | | | 43,645 | |
GSAMP Trust
0.653%, 01/25/36 (c) | | | 102,109 | | | | 17,058 | |
GSRPM Mortgage Loan Trust
0.753%, 03/25/35 (144A) (c) | | | 604,572 | | | | 593,868 | |
| | |
Asset-Backed - Other—(Continued) | | | | | | | | |
Home Equity Mortgage Loan Asset-Backed Notes
0.623%, 04/25/36 (c) | | | 166,909 | | | | 117,658 | |
HSI Asset Securitization Corp. Trust
0.873%, 11/25/35 (c) | | | 4,000,000 | | | | 3,387,586 | |
Long Beach Mortgage Loan Trust
0.968%, 01/21/31 (c) | | | 22,022 | | | | 20,657 | |
Magnus Dritte Immobilienbesitz und Verwaltungs 1 GmbH
7.250%, 07/01/24 (144A) (EUR) | | | 4,171,000 | | | | 4,619,549 | |
Magnus Relda Holding Vier GmbH
7.000%, 10/28/24 (144A) (EUR) | | | 5,820,000 | | | | 6,449,490 | |
Oaktree CLO, Ltd.
6.234%, 10/20/27 (144A) (c) | | | 7,050,000 | | | | 5,682,970 | |
Residential Asset Mortgage Products Trust
0.803%, 07/25/36 (c) | | | 5,665,000 | | | | 3,566,846 | |
SACO I Trust
0.713%, 06/25/36 (c) | | | 403,674 | | | | 716,154 | |
0.793%, 03/25/36 (c) | | | 104,178 | | | | 170,280 | |
Sofi Consumer Loan Program
3.280%, 09/15/23 (144A) | | | 7,788,241 | | | | 7,635,545 | |
| | | | | | | | |
| | | | | | | 38,762,644 | |
| | | | | | | | |
|
Asset-Backed - Student Loan—0.6% | |
DRB Prime Student Loan Trust
3.170%, 07/25/31 (144A) | | | 4,928,103 | | | | 4,997,062 | |
National Collegiate Student Loan Trust
0.723%, 03/26/29 (c) | | | 2,250,000 | | | | 2,039,959 | |
1.303%, 03/25/38 (c) | | | 8,590,396 | | | | 4,369,035 | |
Nelnet Student Loan Trust
Zero Coupon, 03/22/32 (c) | | | 6,200,000 | | | | 5,768,096 | |
Northstar Education Finance, Inc.
1.273%, 10/30/45 (c) | | | 100,000 | | | | 69,969 | |
SoFi Professional Loan Program LLC
Zero Coupon, 08/25/36 (144A) | | | 500 | | | | 2,906,250 | |
| | | | | | | | |
| | | | | | | 20,150,371 | |
| | | | | | | | |
Total Asset-Backed Securities
(Cost $87,814,391) | | | | | | | 83,939,237 | |
| | | | | | | | |
|
| Investment Company Security—0.7% | |
PowerShares Senior Loan Portfolio (a)
(Cost $23,017,750) | | | 1,000,000 | | | | 22,970,000 | |
| | | | | | | | |
|
| Floating Rate Loans (i)—0.3% | |
|
Electric—0.2% | |
Energy Future Intermediate Holding Co. LLC
Term Loan, 4.250%, 12/19/16 | | | 6,240,991 | | | | 6,239,044 | |
| | | | | | | | |
|
Entertainment—0.0% | |
Six Flags Theme Parks, Inc.
Term Loan B, 3.251%, 06/30/22 | | | 55,593 | | | | 55,676 | |
| | | | | | | | |
See accompanying notes to financial statements.
MSF-19
Metropolitan Series Fund
Western Asset Management Strategic Bond Opportunities Portfolio
Schedule of Investments as of June 30, 2016
Floating Rate Loans (i)—(Continued)
| | | | | | | | |
| Security Description | | Shares/
Principal
Amount* | | | Value | |
| | |
Oil & Gas—0.1% | | | | | | | | |
Ascent Resources - Utica LLC
2nd Lien Term Loan, 07/01/19 (j) | | | 6,744 | | | $ | 1,855 | |
Hercules Offshore LLC
Exit Term Loan, 10.500%, 05/06/20 | | | 2,785,444 | | | | 2,725,092 | |
| | | | | | | | |
| | | | 2,726,947 | |
| | | | | | | | |
| | |
Retail—0.0% | | | | | | | | |
CWGS Group LLC
Term Loan, 5.750%, 02/20/20 | | | 1,100,266 | | | | 1,090,638 | |
| | | | | | | | |
| | |
Software—0.0% | | | | | | | | |
First Data Corp.
Extended Term Loan, 4.452%, 03/24/21 | | | 845,511 | | | | 844,137 | |
| | | | | | | | |
Total Floating Rate Loans
(Cost $10,873,953) | | | | | | | 10,956,442 | |
| | | | | | | | |
| | |
| Municipals—0.3% | | | | | | | | |
Brazos River Harbor, TX Navigation District Revenue Bonds Dow Chemical Co. Project
5.950%, 05/15/33 | | | 3,360,000 | | | | 3,698,957 | |
JobsOhio Beverage System
4.532%, 01/01/35 | | | 760,000 | | | | 905,844 | |
Massachusetts State Development Finance Agency Revenue Board Institute, Inc.
5.375%, 04/01/41 | | | 400,000 | | | | 467,008 | |
Port Authority of New York & New Jersey
4.458%, 10/01/62 | | | 460,000 | | | | 524,667 | |
Texas Brazos Harbor Industrial Development Corp., Environmental Facilities Revenue Dow Chemical Project.
5.900%, 05/01/38 (c) | | | 1,505,000 | | | | 1,619,425 | |
Texas Municipal Gas Acquisition & Supply Corp. III
5.000%, 12/15/30 | | | 750,000 | | | | 867,187 | |
5.000%, 12/15/31 | | | 1,550,000 | | | | 1,787,181 | |
Virginia Housing Development Authority
6.000%, 06/25/34 | | | 861,839 | | | | 914,178 | |
| | | | | | | | |
Total Municipals
(Cost $9,599,459) | | | | | | | 10,784,447 | |
| | | | | | | | |
|
| Convertible Preferred Stock—0.2% | |
| | |
Banks—0.2% | | | | | | | | |
Wells Fargo & Co., Series L
7.500%
(Cost $5,598,292) | | | 4,965 | | | | 6,450,528 | |
| | | | | | | | |
| Preferred Stocks—0.1% | | | | | | | | |
| Security Description | | Shares/
Notional
Amount* | | | Value | |
| | |
Air Freight & Logistics—0.0% | | | | | | | | |
CEVA Group plc - Series A2 (k) | | | 864 | | | | 302,302 | |
| | | | | | | | |
| | |
Banks—0.1% | | | | | | | | |
Citigroup Capital, 7.008% (c) | | | 66,710 | | | | 1,739,130 | |
GMAC Capital Trust, 6.411% (c) | | | 56,000 | | | | 1,389,920 | |
| | | | | | | | |
| | | | | | | 3,129,050 | |
| | | | | | | | |
| | |
Telecommunications—0.0% | | | | | | | | |
Qwest Corp., 7.375% (a) | | | 44,901 | | | | 1,195,264 | |
| | | | | | | | |
Total Preferred Stocks
(Cost $5,599,994) | | | | | | | 4,626,616 | |
| | | | | | | | |
|
| Purchased Options—0.1% | |
| | |
Credit Default Swaptions—0.0% | | | | | | | | |
Call - CDX.NA.HY.26, Exercise Price $103.00, Expires 07/20/16 (Counterparty - BNP Paribas) | | | 100,000,000 | | | | 556,431 | |
Put - CDX.NA.HY.26, Exercise Price $100.00, Expires 07/20/16 (Counterparty - Credit Suisse International) | | | 200,000,000 | | | | 209,920 | |
Put - CDX.NA.HY.26, Exercise Price $100.00, Expires 08/17/16 (Counterparty - Credit Suisse International) | | | 125,000,000 | | | | 557,074 | |
Put - CDX.NA.HY.26, Exercise Price $95.00, Expires 08/17/16 (Counterparty - Credit Suisse International) | | | 162,680,000 | | | | 108,545 | |
Put - CDX.NA.HY.26, Exercise Price $95.00, Expires 08/17/16 (Counterparty - JPMorgan Chase Bank N.A.) | | | 92,130,000 | | | | 61,471 | |
Put - CDX.NA.HY.26, Exercise Price $98.00, Expires 07/20/16 (Counterparty - BNP Paribas) | | | 100,000,000 | | | | 42,578 | |
Put - CDX.NA.HY.26, Exercise Price $98.00, Expires 08/17/16 (Counterparty - Credit Suisse International) | | | 17,650,000 | | | | 38,909 | |
Put - CDX.NA.HY.26, Exercise Price $98.00, Expires 08/17/16 (Counterparty - Deutsche Bank AG) | | | 17,970,000 | | | | 39,614 | |
| | | | | | | | |
| | | | | | | 1,614,542 | |
| | | | | | | | |
| | |
Currency Options—0.0% | | | | | | | | |
USD Call/CAD Put, Strike Price CAD 1.485,
Expires 07/27/16 (Counterparty - Barclays Bank plc) | | | 32,400,000 | | | | 3,240 | |
USD Call/JPY Put, Strike Price JPY 110.90,
Expires 09/06/16 (Counterparty - Bank of America N.A.) | | | 36,500,000 | | | | 69,825 | |
| | | | | | | | |
| | | | | | | 73,065 | |
| | | | | | | | |
See accompanying notes to financial statements.
MSF-20
Metropolitan Series Fund
Western Asset Management Strategic Bond Opportunities Portfolio
Schedule of Investments as of June 30, 2016
Purchased Options—(Continued)
| | | | | | | | |
| Security Description | | Shares/
Principal/
Notional
Amount* | | | Value | |
| | |
Interest Rate Swaptions—0.0% | | | | | | | | |
Call - OTC - 1 Yr. Interest Rate Swap,
Exercise Rate 0.53%, Expires 08/14/16 (Counterparty - Bank of America N.A.) | | | 1,803,760,000 | | | $ | 82,197 | |
| | | | | | | | |
|
Options on Exchange-Traded Futures Contracts—0.1% | |
Call - U.S. Treasury Note 10-Year Futures @132.00, Expires 07/22/16 | | | 2,000 | | | | 2,500,000 | |
| | | | | | | | |
Total Purchased Options
(Cost $5,494,961) | | | | | | | 4,269,804 | |
| | | | | | | | |
|
| Convertible Bonds—0.1% | |
|
Energy-Alternate Sources—0.0% | |
LDK Solar Co., Ltd.
5.535%, 12/31/18 (b) (e) | | | 341,970 | | | | 41,036 | |
| | | | | | | | |
| | |
Internet—0.1% | | | | | | | | |
FireEye, Inc.
1.625%, 06/01/35 | | | 1,500,000 | | | | 1,322,813 | |
| | | | | | | | |
| | |
Mining—0.0% | | | | | | | | |
Mirabela Nickel, Ltd.
9.500%, 06/24/19 (144A) (b) (d) | | | 1,420,687 | | | | 426,206 | |
| | | | | | | | |
| | |
Semiconductors—0.0% | | | | | | | | |
Inphi Corp.
1.125%, 12/01/20 (144A) | | | 1,100,000 | | | | 1,165,313 | |
| | | | | | | | |
Total Convertible Bonds
(Cost $3,681,820) | | | | | | | 2,955,368 | |
| | | | | | | | |
| | |
| Common Stocks—0.0% | | | | | | | | |
| | |
Air Freight & Logistics—0.0% | | | | | | | | |
CEVA Group plc (k) | | | 399 | | | | 139,650 | |
| | | | | | | | |
| |
Diversified Consumer Services—0.0% | | | | | |
Ascent CNR Corp. - Class A (k) | | | 1,399,556 | | | | 27,991 | |
| | | | | | | | |
| |
Energy Equipment & Services—0.0% | | | | | |
Hercules Offshore, Inc. (a) (l) | | | 10,611 | | | | 14,749 | |
| | | | | | | | |
| | |
Household Durables—0.0% | | | | | | | | |
Desarrolladora Homex S.A.B. de C.V. (l) | | | 220,114 | | | | 21,190 | |
| | | | | | | | |
| | |
Marine—0.0% | | | | | | | | |
Deep Ocean Group Holding A/S (f) (k) | | | 44,744 | | | | 242,557 | |
| | | | | | | | |
| | |
Media—0.0% | | | | | | | | |
Cengage Learning, Inc. | | | 10,995 | | | | 252,885 | |
ION Media Networks, Inc. (f) (k) | | | 785 | | | | 508,900 | |
| | | | | | | | |
| | | | | | | 761,785 | |
| | | | | | | | |
| | |
Metals & Mining—0.0% | | | | | | | | |
Mirabela Nickel, Ltd. (f) (k) (l) | | | 7,827,755 | | | $ | 58,380 | |
| | | | | | | | |
Total Common Stocks
(Cost $4,989,032) | | | | | | | 1,266,302 | |
| | | | | | | | |
| | |
| Warrant—0.0% | | | | | | | | |
| | |
Sovereign—0.0% | | | | | | | | |
Venezuela Government Oil-Linked Payment Obligation, Expires 04/15/20 (l)
(Cost $0) | | | 1,700 | | | | 1,700 | |
| | | | | | | | |
| | |
| Escrow Shares—0.0% | | | | | | | | |
|
Forest Products & Paper—0.0% | |
Sino-Forest Corp. (f) (k) | | | 1,246,000 | | | | 0 | |
Sino-Forest Corp. (f) (k) | | | 500,000 | | | | 0 | |
| | | | | | | | |
Total Escrow Shares
(Cost $0) | | | | | | | 0 | |
| | | | | | | | |
|
| Short-Term Investments—8.1% | |
| | |
Mutual Fund—7.7% | | | | | | | | |
State Street Navigator Securities Lending MET Portfolio (m) | | | 271,649,503 | | | | 271,649,503 | |
| | | | | | | | |
|
Repurchase Agreements—0.4% | |
Fixed Income Clearing Corp.
Repurchase Agreement dated 06/30/16 at 0.030% to be repurchased at $4,711,346 on 07/01/16, collateralized by $4,695,000 U.S. Treasury Notes with rates ranging from 0.125% - 1.375%, maturity dates ranging from 02/29/20 - 04/15/20, with a value of $4,805,738. | | | 4,711,342 | | | | 4,711,342 | |
RBS Securities, Inc.
Repurchase Agreement dated 06/30/16 at 0.320% to be repurchased at $11,100,099 on 07/01/16 collateralized by $9,775,000 U.S. Treasury Bond at 3.000% due 11/15/45 with a value $11,239,725. | | | 11,100,000 | | | | 11,100,000 | |
| | | | | | | | |
| | | | | | | 15,811,342 | |
| | | | | | | | |
Total Short-Term Investments
(Cost $287,460,845) | | | | | | | 287,460,845 | |
| | | | | | | | |
Total Investments—104.6%
(Cost $3,659,417,752) (n) | | | | | | | 3,696,104,195 | |
Other assets and liabilities (net)—(4.6)% | | | | | | | (162,683,007 | ) |
| | | | | | | | |
| Net Assets—100.0% | | | | | | $ | 3,533,421,188 | |
| | | | | | | | |
See accompanying notes to financial statements.
MSF-21
Metropolitan Series Fund
Western Asset Management Strategic Bond Opportunities Portfolio
Schedule of Investments as of June 30, 2016
| * | Principal and notional amounts stated in U.S. dollars unless otherwise noted. |
| (a) | All or a portion of the security was held on loan. As of June 30, 2016, the market value of securities loaned was $508,211,971 and the collateral received consisted of cash in the amount of $271,649,503 and non-cash collateral with a value of $253,517,373. The cash collateral is invested in a money market fund managed by an affiliate of the custodian. The non-cash collateral received consists primarily of government securities and bank letters of credit, and is held for the benefit of the Portfolio at the Portfolio’s custodian. The Portfolio cannot repledge or resell this collateral. As such, this collateral is excluded from the Statement of Assets and Liabilities. |
| (b) | Payment-in-kind security for which part of the income earned may be paid as additional principal. |
| (c) | Variable or floating rate security. The stated rate represents the rate at June 30, 2016. Maturity date shown for callable securities reflects the earliest possible call date. |
| (d) | Restricted securities are not registered under the Securities Act of 1933 and are subject to legal restrictions on resale. These securities generally may be resold in transactions exempt from registration or to the public if the securities are subsequently registered. Disposal of these securities may involve time-consuming negotiations and prompt sale at an acceptable price may be difficult. As of June 30, 2016, the market value of restricted securities was $5,795,511, which is 0.2% of net assets. See details shown in the Restricted Securities table that follows. |
| (e) | Non-income producing; security is in default and/or issuer is in bankruptcy. |
| (f) | Security was valued in good faith under procedures approved by the Board of Trustees. As of June 30, 2016, these securities represent less than 0.05% of net assets. |
| (g) | Interest only security. |
| (h) | Principal amount of security is adjusted for inflation. |
| (i) | Floating rate loans (Senior Loans) often require prepayments from excess cash flows or permit the borrowers to repay at their election. The degree to which borrowers repay, whether as a contractual requirement or at their election, cannot be predicted with accuracy. As a result, the actual remaining maturity may be substantially less than the stated maturities shown. However, Senior Loans will have an expected average life of approximately two to four years. The stated interest rate represents the weighted average interest rate of all contracts within the senior loan facility and includes commitment fees on unfunded loan commitments, if any. Senior Loans typically have rates of interest which are determined either daily, monthly, quarterly or semi-annually by reference to a base lending rate, plus a premium. These base rates are primarily the London Interbank Offered Rate (“LIBOR”) and secondarily, the prime rate offered by one or more major United States banks (the “Prime Rate”) and the certificate of deposit (“CD”) rate or other base lending rates used by commercial lenders. |
| (j) | This loan will settle after June 30, 2016, at which time the interest rate will be determined. |
| (k) | Illiquid security. As of June 30, 2016, these securities represent 0.0% of net assets. |
| (l) | Non-income producing security. |
| (m) | Represents investment of cash collateral received from securities on loan as of June 30, 2016. |
| (n) | As of June 30, 2016, the aggregate cost of investments was $3,659,417,752. The aggregate unrealized appreciation and depreciation of investments were $117,656,298 and $(80,969,855), respectively, resulting in net unrealized appreciation of $36,686,443. |
| (144A)— | Securities exempt from registration under Rule 144A of the Securities Act of 1933. These securities may be resold in transactions exempt from registration, normally to qualified institutional buyers. As of June 30, 2016, the market value of 144A securities was $895,406,467, which is 25.3% of net assets. |
| (ARM)— | Adjustable-Rate Mortgage |
| (CDX.NA.HY)— | Markit North America High Yield CDS Index |
| (CDS)— | Credit Default Swap |
| (CLO)— | Collateralized Loan Obligation |
| (CMO)— | Collateralized Mortgage Obligation |
| (REMIC)— | Real Estate Mortgage Investment Conduit |
| | | | | | | | | | | | | | | | |
Restricted Securities | | Acquisition Date | | | Principal
Amount | | | Cost | | | Value | |
Alta Wind Holdings LLC, 7.000%, 06/30/35 | | | 07/14/10 | | | $ | 1,539,668 | | | $ | 1,539,668 | | | $ | 1,585,763 | |
Bayview Commercial Asset Trust, Zero Coupon, 07/25/37 | | | 11/23/10 | | | | 4,198,993 | | | | 400,217 | | | | 0 | |
Compiler Finance Sub, Inc., 7.000%, 05/01/21 | | | 05/02/13 | | | | 990,000 | | | | 960,394 | | | | 415,800 | |
Midwest Vanadium Pty, Ltd., 11.500%, 02/15/18 | | | 05/05/11—05/24/11 | | | | 1,000,000 | | | | 1,031,250 | | | | 80,000 | |
Mirabela Nickel, Ltd., 9.500%, 06/24/19 | | | 06/06/14—06/30/14 | | | | 1,420,687 | | | | 1,420,687 | | | | 426,206 | |
Mirabela Nickel, Ltd., 1.000%, 09/10/44 | | | 09/10/14 | | | | 36,053 | | | | 32,518 | | | | 4 | |
NSG Holdings LLC / NSG Holdings, Inc., 7.750%, 12/15/25 | | | 01/25/13 | | | | 2,802,397 | | | | 2,963,480 | | | | 2,998,565 | |
Pacific Exploration and Production Corp., 5.375%, 01/26/19 | | | 11/18/13 | | | | 710,000 | | | | 709,937 | | | $ | 131,350 | |
Scotia Bank Peru DPR Finance Co., 3.403%, 03/15/17 | | | 02/18/10 | | | | 157,895 | | | | 157,895 | | | | 157,823 | |
| | | | | | | | | | | | | | | | |
| | | | | | | | | | | | | | $ | 5,795,511 | |
| | | | | | | | | | | | | | | | |
See accompanying notes to financial statements.
MSF-22
Metropolitan Series Fund
Western Asset Management Strategic Bond Opportunities Portfolio
Schedule of Investments as of June 30, 2016
Forward Foreign Currency Exchange Contracts
| | | | | | | | | | | | | | | | | | | | | | |
Contracts to Buy | | | Counterparty | | Settlement
Date | | | In Exchange
for | | | Unrealized
Appreciation/
(Depreciation) | |
| AUD | | | 27,040,000 | | | Barclays Bank plc | | | 07/14/16 | | | | USD | | | | 20,269,995 | | | $ | (110,436 | ) |
| AUD | | | 47,790,000 | | | Citibank N.A. | | | 07/14/16 | | | | USD | | | | 36,406,422 | | | | (776,787 | ) |
| BRL | | | 62,020,000 | | | Barclays Bank plc | | | 07/14/16 | | | | USD | | | | 17,348,252 | | | | 1,906,140 | |
| CAD | | | 26,616,328 | | | Citibank N.A. | | | 07/14/16 | | | | USD | | | | 20,387,218 | | | | 215,250 | |
| CAD | | | 3,933,781 | | | Citibank N.A. | | | 08/12/16 | | | | USD | | | | 3,067,599 | | | | (22,361 | ) |
| CAD | | | 69,960,000 | | | JPMorgan Chase Bank N.A. | | | 07/14/16 | | | | USD | | | | 53,884,232 | | | | 268,566 | |
| CAD | | | 3,903,827 | | | JPMorgan Chase Bank N.A. | | | 08/12/16 | | | | USD | | | | 2,971,991 | | | | 50,058 | |
| EUR | | | 43,583,996 | | | Bank of America N.A. | | | 07/14/16 | | | | USD | | | | 49,717,572 | | | | (1,335,279 | ) |
| EUR | | | 15,153,947 | | | Barclays Bank plc | | | 07/14/16 | | | | USD | | | | 17,260,724 | | | | (438,433 | ) |
| EUR | | | 32,370,000 | | | Citibank N.A. | | | 07/14/16 | | | | USD | | | | 35,906,422 | | | | 27,291 | |
| EUR | | | 266,340 | | | Citibank N.A. | | | 08/12/16 | | | | USD | | | | 305,141 | | | | (9,164 | ) |
| EUR | | | 394,509 | | | Citibank N.A. | | | 08/12/16 | | | | USD | | | | 443,273 | | | | (4,867 | ) |
| EUR | | | 756,888 | | | Citibank N.A. | | | 08/12/16 | | | | USD | | | | 863,651 | | | | (22,542 | ) |
| GBP | | | 31,020,000 | | | Barclays Bank plc | | | 07/14/16 | | | | USD | | | | 41,381,611 | | | | (84,184 | ) |
| GBP | | | 14,780,000 | | | Citibank N.A. | | | 07/14/16 | | | | USD | | | | 21,673,096 | | | | (1,996,244 | ) |
| GBP | | | 2,000,000 | | | Bank of America N.A. | | | 08/12/16 | | | | USD | | | | 2,828,360 | | | | (164,975 | ) |
| GBP | | | 41,460,000 | | | Barclays Bank plc | | | 08/12/16 | | | | USD | | | | 59,172,210 | | | | (3,960,235 | ) |
| GBP | | | 410,000 | | | Citibank N.A. | | | 08/12/16 | | | | USD | | | | 595,846 | | | | (49,852 | ) |
| GBP | | | 1,905,129 | | | Citibank N.A. | | | 08/12/16 | | | | USD | | | | 2,748,144 | | | | (211,099 | ) |
| ILS | | | 73,570,000 | | | Citibank N.A. | | | 07/14/16 | | | | USD | | | | 19,533,760 | | | | (468,379 | ) |
| ILS | | | 127,400,000 | | | Citibank N.A. | | | 07/14/16 | | | | USD | | | | 34,007,795 | | | | (992,578 | ) |
| INR | | | 1,790,140,000 | | | Citibank N.A. | | | 07/14/16 | | | | USD | | | | 26,684,654 | | | | (203,701 | ) |
| INR | | | 2,878,750,000 | | | Citibank N.A. | | | 07/14/16 | | | | USD | | | | 42,610,272 | | | | (25,869 | ) |
| JPY | | | 905,500,000 | | | Barclays Bank plc | | | 07/14/16 | | | | USD | | | | 8,485,575 | | | | 285,449 | |
| JPY | | | 2,117,430,000 | | | Barclays Bank plc | | | 07/14/16 | | | | USD | | | | 19,207,979 | | | | 1,302,270 | |
| JPY | | | 3,625,160,000 | | | Barclays Bank plc | | | 07/14/16 | | | | USD | | | | 34,098,197 | | | | 1,016,511 | |
| JPY | | | 5,738,660,000 | | | Barclays Bank plc | | | 07/14/16 | | | | USD | | | | 52,323,277 | | | | 3,263,612 | |
| JPY | | | 18,503,266 | | | Citibank N.A. | | | 07/14/16 | | | | USD | | | | 175,011 | | | | 4,218 | |
| KRW | | | 22,469,060,000 | | | Citibank N.A. | | | 07/14/16 | | | | USD | | | | 19,582,587 | | | | (77,856 | ) |
| NOK | | | 273,580,000 | | | Barclays Bank plc | | | 07/14/16 | | | | USD | | | | 33,168,851 | | | | (478,463 | ) |
| RUB | | | 339,200,000 | | | Citibank N.A. | | | 07/14/16 | | | | USD | | | | 5,000,000 | | | | 291,732 | |
| RUB | | | 934,670,000 | | | Citibank N.A. | | | 07/14/16 | | | | USD | | | | 13,583,345 | | | | 998,090 | |
| RUB | | | 1,010,000,000 | | | Citibank N.A. | | | 07/14/16 | | | | USD | | | | 15,003,706 | | | | 752,924 | |
| SGD | | | 28,350,000 | | | Barclays Bank plc | | | 07/14/16 | | | | USD | | | | 20,852,795 | | | | 191,385 | |
| ZAR | | | 197,540,000 | | | Barclays Bank plc | | | 07/14/16 | | | | USD | | | | 13,398,020 | | | | (9,815 | ) |
| | | | | |
Contracts to Deliver | | | | | | | | | | | | | | | |
| AUD | | | 2,750,085 | | | Citibank N.A. | | | 07/14/16 | | | | USD | | | | 2,086,187 | | | | 35,873 | |
| AUD | | | 2,638,001 | | | Citibank N.A. | | | 07/14/16 | | | | USD | | | | 1,896,340 | | | | (70,410 | ) |
| AUD | | | 1,246,001 | | | Citibank N.A. | | | 07/14/16 | | | | USD | | | | 911,753 | | | | (17,198 | ) |
| AUD | | | 1,228,001 | | | Citibank N.A. | | | 07/14/16 | | | | USD | | | | 885,174 | | | | (30,357 | ) |
| AUD | | | 1,156,001 | | | Citibank N.A. | | | 07/14/16 | | | | USD | | | | 834,858 | | | | (26,994 | ) |
| AUD | | | 922,215 | | | Citibank N.A. | | | 07/14/16 | | | | USD | | | | 677,894 | | | | (9,660 | ) |
| AUD | | | 830,001 | | | Citibank N.A. | | | 07/14/16 | | | | USD | | | | 602,878 | | | | (15,926 | ) |
| AUD | | | 298,001 | | | Citibank N.A. | | | 07/14/16 | | | | USD | | | | 218,405 | | | | (3,769 | ) |
| BRL | | | 100,200,000 | | | Barclays Bank plc | | | 07/14/16 | | | | USD | | | | 28,393,313 | | | | (2,714,234 | ) |
| BRL | | | 102,047,677 | | | JPMorgan Chase Bank N.A. | | | 07/14/16 | | | | USD | | | | 28,154,967 | | | | (3,526,200 | ) |
| CAD | | | 17,050,000 | | | Citibank N.A. | | | 07/14/16 | | | | USD | | | | 13,613,731 | | | | 416,115 | |
| CAD | | | 2,195,001 | | | Citibank N.A. | | | 08/12/16 | | | | USD | | | | 1,708,013 | | | | 8,808 | |
| CAD | | | 756,755 | | | Citibank N.A. | | | 08/12/16 | | | | USD | | | | 590,013 | | | | 4,191 | |
| CAD | | | 533,001 | | | Citibank N.A. | | | 08/12/16 | | | | USD | | | | 412,138 | | | | (471 | ) |
| CAD | | | 2,110,897 | | | JPMorgan Chase Bank N.A. | | | 08/12/16 | | | | USD | | | | 1,649,082 | | | | 14,984 | |
| EUR | | | 40,730,000 | | | Bank of America N.A. | | | 07/14/16 | | | | USD | | | | 47,056,184 | | | | 1,842,092 | |
| EUR | | | 10,960,000 | | | Barclays Bank plc | | | 07/14/16 | | | | USD | | | | 12,429,089 | | | | 262,469 | |
| EUR | | | 63,344,558 | | | Citibank N.A. | | | 07/14/16 | | | | USD | | | | 72,372,741 | | | | 2,054,385 | |
| EUR | | | 1,636,001 | | | Citibank N.A. | | | 08/12/16 | | | | USD | | | | 1,868,544 | | | | 50,502 | |
| EUR | | | 1,074,001 | | | Citibank N.A. | | | 08/12/16 | | | | USD | | | | 1,223,595 | | | | 30,088 | |
See accompanying notes to financial statements.
MSF-23
Metropolitan Series Fund
Western Asset Management Strategic Bond Opportunities Portfolio
Schedule of Investments as of June 30, 2016
Forward Foreign Currency Exchange Contracts—(Continued)
| | | | | | | | | | | | | | | | | | | | | | |
Contracts to Deliver | | | Counterparty | | Settlement
Date | | | In Exchange
for | | | Unrealized
Appreciation/
(Depreciation) | |
| EUR | | | 694,349 | | | Citibank N.A. | | | 08/12/16 | | | | USD | | | | 796,106 | | | $ | 24,495 | |
| EUR | | | 602,001 | | | Citibank N.A. | | | 08/12/16 | | | | USD | | | | 667,150 | | | | (1,837 | ) |
| EUR | | | 309,001 | | | Citibank N.A. | | | 08/12/16 | | | | USD | | | | 347,189 | | | | 3,805 | |
| EUR | | | 121,107 | | | Citibank N.A. | | | 08/12/16 | | | | USD | | | | 137,809 | | | | 3,227 | |
| GBP | | | 25,405,001 | | | Citibank N.A. | | | 07/14/16 | | | | USD | | | | 36,274,785 | | | | 2,452,697 | |
| GBP | | | 41,460,000 | | | Bank of America N.A. | | | 08/12/16 | | | | USD | | | | 60,608,301 | | | | 5,396,326 | |
| GBP | | | 3,840,000 | | | Bank of America N.A. | | | 08/12/16 | | | | USD | | | | 5,622,447 | | | | 508,748 | |
| GBP | | | 6,060,754 | | | Citibank N.A. | | | 08/12/16 | | | | USD | | | | 8,793,257 | | | | 722,196 | |
| GBP | | | 911,001 | | | Citibank N.A. | | | 08/12/16 | | | | USD | | | | 1,315,453 | | | | 102,279 | |
| ILS | | | 137,313,943 | | | Barclays Bank plc | | | 07/14/16 | | | | USD | | | | 36,353,465 | | | | 769,088 | |
| ILS | | | 43,303,200 | | | Citibank N.A. | | | 07/14/16 | | | | USD | | | | 11,453,146 | | | | 231,289 | |
| ILS | | | 20,352,857 | | | Citibank N.A. | | | 07/14/16 | | | | USD | | | | 5,383,214 | | | | 108,850 | |
| JPY | | | 2,912,380,000 | | | Barclays Bank plc | | | 07/14/16 | | | | USD | | | | 27,178,093 | | | | (1,032,350 | ) |
| JPY | | | 2,846,740,000 | | | Barclays Bank plc | | | 07/14/16 | | | | USD | | | | 26,466,776 | | | | (1,107,853 | ) |
| JPY | | | 905,500,000 | | | Barclays Bank plc | | | 07/14/16 | | | | USD | | | | 8,499,155 | | | | (271,869 | ) |
| JPY | | | 5,740,630,000 | | | Citibank N.A. | | | 07/14/16 | | | | USD | | | | 52,946,119 | | | | (2,659,852 | ) |
| JPY | | | 3,283,890,000 | | | JPMorgan Chase Bank N.A. | | | 07/14/16 | | | | USD | | | | 32,013,278 | | | | 204,244 | |
| KRW | | | 22,469,060,000 | | | Citibank N.A. | | | 07/14/16 | | | | USD | | | | 19,217,465 | | | | (287,266 | ) |
| NOK | | | 273,580,000 | | | Barclays Bank plc | | | 07/14/16 | | | | USD | | | | 32,658,041 | | | | (32,347 | ) |
| NZD | | | 75,600,000 | | | JPMorgan Chase Bank N.A. | | | 07/14/16 | | | | USD | | | | 51,520,266 | | | | (2,433,629 | ) |
| SGD | | | 28,350,000 | | | Barclays Bank plc | | | 07/14/16 | | | | USD | | | | 20,862,677 | | | | (181,503 | ) |
| SGD | | | 30,400,000 | | | JPMorgan Chase Bank N.A. | | | 07/14/16 | | | | USD | | | | 22,133,236 | | | | (432,657 | ) |
| SGD | | | 17,630,000 | | | JPMorgan Chase Bank N.A. | | | 07/14/16 | | | | USD | | | | 13,013,951 | | | | (72,782 | ) |
| TWD | | | 1,045,790,000 | | | Bank of America N.A. | | | 07/14/16 | | | | USD | | | | 32,548,708 | | | | 122,703 | |
| ZAR | | | 197,540,000 | | | Barclays Bank plc | | | 07/14/16 | | | | USD | | | | 12,919,260 | | | | (468,945 | ) |
| | | | |
Cross Currency Contracts to Buy | | | | | | | | | | | | |
| GBP | | | 8,979,476 | | | Citibank N.A. | | | 07/14/16 | | | | EUR | | | | 11,222,024 | | | | (502,969 | ) |
| | | | | | | | | | | | | | | | | | | | | | |
Net Unrealized Depreciation | | | $ | (1,401,247 | ) |
| | | | | | | | | | | | | | | | | | | | | | |
Futures Contracts
| | | | | | | | | | | | | | | | | | | | |
Futures Contracts—Long | | Expiration
Date | | | Number of
Contracts | | | Notional Amount | | | Unrealized
Appreciation/
(Depreciation) | |
Australian 10 Year Treasury Bond Futures | | | 09/15/16 | | | | 2,215 | | | | AUD | | | | 297,281,729 | | | $ | 3,281,725 | |
U.S. Treasury Note 2 Year Futures | | | 09/30/16 | | | | 1,500 | | | | USD | | | | 326,864,250 | | | | 2,127,939 | |
U.S. Treasury Note 5 Year Futures | | | 09/30/16 | | | | 2,918 | | | | USD | | | | 350,683,984 | | | | 5,790,753 | |
U.S. Treasury Ultra Long Bond Futures | | | 09/21/16 | | | | 1,075 | | | | USD | | | | 187,733,878 | | | | 12,619,247 | |
| | | | | |
Futures Contracts—Short | | | | | | | | | | | | | | | |
Euro-Bund Futures | | | 09/08/16 | | | | (844 | ) | | | EUR | | | | (138,541,387 | ) | | | (2,783,133 | ) |
U.S. Treasury Long Bond Futures | | | 09/21/16 | | | | (1,742 | ) | | | USD | | | | (283,854,023 | ) | | | (16,368,790 | ) |
U.S. Treasury Note 10 Year Futures | | | 09/21/16 | | | | (4,707 | ) | | | USD | | | | (610,858,447 | ) | | | (15,099,006 | ) |
| | | | | | | | | | | | | | | | | | | | |
Net Unrealized Depreciation | | | $ | (10,431,265 | ) |
| | | | | | | | | | | | | | | | | | | | |
Written Options
| | | | | | | | | | | | | | | | | | | | | | | | | | | | |
Foreign Currency Written
Options | | Strike
Price | | | Counterparty | | | Expiration
Date | | | Notional
Amount | | | Premiums
Received | | | Market
Value | | | Unrealized
Depreciation | |
USD Put/CAD Call | | CAD | 1.355 | | | | Barclays Bank plc | | | | 07/27/16 | | | | (32,400,000 | ) | | $ | (453,924 | ) | | $ | (1,613,520 | ) | | $ | (1,159,596 | ) |
| | | | | | | | | | | | | | | | | | | | | | | | | | | | |
See accompanying notes to financial statements.
MSF-24
Metropolitan Series Fund
Western Asset Management Strategic Bond Opportunities Portfolio
Schedule of Investments as of June 30, 2016
Written Options—(Continued)
| | | | | | | | | | | | | | | | | | | | | | | | | | | | | | |
Interest Rate
Swaptions | | Strike
Rate | | Counterparty | | Floating Rate
Index | | Pay/
Receive
Floating
Rate | | | Expiration
Date | | | Notional
Amount | | | Premiums
Received | | | Market
Value | | | Unrealized
Appreciation | |
Call - 1 Yr. IRS | | 0.630% | | Bank of America N.A. | | 3M LIBOR | | | Receive | | | | 08/04/16 | | | | USD (901,880,000) | | | $ | (270,564 | ) | | $ | (215,621 | ) | | $ | 54,943 | |
| | | | | | | | | | | | | | | | | | | | | | | | | | | | | | |
| | | | | | | | | | | | | | | | | | | | | | | | | | | | | | |
Credit Default
Swaptions | | Strike
Price | | | Counterparty | | Reference
Obligation | | Buy/Sell
Protection | | Expiration
Date | | | Notional
Amount | | | Premiums
Received | | | Market
Value | | | Unrealized
Appreciation | |
Put - 5 Yr. CDS | | $ | 100.000 | | | BNP Paribas | | CDX.NA.HY.26 | | Sell | | | 07/20/16 | | | | USD (100,000,000) | | | $ | (480,000 | ) | | $ | (104,960 | ) | | $ | 375,040 | |
| | | | | | | | | | | | | | | | | | | | | | | | | | | | | | |
Swap Agreements
OTC Cross-Currency Swaps
| | | | | | | | | | | | | | | | | | | | | | | | | | | | | | | | |
Receive | | Pay | | Maturity
Date(a) | | | Counterparty | | Notional
Amount of
Currency
Received | | | Notional
Amount of
Currency
Delivered | | | Market
Value | | | Upfront
Premium
Paid/
(Received) | | | Unrealized
Appreciation | |
| Fixed Rate equal to 9.005% based on the notional amount of currency delivered | | Fixed rate equal to 7.250% based on the notional amount of currency received | | | 07/01/24 | | | Barclays Bank plc | | $ | 5,848,000 | | | | EUR | | | | 4,300,000 | | | $ | 1,595,461 | | | $ | (4,084 | ) | | $ | 1,599,545 | |
| | | | | | | | | | | | | | | | | | | | | | | | | | | | | | | | |
| (a) | At the maturity date, the notional amount of the currency received will be exchanged back for the notional amount of the currency delivered. |
OTC Interest Rate Swaps
| | | | | | | | | | | | | | | | | | | | | | | | | | | | |
Pay/Receive
Floating Rate | | Floating
Rate Index | | Fixed
Rate | | Maturity
Date | | Counterparty | | Notional
Amount | | | Market
Value | | | Upfront
Premium
Paid/(Received) | | | Unrealized
Appreciation | |
Pay | | 1 Day CDI | | 1.079% | | 01/04/21 | | Bank of America N.A. | | | BRL | | | | 190,843,760 | | | $ | 4,848,787 | | | $ | — | | | $ | 4,848,787 | |
| | | | | | | | | | | | | | | | | | | | | | | | | | | | |
Centrally Cleared Interest Rate Swaps
| | | | | | | | | | | | | | | | | | | | | | | | |
Pay/Receive Floating Rate | | Floating
Rate Index | | | Fixed
Rate | | | Maturity
Date | | | Notional
Amount | | | Unrealized
Appreciation/
(Depreciation) | |
Pay | | | 3M CDOR | | | | 0.886 | % | | | 06/29/18 | | | | CAD | | | | 844,720,000 | | | $ | 355,561 | |
Pay | | | 3M LIBOR | | | | 1.185 | % | | | 06/13/21 | | | | USD | | | | 56,430,000 | | | | 511,286 | |
Pay | | | 6M LIBOR | | | | 0.556 | % | | | 06/28/18 | | | | GBP | | | | 370,770,000 | | | | 548,975 | |
Receive | | | 3M LIBOR | | | | 0.738 | % | | | 06/30/18 | | | | USD | | | | 498,900,000 | | | | 3,677 | |
Receive | | | 3M LIBOR | | | | 0.765 | % | | | 07/01/18 | | | | USD | | | | 647,640,000 | | | | (318,594 | ) |
Receive | | | 3M LIBOR | | | | 1.580 | % | | | 06/13/26 | | | | USD | | | | 56,280,000 | | | | (951,899 | ) |
Receive | | | 3M LIBOR | | | | 1.674 | % | | | 11/30/22 | | | | USD | | | | 99,324,000 | | | | (3,357,015 | ) |
| | | | | | | | | | | | | | | | | | | | | | | | |
Net Unrealized Depreciation | | | $ | (3,208,009 | ) |
| | | | | | | | | | | | | | | | | | | | | | | | |
Centrally Cleared Credit Default Swaps on Credit Indices—Sell Protection (a)
| | | | | | | | | | | | | | | | | | | | | | |
Reference Obligation | | Fixed Deal
Receive Rate | | | Maturity
Date | | | Implied Credit
Spread at
June 30,
2016(b) | | Notional
Amount(c) | | | Unrealized
Appreciation/
(Depreciation) | |
CDX.NA.HY.26 | | | 5.000% | | | | 06/20/21 | | | 0.000% | | | USD | | | | 130,000,000 | | | $ | 494,375 | |
CDX.NA.IG.26 | | | 1.000% | | | | 06/20/21 | | | 0.000% | | | USD | | | | 197,800,000 | | | | (6,923) | |
| | | | | | | | | | | | | | | | | | | | | | |
Net Unrealized Appreciation | | | $ | 487,452 | |
| | | | | | | | | | | | | | | | | | | | | | |
| (a) | If the Portfolio is a seller of protection and a credit event occurs, as defined under the terms of that particular swap agreement, the Portfolio will either (i) pay to the buyer of protection an amount equal to the notional amount of the swap and take delivery of the referenced obligation or underlying securities comprising the referenced index or (ii) pay a net settlement amount in the form of cash or securities equal to the notional amount of the swap less the recovery value of the referenced obligation or underlying securities comprising the referenced index. |
See accompanying notes to financial statements.
MSF-25
Metropolitan Series Fund
Western Asset Management Strategic Bond Opportunities Portfolio
Schedule of Investments as of June 30, 2016
| (b) | Implied credit spreads, represented in absolute terms, utilized in determining the market value of credit default swap agreements on corporate issues or indices as of period end serve as an indicator of the current status of the payment/performance risk and represent the likelihood or risk of default for the credit derivative. The implied credit spread of a particular referenced entity reflects the cost of buying/selling protection and may include upfront payments required to be made to enter into the agreement. Wider credit spreads represent a deterioration of the referenced entity’s credit soundness and a greater likelihood or risk of default or other credit event occurring as defined under the terms of the agreement. A credit spread identified as “Defaulted” indicates a credit event has occurred for the referenced entity or obligation. |
| (c) | The maximum potential amount of future undiscounted payments that the Portfolio could be required to make under a credit default swap contract would be the notional amount of the contract. These potential amounts would be partially offset by any recovery values of the referenced debt obligation or net amounts received from the settlement of purchased protection credit default swap contracts entered into by the Portfolio for the same referenced debt obligation. |
Securities in the amount of $9,737,306 have been received at the custodian bank as collateral for swaptions and OTC swap contracts.
| (USD)— | United States Dollar |
| (CDI)— | Brazil Interbank Deposit Rate |
| (CDOR)— | Canadian Dollar Offered Rate |
| (CDS)— | Credit Default Swap |
| (CDX.NA.HY)— | Markit North America High Yield CDS Index |
| (CDX.NA.IG)— | Markit North America Investment Grade CDS Index |
| (LIBOR)— | London Interbank Offered Rate |
Fair Value Hierarchy
Accounting principles generally accepted in the United States of America (“GAAP”) define fair market value as the price that the Portfolio would receive to sell an asset or pay to transfer a liability in an orderly transaction between market participants at the measurement date. It establishes a fair value hierarchy that prioritizes inputs to valuation methods and requires disclosure of the fair value hierarchy, separately for each major category of assets and liabilities, that segregates fair value measurements into three levels. Levels 1, 2 and 3 of the fair value hierarchy are defined as follows:
Level 1 - unadjusted quoted prices in active markets for identical investments
Level 2 - other significant observable inputs (including, but not limited to, quoted prices for similar assets or liabilities in markets that are either active or inactive; inputs other than quoted prices that are observable such as interest rates, yield curves, volatilities, prepayment speeds, loss severities, credit risks, default rates, or other market corroborated inputs)
Level 3 - significant unobservable inputs based on the best information available in the circumstances, to the extent observable inputs are unavailable (including the Portfolio’s own assumptions used in determining the fair value of investments and derivative financial instruments)
The inputs or methodologies used for valuing investments are not necessarily an indication of the risk associated with investing in them. Changes to the inputs or methodologies used may result in transfers between levels, which will be recognized as of the beginning of the reporting period. Information on transfers between Level 1 and Level 2, if any, will be disclosed following the fair value hierarchy table below. A reconciliation of Level 3 securities, if any, will also be disclosed following the fair value hierarchy table. For more information about the Portfolio’s policy regarding the valuation of investments, please refer to the Notes to Financial Statements.
See accompanying notes to financial statements.
MSF-26
Metropolitan Series Fund
Western Asset Management Strategic Bond Opportunities Portfolio
Schedule of Investments as of June 30, 2016
Fair Value Hierarchy—(Continued)
The following table summarizes the fair value hierarchy of the Portfolio’s investments as of June 30, 2016:
| | | | | | | | | | | | | | | | |
| Description | | Level 1 | | | Level 2 | | | Level 3 | | | Total | |
| Corporate Bonds & Notes | | | | | | | | | | | | | | | | |
Advertising | | $ | — | | | $ | 126,567 | | | $ | — | | | $ | 126,567 | |
Aerospace/Defense | | | — | | | | 17,998,644 | | | | — | | | | 17,998,644 | |
Agriculture | | | — | | | | 33,241,143 | | | | — | | | | 33,241,143 | |
Airlines | | | — | | | | 1,553,234 | | | | — | | | | 1,553,234 | |
Apparel | | | — | | | | 2,458,125 | | | | — | | | | 2,458,125 | |
Auto Manufacturers | | | — | | | | 24,430,850 | | | | — | | | | 24,430,850 | |
Auto Parts & Equipment | | | — | | | | 27,763,851 | | | | — | | | | 27,763,851 | |
Banks | | | — | | | | 338,484,659 | | | | — | | | | 338,484,659 | |
Beverages | | | — | | | | 51,311,696 | | | | — | | | | 51,311,696 | |
Biotechnology | | | — | | | | 13,728,550 | | | | — | | | | 13,728,550 | |
Building Materials | | | — | | | | 4,028,800 | | | | — | | | | 4,028,800 | |
Chemicals | | | — | | | | 16,631,111 | | | | — | | | | 16,631,111 | |
Coal | | | — | | | | 1,274,000 | | | | — | | | | 1,274,000 | |
Commercial Services | | | — | | | | 29,410,011 | | | | — | | | | 29,410,011 | |
Computers | | | — | | | | 16,364,639 | | | | — | | | | 16,364,639 | |
Diversified Financial Services | | | — | | | | 72,462,893 | | | | — | | | | 72,462,893 | |
Electric | | | — | | | | 47,944,855 | | | | — | | | | 47,944,855 | |
Electronics | | | — | | | | 4,528,250 | | | | — | | | | 4,528,250 | |
Energy-Alternate Sources | | | — | | | | 1,585,763 | | | | — | | | | 1,585,763 | |
Engineering & Construction | | | — | | | | 10,823,260 | | | | — | | | | 10,823,260 | |
Entertainment | | | — | | | | 4,609,743 | | | | — | | | | 4,609,743 | |
Environmental Control | | | — | | | | 1,428,319 | | | | — | | | | 1,428,319 | |
Food | | | — | | | | 15,029,972 | | | | — | | | | 15,029,972 | |
Forest Products & Paper | | | — | | | | 362,250 | | | | — | | | | 362,250 | |
Healthcare-Products | | | — | | | | 23,860,183 | | | | — | | | | 23,860,183 | |
Healthcare-Services | | | — | | | | 67,511,934 | | | | — | | | | 67,511,934 | |
Holding Companies-Diversified | | | — | | | | 15,553,096 | | | | — | | | | 15,553,096 | |
Home Builders | | | — | | | | 28,544,822 | | | | — | | | | 28,544,822 | |
Household Products/Wares | | | — | | | | 13,450,525 | | | | — | | | | 13,450,525 | |
Housewares | | | — | | | | 24,201,850 | | | | — | | | | 24,201,850 | |
Insurance | | | — | | | | 27,553,028 | | | | — | | | | 27,553,028 | |
Internet | | | — | | | | 21,590,526 | | | | — | | | | 21,590,526 | |
Iron/Steel | | | — | | | | 7,264,194 | | | | — | | | | 7,264,194 | |
Leisure Time | | | — | | | | 18,772,881 | | | | — | | | | 18,772,881 | |
Lodging | | | — | | | | 13,924,646 | | | | — | | | | 13,924,646 | |
Machinery-Construction & Mining | | | — | | | | 501,766 | | | | — | | | | 501,766 | |
Media | | | — | | | | 96,188,622 | | | | — | | | | 96,188,622 | |
Metal Fabricate/Hardware | | | — | | | | 355,484 | | | | — | | | | 355,484 | |
Mining | | | — | | | | 94,880,670 | | | | 4 | | | | 94,880,674 | |
Miscellaneous Manufacturing | | | — | | | | 27,291,817 | | | | — | | | | 27,291,817 | |
Oil & Gas | | | — | | | | 189,497,947 | | | | — | | | | 189,497,947 | |
Oil & Gas Services | | | — | | | | 20,034,160 | | | | — | | | | 20,034,160 | |
Packaging & Containers | | | — | | | | 33,350,885 | | | | — | | | | 33,350,885 | |
Pharmaceuticals | | | — | | | | 37,724,646 | | | | — | | | | 37,724,646 | |
Pipelines | | | — | | | | 75,087,299 | | | | — | | | | 75,087,299 | |
Real Estate | | | — | | | | 5,895,233 | | | | — | | | | 5,895,233 | |
Real Estate Investment Trusts | | | — | | | | 16,681,850 | | | | — | | | | 16,681,850 | |
Retail | | | — | | | | 65,773,232 | | | | — | | | | 65,773,232 | |
Savings & Loans | | | — | | | | 3,283,842 | | | | 600 | | | | 3,284,442 | |
Semiconductors | | | — | | | | 10,613,602 | | | | — | | | | 10,613,602 | |
Software | | | — | | | | 23,959,215 | | | | — | | | | 23,959,215 | |
Telecommunications | | | — | | | | 108,558,563 | | | | — | | | | 108,558,563 | |
Transportation | | | — | | | | 22,903,812 | | | | — | | | | 22,903,812 | |
Trucking & Leasing | | | — | | | | 3,564,177 | | | | — | | | | 3,564,177 | |
See accompanying notes to financial statements.
MSF-27
Metropolitan Series Fund
Western Asset Management Strategic Bond Opportunities Portfolio
Schedule of Investments as of June 30, 2016
Fair Value Hierarchy—(Continued)
| | | | | | | | | | | | | | | | |
| Description | | Level 1 | | | Level 2 | | | Level 3 | | | Total | |
Water | | $ | — | | | $ | 3,571,909 | | | $ | — | | | $ | 3,571,909 | |
Total Corporate Bonds & Notes | | | — | | | | 1,839,527,601 | | | | 604 | | | | 1,839,528,205 | |
Total U.S. Treasury & Government Agencies* | | | — | | | | 539,297,826 | | | | — | | | | 539,297,826 | |
Total Foreign Government* | | | — | | | | 501,906,793 | | | | — | | | | 501,906,793 | |
Total Mortgage-Backed Securities* | | | — | | | | 379,690,082 | | | | — | | | | 379,690,082 | |
Total Asset-Backed Securities* | | | — | | | | 83,939,237 | | | | — | | | | 83,939,237 | |
Total Investment Company Security | | | 22,970,000 | | | | — | | | | — | | | | 22,970,000 | |
Total Floating Rate Loans* | | | — | | | | 10,956,442 | | | | — | | | | 10,956,442 | |
Total Municipals | | | — | | | | 10,784,447 | | | | — | | | | 10,784,447 | |
Total Convertible Preferred Stock* | | | 6,450,528 | | | | — | | | | — | | | | 6,450,528 | |
| Preferred Stocks | | | | | | | | | | | | | | | | |
Air Freight & Logistics | | | — | | | | 302,302 | | | | — | | | | 302,302 | |
Banks | | | 3,129,050 | | | | — | | | | — | | | | 3,129,050 | |
Telecommunications | | | 1,195,264 | | | | — | | | | — | | | | 1,195,264 | |
Total Preferred Stocks | | | 4,324,314 | | | | 302,302 | | | | — | | | | 4,626,616 | |
| Purchased Options | | | | | | | | | | | | | | | | |
Credit Default Swaptions | | | — | | | | 1,614,542 | | | | — | | | | 1,614,542 | |
Currency Options | | | — | | | | 73,065 | | | | — | | | | 73,065 | |
Interest Rate Swaptions | | | — | | | | 82,197 | | | | — | | | | 82,197 | |
Options on Exchange-Traded Futures Contracts | | | 2,500,000 | | | | — | | | | — | | | | 2,500,000 | |
Total Purchased Options | | | 2,500,000 | | | | 1,769,804 | | | | — | | | | 4,269,804 | |
Total Convertible Bonds* | | | — | | | | 2,955,368 | | | | — | | | | 2,955,368 | |
| Common Stocks | | | | | | | | | | | | | | | | |
Air Freight & Logistics | | | — | | | | 139,650 | | | | — | | | | 139,650 | |
Diversified Consumer Services | | | — | | | | — | | | | 27,991 | | | | 27,991 | |
Energy Equipment & Services | | | 14,749 | | | | — | | | | — | | | | 14,749 | |
Household Durables | | | 21,190 | | | | — | | | | — | | | | 21,190 | |
Marine | | | — | | | | — | | | | 242,557 | | | | 242,557 | |
Media | | | — | | | | 252,885 | | | | 508,900 | | | | 761,785 | |
Metals & Mining | | | — | | | | — | | | | 58,380 | | | | 58,380 | |
Total Common Stocks | | | 35,939 | | | | 392,535 | | | | 837,828 | | | | 1,266,302 | |
Total Warrant* | | | — | | | | 1,700 | | | | — | | | | 1,700 | |
Total Escrow Shares* | | | — | | | | — | | | | 0 | | | | 0 | |
| Short-Term Investments | | | | | | | | | | | | | | | | |
Mutual Fund | | | 271,649,503 | | | | — | | | | — | | | | 271,649,503 | |
Repurchase Agreements | | | — | | | | 15,811,342 | | | | — | | | | 15,811,342 | |
Total Short-Term Investments | | | 271,649,503 | | | | 15,811,342 | | | | — | | | | 287,460,845 | |
Total Investments | | $ | 307,930,284 | | | $ | 3,387,335,479 | | | $ | 838,432 | | | $ | 3,696,104,195 | |
| | | | | | | | | | | | | | | | | |
Collateral for Securities Loaned (Liability) | | $ | — | | | $ | (271,649,503 | ) | | $ | — | | | $ | (271,649,503 | ) |
| Forward Contracts | | | | | | | | | | | | | | | | |
Forward Foreign Currency Exchange Contracts (Unrealized Appreciation) | | $ | — | | | $ | 25,942,950 | | | $ | — | | | $ | 25,942,950 | |
Forward Foreign Currency Exchange Contracts (Unrealized Depreciation) | | | — | | | | (27,344,197 | ) | | | — | | | | (27,344,197 | ) |
Total Forward Contracts | | $ | — | | | $ | (1,401,247 | ) | | $ | — | | | $ | (1,401,247 | ) |
| Futures Contracts | | | | | | | | | | | | | | | | |
Futures Contracts (Unrealized Appreciation) | | $ | 23,819,664 | | | $ | — | | | $ | — | | | $ | 23,819,664 | |
Futures Contracts (Unrealized Depreciation) | | | (34,250,929 | ) | | | — | | | | — | | | | (34,250,929 | ) |
Total Futures Contracts | | $ | (10,431,265 | ) | | $ | — | | | $ | — | | | $ | (10,431,265 | ) |
| Written Options | | | | | | | | | | | | | | | | |
Credit Default Swaptions at Value | | $ | — | | | $ | (104,960 | ) | | $ | — | | | $ | (104,960 | ) |
Foreign Currency Written Options at Value | | | — | | | | (1,613,520 | ) | | | — | | | | (1,613,520 | ) |
Interest Rate Swaptions at Value | | | — | | | | (215,621 | ) | | | — | | | | (215,621 | ) |
Total Written Options | | $ | — | | | $ | (1,934,101 | ) | | $ | — | | | $ | (1,934,101 | ) |
See accompanying notes to financial statements.
MSF-28
Metropolitan Series Fund
Western Asset Management Strategic Bond Opportunities Portfolio
Schedule of Investments as of June 30, 2016
Fair Value Hierarchy—(Continued)
| | | | | | | | | | | | | | | | |
| Description | | Level 1 | | | Level 2 | | | Level 3 | | | Total | |
| Centrally Cleared Swap Contracts | | | | | | | | | | | | | | | | |
Centrally Cleared Swap Contracts (Unrealized Appreciation) | | $ | — | | | $ | 1,913,874 | | | $ | — | | | $ | 1,913,874 | |
Centrally Cleared Swap Contracts (Unrealized Depreciation) | | | — | | | | (4,634,431 | ) | | | — | | | | (4,634,431 | ) |
Total Centrally Cleared Swap Contracts | | $ | — | | | $ | (2,720,557 | ) | | $ | — | | | $ | (2,720,557 | ) |
| OTC Swap Contracts | | | | | | | | | | | | | | | | |
OTC Swap Contracts at Value (Assets) | | $ | — | | | $ | 6,444,248 | | | $ | — | | | $ | 6,444,248 | |
| * | See Schedule of Investments for additional detailed categorizations. |
Following is a reconciliation of Level 3 assets for which significant unobservable inputs were used to determine fair value:
| | | | | | | | | | | | | | | | | | | | |
Investments in Securities | | Balance as of
December 31,
2015 | | | Change in
Unrealized
Appreciation/
(Depreciation) | | | Purchases | | | Balance as of
June 30,
2016 | | | Change in Unrealized
Appreciation/
(Depreciation) from
Investments Still Held at
June 30, 2016 | |
| Corporate Bonds & Notes | | | | | | | | | | | | | | | | | | | | |
Mining | | $ | 0 | | | $ | 0 | | | $ | 4 | (a) | | $ | 4 | | | $ | 0 | |
Savings & Loans | | | — | | | | 0 | | | | 600 | (a) | | | 600 | | | | 0 | |
| Common Stocks | | | | | | | | | | | | | | | | | | | | |
Diversified Customer Services | | | — | | | | 0 | | | | 27,991 | (a) | | | 27,991 | | | | 0 | |
Marine | | | 208,910 | | | | 33,647 | | | | — | | | | 242,557 | | | | 33,647 | |
Media | | | — | | | | 278,845 | | | | 230,055 | (a) | | | 508,900 | | | | 278,845 | |
Metals & Mining | | | 0 | | | | 5,714 | | | | 52,666 | (a) | | | 58,380 | | | | 5,714 | |
| Escrow Shares | | | | | | | | | | | | | | | | | | | | |
Forest Products & Paper | | | — | | | | 0 | | | | — | | | | 0 | | | | 0 | |
| | | | | | | | | | | | | | | | | | | | |
Total | | $ | 208,910 | | | $ | 318,206 | | | $ | 311,316 | | | $ | 838,432 | | | $ | 318,206 | |
| | | | | | | | | | | | | | | | | | | | |
| (a) | Security was acquired as a result of the merger with the Met Investors Series Trust Lord Abbett Bond Debenture Portfolio and the Met Investors Series Trust Pioneer Strategic Income Portfolio. Purchase amount shown above reflects the value of the security on the date of the merger. (See note 9 of the Notes to Financial Statements) |
See accompanying notes to financial statements.
MSF-29
Metropolitan Series Fund
Western Asset Management Strategic Bond Opportunities Portfolio
Statement of Assets and Liabilities
June 30, 2016
| | | | |
Assets | | | | |
Investments at value (a) (b) | | $ | 3,696,104,195 | |
Cash | | | 7,100,437 | |
Cash denominated in foreign currencies (c) | | | 5,405,049 | |
Cash collateral (d) | | | 25,165,994 | |
OTC swap contracts at market value (e) | | | 6,444,248 | |
Unrealized appreciation on forward foreign currency exchange contracts | | | 25,942,950 | |
Receivable for: | | | | |
Investments sold | | | 36,880,581 | |
Fund shares sold | | | 299,216 | |
Principal paydowns | | | 2,979 | |
Dividends and interest | | | 38,879,994 | |
Variation margin on futures contracts | | | 5,919,004 | |
Interest on OTC swap contracts | | | 263,306 | |
Variation margin on centrally cleared swap contracts | | | 1,735,941 | |
Prepaid expenses | | | 23,458 | |
Other assets | | | 54,786 | |
| | | | |
Total Assets | | | 3,850,222,138 | |
Liabilities | | | | |
Written options at value (f) | | | 1,934,101 | |
Unrealized depreciation on forward foreign currency exchange contracts | | | 27,344,197 | |
Collateral for securities loaned | | | 271,649,503 | |
Payables for: | | | | |
Investments purchased | | | 9,830,407 | |
Fund shares redeemed | | | 3,100,784 | |
Interest on OTC swap contracts | | | 174,035 | |
Accrued Expenses: | | | | |
Management fees | | | 1,456,949 | |
Distribution and service fees | | | 227,965 | |
Deferred trustees’ fees | | | 247,273 | |
Other expenses | | | 835,736 | |
| | | | |
Total Liabilities | | | 316,800,950 | |
| | | | |
Net Assets | | $ | 3,533,421,188 | |
| | | | |
Net Assets Consist of: | | | | |
Paid in surplus | | $ | 3,549,384,149 | |
Undistributed net investment income | | | 44,945,088 | |
Accumulated net realized loss | | | (88,777,076 | ) |
Unrealized appreciation on investments, written options, futures contracts, swap contracts and foreign currency transactions | | | 27,869,027 | |
| | | | |
Net Assets | | $ | 3,533,421,188 | |
| | | | |
Net Assets | | | | |
Class A | | $ | 2,294,485,246 | |
Class B | | | 931,711,040 | |
Class E | | | 307,224,902 | |
Capital Shares Outstanding* | | | | |
Class A | | | 176,175,286 | |
Class B | | | 71,996,599 | |
Class E | | | 23,686,214 | |
Net Asset Value, Offering Price and Redemption Price Per Share | | | | |
Class A | | $ | 13.02 | |
Class B | | | 12.94 | |
Class E | | | 12.97 | |
| * | The Portfolio is authorized to issue an unlimited number of shares. |
| (a) | Identified cost of investments was $3,659,417,752. |
| (b) | Includes securities loaned at value of $508,211,971. |
| (c) | Identified cost of cash denominated in foreign currencies was $5,342,682. |
| (d) | Includes collateral of $10,216,822 for futures contracts, $260,000 for swaptions and $14,689,172 for centrally cleared swap contracts. |
| (e) | Net premium received on OTC swap contracts was $4,084. |
| (f) | Premiums received on written options were $1,204,488. |
Statement of Operations
Six Months Ended June 30, 2016
| | | | |
Investment Income | | | | |
Dividends | | $ | 167,483 | |
Interest | | | 54,192,757 | |
Securities lending income | | | 308,507 | |
Other income | | | 4,864 | |
| | | | |
Total investment income | | | 54,673,611 | |
Expenses | | | | |
Management fees | | | 5,829,729 | |
Administration fees | | | 25,621 | |
Custodian and accounting fees | | | 159,987 | |
Distribution and service fees—Class B | | | 539,659 | |
Distribution and service fees—Class E | | | 101,669 | |
Audit and tax services | | | 46,187 | |
Legal | | | 13,597 | |
Trustees’ fees and expenses | | | 15,990 | |
Shareholder reporting | | | 53,934 | |
Insurance | | | 4,453 | |
Miscellaneous | | | 8,500 | |
| | | | |
Total expenses | | | 6,799,326 | |
Less management fee waiver | | | (522,221 | ) |
| | | | |
Net expenses | | | 6,277,105 | |
| | | | |
Net Investment Income | | | 48,396,506 | |
| | | | |
Net Realized and Unrealized Gain (Loss) | | | | |
| Net realized gain (loss) on: | | | | |
Investments | | | (18,359,411 | ) |
Futures contracts | | | (2,462,360 | ) |
Written options | | | 859,387 | |
Swap contracts | | | (981,556 | ) |
Foreign currency transactions | | | (2,732,871 | ) |
| | | | |
Net realized loss | | | (23,676,811 | ) |
| | | | |
| Net change in unrealized appreciation (depreciation) on: | | | | |
Investments | | | 96,062,380 | |
Futures contracts | | | (12,029,949 | ) |
Written options | | | (729,613 | ) |
Swap contracts | | | 3,856,597 | |
Foreign currency transactions | | | (3,142,268 | ) |
| | | | |
Net change in unrealized appreciation | | | 84,017,147 | |
| | | | |
Net realized and unrealized gain | | | 60,340,336 | |
| | | | |
Net Increase in Net Assets from Operations | | $ | 108,736,842 | |
| | | | |
See accompanying notes to financial statements.
MSF-30
Metropolitan Series Fund
Western Asset Management Strategic Bond Opportunities Portfolio
Statements of Changes in Net Assets
| | | | | | | | |
| | | Six Months
Ended
June 30,
2016 | | | Year Ended
December 31,
2015 | |
Increase (Decrease) in Net Assets: | | | | | | | | |
From Operations | | | | | | | | |
Net investment income | | $ | 48,396,506 | | | $ | 59,796,475 | |
Net realized loss | | | (23,676,811 | ) | | | (35,780,466 | ) |
Net change in unrealized appreciation (depreciation) | | | 84,017,147 | | | | (49,293,413 | ) |
| | | | | | | | |
Increase (decrease) in net assets from operations | | | 108,736,842 | | | | (25,277,404 | ) |
| | | | | | | | |
From Distributions to Shareholders | | | | | | | | |
Net investment income | | | | | | | | |
Class A | | | (35,720,494 | ) | | | (57,669,980 | ) |
Class B | | | (14,043,055 | ) | | | (10,166,780 | ) |
Class E | | | (4,707,996 | ) | | | (2,750,972 | ) |
| | | | | | | | |
Total distributions | | | (54,471,545 | ) | | | (70,587,732 | ) |
| | | | | | | | |
Increase in net assets from capital share transactions | | | 2,168,546,264 | | | | 143,712,626 | |
| | | | | | | | |
Total increase in net assets | | | 2,222,811,561 | | | | 47,847,490 | |
| | |
Net Assets | | | | | | | | |
Beginning of period | | | 1,310,609,627 | | | | 1,262,762,137 | |
| | | | | | | | |
End of period | | $ | 3,533,421,188 | | | $ | 1,310,609,627 | |
| | | | | | | | |
| | |
Undistributed net investment income | | | | | | | | |
End of period | | $ | 44,945,088 | | | $ | 51,020,127 | |
| | | | | | | | |
Other Information:
Capital Shares
Transactions in capital shares were as follows:
| | | | | | | | | | | | | | | | |
| | | Six Months Ended
June 30, 2016
| | | Year Ended
December 31, 2015 | |
| | | Shares | | | Value | | | Shares | | | Value | |
Class A | | | | | | | | | | | | | | | | |
Sales | | | 984,653 | | | $ | 12,699,133 | | | | 12,538,685 | | | $ | 170,643,437 | |
Shares issued through acquisition (a) | | | 103,655,018 | | | | 1,346,478,441 | | | | 0 | | | | 0 | |
Reinvestments | | | 2,771,179 | | | | 35,720,494 | | | | 4,491,432 | | | | 57,669,980 | |
Redemptions | | | (16,605,379 | ) | | | (213,366,992 | ) | | | (4,818,291 | ) | | | (62,520,412 | ) |
| | | | | | | | | | | | | | | | |
Net increase | | | 90,805,471 | | | $ | 1,181,531,076 | | | | 12,211,826 | | | $ | 165,793,005 | |
| | | | | | | | | | | | | | | | |
Class B | | | | | | | | | | | | | | | | |
Sales | | | 747,380 | | | $ | 9,541,702 | | | | 791,911 | | | $ | 10,370,451 | |
Shares issued through acquisition (a) | | | 59,736,085 | | | | 771,192,945 | | | | 0 | | | | 0 | |
Reinvestments | | | 1,096,257 | | | | 14,043,055 | | | | 795,523 | | | | 10,166,780 | |
Redemptions | | | (4,820,224 | ) | | | (61,691,207 | ) | | | (2,876,914 | ) | | | (37,568,769 | ) |
| | | | | | | | | | | | | | | | |
Net increase (decrease) | | | 56,759,498 | | | $ | 733,086,495 | | | | (1,289,480 | ) | | $ | (17,031,538 | ) |
| | | | | | | | | | | | | | | | |
Class E | | | | | | | | | | | | | | | | |
Sales | | | 1,779,353 | | | $ | 22,986,109 | | | | 180,111 | | | $ | 2,345,501 | |
Shares issued through acquisition (a) | | | 18,973,217 | | | | 245,512,995 | | | | 0 | | | | 0 | |
Reinvestments | | | 366,666 | | | | 4,707,996 | | | | 214,920 | | | | 2,750,972 | |
Redemptions | | | (1,500,677 | ) | | | (19,278,407 | ) | | | (774,805 | ) | | | (10,145,314 | ) |
| | | | | | | | | | | | | | | | |
Net increase (decrease) | | | 19,618,559 | | | $ | 253,928,693 | | | | (379,774 | ) | | $ | (5,048,841 | ) |
| | | | | | | | | | | | | | | | |
Increase derived from capital shares transactions | | | | | | $ | 2,168,546,264 | | | | | | | $ | 143,712,626 | |
| | | | | | | | | | | | | | | | |
| (a) | See Note 9 of Notes to Financial Statements |
See accompanying notes to financial statements.
MSF-31
Metropolitan Series Fund
Western Asset Management Strategic Bond Opportunities Portfolio
Financial Highlights
| | | | | | | | | | | | | | | | | | | | | | | | |
| Selected per share data | | | | | | | | | | | | | | | | | | |
| | | Class A | |
| | | Six Months
Ended
June 30,
2016 | | | Year Ended December 31, | |
| | | | 2015 | | | 2014 | | | 2013 | | | 2012 | | | 2011 | |
Net Asset Value, Beginning of Period | | $ | 12.53 | | | $ | 13.43 | | | $ | 13.45 | | | $ | 13.98 | | | $ | 13.01 | | | $ | 12.90 | |
| | | | | | | | | | | | | | | | | | | | | | | | |
Income (Loss) from Investment Operations | | | | | | | | | | | | | | | | | | | | | | | | |
Net investment income (a) | | | 0.31 | | | | 0.59 | | | | 0.64 | | | | 0.63 | | | | 0.50 | | | | 0.53 | |
Net realized and unrealized gain (loss) on investments | | | 0.38 | | | | (0.80 | ) | | | 0.09 | | | | (0.47 | ) | | | 0.96 | | | | 0.24 | |
| | | | | | | | | | | | | | | | | | | | | | | | |
Total from investment operations | | | 0.69 | | | | (0.21 | ) | | | 0.73 | | | | 0.16 | | | | 1.46 | | | | 0.77 | |
| | | | | | | | | | | | | | | | | | | | | | | | |
Less Distributions | | | | | | | | | | | | | | | | | | | | | | | | |
Distributions from net investment income | | | (0.20 | ) | | | (0.69 | ) | | | (0.75 | ) | | | (0.69 | ) | | | (0.49 | ) | | | (0.66 | ) |
| | | | | | | | | | | | | | | | | | | | | | | | |
Total distributions | | | (0.20 | ) | | | (0.69 | ) | | | (0.75 | ) | | | (0.69 | ) | | | (0.49 | ) | | | (0.66 | ) |
| | | | | | | | | | | | | | | | | | | | | | | | |
Net Asset Value, End of Period | | $ | 13.02 | | | $ | 12.53 | | | $ | 13.43 | | | $ | 13.45 | | | $ | 13.98 | | | $ | 13.01 | |
| | | | | | | | | | | | | | | | | | | | | | | | |
Total Return (%) (b) | | | 5.56 | (c) | | | (1.72 | ) | | | 5.47 | | | | 1.09 | | | | 11.50 | | | | 6.14 | |
| | | | | | |
Ratios/Supplemental Data | | | | | | | | | | | | | | | | | | | | | | | | |
Gross ratio of expenses to average net assets (%) | | | 0.61 | (d) | | | 0.63 | | | | 0.65 | | | | 0.66 | | | | 0.65 | | | | 0.67 | |
Net ratio of expenses to average net assets (%) (e) | | | 0.56 | (d) | | | 0.59 | | | | 0.61 | | | | 0.62 | | | | 0.61 | | | | 0.63 | |
Ratio of net investment income to average net assets (%) | | | 4.86 | (d) | | | 4.51 | | | | 4.77 | | | | 4.65 | | | | 3.70 | | | | 4.13 | |
Portfolio turnover rate (%) | | | 44 | (c) | | | 99 | (f) | | | 98 | (f) | | | 132 | (f) | | | 228 | (f) | | | 473 | |
Net assets, end of period (in millions) | | $ | 2,294.4 | | | $ | 1,070.0 | | | $ | 982.6 | | | $ | 682.7 | | | $ | 708.5 | | | $ | 578.9 | |
| |
| | | Class B | |
| | | Six Months
Ended
June 30,
2016 | | | Year Ended December 31, | |
| | | | 2015 | | | 2014 | | | 2013 | | | 2012 | | | 2011 | |
Net Asset Value, Beginning of Period | | $ | 12.46 | | | $ | 13.35 | | | $ | 13.37 | | | $ | 13.90 | | | $ | 12.93 | | | $ | 12.83 | |
| | | | | | | | | | | | | | | | | | | | | | | | |
Income (Loss) from Investment Operations | | | | | | | | | | | | | | | | | | | | | | | | |
Net investment income (a) | | | 0.29 | | | | 0.56 | | | | 0.61 | | | | 0.59 | | | | 0.46 | | | | 0.49 | |
Net realized and unrealized gain (loss) on investments | | | 0.39 | | | | (0.80 | ) | | | 0.08 | | | | (0.46 | ) | | | 0.97 | | | | 0.24 | |
| | | | | | | | | | | | | | | | | | | | | | | | |
Total from investment operations | | | 0.68 | | | | (0.24 | ) | | | 0.69 | | | | 0.13 | | | | 1.43 | | | | 0.73 | |
| | | | | | | | | | | | | | | | | | | | | | | | |
Less Distributions | | | | | | | | | | | | | | | | | | | | | | | | |
Distributions from net investment income | | | (0.20 | ) | | | (0.65 | ) | | | (0.71 | ) | | | (0.66 | ) | | | (0.46 | ) | | | (0.63 | ) |
| | | | | | | | | | | | | | | | | | | | | | | | |
Total distributions | | | (0.20 | ) | | | (0.65 | ) | | | (0.71 | ) | | | (0.66 | ) | | | (0.46 | ) | | | (0.63 | ) |
| | | | | | | | | | | | | | | | | | | | | | | | |
Net Asset Value, End of Period | | $ | 12.94 | | | $ | 12.46 | | | $ | 13.35 | | | $ | 13.37 | | | $ | 13.90 | | | $ | 12.93 | |
| | | | | | | | | | | | | | | | | | | | | | | | |
Total Return (%) (b) | | | 5.45 | (c) | | | (2.00 | ) | | | 5.29 | | | | 0.83 | | | | 11.29 | | | | 5.83 | |
| | | | | | |
Ratios/Supplemental Data | | | | | | | | | | | | | | | | | | | | | | | | |
Gross ratio of expenses to average net assets (%) | | | 0.86 | (d) | | | 0.88 | | | | 0.90 | | | | 0.91 | | | | 0.90 | | | | 0.92 | |
Net ratio of expenses to average net assets (%) (e) | | | 0.81 | (d) | | | 0.84 | | | | 0.86 | | | | 0.87 | | | | 0.86 | | | | 0.88 | |
Ratio of net investment income to average net assets (%) | | | 4.52 | (d) | | | 4.25 | | | | 4.53 | | | | 4.39 | | | | 3.45 | | | | 3.83 | |
Portfolio turnover rate (%) | | | 44 | (c) | | | 99 | (f) | | | 98 | (f) | | | 132 | (f) | | | 228 | (f) | | | 473 | |
Net assets, end of period (in millions) | | $ | 931.7 | | | $ | 189.9 | | | $ | 220.7 | | | $ | 238.4 | | | $ | 268.0 | | | $ | 273.6 | |
Please see following page for Financial Highlights footnote legend.
See accompanying notes to financial statements.
MSF-32
Metropolitan Series Fund
Western Asset Management Strategic Bond Opportunities Portfolio
Financial Highlights
| | | | | | | | | | | | | | | | | | | | | | | | |
| Selected per share data | | | | | | | | | | | | | | | | | | |
| | | Class E | |
| | | Six Months
Ended
June 30,
2016 | | | Year Ended December 31, | |
| | | | 2015 | | | 2014 | | | 2013 | | | 2012 | | | 2011 | |
Net Asset Value, Beginning of Period | | $ | 12.48 | | | $ | 13.38 | | | $ | 13.39 | | | $ | 13.93 | | | $ | 12.96 | | | $ | 12.85 | |
| | | | | | | | | | | | | | | | | | | | | | | | |
Income (Loss) from Investment Operations | | | | | | | | | | | | | | | | | | | | | | | | |
Net investment income (a) | | | 0.29 | | | | 0.57 | | | | 0.62 | | | | 0.61 | | | | 0.48 | | | | 0.50 | |
Net realized and unrealized gain (loss) on investments | | | 0.40 | | | | (0.81 | ) | | | 0.09 | | | | (0.48 | ) | | | 0.96 | | | | 0.25 | |
| | | | | | | | | | | | | | | | | | | | | | | | |
Total from investment operations | | | 0.69 | | | | (0.24 | ) | | | 0.71 | | | | 0.13 | | | | 1.44 | | | | 0.75 | |
| | | | | | | | | | | | | | | | | | | | | | | | |
Less Distributions | | | | | | | | | | | | | | | | | | | | | | | | |
Distributions from net investment income | | | (0.20 | ) | | | (0.66 | ) | | | (0.72 | ) | | | (0.67 | ) | | | (0.47 | ) | | | (0.64 | ) |
| | | | | | | | | | | | | | | | | | | | | | | | |
Total distributions | | | (0.20 | ) | | | (0.66 | ) | | | (0.72 | ) | | | (0.67 | ) | | | (0.47 | ) | | | (0.64 | ) |
| | | | | | | | | | | | | | | | | | | | | | | | |
Net Asset Value, End of Period | | $ | 12.97 | | | $ | 12.48 | | | $ | 13.38 | | | $ | 13.39 | | | $ | 13.93 | | | $ | 12.96 | |
| | | | | | | | | | | | | | | | | | | | | | | | |
Total Return (%) (b) | | | 5.55 | (c) | | | (1.90 | ) | | | 5.40 | | | | 0.94 | | | | 11.30 | | | | 5.92 | |
| | | | | | |
Ratios/Supplemental Data | | | | | | | | | | | | | | | | | | | | | | | | |
Gross ratio of expenses to average net assets (%) | | | 0.76 | (d) | | | 0.78 | | | | 0.80 | | | | 0.81 | | | | 0.80 | | | | 0.82 | |
Net ratio of expenses to average net assets (%) (e) | | | 0.71 | (d) | | | 0.74 | | | | 0.76 | | | | 0.77 | | | | 0.76 | | | | 0.78 | |
Ratio of net investment income to average net assets (%) | | | 4.60 | (d) | | | 4.35 | | | | 4.63 | | | | 4.49 | | | | 3.55 | | | | 3.90 | |
Portfolio turnover rate (%) | | | 44 | (c) | | | 99 | (f) | | | 98 | (f) | | | 132 | (f) | | | 228 | (f) | | | 473 | |
Net assets, end of period (in millions) | | $ | 307.2 | | | $ | 50.8 | | | $ | 59.5 | | | $ | 66.2 | | | $ | 74.0 | | | $ | 75.9 | |
| (a) | Per share amounts based on average shares outstanding during the period. |
| (b) | Total return does not reflect any insurance, sales, separate account or administrative charges of variable annuity or life insurance contracts or any additional expenses that contract owners may bear under their variable contracts. If these charges were included, the returns would be lower. |
| (c) | Periods less than one year are not computed on an annualized basis. |
| (d) | Computed on an annualized basis. |
| (e) | Includes the effects of management fee waivers (see Note 6 of the Notes to Financial Statements). |
| (f) | Includes mortgage dollar roll and TBA transactions; excluding these transactions the portfolio turnover rate would have been 71%, 57%, 62% and 84% for the years ended December 31, 2015, 2014, 2013 and 2012, respectively. |
See accompanying notes to financial statements.
MSF-33
Metropolitan Series Fund
Western Asset Management Strategic Bond Opportunities Portfolio
Notes to Financial Statements—June 30, 2016
1. Organization
Metropolitan Series Fund (the “Trust”) is organized as a Delaware statutory trust and registered under the Investment Company Act of 1940, as amended (the “1940 Act”), as an open-end management investment company. The Trust, which is managed by MetLife Advisers, LLC (“MetLife Advisers” or the “Adviser”), an affiliate of MetLife, Inc., is currently comprised of thirty series, each of which operates as a distinct investment vehicle of the Trust. The portfolio included in this report is Western Asset Management Strategic Bond Opportunities Portfolio (the “Portfolio”), which is diversified. Shares in the Portfolio are not offered directly to the general public and are currently available only to separate accounts established by Metropolitan Life Insurance Company (“MetLife”) and other affiliated life insurance companies.
The Portfolio has registered and offers three classes of shares: Class A, B and E shares. Shares of each Class of the Portfolio represent an equal pro rata interest in the Portfolio and generally give the shareholder the same voting, dividend, liquidation, and other rights. Investment income, realized and unrealized capital gains and losses, the common expenses of the Portfolio, and certain Portfolio-level expense reductions, if any, are allocated on a pro rata basis to each Class based on the relative net assets of each Class to the net assets of the Portfolio. Each Class of shares differs in its respective distribution plan and such distribution expenses are allocated to the corresponding Class of shares.
2. Significant Accounting Policies
The preparation of financial statements in conformity with accounting principles generally accepted in the United States of America (“GAAP”) requires management to make estimates and assumptions that affect the reported amounts of assets and liabilities and disclosure of contingent assets and liabilities as of the date of the financial statements and the reported amounts of income and expenses during the reporting period. Actual results could differ from those estimates. In the preparation of these financial statements, management has evaluated events and transactions subsequent to June 30, 2016 through the date the financial statements were issued.
The Portfolio is an investment company and follows the accounting and reporting guidance of the Financial Accounting Standards Board (“FASB”) Accounting Standards Codification Topic 946—Financial Services—Investment Companies and Topic 820—Fair Value Measurement. The following is a summary of significant accounting policies consistently followed by the Portfolio in the preparation of its financial statements.
Investment Valuation and Fair Value Measurements - Debt securities, including corporate, convertible and municipal bonds and notes; obligations of the U.S. Treasury and U.S. government agencies; foreign sovereign issues; and non-U.S. bonds, are generally valued on the basis of evaluated or composite bid quotations obtained from independent pricing services and/or brokers and dealers selected by the Adviser (each a “pricing service”), pursuant to authorization of and subject to general oversight by the Board of Trustees of the Trust (the “Board” or “Trustees”). Such pricing services may use matrix pricing, which considers observable inputs including, among other things, issuer details, maturity dates, interest rates, yield curves, rates of prepayment, credit risks/spreads, default rates, reported trades, broker dealer quotes and quoted prices for similar assets. Short-term obligations with a remaining maturity of sixty days or less may be valued at amortized cost in the absence of market quotes, so long as the amortized cost value of such short-term debt instrument is approximately the same as the fair value of the instrument as determined without the use of amortized cost valuation. Floating rate loans are generally valued on the basis of an evaluated or composite average of aggregate bid and ask quotations supplied by brokers or dealers, as obtained from the pricing service. Securities that use similar valuation techniques and inputs as described above are generally categorized as Level 2 within the fair value hierarchy.
Mortgage and asset-backed securities are generally valued on the basis of evaluated or composite bid quotations obtained from pricing services selected by the Adviser pursuant to authorization of and subject to general oversight by the Board. These securities are usually issued as separate tranches, or classes, of securities within each deal. The pricing models for these securities usually consider tranche-level attributes, current market data, estimated cash flows and market-based yield spreads for each tranche and incorporate deal collateral performance, as available. Mortgage and asset-backed securities that use similar valuation techniques and inputs as described above are generally categorized as Level 2 within the fair value hierarchy.
Domestic and foreign equity securities, such as common stock, exchange-traded funds, rights, warrants, and preferred stock, that are traded on a securities exchange on a valuation date are generally valued at their last quoted sale price or official closing price on the primary exchange for such security, or, if no sales occurred on that day, at the last reported bid price. Equity securities traded over-the-counter (“OTC”) are generally valued at the last reported bid price. In the event of a major exchange closing during the trading day, the Adviser may use other market information obtained from quotation reporting systems, established market makers, or pricing services in valuing the securities. Valuation adjustments may be applied to certain foreign equity securities that are traded solely on foreign exchanges that close before the time as of which the Portfolio determines its NAV to account for the market movement between the close of the foreign exchanges and the time as of which the Portfolio determines its NAV. The Portfolio may use a systematic fair valuation model provided by a pricing service to value securities principally traded in these foreign markets in order to adjust for possible market movements or other changes that may occur between the close of the foreign exchanges and the time as of
MSF-34
Metropolitan Series Fund
Western Asset Management Strategic Bond Opportunities Portfolio
Notes to Financial Statements—June 30, 2016—(Continued)
which the Portfolio determines its NAV. Foreign equity securities valued using these valuation adjustments are generally categorized as Level 2 within the fair value hierarchy. Equity securities that are actively traded, and have no valuation adjustments applied, are categorized as Level 1 within the fair value hierarchy. Other equity securities traded on inactive markets, or valued in reference to similar instruments traded on active markets, are generally categorized as Level 2 within the fair value hierarchy.
Investments in registered open-end management investment companies are valued at reported net asset value per share on the valuation date and are categorized as Level 1 within the fair value hierarchy.
Foreign currency forward contracts are valued through an independent pricing service by interpolating between forward and spot currency rates in the London foreign exchange markets as of a designated hour on a valuation day. These contracts are generally categorized as Level 2 within the fair value hierarchy.
Options, whether on securities, indices, futures contracts, or otherwise, traded on exchanges are valued at the last sale price available as of the close of business on a valuation day or, if there is no such price available, at the last reported bid price. These types of options are categorized as Level 1 within the fair value hierarchy. Futures contracts that are traded on commodity exchanges are valued at their settlement prices established by the exchanges on which they are traded as of the close of such exchanges and are categorized as Level 1 within the fair value hierarchy.
Options, including swaptions, and futures contracts that are traded OTC are generally valued on the basis of interdealer bid and asked prices or prices provided by pricing service providers who use a series of techniques, including simulation pricing models, to determine the value of the contracts. The pricing models use inputs that are observed from actively quoted markets such as issuer details, indices, spreads, interest rates, yield curves, credit curves, measures of volatility and exchange rates. These contracts are generally categorized as Level 2 within the fair value hierarchy.
Swap contracts (other than centrally cleared swaps) are marked-to-market daily based on quotations and prices supplied by market makers, broker-dealers and other pricing services. Such quotations and prices are derived utilizing observable data, including the underlying reference securities or indices, credit spread quotations and expected default recovery rates determined by the pricing service. These contracts are generally categorized as Level 2 within the fair value hierarchy.
Centrally cleared swaps listed or traded on a multilateral or trade facility platform, such as a registered exchange, are valued at the daily settlement price determined by the respective exchange or a pricing service when the exchange price is not available. For centrally cleared credit default swaps, the clearing facility requires its members to provide actionable price levels across complete term structures. These levels along with external third party prices are used to produce daily settlement prices. These securities are categorized as Level 2 within the fair value hierarchy. Centrally cleared interest rate swaps are valued using a pricing model that references the underlying rates, including the overnight index swap rate and London Interbank Offered Rate (“LIBOR”) forward rate to produce the daily settlement price. These securities are categorized as Level 2 within the fair value hierarchy.
If no current market value quotation or other observable inputs are readily available or market value quotations are deemed to be unreliable for an investment, the fair value of the investment will be determined in accordance with procedures approved by, and under the general supervision of, the Board. In such a circumstance, the Board will be assisted in its responsibility to determine the fair value of an investment by the Valuation Committee (“Committee”) of MetLife Advisers. The Committee provides general pricing oversight and fair value pricing determinations related to portfolio securities and meets on a regular basis to review reports relating to the valuation of the securities in the Portfolio. The Board has delegated to State Street Bank and Trust Company, the Trust’s custodian (“custodian”), the responsibility for calculating the net asset values (“NAVs”) of the Trust’s Portfolios. The Committee is responsible for overseeing the calculation of the NAVs of the Portfolios by the custodian. The Committee also periodically reviews pricing services, including the pricing services providing fair value pricing for the Portfolio’s foreign securities, and is responsible for overseeing the correction of pricing errors and addressing other pricing issues that arise in the ordinary course of business, such as making real-time fair value determinations, as necessary.
No single standard for determining the fair value of an investment can be set forth because fair value depends upon the facts and circumstances with respect to each investment. Information relating to any relevant factors may be obtained by the Committee from any appropriate source, including the subadviser of the Portfolio, the custodian, a pricing service, market maker and/or broker for such security or the issuer. Appropriate methodologies for determining fair value under particular circumstances may include: matrix pricing, a discounted cash flow analysis, comparisons of securities with comparable characteristics, value based on multiples of earnings, discount from market price of similar marketable securities or a combination of these and other methods.
Investment Transactions and Related Investment Income - Portfolio security transactions are recorded on the trade date. Dividend income is recorded on the ex-dividend date or, for certain foreign securities, when notified. Interest income, which includes amortization of premium and accretion of discount on debt securities, is recorded on the accrual basis. Realized gains and losses on investments are determined on the identified cost basis, which is the same basis used for federal income tax purposes. Foreign income and foreign capital gains on some foreign securities may be subject to foreign taxes, which are accrued as applicable. These foreign taxes have been provided for in accordance with the Portfolio’s understanding of the applicable countries’ tax rules and rates.
MSF-35
Metropolitan Series Fund
Western Asset Management Strategic Bond Opportunities Portfolio
Notes to Financial Statements—June 30, 2016—(Continued)
Foreign Currency Translation - The books and records of the Portfolio are maintained in U.S. dollars. The values of securities, currencies, and other assets and liabilities denominated in currencies other than the U.S. dollar are translated into U.S. dollars based upon foreign exchange rates prevailing at the end of the period. Purchases and sales of investment securities, income, and expenses are translated on the respective dates of such transactions. Because the values of investment securities are translated at the foreign exchange rates prevailing at the end of the period, that portion of the results of operations arising from changes in exchange rates and that portion of the results of operations reflecting fluctuations arising from changes in market prices of the investment securities are not separated. Such fluctuations are included in the net realized and unrealized gain or loss on investments.
Net realized foreign exchange gains or losses arise from activity in forward foreign currency exchange contracts, sales of foreign currency, currency gains or losses realized between the trade and settlement dates on securities transactions, and the difference between the amounts of dividends, interest, and foreign withholding taxes recorded by the Portfolio and the U.S. dollar equivalent of the amounts actually received or paid by the Portfolio. Net unrealized foreign exchange gains and losses arise from changes in the value of assets and liabilities, other than investment securities, resulting from changes in foreign exchange rates.
Dividends and Distributions to Shareholders - The Portfolio records dividends and distributions on the ex-dividend date. Net realized gains from securities transactions (if any) are generally distributed annually to shareholders. The timing and characterization of certain income and capital gains distributions are determined in accordance with federal tax regulations that may differ from GAAP. Permanent book and tax basis differences relating to shareholder distributions will result in reclassification between under/over distributed net investment income, accumulated net realized gains/losses, and paid-in surplus. Book-tax differences are primarily due to amortization of debt securities, paydown reclasses, futures transactions, swap transactions, defaulted bonds and foreign currency transactions. These adjustments have no impact on net assets or the results of operations.
Income Taxes - It is the Portfolio’s policy to comply with the requirements of the Internal Revenue Code of 1986, as amended, and regulations thereunder, applicable to regulated investment companies and to distribute, with respect to each taxable year, all of its taxable income to shareholders. Therefore, no federal income tax provision is required. The Portfolio files U.S. federal tax returns. No income tax returns are currently under examination. The Portfolio’s federal tax returns for the prior three fiscal years remain subject to examination by the Internal Revenue Service. As of June 30, 2016, the Portfolio had no uncertain tax positions that would require financial statement recognition, or de-recognition or disclosure.
Mortgage Dollar Rolls - The Portfolio may enter into mortgage “dollar rolls” in which a Portfolio sells to-be-announced (“TBA”) mortgage-backed securities for delivery in the current month and simultaneously contracts to repurchase substantially similar (same type, coupon, and maturity) securities on a specified future date. For the duration of the transaction, or roll period, the Portfolio foregoes principal (including prepayments of principal) and interest paid on the securities sold. Dollar rolls are accounted for as purchase and sale transactions; gain or loss is recognized at the commencement of the term of the dollar roll and each time the mortgage-backed security is rolled.
Mortgage dollar roll transactions involve the risk that the market value of the securities that the Portfolio is required to reacquire may be less than the agreed-upon repurchase price of those securities and that the investment performance of securities purchased with proceeds from these transactions does not exceed the income, capital appreciation and gain or loss that would have been realized on the securities transferred or sold, as applicable, as part of the treasury or mortgage dollar roll.
Mortgage-Related and Other Asset-Backed Securities - The Portfolio may invest in mortgage-related or other asset-backed securities. These securities may include mortgage pass-through securities, collateralized mortgage obligations (“CMOs”), commercial mortgage-backed securities, CMO residuals, stripped mortgage-backed securities (“SMBS”), and other securities that directly or indirectly represent a participation in, or are secured by or payable from, mortgage loans on real property or other receivables. The value of some mortgage- or asset-backed securities may be particularly sensitive to changes in prevailing interest rates. Early repayment of principal on some mortgage-related securities may expose the Portfolio to a lower rate of return upon reinvestment of principal. The value of these securities may fluctuate in response to the market’s perception of the creditworthiness of the issuers. Additionally, although mortgages and mortgage-related securities are generally supported by some form of government or private guarantee and/or insurance, there is no assurance that private guarantors or insurers will meet their obligations.
In one type of SMBS, one class receives all of the interest from the mortgage assets (the interest-only or “IO” class), while the other class will receive all of the principal (the principal-only or “PO” class). Because principal will not be received at the maturity of an IO, adjustments are made to the book value of the security until maturity. These adjustments are netted against payments received for the IOs and the net amount is included in interest income on the Statement of Operations of the Portfolio. Payments received for POs are treated as reductions to the cost and par value of the securities. Details of mortgage-related and other asset-backed securities held by the Portfolio are included in the Portfolio’s Schedule of Investments.
The Portfolio may invest a significant portion of its assets in securities of issuers that hold mortgage and asset-backed securities and direct investments in securities backed by commercial and residential mortgage loans and other financial assets. The value and related income of these securities are sensitive to changes in economic conditions, including delinquencies and/or defaults, and may be negatively impacted by increased volatility of market prices and periods of illiquidity.
MSF-36
Metropolitan Series Fund
Western Asset Management Strategic Bond Opportunities Portfolio
Notes to Financial Statements—June 30, 2016—(Continued)
TBA Purchase & Forward Sale Commitments - The Portfolio may enter into TBA commitments to purchase or sell securities for a fixed price at a future date. TBA commitments are considered securities in themselves, and involve a risk of loss if the value of the security to be purchased or sold declines or increases prior to settlement date, which is in addition to the risk of decline in the value of the Portfolio’s other assets. TBA forward sale commitments are valued at the current market value of the underlying securities, according to the procedures described under “Investment Valuation and Fair Value Measurements”.
When-Issued and Delayed-Delivery Securities - The Portfolio may purchase securities on a when-issued or delayed-delivery basis. Settlement of such transactions normally occurs within a month or more after the purchase commitment is made. The Portfolio may purchase securities under such conditions only with the intention of actually acquiring them, but may enter into a separate agreement to sell the securities before the settlement date. Since the value of securities purchased may fluctuate prior to settlement, the Portfolio may be required to pay more at settlement than the security is worth. In addition, the purchaser is not entitled to any of the interest earned prior to settlement.
Upon making a commitment to purchase a security on a when-issued or delayed-delivery basis, the Portfolio will hold liquid assets in a segregated account with the Portfolio’s custodian, or set aside liquid assets in the Portfolio’s records, worth at least the equivalent of the amount due. The liquid assets will be monitored on a daily basis and adjusted as necessary to maintain the necessary value.
High Yield Debt Securities - The Portfolio may invest in high yield debt securities, or “junk bonds,” which are securities that are rated below “investment grade” or, if not rated, are of equivalent quality. A portfolio with high yield debt securities generally will be exposed to greater market risk and credit risk than a portfolio that invests only in investment grade debt securities because issuers of high yield debt securities are generally less secure financially, are more likely to default on their obligations, and their securities are more sensitive to interest rate changes and downturns in the economy. In addition, the secondary market for lower-rated debt securities may not be as liquid as that for more highly rated debt securities. As a result, the Portfolio’s Subadviser may find it more difficult to value lower-rated debt securities or sell them and may have to sell them at prices significantly lower than the values assigned to them by the Portfolio.
Floating Rate Loans - The Portfolio may invest in loans arranged through private negotiation between one or more financial institutions. The Portfolio’s investment in any such loan may be in the form of a participation in or an assignment of the loan. In connection with purchasing participations, the Portfolio generally will have no right to enforce compliance by the borrower with the terms of the loan agreement relating to the loan, nor any rights of set-off against the borrower. The Portfolio may not benefit directly from any collateral supporting the loan in which it has purchased the participation or assignment. The purchase of assignments will typically result in the Portfolio having a direct contractual relationship with the borrower, and the Portfolio may enforce compliance by the borrower with the terms of the loan agreement.
The Portfolio may invest in multiple series or tranches of a loan, which may have varying terms and carry different associated risks. When the Portfolio purchases assignments it acquires direct rights against the borrower of the loan. These loans may include participations in bridge loans, which are loans taken out by borrowers for a short period (typically less than one year) pending arrangement of more permanent financing.
The Portfolio will assume the credit risk of both the borrower and the lender that is selling the participation. In the event of the insolvency of the lender selling the participation, the Portfolio may be treated as a general creditor of the lender and may not benefit from any set-off between the lender and the borrower.
Repurchase Agreements - The Portfolio may enter into repurchase agreements, under the terms of a Master Repurchase Agreement (“MRA”), with selected commercial banks and broker-dealers, under which the Portfolio acquires securities as collateral and agrees to resell the securities at an agreed-upon time and at an agreed-upon price. The Portfolio, through the custodian or a subcustodian, under a tri-party repurchase agreement, receives delivery of the underlying securities collateralizing any repurchase agreements. It is the Portfolio’s policy that the market value of the collateral be equal to at least 100% of the repurchase price in the case of a repurchase agreement of one-day duration and equal to at least 102% of the repurchase price in the case of all other repurchase agreements. In the event of default or failure by a party to perform an obligation in connection with any repurchase transaction, the MRA gives the non-defaulting party the right to set-off claims and to apply property held by it in connection with any repurchase transaction against obligations owed to it.
At June 30, 2016, the Portfolio had investments in repurchase agreements with a gross value of $15,811,342, which is included as part of investments at value on the Statement of Assets and Liabilities. The value of the related collateral exceeded the value of the repurchase agreements at June 30, 2016.
Securities Lending - The Portfolio may lend its portfolio securities to certain qualified brokers who borrow securities in order to complete certain securities transactions. By lending its portfolio securities, the Portfolio attempts to increase its net investment income through the receipt of income on collateral held from securities on loan. Any gain or loss in the market price of the loaned securities that might occur and any interest earned or dividends declared during the term of the loan would accrue to the account of the Portfolio.
MSF-37
Metropolitan Series Fund
Western Asset Management Strategic Bond Opportunities Portfolio
Notes to Financial Statements—June 30, 2016—(Continued)
The Trust has entered into a Securities Lending Authorization Agreement with the custodian as the lending agent. Under this agreement, the custodian is authorized to loan portfolio securities on the Portfolio’s behalf. In exchange, the Portfolio receives either cash or securities as collateral against the loaned securities. The Portfolio receives collateral equal to at least 102% of the market value of the loaned securities (105% for foreign equity securities), at each loan’s inception. Collateral representing at least 100% of the market value of the loaned securities must be maintained for the duration of the loan. Cash collateral is generally invested in the State Street Navigator Securities Lending MET Portfolio (the “Navigator Portfolio”), a series of the State Street Navigator Securities Lending Trust that is managed by an affiliate of the custodian. The Navigator Portfolio is a registered money market fund that invests in a variety of high-quality, U.S. dollar-denominated instruments. If the market value of the collateral at the close of trading on a business day is less than 100% of the market value of the loaned securities at the close of trading on that day, the borrower shall be required to deliver, by the close of business on the following business day, an additional amount of collateral, so that the total amount of posted collateral is equal to at least 100% of the market value of all the loaned securities as of such preceding day. A portion of net income (income after the deduction of expenses and fees of the Navigator Portfolio) on the collateral is rebated to the borrower of the securities and the remainder is split between the custodian and the Portfolio. On loans collateralized by U.S. Treasuries, a fee is received from the borrower and is allocated between the Portfolio and the custodian. Income received by the Portfolio in securities lending transactions during the six months ended June 30, 2016 is reflected as Securities lending income on the Statement of Operations. The values of any securities loaned by the Portfolio and the related collateral at June 30, 2016 are disclosed in the footnotes to the Schedule of Investments. The value of the related collateral received by the Portfolio exceeded the value of the securities out on loan at June 30, 2016.
The risks associated with lending portfolio securities include, but are not limited to, possible delays in receiving additional collateral or in the recovery of the loaned securities, possible loss of rights in the collateral should the borrower fail financially, as well as risk of loss in the value of the collateral or the value of the investments made with the collateral. The lending agent shall indemnify the Portfolio in the case of default of any securities borrower.
The following table provides a breakdown of the collateral received and the remaining contractual maturities for securities lending transactions, which are accounted for as secured borrowings.
| | | | | | | | | | | | | | | | | | | | |
| | | Remaining Contractual Maturity of the Agreements
As of June 30, 2016 | |
| | | Overnight and
Continuous | | | Up to
30 Days | | | 31 - 90
Days | | | Greater than
90 days | | | Total | |
| Securities Lending Transactions | | | | | | | | | | | | | | | | | | | | |
Common Stocks | | $ | (8,342 | ) | | $ | — | | | $ | — | | | $ | — | | | $ | (8,342 | ) |
Corporate Bonds & Notes | | | (218,352,350 | ) | | | — | | | | — | | | | — | | | | (218,352,350 | ) |
Foreign Government | | | (19,727,784 | ) | | | — | | | | — | | | | — | | | | (19,727,784 | ) |
Investment Company Securities | | | (88,213 | ) | | | — | | | | — | | | | — | | | | (88,213 | ) |
Preferred Stocks | | | (1,222,629 | ) | | | — | | | | — | | | | — | | | | (1,222,629 | ) |
U.S. Treasury & Government Agencies | | | (32,250,185 | ) | | | — | | | | — | | | | — | | | | (32,250,185 | ) |
Total | | $ | (271,649,503 | ) | | $ | — | | | $ | — | | | $ | — | | | $ | (271,649,503 | ) |
Total Borrowings | | $ | (271,649,503 | ) | | $ | — | | | $ | — | | | $ | — | | | $ | (271,649,503 | ) |
Gross amount of recognized liabilities for securities lending transactions | | | $ | (271,649,503 | ) |
| | | | | | | | | | | | | | | | | | | | |
3. Investments in Derivative Instruments
Forward Foreign Currency Exchange Contracts - The Portfolio may enter into forward foreign currency exchange contracts to obtain investment exposure, enhance return or hedge or protect its portfolio holdings against the risk of future movements in certain foreign currency exchange rates. When entering into these contracts, the Portfolio agrees to receive or deliver a fixed quantity of foreign currency for an agreed-upon price on an agreed-upon future date. These contracts are valued daily and the Portfolio’s net equity therein, representing unrealized gain or loss on the contracts as measured by the difference between the forward foreign exchange rates at the dates of entry into the contracts and the forward foreign exchange rates at the valuation date, is included in the Statement of Assets and Liabilities. When a contract is closed, the Portfolio recognizes a realized gain or loss equal to the difference between the value of the contract at the time it was opened and the value at the time it was closed.
Realized and unrealized gains and losses on forward foreign currency exchange contracts are included in the Statement of Operations. These contracts involve market and/or credit risk in excess of the amount recognized in the Statement of Assets and Liabilities. The use of forward foreign currency exchange contracts does not eliminate fluctuations in the underlying prices of the securities of the Portfolio, but it does establish a rate of exchange that can be achieved in the future. Although forward foreign currency exchange contracts may limit the risk of loss due to a decline in the value of the currency holdings, they also limit any potential gain that might
MSF-38
Metropolitan Series Fund
Western Asset Management Strategic Bond Opportunities Portfolio
Notes to Financial Statements—June 30, 2016—(Continued)
result should the value of the currency increase. In addition, the Portfolio could be exposed to losses if the counterparties to the contracts are unable to meet the terms of the contracts. The Portfolio may also experience losses even when such contracts are used for hedging purposes. The Portfolio’s maximum potential loss from such contracts is the aggregate face value in U.S. dollars at the time the contract was opened.
Futures Contracts - The Portfolio may buy and sell futures contracts as a hedge, to maintain investment exposure to a target asset class or to enhance return. The Portfolio may be subject to fluctuations in equity prices, interest rates, commodity prices, and foreign currency exchange rates in the normal course of pursuing its investment objective. Futures contracts are standardized agreements to buy or sell a security, or deliver a final cash settlement price in connection with an index, interest rate, currency, or other asset. The Portfolio must deposit an amount (“initial margin”) equal to a certain percentage of the face value of the futures contract. The initial margin may be in the form of cash or securities, which is returned when the Portfolio’s obligations under the contract have been satisfied. If cash is deposited as the initial margin, it is shown as cash collateral on the Statement of Assets and Liabilities. Futures contracts are marked-to-market daily, and subsequent payments (“variation margin”) are made or received by the Portfolio depending on whether unrealized gains or losses are incurred. These amounts are reflected as receivables or payables on the Statement of Assets and Liabilities and as a component of net change in unrealized appreciation/depreciation on the Statement of Operations. When the contract is closed or expires, the Portfolio records a realized gain or loss equal to the difference between the value of the contract at the time it was opened and the value at the time it was closed. Risks of entering into futures contracts (and related options) include the possibility that the market for these instruments may be illiquid and that a change in the value of the contract or option may not correlate perfectly with changes in the value of the underlying instrument. If futures contracts are exchange-traded, the exchange’s clearinghouse, as counterparty to all exchange-traded futures, guarantees the futures contracts against default. For OTC futures, the Portfolio’s ability to terminate the positions may be more limited than in the case of exchange-traded positions and may also involve the risk that securities dealers participating in such transactions would fail to meet their obligations to the Portfolio.
Options Contracts - An option contract purchased by the Portfolio gives the Portfolio the right, but not the obligation, to buy (call) or sell (put) an underlying instrument at a fixed exercise price during a specified period. Call options written by the Portfolio give the holder the right to buy the underlying instrument from the Portfolio at a fixed exercise price; put options written by the Portfolio give the holder the right to sell the underlying instrument to the Portfolio at a fixed exercise price.
The Portfolio may use options to hedge against changes in values of securities the Portfolio owns or expects to purchase, to maintain investment exposure to a target asset class or to enhance return. Writing puts or buying calls tends to increase the Portfolio’s exposure to the underlying instrument and writing calls or buying puts tends to decrease the Portfolio’s exposure to the underlying instrument, and can be used to hedge other Portfolio investments. For options used to hedge the Portfolio’s investments, the potential risk to the Portfolio is that the change in value of options contracts may not correspond perfectly to the change in value of the hedged instruments. The Portfolio also bears the risk of an unfavorable change in the value of the underlying instrument or the risk that the Portfolio may not be able to enter into a closing transaction due to an illiquid market. The Portfolio’s maximum risk of loss from counterparty credit risk, as opposed to investment and other types of risk, in respect of purchased options is typically the premium initially paid for the option plus any unrealized gains.
The main risk associated with purchasing an option is that the option expires without being exercised. In this case, the option is worthless when it expires and the premium paid for the option is considered a realized loss. The risk associated with writing a call option is that the Portfolio may forgo the opportunity for a profit if the market value of the underlying instrument increases and the option is exercised, requiring the Portfolio to sell the underlying instrument at a price below its market value. When the Portfolio writes a call option on a security it does not own, its exposure on such an option is theoretically unlimited. The risk in writing a put option is that the Portfolio may incur a loss if the market value of the underlying instrument decreases and the option is exercised, requiring the Portfolio to purchase the underlying instrument at a price above its market value. In addition, the Portfolio risks not being able to enter into a closing transaction for the written option as the result of an illiquid market for the option.
Purchases of put and call options are recorded as investments, the value of which are marked-to-market daily. When the Portfolio enters into a closing sale transaction, the Portfolio will realize a gain or loss depending on whether the sales proceeds from the closing sale transaction are greater or less than the premium initially paid for the option. When the Portfolio exercises a put option, it will realize a gain or loss from the sale of the underlying instrument and the proceeds from such sale will be decreased by the premium originally paid for the put option. When the Portfolio exercises a call option, the cost of the security which the Portfolio purchases upon exercise will be increased by the premium originally paid for the call option.
The premium received by the Portfolio for a written option is recorded as an asset and an equivalent liability. The liability is subsequently marked to market to reflect the current value of the option written. When a written option expires without being exercised or the Portfolio enters into a closing purchase transaction, the Portfolio realizes a gain (or loss if the cost of the closing purchase transaction exceeds the premium received when the option was sold) without regard to any unrealized gain or loss on the underlying instrument and the liability related to such option is eliminated. When a written call option is exercised, the Portfolio realizes a gain or loss, as adjusted for the premium received, from the sale of the underlying instrument. When a written put option is exercised, the premium received by the Portfolio is offset against the amount paid for the purchase of the underlying instrument.
MSF-39
Metropolitan Series Fund
Western Asset Management Strategic Bond Opportunities Portfolio
Notes to Financial Statements—June 30, 2016—(Continued)
Options on Exchange-Traded Futures Contract (“Futures Option”) is an option contract in which the underlying instrument is a single futures contract.
The purpose of inflation-capped options is to protect the buyer from inflation, above a specified rate, eroding the value of investments in inflation-linked products with a given notional exposure. Inflation-capped options are used to give downside protection to investments in inflation-linked products by establishing a floor on the value of such products.
Options on swaps (“swaptions”) are similar to options on securities except that instead of selling or purchasing the right to buy or sell a security, the writer or purchaser of the swaptions is granting or buying the right to enter into a previously agreed upon interest rate or credit default swap agreement (interest rate risk and/or credit risk) at any time before the expiration of the option.
Swap Agreements - The Portfolio may enter into swap agreements in which the Portfolio and a counterparty agree to either make periodic net payments on a specified notional amount or net payment upon termination. Swap agreements are either privately negotiated in the OTC market (“OTC swaps”) or executed in a multilateral or other trade facility platform, such as a registered commodities exchange (“centrally-cleared swaps”). The Portfolio may enter into swap agreements for the purposes of managing exposure to interest rate, credit or market risk, or for other purposes. In connection with these agreements, securities or cash may be paid or received, as applicable, by the Portfolio as collateral or margin in accordance with the terms of the respective swap agreements to provide assets of value and recourse in the event of default or bankruptcy/insolvency. Securities posted by the Portfolio as collateral for swap contracts are identified in the Schedule of Investments and restricted cash, if any, is reflected on the Statement of Assets and Liabilities.
Centrally Cleared Swaps: Clearinghouses currently offer clearing derivative transactions which include interest rate and credit derivatives. In a cleared derivative transaction, a Portfolio typically enters into the transaction with a financial institution counterparty, and performance of the transaction is effectively guaranteed by a central clearinghouse, thereby reducing or eliminating the Portfolio’s exposure to the credit risk of the original counterparty. The Portfolio typically will be required to post specified levels of margin with the clearinghouse or at the instruction of the clearinghouse; the margin required by a clearinghouse may be greater than the margin the Portfolio would be required to post in an uncleared derivative transaction.
Swap agreements are marked-to-market daily. The fair value of an OTC swap is reflected on the Statement of Assets and Liabilities. The changes in value, if any, are reflected as a component of net change in unrealized appreciation/depreciation on the Statement of Operations. Daily changes in valuation of centrally cleared swaps, if any, are recorded as a receivable or payable for variation margin on the Statement of Assets and Liabilities and as a component of unrealized appreciation/depreciation on the Statement of Operations. Upfront payments paid or received upon entering into the swap agreement compensate for differences between the stated terms of the swap agreement and prevailing market conditions (such as credit spreads, currency exchange rates, interest rates, and other relevant factors). Upon termination or maturity of the swap, upfront premiums are recorded as realized gains or losses on the Statement of Operations. A liquidation payment received or made at the termination of the swap is recorded as realized gain or loss on the Statement of Operations. Net periodic payments received or paid by the Portfolio are included as part of realized gains or losses on the Statement of Operations.
Swap transactions involve, to varying degrees, elements of interest rate, credit, and market risk in excess of the amounts recognized in the Statement of Assets and Liabilities. Such risks involve the possibility that there will be no liquid market for these agreements, that the counterparty to the agreements may default on its obligation to perform, or that there may be unfavorable changes in market conditions or interest rates. In addition, entering into swap agreements involves documentation risk resulting from the possibility that the parties to a swap agreement may disagree as to the meaning of contractual terms in the agreement. The Portfolio may enter into swap transactions with counterparties in accordance with guidelines established by the Board. These guidelines provide for a minimum credit rating for each counterparty and various credit enhancement techniques (for example, collateralization of amounts due from counterparties) to limit exposure to counterparties that have lower credit ratings. A Portfolio’s maximum risk of loss from counterparty credit risk is the discounted value of the net cash flows to be received from the counterparty over the contract’s remaining life, to the extent that amount is positive, or the fair value of the contract. The risk may be mitigated by having a master netting arrangement between the Portfolio and the counterparty and by the posting of collateral by the counterparty to cover the Portfolio’s exposure to the counterparty. Counterparty risk related to centrally-cleared swaps is mitigated due to the protection against defaults provided by the exchange on which these contracts trade.
Credit Default Swaps: The Portfolio is subject to credit risk in the normal course of pursuing its investment objectives. The Portfolio may enter into credit default swaps to manage its exposure to the market or certain sectors of the market, to reduce its risk exposure to defaults of corporate and/or sovereign issuers, or to create exposure to corporate and/or sovereign issuers to which they are not otherwise exposed. Credit default swaps involve one party making a stream of payments (referred to as the buyer of protection) to another party (the seller of protection) in exchange for the right to receive a specified return if a credit event occurs for the referenced entity, obligation or index. A credit event is defined under the terms of each swap agreement and may include, but is not limited to, underlying entity default, bankruptcy, write-down, principal shortfall or interest shortfall. As the seller of protection, if an underlying credit event occurs, the Portfolio will either pay the buyer an amount equal to the notional amount of the swap and take
MSF-40
Metropolitan Series Fund
Western Asset Management Strategic Bond Opportunities Portfolio
Notes to Financial Statements—June 30, 2016—(Continued)
delivery of the referenced obligation (or underlying securities comprising the referenced index), or pay a net settlement amount in the form of cash or securities equal to the notional amount of the swap less the recovery value of the referenced obligation (or underlying securities comprising the referenced index). In return, the Portfolio would receive from the counterparty an upfront or periodic stream of payments throughout the life of the credit default swap agreement provided that no credit event has occurred. As the seller of protection, the Portfolio will effectively add leverage to its portfolio because, in addition to its total net assets, the Portfolio would be subject to investment exposure on the notional amount of the credit default swap.
The Portfolio may also purchase credit default swap contracts in order to hedge against the risk of default of debt securities held in its portfolio. This would involve the risk that the investment may be worthless when it expires and would only generate income in the event of an actual default by the issuer of the underlying obligation (as opposed to a credit downgrade or other indication of financial instability). It would also involve credit risk, whereby the seller may fail to satisfy its payment obligations to the Portfolio in the event of a default. As the buyer of protection, if an underlying credit event occurs, the Portfolio will either receive from the seller of protection an amount equal to the notional amount of the swap and deliver the referenced obligation (or underlying securities comprising the referenced index), or receive a net settlement amount in the form of cash or securities equal to the notional amount of the swap less the recovery value of the referenced obligation (or underlying securities comprising the referenced index). If no credit event occurs and the Portfolio is a buyer of protection, the Portfolio will typically recover nothing under the credit default swap agreement, but it will have had to pay the required upfront payment or stream of continuing payments under the credit default swap agreement. Recovery values are at times established through the credit event auction process in which market participants are ensured that a transparent price has been set for the defaulted obligation.
Credit default swap agreements on credit indices involve one party making a stream of payments to another party in exchange for the right to receive a specified return in the event of a write-down, principal shortfall, interest shortfall or default of all or part of the referenced entities comprising the credit index. A credit index is a basket of credit instruments or exposures designed to be representative of some part of the credit market as a whole. An index credit default swap references all the names in the index, and if there is a credit event involving an entity in the index, the credit event is settled based on that entity’s weight in the index. A Portfolio may use credit default swaps on credit indices as a hedge for credit default swaps or bonds held in the portfolio, which is less expensive than it would be to buy many individual credit default swaps to achieve similar effect. Credit default swaps on indices are benchmarks for protecting investors owning bonds against default, and may be used to speculate on changes in credit quality.
Implied credit spreads, represented in absolute terms, utilized in determining the market value of credit default swap agreements on a credit index or corporate or sovereign issuer, serve as some indication of the status of the payment/performance risk and the likelihood or risk of default for the credit derivative. The implied credit spread of a particular referenced entity or index also reflects the cost of buying/selling protection and may reflect upfront payments required to be made to enter into the agreement. Wider credit spreads generally represent a deterioration of the referenced entity’s credit soundness and a greater likelihood or risk of default or other credit event occurring as defined under the terms of the particular swap agreement. When no implied credit spread is available for a credit default swap, the current unrealized appreciation/depreciation on the position may be used as an indicator of the current status of the payment/performance risk.
The maximum potential amount of future payments (undiscounted) that the Portfolio as a seller of protection could be required to make under a credit default swap agreement would be an amount equal to the notional amount of the agreement. Notional amounts of all credit default swap agreements outstanding as of June 30, 2016, for which the Portfolio is the seller of protection, are disclosed in the Schedule of Investments. These potential amounts would be partially offset by any recovery values of the respective referenced obligations, upfront payments received upon entering into the agreement or net amounts received from the settlement of buy protection credit default swap agreements entered into by the Portfolio for the same referenced entity or entities.
Currency Swaps: The Portfolio may enter into currency swap agreements to gain or mitigate exposure to currency risk. A currency swap is an agreement to exchange cash flows on a notional amount of two or more currencies based on the relative value differential among them. Such swaps may involve initial and final exchanges that correspond to the agreed upon notional amount. Currency swaps usually involve the delivery of the entire principal value of one designated currency in exchange for the other designated currency. Therefore, the entire principal value of a currency swap is subject to the risk that the other party to the swap will default on its contractual delivery obligations. If there is a default by the counterparty, the Portfolio may have contractual remedies pursuant to the agreements related to the transaction.
Interest Rate Swaps: The Portfolio may enter into interest rate swaps to manage its exposure to interest rates or to protect against currency fluctuations, to adjust the interest rate sensitivity (duration), to preserve a return or spread on a particular investment, or otherwise as a substitute for a direct investment in debt securities. The Portfolio is subject to interest rate risk exposure in the normal course of pursuing its investment objectives. Because the Portfolio holds fixed rate bonds, the value of these bonds may decrease if interest rates rise. To help hedge against this risk and to maintain its ability to generate income at prevailing market rates, the Portfolio may enter into interest rate swap agreements. Interest rate swaps are agreements in which one party pays a stream of interest payments, either fixed or floating rate, for another party’s stream of interest payments, either fixed or floating, on the same
MSF-41
Metropolitan Series Fund
Western Asset Management Strategic Bond Opportunities Portfolio
Notes to Financial Statements—June 30, 2016—(Continued)
notional amount for a specified period of time. Other forms of interest rate swap agreements may include: (1) interest rate caps, under which, in return for a premium, one party agrees to make payments to the other to the extent that interest rates exceed a specified rate, or “cap”; (2) interest rate floors, under which, in return for a premium, one party agrees to make payments to the other to the extent that interest rates fall below a specified rate, or “floor”; and (3) interest rate collars, under which a party sells a cap and purchases a floor or vice versa in an attempt to protect itself against interest rate movements exceeding given minimum or maximum levels. The Portfolio’s maximum risk of loss from counterparty credit risk, as opposed to investment and other types of risk, in respect of interest rate swaps is typically the discounted net value of the cash flows to be received from the counterparty over the contract’s remaining life, to the extent that amount is positive.
The following table summarizes the fair value of derivatives held by the Portfolio at June 30, 2016 by category of risk exposure:
| | | | | | | | | | | | |
| | | Asset Derivatives | | | Liability Derivatives | |
Risk Exposure | | Statement of Assets &
Liabilities Location | | Fair Value | | | Statement of Assets &
Liabilities Location | | Fair Value | |
Interest Rate | | Investments at market value (a) (f) | | $ | 2,582,197 | | | | | | | |
| | OTC swap contracts at market value (b) | | | 4,848,787 | | | | | | | |
| | Unrealized appreciation on centrally cleared swap contracts (c) (d) | | | 1,419,499 | | | Unrealized depreciation on centrally cleared swap contracts (c) (d) | | | 4,627,508 | |
| | Unrealized appreciation on futures contracts (c) (e) | | | 23,819,664 | | | Unrealized depreciation on futures contracts (c) (e) | | | 34,250,929 | |
| | | | | | | | Written options at value | | | 215,621 | |
Credit | | Investments at market value (a) | | | 1,614,542 | | | | | | | |
| | Unrealized appreciation on centrally cleared swap contracts (c) (d) | | | 494,375 | | | Unrealized depreciation on centrally cleared swap contracts (c) (d) | | | 6,923 | |
| | | | | | | | Written options at value | | | 104,960 | |
Foreign Exchange | | Investments at market value (a) | | | 73,065 | | | | | | | |
| | OTC swap contracts at market value (b) | | | 1,595,461 | | | | | | | |
| | Unrealized appreciation on forward foreign currency exchange contracts | | | 25,942,950 | | | Unrealized depreciation on forward foreign currency exchange contracts | | | 27,344,197 | |
| | | | | | | | Written options at value | | | 1,613,520 | |
| | | | | | | | | | | | |
| Total | | | | $ | 62,390,540 | | | | | $ | 68,163,658 | |
| | | | | | | | | | | | |
| | (a) | Represents purchased options which are part of investments as shown in the Statement of Assets and Liabilities. |
| | (b) | Excludes OTC swap interest receivable of $263,306 and OTC swap interest payable of $174,035. |
| | (c) | Financial instrument not subject to a master netting agreement. |
| | (d) | Represents the unrealized appreciation/depreciation of centrally cleared swaps as reported in the Schedule of Investments. Only the variation margin is reported within the Statement of Assets and Liabilities. |
| | (e) | Includes cumulative appreciation/depreciation of futures contracts as reported in the Schedule of Investments. Only the current day’s variation margin is reported within the Statement of Assets and Liabilities. |
| | (f) | Includes exchange traded purchased options with a value of $2,500,000 that are not subject to a master netting agreement. |
The Portfolio is required to disclose the impact of offsetting assets and liabilities represented in the Statement of Assets and Liabilities to enable users of the financial statements to evaluate the effect or potential effect of netting arrangements on its financial position for recognized assets and liabilities.
The following table presents the Portfolio’s derivative assets by counterparty net of amounts available for offset under a master netting agreement (“MNA”) (see Note 4), or similar agreement, and net of the related collateral received by the Portfolio as of June 30, 2016.
| | | | | | | | | | | | | | | | |
Counterparty | | Derivative Assets
subject to an MNA
by Counterparty | | | Financial
Instruments
available for offset | | | Collateral
Received† | | | Net
Amount* | |
Bank of America N.A. | | $ | 12,870,678 | | | $ | (1,715,875 | ) | | $ | (4,821,632 | ) | | $ | 6,333,171 | |
Barclays Bank plc | | | 10,595,625 | | | | (10,595,625 | ) | | | — | | | | — | |
BNP Paribas | | | 599,009 | | | | (104,960 | ) | | | (392,055 | ) | | | 101,994 | |
Citibank N.A. | | | 8,538,305 | | | | (8,488,008 | ) | | | — | | | | 50,297 | |
Credit Suisse International | | | 914,448 | | | | — | | | | (914,448 | ) | | | — | |
Deutsche Bank AG | | | 39,614 | | | | — | | | | — | | | | 39,614 | |
JPMorgan Chase Bank N.A. | | | 599,323 | | | | (599,323 | ) | | | — | | | | — | |
| | | | | | | | | | | | | | | | |
| | $ | 34,157,002 | | | $ | (21,503,791 | ) | | $ | (6,128,135 | ) | | $ | 6,525,076 | |
| | | | | | | | | | | | | | | | |
MSF-42
Metropolitan Series Fund
Western Asset Management Strategic Bond Opportunities Portfolio
Notes to Financial Statements—June 30, 2016—(Continued)
The following table presents the Portfolio’s derivative liabilities by counterparty net of amounts available for offset under an MNA, or similar agreement, and net of the related collateral pledged by the Portfolio as of June 30, 2016.
| | | | | | | | | | | | | | | | |
Counterparty | | Derivative Liabilities
subject to an MNA
by Counterparty | | | Financial
Instruments
available for offset | | | Collateral
Pledged† | | | Net
Amount** | |
Bank of America N.A. | | $ | 1,715,875 | | | $ | (1,715,875 | ) | | $ | — | | | $ | — | |
Barclays Bank plc | | | 12,504,187 | | | | (10,595,625 | ) | | | — | | | | 1,908,562 | |
BNP Paribas | | | 104,960 | | | | (104,960 | ) | | | — | | | | — | |
Citibank N.A. | | | 8,488,008 | | | | (8,488,008 | ) | | | — | | | | — | |
JPMorgan Chase Bank N.A. | | | 6,465,268 | | | | (599,323 | ) | | | — | | | | 5,865,945 | |
| | | | | | | | | | | | | | | | |
| | $ | 29,278,298 | | | $ | (21,503,791 | ) | | $ | — | | | $ | 7,774,507 | |
| | | | | | | | | | | | | | | | |
| | * | Net amount represents the net amount receivable from the counterparty in the event of default. |
| | ** | Net amount represents the net amount payable due to the counterparty in the event of default. |
| | † | In some instances, the actual collateral received and/or pledged may be more than the amount shown here due to overcollateralization. |
The following tables summarize the effect of derivative instruments on the Statement of Operations, classified by derivative type and category of risk exposure, for the six months ended June 30, 2016:
| | | | | | | | | | | | | | | | |
Statement of Operations Location—Net Realized Gain (Loss) | | Interest Rate | | | Credit | | | Foreign
Exchange | | | Total | |
Investments (a) | | $ | (139,346 | ) | | $ | (192,754 | ) | | $ | — | | | $ | (332,100 | ) |
Forward foreign currency transactions | | | — | | | | — | | | | (2,292,444 | ) | | | (2,292,444 | ) |
Futures contracts | | | (2,462,360 | ) | | | — | | | | — | | | | (2,462,360 | ) |
Swap contracts | | | 1,076,660 | | | | (2,152,344 | ) | | | 94,128 | | | | (981,556 | ) |
Written options | | | 859,387 | | | | — | | | | — | | | | 859,387 | |
| | | | | | | | | | | | | | | | |
| | $ | (665,659 | ) | | $ | (2,345,098 | ) | | $ | (2,198,316 | ) | | $ | (5,209,073 | ) |
| | | | | | | | | | | | | | | | |
| | | | |
Statement of Operations Location—Net Change in Unrealized Appreciation
(Depreciation) | | Interest Rate | | | Credit | | | Foreign
Exchange | | | Total | |
Investments (a) | | $ | 990,108 | | | $ | (1,450,704 | ) | | $ | (597,338 | ) | | $ | (1,057,934 | ) |
Forward foreign currency transactions | | | — | | | | — | | | | (3,275,328 | ) | | | (3,275,328 | ) |
Futures contracts | | | (12,029,949 | ) | | | — | | | | — | | | | (12,029,949 | ) |
Swap contracts | | | 3,436,565 | | | | 487,452 | | | | (67,420 | ) | | | 3,856,597 | |
Written options | | | 54,943 | | | | 375,040 | | | | (1,159,596 | ) | | | (729,613 | ) |
| | | | | | | | | | | | | | | | |
| | $ | (7,548,333 | ) | | $ | (588,212 | ) | | $ | (5,099,682 | ) | | $ | (13,236,227 | ) |
| | | | | | | | | | | | | | | | |
For the six months ended June 30, 2016, the average notional par or face amount outstanding for each derivative type was as follows:
| | | | |
Derivative Description | | Average
Notional Par or
Face Amount‡ | |
Investments (a) | | $ | 810,251,333 | |
Forward foreign currency transactions | | | 882,299,338 | |
Futures contracts long | | | 578,096,457 | |
Futures contracts short | | | (564,909,225 | ) |
Swap contracts | | | 1,083,842,301 | |
Written options | | | (366,484,667 | ) |
| | ‡ | Averages are based on activity levels during the period. |
| | (a) | Represents purchased options which are part of net realized gain (loss) on investments and net change in unrealized appreciation (depreciation) on investments as shown in the Statement of Operations. |
MSF-43
Metropolitan Series Fund
Western Asset Management Strategic Bond Opportunities Portfolio
Notes to Financial Statements—June 30, 2016—(Continued)
Written Options
The Portfolio transactions in written options during the six months ended June 30, 2016:
| | | | | | | | | | | | |
Call Options | | Notional
Amount* | | | Number of
Contracts | | | Premium
Received | |
Options outstanding December 31, 2015 | | | — | | | | — | | | $ | — | |
Options written | | | 934,280,000 | | | | 6,472 | | | | 4,507,657 | |
Options bought back | | | — | | | | (5,517 | ) | | | (3,286,007 | ) |
Options exercised | | | — | | | | (751 | ) | | | (374,778 | ) |
Options expired | | | — | | | | (204 | ) | | | (122,384 | ) |
| | | | | | | | | | | | |
Options outstanding June 30, 2016 | | | 934,280,000 | | | | — | | | $ | 724,488 | |
| | | | | | | | | | | | |
| | | |
Put Options | | Notional
Amount* | | | Number of
Contracts | | | Premium
Received | |
Options outstanding December 31, 2015 | | | — | | | | — | | | $ | — | |
Options written | | | 100,000,000 | | | | 6,878 | | | | 3,965,756 | |
Options bought back | | | — | | | | (5,688 | ) | | | (3,316,077 | ) |
Options expired | | | — | | | | (1,190 | ) | | | (169,679 | ) |
| | | | | | | | | | | | |
Options outstanding June 30, 2016 | | | 100,000,000 | | | | — | | | $ | 480,000 | |
| | | | | | | | | | | | |
| | * | Amount shown is in the currency in which the transaction was denominated. |
4. Certain Risks
In the normal course of business, the Portfolio invests in securities and enters into transactions where risks exist due to fluctuations in the market (“market risk”) or failure of the other party to a transaction to perform (“credit and counterparty risk”).
Market Risk: The value of securities held by the Portfolio may decline in response to certain events, including those directly involving the companies whose securities are owned by the Portfolio; conditions affecting the general economy; overall market changes; local, regional or global political, social or economic instability; and currency, interest rate, and price fluctuations.
Credit and Counterparty Risk: The Portfolio may be exposed to counterparty risk, or the risk that an entity with which the Portfolio has unsettled or open transactions may default. The potential loss could exceed the value of the financial assets and liabilities recorded in the financial statements. Financial assets that potentially expose the Portfolio to credit and counterparty risk consist principally of cash due from counterparties and investments. The Portfolio manages counterparty risk by entering into agreements only with counterparties that it believes have the financial resources to honor their obligations and by monitoring the financial stability of those counterparties. The Portfolio’s investment adviser attempts to mitigate counterparty risk by (i) periodically assessing the creditworthiness of its trading partners, (ii) monitoring and/or limiting the amount of its net exposure to each individual counterparty based on its assessment, and (iii) requiring collateral from the counterparty for certain transactions. In order to preserve certain safeguards for non-standard settlement trades, the Portfolio restricts its exposure to credit and counterparty losses by entering into master netting agreements (“Master Agreements”) with counterparties (approved brokers) with whom it undertakes a significant volume of transactions. Master Agreements govern the terms of certain transactions, and reduce the counterparty risk associated with relevant transactions by specifying credit protection mechanisms and providing standardization that improves legal certainty. Master Agreements can also help limit counterparty risk by specifying collateral posting arrangements at pre-arranged exposure levels. Collateral requirements may differ by type of derivative or investment, as applicable. Collateral or margin requirements are set by the broker or exchange clearing house for exchange-traded derivatives (e.g., futures contracts and exchange-traded options), while collateral terms are contract specific for OTC traded derivatives (e.g., forward foreign currency exchange contracts, swap agreements and OTC options).
For derivatives traded under an International Swaps and Derivatives Association, Inc. Master Agreement (“ISDA Master Agreement”) or similar master agreement, the collateral requirements are netted across all transactions traded under such agreement and one amount is posted from one party to the other to collateralize such obligations. The ISDA Master Agreement gives each party to the agreement the right to terminate all transactions traded under such agreement if there is a certain deterioration in the credit quality of the other party. The ISDA Master Agreement gives the Portfolio the right, upon an event of default by the applicable counterparty or a termination of the agreement, to close out all transactions traded under such agreement and to net amounts owed under each transaction to one net amount payable by one party to the other. This right to close out and net payments across all transactions traded under the ISDA Master Agreement could result in a reduction of the Portfolio’s credit risk to such counterparty equal to any amounts payable by the Portfolio under the applicable transactions, if any. However, absent an event of default by the counterparty or
MSF-44
Metropolitan Series Fund
Western Asset Management Strategic Bond Opportunities Portfolio
Notes to Financial Statements—June 30, 2016—(Continued)
a termination of the agreement, the ISDA Master Agreement does not result in an offset of reported amounts of assets and liabilities in the Statement of Assets and Liabilities across transactions between the Portfolio and the applicable counterparty. The enforceability of the right to offset may vary by jurisdiction. Cash collateral that has been pledged to cover obligations of the Portfolio under derivative contracts, if any, will be reported separately in the Statement of Assets and Liabilities. Securities pledged as collateral, if any, for the same purpose are noted in the Schedule of Investments.
Repurchase and reverse repurchase agreements are primarily executed under Global Master Repurchase Agreements (“GMRAs”) or Master Repurchase Agreements (“MRAs”), which provide the rights to set-off. Each repurchase and reverse repurchase agreement is initially collateralized at the transaction level. In the event of default, the total market value exposure will be offset against collateral exchanged to date, which would result in a net receivable/(payable) that would be due from/to the counterparty.
Master Securities Forward Transaction Agreements (“MSFTA”) govern the considerations and factors surrounding the settlement of certain forward settling transactions, such as TBA securities and delayed-delivery or secured borrowings transactions by and between the Portfolio and select counterparties. The MSFTA maintain provisions for, among other things, initiation and confirmation, payment and transfer, events of default, termination, and maintenance of collateral.
Customer Account Agreements and related addenda govern cleared derivatives transactions such as futures, options on futures, and cleared OTC derivatives. Cleared derivative transactions require posting of initial margin as determined by each relevant clearing agency, which is segregated at a broker account registered with the Commodities Futures Trading Commission (“CFTC”), or the applicable regulator. In the U.S., counterparty risk is significantly reduced as creditors of the futures broker do not have claim to Portfolio assets in the segregated account. Additionally, portability of exposure in the event of default further reduces risk to the Portfolio. Variation margin, or changes in market value, are exchanged daily, but may not be netted between futures and cleared OTC derivatives.
Additional risks associated with each type of investment are described above within the respective security type notes. The Portfolio’s prospectus includes a discussion of the principal risks of investing in the Portfolio.
5. Investment Transactions
Aggregate cost of purchases and proceeds of sales of investment securities, including mortgage dollar roll and TBA transactions but excluding short-term securities, for the six months ended June 30, 2016 were as follows:
| | | | | | | | | | | | |
Purchases | | | Sales | |
U.S. Government | | Non U.S. Government | | | U.S. Government | | | Non U.S. Government | |
| $171,969,714 | | $ | 1,258,235,085 | | | $ | 379,615,574 | | | $ | 544,813,865 | |
With respect to the Portfolio’s merger with Lord Abbett Bond Debenture Portfolio and Pioneer Strategic Income Portfolio (see Note 9) on April 29, 2016, the Portfolio acquired long-term securities with a cost of $1,569,020,310 that are not included in the above purchases values.
6. Investment Management Fees and Other Transactions with Affiliates
Investment Management Agreement - MetLife Advisers is the investment adviser to the Portfolio. The Trust has entered into an investment management agreement with MetLife Advisers with respect to the Portfolio. For providing investment management services to the Portfolio, MetLife Advisers receives monthly compensation at the following annual rates:
| | | | | | |
Management
Fees earned by
MetLife Advisers
for the six months ended
June 30, 2016 | | % per annum | | | Average Daily Net Assets |
| $5,829,729 | | | 0.650 | % | | Of the first $500 million |
| | | 0.550 | % | | On amounts in excess of $500 million |
MetLife Advisers has entered into an investment subadvisory agreement with respect to managing the Portfolio. Western Asset Management Company is compensated by MetLife Advisers to provide subadvisory services for the Portfolio.
MSF-45
Metropolitan Series Fund
Western Asset Management Strategic Bond Opportunities Portfolio
Notes to Financial Statements—June 30, 2016—(Continued)
Management Fee Waiver - Pursuant to a management fee waiver agreement, MetLife Advisers has agreed, for the period May 1, 2016 to April 30, 2017, to reduce its advisory fees set out above under “Investment Management Agreement” for each class of the Portfolio as follows:
| | |
% per annum | | Average Daily Net Assets |
| 0.055% | | On the first $500 million |
| 0.025% | | On the next $500 million |
| 0.050% | | On the next $1 billion |
| 0.075% | | On amounts in excess of $2 billion |
Prior to May 1, 2016 the Adviser had agreed, for the period May 1, 2015 to April 30, 2016, to reduce its advisory fees set out above under “Investment Management Agreement” for each class of the Portfolio as follows:
| | |
% per annum | | Average Daily Net Assets |
| 0.055% | | On the first $500 million |
| 0.025% | | On the next $500 million |
| 0.050% | | On amounts in excess of $1 billion |
Amounts waived for the six months ended June 30, 2016 are shown as a management fee waiver in the Statement of Operations.
Certain officers and trustees of the Trust may also be officers of MetLife Advisers; however, such officers and trustees receive no compensation from the Trust.
On January 12, 2016, MetLife, Inc. announced its plan to pursue the separation of a substantial portion of its retail segment and is currently evaluating structural alternatives for such separation. It is anticipated that MetLife Advisers would be included in any such separation. Any separation transaction that might occur will be subject to the satisfaction of various conditions and approvals, including approval of any transaction by the MetLife, Inc. Board of Directors, satisfaction of any applicable requirements of the SEC, and receipt of insurance and other regulatory approvals and other anticipated conditions. Because the form of a separation had yet to be determined, MetLife, Inc. cannot currently provide a specific potential completion date or information about the potential impact on MetLife Advisers. No assurance can be given regarding the form that a separation transaction may take or the specific terms thereof, or that a separation will in fact occur. Depending on the form a separation takes, MetLife Advisers’ continued service as investment adviser to the Trusts could be subject to the satisfaction of various conditions and approvals, which may include obtaining approvals from the Trusts’ Board and shareholders.
Transfer Agency Agreement - MetLife serves as the transfer agent for the Trust. MetLife receives no fees for its services to the Trust under the transfer agency agreement.
Distribution and Service Fees - The Trust has a distribution agreement with MetLife Investors Distribution Company (“MIDC” or the “Distributor”) in which MIDC serves as the distributor for the Portfolio’s Class A, B and E Shares. MIDC is a wholly-owned subsidiary of MetLife Investors Group, LLC, an affiliate of the Adviser. The Trust has also adopted a Distribution and Service Plan under Rule 12b-1 of the 1940 Act for the Portfolio’s Class B and E Shares. Under the Distribution and Service Plan, the Class B and E Shares of the Portfolio pay a fee to compensate the Insurance Companies (or their affiliates) and other broker-dealers and financial intermediaries involved in the offer and sale of Portfolio shares for promoting or selling and servicing the Class B and E Shares. The fees under the Distribution and Service Plan for each class of the Portfolio’s shares are calculated as a percentage of the Portfolio’s average daily net assets that are attributable to that Class. Currently, the fee is 0.25% per year for Class B Shares and 0.15% per year for Class E Shares. Amounts incurred by the Portfolio for the six months ended June 30, 2016 are shown as Distribution and service fees in the Statement of Operations.
Deferred Trustee Compensation - Each Trustee who is not currently an employee of the Adviser or any of its affiliates receives compensation from the Trust for his or her service to the Trust. A deferred compensation plan (the “Plan”) is available to the Trustees on a voluntary basis. Deferred amounts remain in the Trust until distributed in accordance with the provisions of the Plan. The value of a participating Trustee’s deferral account is based on theoretical investments of deferred amounts on the normal payment dates in certain portfolios of the Trust or Met Investors Series Trust, an affiliate of the Trust, as designated by the participating Trustee. Changes in the value of participants’ deferral accounts are reflected as Trustees’ fees and expenses in the Statement of Operations. The portion of the accrued obligations allocated to the Portfolio under the Plan is reflected as Deferred trustees’ fees in the Statement of Assets and Liabilities.
7. Contractual Obligations
Under the Trust’s organizational documents, its officers and Trustees may be indemnified against certain liabilities and expenses arising out of the performance of their duties to the Trust. Additionally, the Trust has a variety of indemnification obligations under
MSF-46
Metropolitan Series Fund
Western Asset Management Strategic Bond Opportunities Portfolio
Notes to Financial Statements—June 30, 2016—(Continued)
contracts with its service providers. The Trust’s maximum exposure under these arrangements is unknown, as this would involve future claims that may be made against the Trust that have not yet occurred.
8. Income Tax Information
The tax character of distributions paid for the years ended December 31, 2015 and 2014 were as follows:
| | | | | | | | | | | | | | | | | | | | |
Ordinary Income | | | Long-Term Capital Gain | | | Total | |
2015 | | 2014 | | | 2015 | | | 2014 | | | 2015 | | | 2014 | |
| $70,587,732 | | $ | 53,344,080 | | | $ | — | | | $ | — | | | $ | 70,587,732 | | | $ | 53,344,080 | |
As of December 31, 2015, the components of distributable earnings (accumulated losses) on a federal income tax basis were as follows:
| | | | | | | | | | | | | | | | | | | | |
Undistributed
Ordinary
Income | | Undistributed
Long-Term
Capital Gain | | | Net
Unrealized
Depreciation | | | Loss Carryforwards | | | Other
Accumulated
Capital Losses | | | Total | |
| $54,024,554 | | $ | — | | | $ | (74,081,790 | ) | | $ | (16,715,740 | ) | | $ | (44,896,598 | ) | | $ | (81,669,574 | ) |
The Portfolio utilizes the provisions of the federal income tax laws that provide for the carryforward of capital losses for prior years, offsetting such losses against any future realized capital gains. Under the Regulated Investment Company Modernization Act of 2010 (the “Act”), net capital losses recognized after December 22, 2010 may be carried forward indefinitely and their character is retained as short-term and/or long-term losses. Previously, net capital losses were carried forward for up to eight years and treated as short-term losses. As a transition rule, the Act requires that post-enactment net capital losses be used before pre-enactment net capital losses.
As of December 31, 2015, the Portfolio had post-enactment accumulated short-term capital losses of $25,708,256 and post-enactment long-term accumulated capital losses of $19,188,342. The pre-enactment accumulated capital loss carryforwards and expiration dates were as follows:
| | | | | | | | |
Expiring
12/31/18 | | Expiring
12/31/17 | | | Total | |
| $2,454,113 | | $ | 14,261,627 | | | $ | 16,715,740 | |
9. Acquisition
At the close of business on April 29, 2016, the Portfolio, with aggregate Class A, Class B and Class E net assets of $1,071,049,128, $185,485,101 and $50,610,322, respectively, acquired all the assets and liabilities of both Lord Abbett Bond Debenture Portfolio of the Met Investors Series Trust (“Lord Abbett Bond Debenture”) and Pioneer Strategic Income Portfolio of the Met Investors Series Trust (“Pioneer Strategic Income”).
The acquisitions were accomplished by a tax-free exchange of shares of the Portfolio in the following amounts:
| | | | | | | | | | | | | | | | |
Portfolio | | Share Class | | | Shares Prior to
Acquisition | | | Net Assets
Prior to
Acquisition | | | Shares Issued By
Portfolio | |
Lord Abbett Bond Debenture | | | Class A | | | | 47,174,589 | | | $ | 529,283,625 | | | | 40,745,486 | |
Lord Abbett Bond Debenture | | | Class B | | | | 60,173,990 | | | | 667,991,393 | | | | 51,742,162 | |
Lord Abbett Bond Debenture | | | Class E | | | | 1,491,864 | | | | 16,610,085 | | | | 1,283,657 | |
Pioneer Strategic Income | | | Class A | | | | 81,835,600 | | | | 817,194,816 | | | | 62,909,532 | |
Pioneer Strategic Income | | | Class B | | | | 10,555,527 | | | | 103,201,552 | | | | 7,993,923 | |
Pioneer Strategic Income | | | Class E | | | | 23,060,053 | | | | 228,902,910 | | | | 17,689,560 | |
Each shareholder of Lord Abbett Bond Debenture and Pioneer Strategic Income received shares of the Portfolio with the same class designation and at the respective Class NAV, as determined at the close of business on April 29, 2016. The transaction was part of a restructuring designed to eliminate the offering of overlapping Portfolios in the MetLife, Inc. families of funds with similar investment objectives and similar investment strategies that serve as funding vehicles for insurance contracts that are offered by affiliates of MetLife. Some of the investments held by the Lord Abbett Bond Debenture and Pioneer Strategic Income Portfolios may have been purchased or sold prior to the acquisition for the purpose of complying with the anticipated investment policies or limitations of the Portfolio after the acquisition. If such purchases or sales occurred, the transaction costs were borne by Lord Abbett Bond Debenture and Pioneer Strategic Income Portfolios. All other costs associated with the merger were not borne by the shareholders of the Portfolios.
MSF-47
Metropolitan Series Fund
Western Asset Management Strategic Bond Opportunities Portfolio
Notes to Financial Statements—June 30, 2016—(Continued)
Lord Abbett Bond Debenture’s net assets on April 29, 2016 were $529,283,625, $667,991,393 and $16,610,085 for Class A, B and E shares, respectively, including investments valued at $1,206,164,787 with a cost basis of $1,199,106,024. Pioneer Strategic Income’s net assets on April 29, 2016 were $817,194,816, $103,201,552 and $228,902,910 for Class A, B and E shares, respectively, including investments valued at $1,087,157,353 with a cost basis of $1,082,699,355. For financial reporting purposes, assets received, liabilities assumed, and shares issued by the Portfolio were recorded at fair value; however, the cost basis of the investments received by the Portfolio from Lord Abbett Bond Debenture and Pioneer Strategic Income Portfolios were carried forward to align ongoing reporting of the Portfolio’s realized and unrealized gains and losses with amounts distributable to shareholders for tax purposes. The aggregate net assets of the Portfolio immediately after the acquisition were $3,670,328,932, which included $7,058,763 and $4,457,998 of acquired unrealized appreciation on investments and foreign currency transactions from Lord Abbett Bond Debenture and Pioneer Strategic Income, respectively.
Assuming the acquisition had been completed on January 1, 2016, the Portfolio’s pro-forma results of operations for the period ended June 30, 2016 are as follows:
| | | | |
Net Investment income | | $ | 83,510,023 | (a) |
Net realized and unrealized loss on investments | | | (240,570,133 | )(b) |
| | | | |
Net decrease in net assets from operations | | $ | (157,060,110 | ) |
| | | | |
Because the combined investment portfolios have been managed as a single integrated portfolio since the acquisition was completed, it is not practicable to separate the amounts of revenue and earnings of Lord Abbett Bond Debenture and Pioneer Strategic Income that have been included in the Portfolio’s Statement of Operations since April 29, 2016.
| | (a) | $48,396,506 net investment income as reported at June 30, 2016 plus $18,673,577 from Lord Abbett Bond Debenture pre-merger net investment income, plus $15,900,758 from Pioneer Strategic Income pre-merger net investment income, plus $371,150 in lower net advisory fees, plus $168,032 of pro-forma eliminated other expenses. |
| | (b) | $27,600,461 unrealized appreciation as reported at June 30, 2016 minus $169,506,997 pro-forma December 31, 2015 unrealized depreciation, plus $23,676,811 net realized loss as reported at June 30, 2016 plus $40,633,835 and $34,352,951 in net realized losses from Lord Abbett Bond Debenture and Pioneer Strategic Income pre-merger, respectively |
MSF-48
Metropolitan Series Fund
Western Asset Management Strategic Bond Opportunities Portfolio
Report of Independent Registered Public Accounting Firm
To the Shareholders of Western Asset Management Strategic Bond Opportunities Portfolio and
the Board of Trustees of Metropolitan Series Fund:
We have audited the accompanying statement of assets and liabilities, including the schedule of investments, of Western Asset Management Strategic Bond Opportunities Portfolio, one of the portfolios constituting Metropolitan Series Fund (the “Trust”), as of June 30, 2016, and the related statement of operations for the six months then ended, the statements of changes in net assets for the six months then ended and the year ended December 31, 2015, and the financial highlights for the six months then ended and each of the five years in the period ended December 31, 2015. These financial statements and financial highlights are the responsibility of the Trust’s management. Our responsibility is to express an opinion on these financial statements and financial highlights based on our audits.
We conducted our audits in accordance with the standards of the Public Company Accounting Oversight Board (United States). Those standards require that we plan and perform the audit to obtain reasonable assurance about whether the financial statements and financial highlights are free of material misstatement. The Trust is not required to have, nor were we engaged to perform, an audit of its internal control over financial reporting. Our audits included consideration of internal control over financial reporting as a basis for designing audit procedures that are appropriate in the circumstances, but not for the purpose of expressing an opinion on the effectiveness of the Trust’s internal control over financial reporting. Accordingly, we express no such opinion. An audit also includes examining, on a test basis, evidence supporting the amounts and disclosures in the financial statements, assessing the accounting principles used and significant estimates made by management, as well as evaluating the overall financial statement presentation. Our procedures included confirmation of securities owned as of June 30, 2016, by correspondence with the custodian and brokers; where replies were not received from brokers, we performed other auditing procedures. We believe that our audits provide a reasonable basis for our opinion.
In our opinion, such financial statements and financial highlights referred to above present fairly, in all material respects, the financial position of Western Asset Management Strategic Bond Opportunities Portfolio of Metropolitan Series Fund as of June 30, 2016, the results of its operations for the six months then ended, the changes in its net assets for the six months then ended and the year ended December 31, 2015, and the financial highlights for the six months then ended and each of the five years in the period ended December 31, 2015, in conformity with accounting principles generally accepted in the United States of America.
/s/ Deloitte & Touche LLP
Boston, Massachusetts
August 25, 2016
MSF-49
Metropolitan Series Fund
Shareholder Votes (Unaudited)
At a Special Meeting of Shareholders, held February 26, 2016, the shareholders of the Portfolio voted for the following proposals:
| | | | | | | | | | | | | | | | |
| | | For | | | Against | | | Abstain | | | Total | |
| To approve an Agreement and Plan of Reorganization (the “Plan”) providing for the acquisition of all of the assets of Pioneer Strategic Income Portfolio (“MIST Portfolio”) by Western Asset Management Strategic Bond Opportunities Portfolio (“MSF Portfolio”), a series of Metropolitan Series Fund, in exchange for shares of MSF Portfolio and the assumption by MSF Portfolio of the liabilities of MIST Portfolio. | | | 99,608,306.021 | | | | 3,587,211.823 | | | | 12,388,871.292 | | | | 115,584,389.136 | |
| | | | |
| To approve an Agreement and Plan of Reorganization (the “Plan”) providing for the acquisition of all of the assets of Lord Abbett Bond Debenture Portfolio (“MIST Portfolio”) by Western Asset Management Strategic Bond Opportunities Portfolio (“MSF Portfolio”), a series of Metropolitan Series Fund, in exchange for shares of MSF Portfolio and the assumption by MSF Portfolio of the liabilities of MIST Portfolio. | | | 90,922,785.440 | | | | 4,436,514.549 | | | | 10,795,195.420 | | | | 106,154,495.408 | |
MSF-50
Metropolitan Series Fund
Western Asset Management U.S. Government Portfolio
Managed by Western Asset Management Company
Portfolio Manager Commentary*
PERFORMANCE
For the six month period ended June 30, 2016, the Class A, B and E shares of the Western Asset Management U.S. Government Portfolio returned 3.10%, 3.01%, and 3.10%, respectively. The Portfolio’s benchmark, the Barclays U.S. Intermediate Government Bond Index1, returned 3.55%.
MARKET ENVIRONMENT / CONDITIONS
Despite a very sluggish first quarter, the U.S. economy generally improved over the first half of 2016, as the post-crisis trend of steady but unspectacular economic growth continued. After several shifts in messaging, the Federal Reserve (the “Fed”) remained highly accommodative throughout the period and kept rates on hold. Notwithstanding the volatility of the first six weeks of the year, risk markets generally performed well. Equity market gains were respectable, with the S&P 500 Index up 3.8% during the six-month period. International events, such as the Brexit (the U.K. referendum on leaving the European Union) vote, threatened to roil markets but largely had only modest effects.
The economy grew at a real annualized rate of 1.4% in the fourth quarter of 2015, resulting in 2.4% annual growth for 2015, which was the same annual growth rate in 2014. In a familiar pattern, expectations for the economy heading into 2016 were fairly high, only to be disappointed in the first months of the year. First quarter 2016 gross domestic product registered an anemic increase of only 0.5% and was eventually revised up to 1.1%. Positive contributions from residential investment were a principal contributor to the revision. Other areas of note were increased contributions from personal consumption expenditures, government spending and exports. Manufacturing related data, however, continued to be weak. The labor market seems to be cooling recently even though the unemployment rate ticked down from 5.0% at the end of 2015 to 4.9% by the end of June. Recent jobs numbers have been especially volatile as the economy added 287,000 in June after a dismal May jobs number of only 11,000. Looking past the monthly volatility it is evident that the jobs growth trend is slowing as gains averaged 171,500 per month over the first six months.
After the Fed raised interest rates for the first time in nearly a decade last December, the Fed entered 2016 with a goal of gradual but continuous rate hikes. Market turmoil and weak global economic data, however, forced the Fed to pause and pivot to a more dovish stance. Fed Chair Janet Yellen’s speech on March 29th confirmed this pivot as she described the need to observe financial conditions very carefully. Her discussion of the asymmetry of policy risks when growth was at a low level clarified the need for greater caution in raising rates. The Fed seemed to be focused on risk management as opposed to a very straightforward, data-dependent path of higher interest rates.
However, during the second quarter the Fed shifted its message abruptly and reinforced its position coming into the year with a clear and definitive bias to tighten. They were only awaiting the expected improvement in the data to warrant the next hike. The Fed had endorsed the notion that growth will be improving sharply from the disappointing 1.1% growth in the first quarter. But the Fed decided to keep rates on hold in June as Federal Open Market Committee participants expressed concerns about job growth, downside risks to their economic outlook, and wanting to know the impact a Brexit vote could have on the U.S. economy. Now that the U.K. has voted to leave the European Union, this only increased the Fed’s concern and uncertainty and they have most likely adopted a wait and see approach.
The price of West Texas Intermediate (WTI) crude oil continued its precipitous descent in 2016 by dropping as low as $26.21 in the first quarter before recovering to end June at $48.33. This recovery benefited energy producers, a major component of high-yield bond indices, which suffered during the price plunge. Many producers had responded to the drop in oil prices by reducing capital expenditures, raising equity capital and retiring older and less efficient rigs. Going forward, the survivors are generally better situated to operate profitably despite lower prices.
Markets were rattled at the end of June as the U.K. defied the betting lines and unexpectedly voted to leave the European Union. Treasuries immediately rallied as investors sought safe haven assets and while spread sectors underperformed, the markets were orderly and no panic selling was detected. In fact, the spread sector underperformance lasted only a couple of days and these markets recovered over the last few days of the month but Treasuries continued to rally. While the Brexit vote will clearly have major political implications, investors were unsure how significant the economic impact will be.
Both short- and long-term Treasury yields moved sharply lower during the six months ended June 30, 2016. Two-year Treasury yields fell from a peak of 1.06% at the beginning of the period to a low of 0.58% at the end of the period. Ten-year Treasury yields began the reporting period at a peak of 2.27% and ended the period at 1.49%. Their low of 1.46% occurred on June 27 and 28, 2016. Despite the extreme sell-off during the first six weeks of the year, spread product sectors including investment grade and high yield credit, structured products and emerging markets have all done well in the first half of the year as spreads have tightened and they’ve generated positive excess returns over Treasuries.
PORTFOLIO REVIEW / PERIOD END POSITIONING
The Western Asset Management U.S. Government Portfolio underperformed its benchmark for the six month reporting period. The main contributor to performance was the Portfolio’s underweight exposure to interest rate risk, as yields fell in the January to June period.
Agency mortgage-backed securities (“MBS”) underperformed Treasuries of similar interest rate risk during the first half of 2016, though
MSF-1
Metropolitan Series Fund
Western Asset Management U.S. Government Portfolio
Managed by Western Asset Management Company
Portfolio Manager Commentary*—(Continued)
the modest allocation to MBS limited the impact to overall returns. Non-Agency mortgages added to performance, as our bias towards lower dollar priced securities in the sector benefited from price appreciation based on ongoing investor demand, positive carry and continued principal paydowns.
The Portfolio was generally overweight the long end of the curve as a strategic position relative to the investment benchmark. We maintained an overweight to the back end of the yield curve over the period, which marginally helped performance as long-dated U.S. Treasury yields declined over 70 basis points in the first six months of the year. At period end, our projection for U.S. growth remained at 1.0%-1.5% for the remainder of 2016, avoiding a recession but still below the historical norm.
Over the last six months, we increased exposure to U.S. Treasuries and maintained moderate exposure to Agency Bonds, Non-Agency and Agency MBS. We generally increased our duration positioning over the first quarter after yields increased following the early year downdraft in equity markets and Treasury yields.
At period end, the Portfolio was positioned to reflect our expectation for modest U.S. economic growth and low inflation. The Portfolio’s exposure to interest rate risk was conservatively positioned relative to an average of 1-year to 10-year U.S. government securities, as shorter-dated interest rates are expected to trend modestly higher over the remainder of the year. However, at period end the Portfolio did have significant exposure to long-dated interest rates, as the yield spread to shorter bonds remains greater than average. U.S. Treasury bond yields also benefit from substantial foreign demand as foreign developed-market government bond yields are near historic lows, and often negative.
At period end, we expected inflation to remain low for some time due to weak overall demand growth, and the Portfolio maintained a substantial position in long-dated inflation-linked Treasury Inflation-Protected Securities (“TIPS”). Even in a low inflation environment, market expectations of inflation may rise to meet Fed-targeted inflation rates should domestic growth maintain its low but steady trend. Long-dated TIPS also may act as hedge against higher bond yields in a scenario of an unwarranted increase in inflation expectations.
At period end, the Portfolio held a 19% position in Agency MBS, which is at the low end of the historic range for exposure to Agency MBS in this Portfolio. Recent underperformance of this sector reflects the higher interest rate volatility seen in capital markets this year. While making MBS somewhat more attractive at current yields, the option-adjusted yield advantage of MBS remains fairly low relative to its historical average. As long as the Fed is reinvesting its substantial portfolio of MBS, spreads are likely to remain low. However, over time, we expect spreads to widen modestly and we prefer to remain conservatively positioned in MBS.
Over the reporting period, we found better opportunities for additional yield in sectors outside of Agency debentures and Agency MBS. These included U.S. dollar bonds from select emerging markets issuers and non-Agency residential MBS. Recently, spreads have narrowed on emerging market bonds but remain fairly wide versus levels seen over the past few years. While only a small part of the Portfolio at the end of June, these did provide incremental yield to the Portfolio and we believe they should do well even in an environment of better domestic economic growth.
S. Kenneth Leech
Mark S. Lindbloom
Fredrick Marki
Portfolio Managers
Western Asset Management Company
* This commentary may include statements that constitute “forward-looking statements” under the U.S. securities laws. Forward-looking statements include, among other things, projections, estimates, and information about possible or future results related to the Portfolio, market or regulatory developments. The views expressed above are not guarantees of future performance or economic results and involve certain risks, uncertainties and assumptions that could cause actual outcomes and results to differ materially from the views expressed herein. The views expressed above are subject to change at any time based upon economic, market, or other conditions and the subadvisory firm undertakes no obligation to update the views expressed herein. Any discussions of specific securities should not be considered a recommendation to buy or sell those securities. The views expressed above (including any forward-looking statement) may not be relied upon as investment advice or as an indication of the Portfolio’s trading intent. Information about the Portfolio’s holdings, asset allocation or country diversification is historical and is not an indication of future Portfolio composition, which may vary. Direct investment in any index is not possible. The performance of any index mentioned in this commentary has not been adjusted for ongoing management, distribution and operating expenses, and sales charges applicable to mutual fund investments. In addition, the returns do not reflect additional fees charged by separate accounts or variable insurance contracts that an investor in the Portfolio may pay. If these additional fees were reflected, performance would have been lower.
MSF-2
Metropolitan Series Fund
Western Asset Management U.S. Government Portfolio
A $10,000 INVESTMENT COMPARED TO THE BARCLAYS U.S. INTERMEDIATE GOVERNMENT BOND INDEX
SIX MONTH RETURN & AVERAGE ANNUAL RETURNS (%) AS OF JUNE 30, 2016
| | | | | | | | | | | | | | | | |
| | | 6 Month | | | 1 Year | | | 5 Year | | | 10 Year | |
| Western Asset Management U.S. Government Portfolio | | | | | | | | | | | | | | | | |
Class A | | | 3.10 | | | | 3.18 | | | | 2.49 | | | | 3.30 | |
Class B | | | 3.01 | | | | 2.92 | | | | 2.24 | | | | 3.04 | |
Class E | | | 3.10 | | | | 3.01 | | | | 2.33 | | | | 3.14 | |
| Barclays U.S. Intermediate Government Bond Index | | | 3.55 | | | | 3.93 | | | | 2.31 | | | | 4.07 | |
1 The Barclays U.S. Intermediate Government Bond Index includes most obligations of the U.S. Treasury, agencies and quasi-federal corporations having maturities between one and ten years.
Portfolio performance is calculated including reinvestment of all income and capital gain distributions. Performance numbers are net of all Portfolio expenses but do not include any insurance, sales, separate account or administrative charges of variable annuity or life insurance contracts or any additional expenses that participants may bear relating to the operations of their plans. If these charges were included, the returns would be lower. The performance of any index referenced above has not been adjusted for ongoing management, distribution and operating expenses, and sales charges applicable to mutual fund investments. Direct investment in any index is not possible. The performance of Class A shares, as set forth in the line graph above, will differ from that of other classes because of the difference in expenses paid by policyholders investing in the different share classes.
This information represents past performance and is not indicative of future results. Investment return and principal value may fluctuate so that shares, upon redemption, may be worth more or less than the original cost.
PORTFOLIO COMPOSITION AS OF JUNE 30, 2016
Top Sectors
| | | | |
| | | % of
Net Assets | |
| U.S. Treasury & Government Agencies | | | 82.9 | |
| Corporate Bonds & Notes | | | 9.6 | |
| Foreign Government | | | 8.2 | |
| Mortgage-Backed Securities | | | 5.5 | |
| Asset-Backed Securities | | | 1.4 | |
MSF-3
Metropolitan Series Fund
Western Asset Management U.S. Government Portfolio
Understanding Your Portfolio’s Expenses (Unaudited)
Shareholder Expense Example
As a shareholder of the Portfolio, you incur ongoing costs, including management fees; distribution and service (12b-1) fees; and other Portfolio expenses. This example is intended to help you understand your ongoing costs (in dollars) (referred to as “expenses”) of investing in the Portfolio and compare these costs with the ongoing costs of investing in other mutual funds. The example is based on an investment of $1,000 invested at the beginning of the period and held for the entire period, January 1, 2016 through June 30, 2016.
Actual Expenses
The first line for each share class of the Portfolio in the table below provides information about actual account values and actual expenses. You may use the information in this line, together with the amount you invested in the particular share class of the Portfolio, to estimate the expenses that you paid over the period. Simply divide your account value by $1,000 (for example, an $8,600 account value divided by $1,000 = 8.6), then multiply the result by the number in the first line under the heading entitled “Expenses Paid During Period” to estimate the expenses you paid on your account during this period.
Hypothetical Example for Comparison Purposes
The second line for each share class of the Portfolio in the table below provides information about hypothetical account values and hypothetical expenses based on the Portfolio’s actual expense ratio and an assumed rate of return of 5% per year before expenses, which is not the Portfolio’s actual return. The hypothetical account values and expenses may not be used to estimate the actual ending account balance or expenses you paid for the period. You may use this information to compare the ongoing costs of investing in the Portfolio and other funds. To do so, compare this 5% hypothetical example with the 5% hypothetical examples that appear in the shareholder reports of the other funds.
Please note that the expenses shown in the table are meant to highlight your ongoing costs only and do not reflect any fees or charges of your variable insurance product or any additional expenses that participants in certain eligible qualified plans may bear relating to the operations of their plan. Therefore, the second line for each share class in the table is useful in comparing ongoing costs only, and will not help you determine the relative total costs of owning different funds. In addition, if these other costs were included, your costs would have been higher.
| | | | | | | | | | | | | | | | | | |
Western Asset Management U.S. Government Portfolio | | | | Annualized
Expense
Ratio | | | Beginning
Account Value
January 1,
2016 | | | Ending
Account Value
June 30,
2016 | | | Expenses Paid
During Period**
January 1, 2016
to
June 30,
2016 | |
Class A(a) | | Actual | | | 0.48 | % | | $ | 1,000.00 | | | $ | 1,031.00 | | | $ | 2.42 | |
| | Hypothetical* | | | 0.48 | % | | $ | 1,000.00 | | | $ | 1,022.48 | | | $ | 2.41 | |
| | | | | |
Class B(a) | | Actual | | | 0.73 | % | | $ | 1,000.00 | | | $ | 1,030.10 | | | $ | 3.68 | |
| | Hypothetical* | | | 0.73 | % | | $ | 1,000.00 | | | $ | 1,021.23 | | | $ | 3.67 | |
| | | | | |
Class E(a) | | Actual | | | 0.63 | % | | $ | 1,000.00 | | | $ | 1,031.00 | | | $ | 3.18 | |
| | Hypothetical* | | | 0.63 | % | | $ | 1,000.00 | | | $ | 1,021.73 | | | $ | 3.17 | |
* Hypothetical assumes a rate of return of 5% per year before expenses.
** Expenses paid are equal to the Portfolio’s annualized expense ratio for the most recent six month period, as shown above, multiplied by the average account value over the period, multiplied by the number of days (182 days) in the most recent fiscal half-year, divided by 366 (to reflect the one-half year period).
(a) The annualized expense ratio shown reflects the impact of the management fee waiver as described in Note 6 of the Notes to Financial Statements.
MSF-4
Metropolitan Series Fund
Western Asset Management U.S. Government Portfolio
Schedule of Investments as of June 30, 2016 (Unaudited)
U.S. Treasury & Government Agencies—82.9% of Net Assets
| | | | | | | | |
| Security Description | | Principal
Amount* | | | Value | |
|
Agency Sponsored Mortgage-Backed—25.1% | |
Fannie Mae 15 Yr. Pool
2.500%, TBA (a) | | | 9,400,000 | | | $ | 9,710,451 | |
3.000%, TBA (a) | | | 6,200,000 | | | | 6,493,047 | |
3.500%, TBA (a) | | | 15,000,000 | | | | 15,875,619 | |
4.500%, 03/01/20 | | | 64,908 | | | | 66,784 | |
5.000%, 03/01/18 | | | 53,641 | | | | 55,168 | |
6.500%, 06/01/17 | | | 12,697 | | | | 12,768 | |
Fannie Mae 20 Yr. Pool
4.500%, 11/01/31 | | | 1,028,977 | | | | 1,131,677 | |
4.500%, 12/01/31 | | | 1,464,683 | | | | 1,611,546 | |
Fannie Mae 30 Yr. Pool
3.000%, 09/01/42 | | | 10,887,409 | | | | 11,442,423 | |
3.000%, TBA (a) | | | 7,900,000 | | | | 8,183,596 | |
3.500%, TBA (a) | | | 14,900,000 | | | | 15,703,202 | |
4.000%, 02/01/40 | | | 934,549 | | | | 1,029,693 | |
4.000%, 06/01/42 | | | 8,288,667 | | | | 9,131,227 | |
4.000%, 07/01/42 | | | 4,493,220 | | | | 4,851,303 | |
4.000%, 05/01/43 | | | 20,471,637 | | | | 22,446,263 | |
4.000%, 10/01/43 | | | 11,488,675 | | | | 12,573,599 | |
4.000%, TBA (a) | | | 82,800,000 | | | | 88,774,749 | |
4.500%, 04/01/41 | | | 12,527,912 | | | | 13,736,572 | |
4.500%, 10/01/41 | | | 9,315,992 | | | | 10,214,843 | |
4.500%, 07/01/44 | | | 327,533 | | | | 364,839 | |
4.500%, 10/01/44 | | | 2,091,567 | | | | 2,323,054 | |
4.500%, 01/01/45 | | | 173,561 | | | | 195,116 | |
4.500%, TBA (a) | | | 5,100,000 | | | | 5,563,755 | |
5.000%, 07/01/33 | | | 342,530 | | | | 382,223 | |
5.000%, 09/01/33 | | | 412,942 | | | | 461,040 | |
5.000%, 10/01/35 | | | 1,163,655 | | | | 1,299,040 | |
5.000%, 03/01/36 | | | 1,871,430 | | | | 2,082,506 | |
5.000%, 01/01/39 | | | 15,023 | | | | 16,867 | |
5.000%, 08/01/39 | | | 35,587 | | | | 40,002 | |
5.000%, 12/01/39 | | | 29,521 | | | | 33,149 | |
5.000%, 05/01/40 | | | 42,699 | | | | 48,010 | |
5.000%, 07/01/40 | | | 52,398 | | | | 59,035 | |
5.000%, 11/01/40 | | | 1,415,405 | | | | 1,594,807 | |
5.000%, 01/01/41 | | | 63,809 | | | | 71,590 | |
5.000%, 02/01/41 | | | 69,669 | | | | 77,355 | |
5.000%, 04/01/41 | | | 153,272 | | | | 172,812 | |
5.000%, 05/01/41 | | | 3,167,710 | | | | 3,567,574 | |
5.000%, 06/01/41 | | | 296,147 | | | | 333,901 | |
5.000%, 07/01/41 | | | 2,982,113 | | | | 3,308,767 | |
5.000%, TBA (a) | | | 2,700,000 | | | | 2,999,867 | |
6.000%, 04/01/33 | | | 97,291 | | | | 112,530 | |
6.000%, 02/01/34 | | | 21,003 | | | | 24,387 | |
6.000%, 11/01/35 | | �� | 213,690 | | | | 247,947 | |
6.000%, 08/01/37 | | | 459,740 | | | | 533,552 | |
6.500%, 03/01/26 | | | 1,409 | | | | 1,622 | |
6.500%, 04/01/29 | | | 67,426 | | | | 77,593 | |
7.000%, 11/01/28 | | | 2,072 | | | | 2,307 | |
7.000%, 02/01/29 | | | 706 | | | | 708 | |
7.000%, 01/01/30 | | | 2,261 | | | | 2,330 | |
7.000%, 10/01/37 | | | 25,894 | | | | 28,119 | |
7.000%, 11/01/37 | | | 33,406 | | | | 40,515 | |
7.000%, 12/01/37 | | | 26,289 | | | | 29,566 | |
7.000%, 02/01/38 | | | 18,229 | | | | 20,236 | |
|
Agency Sponsored Mortgage-Backed—(Continued) | |
Fannie Mae 30 Yr. Pool
7.000%, 08/01/38 | | | 14,473 | | | | 15,518 | |
7.000%, 09/01/38 | | | 3,077 | | | | 3,189 | |
7.000%, 11/01/38 | | | 157,386 | | | | 179,176 | |
7.000%, 02/01/39 | | | 1,719,077 | | | | 1,991,871 | |
7.500%, 04/01/32 | | | 13,805 | | | | 14,182 | |
8.000%, 05/01/28 | | | 4,331 | | | | 4,995 | |
8.000%, 07/01/32 | | | 893 | | | | 978 | |
Fannie Mae ARM Pool
2.042%, 07/01/37 (b) | | | 37,221 | | | | 39,401 | |
Fannie Mae Interest Strip (CMO)
3.500%, 11/25/41 (c) | | | 3,435,448 | | | | 492,890 | |
4.000%, 04/25/42 (c) | | | 4,828,049 | | | | 810,930 | |
4.500%, 11/25/39 (c) | | | 2,801,563 | | | | 444,450 | |
Fannie Mae Pool
3.500%, 08/01/42 | | | 13,655,918 | | | | 14,554,742 | |
3.500%, 09/01/42 | | | 930,638 | | | | 991,968 | |
3.500%, 10/01/42 | | | 6,508,977 | | | | 6,938,028 | |
4.000%, 10/01/42 | | | 3,994,969 | | | | 4,330,813 | |
4.000%, 11/01/42 | | | 2,747,500 | | | | 2,979,471 | |
4.000%, 07/01/43 | | | 83,109 | | | | 90,145 | |
4.000%, 08/01/43 | | | 1,864,012 | | | | 2,021,090 | |
5.000%, 05/01/40 | | | 28,833 | | | | 32,453 | |
6.500%, 12/01/27 | | | 4,762 | | | | 4,820 | |
6.500%, 05/01/32 | | | 26,264 | | | | 31,287 | |
Fannie Mae REMIC Trust Whole Loan (CMO)
3.723%, 01/25/43 (b) | | | 386,735 | | | | 407,542 | |
Fannie Mae REMICS (CMO) | | | | | | | | |
Zero Coupon, 03/25/42 (d) | | | 698,923 | | | | 632,786 | |
3.000%, 12/25/27 (c) | | | 9,212,180 | | | | 820,538 | |
5.500%, 07/25/41 | | | 8,025,793 | | | | 9,497,934 | |
5.500%, 04/25/42 | | | 2,966,963 | | | | 3,325,556 | |
5.647%, 09/25/42 (b) (c) | | | 1,638,193 | | | | 303,737 | |
5.697%, 03/25/42 (b) (c) | | | 11,369,145 | | | | 2,070,851 | |
5.697%, 12/25/42 (b) (c) | | | 1,288,869 | | | | 298,297 | |
6.000%, 05/25/42 | | | 1,912,017 | | | | 2,188,512 | |
6.077%, 01/25/41 (b) (c) | | | 1,842,966 | | | | 364,816 | |
6.097%, 10/25/41 (b) (c) | | | 6,857,271 | | | | 1,391,172 | |
6.197%, 02/25/41 (b) (c) | | | 1,123,657 | | | | 150,283 | |
6.197%, 03/25/42 (b) (c) | | | 2,749,096 | | | | 503,189 | |
6.500%, 06/25/39 | | | 383,874 | | | | 429,967 | |
6.500%, 07/25/42 | | | 3,551,786 | | | | 4,143,743 | |
9.750%, 11/25/18 | | | 549,566 | | | | 587,012 | |
9.750%, 08/25/19 | | | 176,167 | | | | 188,097 | |
Freddie Mac 30 Yr. Gold Pool
3.000%, TBA (a) | | | 10,000,000 | | | | 10,347,791 | |
4.000%, 07/01/43 | | | 6,076,266 | | | | 6,656,962 | |
4.000%, 08/01/43 | | | 6,161,204 | | | | 6,750,023 | |
4.500%, 06/01/38 | | | 2,283,564 | | | | 2,495,422 | |
5.000%, 08/01/33 | | | 30,451 | | | | 33,990 | |
5.000%, 06/01/41 | | | 7,228,954 | | | | 8,071,846 | |
6.000%, 10/01/36 | | | 1,187,832 | | | | 1,369,394 | |
6.500%, 09/01/39 | | | 422,076 | | | | 499,479 | |
8.000%, 12/01/19 | | | 850 | | | | 856 | |
8.000%, 09/01/30 | | | 4,357 | | | | 5,300 | |
See accompanying notes to financial statements.
MSF-5
Metropolitan Series Fund
Western Asset Management U.S. Government Portfolio
Schedule of Investments as of June 30, 2016 (Unaudited)
U.S. Treasury & Government Agencies—(Continued)
| | | | | | | | |
| Security Description | | Principal
Amount* | | | Value | |
|
Agency Sponsored Mortgage-Backed—(Continued) | |
Freddie Mac 30 Yr. Non-Gold Pool
8.000%, 07/01/20 | | | 1,439 | | | $ | 1,448 | |
Freddie Mac ARM Non-Gold Pool
2.247%, 02/01/37 (b) | | | 19,743 | | | | 20,594 | |
2.247%, 05/01/37 (b) | | | 38,391 | | | | 39,633 | |
2.770%, 01/01/35 (b) | | | 15,287 | | | | 16,241 | |
2.995%, 05/01/37 (b) | | | 51,444 | | | | 54,841 | |
Freddie Mac Gold Pool
3.500%, 10/01/42 | | | 1,375,600 | | | | 1,465,820 | |
3.500%, 02/01/44 | | | 616,689 | | | | 657,045 | |
4.000%, 04/01/43 | | | 2,012,351 | | | | 2,178,868 | |
4.000%, 08/01/43 | | | 1,251,624 | | | | 1,356,253 | |
Freddie Mac REMICS (CMO)
4.500%, 04/15/32 | | | 304,579 | | | | 341,878 | |
6.000%, 05/15/36 | | | 831,857 | | | | 951,229 | |
8.500%, 06/15/21 | | | 11,771 | | | | 12,782 | |
Ginnie Mae I 30 Yr. Pool
5.500%, 06/15/36 | | | 632,394 | | | | 724,250 | |
6.000%, 03/15/33 | | | 1,055,972 | | | | 1,246,464 | |
6.500%, 06/15/31 | | | 4,544 | | | | 5,184 | |
6.500%, 08/15/34 | | | 236,422 | | | | 269,723 | |
7.500%, 09/15/29 | | | 2,385 | | | | 2,731 | |
7.500%, 02/15/30 | | | 1,669 | | | | 1,745 | |
8.500%, 05/15/18 | | | 4,132 | | | | 4,149 | |
8.500%, 06/15/25 | | | 33,140 | | | | 39,771 | |
Ginnie Mae II 30 Yr. Pool
3.000%, 09/20/45 | | | 27,803,670 | | | | 29,108,225 | |
3.500%, 09/20/45 | | | 3,469,587 | | | | 3,687,206 | |
3.500%, TBA (a) | | | 24,000,000 | | | | 25,439,063 | |
4.000%, 09/20/45 | | | 2,277,176 | | | | 2,435,075 | |
4.000%, 11/20/45 | | | 13,952,536 | | | | 15,149,069 | |
4.500%, 01/20/40 | | | 1,073,917 | | | | 1,172,414 | |
4.500%, 05/20/40 | | | 1,474,656 | | | | 1,605,978 | |
4.500%, 09/20/40 | | | 29,553 | | | | 32,265 | |
4.500%, 01/20/41 | | | 226,804 | | | | 247,617 | |
4.500%, 07/20/41 | | | 1,580,509 | | | | 1,725,556 | |
5.000%, 07/20/40 | | | 1,110,451 | | | | 1,235,253 | |
6.000%, 11/20/34 | | | 2,012 | | | | 2,372 | |
6.000%, 06/20/35 | | | 3,236 | | | | 3,743 | |
6.000%, 07/20/36 | | | 199,475 | | | | 227,864 | |
6.000%, 09/20/36 | | | 9,895 | | | | 11,386 | |
6.000%, 07/20/38 | | | 529,223 | | | | 604,566 | |
6.000%, 09/20/38 | | | 1,436,588 | | | | 1,641,119 | |
6.000%, 06/20/39 | | | 5,563 | | | | 6,433 | |
6.000%, 05/20/40 | | | 126,804 | | | | 146,133 | |
6.000%, 06/20/40 | | | 333,817 | | | | 384,827 | |
6.000%, 08/20/40 | | | 174,266 | | | | 201,295 | |
6.000%, 09/20/40 | | | 445,384 | | | | 516,530 | |
6.000%, 10/20/40 | | | 276,599 | | | | 319,056 | |
6.000%, 11/20/40 | | | 390,304 | | | | 461,325 | |
6.000%, 01/20/41 | | | 346,777 | | | | 396,106 | |
6.000%, 03/20/41 | | | 1,529,144 | | | | 1,758,362 | |
6.000%, 07/20/41 | | | 315,977 | | | | 366,718 | |
6.000%, 12/20/41 | | | 212,281 | | | | 245,423 | |
6.500%, 10/20/37 | | | 435,953 | | | | 530,046 | |
|
Agency Sponsored Mortgage-Backed—(Continued) | |
Government National Mortgage Association (CMO)
0.364%, 02/16/53 (b) (c) | | | 16,950,491 | | | | 523,101 | |
0.531%, 10/16/54 (b) (c) | | | 34,655,772 | | | | 1,272,078 | |
0.532%, 05/16/54 (b) (c) | | | 21,615,210 | | | | 754,036 | |
0.687%, 03/16/49 (b) (c) | | | 13,172,131 | | | | 485,509 | |
0.772%, 09/16/51 (b) (c) | | | 70,317,743 | | | | 4,059,521 | |
0.797%, 05/16/54 (b) (c) | | | 19,900,429 | | | | 1,067,330 | |
0.816%, 12/20/60 (b) | | | 18,814,732 | | | | 18,617,772 | |
0.826%, 09/16/46 (b) (c) | | | 62,652,515 | | | | 2,103,815 | |
0.836%, 12/20/60 (b) | | | 6,647,359 | | | | 6,589,467 | |
0.891%, 11/16/55 (b) (c) | | | 29,179,896 | | | | 1,939,240 | |
0.901%, 01/16/56 (b) (c) | | | 65,367,366 | | | | 5,038,000 | |
0.916%, 06/16/55 (b) (c) | | | 14,607,248 | | | | 732,355 | |
0.916%, 03/20/61 (b) | | | 5,515,908 | | | | 5,482,667 | |
0.922%, 01/16/57 (b) (c) | | | 33,877,694 | | | | 2,658,227 | |
0.936%, 12/20/60 (b) | | | 48,553,813 | | | | 48,290,798 | |
0.949%, 09/16/55 (b) (c) | | | 22,287,041 | | | | 1,390,861 | |
1.052%, 09/16/56 (b) (c) | | | 46,114,095 | | | | 3,530,412 | |
1.069%, 09/16/44 (b) (c) | | | 20,481,798 | | | | 1,265,451 | |
1.114%, 02/16/48 (b) (c) | | | 11,480,400 | | | | 640,904 | |
1.173%, 02/16/46 (b) (c) | | | 25,965,855 | | | | 1,734,057 | |
2.250%, 03/16/35 | | | 5,162,332 | | | | 5,198,234 | |
5.658%, 08/16/42 (b) (c) | | | 1,644,365 | | | | 256,965 | |
6.052%, 03/20/39 (b) (c) | | | 505,548 | | | | 37,522 | |
6.202%, 01/20/40 (b) (c) | | | 1,301,788 | | | | 150,733 | |
| | | | | | | | |
| | | | | | | 571,539,472 | |
| | | | | | | | |
|
Federal Agencies—37.6% | |
Federal Farm Credit Bank
0.500%, 08/23/16 | | | 25,000,000 | | | | 25,005,325 | |
0.650%, 06/19/17 | | | 15,000,000 | | | | 15,003,375 | |
1.100%, 06/01/18 | | | 20,000,000 | | | | 20,131,900 | |
1.950%, 11/15/17 | | | 19,980,000 | | | | 20,340,719 | |
Federal Home Loan Bank
0.500%, 10/17/16 | | | 15,000,000 | | | | 15,005,070 | |
0.625%, 11/23/16 | | | 20,000,000 | | | | 20,010,740 | |
0.625%, 10/26/17 | | | 18,000,000 | | | | 18,006,408 | |
0.750%, 03/24/17 | | | 23,000,000 | | | | 23,044,206 | |
0.875%, 03/19/18 (e) | | | 20,000,000 | | | | 20,070,340 | |
2.000%, 09/09/16 | | | 20,000,000 | | | | 20,060,620 | |
2.125%, 06/09/23 | | | 17,700,000 | | | | 18,479,136 | |
2.750%, 06/08/18 | | | 15,000,000 | | | | 15,608,535 | |
5.250%, 12/11/20 | | | 12,000,000 | | | | 14,113,812 | |
Federal Home Loan Mortgage Corp.
Zero Coupon, 11/29/19 | | | 10,000,000 | | | | 9,593,900 | |
0.750%, 04/09/18 | | | 9,000,000 | | | | 9,010,368 | |
1.125%, 04/15/19 | | | 30,000,000 | | | | 30,254,910 | |
5.000%, 12/14/18 (e) | | | 12,741,000 | | | | 14,037,358 | |
Federal National Mortgage Association
Zero Coupon, 10/09/19 | | | 50,000,000 | | | | 48,030,350 | |
1.250%, 05/06/21 (e) | | | 20,000,000 | | | | 20,074,960 | |
2.125%, 04/24/26 | | | 10,000,000 | | | | 10,270,530 | |
2.625%, 09/06/24 | | | 22,000,000 | | | | 23,669,712 | |
See accompanying notes to financial statements.
MSF-6
Metropolitan Series Fund
Western Asset Management U.S. Government Portfolio
Schedule of Investments as of June 30, 2016 (Unaudited)
U.S. Treasury & Government Agencies—(Continued)
| | | | | | | | |
| Security Description | | Principal
Amount* | | | Value | |
|
Federal Agencies—(Continued) | |
Financing Corp. Fico
Zero Coupon, 10/06/17 | | | 20,433,000 | | | $ | 20,264,795 | |
Zero Coupon, 05/11/18 | | | 40,000,000 | | | | 39,398,240 | |
Zero Coupon, 08/03/18 | | | 7,638,000 | | | | 7,515,166 | |
Zero Coupon, 12/27/18 | | | 16,254,000 | | | | 15,933,569 | |
Zero Coupon, 06/06/19 | | | 26,414,000 | | | | 25,519,754 | |
Zero Coupon, 09/26/19 | | | 14,535,000 | | | | 14,096,726 | |
Government Trust Certificates
Zero Coupon, 10/01/16 | | | 8,567,000 | | | | 8,555,632 | |
National Archives Facility Trust
8.500%, 09/01/19 | | | 1,998,740 | | | | 2,242,205 | |
New Valley Generation II
5.572%, 05/01/20 | | | 6,078,275 | | | | 6,640,515 | |
Overseas Private Investment Corp. | | | | | | | | |
Zero Coupon, 11/18/16 | | | 12,000,000 | | | | 12,062,064 | |
Zero Coupon, 11/17/17 | | | 26,000,000 | | | | 27,966,125 | |
Zero Coupon, 07/30/19 | | | 20,000,000 | | | | 21,161,000 | |
Zero Coupon, 11/11/20 (g) | | | 6,647,377 | | | | 6,701,221 | |
Zero Coupon, 11/13/20 | | | 5,000,000 | | | | 5,302,245 | |
Zero Coupon, 11/15/20 | | | 4,700,000 | | | | 5,013,161 | |
2.310%, 11/15/30 | | | 8,580,420 | | | | 8,738,772 | |
3.330%, 05/15/33 | | | 6,662,523 | | | | 7,191,874 | |
3.490%, 12/20/29 | | | 12,214,170 | | | | 13,388,831 | |
Residual Funding Corp. Principal Strip | | | | | | | | |
Zero Coupon, 10/15/19 | | | 10,642,000 | | | | 10,300,668 | |
Zero Coupon, 07/15/20 | | | 10,000,000 | | | | 9,546,680 | |
Zero Coupon, 10/15/20 | | | 38,159,000 | | | | 36,314,890 | |
Zero Coupon, 01/15/21 | | | 20,000,000 | | | | 18,860,160 | |
Zero Coupon, 01/15/30 | | | 25,000,000 | | | | 17,984,050 | |
Tennessee Valley Authority
1.750%, 10/15/18 | | | 20,000,000 | | | | 20,414,700 | |
3.875%, 02/15/21 | | | 35,000,000 | | | | 39,263,630 | |
4.500%, 04/01/18 | | | 20,000,000 | | | | 21,319,000 | |
5.500%, 07/18/17 | | | 23,306,000 | | | | 24,483,582 | |
| | | | | | | | |
| | | | | | | 856,001,529 | |
| | | | | | | | |
| | |
U.S. Treasury—20.2% | | | | | | | | |
U.S. Treasury Bonds
3.000%, 11/15/44 | | | 10,800,000 | | | | 12,417,473 | |
5.250%, 02/15/29 | | | 16,000,000 | | | | 22,623,744 | |
U.S. Treasury Inflation Indexed Bonds
0.625%, 02/15/43 (f) | | | 10,196,900 | | | | 9,924,847 | |
0.750%, 02/15/45 (f) | | | 12,495,447 | | | | 12,548,653 | |
1.000%, 02/15/46 (f) | | | 18,496,238 | | | | 19,968,224 | |
1.375%, 02/15/44 (f) | | | 28,637,955 | | | | 33,105,562 | |
U.S. Treasury Notes
1.000%, 05/31/18 | | | 25,000,000 | | | | 25,193,350 | |
1.000%, 08/15/18 | | | 22,000,000 | | | | 22,176,176 | |
1.500%, 02/28/23 | | | 34,960,000 | | | | 35,468,004 | |
1.625%, 06/30/20 | | | 23,000,000 | | | | 23,652,257 | |
1.875%, 09/30/17 | | | 25,000,000 | | | | 25,409,175 | |
1.875%, 05/31/22 (e) | | | 89,000,000 | | | | 92,566,942 | |
2.000%, 11/30/22 | | | 100,090,000 | | | | 104,754,394 | |
|
U.S. Treasury—(Continued) | |
U.S. Treasury Notes
2.625%, 11/15/20 | | | 19,900,000 | | | | 21,320,979 | |
| | | | | | | | |
| | | | | | | 461,129,780 | |
| | | | | | | | |
Total U.S. Treasury & Government Agencies (Cost $1,836,940,435) | | | | | | | 1,888,670,781 | |
| | | | | | | | |
|
| Corporate Bonds & Notes—9.6% | |
| | |
Banks—1.2% | | | | | | | | |
Bank of Montreal
1.750%, 06/15/22 (144A) (e) | | | 10,000,000 | | | | 10,026,780 | |
National Australia Bank, Ltd.
1.250%, 03/08/18 (144A) (e) | | | 13,000,000 | | | | 13,023,465 | |
Stadshypotek AB
1.875%, 10/02/19 (144A) | | | 5,000,000 | | | | 5,073,435 | |
| | | | | | | | |
| | | | | | | 28,123,680 | |
| | | | | | | | |
|
Diversified Financial Services—7.9% | |
COP I LLC
3.650%, 12/05/21 | | | 7,416,054 | | | | 7,870,881 | |
National Credit Union Administration Guaranteed Notes
3.000%, 06/12/19 | | | 19,650,000 | | | | 20,879,108 | |
3.450%, 06/12/21 | | | 45,000,000 | | | | 48,757,050 | |
Postal Square L.P.
6.500%, 06/15/22 | | | 7,099,380 | | | | 8,066,159 | |
Private Export Funding Corp.
1.375%, 02/15/17 | | | 25,000,000 | | | | 25,110,425 | |
2.250%, 12/15/17 | | | 40,000,000 | | | | 40,827,320 | |
2.300%, 09/15/20 | | | 28,000,000 | | | | 28,811,272 | |
| | | | | | | | |
| | | | | | | 180,322,215 | |
| | | | | | | | |
| | |
Multi-National—0.1% | | | | | | | | |
Asian Development Bank
2.125%, 03/19/25 | | | 2,000,000 | | | | 2,069,902 | |
| | | | | | | | |
| | |
Oil & Gas—0.4% | | | | | | | | |
Ecopetrol S.A.
5.375%, 06/26/26 (e) | | | 4,260,000 | | | | 4,142,850 | |
Petroleos Mexicanos
6.375%, 01/23/45 | | | 3,610,000 | | | | 3,628,050 | |
| | | | | | | | |
| | | | | | | 7,770,900 | |
| | | | | | | | |
Total Corporate Bonds & Notes
(Cost $220,864,628) | | | | | | | 218,286,697 | |
| | | | | | | | |
|
| Foreign Government—8.2% | |
| | |
Sovereign—8.2% | | | | | | | | |
Colombia Government International Bond
5.625%, 02/26/44 | | | 4,840,000 | | | | 5,360,300 | |
Indonesia Government International Bonds
3.750%, 04/25/22 (144A) | | | 410,000 | | | | 424,102 | |
See accompanying notes to financial statements.
MSF-7
Metropolitan Series Fund
Western Asset Management U.S. Government Portfolio
Schedule of Investments as of June 30, 2016 (Unaudited)
Foreign Government—(Continued)
| | | | | | | | |
| Security Description | | Principal
Amount* | | | Value | |
|
Sovereign—(Continued) | |
Indonesia Government International Bonds
3.750%, 04/25/22 | | | 1,900,000 | | | $ | 1,965,351 | |
4.875%, 05/05/21 | | | 2,957,000 | | | | 3,210,527 | |
5.875%, 03/13/20 | | | 310,000 | | | | 344,746 | |
5.875%, 01/15/24 (144A) | | | 1,060,000 | | | | 1,225,856 | |
Israel Government AID Bonds | | | | | | | | |
Zero Coupon, 08/15/16 | | | 28,251,000 | | | | 28,243,739 | |
Zero Coupon, 09/15/16 | | | 10,000,000 | | | | 9,994,410 | |
Zero Coupon, 11/15/18 | | | 20,869,000 | | | | 20,499,827 | |
5.500%, 12/04/23 | | | 24,290,000 | | | | 30,578,195 | |
5.500%, 04/26/24 | | | 20,950,000 | | | | 26,533,385 | |
Mexico Government International Bond
5.550%, 01/21/45 | | | 11,480,000 | | | | 13,747,300 | |
Peruvian Government International Bond
5.625%, 11/18/50 | | | 4,000,000 | | | | 4,960,000 | |
Poland Government International Bond
4.000%, 01/22/24 | | | 7,870,000 | | | | 8,499,600 | |
Turkey Government International Bonds
5.625%, 03/30/21 | | | 1,078,000 | | | | 1,175,020 | |
6.250%, 09/26/22 | | | 2,205,000 | | | | 2,493,436 | |
7.000%, 03/11/19 | | | 1,660,000 | | | | 1,836,916 | |
7.500%, 11/07/19 | | | 540,000 | | | | 616,729 | |
Ukraine Government AID Bond
1.844%, 05/16/19 | | | 25,000,000 | | | | 25,448,950 | |
| | | | | | | | |
Total Foreign Government
(Cost $178,859,068) | | | | | | | 187,158,389 | |
| | | | | | | | |
|
| Mortgage-Backed Securities—5.5% | |
|
Collateralized Mortgage Obligations—5.1% | |
American Home Mortgage Assets Trust
0.643%, 09/25/46 (b) | | | 850,436 | | | | 576,988 | |
0.643%, 12/25/46 (b) | | | 2,513,428 | | | | 1,580,499 | |
Banc of America Funding Corp.
0.596%, 02/27/37 (144A) (b) | | | 12,140,005 | | | | 11,459,140 | |
Banc of America Funding Trust
0.611%, 09/29/36 (144A) (b) | | | 11,687,837 | | | | 11,132,448 | |
2.108%, 06/20/35 (b) | | | 310,773 | | | | 193,667 | |
Banc of America Mortgage Trust
2.966%, 07/25/35 (b) | | | 101,363 | | | | 93,315 | |
BCAP LLC Trust
0.596%, 11/27/36 (144A) (b) | | | 18,318,355 | | | | 16,915,611 | |
Citigroup Mortgage Loan Trust, Inc.
2.730%, 10/25/35 (b) | | | 199,890 | | | | 196,873 | |
Countrywide Alternative Loan Trust
0.648%, 07/20/46 (b) | | | 2,908,068 | | | | 1,410,420 | |
1.033%, 05/25/34 (b) | | | 2,083,096 | | | | 1,991,027 | |
Countrywide Home Loan Reperforming Loan REMIC Trust
0.873%, 07/25/36 (144A) (b) | | | 787,949 | | | | 709,971 | |
Fannie Mae Connecticut Avenue Securities
1.953%, 02/25/25 (b) | | | 1,951,313 | | | | 1,952,561 | |
First Horizon Alternative Mortgage Securities Trust
0.823%, 02/25/37 (b) | | | 242,367 | | | | 109,184 | |
|
Collateralized Mortgage Obligations—(Continued) | |
Freddie Mac Structured Agency Credit Risk Debt Notes
2.103%, 04/25/24 (b) | | | 7,000,000 | | | | 6,999,998 | |
2.653%, 02/25/24 (b) | | | 5,000,000 | | | | 5,067,241 | |
2.653%, 09/25/24 (b) | | | 8,000,000 | | | | 8,003,145 | |
GMAC Mortgage Corp. Loan Trust
3.006%, 11/19/35 (b) | | | 741,718 | | | | 662,710 | |
Greenpoint Mortgage Funding Trust
0.533%, 02/25/47 (b) | | | 17,091 | | | | 16,891 | |
GSMPS Mortgage Loan Trust
0.803%, 01/25/35 (144A) (b) | | | 387,894 | | | | 320,841 | |
3.441%, 06/25/34 (144A) (b) | | | 4,146,362 | | | | 3,891,553 | |
GSR Mortgage Loan Trust
2.837%, 04/25/35 (b) | | | 688,248 | | | | 669,333 | |
HarborView Mortgage Loan Trust
0.648%, 09/19/46 (b) | | | 340,079 | | | | 248,123 | |
JPMorgan Mortgage Trust
2.488%, 06/25/34 (b) | | | 195,610 | | | | 192,666 | |
JPMorgan Resecuritization Trust
0.606%, 12/27/36 (144A) (b) | | | 9,510,920 | | | | 8,986,573 | |
MASTR Adjustable Rate Mortgages Trust
0.653%, 05/25/47 (b) | | | 6,211,756 | | | | 4,781,936 | |
2.382%, 02/25/34 (b) | | | 234,738 | | | | 227,972 | |
3.603%, 12/25/34 (b) | | | 18,039 | | | | 17,223 | |
MASTR Reperforming Loan Trust
0.803%, 05/25/35 (144A) (b) | | | 324,870 | | | | 255,181 | |
3.481%, 05/25/35 (144A) (b) | | | 4,109,899 | | | | 3,334,472 | |
4.568%, 05/25/36 (144A) (b) | | | 3,310,995 | | | | 2,985,213 | |
7.000%, 08/25/34 (144A) | | | 409,344 | | | | 415,923 | |
Morgan Stanley Mortgage Loan Trust
0.523%, 06/25/36 (b) | | | 662,272 | | | | 285,008 | |
2.880%, 07/25/35 (b) | | | 270,427 | | | | 242,473 | |
Morgan Stanley Resecuritization Trust
0.671%, 10/26/46 (144A) (b) | | | 6,270,618 | | | | 6,104,271 | |
NovaStar Mortgage Funding Trust
0.636%, 09/25/46 (b) | | | 2,214,100 | | | | 1,790,452 | |
Provident Funding Mortgage Loan Trust
2.879%, 05/25/35 (b) | | | 667,132 | | | | 664,026 | |
3.002%, 10/25/35 (b) | | | 105,008 | | | | 102,391 | |
RFMSI Trust
4.750%, 12/25/18 | | | 135,573 | | | | 136,490 | |
SACO I Trust
8.993%, 06/25/21 (144A) (b) | | | 1,233,416 | | | | 1,274,690 | |
Structured Adjustable Rate Mortgage Loan Trust
2.942%, 05/25/35 (b) | | | 3,851,204 | | | | 3,538,139 | |
Structured Asset Mortgage Investments Trust
0.633%, 07/25/46 (b) | | | 264,223 | | | | 207,686 | |
Structured Asset Securities Corp.
0.803%, 04/25/35 (144A) (b) | | | 2,779,174 | | | | 2,288,880 | |
3.384%, 06/25/35 (144A) (b) | | | 165,722 | | | | 147,274 | |
Structured Asset Securities Corp. Mortgage Loan Trust
1.253%, 09/25/33 (144A) (b) | | | 47,437 | | | | 46,709 | |
WaMu Mortgage Pass-Through Certificates Trust
0.713%, 11/25/45 (b) | | | 27,995 | | | | 25,486 | |
0.723%, 12/25/45 (b) | | | 1,945,638 | | | | 1,813,392 | |
See accompanying notes to financial statements.
MSF-8
Metropolitan Series Fund
Western Asset Management U.S. Government Portfolio
Schedule of Investments as of June 30, 2016 (Unaudited)
Mortgage-Backed Securities—(Continued)
| | | | | | | | |
| Security Description | |
Principal
Amount* | | | Value | |
|
Collateralized Mortgage Obligations—(Continued) | |
WaMu Mortgage Pass-Through Certificates Trust
0.743%, 12/25/45 (b) | | | 157,293 | | | $ | 136,568 | |
0.773%, 08/25/45 (b) | | | 177,396 | | | | 163,064 | |
| | | | | | | | |
| | | | | | | 114,365,697 | |
| | | | | | | | |
|
Commercial Mortgage-Backed Securities—0.4% | |
FDIC Structured Sale Guaranteed Notes
2.980%, 12/06/20 (144A) | | | 7,903,425 | | | | 8,032,418 | |
National Credit Union Administration Guaranteed Notes Trust
2.900%, 10/29/20 | | | 1,210,390 | | | | 1,210,935 | |
| | | | | | | | |
| | | | | | | 9,243,353 | |
| | | | | | | | |
Total Mortgage-Backed Securities
(Cost $125,917,411) | | | | | | | 123,609,050 | |
| | | | | | | | |
|
| Asset-Backed Securities—1.4% | |
|
Asset-Backed - Home Equity—0.1% | |
EMC Mortgage Loan Trust
0.896%, 12/25/42 (144A) (b) | | | 50,100 | | | | 47,699 | |
Home Equity Mortgage Loan Asset-Backed Trust
0.713%, 06/25/36 (b) | | | 4,049,375 | | | | 776,138 | |
Morgan Stanley Mortgage Loan Trust
0.543%, 12/25/36 (b) | | | 238,185 | | | | 117,059 | |
0.753%, 03/25/36 (b) | | | 1,768,333 | | | | 984,731 | |
Option One Mortgage Loan Trust
1.033%, 06/25/33 (b) | | | 130,958 | | | | 119,526 | |
Structured Asset Securities Corp. Mortgage Loan Trust
0.673%, 02/25/36 (144A) (b) | | | 4,793,344 | | | | 331,929 | |
| | | | | | | | |
| | | | | | | 2,377,082 | |
| | | | | | | | |
| | |
Asset-Backed - Other—0.2% | | | | | | | | |
Countrywide Home Equity Loan Trust
0.592%, 11/15/36 (b) | | | 48,913 | | | | 37,874 | |
0.732%, 02/15/34 (b) | | | 110,101 | | | | 101,054 | |
Countrywide Revolving Home Equity Loan Trust
0.582%, 07/15/36 (b) | | | 1,044,286 | | | | 891,147 | |
GMAC Mortgage Corp. Loan Trust
0.626%, 12/25/36 (b) | | | 479,652 | | | | 425,289 | |
GSR Mortgage Loan Trust
0.976%, 11/25/30 (b) | | | 1,167 | | | | 89 | |
RAAC Trust
0.716%, 05/25/36 (144A) (b) | | | 1,301,163 | | | | 1,174,139 | |
SACO I Trust
0.713%, 06/25/36 (b) | | | 715,282 | | | | 1,268,975 | |
0.753%, 04/25/36 (b) | | | 274,884 | | | | 501,071 | |
| | | | | | | | |
| | | | | | | 4,399,638 | |
| | | | | | | | |
|
Asset-Backed - Student Loan—1.1% | |
National Credit Union Administration Guaranteed Notes Trust
0.795%, 12/07/20 (b) | | | 5,500,037 | | | | 5,487,497 | |
|
Asset-Backed - Student Loan—(Continued) | |
Nelnet Student Loan Trust
2.312%, 11/25/24 (b) | | | 5,930,000 | | | | 5,980,204 | |
SLM Student Loan Trust
0.678%, 01/25/19 (b) | | | 6,282,162 | | | | 6,184,382 | |
0.678%, 04/25/19 (b) | | | 2,977,704 | | | | 2,959,669 | |
2.288%, 07/25/22 (b) | | | 5,065,000 | | | | 5,068,044 | |
| | | | | | | | |
| | | | | | | 25,679,796 | |
| | | | | | | | |
Total Asset-Backed Securities
(Cost $37,005,330) | | | | | | | 32,456,516 | |
| | | | | | | | |
|
| Short-Term Investments—0.6% | |
| | |
Mutual Fund—0.3% | | | | | | | | |
State Street Navigator Securities Lending MET Portfolio (h) | | | 7,412,638 | | | | 7,412,638 | |
| | | | | | | | |
| | |
Repurchase Agreements—0.3% | | | | | | | | |
Bank of America Securities LLC
Repurchase Agreement dated 06/30/16 at 0.410% to be repurchased at $4,700,054 on 07/01/16, collateralized by $4,639,000 U.S. Treasury Note at 1.750% due 5/15/23 with a value of $4,785,602. | | | 4,700,000 | | | | 4,700,000 | |
Fixed Income Clearing Corp.
Repurchase Agreement dated 06/30/16 at 0.030% to be repurchased at $2,377,171 on 07/01/16, collateralized by $2,360,000 U.S. Treasury Note at 1.625% due 11/30/20 with a value of $2,427,850. | | | 2,377,169 | | | | 2,377,169 | |
| | | | | | | | |
| | | | | | | 7,077,169 | |
| | | | | | | | |
Total Short-Term Investments
(Cost $14,489,807) | | | | | | | 14,489,807 | |
| | | | | | | | |
Total Investments—108.2%
(Cost $2,414,076,679) (i) | | | | | | | 2,464,671,240 | |
Other assets and liabilities (net)—(8.2)% | | | | | | | (186,705,616 | ) |
| | | | | | | | |
| Net Assets—100.0% | | | | | | $ | 2,277,965,624 | |
| | | | | | | | |
| * | Principal amount stated in U.S. dollars unless otherwise noted. |
| (a) | TBA (To Be Announced) Securities are purchased on a forward commitment basis with an approximate principal amount and no defined maturity date. The actual principal and maturity date will be determined upon settlement date. |
| (b) | Variable or floating rate security. The stated rate represents the rate at June 30, 2016. Maturity date shown for callable securities reflects the earliest possible call date. |
| (c) | Interest only security. |
| (d) | Principal only security. |
| (e) | All or a portion of the security was held on loan. As of June 30, 2016, the market value of securities loaned was $88,943,236 and the collateral received consisted of cash in the amount of $7,412,638 and non-cash collateral with a value of $84,039,090. The cash collateral is |
See accompanying notes to financial statements.
MSF-9
Metropolitan Series Fund
Western Asset Management U.S. Government Portfolio
Schedule of Investments as of June 30, 2016 (Unaudited)
| | invested in a money market fund managed by an affiliate of the custodian. The non-cash collateral received consists primarily of government securities and bank letters of credit, and is held for the benefit of the Portfolio at the Portfolio’s custodian. The Portfolio cannot repledge or resell this collateral. As such, this collateral is excluded from the Statement of Assets and Liabilities. |
| (f) | Principal amount of security is adjusted for inflation. |
| (g) | Illiquid security. As of June 30, 2016, these securities represent 0.3% of net assets. |
| (h) | Represents investment of cash collateral received from securities on loan as of June 30, 2016. |
| (i) | As of June 30, 2016, the aggregate cost of investments was $2,414,076,679. The aggregate unrealized appreciation and depreciation of investments were $77,591,446 and $(26,996,885), respectively, resulting in net unrealized appreciation of $50,594,561. |
| (144A)— | Securities exempt from registration under Rule 144A of the Securities Act of 1933. These securities may be resold in transactions exempt from registration, normally to qualified institutional buyers. As of June 30, 2016, the market value of 144A securities was $109,628,573, which is 4.8% of net assets. |
| (ARM)— | Adjustable-Rate Mortgage |
| (CMO)— | Collateralized Mortgage Obligation |
| (REMIC)— | Real Estate Mortgage Investment Conduit |
TBA Forward Sale Commitments
| | | | | | | | | | | | | | | | | | | | |
Security Description | | Interest Rate | | | Maturity | | | Face
Amount | | | Cost | | | Value | |
Ginnie Mae II 30 Yr. Pool | | | 3.500 | % | | | TBA | | | | (3,400,000 | ) | | $ | (3,606,391 | ) | | $ | (3,608,648 | ) |
| | | | | | | | | | | | | | | | | | | | |
Futures Contracts
| | | | | | | | | | | | | | | | | | | | |
Futures Contracts—Long | | Expiration
Date | | | Number of
Contracts | | | Notional
Amount | | | Unrealized
Appreciation/
(Depreciation) | |
U.S. Treasury Note 10 Year Futures | | | 09/21/16 | | | | 180 | | | | USD | | | | 23,271,210 | | | $ | 665,978 | |
| | | | | |
Futures Contracts—Short | | | | | | | | | | | | | | | |
90 Day Eurodollar Futures | | | 12/19/16 | | | | (227 | ) | | | USD | | | | (56,139,938 | ) | | | (227,000 | ) |
90 Day Eurodollar Futures | | | 12/18/17 | | | | (385 | ) | | | USD | | | | (95,286,961 | ) | | | (168,976 | ) |
U.S. Treasury Long Bond Futures | | | 09/21/16 | | | | (421 | ) | | | USD | | | | (68,622,554 | ) | | | (3,934,165 | ) |
U.S. Treasury Note 5 Year Futures | | | 09/30/16 | | | | (98 | ) | | | USD | | | | (11,843,135 | ) | | | (128,944 | ) |
| | | | | | | | | | | | | | | | | | | | |
Net Unrealized Depreciation | | | $ | (3,793,107 | ) |
| | | | | | | | | | | | | | | | | | | | |
| (USD)— | United States Dollar |
See accompanying notes to financial statements.
MSF-10
Metropolitan Series Fund
Western Asset Management U.S. Government Portfolio
Schedule of Investments as of June 30, 2016 (Unaudited)
Fair Value Hierarchy
Accounting principles generally accepted in the United States of America (“GAAP”) define fair market value as the price that the Portfolio would receive to sell an asset or pay to transfer a liability in an orderly transaction between market participants at the measurement date. It establishes a fair value hierarchy that prioritizes inputs to valuation methods and requires disclosure of the fair value hierarchy, separately for each major category of assets and liabilities, that segregates fair value measurements into three levels. Levels 1, 2 and 3 of the fair value hierarchy are defined as follows:
Level 1 - unadjusted quoted prices in active markets for identical investments
Level 2 - other significant observable inputs (including, but not limited to, quoted prices for similar assets or liabilities in markets that are either active or inactive; inputs other than quoted prices that are observable such as interest rates, yield curves, volatilities, prepayment speeds, loss severities, credit risks, default rates, or other market corroborated inputs)
Level 3 - significant unobservable inputs based on the best information available in the circumstances, to the extent observable inputs are unavailable (including the Portfolio’s own assumptions used in determining the fair value of investments and derivative financial instruments)
The inputs or methodologies used for valuing investments are not necessarily an indication of the risk associated with investing in them. Changes to the inputs or methodologies used may result in transfers between levels, which will be recognized as of the beginning of the reporting period. Information on transfers between Level 1 and Level 2, if any, will be disclosed following the fair value hierarchy table below. A reconciliation of Level 3 securities, if any, will also be disclosed following the fair value hierarchy table. For more information about the Portfolio’s policy regarding the valuation of investments, please refer to the Notes to Financial Statements.
The following table summarizes the fair value hierarchy of the Portfolio’s investments as of June 30, 2016:
| | | | | | | | | | | | | | | | |
| Description | | Level 1 | | | Level 2 | | | Level 3 | | | Total | |
Total U.S. Treasury & Government Agencies* | | $ | — | | | $ | 1,888,670,781 | | | $ | — | | | $ | 1,888,670,781 | |
Total Corporate Bonds & Notes* | | | — | | | | 218,286,697 | | | | — | | | | 218,286,697 | |
Total Foreign Government* | | | — | | | | 187,158,389 | | | | — | | | | 187,158,389 | |
Total Mortgage-Backed Securities* | | | — | | | | 123,609,050 | | | | — | | | | 123,609,050 | |
Total Asset-Backed Securities* | | | — | | | | 32,456,516 | | | | — | | | | 32,456,516 | |
| Short-Term Investments | | | | | | | | | | | | | | | | |
Mutual Fund | | | 7,412,638 | | | | — | | | | — | | | | 7,412,638 | |
Repurchase Agreements | | | — | | | | 7,077,169 | | | | — | | | | 7,077,169 | |
Total Short-Term Investments | | | 7,412,638 | | | | 7,077,169 | | | | — | | | | 14,489,807 | |
Total Investments | | $ | 7,412,638 | | | $ | 2,457,258,602 | | | $ | — | | | $ | 2,464,671,240 | |
| | | | | | | | | | | | | | | | | |
Collateral for Securities Loaned (Liability) | | $ | — | | | $ | (7,412,638 | ) | | $ | — | | | $ | (7,412,638 | ) |
TBA Forward Sales Commitments | | $ | — | | | $ | (3,608,648 | ) | | $ | — | | | $ | (3,608,648 | ) |
| Futures Contracts | | | | | | | | | | | | | | | | |
Futures Contracts (Unrealized Appreciation) | | $ | 665,978 | | | | — | | | $ | — | | | $ | 665,978 | |
Futures Contracts (Unrealized Depreciation) | | | (4,459,085 | ) | | | — | | | | — | | | | (4,459,085 | ) |
Total Futures Contracts | | $ | (3,793,107 | ) | | $ | — | | | $ | — | | | $ | (3,793,107 | ) |
| * | See Schedule of Investments for additional detailed categorizations. |
See accompanying notes to financial statements.
MSF-11
Metropolitan Series Fund
Western Asset Management U.S. Government Portfolio
Statement of Assets and Liabilities
June 30, 2016 (Unaudited)
| | | | |
Assets | | | | |
Investments at value (a) (b) | | $ | 2,464,671,240 | |
Cash | | | 41 | |
Cash collateral for futures contracts | | | 1,864,931 | |
Receivable for: | | | | |
TBA securities sold (c) | | | 100,804,192 | |
Fund shares sold | | | 729,166 | |
Principal paydowns | | | 954 | |
Interest | | | 7,101,094 | |
Variation margin on futures contracts | | | 226,800 | |
Prepaid expenses | | | 14,230 | |
Other assets | | | 61,653 | |
| | | | |
Total Assets | | | 2,575,474,301 | |
Liabilities | | | | |
Forward sales commitments, at value | | | 3,608,648 | |
Collateral for securities loaned | | | 7,412,638 | |
Payables for: | | | | |
TBA securities purchased (c) | | | 284,913,590 | |
Fund shares redeemed | | | 268,018 | |
Accrued Expenses: | | | | |
Management fees | | | 853,131 | |
Distribution and service fees | | | 97,679 | |
Deferred trustees’ fees | | | 76,880 | |
Other expenses | | | 278,093 | |
| | | | |
Total Liabilities | | | 297,508,677 | |
| | | | |
Net Assets | | $ | 2,277,965,624 | |
| | | | |
Net Assets Consist of: | | | | |
Paid in surplus | | $ | 2,292,906,883 | |
Undistributed net investment income | | | 18,340,014 | |
Accumulated net realized loss | | | (80,142,122 | ) |
Unrealized appreciation on investments and futures contracts | | | 46,860,849 | |
| | | | |
Net Assets | | $ | 2,277,965,624 | |
| | | | |
Net Assets | | | | |
Class A | | $ | 1,787,331,341 | |
Class B | | | 463,803,190 | |
Class E | | | 26,831,093 | |
Capital Shares Outstanding* | | | | |
Class A | | | 149,538,397 | |
Class B | | | 38,958,569 | |
Class E | | | 2,251,313 | |
Net Asset Value, Offering Price and Redemption Price Per Share | | | | |
Class A | | $ | 11.95 | |
Class B | | | 11.91 | |
Class E | | | 11.92 | |
| * | The Portfolio is authorized to issue an unlimited number of shares. |
| (a) | Identified cost of investments was $2,414,076,679. |
| (b) | Includes securities loaned at value of $88,943,236. |
| (c) | Included within TBA securities sold is $29,053,418 related to TBA forward sale commitments and included within TBA securities purchased is $25,278,750 related to TBA forward sale commitments. |
Statement of Operations
Six Months Ended June 30, 2016 (Unaudited)
| | | | |
Investment Income | | | | |
Interest | | $ | 24,658,208 | |
Securities lending income | | | 70,552 | |
| | | | |
Total investment income | | | 24,728,760 | |
Expenses | | | | |
Management fees | | | 5,317,825 | |
Administration fees | | | 28,546 | |
Custodian and accounting fees | | | 92,876 | |
Distribution and service fees—Class B | | | 570,459 | |
Distribution and service fees—Class E | | | 20,448 | |
Audit and tax services | | | 32,679 | |
Legal | | | 13,597 | |
Trustees’ fees and expenses | | | 15,990 | |
Shareholder reporting | | | 61,401 | |
Insurance | | | 7,855 | |
Miscellaneous | | | 11,136 | |
| | | | |
Total expenses | | | 6,172,812 | |
Less management fee waiver | | | (150,707 | ) |
| | | | |
Net expenses | | | 6,022,105 | |
| | | | |
Net Investment Income | | | 18,706,655 | |
| | | | |
Net Realized and Unrealized Gain (Loss) | | | | |
| Net realized gain (loss) on: | | | | |
Investments | | | 4,293,196 | |
Futures contracts | | | (4,957,340 | ) |
| | | | |
Net realized loss | | | (664,144 | ) |
| | | | |
| Net change in unrealized appreciation (depreciation) on: | | | | |
Investments | | | 55,807,809 | |
Futures contracts | | | (4,219,295 | ) |
| | | | |
Net change in unrealized appreciation | | | 51,588,514 | |
| | | | |
Net realized and unrealized gain | | | 50,924,370 | |
| | | | |
Net Increase in Net Assets From Operations | | $ | 69,631,025 | |
| | | | |
See accompanying notes to financial statements.
MSF-12
Metropolitan Series Fund
Western Asset Management U.S. Government Portfolio
Statements of Changes in Net Assets
| | | | | | | | |
| | | Six Months
Ended
June 30,
2016
(Unaudited) | | | Year Ended
December 31,
2015 | |
Increase (Decrease) in Net Assets: | | | | | | | | |
From Operations | | | | | | | | |
Net investment income | | $ | 18,706,655 | | | $ | 35,511,900 | |
Net realized gain (loss) | | | (664,144 | ) | | | 6,997,475 | |
Net change in unrealized appreciation (depreciation) | | | 51,588,514 | | | | (26,340,492 | ) |
| | | | | | | | |
Increase in net assets from operations | | | 69,631,025 | | | | 16,168,883 | |
| | | | | | | | |
From Distributions to Shareholders | | | | | | | | |
Net investment income | | | | | | | | |
Class A | | | (46,380,937 | ) | | | (45,365,989 | ) |
Class B | | | (10,833,492 | ) | | | (9,804,626 | ) |
Class E | | | (656,202 | ) | | | (650,862 | ) |
| | | | | | | | |
Total distributions | | | (57,870,631 | ) | | | (55,821,477 | ) |
| | | | | | | | |
Decrease in net assets from capital share transactions | | | (56,139,500 | ) | | | (427,989,904 | ) |
| | | | | | | | |
Total decrease in net assets | | | (44,379,106 | ) | | | (467,642,498 | ) |
| | |
Net Assets | | | | | | | | |
Beginning of period | | | 2,322,344,730 | | | | 2,789,987,228 | |
| | | | | | | | |
End of period | | $ | 2,277,965,624 | | | $ | 2,322,344,730 | |
| | | | | | | | |
Undistributed net investment income | | | | | | | | |
End of period | | $ | 18,340,014 | | | $ | 57,503,990 | |
| | | | | | | | |
Other Information:
Capital Shares
Transactions in capital shares were as follows:
| | | | | | | | | | | | | | | | |
| | | Six Months Ended
June 30, 2016
(Unaudited) | | | Year Ended
December 31, 2015 | |
| | | Shares | | | Value | | | Shares | | | Value | |
Class A | | | | | | | | | | | | | | | | |
Sales | | | 2,571,169 | | | $ | 31,130,145 | | | | 3,149,293 | | | $ | 38,107,214 | |
Reinvestments | | | 3,897,558 | | | | 46,380,937 | | | | 3,815,474 | | | | 45,365,989 | |
Redemptions | | | (10,799,610 | ) | | | (129,689,110 | ) | | | (40,060,724 | ) | | | (485,560,140 | ) |
| | | | | | | | | | | | | | | | |
Net decrease | | | (4,330,883 | ) | | $ | (52,178,028 | ) | | | (33,095,957 | ) | | $ | (402,086,937 | ) |
| | | | | | | | | | | | | | | | |
Class B | | | | | | | | | | | | | | | | |
Sales | | | 2,130,333 | | | $ | 25,571,053 | | | | 3,433,251 | | | $ | 41,066,433 | |
Reinvestments | | | 914,219 | | | | 10,833,492 | | | | 828,094 | | | | 9,804,626 | |
Redemptions | | | (3,246,613 | ) | | | (38,897,277 | ) | | | (6,046,743 | ) | | | (72,421,342 | ) |
| | | | | | | | | | | | | | | | |
Net decrease | | | (202,061 | ) | | $ | (2,492,732 | ) | | | (1,785,398 | ) | | $ | (21,550,283 | ) |
| | | | | | | | | | | | | | | | |
Class E | | | | | | | | | | | | | | | | |
Sales | | | 67,264 | | | $ | 805,828 | | | | 66,612 | | | $ | 795,694 | |
Reinvestments | | | 55,329 | | | | 656,202 | | | | 54,925 | | | | 650,862 | |
Redemptions | | | (244,315 | ) | | | (2,930,770 | ) | | | (482,959 | ) | | | (5,799,240 | ) |
| | | | | | | | | | | | | | | | |
Net decrease | | | (121,722 | ) | | $ | (1,468,740 | ) | | | (361,422 | ) | | $ | (4,352,684 | ) |
| | | | | | | | | | | | | | | | |
Decrease derived from capital shares transactions | | | | | | $ | (56,139,500 | ) | | | | | | $ | (427,989,904 | ) |
| | | | | | | | | | | | | | | | |
See accompanying notes to financial statements.
MSF-13
Metropolitan Series Fund
Western Asset Management U.S. Government Portfolio
Financial Highlights
| | | | | | | | | | | | | | | | | | | | | | | | |
| Selected per share data | | | | | | | | | | | | | | | | | | |
| | | Class A | |
| | | Six Months
Ended
June 30,
2016
(Unaudited) | | | Year Ended December 31, | |
| | | | 2015 | | | 2014 | | | 2013 | | | 2012 | | | 2011 | |
Net Asset Value, Beginning of Period | | $ | 11.90 | | | $ | 12.11 | | | $ | 12.01 | | | $ | 12.36 | | | $ | 12.21 | | | $ | 12.17 | |
| | | | | | | | | | | | | | | | | | | | | | | | |
Income (Loss) from Investment Operations | | | | | | | | | | | | | | | | | | | | | | | | |
Net investment income (a) | | | 0.10 | | | | 0.17 | | | | 0.16 | | | | 0.13 | | | | 0.13 | | | | 0.18 | |
Net realized and unrealized gain (loss) on investments | | | 0.27 | | | | (0.10 | ) | | | 0.17 | | | | (0.22 | ) | | | 0.28 | | | | 0.46 | |
| | | | | | | | | | | | | | | | | | | | | | | | |
Total from investment operations | | | 0.37 | | | | 0.07 | | | | 0.33 | | | | (0.09 | ) | | | 0.41 | | | | 0.64 | |
| | | | | | | | | | | | | | | | | | | | | | | | |
Less Distributions | | | | | | | | | | | | | | | | | | | | | | | | |
Distributions from net investment income | | | (0.32 | ) | | | (0.28 | ) | | | (0.23 | ) | | | (0.26 | ) | | | (0.26 | ) | | | (0.18 | ) |
Distributions from net realized capital gains | | | 0.00 | | | | 0.00 | | | | 0.00 | | | | 0.00 | | | | 0.00 | | | | (0.42 | ) |
| | | | | | | | | | | | | | | | | | | | | | | | |
Total distributions | | | (0.32 | ) | | | (0.28 | ) | | | (0.23 | ) | | | (0.26 | ) | | | (0.26 | ) | | | (0.60 | ) |
| | | | | | | | | | | | | | | | | | | | | | | | |
Net Asset Value, End of Period | | $ | 11.95 | | | $ | 11.90 | | | $ | 12.11 | | | $ | 12.01 | | | $ | 12.36 | | | $ | 12.21 | |
| | | | | | | | | | | | | | | | | | | | | | | | |
Total Return (%) (b) | | | 3.10 | (c) | | | 0.57 | | | | 2.81 | | | | (0.74 | ) | | | 3.37 | | | | 5.51 | |
| | | | | | |
Ratios/Supplemental Data | | | | | | | | | | | | | | | | | | | | | | | | |
Gross ratio of expenses to average net assets (%) | | | 0.50 | (d) | | | 0.49 | | | | 0.49 | | | | 0.49 | | | | 0.50 | | �� | | 0.49 | |
Net ratio of expenses to average net assets (%) (e) | | | 0.48 | (d) | | | 0.48 | | | | 0.48 | | | | 0.48 | | | | 0.48 | | | | 0.49 | |
Ratio of net investment income to average net assets (%) | | | 1.71 | (d) | | | 1.44 | | | | 1.35 | | | | 1.05 | | | | 1.03 | | | | 1.51 | |
Portfolio turnover rate (%) | | | 106 | (c)(f) | | | 215 | (f) | | | 194 | (f) | | | 317 | (f) | | | 340 | (f) | | | 549 | |
Net assets, end of period (in millions) | | $ | 1,787.3 | | | $ | 1,830.7 | | | $ | 2,263.8 | | | $ | 2,094.9 | | | $ | 2,017.9 | | | $ | 1,904.6 | |
| |
| | | Class B | |
| | | Six Months
Ended
June 30,
2016
(Unaudited) | | | Year Ended December 31, | |
| | | | 2015 | | | 2014 | | | 2013 | | | 2012 | | | 2011 | |
Net Asset Value, Beginning of Period | | $ | 11.84 | | | $ | 12.04 | | | $ | 11.95 | | | $ | 12.29 | | | $ | 12.15 | | | $ | 12.11 | |
| | | | | | | | | | | | | | | | | | | | | | | | |
Income (Loss) from Investment Operations | | | | | | | | | | | | | | | | | | | | | | | | |
Net investment income (a) | | | 0.09 | | | | 0.14 | | | | 0.13 | | | | 0.10 | | | | 0.10 | | | | 0.15 | |
Net realized and unrealized gain (loss) on investments | | | 0.27 | | | | (0.09 | ) | | | 0.16 | | | | (0.21 | ) | | | 0.27 | | | | 0.46 | |
| | | | | | | | | | | | | | | | | | | | | | | | |
Total from investment operations | | | 0.36 | | | | 0.05 | | | | 0.29 | | | | (0.11 | ) | | | 0.37 | | | | 0.61 | |
| | | | | | | | | | | | | | | | | | | | | | | | |
Less Distributions | | | | | | | | | | | | | | | | | | | | | | | | |
Distributions from net investment income | | | (0.29 | ) | | | (0.25 | ) | | | (0.20 | ) | | | (0.23 | ) | | | (0.23 | ) | | | (0.15 | ) |
Distributions from net realized capital gains | | | 0.00 | | | | 0.00 | | | | 0.00 | | | | 0.00 | | | | 0.00 | | | | (0.42 | ) |
| | | | | | | | | | | | | | | | | | | | | | | | |
Total distributions | | | (0.29 | ) | | | (0.25 | ) | | | (0.20 | ) | | | (0.23 | ) | | | (0.23 | ) | | | (0.57 | ) |
| | | | | | | | | | | | | | | | | | | | | | | | |
Net Asset Value, End of Period | | $ | 11.91 | | | $ | 11.84 | | | $ | 12.04 | | | $ | 11.95 | | | $ | 12.29 | | | $ | 12.15 | |
| | | | | | | | | | | | | | | | | | | | | | | | |
Total Return (%) (b) | | | 3.01 | (c) | | | 0.31 | | | | 2.55 | | | | (0.91 | ) | | | 3.05 | | | | 5.27 | |
| | | | | | |
Ratios/Supplemental Data | | | | | | | | | | | | | | | | | | | | | | | | |
Gross ratio of expenses to average net assets (%) | | | 0.75 | (d) | | | 0.74 | | | | 0.74 | | | | 0.74 | | | | 0.75 | | | | 0.74 | |
Net ratio of expenses to average net assets (%) (e) | | | 0.73 | (d) | | | 0.73 | | | | 0.73 | | | | 0.73 | | | | 0.73 | | | | 0.74 | |
Ratio of net investment income to average net assets (%) | | | 1.46 | (d) | | | 1.20 | | | | 1.10 | | | | 0.80 | | | | 0.78 | | | | 1.26 | |
Portfolio turnover rate (%) | | | 106 | (c)(f) | | | 215 | (f) | | | 194 | (f) | | | 317 | (f) | | | 340 | (f) | | | 549 | |
Net assets, end of period (in millions) | | $ | 463.8 | | | $ | 463.5 | | | $ | 493.2 | | | $ | 524.9 | | | $ | 565.2 | | | $ | 538.2 | |
Please see following page for Financial Highlights footnote legend.
See accompanying notes to financial statements.
MSF-14
Metropolitan Series Fund
Western Asset Management U.S. Government Portfolio
Financial Highlights
| | | | | | | | | | | | | | | | | | | | | | | | |
| Selected per share data | | | | | | | | | | | | | | | | | | |
| | | Class E | |
| | | Six Months
Ended
June 30,
2016
(Unaudited) | | | Year Ended December 31, | |
| | | | 2015 | | | 2014 | | | 2013 | | | 2012 | | | 2011 | |
Net Asset Value, Beginning of Period | | $ | 11.85 | | | $ | 12.06 | | | $ | 11.97 | | | $ | 12.31 | | | $ | 12.16 | | | $ | 12.13 | |
| | | | | | | | | | | | | | | | | | | | | | | | |
Income (Loss) from Investment Operations | | | | | | | | | | | | | | | | | | | | | | | | |
Net investment income (a) | | | 0.09 | | | | 0.16 | | | | 0.14 | | | | 0.11 | | | | 0.11 | | | | 0.16 | |
Net realized and unrealized gain (loss) on investments | | | 0.28 | | | | (0.11 | ) | | | 0.16 | | | | (0.21 | ) | | | 0.28 | | | | 0.46 | |
| | | | | | | | | | | | | | | | | | | | | | | | |
Total from investment operations | | | 0.37 | | | | 0.05 | | | | 0.30 | | | | (0.10 | ) | | | 0.39 | | | | 0.62 | |
| | | | | | | | | | | | | | | | | | | | | | | | |
Less Distributions | | | | | | | | | | | | | | | | | | | | | | | | |
Distributions from net investment income | | | (0.30 | ) | | | (0.26 | ) | | | (0.21 | ) | | | (0.24 | ) | | | (0.24 | ) | | | (0.17 | ) |
Distributions from net realized capital gains | | | 0.00 | | | | 0.00 | | | | 0.00 | | | | 0.00 | | | | 0.00 | | | | (0.42 | ) |
| | | | | | | | | | | | | | | | | | | | | | | | |
Total distributions | | | (0.30 | ) | | | (0.26 | ) | | | (0.21 | ) | | | (0.24 | ) | | | (0.24 | ) | | | (0.59 | ) |
| | | | | | | | | | | | | | | | | | | | | | | | |
Net Asset Value, End of Period | | $ | 11.92 | | | $ | 11.85 | | | $ | 12.06 | | | $ | 11.97 | | | $ | 12.31 | | | $ | 12.16 | |
| | | | | | | | | | | | | | | | | | | | | | | | |
Total Return (%) (b) | | | 3.10 | (c) | | | 0.40 | | | | 2.56 | | | | (0.75 | ) | | | 3.15 | | | | 5.28 | |
| | | | | | |
Ratios/Supplemental Data | | | | | | | | | | | | | | | | | | | | | | | | |
Gross ratio of expenses to average net assets (%) | | | 0.65 | (d) | | | 0.64 | | | | 0.64 | | | | 0.64 | | | | 0.65 | | | | 0.64 | |
Net ratio of expenses to average net assets (%) (e) | | | 0.63 | (d) | | | 0.63 | | | | 0.63 | | | | 0.63 | | | | 0.63 | | | | 0.64 | |
Ratio of net investment income to average net assets (%) | | | 1.56 | (d) | | | 1.30 | | | | 1.20 | | | | 0.90 | | | | 0.88 | | | | 1.35 | |
Portfolio turnover rate (%) | | | 106 | (c)(f) | | | 215 | (f) | | | 194 | (f) | | | 317 | (f) | | | 340 | (f) | | | 549 | |
Net assets, end of period (in millions) | | $ | 26.8 | | | $ | 28.1 | | | $ | 33.0 | | | $ | 37.9 | | | $ | 43.8 | | | $ | 48.7 | |
| (a) | Per share amounts based on average shares outstanding during the period. |
| (b) | Total return does not reflect any insurance, sales, separate account or administrative charges of variable annuity or life insurance contracts or any additional expenses that contract owners may bear under their variable contracts. If these charges were included, the returns would be lower. |
| (c) | Periods less than one year are not computed on an annualized basis. |
| (d) | Computed on an annualized basis. |
| (e) | Includes the effects of management fee waivers (see Note 6 of the Notes to Financial Statements). |
| (f) | Includes mortgage dollar roll and TBA transactions; excluding these transactions the portfolio turnover rates would have been 43%, 87%, 68%, 137% and 164% for the six months ended June 30, 2016 and the years ended December 31, 2015, 2014, 2013 and 2012, respectively. |
See accompanying notes to financial statements.
MSF-15
Metropolitan Series Fund
Western Asset Management U.S. Government Portfolio
Notes to Financial Statements—June 30, 2016 (Unaudited)
1. Organization
Metropolitan Series Fund (the “Trust”) is organized as a Delaware statutory trust and registered under the Investment Company Act of 1940, as amended (the “1940 Act”), as an open-end management investment company. The Trust, which is managed by MetLife Advisers, LLC (“MetLife Advisers” or the “Adviser”), an affiliate of MetLife, Inc., is currently comprised of thirty series, each of which operates as a distinct investment vehicle of the Trust. The portfolio included in this report is Western Asset Management U.S. Government Portfolio (the “Portfolio”), which is diversified. Shares in the Portfolio are not offered directly to the general public and are currently available only to separate accounts established by Metropolitan Life Insurance Company (“MetLife”) and other affiliated life insurance companies.
The Portfolio has registered and offers three classes of shares: Class A, B, and E shares. Shares of each Class of the Portfolio represent an equal pro rata interest in the Portfolio and generally give the shareholder the same voting, dividend, liquidation, and other rights. Investment income, realized and unrealized capital gains and losses, the common expenses of the Portfolio, and certain Portfolio-level expense reductions, if any, are allocated on a pro rata basis to each Class based on the relative net assets of each Class to the net assets of the Portfolio. Each Class of shares differs in its respective distribution plan and such distribution expenses are allocated to the corresponding Class of shares.
2. Significant Accounting Policies
The preparation of financial statements in conformity with accounting principles generally accepted in the United States of America (“GAAP”) requires management to make estimates and assumptions that affect the reported amounts of assets and liabilities and disclosure of contingent assets and liabilities as of the date of the financial statements and the reported amounts of income and expenses during the reporting period. Actual results could differ from those estimates. In the preparation of these financial statements, management has evaluated events and transactions subsequent to June 30, 2016 through the date the financial statements were issued.
The Portfolio is an investment company and follows the accounting and reporting guidance of the Financial Accounting Standards Board (“FASB”) Accounting Standards Codification Topic 946—Financial Services—Investment Companies and Topic 820—Fair Value Measurement. The following is a summary of significant accounting policies consistently followed by the Portfolio in the preparation of its financial statements.
Investment Valuation and Fair Value Measurements - Debt securities, including corporate, convertible and municipal bonds and notes; obligations of the U.S. Treasury and U.S. government agencies; foreign sovereign issues; and non-U.S. bonds, are generally valued on the basis of evaluated or composite bid quotations obtained from independent pricing services and/or brokers and dealers selected by the Adviser (each a “pricing service”), pursuant to authorization of and subject to general oversight by the Board of Trustees of the Trust (the “Board” or “Trustees”). Such pricing services may use matrix pricing, which considers observable inputs including, among other things, issuer details, maturity dates, interest rates, yield curves, rates of prepayment, credit risks/spreads, default rates, reported trades, broker dealer quotes and quoted prices for similar assets. Short-term obligations with a remaining maturity of sixty days or less may be valued at amortized cost in the absence of market quotes, so long as the amortized cost value of such short-term debt instrument is approximately the same as the fair value of the instrument as determined without the use of amortized cost valuation. Floating rate loans are generally valued on the basis of an evaluated or composite average of aggregate bid and ask quotations supplied by brokers or dealers, as obtained from the pricing service. Securities that use similar valuation techniques and inputs as described above are generally categorized as Level 2 within the fair value hierarchy.
Mortgage and asset-backed securities are generally valued on the basis of evaluated or composite bid quotations obtained from pricing services selected by the Adviser pursuant to authorization of and subject to general oversight by the Board. These securities are usually issued as separate tranches, or classes, of securities within each deal. The pricing models for these securities usually consider tranche-level attributes, current market data, estimated cash flows and market-based yield spreads for each tranche and incorporate deal collateral performance, as available. Mortgage and asset-backed securities that use similar valuation techniques and inputs as described above are generally categorized as Level 2 within the fair value hierarchy.
Domestic and foreign equity securities, such as common stock, exchange-traded funds, rights, warrants, and preferred stock, that are traded on a securities exchange on a valuation date are generally valued at their last quoted sale price or official closing price on the primary exchange for such security, or, if no sales occurred on that day, at the last reported bid price. Equity securities traded over-the-counter (“OTC”) are generally valued at the last reported bid price. In the event of a major exchange closing during the trading day, the Adviser may use other market information obtained from quotation reporting systems, established market makers, or pricing services in valuing the securities. Valuation adjustments may be applied to certain foreign equity securities that are traded solely on foreign exchanges that close before the time as of which the Portfolio determines its NAV to account for the market movement between the close of the foreign exchanges and the time as of which the Portfolio determines its NAV. The Portfolio may use a systematic fair valuation model provided by a pricing service to value securities principally traded in these foreign markets in order to
MSF-16
Metropolitan Series Fund
Western Asset Management U.S. Government Portfolio
Notes to Financial Statements—June 30, 2016—(Continued)
adjust for possible market movements or other changes that may occur between the close of the foreign exchanges and the time as of which the Portfolio determines its NAV. Foreign equity securities valued using these valuation adjustments are generally categorized as Level 2 within the fair value hierarchy. Equity securities that are actively traded, and have no valuation adjustments applied, are categorized as Level 1 within the fair value hierarchy. Other equity securities traded on inactive markets, or valued in reference to similar instruments traded on active markets, are generally categorized as Level 2 within the fair value hierarchy.
Investments in registered open-end management investment companies are valued at reported net asset value per share on the valuation date and are categorized as Level 1 within the fair value hierarchy.
Futures contracts that are traded on commodity exchanges are valued at their closing prices as of the close of such exchanges and are categorized as Level 1 within the fair value hierarchy.
If no current market value quotation or other observable inputs are readily available or market value quotations are deemed to be unreliable for an investment, the fair value of the investment will be determined in accordance with procedures approved by, and under the general supervision of, the Board. In such a circumstance, the Board will be assisted in its responsibility to determine the fair value of an investment by the Valuation Committee (“Committee”) of MetLife Advisers. The Committee provides general pricing oversight and fair value pricing determinations related to portfolio securities and meets on a regular basis to review reports relating to the valuation of the securities in the Portfolio. The Board has delegated to State Street Bank and Trust Company, the Trust’s custodian (“custodian”), the responsibility for calculating the net asset values (“NAVs”) of the Trust’s Portfolios. The Committee is responsible for overseeing the calculation of the NAVs of the Portfolios by the custodian. The Committee also periodically reviews pricing services, including the pricing services providing fair value pricing for the Portfolio’s foreign securities, and is responsible for overseeing the correction of pricing errors and addressing other pricing issues that arise in the ordinary course of business, such as making real-time fair value determinations, as necessary.
No single standard for determining the fair value of an investment can be set forth because fair value depends upon the facts and circumstances with respect to each investment. Information relating to any relevant factors may be obtained by the Committee from any appropriate source, including the subadviser of the Portfolio, the custodian, a pricing service, market maker and/or broker for such security or the issuer. Appropriate methodologies for determining fair value under particular circumstances may include: matrix pricing, a discounted cash flow analysis, comparisons of securities with comparable characteristics, value based on multiples of earnings, discount from market price of similar marketable securities or a combination of these and other methods.
Investment Transactions and Related Investment Income - Portfolio security transactions are recorded on the trade date. Dividend income is recorded on the ex-dividend date or, for certain foreign securities, when notified. Interest income, which includes amortization of premium and accretion of discount on debt securities, is recorded on the accrual basis. Realized gains and losses on investments are determined on the identified cost basis, which is the same basis used for federal income tax purposes. Foreign income and foreign capital gains on some foreign securities may be subject to foreign taxes, which are accrued as applicable. These foreign taxes have been provided for in accordance with the Portfolio’s understanding of the applicable countries’ tax rules and rates.
Foreign Currency Translation - The books and records of the Portfolio are maintained in U.S. dollars. The values of securities, currencies, and other assets and liabilities denominated in currencies other than the U.S. dollar are translated into U.S. dollars based upon foreign exchange rates prevailing at the end of the period. Purchases and sales of investment securities, income, and expenses are translated on the respective dates of such transactions. Because the values of investment securities are translated at the foreign exchange rates prevailing at the end of the period, that portion of the results of operations arising from changes in exchange rates and that portion of the results of operations reflecting fluctuations arising from changes in market prices of the investment securities are not separated. Such fluctuations are included in the net realized and unrealized gain or loss on investments.
Net realized foreign exchange gains or losses arise from activity in forward foreign currency exchange contracts, sales of foreign currency, currency gains or losses realized between the trade and settlement dates on securities transactions, and the difference between the amounts of dividends, interest, and foreign withholding taxes recorded by the Portfolio and the U.S. dollar equivalent of the amounts actually received or paid by the Portfolio. Net unrealized foreign exchange gains and losses arise from changes in the value of assets and liabilities, other than investment securities, resulting from changes in foreign exchange rates.
Dividends and Distributions to Shareholders - The Portfolio records dividends and distributions on the ex-dividend date. Net realized gains from securities transactions (if any) are generally distributed annually to shareholders. The timing and characterization of certain income and capital gains distributions are determined in accordance with federal tax regulations that may differ from GAAP. Permanent book and tax basis differences relating to shareholder distributions will result in reclassification between under/over distributed net investment income, accumulated net realized gains/losses, and paid-in surplus. Book-tax differences are primarily due to amortization of debt securities, TIPS adjustments and paydown reclasses. These adjustments have no impact on net assets or the results of operations.
Income Taxes - It is the Portfolio’s policy to comply with the requirements of the Internal Revenue Code of 1986, as amended, and regulations thereunder, applicable to regulated investment companies and to distribute, with respect to each taxable year, all of its
MSF-17
Metropolitan Series Fund
Western Asset Management U.S. Government Portfolio
Notes to Financial Statements—June 30, 2016—(Continued)
taxable income to shareholders. Therefore, no federal income tax provision is required. The Portfolio files U.S. federal tax returns. No income tax returns are currently under examination. The Portfolio’s federal tax returns for the prior three fiscal years remain subject to examination by the Internal Revenue Service. As of June 30, 2016, the Portfolio had no uncertain tax positions that would require financial statement recognition, or de-recognition or disclosure.
Mortgage Dollar Rolls - The Portfolio may enter into mortgage “dollar rolls” in which a Portfolio sells to-be-announced (“TBA”) mortgage-backed securities for delivery in the current month and simultaneously contracts to repurchase substantially similar (same type, coupon, and maturity) securities on a specified future date. For the duration of the transaction, or roll period, the Portfolio foregoes principal (including prepayments of principal) and interest paid on the securities sold. Dollar rolls are accounted for as purchase and sale transactions; gain or loss is recognized at the commencement of the term of the dollar roll and each time the mortgage-backed security is rolled.
Mortgage dollar roll transactions involve the risk that the market value of the securities that the Portfolio is required to reacquire may be less than the agreed-upon repurchase price of those securities and that the investment performance of securities purchased with proceeds from these transactions does not exceed the income, capital appreciation and gain or loss that would have been realized on the securities transferred or sold, as applicable, as part of the treasury or mortgage dollar roll.
Mortgage-Related and Other Asset-Backed Securities - The Portfolio may invest in mortgage-related or other asset-backed securities. These securities may include mortgage pass-through securities, collateralized mortgage obligations (“CMOs”), commercial mortgage-backed securities, CMO residuals, stripped mortgage-backed securities (“SMBS”), and other securities that directly or indirectly represent a participation in, or are secured by or payable from, mortgage loans on real property or other receivables. The value of some mortgage- or asset-backed securities may be particularly sensitive to changes in prevailing interest rates. Early repayment of principal on some mortgage-related securities may expose the Portfolio to a lower rate of return upon reinvestment of principal. The value of these securities may fluctuate in response to the market’s perception of the creditworthiness of the issuers. Additionally, although mortgages and mortgage-related securities are generally supported by some form of government or private guarantee and/or insurance, there is no assurance that private guarantors or insurers will meet their obligations.
In one type of SMBS, one class receives all of the interest from the mortgage assets (the interest-only or “IO” class), while the other class will receive all of the principal (the principal-only or “PO” class). Because principal will not be received at the maturity of an IO, adjustments are made to the book value of the security until maturity. These adjustments are netted against payments received for the IOs and the net amount is included in interest income on the Statement of Operations of the Portfolio. Payments received for POs are treated as reductions to the cost and par value of the securities. Details of mortgage-related and other asset-backed securities held by the Portfolio are included in the Portfolio’s Schedule of Investments.
The Portfolio may invest a significant portion of its assets in securities of issuers that hold mortgage and asset-backed securities and direct investments in securities backed by commercial and residential mortgage loans and other financial assets. The value and related income of these securities are sensitive to changes in economic conditions, including delinquencies and/or defaults, and may be negatively impacted by increased volatility of market prices and periods of illiquidity.
TBA Purchase & Forward Sale Commitments - The Portfolio may enter into TBA commitments to purchase or sell securities for a fixed price at a future date. TBA commitments are considered securities in themselves, and involve a risk of loss if the value of the security to be purchased or sold declines or increases prior to settlement date, which is in addition to the risk of decline in the value of the Portfolio’s other assets. TBA forward sale commitments are valued at the current market value of the underlying securities, according to the procedures described under “Investment Valuation and Fair Value Measurements”.
When-Issued and Delayed-Delivery Securities - The Portfolio may purchase securities on a when-issued or delayed-delivery basis. Settlement of such transactions normally occurs within a month or more after the purchase commitment is made. The Portfolio may purchase securities under such conditions only with the intention of actually acquiring them, but may enter into a separate agreement to sell the securities before the settlement date. Since the value of securities purchased may fluctuate prior to settlement, the Portfolio may be required to pay more at settlement than the security is worth. In addition, the purchaser is not entitled to any of the interest earned prior to settlement.
Upon making a commitment to purchase a security on a when-issued or delayed-delivery basis, the Portfolio will hold liquid assets in a segregated account with the Portfolio’s custodian, or set aside liquid assets in the Portfolio’s records, worth at least the equivalent of the amount due. The liquid assets will be monitored on a daily basis and adjusted as necessary to maintain the necessary value.
Repurchase Agreements - The Portfolio may enter into repurchase agreements, under the terms of a Master Repurchase Agreement (“MRA”), with selected commercial banks and broker-dealers, under which the Portfolio acquires securities as collateral and agrees to resell the securities at an agreed-upon time and at an agreed-upon price. The Portfolio, through the custodian or a subcustodian, under a tri-party repurchase agreement, receives delivery of the underlying securities collateralizing any repurchase agreements. It is the Portfolio’s policy that the market value of the collateral be equal to at least 100% of the repurchase price in the case of a repurchase agreement of one-day duration and equal to at least 102% of the repurchase price in the case of all other repurchase agreements. In
MSF-18
Metropolitan Series Fund
Western Asset Management U.S. Government Portfolio
Notes to Financial Statements—June 30, 2016—(Continued)
the event of default or failure by a party to perform an obligation in connection with any repurchase transaction, the MRA gives the non-defaulting party the right to set-off claims and to apply property held by it in connection with any repurchase transaction against obligations owed to it.
At June 30, 2016, the Portfolio had investments in repurchase agreements with a gross value of $7,077,169, which is included as part of investments at value on the Statement of Assets and Liabilities. The value of the related collateral exceeded the value of the repurchase agreements at June 30, 2016.
Securities Lending - The Portfolio may lend its portfolio securities to certain qualified brokers who borrow securities in order to complete certain securities transactions. By lending its portfolio securities, the Portfolio attempts to increase its net investment income through the receipt of income on collateral held from securities on loan. Any gain or loss in the market price of the loaned securities that might occur and any interest earned or dividends declared during the term of the loan would accrue to the account of the Portfolio.
The Trust has entered into a Securities Lending Authorization Agreement with the custodian as the lending agent. Under this agreement, the custodian is authorized to loan portfolio securities on the Portfolio’s behalf. In exchange, the Portfolio receives either cash or securities as collateral against the loaned securities. The Portfolio receives collateral equal to at least 102% of the market value of the loaned securities (105% for foreign equity securities), at each loan’s inception. Collateral representing at least 100% of the market value of the loaned securities must be maintained for the duration of the loan. Cash collateral is generally invested in the State Street Navigator Securities Lending MET Portfolio (the “Navigator Portfolio”), a series of the State Street Navigator Securities Lending Trust that is managed by an affiliate of the custodian. The Navigator Portfolio is a registered money market fund that invests in a variety of high-quality, U.S. dollar-denominated instruments. If the market value of the collateral at the close of trading on a business day is less than 100% of the market value of the loaned securities at the close of trading on that day, the borrower shall be required to deliver, by the close of business on the following business day, an additional amount of collateral, so that the total amount of posted collateral is equal to at least 100% of the market value of all the loaned securities as of such preceding day. A portion of net income (income after the deduction of expenses and fees of the Navigator Portfolio) on the collateral is rebated to the borrower of the securities and the remainder is split between the custodian and the Portfolio. On loans collateralized by U.S. Treasuries, a fee is received from the borrower and is allocated between the Portfolio and the custodian. Income received by the Portfolio in securities lending transactions during the six months ended June 30, 2016 is reflected as Securities lending income on the Statement of Operations. The values of any securities loaned by the Portfolio and the related collateral at June 30, 2016 are disclosed in the footnotes to the Schedule of Investments. The value of the related collateral received by the Portfolio exceeded the value of the securities out on loan at June 30, 2016.
The risks associated with lending portfolio securities include, but are not limited to, possible delays in receiving additional collateral or in the recovery of the loaned securities, possible loss of rights in the collateral should the borrower fail financially, as well as risk of loss in the value of the collateral or the value of the investments made with the collateral. The lending agent shall indemnify the Portfolio in the case of default of any securities borrower.
The following table provides a breakdown of the collateral received and the remaining contractual maturities for securities lending transactions, which are accounted for as secured borrowings.
| | | | | | | | | | | | | | | | | | | | |
| | | Remaining Contractual Maturity of the Agreements
As of June 30, 2016 | |
| | | Overnight and
Continuous | | | Up to
30 Days | | | 31 - 90
Days | | | Greater than
90 days | | | Total | |
| Securities Lending Transactions | | | | | | | | | | | | | | | | | | | | |
Corporate Bonds & Notes | | $ | (3,060,704 | ) | | $ | — | | | $ | — | | | $ | — | | | $ | (3,060,704 | ) |
U.S. Treasury & Government Agencies | | | (4,351,934 | ) | | | — | | | | — | | | | — | | | | (4,351,934 | ) |
Total | | $ | (7,412,638 | ) | | $ | — | | | $ | — | | | $ | — | | | $ | (7,412,638 | ) |
Total Borrowings | | $ | (7,412,638 | ) | | $ | — | | | $ | — | | | $ | — | | | $ | (7,412,638 | ) |
Gross amount of recognized liabilities for securities lending transactions | | | $ | (7,412,638 | ) |
| | | | | | | | | | | | | | | | | | | | |
3. Investments in Derivative Instruments
Futures Contracts - The Portfolio may buy and sell futures contracts as a hedge, to maintain investment exposure to a target asset class or to enhance return. The Portfolio may be subject to fluctuations in equity prices, interest rates, commodity prices, and foreign currency exchange rates in the normal course of pursuing its investment objective. Futures contracts are standardized agreements to buy or sell a security, or deliver a final cash settlement price in connection with an index, interest rate, currency, or other asset. The Portfolio must deposit an amount (“initial margin”) equal to a certain percentage of the face value of the futures contract. The initial margin may be in the form of cash or securities, which is returned when the Portfolio’s obligations under the contract have been
MSF-19
Metropolitan Series Fund
Western Asset Management U.S. Government Portfolio
Notes to Financial Statements—June 30, 2016—(Continued)
satisfied. If cash is deposited as the initial margin, it is shown as cash collateral on the Statement of Assets and Liabilities. Futures contracts are marked-to-market daily, and subsequent payments (“variation margin”) are made or received by the Portfolio depending on whether unrealized gains or losses are incurred. These amounts are reflected as receivables or payables on the Statement of Assets and Liabilities and as a component of net change in unrealized appreciation/depreciation on the Statement of Operations. When the contract is closed or expires, the Portfolio records a realized gain or loss equal to the difference between the value of the contract at the time it was opened and the value at the time it was closed. Risks of entering into futures contracts (and related options) include the possibility that the market for these instruments may be illiquid and that a change in the value of the contract or option may not correlate perfectly with changes in the value of the underlying instrument. If futures contracts are exchange-traded, the exchange’s clearinghouse, as counterparty to all exchange-traded futures, guarantees the futures contracts against default. For OTC futures, the Portfolio’s ability to terminate the positions may be more limited than in the case of exchange-traded positions and may also involve the risk that securities dealers participating in such transactions would fail to meet their obligations to the Portfolio.
The following table summarizes the fair value of derivatives held by the Portfolio at June 30, 2016 by category of risk exposure:
| | | | | | | | | | | | |
| | | Asset Derivatives | | | Liability Derivatives | |
Risk Exposure | | Statement of Assets &
Liabilities Location | | Fair Value | | | Statement of Assets &
Liabilities Location | | Fair Value | |
| Interest Rate | | Unrealized appreciation on futures contracts (a) | | $ | 665,978 | | | Unrealized depreciation on futures contracts (a) | | $ | 4,459,085 | |
| | | | | | | | | | | | |
| | (a) | Includes cumulative appreciation/depreciation of futures contracts as reported in the Schedule of Investments. Only the current day’s variation margin is reported within the Statement of Assets and Liabilities. |
The following tables summarize the effect of derivative instruments on the Statement of Operations, classified by derivative type and category of risk exposure, for the six months ended June 30, 2016:
| | | | |
Statement of Operations Location—Net Realized Gain (Loss) | | Interest
Rate | |
Futures contracts | | $ | (4,957,340 | ) |
| | | | |
| |
Statement of Operations Location—Net Change in Unrealized Appreciation (Depreciation) | | Interest
Rate | |
Futures contracts | | $ | (4,219,295 | ) |
| | | | |
For the six months ended June 30, 2016, the average notional par or face amount outstanding for each derivative type was as follows:
| | | | |
Derivative Description | | Average
Notional Par or
Face Amount‡ | |
Futures contracts long | | $ | 12,233,333 | |
Futures contracts short | | | (347,791,667 | ) |
| | ‡ | Averages are based on activity levels during the period. |
4. Certain Risks
In the normal course of business, the Portfolio invests in securities and enters into transactions where risks exist due to fluctuations in the market (“market risk”) or failure of the other party to a transaction to perform (“credit and counterparty risk”).
Market Risk: The value of securities held by the Portfolio may decline in response to certain events, including those directly involving the companies whose securities are owned by the Portfolio; conditions affecting the general economy; overall market changes; local, regional or global political, social or economic instability; and currency, interest rate, and price fluctuations.
Credit and Counterparty Risk: The Portfolio may be exposed to counterparty risk, or the risk that an entity with which the Portfolio has unsettled or open transactions may default. The potential loss could exceed the value of the financial assets and liabilities recorded in the financial statements. Financial assets that potentially expose the Portfolio to credit and counterparty risk consist principally of cash due from counterparties and investments. The Portfolio manages counterparty risk by entering into agreements only with counterparties that it believes have the financial resources to honor their obligations and by monitoring the financial stability of those counterparties. The Portfolio’s investment adviser attempts to mitigate counterparty risk by (i) periodically assessing the creditworthiness of its trading partners, (ii) monitoring and/or limiting the amount of its net exposure to each individual counterparty based on its assessment, and (iii) requiring collateral from the counterparty for certain transactions. In order to preserve certain safeguards for non-standard settlement trades, the Portfolio restricts its exposure to credit and counterparty losses by entering
MSF-20
Metropolitan Series Fund
Western Asset Management U.S. Government Portfolio
Notes to Financial Statements—June 30, 2016—(Continued)
into master netting agreements (“Master Agreements”) with counterparties (approved brokers) with whom it undertakes a significant volume of transactions. Master Agreements govern the terms of certain transactions, and reduce the counterparty risk associated with relevant transactions by specifying credit protection mechanisms and providing standardization that improves legal certainty. Master Agreements can also help limit counterparty risk by specifying collateral posting arrangements at pre-arranged exposure levels.
Repurchase and reverse repurchase agreements are primarily executed under Global Master Repurchase Agreements (“GMRAs”) or Master Repurchase Agreements (“MRAs”), which provide the rights to set-off. Each repurchase and reverse repurchase agreement is initially collateralized at the transaction level. In the event of default, the total market value exposure will be offset against collateral exchanged to date, which would result in a net receivable/(payable) that would be due from/to the counterparty.
Master Securities Forward Transaction Agreements (“MSFTA”) govern the considerations and factors surrounding the settlement of certain forward settling transactions, such as TBA securities and delayed-delivery or secured borrowings transactions by and between the Portfolio and select counterparties. The MSFTA maintain provisions for, among other things, initiation and confirmation, payment and transfer, events of default, termination, and maintenance of collateral.
Customer Account Agreements and related addenda govern cleared derivatives transactions such as futures, options on futures, and cleared OTC derivatives. Cleared derivative transactions require posting of initial margin as determined by each relevant clearing agency, which is segregated at a broker account registered with the Commodities Futures Trading Commission (“CFTC”), or the applicable regulator. In the U.S., counterparty risk is significantly reduced as creditors of the futures broker do not have claim to Portfolio assets in the segregated account. Additionally, portability of exposure in the event of default further reduces risk to the Portfolio. Variation margin, or changes in market value, are exchanged daily, but may not be netted between futures and cleared OTC derivatives.
Additional risks associated with each type of investment are described above within the respective security type notes. The Portfolio’s prospectus includes a discussion of the principal risks of investing in the Portfolio.
5. Investment Transactions
Aggregate cost of purchases and proceeds of sales of investment securities, including mortgage dollar roll and TBA transactions but excluding short-term securities, for the six months ended June 30, 2016 were as follows:
| | | | | | | | | | | | |
Purchases | | | Sales | |
U.S. Government | | Non U.S. Government | | | U.S. Government | | | Non U.S. Government | |
| $2,566,721,410 | | $ | 15,020,614 | | | $ | 2,632,077,121 | | | $ | 49,090,602 | |
Purchases and sales of mortgage dollar rolls and TBA transactions for the six months ended June 30, 2016 were as follows:
| | | | |
Purchases | | Sales | |
| $1,603,159,900 | | $ | 1,606,548,931 | |
6. Investment Management Fees and Other Transactions with Affiliates
Investment Management Agreement - MetLife Advisers is the investment adviser to the Portfolio. The Trust has entered into an investment management agreement with MetLife Advisers with respect to the Portfolio. For providing investment management services to the Portfolio, MetLife Advisers receives monthly compensation at the following annual rates:
| | | | | | |
Management
Fees earned by
MetLife Advisers
for the six months ended
June 30, 2016 | | % per annum | | | Average Daily Net Assets |
| $5,317,825 | | | 0.550 | % | | Of the first $500 million |
| | | 0.450 | % | | On amounts in excess of $500 million |
MetLife Advisers has entered into an investment subadvisory agreement with respect to managing the Portfolio. Western Asset Management Company is compensated by MetLife Advisers to provide subadvisory services for the Portfolio.
Management Fee Waiver - Pursuant to a management fee waiver agreement, MetLife Advisers has agreed, for the period May 1, 2016 to April 30, 2017, to reduce its advisory fees set out above under “Investment Management Agreement” for each class of the Portfolio as follows:
| | | | |
| % per annum | | | Average Daily Net Assets |
| | 0.050 | % | | On amounts over $200 million and under $500 million |
| | 0.010 | % | | On amounts over $1 billion and under $2 billion |
| | 0.020 | % | | On amounts in excess of $2 billion |
MSF-21
Metropolitan Series Fund
Western Asset Management U.S. Government Portfolio
Notes to Financial Statements—June 30, 2016—(Continued)
An identical agreement was in place for the period May 1, 2015 to April 30, 2016. Amounts waived for the six months ended June 30, 2016 are shown as a management fee waiver in the Statement of Operations.
Certain officers and trustees of the Trust may also be officers of MetLife Advisers; however, such officers and trustees receive no compensation from the Trust.
On January 12, 2016, MetLife, Inc. announced its plan to pursue the separation of a substantial portion of its retail segment and is currently evaluating structural alternatives for such separation. It is anticipated that MetLife Advisers would be included in any such separation. Any separation transaction that might occur will be subject to the satisfaction of various conditions and approvals, including approval of any transaction by the MetLife, Inc. Board of Directors, satisfaction of any applicable requirements of the SEC, and receipt of insurance and other regulatory approvals and other anticipated conditions. Because the form of a separation had yet to be determined, MetLife, Inc. cannot currently provide a specific potential completion date or information about the potential impact on MetLife Advisers. No assurance can be given regarding the form that a separation transaction may take or the specific terms thereof, or that a separation will in fact occur. Depending on the form a separation takes, MetLife Advisers’ continued service as investment adviser to the Trusts could be subject to the satisfaction of various conditions and approvals, which may include obtaining approvals from the Trusts’ Board and shareholders.
Transfer Agency Agreement - MetLife serves as the transfer agent for the Trust. MetLife receives no fees for its services to the Trust under the transfer agency agreement.
Distribution and Service Fees - The Trust has a distribution agreement with MetLife Investors Distribution Company (“MIDC” or the “Distributor”) in which MIDC serves as the distributor for the Portfolio’s Class A, B and E Shares. MIDC is a wholly-owned subsidiary of MetLife Investors Group, LLC, an affiliate of the Adviser. The Trust has also adopted a Distribution and Service Plan under Rule 12b-1 of the 1940 Act for the Portfolio’s Class B and E Shares. Under the Distribution and Service Plan, the Class B and E Shares of the Portfolio pay a fee to compensate the Insurance Companies (or their affiliates) and other broker-dealers and financial intermediaries involved in the offer and sale of Portfolio shares for promoting or selling and servicing the Class B and E Shares. The fees under the Distribution and Service Plan for each class of the Portfolio’s shares are calculated as a percentage of the Portfolio’s average daily net assets that are attributable to that Class. Currently, the fee is 0.25% per year for Class B Shares and 0.15% per year for Class E Shares. Amounts incurred by the Portfolio for the six months ended June 30, 2016 are shown as Distribution and service fees in the Statement of Operations.
Deferred Trustee Compensation - Each Trustee who is not currently an employee of the Adviser or any of its affiliates receives compensation from the Trust for his or her service to the Trust. A deferred compensation plan (the “Plan”) is available to the Trustees on a voluntary basis. Deferred amounts remain in the Trust until distributed in accordance with the provisions of the Plan. The value of a participating Trustee’s deferral account is based on theoretical investments of deferred amounts on the normal payment dates in certain portfolios of the Trust or Met Investors Series Trust, an affiliate of the Trust, as designated by the participating Trustee. Changes in the value of participants’ deferral accounts are reflected as Trustees’ fees and expenses in the Statement of Operations. The portion of the accrued obligations allocated to the Portfolio under the Plan is reflected as Deferred trustees’ fees in the Statement of Assets and Liabilities.
7. Contractual Obligations
Under the Trust’s organizational documents, its officers and Trustees may be indemnified against certain liabilities and expenses arising out of the performance of their duties to the Trust. Additionally, the Trust has a variety of indemnification obligations under contracts with its service providers. The Trust’s maximum exposure under these arrangements is unknown, as this would involve future claims that may be made against the Trust that have not yet occurred.
8. Income Tax Information
The tax character of distributions paid for the years ended December 31, 2015 and 2014 were as follows:
| | | | | | | | | | | | | | | | | | | | |
Ordinary Income | | | Long-Term Capital Gain | | | Total | |
2015 | | 2014 | | | 2015 | | | 2014 | | | 2015 | | | 2014 | |
| $55,821,477 | | $ | 49,996,113 | | | $ | — | | | $ | — | | | $ | 55,821,477 | | | $ | 49,996,113 | |
As of December 31, 2015, the components of distributable earnings (accumulated losses) on a federal income tax basis were as follows:
| | | | | | | | | | | | | | | | |
Undistributed
Ordinary
Income | | Undistributed
Long-Term
Capital Gain | | | Net
Unrealized
Depreciation | | | Other
Accumulated
Capital Losses | | | Total | |
| $57,634,323 | | $ | — | | | $ | (24,962,631 | ) | | $ | (59,297,823 | ) | | $ | (26,626,131 | ) |
MSF-22
Metropolitan Series Fund
Western Asset Management U.S. Government Portfolio
Notes to Financial Statements—June 30, 2016—(Continued)
The Portfolio utilizes the provisions of the federal income tax laws that provide for the carryforward of capital losses for prior years, offsetting such losses against any future realized capital gains. Under the Regulated Investment Company Modernization Act of 2010 (the “Act”), net capital losses recognized after December 22, 2010 may be carried forward indefinitely and their character is retained as short-term and/or long-term losses. Previously, net capital losses were carried forward for up to eight years and treated as short-term losses. As a transition rule, the Act requires that post-enactment net capital losses be used before pre-enactment net capital losses.
As of December 31, 2015, the Portfolio had post-enactment short-term accumulated capital losses in the amount of $4,943,111 and post-enactment long-term accumulated capital losses in the amount of $54,354,712.
MSF-23
Item 2. Code of Ethics.
Item applicable only to annual report on Form N-CSR.
Item 3. Audit Committee Financial Expert.
Item applicable only to annual report on Form N-CSR.
Item 4. Principal Accountant Fees and Services.
Item applicable only to annual report on Form N-CSR.
Item 5. Audit Committee of Listed Registrants.
Not applicable.
Item 6. Investments.
(a) Schedule of Investments is included as a part of the report to shareholders included under Item 1 of this Form N-CSR.
(b) Not applicable.
Item 7. Disclosure of Proxy Voting Policies and Procedures for Closed-End Management Investment Companies.
Not applicable.
Item 8. Portfolio Managers of Closed-End Management Investment Companies.
Not applicable.
Item 9. Purchases of Equity Securities by Closed-End Management Investment Company and Affiliated Purchasers.
Not applicable.
Item 10. Submission of Matters to a Vote of Security Holders.
The registrant does not have procedures by which shareholders may recommend nominees to the registrant’s Board of Trustees.
Item 11. Controls and Procedures.
(a) The President and Treasurer of the registrant have concluded, based on their evaluation of the effectiveness of the registrant’s disclosure controls and procedures (as defined in Rule 30a-
3(c) under the Act) as of a date within 90 days of the filing date of this report on Form N-CSR, that the design and operation of such procedures provide reasonable assurance that information required to be disclosed by the registrant in this report on Form N-CSR is recorded, processed, summarized, and reported within the time periods specified in the Securities and Exchange Commission’s rules and forms.
(b) There were no significant changes in the registrant’s internal control over financial reporting (as defined in Rule 30a-3(d) under the 1940 Act) that occurred during the registrant’s second fiscal quarter of the period covered by this report that have materially affected, or are reasonably likely to materially affect, the registrant’s internal control over financial reporting.
Item 12. Exhibits
(a)(1) Not applicable.
(a)(2) The certifications required by Rule 30a-2(a) under the 1940 Act are attached hereto.
(a)(3) Not applicable.
(b) The certifications required by Rule 30a-2(b) under the 1940 Act and Section 906 of the Sarbanes-Oxley Act of 2002 are attached hereto.
SIGNATURES
Pursuant to the requirements of the Securities Exchange Act of 1934 and the Investment Company Act of 1940, the registrant has duly caused this report to be signed on its behalf by the undersigned, thereunto duly authorized.
| | |
| METROPOLITAN SERIES FUND |
| |
| By: | | /s/ Kristi Slavin |
| | Kristi Slavin |
| | President and Chief Executive Officer |
Date: September 1, 2016
Pursuant to the requirements of the Securities Exchange Act of 1934 and the Investment Company Act of 1940, this report has been signed below by the following persons on behalf of the registrant and in the capacities and on the dates indicated.
| | |
| By: | | /s/ Kristi Slavin |
| | Kristi Slavin |
| | President and Chief Executive Officer |
Date: September 1, 2016
| | |
| By: | | /s/ Peter H. Duffy |
| | Peter H. Duffy |
| | Chief Financial Officer and Treasurer |
Date: September 1, 2016